| ☒ | ANNUAL REPORT PURSUANT TO SECTION 13 OR 15(d) OF THE SECURITIES EXCHANGE ACT OF 1934 | ||||
| ☐ | TRANSITION REPORT PURSUANT TO SECTION 13 OR 15(d) OF THE SECURITIES EXCHANGE ACT OF 1934 | ||||
![]()

Delaware (State or other jurisdiction of incorporation or organization) | ||||||||
5615 High Point Drive, Irving, TX (Address of principal executive offices) | 11-3656261 (I.R.S. Employer Identification No.) 75038 (Zip Code) | |||||||
(214) 453-3000 (Registrant’s telephone number, including area code) | ||||||||
(Registrant’s telephone number, including area code)
(214) 453-3000
| Title of each class | Trading Symbol(s) | Name of each exchange on which registered | ||||||
| Common Stock $0.01 par value | HMSY | The ( | ||||||
Indicate by check mark if disclosure of delinquent filers pursuant to Item 405 of Regulation S-K is not contained herein, and will not be contained, to the best of registrant’s knowledge, in definitive proxy or information statements incorporated by reference in Part III of this Form 10-K or any amendment to this Form 10-K. ☒
Indicate by check mark whether the registrant is a large accelerated filer, an accelerated filer, a non-accelerated filer, a smaller reporting company, or an emerging growth company. See the definitions of “large accelerated filer,” “accelerated filer”,filer,” “smaller reporting company” and “emerging growth company” in Rule 12b-2 of the Exchange Act.
| Large | Accelerated | Non-accelerated filer ☐ | Smaller reporting company ☐ | |||||||||||||||||
| Emerging growth company ☐ | ||||||||||||||||||||
Emerging growth company ☐
February 17, 2020.
None.
| ||||||||||||||
| Page | ||||||||||||||
| ACA | Patient Protections and Affordable Care Act, as amended by the Health Care and Education Reconciliation Act of 2010 | |||||
| ACO | Accountable | |||||
| ADR | Additional | |||||
| ASC | Accounting Standards Codification | |||||
| ASO | Administrative | |||||
| Accounting Standards Update | ||||||
| CHIP | Children's Health Insurance Program | |||||
| CMS | Centers for Medicare & Medicaid Services | |||||
| CMS NHE | ||||||
| Coordination of Benefits | ||||||
| COSO | Committee of Sponsoring Organizations of the Treadway Commission | |||||
| Credit Agreement | The Amended and Restated Credit Agreement dated as of May 3, 2013, as amended by Amendment No. 1 to Amended and Restated Credit Agreement dated as of March 8, 2017, and as further amended by Amendment No. 2 to Amended and Restated Credit Agreement, dated as of December | |||||
| DSO | Days sales outstanding | |||||
| ERISA | Employment Retirement Income Security Act of 1974 | |||||
| Exchange Act | Securities Exchange Act of 1934, as amended | |||||
| FASB | Financial Accounting Standards Board | |||||
| FCPA | U.S. Foreign Corrupt Practices Act of 1977, as amended | |||||
| HIPAA | Health Insurance Portability and Accountability Act of 1996 | |||||
| HITECH | Health Information Technology for Economic and Clinical Health | |||||
| IRS | U.S. Internal Revenue Service | |||||
| LIBOR or LIBO Rate | Intercontinental Exchange London Interbank Offered Rate (or any successor rate determined in accordance with the Credit Agreement) | |||||
| MCO | Managed care organization | |||||
| ML | Machine learning | |||||
| NLP | Natural language processing | |||||
| PBM | Pharmacy benefit manager | |||||
| PHI | Protected health information | |||||
| PHM | Population Health Management | |||||
| PI | Payment Integrity | |||||
| PMPM | Per member per month | |||||
| PMPY | Per member per year | |||||
| RAC | Recovery Audit Contractor | |||||
| RFP | Request for proposal | |||||
| ROU | Right-of-use | |||||
| RPA | Robotic process automation | |||||
| SEC | U.S. Securities and Exchange Commission | |||||
| Securities Act | Securities Act of 1933, as amended | |||||
| Section 199 Deduction | U.S. Production Activities Deduction pursuant to IRC Section 199 | |||||
| SG&A | Selling, general and administrative | |||||
| TPL | Third-party liability | |||||
| U.S. GAAP | United States Generally Accepted Accounting Principles | |||||
| 2006 Stock Plan | HMS Holdings Corp. Fourth Amended and Restated 2006 Stock Plan, as amended by Amendment No. 1 to the HMS Holdings Corp. Fourth Amended and Restated 2006 Stock Plan dated as of February 16, 2012 | |||||
| 2011 HDI Plan | HDI Holdings, Inc. Amended 2011 Stock | |||||
| 2016 Omnibus Plan | HMS Holdings Corp. 2016 Omnibus Incentive Plan | |||||
| 2017 Tax Act | Tax Cuts and Jobs Act of 2017 | |||||
| 2019 Form 10-K | HMS Holdings Corp. Annual Report on Form 10-K for the year ended December 31, 2019 | |||||
| 2019 Omnibus Plan | HMS Holdings Corp. 2019 Omnibus Incentive Plan | |||||
| 401(k) Plan | HMS Holdings Corp. 401(k) Plan | |||||
This Annual Report on
programs, and other statements regarding our possible future actions, business plans, objectives and prospects.
2019 Form 10-K. Additionally, our internal data and estimates are based upon information obtained from our customers, our partners, trade and business organizations, publicly available information and other contacts in the markets in which we operate and our management’s understanding of industry conditions. Estimates are difficult to develop and inherently uncertain, and we cannot assure you that they are accurate. Our estimates involve risks and uncertainties and are subject to change based on various factors, including those detailed above and under “Part I, Item 1A. Risk Factors” of this 2019 Form 10-K. healthcare continuum. Through our solutions, we help move the healthcare system forward by saving billions of dollars for our customers while helping consumers lead healthier lives. cost containment business. The addition of Accent enhances our capabilities across all of our coordination of benefit and payment integrity solutions and extends our reach in both new and established market segments, offering immediate market expansion and growth opportunities. As of December 31, 3,100 employees. Additional information about HMS is available on our website at www.hms.com. Directors in November 2019. If we fail to innovate and develop new or enhanced solutions and services, or if these solutions and services are not adopted by our customers, it could have a material adverse effect on our business, financial condition, results of operations and cash flows. presence. We intend to pursue future acquisitions, investments and strategic relationships that will continue to We face challenges associated with forecasting the revenue under our contracts, Any failure to maintain effective information processing systems and the integrity of the data in, and operations of, those systems could materially adversely affect our business, financial condition, results of operations and cash flows. We may rely on Adverse judgments or settlements in legal proceedings could materially harm our business, financial condition, operating results and cash flows. Our outstanding indebtedness could materially adversely affect our financial condition and our ability to operate our business, and we may not be able to generate sufficient cash flows to meet our debt service obligations or capital requirements. adversely affected. operations. HIPAA). We are also obligated by our contractual requirements with customers, which may require that we comply with additional privacy regulations imposed upon certain types of customers, such as the federal Gramm-Leach-Bliley Act and other laws. Additional legislation governing the acquisition, storage and transmission or other dissemination of health record information and other personal or sensitive information, including information outside the scope of HIPAA, continues to be proposed and come into force at the state level, such as the recently enacted California Consumer Privacy Act of 2018. There are also numerous international privacy and security laws that govern the collection, dissemination, use, access, retention, storage, protection and confidentiality of personal information. For example, the European Union General Data Protection Regulation, which became effective in May 2018, introduced new data protection requirements, which relate to, among other things, the security, confidentiality and processing of personal data in the European Union. The transferring of personal information across international borders is also becoming increasingly complex. Additionally, several countries, including Australia, have established specific legal requirements for cross-border transfers, and other countries, such as India, are considering requirements for data localization. Federal and state governments may limit or prohibit outsourcing of certain programs or functions to private entities, refuse to grant consents or waivers necessary Risks See “Leases” in Note 16 to the Consolidated Financial Statements in Part II, Item 8 for additional information. As of the close of business on business and possibly for the repurchase of shares from time to time. Our Board of Directors will evaluate various factors, including, without limitation, our future earnings, operating cash flows, financial condition, results of operations and capital requirements in determining whether to pay any cash dividends in the future. In addition, our Credit Agreement 2019. Part II, Item 7. Management’s Discussion and Analysis of Financial Condition and Results of Operations, and the Consolidated Financial Statements and Notes thereto, in Part II, Item 8 of this 2019 Form 10-K. operations or financial results. technology firms. As of December 31, and Estimates (in millions) Administrative Expenses (in millions) 2019. (1.4%), respectively. follows other expenses. approximately $13.5 million. renewed. million year over year. 2020. the Consolidated Financial Statements in Part II, Item 8 for additional information regarding the Credit Agreement. In designing and evaluating the disclosure controls and procedures, management recognizes that any controls and procedures, no matter how well designed and operated, can provide only reasonable assurance of achieving the desired control objectives, and management is required to apply its judgment in evaluating the cost-benefit relationship of possible controls and procedures (c)Changes in Internal Control Over Financial Reporting “ Director Our Board of Directors has adopted a Code of Conduct applicable to all of our directors, officers and employees, including all employees, officers, directors, contractors, contingent workers and business affiliates of HMS subsidiaries. The Code of Conduct is publicly available on our website under the HMS ($) 2016 Peer Group Median ($) HMS Percentile Rank (%) HMS ($) 2016 Peer Group Median ($) HMS Percentile Rank (%) 2014 Year End Salary ($) Increase (%) 2015 Year End Salary ($) Increase (1) (%) 2016 Salary (1) ($) Target Bonus ($) Actual Percentage of Target Bonus Paid (%) Performance- Based Awards Earned in 2016 Performance- Based Awards Forfeited in 2016 Grant Date Fair Value of Performance- Based Awards Value of Options Granted ($) Number of Options Granted (1)(2) (#) Value of Restricted Stock Units Granted ($) Grant Date Fair Value of Options Granted (1) ($) Grant Date Fair Value of RSUs Granted (1) ($) Salary (1) ($) ($) Non- Equity Incentive sation (5) All Other Compen- sation (6) Total Compen- sation Estimated Possible Payouts Under Non-Equity Incentive Plan Awards(1) Estimated Future Payouts Under Equity Incentive Plan Awards (2) Compensa- tion Committee Approval Date Number of Shares Acquired on Exercise (#) Value Realized on Exercise(1) ($) Number of Shares Acquired on Vesting (#) Value Realized on Vesting(2) ($) Termination without Cause(1) ($) Resignation for Good Reason(2) ($) Disability(4) ($) Death or Retirement(5) ($) “ Effective 1/1/16- 10/31/16 ($) Effective 11/1/16-12/31/16 ($) Fees Earned or Paid in Cash(1) ($) Option Awards(2)(4) ($) Deferred Stock Units Received in Lieu of 2016 Cash Compensation (#) Fair Market Value ($) Outstanding Stock Options (#) Item 12. Security Ownership of Certain Beneficial Owners and Management and Related Shareholder Matters Number of Outstanding Shares of Common Stock (#) Percent of Class (%) Item 13. Certain Relationships and Related Transactions and Director Independence 59. /s/ /s/ /s/ We are a public accounting firm registered with the PCAOB and are required to be independent with respect to the Company in accordance with the U.S. federal securities laws and the applicable rules and regulations of the Securities and Exchange Commission and the PCAOB. 2013 We are a public accounting firm registered with the PCAOB and are required to be independent with respect to the Company in accordance with the U.S. federal securities laws and the applicable rules and regulations of the Securities and Exchange Commission and the PCAOB. Assets In 2019 and 2018, the Company only issued equity awards with service conditions. In August 2016, the FASB issued ASU No. 2016-15, Statements of Cash Flows (Topic 230): Classification of Certain Cash Receipts and Cash Payments guidance on January 1, 2018. The adoption of this guidance in 2018 did not have a material effect on the Company’s consolidated financial statements. September 16, 2019. The Company allocated the purchase price, net of cash acquired, to Accounts payable, accrued expenses and other liabilities consisted of the following (in Included in Other 41. At December 31, "Credit Agreement")with certain lenders and Citibank, N.A. as administrative agent. The Credit Agreement well as customary agency fees. As part of a contractual agreement with a customer, the Company has an outstanding irrevocable letter of credit for 10. Equity Activity The Company’s certificate of incorporation, as amended, authorizes the issuance of up to 5,000,000 shares of “blank check” preferred stock with such designations, rights and preferences as may be determined by the Company’s Board of Directors. As of December 31, 12. Stock-Based Compensation (d)Restricted Stock Units Action. In HMS records accruals for outstanding legal matters when it believes it is probable that a loss will be incurred and the amount can be reasonably estimated. The Company evaluates, on a quarterly basis, developments in legal matters that could affect the amount of any accrual and developments that would make a loss contingency both probable and reasonably estimable. If a loss contingency is not both probable and estimable, HMS does not establish an accrued States with some international revenue that is not considered material. In connection with the preparation of SCHEDULE II – VALUATION AND QUALIFYING ACCOUNTS 2017I.I, Item 1. Business,” “Part I.I, Item 1A,1A. Risk Factors,” “Part II, Item 7. Management’s Discussion and Analysis of Financial Condition and Results of Operations,” and “Part II, Item 7A. Quantitative and Qualitative Disclosures about Market Risk” of this 20162019 Form 10-K and in other documents we file with the SEC.20162019 Form 10-K speak only as of the date on which they are made. We undertake no obligation to publicly update forward-looking statements, whether as a result of new information, future events or otherwise, except as may be required by law. We caution readers not to place undue reliance upon any of these forward-looking statements. You are advised, however, to consult any further disclosures we make on related subjects in our Form 10-Q and Form 8-K8- K reports and our other filings with the SEC.20162019 Form 10-K contains market, industry and government data and forecasts that have been obtained from publicly available information, various industry publications, and other published industry sources.sources and our internal data and estimates. We have not independently verified the information from third party sources and cannot make any representation as to the accuracy or completeness of such information. None of the reports and other materials of third party sources referred to in this 20162019 Form 10-K were prepared for use in, or in connection with, this report.a leadingan industry-leading provider of cost containment and analytical solutions in the U.S. healthcare marketplace. Our mission is to make healthcare work better for everyone. We use innovativedata, technology extensive data services and powerful analytics to deliver coordination of benefits, payment integrity and population health management and engagement solutions tothat help healthcare payersorganizations reduce costs, improve performancehealth outcomes and outcomes.enhance consumer experiences. We provide coordinationa broad range of benefits servicespayment accuracy solutions to government and commercial healthcare payers, and sponsorsincluding coordination of benefits services, to ensure that the responsible partyright payer pays healthcare claims. Ourthe claim, and payment integrity services ensure healthcare claims billed are accurateto address improper payments and appropriate; and our care management technology helps risk-bearing organizations manage the care delivered to their members. Together these various services help customers recover amounts from liable third parties; prevent future improper payments; reduce fraud, waste and abuse; better manageabuse. Our population health management solutions include a portfolio of integrated risk analytics, consumer engagement and care management solutions that provide healthcare organizations with reliable intelligence insight into their population and member risks to predict, identify and avoid preventable high cost events over the care that members receive; and ensure regulatory compliance.HMSour business has grown both organicallyevolved through a combination of organic growth and through targeted acquisitions. We currently operate as one business segment with a single management team that reports to the Chief Executive Officer.businesses that helpedour service offerings and entry into new markets. In September 2019, we acquired VitreosHealth, an innovator in advanced analytics for predictive and prescriptive health insights, bolstering our predictive analytics capability within our population health management solution and establishing our geographic presence in India. We also made a strategic investment in MedAdvisor, a leading digital medication management company based in Australia, to further evolve our population health management capabilities and potentially expand our product suite, including IntegriGuard, LLC (2009), HealthDataInsights, Inc.(“HDI”) (2011), Essette, Inc. (2016), Eliza Holding Corp. (2017)international presence. In December 2019, we completed the acquisition of Accent, a payment accuracy and others.We operate as one business segment with a single management team that reports to the Chief Executive Officer.Our SolutionsOur coordination of benefits services draw principally upon proprietary information management and data mining techniques designed to ensure that the correct party pays a healthcare claim. Our payment integrity services are designed to ensure that healthcare billings and/or payments are accurate and appropriate. As a result of these services, customers received billions of dollars in cash recoveries in 2016, and saved billions more through the prevention of erroneous payments. In addition, our care management solutions help risk-bearing organizations manage the care delivered to their members with a focus on improving outcomes and patient engagement.3Our services are applicable to federal, state and commercial health plans and prevent and address errors across the payment continuum, from an individual’s enrollment in a program before any medical service is rendered, to pre-payment review of a claim by a payer, through recovery where discovery of an improper payment is made via audit. Our services address a wide spectrum of payment errors, from eligibility and coordination of benefits errors, to the identification and investigation of potential fraud, and extend to most claim types. Our services also assist customers in managing quality, risk, cost and compliance across all lines of business.
In general, our range of services includes the following:§Coordination of benefits servicesWe provide cost avoidance services, which include providing validated insurance coverage information that is used by government-sponsored payers to coordinate benefits properly for future claims. With validated insurance information, Medicaid payers can avoid unnecessary costs by ensuring that they pay only after all other benefits available have been exhausted, thereby complying with federal regulations that require Medicaid to be the payer of last resort. Nevertheless, due to a variety of factors, some Medicaid claims are paid even when there is a known responsible third party. Our government-sponsored program customers rely on us to identify those claims that were paid in error and recover these payments from the liable third party. Further, we also provide services to assist customers in identifying other third-party insurance and recovering medical expenses where a member is involved in a casualty or tort incident. Lastly, for Medicaid agencies exclusively, we provide estate recovery services to identify and recover Medicaid expenditures from the estates of deceased Medicaid members in accordance with state policies. For the years ended December 31, 2016, 2015 and 2014, our coordination of benefits services represented 72.3%, 71.2% and 70.5% of our total revenue, respectively.§Payment integrity servicesOur payment integrity services are applicable to all markets that HMS serves, including the federal and state governments, commercial health plans and other at-risk entities. Our solutions are designed to verify that medical services are utilized, billed and paid appropriately. Our services combine data analytics, clinical expertise and proprietary technology to identify improper payments on both a pre-payment and post-payment basis; identify and recover overpayments/underpayments; detect and prevent fraud, waste and abuse; and identify process improvements. For the years ended December 31, 2016, 2015 and 2014, our payment integrity services represented 24.3%, 24.5% and 24.5% of our total revenue, respectively.4§Care management and member analytics technologiesWe offer a web-based care management platform which helps risk-bearing healthcare organizations identify, engage, and manage at-risk patient populations to improve outcomes while managing costs.CustomersFor each of the years ended December 31, 2016, 2015 and 2014 no one individual Company customer accounted for more than 10% of our total revenue.The composition of our 10 largest customers changes periodically. For the years ended December 31, 2016, 2015 and 2014, our 10 largest customers represented 40.6%, 44.0% and 40.1% of our total revenue, respectively. The current terms of our agreements with these customers have expiration dates ranging between 2017 and 2020. Several of our contracts, including those with some of our largest customers, may be terminated for convenience. The early termination of a contract with one of our significant customers may have an adverse effect on our financial condition, results of operations and cash flows.We provide products and services under contracts (or sub-contracts) that contain various revenue structures, including contingent revenue and fixed-fee arrangements. Most of our contracts have terms ranging from three to five years, including renewal terms at the option of the customer. In many instances, we provide our services pursuant to agreements that are subject to periodic reprocurements. Because we provide our services pursuant to agreements that are open to competition from various businesses in the U.S. healthcare insurance benefit cost containment marketplace, we cannot provide assurance that our contracts, including those with our largest customers, will not be terminated for convenience, awarded to other parties, or renewed. Additionally, we cannot provide assurance that our contracts, if renewed, will have the same fee structures or otherwise be on satisfactory terms.Industry Trends and OpportunitiesU.S. healthcare expenditures continue to escalate and consume a large proportion of our GDP, presenting challenges for payers who wish to contain and reduce costs while also promoting quality healthcare outcomes. These aims are the same across all at-risk entities, including commercial health plans and government healthcare programs, such as Medicaid and Medicare.Within the commercial market, health plans sell policies directly to individuals (on the open market or via health insurance exchanges), contract with employers to underwrite their employees’ care, or contract with self-insured employers to oversee benefit administration to their employees. This market also includes a growing number of risk bearing provider-sponsored plans that operate and market health plan benefits. According to CMS NHE projections, private health insurance covered 195 million individuals in 2016 at a cost of $1.09 trillion.Several commercial health plans also offer government-sponsored lines of business, including partnering with Medicare, Medicaid and CHIP to oversee care delivery for beneficiaries enrolled in those programs. Government managed care grew out of pressures to contain the growth of state and federal program spending and to address general concerns about healthcare access. Commercial health plan-related partnerships with government programs include the following:§Within the Medicaid program, 38 states and the District of Columbia presently contract with managed care organizations to provide care to some or all of their Medicaid beneficiaries. In addition, many states have expanded the use of managed care organizations to new regions or to serve beneficiaries with more complex conditions. Of the 32 states and the District of Columbia that opted to expand Medicaid eligibility levels pursuant to the ACA, all except 5 use Medicaid managed care organizations. The majority of new lives that have entered the Medicaid program as a result of the ACA are enrolled in managed care plans. It is unclear at this time how, if at all, efforts in Congress to “repeal and replace” the ACA could affect any of the state expansions or future growth of Medicaid lives and expenditures.§Similarly, managed care health plans also continue to assume risk for Medicare lives, with the Kaiser Family Foundation estimating that in 2016, nearly one-third of all Medicare recipients were enrolled in a Medicare Advantage plan.5HMS also continues to serve government-sponsored agencies’ legacy fee-for-service programs at the state and federal level. These plans are generally reliant on and susceptible to the government appropriations process that determines their budget and governs the number of beneficiaries they serve.According to the CMS NHE projections, Medicare programs in 2016 covered approximately 56 million people at a cost of approximately $681 billion and Medicaid/CHIP covered approximately 77 million people, costing approximately $593 billion. Altogether, it is projected that the government programs we serve covered approximately 130 million people at a total cost of approximately $1.3 trillion in 2016. Based on the CMS NHE Projections, Medicare spending is projected to grow 5.8% in 2017 over 2016, and CMS projects Medicaid enrollment will grow by 1.7% in 2017 over 2016. Total Medicaid spending is projected to increase at a rate of 4.8% in 2017 over 2016.As commercial and government health plans continue to focus on strategies to contain costs across their different lines of business, we will continue to focus on serving them and meeting their evolving needs. Regardless of the program, coordinating benefits among a growing number of healthcare payers and ensuring that claims are paid appropriately represents an enormous challenge for our customers and an ongoing opportunity for us.Regulatory EnvironmentThe market for cost containment solutions is large and growing, driven by increasing healthcare costs and payment complexities. For 2017, Medicare and Medicaid are projected to pay approximately 45.9% of the nation’s healthcare expenditures and serve over 130 million beneficiaries. Many of these beneficiaries are enrolled in managed care plans, which have the responsibility for both patient care and claim adjudications. Since 1985, we have provided state Medicaid agencies with services to identify third parties with primary liability for Medicaid claims, and since 2005, we have provided similar services to Medicaid managed care plans.In 2006, Congress enacted the DRA and created the Medicaid Integrity Program under the Social Security Act to increase the government’s capacity to prevent, detect and address fraud, waste and abuse in the Medicaid program. Later that year, Congress passed the Tax Relief and Health Care Act of 2006, which established the Medicare RAC program. HDI was awarded one of the first contracts under the program. In October 2016, CMS made a new round of awards and we again were awarded a region.These measures, at both the federal and state level, have strengthened our ability to identify and recover erroneous payments on behalf of our customers.The ACA was signed into law in 2010. It included many provisions impacting healthcare delivery and payment programs, including employer-sponsored health coverage, expansion of the Medicaid program, health insurance exchanges with premium subsidies, and payment integrity efforts. Following the 2016 Presidential and Congressional elections, some or all of the ACA provisions may be revised or repealed, although the scope and timing of such Congressional efforts are yet to be defined. Options that have been discussed include issuing block grants or establishing per capita caps for state Medicaid populations, and looking at program design alternatives for future enrollment criteria. We will monitor ACA-related changes as they develop and assess their potential impact, as well as any opportunities they may present for our customers and for us.CompetitionThe U.S. healthcare insurance benefit cost containment marketplace is a dynamic industry with a range of businesses currently able to offer cost containment services, both directly or indirectly (through sub-contracting), to some or all of the various healthcare payers. In addition, with improvements in technology and the growth in healthcare spending, new businesses are incentivized to enter this marketplace. Many healthcare payers also have the ability to perform some or all of these cost containment services themselves and choose to exercise that option. Competition is therefore robust as customers have many alternatives available to them in their effort to contain healthcare costs.6We compete based on a variety of factors, including our ability to perform a wide range of coordination of benefits and payment integrity related functions; proven results to maximize recoveries and cost avoidance; our in-depth government healthcare program experience; clinical staff expertise; extensive insurance eligibility database; proprietary systems and processes; existing relationships with various customer and other industry shareholders; and our ability to provide customers with actionable intelligence to improve outcomes and patient engagement.Within our core coordination of benefits services, we compete primarily with large business outsourcing and technology firms, claims processors and PBMs, clearinghouses, healthcare consulting firms, smaller regional vendors and other TPL service providers. In addition, we frequently work with customers who may elect to perform some or all of their recovery and cost avoidance functions in-house. The competitive environment for payment integrity services includes some of the same companies that provide coordination of benefits services. Within the care management and risk analytics sector, we compete primarily with vendors who provide these and other population health management technology services. Companies with whom we compete across our product offerings include:§ChangeHealthcare§Experian Health§Verscend Technologies§Cotiviti§IBM/Truven§CaseNet§HP §LexisNexis§MedHok§Optum, Inc.§Performant Financial Corp.§Trizetto§Xerox§SCIO Health Analytics§ZeOmegaBusiness StrategyWe believe that the steadily increasing enrollment and rising expenditures for Medicare and Medicaid, with most new enrollees entering managed care plans; an aging U.S. population with an increasing concentration of individuals with high cost chronic conditions; and the overall complexity of the healthcare claims payment system in the U.S. all combine to create substantial growth opportunities for the suite of cost containment solutions which we offer. We also believe that these factors similarly present growth opportunities for our care management solutions. We expect to grow our business over the course of 2017 and beyond, both organically and inorganically, by leveraging existing key assets (e.g., our data, analytics and in-house expertise, and distribution channel) and pursuing a number of strategic objectives or initiatives, including:§Expanding the scope of our relationship with existing customers– by selling additional products and services.§Adding new customers– by marketing to commercial health plans, including Medicaid managed care and Medicare Advantage plans, at-risk group and individual health lines of business and ASO; government healthcare payers, including Medicaid agencies, state employee health benefit plans and CHIP; at-risk provider organizations and ACOs; and commercial employers.§Introducing new “homegrown” products and services– through internal development initiatives designed to enhance or expand our existing suite of cost containment products.§Utilizing big data – to create a more nimble operating environment and to identify new revenue opportunities within our current service delivery models.§Promoting automation and innovation to improve the efficiency and effectiveness of our services – by continuing to implement new technology and process improvements designed to increase recovery yields and increase customer satisfaction.§Building out our new health management and member engagement technology platform – by establishing a broad foundation of technology and service solutions to help customers better manage quality, cost and compliance across all lines of business. Our first step in this strategy was the acquisition of Essette Inc., a care management platform, in September 2016. More recently, we acquired Eliza Holding Corp., which provides comprehensive and personalized outreach and health engagement solutions, in April 2017.7§Continuing opportunistic growth via acquisition– by selectively seeking assets to complement our core cost-containment expertise; build care management and care coordination adjacencies to complement the Essette and Eliza acquisitions; and expand our data analytics capabilities. Our focus is on acquisitions that have long-term growth potential; target high-growth areas; are accretive to earnings; and fill a strategic need in our business portfolio as we seek to provide increasingly comprehensive solutions to our customers.Employees2016,2019, we had 2,315 employees, of which 2,287 were full-time. Of our total employees, 253 support SG&A activities.Intellectual PropertyOur ability to develop and maintain the proprietary aspects of our technology and operate without infringing the proprietary rights of others are important to our business and competitive position. We establish and protect our proprietary technology and intellectual property through a combination of patents, patent applications, trademarks, copyrights, domain names, trade secrets, including know-how, confidentiality and invention assignment agreements, security measures, non-disclosure agreements with third parties, and other contractual rights. As a result of acquiring Eliza Holding Corp. on April 17, 2017, we now own a patent portfolio comprised of approximately 55 domestic and international patents and patent applications. We do not believe that any one individual technology is essential to our business.Available Information The content on our website, or any website referred to in this Annual Report on Form 10-K, is not incorporated by reference into this Annual Report, unless expressly noted. You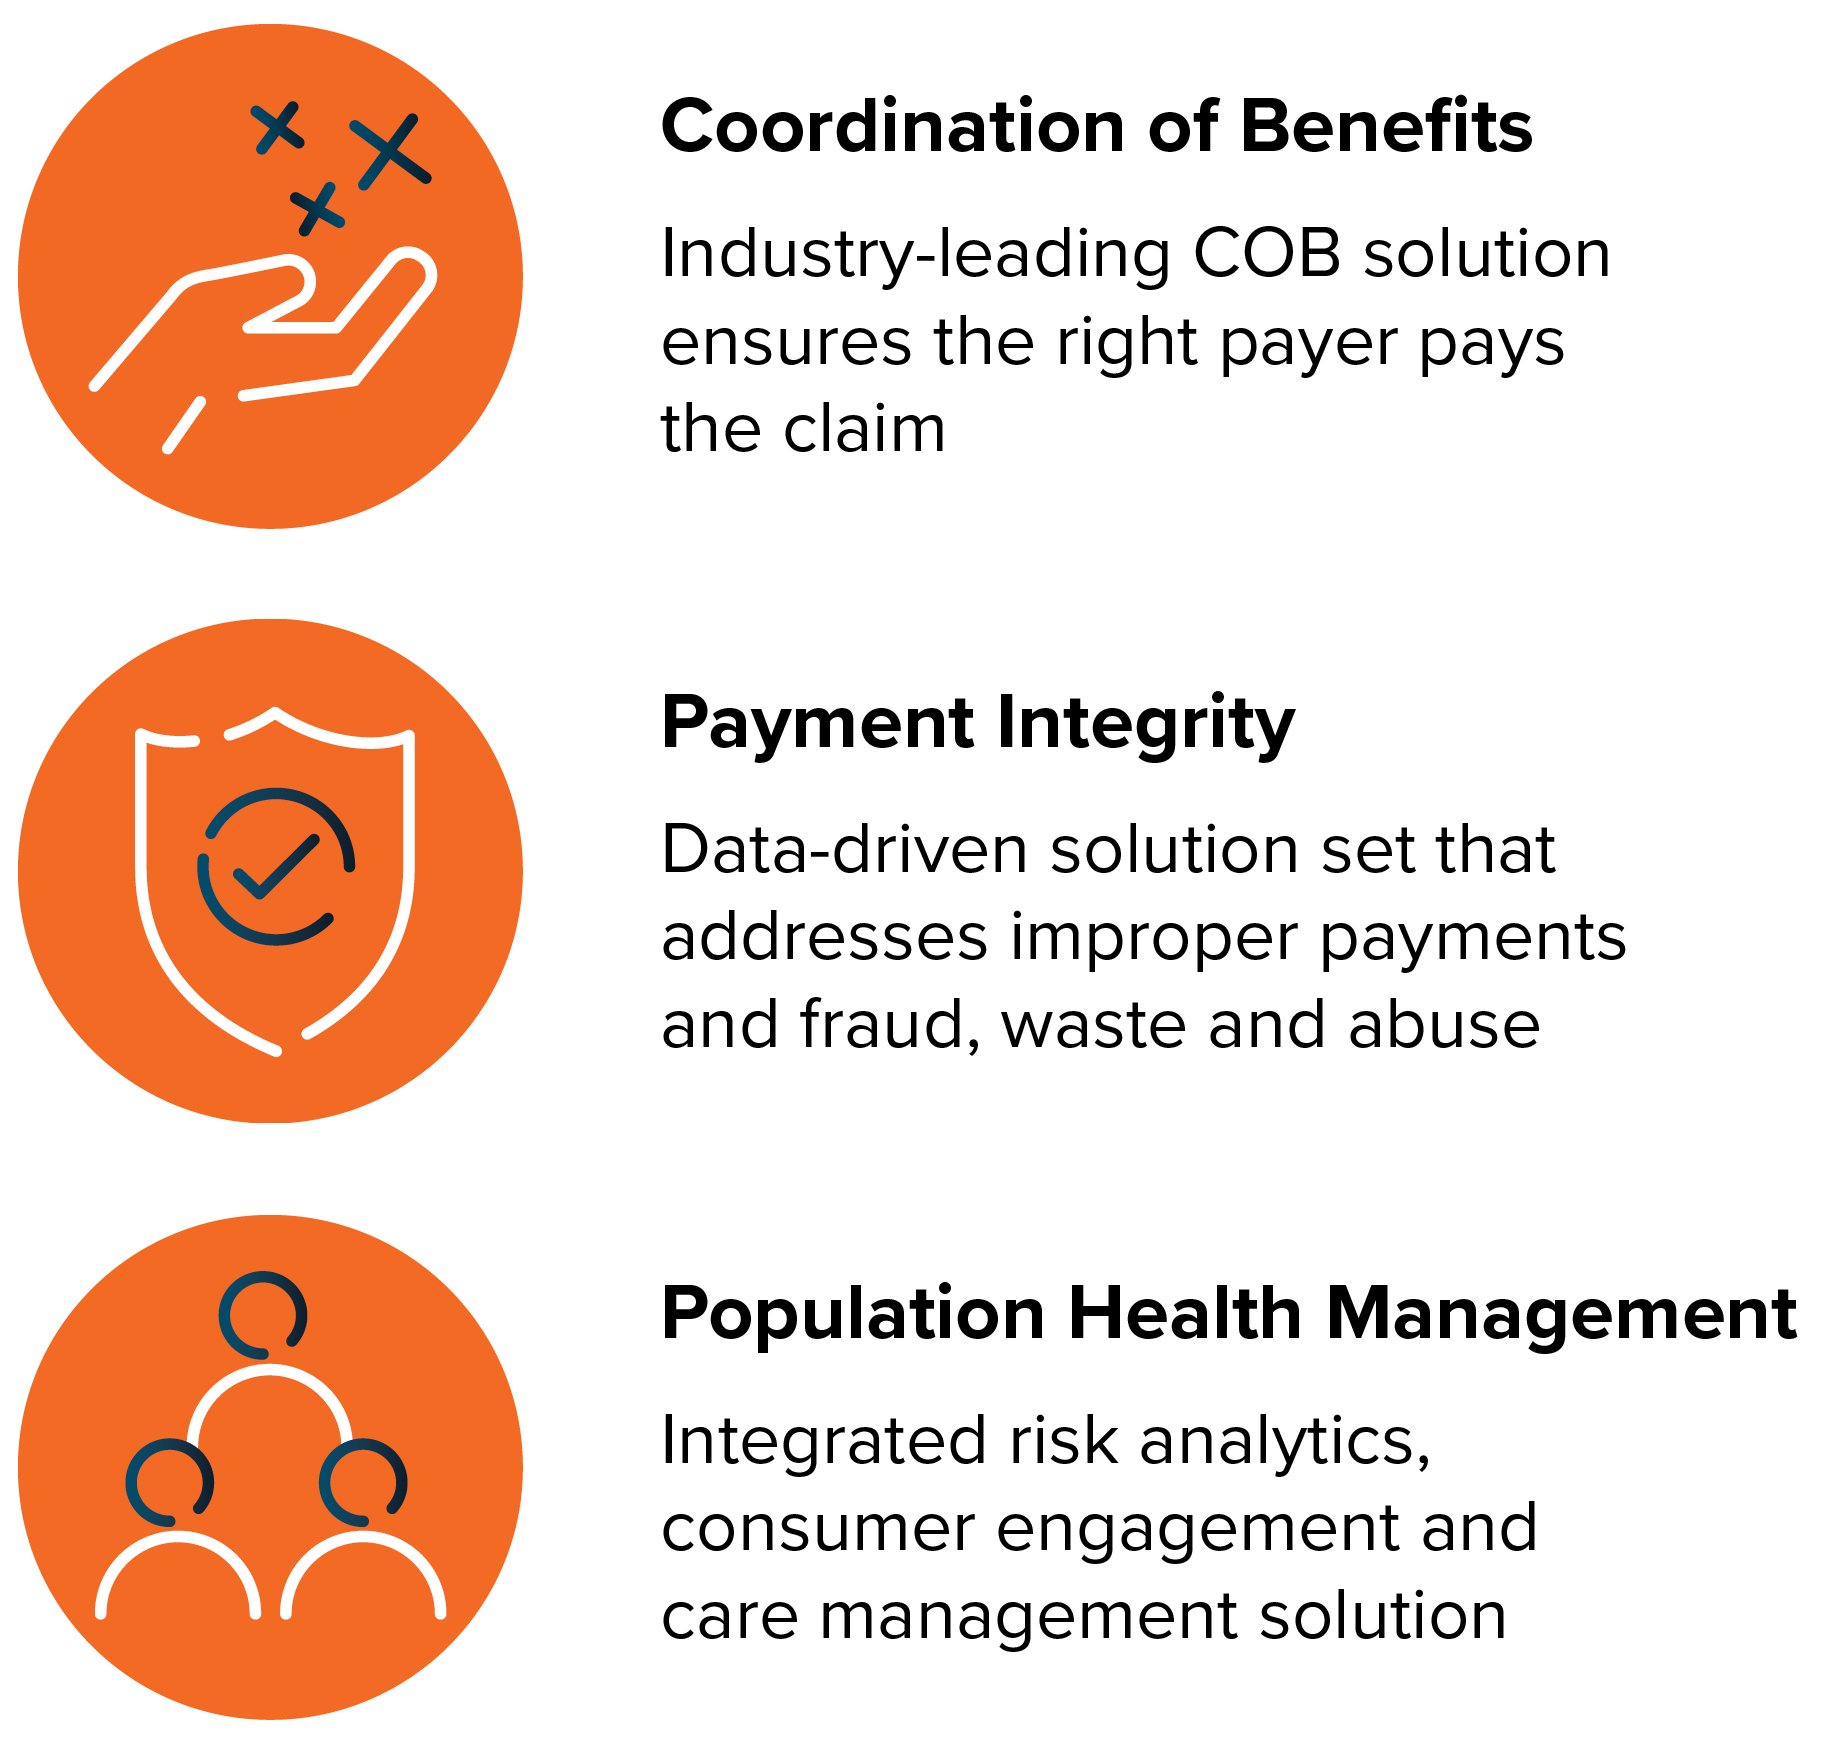
▪ Accenture plc ▪ Casenet LLC ▪ Change Healthcare ▪ Cotiviti, Inc. ▪ DXC Technology Company ▪ ExlService Holdings, Inc. ▪ IBM Watson Health ▪ Inovalon Holdings, Inc. ▪ MEDecision, Inc. ▪ MHK ▪ Performant Financial Corporation ▪ Optum, Inc. (subsidiary of UnitedHealth Group; Equian is part of Optum) ▪ WellTok, Inc. ▪ ZeOmega, Inc. read and copy any materials we file with the SEC at the SEC’s Public Reference Room at 100 F Street NE, Washington, D.C. 20549. Information on the operationrepurchase our shares, pursuant to a two-year $50 million authority granted by our Board of the Public Reference Room may be obtained by calling the SEC at 1-800-SEC-0330.20162019 Form 10-K, including our Consolidated Financial Statements and the related Notes. The occurrence of any of these risks could adversely affect our business, financial condition, results of operations, and cash flows in a material way. the scope of our business operations have expanded over the past several years, and we currently intend to continue to growour growth and expandexpansion into new healthcare areas within the government and commercial healthcare space;markets, however, suchour growth and expansion strategy carries costs and risks that, if not properly managed, could adversely affect our business. Our future growth will depend on, among other things, on our ability to successfully execute our business plans, which includes penetrating new markets, cross-selling our solutions to new and continued efforts to improveexisting customers, broadening and deepening our operations,customer relationships, our brand identity and our talent pool, identifying and executing future acquisitions, investments and strategic relationships, and increasing the speed, quality, capacity and scale at which we deliver our services across emerging and more established markets, all while remaining competitive. We must also be flexible and responsive to our customers’ needs and to changes in the political, economic and regulatory environment in which we operate. The greater size and complexity of our expanding business putsmay put additional strain on our administrative, operational and financial resources and can make optimal resource allocation more difficult to determine. WeIt is possible that we may not be able to maintain or accelerate our growth. A failure to anticipate or properly address the demands and challenges that our continued growth strategy and potential diversification may have on our resources and existing infrastructure may result in unanticipated costs and inefficiencies andthat could negatively impact our ability to execute on our business plans and growth goals, which couldmay have a material adverse effect on our business, financial condition, results of operations and cash flows.8solutions and servicesofferings may not be responsive to customer preferences or industry changes, appropriately timed with market opportunity or effectively brought to market, and that the solution and service development initiatives that we prioritize may not yield the gains that we anticipate, if any. If we are unable to predict market preferences or healthcare industry changes, or if we are unable to develop or adapt solutions and services that are responsive to existing and potential customers’ needs, we may fail to expand our business, which could constrain our future revenue growth and materially adversely affect our business, financial condition, results of operations and cash flows.Historically, totheour service offerings, including our population health management solutions, and services we offer, provided a presence in complementary business lines, or expandedbroadened our customer base and our market and geographic presence and/or customer base. For example, we acquired IntegriGuard, LLC in September 2009; Verify Solutions, Inc. in December 2009; Allied Management Group-Special Investigation Unit in June 2010; Chapman Kelly, Inc. in August 2010; HDI in December 2011; MedRecovery Management, LLC in December 2012; Essette, Inc. in September 2016; and Eliza Holding Corp. in April 2017.expandcomplement and diversifygrow our business lines and to engage periodically engage in discussions regarding such possible acquisitions.transactions. We are subject to risks and uncertainties relating to our ability to identifyacquisition candidates,acquisitions, investments and strategic relationships, and to consummate additional acquisitionstransactions that will be advantageous to us and to successfully integrate future acquisitions.acquired businesses, solutions, services, technologies or employees. Future and potential business acquisitions, investments and strategic relationships involve a number of risk factors that could affect our operations, including, but not limited to:§diversion of management’s attention and other resources;§our ability to integrate operational, accounting and technology functions, policies, processes, systems and controls, and to implement these functions, policies, processes, systems and controls, without incurring substantial expenses, delays or other issues;§our ability to integrate personnel and human resource systems as well as the cultures of the acquired business;§our ability to retain or replace the key personnel of the acquired business;§our ability to maintain relationships with the customers of the acquired business and further develop the acquired business;§our ability to cross-sell our solutions and services and the solutions and services of the acquired business to our respective customers;9§customer dissatisfaction or performance problems with the acquired business;§our ability to comply with regulatory requirements and avoid potential conflicts of interest in markets that we serve;§the misuse of intellectual property by the personnel of the acquired business;§our ability to successfully enter into unfamiliar markets;§assumption of unanticipated legal or financial liabilities and/or negative publicity related to prior acts by the acquired business;§we may become subject to litigation or other claims in connection with the acquired business, including claims from terminated employees, customers, former shareholders or third parties;§we may become significantly leveraged as a result of incurring debt to finance an acquisition;§we may encounter unanticipated operating, accounting or management difficulties in connection with the acquired business;§the acquired business may not perform as projected which could negatively impact earnings or contingent consideration;§we may suffer impairment of goodwill and other acquired intangible assets; and§we may suffer dilution to our earnings per share.performance. We have experienced significant variations in our revenue between reporting periods due to the timing of periodic revenue recovery projects, the timingperformance and delays in third party payers’ claim adjudication and ultimate payment to our customers where our revenue is contingent upon such collections and delays in receiving payment for our services. Our revenue and operating results have also been impactedcould vary significantly from period toperiod-to- period as a result of a number of factors, some of which are outside of our control, including,control. We have experienced fluctuations in our revenue and operating results in the past and they may vary in the future for reasons that include, but are not limited to:§fluctuations in sales activity given our sales cycle;§the commencement, completion or termination of contracts during any particular quarter;§expenses related to certain contracts which may be incurred in periods prior to revenue being recognized;§the timing of government contract awards;§the time required to resolve bid protests;§contract renewal discussions, which result in delayed payments for services already performed;§technological and operational issues affecting our customers, including delays in payment receipt for previously recognized revenue due to delays in certain customers processing our findings through their systems;§adjustments to age/quality of receivables and accruals as a result of delays involving contract limitations and changes or sub-contractor performance deficiencies or internal managerial decision not to pursue identified claim revenue from customers; and§regulatory changes or general economic conditions as they affect healthcare providers and payers.Occasionallypayments. We also typically face a long implementation period with a new customer or a new contract with an existing customer and may not be able to estimate with certainty the period in which implementation may be completed.We cannot predict the extent to which future variations could occur due to these or other factors. Although we have experienced some seasonal trends in our operational volume, we do not consider our operations to be seasonal to any material degree.payment. Consequently, our operating results are subject to significant fluctuation for any particular quarter, fiscal year, or other period, and may not be indicative of future periods. Significant fluctuationsOur business is also subject to seasonal patterns resulting from increased efforts at year-end by certain customers to generate additional savings, complete compliance obligations and close gaps in care. However, taken as a whole, we do not consider our operations to be seasonal to any material degree. Due to all of these factors, our revenue and operating results are difficult to predict and are subject to significant fluctuation, which may cause the market price of our common stock to decrease significantly.10 and solutions, and any failure to accurately forecast such revenue could have a material adverse effect on our business, financial condition, results of operations and cash flows.time-and-materialtime-and-materials based contracts with the federal government where our revenue is recognized based on costs incurred plus an estimate of the negotiated fee earned. Our ability to earn a profit on these contracts requires that we accurately estimate the costs involved with these contracts and assess the probability of achieving certain outcomes or milestones within the contracted time period. In addition, we cannot predict with certainty the costs or the period in which implementation or contracts may be completed when we introduce new solutions or services into the marketplace. WeFor our coordination of benefits and also face a long implementation period with a new customer or a new contract with an existing customer, making it difficult to reliably forecast revenue under those contracts. If we do not accurately estimate the costs and timing for completing projects, or if we encounter increased or unexpected costs, delays, failures, liabilities or risks, including those outside of our control, our contracts could prove unprofitable for us or yield lower profit margins than anticipated. Although we believe that we have recorded adequate provisions in our financial statements for losses on our fixed-pricefixed price and cost-plus contracts where applicable, as required under U.S. GAAP, our contract loss provisions may not be adequate to cover all actual future losses.§power loss, transmission cable cuts and telecommunications failures;§damage or interruption caused by fire, earthquake and other natural disasters;§software defects;§cyber security breaches; and§physical break-ins, sabotage, intentional acts of vandalism, terrorist attacks and other events beyond our control. operating facilities, an extended outage of utility or network services supplied by third party IT vendors or providers may delay or disrupt the delivery or performance of the solutions and services we provide for our customers. We also utilize third-party cloud service providers to help us efficiently scale certain cloud-based solutions. If we or our cloud service providers encounter a lengthy business interruption, or in the event our disaster recovery and business continuity plans and business interruptionare not effective, or our applicable insurance coverage areis denied or not adequate or failsufficient to compensate usfor all the liability on a timely basis, we could suffer operational, communication and service disruptions, disputes with customers and third parties, civil or criminal penalties, regulatory problems, increases in administrative expenses, loss of our ability to produce timely and accurate financial and other reports, damage to our reputation or customer relationships or other adverse consequences, any of which could have a material adverse effect on our business, financial condition, results of operations and cash flows.input,process, transmit, maintain, store and communicatehost the confidential, proprietary and proprietarysensitive information and data we receive on behalf offrom our customers as well as third-party products and services.other data suppliers, including private insurance plans and financial institutions. Some of the data we process, access, store and transmit may be outside of the United States due to our international business operations. In addition, sub-contractors,subcontractors, teaming partners or other third-party vendors may receive or utilize this information on our behalf.behalf in support of the services we perform for our customers. The secure processing and maintenance of this information is critical to our operations and business strategy. OurWe have devoted and continue to devote significant resources to implement security and privacy programs and controls, train our workforce and augment our security measures orwith new and enhanced technologies and processes, among other investments. Despite our security management efforts, our information technology and infrastructure, and those of third parties on which we rely, couldmay continue to be compromisedvulnerable to computer hacking or breached as a result of computer hacking,phishing efforts, acts of vandalism or theft, introduction of malware, computer viruses, other malicious codes or other cyber-attacks, employee error or insider malfeasance and misfeasance issues, fraud, human error, catastrophes, or other unforeseen events. We may be unable to information technology or infrastructure could be accessed improperly, made unavailable, improperly modified, corrupted or corruptedotherwise breached or compromised, or we could suffer system disruptions, shutdowns and denials of service. The occurrence of any of these events could cause our solutions and services to be perceived as vulnerable, cause our customers to lose confidence in our solutions and services, negatively affect our ability to attract new customers, cause existing customers to terminate or not renew our solutions and services and damage our reputation, all of which could reduce our revenue, increase our expenses and expose us to legal claims and regulatory actions. Similarly, we could be materially adversely affected by the loss of proprietary, trade secret or confidential technical and financial data if our internal networks are compromised. The occurrence of any of these events could harm the market perception of the effectiveness of our security measures, lead to reputational damage or the loss of our customers’ confidence in our solutions, negatively affect our ability to attract new customers, cause existing customers to terminate or not renew their existing contracts with us, or deter them from using our solutions or services in the future, all of which could reduce our revenue, increase our expenses and expose us to potential liability under privacy, security or other applicable laws and regulations, including losses and costs associated with any resulting fraud. We also may be subject to regulatory fines and penalties imposed by government regulatory agencies, and damages and other substantial costs associated with litigation, indemnification and contractual obligations, increased cybersecurity insurance premiums, and additional remediation efforts, such as credit monitoring, call center services or other corrective plans. We may be unable to implement adequate preventive measures to protect against such compromises. We could also be forced to expendspend significant time and resources in response to a cyber-securityinvestigating the cause of the breach, including repairing system damage, increasingremediating vulnerabilities in our security procedures, disseminating breach notifications, enhancing cyber security protection costs bycontrols and measures, and deploying additional security personnel and protection technologies, paying regulatory fines and litigating and resolving legal claims and regulatory actions, all of which could increase our expenses, divert the attention of our management and key personnel away from our business operations and materially adversely affect our results of operations.11If we are unable to protect our proprietary technology, information, processes, know-how, and other intellectual property and intellectual property rights, or become subject to claims of infringing or misappropriating the intellectual property of third parties, the value of our solutions and services may be diminished and our business may be materially adversely affected.Our success as a company depends in part upon our ability to protect our core technology and intellectual property. Our expanding operations and efforts to develop new solutions and services also make protection of our intellectual property more critical. We seek to protect trade secrets and other proprietary information through confidentiality agreements and invention assignment agreements with employees, consultants and other third parties, as well as through the terms of our agreements with customers and vendors, and other security measures. However, the steps we have taken to deter misappropriation of intellectual property may be insufficient to protect our proprietary information. Misappropriation of our intellectual property by third parties, or any disclosure or dissemination of our confidential and proprietary business intelligence, queries, algorithms and other similar information by any means, could undermine any competitive advantage we currently derive or may derive from that intellectual property. For example, our current or former employees, consultants or other third parties may unintentionally or willfully disclose our trade secrets, know-how or other confidential and proprietary information to competitors. Competitors have also attempted to use state open records and/or federal Freedom of Information Act laws to obtain our proposal responses and other documents we provide to our government customers. We cannot be certain that our efforts to protect the confidential and proprietary trade secret information or intellectual property in these proposals or other documents will always be successful, due to the many factors underlying the various state and federal decisions to release information in response to open records requests (even in spite of our objections and efforts to protection information). On the other hand, third parties may claim that we are infringing upon or misappropriating their intellectual property. Our exposure to risks related to the use of intellectual property may also increase as a result of acquisitions because third parties may make infringement and similar or related claims after we have acquired technology. Any of these situations could cause us to expend significant time and resources and to incur substantial costs associated with litigation or legal proceedings that may be necessary to defend ourselves or to enforce our intellectual property rights, in which we may not ultimately prevail, and could result in our being prevented from furnishing certain solutions and services. If the protection of our proprietary rights is inadequate to prevent unauthorized use or appropriation by third parties or our employees, the value of our brand and other intangible assets may be diminished and others may be able to more effectively compete with our business by offering solutions or concepts that are substantially similar to ours, which could have a material adverse effect on our business, financial condition, results of operations and cash flows.We face significant competition for our solutions and services and we expect competition to increase, which could materially adversely affect our business, financial condition, results of operations and cash flows.The market for healthcare cost containment solutions and services is intensely competitive, driven by rapidly changing technologies, evolving industry standards and customer demands to become more efficient. Our competitors range in size from large, diversified national companies to small, specialized firms, and could include current or former sub-contractors or teaming partners seeking to establish direct relationships with our customers in order to perform similar services as the prime contractor, as well as current and prospective customers that elect to perform recovery and cost avoidance functions in-house or to develop in-house capacities for solutions and services that we provide or hope to provide. Consolidation among vendors and healthcare providers, as well as the merging of some of our competitors or formation of business alliances with other competitors, have contributed to the increasingly competitive environment. For example, certain state customers have combined or “bundled” TPL services under large-scale IT procurements, allowing MMIS vendors to partner with less experienced TPL identification vendors based on preferred relationships or favorable pricing. In addition, companies that have invested in proprietary technology different from our own solution and service offerings, such as front-end analytics, have emerged as new competitors due to the rapidly evolving healthcare landscape. There is also increasing sophistication in the solutions and services that our competitors are developing that may become more efficient or appealing to our customers. In order to remain competitive, we may need to quickly develop and market new and enhanced solutions and services responsive to emerging technologies and changes in the healthcare industry, which may require that we make substantial financial and resource investments.12We may not be able to compete successfully against our existing or future competitors. Some of these competitors have significantly greater financial and technical resources and market recognition than we do. They may be able to (i) offer lower prices or negotiate fee reductions on our current solutions and services, (ii) respond more quickly than we can to new and emerging technologies and changing customer requirements, (iii) devote greater resources to the sale of their solutions and services and the development and implementation of new and improved systems, solutions and services for customers that we serve, and (iv) pursue various acquisitions that allow them to rapidly amass a wide array of capabilities. We may be forced to lower our pricing, unexpectedly increase or enhance our technological or data capabilities, or modify our solution or service offerings. Notwithstanding any changes we make in response to increased competition, the demand for our solutions and services may decrease as a result of increased competition. A failure to be responsive to our existing and potential customers’ needs or the changing industry landscape could hinder our ability to maintain or expand our customer base, hire and retain new employees, pursue new business opportunities, complete future acquisitions and operate our business effectively. Any inability to compete effectively could materially adversely affect our business, financial condition, results of operations and cash flows.Our business could be materially adversely affected if we fail to maintain a high level of customer retention, if our customers elect to reduce the scope of our contracts or terminate them before their scheduled expiration dates or if we fail to meet performance standards under our customer contracts.We historically have derived and expect to continue to generate a significant portion of our revenue from a limited number of large customers at the federal and state level. Our contracts with these customers are subject to periodic renewal and some permit them to terminate their contracts on short notice, with or without cause. If a customer is dissatisfied with the quality of our work or if we fail to meet performance standards under our contracts, or if our solutions, technical infrastructure or services do not comply with the provisions of our contractual agreements or applicable regulatory requirements, customers might seek to reduce the scope of the services we perform or prematurely terminate their agreements with us, or we could incur additional costs that may impair the profitability of a contract and damage our ability to obtain additional work from that customer, or other current or prospective customers. For example, some of our contracts contain liquidated damages provisions and financial penalties related to performance failures, which if triggered, could materially adversely affect our reputation, business, financial condition, results of operations and cash flows. We also may be required to disclose such liquidated damages or other financial penalties assessed against us in connection with future bids for services with other customers.In addition, government customers are subject to financial pressures or pressure from stakeholders that may cause them to terminate contracts for our services that may be regarded as non-essential or to redefine or reduce the scope of our contracts by, for example, significantly reducing the volume of data that we are permitted to audit. Despite our right to prompt and full payment under the terms of our contracts, we could face challenges in obtaining timely or full payments for our properly provided services from our customers. If there is a substantial reduction in the scope of our services under, or a termination of, any of our key contracts with our major customers, or if we are exposed to significant costs, liabilities or negative publicity, our ability to compete for new contracts with current or prospective customers could be damaged and our business, financial condition, reputation, results of operations and cash flows could be materially adversely affected.13TheseAs a result of the services we provide, we process a number of complex transactions that require us to access, store, retrieve, manipulate, manage and transmit the information and data of our customers’ and external third parties, as well as our own data. Although we have invested a great deal of time and resources in developing systems, processes and controls that protect the integrity of the data, such measures cannot provide absolute security. It is possible that failures or errors in hardware and software, including those in third-party technology, or technical deficiencies in our systems could result in data loss or corruption, or cause the data that we collect, utilize or disseminate to be incomplete or contain inaccuracies that our customers regard as significant. In addition, these information systems and applications require continual maintenance, upgrading and enhancement to meet our operational needs, satisfy customer requests and handle our expansion and growth. Despite our testing and quality control measures, we cannot be certain that errors or system deficiencies will not be found and that remediation can be done in a timeframe that is acceptable to our customers, or that customer relationships will not be impaired by the occurrence of errors or the need for remediation. In addition, implementation of upgrades and enhancements may cost more, take longer or require more testing than originally expected. Given the large amount of dataAs we collect and manage, it is possible that hardware failures or errors or technical deficienciescontinue to expand our business, we face additional challenges in our systems could result in data loss or corruption or cause the information that we collect, utilize or disseminate to be incomplete or contain inaccuracies that our customers regard as significant.implementing adequate internal control over financial reporting. Situations may also arise in which the accuracy of our data analysis or the content and quality of our work product is central to the disposition of claims, controversies or litigation between our customers and third parties that would require us to allocate significant resources to fulfilling our contractual obligations to provide our customers with full and complete access to records, analysis and back-up documentation of our work. Assuring our capacity to fulfill these obligations as well as actually fulfilling them could impose significant burdens on our infrastructure for data storage, maintenance and processing, and require us to incur increased costs to supplement our personnel, data storage and computing resources, which could materially and negatively impact other business operations.anany inability to successfully manage our relationships with a number of these suppliers may harm the quality and availability of our solutions and services.interpretation. For example, data suppliers could seek to limit or end our access to and use of their data if they determine that certain uses of data for our customers are not permitted by our agreements, or such suppliers may make errors in compiling, transmitting or accurately characterizing data or have technological limitations that interfere with our receipt or use of the data we rely on them to provide.interpretations. If a number of our information sources become unable or unwilling to provide us with certain data under terms and conditions of receipt, processing or use that are acceptable to us and our customers, or if laws and regulations for use and protection of this data changes in a way that disincentivizescould disincentivize our suppliers, or imposesimpose unacceptable or unreasonable conditions, costs, or risks on us, we may not be able to obtain new or favorable agreements with alternative data suppliers. In addition, our ability to normalize and fully utilize the information we have receivedreceive from various data sources in order to enhance and improve current solutionsservices for our customers is an important component of our growth strategy. Although we believe that we have the legal and contractual rights necessary to normalize and use the data we have obtained from these sources for potential or contemplated solution and service offerings, we cannot provide assurance that these entities will permit the use of their data for these purposes. If we lose a number of our data sources or our access to certaintheir data, and are unablefail to identify and reach the requisite agreements with suitable alternative suppliers or fail to successfully integrate themtheir data into our solutionsolutions and service offerings,services, or if there is a lack of accuracy or integrity in the data that current or future suppliers provide, we could experience service disruptions, increased costs, reduced quality of our solutions and services, or performance penalties under our customer contracts, which could have a material adverse effect on our business, financial condition, results of operations and cash flows.14sub-contractorssubcontractors and other third party providers to provide customers with a single-source solution or service or we may serve as a sub-contractorsubcontractor to a third party prime contractor. If these parties fail to satisfy their obligations to us or if we are unable to maintain these relationships, our business, financial condition, results of operations and cash flows could be materially adversely affected.sub-contractors,subcontractors, teaming partners, vendors or other third party providers to provide our customers with a single-source solution or service for a broader range of service needs. These third parties include software vendors, utility and network providers, cloud service providers, contingent workers and other information technology service providers.providers and solution partners. Our ability to deliver and implement solutions and serve our customers effectively depends on our ability to obtain permissions from our customers, when necessary, to use these third party sub-contractors, or on these third parties meeting our service standards in both timeliness and quality. Similarly, we arequality, and may in the future be engaged as a sub-contractor to a third party prime contractor. Sub-contracting arrangements where we are not the prime contractor pose unique risks to us because we do not have control over the customer relationship, andcertain instances, on our ability to generate revenue under such sub-contracts is dependent onobtain customer approval for the prime contractor, its performance and relationship with the customer, and its relationship with us.use of these third party subcontractors. While we believe that we perform appropriate due diligence on these third parties and take adequate measures to ensure that they comply with the appropriate laws and regulations, we cannot guarantee that they will comply with the terms set forth in their agreements with us or in the case of a prime contractor, their agreement with the customer or that they will provide adequate and timely services, construe their contractual rights and obligations in a reasonable way, act appropriately in dealing with us or customers, and remain in compliance with the relevant laws, rules or regulations. As a result, we may have disputes with these parties arising from these or other matters.us. Performance deficiencies or misconduct by our prime contractorssubcontractors, teaming partners, vendors or sub-contractorsother third party providers may be perceived as inadequacies in our solutions or services or cause us to fail to fulfill our contractual obligations to our customers, which could materially adversely affect our customer relationships and reputation, result in termination of a customer contract or the sub-contractor or partner,contracts, and subject us to a disputedisputes with our customer or such third party.customers. In addition, if our third party service providers terminate or refuse to renew their relationships with us or offer their products to us in the future on less advantageous terms, we may not be able to perform or deliver solutions or services for existing customers as expected. Likewise,suffer losses inmaterially adversely affect our reputation and subject us to a dispute with the prime contractor or the customer. In the event a prime contract under which we serve as a sub-contractor, is terminated, whether for non-performance by the prime contractor or otherwise. Upon any such termination of the prime contract,otherwise, our sub-contractsubcontract will similarly terminate, and the resulting contract loss could materially adversely affect our business, financial condition, results of operations and cash flows. significant portion of our business through competitive bidding in response to government requests for proposals. Reprocurements and future contracts may not be awarded through this process on the same level or our contract awards may be challenged by interested parties which could materially adversely affect our business, financial condition, results of operations and cash flows. and services and compete for contracts with existing and potential state and federal customers, we are often required to respond to government-issued RFPs. These RFP responses typically require us to assemble and submit a large volume of information within a rigid timetable, and to accurately estimate our cost structure for servicing the proposed contract, the time required to establish operations and the likely terms of any proposals submitted by our competitors. We may also be required to disclose the occurrence of anycertain negative events suffered by our business, such as customer disputes, a government inquiry or audit, or an adverse judgment or settlement in litigation or a legal proceeding, which could impair our ability to win the contract at issue or have a material adverse effect on our reputation in the industry.15lawsuitslegal proceedings and other claims that arise from time to time in the ordinary course of our business, which may include, but are not limited to, those related to, for example, contracts, sub-contracts,claims brought by our customers in connection with billing and contractual disputes, subcontracts and teaming agreements, protection of confidential information or trade secrets, individual or class action claims in relation to the services we provide, claims relating to pending, terminated or completed acquisitions or dispositions, or relating to investments or strategic relationships, adversary proceedings arising from customer bankruptcies, employment of our workforce and immigration requirements or compliance with any of a wide array of state and federal statutes, rules and regulations that pertain to different aspects of our business.business, both domestically and internationally. We may also be required to initiate expensive litigation or other proceedings to protect our business interests. There is a risk that we will not be successful or otherwise be able to satisfactorily resolve any pending or future litigation. In addition, litigation and other legal claims are subject to inherent uncertainties and management’s view of currently pending legal matters may change in the future. Those uncertainties include, but are not limited to, litigation costs and attorneys’ fees, unpredictable judicial or jury decisions, and the differing laws and judicial proclivities regarding damage awards amongin the statesjurisdictions in which we operate. Resolution may also require that HMS accept some amount of loss or liability in order to avoid customer abrasion, negative marketplace perceptions and other disadvantageous results. Unexpected outcomes in such legal proceedings, or changes in management’s evaluation or predictions of the likely outcomes of such proceedings (possibly resulting in changes in established reserves), could have a material adverse effect on our business, financial condition, results of operations and cash flows. solutions is dependent upon our ability to recruit, employ, train and retain skilled personnel. Our ability to maintain our productivity and profitability is limited bydependent on our ability to attractidentify, recruit, employ, train and retain the skilled personnel necessary to sustain our business and operations.personnel. The success of recruitment and retention strategies depend on a number of factors, including the competitive demands for employees having the skills we need, and the level of compensation required to hire and retain such employees. Asemployees and immigration requirements that may affect our business expandsability to sponsor employees for employment-based visas. Customers or competitors may seek to hire away qualified and undergoes change, we may also find it difficult to preserve our corporate culture,seasoned employees, which could reduce our ability to innovate and operate effectively or result in a loss of experienced personnel. In addition, our customers or competitors may hire away our qualified employees.effectively. We may not be able to recruit the appropriate personnel or maintain the personnel necessary to efficiently operate and support our business in the future, and even if our recruitment and retention strategies are successful, our labor costs may increase significantly. Our inability to hire sufficient personnel on a timely basis without significantly increasing our labor costs could materially adversely affect our business, financial condition, results of operations and cash flows.managersleaders who have successfully managed, designed, or implemented and led government services programs or information technology projects,initiatives, or have relevant experience in other healthcare sectors, ofincluding data management or the healthcare industry.and analytics. These individuals are in great demand and are likely to remain a limited resource in our industry. The loss of services of one or more members of our management team could materially adversely affect our business, financial condition, results of operations and cash flows. In addition, to the extent we lose an executive officer or senior manager,leader, we may incur increased expenses in connection with the hiring, promotion or replacement of these individuals and the transition of leadership and critical knowledge.16obligations.2016,2019, the outstanding principal balance due under our Credit Agreement was $197.8$240 million. Our Credit Agreement provides for a senior secured revolving credit facility in an aggregate principal amount equal to $500 million and is secured, subject to certain customary carve-outs and exceptions, by a first priority lien and security interest in substantially all of our tangible and intangible assets. Our outstanding indebtedness and any additional indebtedness we incur may have important consequences for us, including, without limitation, that: (i) (ii) (iii) (iv) leverage may prevent us from taking advantage of business opportunities as they arise or successfully carrying out our plans to expand our business; andIn addition, our ability to make payments of principal and interest on our outstanding revolving credit facility depends upon our future performance and our ability to generate cash flows. the terms of the Credit Agreement, we are also required to comply with specified financial and operating covenants, which may limit our ability to operate our business as we otherwise might operate it. For example,The Credit Agreement also contains (i) certain affirmative covenants that impose certain reporting and/or performance obligations on us and our restricted subsidiaries, (ii) certain negative covenants that generally limit, subject to various exceptions, us and our restricted subsidiaries from taking certain actions, including, without limitation, incurring indebtedness, creating liens, engaging in mergers and consolidations, disposing of certain assets or property, making certain investments and acquisitions, entering into certain transactions with affiliates, swap agreements or sale-leasebacks, making certain restricted payments, including dividends and share repurchases, changing our fiscal year or the lines of business that we or our restricted subsidiaries conduct to a material extent, and prepaying certain junior indebtedness, (iii) financial covenants consisting of a maximum consolidated leverage ratio and a minimum interest coverage ratio, and (iv) customary events of default for financings of this type.accelerateddeclared due and payable upon the occurrence and during the continuance of an event of default, including,which includes, without limitation, payment defaults,limitation: non-payment of principal or reimbursement obligations when due; non-payment of interest, fees and other amounts for a period of five business days after the due date; material inaccuracies of representations and warranties; failure to perform affirmativeor observe covenants, conditions or agreements (subject to any applicable grace periods); cross-defaults of certain indebtedness; inability to pay debts;refrain from actions or omissions prohibited by negative covenants, the inaccuracy of representations or warranties, cross-defaults, bankruptcy and insolvency related defaults, defaults relating to judgments, defaults due topay certain ERISA related eventsmaterial judgments; and a change of control default.as defined in the Credit Agreement. If not cured, an event of default wouldcould result in any amounts outstanding, including any accrued interest and unpaid fees, becoming immediately due and payable, and would give our lenders the right to proceed against the collateral granted to them to secure the debt, which would require us to, among other things:things, seek additional financing in the debt or equity markets, refinance or restructure all or a portion of our indebtedness, sell selected assets, and/or reduce or delay planned capital or operating expenditures. Such measures might not be sufficient to enable us to service our debt, and any such financing or refinancing might not be available on economically favorable terms or at all. Our ability to make payments of principal and interest on our outstanding credit facility depends upon our future performance and our ability to generate cash flows. If we are not ableunable to generate sufficient cash flows to meet our debt service obligations or are forced to take additional measures to be able to service our indebtedness, our business, financial condition and results of operations could be materially and adversely affected. or interpretations of, tax rules and regulations, or in interpretations thereof, may materially adversely affect our effective tax rates.United States-basedU.S.-based company subject to various federal, state and local tax laws and regulationstaxation in multiple U.S. jurisdictions that govern numerous aspects of our business.and foreign jurisdictions. As we continue to expand our business we may perform services for new customers located outside of the United States, or in a U.S. Territory, whichwe may become subject us to foreignadditional tax laws and regulations, including those that could increase our exposure to additional tax liabilities. Unanticipatedliabilities, such as foreign tax laws, and laws relating to U.S. taxes on foreign operations. Our future effective tax rates could be materially affected by various factors, including changes in the tax rates of jurisdictions in which we do business, changes in relevant tax and accounting rules, regulations and interpretations, increases in expenses not deductible for tax purposes, including impairments of goodwill, changes in the valuation of our deferred tax assets and liabilities, and changes in geographic sales mix. For example, in December 2017, Congress enacted the 2017 Tax Act which, among other things, reduced the U.S. corporate tax rate, modified limitations on certain deductions for executive compensation, placed new limitations on interest deductions, repealed the Section 199 Deduction and certain capital investment deductions, and shifted U.S. taxation of multinational corporations from a tax on worldwide income to a territorial system. Any unanticipated changes in our tax rates could affect our future results of operations. Our future effective tax rates could be unfavorably affected by changes in the tax rates in jurisdictions where our income is earned and taxed, by changes in, or our interpretation of, tax rules and regulations in the jurisdictions in which we do business, by providing services in new jurisdictions, by increases in expenses not deductible for tax purposes including impairments of goodwill, by changes in U.S. GAAP or by changes in the valuation of our deferred tax assets and liabilities. Furthermore, the results of the 2016 elections create uncertainty regarding future potential tax law reform. health insurance coverage and self-insurance reserves may not cover future claims, which could materially adversely affect our business, financial condition, results of operations and cash flows.maintain various insurance policies for companycurrently self-insure a significant portion of expected losses associated with workers’ compensation claims, general business liabilities, property damage and employee health workers’ compensation, general liability and property damage.care benefits. We are self-insured for our health plans, and have purchased a fully-insured stop loss policy for our health plans to help offset our liability for both individual and aggregate claim costs. Wecosts and maintain insurance coverage with varying limits and retention amounts to help limit exposure to certain other risks. Insurance reserves are also responsibleestablished for losses up to a certain limit for workers’ compensation, general liability and property damage insurance.17For policies under which we are responsible for losses, we record a liability that represents our estimated cost of claims incurred and unpaid as of the balance sheet date. Our estimated liability is not discounted anddate on an undiscounted basis,and economic conditions and management judgments about the present and expected level of cost per claim. This determination is closely monitored and adjusted when warranted by changing circumstances. Our prior growth could affect the accuracy of estimates based on historical experience. Should a greater amount of claims occur compared to what was estimated or medical costs increase beyond what was expected, our accrued liabilities might not be sufficient and we may be required to record additional expense. Unanticipated changes may also producein the assumptions and estimates underlying our reserves could result in materially different amounts of expense than reported under these programs, which could materially adversely affect our business, financial condition, results of operations and cash flows.identified material weaknesseshave expanded our business to include operations, investments, strategic relationships and personnel outside of the United States. Our international operations expose us to a number of business and financial risks, including, but not limited to:internal control overability to protect our intellectual property in foreign jurisdictions;reporting,condition, results of operations and if we fail to remedy them or other material weaknesses that we may identify in the future, our financial statementscash flows could be materially misstated.management is responsible for establishing and maintaining adequate internal control over our financial reporting, as defined in Rule 13a-15(f) under the Exchange Act. As described in Part II, Item 9A of this Annual Report on Form 10-K, management identified material weaknesses in our internal control over financial reporting as of December 31, 2016 relatedstatements are subject to the calculationapplication of U.S. GAAP, which is periodically revised and/or expanded. From time to time, we are required to adopt new or revised accounting standards issued by recognized authoritative bodies, including the estimated liability for appeals balance in connection with our CMS reserveFASB and the valuation ofSEC. It is possible that accounting standards we are required to adopt may require changes to the current accounting treatment that we apply to our accounts receivable allowance. These material weaknesses resulted in an immaterial reclassification error in revenue and selling, general and administrative expenses that was corrected prior to issuance of the consolidated financial statements. Until remediated, these material weaknessesstatements and may require us to make significant changes to our systems. Changes in accounting standards could result in misstatements of account balances or disclosures that would result in a material misstatement to the annual or interim consolidated financial statements that will not be prevented or detectedadverse impact on a timely basis.We are actively revising and supplementing our control environment and our risk assessment process and the design of our process level controls in order to remediate these material weaknesses, including a set of compensating controls in the near term. We are enhancing and revising the design of controls and procedures to ensure the calculations of the CMS reserve and the accounts receivable allowance properly utilize historical information to derive the period-end balances. Additionally, management will be supplementing the review controls over the CMS reserve and the accounts receivable allowance, and controls over the completeness and accuracy of the data used to calculate the balances, with additional levels of review involving senior members of our accounting department and will assess the need for additional remediation steps.We cannot predict the outcome of our assessment and that of our independent registered public accounting firm in future periods. If our remedial measures are insufficient to address the material weaknesses, or if additional material weaknesses or significant deficiencies in our internal controls are discovered or occur in the future, we may fail to meet our future reporting obligations on a timely basis, our financial statements may contain material misstatements, our operating results orbusiness, financial condition may be negatively impacted, and we may be subject to litigation and regulatory actions, causing investor perceptions to be adversely affected and potentially resulting in a decline in the market priceresults of our common stock.the United Stateswhich we operate is subject to changing political, economic and regulatory influences that maydirectly affect the procurement practices and operations of federal, state and commercial healthcare organizations and agencies. The ACA’sin the Unitedand cost containment along with itsand expansion of Medicaid created new opportunities to grow our business and our service offerings. However, due to a wide range of factors contributing to uncertaintycertain provisions of the healthcare landscape, including, among other factors,ACA have yet to be implemented and the resultsregulatory framework of the 2016 elections, Congressional activityACA and other healthcare reforms continues to evolve as a result of executive, legislative, regulatory and administrative developments and judicial proceedings. Since its adoption into law in 2010, there have been continued efforts by Congress to amend, repeal or replace all or part of the ACA. Congress has introduced several other bills to delay, defund or repeal implementation or amend significant provisions of the ACA, though none of these other bills have passed the House and Senate.numerous, varyingDistrict of Columbia filed a petition requesting the Supreme Court to take up the case with an expedited review, which was denied. Although, a stay and partial final judgment has been issued pending appeals, ensuring that the ACA replaceremains operational in all respects, we cannot predict the outcome of the litigation that has been filed relating to the constitutionality of the ACA. As such, there remains considerable uncertainty surrounding the continued implementation of the ACA and what similar healthcare reform measures or other changes might be enacted at the federal and/or state level.may encompass Medicaid, Medicare and commercial insurance, it is difficult to predict its full impact and influence on future changes to healthcare policy. Policies thatwould fundamentally change the financial structure of the Medicaid program currently(currently funded jointly by the states and the U.S. Federal Government,Government), which could result in early termination, reduced scopes or non-renewal of our contracts with certain state government customers. Federalcustomers, and (ii) changes may alsoat the federal level that would reduce reimbursement rates to states, establish new payment models, increase or decrease government involvement in healthcare, decreasefurther limit the Medicare RAC Program,program, or otherwise change the operating environment for our customers. Healthcarecustomers and transform the government’s involvement in healthcare. Future healthcare legislation could also have a significant impact on our business. Due to uncertainties regarding the outcome of future healthcare reform initiatives, and their enactment and implementation, we cannot predict which, if any, of the future reform proposals will be adopted or the effect such adoption may have on us. if efforts to waive, modify or otherwise change the ACA, in whole or in part, are successful, if we are unable to adapt our solutions and services to meet changing requirements or expand service delivery into new areas, or if the demand for our solutions and services is reduced.
reduced as a result of future legislative changes affecting Medicare, Medicaid or other publicly funded or subsidized health programs, or efforts to18spending in the Medicare and Medicaid programs and government spending on these programs, and the impact on the current healthcare financing system overall and the need for our solutions and services within that existing framework. Our continued success as a company is based in large part on offering solutions and services that improve the ability of our customers to identify and recover revenue that would otherwise be lost often as a result of procedural inefficiencies and complexities in thatthe healthcare delivery and payment system. However, the need for our solutions and services, the price customers are willing to pay for them orand the scope and profitability of our contracts could be negatively affected by a number of factors, including, but not limited to:programsprogram enrollment and expenditures;developments suchbudgetary or deficit considerations, including the continuance of existing programs, as well as budgetary pressures that may drive changes at the possible repealstate level;or modificationhealthcare program benefits (such as, for example, state decisions to the ACA, and any action taken to reduce eligibilityeliminate coverage of optional Medicaid populations or services or reform Medicaid spending. The absenceshifting lives into managed care plans);near-term compliance deadlines effected by the ACAhealthcare beneficiaries from fee-for-service plans to value-based care and other legislation could additionally cause our revenue to decline. There can be no certainty that additional incentives will be created in regard to our solutions and services, or that any legislation or regulations that may be adopted would favorably impact our business.Modificationsalternative risk models;spending, could also reduce spending;profitabilityadoption of our contractshealthcare plans with significantly higher deductibles or other consumer healthcare cost-sharing;reduce enhancements to their internal healthcare claims and billing processes;need for our solutionssimplification of the healthcare benefit and services. Compounding this are budgetary pressures that may drivepayment system through legislative or regulatory changes at the federal or state level. The demandlevel (for example, legislative changes impacting the scope of mandatory audits, including limits on the look-back period for our solutionsreview in areas where we conduct audits);services could also be impacted by other changes in government healthcarestate Medicaid RAC programs (for example, limitations or reductions in the levelamount of government spending,reviewable claims we audit, such as:§the simplification of the healthcare benefit and payment system through legislative or regulatory changes at the federal or state level (for example, legislative changes impacting the scope of mandatory audits; limiting or reducing the amount of reviewable claims and/or the look-back period for review in areas where we conduct audits);§unanticipated reductions in the scope of program benefits (such as, for example, state decisions to eliminate coverage of optional Medicaid populations or services or shifting lives into managed care plans); or§as the modified ADR limits placed on ongoing program integrity initiatives.For example, during 2014 and 2015, our recovery audit services under HDI’s existing Medicare RAC contract were limited because of significant delays in procurement activitiessliding scale policy implemented by CMS for the new Medicare RAC contract awards, resulting from, in part, the cancellation of the original and second procurements following the denial of pre-award protests and ongoing litigation regarding certain payment terms proposed by CMS as part of the new Medicare RAC proposals. In October 2016, CMS announced the new awards, including the award of RAC Region 4 to our wholly owned subsidiary. These newcurrent Medicare RAC contracts, are currently being implemented and we currently expect that audits will begin in Q2 2017. Our existing Medicare RAC contract endswhich have a significant impact on January 31, 2018, and we are required to maintain certain reserves related to pending appeals for this contract through at least this date. In addition, CMS has shifted the responsibility for initial medical reviews of short inpatient stays from the Medicare RACs to Quality Improvement Organizations, further restricting the Medicare RACs review to a small subset of claims for potential payment inaccuracies. CMS has also implemented new ADR limits for inpatient providers that reduces the ADR requirement to 0.5% under the new contract, down from the 2.0% ADR requirement under the prior contract. This change significantly impacts the volumes of claims that Medicare RACs are permitted to review for inpatient providers and reducesreduce their ability to identify overpayments and underpayments under their Medicare RAC contracts. Forunderpayments); andnew contract, CMS has continued to maintainabsence of near-term compliance deadlines effected by the previously established ADR limits for institutional providers, originally established in January 2016, which reducedACA, the ADR requirement to 0.5%. In April 2016, CMS instituted a new policy adjusting ADR limits based on provider denial rate after three (3) 45-day ADR cycles. This change significantly impacts the volumes of claims Medicare RACs are permitted to review for inpatient providers, and reduces their ability to identify overpayments and underpayments under their Medicare RAC contracts in the near term, pending the adjustment of ADR limits based on provider denial rates established following the first three (3) cycles of RAC reviews.19Further, in August 2014, CMS announced it would settle with hospitals willing to withdraw inpatient status claims currently pending in the RAC appeals process by offering to pay hospitals 68% for all eligible claims they had billed to Medicare. In June 2015, CMS notified HDI that based on the initial lists of finalized settlements, HDI owed CMS approximately $28.6 million due to adjustments in contingency fees under our existing Medicare RAC contract. HDI previously advised CMS that it disagrees with CMS’ interpretationpossible repeal or modification of the contract and that CMS does not have the contractual right, among other things, to require repayment of fees already paid. The amount ultimately payable to CMS by HDI remains uncertain. In addition, in September 2016, CMS announced that it would extend an opportunity for another round of settlements for hospitals that were eligible for but did not choose to participate in the 2014 settlement, with CMS offering to pay 66% for all eligible claims they had billed to Medicare. We believe this settlement will be processed and evaluated by CMS over the course of 2017, and the number and amount of claims that will be subject to the 2016 settlement remains uncertain. There could be a material negative impact on our future revenue to the extent that (i) any final determination of amounts owed by us to CMS under the current Medicare RAC contract materially exceeds our accrued reserves for such appeals, (ii) we are required to increase or decrease our contractually required reserves with respect to pending appeals due toACA, changes in appeal performance, changesrules and regulations that discourage participation in data providedgovernment-sponsored healthcare programs among certain key populations and other legislative actions to us from other entities in the RAC process,reduce program eligibility or other related factors, (iii) we are required to repay a portion of prior fees associated with the hospital settlement program, (iv) we are unable to obtain full payments for properly provided services, or (v) future fees payable to us by CMS are reduced. Although we do not anticipate our Medicare RAC contract will represent a significant portionreform Medicaid spending. our business going forward, our Medicare RAC contract still represents a future business opportunity for us and any of these factorsevents, or other changes to the funding of the Medicare RACand Medicaid programs or limitations in the scope of program eligibility, benefits, initiatives and healthcare spending that materially reduce our revenue or profitability with such program couldprograms may have a materialan adverse effect on our future business, financial condition, results of operations and cash flows.subsidiaries,subcontractors, government agencies, data suppliessuppliers and other third parties from whichwhom we obtain information. The use and disclosure of that information is regulated at the federal, state, international and industry levels and we are also obligated by our contractual requirements with customers. For example,levels. In particular, we are subject to federal regulation under HIPAA, as amended by the HITECH, Act,and the Final Omnibus Privacy, Security, Breach Notification, and Enforcement Rule, which modified and supplemented many of the standards and regulations under HIPAA and the HITECH Act, andas well as various U.S. state laws. HIPAA also imposes standards and requirements on our business associates as(as defined under HIPAA.sub-contractorssubcontractors comply with these laws, regulations and rules, we have less than complete control over our business associates’ and sub-contractors’subcontractors’ actions and practices. We may be exposed to data breach risk if there is unauthorized access to one of our or our sub-contractors’subcontractors’ secure facilities, or to third-party enterprise cloud storage and cloud computing application services that we use, or from lost or stolen laptops or other portable media from current or former employee theft of data containing PHI, from computer hacking, malware, computer viruses or other malicious codes, phishing or other cyber-attacks, from misdirected mailings containing PHI, or other forms of administrative or operational error. If we or our sub-contractorssubcontractors fail to comply with applicable laws; if unauthorized parties gain physical access to one of our facilities and stealssteal or misusesmisuse confidential information; if we erroneously use or disclose data in a way that is inconsistent with our granted rights; or if such information is misdirected, lost or stolen during transmission or transport, we may suffer damage to our reputation, potential loss of existing customers and difficulty attracting new customers. We could also be exposed to, among other things, unfavorable publicity, governmental inquiry and oversight, allegations by our customers that we have not performed our contractual obligations, costs to provide notifications or remediation (such as credit monitoring) to affected individuals, fines or other penalties imposed by government regulatory agencies, or litigation by affected parties and possible financial obligations for damages or indemnification obligations related to the theft or misuse of such information, any of which could have a material adverse effect on our business, financial condition, results of operations and cash flows.20In addition, laws, rules and regulations concerning the protectiongovernment regulation,domestic and foreign laws and regulations, including government and customer audits and investigations relating to our compliance with thesuch laws and regulations applicable to companies in our industry, and a negative finding or other adverse determination could have a material adverse effect on our reputation, business, financial condition, results of operations and cash flows.MuchTheThese laws and regulations governing our operations are generally intended to benefit and protect individual citizens, including government program beneficiaries, health plan members and providers, rather than shareholders,their dependents. As such, the federal and the governmentstate governmental agencies administering these laws and regulations have broad latitude to enforce them. As such, weOur contracts with U.S. government agencies are also subject to unique contractual provisions and performance requirements, and, on an ongoing basis, to various governmentalgovernment and customer reviews, audits and investigations to verify our compliance with our contracts and applicable laws and regulations, as well as specialized legal actions and enforcement proceedings. For example, because we receive payments from federal and state governmental agencies, we are subject to various laws, includingsuch as the Federal Acquisition Regulations, the Foreign Corrupt Practices Act, federal and state employment, equal opportunity and affirmative action laws, federal and state prompt pay statutes.statutes, healthcare fraud, waste and abuse laws, including anti-kickback laws, and similar legislation. We are also subject to the Federal False Claims Act and similar state statutes, which permit government law enforcement agencies to institute suits against us for violations and, in some cases, to seek double or treble damages, penalties and assessments. In addition, private citizens, acting as whistleblowers, can sue on behalf of the government under the “qui tam” provisions of the Federal False Claims Act and similar statutory provisions in many states.The expansion of our operationsand servicesthat may further expose us to requirements and potential liabilities under additional statutes and legislative schemes that have previously not been relevant to our business, such as the Fair Debt Collection Practices Act and other banking and credit reporting statutes,statutes. For example, in connection with our acquisition of Eliza Corporation ("Eliza"), we became subject to the Telephone Consumer Protection Act of 1991, state and federal audio and telephone recording laws, and other consumer laws and regulations as a result of the member engagement services that may both increase demands on our resources for compliance activities and subject us to potential penalties for noncompliance with statutory andwe perform. We also face heightened consumer communication protections as a result of the changing regulatory standards. Increasedenvironment. Our increased involvement in analytic or audit work that can have an impact on the eligibility of individuals for medical coverage or specific benefits, or payments made by our customers to providers,population health services and penetration into new markets, such as ACOs, PBMs and commercial self-insured employers, could increase the likelihood and incidence of our being subjected to regulatory scrutiny or legal actions by third parties other than our customers, based on alleged mistakes or deficiencies in our work, withwhich may impose significant resulting costs and strain on our resources.solutions and services we offer and how we interact with our customers, providers, other healthcare payers and the public. Although we have implemented policies and procedures designed to ensure compliance, there can be no assurance that our employees, subcontractors, vendors, agents, strategic partners or third parties with whom we do business, will notsuspensions andsuspension, disqualification or debarment from doing business with the government. Similarly, if our customers assert that we have failed to properly perform or comply with our contractual obligations, or if the carriers to which we send billings assert that we have failed to properly comply with applicable federal or state billing rules and regulations, we may be required to provide refunds or make payments to resolve such issues. The risks to which we are subject, particularly under the Federal False Claims Act and similar state fraud statutes, have also increased in recent years due to legislative changes that have (among other amendments) expanded the definition of a false claim to include, potentially, any unreimbursed overpayment received from, or other monetary debt owed to, a government agency. This subjects us to potential liability for a false claim, for example, where we may be overcharged for services by a sub-contractor and may pass that charge on to a government customer, or where we may have a good faith disagreement with a government agency’s view of whether an overpayment has occurred. If we are found to be in violation of any applicable law or regulation, or if we receive an adverse review, audit or investigation from a government agency or customer related to our compliance with such laws or regulations or the terms of our government contracts, any resulting negative publicity, penalties or sanctions could have an adverse effect on our reputation in the industry, impair our ability to compete for new contracts or bid in response to RFPs in one or more jurisdictions, and have a material adverse effect on our business, financial condition, results of operations and cash flows.21to permit private entitiesfor them to perform such work, or impose other limitations on outsourcing or certain vendors that may obstruct cost-effective performance of our contracts.Thegovernment or a state governments could limit or prohibit private contractors like us from operating or performing elements of certain government functions or programs. State orAs a condition of receiving federal funding, state and local governments couldgovernment agencies may be required to operate such programs with government employees as a condition of receiving federal funding. Moreover, underemployees. Under current U.S. law, in order to privatize certain functions of government programs, the federal government must grant a consent and/or waiver to the petitioning state or local agency. If the federal government does not grant a necessary consent or waiver, the state or local agencygovernment will be unable to outsource that function to a commercial entity. Such a situation could eliminate a contracting opportunity or reduce the value of an existing contract.other statethe U.S. government may impose limitations or federal limitationsrequirements on the outsourcing certain types of work to vendors that supplement our own workforceoffshore resources, which could make it more difficult for us to fulfill our contracts in a cost-effective manner. Certain segmentsareas of our operations use or involve vendor or sub-contractorsubcontractor personnel located outside of the United States to supplement our workforce, who may (under carefully controlled circumstances) access certain PHI in the course of assisting us with various elements of the services we provide to our customers. There is, however, increasing pressure from an expanding number of sources to prohibit the use of off-shore labor, particularly on government contracts. The federal government and a number of states have consideredproposed or passed laws or issued rules, regulations, and orders that would limit, restrict or wholly prohibit the use of off-shoreoffshore labor in performance of government contracts, or impose sanctions for the use of such resources. Some of our customers have already chosen to contractually limit or restrict our ability to use off-shore resources.offshore personnel and systems. Intensified restrictions of this type or associated penalties could raise our costs of doing business, expose us to unexpected fines or penalties, increase the prices we must charge to customers to realize a profit and eliminate or significantly reduce the value of existing contracts or potential contract opportunities, any of which could have a material adverse effect on our business, financial condition, results of operations and cash flows.efficiency, orefficiency. We may require that wealso need to divest ourselvescertain existingneeds as a company that is expanding in complexity.increasing complexity of our business. Our failure to devote sufficient care, attention and resources to managing these adjustments may result in technical or administrative errors that could expose us to potential liability or adverse regulatory action. In addition, conflict of interest rules and standards change frequently, and are subject to varying interpretations and varying degrees and consistency of enforcement at the federal, state and municipal levels, and weenforcement. We may not be successful in navigating these restrictions. If we are prevented from expanding our business or are unable to effectively implement our strategic initiatives due to real or perceived conflicts of interest, our business, financial condition, results of operations and cash flows could be materially adversely affected.22RelatedRelating to Our Common Stock widely and may continue to do so.fluctuate. During the 52-week period ended MayDecember 31, 2017, the closing price of2019, our common stock traded on the NASDAQNasdaq Global Select market ranged from aMarket as high of $23.46as $39.93 per share to aand as low of $16.18as $26.53 per share. Our stock price is subject to fluctuation as a result offluctuates based on a variety of factors, including factorsmany of which are beyond our control, includingwhich include the risk factors described above and those which are related to:§changes in estimates of our performance or recommendations by securities analysts and operating and stock price performance of other companies that investors deem comparable to our company;§news reports relating to trends, concerns and other issues in the healthcare industry, including perceptions in the marketplace regarding us and our competitors;§the financial projections we publicly provide and any changes in or failure to meet those projections;§future sales of shares of common stock in the public market by our executive officers or directors;§any other changes in the amount of our outstanding shares, including as a result of share repurchases;§the public’s response to our press releases, or other public announcements, including our filings with the SEC;§securities class actions, shareholder lawsuits or other litigation; and§market conditions in the industry and the economy as a whole.the stock marketmarkets often experiencesexperience significant price and volume fluctuations. These fluctuations are often unrelated to the operating performance of particular companies. These broad market fluctuations may materially adversely affect the market price of our common stock. Whenstock regardless of our operating performance. In the market price of a company’s stock drops significantly,past, shareholders may institutehave instituted securities class action litigation against that company.following periods of market volatility. Any litigation against us could cause us to incur substantial costs, divert the time and attention of our management and other resources or otherwise harm our business.noor declared cash dividends on any of our capital stock to date and currently intend to retain our future earnings, if any, to fund the development and continued growth of our business.business and repurchase shares opportunistically from time to time. As a result, we do not expect to pay any cash dividends in the foreseeable future. The success of your investment in our common stock will likely depend entirely upon any future appreciation. There is no guarantee that our common stock will appreciate in value or even maintain the price at which you purchased your shares.provide for a classified Board of Directors,currently require advance notice of shareholder proposals for business to be conducted at meetings of our shareholders and for nominations of candidates for election to our Board of Directors and provide for Delaware as an exclusive forum for certain disputes with our shareholders, all of which could also have the effect of discouraging a change of control.23LocationApproximate Square Footage Owned/LeasedIrving, TX 242,260OwnedLas Vegas, NV 64,736LeasedWesterville, OH 25,212LeasedIrvine, CA 23,790LeasedNew York City, NY 22,500LeasedCharlestown, MA 13,628LeasedAll Other Locations 77,914LeasedAs2016, we leased approximately 78,000 square feet2019 are shown in the following table:Location Approximate Square Footage Owned/Leased Irving, TX (corporate headquarters) 242,260 Owned Las Vegas, NV (office space) 63,593 Leased Danvers, MA (office space) 38,868 Leased New York , NY (office space) 34,759 Leased Jackson, MN (office space) 27,932 Owned Westerville, OH (office space) 25,212 Leased All other locations (26) 120,556 Leased 21 other locations throughout the United States,States. Outside the leases for whichU.S., we also lease office space in India. The leased locations have expiration dates starting late 2017 through 2024. See Note 12 - “Commitments2026. A portion of the above Las Vegas, NV and Contingencies” in our Notes to the Consolidated Financial Statements in Item 8. Consolidated Financial Statements and Supplementary Data for additional information regarding our lease commitments.New York, NY office spaces are sub-leased. In general, we believe our existing facilities, including both owned and leased, are suitable to meet our current and reasonably anticipated future needs.12 of the Notes14 to the Consolidated Financial Statements included in Part II, Item 8. Consolidated Financial Statements and Supplementary Data8 is incorporated herein by reference.included inlisted on the NASDAQNasdaq Global Select Market under the symbol HMSY. The table below summarizes the high and low sales prices per share for our common stock for the periods indicated, as reported on the NASDAQ Global Select Market.
“HMSY”.24Quarter Ended March 31, June 30, September 30, December 31, Fiscal Year 2016 High $ 14.42 $ 18.38 $ 23.46 $ 22.03 Low $ 10.22 $ 13.67 $ 17.44 $ 16.18 Fiscal Year 2015 High $ 21.73 $ 18.18 $ 17.10 $ 13.05 Low $ 15.32 $ 15.44 $ 8.24 $ 8.64
Holders25Repurchases of Shares of Common StockSee Note 8 – Equity, in our Notes to the Consolidated Financial Statements under Item 8. Consolidated Financial Statements and Supplementary Data for additional information regarding share repurchases. The following are our monthly stock repurchases for the fourth quarter of fiscal year 2016, all of which were made as part of publicly announced plans or programs:Period Total Number of
Shares
Purchased Average
Price Paid
Per Share Total Number of
Shares
Purchased as
Part of Publicly
Announced
Program(1) Approximate
Dollar Value of
Shares That
May Yet Be
Purchased
Under the
ProgramOctober 1, 2016 to October 31, 2016 — $ — — $ — November 1, 2016 to November 30, 2016 570,717 17.61 570,717 15,000,000 December 1, 2016 to December 31, 2016 569,615 18.25 569,615 5,000,000 October 1, 2016 to December 31, 2016 1,140,332 $ 17.93 1,140,332 $ 5,000,000 (1)On July 30, 2015, the Company's Board of Directors approved a share repurchase program authorizing the repurchase of up to $75 million of the Company's common stock from time to time on the open market or in privately negotiated transactions, and the Company publicly announced the program in August 2015. The repurchase program is authorized through July 30, 2017, and may be suspended or discontinued at any time. Repurchases may also be made under a Rule 10b5-1 plan. All repurchases for the periods presented were made under the program and using cash resources.HoldersMay 31, 2017,February 17, 2020, there were 262249 holders of record of our common stock.futurecontinued growth of our business.restrictsgenerally limits, subject to certain exceptions, our ability to make certain payments or distributions with respect to our capital stock, including cash dividends to our shareholders. These restrictions are describedFor additional detail, see the information under the heading “Liquidity and Capital Resources” in more detail inPart II, Item 7. Management’s Discussion and Analysis of Financial Condition and Results of Operations, under “Liquidity and Capital Resources” and in Note 7 – “Credit Agreement”, in our Notes9 to the Consolidated Financial Statements underin Part II, Item 8.and Supplementary Data.
in Part II, Item 8 for additional information regarding share repurchases. There were no repurchases of shares of common stock under either share repurchase program during the fourth quarter of 2019.26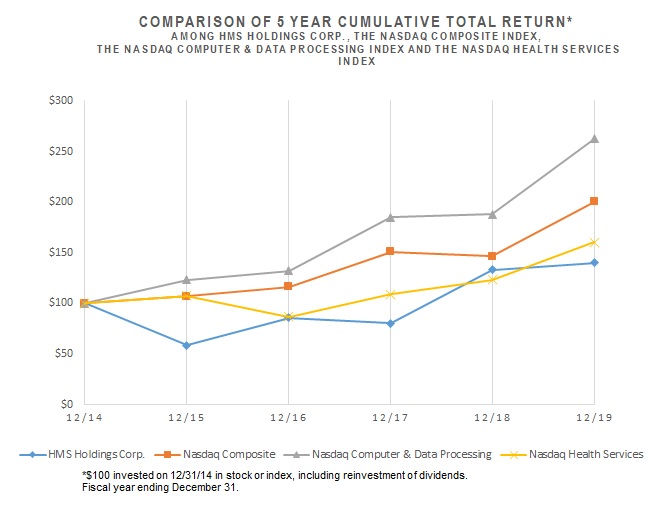
belowabove compares the cumulative total shareholder return on our common stock with the cumulative total shareholder returns of the NASDAQNasdaq Composite Index, the NASDAQNasdaq Computer & Data Processing Index and the NASDAQNasdaq Health Services Index assuming an investment of $100 on December 31, 20112014 and the reinvestment of dividends through the year ended December 31, 2016.
12/31/11 12/31/12 12/31/13 12/31/14 12/31/15 12/31/16 HMS Holdings Corp. $ 100.00 $ 81.05 $ 70.98 $ 66.10 $ 38.59 $ 56.79 NASDAQ Composite $ 100.00 $ 116.41 $ 165.47 $ 188.69 $ 200.32 $ 216.54 NASDAQ Computer & Data Processing $ 100.00 $ 107.40 $ 164.63 $ 189.15 $ 223.06 $ 242.34 NASDAQ Health Services $ 100.00 $ 115.47 $ 167.94 $ 204.39 $ 220.44 $ 188.28 12/31/14 12/31/15 12/31/16 12/31/17 12/31/18 12/31/19 HMS Holdings Corp. $ 100.00 $ 58.37 $ 85.90 $ 80.18 $ 133.07 $ 140.02 Nasdaq Composite 100.00 106.96 116.45 150.96 146.67 200.49 Nasdaq Computer & Data Processing 100.00 123.21 132.37 185.07 187.89 262.83 Nasdaq Health Services 100.00 107.35 86.83 109.24 123.53 160.42 Annual Report on2019 Form 10-K or future filings made by us under those statutes, the Comparative Stock Performance Graph is not deemed filed with the SEC, is not deemed soliciting material and shall not be deemed incorporated by reference into any of those prior filings or into any future filings we make under those statutes, except to the extent that we specifically incorporate such information by reference into a previous or future filing, or specifically request that such information be treated as soliciting material, in each case under those statutes.272016.2019. It should be read in conjunction with Management’s Discussion and Analysis of Financial Condition and Results of Operations, included in Item 7 of this Annual Report on Form 10-K and the Consolidated Financial Statements and Supplementary Data thereto, included in Item 8 of this Annual Report.Statement of Operations Data Years ended December 31, (in thousands, except per share amounts) 2016 2015 2014 2013 2012 Revenue $ 489,720 $ 474,216 $ 443,225 $ 491,762 $ 473,696 Total operating expenses 432,051 426,644 409,021 414,584 374,184 Operating income 57,669 47,572 34,204 77,178 99,512 Interest expense (8,519 ) (7,812 ) (7,931 ) (12,460 ) (16,561 ) Interest income 321 49 57 71 12 Other income, net — — — 801 382 Income before income taxes 49,471 39,809 26,330 65,590 83,345 Income taxes 11,835 15,282 12,383 25,593 32,829 Net income $ 37,636 $ 24,527 $ 13,947 $ 39,997 $ 50,516 Net Income Per Common Share Basic income per common share: Net income per common share - basic $ 0.45 $ 0.28 $ 0.16 $ 0.46 $ 0.59 Diluted income per common share: Net income per common share - diluted $ 0.43 $ 0.28 $ 0.16 $ 0.45 $ 0.57 Weighted average shares: Basic 84,221 87,881 87,673 87,598 86,204 Diluted 86,987 88,361 88,164 88,344 88,365 Balance Sheet Data Years ended December 31, (in thousands) 2016 2015 2014 2013 2012 Cash and cash equivalents $ 175,999 $ 145,610 $ 133,116 $ 93,366 $ 135,227 Working capital $ 277,478 $ 240,456 $ 226,271 $ 199,069 $ 205,537 Total assets $ 882,755 $ 850,597 $ 880,988 $ 878,602 $ 926,052 Revolving credit facility $ 197,796 $ 197,796 $ 197,796 $ 232,796 $ - Term loan, less current portion $ - $ - $ - $ - $ 297,500 Total shareholders' equity $ 556,610 $ 524,702 $ 533,090 $ 502,439 $ 462,874 28Years ended December 31, (in thousands, except per share amounts) 2019 2018 2017 2016 2015 Revenue $ 626,395 $ 598,290 $ 521,212 $ 489,720 $ 474,216 Total operating expenses 523,379 535,052 470,781 432,051 426,644 Operating income 103,016 63,238 50,431 57,669 47,572 Interest expense (11,013) (11,310) (10,871) (8,519) (7,812) Interest income 4,148 1,089 295 321 49 Other income 8,211 — — — — Income before income taxes 104,362 53,017 39,855 49,471 39,809 Income taxes 17,138 (1,972) (199) 11,835 15,282 Net income $ 87,224 $ 54,989 $ 40,054 $ 37,636 $ 24,527 Net Income Per Common Share Basic income per common share: Net income per common share — basic $ 1.00 $ 0.66 $ 0.48 $ 0.45 $ 0.28 Diluted income per common share: Net income per common share — diluted $ 0.98 $ 0.64 $ 0.47 $ 0.43 $ 0.28 Weighted average shares: Basic 87,222 83,625 83,821 84,221 87,881 Diluted 89,317 86,144 85,088 86,987 88,361 Years ended December 31, (in thousands) 2019 2018 2017 2016 2015 Cash and cash equivalents $ 139,268 $ 178,946 $ 83,313 $ 175,999 $ 145,610 Working capital $ 296,093 $ 328,684 $ 199,967 $ 277,478 $ 240,456 Total assets $ 1,244,276 $ 1,078,518 $ 975,160 $ 882,755 $ 850,597 Revolving credit facility $ 240,000 $ 240,000 $ 240,000 $ 197,796 $ 197,796 Total shareholders' equity $ 854,865 $ 713,396 $ 606,229 $ 556,610 $ 524,702 HMS Holdings Corp.HMS. You should read this discussion and analysis in conjunction with the other sections of this Annual Report on2019 Form 10-K,10- K, including the Cautionary Note Regarding Forward-Looking statementsStatements appearing prior to Part I, the Risk Factors appearinginformation in Part I, Item 1A, and the Consolidated Financial Statements and Supplemental DataNotes thereto appearing in Part II, Item 8. The historical results set forth in Part II, Item 6, Item 7 and Item 8 of this Annual Report2019 Form 10-K should not be taken as necessarily indicative of our future operations.isdelivers healthcare technology, analytics and engagement solutions to help reduce costs, improve health outcomes and enhance consumer experiences. We provide a leading providerbroad range of cost containment solutions in the U.S. healthcare marketplace. Using innovative technology as well as extensive data services and powerful analytics, we deliver coordination of benefits, payment integrity and population health management and engagement solutions through our operating subsidiaries to helpmove the healthcare payers improve performancesystem forward for our customers and contribute to improving health outcomes. We are managed and operate as one business segment with a single management team that reports to the Chief Executive Officer.
serveprovide solutions that apply broadly across state Medicaid programs, commercialand Federal government agencies, health plans federal government health agencies, government and privatePBMs. employers, child support agencies, and other healthcare payersat-risk providers. We also serve as a subcontractor for certain business outsourcing and sponsors. Together our various services help our customers recover improper payments; prevent future improper payments; reduce fraud, waste and abuse; better manage the care that members receive; and ensure regulatory compliance.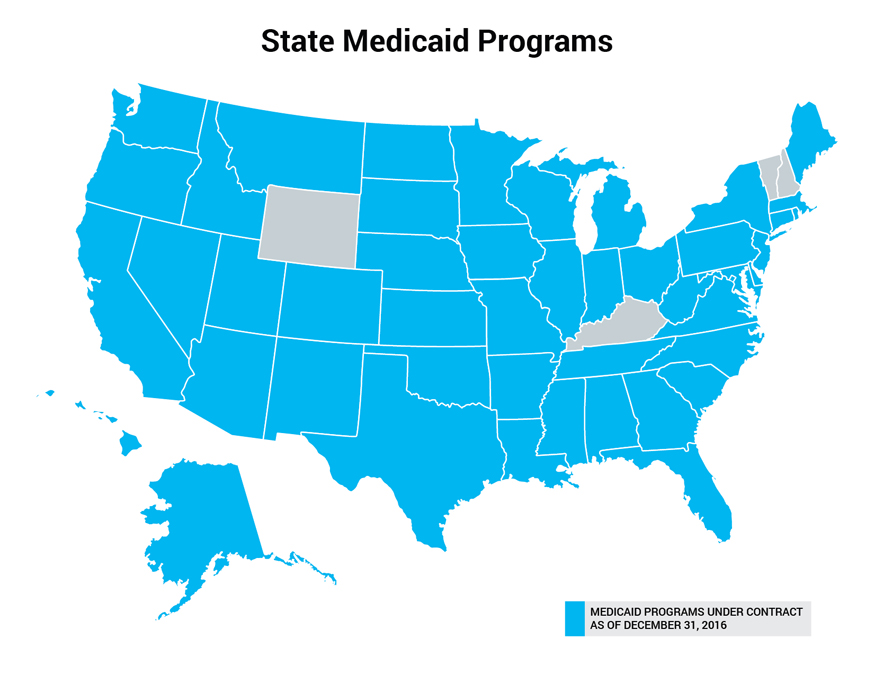
2016:§We serve 46 state Medicaid programs and the District of Columbia, CMS and the VHA;§We provide services to approximately 255 health plans in support of their multiple lines of business, including Medicaid managed care, Medicare Advantage and group and individual health; and§We also serve as a sub-contractor for certain business outsourcing and technology firms.
2019, our customer base included the following:292016 Highlights§Revenue increased $15.5 million, or 3.3% to $489.7 million§Operating income increased $10.1 million, or 21.2% to $57.7 million§Net income increased $13.1 million, or 53.5% to $37.6 million§Diluted earnings per share increased $0.15 or 53.6% to $0.43 per share§Shareholders’ equity increased $31.9 million, or 6.1% to $556.6 million§Cash flow from operations increased $16.7 million, or 23.1% to $89.0 millionTo date, weproductssolutions and services, as well as by acquisition of businesses whose core services strengthenstrengthened our overall mission to help our customers contain healthcare costs.costs and improve health outcomes. Our largest growth during 20162019 was with commercialgovernmentplan customersmanagement solutions and we expect this marketplace to present the greatest opportunity forother internal growth initiatives in the year ahead, particularly with the2019, various factors related to the macro healthcare environment are expected to provide opportunities for future growth, including:§Growth of Medicare enrollment, particularly Medicare Advantage plans;§An aging U.S. population with a growing concentration of individuals with chronic conditions; and§The continued dominance of employee sponsored health insurance for a majority of working individuals and the demand by large self-insured employers for cost savings.We planby leveragingwe plan to enter into new markets and expand the scope of our expertiserelationships with existing customers, with a focus on selling additional solutions and services that span the payment and care continuum, from an individual's enrollment in a healthcare program to expand product offerings, attractingpre-payment review of their claims through post-payment identification and recovery of improper payments, and back to the individual where our consumer-driven solutions will allow healthcare organizations to manage individuals' healthcare on a personal level, at scale.andwhile broadening our relationships with current customers, through the introduction of innovative solutions and services, designed to enhance or expand our existing suite of cost containment solutions, By utilizing technology tools that leverage a big data environment, we intend to continue to promote automation and innovation to improve the effectiveness of our existing solution suite, and identify new services, audit strategiesrevenue opportunities. We plan to continue to implement new technology and claim types. Our goal isprocess improvements to develop and build on existing partnerships with our state, federal and commercial health plan customers to provide services that better address their business needs and promoteincrease customer satisfaction in the constantly evolving healthcare marketplace, particularly as potentially significant changes to the ACA are considered by Congress. We also expect to continue increasing recovery yields from our current products by enhancing ourand achieve greater operating and organizational efficiency and by implementing new technologyefficiencies that will improve the quality, effectiveness and effectivenessprofitability of our service offerings.An The accounting policy is deemedpolicies that we believe to be the most critical if it requiresto an accounting estimate to be made based on assumptions about mattersunderstanding of our financial condition and results of operations and that require the most complex and subjective management judgments are highly uncertain at the time the estimate is made, if different estimates reasonably could have been used, or if changes in the estimate that are reasonably possible could materially impact the financial statements. We believe that the assumptions and estimates associated with revenue recognition, estimated liability for appeals, income taxes, share-based compensation, loss contingencies, and goodwill and intangible assets have the greatest potential impact on our consolidated financial statements. Therefore, we consider these to be our critical accounting policies and estimates. as follows:Revenue Recognition Description Judgments and Uncertainties Effect if Actual Results Differ from Assumptions The Company recognizes revenue when performance obligations under the terms of the contracts with our customers are satisfied. Due to the range of solutions and services that HMS provides and the differing fee structures associated with each type of contract, revenue may be recognized in irregular increments. A portion of our revenue is recorded net of an estimate of future revenue adjustments, with an offsetting entry to accounts receivable, based on historical patterns of billing adjustments, length of operating and collection cycle and customer negotiations, behaviors and payment patterns. Changes in these estimates are recorded to revenue in the period of change. If we were to enter any new contracts with differing fee structures or performance obligations or if we were to change any of the judgments or estimates related to estimated future revenue adjustments, it could cause a material increase or decrease in the amount of revenue we report in a particular period. Business Combinations Description Judgments and Uncertainties Effect if Actual Results Differ from Assumptions We record assets acquired and liabilities assumed in a business combination based upon their acquisition date fair values. Goodwill is the excess of acquisition costs over the fair values of assets and liabilities of acquired businesses. During the measurement period, which is up to one year from the acquisition date, we may record adjustments to the assets acquired and liabilities assumed, with the corresponding offset to goodwill. Upon the conclusion of the measurement period, any subsequent adjustments are recorded to earnings. In most instances there is not a readily defined or listed market price for individual assets and liabilities acquired in connection with a business, including intangible assets. We determine fair value through various valuation techniques including discounted cash flow models, quoted market values and third party independent appraisals, as considered necessary. Significant assumptions used in those techniques include, but are not limited to, growth rates, discount rates, customer attrition rates, expected levels of revenues, earnings, cash flows and tax rates. The use of different valuation techniques and assumptions are highly subjective and inherently uncertain and, as a result, actual results may differ materially from estimates. Impairment of Goodwill Description Judgments and Uncertainties Effect if Actual Results Differ from Assumptions The results of the annual impairment assessment provide that the fair value of the reporting unit was significantly in excess of the Company’s carrying value, including goodwill; therefore, no impairment was indicated. If actual results are not consistent with our estimates or assumptions, the Company may be exposed to an impairment charge that could materially adversely impact our consolidated financial position and results of operations. There were no impairment charges related to goodwill during the years ended December 31, 2019, 2018, or 2017. Impairment of Long-Lived and Intangible Assets Description Judgments and Uncertainties Effect if Actual Results Differ from Assumptions Long-lived assets, including property and equipment and intangible assets, are reviewed for impairment whenever events or changes in circumstances indicate that the carrying amount of the asset may not be recoverable. When indicators exist, recoverability of assets is measured by a comparison of the carrying value of the asset group to the estimated undiscounted future net cash flows expected to be generated by the asset. If such assets are considered to be impaired, the impairment to be recognized and charged to earnings is measured by the amount by which the carrying value of the asset group exceeds the fair value of the assets. We use significant judgment in assessing events or changes in circumstances which indicate that the carrying amount of the asset may not be recoverable. The Company’s carrying amount of long-lived assets, including property and equipment and intangible assets was $218.8 million as of December 31, 2019. The Company did not recognize any impairment charges related to long-lived and intangible assets during the years ended December 31, 2019, 2018 or 2017. However, if actual results are not consistent with our estimates or assumptions, we may be exposed to an impairment charge that could materially adversely impact our consolidated financial position and results of operations. Valuation of Stock-Based Compensation Description Judgments and Uncertainties Effect if Actual Results Differ from Assumptions The determination of the fair value of the options on the grant date using the Black-Scholes pricing model is affected by the Company’s stock price, as well as assumptions regarding a number of complex and subjective variables. Certain key variables include: the Company’s expected stock price volatility over the expected term of the awards; a risk-free interest rate; and any expected dividends. The fair value of all awards also includes an estimate of expected forfeitures. We estimate stock price volatility based on the historical volatility of the Company’s common stock and estimate the expected term of the awards based on the Company’s historical option exercises for similar types of stock option awards. The assumed risk-free interest rate is based on the yield on the measurement date of a zero-coupon U.S. Treasury bond with a maturity period equal to the option’s expected term. The Company does not anticipate paying any cash dividends in the foreseeable future and therefore, uses an expected dividend yield of zero in the option valuation models. Forfeitures are estimated based on historical experience. If we were to change any of these judgments or estimates, it could cause a material increase or decrease in the amount of stock compensation expense we report in a particular period. For example, if actual forfeitures vary from estimates, a difference in compensation expense will be recognized in the period the actual forfeitures occur. Income Taxes Description Judgments and Uncertainties Effect if Actual Results Differ from Assumptions Income taxes are accounted for under the asset and liability method. Under this method, deferred tax assets and liabilities are recognized for the future tax consequences attributable to temporary differences between the financial statement carrying amounts of existing assets and liabilities and their respective tax bases. This method also requires the recognition of future tax benefits for net operating loss carry-forwards Deferred tax assets and liabilities are measured using enacted tax rates expected to apply to taxable income in the years in which those temporary differences are expected to be recovered or settled. The effect on deferred tax assets and liabilities of a change in tax rates is recognized as income or expense in the period that includes the enactment date. A valuation allowance is provided against deferred tax assets to the extent their realization is not more likely than not.
Uncertain income tax positions are accounted for by prescribing a minimum recognition threshold that a tax position is required to meet before being recognized in the financial statements. We make adjustments to these reserves in accordance with the income tax accounting guidance when facts and circumstances change, such as the closing of a tax audit or the refinement of an estimate.To the extent that the final tax outcome of these matters is different than the amounts recorded, such differences will affect the provision for income taxes in the period in which such determination is made, and could have a material impact on our financial condition and operating results.
Although the Company believes that it has adequately reserved for uncertain tax positions (including interest and penalties), it can provide no assurance that the final tax outcome of these matters will not be materially different.Contingencies Description Judgments and Uncertainties Effect if Actual Results Differ from Assumptions From time to time, we are involved in legal proceedings in the ordinary course of business. We assess the likelihood of any adverse judgments or outcomes to these contingencies as well as potential ranges or probable losses and establish reserves accordingly. We record accruals for outstanding legal matters when we believe it is probable that a loss will be incurred and the amount can be reasonably estimated. Significant judgment is required to determine both probability and the estimated amount. We review these provisions at least quarterly and adjust the provisions to reflect the impact of negotiations, settlements, rulings, advice of legal counsel and updated information. Litigation is inherently unpredictable and is subject to significant uncertainties, some of which are beyond the Company’s control. The amount of reserves required may change in future periods due to new developments in each matter or changes in approach to a matter such as a change in settlement strategy which could have a material impact on our financial condition and operating results. Note 1 –the discussion under “Business and Summary of Significant Accounting Policies” in our NotesNote 1 to the Consolidated Financial Statements underin Part II, Item 8. Consolidated Financial Statements and Supplementary Data.3020162019 to 20152018 and 20152018 to 2014 % of Revenue Years Ended December 31, 2016 2015 2014 Revenue 100 % 100 % 100 % Cost of Services: Compensation 38.6 37.6 40.9 Data processing 7.6 8.6 8.9 Occupancy 2.9 3.3 3.8 Direct project expenses 9.4 10.9 8.3 Other operating expenses 5.7 6.1 5.6 Amortization of acquisition related software and intangible assets 5.7 5.9 6.5 Total cost of services 70.0 72.4 74.0 Selling, general and administrative expenses 18.3 17.6 18.3 Total operating expenses 88.2 90.0 92.3 Operating income 11.8 10.0 7.7 Interest expense (1.7 ) (1.6 ) (1.8 ) Interest income 0.1 0.0 0.0 Income before income taxes 10.1 8.4 5.9 Income taxes 2.5 3.2 2.8 Net income 7.6 % 5.2 % 3.1 % (in thousands)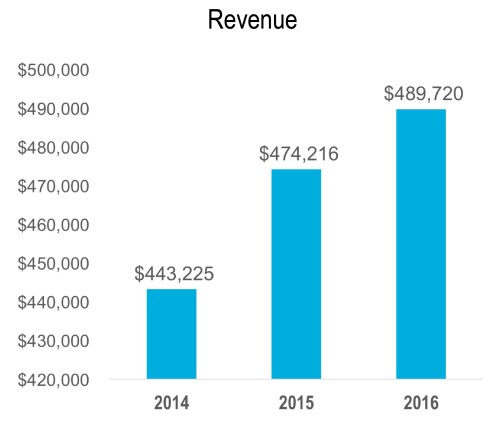
201731(dollars in millions) Year Ended December 31, $ Change % Change $ Change % Change 2019 2018 2017 2019 vs 2018 2018 vs 2017 Revenue $ 626.4 $ 598.3 $ 521.2 $ 28.1 4.7% $ 77.1 14.8% Cost of services: Compensation 231.3 224.9 202.0 6.4 2.8 22.9 11.3 Direct project and other operating expenses 90.1 74.3 69.8 15.8 21.3 4.5 6.4 Information technology 53.9 53.4 45.7 0.5 0.9 7.7 16.8 Occupancy 16.4 16.0 17.2 0.4 2.5 (1.2) (7.0) Amortization of acquisition related software and intangible assets 17.0 33.0 30.4 (16.0) (48.5) 2.6 8.6 Total cost of services 408.7 401.6 365.1 7.1 1.8 36.5 10.0 Selling, general and administrative expenses 114.7 113.5 105.7 1.2 1.1 7.8 7.4 Settlement expense — 20.0 — (20.0) (100.0) 20.0 100.0 Total operating expenses 523.4 535.1 470.8 (11.7) (2.2) 64.3 13.7 Operating income 103.0 63.2 50.4 39.8 63.0 12.8 25.4 Interest expense (11.0) (11.3) (10.8) 0.3 (2.7) (0.5) 4.6 Interest income 4.1 1.1 0.3 3.0 272.7 0.8 266.7 Other income 8.2 — — 8.2 100.0 — — Income before income taxes 104.3 53.0 39.9 51.3 96.8 13.1 32.8 Income taxes 17.1 (2.0) (0.2) 19.1 (955.0) (1.8) 900.0 Net income $ 87.2 $ 55.0 $ 40.1 $ 32.2 58.5% $ 14.9 37.2% 2016 vs. 2015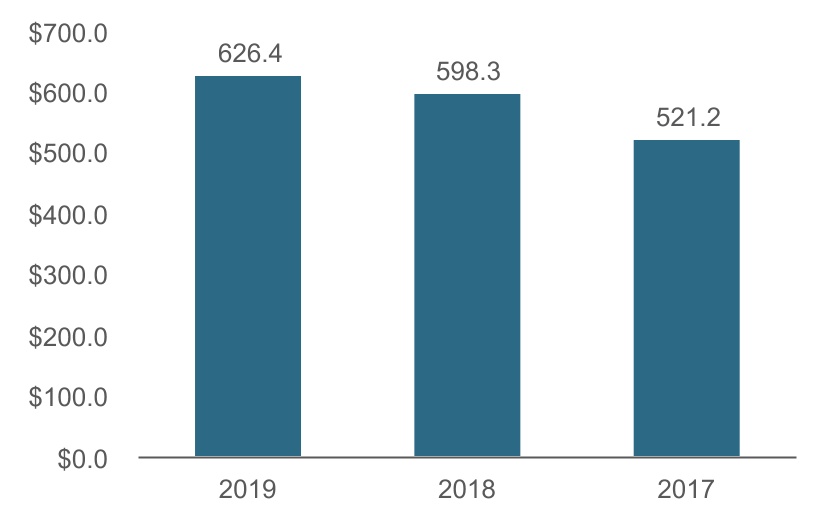
2016,2019, revenue was $489.7$626.4 million, an increase of $15.5$28.1 million or 3.3%4.7% compared to prior year revenue of $474.2 million. The increase was primarily due to commercial health plan revenue growth of $27.2 million or 13.4% partially offset by decreases in both state government revenue of $7.0 million or 3.1%, and federal government revenue of $4.5 million or 11.7%. The reduction in federal government revenue includes a $3.4 million decrease related to the reduction of Medicare RAC activity.2015 vs. 2014During the year ended December 31, 2015, revenue was $474.2 million, an increase of $31.0 million, or 7.0%, compared to prior year revenue of $443.2 million. This increase was primarily due to commercial health plan revenue growth of $32.2 million or 18.8% partially offset by a decrease in federal government revenue of $1.2 million or 3.1%, primarily related to the reduction of Medicare RAC activity.(In thousands)
Total Cost of ServicesTotal cost of services consists of compensation, data processing, occupancy, direct project expenses, other operating expenses, and amortization of acquisition related software and intangible assets.2016 vs. 2015During the year ended December 31, 2016, total cost of services as a percentage of revenue was 70.0% compared to 72.4% for the year ended December 31, 2015. Total cost of services for the year ended December 31, 2016 was $342.7 million, a decrease of $0.8 million compared to $343.5$598.3 million for the year ended December 31, 2015. This change resulted primarily from decreases2018.direct project costs, data processing costs, occupancy costs and other operating expenses. These decreases wereour cost recovery business, partially offset by increasesthe timing of recoveries related to certain customers.compensation expense.
federal related claims, which included a $2.1 million increase resulting from the release of the Company's remaining estimated liability and net receivables relating to the original Medicare RAC contract.322015 vs. 2014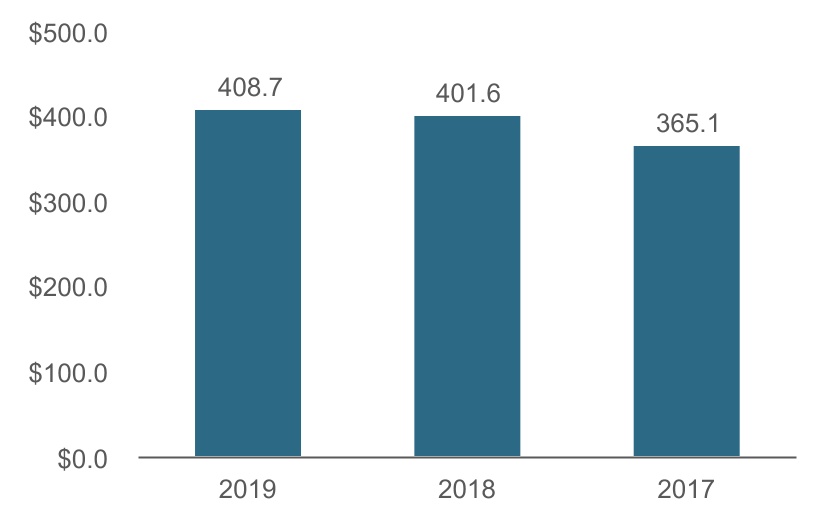
2015,2019, total cost of services as a percentage of revenue was 72.4% compared to 74.0% for the year ended December 31, 2014. Total cost of services for the year ended December 31, 2015 was $343.5$408.7 million, an increase of $15.5$7.1 million or 1.8% compared to $328.0$401.6 million for the year ended December 31, 2014. This change resulted2018.from increasesdue to an increase in directcompensation costs partially offset by a decrease in variable compensation. costs and other operating expenses. Thesecosts increased by $15.8 million primarily due to increases were partially offsetin labor costs, software costs and third party service providers expense.decreases$16.0 million due to certain intangible assets becoming fully amortized in compensation expense.CompensationCompensation expense is primarily composed of salariesprior periods.wages, which include overtime, health benefits, stock option expense, performance awards, commissions, employers share of FICA and fringe benefits.2016 vs. 2015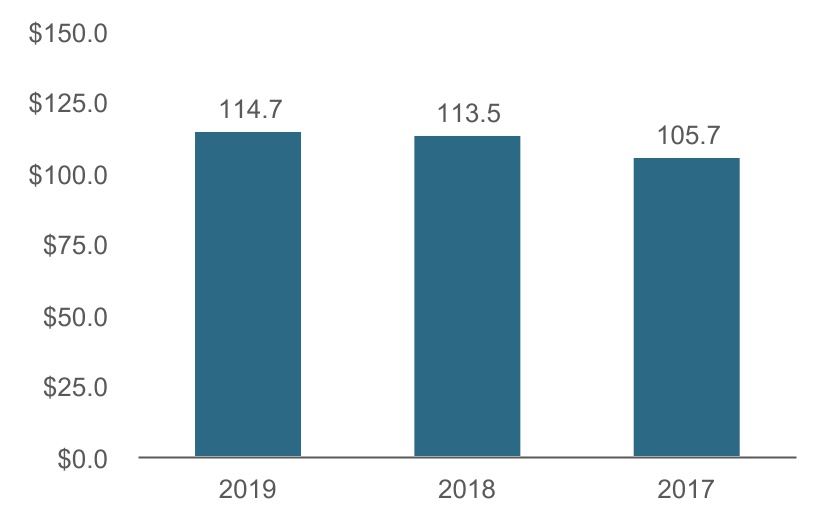
2016, compensation2019, SG&A expense as a percentage of revenue was 38.7% compared to 37.6% for the year ended December 31, 2015. Compensation expense for the year ended December 31, 2016 was $189.3$114.7 million, an increase of $11.0$1.2 million or 1.1% compared to $178.3$113.5 million for the year ended December 31, 2015. This change resulted from2018. $13.1 million total increase in salaries, variable compensation expense, and fringe benefit expense, partially offset by a $2.1 million decrease in stock-based compensation expense. Forvariable compensation.2016, we averaged 2,030 employees, a 1.1% increase from the year ended December 31, 2015, during which we averaged 2,007 employees.2015 vs. 20142015, compensation2019, we recorded an income tax expense as a percentage of revenue was 37.6% compared to 40.9% for$17.1 million, the year ended December 31, 2014. Compensation expense for the year ended December 31, 2015 was $178.3 million, a decrease of $3.0increased by $19.1 million compared to $181.3an income tax benefit of $(2.0) million for the year ended December 31, 2014. This change resulted primarily from a $4.9 million decrease in salary, severance and overtime expense partially offset by a $1.9 million increase in variable compensation expense, stock compensation expense, and fringe benefit expense. For the year ended December 31, 2015, we averaged 2,007 employees, a 7.4% decrease from the year ended December 31, 2014, during which we averaged 2,167 employees.Data Processing2016 vs. 2015During the year ended December 31, 2016, data processing expense as a percentage of revenue2018.7.6% compared to 8.6%16.4% for the year ended December 31, 2015. Data processing expense2019 compared to an effective tax rate of (3.7)% for the year ended December 31, 2016 was $37.3 million, a decrease of $3.6 million compared to $40.9 million for the year ended December 31, 2015. This change resulted primarily from a $4.0 million decrease in depreciation expense partially offset by an increase in software expenses.2015 vs. 2014During the year ended December 31, 2015, data processing expense as a percentage of revenue was 8.6% compared to 8.9% for the year ended December 31, 2014. Data processing expense for the year ended December 31, 2015 was $40.9 million, an increase of $1.2 million compared to $39.7 million for the year ended December 31, 2014. This change resulted primarily from a $3.0 million total increase in software and data expenses, partially offset by a decrease in depreciation expense.Occupancy2016 vs. 2015During the year ended December 31, 2016, occupancy expense as a percentage of revenue was 2.9% compared to 3.3% for the year ended December 31, 2015. Occupancy expense for the year ended December 31, 2016 was $14.0 million, a decrease of $1.8 million compared to $15.8 million for the year ended December 31, 2015. This decrease was primarily related to the closure of one of our office locations in 2016. Additional savings were realized due to reductions in utilities and equipment rental expense.332015 vs. 2014During the year ended December 31, 2015, occupancy expense as a percentage of revenue was 3.3% compared to 3.8% for the year ended December 31, 2014. Occupancy expense for the year ended December 31, 2015 was $15.8 million, a decrease of $1.2 million compared to $17.0 million for the year ended December 31, 2014. This decrease was primarily related to downsizing office space and relocation of our offices in Omaha, Nebraska and Albany, New York. Additional savings were realized after closing several of our smaller field offices in 2014 and 2015.Direct Project Expenses2016 vs. 2015During the year ended December 31, 2016, direct project expense as a percentage of revenue was 9.4% compared to 10.9% for the year ended December 31, 2015. Direct project expense for the year ended December 31, 2016 was $46.3 million, a decrease of $5.2 million compared to $51.5 million for the year ended December 31, 2015.2018. The reduction of Medicare RAC activity resulted in a $3.5 million decrease in sub-contractor fees from the prior year.2015 vs. 2014During the year ended December 31, 2015, direct project expense as a percentage of revenue was 10.9% compared to 8.3% for the year ended December 31, 2014. Direct project expense for the year ended December 31, 2015 was $51.5 million, an increase of $14.6 million compared to $36.9 million for the year ended December 31, 2014. This increase was partially due to a $9.6 million increase related to the transition of operational processes to sub-contractors. Additionally, data costs increased by $2.9 million in connection with an increase in the volume of patient charts we reviewed for our commercial health plan customers. The volume increase also resulted in a $1.4 million increase in key punch and data conversion due to the increase in reformatting electronic and hard copy remittance data.Other Operating Expenses2016 vs. 2015During the year ended December 31, 2016, other operating expenses as a percentage of revenue were 5.7% compared to 6.1% for the year ended December 31, 2015. Other operating expenses for the year ended December 31, 2016 were $27.8 million, a decrease of $1.1 million compared to $28.9 million for the year ended December 31, 2015. This decrease primarily resulted from a $2.3 million decrease in temporary staffing and sub-contractor fees, partially offset by a $0.9 million increase in consulting fees.2015 vs. 2014During the year ended December 31, 2015, other operating expenses as a percentage of revenue were 6.1% compared to 5.6% for the year ended December 31, 2014. Other operating expenses for the year ended December 31, 2015 were $28.9 million, an increase of $4.3 million compared to $24.6 million for the year ended December 31, 2014. This increase primarily resulted from a $3.6 million increase in temporary staffing and consulting expense.Amortization of Acquisition Related Software and Intangible Assets2016 vs. 2015During the year ended December 31, 2016, amortization of acquisition related software and intangibles as a percentage of revenue was 5.7% compared to 5.9% for the year December 31, 2015. Amortization of acquisition related software and intangible assets for 2016 was $28.0 million, a decrease of $0.1 million compared to $28.1 million for the year ended December 31, 2015. This decrease resulted from intangibles becoming fully amortized in 2016, partially offset by additional expense related to the Essette acquisition.342015 vs. 2014During the year ended December 31, 2015, amortization of acquisition related software and intangibles as a percentage of revenue was 5.9% compared to 6.5% for the year December 31, 2014. Amortization of acquisition related software and intangible assets for 2015 was $28.1 million, a decrease of $0.5 million compared to $28.6 million for the year ended December 31, 2014. This decrease resulted from the completion of amortization in 2014 on restrictive covenants for our Verify Solutions, Inc. and MedRecovery Management, LLC acquisitions.Selling, General and Administrative expenses2016 vs. 2015During the year ended December 31, 2016, SG&A expense as a percentage of revenue was 18.3% compared to 17.6% for the year December 31, 2015. SG&A expense for 2016 was $89.4 million, an increase of $6.3 million compared to $83.1 million for the year ended December 31, 2015. Increases totaling $14.1 million were comprised of consulting expense of $4.0 million, fringe benefits expense of $1.6 million, compensation costs of $6.1 million, and other expenses $2.4 million. These increases were partially offset by a $7.8 million reduction in legal fees and settlements. During the year ended December 31, 2016, we averaged 236 employees in the SG&A group, an 8.3% increase over our average of 218 employees in that group during the year ended December 31, 2015.2015 vs. 2014During the year ended December 31, 2015, SG&A expense as a percentage of revenue was 17.6% compared to 18.3% for the year December 31, 2014. SG&A expense for 2015 was $83.1 million, an increase of $2.0 million compared to $81.1 million for the year ended December 31, 2014. This increase waslow 2018 effective tax rate is primarily due to a $2.8 million increase in salary expense which was partially offset by a $0.9 million decrease in software-related costs. During the year ended December 31, 2015, we averaged 218 employees in the SG&A group, a 1.4% decrease over our average of 221 employees in that group during the year ended December 31, 2014.Operating Income2016 vs. 2015Operating income for the year ended December 31, 2016 was $57.7 million, or 11.8% of revenue, compared to $47.6 million or 10.0% of revenue, for the prior year.2015 vs. 2014Operating income for the year ended December 31, 2015 was $47.6 million, or 10.0% of revenue, compared to $34.2 million, or 7.7% of revenue, for the prior year.Interest ExpenseInterest expense represents interest on borrowings under our revolving credit facility, amortization of deferred financing costs, commitment fees for our revolving credit facility and issuance fees for our letter of credit.2016 vs. 2015During the year ended December 31, 2016, interest expense was $8.5 million, an increase of $0.7 million compared to the prior year. This increase resulted from an increase on the variable interest rate on our outstanding debt. Amortization of deferred financing costs of $2.1 million in both periods is included within interest expense.2015 vs. 2014During the year ended December 31, 2015, interest expense was $7.8 million, a decrease of $0.1 million compared to the prior year. The decrease primarily relates to a reduction in interest on capital leases. Amortization of deferred financing costs of $2.1 million in both periods is included within interest expense.35Income Taxes2016 vs. 2015During the year ended December 31, 2016, we recorded incomefavorable tax expense of $11.8 million, a decrease of $3.5 million compared to the prior year. Net income before taxes of $49.5 million increased $9.7 million year-over-year, while income tax expense decreased $3.5 million. Our effective tax rate decreased from 38.4% to 23.9%, which reflects a $6.2 million tax benefit recognized in the third quarter of 2016 that wasbenefits related to R&D Creditscurrent year credits, equity compensation, subsidiary basis write off, prior year state tax apportionment changes, uncertain tax position releases, and Section 199 Deductions. Excluding that tax benefit would result in aacquisition adjustments.36.2%. The principal differences between the statutory rate and27.8% for 2019 increased from our effective rate were the R&D Credits, the Section 199 Deduction, other permanent items, unrecognized tax benefits and state taxes.2015 vs. 2014During the year ended December 31, 2015, we recorded income tax expense of $15.3 million, an increase of $2.9 million compared to the prior year. Net income before taxes of $39.8 million increased $13.5 million year-over-year. Ournormalized effective tax rate decreased from 47.0%of 25.8% for 2018. The 2019 normalized effective tax rate excludes tax benefits related to 38.4% primarily due to a change in unitary state apportionmentsstock compensation net windfalls and permanent differences. The principal differences between the statutory ratereversal of prior years' uncertain tax benefits of (10.0%) and our effective rate were state taxes and permanent differences.Net Income2016 vs. 2015During the year ended December 31, 2016, net income was $37.6 million which represents a $13.1 million increase compared to net income of $24.5 million for 2015.2015 vs. 2014During the year ended December 31, 2015, net income was $24.5 million which represents a $10.6 million increase compared to net income of $13.9 million for 2014.Supplementary DataNotes thereto, included in Part II, Item 8 of this Annual Report on2019 Form 10-K.follows: Years Ended December 31, (In thousands) 2016 2015 Cash and cash equivalents $ 175,999 $ 145,610 Working capital $ 277,478 $ 240,456 Available borrowings under credit facility $ 183,913 $ 121,204
follows (in thousands):36Years ended December 31, 2019 2018 Cash and cash equivalents $ 139,268 $ 178,946 Working capital $ 296,093 $ 328,684 Available borrowings under credit facility $ 253,500 $ 253,500 iswas as follows: Years Ended December 31, (In thousands) 2016 2015 2014 Net cash provided by operating activities $ 88,639 $ 72,285 $ 100,556 Net cash used in investing activities (39,201 ) (11,817 ) (26,201 ) Net cash used in financing activities (19,049 ) (47,974 ) (34,605 ) Net increase in cash and cash equivalents $ 30,389 $ 12,494 $ 39,750 Years ended December 31, 2019 2018 2017 Net cash provided by operating activities $ 133,232 $ 96,457 $ 86,464 Net cash used in investing activities (205,059) (30,413) (204,364) Net cash provided by financing activities 32,149 29,589 25,214 Net increase / (decrease) in cash and cash equivalents $ (39,678) $ 95,633 $ (92,686) and SG&A expenses and acquisitions.§the working capital requirements of our operations;§investments in our business;§business development activities;§repurchases of common stock; and§repayment of our revolving credit facility.toinvestments or repay our indebtedness under the Credit Agreement, which matures in May 2018.Agreement. If we need to obtain new debt or equity financing in the future, the terms and availability of such financing may be impacted by economic and financial market conditions as well as our financial condition and results of operations at the time we seek additional financing.20162019 was $89.0$133.2 million, a $16.7$36.7 million increase from net cash provided by operating activities of $72.3$96.5 million for the year ended December 31, 2015.2018. The increase was primarily due to an increasesa $32.2 million increase in net income, as adjusted for non-cash items including decreased stock-based compensation expensea $14.7 million decrease in the amortization of intangibles and a $7.7 million gain on the sale of a cost-basis investment. These increases were partially offset by a $10.8 million change in deferred income taxes, as well asa $4.1 million increase in accounts payable and other liabilities.Net cash provided by operating activities for the year ended December 31, 2015 was $72.3 million, a $28.3 million decrease from net cash provided by operating activities of $100.6 million for the year ended December 31, 2014. This decrease was primarily due to an increase in accounts receivablenoncash lease expense and a net decrease in our net deferred taxoperating assets and liabilities and accounts payable, partially offset by an increase in net income.Net cash provided by operating activities for the year ended December 31, 2014 was $100.6 million, a $0.6 million decrease from net cash provided by operating activities of $101.2 million for the year ended December 31, 2013. This decrease was driven primarily by a decrease in net income and the net changes in the estimated allowance for unbilled receivables, accounts receivable, accounts payable, accrued expenses and other liabilities and the provision for the accounts receivable allowance.2016,2019, revenue was $489.7$626.4 million, an increase of $15.5$28.1 million compared to revenue of $474.2$598.3 million for the year ended December 31, 2015.2018. DSO increased by 64 days to 124123 days as of December 31, 2016,2019, as compared to 118119 days as of December 31, 2015.2018. The change was primarily due to delaysthe acquisition of Accent resulting in invoicing and receipt of payment for previously recognized revenue as a result of timing delays; offset by accelerated cash collections of invoiced balances; and a decrease in various operational issues including missing Explanation of Benefits which delay invoicing.37Higher accounts receivable balances and higher DSOs in future periods would reduce net cash from operating activities in those periods.3 day increase. We do not currently anticipate collection issues with our accounts receivable, however, nor do we currently expect that any extended collections will materially impact our liquidity.re-awarded.20162019 was $39.5$205.1 million, a $27.7$174.7 million increase compared to net cash used in investing activities of $11.8$30.4 million for the year ended December 31, 2015.2018. This increase was primarily due to the use of approximately $20.7$185.8 million, net of cash acquired, for the acquisitions of Accent and VitreosHealth, proceeds from the sale of our cost basis investment in the Essette acquisitionInstaMed of $9.8 million and purchasethird quarter of 2016.year ended December 31, 2019. Purchases of property and equipment and investment in capital software also increased by $9.2 million. These increases were partially offset by the receipt of proceeds from the sale of a cost basis investment of approximately $2.5 million.Net cash used in investing activities for the year ended December 31, 2015 was $11.8 million, a $14.4 million decrease compared to net cash used in investing activities of $26.2 million for the year ended December 31, 2014. The decrease was primarily related to a $14.1 million decrease in purchase of property and equipment and a $0.3 million decrease in investment in capitalized software.Net cash used in investing activities for the year ended December 31, 2014 was $26.2 million, a $0.1 million decrease compared to net cash used in investing activities of $26.3 million for the year ended December 31, 2013. This decrease was primarily related to a $0.5 million decrease in investments in common stock and a $0.1 million decrease in investment in capitalized software which were offsetdecreased by a $0.5$8.8 million increase in purchases of property and equipment.$28approximately $34 million during the year ended December 31, 2017.used inprovided by financing activities for the year ended December 31, 20162019 was $19.0$32.1 million, a $29.0$2.5 million decreaseincrease from net cash used inprovided by financing activities of $48.0$29.6 million for the year ended December 31, 2015.2018. This decreaseincrease was primarily attributable to a decrease in shareresult of the Company not making any repurchases as compared to the prior year. Approximately $20.5 million was used for share repurchases of 1,140,332 of our shares of common stock at a weighted average priceduring fiscal year 2019, compared to approximately $6.0 million in 2018, partially offset by an increase in tax withholding payments for employees' net-share settlement of $17.93 per share pursuant to an authorized sharestock options.program as more fully describedany shares of our common stock. See the discussion under “Repurchases of Shares of Common Stock” under Part II, Item 5 and “Equity” in Note 8 – “Equity” in our Notes10 to the Consolidated Financial Statements under Part II, Item 8. Consolidated Financial Statements and Supplementary Data.Net cash used in financing activities8 for the year ended December 31, 2015 was $48.0 million, a $13.4 million increase from net cash used in financing activities of $34.6 million for the year ended December 31, 2014. This increase was primarily attributable to $50.0 million used in 2015 for share repurchases of 4,747,441 of our shares of common stock at a weighted average price of $10.51 per share pursuant to an authorized share repurchase program, partially offset by a $35.0 million reduction in payments toward the principal outstanding on our revolving credit facility and. No share repurchases were made during the year ended December 31, 2014.Net cash used in financing activities for the year ended December 31, 2014 was $34.6 million, an $82.2 million decrease from net cash used in financing activities of $116.8 million for the year ended December 31, 2013. This decrease was primarily attributable to a $60.0 million reduction in payments toward the principal outstanding on our revolving credit facility and a $25.0 million reduction foradditional information regarding share repurchases. No share repurchases were made for the year ended December 31, 2014.38financial institutionslenders and Citibank, N.A. as Administrative Agent.administrative agent. The Credit Agreement has a five-year term, providesoriginally provided for an initial $500 million five-year revolving credit facility maturing on May 3, 2018. On December 19, 2017, we entered into an amendment to the Credit Agreement that, among other things, provided for an extension of the maturity date of our then-existing senior secured revolving credit facility to December 19, 2022, which includes a $50 million sublimit for the issuance of letters of credit and a $25 million sublimit for swingline loans. In addition, the Credit Agreement includes an accordion feature that permits us to increase the revolving credit facility up to the sum of (a) the greater of $120 million and 100% of Consolidated EBITDA (as defined in the Credit Agreement) and (b) additional amounts so long as our first lien leverage ratio (as defined in the Credit Agreement) on a pro forma basis is not greater than 3.00:1.00, in each case subject to obtaining commitments from lenders therefor and meeting certain other conditions. Our obligationsany amounts due underexpires June 30, 2020.Agreement are guaranteed by our material 100% owned subsidiaries and secured by a security interest in all or substantially all of our and our subsidiaries’ physical assets. Agreement.7 – “Credit Agreement” in our Notes9 to the Consolidated Financial Statements underin Part II, Item 8. Consolidated Financial Statements and Supplementary Data8 for additional information regarding our Credit Agreement.As of December 31, 2016, the Company was in compliance with all the terms of the Credit Agreement.Share Repurchase ProgramDuring the year ended December 31, 2016, we repurchased 1.1 million shares of our common stock for approximately $20.5 million using cash resources. See Note 8 – “Equity” in our Notes to the Consolidated Financial Statements under Item 8. Consolidated Financial Statements and Supplementary Data for additional information regarding share repurchases.commitments (commitments:Total Less than 1 year 1 - 3 years 3 -5 years More than 5 years $ 18,726 $ 5,808 $ 7,092 $ 4,835 $ 991 240,000 — 240,000 — — 24,027 8,171 15,856 — — 1,949 653 1,296 — — 1,154 454 454 246 — 53 53 — — — 28,334 15,211 13,123 — — Total $ 314,243 $ 30,350 $ 277,821 $ 5,081 $ 991 thousands): Payments Due by Period Contractual Obligations (7) Total Less than
1 year 1 - 3 years 3 -5 years More
than 5
yearsOperating leases (1) $ 38,568 $ 16,077 $ 10,598 $ 7,041 $ 4,852 Revolving credit facility (2) 197,796 - 197,796 - - Interest expense (3) 7,368 5,511 1,857 - - Commitment fee (4) 2,028 1,517 511 - - Capital leases (5) 4 4 - - - Letter of Credit fee (6) 26 26 - - - Total $ 245,790 $ 23,135 $ 210,762 $ 7,041 $ 4,852 ____________________________(1)Represents the future minimum lease payments under non-cancelable operating leases. In addition to minimum rent, certain leases require the payment for insurance, maintenance and other costs. These costs have historically represented approximately 3% to 6% of the minimum rent amount. These additional amounts are not included in the table of contractual obligations as the timing or amounts of such payments are unknown.(2)Represents scheduled repayments of principal on the revolving credit facility under the terms of our Credit Agreement. See Note 7 - “Credit Agreement” in our Notes to the Consolidated Financial Statements in Item 8. Consolidated Financial Statements and Supplementary Data for additional information regarding the Credit Agreement.
Part II, Item 8 for additional information regarding Leases.39(3)Represents estimates of amounts due on revolving credit facility based on the interest rate as of December 31, 2016 and on scheduled repayments of principal. See Note 7 - “Credit Agreement” in our Notes to the Consolidated Financial Statements in Item 8. Consolidated Financial Statements and Supplementary Data for additional information regarding the Credit Agreement.(4)Represents the commitment fee due on the revolving credit facility. See Note 7 - “Credit Agreement” in our Notes to the Consolidated Financial Statements in Item 8. Consolidated Financial Statements and Supplementary Data for additional information regarding the Credit Agreement.(5)Represents the future minimum lease payments under capital leases.(6) the letter of credit established against the revolving credit facility. See Note 7 - “Credit Agreement” in our Notes to the Consolidated Financial Statements in Item 8. Consolidated Financial Statements and Supplementary Data for additional information regarding the Credit Agreement.(7)The Company has excluded long-term unrecognized tax benefits, including interest and penalties, of $7.4 million from the amounts presented as the timing of these obligations is uncertain.As part of our contractual agreement with a customer, we have an outstanding irrevocable letter of credit for $3.0 million, which we established against our existing revolving credit facility. On May 1, 2017, the expiration date of the letter of credit was extendedissued against the revolving credit facility. See Note 9 to April 26, 2018.of the Notes to the Consolidated Financial Statements included in Part II, Item 8. Consolidated Financial Statements and Supplementary Data8 is incorporated herein by reference.2016,2019, we were not a party to any derivative financial instruments. We conduct allmost of our business in U.S. currency and hencehave limited operations outside of the United States. As such, do not have directmaterial foreign currency risk.risk exposure. As we continue to grow our foreign operations, our exposure to foreign currency exchange rate risk could become more significant. We are exposed to changes in interest rates, primarily with respect to our revolving credit facility under our Credit Agreement. If the effective interest rate for all of our variable rate debt were to increase by 100 basis points (1%), our annual interest expense would increase by a maximum of $2.0$2.4 million based on our debt balances outstanding at December 31, 2016.2019. Further, we currently invest substantially all of our excess cash in short-term investments, primarily money market accounts, where returns effectively reflect current interest rates. As a result, market interest rate changes may impact our interest income or expense. The impact will depend on variables such as the magnitude of rate changes and the level of borrowings or excess cash balances. We do not consider this risk to be material. We manage such risk by continuing to evaluate the best investment rates available for short-term, high quality investments.on pages 101 to 123under Item 15 of this Annual Report on2019 Form 10-KNone.402016.2019. Based on ourthat evaluation, our Chief Executive Officer and Chief Financial Officer concluded that our disclosure controls and procedures were not effective as of December 31, 2016 due to the identificationend of material weaknesses in our internal control over financial reporting as described in the period covered by the 2019 Form 10-K. below.(b) Management’s Report on Internal Control Over Financial Reportingofunder the Exchange Act, internal control over financial reporting is a process designed by, or under the supervision of our Chief Executive Officer and our Chief Financial Officer and effected by our Board of Directors, management and other personnel, to provide reasonable assurance regarding the reliability of financial reporting and the preparation of the consolidated financial statements for external purposes in accordance with U.S. GAAP.A material weakness is a deficiency, or combination of deficiencies, in internal control over financial reporting such that there is a reasonable possibility that a material misstatement in our annual or interim financial statements will not be prevented or detected on a timely basis.In connection with the preparation of our annual consolidated financial statements, management has undertaken an assessment of the effectiveness of our internal control over financial reporting as of December 31, 2016, based on criteria established in the Internal Control-Integrated Framework issued by COSO. Management’s assessment included an evaluation of the design of our internal control over financial reporting and testing of the operational effectiveness of those controls.Based on that assessment, management identified the following material weaknesses:We did not maintain an effective control environment based on lack of established reporting lines and defined authorities and responsibilities for financial reporting at our wholly owned subsidiary, HDI, and did not have an effective risk assessment process on a periodic basis to assess the effects of changes in business operations and turnover of our employees that significantly impact our financial processes and internal control over financial reporting related to (i) our estimated liability for appeals associated with our contract with CMS (the “CMS Reserve”) and (ii) the valuation of our accounts receivable allowance (the “Allowance”). As a result, we did not design and implement effective process level control activities, specifically management review controls over the measurement and disclosure of the CMS Reserve and the Allowance and controls over the completeness and accuracy of data used to calculate the CMS Reserve and the Allowance.41The material weaknesses identified above resulted in an immaterial reclassification error in revenue and selling, general and administrative expenses that was corrected prior to the issuance of the consolidated financial statements. These material weaknesses create a reasonable possibility as of December 31, 2016 that a material misstatement to the consolidated financial statements will not be prevented or detected on a timely basis; therefore, we concluded that our internal control over financial reporting was not effective as of December 31, 2016.KPMG LLP, the independent registered public accounting firm that audited our consolidated financial statements included in this Annual Report on Form 10-K, has issued an adverse opinion in their report on the effectiveness of our internal control over financial reporting, a copy of which appears on page 99.Except as relating to the material weaknesses identified in the current period and described under “Management’s Report on Internal Control Over Financial Reporting,” therein ourto the Company’s internal control over financial reporting identified in connection with the evaluation of our controls performed during the quarter ended December 31, 20162019 that have materially affected, or are reasonably likely to materially affect, our internal control over financial reporting.(d) RemediationManagement is currently revising and supplementing our control environment and our risk assessment process and the design of our process level controls in order to remediate the material weaknesses described above, including a set of compensating controls in the near term. We are enhancing and revising the design of controls and procedures to ensure the calculations of the CMS Reserve and the Allowance properly utilize historical information to derive the period-end balances. Additionally, management will be supplementing the review controls over the CMS Reserve and the Allowance, and controls over the completeness and accuracy of the data used to calculate the balances with additional levels of review involving senior members of our accounting department and will assess the need for additional remediation steps. We believe that the steps identified should remediate the control weaknesses identified.None.42BOARD OF DIRECTORSBoard of Directorsinformation required by this Item 10 is currently composed of nine members, eight of whom are non-employee directors. Pursuantincorporated herein by reference to the applicable disclosure found in our Bylaws, our Board of Directors is currently divided into two classes, Class I and Class II,definitive proxy statement to be filed with one class standing for election each year for a term of two years. The following table sets forth certain information with respect to each of our directors.Name Age Has Served as a Director Since Position with HMS Class II Directors (Terms expire at the 2017 Annual Meeting) William F. Miller III 67 2000 Class II Director Ellen A. Rudnick 66 1997 Class II Director Richard H. Stowe 73 1989 Class II Director and Lead Independent Director Cora M. Tellez 67 2012 Class II Director Class I Directors (Terms expire at the 2018 Annual Meeting) Alex M. Azar II(1) 49 2016 Class I Director Robert Becker(2) 63 2016 Class I Director Craig R. Callen 61 2013 Class I Director William C. Lucia 59 2009 Chairman, President and Chief Executive Officer, and Class I Director Bart M. Schwartz 70 2010 Class I Director (1)In October 2016, the Board of Directors increased the size of the board to nine members and appointed Mr. Azar as a Class I director.(2)The Board of Directors appointed Mr. Becker as a Class I director in January 2016 to fill a vacancy on the Board.Detailed biographical information of each director, as well as a description of the specific experience, qualifications, attributes and skills that led our Board to conclude that each director should serve as a member of our Board of Directors, is below.Class II DirectorS (Terms expire at the 2017 annual meeting)William F. Miller III
Mr. Miller has served as one of our directors since October 2000. In 2013, Mr. Miller joined KKR Advisors, a global investment firm, as a healthcare industry advisor. From 2006 to 2013, Mr. Miller was a partner at Highlander Partners, a private equity group in Dallas, Texas focused on investments in healthcare products, services and technology. From October 2000 to April 2005, Mr. Miller served as our Chief Executive Officer and from December 2000 to April 2006, Mr. Miller served as our Chairman. From 1983 to 1999, Mr. Miller served as President and Chief Operating Officer of EmCare Holdings, Inc., a national healthcare services firm focused on the provision of emergency physician medical services. From 1980 to 1983, Mr. Miller served as Administrator/Chief Operating Officer of Vail Mountain Medical. From 1997 to 2012, Mr. Miller served as a director of Lincare Holdings, Inc.Mr. Miller brings to the Board of Directors both a thorough understanding of our business and the healthcare industry and extensive experience in the financial markets. His significant operational experience, both at HMS and at EmCare Holdings, makes him well-positioned to provide HMS with insight on financial, operational and strategic issues and to serve as a member of the Compliance and Ethics Committee.43Ellen A. Rudnick
Ms. Rudnick has served as one of our directors since 1997. Since 1999, Ms. Rudnick has served in various roles at the Polsky Center for Entrepreneurship and Innovation, University of Chicago Booth School of Business, including her current role as Senior Advisor for Entrepreneurship, adjunct faculty, and her prior role as Executive Director and Clinical Professor from 1999 through July 2016. From 1993 to 1999, Ms. Rudnick served as Chairman of Pacific Biometrics, Inc., a publicly held healthcare biodiagnostics company and its predecessor, Bioquant, which she co-founded. From 1990 to 1992, she served as President and Chief Executive Officer of Healthcare Knowledge Resources (HKR), a privately held healthcare information technology corporation and subsequently served as President of HCIA, Inc. (HCIA) following the acquisition of HKR by HCIA. From 1975 to 1990, Ms. Rudnick served in various positions at Baxter Health Care Corporation, including Corporate Vice President and President of its Management Services Division. Ms. Rudnick also serves as a director of Patterson Companies, Inc. and First Midwest Bancorp, Inc.Ms. Rudnick brings to the Board of Directors extensive business understanding and demonstrated management expertise, having served in key leadership positions at a number of healthcare companies. Ms. Rudnick has a comprehensive understanding of the operational, financial and strategic challenges facing companies and knows how to make businesses work effectively and efficiently. Her management experience and service on other public company boards has provided her with a thorough understanding of the financial and other issues facing large companies, making her particularly valuable as the Chair of our Audit Committee and as a member of our Compliance and Ethics Committee and Nominating and Governance Committee.Richard H. Stowe
Mr. Stowe has served as one of our directors since 1989 and as Lead Independent Director of the Board since July 2015. Mr. Stowe has served as a general partner of Health Enterprise Partners LP, a private equity firm, since 2005. From 1999 to 2005, Mr. Stowe was a private investor, a senior advisor to the predecessor funds to Health Enterprise Partners, and a senior advisor to Capital Counsel LLC, an asset management firm. From 1979 until 1998, Mr. Stowe was a general partner of Welsh, Carson, Anderson & Stowe. Prior to 1979, he was a Vice President in the venture capital and corporate finance groups of New Court Securities Corporation (now Rothschild, Inc.).Mr. Stowe brings over 46 years of financial, capital markets and investment experience to our Board of Directors. Mr. Stowe’s background and extensive experience make him well-positioned to serve as the Chair of the Compensation Committee, a member of the Nominating and Governance Committee and as our Lead Independent Director. Mr. Stowe has effectively carried out his responsibilities as a Chair for several of our Board committees and is well-respected by the independent directors. The Board believes that Mr. Stowe is highly qualified and continues to be in the best position to serve as Lead Independent Director.44Cora M. Tellez
Ms. Tellez has served as one of our directors since October 2012. Ms. Tellez is the President and Chief Executive Officer of Sterling HSA, an independent health savings accounts administrator which she founded in 2004. Prior to starting Sterling HSA, Ms. Tellez served as President of the health plans division of Health Net, Inc., an insurance provider. She later served as President of Prudential’s western health care operations, CEO of Blue Shield of California, Bay Region and Regional Manager for Kaiser Permanente of Hawaii. Ms. Tellez also serves as Chief Executive Officer of Amazing CARE Network, Inc., a company she founded in January 2015. Ms. Tellez serves on the boards of directors of Pacific Premier Bancorp, Inc. and CorMedix Inc., as well as on the boards of various nonprofit organizations such as the Institute for Medical Quality and UC San Diego’s Center for Integrative Medicine.Ms. Tellez brings over 25 years of healthcare policy and operations experience to the Board. Her public company operational, financial and corporate governance experience is a valuable resource for our Board and makes her well-positioned to serve as the Chair of the Nominating and Governance Committee, a member of the Audit and Compensation Committees and as an audit committee financial expert.Class I Directors (Terms expire at the 2018 annual meeting)Alex M. Azar II
Mr. Azar has served as one of our directors since October 2016. Mr. Azar is currently Chairman of Seraphim Strategies, LLC, a firm he founded in 2017, which provides strategic consulting and counsel on the biopharmaceutical and health insurance industries, including biopharmaceutical pricing, reimbursement, access, and distribution, as well as federal and state healthcare policy. From January 2012 to January 2017, Mr. Azar served as President of Lilly USA, LLC, the largest affiliate of global biopharmaceutical company Eli Lilly & Co. (Lilly), where he was responsible for directing the sales and marketing operations of Lilly’s U.S. commercial business and also directly led the U.S. Biomedicines division. From April 2009 to December 2011, he served as Lilly’s Vice President of Managed Healthcare Services and Puerto Rico, and from June 2007 to April 2009 as its Senior Vice President of Corporate Affairs and Communications responsible for the company’s global communications, government affairs, public policy, advocacy, and pricing, reimbursement and access organizations. Prior to joining Lilly, Mr. Azar served as the Deputy Secretary of the U.S. Department of Health and Human Services (HHS) from 2005 to 2007, where he was the Chief Operating Officer of the largest civilian cabinet department in the U.S. government. Mr. Azar supervised all operations of HHS, including the regulation of food and drugs, Medicare, Medicaid, medical research, public health, welfare, child and family services, disease prevention, Indian health, mental health services, and others. Mr. Azar served as General Counsel of HHS from 2001 to 2005. Prior to his service at HHS, Mr. Azar was in private legal practice. He also served as a Law Clerk to U.S. Supreme Court Justice Antonin Scalia. Mr. Azar serves on the boards of the American Council on Germany and the Indianapolis Symphony Orchestra.Mr. Azar brings an important blend of government and healthcare industry experience to our Board of Directors. He has an informed perspective on healthcare policy and extensive experience with big data, which is particularly relevant to us as we expand into the care management and data analytics field.45Robert Becker
Mr. Becker has served as one of our directors since January 2016. Mr. Becker most recently served as President and CEO of Wolters Kluwer Health, a provider of information and point of care solutions to the healthcare industry, from December 2008 until his retirement in May 2015. In his role at Wolters Kluwer Health, Mr. Becker reported to the Chairman of the Executive Board and had global responsibility for Wolters Kluwer’s $1.2 billion Health division. From August 2003 to November 2008, he served as CEO of Wolters Kluwer Law & Business. Mr. Becker led the transformation of both the Health and Law & Business divisions from traditional publishers to world class providers of digital content and software solutions through a combination of organic growth and mergers and acquisitions. Prior to joining Wolters Kluwer, Mr. Becker served as President and CEO of Jupiter Media Metrix, a provider of comprehensive research and measurement products and services designed to assist companies in utilizing Internet technologies to more effectively operate their businesses. Mr. Becker also spent 13 years with The Thomson Corporation, 10 years as a CEO and three as a CFO of several global businesses. Mr. Becker, who is a CPA, began his career at PriceWaterhouse auditing numerous public and privately held companies. Mr. Becker previously served on the board of directors of Symphony Health, a privately held portfolio company of Symphony Technology Group providing pharmacy claims and patient longitudinal health records to the pharmaceutical industry.Mr. Becker’s executive leadership experience and strong background in technology and data analytics provide valuable insight into strategic planning and operations to the Board. Among other qualifications, Mr. Becker brings to the Board extensive financial expertise, including budgeting, forecasting and mergers and acquisitions, making him well-positioned to serve as a member of the Audit Committee and an audit committee financial expert, as well as a member of the Nominating and Governance Committee.Craig R. Callen
Mr. Callen has served as one of our directors since October 2013. Mr. Callen was a Senior Advisor at Crestview Partners, a private equity firm, from 2009 through 2016. From 2004 to 2007, Mr. Callen was Senior Vice President and Head of Strategic Planning and Business Development and a member of the Executive Committee for Aetna, Inc. In his role at Aetna, Mr. Callen reported directly to the Chairman and CEO and was responsible for oversight and development of Aetna’s corporate strategy, including mergers and acquisitions. During his tenure, Mr. Callen and his team led the acquisitions of seven companies, investing over $2.0 billion, broadening Aetna’s revenue, global presence, product line, targeted markets and participation in government programs. Prior to joining Aetna, Mr. Callen was a Managing Director and Head of U.S. Healthcare Investment Banking at Credit Suisse First Boston and Co-Head of Healthcare Investment Banking at Donaldson, Lufkin & Jenrette. Mr. Callen serves on the board of directors of Omega Healthcare Investors, Inc.Mr. Callen brings over 20 years of healthcare investment banking experience and corporate development expertise to our Board, which are invaluable to us as we evaluate, develop and implement new solutions for clients. His extensive experience in a corporate setting and as an advisor to public/private healthcare companies positions him well to serve on the Compensation and Nominating and Governance Committees.46William C. Lucia
Mr. Lucia has served as our President and Chief Executive Officer since March 2009. He has been a member of our Board of Directors since May 2008 and was appointed Chairman of the Board in July 2015. From May 2005 to March 2009, Mr. Lucia served as our President and Chief Operating Officer. Since joining us in 1996, Mr. Lucia has held several positions with us, including: President of our subsidiary, Health Management Systems, Inc., from 2002 to 2009; President of our Payor Services Division from 2001 to 2002; Vice President and General Manager of our Payor Services Division from 2000 to 2001; Vice President of our Business Office Services from 1999 to 2000; Chief Operating Officer of our former subsidiary Quality Medical Adjudication, Incorporated (QMA) and Vice President of West Coast Operations from 1998 to 1999; Vice President and General Manager of QMA from 1997 to 1998; and Director of Information Systems for QMA from 1996 to 1997. Prior to joining us, Mr. Lucia served in various executive positions including Senior Vice President, Operations and Chief Information Officer for Celtic Life Insurance Company, and Senior Vice President, Insurance Operations for North American Company for Life and Health Insurance. Mr. Lucia is a Fellow of the Life Management Institute Program through LOMA, an international association through which insurance and financial services companies around the world engage in research and educational activities to improve company operations.With over 20 years of experience with HMS working across multiple divisions and his prior experience in the insurance industry, Mr. Lucia brings to our Board in-depth knowledge of HMS and the healthcare and insurance industries, the evolving healthcare landscape and the array of challenges to be faced and demonstrates an ability to formulate and implement key strategic initiatives, making him well-positioned to lead our management team and provide essential insight and leadership to the Board.Bart M. Schwartz
Mr. Schwartz has served as one of our directors since July 2010. Mr. Schwartz currently serves as the Chairman and Chief Executive Officer of SolutionPoint International, LLC, which provides an integrated array of business intelligence, security and compliance, identity assurance and situational awareness solutions. In 2003, Mr. Schwartz founded his own law firm, which specializes in, among other areas, conducting independent investigations, monitoring and Independent Private Sector Inspector General engagements and developing, auditing and implementing compliance programs. From 1991 to 2003, Mr. Schwartz served as the Chief Executive Officer of Decision Strategies, an internationally recognized investigative and security firm, which was sold to SPX Corporation in 2001. Mr. Schwartz has over 30 years’ experience managing domestic and international investigations, prosecutions and assessments for clients in both the public and private sectors. He currently serves as the federally appointed Monitor of GM and as Chairman of the Board of Kadmon Holdings, Inc.Mr. Schwartz brings extensive legal and compliance experience to our Board, which is particularly valuable as we continue to expand our business. Mr. Schwartz’s background makes him well-positioned to serve as the Chair of the Compliance and Ethics Committee and as a member of the Audit and Nominating and Governance Committees.47EXECUTIVE OFFICERSThe following table sets forth certain information with respect to each person who currently serves as one of our executive officers as of the date of this Annual Report on Form 10-K. Our executive officers are elected annually by our Board of Directors and generally serve at the discretion of our Board of Directors. There are no arrangements or understandings between any of our executive officers and any other personSEC pursuant to which they were selected as an officer. None of our directors or executive officers are related to any other director or executive officer of HMS or any of its subsidiaries by blood, marriage or adoption.NameAgePositionWilliam C. Lucia59Chairman, President and Chief Executive OfficerMeredith W. Bjorck41Executive Vice President, General Counsel and Corporate SecretarySemone Neuman53Executive Vice President, Operations and Information TechnologyCynthia Nustad46Executive Vice President, Chief Strategy OfficerJeffrey S. Sherman51Executive Vice President, Chief Financial Officer and TreasurerTracy A. South58Executive Vice President, Human Resources and Chief Administrative OfficerDouglas M. Williams58President, Markets and ProductThe principal occupations for the last five years, as well as certain other biographical information, for each of our current executive officers who are not directors are set forth below. See “Class I Directors” above for biographical information for Mr. Lucia.Meredith W. Bjorck
Ms. Bjorck has served as our Executive Vice President, General Counsel and Corporate Secretary since April 2016. Ms. Bjorck previously served as Senior Vice President, General Counsel and Corporate Secretary for Tuesday Morning Corporation, a national off-price retailer, from January 2013 to March 2016. From April 2008 until January 2013, Ms. Bjorck served in various capacities for CEC Entertainment, Inc., an international restaurant chain, including as Deputy General Counsel, Chief Compliance Officer and Corporate Secretary. Prior to joining CEC Entertainment, Ms. Bjorck was an attorney at Fulbright & Jaworski L.L.P. (now Norton Rose Fulbright) and Vinson & Elkins L.L.P., where she specialized in corporate securities and mergers and acquisitions.Semone Neuman
Ms. Neuman has served as our Executive Vice President, Operations and Information Technology since December 2016, responsible for our operations for coordination of benefits, premium protection and subrogation services and information technology. From April 2013 to December 2016, she served as our Executive Vice President of Operations. Ms. Neuman has extensive experience in healthcare claims processing, operations and reengineering. She has a track record for leading change, driving quality performance and reducing unit costs in complex operating environments. Prior to joining HMS, Ms. Neuman served as Senior Vice President of Claim Operations at United HealthCare (UHC), from 2009 to 2013, where she oversaw the operations for all business lines and major platforms processing over 500 million claims annually. Under her leadership, UHC achieved industry-leading performance levels, earning the American Medical Association designation for the industry’s best claim operation in 2011 and 2012.48Cynthia Nustad
Ms. Nustad has served as our Executive Vice President, Chief Strategy Officer since December 2016, and is responsible for strategy development, evolution and growth of our technology and analytics software and services and care management solutions. From February 2011 to December 2016, she served as our Executive Vice President, Chief Information Officer. Prior to joining HMS, Ms. Nustad served as Vice President of Architecture and Technology for Regence Blue Cross Blue Shield (now Cambia Health Solutions), where she was responsible for servicing a large corporation across multiple sites and states from January 2005 to January 2011. Ms. Nustad has over 20 years of management experience in the healthcare information technology industry, including executive experience in enterprise technology, business transformation, product development and innovation. Ms. Nustad and her teams have earned numerous industry awards, including the Computerworld Premier 100 IT Leader award in 2013.Jeffrey S. Sherman
Mr. Sherman has served as our Executive Vice President, Chief Financial Officer and Treasurer since September 2014, and is also responsible for corporate development, investor relations, risk management and corporate security. Mr. Sherman has over 25 years of experience in healthcare operations, strategic planning and financial performance in senior financial executive positions. Prior to joining HMS, Mr. Sherman served as Executive Vice President and Chief Financial Officer of AccentCare, a healthcare delivery organization, from September 2013 to August 2014. From April 2009 to September 2013, he served as Executive Vice President and Chief Financial Officer of Lifepoint Hospitals, Inc. From September 2005 until April 2009, Mr. Sherman served as Vice President and Treasurer of Tenet Healthcare, where he managed all aspects of corporate finance, including cash flow management and capital structure, and was also responsible for risk management. Mr. Sherman served in various capacities for Tenet Healthcare and its predecessor company since 1990, including as a hospital chief financial officer and regional vice president.Tracy A. South
Ms. South has served as our Executive Vice President, Human Resources and Chief Administrative Officer since May 2014. She served as our Senior Vice President of Human Resources from December 2011 to May 2014. Ms. South has over 21 years of executive-level human resources experience, including at national healthcare organizations. From 2003 to 2011, Ms. South served as the Senior Vice President, Chief Human Resources Officer at Mosaic Sales Solutions, a privately-held full-service marketing agency in Irving, Texas. During her tenure at Mosaic, she built the company’s North America Human Resources department, focusing on attracting and training a dispersed workforce of over 10,000 employees hired to represent world class brands at retail, in the community and online. In her role, Ms. South oversaw Talent Acquisition, HR Services and Organizational Effectiveness. Ms. South has also served in HR leadership roles at Tenet Healthcare and Aetna US Healthcare.49Douglas M. Williams
Mr. Williams has served as our President, Markets and Product since December 2016, with responsibility for leading sales and marketing, product management and payment integrity solutions. From January 2015 to December 2016, he served as our Division President of Markets with responsibility for leading the state and federal government and commercial markets, sales and marketing. From December 2013 to January 2015, he served as our Division President of Commercial Solutions, responsible for leading our commercial product and business development strategy. Prior to joining HMS, Mr. Williams served as Chief Information Officer of Aveta Inc. (now part of Optum, Inc.), a provider of managed healthcare services, from 2010 to 2013. Mr. Williams has over 25 years of experience in healthcare information technology, sales, and operations.SECTION 16(a) BENEFICIAL OWNERSHIP REPORTING COMPLIANCEPursuant to Section 16(a) ofRegulation 14A under the Exchange Act our executive officers, directorsin connection with HMS Holdings Corp.’s 2020 Annual Meeting of Shareholders under “persons owning more than 10% of a registered class of our equity securities are required to file reports of ownershipDirector Nominations for 2021 Annual Meeting,” and changes in ownership of common stock with the SEC. Copies of such reports are required to be furnished to us.Based solely on a review of the copies of such reports furnished to us, or written representations that no other reports were required, we believe that during fiscal 2016, all of the reporting persons complied with the requirements of Section 16(a).CORPORATE GOVERNANCErelated mattersThe Board of Directors has the following standing committees: Audit Committee, Compensation Committee, Compliance and Ethics Committee and Nominating and Governance Committee, each of which operates pursuant to a separate charter that has been approved by the Board of Directors. A current copy of each charter is available on our website under the “Investors—Corporate Governance” tabs at http://investor.hms.com/corporate-governance.cfm. Each committee reviews the appropriateness of its charter on an annual basis, as required by its charter, and recommends any changes to the Board of Directors for approval.The Board of Directors makes committee and committee chair assignments annually at its meeting following the annual meeting of shareholders, although further changes to committee assignments are made from time to time as deemed appropriate by the Board of Directors. The membership of each standing committee as of the date of this Annual Report on Form 10-K and the number of meetings held by each committee during 2016 are summarized in the table below.
Related Matters.”50 Committee Board Audit(2) Compensation(3) Compliance and Ethics Nominating and Governance Alex M. Azar II(1)(4) 
Robert Becker(1)(5) Craig R. Callen(1) William C. Lucia Chairman William F. Miller III(1)(6) Ellen A. Rudnick(1) Chair Bart M. Schwartz(1) Chair Richard H. Stowe(1) Lead Independent Director Chair Cora M. Tellez(1)(7) Chair Number of Meetings in 2016 8 6 7 5 7 (1)The Board has determined that the director is independent as defined in the NASDAQ Marketplace Rules.(2)The Board has determined that each member of the Audit Committee meets NASDAQ’s financial knowledge and sophistication requirements. In addition, the Board has determined that Mr. Becker and Ms. Tellez each qualify as an “audit committee financial expert,” as such term is defined in Item 407(d)(5)(ii) of Regulation S-K.(3)The Board has determined that each member of the Compensation Committee is an independent director, as independence for compensation committee members is defined in the NASDAQ Marketplace Rules. Each of Messrs. Callen and Stowe and Ms. Tellez also qualifies as an “outside director” within the meaning of Section 162(m) of the Internal Revenue Code of 1986 (the “Code”) and as a “non-employee” director under Rule 16b-3 of the Exchange Act.(4)Mr. Azar was appointed as an independent member of the Board of Directors in October 2016.(5)Mr. Becker was appointed as a member of the Audit Committee and the Nominating and Governance Committee effective as of February 19, 2016.(6)Mr. Miller was appointed as a member of the Compliance and Ethics Committee effective as of July 28, 2016.(7)Ms. Tellez stepped down from the Compliance and Ethics Committee and was appointed as a member of the Compensation Committee effective as of July 28, 2016.Code of Conduct“Investors—“Investors—Corporate Governance” tab at http://investor.hms.com/corporate-governance.cfm corporate- governance.cfm and can also be obtained free of charge by sending a written request to our Corporate Secretary.Secretary. To the extent permissible under NASDAQthe Nasdaq Marketplace Rules, we intend to disclose amendments to our Code of Conduct, as well as waivers of the provisions thereof, that relate to our principal executive officer, principal financial officer, principal accounting officer, controller or persons performing similar functions on the Company’s website under the “Investors—Corporate Governance” tab at http://investor.hms.com/corporate-governance.cfm.51EXECUTIVE COMPENSATIONCompensation Discussion and AnalysisThis Compensation Discussion and Analysis (“CD&A”), describes2016 executive compensation program and certain actions with respectdefinitive proxy statement to our 2017 executive compensation program and should be read in conjunctionfiled with the compensation tables that follow this CD&A. In particular, this CD&A explains howSEC pursuant to Regulation 14A under the Compensation Committee of the Board of Directors made its compensation decisions for our named executive officers for fiscal 2016.For 2016, our named executive officers are:§William C. Lucia, Chairman, President and Chief Executive Officer (“CEO”);§Jeffrey S. Sherman, Executive Vice President, Chief Financial Officer and Treasurer;§Semone Neuman, Executive Vice President, Operations and Information Technology;§Cynthia Nustad, Executive Vice President, Chief Strategy Officer; and§Douglas Williams, President, Markets and Product.2016 Say-on-Pay VoteAt our 2016Exchange Act in connection with HMS Holdings Corp.’s 2020 Annual Meeting of Shareholders over 97% of the votes cast on the say-on-pay proposal were in favor of our 2015 executive compensation program described in our 2016 Proxy Statement. The Compensation Committee believes that this vote, and the consistent high level of support from our shareholders of our executive compensation program year over year, affirms our shareholders’ strong support of HMS’s general approach to executive compensation. Therefore, the Compensation Committee did not change its compensation philosophy as it made decisions for 2016. As market practices on executive compensation policies evolve, the Compensation Committee will continue to evaluate and, if needed, make changes to our executive compensation program to ensure that the program continues to reflect our pay-for-performance compensation philosophy and objectives. The Compensation Committee will also continue to consider the outcome of HMS’s say-on-pay votes when making future compensation decisions for executive officers.Executive Summary2016 FINANCIAL PERFORMANCE OVERVIEWOur full year 2016 financial performance included solid growth in revenue, operating income and adjusted EPS, margin expansion, higher adjusted EBITDA, strong operating cash flow and prudent capital deployment – including the Essette acquisition and share repurchases.The following is an overview of our financial performance for the year ended December 31, 2016.§We reported total revenue of $489.7 million, a 3.3% increase compared to total revenue for fiscal 2015 of $474.2 million.§We reported net income of $37.6 million or $0.43 per diluted share, a 53.6% increase compared to net income for fiscal 2015 of $24.5 million or $0.28 per diluted share.§We reported adjusted earnings before interest, income taxes, depreciation and amortization, stock-based compensation and non-recurring legal expense (“adjusted EBITDA”) of $117.4 million, a 4.4% increase compared to adjusted EBITDA for fiscal 2015 of $112.5 million.§We reported adjusted earnings per diluted share (“adjusted EPS”) of $0.75, a 31.6% increase compared to adjusted EPS for fiscal 2015 of $0.57.52§Our stock price increased by 47.2% for the one-year period ending December 30, 2016, from $12.34 per share to $18.16 per share.A reconciliation of the non-GAAP financial measures (adjusted EBITDA and adjusted EPS) to the most directly comparable GAAP measures is set forth below under the heading "Non-GAAP Financial Measures".KEY 2016 COMPENSATION ACTIONSThe following highlights key decisions and actions of the Compensation Committee with respect to executive compensation for 2016. These decisions and actions were made with the advice of the Compensation Committee’s independent consultant, Frederic W. Cook & Co., Inc. (“FW Cook”) (see “Role of the Independent Compensation Consultant” below), and are discussed in greater detail later in this CD&A.§Executive Compensation Peer Group.In January 2016, the Compensation Committee approved certain changes to its executive compensation peer group, resulting in a new 14 company peer group.§Merit-Based Salary Increases. In February 2016, the Compensation Committee approved merit-based salary increases for the named executive officers, other than the CEO.§Annual Short-Term Incentive Plan Performance Metrics. In February 2016, the Compensation Committee introduced a fourth performance metric, adjusted EPS, under the 2016 Short-Term Incentive Plan (the “2016 STIP”), in addition to the metrics used under the prior year’s short-term incentive plan of revenue, adjusted EBITDA, and corporate strategic performance.§Performance-Based Long-Term Incentive Awards.In February 2016, in light of our strong shareholder support evidenced by the results of the say-on-pay vote at our 2015 Annual Meeting of Shareholders, the Compensation Committee continued to grant annual long-term incentive awards to our executive officers consisting, on a substantially equal value basis, of 50% non-qualified stock options and 50% restricted stock units, half of which are subject to stock price performance conditions.§Earned and Unearned Performance Awards. The Compensation Committee determined that the performance conditions for the long-term incentive awards granted on March 4, 2015, May 13, 2015 and March 2, 2016 had been achieved during 2016 (within the 3-year award period), and therefore, the awards have been earned subject only to any remaining time-based vesting and other terms applicable to the awards. In addition, the Compensation Committee determined that the performance conditions for the long-term incentive awards granted on November 15, 2013 had not been achieved within the 3-year award period and therefore, the awards were forfeited during 2016.53KEY COMPENSATION PRACTICES AND GOVERNANCE FEATURESOur executive compensation program reflects a number of best practices used by the Compensation Committee and the Board of Directors.What We DoWhat We Don’t DoPay-for-Performance. Payment of a significant amount of our executives’ total direct compensation is contingent upon satisfaction of certain pre-determined financial and non-financial objectives.Annual Say-on-Pay Votes. We have annual say-on-pay votes and recommend continued annual votes.Independent Compensation Consultant. The Compensation Committee retains a compensation consultant that is independent from management to provide advice to the committee on executive and director compensation, as well as other compensation and benefits matters.Limited Use of Executive Perquisites. We offer limited executive perquisites in order to attract and retain top executive talent and to maintain competitiveness.Stock Ownership Guidelines. Our CEO is required to hold five times his base salary in our common stock and all other executive officers are required to hold two times their base salary in our common stock, aligning the executive officer’s interests with those of our shareholders and mitigating the risk of focusing only on short-term goals.Compensation Recovery (Clawback Policy). We are permitted to recover from any of HMS’s current or former executive officers any incentive bonus and equity compensation gains attributable to such executive officer’s misconduct occurring after January 1, 2015, that causes a subsequent restatement of our financial statements.Employment Agreements. Each of our executive officers has entered into an employment agreement and restrictive covenant agreement with HMS.CEO Compensation. All of our independent directors as a group approve the compensation of our CEO, taking into account the recommendation of the Compensation Committee.No Repricing. We have not reduced the exercise price, repriced or provided cash payment for underwater stock options.No Hedging or Pledging. We do not permit pledging of our securities as collateral for a loan or entering into hedging and derivative transactions with respect to our securities by employees or directors.No Evergreen Equity Plans. Our equity plan does not permit evergreen share authorizations or liberal share recycling.No Pensions or Supplemental Executive Retirement Plans. We only provide retirement benefits to executives that are generally available to all other employees.No Change-in-Control-Related Excise Tax Gross-ups. We do not include change-in-control excise tax gross-up provisions in employment agreements.No Single Trigger Change-in-Control Compensation. We provide double trigger change-in-control compensation.Philosophy, Objectives and Principles of Our captions “ ProgramOur mission is to make the healthcare system work better for everyone. In order to support that mission and Board-approved strategic objectives, while providing adequate returns to our shareholders, we must compete for, attract, develop, motivate and retain top quality executive talent at the corporate and operating business unit levels during periods of both favorable and unfavorable business conditions.54Our executive compensation program is a critical management tool in achieving these objectives. “Pay-for-performance” is the underlying philosophy for our executive compensation program. The program is designed and administered to:§reward performance that drives the achievement of our short and long-term goals;§align the interests of our senior executives with the interests of our shareholders, thus rewarding individual and team achievements that contribute to the attainment of our business goals;§foster teamwork and encourage our senior executives to work together with key personnel in the interest of company performance;§attract, develop, motivate and retain high-performing senior executives by providing a balance of total compensation opportunities, including salary and short and long-term incentives that are competitive with similarly situated companies and reflective of our performance;§maximize the financial efficiency of the overall compensation program from tax, accounting and cash flow perspectives; and§motivate our senior executives to pursue objectives that create long-term shareholder value and discourage behavior that could lead to excessive risk, by balancing our fixed and at-risk pay (both short and long-term incentives) and choosing multiple financial metrics for our short and long-term incentives.PAY-FOR-PERFORMANCEWe design our compensation programs to make a meaningful amount of target total direct compensation (salary, plus target annual incentive compensation, plus target annual long-term incentive compensation) dependent on the achievement of performance objectives.To illustrate this, in the chart that follows, we compare the aggregate target total direct compensation for our CEO for the last three fiscal years to the aggregate compensation for the last three fiscal years that had been earned or that may be considered realizable (based on the methodology described below) as of December 31, 2016. The chart illustrates that our annual and long-term incentive programs over the past three fiscal years have been designed to make a meaningful amount of our CEO’s target total direct compensation dependent on the achievement of performance objectives and have resulted in actual compensation significantly less than the target amount.55
(1)“Target Level Compensation” equals the sum of (i) annual base salary paid in each of the last three fiscal years, (ii) the target value of short-term cash incentive awards for each of the last three fiscal years and (iii) stock awards and option awards granted in each of the last three fiscal years valued at the grant date fair value, the same value at which such awards are required to be reflected in the Summary Compensation Table included in this Annual Report on Form 10-K, under applicable SEC regulations. Target Level Compensation does not include amounts under All Other Compensation in the Summary Compensation Table.(2)“Realizable Compensation” equals the sum of (i) annual base salary paid in each of the last three fiscal years, (ii) actual short-term cash incentive awards earned in each of the last three fiscal years, (iii) the value as of their vesting date of any portion of stock awards granted in each of the last three fiscal years that vested prior to December 31, 2016, (iv) an assumed realizable value for any portion of stock awards granted in each of the last three fiscal years that remained unvested on December 31, 2016, based on the closing market price per share of our common stock on December 30, 2016, the last trading day in 2016, of $18.16 per share and (v) the intrinsic value of option awards granted during fiscal 2015 and 2016 based on the difference between the option exercise prices of $16.77 per share and $13.94 per share, respectively, and the closing market price per share of our common stock on December 30, 2016 of $18.16 per share. For purposes of this table, the intrinsic value of the option award granted during 2014 is zero because the award has an exercise price per share that is greater than the closing market price per share of our common stock on December 30, 2016. For purposes of this table, all performance-based stock awards and option awards are considered earned and all option awards (whether time-based or performance-based) are considered fully vested. The value that may be realized by our CEO on such stock awards and option awards in the future, if any, will depend on the extent to which the performance-based stock awards and option awards are earned and vest, the extent to which time-based stock awards and option awards vest, the market price of our common stock on the vesting date for stock awards and the extent to which there is appreciation in the market price of our common stock over the respective exercise price per share of stock options at the time such options are exercised.56How We Determine ExecutiveROLE OF MANAGEMENTOur CEO, together with our Chief Financial Officer and Executive Vice President of Human Resources, develop recommendations regarding the design of our executive compensation program. In addition, they are involved in setting the financial and strategic objectives that, subject to the approval of the Board and the Compensation Committee, are used as the performance measures for the short and long-term incentive plans. Both the CEO and the Chief Financial Officer provide the Compensation Committee with information relevant to determining the achievement of financial and non-financial performance objectives and related funding levels under our short-term cash incentive plan. Also, as part of its review process in determining executive compensation, the Compensation Committee receives from our CEO an assessment of each other executive officer’s performance against individual objectives and compensation recommendations for such officer, including base salary and short and long-term incentives.ROLE OF THE COMPENSATION COMMITTEEOur executive compensation program is administered by the Compensation Committee, which is composed entirely of independent directors. The Compensation Committee is responsible for designing our executive compensation program, including each element of the program, and determining and approving total executive remuneration. Each year, the Compensation Committee reviews a competitive analysis and assessment of the compensation provided to executive officers and approves executive compensation based on this review, as well as an evaluation of recommendations presented by our CEO with respect to the other executive officers and the advice of FW Cook. Our CEO does not participate in the Compensation Committee’s deliberations or decisions with regard to his own compensation, and the Compensation Committee’s decisions with respect to our CEO’s compensation are reviewed and approved by the independent members of the Board of Directors as a group.ROLE OF THE INDEPENDENT COMPENSATION CONSULTANTThe Compensation Committee is authorized to engage its own independent advisors to assist in carrying out its responsibilities. The Compensation Committee has retained FW Cook as its independent compensation consultant. Representatives of FW Cook regularly attend Compensation Committee meetings and communicate with the Chair of the Compensation Committee outside of meetings. FW Cook reports directly to the Compensation Committee and the Compensation Committee oversees the fees paid for its services. FW Cook provides the Compensation Committee with independent and objective guidance on a variety of matters related to our executive and director compensation programs and general compensation and benefits matters. In addition, FW Cook provides objective guidance regarding management’s executive compensation recommendations, with the instruction that FW Cook is to advise the Compensation Committee independent of management and to provide such advice for the benefit of HMS and its shareholders. FW Cook does not provide any consulting services to HMS beyond its role as a consultant to the Compensation Committee. The Compensation Committee conducts an assessment of the independence of its compensation consultant annually, pursuant to SEC rules and, following its most recent assessment in April 2017, concluded that no conflict of interest exists that would prevent FW Cook from serving as an independent consultant to the Compensation Committee.During fiscal 2016, FW Cook provided the following services to the Compensation Committee:§assisted in the design and development of all elements of the 2016 executive and director compensation program;§consulted on the composition of the peer group and provided competitive benchmarking and market data analysis based on the peer group;§evaluated management’s compensation recommendations and proposals;§consulted on the design of the 2016 Omnibus Incentive Plan and amendments to the Annual Incentive Compensation Plan in light of best practices, industry trends and voting policies of proxy advisory firms;§reviewed and provided advice on the design of the 2016 Short-Term Incentive Plan;§reviewed agendas for the Compensation Committee meetings held in 2016;57§reviewed HMS’s 2016 compensation risk assessment;§consulted on compliance with Section 162(m) of the Code;§provided updates regarding evolving regulatory requirements, emerging trends and best practices in executive compensation; and§reviewed and provided advice on HMS’s executive compensation-related disclosures in the 2016 Proxy Statement and reviewed the compensation-related disclosures and proposals in the 2017 Proxy Statement.Competitive Pay Positioning and Peer Group AnalysesThe Compensation Committee believes that competitive pay positioning is a key factor in helping to achieve our executive compensation program objectives. As part of our annual pay-setting process, the Compensation Committee uses benchmarking data to evaluate each executive officer’s target compensation levels compared to similarly situated executives at peer group companies.The Compensation Committee does not target the level of total direct compensation (or any specific element of compensation) for our executive officers to a specific percentile of our peer group. Instead, the Compensation Committee exercises its discretion in setting target compensation levels annually based on a variety of factors to achieve our compensation objectives:§each executive’s competitive pay positioning relative to similarly situated executives among our peer companies,§each executive’s scope of responsibilities, individual performance and expected contributions going forward,§tenure,§relative internal pay levels,§recommendations by the CEO for the other executive officers, and§prior year target and actual compensation levels.Our peer group companies are selected by the Compensation Committee based on their similarity to us in size, financial profile and scope of operations, as well as potential to compete for executive talent. The Compensation Committee’s general practice is to select companies that position HMS at approximately the peer group median across these metrics. The Compensation Committee reviews the peer group annually with guidance from FW Cook and may make modifications from time to time to ensure that it continues to provide an appropriate benchmark for competitive pay analyses.In January 2016, the Compensation Committee, with guidance from FW Cook, reviewed and modified the peer group used to benchmark executive compensation for 2016. The peer group established by the Compensation Committee for 2016 consists of the 14 companies listed below, grouped by sub-industry (the “2016 Peer Group”).2016 Peer Group CompaniesHeath Care TechnologyApplication SoftwareData Processing and Outsourced ServicesAllscripts Healthcare Solutions, Inc.athenahealth, Inc.Computer Programs & Systems, Inc.HealthStream, Inc.Medidata Solutions, Inc.Omnicell, Inc.Quality Systems, Inc.Blackbaud, Inc.Bottomline Technologies (de), Inc.RealPage, Inc.Tyler Technologies, Inc.ExlService Holdings, Inc.MAXIMUS, Inc.WEX Inc.58The Compensation Committee made the changes listed below to the peer group at the time of its review.Peers AddedPeers RemovedCompanyRationaleCompanyRationaleBlackbaud, Inc.§ Comparably-sized§ Application software industry§ Peer of peersDealertrack Technologies§ Acquired by Cox AutomotiveComputer Programs & Systems, Inc.§ Health care technology industry§ Peer of peersMedAssets§ Acquired by Pamplona Capital ManagementHealthstream, Inc.§ Health care technology industry§ Peer of peerAcxiom§ Not comparably-sized§ Not in a sub-industry referenced aboveRealPage, Inc.§ Comparably-sized§ Application software industry§ Peer of peersFair Isaac§ Not comparably-sizedNeuStar§ Not comparably sizedThe chart below compares our revenue, net income, EBITDA (income before interest, income taxes, depreciation and amortization) and market capitalization to the median of those four measures for our 2016 Peer Group at the time the 2016 Peer Group was established in January 2016, and at the time it was subsequently reviewed in October 2016. In January 2016, our revenue, net income and market capitalization were below the 2016 Peer Group median, and our EBITDA was above the median. Increases in our stock price between January 2016 and October 2016 repositioned HMS’s market capitalization considerably closer to the peer median and net income increased above the peer median. January 2016 Review October 2016 Review (in millions) Revenue(1) 458 529 32 490 633 30 Net Income(1)(2) 13 23 34 29 12 69 EBITDA(1) 85 68 60 94 78 57 Market Capitalization(3) 1,061 2,244 20 1,872 2,260 42 (1)Based on most recently reported four quarters as of January 25, 2016 and October 31, 2016 for the January 2016 review and the October 2016 review, respectively.(2)Before extraordinary items and discontinued operations.(3)As of December 31, 2015 and September 30, 2016 for the January 2016 review and the October 2016 review, respectively.During the first quarter of 2016, the Compensation Committee evaluated competitive market data from our 2016 Peer Group with guidance from FW Cook. The analysis included benchmarking data on several factors:§target total direct compensation (comprised of base salary, target bonus and recommended long-term incentive awards) for our executive officers relative to the compensation of similarly situated executives in the 2016 Peer Group based on the most recent proxy data,59§equity usage (shares granted in equity plans as a percentage of weighted average shares outstanding), and§equity allocation, in both absolute dollar value and percentage of annual equity granted, among (i) the CEO, (ii) the next four most highly paid executives, (iii) the remaining executives and (iv) all other employees.2016 Executive Compensation ElementsThe elements of our executive compensation program for 2016 are summarized in the table below.ElementTypeObjectiveAnnual Base SalaryFixed cash compensation for performing day-to-day responsibilitiesRecognizes skills, experience, knowledge and responsibilitiesAnnual Short-Term Incentive CompensationPerformance-based cash compensation awards based on the achievement of short-term financial goals and strategic objectives measured over a specific yearPromotes and rewards short-term corporate performance based on achievement of both financial and non-financial objectivesAnnual Long-Term Incentive CompensationRestricted stock units, 50% performance-basedNonqualified stock options, 50% performance-basedBuilds executive stock ownership, retains executives and aligns compensation with the achievement of our long-term financial goals of creating shareholder value and our strategic objectives as measured over multi-year periodsLimited Executive PerquisitesExecutive disability income insuranceExecutive financial consulting servicesMaintains competitiveness in the market among our peer companies for both retention and recruitment purposesOther Elements of CompensationBroad-based benefits available to all employeesSeverance and change-in-control benefitsAttractive benefits package attracts and retains talentSupports executive retention and encourages executive independence and objectivity in considering a potential change in control transactionCompensation MixThe Compensation Committee does not have a formal or informal policy or target for allocating target total compensation between short-term and long-term compensation, performance and non-performance-based compensation, cash and non-cash compensation, or among the different forms of non-cash compensation. In allocating compensation between the different forms of compensation, we, with guidance from FW Cook, determine what we believe in our business judgment is the appropriate level with respect to each element of total direct compensation to achieve the objectives of our executive compensation program. The allocation of the primary elements of compensation for 2016 at target levels for both our CEO and the average of our other named executive officers is shown below.60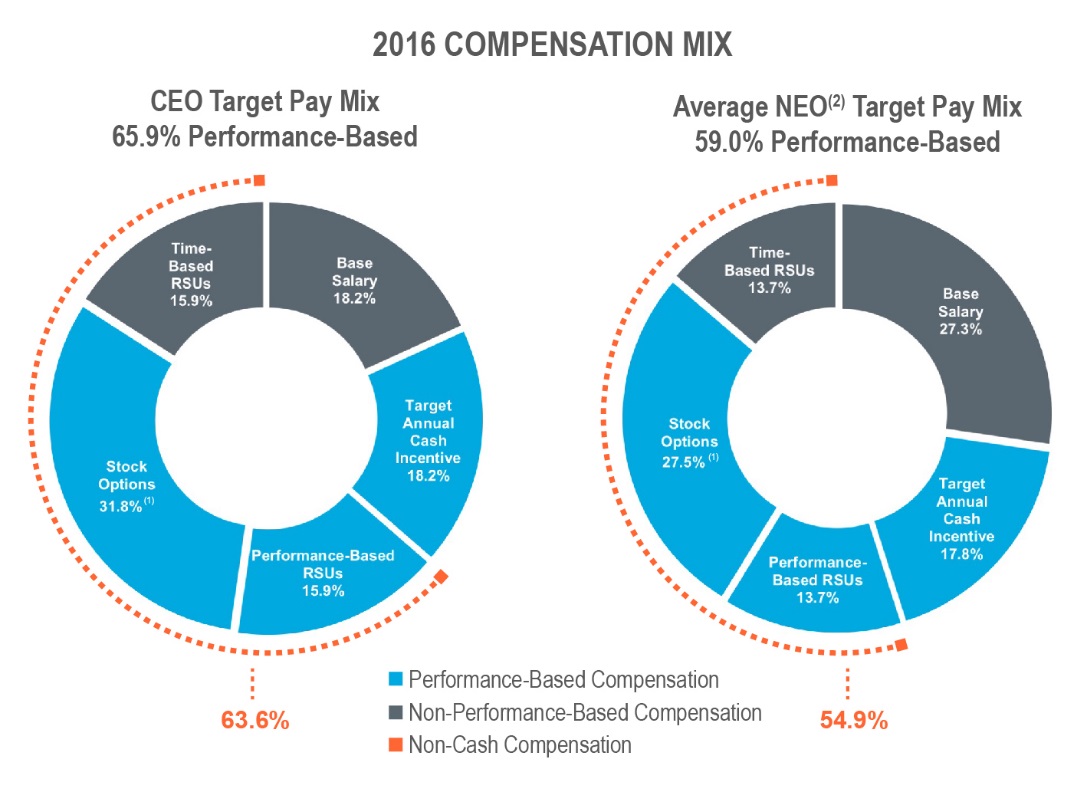
(1)For purposes of this illustration, we include all stock options as performance-based compensation. One half of the stock options are subject to additional, predetermined performance-based vesting criteria based on stock price performance. See “Grants of Plan Based Awards for the Year Ended December 31, 2016” for a description of the vesting and other terms of the option awards granted on March 2, 2016.(2)Includes named executive officers other than the CEO.Annual Base SalaryBase salary is used to recognize the experience, skills, knowledge and responsibilities of our employees, including our named executive officers, and to provide a competitive level of fixed compensation to balance performance-based risks. The key factors in determining base salary are individual and Company performance, job responsibilities, the competitive rate among our peers for positions of like responsibility and internal pay equity among our employees with similar responsibilities and tenure. As noted above, the Compensation Committee does not target the amount of base salary or other components of compensation for our executive officers to a specific percentile of our peer group, but rather considers the peer group analysis together with a variety of factors in determining compensation.The Compensation Committee reviews base salaries annually and, if appropriate, makes adjustments to reflect market levels generally every two years after taking into account individual responsibilities, performance and experience, the recommendations of the CEO and the benchmarking data provided by FW Cook. The Compensation Committee also reviews salaries on an interim basis as it determines appropriate based on significant changes in an executive’s scope of responsibilities.In February 2016, the Compensation Committee approved merit-based increases in base salary for each of our named executive officers, other than the CEO. The table below shows the annual base salaries for 2014 through 2016 for our named executive officers.61Named Executive Officer Lucia 650,000 0 650,000 0 650,000 Sherman 500,000 0 500,000 3.0 515,000 Neuman 475,000 0 475,000 5.3 500,000 Nustad 425,000 0 425,000 3.0 437,750 Williams 400,000 18.8 475,000 5.3 500,000 (1)Effective February 29, 2016Annual Short-Term Incentive CompensationThe Compensation Committee awards annual short-term cash incentive compensation to our named executive officers that reflects financial and strategic achievements based on both objective and subjective criteria, as well as individual performance. Our annual short-term incentive compensation is at-risk compensation. The Compensation Committee believes that this element of our executive compensation program promotes our performance-based compensation philosophy by providing named executive officers with direct financial incentives to achieve specific short-term performance goals intended to increase shareholder value and rewards both overall short-term corporate performance and individual contributions to attaining such performance. Our annual short-term cash incentive awards are paid in a lump sum during the first quarter following the completion of the fiscal year.Each of our named executive officers was eligible to participate in the 2016 STIP. The target incentive opportunity for each of the named executive officers under the 2016 STIP, as approved by the Compensation Committee, is shown in the table below expressed as a percentage of base salary. The target incentive opportunities were determined based upon a number of factors, including salary levels, job responsibilities and the appropriate targeted level of short-term incentive opportunity for each named executive officer.Named Executive OfficerTarget Incentive Opportunity(as a % of base salary)Lucia100%Sherman65%Neuman65%Nustad65%Williams65%2016 PERFORMANCE GOALSBonus payouts under the 2016 STIP were subject to the achievement of pre-determined performance goals based on the following financial and non-financial measures and relative weights:Financial MeasuresNon-Financial MeasuresRevenue (25%)Strategic Objectives (25%)Adjusted EBITDA (25%)Adjusted EPS (25%)We chose revenue, adjusted EBITDA and adjusted EPS as financial measures under the 2016 STIP because we believe each is a strong indicator of our overall financial performance, a key indicator used by industry analysts to evaluate our operating performance and motivates our executives to drive company growth and profitability. Adjusted EPS was introduced as an additional financial metric for 2016 to further diversify the performance measures and further align the performance metrics with the interest of shareholders. Consistent with 2015, the Committee determined that payout of 50% of the bonus pool should be based on performance against earnings targets (by lowering the relative weighting of the adjusted EBITDA measure compared to 2015 and adding adjusted EPS) in order to drive profitability and long-term shareholder value.62We define adjusted EBITDA, which is a non-GAAP measure, as earnings before interest, income taxes, depreciation and amortization, stock-based compensation and non-recurring legal expense.We define adjusted EPS, which is a non-GAAP measure, as earnings per share adjusted for stock-based compensation expense, non-recurring legal expense, amortization of acquisition related software and intangible assets and for the related taxes.In addition, we chose to include strategic objectives under the 2016 STIP that are designed to enhance profitability and create long-term shareholder value.Financial Objectives. Financial objectives are established based on the annual financial plan approved by the Board of Directors during the first quarter of the year and are intended to be challenging. For 2016, the revenue target was set higher than 2015 performance based on expectations of increased growth in our commercial health plan market, while the adjusted EBITDA and adjusted EPS targets were set at levels higher than 2015 performance after normalizing for anticipated changes in Medicare RAC and state revenues.A threshold level of performance against each of the financial targets is required in order for the respective portion of the bonus pool to be funded. If the threshold level is met, the actual payout amount is calculated based on the funding curves below, which provide for funding greater than the target level only if results exceed 105% of target.Adjusted EBITDA (25%) & Adjusted EPS (25%) Funding Curve Percent of Target Achieved % Funding of Bonus Pool <85% — 85% 50% 86% - 94% Payout is straight line from 50% to 100% 95 - 105% 100% 106% - 130% Payout is straight line from 100% to 200% Revenue (25%) Funding Curve Percent of Target Achieved % Funding of Bonus Pool <90% — 90% 50% 91% - 94% Payout is straight line from 50% to 100% 95 - 105% 100% 106% - 120% Payout is straight line from 100% to 200% The 2016 STIP authorized the Compensation Committee, in its discretion, to include or exclude the impact of acquisitions and/or dispositions of businesses during the performance period that would distort HMS’s 2016 financial results; however, the Compensation Committee did not make any such adjustments in 2016.Non-financial Objectives.The Compensation Committee established the following strategic objectives under the 2016 STIP: (i) achieve revenue growth by product and market; (ii) increase customer loyalty and retention; (iii) achieve certain growth objectives; (iv) achieve certain margin objectives; and (v) increase employee engagement. The level of achievement of the strategic objectives is determined in the Compensation Committee’s sole discretion based on its review of the measured results.63RESULTS UNDER THE 2016 SHORT-TERM INCENTIVE PLANFor fiscal 2016, we reported the following results under the financial performance measures that are used in determining payouts under our 2016 STIP.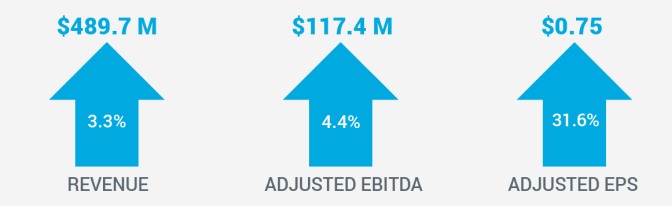
For purposes of calculating the funding percentage under the 2016 STIP, the reported adjusted EBITDA and adjusted EPS results were reduced to include the impact of certain non-recurring legal fees, which resulted in lower payouts under the 2016 STIP. In addition, based on its evaluation of performance against the 2016 strategic objectives measures shown above, the Compensation Committee determined that a 90% payout for the strategic objectives was appropriate based on slightly lower than expected results in revenue growth in certain markets and products. The table below sets forth the calculated funding level under the 2016 STIP.Performance Objectives Performance Objective Weighting Performance Target Results under 2016 STIP Achievement of Performance Objective 2016 STIP Funding Percentage(1) Revenue 25% $477.9M $489.7M 102.5% 100.0% Adjusted EBITDA 25% $109.5M $115.9M 105.8% 103.4% Adjusted EPS 25% $ 0.57 $ 0.74 129.8% 199.3% Strategic Objectives 25% 100% 90.0% 90.0% 90.0% Total 100% 123.2% (1)Based on the funding curves shown above with respect to revenue, adjusted EBITDA and adjusted EPS.2016 BONUS PAYOUTSBonus payouts for 2016 reflect the Company’s strong financial performance for fiscal 2016 and above-target achievement of key financial metrics under the 2016 STIP.Each of the named executive officers’ short-term incentive awards for 2016 were determined by applying the formula set forth below, which, as provided under the 2016 STIP, includes the Committee’s ability to use discretion to modify the calculated payout based on individual performance.Base SalaryxTarget Incentive Opportunityx2016 STIP funding percentage of 123.2% based on achievement of:·25% Adjusted EBITDA Target·25% Adjusted EPS Target·25% Revenue Target·25% Strategic Objectives=Cash Incentive Award(may be modified based on individual performance)64The Compensation Committee considered the CEO’s recommendations regarding individual bonus amounts for the named executive officers (other than himself) based on both corporate performance (as determined by the level of achievement under the 2016 STIP) and the officers’ individual performance and determined to modify the awards for Mses. Neuman and Nustad and Messrs. Sherman and Williams based on performance within their respective business units. Mr. Lucia’s bonus amount was determined solely based on corporate performance under the 2016 STIP, and all of the independent members of the Board as a group approved and ratified the Compensation Committee’s decision with respect to the CEO’s bonus amount. The table below compares target bonus amounts to actual bonus amounts paid to the named executive officers under the 2016 STIP. Named Executive Officer Actual Bonus ($) Lucia 650,000 123.2 800,800 Sherman 334,750 130.0 435,175 Neuman 325,000 120.0 390,000 Nustad 284,538 120.0 341,445 Williams 325,000 120.0 390,000 OTHER CONSIDERATIONSThe 2016 STIP operates as a sub-plan under our Annual Incentive Compensation Plan as amended and restated (the “AIP”), which was adopted by the Board and approved by our shareholders in order to qualify incentive awards as performance-based compensation that is intended to be deductible (to the extent possible) for federal income tax purposes under the Code. Each of the named executive officers was a participant in the AIP for 2016 and was eligible to receive a maximum bonus award of $2,000,000 for the 2016 performance period, subject to the Compensation Committee’s authority to use negative discretion, if the predetermined objective goal for the fiscal year was met. This limit is in addition to the limit on performance-based cash awards under the 2016 Omnibus Plan. EBITDA was selected as the performance metric under the AIP for fiscal 2016 because it is one of the primary metrics used to measure our operating performance and although it is a non-GAAP financial measure, its components are calculated based on U.S. GAAP. EBITDA is defined as income before interest, income taxes, depreciation and amortization. The Compensation Committee establishes an initial performance requirement under the AIP, pursuant to which an executive may earn the initial right to receive the maximum bonus under the AIP. The performance requirement for fiscal 2016 was established at $50 million in EBITDA. The 2016 STIP then establishes a second performance requirement, consisting of the performance goals and objectives described above. The potentially achievable incentive compensation under this second performance requirement is less than or equal to the maximum possible bonus specified in the AIP which was approved by the shareholders.Annual Long-Term Incentive CompensationWe believe that equity awards provide our named executive officers with a strong link to our long-term performance in order to create an ownership culture and help to align their interests with those of our shareholders. Annual long-term incentive awards are granted pursuant to our 2016 Omnibus Incentive Plan, which replaced and superseded the 2006 Stock Plan, upon approval by our shareholders on June 23, 2016. The 2016 Omnibus Plan, which is administered by the Compensation Committee, is intended to furnish a material incentive to employees by making available to them the benefits of a larger common stock ownership in HMS through stock options and other awards. The Board of Directors and the Compensation Committee believe that these increased incentives align compensation with the achievement of our long-term financial goal of creating shareholder value and our strategic objectives as measured over multi-year periods, as well as assist in the retention of employees.65TYPES OF LONG-TERM INCENTIVE AWARDSFor 2016, the Compensation Committee granted 50% of the total annual long-term incentive award value to our named executive officers in nonqualified stock options (50% of which are subject to stock price performance conditions) and 50% in restricted stock units (50% of which are subject to stock price performance conditions), pursuant to the 2006 Stock Plan. We believe that the mix of performance-based and non-performance-based stock options and restricted stock units is appropriate because it represents a balanced approach that reinforces our emphasis on pay-for-performance while retaining, incentivizing and compensating named executive officers for achievement of long-term goals intended to increase shareholder value.Time-Based Stock Options. We believe stock options strongly support our objective of ensuring that pay is aligned with changes in shareholder value. We set the exercise price of all stock options equal to or above the closing price of our common stock on the NASDAQ Global Select Market on the day of the grant. Accordingly, a stock option is intended to provide a return to the executive only if the market price of our common stock appreciates from the exercise price of the stock option and the executive remains employed during the vesting period. To foster retention and long-term performance, time-based stock options vest in one-third increments on the first, second and third anniversaries of the date of grant.Time-Based Restricted Stock Units. We believe restricted stock unit grants support the goal of retaining our named executive officers and further align the interests of our executives with shareholders by increasing their stock ownership. Because these restricted stock units vest in installments over time, these awards will provide a return to the executive only if the executive remains employed during the vesting period. The value of restricted stock unit awards increases or decreases as the market price of our common stock increases or decreases, further supporting our objective of ensuring that pay is aligned with changes in shareholder value. In addition, restricted stock units generally are perceived as more valuable than stock options during periods of stock price volatility. Time-based restricted stock units vest in one-third increments on the first, second and third anniversaries of the date of grant.Performance-Based Awards.To drive long-term performance and shareholder value, we establish performance conditions with respect to 50% of the stock option awards and 50% of the restricted stock unit awards granted to the named executive officers. Performance-based awards are earned only to the extent pre-established performance goals are met, and, if earned, are subject to the time-based vesting requirements described above. For awards granted in 2016, both the performance-based stock options and performance-based restricted stock units will be earned only if our average closing price per share for the trading days during any 30-day calendar period preceding the first, second and/or third anniversaries of the date of grant is at least 25% higher than the closing price per share on the date of grant. If the performance condition is met prior to the first anniversary of the grant date, one-third of the performance-based stock options and restricted stock units will vest in three equal installments on the first, second and third anniversaries of the grant date; if the performance condition is met after the first anniversary but prior to the second anniversary of the grant date, two-thirds of the performance-based stock options and restricted stock units will vest on the second anniversary of the grant date and one-third will vest on the third anniversary of the grant date; if the performance condition is met after the second anniversary but prior to the third anniversary of the grant date, 100% of the performance-based stock options and restricted stock units will vest on the third anniversary of the grant date. If the performance condition is not achieved before the third anniversary of the grant date, the performance-based stock options and restricted stock units will be forfeited. The named executive officer must remain employed by the Company as of each vesting date.The table below includes certain information regarding performance-based awards previously granted to our named executive officers that, during 2016, were either (i) earned at the target level, following the Compensation Committee’s certification of the achievement of the respective performance goals (and are subject to time-based vesting according to the previously-approved award terms) or (ii) forfeited, following the Compensation Committee’s determination that the performance goal had not been achieved during the 3-year award period.66Name Award Type Grant Date
(#)
(#)Exercise Price of Options
($/Sh)
($)Lucia Stock Options 11/15/2013 — 86,083 21.36 599,387 Stock Options 3/4/2015 96,488 — 16.77 568,749 Restricted Stock Units 3/4/2015 33,915 — — 568,755 Stock Options 3/2/2016 104,166 — 13.94 568,746 Restricted Stock Units 3/2/2016 40,800 — — 568,752 Sherman Stock Options 3/4/2015 59,377 — 16.77 349,998 Restricted Stock Units 3/4/2015 20,871 — — 350,007 Stock Options 5/13/2015 21,193 — 16.64 125,001 Restricted Stock Units 5/13/2015 7,512 — — 125,000 Stock Options 3/2/2016 51,282 — 13.94 280,000 Restricted Stock Units 3/2/2016 20,086 — — 279,999 Neuman Stock Options 11/15/2013 — 32,281 21.36 224,769 Stock Options 3/4/2015 50,895 — 16.77 300,001 Restricted Stock Units 3/4/2015 17,889 — — 299,999 Stock Options 5/13/2015 21,193 — 16.64 125,001 Restricted Stock Units 5/13/2015 7,512 — — 125,000 Stock Options 3/2/2016 45,787 — 13.94 249,997 Restricted Stock Units 3/2/2016 17,934 — — 250,000 Nustad Stock Options 11/15/2013 — 28,694 21.36 199,793 Stock Options 3/4/2015 42,412 — 16.77 249,998 Restricted Stock Units 3/4/2015 14,908 — — 250,007 Stock Options 3/2/2016 36,859 — 13.94 201,250 Restricted Stock Units 3/2/2016 14,437 — — 201,252 Williams Stock Options 3/4/2015 50,895 — 16.77 300,001 Restricted Stock Units 3/4/2015 17,889 — — 299,999 Stock Options 5/13/2015 21,193 — 16.64 125,001 Restricted Stock Units 5/13/2015 7,512 — — 125,000 Stock Options 3/2/2016 45,787 — 13.94 249,997 Restricted Stock Units 3/2/2016 17,934 — — 250,000 2016 ANNUAL LONG-TERM INCENTIVE COMPENSATIONThe 2016 annual long-term incentive awards for the named executive officers were determined based upon the Compensation Committee’s subjective evaluation of the factors set forth below and guidance from FW Cook:§competitive positioning among our peer group companies;§corporate performance;§relative shareholder return (for CEO’s evaluation);§recommendations of the CEO, based on individual performance, expected contributions going forward and appropriateness of the grant depending upon the level of responsibility (for executives other than the CEO);§perceived retention value of the award;§comparative share ownership and outstanding equity awards of HMS executives;§awards granted to each executive in prior years; and§potential wealth creation.No mathematical weighting was applied to any individual factor. All of the independent directors as a group approved and ratified the 2016 annual long-term incentive award for the CEO.67The following long-term incentive awards were granted to our named executive officers, effective March 2, 2016:Named Executive Officer Number of Restricted Stock Units Granted (1)(2)
(#)Lucia 1,137,500 208,333 1,137,500 81,600 Sherman 560,000 102,564 560,000 40,172 Neuman 500,000 91,575 500,000 35,868 Nustad 402,500 73,718 402,500 28,874 Williams 500,000 91,575 500,000 35,868 (1)See “Grants of Plan Based Awards For the Year Ended December 31, 2016” for a description of the vesting and other terms of the option and restricted stock unit awards.(2)The options have an exercise price of $13.94 per share.Limited Executive PerquisitesIn order to enhance our ability to recruit and retain highly qualified executive talent, we offer Guaranteed Standard Issue, or individual disability income insurance, to employees earning more than $300,000 in annualized base salary, and financial counseling services to the CEO and any officers who report directly to the CEO. In addition, beginning in 2017, we also offer preventative health program benefits to our CEO and executives who report directly to the CEO. The Compensation Committee believes these benefits are reasonable and comparable to benefits offered by companies of a similar size to ours and better enable us to maintain competitiveness by providing high-performing executives with benefits that will facilitate strong, focused performance, while optimizing physical health. The cost of these perquisites constitutes a small percentage of each executive’s total compensation. Each of the named executive officers is eligible to receive these benefits. Mr. Williams opted not to receive financial counseling services during 2016, as reflected in the Summary Compensation Table.Other Elements of CompensationBENEFITS AND OTHER COMPENSATIONWe maintain broad-based benefits that are provided to all employees, including health and dental insurance, life and disability insurance and a 401(k) plan. Our named executive officers are eligible to participate in all of our employee benefit plans, in each case on the same basis as other employees.SEVERANCE AND CHANGE-IN-CONTROL BENEFITSTo enable us to offer competitive total compensation packages to our senior executives, as well as to ensure the ongoing retention of these individuals when considering transactions that may create uncertainty as to their future employment with us, in 2011, the Compensation Committee approved standardizing the terms of employment of our senior executives, which included providing consistent separation and change-in-control protection.Based on information provided by FW Cook, the Compensation Committee believes that the protection afforded by the revised terms of employment described above provides a level of benefits that are estimated to be within a reasonable range based on competitive practices with respect to comparable positions. We believe that the benefits provided under these agreements are consistent with our objective of attracting and retaining highly qualified executives and provide reasonable assurance so that our senior executives are not distracted from their duties during the uncertainty that may accompany a possible change in control and as well as encourage executive independence and objectivity in considering any such transaction. The agreements and equity plans provide a "double trigger" for the payment of benefits upon a change of control, so that vesting occurs if a qualifying termination event occurs in connection with the change-in-control. The Compensation Committee believes that a “double trigger” is more appropriate than a “single trigger” because a double trigger prevents the unnecessary payment of benefits to an executive officer in the event that the change in control does not result in a qualifying termination event with respect to the executive's employment.68We have provided detailed information about Mr. Lucia’s employment agreement and our agreements with the other named executive officers and the benefits provided to Mr. Lucia and the other named executive officers under their respective agreements, along with estimates of the value of such benefits under various circumstances, under the heading “Potential Payments Upon Termination of Employment or Change in Control” below.Equity Award Grant PracticesAnnual equity awards to eligible employees, including the named executive officers, are considered by the Compensation Committee at its regularly scheduled meeting held in the first quarter of each year. At this meeting, the Compensation Committee meets with management and FW Cook to discuss and consider annual long-term incentive awards and to approve individual award amounts and terms for the executive officers and other employees subject to Section 16 of the Exchange Act. The grant date for the 2016 annual equity awards was established as the second business day after the date that HMS filed its annual report on Form 10-K with the SEC.The Compensation Committee also approves off-cycle initial equity grants to attract and retain key new hires. Generally, the grant value and equity mix is based on management’s negotiations with new hire candidates. If the Company is in a blackout period when an individual is hired, then the grant date is established as the third trading day following the Company’s public announcement of material non-public information. If the Company is not in a blackout period when an individual is hired, then the grant date is established on the date of the new hire’s commencement of employment. Equity grants to new hires are subject to service-based vesting over four years. The Compensation Committee has delegated authority to the CEO to grant new hire awards, subject to certain limitations, on terms pre-established by the Compensation Committee to employees who are not subject to Section 16 of the Exchange Act. Grants approved by the CEO pursuant to this delegation are reviewed at the Compensation Committee’s next regularly scheduled meeting.The grant date for other off-cycle equity grants that may be approved by the Compensation Committee from time to time is established as the second business day after the date that HMS files its next annual or quarterly report with the SEC.Stock Ownership Guidelines for Executive OfficersThe Board of Directors has established significant stock ownership guidelines for our executive officers to encourage them to own and hold a meaningful equity stake in HMS in order to further align their interests and actions with the interests of HMS and its shareholders. The guidelines for executive officers are based on a multiple of the executive’s base salary.TitleValue of Shares Required to be OwnedCEO5 X Annual Base SalaryOther Executive Officers2 X Annual Base SalaryFor purposes of satisfying these guidelines, an executive officer’s shares owned outright, directly or indirectly, and restricted stock and restricted stock units, whether or not vested, are counted in determining the executive’s stock ownership. Each executive is required to meet his or her respective ownership guideline within five years after election (or promotion to a covered position), or in the case of executives in office at the time the guidelines were adopted, within five years of the date of adoption. To mitigate the impact of stock price fluctuation, the number of shares required to be held by each executive to satisfy the guidelines remains fixed through December 1, 2019. The Compensation Committee monitors compliance with these guidelines on an annual basis.69The following graph summarizes the stock ownership of each of our named executive officers as of December 1, 2016, as a multiple of base salary in effect as of December 1, 2016, pursuant to our Stock Ownership Guidelines.
(1)Rounded down to the nearest multipleClawback PolicyThe Board of Directors has adopted a clawback policy that covers each of our current and former executive officers and applies to all forms of executive incentive compensation. Our clawback policy provides that the Board of Directors (or a Board committee) is authorized to recover from any current or former executive officer any bonus, incentive compensation or equity-based compensation gains resulting from certain misconduct occurring after January 1, 2015 that causes a restatement of our financial statements. The Board is required to review all circumstances and actions causing such restatement and to take action as it deems appropriate. We are monitoring this policy to ensure that it is consistent with applicable laws, and to the extent that the SEC adopts rules for clawback policies, we will revise our policy to reflect any necessary changes.Prohibition on Hedging and PledgingOur Insider Trading Policy prohibits our employees and directors from, among many other actions, purchasing our securities on margin, borrowing against our securities held in a margin account, pledging our securities as collateral for a loan and entering into hedging and derivative transactions with respect to our securities.Tax ConsiderationsSection 162(m) of the Code prohibits us from deducting from taxable income any compensation in excess of $1 million paid to our CEO and the three other most highly compensated named executive officers employed at the end of the year (other than our Chief Financial Officer), except to the extent that such compensation is paid pursuant to a shareholder approved plan upon the attainment of specified performance objectives. The Compensation Committee believes that tax deductibility is an important factor, but not the sole factor, to be considered in setting executive compensation policy. Accordingly, the Compensation Committee periodically reviews the potential consequences of Section 162(m) of the Code and generally intends to take such reasonable steps as are required to avoid the loss of a tax deduction due to Section 162(m) of the Code. However, the Compensation Committee may, in its judgment, authorize compensation payments or arrangements that do not comply with the exemptions in Section 162(m) of the Code when it believes that such payments are appropriate to attract and retain executive talent. In addition, because of the uncertainties associated with the application and interpretation of Section 162(m) of the Code and the regulations issued thereunder, there can be no assurance that compensation intended to satisfy the requirements for deductibility under Section 162(m) of the Code will in fact be deductible. We obtained shareholder approval of the AIP, as amended and restated, and the 2016 Omnibus Plan in 2016 in order to qualify awards under such plans, to the extent structured to comply with Section 162(m) of the Code, as performance-based compensation that is tax deductible under Section 162(m) of the Code.70Early 2017 Compensation ActionsThe following is a brief summary of certain changes to the compensation of the named executive officers for fiscal 2017, which is intended to provide additional information to shareholders in their review of our compensation program for fiscal 2016. A more detailed description of compensation for fiscal 2017 will be included in the proxy statement for the 2018 Annual Meeting of Shareholders.2017 Annual Base SalaryIn February 2017, the Compensation Committee increased Mr. Lucia’s annual base salary to $700,000, effective February 27, 2017, following its annual review of executive compensation. The Compensation Committee did not increase the annual base salary of any other named executive officer for 2017.2017 Short-Term Incentive Plan DesignIn February 2017, the Compensation Committee established the 2017 Short-Term Incentive Plan (“2017 STIP”) for eligible employees, including our named executive officers. The 2017 STIP is substantially similar to the 2016 STIP with respect to the performance criteria and funding curves, and provides additional items for which the Compensation Committee may make adjustments in determining the level of achievement of the financial objectives. To ensure a minimum amount of earnings is achieved before bonuses are paid and to further align the plan design with shareholder interests, the Committee determined that if either the adjusted EBITDA or adjusted EPS results for fiscal 2017 do not meet the minimum threshold for funding under the 2017 STIP, the Committee may use negative discretion to reduce the entire bonus plan funding from the calculated amount. For a discussion of the performance goals under the 2016 STIP, see “2016 Performance Goals” earlier in this CD&A. Payouts under the 2017 STIP generally are capped at 200% of target and will be determined in early 2018.2017 Long-Term Incentive AwardsIn April 2017, the Compensation Committee approved the grant of annual long-term incentive awards to the named executive officers in the form of non-qualified stock options and restricted stock units, on a substantially equal value basis, pursuant to the 2016 Omnibus Plan. Due to the delay in filing the Company’s annual report on Form 10-K for the year-ended December 31, 2016 with the SEC, the Committee determined to make the awards effective on the third business day following the filing of our quarterly report on Form 10-Q for the period ended March 31, 2017, with the SEC. One-half of the stock options and one-half of the restricted stock units are subject to stock price performance conditions.Named Executive Officer Lucia 1,500,000 1,500,000 Sherman 850,000 850,000 Neuman 600,000 600,000 Nustad 350,000 350,000 Williams 600,000 600,000 (1)The non-qualified stock options and restricted stock units vest as follows: 50% vest in three equal installments on the first, second and third anniversaries of the grant date, and the remaining 50% are earned upon the Company’s achievement of the following performance condition and vest as set forth below: the Company’s average closing price per share must be at least 25% higher than the closing price on the grant date for a period of 30 consecutive trading days preceding the first, second or third anniversaries of the grant date. If the performance condition is met prior to the first anniversary of the grant date, one-third of the performance-based stock options and restricted stock units will vest in three equal installments on the first, second and third anniversaries of the grant date; if the performance condition is met after the first anniversary but prior to the second anniversary of the grant date, two-thirds of the performance-based stock options and restricted stock units will vest on the second anniversary of the grant date and one-third will vest on the third anniversary of the grant date; if the performance condition is met after the second anniversary but prior to the third anniversary of the grant date, 100% of the performance-based stock options and restricted stock units will vest on the third anniversary of the grant date. If the performance condition is not achieved before the third anniversary of the grant date, the performance-based stock options and restricted stock units will be forfeited. The named executive officer must remain employed by the Company as of each vesting date.71NON-GAAP FINANCIAL MEASURESThe Company believes that the non-GAAP financial measures presented in this CD&A provide useful information to the Company's management, investors, and other interested parties about the Company's operating performance because they allow them to understand and compare the Company's operating results during the current periods to the prior year periods in a more consistent manner. The non-GAAP measures presented in this CD&A may not be comparable to similarly titled measures used by other companies. These non-GAAP financial measures are used in addition to and in conjunction with results presented in accordance with GAAP and reflect an additional way of viewing aspects of the Company's operations that, when viewed with GAAP results and the accompanying reconciliations to corresponding GAAP financial measures, provides a more complete understanding of the results of operations and trends affecting the Company's business. These non-GAAP financial measures should be considered as a supplement to, and not as a substitute for, or superior to financial measures calculated in accordance with GAAP.Reconciliation of Net Income to EBITDA and Adjusted EBITDA(in thousands) FY 2016 FY 2015 Net income $ 37,636 $ 24,527 Net interest expense 8,198 7,763 Income taxes 11,835 15,282 Depreciation and amortization, net of deferred financing costs, included in net interest expense 44,930 50,598 Earnings before interest, taxes, depreciation and amortization (EBITDA) $ 102,599 $ 98,170 Stock based compensation expense 13,277 14,297 Non-recurring legal fees (1) 1,563 - Adjusted EBITDA $ 117,439 $ 112,467 (1)In periods prior to 2016, legal fees related to disputes involving PCG were not included in adjusted earnings because they were not considered non-recurring at the time. For the twelve months ended December 31, 2015, related legal fees were $5.5 million.72Reconciliation of Net Income to GAAP EPS and Adjusted EPS(in thousands, except per share amounts) FY 2016 FY 2015 Net Income $ 37,636 $ 24,527 Stock-based compensation expense 13,277 14,297 Non-recurring legal fees (1) 1,563 - Amortization of acquisition related software and intangible assets 28,030 28,148 Income tax related to adjustments (15,536 ) (16,295 ) Sub-total $ 64,970 $ 50,677 Weighted average common shares, diluted 86,987 88,361 Diluted GAAP EPS 0.43 $ 0.28 Diluted adjusted EPS 0.75 $ 0.57 (1)Related legal fees were not considered non-recurring in 2015. For the twelve months ended December 31, 2015, related legal fees were approximately $5.5 million and income taxes on related legal fees were approximately $2.1 million or the equivalent of $0.04 per diluted Adjusted EPS.Compensation Committee ReportThe Compensation Committee of the Board of Directors of HMS Holdings Corp. has reviewed and discussed the Compensation Discussion and Analysis required by Item 402(b) of Regulation S-K with management. Based on this review and discussion, the Compensation Committee recommended to the Board of Directors that the Compensation Discussion and Analysis be included in this Annual Report on Form 10-K.By the Compensation Committee of the Board of Directors of HMS Holdings Corp.Richard H. Stowe, ChairCraig R. CallenCora M. TellezThe information contained in the Compensation Committee Report shall not be deemed to be “soliciting material” or to be “filed” with the Securities and Exchange Commission, nor shall such information be incorporated by reference into any future filing under the Securities Act of 1933, as amended, or the Securities Exchange Act of 1934, as amended, except to the extent that we specifically incorporate it by reference in such filing.73Summary Compensation TableThe following table sets forth the cash and non-cash compensation awarded to or earned by our named executive officers for the fiscal years ended December 31, 2016, 2015 and 2014.Name and Principal Position Year
Bonus (2)Stock Awards (3)
($)Option Awards (4)
($)
Plan Compen-
($)
($)
($)William C. Lucia 2016 650,000 — 1,137,504 1,137,498 800,800 33,421 3,759,223 Chairman, President 2015 650,000 — 1,137,493 1,137,498 606,385 31,491 3,562,867 and CEO 2014 650,000 — 1,412,490 737,497 468,000 10,400 3,278,387 Jeffrey S. Sherman 2016 512,115 — 559,998 559,999 435,175 28,391 2,095,678 EVP, Chief Financial 2015 500,000 — 949,997 1,933,332 303,193 28,194 3,714,716 Officer and Treasurer 2014 136,538(7) 355,000 337,493 1,087,493 — — 1,916,524 Semone Neuman 2016 495,192 — 500,000 500,000 390,000 28,773 1,913,965 EVP, Operations and 2015 475,000 — 849,998 1,833,332 288,033 29,893 3,476,256 Information Technology 2014 470,192 — 787,480 287,494 265,000 13,677 1,823,843 Cynthia Nustad 2016 435,298 — 402,504 402,500 341,445 27,826 1,609,573 EVP, Chief 2015 425,000 — 499,997 1,237,501 257,714 29,387 2,449,599 Strategy Officer 2014 421,731 — 649,996 249,994 200,000 10,400 1,532,121 Douglas M. Williams 2016 495,192 — 500,000 500,000 390,000 13,595 1,898,787 President, Markets 2015 469,231 — 849,998 1,833,332 288,033 12,646 3,453,240 and Product 2014 396,923 50,000 499,980 274,994 230,000 8,885 1,460,782 (1)The amounts in this column consist of base salary earned for the fiscal year.(2)The amounts in this column consist of (i) with respect to Mr. Sherman, a sign-on bonus of $200,000 paid in 2014 and a bonus payment of $155,000 ($150,000 of which was guaranteed) earned for 2014 and paid in 2015 and (ii) with respect to Mr. Williams, a sign-on bonus of $50,000 paid in 2014, pursuant to the terms of their respective employment agreements.(3)The amounts in this column represent the aggregate grant date fair value of the restricted stock unit awards computed in accordance with FASB guidance on stock-based compensation. The grant date fair value of restricted stock units is determined based on the number of units awarded and the fair value of our common stock on the grant date, which is the closing sales price per share of our common stock reported on the NASDAQ Global Select Market on that date.(4)The amounts in this column represent the aggregate grant date fair value of the stock option awards computed in accordance with FASB guidance on stock-based compensation. The relevant assumptions made in the valuations for the 2016, 2015 and 2014 stock option awards may be found in (i) Note 1 of the Notes to the Consolidated Financial Statements in this Annual Report on Form 10-K for the fiscal year ended December 31, 2016, (ii) Note 10 of the Notes to the Consolidated Financial Statements in our Annual Report on Form 10-K for the fiscal year ended December 31, 2015 and (iii) Note 11 of the Notes to the Consolidated Financial Statements in our Annual Report on Form 10-K for the fiscal year ended December 31, 2014, respectively. The grant date fair value of stock options is determined based on the number of options awarded and the fair value of the stock option on the grant date based upon the Black Scholes pricing model.(5)The amounts in this column consist of amounts earned pursuant to the short-term (cash) incentive plan for the fiscal year reported, which are paid in the following fiscal year.(6)The table below shows the components of “All Other Compensation” for the named executive officers for 2016.(7)The amount reported consists of base salary earned by Mr. Sherman, prorated from his date of employment on September 8, 2014.74fiscal 2016 All other compensation tableName 401(k) Savings Plan Employer Matching Contributions(1)
($)Executive Disability Insurance(2)
($)Financial Counseling(3)
($)Other(4)
($)Tax Gross-ups(5)
($)Total All Other
Compensation
($)Lucia 10,600 3,003 15,000 3,356 1,462 33,421 Sherman 10,600 2,791 15,000 — — 28,391 Neuman 10,600 2,849 15,000 316 8 28,773 Nustad 10,600 2,226 15,000 — — 27,826 Williams 10,600 2,995 — — — 13,595 (1)These amounts represent Company matching contributions to our named executive officers in the Company’s 401(k) savings plan.(2)These amounts represent the premiums paid by the Company on behalf of our named executive officers for executive disability insurance.(3)These amounts represent the amounts paid on behalf of our named executive officers for financial counseling services.(4)These amounts represent the cost of Company gifts given to the named executive officer in celebration of certain events.(5)These amounts represent the amounts paid to the named executive officer for taxes incurred on Company gifts.Grants of Plan-Based Awards For the Year Ended December 31, 2016The following table provides information concerning each grant of an award made to our named executive officers in fiscal 2016 under our AIP, 2016 STIP and 2006 Stock Plan. All Other Stock Awards: Number of Shares of Stock or Units(3)
(#)All Other Option Awards: Number of Securities Underlying Options(4)
(#)Exercise or Base Price of Options(5)
($/Sh)Grant Date Fair Value of Stock and Option Awards(6)
($) Award Type Grant Date Target
($)Maximum
($)Target
(#)Name Lucia AIP/2016 STIP — — 650,000 2,000,000 — — — — — Stock Options (7) 3/2/2016 2/18/2016 — — 104,166 — 104,167 13.94 1,137,498 RSUs (7) 3/2/2016 2/18/2016 — — 40,800 40,800 — — 1,137,504 Sherman AIP/2016 STIP — — 334,750 2,000,000 — — — — — Stock Options (7) 3/2/2016 2/18/2016 — — 51,282 — 51,282 13.94 559,999 RSUs (7) 3/2/2016 2/18/2016 — — 20,086 20,086 — — 559,998 Neuman AIP/2016 STIP — — 325,000 2,000,000 — — — — — Stock Options (7) 3/2/2016 2/18/2016 — — 45,787 — 45,788 13.94 500,000 RSUs (7) 3/2/2016 2/18/2016 — — 17,934 17,934 — — 500,000 Nustad AIP/2016 STIP — — 284,538 2,000,000 — — — — — Stock Options (7) 3/2/2016 2/18/2016 — — 36,859 — 36,859 13.94 402,500 RSUs (7) 3/2/2016 2/18/2016 — — 14,437 14,437 — — 402,504 Williams AIP/2016 STIP — — 325,000 2,000,000 — — — — — Stock Options (7) 3/2/2016 2/18/2016 — — 45,787 — 45,788 13.94 500,000 RSUs (7) 3/2/2016 2/18/2016 — — 17,934 17,934 — — 500,000 75(1)Amounts represent the target and maximum short-term (cash) incentive compensation payouts that could be earned by the named executive officers for 2016. The target amount shown is 100% of the individual’s target annual award opportunity and assumes that the named executive officer achieves all related pre-determined financial and non-financial objectives. The maximum amount shown is the shareholder-approved maximum payout under the AIP. There are no threshold amounts under the 2016 STIP or the AIP. The actual short-term (cash) incentive compensation paid for 2016 is shown in the Summary Compensation Table in the “Non-Equity Incentive Plan Compensation” column. The AIP and our 2016 STIP are described in the Compensation Discussion and Analysis, under the heading “Annual Short-Term Incentive Compensation.” For 2016, Mr. Lucia’s target award opportunity was 100% of his base salary. The target award opportunity for Messrs. Sherman and Williams and Mses. Neuman and Nustad was 65% of his/her base salary.(2)Amounts represent the portion of the award made to each named executive officer in 2016 that is dependent on certain pre-defined performance conditions and continued service for both non-qualified stock options and restricted stock units. These grants are discussed in the Compensation Discussion and Analysis under the heading “Annual Long-Term Incentive Compensation.”(3)Amounts represent the portion of the restricted stock unit award made to each named executive officer in 2016 that is conditioned on continued service. These restricted stock unit awards are discussed in the Compensation Discussion and Analysis under the heading “Annual Long-Term Incentive Compensation.”(4)Amounts represent the portion of the non-qualified stock option award made to the named executive officers in 2016 that is conditioned on continued service. These stock option awards are discussed in the Compensation Discussion and Analysis under the heading “Annual Long-Term Incentive Compensation.”(5)Represents the closing price of our common stock on the date of the grant.(6)Amounts in this column represent the grant date fair value of each stock option grant and each restricted stock unit grant computed in accordance with FASB guidance on stock-based compensation, and exclude the impact of estimated forfeitures related to service-based vesting conditions. The relevant assumptions made in the valuations may be found in Note 1 of the Notes to the Consolidated Financial Statements in this Annual Report on Form 10-K for the fiscal year ended December 31, 2016.(7)The non-qualified stock options and restricted stock units vest as follows: 50% vests in three equal installments on the first, second and third anniversaries of the grant date, and the remaining 50% vests upon the Company’s achievement of the following performance condition: the Company’s average closing price per share must be at least 25% higher than the closing price on the grant date for a period of 30 consecutive trading days preceding the first, second or third anniversaries of the grant date. If the performance condition is met prior to the first anniversary of the grant date, one-third of the performance-based stock options and restricted stock units will vest in three equal installments on the first, second and third anniversaries of the grant date; if the performance condition is met after the first anniversary but prior to the second anniversary of the grant date, two-thirds of the performance-based stock options and restricted stock units will vest on the second anniversary of the grant date and one-third will vest on the third anniversary of the grant date; if the performance condition is met after the second anniversary but prior to the third anniversary of the grant date, 100% of the performance-based stock options and restricted stock units will vest on the third anniversary of the grant date. If the performance condition is not achieved before the third anniversary of the grant date, the performance-based stock options and restricted stock units will be forfeited. The named executive officer must remain employed by the Company as of each vesting date. The non-qualified stock options are exercisable over a term of ten years.76Outstanding Equity Awards at December 31, 2016 Option Awards Stock Awards Name Number of Securities Underlying Unexercised Options
(#) ExercisableNumber of Securities Underlying Unexercised Options
(#) UnexercisableEquity Incentive Plan Awards: Number of Securities Underlying Unexercised Unearned Options
(#)Option Exercise Price
($)Option Expiration
Date Number of Shares or Units of Stock That Have Not Vested (#) Market Value of Shares or Units of Stock that Have Not Vested (1)
($)Equity Incentive Plan Awards: Number of Unearned Shares, Units or other Rights That Have Not Vested (#) Equity Incentive Plan Awards: Market or Payout Value of Unearned Shares, Units or Other Rights That Have Not Vested
($) Lucia 30,000 — — 19.77 9/30/2017 — — — — 71,628 — — 22.95 9/30/2018 — — — — 64,100 — — 27.79 10/4/2019 — — — — 86,083 — — 21.36 11/14/2020 — — — — 32,410 16,205 (2) 48,616 (3) 21.63 11/11/2021 — — — — 32,163 160,813 (4) — 16.77 3/3/2022 — — — — — 208,333 (12) — 13.94 3/3/2023 — — — — — — — — — 11,743 (5) 213,253 — — — — — — — 16,700 (6) 303,272 — — — — — — — 5,683 (2) 103,203 17,048 (3) 309,592 — — — — — 56,525 (4) 1,026,494 — — — — — — — 81,600 (12) 1,481,856 — — Sherman 51,796 51,795 (7) — 20.71 9/8/2021 — — — — 14,831 7,416 (2) 22,248 (3) 21.63 11/11/2021 — — — — 19,792 98,962 (4) — 16.77 3/3/2022 — — — — 7,064 35,321 (9) — 16.64 5/13/2022 — — — — 33,334 66,666 (10) — 11.20 11/10/2022 — — — — 33,334 66,666 (10) — 14.00 11/10/2022 — — — — — 102,564 (12) — 13.94 3/3/2023 — — — — — — — — — 2,601 (2) 47,234 7,802 (3) 141,684 — — — — — 34,785 (4) 631,696 — — — — — — — 12,520 (9) 227,363 — — — — — — — 40,172 (12) 729,524 — — Neuman 32,281 — — 21.36 11/14/2020 — — — — 12,634 6,317 (2) 18,952 (3) 21.63 11/11/2021 — — — — 16,965 84,824 (4) — 16.77 3/3/2022 — — — — 7,064 35,321 (9) — 16.64 5/13/2022 — — — — 33,334 66,666 (10) — 11.20 11/10/2022 — — — — 33,334 66,666 (10) — 14.00 11/10/2022 — — — — — 91,575 (12) — 13.94 3/3/2023 — — — — — — — — — 4,551 (8) 82,646 — — — — — — — 12,370 (6) 224,639 — — — — — — — 2,215 (2) 40,224 6,646 (3) 120,691 — — — — — 29,815 (4) 541,440 — — — — — — — 12,520 (9) 227,363 — — — — — — — 35,868 (12) 651,363 — — Nustad 11,247 — — 22.47 2/8/2018 — — — — 22,384 — — 22.95 9/30/2018 — — — — 10,015 — — 27.79 10/4/2019 — — — — 10,016 — — 27.79 10/4/2019 — — — — 28,694 — — 21.36 11/14/2020 — — — — 10,986 5,493 (2) 16,480 (3) 21.63 11/11/2021 — — — — 14,137 70,687 (4) — 16.77 3/3/2022 — — — — 25,000 50,000 (10) — 11.20 11/10/2022 — — — — 25,000 50,000 (10) — 14.00 11/10/2022 — — — — — 73,718 (5) — 13.94 3/3/2023 — — — — 77 — — — — — 8,699 (5) 157,974 — — — — — — — 9,896 (6) 179,711 — — — — — — — 1,927 (2) 34,994 5,779 (3) 104,947 — — — — — 24,846 (4) 451,203 — — — — — — — 28,874 (12) 524,352 — — Williams 38,285 12,762 (11) — 22.54 12/8/2020 — — — — 12,084 6,043 (2) 18,128 (3) 21.63 11/11/2021 — — — — 16,965 84,824 (4) — 16.77 3/3/2022 — — — — 7,064 35,321 (9) — 16.64 5/13/2022 — — — — 33,334 66,666 (10) — 11.20 11/10/2022 — — — — 33,334 66,666 (10) — 14.00 11/10/2022 — — — — — 91,575 (12) — 13.94 3/3/2023 — — — — — — — — — 5,567 (6) 101,097 — — — — — — — 2,119 (2) 38,481 6,357 (3) 115,443 — — — — — 29,815 (4) 541,440 — — — — — — — 12,520 (9) 227,363 — — — — — — — 35,868 (12) 651,363 — — (1)The market value of shares or units of stock that have not vested is calculated by multiplying the closing market price per share of our common stock on December 30, 2016, the last trading day in 2016, of $18.16 per share by the number of shares or units of stock that have not vested.(2)Represents stock options and restricted stock units granted on November 12, 2014. The remaining stock options and restricted stock units are scheduled to vest on November 12, 2017.(3)Represents performance-based stock options and restricted stock units granted on November 12, 2014 that have not been earned. The stock options and restricted stock units are scheduled to vest on November 12, 2017, subject to satisfaction of the following performance condition: an increase in the average closing price per share of our common stock during the applicable trading days in any consecutive 30 calendar day period preceding the third anniversary of the grant date of at least 25% over the option exercise price.(4)Represents stock options and restricted stock units granted on March 4, 2015. One-half of the stock options and restricted stock units granted are subject to time-based vesting in one-third increments. Of the remaining two-thirds that were unexercisable or that had not vested as of December 30, 2016, one-third vested on March 4, 2017, and one-third is scheduled to vest on March 4, 2018. One-half of the stock options and restricted stock units granted were subject to performance-based conditions that have been satisfied and subject to time-based vesting conditions. Two-thirds of these performance-based stock options and restricted stock units vested on March 4, 2017, and one-third is scheduled to vest on March 4, 2018.(5)Represents restricted stock units granted on February 27, 2013 that were subject to performance-based conditions that have been satisfied and subject to time-based vesting conditions. Of the remaining restricted stock units that had not vested as of December 30, 2016, one-half vested on February 27, 2017, and one-half is scheduled to vest on February 27, 2018.(6)Represents restricted stock units granted on March 5, 2014 that were subject to performance-based conditions that have been satisfied and subject to time-based vesting conditions. Of the remaining restricted stock units that had not vested as of December 30, 2016, one-half vested on March 5, 2017, and one-half is scheduled to vest on March 5, 2018.(7)Represents stock options granted on September 8, 2014. One-half of the remaining stock options are scheduled to vest on September 8, 2017, and one-half are scheduled to vest on September 8, 2018.(8)Represents restricted stock units granted on April 1, 2013. All of the remaining restricted stock units vested on April 1, 2017.(9)Represents stock options and restricted stock units granted on May 13, 2015. One-half of the stock options and restricted stock units granted are subject to time-based vesting in one-third increments. Of the remaining two-thirds that were unexercisable or that had not vested as of December 30, 2016, one-third is scheduled to vest on May 13, 2017, and one-third is scheduled to vest on May 13, 2018. One-half of the stock options and restricted stock units granted were subject to performance-based conditions that have been satisfied and subject to time-based vesting conditions. Two-thirds of these performance-based stock options and restricted stock units are scheduled to vest on May 13, 2017, and one-third are scheduled to vest on May 13, 2018.(10)Represents stock options granted on November 11, 2015. Of the remaining two-thirds that were unexercisable as of December 30, 2016, one-third is scheduled to vest on November 11, 2017, and one-third is scheduled to vest on November 11, 2018.(11)Represents stock options granted on December 9, 2013. All of the remaining stock options are scheduled to vest on December 9, 2017.78(12)Represents stock options and restricted stock units granted on March 2, 2016. One-half of the stock options and restricted stock units granted are subject to time-based vesting in one-third increments. One-third of the time-based stock options and restricted stock units vested on March 2, 2017, and one-third is scheduled to vest on each of March 2, 2018 and March 2, 2019. One-half of the stock options and restricted stock units granted were subject to performance-based conditions that have been satisfied and subject to time-based vesting conditions. One-third of these performance-based stock options and restricted stock units vested on March 2, 2017, and one-third is scheduled to vest on each of March 2, 2018 and March 2, 2019.Option Exercises and Stock Vested in 2016The following table sets forth certain information concerning the stock options exercised and stock awards that vested for our named executive officers during the year ended December 31, 2016. Option Awards Stock Awards Name Lucia 339,328 4,504,336 44,906 604,649 Sherman — — 12,060 179,971 Neuman — — 21,417 310,316 Nustad — — 16,192 227,287 Williams — — 13,369 197,093 (1)The value realized on the exercise of stock options is based on the difference between the exercise price and the market price (used for tax purposes) of our common stock on the date of exercise.(2)The value realized on vesting represents the number of shares acquired on vesting multiplied by the market value of shares of our common stock on the vesting date, which is the closing price of our common stock on:(i)February 18, 2016 of $11.61 for Mr. Lucia (13,697 shares);(ii)February 27, 2016 of $12.99 for Mr. Lucia (5,872 shares) and Ms. Nustad (4,349 shares);(iii)March 4, 2016 of $14.01 for Messrs. Lucia (11,304 shares), Sherman (6,956 shares) and Williams (5,963 shares) and Mses. Neuman (5,963 shares) and Nustad (4,969 shares);(iv)March 5, 2016 of $14.01 for Messrs. Lucia (8,350 shares) and Williams (2,783 shares) and Mses. Neuman (6,185 shares) and Nustad (4,948 shares);(v)April 1, 2016 of $14.06 for Ms. Neuman (4,550 shares);(vi)May 13, 2016 of $15.78 for Messrs. Sherman (2,504 shares) and Williams (2,504 shares) and Ms. Neuman (2,504 shares); and(vii)November 12, 2016 of $16.54 for Messrs. Lucia (5,683 shares), Sherman (2,600 shares) and Williams (2,119 shares) and Mses. Neuman (2,215 shares) and Nustad (1,926 shares).Potential Payments Upon Termination of Employment or Change in ControlThe information and table in this section summarize the estimated compensation payable to each of our named executive officers in the event of termination of employment or a change in control. This compensation is payable pursuant to (i) the terms of the employment agreement with each of our named executive officers, and (ii) the terms of our equity incentive plans and related award agreements. Regardless of the manner in which the named executive officer’s employment terminates, each executive is generally entitled to receive earned, unpaid salary and accrued but unused paid time off through the date of termination under his or her employment agreement. Each named executive officer is also entitled to receive any earned, unpaid bonus for the calendar year preceding the calendar year in which his or her employment ends unless such termination is for Cause. The definitions of “Cause,” Change in Control,” “Disability,“Good Reason” appear at the end of the next section under the heading “Key Terms.”79In addition to the compensation discussed above, the following table reflects the compensation and benefits that would have been paid to the named executive officers had their employment terminated on December 31, 2016 under the termination scenarios shown below, and assumes a closing price of our common stock as of December 30, 2016, the last trading day in 2016 ($18.16). The table also assumes that each named executive officer executes a separation agreement and general release, as required under the terms of their employment agreements, and complies with certain restrictive covenants and confidentiality provisions contained in their employment agreements and Restrictive Covenants Agreements (as defined and described under the heading “Restrictive Covenants Agreements”). The table does not include any amounts due for unused paid time off for 2016 or the value of immediately exercisable stock options at the date of termination (where vesting was not accelerated as a result of the termination). Due to a number of factors that may affect the availability, nature and amount of compensation upon termination, any actual amounts paid or distributed to named executive officers may be different from the amounts provided in this section. In addition, in connection with any actual termination or change in control situation, we may determine to enter into agreements or establish arrangements that alter the terms below.Named Executive Officer and Type of Payment Termination without Cause following a Change in Control(3)
($)Resignation for Good Reason following a Change in Control(3)
($)Lucia Cash severance 1,300,000 1,300,000 1,300,000 1,300,000 1,300,000 — Bonus compensation(6) 1,300,000 1,300,000 1,300,000 1,300,000 1,300,000 — Continued health insurance coverage 22,833 22,833 22,833 22,833 22,833 — RSUs(7)(9) 3,437,670 3,437,670 3,437,670 3,437,670 3,437,670 3,437,670 Stock Options(8)(9) 1,102,695 1,102,695 1,102,695 1,102,695 1,102,695 1,102,695 Total 7,163,198 7,163,198 7,163,198 7,163,198 7,163,198 4,540,365 Sherman Cash severance 515,000 515,000 515,000 — — — Continued health insurance coverage 16,407 16,407 16,407 — — — RSUs(7) — — 1,777,501 1,777,501 1,777,501 1,777,501 Stock Options(8) — — 1,365,391 1,365,391 1,365,391 1,365,391 Total 531,407 531,407 3,674,299 3,142,892 3,142,892 3,142,892 Neuman Cash severance 500,000 — 500,000 500,000 — — Continued health insurance coverage 10,669 — 10,669 10,669 — — RSUs(7) — — 1,888,368 1,888,368 1,888,368 1,888,368 Stock Options(8) — — 1,299,366 1,299,366 1,299,366 1,299,366 Total 510,669 — 3,698,402 3,698,402 3,187,733 3,187,733 Nustad Cash severance 437,750 — 437,750 437,750 — — Continued health insurance coverage 16,407 — 16,407 16,407 — — RSUs(7) — — 1,453,181 1,453,181 1,453,181 1,453,181 Stock Options(8) — — 965,345 965,345 965,345 965,345 Total 454,157 — 2,872,683 2,872,683 2,418,526 2,418,526 Williams Cash severance 500,000 — 500,000 500,000 — — Continued health insurance coverage 16,407 — 16,407 16,407 — — RSUs(7) — — 1,675,187 1,675,187 1,675,187 1,675,187 Stock Options(8) — — 1,299,366 1,299,366 1,299,366 1,299,366 Total 516,407 — 3,490,960 3,490,960 2,974,553 2,974,553 (1)Assuming involuntary termination without Cause, Messrs. Sherman and Williams and Mses. Neuman and Nustad would be entitled to cash severance in an amount equal to 12 times their monthly base salary paid ratably in equal installments over a 12 month period, and a lump sum amount equal to 12 times the difference between the monthly COBRA coverage premium for the same type of medical and dental coverage they are receiving as of the date their employment ends and their monthly employee contribution. Mr. Lucia would be entitled to cash severance in an amount equal to 24 times his monthly base salary paid ratably in equal installments over a 24-month period, continued health coverage for 24 months or until he becomes eligible for health coverage from another employer, whichever is earlier, and twice his bonus component. The bonus component varies depending upon whether the bonus for the year of termination is intended to be “performance-based” compensation and performance is satisfied, in which case it will be paid when bonuses are paid to our other senior executive officers, or whether the bonus is under a different program, in which case it will be his target bonus. In addition, Mr. Lucia would be treated as continuing in service for purposes of the vesting of any equity award under the terms of his employment agreement.80(2)The amounts in this column represent the amounts payable to the named executive officer in the event he resigns for Good Reason, as defined in his employment Agreement, which will be paid on the same schedule as if he were terminated without Cause.(3)If within 24 months following a Change in Control, the named executive officer’s employment is terminated without cause or the named executive officer resigns for Good Reason, Messrs. Sherman and Williams and Mses. Neuman and Nustad would receive the amount of cash severance equal to 12 times their monthly base salary in a single lump sum, and Mr. Lucia would receive the amount of his cash severance equal to 24 times his monthly base salary and twice his bonus component in a single lump sum. In addition, if Mr. Lucia is terminated without Cause or resigns for Good Reason within six months prior to a Change in Control, Mr. Lucia would receive a lump sum cash payment equal to the excess of the amount he would have received for any equity awards outstanding or deemed to be outstanding, or canceled or forfeited, as a result of termination or Change in Control, over the amount he actually received. The named executive officers would also be entitled to continued health coverage, and accelerated vesting of stock awards and option awards pursuant to the terms of the applicable agreements. Since the employment agreements of named executive officers and the equity awards have double-trigger Change in Control provisions (except with respect to equity awards not assumed by the acquiring entity), the table assumes that both a Change in Control and a subsequent termination of employment has occurred.(4)In the event the employment of Messrs. Sherman or Williams, or Mses. Neuman or Nustad is terminated due to the executive’s Disability, all outstanding stock awards will immediately vest and all option awards will become vested and fully exercisable pursuant to the terms of the applicable award agreements. A termination of Mr. Lucia’s employment due to Disability would be treated as a termination without Cause pursuant to his employment agreement.(5)The amounts in this column represent the amounts payable to the named executive officer if his or her employment is terminated upon death or Retirement. If the named executive officer’s employment is terminated as a result of death, all outstanding stock awards will immediately vest and all option awards will become vested and fully exercisable upon termination pursuant to the terms of the applicable award agreements. If the named executive officer’s employment is terminated as a result of Retirement, the named executive officer will be treated as continuing in service for vesting purposes and the vested portion of options shall remain exercisable until the second anniversary of such executive’s Retirement, or until the last applicable vesting date or option expiration date under the applicable award agreement, whichever is sooner. Under the award agreements, “Retirement” means cessation of employment on or after attaining the age of 60 and having at least 5 years of continuous service with the Company. None of the named executive officers qualified for Retirement as of December 31, 2016.(6)Amounts represent the target annual short-term (cash) incentive compensation that Mr. Lucia would be entitled to receive under his employment agreement as of the date his employment ends, and not the amount that the Compensation Committee determined to pay Mr. Lucia as set forth in the Non-Equity Incentive Plan Compensation” column of the Summary Compensation Table.(7)Except for the amounts reported for Mr. Lucia in the columns entitled Termination Without Cause or Resignation for Good Reason, the amounts reported represent the estimated market value of unvested restricted stock units (including any performance-based restricted stock units) that would have vested as of December 31, 2016 under the termination scenarios in the table, calculated based on the aggregate number of accelerated restricted stock units multiplied by the closing market price per share of our common stock on December 30, 2016, the last trading day in 2016, of $18.16 per share.(8)Except for the amounts reported for Mr. Lucia in the columns entitled Termination Without Cause or Resignation for Good Reason, the amounts reported represent the estimated market value of outstanding stock options, which are not then exercisable (including any performance-based stock options), that would have become exercisable as of December 31, 2016 under the termination scenarios in the table, calculated based on the difference between the aggregate exercise price of all accelerated options and the aggregate market value of the underlying shares as of December 30, 2016, the last trading day in 2016, based on the closing market price per share of our common stock on December 30, 2016 of $18.16 per share.(9)The amounts reported for Mr. Lucia in the columns entitled Termination Without Cause or Resignation for Good Reason represent the estimated market value of his (i) unvested restricted stock units (including any performance-based restricted stock units) as of December 31, 2016, calculated based on the aggregate number of restricted stock units multiplied by the closing market price per share of our common stock on December 30, 2016, the last trading day in 2016, of $18.16 per share and (ii) and outstanding stock options, which are not then exercisable (including any performance-based stock options) as of December 31, 2016, calculated based on the difference between the aggregate exercise price of such options and the aggregate market value of the underlying shares as of December 30, 2016, the last trading day in 2016, based on the closing market price per share of our common stock on December 30, 2016 of $18.16 per share, which would continue to vest under these termination scenarios pursuant to the terms of his employment agreement. The amounts reported assume that these restricted stock units and stock options are earned, to the extent such awards are performance-based, and fully vest.81Executive Employment AgreementsEMPLOYMENT AGREEMENT WITH MR. LUCIAHMS and Mr. Lucia entered into the second amendment to his executive employment agreement, effective March 1, 2015, extending the term of his agreement to February 28, 2018. Under his employment agreement, Mr. Lucia is entitled to a minimum annual base salary of $650,000, subject to increase from time to time by the Board of Directors or the Compensation Committee, and a targeted annual short-term (cash) incentive award opportunity of 100% of his base salary. If we terminate Mr. Lucia’s employment without Cause, in connection with a Change in Control or otherwise, or if his employment ceases because of his disability or if he terminates his employment with Good Reason, then provided that Mr. Lucia executes and does not revoke a separation agreement and release, and complies with his Restrictive Covenants Agreement, (i) he will be entitled to receive cash severance in an amount equal to (A) 24 times his monthly base salary paid ratably in equal installments over a 24 month period (unless his termination/resignation is in connection with a Change in Control, in which case the payment will be in a single lump sum), and (B) twice his bonus component that will vary depending upon whether the bonus for the year of termination is intended to be “performance-based” compensation and performance is satisfied, in which case it will be paid when bonuses are paid to our other senior executive officers, or whether the bonus is under a different program, in which case it will be his target bonus and will be paid on the same schedule as (A) above (unless his termination/resignation is in connection with a Change in Control, in which case the payment will be in a single lump sum), (ii) he will be entitled to continued health coverage for 24 months or until he becomes eligible for health coverage from another employer, whichever is earlier, and (iii) he will be treated as continuing in service for purposes of the vesting of any equity award until the earliest of: (x) the end of the Noncompetition Period (as defined in Mr. Lucia’s Restrictive Covenants Agreement), (y) the last of the applicable vesting dates under such awards, or (z) the termination or violation of the Restrictive Covenants Agreement.In addition, if we terminate Mr. Lucia’s employment without Cause or Mr. Lucia resigns for Good Reason, and such termination occurs within a six-month period before a Change in Control, Mr. Lucia will receive a cash payment equal to the excess of the amount he would have received for such equity awards if he were continuing in service as of the date of the Change in Control and terminated immediately thereafter over the amount actually received, paid in a single lump sum payment at the time provided in the agreement. In the event that any payments and benefits, including any benefits provided to Mr. Lucia or for Mr. Lucia’s benefit under the agreement or any other company plan or agreement, become subject to the excise tax under Section 4999 of the Code, such payments and benefits will be “cut-back” to an amount that is less than such amount that would cause the excise tax to the extent that such reduction would result in Mr. Lucia retaining a larger amount on an after-tax basis.EMPLOYMENT AGREEMENTS WITH OTHER NAMED EXECUTIVE OFFICERSWe have employment agreements that are at-will, subject to certain notice and/or severance provisions, with Mr. Sherman, Ms. Neuman, Ms. Nustad and Mr. Williams. These employment agreements set forth the named executive officer’s initial annualized base salary as follows: (i) Mr. Sherman at $500,000, (ii) Ms. Neuman at $450,000, (iii) Ms. Nustad at $350,000 and (iv) Mr. Williams at $400,000, subject to increase from time to time by the Board of Directors or the Compensation Committee. In addition, under the terms of these agreements, the named executive officers are eligible to receive bonus compensation from us in respect of each fiscal year (or portion thereof) during the term of their employment, in each case as may be determined by our Compensation Committee in its sole discretion on the basis of such performance-based or other criteria as it determines appropriate. For 2016, the targeted annual short-term (cash) incentive award opportunity for each other named executive was 65% of his/her base salary.In the event any of these named executive officers is terminated without Cause, in connection with a Change in Control or otherwise, then provided that such named executive officer executes and does not revoke a separation agreement and release, and complies with the Restrictive Covenants Agreement, the executive will be entitled to receive (i) cash severance in an amount equal to 12 times the executive’s monthly base salary paid ratably in equal installments over a 12 month period, (ii) a lump sum amount equal to 12 times the difference between the monthly COBRA coverage premium for the same type of medical and dental coverage (single, family, or other) the executive is receiving as of the date employment ends and then monthly employee contribution, which amount may be used for any purpose, and (iii) any earned but unpaid annual bonus for the calendar year preceding the calendar year in which employment ends. If within 24 months following a Change in Control, Mr. Williams’ or Mses. Neuman’s or Nustad’s employment is terminated without Cause or resigns for Good Reason, provided that the executive executes a separation agreement and release, and complies with the Restrictive Covenants Agreement, he or she will receive the amounts set forth in (i) above in a single lump sum payment, rather than in installments as applies outside of a Change in Control.82Restrictive Covenants AgreementsWe also have entered into a Noncompetition, Nonsolicitation, Proprietary and Confidential Information and Developments Agreement (the “Restrictive Covenants Agreement”) with each of our named executive officers. Under the terms of the Restrictive Covenants Agreements, in Mr. Lucia’s case, for the 24 months following the termination of his employment for any reason, and in the case of the other named executive officers, for the 12 months following the termination of employment for any reason, the named executive officer is generally prohibited from (i) engaging or assisting others to engage in any business or enterprise in the United States that competes with HMS’s business, products or services, (ii) soliciting or diverting, or attempting to solicit or divert, the business of any of HMS’s current or prospective clients, (iii) soliciting, recruiting or inducing or attempting to solicit, recruit or induce any company employee or independent contractor to leave HMS’s employ (or, in some situations, hire any such company employee or independent contractor), and (iv) disclosing or utilizing for the benefit of any entity other than HMS, any system or product development ideas discussed or explored, even if not implemented, during the named executive officer’s employment with HMS. The Restrictive Covenants Agreements also set forth certain obligations with respect to proprietary and confidential information and developments and inventions.Equity Incentive PlansAll named executive officers participated in the Company’s equity plans in 2016.With respect to stock awards and option awards under the 2006 Stock Plan, the 2016 Omnibus Plan, and the related award agreements, such awards generally require that the named executive officer remain employed by the Company (or continue to serve on the Board of Directors if no longer employed by the Company) during the period designated by the Compensation Committee, subject to acceleration of vesting or continued vesting of equity awards in the termination scenarios described in the table under “Potential Payments Upon Termination of Employment or Change in Control.” If the named executive officer’s employment or Board membership ends before the designated period for any reason (other than upon death, Disability, Retirement, termination without Cause or resignation for Good Reason following a Change in Control, or as otherwise specified in the executive’s employment agreement), all unvested restricted stock units will be forfeited and all unexercisable portions of option awards will expire immediately. If we terminate the named executive officer’s employment or Board membership for Cause, all stock awards and option awards will immediately terminate without regard to whether such awards are vested or exercisable, respectively.In general, the treatment of equity upon a Change in Control depends on if the awards are assumed by the successor company. Upon a Change in Control, and unless provided otherwise in the terms of an award agreement or employment agreement, awards granted under the 2006 Stock Plan and the 2016 Omnibus Plan vest on an accelerated basis only if a qualifying termination occurs within 24 months after a Change in Control. In this case, restricted stock unit awards will immediately vest and become free of restrictions, and any outstanding option awards will become fully vested and immediately exercisable. Such options will remain exercisable for 12 months following the qualifying termination, but not beyond the option expiration date set forth in the applicable award agreement. To the extent an award under the 2016 Omnibus Plan is not assumed in a Change in Control, accelerated vesting generally occurs upon a Change in Control.Key DefinitionsThe capitalized terms used in the sections under the headings “Potential Payments Upon Termination of Employment or Change in Control” and “Executive Employment Agreements” are defined as below. These definitions are subject to further limitations if necessary to conform to Section 409A of the Code.CAUSE”§Under the employment agreements for each of the named executive officers, “Cause” means: (i) fraud with respect to HMS or any of its subsidiaries and affiliates; (ii) material misrepresentation to any regulatory agency, governmental authority, outside or internal auditors, internal or external company counsel, or the Board of Directors concerning the operation or financial status of HMS or of any of its subsidiaries and affiliates; (iii) theft or embezzlement of assets of HMS or any of its subsidiaries or affiliates; (iv) conviction, or plea of guilty or nolo contendere to any felony (or to a felony charge reduced to a misdemeanor), or, with respect to the named executive officer’s employment, to any misdemeanor (other than a traffic violation); (v) material failure to follow HMS’s conduct and ethics policies that have been provided or made available to the named executive officer; (vi) a material breach of the named executive officer’s employment agreement or Restrictive Covenants Agreement; and/or (vii) continued failure to attempt in good faith to perform his/her duties as reasonably assigned by the Board, in Mr. Lucia’s case, or by his/her supervisor in the case of the other named executive officers. Certain of the foregoing definitions permit the named executive officer to attempt to cure the grounds for Cause prior to termination.83§Under the 2006 Stock Plan and the related award agreements, “Cause” is equated with “gross misconduct,” and is determined by the Compensation Committee or our Board of Directors.§During fiscal 2016, we adopted forms of Non-Qualified Stock Option Award Agreement and Restricted Stock Unit Award Agreement for awards under the 2016 Omnibus Plan, under which, “Gross Misconduct” is equated with “Cause” as defined in the employment agreements for the named executive officers. For participants that have not entered into employment agreements with HMS, “Gross Misconduct” means, for purposes of these awards, a conviction of any felony, or a misdemeanor with respect to the participant’s employment, or the entering of a plea guilty or nolo contendere to such charge, the embezzlement or theft of HMS property, or a violation of a restrictive covenants or similar agreement with HMS.“CHANGE IN CONTROL”§Under the employment agreements and the terms of the 2006 Stock Plan and the 2016 Omnibus Plan, a “Change in Control” generally occurs, subject to specific exceptions, when:-a person or group beneficially owns 50.01% or more of our outstanding shares of common stock or the combined voting power of outstanding company securities entitled to vote in the election of directors;-there is a merger, consolidation, reorganization, recapitalization or share exchange involving HMS or a sale or other disposition of all or substantially all of HMS’s assets, unless, immediately after the transaction (i) all or substantially all of the beneficial owners of HMS’s outstanding common stock and outstanding voting securities prior to the transaction own, directly or indirectly, more than 50% of such securities after the transaction in substantially the same proportions as their initial ownership and (ii) no person beneficially owns 50.01%, or more of the outstanding shares of common stock or voting securities of the acquiring corporation (unless such ownership level existed prior to the transaction); or-during any one year-period, the individuals who are the continuing directors (as determined under the 2016 Omnibus Plan) cease for any reason to constitute a majority of the Board of Directors or the Board of a successor corporation.“DISABILITY”§Under the employment agreements, “Disability” exists when the Company determines that based upon appropriate medical evidence, the named executive officer has become physically or mentally incapacitated so as to render such executive incapable of performing the executive’s usual and customary duties, with or without a reasonable accommodation, for at least 180 days (or in Mr. Sherman’s case, for at least 120 days), whether or not consecutive, during any 12-month period, or if the named executive officer is found to be disabled within the Company’s long-term disability insurance as then in effect.§Under the related award agreements to the 2006 Stock Plan and the 2016 Omnibus Plan, “Disability” means permanent and total disability as defined by Section 22(e)(3) of the Code.“GOOD REASON”§Under the employment agreements, “Good Reason” means, the occurrence, without the named executive officer’s prior written consent, of any of the following events: (i) a material diminution in his/her authority, duties or responsibilities (in Mr. Lucia’s case, other than in connection with a portion of his authority, duties or responsibilities being assigned to or carried out by a President); (ii) a requirement that, in Mr. Lucia’s case, he report to an officer rather than to the Board, and in the case of the other named executive officers, that they report to a new supervisor who has materially diminished authority, duties or responsibilities in comparison to his/her previous supervisor; (iii) a material reduction in the named executive officer’s base salary (or, in Mr. Sherman’s case, his base salary or target bonus percentage); (iv) HMS’s requiring, (a) in the case of Messrs. Lucia and Sherman, that they perform their principal services in a geographic area more than 50 miles from HMS’s offices in Irving, Texas, or such other place at which they have agreed to provide such services, and (b) in the case of Mses. Neuman and Nustad and Mr. Williams, that they perform their principal services primarily in a geographic area more than 50 miles from HMS’s offices in Dallas, Texas and New York, New York, or such other place of primary employment at which they have agreed to provide such services; or (v) a material breach by HMS of any material provision of the named executive officer’s employment agreement. Good Reason is also subject to certain timing restrictions and our ability to cure the proposed Good Reason.84Compensation-Related RiskWe regularly assess risks related to our compensation programs for all employees, including non-executive officers. In February 2017, HMS’s management and Compensation Committee, with the assistance of FW Cook, conducted a comprehensive assessment of the risks associated with our compensation policies and practices as they relate to risk management practices and risk-taking incentives. The Compensation Committee took into consideration our current compensation structure and the possible risks and mitigation factors associated with each compensation element, including the mix of cash, equity and fixed compensation with short- and long-term incentives, the use of multi-year vesting periods and performance criteria for equity awards, clawback provisions that apply to long-term incentive awards, stock ownership guidelines for executive officers and a cap on bonus pool funding and individual payouts for all short-term incentive awards. Based on the results of this assessment, the Compensation Committee does not believe our compensation policies and practices for employees create risks that are reasonably likely to have a material adverse effect on our company.As discussed in more detail under the heading “Compensation Discussion and Analysis” above, the Compensation Committee reviews and approves executive compensation programs that focus on having the appropriate balance of features that mitigate compensation-related risk without diminishing the incentive nature of the compensation.ParticipationNone of the persons who served on the Compensation Committee during 2016 (Messrs. Stowe (Chair) and Callen and Ms. Tellez) were or are an officer or employee of HMS or had a related person transaction involving HMS requiring disclosure under Item 404 of Regulation S-K. During 2016, none of our executive officers (i) served as a member of the board of directors or compensation committee (or equivalent entity) of any other entity that had one or more of its executive officers serving as a member of our Compensation Committee or (ii) served as a member of the compensation committee (or equivalent entity) of any other entity that had one or more of its executive officers serving as a member of our Board of Directors.DIRECTOR COMPENSATIONThe Compensation Committee has the responsibility for recommending to the Board of Directors the form and amount of compensation for directors, which are subject to review and adjustment by the Board of Directors from time to time. Directors who are employed by HMS do not receive compensation for their service on the Board of Directors. Directors who are not our employees (non-employee directors) receive cash and equity-based compensation for their services as a director. All of our directors are reimbursed for reasonable expenses incurred in connection with attendance at meetings of the Board of Directors or its committees.Standard Compensation Arrangements for Non-Employee DirectorsOur standard compensation arrangements for non-employee directors for fiscal 2016 are summarized in the table below. Amounts effective during the periods from January 1, 2016 through October 31, 2016, and November 1, 2016 through December 31, 2016, are shown separately to illustrate certain changes approved by the Board of Directors that became effective on November 1, 2016, as discussed in more detail below. Other than the meeting fees, the amounts shown in the table below are per annum.
Participation.”85 Cash Compensation Board Cash Retainer(1) Board Member 50,000 60,000 Committee Chair Cash Retainer(1)(2) Audit 20,000 20,000 Compensation 15,000 15,000 Compliance and Ethics 15,000 15,000 Nominating and Governance 15,000 15,000 Committee Member Cash Retainer(1) Audit 7,000 7,000 Compensation 5,000 5,000 Compliance and Ethics 5,000 5,000 Nominating and Governance 5,000 5,000 Additional Cash Retainer(1) Lead Independent Director 25,000 25,000 Meeting Fees Per meeting fee for board meetings in excess of eight during fiscal year; does not include committee meetings 2,000 2,000 Equity-Based Compensation Annual Equity Retainer(3) Board Member 130,000 165,000 (1)All cash retainer fees, unless deferred by a director pursuant to the Director Deferred Compensation Plan, are paid in quarterly installments in arrears. Cash retainer fees are pro-rated for partial periods of service.(2)Committee chair cash retainers are paid in lieu of the respective committee member cash retainer.(3)The annual equity retainer to non-employee directors is in the form of a substantially equal number of non-qualified stock options and restricted stock units. See “2016 Non-Employee Director Compensation Decisions” below for a discussion of the 2016 annual equity retainer awards.2016 Non-Employee Director Compensation DecisionsIn October 2016, the Compensation Committee reviewed the design and competitive positioning of our non-employee director compensation program in relation to our peer group. For a discussion regarding our peer group, see “Competitive Pay Position and Peer Group Analyses” under the subsection entitled “Compensation Discussion and Analysis.” The peer group analysis included benchmarking data on total director compensation (taking into account our board and committee structure, board leadership structure, and number of meetings held during 2016), as well as pay mix, cash compensation and equity compensation levels, and general practices such as committee chair and member retainers and stock ownership guidelines. With guidance from FW Cook, the Compensation Committee recommended, and the Board approved, certain changes to our non-employee director compensation, effective as of November 1, 2016, as reflected in the table above under the heading “Standard Compensation Arrangements for Non-Employee Directors.” These changes resulted in our total non-employee director compensation approximating the median level of our peer group companies.Based on the recommendation of the Compensation Committee, in November 2016 the Board of Directors determined to change the timing of the annual non-employee director equity grant, which is typically granted during the fourth quarter, to the date of the annual meeting of shareholders beginning in 2017, primarily to align the vesting of the award with the directors’ year of service. To compensate the non-employee directors for their board membership from November 2016 through the anticipated date of our 2017 annual meeting of shareholders, the Board approved a pro-rated grant, effective as of November 11, 2016, for each non-employee director (other than Mr. Azar), pursuant to the 2016 Omnibus Incentive Plan, or the 2016 Omnibus Plan, with an aggregate grant date fair value of $87,450. In connection with Mr. Azar’s appointment to the Board in October 2016, Mr. Azar received an initial equity grant with an aggregate grant date fair value of $165,000, effective November 11, 2016, pursuant to the 2016 Omnibus Plan. In addition, in connection with Mr. Becker’s appointment to the Board in January, 2016, Mr. Becker received an initial equity grant with an aggregate grant date fair value of $130,000, effective as of March 2, 2016, pursuant to the then-effective Fourth Amended and Restated 2006 Stock Plan, as amended (the “2006 Stock Plan”). For additional information regarding the 2016 non-employee director equity awards, see “2016 Director Compensation” below.86Equity-Based CompensationEquity compensation provided to our non-employee directors consists of a substantially equal number of stock options and restricted stock units granted pursuant to the 2016 Omnibus Plan. Notwithstanding the changes in director grant timing that were approved in November 2016 for grants to be awarded beginning in 2017 (described above), equity grants to our non-employee directors historically have been approved annually in the fourth quarter of the fiscal year, are effective two business days following the filing of our next quarterly report on Form 10-Q with the SEC and vest in four equal installments, with 25% vesting on the last day of the calendar quarter in which the grant was effective and 25% vesting on the last day of each of the next three calendar quarters, provided that the non-employee director remains a member of our Board of Directors through each vesting date. Equity grants for new directors joining the Board are approved by the Compensation Committee at its next meeting following the director’s appointment or election and are effective two business days following the filing of our next quarterly report on Form 10-Q or annual report on Form 10-K, as applicable, with the SEC.Director Compensation LimitsUnder the terms of the 2016 Omnibus Plan, the maximum number of shares subject to awards granted during a single fiscal year to any non-employee director, taken together with any cash fees paid to such non-employee director during the fiscal year, is limited to $500,000 in total value (calculating the value of any such awards based on the grant date fair value of such award for financial reporting purposes). The Compensation Committee may make exceptions to this limit for a non-executive chair of the Board or, in extraordinary circumstances, for other individual non-employee directors, as the Committee may determine in its discretion, provided that the non-employee director receiving such additional compensation may not participate in the decision to award such compensation.Deferred CompensationEach of our non-employee directors is eligible to participate in our Director Deferred Compensation Plan, under which the non-employee director may elect annually to defer payment of all or a portion of his or her cash retainer fees and annual restricted stock unit grants until the termination of his or her service as a member of the Board. The amount of any cash compensation deferred by a non-employee director is converted into a number of deferred stock units, determined based upon the closing price of our common stock on the NASDAQ Global Select Market on the date such fees would otherwise have been payable, and credited to a deferred compensation account maintained in his or her name. Any restricted stock units that are deferred by a non-employee director are credited to the non-employee director’s account in the form of deferred stock units on a share-for-share basis on the date such restricted stock units would otherwise have been payable. The account will be credited with additional deferred stock units on the payment date for any dividends declared on our common stock, calculated based on the closing price of our common stock on the payment date. On the tenth business day of January of the year following a director’s termination of service for any reason, the amounts accumulated in the deferred compensation account will be paid in a lump sum in shares of our common stock under the 2016 Omnibus Plan equal to the number of whole deferred stock units in the account and cash in lieu of any fractional shares.The following table sets forth the number of deferred stock units credited to the accounts of our non-employee directors as of December 31, 2016.NameDeferred Stock Units(#)Azar7,785Becker10,441Callen19,041Holster35,213Miller4,058Rudnick13,490Schwartz23,592Stowe50,381Tellez35,94887Stock Ownership Guidelines for non-employee DirectorsThe Board of Directors has established significant stock ownership guidelines for our non-employee directors to encourage non-employee directors to own and hold a meaningful ownership stake in HMS in order to further align their interests and actions with the interests of HMS and its shareholders. Our non-employee directors are required to own shares of HMS common stock equal in value to at least five times their annual cash retainer. For purposes of satisfying these guidelines, a non-employee director’s shares owned outright, directly or indirectly, restricted stock and restricted stock units, whether or not vested, and deferred stock units are counted in determining the non-employee director’s stock ownership. Each non-employee director is required to achieve his or her respective ownership guidelines within five years after election to the Board of Directors, or in the case of non-employee directors serving at the time the guidelines were adopted (July 28, 2016), within five years of the date of adoption. To mitigate the impact of stock price fluctuation, the number of shares required to be held by each non-employee director to satisfy the guidelines remains fixed through December 1, 2019. The Compensation Committee monitors compliance with these guidelines on an annual basis.The following graph summarizes the stock ownership of each of our non-employee directors as of December 1, 2016, as a multiple of annual cash retainer in effect as of December 1, 2016, pursuant to our Stock Ownership Guidelines.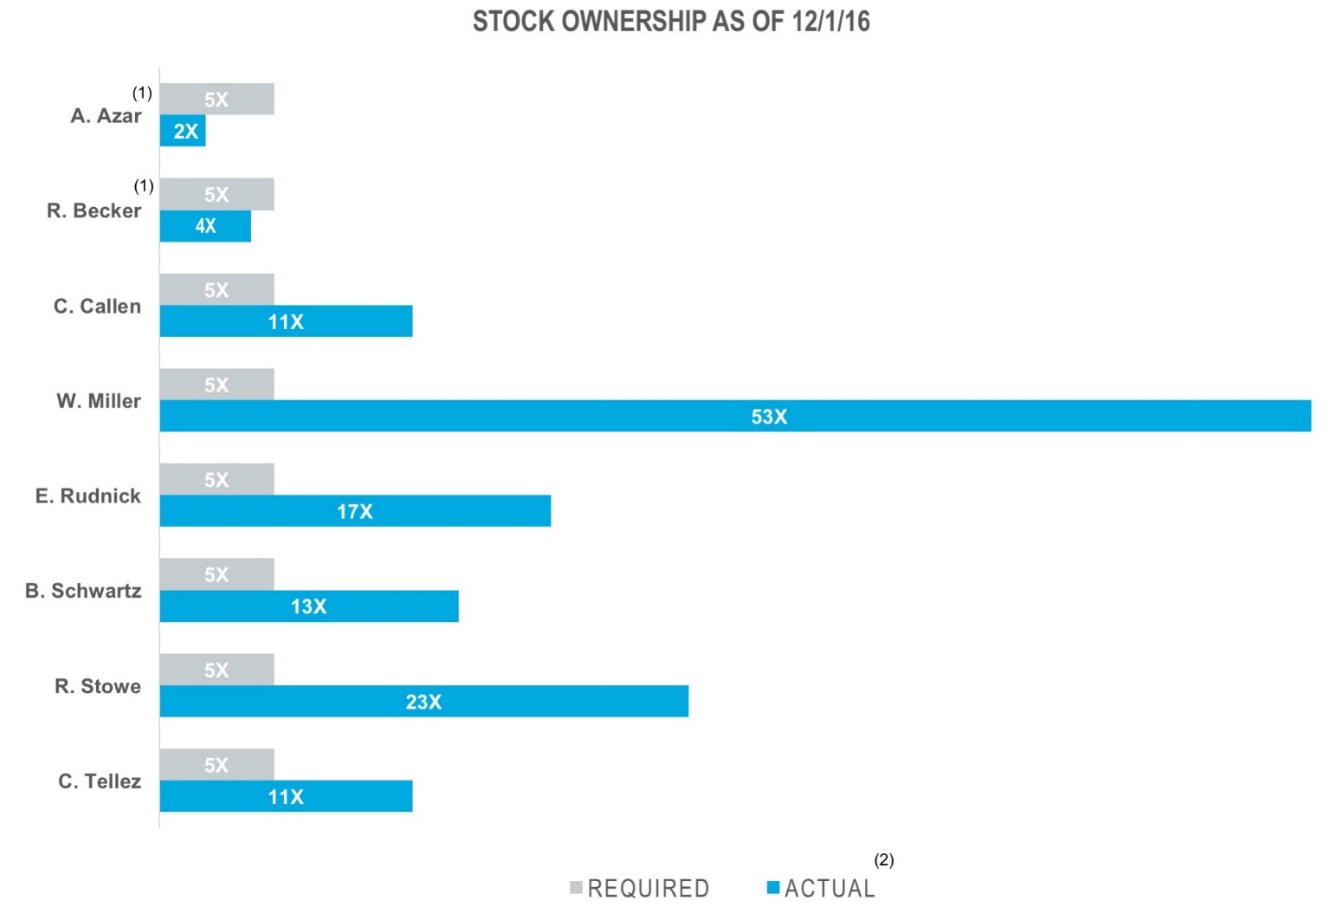
(1)Messrs. Azar and Becker joined the Board on October 11, 2016 and January 29, 2016, respectively. Pursuant to our stock ownership guidelines, Mr. Azar has until October 11, 2021 to achieve the ownership guideline, and Mr. Becker has until July 28, 2021 to achieve the ownership guideline.(2)Rounded down to the nearest multiple.882016 Director CompensationThe following table sets forth compensation earned by each of our non-employee directors for services as a director during fiscal 2016.Name
Stock Awards(2)(3)
($) Total
($)Alex M. Azar 13,217 116,723 48,270 178,210 Robert Becker 41,039 155,272 62,169 258,480 Craig R. Callen 61,720 61,860 25,582 149,162 Robert M. Holster (5) 24,038 — — 24,038 William F. Miller 54,860 61,860 25,582 142,302 Ellen A. Rudnick 81,720 61,860 25,582 169,162 Bart M. Schwartz 78,720 61,860 25,582 166,162 Richard H. Stowe 96,720 61,860 25,582 184,162 Cora M. Tellez 79,360 61,860 25,582 166,802 (1)The amounts in this column include the value of fully vested deferred stock units received under our Director Deferred Compensation Plan in lieu of all or a specified portion of the non-employee director’s cash retainer fees, calculated based on the fair market value of the underlying shares on the dates the cash retainer fees would otherwise have been paid. The aggregate number of deferred stock units credited to non-employee directors in lieu of all or a specified portion of the non-employee director’s cash retainer fees for 2016, pursuant to each director’s election, and the aggregate fair market value (calculated as of the date the units were credited to the non-employee director) of such deferred stock units are shown in Figure 1 below.(2)The number of outstanding stock options and unvested restricted stock units, whether or not deferred under the Director Deferred Compensation Plan, held by the non-employee directors as of December 31, 2016 is shown in Figure 2 below.(3)The amounts in this column represent the grant date fair value of the restricted stock units granted to the non-employee directors during fiscal 2016, whether or not deferred, computed in accordance with FASB guidance on stock-based compensation. The relevant assumptions made in the valuations may be found in Note 1 of the Notes to the Consolidated Financial Statements in this Annual Report on Form 10-K for the fiscal year ended December 31, 2016. The number of restricted stock units granted to each non-employee director during fiscal 2016 and the number of such restricted stock units that were deferred under our Director Deferred Compensation Plan, pursuant to each director’s election, are shown in Figure 3 below. The restricted stock units, whether or not deferred, vest in four equal increments, with the first 25% vesting on the last day of the calendar quarter of the date of grant, and 25% vesting on the last day of each of the next three calendar quarters.(4)The amounts in this column represent the grant date fair value of the nonqualified stock options granted to the non-employee directors during fiscal 2016, computed in accordance with FASB guidance on stock-based compensation. The relevant assumptions made in the valuations may be found in Note 1 of the Notes to the Consolidated Financial Statements in this Annual Report on Form 10-K for the fiscal year ended December 31, 2016. The number of nonqualified stock options granted to each non-employee director during fiscal 2016 is shown in Figure 4 below. The stock options vest in four equal increments, with the first 25% vesting on the last day of the calendar quarter of the date of grant, and 25% vesting on the last day of each of the next three calendar quarters.(5)Mr. Holster retired from the Board of Directors effective as of the 2016 Annual Meeting held on June 23, 2016, and therefore did not receive an equity grant during fiscal 2016.89FIGURE 1 – DEFERRED STOCK UNITS RECEIVED IN LIEU OF CASH DURING FISCAL 2016Name Azar 728 13,220 Schwartz 2,229 39,362 Stowe 5,478 96,728 Tellez 4,486 79,352 figure 2 – OUTSTANDING STOCK OPTIONS AND UNVESTED RESTRICTED STOCK UNITS AT DECEMBER 31, 2016Name Unvested Restricted Stock Units
(#)Azar 7,057 5,293 Becker 10,441 2,805 Callen 19,041 2,805 Holster 35,213 — Miller 26,983 2,805 Rudnick 26,983 2,806 Schwartz 26,983 2,806 Stowe 26,983 2,805 Tellez 21,725 2,805 FIGURE 3 – RESTRICTED STOCK UNITS GRANTED during fiscal 2016Name Restricted Stock Units Granted(1)
(#) Restricted Stock Units Deferred
(#)Azar 7,057 7,057 Becker 10,441 10,441 Callen 3,740 3,740 Miller 3,740 — Rudnick 3,740 1,870 Schwartz 3,740 1,870 Stowe 3,740 3,740 Tellez 3,740 3,740 (1)The amount shown represents the number of restricted stock units granted to each non-employee director (other than Mr. Becker) on November 11, 2016. The amount shown for Mr. Becker represents the aggregate number of restricted stock units granted on March 2, 2016 (6,701) and November 11, 2016 (3,740).90FIGURE 4 – STOCK OPTIONS GRANTED during fiscal 2016NameNonqualified Stock Options Granted(1)(#)Azar 7,057Becker10,441Callen 3,740Miller 3,740Rudnick 3,740Schwartz 3,740Stowe 3,740Tellez 3,740(1)The amount shown represents the number of nonqualified stock options granted to each non-employee director (other than Mr. Becker) on November 11, 2016. The amount shown for Mr. Becker represents the aggregate number of nonqualified stock options granted on March 2, 2016 (6,701) and November 11, 2016 (3,740).2016.2019. For additional information about our equity compensation plans see Note 10 –the discussion set forth under the caption “Stock-Based Compensation” in our NotesNote 12 to the Consolidated Financial Statements in Part II, Item 8. Consolidated Financial StatementsNumber of securities to be issued upon exercise of outstanding options, warrants and rights Weighted- average exercise price of outstanding options, warrants and rights Number of securities remaining available for future issuance under equity compensation plans (excluding securities reflected in column (a)) Plan Category (a) (b) (c) Equity compensation plans approved by shareholders 3,577,870 (1) $ 23.43 9,289,094 Equity compensation plans not approved by shareholders 17,184 (2) $ 12.95 — Total 3,595,054 Supplemental Data. Number of
securities to be
issued upon
exercise of
outstanding
options, warrants
and rights Weighted-
average exercise
price of
outstanding
options,
warrants and
rights Number of
securities
remaining
available for future
issuance under
equity
compensation
plans (excluding
securities reflected
in column (a))Plan Category (a) (b) (c) Equity compensation plans approved by shareholders 6,515,239 (1) $ 17.35 7,142,562 Equity compensation plans not approved by shareholders 52,140 (2) $ 22.58 — Total 6,567,379 (1)This includes stock options and restricted stock units granted under our 2006 Stock Plan and 2016 Omnibus Plan.(2)restricted stock units granted under our 2006 Stock Plan, 2016 Omnibus Plan and 2019 Omnibus Plan. of our Board.SECURITY OWNERSHIP OF CERTAIN BENEFICIAL OWNERS AND MANAGEMENTThe following tables set forth information known to us with respect to the beneficial ownership of our common stock as of May 15, 2017 by (i) each of our directors, (ii) each of Messrs. Lucia, Sherman and Williams and Mses. Neuman and Nustad, our named executive officers for fiscal 2016, (iii) all of our directors and current executive officers as a group and (iv) each person (or group of affiliated persons) known by us to be the beneficial owner of more than 5% of our common stock.
Board.91The tables are based upon information supplied to us by directors, executive officers and principal shareholders and filings under the Exchange Act. We have based our calculation of the percentage of beneficial ownership on 83,909,845 shares of our common stock outstanding as of May 15, 2017, unless otherwise noted. The beneficial ownership reported in the following tables is determined in accordance with the applicable rules of the SEC and does not necessarily indicate beneficial ownership for any other purpose. For purposes of the following tables, an entity or individual is considered the beneficial owner of shares of common stock if the entity or individual directly or indirectly has or shares voting power or investment power, as defined in the rules of the SEC, with respect to such shares or has the right to acquire beneficial ownership of such shares within 60 days of May 15, 2017.Unless otherwise noted and subject to applicable community property laws, to our knowledge each shareholder named in the following table possesses sole voting and investment power over the shares listed. The address of each person listed in the table is c/o HMS Holdings Corp., 5615 High Point Drive, Irving, Texas 75038. To our knowledge, as of May 15, 2017, none of our officers or directors has pledged any of the shares that they respectively beneficially own as security.Security Ownership of managementName of Beneficial Owner Number of Outstanding Shares of Common Stock Number of Shares Underlying Options Exercisable Within 60 Days(1) Number of Shares Underlying Restricted Stock Units that will Vest Within 60 Days(2)(3) Percent of Class Directors (who are not officers): Alex M. Azar II — 5,292 — * Robert Becker 5,000 9,506 — * Craig R. Callen 19,000 18,106 — * William F. Miller III 164,940 (4) 26,048 935 * Ellen A. Rudnick 42,980 26,048 467 * Bart M. Schwartz 20,306 26,048 467 * Richard H. Stowe 25,000 26,048 — * Cora M. Tellez 580 20,790 — * Named Executive Officers: William C. Lucia 522,092 (5) 482,316 — 1.2% Semone Neuman 35,280 238,222 — * Cynthia Nustad 32,209 224,462 — * Jeffrey S. Sherman 50,507 (6) 274,907 — * Douglas Williams 43,532 243,676 — * All current directors and executive officers as a group (15 persons)(7) 995,664 (8) 1,784,002 1,869 3.3% * Less than 1% of outstanding shares(1)Includes the number of shares that could be purchased by exercise of options exercisable at May 15, 2017 or within 60 days thereafter. The amounts reported in this column are excluded from the amounts reported in the column “Number of Outstanding Shares of Common Stock.”(2)Includes the number of shares underlying restricted stock units that are not subject to outstanding performance conditions and vest within 60 days of May 15, 2017, and excludes vested and unvested deferred stock units acquired pursuant to the Director Deferred Compensation Plan. Restricted stock units do not have voting power and are payable solely in shares of HMS common stock. The amounts reported in this column are excluded from the amounts reported in the column “Number of Outstanding Shares of Common Stock.”(3)Excludes deferred stock units (whether or not vested) held by non-employee directors pursuant to the Director Deferred Compensation Plan as follows: Mr. Azar (8,523), Mr. Becker (10,441), Mr. Callen (19,041), Mr. Miller (4,058), Ms. Rudnick (13,490), Mr. Schwartz (24,127), Mr. Stowe (51,672), and Ms. Tellez (37,018).(4)Includes 9,000 shares of common stock held in trusts for the benefit of Mr. Miller’s family. Mr. Miller disclaims beneficial ownership of the shares of common stock held by the trusts.92(5)Includes 522,092 shares of common stock held by the William C. Lucia Family Trust, a revocable trust for which Mr. Lucia serves as trustee.(6)Includes 10,760 shares of common stock held by a revocable family trust for the benefit of Mr. Sherman’s children and for which Mr. Sherman and his spouse serve as trustees.(7)Includes the named executive officers, the current directors and Mses. Bjorck and South.(8)Includes the shares reported in footnotes (4), (5) and (6).Based on a review of filings with the SEC, the following entities hold more than 5% of our outstanding shares of common stock as of the date indicated on the respective filing.Security Ownership of Certain BeneficIal OwnersName and Address of Beneficial Owner BlackRock, Inc.(1) 9,836,431 11.6 The Vanguard Group(2) 7,907,910 9.3 T. Rowe Price Associates, Inc.(3) 6,819,568 8.0 (1)Based solely on a Schedule 13G/A filed with the SEC on January 12, 2017. According to the Schedule 13G/A, BlackRock, Inc., in its capacity as a parent holding company or control person of subsidiaries that acquired the reported securities, has sole voting power over 9,442,892 shares and sole dispositive power over 9,836,431 shares. The Schedule 13G/A was filed on BlackRock’s behalf and on behalf of its subsidiaries BlackRock (Netherlands) B.V.; BlackRock Advisors, LLC; BlackRock Asset Management Canada Limited; BlackRock Asset Management Ireland Limited; BlackRock Asset Management Schweiz AG; BlackRock Financial Management, Inc.; BlackRock Fund Advisors; BlackRock Institutional Trust Company, N.A.; BlackRock Investment Management (Australia) Limited; BlackRock Investment Management (UK) Ltd and BlackRock Investment Management, LLC. BlackRock Fund Advisors beneficially owns 5% or greater of the outstanding shares of the class. BlackRock’s principal business address is 55 East 52nd Street, New York, NY 10055.(2)Based solely on a Schedule 13G/A filed with the SEC on February 13, 2017. According to the Schedule 13G/A, The Vanguard Group, a registered investment advisor, has sole voting power over 167,345 shares, shared voting power over 12,078 shares, sole dispositive power over 7,732,809 shares and shared dispositive power over 175,101 shares. Vanguard Fiduciary Trust Company, a wholly-owned subsidiary of The Vanguard Group, Inc., is the beneficial owner of 163,023 shares as a result of its serving as investment manager of collective trust accounts. Vanguard Investments Australia, Ltd., a wholly-owned subsidiary of The Vanguard Group, Inc., is the beneficial owner of 16,400 shares as a result of its serving as investment manager of Australian investment offerings. The Vanguard Group’s principal business address is 100 Vanguard Boulevard, Malvern, PA 19355.(3)Based solely on a Schedule 13G filed with the SEC on February 2, 2017. According to the Schedule 13G, T. Rowe Price Associates, Inc., a registered investment advisor (“Price Associates”), has sole voting power over 957,740 shares and sole dispositive power over 6,819,568 shares. Price Associates does not serve as custodian of the assets of any of its clients; accordingly, in each instance only the client or the client's custodian or trustee bank has the right to receive dividends paid with respect to, and proceeds from the sale of, such securities. The ultimate power to direct the receipt of dividends paid with respect to, and the proceeds from the sale of, such securities, is vested in the individual and institutional clients which Price Associates serves as investment adviser. Any and all discretionary authority which has been delegated to Price Associates may be revoked in whole or in part at any time. Price Associates’ principal business address is 100 E. Pratt Street, Baltimore, MD 21202.CERTAIN RELATIONSHIPS AND RELATED TRANSACTIONSRelated Person Transaction PolicyAudit Committeeinformation required by this Item 13 is responsible for reviewing all transactions with related persons on an ongoing basis for potential conflict of interest situations, and all such transactions must be approvedincorporated herein by reference to the Audit Committee. Our Board of Directors has adopted a written Related Person Transaction Policy to assist the Audit Committeeapplicable disclosure found in reviewing proposed transactions between HMS and certain individuals deemedour definitive proxy statement to be “related persons.” The policy applies to our executive officers, directors, director nominees and 5% shareholders (and their immediate family members), each of whom we refer to as a “related person,” and governs the review of any transaction, arrangement or relationship in which we are a participant, the amount involved exceeds $120,000 and a related person has a direct or indirect material interest. We refer to such a transaction, arrangement or relationship as a “related person transaction.”93Review and Approval of Related Person TransactionsPursuant to our Related Person Transaction Policy, a related person must notify the Corporate Secretary of any plan to enter into, extend or modify any transaction with HMS or its affiliates that could be a related person transaction. The proposed transaction is reviewed and, if deemed appropriate, approved by the Audit Committee prior to entry into the transaction. Under the policy, any related person transactions that are ongoing in nature and previously approved by the Audit Committee will be reviewed annually. A transaction with a related person reviewed under the policy will be considered approved or ratified if it is authorized by the Audit Committee after full disclosure of the related person’s interest in the transaction. The Audit Committee will review and consider all relevant information regarding the transaction, including the impact on a director’s independence or a Board committee’s composition in the event the related person is a director, as it deems appropriate under the circumstances.The Audit Committee may approve or ratify the transaction only if the Audit Committee determines that, under all of the circumstances, the transaction is in, or is not inconsistentfiled with the best interests of HMS. In connection with approving a transaction with a related person, the Audit Committee may impose any conditions on the transaction that it deems appropriate. All related person transactions will be disclosed in applicable SEC filingspursuant to the extent required by the Securities Act andRegulation 14A under the Exchange Act and related rules and regulations. There have been no transactionsin connection with related persons since the beginningHMS Holdings Corp.’s 2020 Annual Meeting of fiscal 2016 reportable pursuant to applicable SEC rules.Director IndependenceA majority of our Board of Directors must be comprised of “independent directors” in accordance with the NASDAQ Marketplace Rules. Under Rule 5605(a)(2) of the NASDAQ Marketplace Rules, a director will only qualify as an “independent director” if, in the opinion of our Board of Directors, that person does not have a relationship which would interfere with the exercise of independent judgment in carrying out the responsibilities of a director. Based on its review of the applicable independence standards and answers to annual questionnaires completed by the directors, our Board of Directors has determined that each of Messrs. Azar, Becker, Callen, Miller, Schwartz and Stowe and Mses. Rudnick and Tellez is an “independent director” as definedShareholders under the NASDAQ Marketplace Rules. The Board of Directors previously determined that Mr. Robert M. Holster, who retired from our Board of Directors effective at the 2016 annual meeting of shareholders, was an independent director during the time he served on the Board in 2016.INDEPENDENT REGISTERED PUBLIC ACCOUNTING FIRMKPMG LLP (“KPMG”) has served as our (and our predecessor’s) independent registered public accounting firm since 1981. aggregate fees forinformation required by this Item 14 is incorporated herein by reference to the services rendered by KPMG duringapplicable disclosure from the past two fiscal years are set forth in the table below.Audit and Non-Audit FeesType of Fee 2016
($) 2015
($)Audit Fees(1) 1,600,000 945,000 Audit-Related Fees(2) — — Tax Fees(3) 1,757,388 320,000 All Other Fees(4) — — Total Fees for Services Provided(5) 3,357,388 1,265,000 (1)Audit fees consist of fees for professional services rendered for the audit of our consolidated financial statements, review of interim financial statements and services normally provided by the independent registered public accounting firm in connection with regulatory filings, including registration statements. The amount shown for fiscal 2016 represents the aggregate fees estimated to be billed by KPMG for the services rendered.94(2)Audit-related fees may consist of fees for audits of benefit plans and due diligence related to mergers and acquisitions. KPMG did not perform any audit-related services during fiscal years 2015 and 2016.(3)Tax fees consist of fees for permissible tax services, including tax compliance, tax analysis and tax implementation provided during the ordinary course of operations.(4)All other fees consist of services not included in the categories above. KPMG did not perform any other services during fiscal years 2015 and 2016.(5)All audit and non-audit services disclosed in the table were pre-approved by the Audit Committee prior to the provision of the services.Audit Committee Pre-Approval Policies and ProceduresIn accordance with its Charter, the Audit Committee pre-approves all audit and permissible non-audit services provided by our independent registered public accounting firm. At the timeproposal captioned “annual engagementSelection of Independent Registered Public Accounting Firm” found in our independent registered public accounting firm or as soon as practicable thereafter, the Audit Committee pre-approves specific services and/or categories of services that maydefinitive proxy statement to be provided during the year by the independent registered public accounting firm and the estimated fees for such services. During the year, circumstances may arise when it may become necessary or appropriate to engage the independent registered public accounting firm for additional services not contemplated in the original pre-approval. In such circumstances, our senior management seeks approval from the Audit Committee to engage the independent registered public accounting firm for such additional services. A description of any proposed non-audit services is provided to the Audit Committee alongfiled with the estimated fees for its pre-approval. For each proposed service, the independent registered public accounting firm is required to provide detailed supporting documentation at the time of approval to permit the Audit Committee to make a determination whether the performance of such services would impair the auditor’s independence. The Audit Committee is regularly informed of any non-audit services provided by the independent auditorSEC pursuant to this pre-approval process.
Regulation 14A under the Exchange Act in connection with HMS Holdings Corp.’s 2020 Annual Meeting of Shareholders.951.Financial Statements.100.2.Financial Statement Schedules.124.97. All other financial statement schedules have been omitted as they are either not required, not applicable or the information is otherwise included.3.Exhibits.The are set forth on the Exhibit Index on page 125 and incorporated herein by reference. .Exhibit Number Description 2.1 2.2.1 2.2.2 3.1 3.2 Exhibit Number Description 4.1 4.2 10.1.1 10.1.2 10.1.3 10.1.4 10.1.5 10.1.6 10.1.7 10.1.8 10.2.1 10.2.2 10.2.3 10.2.4 10.2.5 10.3.1 10.3.2 10.3.3 Exhibit Number Description 10.3.4 10.3.5 10.4.1 10.4.2 10.4.3 10.4.4 10.5 10.6 10.7 10.8 10.9 10.10 10.11 10.12 10.13 10.14.1 Exhibit Number Description 10.14.2 10.15 21.1 23.1 31.1 31.2 32.1 32.2 101.INS XBRL Instance Document - the instance document does not appear in the Interactive Data File because its XBRL tags are embedded within the Inline XBRL document 101.SCH Inline XBRL Taxonomy Extension Schema Document 101.CAL Inline XBRL Taxonomy Extension Calculation Linkbase Document 101.DEF Inline XBRL Taxonomy Extension Definition Linkbase Document 101.LAB Inline XBRL Taxonomy Extension Label Linkbase Document 101.PRE Inline XBRL Taxonomy Extension Presentation Linkbase Document 104 Cover Page Interactive Data File (formatted in Inline XBRL and contained in Exhibit 101) None.96SIGNATURESJune 6, 2017. February 24, 2020.HMS Holdings Corp./s/ WILLIAM C. LUCIAWilliam C. Lucia William C. Lucia Chairman of the Board, President and
Chief Executive OfficerJune 6, 2017.February 24, 2020.Signature Title WILLIAMWilliam C. LUCIAWilliam C. Lucia Director, Chairman of the Board, President and
Chief ExecutiveWilliam C. LuciaOfficer (Principal Executive Officer) JEFFREYJeffrey S. SHERMAN Jeffrey S. Sherman Executive Vice President, Chief Financial Officer and Treasurer (Principal Financial Officer) Jeffrey S. Sherman(Principal Financial Officer)/s/ Greg D. Aunan /s/ GREGGreg D. AUNANSenior Vice President and Chief Accounting Officer (Principal Accounting Officer) Greg D. AunanAccounting Officer)/s/ Katherine Baicker /s/ ALEX M. AZAR IIDirector Alex M. Azar II/s/ Robert Becker /s/ ROBERT BECKERDirector Robert BeckerCRAIG R. CALLENDirectorCraig R. Callen Craig R. Callen Director /s/ WILLIAM F. MILLER IIIDirector/s/ William F. Miller III William F. Miller III Director /s/ ELLEN A. RUDNICKDirector/s/ Jeffrey A. Rideout Jeffrey A. Rideout Director /s/ Ellen A. Rudnick Ellen A. Rudnick Director /s/ BART M. SCHWARTZDirector/s/ Bart M. Schwartz Bart M. Schwartz Director /s/ RICHARD H. STOWEDirector/s/ Richard H. Stowe Richard H. Stowe Director /s/ CORA M. TELLEZDirector/s/ Cora M. Tellez Cora M. Tellez 97Director PageNumberConsolidated Financial Statements: Page Number Financial Statement Schedule: 98The :20162019 and 2015, and2018, the related consolidated statements of income, changes in shareholders’ equity, and cash flows for each of the three years in the three-year period ended December 31, 2016.2019, and the related notes and financial statement schedule included under Item 15 (collectively referred to as the “financial statements”). In connectionour opinion, the financial statements present fairly, in all material respects, the financial position of the Company as of December 31, 2019 and 2018, and the results of its operations and its cash flows for each of the three years in the period ended December 31, 2019, in conformity with accounting principles generally accepted in the United States of America.audits ofreport dated February 24, 2020 expressed an unqualified opinion.we also have auditedthe Company has changed its method of accounting for leases on January 1, 2019 using the optional transition method due to the adoption of Accounting Standards Update No. 2016-02: Leases (Topic 842).statement schedule II. These consolidated financial statements and financial statement schedule are the responsibility of the Company’s management. Our responsibility is to express an opinion on these consolidatedthe Company’s financial statements and financial statement schedule based on our audits.Public Company Accounting Oversight Board (United States).PCAOB. Those standards require that we plan and perform the audit to obtain reasonable assurance about whether the financial statements are free of material misstatement. An audit includesmisstatement, whether due to error or fraud. Our audits included performing procedures to assess the risks of material misstatement of the financial statements, whether due to error or fraud, and performing procedures that respond to those risks. Such procedures included examining, on a test basis, evidence supporting the amounts and disclosures in the financial statements. An auditOur audits also includes assessingincluded evaluating the accounting principles used and significant estimates made by management, as well as evaluating the overall presentation of the financial statement presentation.statements. We believe that our audits provide a reasonable basis for our opinion.In consolidated financial statements referred to above present fairly, in all material respects, the financial position of HMS Holdings Corp. and subsidiaries as of December 31, 2016 and 2015, and the results of their operations and their cash flows for each of the years in the three-year period ended December 31, 2016, in conformity with U.S. generally accepted accounting principles. Also in our opinion, the related financial statement schedule, when considered in relation to the basic consolidated financial statements, taken as a whole, presents fairly,and we are not, by communicating the critical audit matters below, providing separate opinions on the critical audit matters or on the accounts or disclosures to which they relate.information set forth therein.HMS Holdings Corp.’s internal control overthe consolidated financial reportingstatements of the Company as of and for the year ended December 31, 2016, based on criteria established in Internal Control – Integrated Framework (2013) issued by the Committee of Sponsoring Organizations of the Treadway Commission (COSO),2019, and our report dated June 6, 2017February 24, 2020 expressed an adverseunqualified opinion on the effectiveness of thethose financial statements. internal control over financial reporting./s/ KPMG LLPKPMG LLPDallas, TexasJune 6, 201799Report of Independent Registered Public Accounting FirmThe Board of Directors and ShareholdersHMS Holdings Corp.:We have audited HMS Holdings Corp.’s internal control over financial reporting as of December 31, 2016, based on criteria established in Internal Control - Integrated Framework (2013) issued by the Committee of Sponsoring Organizations of the Treadway Commission (COSO). HMS Holdings Corp.'s management is responsible for maintaining effective internal control over financial reporting and for its assessment of the effectiveness of internal control over financial reporting, included in the accompanying Management’s Report on Internal Control Over Financial Reporting.Reporting (“Management’s Report”). Our responsibility is to express an opinion on the Company'sCompany’s internal control over financial reporting based on our audit.Public Company Accounting Oversight Board (United States).PCAOB. Those standards require that we plan and perform the audit to obtain reasonable assurance about whether effective internal control over financial reporting was maintained in all material respects. Our audit included obtaining an understanding of internal control over financial reporting, assessing the risk that a material weakness exists, and testing and evaluating the design and operating effectiveness of internal control based on the assessed risk. Our audit also includedrisk, and performing such other procedures as we considered necessary in the circumstances. We believe that our audit provides a reasonable basis for our opinion.company'scompany’s internal control over financial reporting is a process designed to provide reasonable assurance regarding the reliability of financial reporting and the preparation of financial statements for external purposes in accordance with generally accepted accounting principles. A company’s internal control over financial reporting includes those policies and procedures that (1) pertain to the maintenance of records that, in reasonable detail, accurately and fairly reflect the transactions and dispositions of the assets of the company; (2) provide reasonable assurance that transactions are recorded as necessary to permit preparation of financial statements in accordance with generally accepted accounting principles, and that receipts and expenditures of the company are being made only in accordance with authorizations of management and directors of the company; and (3) provide reasonable assurance regarding prevention or timely detection of unauthorized acquisition, use, or disposition of the company’s assets that could have a material effect on the financial statements.A material weakness is a deficiency, or a combination/s/ KPMG LLPKPMG LLPDallas, TexasJune 6, 2017101 December 31,
2016 December 31,
2015December 31,
2019December 31,
2018Assets Assets Current assets: Current assets: Cash and cash equivalents $ 175,999 $ 145,610 Cash and cash equivalents $ 139,268 $ 178,946 Accounts receivable, net of allowance of $10,772 and $11,464, at December 31, 2016 and 2015, respectively 173,582 169,146 Prepaid expenses 13,699 11,261 Accounts receivable, net Accounts receivable, net 223,443 206,772 Prepaid expenses and other current assets Prepaid expenses and other current assets 30,925 20,210 Income tax receivable 3,354 - Income tax receivable 3,210 18,817 Other current assets 1,001 3,051 Deferred financing costs, net Deferred financing costs, net 564 564 Total current assets 367,635 329,068 Total current assets 397,410 425,309 Property and equipment, net 92,167 96,551 Property and equipment, net 86,947 94,435 Goodwill 379,716 361,468 Goodwill 599,351 487,617 Intangible assets, net 37,797 54,308 Intangible assets, net 131,849 67,140 Operating lease right-of-use assets Operating lease right-of-use assets 17,493 — Deferred financing costs, net 2,790 4,873 Deferred financing costs, net 1,109 1,673 Other assets 2,650 4,329 Other assets 10,117 2,344 Total assets $ 882,755 $ 850,597 Total assets $ 1,244,276 $ 1,078,518 Liabilities and Shareholders' Equity Liabilities and Shareholders' Equity Current liabilities: Current liabilities: Accounts payable, accrued expenses and other liabilities $ 59,402 $ 51,661 Accounts payable, accrued expenses and other liabilities $ 97,747 $ 74,902 Estimated liability for appeals 30,755 33,078 Income taxes payable - 3,873 Liability for appeals Liability for appeals 3,570 21,723 Total current liabilities 90,157 88,612 Total current liabilities 101,317 96,625 Long-term liabilities: Long-term liabilities: Revolving credit facility 197,796 197,796 Revolving credit facility 240,000 240,000 Operating lease liabilities Operating lease liabilities 14,881 — Net deferred tax liabilities 22,717 30,961 Net deferred tax liabilities 25,587 18,485 Deferred rent 5,427 6,006 Other liabilities 10,048 2,520 Other liabilities 7,626 10,012 Total long-term liabilities 235,988 237,283 Total long-term liabilities 288,094 268,497 Total liabilities 326,145 325,895 Total liabilities 389,411 365,122 Commitments and contingencies (Note 12) Commitments and contingencies Commitments and contingencies Shareholders' equity: Shareholders' equity: Preferred stock -- $0.01 par value; 5,000,000 shares authorized; none issued - - Common stock -- $0.01 par value; 175,000,000 shares authorized; 95,966,852 shares issued and 83,552,774 shares outstanding at December 31, 2016; 95,263,461 shares issued and 83,989,715 shares outstanding at December 31, 2015 959 952 Preferred stock -- $0.01 par value; 5,000,000 shares authorized; NaN issued Preferred stock -- $0.01 par value; 5,000,000 shares authorized; NaN issued — — Common stock -- $0.01 par value; 175,000,000 shares authorized; 101,766,468 shares issued and 88,103,566 shares outstanding at December 31,2019; 98,924,501 shares issued and 85,261,664 shares outstanding at December 31, 2018 Common stock -- $0.01 par value; 175,000,000 shares authorized; 101,766,468 shares issued and 88,103,566 shares outstanding at December 31,2019; 98,924,501 shares issued and 85,261,664 shares outstanding at December 31, 2018 1,018 989 Capital in excess of par value 345,025 330,290 Capital in excess of par value 479,964 425,748 Retained earnings 326,110 288,474 Retained earnings 509,459 422,235 Treasury stock, at cost -- 12,414,078 shares at December 31, 2016 and 11,273,746 shares December 31, 2015 (115,484 ) (95,014 ) Treasury stock, at cost: 13,663,194 shares at December 31, 2019 and 13,663,194 shares at December 31, 2018 Treasury stock, at cost: 13,663,194 shares at December 31, 2019 and 13,663,194 shares at December 31, 2018 (135,576) (135,576) Total shareholders' equity 556,610 524,702 Total shareholders' equity 854,865 713,396 Total liabilities and shareholders' equity $ 882,755 $ 850,597 Total liabilities and shareholders' equity $ 1,244,276 $ 1,078,518 102 Years Ended December 31, Year Ended December 31, 2016 2015 2014 2019 2018 2017 Revenue $ 489,720 $ 474,216 $ 443,225 Revenue $ 626,395 $ 598,290 $ 521,212 Cost of services: Cost of services: Compensation 189,271 178,272 181,273 Compensation 231,321 224,893 202,049 Data processing 37,337 40,915 39,661 Direct project and other operating expenses Direct project and other operating expenses 90,069 74,346 69,772 Information technology Information technology 53,950 53,428 45,723 Occupancy 14,000 15,766 16,950 Occupancy 16,375 15,968 17,190 Direct project expenses 46,254 51,527 36,866 Other operating expenses 27,778 28,895 24,588 Amortization of acquisition related software and intangible assets 28,030 28,148 28,612 Amortization of acquisition related software and intangible assets 16,999 32,975 30,393 Total cost of services 342,670 343,523 327,950 Total cost of services 408,714 401,610 365,127 Selling, general and administrative expenses 89,381 83,121 81,071 Selling, general and administrative expenses 114,665 113,442 105,654 Settlement expense Settlement expense — 20,000 — Total operating expenses 432,051 426,644 409,021 Total operating expenses 523,379 535,052 470,781 Operating income 57,669 47,572 34,204 Operating income 103,016 63,238 50,431 Interest expense (8,519 ) (7,812 ) (7,931 ) Interest expense (11,013) (11,310) (10,871) Interest income 321 49 57 Interest income 4,148 1,089 295 Other income Other income 8,211 — — Income before income taxes 49,471 39,809 26,330 Income before income taxes 104,362 53,017 39,855 Income tax expense 11,835 15,282 12,383 Income taxes Income taxes 17,138 (1,972) (199) Net income $ 37,636 $ 24,527 $ 13,947 Net income $ 87,224 $ 54,989 $ 40,054 Basic income per common share: Basic income per common share: Net income per common share -- basic $ 0.45 $ 0.28 $ 0.16 Net income per common share — basic Net income per common share — basic $ 1.00 $ 0.66 $ 0.48 Diluted income per common share: Diluted income per common share: Net income per common share -- diluted $ 0.43 $ 0.28 $ 0.16 Net income per common share — diluted Net income per common share — diluted $ 0.98 $ 0.64 $ 0.47 Weighted average shares: Weighted average shares: Basic 84,221 87,881 87,673 Basic 87,222 83,625 83,821 Diluted 86,987 88,361 88,164 Diluted 89,317 86,144 85,088 103 Common Stock Treasury Stock # of Shares
Issued Par Value Capital in
Excess of
Par Value Retained
Earnings # of Shares Amount Total
Shareholders'
EquityBalance at January 1, 2014 93,826,453 $ 936 $ 296,517 $ 250,000 6,526,305 $ (45,014 ) $ 502,439 Net income - - - 13,947 - - 13,947 Stock-based compensation expense - - 13,356 - - - 13,356 Exercise of stock options 516,552 5 4,105 - - - 4,110 Vesting of restricted stock awards and units, net of shares withheld for employee tax 168,439 2 (1,660 ) - - - (1,658 ) Excess tax benefit from exercise of stock options - - 1,795 - - - 1,795 Shortfall due to exercise of stock options - - (323 ) - - - (323 ) Deferred tax asset reversal for unexercised stock options - - (576 ) - - - (576 ) Balance at December 31, 2014 94,511,444 943 313,214 263,947 6,526,305 (45,014 ) 533,090 Net income - - - 24,527 - - 24,527 Stock-based compensation expense - - 14,297 - - - 14,297 Purchase of treasury stock - - - - 4,747,441 (50,000 ) (50,000 ) Exercise of stock options 577,559 7 4,180 - - - 4,187 Vesting of restricted stock awards and units, net of shares withheld for employee tax 174,458 2 (1,031 ) - - - (1,029 ) Excess tax benefit from exercise of stock options - - 1,569 - - - 1,569 Shortfall due to exercise of stock options - - (827 ) - - - (827 ) Deferred tax asset reversal for unexercised stock options - - (1,112 ) - - - (1,112 ) Balance at December 31, 2015 95,263,461 952 330,290 288,474 11,273,746 (95,014 ) 524,702 Net income - - - 37,636 - - 37,636 Stock-based compensation expense - - 13,277 - - - 13,277 Purchase of treasury stock - - - - 1,140,332 (20,470 ) (20,470 ) Exercise of stock options 510,512 5 2,935 - - - 2,940 Vesting of restricted stock awards and units, net of shares withheld for employee tax 192,879 2 (1,477 ) - - - (1,475 ) Balance at December 31, 2016 95,966,852 $ 959 $ 345,025 $ 326,110 12,414,078 $ (115,484 ) $ 556,610 Year Ended December 31, 2019 2018 2017 Common Stock and paid-in capital Balance, beginning of period $ 426,737 $ 369,686 $ 345,984 Exercise of stock options 39,332 38,362 2,720 Stock-based compensation expense 21,901 21,507 24,143 Vesting of restricted stock units, net of shares withheld for employee tax (6,988) (2,818) (3,161) Balance, end of period 480,982 426,737 369,686 Retained earnings Balance, beginning of period 422,235 366,164 326,110 Net income 87,224 54,989 40,054 Cumulative effect of accounting changes — 1,082 — Balance, end of period 509,459 422,235 366,164 Treasury stock Balance, beginning of period (135,576) (129,621) (115,484) Purchase of treasury stock — (5,955) (14,137) Balance, end of period (135,576) (135,576) (129,621) Total shareholders' equity $ 854,865 $ 713,396 $ 606,229 Shares issued Balance, beginning of period 98,924,501 96,536,251 95,966,852 Exercise of stock options 2,435,648 2,017,442 172,326 Vesting of restricted stock units, net of shares withheld for employee tax 406,319 370,808 397,073 Balance, end of period 101,766,468 98,924,501 96,536,251 Treasury Stock Balance, beginning of period 13,663,194 13,279,393 12,414,078 Purchase of treasury stock — 383,801 865,315 Balance, end of period 13,663,194 13,663,194 13,279,393 104 Years ended December 31, Year Ended December 31, 2016 2015 2014 2019 2018 2017 Operating activities: Operating activities: Net income $ 37,636 $ 24,527 $ 13,947 Net income $ 87,224 $ 54,989 $ 40,054 Adjustments to reconcile net income to net cash provided by operating activities: Adjustments to reconcile net income to net cash provided by operating activities: Depreciation and amortization of property and equipment 24,882 30,328 32,864 Depreciation and amortization of property, equipment and software Depreciation and amortization of property, equipment and software 33,293 33,254 27,724 Amortization of intangible assets 20,164 20,270 20,734 Amortization of intangible assets 9,691 24,342 22,555 Amortization of deferred financing costs 2,083 2,084 2,084 Amortization of deferred financing costs 564 564 2,258 Gain on sale of cost basis investment Gain on sale of cost basis investment (7,697) — — Stock-based compensation expense 13,277 14,297 13,356 Stock-based compensation expense 21,901 21,507 24,143 Deferred income taxes (7,368 ) (14,020 ) (12,290 ) Deferred income taxes 7,290 (3,504) (20,409) (Gain) / Loss on disposal of assets (948 ) 84 219 Noncash lease expense Noncash lease expense 4,133 — — Change in fair value of contingent consideration - - (517 ) Change in fair value of contingent consideration — (35) (2,865) Changes in operating assets and liabilities, net of the effect of acquisitions: Release of estimated liability for appeals, net Release of estimated liability for appeals, net (10,478) (8,436) — Changes in operating assets and liabilities: Changes in operating assets and liabilities: Accounts receivable (3,554 ) (12,045 ) 14,625 Accounts receivable (16,292) (17,312) (6,976) Prepaid expenses (2,399 ) 549 1,132 Prepaid income taxes - 6,711 3,445 Other current assets 2,066 (412 ) (2,150 ) Prepaid expenses and other current assets Prepaid expenses and other current assets (10,487) (2,785) (1,298) Other assets 234 10 121 Other assets (2,173) 245 124 Income taxes receivable / (payable) (7,227 ) 3,873 - Income taxes receivable / (payable) 15,607 (16,925) 1,462 Accounts payable, accrued expenses and other liabilities 12,116 (250 ) 18,039 Accounts payable, accrued expenses and other liabilities 4,744 11,181 (340) Estimated liability for appeals (2,323 ) (3,721 ) (5,053 ) Operating lease liabilities Operating lease liabilities (5,315) — — Liability for appeals Liability for appeals 1,227 (628) 32 Net cash provided by operating activities 88,639 72,285 100,556 Net cash provided by operating activities 133,232 96,457 86,464 Investing activities: Investing activities: Acquisition of a business, net of cash acquired (20,678 ) - - Acquisition of businesses, net of cash acquired Acquisition of businesses, net of cash acquired (185,790) — (171,321) Proceeds from sale of cost basis investment 2,496 - - Proceeds from sale of cost basis investment 9,776 — — Purchases of land, property and equipment (13,703 ) (8,620 ) (22,687 ) Investment in common stock Investment in common stock (7,421) — — Purchases of property and equipment Purchases of property and equipment (8,276) (11,264) (17,318) Investment in capitalized software (7,316 ) (3,197 ) (3,514 ) Investment in capitalized software (13,348) (19,149) (15,725) Net cash used in investing activities (39,201 ) (11,817 ) (26,201 ) Net cash used in investing activities (205,059) (30,413) (204,364) Financing activities: Financing activities: Repayment of revolving credit facility - - (35,000 ) Proceeds from credit facility Proceeds from credit facility — — 42,204 Payments for deferred financing costs Payments for deferred financing costs — — (2,269) Proceeds from exercise of stock options 2,940 4,187 4,110 Proceeds from exercise of stock options 39,332 38,362 2,720 Payments of tax withholdings on behalf of employees for net-share settlement for stock-based compensation (1,475 ) (1,029 ) (1,658 ) Payments of tax withholdings on behalf of employees for net-share settlements Payments of tax withholdings on behalf of employees for net-share settlements (6,988) (2,818) (3,161) Payments on capital lease obligations (44 ) (1,132 ) (1,629 ) Payments on capital lease obligations (195) — (143) Payments on contingent consideration - - (428 ) Purchases of treasury stock (20,470 ) (50,000 ) - Purchases of treasury stock — (5,955) (14,137) Net cash used in financing activities (19,049 ) (47,974 ) (34,605 ) Net increase in cash and cash equivalents 30,389 12,494 39,750 Cash and cash equivalents Net cash provided by financing activities Net cash provided by financing activities 32,149 29,589 25,214 Net (decrease)/increase in cash and cash equivalents Net (decrease)/increase in cash and cash equivalents (39,678) 95,633 (92,686) Cash and Cash Equivalents Cash and Cash Equivalents Cash and cash equivalents at beginning of year 145,610 133,116 93,366 Cash and cash equivalents at beginning of year 178,946 83,313 175,999 Cash and cash equivalents at end of year $ 175,999 $ 145,610 $ 133,116 Cash and cash equivalents at end of period Cash and cash equivalents at end of period $ 139,268 $ 178,946 $ 83,313 Supplemental disclosure of cash flow information: Supplemental disclosure of cash flow information: Cash paid for income taxes $ 20,326 $ 22,878 $ 21,144 Cash (refunds received)/paid for income taxes, net of refunds Cash (refunds received)/paid for income taxes, net of refunds $ (5,298) $ 22,225 $ 17,995 Cash paid for interest $ 6,196 $ 5,694 $ 4,458 Cash paid for interest $ 10,457 $ 10,326 $ 9,944 Supplemental disclosure of noncash activities: Supplemental disclosure of non-cash activities: Supplemental disclosure of non-cash activities: Change in balance of accrued property and equipment purchases $ 684 $ 729 $ 1,610 Change in balance of accrued property and equipment purchases $ (1,303) $ 1,305 $ 51 1051.Business and Summary of Significant Accounting Policiesa leadingan industry-leading provider of cost containment and analytical solutions in the U.S. healthcare marketplace. Using innovativeOur mission is to make healthcare work better for everyone. We use data, technology as well as extensive data services and powerful analytics the Company deliversto deliver coordination of benefits, payment integrity and population health management solutions that help healthcare organizations reduce costs, improve health outcomes and enhance consumer experiences. We provide a broad range of payment accuracy solutions to government and commercial healthcare payers, including coordination of benefit services to ensure that the right payer pays the claim, and payment integrity services to address improper payments and fraud, waste and abuse. Our population health management solutions include a portfolio of integrated risk analytics, consumer engagement and care management solutions through its operating subsidiariesthat provide healthcare organizations with reliable intelligence insight into their population and member risks to predict, identify and avoid preventable high cost events over the healthcare continuum. Through our solutions, we help move the healthcare payers improve performance and outcomes. The Company is managed and operatessystem forward by saving billions of dollars for our customers while helping consumers lead healthier lives. We currently operate as one1 business segment with a single management team that reports to the Chief Executive Officer. The Company serves state Medicaid programs, commercial health plans, federal government health agencies, government and private employers, child support agencies, and other healthcare payers and sponsors. Together the various services help the Company’s customers recover improper payments; prevent future improper payments; reduce fraud, waste and abuse; and ensure regulatory compliance.United States Generally Accepted Accounting Principles (“U.S. GAAP”)GAAP requires management to make estimates and assumptions that affect the reported amounts of assets and liabilities and disclosure of contingent assets and liabilities at the date of the financial statements and the reported amounts of revenues and expenses during the reporting period. Actual results could differ from those estimates. ReclassificationsIn the 2015 Consolidated Balance Sheets, the Company reported Accounts Receivable, net of allowance for doubtful accounts and estimated allowance for appeals. In the 2016 Consolidated Balance Sheets, Accounts Receivable, net of allowance includes the allowance for doubtful accounts, revenue adjustments and the estimated allowance for appeals.(iv) (v) 106(vi) (v)Property and Equipmentrelated lease which is typically five years, including any anticipated renewal periods, or (ii) the estimated useful life of the leasehold improvement, whichever is shorter.improvement. Equipment leased under capital leases is depreciated over the shorter of (i) the term of the lease andor (ii) the estimated useful life of the equipment. Capitalized software costs relatedrelate to software that is acquired or developed for internal use while in the application development stage. All other costs to develop software for internal use, either in the preliminary project stage or post-implementation stage, are expensed as incurred. Amortization of capitalized software is calculated on a straight-line basis over the expected economic life. Land is not depreciated.Property and Equipment Useful Life
(in years)Property and Equipment Useful Life
(in years)Equipment 2 - 3 Equipment 2 to 5 Leasehold improvements 3 - 10 Leasehold improvements 5 to 10 Furniture and fixtures 3 - 5 Furniture and fixtures 5 Capitalized software 3 - 10 Capitalized software 3 to 10 Building and building improvements up to 39.5 Building and building improvements up to 39 anthe asset may not be recoverable. When indicators exist, recoverability of assets is measured by a comparison of the carrying value of the asset group to the estimated undiscounted future net cash flows expected to be generated by the asset. If such assets are considered to be impaired, the impairment to be recognized and charged to earnings is measured by the amount by which the carrying value of the asset group exceeds the fair value of the assets, which amount is charged to earnings. Fair value is based on a projection of the estimated discounted future net cash flows expected to result from the asset group, using a discount rate reflective of the Company’s cost of funds.assets. The Company did not recognize any impairment charges related to property and equipment during the years ended December 31, 2016, 20152019, 2018 or 2014.(vii) 2017.assetsdetermination ofCompany determines fair value for individual assetsthrough various valuation techniques including discounted cash flow models, quoted market values, relief from royalty methodologies, multi-period and liabilitiesthird party independent appraisals, as considered necessary. Significant assumptions used in many instances requires a high degree of estimation and the valuation of intangible assets, in particular, is subjective. Significant estimates in intangible assetsthose techniques include, but are not limited to, growth rates, discount rates, customer attrition rates, expected levels of revenues, earnings, cash flows and tax rates. The use of different valuation techniques and assumptions are highly subjective and inherently uncertain and unpredictable and, as a result, actual results may differ materially from estimates.Intangible Assets Useful Life
(in years)Intangible Assets Useful Life
(in years)Customer relationships 5 - 10 Customer relationships 7 to 15 Restrictive covenants 3 - 7 Restrictive covenants 1 to 3 Trade name 3 - 5 Trade names Trade names 1.5 to 7 Intellectual property 5 Intellectual property 4 to 6 anthe asset may not be recoverable. When indicators exist, recoverability of assets is measured by a comparison of the carrying value of the asset group to the estimated undiscounted future net cash flows expected to be generated by the asset. If such assets are considered to be impaired, the impairment to be recognized and charged to earnings is measured by the amount by which the carrying value of the asset group exceeds the fair value of the assets, which amount is charged to earnings. Fair value is based on a projection of the estimated discounted future net cash flows expected to result from the asset group, using a discount rate reflective of the Company’s cost of funds.assets. The Company did not0t recognize any impairment charges related to intangible assets during the years ended December 31, 2016, 20152019, 2018 or 2014.
2017.107(viii) GoodwillGoodwill is subject to a periodic assessment for impairment. HMSHMSthe Company would not need to perform the two-step impairment test for that reporting unit.test. If the Company cannot support such a conclusion, or the Company does not elect to perform the qualitative assessment, then the first step of the goodwill impairment test is used to identify potential impairment by comparing the fair value of athe reporting unit with its carrying amount, including goodwill. HMSThe Company completed the annual impairment test as of June 30, 20162019 using the optional qualitative assessment and determined no impairment existed. There were no0 impairment charges related to goodwill during the years ended December 31, 2016, 20152019, 2018 or 2014.(ix)2017.carry-forwards.carry-forwards. Deferred tax assets and liabilities are measured using enacted tax rates expected to apply to taxable income in the years in which those temporary differences are expected to be recovered or settled. The effect on deferred tax assets and liabilities of a change in tax rates is recognized as income or expense in the period that includes the enactment date. A valuation(x) Revenue RecognitionThe Company provides services under contracts that contain various fee structures, including contingency fee and fixed fee arrangements. Revenue is recognized when a contract exists, services have been provided to the customer, the fee is fixed and determinable, and collectability is reasonably assured. In addition, the Company has contracts with the federal government which are generally cost-plus or time and material based. Revenue on cost-plus contracts is recognized based on costs incurred plus the negotiated fee earned. Revenue on time and materials contracts is recognized based on hours worked and expenses incurred. In addition, some of the Company’s contracts may include customer acceptance provisions. Formal customer sign-off is not always necessary to recognize revenue, provided HMS objectively demonstrates that the criteria specified in the acceptance provision are satisfied. Due to the range of products and services that HMS provides and the differing fee structures associated with each type of contract, revenue may be recognized in irregular increments. A portion of our revenue is recorded net of an estimate of future revenue adjustments, with an offsetting entry to accounts receivable allowance, based on historical patterns of billing adjustments, length of operating and collection cycle and customer negotiations, behaviors and payment patterns. Changes in these estimates are recorded to revenue in the period of change.108(xi) Estimated Liability for AppealsUnder the Company’s Recovery Audit Contractor (“RAC”) contract with Centers for Medicare and Medicaid Services (“CMS”), the Medicaid RAC contracts with various states, and similar contracts for commercial health plan customers, HMS recognizes revenue when findings are sent to the customer for offset against future claims payments. Providers have the right to appeal a finding and may pursue additional appeals if the initial appeal is found in favor of the customer. HMS records a) a liability for findings which have been adjudicated in favor of providers and b) an estimated liability for findings that are probable of being returned to providers following a successful appeal. Resolution of appeals can take substantial time to resolve as there is a significant backlog in the system for resolving appeals, as over the course of the Company’s existing RAC contract, healthcare providers have increased their pursuit of appeals beyond the first and second levels of appeals to the third level of appeal, where cases are heard by Administrative Law Judges (“ALJs”). In the Company’s experience, decisions at the third level of appeal are the least favorable as ALJs exercise greater discretion and there is less predictability in the ALJ decisions as compared to appeals for the first or second levels. The estimated liability is based on the amount of revenue that is subject to appeals, closures or other adjustments and the Company’s historical experience with appeals. The liability for appeals is an offset to revenue to the Company’s Consolidated Statements of Income. The total liability for appeals balance of $30.8 million and $33.1 million as of December 31, 2016 and 2015, respectively, includes $17.3 million and $15.9 million, respectively, of CMS liabilities which represents findings which have been adjudicated in favor of providers and $11.1 million and $12.8 million, respectively, of CMS liabilities which represents an estimate of findings that are probable of being returned to providers following a successful appeal. To the extent the amount to be returned to providers following a successful appeal, closure or other adjustment exceeds or is less than the amount recorded, revenue in the applicable period would be reduced or increased by such amount. Any future changes to any of the Company’s customer contracts, including further modifications to the transition plan for incumbent Medicare RACs may require the Company to apply different assumptions that could materially affect the Company’s liability for future periods.(xii)(ix) Expense ClassificationsSelling,selling, general and administrative expenses (“("SG&A”&A") functions, which are presented separately as a component of total operating costs. A description of the primary expenses included in each category is as follows:§Compensation:Salary, fringe benefits, bonus and stock-based compensation.§Data processing:Hardware, software and data communication costs.§Occupancy:Rent, utilities, depreciation, office equipment and repair and maintenance costs.§Direct project expense:Variable costs incurred from third party providers that are directly associated with specific revenue generating projects and employee travel expenses.§Other operating expense:Professional fees, temporary staffing, travel and entertainment, insurance and local and property tax costs.§Amortization of acquisition related software and intangible assets: Amortization of the cost of acquisition related software and intangible assets.§Expenses related to general management, marketing and administration activities.109(xiii)receivablesreceivable based on an analysis of historical revenue adjustments, bad debts, customer concentrations, customer credit-worthiness, current economic trends and changes in customer payment terms. As of December 31, 20162019 and 2015,2018, the accounts receivable balance was $173.6$223.4 million and $169.1$206.8 million, net of adjustments. Adjustments to the accounts receivable balance include revenue recognition related adjustments, such as customer discounts, and allowance for credit related losses. The allowance for credit related losses was not material to the financial statements as of $10.8 millionDecember 31, 2019 and $11.5 million, respectively.(xiv)2018. equity-based compensation awards, including stock options and restricted stock units to HMS employees and non-employee directors of the Company under the 2016HMS Holdings Corp. 2019 Omnibus Incentive Plan which was(the “2019 Omnibus Plan”), as approved byJune 23, 2016.May 22, 2019. The 20162019 Omnibus Plan replaced and superseded the Company’s 2006 Stock PlanHMS Holdings Corp. 2016 Omnibus Incentive Plan. As of December 31, 2019, the number of securities remaining available for future issuance under equity compensation plans, excluding securities to be issued upon exercise of outstanding options and 2011 HDI Plan.vesting of restricted stock units, was 9,289,094 shares. All of the Company’s employees as well as HMS non-employee directors are eligible to participate in the 20162019 Omnibus Plan. Awards granted under the 20162019 Omnibus Plan generally vest over one to four years. TheSubject to certain exceptions, the exercise price of stock options granted under the 20162019 Omnibus Plan may not be less than the fair market value of a share of stock on the grant date, as measured bywhich is determined based on the closing price of the Company’s common stock on the NASDAQNasdaq Global Select Market and the term of a stock option may not exceed ten years. Certain stock optionPrior to 2018, the Company granted two types of equity awards: 1) equity awards with service conditions and restricted stock unit2) equity awards granted to senior executives are subject to performance-based vestingwith market and service conditions. The performance-based awards are market condition awards as the performance condition is based on the Company’s common stock price overduring the applicable performancemeasurement period.For awards subject to service-based vesting conditions, theperiod, which is generally the vesting term. For the performance-based awards subject to market conditions, the Company recognizes stock-based compensation expense equal to the grant date fair value of the stock options on a straight-line basis over the requisite service period.market-basedmarket and service-based conditions is estimated using a Monte Carlo simulation model. The fair value of each restricted stock unit is calculated based on the closing sale price of the Company’s common stock on the grant date.stock options on the grant date using the models aboveBlack-Scholes pricing model and/or the Monte Carlo simulation model is affected by the Company’s stock price, as well as assumptions regarding a number of complex and subjective variables. Certain key variables include: the Company’s expected stock price volatility over the expected term of the awards; a risk-free interest rate; and any expected dividends. The Company estimates stock price volatility based on the historical volatility of the Company’s common stock and estimates the expected term of the awards based on the Company’s historical option exercises for similar types of stock option awards. The assumed risk-free interest rate is based on the yield on the measurement date of a zero-coupon U.S. Treasury bond with a maturity period equal to the option’s expected term. The Company does not anticipate paying any cash dividends in the foreseeable future and therefore, uses an expected dividend yield of zero0 in the option valuation models. The fair value of all awards also includes an estimate of expected forfeitures. Forfeitures are estimated based on historical experience. If actual forfeitures vary from estimates, a difference in compensation expense will be recognized in the period the actual forfeitures occur. Upon the exercise of stock options or the vesting of restricted stock units, the resulting excess tax benefits or deficiencies, if any, are recognized as income tax expense or benefit. Additionally, excess tax benefits are required to be reflected as a cash flow operating activity.110(xv)(xii) Fair Value of Financial Instruments§Level 1: Observable inputs such as quoted prices in active markets;§Level 2:Inputs, other than the quoted prices in active markets, that are observable either directly or indirectly; and§Level 3:Unobservable inputs in which there is little or no market data, which require the reporting entity to develop its own assumptions.cost. Duecost, which approximates fair value due to the variable interest rate associated with the revolving credit facility and the variable interest margin based uponfacility.leverage ratio, cost approximates its fair value. The fairbalance sheet within Operating lease right-of-use ("ROU") assets, Operating lease liabilities and Accounts payable, accrued expenses and other liabilities. Finance leases are reported on the Company’s consolidated balance sheets within Other assets, Other liabilities and Accounts payable, accrued expenses and other liabilities. contingent consideration liability is determined using Level 3 inputs. See Note 4 – “Acquisitions”future minimum lease payments over the lease term at commencement date. As most of the Company’s leases do not provide an implicit rate, we use the Company’s incremental borrowing rate based on the information available at the lease’s commencement date in our Notes todetermining the Consolidated Financial Statements under Item 8. Consolidated Financial Statements and Supplementary Data for additional information regarding the fairpresent value of financial instruments.(xvi) LeasesHMS accounts forfuture payments. The operating lease ROU asset also includes any lease payments made and excludes lease incentives and initial direct costs incurred. The lease terms may include options to extend or terminate the lease agreements as either operating or capital leases, depending onwhen it is reasonably certain defined criteria.that we will exercise that option. Lease costs are amortizedexpense for minimum lease payments is recognized on a straight-line basis without regard to deferred payment terms, such as rent holidays, that deferover the commencement date of required payments. Additionally, incentives such as tenant improvement allowances,lease term. For certain real estate and equipment leases, the Company has lease agreements with lease and non-lease components, which are capitalized and are treatedgenerally accounted for as a reduction of rental expense over the term of the lease agreement.(xvii) ContingenciesFrom time to time, HMS is involved in legal proceedings in the ordinary course of business. single component.assesses the likelihood of any adverse judgments or outcomes to these contingencies as well as potential ranges or probable lossesprimarily leases real estate, information technology equipment and establish reserves accordingly. HMS records accruals for outstanding legal matters when it believes it is probabledata centers on terms that a loss will be incurred and the amount can be reasonable estimated. Significant judgment is required to determine both probability and the estimated amount. HMS reviews these provisions at least quarterly and adjusts the provisions to reflect the impact of negotiations, settlements, rulings, advice of legal counsel and updated information. Litigation is inherently unpredictable and is subject to significant uncertainties,expire on various dates through 2026, some of which are beyondinclude options to extend the Company’s control. The amountlease for up to 10 years. We evaluate whether to include the option period in the calculation of reserves required may change in future periods due to new developments in each matter or changes in approach tothe ROU asset and lease liability on a matter such as a change in settlement strategy.(xviii)lease-by-lease basis. As of December 31, 2019, all operating and finance leases that create significant rights and obligations for the Company have commenced. April 2015,May 2014, the Financial Accounting Standards Board (“FASB”("FASB") issued Accounting Standards Update (“ASU”("ASU") 2015-05, Intangibles – GoodwillNo. 2014-9, Revenue from Contracts with Customers (Topic 606) (“ASU 2014-9”), which is the new comprehensive revenue recognition standard that supersedes all existing revenue recognition guidance under U.S. GAAP. The Company adopted ASU 2014-9 on January 1, 2018 using the modified retrospective method and Other – Internal-Use Software (Subtopic 350-40): Customer’s Accountingthe Company recognized the cumulative effect of initially applying the new revenue standard as an adjustment to the opening balance of retained earnings. The financial information for Fees Paid in a Cloud Computing Arrangement (“ASU 2015-05”). ASU 2015-05 provides explicit guidancecomparative prior periods has not been restated and continues to help companies evaluatebe reported under the accounting standards in effect for fees paid by a customerthose periods. The effect of adopting ASU 2014-9 in a cloud computing arrangement2018 as compared with the guidance that was in effect before the change is immaterial. The Company’s internal control framework did not materially change, but existing internal controls were modified due to certain changes to business processes and clarifies that if a cloud computing arrangement includes a software license,systems to support the customer should account for the license consistent with its accounting for other software licenses. If the arrangement does not include a software license, the customer should account for the arrangementnew revenue recognition standard as a service contract. ASU 2015-05 is effective for annual reporting periods beginning after December 15, 2015, including interim periods within such annual reporting periods with early adoption permitted.necessary. The adoption of this guidance did not have a material effect on the Company’s consolidated financial statements.111In November 2015, the FASB issued ASU 2015-17, Income Taxes (Topic 740): Balance Sheet ClassificationIn February 2016, the FASB issued ASU 2016-02, Leases (Topic 842) (“ASU 2016-02”). ASU 2016-02 will require most lessees to recognize a majority of the Company’s leases on the balance sheet, which will increase reported assets and liabilities. ASU 2016-02 is effective for annual reporting periods beginning after December 15, 2018 including interim periods within such annual reporting periods with early adoption permitted. The Company has not early adopted this guidance and is currently evaluating the impact on the Company’s consolidated financial statements.(“ (“ASU 2016-15”). The amendment ASU 2016-15 clarifies where certain cash receipts and cash payments are presented and classified in the statement of cash flows. Current guidance does not include specific guidance on the eight classification issues presented in the amendments, which are intended to reduce diversity in practice with respect to classification and presentation of such cash receipts and payments. The amendments are effective for annual reporting periods beginning after December 15, 2017, and for interim reporting periods within such annual periods. The Company is currently evaluating the impactadopted this guidance on January 1, 2018. The adoption of this guidance in 2018 did not have a material effect on the Company’s consolidated financial statements.2017-01, 2017-1, Business Combinations (Topic(Topic 805) – Clarifying the Definition of a Business (“ASU 2017-01”2017-1”). ASU 2017-012017-1 finalizes previous proposals regarding shareholder concerns that the definition of a business is applied too broadly. The guidance assists entities with evaluating whether transactions should be accounted for as acquisitions of assets or of businesses. The amendments are effective for annual periods beginning after December 15, 2017, including interim periods within those periods. The Company is currently evaluating the impactadopted this guidance on January 1, 2018. The adoption of this guidance in 2018 did not have a material effect on the Company’s consolidated financial statementsstatements.adoptingModification Accounting, (“ASU 2017-9”). ASU 2017-9 requires entities to apply modification accounting to changes made to a share-based payment award. The new guidance specifies that entities will apply modification accounting to changes to a share-based payment award only if any of the following are not the same immediately before and after the change: 1) The award’s fair value (or calculated value or intrinsic value, if those measurement methods are used), 2) the award’s vesting conditions, and 3) the award’s classification as an equity or liability instrument. ASU 2017-9 is effective for annual reporting periods beginning after December 15, 2017, including interim periods within such annual periods, with early adoption permitted. The Company adopted this guidance.2017-04, 2017-4, Goodwill and Other (Topic 350): Simplifying the Test for Goodwill Impairment (“ (“ASU 2017-04”2017-4”). This amendment simplifies the manner in which an entity is required to test for goodwill impairment by eliminating Step 2 from the goodwill impairment test. Step 2 measures goodwill impairment loss by comparing the implied fair value of a reporting unit’s goodwill with the carrying amount of that goodwill. The amendment simplifies this approach by having the entity (1) perform its annual or interim goodwill impairment test by comparing the fair value of a reporting unit with its carrying amount, and (2) recognize an impairment charge for the amount by which the carrying amount exceeds the reporting unit’s fair value, with the understanding that the loss recognized should not exceed the total amount of goodwill allocated to that reporting unit. The amendment isCompany elected to early adopt the new guidance in the fourth quarter of fiscal year 2018. The adoption of this guidance in 2018 did not have a material effect on the Company’s consolidated financial statements.U.S. SecuritiesSEC filers on November 5, 2018. The adoption of this guidance in 2018 did not have a material effect on the Company’s consolidated financial statements.Exchange Commissionliabilities. ASU 2016-02 was subsequently amended by ASU No. 2018-01, Land Easement Practical Expedient for Transition to Topic 842; ASU No. 2018-10, Codification Improvements to Topic 842, Leases; and ASU No. 2018-11, Targeted Improvements. The new standard establishes a ROU model that requires a lessee to recognize a ROU asset and lease liability on the balance sheet for all leases with a term longer than 12 months. Leases are classified as finance or operating, with classification affecting the pattern and classification of expenseSEC”ASU 2018-07”) filers prospectively. ASU 2018-07 requires entities to apply similar accounting for their annual, or any interim, goodwill impairment tests inshare-based payment transactions with non-employees as with share-based payment transactions with employees. ASU 2018-07 is effective for public entities for fiscal years beginning after December 15, 2018, including interim periods within those fiscal years. The Company adopted this guidance on January 1, 2019. The adoption of this guidance did not have a material effect on the Company’s consolidated financial statements.permitted for all entities for interim or annual goodwill impairment tests performed on testing dates after January 1, 2017. The Companypermitted. This guidance is currently evaluating the impact on the Company’s financial statements of adopting this guidance.Other new pronouncements issued but not effective until after December 31, 2016, if any, are not expected to have a material impact on the Company’s financial position, results of operations or liquidity.2.Property and EquipmentPropertyIn August 2018, the FASB issued ASU No. 2018-15, Intangibles - Goodwill and equipment consistedOther - Internal Use Software (Subtopic 350-40): Customer's Accounting for Implementation Costs Incurred in a Cloud Computing Arrangement That Is a Service Contract ("ASU 2018-15"). The standard aligns the requirements for capitalizing implementation costs incurred in a hosting arrangement that is a service contract with the requirements for capitalizing implementation costs incurred to develop or obtain internal use software. ASU 2018-15 is effective for public business entities for fiscal years beginning after December 15, 2019, and interim periods within those fiscal years. Early adoption is permitted, including adoption in any interim period for which financial statements have not been issued. Entities can choose to adopt the new guidance prospectively to eligible costs incurred on or after the date this guidance is first applied or retrospectively. This guidance is not expected to have a material impact on the Company’s financial position, results of operations or internal control framework.following ASU113Years ended December 31, 2019 2018 Coordination of Benefits $ 404,123 $ 397,095 Payment Integrity 162,194 144,063 Population Health Management 60,078 57,132 Total $ 626,395 $ 598,290 December 31, 2016 2015 Equipment $ 94,345 $ 90,496 Leasehold improvements 8,637 8,512 Building 8,624 8,624 Building improvements 12,671 11,367 Land 2,769 2,769 Furniture and fixtures 10,728 10,858 Capitalized software 110,696 104,266 248,470 236,892 Less: accumulated depreciation and amortization (156,303 ) (140,341 ) Property and equipment, net 92,167 96,551 December 31, (in millions) 2016 2015 2014 Depreciation and amortization expense related to property and equipment $ 24.9 $ 30.3 $ 32.9 Net capital leasesYears ended December 31, 2019 2018 Commercial $ 302,489 $ 323,150 State 257,685 233,921 Federal 66,221 41,219 Total $ 626,395 $ 598,290 equipment were approximately $4,000the existing contract. The Company has elected to use the practical expedient to expense the incremental costs of obtaining a contract if the amortization period of the asset that the Company would have otherwise recognized is one year or less.$51,000 atcost containment business, for aggregate consideration of cash in the amount of $158.6 million, which was funded through cash on hand. The purchase price is subject to certain post-closing purchase price adjustments and the initial purchase price allocation as of the date of acquisition was based on a preliminary valuation. Estimates and assumptions for which the Company is still obtaining or evaluating information are subject to change up to one year from the acquisition date as additional information becomes available and adjustments may require a change in the amounts allocated to goodwill during the periods in which the adjustments are determined.Cash and cash equivalents $ 9,400 Accounts receivable 9,188 Prepaid expenses 129 Property and equipment 2,878 Intangible assets 68,400 Goodwill 81,545 Other assets 489 Accounts payable and accrued liabilities (13,395) Total purchase price $ 158,634 Useful Life
(in years)Customer relationships 12 $ 67,000 Trade name 3 1,400 Fair value of intangibles acquired $ 68,400 20162019. The costs include consulting, legal and 2015, respectively. Accumulated depreciationtransaction costs, and have been recorded in selling, general and administrative expenses.equipmentthe year ended December 31, 2019.capital leases was approximately $6.1 millionthe circumstances. The pro forma results are not necessarily indicative of future results. The pro forma financial information includes the historical results of the Company and $6.0 millionAccent adjusted for certain items, which are described below, and does not include the effects of any synergies or cost reduction initiatives related to the acquisition of Accent.Years ended December 31, 2019 2018 (pro forma, in thousands) (unaudited) Revenue $ 675,259 $ 650,203 Net income $ 92,845 $ 60,011 20162019 and 2015. Depreciation expense for equipment under capital leases for the years ended December 31, 2016, 2015 and 2014 was approximately $40,000, $1.2 million, and $1.6 million, respectively.3.Intangible AssetsIntangible assets consisted of the following (in thousands): Gross
Carrying
Amount Accumulated
Amortization Net Carrying
AmountDecember 31, 2016 Customer relationships $ 103,090 $ (71,914 ) $ 31,176 Trade name 15,936 (11,393 ) 4,543 Intellectual property 2,100 (140 ) 1,960 Restrictive covenants 133 (15 ) 118 Total $ 121,259 $ (83,462 ) $ 37,797 December 31, 2015 Customer relationships $ 101,806 $ (57,497 ) $ 44,309 Trade name 17,000 (10,221 ) 6,779 Restrictive covenants 16,800 (13,580 ) 3,220 Total $ 135,606 $ (81,298 ) $ 54,308 In 2016, the Company wrote-off approximately $16.8 million of fully amortized restrictive covenant intangibles and $1.2 million of fully amortized trade name intangibles.114Amortization expense of intangible assets is expected to approximate the following (in thousands):Year ending December 31, 2017 $ 17,306 2018 16,685 2019 2,245 2020 791 2021 463 Thereafter 307 For the years ended December 31, 2016, 2015 and 2014, amortization expense2018 reflects adjustments primarily related to intangible assets was $20.2 million, $20.3 milliondepreciation and $20.7 million, respectively.4.Acquisitions2, 2016, the Company16, 2019, HMS acquired the outstanding capital stock of Essette,VitreosHealth, Inc. ("VitreosHealth"), a care management technology company which helps risk-bearing organizations manage the care delivered to their members,that offers predictive and prescriptive health insights utilized by population risk models, for aggregate consideration of $24.2$36.6 million, which is primarily comprised of cash payments of $21.3 million. To fund the purchase price, the Company utilizedwas funded with cash on hand. The purchase price was subject to certain post-closing purchase price adjustments and the initial purchase price allocation as of the date of acquisition was based on a preliminary valuation.subject to adjustment based upon the final amounton estimated fair values as of adjusted working capital of Essette at closing.a) at their acquisition date fair values, the following tangible assets: net deferred tax assets of $0.9 million and other net assets of $0.9 million and b) at their acquisition date fair values, the following amortizing intangiblesignificant assets: intellectual property subject to amortization of $2.1 million, customer relationships of $1.3 million, restrictive covenants of $0.1$6.0 million, and trade namegoodwill of $0.1 million. Goodwill of $18.2$30.2 million which represents the excess purchase price over the net identifiable tangible and intangible assets. There were no additional material allocations to assets and liabilities. The intangible assets are valued using various methods which requiresrequire several judgments, including growth rates, discount rates, customer attrition rates, and expected levels of revenues, earnings, cash flows and tax rates. The intangible assets are amortized over their estimated useful lives on a straight-line basis and are not expected to be deductible for tax purposes. The goodwill recognized from the Contingent consideration, up to an aggregate maximum $12.0 million, will be payable in calendar years 2017, 2018, or 2019, respectively, should Essette achieve certain revenue targets as defined in the stock purchase agreement. The contingent consideration is valued using a method which requires several judgments but primarily include discount rates and expected levels of revenues. In the fourth quarter 2016, purchase accounting adjustments included a $1.1 million increase to total transaction consideration and to goodwill, a $0.7 million increase to other net assets, and a $0.2 million increase in the customer relationship intangible. The amounts shown above may change in the near term as management continues to assess the fair value of acquired assets and liabilities.The acquisition was not significant to the Company’s consolidated financial statements; therefore, pro the operations related to this business acquisition for the year ended December 31, 20152018, or interim periods thereafter, and for the year ended December 31, 2019, have not been presented.presented and are not considered material. The immaterial results of Essette’sVitreosHealth's operations since September 2, 201616, 2019 have been included in the Company's consolidated financial statements and are not considered material.There were no Eliza contributed $52.5 million, $51.9 million and $30.4 million in revenue to HMS results of operations in the years ended December 31, 2019, 2018 and 2017, respectively.December 31, 2019 2018 Equipment $ 90,347 $ 95,350 Leasehold improvements 8,042 7,547 Building 9,674 8,624 Building improvements 16,305 14,825 Land 2,949 2,769 Furniture and fixtures 8,685 9,404 Capitalized software 134,864 131,819 270,866 270,338 Less: accumulated depreciation and amortization (183,919) (175,903) Property and equipment, net $ 86,947 $ 94,435 Years ended December 31, 2019 2018 2017 Depreciation and amortization expense related to property and equipment $ 33,293 $ 33,254 $ 27,515 Gross Carrying Amount Accumulated
AmortizationNet Carrying Amount Weighted Average
Amortization Period in YearsDecember 31, 2019 Customer relationships $ 135,290 $ (21,637) $ 113,653 12.1 Trade names 1,536 (147) 1,389 3.0 Intellectual property 27,700 (10,893) 16,807 3.7 Total $ 164,526 $ (32,677) $ 131,849 Gross Carrying Amount Accumulated
AmortizationNet Carrying Amount Weighted Average
Amortization Period in YearsDecember 31, 2018 Customer relationships $ 156,790 $ (104,740) $ 52,050 12.8 Trade names 16,246 (16,215) 31 0.7 Intellectual property 21,700 (6,670) 15,030 4.1 Restrictive covenants 263 (234) 29 0.7 Total $ 194,999 $ (127,859) $ 67,140 Year ending December 31, Amortization 2020 $ 14,914 2021 14,447 2022 14,439 2023 11,605 2024 10,180 Thereafter 66,264 Total $ 131,849 Balance at December 31, 2018 $ 487,617 Vitreos acquisition 30,189 Accent acquisition 81,545 Balance at December 31, 2019 $ 599,351 yearsyear ended December 31, 20152019.2014.Other Liabilities5.Accounts Payable, Accrued Expenses and Other Liabilitiesthousands)thousands): December 31,
2016 December 31,
2015 Accounts payable, trade $ 13,847 $ 7,790 Accrued compensation and other 28,507 21,948 Accrued operating expenses 17,048 21,923 Total accounts payable, accrued expenses and other liabilities $ 59,402 $ 51,661 115December 31,
2019December 31,
2018Accounts payable, trade $ 12,246 $ 12,394 Accrued compensation and other 36,827 42,833 Accrued operating expenses 42,045 19,675 Current portion of lease liabilities 6,629 — Total accounts payable, accrued expenses and other liabilities $ 97,747 $ 74,902 6.Income Taxesthousands)thousands): December 31, 2016 2015 2014 December 31, Current tax expense: 2019 2018 2017 Current tax expense (benefit): Current tax expense (benefit): Federal $ 16,274 $ 25,852 $ 20,244 Federal $ 6,167 $ 2,965 $ 17,008 State 2,929 3,450 4,429 State 3,678 (1,433) 3,201 Total current tax expense: 19,203 29,302 24,673 Total current tax expense: 9,845 1,532 20,209 Deferred tax expense (benefit): Deferred tax expense (benefit): Federal (7,115 ) (12,571 ) (12,421 ) Federal 6,219 (2,650) (19,425) State (253 ) (1,449 ) 131 State 1,074 (854) (983) Total deferred tax benefit: (7,368 ) (14,020 ) (12,290 ) Total income tax expense $ 11,835 $ 15,282 $ 12,383 Total deferred tax expense (benefit): Total deferred tax expense (benefit): 7,293 (3,504) (20,408) Total income tax expense (benefit) Total income tax expense (benefit) $ 17,138 $ (1,972) $ (199) thousands)thousands): December 31, December 31, 2016 % 2015 % 2014 % 2019 % 2018 % 2017 % Computed at federal statutory rate $ 17,315 35.0 $ 13,934 35.0 $ 9,215 35.0 Computed at federal statutory rate $ 21,916 21.0 $ 11,134 21.0 $ 13,949 35.0 State and local tax expense, net of federal benefit 2,448 5.0 1,038 2.6 2,973 11.3 State and local tax expense, net of federal benefit 3,625 3.4 2,367 4.5 2,226 5.6 Net perm deduction and credit tax benefits from prior years (6,213 ) (12.6 ) - - - - Net perm deduction and credit tax benefits from current year (1,509 ) (3.1 ) - - - - Net permanent deduction and credit tax benefits from current year Net permanent deduction and credit tax benefits from current year (1,166) (1.1) (1,143) (2.2) (1,513) (3.8) Net uncertain tax positions excluding current
permanent deduction and credit benefitsNet uncertain tax positions excluding current
permanent deduction and credit benefits(937) (0.8) (3,756) (7.0) (373) (0.9) Subsidiary basis write off Subsidiary basis write off — — (3,423) (6.5) — — Equity compensation net tax windfall Equity compensation net tax windfall (8,634) (8.3) (2,890) (5.5) — — State tax apportionment changes State tax apportionment changes — — (3,737) (7.0) — — Disallowed executive compensation Disallowed executive compensation 1,750 1.6 682 1.3 — — Tax Reform - revaluation of deferrals Tax Reform - revaluation of deferrals — — — — (15,130) (38.0) Acquisition adjustments Acquisition adjustments — — (1,226) (2.3) (1,003) (2.5) Acquisition costs Acquisition costs 245 0.3 — — 697 1.7 Other, net (206 ) (0.4 ) 310 0.8 195 0.7 Other, net 339 0.3 20 — 948 2.4 Total income tax expense $ 11,835 23.9 $ 15,282 38.4 $ 12,383 47.0 Total income tax expense $ 17,138 16.4 $ (1,972) (3.7) $ (199) (0.5) Company’s effectiveCompany has current period foreign income tax rate decreased to 23.9% for the year ended December 31, 2016 from 38.4% for the year ended December 31, 2015, primarily dueexpense and includes global intangible low-taxed income as current period income tax expense, both of which are not material to the Company’s recognitionoverall financial statements.(in(in thousands):116December 31, 2019 2018 Deferred tax assets: Stock-based compensation $ 8,056 $ 9,545 Goodwill and intangible assets 5,516 5,874 Accounts receivable, net 4,442 3,537 Deferred rent — 696 Tenant improvements — 569 Liability for appeals 931 5,632 Net operating loss carry-forwards 2,644 1,527 Tax credit carry-forwards 1,815 4,076 Property and equipment 139 49 Accrued expenses and other 5,054 7,839 ROU Liability 5,799 — Total deferred tax assets 34,396 39,344 Deferred tax liabilities: Goodwill and intangible assets 42,894 43,400 Section 481(a) adjustment 2,551 5,073 Prepaid expenses 734 668 Capitalized software cost 9,068 8,688 ROU Asset 4,736 — Total deferred tax liabilities 59,983 57,829 Total net deferred tax liabilities $ 25,587 $ 18,485 December 31, 2016 2015 Deferred tax assets: Stock-based compensation $ 10,373 $ 9,059 Goodwill and intangible assets 10,711 10,449 Allowance for doubtful accounts 4,108 1,766 Deferred rent 1,120 1,119 Tenant improvements 1,226 1,392 Estimated liability for appeals 11,596 - Net operating loss carry-forwards 2,141 113 Property and equipment 79 - Accrued expenses and other 7,811 6,298 Total deferred tax assets 49,165 30,196 Deferred tax liabilities: Goodwill and intangible assets 52,729 56,790 Section 481(a) adjustment 14,757 - Property and equipment - 894 Capitalized software cost 4,396 3,473 Total deferred tax liabilities 71,882 61,157 Total net deferred tax liabilities $ 22,717 $ 30,961 liabilitiesLiabilities on the Consolidated Balance Sheets, are the total amount of unrecognized tax benefits of approximately $7.4$4.2 million and $1.3$4.8 million as of December 31, 20162019 and 2015,2018, respectively, (netnet of the federal benefit for state issues)issues that, if recognized, would favorably affect the Company’s future effective tax rate. Also included in Other Liabilities on the Consolidated Balance Sheets are accrued liabilities for interest expense and penalties related to unrecognized tax benefits of $0.6$0.7 million and $0.4$0.7 million as of December 31, 20162019 and 2015,2018, respectively. HMS includes interest expense and penalties in the provision for income taxes in the Consolidated Statements of Income. The amount of interest expense, (netnet of federal and state income tax benefits)benefits, and penalties in the Consolidated Statements of Income for the years ended December 31, 2016, 20152019, 2018, and 20142017 was $0.2$0.04 million, $0.6$0.1 million and $0.4$0.02 million, respectively. The Company believes it is reasonably possible the amount of unrecognized tax benefits may decrease by $0.9$1.7 million during 2017,2020, due to the expiration of the statute of limitations in various state jurisdictions. December 31, 2016 2015 2019 2018 Unrecognized tax benefits at January 1 $ 1,329 $ 1,329 Unrecognized tax benefits at January 1 $ 4,839 $ 8,234 Additions for tax positions taken during prior periods 763 565 Additions for tax positions taken during prior periods 543 399 Additions for tax positions taken during current period including amended prior years 5,931 - Additions for tax positions taken during current period including amended prior years 409 360 Reductions relating to settlements with taxing authorities Reductions relating to settlements with taxing authorities — (2,227) Reductions related to the expiration of statutes of limitations (590 ) (565 ) Reductions related to the expiration of statutes of limitations (1,542) (1,927) Unrecognized tax benefits at December 31 $ 7,433 $ 1,329 Unrecognized tax benefits at December 31 $ 4,249 $ 4,839 $5.9$0.4 million during the year ended December 31, 2016,2019, related to tax benefits recognized associated with R&Dfor current period U.S. Research and Experimentation Tax Credits and thepursuant to IRC Section 199 Deduction for all open tax years.2016,2019, HMS had federal and state pre-tax net operating loss and tax credit carryforwards of approximately $13.8$30.3 million and $1.8 million, respectively, which will be available to offset future taxable income. If not used, these net operating loss and tax credit carryforwards will begin to expire betweenin 2020 and 2036.The2028, respectively. The Company files income tax returns with the U.S. Federal government and various state jurisdictions.and local jurisdictions and will file income tax returns in certain foreign jurisdictions as a result of its acquisition of VitreosHealth. HMS is generally no longer subject to U.S. Federal income tax examinations for years before 2012. The Company received notification the Internal Revenue Service intends to audit years 2013 and 2014.2013. HMS operates in a number of state, foreign and local jurisdictions, most of which have never audited the Company’s records.jurisdictions. Accordingly, HMS is subject to state, local, and localforeign income tax examinations based uponon the various statutes of limitations in each jurisdiction. The Company is currently beingPreviously recognized Texas refund claims were examined by the State of New York.
state and resulted in a favorable apportionment method change for all open tax years.1177.Credit AgreementDuring the years ended December 31, 2016 and 2015, no principal payments were made against8. Liability for Appealsrevolving credit facility. contracts with certain commercial health plan customers and its Medicare Recovery Audit Contractor (“RAC”) contract with the Centers for Medicare & Medicaid Services (“CMS”) (included within the Company’s payment integrity services revenue), providers have the right to appeal HMS claim findings and to pursue additional appeals if the initial appeal is found in favor of HMS’s customer.$197.8 million principal balanceappeal process established under the Medicare RAC contracts with CMS includes five levels of appeals, and resolution of appeals can take substantial time to resolve. HMS records a) an actual return obligation liability for findings which have been previously adjudicated in favor of providers and b) an estimated return obligation liability based on the amount of revenue that is subject to appeals and which are probable of being adjudicated in favor of providers following their successful appeal. The Company’s estimate is based on the Company’s historical experience. To the extent the amount to be returned to providers following a successful appeal exceeds or is less than the amount recorded, revenue in the applicable period would be reduced or increased by such amount.revolvingactivity in the liability for appeals is as follows (in thousands):Original
RAC contractRAC 4
contractCommercial
contractsTotal Balance at December 31, 2017 $ 27,816 $ — $ 2,971 $ 30,787 Provision 108 20 2,038 2,166 Appeals found in providers favor (108) — (2,686) (2,794) Release of estimated liability (8,436) — — (8,436) Balance at December 31, 2018 $ 19,380 $ 20 $ 2,323 $ 21,723 Provision — 2,026 7,347 9,373 Appeals found in providers favor — (440) (7,706) (8,146) Release of estimated liability (19,380) — — (19,380) Balance at December 31, 2019 $ — $ 1,606 $ 1,964 $ 3,570 facility is due in May 2018. The Company has commenced discussions to extend or refinanceagreement (as amended and restated, the revolving credit facility.providesoriginally provided for an initial $500 million five-year revolving credit facility and, under specified circumstances,maturing on May 3, 2018.can be increased by five years to December 2022 (the "Amended Revolving Facility"). The availability of funds under the Amended Revolving Facility includes sublimits for (a) up to $50 million for the issuance of letters of credit and (b) up to $25 million for swingline loans. In addition, the Company may increase the commitments under the Amended Revolving Facility and/or add one or more incremental term loan facilities, can be added, provided that thesuch incremental credit facilities do not exceed in the aggregate the sum of (a) $75(i) the greater of $120 million plus (b)and 100% of Consolidated EBITDA (as defined in the Credit Agreement) and (ii) an additional amount not less than $25 million, so long as the total securedour first lien leverage ratio calculated giving(as defined in the Credit Agreement) on a pro forma effect to the requested incremental borrowing and other customary and appropriate pro forma adjustment events, including any permitted acquisitions,basis is nonot greater than 2.5:1.0. The Company’s obligations3.00:1.00, subject to obtaining commitments from the lenders and any amountsmeeting certain other conditions.are guaranteed bywill bear interest at a rate equal to, at the Company’s material 100% owned subsidiaries and securedelection (except with respect to swingline borrowings, which will accrue interest based only at the base rate), either:a security interest in allreference to the greatest of (a) the prime or substantially allbase commercial lending rate of the Company’sadministrative agent as in effect on the relevant date, (b) the federal funds effective rate plus 0.50% and (c) the one-month London Interbank Offered Rate (or any successor rate determined in accordance with the Credit Agreement) subsidiaries’ physical assets.The Credit Agreement requires the Company to comply with certain principal financial covenants and other covenants, including a maximum consolidated leverage ratio reducing from 3.50:1.00 to 3.25:1.00 overfor the next five years and a minimum interest coverage ratio of 3.00:1.00. See Note 14 – “Subsequent Events” in our Notesapplicable period; orConsolidated Financial Statements under Item 8. Consolidated Financial Statements and Supplementary DataLIBO Rate for additional information regarding the amendmentapplicable interest period multiplied by the statutory reserve rate (equal to our Credit Agreement.The(x) one divided by (y) one minus the aggregate of the maximum reserve percentage (including any marginal, special, emergency or supplemental reserves) established by the Board of Governors of the Federal Reserve System of the United States), rates applicablemargin ranging from 1.50% to the revolving credit facility are, at2.00% based on the Company’s option, either:a)the LIBOR multiplied by the statutory reserve rate plus an interest margin ranging from 1.50% to 2.25% based on the Company’s consolidated leverage ratio, orb)a base rate (which is equal to the greatest of (i) Citibank’s prime rate, (ii) the federal funds effective rate plus 0.50% and (iii) the one-month LIBOR plus 1.00% plus an interest margin ranging from 0.50% to 1.25% based on the Company’s consolidated leverage ratio.HMS pays anconsolidated leverage ratio for the applicable period.feefees on the revolving credit facilityAmended Revolving Facility during the term of the Credit Agreement ranging from 0.375% to 0.50%0.250% per annum based on the Company’s consolidated leverage ratio.Interest expenseratio and the commitmentletter of credit fees equal to 0.125% per annum on the unused portionaggregate face amount of the Company’s revolvingeach letter of credit, facility are as follows (in thousands): December 31, 2016 2015 2014 Interest expense $ 4,837 $ 4,117 $ 4,186 Commitment fees $ 1,518 $ 1,513 $ 1,465 At December 31, 2016 and 2015, the unamortized balance of deferred financing costs was $2.8 million and $4.9 million, respectively. HMS amortized $2.1 million in December 31, 2016, 2015 and 2014, respectively, of interest expense related to the Company’s deferred financing costs.$3.0$6.5 million, which was establishedis issued against the existingAmended Revolving Facility and expires June 30, 2020.facility. On May 1,facility were as follows (in thousands):Years ended December 31, 2019 2018 2017 Interest expense $ 9,460 $ 9,294 $ 7,170 Commitment fees 638 1,189 1,359 the expiration date of the letter of credit was extended to April 26, 2018.
respectively.1188.EquityJuly 30, 2015, the Company’sNovember 1, 2019, our Board of Directors approved a new $50.0 million share repurchase program authorizingto replace the repurchase of up to $75 million of the Company’s common stock from time to time on the open market or in privately negotiated transactions. Theprevious share repurchase program, is authorized through July 30, 2017,which expired in November 2019 and may be suspended or discontinuedhad $29.9 million remaining at any time. Repurchasedthe time of expiration. We did not repurchase shares will be available for use in connection with issuance under the Company’s stock plans and for other corporate purposes. Repurchases may also be made under a Rule 10b5-1 plan, which would permit shares to be repurchased when HMS might otherwise be precluded from doing so under insider trading laws. The timing and amount of any shares repurchased under the program will be determined by management based on its evaluation of market conditions and other factors. During the year ended December 31, 2016, the Company repurchased $20 million of the Company’s common stock pursuant to this authorization and 10b5-1 plans. All repurchases were made using cash resources.Following are the Company’s monthly stock repurchases for the fourth quarter ofduring fiscal year 2016, all2019.Period Total Number of
Shares
Purchased Average
Price Paid
Per Share Total Number of
Shares
Purchased as
Part of Publicly
Announced
Program(1) Approximate
Dollar Value of
Shares That
May Yet Be
Purchased Under
the ProgramOctober 1, 2016 to October 31, 2016 — $ — — $ — November 1, 2016 to November 30, 2016 570,717 17.61 570,717 15,000,000 December 1, 2016 to December 31, 2016 569,615 18.25 569,615 5,000,000 October 1, 2016 to December 31, 2016 1,140,332 $ 17.93 1,140,332 $ 5,000,000 (1)Represents shares repurchased through the Company’s Share Repurchase Program publicly announced in August 2015.(b) Preferred Stock2016, no2019, 0 preferred stock had been issued.9.Employee Benefit Plan2016, 20152019 and 20142018, HMS matched 100% of the first 4% of pay contributed by each eligible employee and 50% of the next 1% of pay contributed. During 2017, HMS matched 100% of the first 3% of pay contributed by each eligible employee and 50% on the next 2% of pay contributed. These matching contributions vest immediately and are not in the form of the Company’s common stock.2016, 20152019, 2018 and 2014,2017, HMS contributed $4.8$7.7 million, $4.8$7.3 million and $5.0$5.9 million, respectively, to the 401(k) Plan in the form of matching contributions.11910.Stock-Based Compensationlong-termlong- term incentive award plans was as follows (in(in thousands): December 31, 2016 2015 2014 Cost of services-compensation $ 3,805 $ 6,242 $ 5,075 Selling, general and administrative 9,472 8,055 8,280 Total $ 13,277 $ 14,297 $ 13,355 120Years ended December 31, 2019 2018 2017 Cost of services-compensation $ 8,887 $ 7,421 $ 7,354 Selling, general and administrative 13,014 14,086 16,789 Total $ 21,901 $ 21,507 $ 24,143 $6.9$8.9 million, $6.4$9.6 million and $7.6$10.3 million for the years ended December 31, 2016, 20152019, 2018 and 2014,2017, respectively.2016 2019 (in thousands, except for weighted average exercise price and weighted average remaining contractual terms): Shares Weighted
Average
Exercise
Price Weighted
Average
Remaining
Contractual
Terms Aggregate
Intrinsic
ValueOutstanding at December 31, 2015 5,030 $ 17.37 Number of Options Weighted
Average
Exercise
PriceWeighted
Average- Remaining
Contractual
TermsAggregate-
Intrinsic
ValueOutstanding balance at December 31, 2018 Outstanding balance at December 31, 2018 4,402 $ 17.07 Granted 1,078 14.07 Granted 640 38.61 Exercised (511 ) 7.03 Exercised (2,436) 16.20 Forfeitures (67 ) 17.76 Forfeitures (187) 21.21 Expired (339 ) 22.67 Expired (8) 23.59 Outstanding at December 31, 2016 5,191 17.35 5.00 $ 12,854 Outstanding balance at December 31, 2019 Outstanding balance at December 31, 2019 2,411 23.43 7.28 $ 20,242 Expected to vest at December 31, 2016 2,207 15.22 5.72 7,219 Exercisable at December 31, 2016 2,150 $ 20.25 4.02 $ 3,042 Expected to vest at December 31, 2019 Expected to vest at December 31, 2019 1,070 $ 28.20 8.5 $ 5,979 Exercisable at December 31, 2019 Exercisable at December 31, 2019 968 $ 17.08 5.6 $ 12,121 weighted-average grant-dateweighted-average-grant-date fair value per share of the stock options granted during the years ended December 31, 2016, 20152019, 2018 and 20142017 was $5.55, $5.37$13.86, $7.52 and $7.59,$7.66, respectively. The weighted-average-grant-date fair value per share of stock options vested during the year ended December 31, 2019 was $7.36. The weighted-average-grant-date fair value per share of the stock options forfeited during the years ended December 31, 2019, 2018 and 2017 was $7.94, $6.86 and $5.24, respectively.model and weighted–model. Weighted–average assumptions are set forth in the following table: December 31, Year ended December 31, 2019 2016 2015 2014 2019 2018 2017 Expected dividend yield 0 % 0 % 0 % Expected dividend yield — % — % — % Risk-free interest rate 1.20 % 1.54 % 1.57 % Risk-free interest rate 2.5 % 2.7 % 1.8 % Expected volatility 44.01 % 40.62 % 38.18 % Expected volatility 41.1 % 42.4 % 44.2 % Expected life (years) 4.90 4.89 4.82 Expected life (years) 6.4 6.0 5.0 Year ended December 31, 2019 2018 2017 Expected dividend yield — % — % — % Risk-free interest rate — % — % 2.2 % Expected volatility — % — % 52.5 % Expected life (years) 0 0 6.5 2016, 20152019, 2018 and 2014,2017, the Company issued 510,512, 577,5592,435,648, 2,017,442 and 516,552172,326 shares, respectively, of the Company’s common stock upon the exercise of outstanding stock options and received proceeds of $2.9$39.3 million, $4.2$38.4 million and $4.1$2.7 million, respectively. The total intrinsic value of stock options exercised during the years ended December 31, 2016, 20152019, 2018 and 20142017 was $6.3$45.6 million, $5.9$27.6 million and $6.5$0.5 million, respectively.2016,2019, there was approximately $12.7$4.3 million of total unrecognized compensation cost related to stock options outstanding, which is expected to be recognized over a weighted average period of 1.050.8 years.The excess tax benefit from the exercise of stock options for the years ended December 31, 2016, 2015 and 2014 was $1.9 million, $1.6 million and $1.8 million, respectively.121$6.4$13.0 million, $7.9$11.9 million and $5.7$13.8 million for the years ended December 31, 2016, 20152019, 2018 and 2014,2017, respectively.2016 2019 (in thousands, except for weighted average grant date fair value per unit)unit): Number of
Units Weighted Average
Grant Date Fair
Value per UnitOutstanding balance at December 31, 2015 1,154 $ 18.85
Number of UnitsWeighted Average
Grant Date Fair
Value per UnitOutstanding balance at December 31, 2018 Outstanding balance at December 31, 2018 1,488 $ 17.60 Granted 637 14.26 Granted 487 34.02 Vesting of restricted stock units, net of units withheld for taxes (193 ) 18.64 Vesting of restricted stock units, net of units withheld for taxes (406) 16.65 Units withheld for taxes (102 ) 18.64 Units withheld for taxes (201) 16.65 Forfeitures (83 ) 16.95 Forfeitures (129) 21.32 Outstanding balance at December 31, 2016 1,413 $ 16.44 Outstanding balance at December 31, 2019 Outstanding balance at December 31, 2019 1,239 $ 21.37 2016, 1,231,7362019, 974,050 restricted stock units remained unvested and there was approximately $14.1$9.9 million of unrecognized compensation cost related to restricted stock units, which is expected to be recognized over a weighted average vesting period of 0.920.84 years. During the years ended December 31, 2019, 2018 and 2017, the Company’s vested restricted stock units had a fair value of $10.7 million, $9.9 million, and $9.5 million, respectively. The weighted average grant date fair value per share of the restricted stock units vested during the years ended December 31, 2019, 2018 and 2017 was $16.65, $17.06 and $15.39, respectively. The weighted average grant date fair value per share of the restricted stock units forfeited during the years ended December 31, 2019, 2018 and 2017 was $21.32, $17.31 and $15.37, respectively.11.Earnings per Sharedata)amounts): Years ended December 31, 2016 2015 2014 Net income $ 37,636 $ 24,527 $ 13,947 Weighted average common shares outstanding-basic 84,221 87,881 87,673 Plus: net effect of dilutive stock options and restricted common shares 2,766 480 491 Weighted average common shares outstanding-diluted 86,987 88,361 88,164 Net income per common share-basic $ 0.45 $ 0.28 $ 0.16 Net income per common share-diluted $ 0.43 $ 0.28 $ 0.16 Years ended December 31 2019 2018 2017 Net income $ 87,224 $ 54,989 $ 40,054 Weighted average common shares outstanding-basic 87,222 83,625 83,821 Plus: net effect of dilutive stock options and restricted stock units 2,095 2,519 1,267 Weighted average common shares outstanding-diluted 89,317 86,144 85,088 Net income per common share — basic $ 1.00 $ 0.66 $ 0.48 Net income per common share — diluted $ 0.98 $ 0.64 $ 0.47 2016, 20152019, 2018 and 2014, 2,070,771, 3,480,4582017: (i) 509,617, 804,959 and 2,442,6282,646,100 stock options, respectively, were not included in the diluted earnings per share calculation because the effect would have been anti-dilutive. For the years ended December 31, 2016, 2015 and 2014,(ii) restricted stock units representing 46,651, 305,9992,564, 0 and 90,90531,155 shares of common stock, respectively, were not included in the diluted earnings per share calculation because the effect would have been anti-dilutive.12. and Contingencies(a) Lease CommitmentsThe Company leases office space, data processing equipment and software licenses under operating leases that expire on various dates through 2024. The lease agreements provide for rent escalations. Lease expense, exclusive of sublease income, for the year ended December 31, 2016, 2015 and 2014 was $5.0 million, $5.4 million and $6.9 million, respectively. Lease and sublease income was approximately $27,000, $25,000 and $42,000 for the years ended December 31, 2016, 2015 and 2014, respectively.
Contingencies122Minimum annual lease payments to be made both under capital leases and operating leases, net of nominal sublease payments to be received for each of the next five years ending December 31 and thereafter are as follows (in thousands): Capital Lease Payments Operating Lease Payments 2017 $ 4 $ 16,077 2018 - 6,304 2019 - 4,294 2020 - 3,815 2021 - 3,226 Thereafter - 4,852 Total 4 $ 38,568 Less: Interest - Total $ 4 (b) LitigationDennis Demetre and Lori Lewis: In July 2012, Dennis Demetre and Lori Lewis (the “Plaintiffs”), filed an action in the Supreme Court of the State of New York against HMS Holdings Corp., claiming an undetermined amount of damages alleging that various actions by HMS unlawfully deprived the Plaintiffs of the acquisition earn-out portion of the purchase price for Allied Management Group Special Investigation Unit, Inc. (“AMG”) under the applicable Stock Purchase Agreement (the “SPA”) and that HMS had breached certain contractual provisions under the SPA. The Plaintiffs filed a second amended complaint with two causes of action for breach of contract and one cause of action for breach of implied covenant of good faith and fair dealing. HMS asserted a counterclaim against Plaintiffs for breach of contract based on contractual indemnification costs, including attorneys’ fees arising out of the Company’s defense of AMG in Kern Health Systems v. AMG, Dennis Demetre and Lori Lewis (the “California Action”), which are recoverable under the SPA. Mediation took place in September 2014 but the matter was not resolved.SPA. In June 2016, Kern Health Systems and AMG entered into a settlement agreement that resolved all claims in the California Action.January 2016, HMS movedJuly 2017, the Court issued a decision on the Company’s motion for partial summary judgment on its counterclaim for breachand granted the motion in part, dismissing one of contract and for summary judgment on the Plaintiffs’ breach of contract causes of action against HMS (HMS did not move for summary judgmentHMS. On November 3, 2017, following a jury trial, a verdict was returned in favor of the Plaintiffs on Plaintiffs’a breach of implied covenantcontract claim, and the jury awarded $60.0 million in damages to the Plaintiffs. On March 14, 2018, the Court held a hearing on the Company’s post-trial motion for an order granting it judgment notwithstanding the verdict or, alternatively, setting aside the jury’s award of good faith and fair dealing claim). The motions were argued ondamages. On June 22, 2016. A27, 2018, prior to the Court issuing a decision on the motionsmotion, the Company entered into a Settlement Agreement (the “Settlement Agreement”) with the Plaintiffs, John Alfred Lewis and Christopher Brandon Lewis. Pursuant to the terms of the Settlement Agreement, the Company paid $20.0 million to resolve all matters in controversy pertaining to the lawsuit. On July 5, 2018, the Court entered an order to discontinue the lawsuit pursuant to the Stipulation of Discontinuance with Prejudice filed by the parties.yet been issued byreceived any further requests from the government in connection with this CID.and a trial date has not been set. HMSheard oral arguments on the Company's motion to dismiss the complaint. The motion remains pending before the Court. The Company continues to believe that the Plaintiffs’ claims arethis claim is without merit and will continueintends to vigorously defend against them.Shareholder Proceedings: On March 3, 2017, a putative securities class action was filed in the Federal District Court for the Districtthis matter.123liability.13.Customer ConcentrationStates.2016, 20152019, 2018 and 20142017 no one individual Company customer accounted for more than 10% of the Company’s total revenue.2016, 20152019, 2018 and 2014,2017, the Company’s ten largest customers represented 40.6%42.7%, 44.0%41.4% and 40.1%39.5% of HMS’ total revenue, respectively. TheExcluding those contracts that contain automatic renewal provisions or evergreen terms, the Company’s agreements with the ten current largest customers generally expire between 20172020 and 2020.2026. In many instances, HMS provides services pursuant to agreements that may be renewed or subject to a competitive reprocurement process. Several of the Company’s contracts, including those with some of its largest customers, may be terminated for convenience.14.Subsequent Events(a) Credit AgreementOn March 8, 2017, Amendment No. 1 to the Credit Agreement was executed which amended, among other things, the Company’s requirement to furnish to Citibank, N.A., as administrative agent, and the lenders party to the Credit Agreement, financial statements and other information within 90 daysthe fiscal year end to 180 dayslease expense for the fiscal year ended December 31, 2016. These financial statements include2019 were as follows (in thousands):Year ended December 31, 2019 Operating lease cost $ 6,625 Finance lease cost: Amortization of right-of-use assets $ 202 Interest on lease liabilities 25 Total finance lease cost $ 227 audited consolidatedyear ended December 31, 2019 were as follows (in thousands):Year ended December 31, 2019 Cash paid for amounts included in measurement of lease liabilities: Operating cash flows from operating leases $ 7,402 Operating cash flows from finance leases $ 24 Financing cash flows from finance leases $ 195 Right-of-use assets obtained in exchange for new lease liabilities: Operating leases $ 1,181 Finance leases $ 1,820 andinformation related statementsto leases as of income, stockholders’ equity and cash flowsDecember 31, 2019 consisted of the Companyfollowing (in thousands):Year ended December 31, 2019 Operating Leases Operating lease right-of-use assets $ 17,493 Other current liabilities $ 6,269 Operating lease liabilities 14,881 Total operating lease liabilities $ 21,150 Finance Leases Other Assets $ 1,081 Other current liabilities $ 360 Other long-term liabilities 677 Total finance leases liabilities $ 1,037 its subsidiaries.(b) Eliza Holding Corp. AcquisitionOn April 17, 2017,finance leases was 4.1 years and 2.6 years, respectively. As of December 31, 2019, the Company completed its previously announced acquisitionweighted-average discount rates were 5.7% and 4.6% for operating and finance leases, respectively.Eliza Holding Corp. (“Eliza”lease liabilities were as follows (in thousands), a Delaware Company, pursuant:Year ended December 31, Operating Leases Finance Leases 2020 $ 7,266 $ 399 2021 5,791 454 2022 3,546 246 2023 3,319 — 2024 2,833 — Thereafter 991 — Total lease payments 23,746 1,099 Less: Imputed interest 2,596 62 Total lease obligation $ 21,150 $ 1,037 an Agreement and Plan of Merger dated March 10, 2017 (the “Merger Agreement”), for a cash purchase price of approximately $172.0 million, after adjustments for working capital, cash, transaction expenses and indebtedness. The acquisition was funded with available liquidity, consisting of approximately 75% cash on hand and approximately 25% of borrowings under the Company’s credit facility. The purchase price is subjectperiods prior to certain post-closing purchase price adjustments.The Merger Agreement was entered into by and among the Company, Echo Acquisition Sub, Inc., a Delaware corporation and an indirect wholly owned subsidiaryadoption of the Company (the “Merger Sub”), Eliza, and Parthenon Investors III, L.P., a Delaware limited partnership, solely in its capacity as the representativeNew Lease Standardequity holders of Eliza. Under the termseach of the Merger Agreement,next five years ending December 31 and thereafter were as follows (in thousands):Year ended December 31, Operating Leases 2019 $ 5,778 2020 5,420 2021 3,742 2022 2,531 2023 2,236 Thereafter 2,947 Total lease payments $ 22,654 Merger Sub merged with and into Eliza (the “Merger”) and Eliza continued as the surviving corporation becoming an indirect wholly owned subsidiaryCompensation Committee of the Company.
Board of Directors approved approximately $24.5 million in stock option and restricted stock unit awards to employees. The awards generally will vest over three years and will be issued three business days subsequent to the filing of this 2019 Form 10-K.124The Merger Agreement contains customary representations, warranties and covenants. The Merger Agreement also contains indemnification provisions that are subject to specified limitations, including recourse to a representation and warranty insurance policy for certain losses.these auditedour consolidated financial statements, an evaluation of subsequent events was performed through the date these audited consolidated financial statementsof filing and there were issued and, other than the events above, there are no other events that have occurred that would require adjustments or disclosure to the Company’s audited consolidated financial statements.15.Quarterly Financial Data (Unaudited)Year ended December 31, 2016 First
Quarter Second
Quarter Third
Quarter Fourth
Quarter2019 2019 First
QuarterSecond Quarter Third
QuarterFourth
QuarterYear Ended Revenue $ 119,763 $ 123,550 $ 124,604 $ 125,590 Revenue $ 147,953 $ 168,182 $ 146,815 $ 163,445 $ 626,395 Gross profit Gross profit $ 48,952 $ 68,584 $ 45,296 $ 54,849 $ 217,681 Operating income $ 9,909 $ 16,352 $ 12,650 $ 18,758 Operating income $ 19,706 $ 40,548 $ 17,064 $ 25,698 $ 103,016 Net income $ 4,560 $ 8,566 $ 13,508 $ 11,002 Net income $ 19,642 $ 29,100 $ 21,136 $ 17,346 $ 87,224 Net income per common share - basic $ 0.05 $ 0.10 $ 0.16 $ 0.14 Net income per common share - basic $ 0.23 $ 0.34 $ 0.24 $ 0.20 $ 1.00 Net income per common share - diluted $ 0.05 $ 0.10 $ 0.16 $ 0.12 Net income per common share - diluted $ 0.22 $ 0.33 $ 0.24 $ 0.20 $ 0.98 Revenue, as reported $ 119,763 $ 123,550 $ 124,604 $ 125,590 Revenue, as revised $ 119,758 $ 121,512 $ 122,860 Selling, general and administrative expenses, as reported $ 22,930 $ 22,227 $ 24,875 $ 23,136 Selling, general and administrative expenses, as revised $ 22,925 $ 20,189 $ 23,131 During2018 First
Quarter Second Quarter Third
Quarter Fourth
Quarter Year Ended Revenue $ 141,425 $ 146,791 $ 154,246 $ 155,828 $ 598,290 Gross profit $ 43,920 $ 45,769 $ 52,409 $ 54,582 $ 196,680 Operating income/(loss) $ 11,922 $ (763) $ 24,231 $ 27,848 $ 63,238 Net income/(loss) $ 6,391 $ (3,367) $ 18,574 $ 33,391 $ 54,989 Net income/(loss) per common share - basic $ 0.08 $ (0.04) $ 0.22 $ 0.40 $ 0.66 Net income/(loss) per common share - diluted $ 0.07 $ (0.04) $ 0.22 $ 0.38 $ 0.64 fourthCompany's sale of its investment in InstaMed, as described in Note 5(c).of 2016,2018 results include the Company identified a material weakness in accounting for its accounts receivable allowance, resulting in overstatements of revenue and of selling, general and administrative expensesCompany's entry into the Settlement Agreement for the quarters ended March 31, 2016payment of $5,050, June 30, 2016$20.0 million, as described in Note 14.1252016, 20152019, 2018 and 20142016, 20152019, 2018 and 20142017 are as follows:receivable allowance Receivable Allowance (in thousands): Balance at
Beginning of Year Provision Recoveries Charge-offs Balance at
End of YearYear ended December 31, 2014 $ 15,899 12,861 (17 ) (19,384 ) $ 9,359 Year ended December 31, 2015 $ 9,359 8,046 (100 ) (5,841 ) $ 11,464 Year ended December 31, 2016 $ 11,464 21,583 108 (22,383 ) $ 10,772 Balance at Beginning of
YearProvision Recoveries Charge-offs Balance at End of Year Year ended December 31, 2017 $ 10,772 $ 20,233 $ — $ (16,206) $ 14,799 Year ended December 31, 2018 14,799 20,453 — (21,569) 13,683 Year ended December 31, 2019 13,683 22,289 — (18,890) 17,082 Balance at Beginning of Year Provision Appeals found in providers favor Balance at End of Year Year ended December 31, 2014 $ 19,853 1,459 (1,998 ) $ 19,314 Year ended December 31, 2015 $ 19,314 2,610 (9,123 ) $ 12,801 Year ended December 31, 2016 $ 12,801 721 (2,396 ) $ 11,126 Balance at Beginning of
YearProvision Appeals found in
providers favorRelease of estimated
liabilityBalance at End of Year Year ended December 31, 2017 $ 11,126 $ 83 $ (2,665) $ — $ 8,544 Year ended December 31, 2018 8,544 — (108) (8,436) — Year ended December 31, 2019 — — — — — See Note 1 - "Business and Summary of Significant Accounting Policies" in our Notes to the Consolidated Financial Statements under Item 8. Consolidated Financial Statements and Supplementary Data for additional information regarding the estimated liability for appeals.126HMS HOLDINGS CORP. AND SUBSIDIARIESExhibit IndexWhere an exhibit is filed by incorporation by reference to a previously filed registration statement or report, such registration statement or report is identified after the description of the exhibit.ExhibitNumberDescription2.1Agreement and Plan of Merger among Health Management Systems, Inc., HMS Holdings Corp. and HMS Acquisition Corp. dated December 16, 2002 (incorporated by reference to Exhibit A to HMS Holdings Corp.’s Prospectus and Proxy Statement (Reg No. 333-100521) as filed with the SEC on January 24, 2003)2.2Agreement and Plan of Merger, between the HMS Holdings Corp., a Delaware corporation and HMS Holdings Corp., a New York corporation dated July 17, 2013 (incorporated by reference to Exhibit 2.1 to HMS Holding Corp.'s Current Report on Form 8-K/12g-3 (File No. 000-50194) as filed with the SEC on July 23, 2013)3.1Conformed copy of Certificate of Incorporation of HMS Holdings Corp., as amended through July 9, 2015 (incorporated by reference to Exhibit 3.1 to HMS Holding Corp.'s Quarterly Report on Form 10-Q (File No. 000-50194) as filed with the SEC on August 10, 2015)3.2Amended and Restated Bylaws of HMS Holdings Corp. dated May 4, 2016 (incorporated by reference to Exhibit 3.2 to HMS Holdings Corp.’s Current Report on Form 8-K (File No. 000-50194) as filed with the SEC on May 5, 2016)4.1Specimen Common Stock Certificate (incorporated by reference to Exhibit 4.1 to HMS Holding Corp.'s Current Report on Form 8-K/12g-3 (File No. 000-50194) as filed with the SEC on July 23, 2013)4.2See Exhibits 3.1 and 3.2 for provisions defining the rights of holders of common stock of HMS Holdings Corp.10.1†HMS Holdings Corp. Fourth Amended and Restated 2006 Stock Plan (the “2006 Stock Plan”) (incorporated by reference to Exhibit 3.1 to HMS Holdings Corp.’s Current Report on Form 8-K (File No. 000-50194) as filed with the SEC on July 12, 2011)10.2†Amendment No. 1 to the 2006 Stock Plan (incorporated by reference to Exhibit 10.6 to HMS Holdings Corp.’s Annual Report on Form 10-K (File No. 000-50194) as filed with the SEC on February 29, 2012)10.3†Form of 2010 Director Non-Qualified Stock Option Agreement under the 2006 Stock Plan (incorporated by reference to Exhibit 10.2 to HMS Holdings Corp.’s Quarterly Report on Form 10-Q (File No. 000-50194) as filed with the SEC on November 8, 2010)10.4†Form 2010 Employee Non-Qualified Stock Option Agreement under the 2006 Stock Plan (incorporated by reference to Exhibit 10.4 to HMS Holdings Corp.’s Quarterly Report on Form 10-Q (File No. 000-50194) filed with the SEC on November 8, 2010)10.5†Form of 2011 Director Non-Qualified Stock Option Agreement under the 2006 Stock Plan (incorporated by reference to Exhibit 10.16 to HMS Holdings Corp.’s Annual Report on Form 10-K (File No. 000-50194) as filed with the SEC on February 29, 2012)10.6†Form of 2011 Employee Non-Qualified Stock Option Agreement under the 2006 Stock Plan (incorporated by reference to Exhibit 10.18 to HMS Holdings Corp.’s Annual Report on Form 10-K (File No. 000-50194) as filed with the SEC on February 29, 2012)10.7†Form of 2012 Director Non-Qualified Stock Option Agreement under the 2006 Stock Plan (incorporated by reference to Exhibit 10.20 to HMS Holdings Corp.’s Annual Report on Form 10-K (File No. 000-50194) as filed with the SEC on March 1, 2013)10.8†Form of 2012 Executive Non-Qualified Stock Option Agreement under the 2006 Stock Plan (incorporated by reference to Exhibit 10.22 to HMS Holdings Corp.’s Annual Report on Form 10-K (File No. 000-50194) as filed with the SEC on March 1, 2013)127ExhibitNumberDescription10.9†Form of 2013 Executive Restricted Stock Unit Agreement under the 2006 Stock Plan (incorporated by reference to Exhibit 10.24 to HMS Holdings Corp.’s Annual Report on Form 10-K (File No. 000-50194) as filed with the SEC on March 1, 2013)10.10†Form of 2013 Director Non-Qualified Stock Option Agreement under the 2006 Stock Plan (incorporated by reference to Exhibit 10.1 to HMS Holding Corp.’s Quarterly Report on Form 10-Q (File No. 000-50194) as filed with the SEC on May 12, 2014)10.11†Form of 2013 Executive Non-Qualified Stock Option Agreement under the 2006 Stock Plan (incorporated by reference to Exhibit 10.3 to HMS Holding Corp.’s Quarterly Report on Form 10-Q (File No. 000-50194) as filed with the SEC on May 12, 2014)10.12†Form of March 2014 Executive Restricted Stock Unit Agreement under the 2006 Stock Plan (incorporated by reference to Exhibit 10.4 to HMS Holding Corp.’s Quarterly Report on Form 10-Q (File No. 000-50194) as filed with the SEC on May 12, 2014)10.13†Form of November 2014 Executive Restricted Stock Unit Agreement under the 2006 Stock Plan (incorporated by reference to Exhibit 10.1 to HMS Holding Corp.’s Quarterly Report on Form 10-Q (File No. 000-50194) as filed with the SEC on November 10, 2014) 10.14†Form of 2014 Director Non-Qualified Stock Option Agreement under the 2006 Stock Plan (incorporated by reference to Exhibit 10.26 to HMS Holding Corp.’s Annual Report on Form 10-K (File No. 000-50194) as filed with the SEC on March 2, 2015)10.15†Form of 2014 Executive Non-Qualified Stock Option Agreement under the 2006 Stock Plan (incorporated by reference to Exhibit 10.28 to HMS Holding Corp.’s Annual Report on Form 10-K (File No. 000-50194) as filed with the SEC on March 2, 2015)10.16†Form of March 2015 Executive Non-Qualified Stock Option Agreement under the 2006 Stock Plan (incorporated by reference Exhibit 10.1 to HMS Holding Corp.'s Quarterly Report on Form 10-Q (File No. 000-50194) as filed with the SEC on May 11, 2015)10.17†Form of March 2015 Executive Restricted Stock Unit Agreement under the 2006 Stock Plan (incorporated by reference Exhibit 10.2 to HMS Holding Corp.'s Quarterly Report on Form 10-Q (File No. 000-50194) as filed with the SEC on May 11, 2015)10.18†Form of 2015 Director Non-Qualified Stock Option Agreement under the 2006 Stock Plan (incorporated by reference to Exhibit 10.21 to HMS Holdings Corp.’s Annual Report on Form 10-K (File No. 000-50194) as filed with the SEC on March 1, 2016)10.19†Form of 2015 Director Restricted Stock Unit Agreement under the 2006 Stock Plan (incorporated by reference to Exhibit 10.22 to HMS Holdings Corp.’s Annual Report on Form 10-K (File No. 000-50194) as filed with the SEC on March 1, 2016)10.20†Form of November 2015 Executive Non-Qualified Stock Option Agreement under the 2006 Stock Plan (incorporated by reference to Exhibit 10.23 to HMS Holdings Corp.’s Annual Report on Form 10-K (File No. 000-50194) as filed with the SEC on March 1, 2016)10.21†Form of 2016 Executive and Senior Vice President Non-Qualified Stock Option Agreement under the 2006 Stock Plan (incorporated by reference to Exhibit 10.1 to HMS Holdings Corp.’s Quarterly Report on Form 10-Q (File No. 000-50194) as filed with the SEC on May 10, 2016)10.22†Form of 2016 Executive and Senior Vice President Restricted Stock Unit Agreement under the 2006 Stock Plan (incorporated by reference to Exhibit 10.2 to HMS Holdings Corp.’s Quarterly Report on Form 10-Q (File No. 000-50194) as filed with the SEC on May 10, 2016)10.23†HMS Holdings Corp. 2016 Omnibus Incentive Plan (“the “2016 Omnibus Plan”) (incorporated by reference to Exhibit 10.2 to HMS Holdings Corp.’s Current Report on Form 8-K (File No. 000-50194) as filed with the SEC on June 27, 2016)128ExhibitNumberDescription10.24†Form of Non-Qualified Stock Option Award Agreement for Employees under the 2016 Omnibus Plan (incorporated by reference to Exhibit 10.1 to HMS Holdings Corp.’s Quarterly Report on Form 10-Q (File No. 000-50194) as filed with the SEC on November 9, 2016)10.25†Form of Restricted Stock Unit Award Agreement for Employees under the 2016 Omnibus Plan (incorporated by reference to Exhibit 10. to HMS Holdings Corp.’s Quarterly Report on Form 10-Q (File No. 000-50194) as filed with the SEC on November 9, 2016)10.26†Form of Non-Qualified Stock Option Award Agreement for Non-Employee Directors under the 2016 Omnibus Plan (incorporated by reference to Exhibit 10.3 to HMS Holdings Corp.’s Quarterly Report on Form 10-Q (File No. 000-50194) as filed with the SEC on November 9, 2016)10.27†Form of Restricted Stock Unit Award Agreement for Non-Employee Directors under the 2016 Omnibus Plan (incorporated by reference to Exhibit 10.4 to HMS Holdings Corp.’s Quarterly Report on Form 10-Q (File No. 000-50194) as filed with the SEC on November 9, 2016)10.28†HDI Holdings, Inc. Amended 2011 Stock Option and Stock Issuance Plan (the “HDI 2011 Stock Plan”) (incorporated by reference to Exhibit 10.21 to HMS Holdings Corp.’s Annual Report on Form 10-K (File No. 000-50194) as filed with the SEC on February 29, 2012)10.29†Form of 2011 Employee Non-Qualified Stock Option Agreement under the HDI 2011 Stock Plan (incorporated by reference to Exhibit 10.22 to HMS Holdings Corp.’s Annual Report on Form 10-K (File No. 000-50194) as filed with the SEC on February 29, 2012)10.30†Executive Employment Agreement between William C. Lucia and HMS Holdings Corp. dated March 1, 2013 (incorporated by reference to Exhibit 10.20 to HMS Holdings Corp.’s Annual Report on Form 10-K (File No. 000-50194) as filed with the SEC on March 1, 2013)10.31†Letter of Amendment to Executive Employment Agreement between William C. Lucia and HMS Holdings Corp. dated April 30, 2013 (incorporated by reference to Exhibit 10.1 to Amendment No. 1 to HMS Holdings Corp.’s Annual Report on Form 10-K/A (File No. 000-50194) as filed with the SEC on April 30, 2013)10.32†Second Amendment to Executive Employment Agreement between HMS Holdings Corp. and William C. Lucia dated January 20, 2015 (incorporated by reference to Exhibit 10.1 to HMS Holding Corp.’s Current Report on Form 8-K (Filed No. 000-50194) as filed with the SEC on January 23, 2015)10.33†Employment Agreement between Jeffrey S. Sherman and HMS Holdings Corp. dated July 28, 2014 (incorporated by reference to Exhibit 10.1 to HMS Holdings Corp.’s Current Report on Form 8-K (File No. 000-50194) as filed with the SEC on September 8, 2014)10.34†Employment Agreement between Semone Wagner and HMS Holdings Corp. dated January 16, 2013 (incorporated by reference to Exhibit 99.2 to HMS Holding Corp.’s Annual Report on Form 10-K (File No. 000-50194) as filed with the SEC on March 3, 2014)10.35†Employment Agreement between Cynthia Nustad and HMS Business Services, Inc. dated May 15, 2012 (incorporated by reference to Exhibit 10.47 to Amendment No. 1 to HMS Holding Corp.’s Annual Report on Form 10-K/A (File No. 000-50194) as filed with the SEC on April 30, 2015)10.36†Employment Agreement between Douglas M. Williams and HMS Holdings Corp. dated November 13, 2013 (incorporated by reference to Exhibit 10.33 to HMS Holdings Corp.’s Annual Report on Form 10-K (File No. 000-50194) as filed with the SEC on March 1, 2016)10.37†Form of Indemnification Agreement (incorporated by reference to Exhibit 10.1 to HMS Holdings Corp.’s Current Report on Form 8-K (File No. 000-50194) as filed with the SEC on August 6, 2014)10.38†HMS Holdings Corp. Director Deferred Compensation Plan, as amended through June 29, 2016 (incorporated by reference to Exhibit 10.3 to HMS Holdings Corp.’s Quarterly Report on Form 10-Q (File No. 000-50194) as filed with the SEC on August 9, 2016)129ExhibitNumberDescription10.39†2016 HMS Holdings Corp. Annual Incentive Compensation Plan as amended and restated (incorporated by reference to Exhibit 10.1 to HMS Holdings Corp.’s Current Report on Form 8-K (File No. 000-50194) as filed with the SEC on June 27, 2016)10.40Credit Agreement dated May 3, 2013 among HMS Holdings Corp., the Guarantors Party thereto, the Lenders party thereto and Citibank, N.A. as Administrative Agent (incorporated by reference to Exhibit 10.1 to HMS Holdings Corp.’s Current Report on Form 8-K (File No. 000-50194) as filed with the SEC on May 6, 2013)10.41HDI Lease between New Russell One LLC and HMS Business Services, Inc. dated February 27, 2014 (incorporated by reference to Exhibit 10.5 to HMS Holdings Corp.’s Quarterly Report on Form 10-Q (File No. 000-50194) as filed with the SEC on May 12, 2014)21.1*HMS Holdings Corp. List of Subsidiaries23.1*Consent of Independent Registered Public Accounting Firm31.1*Rule 13a-14(a)/15d-14(a) Certification of the Principal Executive Officer of HMS Holdings Corp., as adopted pursuant to Section 302 of the Sarbanes-Oxley Act of 200231.2*Rule 13a-14(a)/15d-14(a) Certification of the Principal Financial Officer of HMS Holdings Corp., as adopted pursuant to Section 302 of the Sarbanes-Oxley Act of 200232.1‡Section 1350 Certification of the Principal Executive Officer of HMS Holdings Corp., as adopted pursuant to Section 906 of the Sarbanes-Oxley Act of 200232.2‡Section 1350 Certification of the Principal Financial Officer of HMS Holdings Corp., as adopted pursuant to Section 906 of the Sarbanes-Oxley Act of 2002101.INS*XBRL Instance Document101.SCH*XBRL Taxonomy Extension Schema Document101.CAL*XBRL Taxonomy Extension Calculation Linkbase Document101.DEF*XBRL Taxonomy Extension Definition Linkbase Document101.LAB*XBRL Taxonomy Extension Label Linkbase Document101.PRE*XBRL Taxonomy Extension Presentation Linkbase Document†Indicates a management contract or compensatory plan, contract or arrangement*Filed herewith‡Furnished herewith