![]()
000-06253
| ☒ | |||||||||
or
| ☐ | ||||||
![]()
000-06253
 SIMMONS FIRST NATIONAL CORPORATION
| Arkansas | 71-0407808 | ||||
| (State or other jurisdiction of | (I.R.S. | ||||
| incorporation or organization) | |||||
| 501 Main Street | 71601 | ||||
| Pine Bluff | (Zip Code) | ||||
| Arkansas | |||||
| (Address of principal executive offices) | |||||
| Trading Symbol(s) | Name of each exchange on which | |||||||||||||
| Common stock, par value $0.01 per share | SFNC | The Nasdaq Global Select Market | ||||||||||||
☒ Yes ☐ No
☐ Yes ☒ No
☒ Yes ☐ No
Indicate by check mark if disclosure of delinquent filers pursuant to Item 405 of Regulation S-K is not contained herein, and will not be contained, to the best of registrant's knowledge in definitive proxy or in information statements incorporated by reference in Part III of this Form 10-K or any amendment to this Form 10-K. ☐
| Large accelerated filer | ☒ | Accelerated filer | ☐ | Non-accelerated filer | ☐ | ||||||||||||
| Smaller reporting company | ☐ | Emerging Growth company | ☐ | ||||||||||||||
$17.25.
Part III is incorporated by reference from125,327,684.
Introduction
The Company has chosen to combine our Annual Report to Shareholders with our23, 2024, are incorporated by reference into Part III of this Form 10-K. We hope investors find it useful to have all of this information in a single document.
The Securities and Exchange Commission allows us to report information in the Form 10-K by “incorporated by reference” from another part of the Form 10-K, or from the proxy statement. You will see that information is “incorporated by reference” in various parts of our Form 10-K.
A more detailed table of contents for the entire Form 10-K follows:
Our business philosophy centers on building strong, deep customer relationships through excellent customer service and integrity in our operations. While we have grown in recent years into a regional financial institution and one of the largest bank/financial holding companies headquartered in the State of Arkansas, we continue to emphasize, where practicable, a community-based mindset focused on local associates responding to local banking needs and making business decisions in the markets they serve. Those efforts, though, are buttressed by experienced, centralized support functions in select, critical areas. While we serve a variety of customers and industries, we are not dependent on any single customer or industry.
OurBank
Our other subsidiary bank, Bank SNB, is an Oklahoma state-chartered bank that was acquired in October 2017 through the Company’s merger with Southwest Bancorp, Inc. (“OKSB”). Bank SNB operates locations in Oklahoma, Colorado, Kansas
Notably, in October 2017,Commercial Banking Strategy
Our subsidiary banks provide financial services to individuals and businesses throughout the market areas they serve. These banks offer consumer, real estate and commercial loans, checking, savings and time deposits. Simmons Bank and its subsidiaries have also developed through their experience, scale and acquisitions, specialized products and services that are in addition to those offered by the typical community bank. Those products include credit cards, trust and fiduciary services, investments, agricultural finance lending, equipment lending, insurance and small business administration (“SBA”) lending.
Community Bank Strategy
Historically, we utilized separately chartered community banks, supported by Simmons Bank,bank subsidiaries to provide full servicefull-service banking products and services across our footprint. On March 5,During 2014, we announced the planned consolidation of our six smaller subsidiaryconsolidated all separately chartered banks into Simmons Bank which was completed in August 2014. We made the decision to consolidate in order to more effectively meet the increased regulatory burden facing banks, to reduce certain operating costs, and to more efficiently perform operational duties. AfterTo both effectively compete for and service the charter consolidation and the 2015 mergers discussed below,needs of different types of customers, Simmons Bank has operatednow operates using two main groups, a three-region structure. Below iscommunity banking group (which generally focuses on small-to-mid-size customer relationships) and a listingcommercial banking group (which generally focuses on larger, more complex customers with intricate or unique banking needs). Both of those regions:
With the mergers of OKSB, First Texas,these groups are supported by Simmons Bank’s retail, private banking, trust and Southwest Bank discussed above, and after the mid-2018 merger of Bank SNB into Simmons Bank, Simmons Bank plans to revise its regions into the following divisions:
various operations divisions.
In December 2009, we completed a secondary stock offering by issuing a total of 6,095,000 shares (split adjusted) of common stock, including the over-allotment, at a price of $12.25 per share, less underwriting discounts and commissions. The net proceeds of the offering after deducting underwriting discounts and commissions and offering expenses were approximately $70.5 million. Thefollowing summary provides additional capital positioned us to take advantage of unprecedenteddetails concerning our more recent acquisition opportunities through FDIC-assisted transactions of failed banks.
In 2010, we expanded outside the borders of Arkansas by acquiring two failed institutions through FDIC-assisted transactions. The first was a $100 million failed bank located in Springfield, Missouri, and the second was a $400 million failed thrift located in Olathe, Kansas. On both transactions, we entered into a loss share agreement with the FDIC, which provided significant protection of 80% of covered assets.
In 2012, we acquired two additional failed institutions through FDIC-assisted transactions. The first was a $300 million failed bank located in St. Louis, Missouri, and the second was a $200 million failed bank located in Sedalia, Missouri. On both transactions, we again entered into a loss share agreement with the FDIC that provided 80% protection of a significant portion of the assets.
On
Under the terms of the agreement, the FDIC made a net payment of $2,368,000 to Simmons Bank as consideration for the early termination of the loss share agreements. The early termination was recorded in the Company’s financial statements by removing the FDIC indemnification asset, receivable from FDIC, the FDIC true-up liability and recording a one-time, pre-tax charge of $7,476,000. As a result, the Company reclassified loans previously covered by FDIC loss share to loans acquired, not covered by FDIC loss share. Foreclosed assets previously covered by FDIC loss share were reclassified to foreclosed assets not covered by FDIC loss share.
On October 29, 2015, we completed the acquisition of Ozark Trust & Investment Corporation (“Ozark Trust”), including its wholly-owned non-deposit trust company, Trust Company of the Ozarks. Headquartered in Springfield, Missouri, Ozark Trust had over $1 billion in assets under management and provided a wide range of financial services for its clients including investment management, trust services, IRA rollover or transfers, successor trustee services and personal representativesrepresentative and custodial services. As our first acquisition of a fee-only financial firm, Ozark Trust provided a new wealth management capability that cancould be leveraged across the Company’s entire geographic footprint.
On
On
On
Acquisition Strategy
We expect that our target areas for acquisitions will continue to be banks operating in growth markets within the existing footprint of Arkansas, Colorado, Kansas, Missouri, Oklahoma, Tennessee and Texas markets. In addition, we will pursue opportunities with financial service companies with specialty lines of business and branch acquisitions within the existing markets as and when they arise.
banks to the extent a compelling strategic opportunity presents itself.
Employees
announcements about the Company and its subsidiaries. Our website and the information contained on, or that can be accessed through, our website are not deemed to be incorporated by reference in, and are not considered part of, this Annual Report.
Subsidiary Banks
During
Following thebank holding company’s regulatory realignment, capital levels or plan, and must comply with all applicable state and federal corporate and securities laws and regulations.
In January 2016 the bank’s board of directors approved a recommendation to convert from a national bank charter to a state bank charter. Effective April 1, 2016, the Bank converted from a national banking association tois an Arkansas state-chartered bank. The Bank’s name changed to Simmons Bank. Simmons Bank isbank and a member of the Federal Reserve System through the Federal Reserve Bank of St. Louis. The charter conversion wasDue to the Company’s typical acquisition process, there may be brief periods of time during which the Company may operate another subsidiary bank that the Company acquired through a strategic undertakingmerger with a target bank holding company as a separate subsidiary while preparing for the merger and integration of that we believe will enhance our operations insubsidiary bank into Simmons Bank. However, it is the long term.
Company’s intent to generally maintain Simmons Bank as the Company’s sole subsidiary bank.
agency would be harmed if such equitable relief was not granted.
Since 1993, banking organizations (including financial holding companies, bank holding companies and banks) were required to meet a minimum ratio of Total Capital to Total Risk-Weighted Assets of 8%, of which at least 4% must be in the form of Tier 1 Capital. A well-capitalized institution was one that had at least a 10% “total risk-based capital” ratio.
Bank
Under
restoration plan. There is also a method by which an institution may be downgraded to a lower capital category based on supervisory factors other than capital. As of December 31, 2023, Simmons Bank was “well capitalized” based on the aforementioned ratios.
Please refer to the section below titled
FDIC Deposit Insurance and Assessments for more information.On July 21,
However, the Dodd-Frank Act does not prevent states from adopting stricter consumer protection standards than those promulgated by the CFPB. State regulation of financial products and potential enforcement actions could also adversely affect the Company’s business, financial condition, or operations.
Simmons Bank is required to pay deposit insurance assessments to maintain the DIF. Because Simmons Bank’s assets exceed $10 billion, its deposit insurance assessment is based on a scoring system that examines the institution’s supervisory ratings and certain financial measures. The Dodd-Frank Act changed howscoring system assesses risk measures to produce two scores, a performance score and a loss severity score, that are combined and converted to an initial assessment rate. The FDIC has the ability to make discretionary adjustments to the total score based upon significant risk factors not adequately captured in the calculations.
The minimum deposit insurance fund rate will increase from 1.15% to 1.35% by September 30, 2020, and the cost of the increase will be borne by depository institutions with assets of $10 billion or more. As of the date of this filing, our lead bank subsidiary, Simmons Bank, exceeds $10 billion in total assets, and it is, therefore, subject to the assessment rates assigned to larger banks, which may result in higher deposit insurance premiums. The FDIC adopted a final rule on February 7, 2011 that implemented these provisions of the Dodd-Frank Act.
On April 26, 2016, the FDIC approvedissued a final rule to improveimplement a special assessment to recover losses to the DIF incurred as a result of recent bank failures and the FDIC’s use of the systemic risk exception to cover certain deposits that were otherwise uninsured. The special assessment was based on estimated uninsured deposits as of December 31, 2022 (excluding the first $5.0 billion) and will be assessed at a quarterly rate of 3.36 basis points, over eight quarterly assessment periods, beginning in the first quarter of 2024. As a result of this final rule, we accrued $10.5 million related to this assessment in the fourth quarter of 2023. This amount represents our current expectation of the full amount of the assessment based on our total uninsured deposits as of December 31, 2022. Under the final rule, the estimated loss pursuant to the systemic risk determination will be periodically adjusted, and the FDIC has retained the ability to cease collection early, extend the special assessment collection period and impose a final shortfall special assessment on a one-time basis. The extent to which any such additional future assessments will impact our future deposit insurance assessment systemexpense is currently uncertain.
privacy policies to consumers, as well as provide consumers an ability to prevent our disclosure of their information under certain circumstances.
Pending Legislation
Because of concerns relating to competitivenessregulations impose compliance costs and the safetycreate obligations and, soundnessin some cases, reporting obligations, and compliance with all of the banking industry, Congress often considers a number of wide-ranging proposals for altering the structure, regulation,laws, regulations, and competitive relationships of the nation’s financial institutions. We cannot predict whether or in what form any proposals will be adopted or the extent to which our businessreporting obligations may be affected.
Impacts of Growth
During 2017, through internal growth and through acquisitions, the assetsrequire significant resources of the Company and our subsidiary bank, these laws and regulations do not materially affect our products, services or other business activities.
Thein assets, each of the Company and the Bank are subject to heightened requirements (as compared to smaller community banking organizations) that are imposed by various federal banking law and regulations.
the grandfather provisions applicable to its trust preferred securities no longer apply, and trust preferred securities are no longer included as Tier 1 capital. Trust preferred securities and qualifying subordinated debt are included as total Tier 2 capital.
FRB.
and Markets
The previous economic downturn elevated unemployment levels and negatively impacted consumer confidence. It also had
Market conditions have also led to the failure or merger of a number of prominent financial institutions. Financial institution failures or near-failures have resulted in further losses as a consequence of defaults on securities issued by them and defaults under contracts entered into with such entities as counterparties. Furthermore,significant recession, declining asset values, defaults on mortgages and consumer loans, and the lack of market and investor confidence, as well as other factors, havecan all combinedcombine to increase credit default swap spreads, to cause rating agencies to lower credit ratings, and to otherwise increase the cost and decrease the availability of liquidity, despite very significant declines in Federal Reserve borrowing rates and other government actions. SomeIn the Great Recession, some banks and other lenders have suffered significant losses and have becomebecame reluctant to lend, even on a secured basis, due to the increased risk of default and the impact of declining asset values on the value of collateral. The foregoing hascan significantly weakenedweaken the strength and liquidity of some financial institutions worldwide.
Financial legislative and regulatory initiatives could adversely affect the results of our operations.
In response to the financial crisis affecting the banking system and financial markets, the Dodd-Frank Act was enacted in 2010, as well as several programs that have been initiated by the U.S. Treasury, the FRB, and the FDIC.
Some of the provisions of legislation and regulation that can adversely impact the Company include: the Durbin Amendment to the Dodd-Frank Act which mandates a limit to debit card interchange fees and Regulation E amendments to the EFTA regarding overdraft fees. These provisions can limit the type of products we offer, the methods by which we offer them, and the prices at which they are offered. These provisions can also increase our costs in offering these products.
The CFPB has unprecedented authority over the regulation of consumer financial products and services. The CFPB has broad rule-making, supervisory and examination authority, as well as expanded data collecting and enforcement powers. The scope and impact of the CFPB's actions cannot be fully determined at this time, which creates significant uncertainty for the Company and the financial services industry in general.
These laws, regulations, and changes can increase our costs of regulatory compliance. They also can significantly affect the markets in which we do business, the markets for and value of our investments, and our ongoing operations, costs, and profitability. The ultimate impact of the many provisions in the Dodd-Frank Act and other legislative and regulatory initiatives on the Company's business and results of operations will depend upon the continued development of regulatory interpretation and rulemaking. As a result, we are unable to predict the ultimate impact of the Dodd-Frank Act or of other future legislation or regulation, including the extent to which it could increase costs or limit our ability to pursue business opportunities in an efficient manner, or otherwise adversely affect our business, financial condition and results of operations.
Difficult market conditions have adversely affected our industry.
The financial markets have experienced significant volatility over the past several years. In some cases, the financial markets have produced downward pressure on stock prices and credit availability for certain issuers without regard to those issuers’ underlying financial strength. If financial market volatility worsens, or if there are more disruptions in the financial markets, including disruptions to the United States or international banking systems, there can be no assurance that we will not experience an adverse effect, which may be material, on our ability to access capital and on our business, financial condition and results of operations.
Risks Related
increase due to continued inflation, our profitability could decline and our business, financial condition and results of operations may be otherwise materially and adversely affected. In addition, continued inflationary pressures could increase the operating costs of our borrowers, which could adversely impact their profitability and financial condition and thereby increase the likelihood of defaults on loans we have extended.
successful. regulators. failure to comply with applicable banking laws and regulations could result in significant monetary penalties and losses, restrict our ability to execute our growth strategy, and have other material adverse impacts on our business. Our subsidiary bank’s ability to pay dividends or make other payments to us, as well as our ability to pay dividends on our common stock, is limited by the bank’s obligation to maintain sufficient capital and by other general regulatory restrictions on its dividends, including restrictions imposed by state laws and regulations. Arkansas, including a twelve-story office building in Little Rock’s River Market district. Notes to Consolidated Financial Statements in Part II, Item 8 of this report is incorporated herein by reference. were purchased in connection with employee tax withholding obligations under employee compensation plans, which are not purchases under any publicly announced plan. Credit Losses through provision for credit losses expense. Our net income available to common shareholders for the year ended December 31, focus on maintaining disciplined pricing and conservative underwriting standards given the current economic environment. Total nonperforming loans as of December 31, 2023 were $84.5 million, as compared to $58.9 million at December 31, 2022. Non-performing assets as a percent of total assets were 0.33%, compared to 0.23% at December 31, 2023 and 2022, respectively. common stock during 2023. 26.135%. the end of 2023. Markets anticipate potential rate cuts by the Federal Reserve during 2024. portfolio. Also contributing to the decrease in the average portfolio balance was a targeted sale of $241.1 million of lower-yielding AFS securities late in the fourth quarter of 2023, the proceeds of which we used to pay off higher-rate wholesale fundings. this current challenging rate environment. 2021. Equivalent using an effective tax rate of 26.135%) The provision for legal reserve recapture associated with litigation. 2021. Spirit acquisition. additional information regarding our intangibles. 2021. The provision for income taxes for lending. outstanding at the indicated dates are reflected in Table 2023. $2.8 million, respectively. nonaccrual during the fourth quarter of 2020. The remaining increase was related to various other CRE loans and commercial loan relationships. remaining outstanding principal balance of the loan. foreclosed assets held for sale. 2021. Table Our securities portfolio is the second largest component of earning assets and provides a significant source of revenue. Securities within the portfolio are classified as either held-to-maturity (“HTM”) or available-for-sale amortized to their earliest call date. 2022. We will continue to look for opportunities to maximize the value of the investment portfolio. 2023. HTM portfolio. As of December 31, $126.4 million in accumulated other comprehensive income (loss) will be amortized over the remaining life of the securities. No gains or losses on these securities were recognized at the time of transfer. We are continually monitoring and looking for opportunities to fairly reprice our deposits while remaining competitive in this current challenging rate environment. Our uninsured deposits as of December 31, 2023 and 2022 were $4.75 billion and $5.63 billion, respectively. 2023. Table 2022. Our total debt was the event the benchmark rate is less than zero, the benchmark rate will be deemed to be zero) plus 592 basis points, payable quarterly, in arrears. 2022. 2024 Program to come from available sources of liquidity, including cash on hand and future cash flow. 2020 CECL Transition Provision. The Basel III Capital Rules The tables below present computations of The Company has updated its calculation of certain non-GAAP financial measures to exclude the impact of gains or losses on the sale of AFS investment securities in light of the impact of the Company’s strategic AFS investment securities transactions during the fourth quarter of 2023 and has presented past periods on a comparable basis. uninsured, non-collateralized deposit coverage ratio. Bank needs. liquidity. purchases, or enter into derivative contracts such as interest rate swaps. 2023. Audit Committee on those consolidated financial statements. Audit Committee thereon. Texas. segment. Such estimates include, but are not limited to, the Company’s allowance for credit losses. their earliest call date. their earliest call date. met. settlement. the consolidated balance sheets. a specific allocation. credit losses. losses expense. and Allowance for Credit Losses. equipment. 2021 due to the average market price of the Company’s stock exceeding the related stock option exercise price. In accordance with ASC Topic 718, On stock equivalents) to effect the merger. stock equivalents) to effect the merger. stock equivalents) to effect the merger. goodwill will not be deductible for tax purposes. liabilities related to Triumph. credit losses related to these securities. 2022. amounts in 2023, 2022 and 2021. Company’s local markets. recaptured during the year for a variety of factors including a release of $16.0 million driven by improvements in certain industry specific qualitative factors for the restaurant, hospitality, student housing and office space industries due to lower pandemic related stresses. The remaining recapture during 2022 was driven by the planned exit of several large oil and gas relationships during the year, along with the Company’s United States (“US”) responded to the sudden collapse of two US banks. As a result of the decrease in the Company’s market capitalization, the Company performed an interim goodwill impairment qualitative assessment during the first quarter of 2023 and concluded that it was more likely-than-not that the fair value of goodwill continued to exceed its carrying value and therefore, goodwill was not impaired. During the second quarter of 2023, the Company performed an annual goodwill impairment analysis and concluded that it is more likely-than-not that the fair value of goodwill continues to exceed its carrying value and therefore, goodwill was not impaired. Additionally, the Company performed interim goodwill impairment assessments during the third and fourth quarters of 2023 and concluded no impairment existed during the periods. (2) The The provision for income taxes for the years ended December 31 is comprised of the following components: are expected to be fully utilized by 2036. Debt at December 31, were tax-advantaged issues that qualified for inclusion as Tier 2 capital. On April 27, 2022, the Company’s shareholders approved an amendment to the Company’s Articles of Incorporation to remove the classification and designation for the Series D Preferred Stock. As of December 31, 2023 and 2022, there were no shares of preferred stock issued or outstanding. $1.3 million. NOTE or Level 3 of the fair value hierarchy. Where assumptions are made using significant unobservable inputs, such loans held for sale are classified as Level 3. At December 31, 2023 and 2022, the aggregate fair value of mortgage loans held for sale exceeded their cost. Past dividends are not necessarily indicative of amounts that may be paid, or available to be paid, in future periods. dividends, other distributions and discretionary bonuses. end of the period covered by this report. defined in Item 408 of Regulation S-K of the Securities Act of 1933).DeterioratingWe face strong competition from other banks, bank holding companies, and financial services companies.In the markets we serve, the businesses of banking and financial services are fiercely competitive. Many of our competitors offer the same, or similar, products and services within our market areas. Some of our competitors are able to offer a broader range of products and services than we do. These competitors include banks with nationwide presences, regional banks, and community banks (who may have greater flexibility in their operational strategies than we possess). We also face competition from many other types of financial institutions, including, among others, credit quality, particularlyunions, finance companies, insurance companies, brokerage and investment banking firms. Certain nonbank competitors of the Company are increasingly offering products and services that traditionally were banking products due to technological advances, and many of these nonbank competitors are not subject to the same extensive federal regulations that govern bank holding companies and federally insured banks. As a result, some of the competitors in our credit card portfolio,markets have the ability to offer products and services that we are unable to offer or to offer such products and services at more competitive rates. If we are unable to effectively compete for customers, we may lose loan and deposit market share, as well as experience reductions in net interest margin, fee income, and profitability, and our business, financial condition, and results of operations could be adversely impact us.Weaffected.23Changes in service delivery channels and emerging technologies pose a competitive risk.Advancements in technology have created the ability for financial transactions that have historically often involved traditional banks to be conducted through alternative channels. For example, consumers can now hold funds in brokerage accounts and internet-only banks, or indeed with essentially any bank that provides for online account opening and online banking. Consumers can also complete transactions such as the purchase or sale of goods and services, the payment of bills, and the transfer of funds without the direct assistance of banks. Indeed, non-traditional financial services firms, such as financial technology (FinTech) companies, have begun to offer a significant consumer credit card portfolio. Although we experienced a decreased amountvariety of net charge-offs in our credit card portfolio in recent years, the amount of net charge-offs could worsen. While we continue to experience a better performance with respect to net charge-offs than the national average in our credit card portfolio, our net charge-offs were 1.61%services traditionally provided by banks and 1.28% of our average outstanding credit card balances for the years ended December 31, 2017 and 2016, respectively. Future downturns in the economy could adversely affect consumers in a more delayed fashion compared to commercial businesses in general. Increasing unemployment and diminished asset values may prevent our credit card customers from repaying their credit card balances whichother financial institutions. The resulting increased competition could result in an increased amountthe loss of fee income and customer deposits,which could negatively impact our net charge-offsfinancial condition, results of operations, and liquidity. It could also require additional, costly investments in technology to remain competitive.We anticipate that could havenew technologies will continue to emerge that may be superior to, or render obsolete, the technologies currently used by the Company and the Bank in their products and services. Developing or acquiring access to new technologies and incorporating those technologies into our products and services, or using them to expand our products and services, in each case in a material adverse effect on our unsecured credit card portfolio.Changesway that enables us to consumer protection lawsremain competitive, may impede our origination or collection efforts with respectrequire significant investments, may take considerable time to credit card accounts, change account holder use patterns or reduce collections, any of which may result in decreased profitability of our credit card portfolio.Credit card receivables that do not comply with consumer protection lawscomplete, and ultimately may not be valid or enforceable under their terms against the obligors of those credit card receivables. Federal and state consumer protection laws regulate the creation and enforcement of consumer loans, including credit card receivables. For instance, the federal Truth in Lending Act was amended by the “Credit Card Accountability, Responsibility and Disclosure Act of 2009,” or the “Credit CARD Act,” which, among other things:·prevents any increases in interest rates and fees during the first year after a credit card account is opened, and increases at any time on interest rates on existing credit card balances, unless (i) the minimum payment on the related account is 60 or more days delinquent, (ii) the rate increase is due to the expiration of a promotional rate, (iii) the account holder fails to comply with a negotiated workout plan or (iv) the increase is due to an increase in the index rate for a variable rate credit card;·requires that any promotional rates for credit cards be effective for at least six months;·requires 45 days notice for any change of an interest rate or any other significant changes to a credit card account;·empowers federal bank regulators to promulgate rules to limit the amount of any penalty fees or charges for credit card accounts to amounts that are “reasonable and proportional to the related omission or violation;” and·requires credit card companies to mail billing statements 21 calendar days before the due date for account holder payments.As a result of the Credit CARD Act and other consumer protection laws and regulations, it may be more difficult for us to originate additional credit card accounts or to collect payments on credit card receivables, and the finance charges and other fees that we can charge on credit card account balances may be reduced. Furthermore, account holders may choose to use credit cards less as a result of these consumer protection laws. Each of these results, independently or collectively, could reduce the effective yield on revolving credit card accounts and could result in decreased profitability of our credit card portfolio.Our growth and expansion strategy may not be successful, and our market value and profitability may suffer.We have historically employed, as important parts of our business strategy, growth through acquisitionacquisitions of banks and, to a lesser extent, through branch acquisitions and de novobranching. Any future acquisitions in which we might engage will be accompanied by the risks commonly encountered in acquisitions. These risks include, among other risks:·credit risk associated with the acquired bank’s loans and investments;·difficulty of integrating operations and personnel; and·potential disruption of our ongoing business.•credit risk associated with the acquired bank’s loans and investments;•difficulty of integrating operations and personnel; and•potential disruption of our ongoing business.In addition to pursuing the acquisition of existing viable financial institutions as opportunities arise we may also continue to engage in de novobranching to further our growth strategy. De novobranching and growing through acquisition involve numerous risks, including the following:·the inability to obtain all required regulatory approvals;·the significant costs and potential operating losses associated with establishing a de novo branch or a new bank;·the inability to secure the services of qualified senior management;·the local market may not accept the services of a new bank owned and managed by a bank holding company headquartered outside of the market area of the new bank;·the risk of encountering an economic downturn in the new market;·the inability to obtain attractive locations within a new market at a reasonable cost; and·the additional strain on management resources and internal systems and controls.
following (among others):13•the inability to obtain all required regulatory approvals;•the significant costs and potential operating losses associated with establishing a de novo branch or a new bank;•the inability to secure the services of qualified senior management;•the local market may not accept the services of a new bank owned and managed by a bank holding company headquartered outside of the market area of the new bank;•the risk of encountering an economic downturn in the new market;•the inability to obtain attractive locations within a new market at a reasonable cost; and•the additional strain on management resources and internal systems and controls.We expect that competition for suitable acquisition candidates will be significant. We may compete with other banks or financial service companies that are seeking to acquire our acquisition candidates, many of which are larger competitors and have greater financial and other resources. We cannot assure you that we will be able to successfully identify and acquire suitable acquisition targets on acceptable terms and conditions. Further, we cannot assure you that we will be successful in overcoming these risks or any other problems encountered in connection with acquisitions and de novobranching. Our inability to overcome these risks could have an adverse effect on our ability to achieve our business and growth strategy and maintain or increase our market value and profitability.Our recent results do not indicateThe value of our goodwill and other intangible assets may decline in the future.As of December 31, 2023, we had $1.3 billion of goodwill and $112.6 million of other intangible assets. A significant decline in our expected future resultscash flows, a significant adverse change in the business climate, slower economic growth or a significant and may not provide guidance to assesssustained decline in the price of our common stock, any or all of which could be materially impacted by many of the risk factors discussed herein, may necessitate our taking charges in the future related to the impairment of an investmentour goodwill. Future regulatory actions could also have a material impact on assessments of goodwill for impairment. If we were to conclude that a future write-down of our goodwill is necessary, we would record the appropriate charge, which could have a material adverse effect on our results of operations.24Identifiable intangible assets other than goodwill consist of core deposit intangibles, books of business, and other intangible assets. Adverse events or circumstances could impact the recoverability of these intangible assets including loss of core deposits, significant losses of customer accounts and/or balances, increased competition or adverse changes in the economy. To the extent these intangible assets are deemed unrecoverable, a non-cash impairment charge would be recorded, which could have a material adverse effect on our common stock.We may not be ableresults of operations.Damage to sustain our historical rate of growth or be able to expandreputation could significantly harm our business. Various factors, such as economic conditions,Our ability to attract and retain customers, employees, and acquisition partners is influenced by our reputation. A negative opinion of our business can develop in connection with a variety of circumstances, including issues with our lending practices, legal and regulatory compliance, risk management, corporate governance, customer service, community involvement, integration of acquired institutions, and legislative considerationsthird-party service providers. Our reputation could also be harmed through regulatory proceedings by governmental authorities, litigation, or cybersecurity events. Reputational damage could also impact our relationships with investors, our credit ratings and competition, may also impede or prohibit our ability to expand our market presence. We may also be unable to identify advantageous acquisition opportunities or, once identified, enter into transactions to make such acquisitions. access capital markets.If we are not ableunsuccessful in developing new, and adapting our current, products and services so that they respond to changing industry standards and customer preferences, our business may suffer.We provide a variety of commercial and consumer banking, as well as other financial, products and services designed to meet a broad range of needs. While many of these products and services are traditional both in their characteristics and their delivery channels, advancements in technology, changes in the regulatory environment, and evolving customer preferences require that we continuously evaluate the terms under which we provide our existing products and services (including, among other things, interest rates and loan covenants), the methods by which we deliver them (including the use of online and mobile banking), whether to partner with a FinTech company or other third-party vendor to provide products and services, and the potential for new products and services in order to remain competitive. These efforts, though, could require substantial investments, and we can provide no assurance that we will develop new products and services, or adequately adapt our existing products and services, in a timely or successful manner. Our inability to do so could harm our business and adversely affect our results of operations and reputation. Furthermore, any new line of business and/or new product or service could require the establishment of new key and other controls and have a significant impact on our existing system of internal controls. Failure to successfully growmanage these risks in the development and implementation of new lines of business and/or new products or services could have a material adverse effect on our business and, in turn, our financial condition and results of operations.Risks Related to the Company’s OperationsWe are subject to fraud risk, which could have a material adverse effect on our business and results of operations.Fraud is a major, and increasing, operational risk, particularly for financial institutions. We continue to experience fraud attempts and losses through, for example, deposit fraud (such as wire fraud and check fraud) and loan fraud. Fraud has also arisen from the misconduct of our employees. The methods used to perpetrate and combat fraud continue to evolve, particularly as advances in technology occur. While we seek to be vigilant in the prevention, detection, and remediation of fraud events, some fraud loss is unavoidable, and the risk of major fraud loss cannot be eliminated.Our models and estimations may be inadequate, which could lead to significant losses and regulatory scrutiny.To assist with the management of our credit, liquidity, operations, could be adversely affected.Our cost of funds may increase as a result of general economic conditions, interest rates and competitive pressures.Our cost of funds may increase as a result of general economic conditions, fluctuations in interest ratescompliance functions and competitive pressures. We have traditionally obtained funds principally through local deposits asrisks, we have a base of lower cost transaction deposits. Our costs of fundsdeveloped, and our profitabilitycurrently use, various models and liquidityother analytical tools, including certain estimations. The models and estimations often take into account assumptions and historical trends and are, likely toin some case, based on subjective judgments. As such, the models and estimations may not be adversely affected, if we have to rely upon higher cost borrowings from other institutional lenders or brokers to fund loan demand or liquidity needs. Also, changeseffective in our deposit mixidentifying and growthmanaging risks, which could adversely affectimpact our profitabilityfinancial condition and the abilityresults of operations. Inadequate models may also result in compliance failures, which could lead to expandincreased scrutiny by our loan portfolio.25We may not be able to raise the additional capital we need to grow and, as a result, our ability to expand our operations could be materially impaired.Federal and state regulatory authorities require us and our subsidiary banksbank to maintain adequate levels of capital to support our operations. Many circumstances could require us to seek additional capital, such as:·faster than anticipated growth;·reduced earning levels;·operating losses;·changes in economic conditions;·revisions in regulatory requirements; or·additional acquisition opportunities.•faster than anticipated growth;•reduced earning levels;•operating losses;•changes in economic conditions;•revisions in regulatory requirements; or•additional acquisition opportunities.Our ability to raise additional capital will largely depend on our financial performance, and on conditions in the capital markets whichthat are outside our control. Moreover, if we need to raise capital in the future, we may have to do so when many other financial institutions are also seeking to raise capital and would, as a result, have to compete with those institutions for investors, which could adversely impact the price at which we are able to offer our securities. If we need additional capital but cannot raise it on terms acceptable to us, our ability to expand our operations or to engage in acquisitions could be materially impaired.Accounting standards periodically change and the application of our accounting policies and methods may require management to make estimates about matters that are uncertain.The regulatory bodies that establish accounting standards, including, among others, the Financial Accounting Standards Board and the SEC, periodically revise or issue new financial accounting and reporting standards that govern the preparation of our consolidated financial statements. The effect of such revised or new standards on our financial statements can be difficult to predict and can materially impact how we record and report our financial condition and results of operations.In addition, our management must exercise judgment in appropriately applying many of our accounting policies and methods so they comply with generally accepted accounting principles. In some cases, management may have to select a particular accounting policy or method from two or more alternatives. In some cases, the accounting policy or method chosen might be reasonable under the circumstances and yet might result in our reporting materially different amounts than would have been reported if we had selected a different policy or method. Accounting policies are critical to fairly presenting our financial condition and results of operations and may require management to make difficult, subjective or complex judgments about matters that are uncertain.14The Federal Reserve Board’s source of strength doctrine could require that we divert capital to our subsidiary banks instead of applying available capital towards planned uses, such as engaging in acquisitions or paying dividends to shareholders.The FRB’s policies and regulations require that a bank holding company, including a financial holding company, serve as a source of financial strength to its subsidiary banks, and further provide that a bank holding company may not conduct operations in an unsafe or unsound manner. It is the FRB’s policy that a bank holding company should stand ready to use available resources to provide adequate capital to its subsidiary banks during periods of financial stress or adversity, such as during periods of significant loan losses, and that such holding company should maintain the financial flexibility and capital-raising capacity to obtain additional resources for assisting its subsidiary banks if such a need were to arise.A bank holding company’s failure to meet its obligations to serve as a source of strength to its subsidiary banks will generally be considered an unsafe and unsound banking practice or a violation of the FRB’s regulations, or both. Accordingly, if the financial condition of our subsidiary banks were to deteriorate, we could be compelled to provide financial support to our subsidiary banks at a time when, absent such FRB policy, we may not deem it advisable to provide such assistance. Under such circumstances, there is a possibility that we may not either have adequate available capital or feel sufficiently confident regarding our financial condition, to enter into acquisitions, pay dividends, or engage in other corporate activities.We may incur environmental liabilities with respect to properties to which we take title.A significant portion of our loan portfolio is secured by real property. In the course of our business, we may own or foreclose and take title to real estate and could become subject to environmental liabilities with respect to these properties. We may become responsible to a governmental agency or third parties for property damage, personal injury, investigation and clean-up costs incurred by those parties in connection with environmental contamination, or may be required to investigate or clean-up hazardous or toxic substances, or chemical releases at a property. The costs associated with environmental investigation or remediation activities could be substantial. If we were to become subject to significant environmental liabilities, it could have a material adverse effect on our results of operations and financial condition.Our management has broad discretion over the use of proceeds from future stock offerings.Although we generally indicate our intent to use the proceeds from stock offerings for general corporate purposes, including funding internal growth and selected future acquisitions, our Board of Directors retains significant discretion with respect to the use of the proceeds from possible future offerings. If we use the funds to acquire other businesses, there can be no assurance that any business we acquire will be successfully integrated into our operations or otherwise perform as expected.Our business is heavily reliant on information technology systems, facilities, and processes; and a disruption in those systems, facilities, and processes, or a breach, including cyber-attacks, in the security of our systems, could have significant, negative impact on our business, result in the disclosure of confidential information, damage our reputation and create significant financial and legal exposure for us.Our businesses are dependent on our ability and the ability of our third partythird-party service providers to process, record and monitor a large number of transactions. If the financial, accounting, data processing or other operating systems and facilities fail to operate properly, become disabled, experience security breaches or have other significant shortcomings, our results of operations could be materially, adversely affected.Although we and our third party service providers devote significant resources to maintain and regularly upgrade our systems and processes that are designed to protect the security of computer systems, software, networks and other technology assets and the confidentiality, integrity and availability of information belonging to us and our customers, there is no assurance that our security systems and those of our third partythird-party service providers will provide absolute security. Financial services institutions and companies engaged in data processing have reported breaches in the security of their websites or other systems, some of which have involved sophisticated and targeted attacks intended to obtain unauthorized access to confidential information, destroy data, disable or degrade service, or sabotage systems, often through the introduction of computer viruses or malware, cyber-attacks and other means. Certain financial institutions in the United States have also experienced attacks from technically sophisticated and well-resourced third parties that were intended to disrupt normal business activities by making internet banking systems inaccessible to customers for extended periods. These “denial-of-service” attacks have not breached our data security systems, but require substantial resources to defend, and may affect customer satisfaction and behavior.Despite our efforts and those of our third party service providers to ensure the integrity of our systems, it is possible that we may not be able to anticipate or to implement effective preventive measures against all security breaches of these types, especially because the techniques used change frequently or are not recognized until launched, and because security attacks can originate from a wide variety of sources, including persons who are involved with organized crime or associated with external service providers or who may be linked to terrorist organizations or hostile foreign governments. Those parties may also attempt to fraudulently induce employees, customers or other users of our systems to disclose sensitive information in order to gain access to our data or that of our customers or clients. These risks may increase in the future as we continue to increase our mobile payments and other internet basedinternet-based product offerings and expand our internal usage of web-based products and applications. Furthermore, because certain of our employees are working, or may work, remotely, there is an increased risk of disruption to our systems because remote networks and infrastructure may not be as secure as in our office environment. If our security systems were penetrated or circumvented, it could cause serious negative consequences for us, including significant disruption of our operations, misappropriation of our confidential information or that of our customers, or damage our computers or systems and those of our customers and counterparties, and could result in violations of applicable privacy and other laws, financial loss to us or to our customers, loss of confidence in our security measures, customer dissatisfaction, significant litigation exposure, and harm to our reputation, all of which could have a material adverse effect on us.1526We depend on qualified employees and key personnel to operate and lead our business, and we may not be able to attract or retain them in the future.A critical component of our success is the ability to attract, develop and retain highly qualified, skilled lending, operations, information technology, and other employees, as well as managers who are experienced and effective at leading their respective departments. We have an experienced group of senior management and other key personnel that our board of directors believes is capable of managing and growing our business. In many areas of the financial services industry, competition for key personnel is fierce, and the departure of those individuals from our business presents risk that we will be unable to attract, develop and retain suitable successors, which could have a material, adverse impact on our competitive position in the marketplace.Our business is heavily reliant on a variety of third-party service providers.We rely on a large number of vendors to provide products and services that we need for our day-to-day operations, particularly in the areas of loan and deposit operations, information technology, and security. This reliance exposes us to the risk that the vendors will not perform in accordance with the applicable contractual arrangements or service level agreements, as well as risks resulting from defective products, poor performance of services, disruption in a product or service, vendor contracts, or loss of a product or service if a vendor ceases doing business because of its own financial or operational difficulties. These risks, if realized, could result in significant disruptions to our business, which could have a material adverse impact on our financial condition and results of operations. While we maintain a vendor management program designed to assist in the oversight and monitoring of our third-party service providers, there can be no assurance that we will not experience service-related issues associated with our vendors.Our controls, policies and procedures may fail, or our employees may not adhere to them.It is critical that our internal controls, disclosure controls and procedures, and corporate governance and operational policies and procedures be effective in order to provide assurance that our financial reports and disclosures are materially accurate. A failure or circumvention of our controls, policies and procedures, or a failure to comply with regulations related to controls, policies and procedures, could have a material adverse effect on our business, financial condition, and results of operations, as well as cause reputational harm, which could limit our ability to access the capital markets.Errors or mistakes in the provision of services to our customers or in carrying out our own transactions can subject us to liability, result in losses, or otherwise negatively impact our business.In our business activities, including the provision of banking services to our customers and the management of our own investments and other assets, we effect or process, sometimes on a manual basis, a large volume of transactions representing very large amounts of money for our customers and ourselves. Errors or mistakes in these activities (including human error and systems error), as well as other failures to mitigate operational risks, can have adverse consequences, including exposing us to liability and loss and, in the case of providing services to our customers, preventing us from receiving certain contractual protections.Accounting standards periodically change, and the application of our accounting policies and methods may require management to make estimates about matters that are uncertain.The regulatory bodies that establish accounting standards, including, among others, the Financial Accounting Standards Board (“FASB”) and the SEC, periodically revise or issue new financial accounting and reporting standards that govern the preparation of our consolidated financial statements. The effect of such revised or new standards on our financial statements can be difficult to predict and can materially impact how we record and report our financial condition and results of operations. For example, in June 2016, the FASB issued Accounting Standards Update (“ASU”) 2016-13, Measurement of Credit Losses on Financial Instruments, that substantially changed the accounting for credit losses and other financial assets held by banks, financial institutions and other organizations. The standard removed the existing “probable” threshold in generally accepted accounting principles (“US GAAP”) for recognizing credit losses and instead requires companies to reflect their estimate of credit losses over the life of the financial assets. Companies must consider all relevant information when estimating expected credit losses, including details about past events, current conditions, and reasonable and supportable forecasts. We adopted an optional three-year phase-in period for the day-one adverse regulatory capital impact upon adoption of the standard with the additional two-year delay allowed by regulators in response to the COVID-19 pandemic. The adoption of the standard resulted in an overall material increase in the allowance for credit losses. However, the impact at adoption was influenced by our portfolios' composition and quality at the adoption date and economic conditions and forecasts at that time.27In addition, our management must exercise judgment in appropriately applying many of our accounting policies and methods so they comply with generally accepted accounting principles. In some cases, management may have to select a particular accounting policy or method from two or more alternatives. In some cases, the accounting policy or method chosen might be reasonable under the circumstances and yet might result in our reporting materially different amounts than would have been reported if we had selected a different policy or method. Accounting policies are critical to fairly presenting our financial condition and results of operations and may require management to make difficult, subjective or complex judgments about matters that are uncertain.Risks Related to Owning the Company’s Legal and Regulatory EnvironmentFinancial legislative and regulatory initiatives could adversely affect the results of our operations.We are subject to extensive governmental regulation, supervision, legislation, and control. For instance, in response to the financial crisis affecting the banking system and financial markets, the Dodd-Frank Act was enacted in 2010, as well as several programs that have been initiated by the U.S. Treasury, the FRB, and the FDIC. See “Item 1. Business - Supervision and Regulation” included herein for more information regarding regulatory burden and supervision.Some of the provisions of legislation and regulation that have adversely impacted the Company include the “Durbin Amendment” to the Dodd-Frank Act, which mandates a limit to debit card interchange fees, and Regulation E amendments to the EFTA regarding overdraft fees. Future financial legislation and regulatory initiatives can limit the type of products we offer, the methods by which we offer them, the prices at which they are offered, and the fees that are associated with them. These provisions can also increase our costs in offering these products.The CFPB, Federal Reserve, and Arkansas State Bank Department have broad rulemaking, supervisory and examination authority, as well as data collection and enforcement powers. The scope and impact of the regulators’ actions can significantly impact the operations of the Company and its subsidiaries and the financial services industry in general.These laws, regulations, and changes can increase our costs of regulatory compliance. They also can significantly affect the markets in which we do business, the markets for and value of our investments, and our ongoing operations, costs, and profitability. The ultimate impact of the provisions in legislative and regulatory initiatives on the Company’s business and results of operations also depends upon regulatory interpretation and rulemaking. As a result, we are unable to predict the ultimate impact of future legislation or regulation, including the extent to which it could increase costs or limit our ability to pursue business opportunities in an efficient manner, or otherwise adversely affect our business, financial condition and results of operations.Our StockWe are charged with maintaining compliance with all applicable banking laws and regulations, including, among others, fair lending, CRA, consumer compliance, BSA and anti-money laundering, capital, and other regulations described herein under “Item 1. Business - Supervision and Regulation.” Various agencies, including, without limitation, the FRB, CFPB, Arkansas State Bank Department, and the Department of Justice, have the ability to institute proceedings to address compliance failures. Should those agencies be successful in the case of such a proceeding, we could become subject to material sanctions, including, among other things, monetary penalties and restrictions on our ability to engage in mergers and acquisitions and other growth-oriented activities. Compliance failures may also result in litigation instituted by private parties, including consumers, which could result in material adverse impacts on our business.We are subject to litigation in the ordinary course of our business, and adverse rulings, judgements, settlements, and other outcomes of such litigation, as well as our associated legal expenses, may adversely affect our results.From time to time, we are subject to litigation. Litigation and claims can arise in various contexts, including, among others, our lending activities, deposit activities, employment practices, commercial agreements, fiduciary responsibilities, compliance programs, anti-money laundering programs and other general business matters. These claims and legal actions, including supervisory actions by our regulators, could involve large amounts in controversy, significant fines or penalties, and substantial legal costs necessary for our defense. The outcome of litigation and regulatory matters, as well as the timing associated with resolving these matters, are inherently hard to predict. Substantial legal liability, which may not be insured, and significant regulatory actions against us could materially and adversely impact our business operations, including our ability to engage in mergers and acquisitions, our results of operations and our financial condition.28The Federal Reserve Board’s source of strength doctrine could require that we divert capital to our subsidiary bank instead of applying available capital towards planned uses, such as engaging in acquisitions or paying dividends to shareholders.The FRB’s policies and regulations require that a bank holding company, including a financial holding company, serve as a source of financial strength to its subsidiary banks, and further provide that a bank holding company may not conduct operations in an unsafe or unsound manner. It is the FRB’s policy that a bank holding company should stand ready to use available resources to provide adequate capital to its subsidiary banks during periods of financial stress or adversity, such as during periods of significant loan losses, and that such holding company should maintain the financial flexibility and capital-raising capacity to obtain additional resources for assisting its subsidiary banks if such a need were to arise.A bank holding company’s failure to meet its obligations to serve as a source of strength to its subsidiary banks will generally be considered an unsafe and unsound banking practice or a violation of the FRB’s regulations, or both. Accordingly, if the financial condition of our subsidiary bank was to deteriorate, we could be compelled to provide financial support to our subsidiary bank at a time when, absent such FRB policy, we may not deem it advisable to provide such assistance. Under such circumstances, there is a possibility that we may not either have adequate available capital or feel sufficiently confident regarding our financial condition, to enter into acquisitions, pay dividends, or engage in other corporate activities.We may incur environmental liabilities with respect to properties to which we take title.A significant portion of our loan portfolio is secured by real estate. In the course of our business, we may own or foreclose and take title to real estate and could become subject to environmental liabilities with respect to these properties. We may become responsible to a governmental agency or third parties for property damage, personal injury, investigation and clean-up costs incurred by those parties in connection with environmental contamination, or may be required to investigate or clean-up hazardous or toxic substances, or chemical releases at a property. The costs associated with environmental investigation or remediation activities could be substantial. If we were to become subject to significant environmental liabilities, it could have a material adverse effect on our results of operations and financial condition.We may be subject to allegations of intellectual property infringement or may fail to effectively protect our own intellectual property rights.Our competition, or other third parties, may allege that we have violated their intellectual property rights. For example, we may unintentionally infringe upon the rights of third parties through the use of infringing software or other types of content provided by vendors. Alternatively, failure to effectively protect our own intellectual property through trade secret, copyright, patents, and other legal means may result in it being used to the benefit of others and to the detriment of our business. A successful claim of infringement could subject us to money damages, require significant license or royalty fees, or result in restrictions preventing us from using certain software or technology, thereby impeding our delivery of products or services. Even if ultimately unsuccessful, the financial cost of a legal defense and the diversion of management’s attention from our business may prove costly.Risks Related to the Company’s SecuritiesThe holders of our subordinated notes and subordinated debentures have rights that are senior to those of our common shareholders. If we defer payments of interest on our outstanding subordinated debentures or if certain defaults relating to those debentures occur, we will be prohibited from declaring or paying dividends or distributions on, and from making liquidation payments with respect to, our common stock.We have subordinated debentures issued in connection with trust preferred securities. Payments of the principal and interest on the trust preferred securities are unconditionally guaranteed by us. The subordinated debentures are senior to our shares of common stock. As a result, we must make payments on the subordinated debentures (and the related trust preferred securities) before any dividends can be paid on our common stock and,stock. In addition, in the event of our bankruptcy, dissolution or liquidation, the holders of both the subordinated debentures and the subordinated notes must be satisfied before any distributions can be made to the holders of our common stock. We have the right to defer distributions on the subordinated debentures (and the related trust preferred securities) for up to five years, during which time no dividends may be paid to holders of our capital stock. If we elect to defer or if we default with respect to our obligations to make payments on these subordinated debentures, this would likely have a material adverse effect on the market value of our common stock. Moreover, without notice to or consent from the holders of our common stock, we may issue additional series of subordinated debt securities in the future with terms similar to those of our existing subordinated debt securities or enter into other financing agreements that limit our ability to purchase or to pay dividends or distributions on our capital stock.29We may be unable to, or choose not to, pay dividends on our common stock.We cannot assure you of our ability to continue to pay dividends. Our ability to pay dividends depends on the following factors, among others:·We may not have sufficient earnings since our primary source of income, the payment of dividends to us by our subsidiary banks, is subject to federal and state laws that limit the ability of those banks to pay dividends;·FRB policy requires bank holding companies to pay cash dividends on common stock only out of net income available over the past year and only if prospective earnings retention is consistent with the organization’s expected future needs and financial condition; and·Our Board of Directors may determine that, even though funds are available for dividend payments, retaining the funds for internal uses, such as expansion of our operations, is a better strategy.•We may not have sufficient earnings since our primary source of income, the payment of dividends to us by our subsidiary bank, is subject to federal and state laws that limit the ability of the bank to pay dividends;•FRB policy requires bank holding companies to pay cash dividends on common stock only out of net income available over the past year and only if prospective earnings retention is consistent with the organization’s expected future needs and financial condition; and•Our Board of Directors may determine that, even though funds are available for dividend payments, retaining the funds for internal uses, such as expansion of our operations, is a better strategy.If we fail to pay dividends, capital appreciation, if any, of our common stock may be the sole opportunity for gains on an investment in our common stock. In addition, in the event our subsidiary banks becomebank becomes unable to pay dividends to us, we may not be able to service our debt or pay our other obligations or pay dividends on our common stock. Accordingly, our inability to receive dividends from our subsidiary banksbank could also have a material adverse effect on our business, financial condition and results of operations and the value of your investment in our common stock.There may be future sales of additional common stock or preferred stock or other dilution of our equity, which may adversely affect the value of our common stock.We are not restricted from issuing additional common stock or preferred stock, including any securities that are convertible into or exchangeable for, or that represent the right to receive, common stock or preferred stock or any substantially similar securities. The value of our common stock could decline as a result of sales by us of a large number of shares of common stock or preferred stock or similar securities in the market or the perception that such sales could occur.Shares of our common stock, as well as our other securities, are not insured deposits and may lose value.Shares of the Company’s common stock, as well as our other securities, are not savings accounts, deposits, or other obligations of any depository institution, and those shares are not insured by the FDIC or any other governmental agency or instrumentality or private insurer. Investments in shares of the Company’s common stock or other securities, therefore, are subject to investment risk, including the possible loss of principal.Anti-takeover provisions could negatively impact our shareholders.Provisions of our articles of incorporation and by-laws and federal banking laws, including regulatory approval requirements, could make it more difficult for a third party to acquire us, even if doing so would be perceived to be beneficial to our shareholders. The combination of these provisions effectively inhibits a non-negotiated merger or other business combination, which, in turn, could adversely affect the market price of our common stock. These provisions could also discourage proxy contests and make it more difficult for holders of our common stock to elect directors other than the candidates nominated by our Board of Directors.1630General Risk FactorsOur management has broad discretion over the use of proceeds from future stock offerings.Although we generally indicate our intent to use the proceeds from stock offerings for general corporate purposes, including funding internal growth and selected future acquisitions, our Board of Directors retains significant discretion with respect to the use of the proceeds from possible future offerings. If we use the funds to acquire other businesses, there can be no assurance that any business we acquire will be successfully integrated into our operations or otherwise perform as expected.Our recent results do not indicate our future results and may not provide guidance to assess the risk of an investment in our common stock.We may not be able to sustain our historical rate of growth or be able to expand our business. Various factors, such as economic conditions, regulatory and legislative considerations and competition, may also impede or prohibit our ability to expand our market presence. We may also be unable to identify advantageous acquisition opportunities or, once identified, enter into transactions to make such acquisitions. If we are not able to successfully grow our business, our financial condition and results of operations could be adversely affected.Weather-related events or natural or man-made disasters could cause a disruption in our business or have other effects which could adversely impact our financial condition and results of operations.We have operations in the mid-south and certain great plains states, areas susceptible to tornados and severe weather events. In addition, our operations and a significant number of our branches are located in the New Madrid Seismic Zone. While we have in place a business continuity plan, such events could potentially disrupt our operations or result in physical damage to our branch office locations. Severe weather events or earthquakes could also impact the value of any collateral we hold, or significantly disrupt the local economies in the markets that we serve, manifesting in a decline in loan originations, as well as an increase in the risk of delinquencies, defaults, and foreclosures.ITEM 1B.UNRESOLVED STAFF COMMENTSThereITEM 1B. UNRESOLVED STAFF COMMENTSNone.ITEM 1C. CYBERSECURITYWe maintain an information security program and governance structure for assessing, identifying, and managing material risks from cybersecurity threats.Risk Management and StrategyOur information security program is led by our chief information security officer (“CISO”), who has over 25 years of experience in technology management, has 8 years of banking experience, and is a certified information systems security professional. The CISO oversees our “information security team” within our information technology department, which includes our identity and access management group, our security operations center group, and our security engineering and security architecture groups. These groups develop, deploy, monitor, and manage multiple processes, systems, and controls, including embedded controls within the technology we use, designed to help identify, protect against, detect, respond to, and recover from cybersecurity threats and incidents.In addition to our information security team, we also employ an IT risk and compliance director who has over 18 years of IT governance, risk, and compliance experience and is responsible for the development, monitoring, and reporting of IT-related key risk indicators (“KRIs”), including KRIs related to cyber risks. Both our CISO and our IT risk and compliance director report to our chief information officer (“CIO”), who has more than 25 years of technology leadership experience, including leadership experience at global financial institutions, and is responsible, among other things, for oversight of our information technology environment, strategy, and security risks.As part of our information security program, we undertake efforts to monitor new and emerging risks and evaluate the effectiveness and maturity of our cyber defenses through various means, including internal audits, targeted testing (including penetration testing), incident response exercises, maturity assessments, and industry benchmarking. In connection with these efforts, we use, on an as-needed basis, certain third-parties, including auditors, consultants, and others, that have particular cyber expertise.31We also maintain multiple groups that help oversee risks associated with our third-party service providers. These groups include (1) our third-party risk management department, which facilitates reviews of certain third parties by our assurance providers, including our information security and business continuity teams, (2) our vendor council, which reviews contractual terms (including, at times, terms related to confidentiality and data protection) for certain third-party relationships, and (3) our architecture review board, which reviews certain new business initiatives that may impact the Company’s technical and/or security architecture.Our information security program is one component of our broader enterprise risk management program. As such, KRIs related to cyber risk (which are currently no unresolved Commission staff comments.a subset of operational risk KRIs) are reported to, and overseen and monitored by, our enterprise risk management committee, which is comprised of senior executives of the Company. Additionally, we maintain an incident response framework that details the applicable teams, their functions, and guidelines when a cybersecurity incident occurs. The framework is designed to cover significant aspects of the incident including detection, containment, remediation, and post incident analysis. Various groups of senior executives help oversee responses to security incidents, including the data loss prevention team, the core computer security incident response team, and the extended computer security incident response team.While we do not believe that our business strategy, results of operations, or financial condition have been materially adversely affected by any cybersecurity incidents, cybersecurity threats are constant, and, like other financial institutions, we, as well as our customers, employees, and third-party service providers, have experienced a significant increase in information security and cybersecurity risk in recent years and will likely continue to be the target of cyber-attacks. We continue to assess the risks and changes in the cyber environment, reasonably invest in enhancements to our cybersecurity capabilities, and engage in industry and government forums to promote advancements in our cybersecurity capabilities. See the risk factor “Our business is heavily reliant on information technology systems, facilities, and processes; and a disruption in those systems, facilities, and processes, or a breach, including cyber-attacks, in the security of our systems, could have significant, negative impact on our business, result in the disclosure of confidential information, and create significant financial and legal exposure for us.” in “Item 1A. Risk Factors” of this Form 10-K for more information.GovernanceOur board of directors is aware of, and takes seriously, the importance of overseeing risks associated with cybersecurity threats. Senior management has provided the board of directors with cybersecurity information, as well as incident response training. Additionally, employees have received training related to cybersecurity. Cyber risks are incorporated into risk appetite metrics for operational risk and presented to and reviewed by the risk committee of the board of directors. Additionally, the audit committee of the board of directors receives and reviews internal audit reports concerning, among other things, matters related to information security. Furthermore, the board of directors of Simmons Bank, the Company’s primary operating subsidiary, has established an information technology committee (“IT Committee”) that receives regular reports from the CISO and CIO concerning our information security program and cybersecurity matters. The CIO also reports IT KRIs, including those related to cyber risks, to the IT Committee. Significant security incidents are also reported by senior management to the IT Committee or its chairman, when warranted. The IT Committee chairman provides reports of the committee’s activities to the board of directors of Simmons Bank. The Company’s board of directors, or the board of directors of Simmons Bank (as applicable), also approves information security-related policies, including the Acceptable Use Policy, Information Security Policy, IT Ransomware Policy, and Business Continuity Management Policy.With respect to internal management, the CISO and CIO meet regularly to discuss the activities and operations of the information security team, and the CIO holds regular meetings with our chief executive officer to discuss cyber related matters, information technology issues, and cybersecurity threats. To enhance awareness, monitoring, and oversight of cybersecurity risks, management also uses the following internal committees (in addition to the enterprise risk management committee discussed above): (1) the IT strategy and investment committee, which is comprised of senior executives and helps provide oversight of the investment and strategic direction for the Company’s IT function, (2) the IT steering committee, which is comprised of leaders from various business units and helps provide oversight and direction for inter- and intra-departmental IT related initiatives, and (3) the vulnerability management working group, which is comprised of IT leaders and helps establish appropriate roles, responsibilities, and escalation paths to resolve department and enterprise vulnerabilities within service level agreements.32ITEM 2.PROPERTIESITEM 2. PROPERTIES The principal offices of the Company and of its subsidiary bank, Simmons Bank, consist of an eleven-story office building and adjacent office space located in the centraldowntown business district of the city of Pine Bluff, Arkansas. A portion of those offices is subject to a ground lease that expires March 31, 2057. We have additional corporate offices located in Little Rock, Arkansas.The Company and its subsidiaries own or lease additional offices in the states of Arkansas, Colorado, Kansas, Missouri, Oklahoma, Tennessee and Texas. The Company and its subsidiary bankssubsidiaries conduct financial operations from approximately 200234 financial centers located in communities throughout Arkansas, Colorado, Kansas, Missouri, Oklahoma, Tennessee and Texas. We believe our properties are suitable and adequate for our present operations.ITEM 3.LEGAL PROCEEDINGSITEM 3. LEGAL PROCEEDINGSThe Company and/or its subsidiaries have various unrelated legal proceedings, most of which involve loan foreclosure activity pending, which,information contained in the aggregate, are not expected to have a material adverse effect on the financial positionNote 22, Contingent Liabilities, of the Company and its subsidiaries.ITEM 4. MINE SAFETY DISCLOSURESNot applicable.33PART IIITEM 5.MARKET FOR REGISTRANT’S COMMON EQUITY, RELATED STOCKHOLDER MATTERS AND ISSUER PURCHASES OF EQUITY SECURITIESITEM 5. MARKET FOR REGISTRANT’S COMMON EQUITY, RELATED STOCKHOLDER MATTERS AND ISSUER PURCHASES OF EQUITY SECURITIESOur common stock is listed on the NASDAQNasdaq Global Select Market under the symbol “SFNC.” Set forth below are the high and low sales prices for our common stock as reported by the NASDAQ Global Select Market for each quarter of the fiscal years ended December 31, 2017 and 2016. Also set forth below are dividends declared per share in each of these periods. The quarterly stock prices and dividends declared per common share presented below have been adjusted to reflect the effect of the two-for-one stock split of our common stock effected on February 8, 2018: Quarterly Price Per Dividends Common Share Per Common High Low Share 2017 1st quarter $ 31.65 $ 25.50 $ 0.125 2nd quarter 27.83 24.88 0.125 3rd quarter 29.33 24.98 0.125 4th quarter 30.23 27.08 0.125 2016 1st quarter $ 25.73 $ 19.15 $ 0.12 2nd quarter 24.15 21.01 0.12 3rd quarter 25.23 22.13 0.12 4th quarter 33.50 22.95 0.12 On February 12, 2018, the closing price for our common stock as reported on the NASDAQ was $29.00. As of February 12, 2018,23, 2024, there were 2,046approximately 2,379 shareholders of record of our common stock.The timing See the amountAnalysis of future dividends are at the discretionFinancial Condition and Results of Operations, for additional information regarding cash dividends.Issuer Purchases of Equity SecuritiesEffective July 23, 2021, our Board of Directors approved an amendment to the Company’s stock repurchase program originally approved in October 2019 and will depend upon our consolidated earnings, financial condition, liquidity and capital requirements,first amended in March 2020 (“2019 Program”) that increased the amount of cash dividends paidour Class A Common Stock that may be repurchased under the 2019 Program from a maximum of $180.0 million to us bya maximum of $276.5 million and extended the term of the 2019 Program from October 31, 2021, to October 31, 2022. The repurchase authorization under the 2019 Program was substantially exhausted during January 2022.On January 27, 2022, we announced a new stock repurchase program (“2022 Program”) under which we may repurchase up to $175.0 million of our subsidiaries, applicable government regulationsClass A Common Stock currently issued and policies and other factors considered relevant by our Board of Directors. Ouroutstanding. The 2022 Program replaced the 2019 Program.Because the 2022 Program was set to terminate on January 31, 2024, the Company’s Board of Directors anticipates that weauthorized a new stock repurchase program in January 2024 (“2024 Program”) under which the Company may repurchase up to $175.0 million of its Class A common stock currently issued and outstanding. The 2024 Program has replaced the 2022 Program.The timing, pricing, and amount of any repurchases under the 2024 Program will continue to pay quarterly dividends in amountsbe determined by management at its discretion based on thea variety of factors, discussed above. However, there can be no assurance that we will continueincluding, but not limited to, pay dividends ontrading volume and market price of our common stock, corporate considerations, the Company working capital and investment requirements, general market and economic conditions, and legal requirements. Under the 2024 Program, we may repurchase shares of our Class A Common Stock through open market and privately negotiated transactions or otherwise. The 2024 Program does not obligate us to repurchase any of our Class A Common Stock and may be modified, discontinued, or suspended at the current levels or at all.Our principal source of funds for dividend payments to our stockholders is distributions, including dividends, from our subsidiary banks, which is subject to restrictions tied to such institution’s earnings. Under applicable banking laws, the declaration of dividends by Simmons Bank in any year in an amount equal to or greater than 75% of its net profits, after all taxes for that year plus 75% of the retained net profitstime without prior notice. We anticipate funding for the immediately preceding year must be approved by the Arkansas State Bank Department. At December 31, 2017, approximately $7.5 million was2024 Program to come from available for the paymentsources of dividends by our subsidiary banks without regulatory approval. For further discussion of restrictionsliquidity, including cash on the payment of dividends, see “Quantitativehand and Qualitative Disclosures About Market Risk – Liquidity and Market Risk Management,” and Note 21, Undivided Profits, of Notes to Consolidated Financial Statements.
future cash flow.17Stock RepurchaseThe Company made no purchases of its common stock during the three months ended or yearsDecember 31, 2023. As of December 31, 2023, the Company had approximately $39.9 million of remaining funds that could have been used to repurchase shares of the Company’s Class A Common Stock under the 2022 Program. The 2024 Program has since replaced the 2022 Program.Information concerning our repurchases of Class A Common Stock during the quarter ended December 31, 2017 and 2016. Under the current2023 is as follows:Period Total Number of Shares Purchased (1)Average Price Paid per Share Total Number of Shares Purchased as Part of Publicly Announced Plans or Programs Approximate Dollar Value of Shares that May Yet Be Purchased Under the Plans or Programs October 1, 2023 - October 31, 2023 — $ — — $ 39,922,000 November 1, 2023 - November 30, 2023 — — — $ 39,922,000 December 1, 2023 - December 31, 2023 — — — $ 39,922,000 Total — $ — — _________________________ (1)No shares of restricted stock repurchase plan, we can repurchase an additional 308,272 shares (split adjusted).34Performance GraphThe performance graph below compares the cumulative total shareholder return on the Company’s Common Stock with the cumulative total return onof the equity securities of companies included in the NASDAQ CompositeRussell 2000 Index and the SNL U.S. Bank & ThriftKBW Nasdaq Regional Banking Index. The graph assumes an investment of $100 on December 31, 20122018 and reinvestment of dividends on the date of payment without commissions. The performance graph represents past performance and should not be considered as an indication of future performance.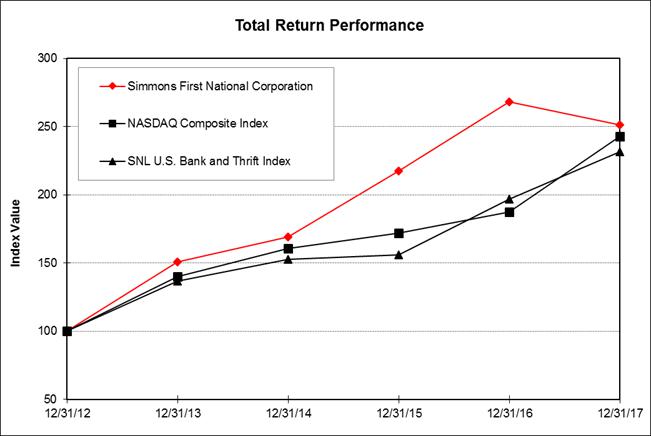
Period Ending Index 12/31/12 12/31/13 12/31/14 12/31/15 12/31/16 12/31/17 Simmons First National Corporation 100.00 150.99 168.89 217.64 268.42 251.13 NASDAQ Composite 100.00 140.12 160.78 171.97 187.22 242.71 SNL U.S. Bank & Thrift 100.00 136.92 152.85 155.94 196.86 231.49 18ITEM 6.SELECTED CONSOLIDATED FINANCIAL DATAThe following table sets forth selected consolidated financial data concerning the Company and is qualified in its entirety by the detailed information and consolidated financial statements, including notes thereto, included elsewhere in this report. The income statement, balance sheet and per common share data as of and for the years ended December 31, 2017, 2016, 2015, 2014, and 2013, were derived from consolidated financial statements of the Company, which were audited by BKD, LLP. Results from past periods are not necessarily indicative of results that may be expected for any future period.Management believes that certain non-GAAP measures, including diluted core earnings per share, tangible book value, the ratio of tangible common equity to tangible assets, tangible stockholders’ equity and return on average tangible equity, may be useful to analysts and investors in evaluating the performance of our Company. We have included certain of these non-GAAP measures, including cautionary remarks regarding the usefulness of these analytical tools, in this table. The selected consolidated financial data set forth below should be read in conjunction with the financial statements of the Company and related notes thereto and “Management's Discussion and Analysis of Financial Condition and Results of Operations” included elsewhere in this report. See the “GAAP Reconciliation of Non-GAAP Financial Measures” for additional discussion of non-GAAP measures. Years Ended December 31 (In thousands, except per share & other data) 2017 2016 2015 2014 2013 Income statement data: Net interest income $ 354,930 $ 279,206 $ 278,595 $ 171,064 $ 130,850 Provision for loan losses 26,393 20,065 9,022 7,245 4,118 Net interest income after provision for loan losses 328,537 259,141 269,573 163,819 126,732 Non-interest income 138,765 139,382 94,661 62,192 40,616 Non-interest expense 312,379 255,085 256,970 175,721 134,812 Income before taxes 154,923 143,438 107,264 50,290 32,536 Provision for income taxes 61,983 46,624 32,900 14,602 9,305 Net income 92,940 96,814 74,364 35,688 23,231 Preferred stock dividends -- 24 257 -- -- Net income available to common shareholders $ 92,940 $ 96,790 $ 74,107 $ 35,688 $ 23,231 Per share data(9): Basic earnings 1.34 1.58 1.32 1.06 0.71 Diluted earnings 1.33 1.56 1.31 1.05 0.71 Diluted core earnings (non-GAAP) (1) 1.70 1.64 1.59 1.14 0.84 Book value 22.65 18.40 17.27 13.69 12.44 Tangible book value (non-GAAP) (2) 12.34 11.98 10.98 10.07 9.56 Dividends 0.50 0.48 0.46 0.44 0.42 Basic average common shares outstanding 69,384,500 61,291,296 56,167,592 33,757,532 32,678,670 Diluted average common shares outstanding 69,852,920 61,927,092 56,419,322 33,844,052 32,704,334 Balance sheet data at period end: Assets 15,055,806 8,400,056 7,559,658 4,643,354 4,383,100 Investment securities 1,957,575 1,619,450 1,526,780 1,082,870 957,965 Total loans 10,779,685 5,632,890 4,919,355 2,736,634 2,404,935 Allowance for loan losses (excluding acquired loans) (3) 41,668 36,286 31,351 29,028 27,442 Goodwill and other intangible assets 948,722 401,464 380,923 130,621 93,501 Non-interest bearing deposits 2,665,249 1,491,676 1,280,234 889,260 718,438 Deposits 11,092,875 6,735,219 6,086,096 3,860,718 3,697,567 Other borrowings 1,380,024 273,159 162,289 114,682 117,090 Subordinated debt and trust preferred 140,565 60,397 60,570 20,620 20,620 Stockholders’ equity 2,084,564 1,151,111 1,076,855 494,319 403,832 Tangible stockholders’ equity (non-GAAP) (2) 1,135,842 749,647 665,080 363,698 310,331 Capital ratios at period end: Common stockholders’ equity to total assets 13.85 % 13.70 % 13.84 % 10.65 % 9.21 % Tangible common equity to tangible assets (non-GAAP) (4) 8.05 % 9.37 % 9.26 % 8.06 % 7.23 % Tier 1 leverage ratio 9.21 % 10.95 % 11.20 % 8.77 % 9.22 % Common equity Tier 1 risk-based ratio 9.80 % 13.45 % 14.21 % n/a n/a Tier 1 risk-based ratio 9.80 % 14.45 % 16.02 % 13.43 % 13.02 % Total risk-based capital ratio 11.35 % 15.12 % 16.72 % 14.50 % 14.10 % Dividend payout to common shareholders 37.59 % 30.67 % 34.98 % 41.71 % 59.15 % 19
Period Ending Index 12/31/2018 12/31/2019 12/31/2020 12/31/2021 12/31/2022 12/31/2023 Simmons First National Corporation 100.00 113.90 95.56 134.10 101.08 97.08 Russell 2000 Index 100.00 125.53 150.58 172.90 137.56 160.85 KBW Nasdaq Regional Banking Index 100.00 123.81 113.03 154.45 143.75 143.17 Years Ended December 31 2017 2016 2015 2014 2013 Annualized performance ratios: Return on average assets 0.92 % 1.25 % 1.03 % 0.80 % 0.64 % Return on average common equity 6.68 % 8.75 % 7.90 % 8.11 % 5.33 % Return on average tangible equity (non-GAAP) (2) (5) 11.26 % 13.92 % 12.53 % 10.99 % 6.36 % Net interest margin (6) 4.07 % 4.19 % 4.55 % 4.47 % 4.21 % Efficiency ratio (7) 55.27 % 56.32 % 59.01 % 67.22 % 71.20 % Balance sheet ratios: (8) Nonperforming assets as a percentage of period-end assets 0.52 % 0.79 % 0.85 % 1.25 % 1.69 % Nonperforming loans as a percentage of period-end loans 0.81 % 0.91 % 0.58 % 0.63 % 0.53 % Nonperforming assets as a percentage of period-end loans and OREO 1.38 % 1.53 % 1.94 % 2.76 % 4.10 % Allowance to nonperforming loans 90.26 % 92.09 % 165.83 % 223.31 % 297.89 % Allowance for loan losses as a percentage of period-end loans 0.73 % 0.84 % 0.97 % 1.41 % 1.57 % Net charge-offs (recoveries) as a percentage of average loans 0.35 % 0.40 % 0.17 % 0.30 % 0.27 % Other data Number of financial centers 200 150 149 109 131 Number of full time equivalent employees 2,640 1,875 1,946 1,338 1,343 ITEM 6. [RESERVED]35(1)Diluted core earnings per share is a non-GAAP financial measure. Diluted core earnings per share excludes from net income certain non-core items and then is divided by average diluted common shares outstanding. See “GAAP Reconciliation of Non-GAAP Financial Measures” below for a GAAP reconciliation of this non-GAAP financial measure.(2)Because of Simmons’ significant level of intangible assets, total goodwill and core deposit premiums, management of Simmons believes a useful calculation for investors in their analysis of Simmons is tangible book value per share, which is a non-GAAP financial measure. Tangible book value per share is calculated by subtracting goodwill and other intangible assets from total common shareholders’ equity, and dividing the resulting number by the common stock outstanding at period end. See “GAAP Reconciliation of Non-GAAP Financial Measures” below for a GAAP reconciliation of this non-GAAP financial measure.(3)Allowance for loan losses includes $418,000 at December 31, 2017 and $954,000 at December 31, 2016 and 2015 for loans acquired (not shown in the table above). The total allowance for loan losses at December 31, 2017, 2016 and 2015 was $42,086,000, $37,240,000 and $32,305,000, respectively.(4)Tangible common equity to tangible assets ratio is a non-GAAP financial measure. The tangible common equity to tangible assets ratio is calculated by dividing total common shareholders’ equity less goodwill and other intangible assets (resulting in tangible common equity) by total assets less goodwill and other intangible assets as of and for the periods ended presented above. See “GAAP Reconciliation of Non-GAAP Financial Measures” below for a GAAP reconciliation of this non-GAAP financial measure.(5)Return on average tangible equity is a non-GAAP financial measure that removes the effect of goodwill and other intangible assets, as well as the amortization of intangibles, from the return on average equity. This non-GAAP financial measure is calculated as net income, adjusted for the tax-effected effect of intangibles, divided by average tangible equity which is calculated as average shareholders’ equity for the period presented less goodwill and other intangible assets. See “GAAP Reconciliation of Non-GAAP Financial Measures” below for a GAAP reconciliation of this non-GAAP financial measure.(6)Fully taxable equivalent (assuming an income tax rate of 39.225%).(7)The efficiency ratio is noninterest expense before foreclosed property expense and amortization of intangibles as a percent of net interest income (fully taxable equivalent) and noninterest revenues, excluding gains and losses from securities transactions and non-core items. See “GAAP Reconciliation of Non-GAAP Financial Measures” below for a GAAP reconciliation of this non-GAAP financial measure.(8)Excludes all loans acquired and excludes foreclosed assets acquired, covered by FDIC loss share agreements, except for their inclusion in total assets(9)Share and per share amounts have been restated for the two-for-one stock split in February 2018.20ITEM 7. MANAGEMENT’S DISCUSSION AND ANALYSIS OF FINANCIAL CONDITION AND RESULTS OF OPERATIONSThe following discussion and analysis presents the more significant factors that affected our financial condition as of December 31, 2023 and 2022 and results of operations for each of the years then ended. Refer to “Management’s Discussion and Analysis of Financial Condition and Results of Operations” included in our Annual Report on Form 10-K filed with the SEC on February 27, 2023 (the “2022 Form 10-K”) for a discussion and analysis of the more significant factors that affected the 2021 period, which are incorporated herein by reference. Certain immaterial reclassifications have been made to make prior periods comparable. This discussion and analysis should be read in conjunction with our financial statements, notes thereto and other financial information appearing elsewhere in this report, as well as the cautionary note regarding forward-looking statements and the risks discussed in Item 1A of Part I of this Form 10-K.ITEM 7.MANAGEMENT'S DISCUSSION AND ANALYSIS OF FINANCIAL CONDITION AND RESULTS OF OPERATIONSCritical Accounting Estimates Critical Accounting Policies & EstimatesOverview OverviewWe follow accounting and reporting policies that conform, in all material respects, to generally accepted accounting principles and to general practices within the financial services industry. The preparation of financial statements in conformity with generally accepted accounting principlesUS GAAP requires management to make estimates and assumptions that affect the amounts reported in the financial statements and accompanying notes. While we base estimates on historical experience, current information and other factors deemed to be relevant, actual results could differ from those estimates.We consider accounting estimates to be critical to reported financial results if (i) the accounting estimate requires management to make assumptions about matters that are highly uncertain and (ii) different estimates that management reasonably could have used for the accounting estimate in the current period, or changes in the accounting estimate that are reasonably likely to occur from period to period, could have a material impact on our financial statements.The accounting policies that we view as critical to us are those relating to estimates and judgments regarding (a) the determination of the adequacy of the allowance for loancredit losses, (b) acquisition accounting and valuation of covered loans, and related indemnification asset, (c) the valuation of goodwill and the useful lives applied to intangible assets, (d) the valuation of stock-based compensation plans and (e) income taxes.Allowance for LoanCredit Losses on Loans Not AcquiredThe allowance for loancredit losses is a reserve established through a provision for credit losses charged to expense, which represents management’s best estimate of probablelifetime expected losses based on reasonable and supportable forecasts, quantitative factors, and other qualitative considerations. The allowance, in the judgment of management, is necessary to reserve for expected credit losses and risks inherent in the loan portfolio. Loan losses are charged against the allowance when management believes the uncollectability of a loan balance is confirmed. Subsequent recoveries, if any, are credited to the allowance.TheOur allowance for loancredit loss methodology includes reserve factors calculated to estimate current expected credit losses to amortized cost balances over the remaining contractual life of the portfolio, adjusted for prepayments, in accordance with Accounting Standard Codification (“ASC”) Topic 326-20, calculated monthly based on management’s assessment of several factors such as (1)our reasonable and supportable economic forecasts, historical loss experience, based on volumes and types, (2) volume and trends in delinquencies and nonaccruals, (3) lending policies and procedures including those for loan losses, collections and recoveries, (4) national, state and local economic trends and conditions, (5) external factors and pressure from competition, (6) the experience, ability and depth of lending management and staff, (7) seasoning of new products obtained and new markets entered through acquisition and (8) other factors and trends that will affect specific loans and categories of loans. We establish general allocations for each major loan category. This category also includes allocations to loans which are collectively evaluated for loss such as credit cards, one-to-four family owner occupied residential real estate loans and other consumer loans. General reserves have been established, based uponqualitative adjustments. For further information see the aforementioned factors and allocated to the individual loan categories. Allowances are accruedsection Allowance for probable losses on specific loans evaluated for impairment for which the basis of each loan, including accrued interest, exceeds the discounted amount of expected future collections of interest and principal or, alternatively, the fair value of loan collateral.Our evaluation of the allowance for loancredit losses is inherently subjective as it requires material estimates. The actual amounts of loancredit losses realized in the near term could differ from the amounts estimated in arriving at the allowance for loancredit losses reported in the financial statements.In the first quarter of 2023, we refined the estimation process by improving systems, models, processes, methodology, and assumptions used within the calculation. After multiple parallel runs with the former process, it was determined that the changes did not and are not expected to result in material differences of results.36Acquisition Accounting, Acquired LoansWe account for our acquisitions under Accounting Standards Codification (“ASC”) Topic 805, Business Combinations, which requires the use of the purchaseacquisition method of accounting. All identifiable assets acquired, including loans, are recorded at fair value. No allowanceThe fair value for loan losses related to the acquired loans at the time of acquisition is recordedbased on the acquisition date asa variety of factors including discounted expected cash flows, adjusted for estimated prepayments and credit losses. In accordance with ASC 326, the fair value adjustment is recorded as premium or discount to the unpaid principal balance of theeach acquired loan. Loans that have been identified as having experienced a more-than-insignificant deterioration in credit quality since origination are purchased credit deteriorated (“PCD”) loans. The net premium or discount on PCD loans acquired incorporates assumptions regardingis adjusted by our allowance for credit risk. Loans acquired arelosses recorded at fair value in accordance with the fair value methodology prescribed in ASC Topic 820.time of acquisition. The fair value estimates associated with the loans include estimates related to expected prepayments and the amount and timing of undiscounted expected principal, interest and other cash flows.We evaluate loans acquired in accordance with the provisions of ASC Topic 310-20, Nonrefundable Fees and Other Costs. The fair valueremaining net premium or discount on these loans is accreted or amortized into interest income over the weighted average life of the loans using a constant yield method. These loans are not considered to be impaired loans. We evaluate purchased impaired loans in accordance with the provisions of ASC Topic 310-30, Loans and Debt Securities Acquired with Deteriorated Credit Quality. Purchased loans are considered impaired if there is evidence of credit deterioration since origination and if it is probable that not all contractually required payments will be collected. All loans acquired are considered impaired if there is evidence of credit deterioration since origination and if it is probable that not all contractually required payments will be collected.21For impaired loans accounted for under ASC Topic 310-30, we continue to estimate cash flows expected to be collected on purchased credit impaired loans. We evaluate at each balance sheet date whether the present value of our purchased credit impaired loans determined using the effective interest rates has decreased significantly and if so, recognize a provision for loan loss in our consolidated statement of income. For any significant increases in cash flows expected to be collected, we adjust the amount of accretable yield recognized on a prospective basis over the remaining life of the purchased credit impaired loan.Covered Loans and Related Indemnification AssetDuring the third quarter of 2015, the Bank entered into an agreement with the FDIC to terminate all remaining loss-sharing agreements. As a result, all FDIC-acquired assets are now classified as non-covered. All acquired loans are recorded at their discounted net present value; therefore, they are excluded from the computations of the asset quality ratios for the legacy loan portfolio, except for their inclusion in total assets. Under the early termination, all rights and obligations of the Bank and the FDIC under the FDIC loss share agreements, including the clawback provisions and the settlement of loss share and expense reimbursement claims, have been resolved and terminated.Under the terms of the agreement, the FDIC made a net payment of $2,368,000 to Simmons Bank as consideration for the early termination of the loss share agreements. The early termination was recorded in our financial statements by removing the FDIC indemnification asset, receivable from FDIC, the FDIC true-up provision and recording a one-time, pre-tax charge of $7,476,000.Prior to the termination of the loss share agreements, deterioration in the credit quality of the loans (immediately recorded as an adjustment to the allowance for loan losses) would immediately increase the basis of the shared-loss agreements, with the offset recorded through the consolidated statement of income. Increases in the credit quality or cash flows of loans (reflected as an adjustment to yield and accreted into income over the remaining life of the loans) decrease the basis of the shared-loss agreements, with such decrease beingloan using a constant yield method. The net premium or discount on loans that are not classified as PCD (“non-PCD”), that includes credit and non-credit components, is accreted or amortized into interest income over 1) the same period or 2) theremaining life of the shared-loss agreements, whichever is shorter. Loss assumptions used inloan using a constant yield method. We then record the basis ofnecessary allowance for credit losses on the indemnifiednon-PCD loans are consistent with the loss assumptions used to measure the indemnification asset. Fair value accounting incorporates into the fair value of the indemnification asset an element of the time value of money, which was accreted back into income over the life of the shared-loss agreements.Goodwill and Intangible AssetsGoodwill represents the excess of the cost of an acquisition over the fair value of the net assets acquired. Other intangible assets represent purchased assets that also lack physical substance but can be separately distinguished from goodwill because of contractual or other legal rights or because the asset is capable of being sold or exchanged either on its own or in combination with a related contract, asset or liability. We perform an annual goodwill impairment test, and more than annually if circumstances warrant, in accordance with ASC Topic 350, Intangibles – Goodwill and Other, as amended by ASU 2011-08 – TestingTesting Goodwill for Impairment and ASU 2017-04 - Intangibles – Goodwill and Other. ASC Topic 350 requires that goodwill and intangible assets that have indefinite lives be reviewed for impairment annually or more frequently if certain conditions occur. Our assessment depends on several assumptions which are dependent on market and economic conditions. Impairment losses on recorded goodwill, if any, will be recorded as operating expenses.Employee BenefitTo quantitatively test goodwill for impairment, a present value of discounted cash flows calculation is completed and relies on several assumptions that have a level of subjectivity and judgement. These assumptions are dependent on market and economic conditions. Key inputs to estimate terminal fair value of the Company include projected forecasts, noninterest expense savings and a pricing multiple based on a group of peer banks with similar characteristics. These inputs are discounted by the cost of equity, which includes assumptions involving our beta; equity risk, size and company premiums; and the 20-year treasury rate. Assumptions used in calculating the cost of equity are obtained from market and third-party data. Results are compared to book value and no impairment was indicated as of December 31, 2023. Judgement is inherent in assessing goodwill for impairment. The various assumptions used in assessing goodwill for impairment involve uncertainties that are beyond our control and could cause actual results to differ materially from those projected.Stock-Based Compensation PlansWe have adopted various stock-based compensation plans. The plans provide for the grant of incentive stock options, nonqualified stock options, stock appreciation rights, restricted stock awards, restricted stock units, and performance stock units.units, and stock awards. Pursuant to the plans, shares are reserved for future issuance by the Company upon exercise of stock options or awarding of bonus sharesrestricted stock, restricted stock units, performance stock units or stock awards granted to directors, officers and other key employees.In accordance with ASC Topic 718, Compensation – Stock Compensation, the fair value of each option award is estimated on the date of grant using the Black-Scholes option-pricing model that uses various assumptions. This model requires the input of highly subjective assumptions, changes to which can materially affect the fair value estimate. For additional information, see Note 14, Employee Benefit Plans, in the accompanying Notes to Consolidated Financial Statements included elsewhere in this report.Income TaxesWe are subject to the federal income tax laws of the United States, and the tax laws of the states and other jurisdictions where we conduct business. Due to the complexity of these laws, taxpayers and the taxing authorities may subject these laws to different interpretations. Management must make conclusions and estimates about the application of these innately intricate laws, related regulations, and case law. When preparing the Company’s income tax returns, management attempts to make reasonable interpretations of the tax laws. Taxing authorities have the ability to challenge management’s analysis of the tax law or any reinterpretation management makes in its ongoing assessment of facts and the developing case law. Management assesses the reasonableness of its effective tax rate quarterly based on its current estimate of net income and the applicable taxes expected for the full year. On a quarterly basis, management also reviews circumstances and developments in tax law affecting the reasonableness of deferred tax assets and liabilities and reserves for contingent tax liabilities.37222023 Overview The adoption of ASU 2016-09 – Compensation-Stock Compensation: Improvements to Employee Share-Based Payment Accounting decreased the effective tax rate during 2017 as the new standard impacted how the income tax effects associated with stock-based compensation are recognized.2017 Overview20172023 was $92.9$175.1 million, andor $1.38 diluted earnings per share, were $1.33 (split adjusted), compared to net income of $96.8$256.4 million, and $1.56or $2.06 diluted earnings per share, (split adjusted)for the same period in 2016. Net income for both 20172022. Included in 2023 results were $32.7 million of certain items, net of tax, that were primarily related to early retirement program costs, loss on sale of securities, a FDIC special assessment and 2016 included several significant non-corebranch right sizing initiatives. Included in 2022 results were $42.4 million of certain items, net of tax, that impacted net income, mostlywere primarily related to our acquisitions. Excluding all non-coreacquisitions, Day 2 accounting provision in connection with acquisitions, gain on an insurance settlement related to a weather event, merger related costs and branch right sizing initiatives. Adjusting for these certain items, coreadjusted earnings for the year ended December 31, 2017 was $119.02023 were $207.7 million, or $1.70$1.64 adjusted diluted core earnings per share, (split adjusted), compared to $101.4$298.8 million, or $1.64$2.40 adjusted diluted core earnings per share, (split adjusted) in 2016.2022. See “GAAPGAAP Reconciliation of Non-GAAP Financial Measures for additional discussion and reconciliationreconciliations of non-GAAP measures”.On January 17, 2017, we merged Simmons First Finance Company, a wholly-owned subsidiarymeasures.Throughout 2023, significant turmoil within the financial services industry, which was fueled by the failure of Simmons Bank, into Simmons Bank to reduce regulatory risks related to its operations relative to the size of its assets. At December 31, 2017, the loan balance of this portfolio was $29 million.In February 2017, we executed the sale of 11 substandard loans, which were primarily loans acquired, with a net principal balance of $11 million. We recognized a loss of $676,000 on this sale.During March 2017, we exited the indirect lending market as this is a low-margin unit and we made a financial decision to reallocate our capital resources. At December 31, 2017, the loan balance of this portfolio was $170 million.On May 15, 2017, we closed the transaction to acquire Hardeman County Investment Company, Inc. (“Hardeman”) including its wholly-owned bank subsidiary, First South Bank. The Company completed the systems conversion and merged First South Bank into Simmons Bank in September 2017. As a result of this acquisition, we recognized $7.9 million in pretax merger related expenses during year ended December 31, 2017.In June 2017, we executed a sale of thirty-five classified loans with a discounted principal balance of $13.8 million, which included $7.3 million of legacy loans and $6.5 million of loans acquired. The loans acquired portion of the sale resulted in a benefit of $1.4 million accretion income and $714,000 increase in provision expense for loans acquired, resulting in a net pretax benefit of approximately $700,000.During August 2017, we were the successful bidder at public auction held to discharge certain indebtedness owed to Simmons Bank and became the sole shareholder of Heartland Bank in Little Rock, Arkansas. In December 2017, Heartland Bank announced the sale of the majority of its branches,regional banks that utilized specialized business models as well as allcontinued inflationary pressures and recessionary fears, resulted in industry concerns around the level of itsuninsured, non-collateralized deposits, liquidity, capital and operations. Despite these challenges, which have seemed to Relyance Bank, N.A. The completionabate slightly in the latter half of the transaction is contingentyear, we remain resolute in serving our customers’ financial needs while diligently focusing on maintaining strong asset quality, capital and liquidity positions, and on strategies to improve our financial performance and maximize the satisfactionvalue of conditions set forthour shareholders’ investment in the purchasecurrent rate environment. We believe that our liquidity is solid and assumption agreement. The transactionthat our capital is expected to close in March 2018 andstrong:•Deposits were relatively stable over the Company will continue to work throughyear, which highlights the dispositiongranularity of Heartland Bank’s remaining assets and expects to be complete within one yearour deposit base, as well as the long-term relationships we have with many of the acquisition. See Note 4 for additional information related to assets and liabilities held for sale related to Heartland Bankour customers. Total deposits as of December 31, 2017.In September 2017,2023 were $22.24 billion, compared to $22.55 billion as of December 31, 2022. Uninsured deposits (excluding collateralized deposits and intercompany deposits) as of December 31, 2023 were approximately $4.75 billion, or 21% of total deposits.•Capital levels were steady during the year, with all regulatory capital ratios remaining significantly above “well-capitalized” guidelines as of December 31, 2023 (see Table 18 in the Risk Based Capital section below). As of December 31, 2023, our ratio of common equity to total assets was 12.53%, the ratio of tangible common equity to tangible assets was 7.69% and our Tier 1 leverage ratio was 9.39%.•Key credit quality metrics as of December 31, 2023 also remained solid, with our nonperforming loan coverage ratio at 267% and our allowance for credit losses as a percent of total loans ratio was 1.34%.•Significant liquidity position with a loan to deposit ratio of 76% as of December 31, 2023, compared to 72% as of December 31, 2022. Additional liquidity sources available to us as of December 31, 2023 totaled $11.22 billion and our uninsured, non-collateralized deposit coverage ratio was 2.4x.Simmons Bank was named to Forbes magazine’s 2023 list of “World’s Best Banks” for the fourth consecutive year and recognized by Forbes’ as one of “America’s Best Midsize Employers” for 2023. We continue to work to expand our suite of digital solutions to provide an enhanced customer experience to “bank when you want, where you want.”During 2023, we completed the sale of our propertyBetter Bank Initiative, which focused on programs designed to enhance operational processes and casualty insurance business linesincrease capacity to capitalize on organic growth opportunities, and an after-tax gain of $1.8 millionachieved success across multiple fronts. We completed our early retirement program and extensive progress was recognizedcompleted on the transaction. Tangible common equity was positively impacted by $7.2 million due to a reduction in intangible assetsother identified opportunities related to the sold business.We completed the acquisitions of Southwest Bancorp, Inc., including its wholly-owned bank subsidiary, Bank SNB,process improvements and First Texas BHC, Inc., including its wholly-owned bank subsidiary, Southwest Bank, in October 2017. The systems conversions are planned during the first half of 2018, at which time the subsidiary banks will be merged into Simmons Bank. Southwest Bank was merged in to Simmons Bank on February 20, 2018 and Bank SNB is scheduled to be merged in May 2018. See Note 2 for additional information related to these acquisitions.232017 was a momentous year for our Company. We created a stronger organization with assets exceeding $15 billion, expanded in to new territories, welcomed new associates and customers, all while maintaining our community first approach and producing exceptional results.streamlining or upgrading systems. As a result, we were able to achieve $18 million of acquisitionsannualized cost savings, compared to the original $15 million of annual cost savings we previously estimated.Asset quality metrics remain strong and compliance initiatives in recent reporting periods, we have and will continue to recognize one-time revenue and expense items which may skewreflect our short-term core business results but provide long-term performance benefits. Our focus continues to be improvement in core operating income.We are also very pleased with the positive trends in our balance sheet, as reflected in our organic loan growth during the past yearconservative credit culture, as well as our growth from acquisitions.Stockholders’ equity as of December 31, 20172023 was $2.1$3.43 billion, book value per share was $22.65 (split adjusted)$27.37 and tangible book value per common share was $12.34 (split adjusted).$15.92. Our ratio of common stockholders’ equity to total assets was 13.9%12.5% and the ratio of tangible common stockholders’ equity to tangible assets was 8.1%7.7% at December 31, 2017.2023. See “GAAPGAAP Reconciliation of Non-GAAP Financial Measures”Measures for additional discussion and reconciliationreconciliations of non-GAAP measures. The Company’s Tier I leverage ratioWe repurchased approximately 2.3 million shares of 9.2%, as well as our other regulatory capital ratios, remain significantly above the “well capitalized”. See Table 18 – Risk-Based Capital for regulatory capital ratios.38Total loans including loans acquired, were $10.7$16.85 billion at December 31, 2017,2023, an increase of $5.1 billion,$703.5 million, or 91.9%4.4%, from the same time in 2022. The increase in total loans during the period in 2016. Acquired loans increased by $3.8 billion, net of discounts, while legacy loans (all loans excluding acquired loans) grew $1.4 billion, or 31.9%. Excluding the $214 million in loan balances that migrated from acquired loans, legacy loans grew $1.2 billion, or 32.7%. We continue to be encouraged by the growth in our legacy loan portfolio throughout 2017. We have had very good legacyprimarily reflects diverse loan growth again this year, particularly fromdriven by increased activity throughout our targeted growth markets. Duegeographic footprint. Our unfunded commitments decreased to our increased size and scale we are benefiting from access to new lending opportunities as the Simmons Bank name becomes more familiar in these growth markets as well as in our historical legacy markets.We continue to have strong asset quality. At December 31, 2017, the allowance for loan losses for legacy loans was $41.7 million, with an additional $418,000 allowance for acquired loans. The loan discount credit mark was $89.3 million, for a total of $131.4 million of coverage. This equates to a total coverage ratio of 1.2% of gross loans. The ratio of credit mark and related allowance to acquired loans was 1.7%.The Company’s allowance for loan losses on legacy loans as a percent of total legacy loans was 0.73% at December 31, 2017. In the legacy portfolio, non-performing loans equaled 0.81% of total loans. Non-performing assets were 0.52% of total assets. The allowance for loan losses on legacy loans was 90% of non-performing loans. The Company’s annualized net charge-offs for 2017 were 0.35% of total loans. Excluding credit cards, annualized net charge-offs for 2017 were 0.31% of total loans.Total assets were $15.1$4.17 billion at December 31, 20172023, as compared to $8.4$5.64 billion at December 31, 2016,2022. While unfunded commitments are considered a key indicator of future loan growth, the rapid increase in interest rates, coupled with softer economic conditions, have resulted in lower activity in our commercial loan pipeline, which was $948.2 million as of December 31, 2023, compared to $1.12 billion at December 31, 2022.In our discussion and analysis of our financial condition and results of operation in this Item 7, “Management’s Discussion and Analysis of Financial Condition and Results of Operations,” we provide certain financial information determined by methods other than in accordance with US GAAP. We believe the presentation of non-GAAP financial measures provides a meaningful basis for period-to-period and company-to-company comparisons, which we believe will assist investors and analysts in analyzing the core financial measures of the Company and predicting future performance. See the GAAP Reconciliation of Non-GAAP Measures section below for additional discussion and reconciliations of non-GAAP measures.Simmons First National Corporation is an increaseArkansas-based financial holding company that, as of $6.7December 31, 2023, has approximately $27.35 billion due to three 2017 acquisitions along with strong legacy loan growth.Net Interest IncomeNet Interest Income Net interest income, our principal source of earnings, is the difference between the interest income generated by earning assets and the total interest cost of the deposits and borrowings obtained to fund those assets. Factors that determine the level of net interest income include the volume of earning assets and interest bearing liabilities, yields earned and rates paid, the level of non-performing loans and the amount of non-interestnoninterest bearing liabilities supporting earning assets. Net interest income is analyzed in the discussion and tables below on a fully taxable equivalent basis. The adjustment to convert certain income to a fully taxable equivalent basis consists of dividing tax-exempt income by one minus the combined federal and state income tax rate of 39.225% for years ended December 31, 2017 and prior.The FRB sets various benchmark interest rates including the Federal Funds rate, and thereby influenceswhich influence the general market rates of interest, including the deposit and loan rates offered by financial institutions. Between December 2015 and December 2018, the FRB had been gradually raising benchmark interest rates. The FRB target for the Federal Fundsfederal funds rate, which is the cost to banks of immediately available overnight funds, had remained unchanged at 0.00%increased gradually from 0% - 0.25% since0.50% in December 2008 through December 16, 2015 at which timeto 2.25% - 2.50% over a three year period. The federal funds rate was flat until the FRB did raisebegan to lower the targetrate in August 2019 and ultimately reduced it to 0.25%1.50% - 0.5%. The FRB raised this target rate again to 0.5% - 0.75% on December 14, 2016.1.75% in October 2019. During 2017,March 2020, the Federal Open Market Committee (“FOMC”) of the FRB raised this targetsubstantially reduced interest rates in response to the economic crisis brought on by the COVID-19 pandemic. The federal funds rate was cut to a range of 0% - 0.25%, where it remained throughout 2021 and into early 2022. During March 2022, the FOMC began a series of rate increases in March, Junean effort to curb rising inflation. From early 2022 through 2023, the federal funds rate range was increased on eleven occasions and December endingended 2023 with a range set at 1.25%5.25% - 1.50% as of December 14, 2017. 5.50%. To date in 2024, rates have been held steady by the FOMC.Our loan portfolio is significantly affected by changes in the prime interest rate. The prime interest rate, which is the rate offered on loans to borrowers with strong credit, had also remained unchanged atincreased from 3.25% from December 2008 to December 17,5.50% during the years 2015 when the rate increased to 3.5%. On December 15, 2016, the prime interest rate increased to 3.75%.through 2018. The prime interest rate alsoremained flat until it began to decrease in July 2019 and was eventually reduced to 4.75% in October 2019. Similarly to the reduction in the federal funds rate, the prime rate was cut to 3.25% in mid-March of 2020 in response to the COVID-19 pandemic and remained unchanged throughout 2021 and into early 2022. Paralleling the federal funds rate, multiple increases by the Federal Reserve during 2022 and 2023 increased three times during 2017 ultimately ending at 4.50%the prime rate to 8.50% as of December 14, 2017.Our practice is to limit exposure to interest rate movements by maintaining a significant portion of earning assets and interest bearing liabilities in shorter-termshort-term repricing. Historically,In the last several years, on average, approximately 70%41% of our loan portfolio and approximately 80%89% of our time deposits have repriced in one year or less. Through acquisitions our acquired loans tended to have longer maturities. In addition, due to market pressures the duration of our legacy loan portfolio has also extended over the past several years. Our current interest rate sensitivity shows that approximately 63%42% of our loans and 77%94% of our time deposits will reprice in the next year.
year, largely contributing to our liability-sensitive position at December 31, 2023.24For the year ended December 31, 2017,2023, net interest income on a fully taxable equivalent basis was $362.7$675.6 million, an increasea decrease of $75.7$66.4 million, fromor 9.0%, over the same period in 2016.2022. The increasedecrease in net interest income was primarily the result of a $94.0$349.2 million increase in interest income, more than offset by a $18.3$415.6 million increase in interest expense.39The increase in interest income primarily resulted from an incremental $86.8a $296.5 million ofincrease in interest income on loans, consisting of legacy loans and acquired loans, andcoupled with an increase of $6.5$48.0 million ofin interest income on investment securities. TheRegarding the increase in interest income on loans during 2023, the increase in loan volume during 2017 generated $92.3resulted in an increase of $117.6 million of additionalin interest income, while a 10113 basis point declineincrease in yield due to rising market rates resulted in a $5.5$178.9 million decreaseincrease in interest income.income during the year ended December 31, 2023. The interest incomeloan yield for 2023 was 5.96%, compared to 4.83% for 2022. The increase fromin our loan volume during 2023 was primarily due to the three acquisitions completed during 2017 as wellSpirit acquisition in the second quarter of 2022, combined with solid organic loan growth over the comparative period. The increase in interest income on investment securities reflects an increase of $66.0 million due to yield increases over the period of 132 basis points and 9 basis points for our taxable and non-taxable investment security portfolios, respectively, which were a result of rising market interest rates. The increase in interest income on investment securities due to yield increases was mitigated by a $17.9 million decrease due to the decline in our investment portfolio average balances which decreased by $861.5 million or 10.5%, as our legacyportfolio experienced pay downs and maturities over the period, which was reinvested into our loan growth.Included in interest income is the additional yield accretion recognized as a result of updated estimates of the cash flows of our acquired loans as discussed in Note 6, Loans Acquired, in the accompanying Notes to Consolidated Financial Statements included elsewhere in this report.acquired. Each quarter, we estimate the cash flows expected to be collected from the loans acquired, loans, and adjustments may or may not be required. The cash flows estimate has increasedmay increase or decrease based on payment histories and reduced loss expectations of the loans. This resulted in increasedThe resulting adjustment to interest income that is spread on a level-yield basis over the remaining expected lives of the loans. For the years ended December 31, 2023, 2022 and 2021, interest income included $8.8 million, $23.9 million and $22.1 million, respectively, for the yield accretion recognized on loans previously covered by FDIC loss sharing agreements, any increasesacquired.The $415.6 million increase in expected cash flows also reduced the amount of expected reimbursements under the loss-sharing agreements, which were recorded as indemnification assets. The estimated adjustmentsinterest expense is mostly due to the indemnification assets were amortized on a level-yield basisincrease in our deposit account rates over the remainderperiod, combined with the additional deposit base from the Spirit acquisition and change in deposit mix as the market experiences a shift in consumer sentiment given the attractiveness of higher yielding time deposits in the loss-sharing agreements orcurrent higher interest rate environment. Interest expense increased $323.4 million due to the increase in rate of 212 basis points on interest-bearing deposit accounts and increased $50.5 million due to the increase in deposit volume over the period. Additionally, interest expense increased $35.3 million due to the increase in rate of 302 basis points on other borrowings. We continually monitor and look for opportunities to fairly reprice our deposits while remaining expected life of the loan pools, whichever was shorter, and were recordedcompetitive in non-interest expense.Our net interest margin on a fully tax equivalent basis was 4.07%2.78% for the year ended December 31, 2017,2023, down 1239 basis points from 2016.2022. The most significant factordecrease in the decreasing margin during the year is the impact of the lower accretable yield adjustments on acquired loans, previously discussed. Normalized for all accretion, our core net interest margin at December 31, 2017 and 2016 was 3.76% and 3.83%, respectively. Our margin has been weakened from the impact of the accretable yield adjustments discussed above. The normalized core net interest margin decrease is indicative of strong market pressure on loan rates in the competitive loan environment.Our net interest margin was 4.19%due to the rising deposit rate pressure and 4.55%change in deposit mix previously discussed, mitigated by the overall increase in our earning assets average balances over the comparative periods which has improved interest income in the rising rate environment.Over the course of 2024, we anticipate moderating pressure on our margin due to several factors. We saw moderate organic loan growth during 2023, but our loan pipeline experienced decreased volume throughout the year. We expect further modest organic loan growth during 2024, subject to macroeconomic uncertainties that may reduce or otherwise impact loan demand, with continued focus on maintaining prudent underwriting standards and pricing discipline given projects surrounding near term future economic growth. We sold $241.1 million of low yield AFS securities late in the fourth quarter of 2023, and used sale proceeds to pay off higher rate wholesale fundings and we will continue to evaluate opportunities to optimize our balance sheet based on changing market conditions. Further, we have $1.0 billion of fixed rate callable municipal securities held in the AFS portfolio under swap agreements, which involve the payment of fixed interest rates with a weighted average of 1.21% in exchange for variable interest rates based on federal funds rates that began in the years ended December 31, 2016third quarter of 2023. Additionally, while our most likely forecast embeds several rate cuts during 2024, there is still much uncertainty as to decisions that will be made by the FOMC and 2015, respectively.
the risks present in the economy.2540Tables 1 and 2 reflect an analysis of net interest income on a fully taxable equivalent basis for the years ended December 31, 2017, 20162023, 2022 and 2015,2021, respectively, as well as changes in fully taxable equivalent net interest margin for the years 20172023 versus 20162022 and 20162022 versus 2015.Table 1: Analysis of Net Interest Margin(FTE =Fully= Fully Taxable Equivalent) Years Ended December 31 (In thousands) 2017 2016 2015 Interest income $ 395,004 $ 301,005 $ 300,948 FTE adjustment 7,723 7,722 8,518 Interest income - FTE 402,727 308,727 309,466 Interest expense 40,074 21,799 22,353 Net interest income - FTE $ 362,653 $ 286,928 $ 287,113 Yield on earning assets - FTE 4.52 % 4.50 % 4.91 % Cost of interest bearing liabilities 0.59 % 0.41 % 0.45 % Net interest spread - FTE 3.93 % 4.09 % 4.46 % Net interest margin - FTE 4.07 % 4.19 % 4.55 % Years Ended December 31, (In thousands) 2023 2022 2021 Interest income $ 1,210,161 $ 861,735 $ 671,061 FTE adjustment 25,443 24,671 19,231 Interest income - FTE 1,235,604 886,406 690,292 Interest expense 560,035 144,419 79,529 Net interest income - FTE $ 675,569 $ 741,987 $ 610,763 Yield on earning assets - FTE 5.09 % 3.79 % 3.27 % Cost of interest bearing liabilities 2.99 % 0.84 % 0.52 % Net interest spread - FTE 2.10 % 2.95 % 2.75 % Net interest margin - FTE 2.78 % 3.17 % 2.89 % Table 2: Changes in Fully Taxable Equivalent Net Interest Margin(In thousands) 2017 vs. 2016 2016 vs. 2015 Increase due to change in earning assets $ 94,099 $ 38,845 Decrease due to change in earning asset yields (99 ) (39,584 ) (Decrease) increase due to change in interest rates paid on interest bearing liabilities (7,805 ) 1,168 Decrease due to change in interest bearing liabilities (10,470 ) (614 ) Increase (decrease) in net interest income $ 75,725 $ (185 ) 26(In thousands) 2023 vs. 2022 2022 vs. 2021 Increase due to change in earning assets $ 93,320 $ 147,423 Increase due to change in earning asset yields 255,878 48,691 Decrease due to change in interest bearing liabilities (48,716) (3,274) Decrease due to change in interest rates paid on interest bearing liabilities (366,900) (61,616) (Decrease) increase in net interest income $ (66,418) $ 131,224 Table 3 shows, for each major category of earning assets and interest bearing liabilities, the average (computed on a daily basis) amount outstanding, the interest earned or expensed on such amount and the average rate earned or expensed for each of the years in the three-year period ended December 31, 2017.2023. The table also shows the average rate earned on all earning assets, the average rate expensed on all interest bearing liabilities, the net interest spread and the net interest margin for the same periods. The analysis is presented on a fully taxable equivalent basis. Nonaccrual loans were included in average loans for the purpose of calculating the rate earned on total loans.41Table 3:Average Balance Sheets and Net Interest Income Analysis Years Ended December 31 2017 2016 2015 Average Income/ Yield/ Average Income/ Yield/ Average Income/ Yield/ (In thousands) Balance Expense Rate (%) Balance Expense Rate (%) Balance Expense Rate (%) ASSETS Earning assets: Interest bearing balances due from banks and federal funds sold $ 225,466 $ 1,933 0.86 $ 199,983 $ 756 0.38 $ 336,990 $ 899 0.27 Investment securities - taxable 1,420,642 28,517 2.01 1,107,718 21,706 1.96 1,128,035 17,291 1.53 Investment securities - non-taxable 330,912 19,045 5.76 405,871 19,337 4.76 375,390 21,756 5.80 Mortgage loans held for sale 13,064 605 4.63 27,506 1,102 4.01 24,996 1,051 4.20 Assets held in trading accounts 41 -- -- 4,752 16 0.34 6,481 18 0.28 Loans 6,918,293 352,627 5.10 5,109,492 265,810 5.20 4,434,074 268,451 6.05 Total interest earning assets 8,908,418 402,727 4.52 6,855,322 308,727 4.50 6,305,966 309,466 4.91 Non-earning assets 1,166,533 904,911 858,822 Total assets $ 10,074,951 $ 7,760,233 $ 7,164,788 LIABILITIES AND STOCKHOLDERS’ EQUITY Liabilities: Interest bearing liabilities: Interest bearing transaction and savings deposits $ 4,594,733 $ 18,112 0.39 $ 3,637,907 $ 8,050 0.22 $ 3,304,654 $ 7,794 0.24 Time deposits 1,430,701 9,644 0.67 1,263,317 7,167 0.57 1,344,762 7,454 0.55 Total interest bearing deposits 6,025,434 27,756 0.46 4,901,224 15,217 0.31 4,649,416 15,248 0.33 Federal funds purchased and securities sold under agreements to repurchase 117,147 347 0.30 112,030 273 0.24 113,881 236 0.21 Other borrowings 567,959 8,621 1.52 188,085 4,148 2.21 182,007 5,097 2.80 Subordinated debentures 79,880 3,350 4.19 60,206 2,161 3.59 55,554 1,772 3.19 Total interest bearing liabilities 6,790,420 40,074 0.59 5,261,545 21,799 0.41 5,000,858 22,353 0.45 Non-interest bearing liabilities: Non-interest bearing deposits 1,788,385 1,333,965 1,133,951 Other liabilities 105,331 56,575 65,568 Total liabilities 8,684,136 6,652,085 6,200,377 Stockholders’ equity 1,390,815 1,108,148 964,411 Total liabilities and stockholders’ equity $ 10,074,951 $ 7,760,233 $ 7,164,788 Net interest spread 3.93 4.09 4.46 Net interest margin $ 362,653 4.07 $ 286,928 4.19 $ 287,113 4.55 (FTE = Fully Taxable Equivalent using an effective tax rate of 26.135%) Years Ended December 31, 2023 2022 2021 Average Income/ Yield/ Average Income/ Yield/ Average Income/ Yield/ (In thousands) Balance Expense Rate (%) Balance Expense Rate (%) Balance Expense Rate (%) ASSETS Earning assets: Interest bearing balances due from banks and federal funds sold $ 320,261 $ 13,490 4.21 $ 793,836 $ 5,500 0.69 $ 2,376,421 $ 2,795 0.12 Investment securities - taxable 4,698,742 143,178 3.05 5,462,427 94,437 1.73 4,512,564 58,976 1.31 Investment securities - non-taxable 2,605,868 85,861 3.29 2,703,662 86,596 3.20 2,343,117 71,207 3.04 Mortgage loans held for sale 8,064 557 6.91 16,609 720 4.33 55,204 1,565 2.83 Other loans held for sale — — — 8,322 3,120 37.49 — — — Loans - including fees 16,647,570 992,518 5.96 14,419,763 696,033 4.83 11,810,480 555,749 4.71 Total interest earning assets 24,280,505 1,235,604 5.09 23,404,619 886,406 3.79 21,097,786 690,292 3.27 Non-earning assets 3,274,354 3,014,219 2,394,522 Total assets $ 27,554,859 $ 26,418,838 $ 23,492,308 LIABILITIES AND STOCKHOLDERS’ EQUITY Liabilities: Interest bearing liabilities: Interest bearing transaction and savings deposits $ 11,033,263 $ 238,982 2.17 $ 12,253,164 $ 63,033 0.51 $ 10,638,665 $ 19,568 0.18 Time deposits 6,038,640 233,937 3.87 3,094,747 36,016 1.16 2,804,851 21,604 0.77 Total interest bearing deposits 17,071,903 472,919 2.77 15,347,911 99,049 0.65 13,443,516 41,172 0.31 Federal funds purchased and securities sold under agreements to repurchase 105,802 1,150 1.09 200,744 941 0.47 247,448 579 0.23 Other borrowings 1,169,374 60,517 5.18 1,155,310 24,934 2.16 1,340,185 19,495 1.45 Subordinated debt and debentures 366,066 25,449 6.95 394,870 19,495 4.94 383,182 18,283 4.77 Total interest bearing liabilities 18,713,145 560,035 2.99 17,098,835 144,419 0.84 15,414,331 79,529 0.52 Noninterest bearing liabilities: Noninterest bearing deposits 5,201,384 5,827,160 4,836,839 Other liabilities 281,018 233,179 169,140 Total liabilities 24,195,547 23,159,174 20,420,310 Stockholders’ equity 3,359,312 3,259,664 3,071,998 Total liabilities and stockholders’ equity $ 27,554,859 $ 26,418,838 $ 23,492,308 Net interest spread 2.10 2.95 2.75 Net interest margin $ 675,569 2.78 $ 741,987 3.17 $ 610,763 2.89 42Table 4 shows changes in interest income and interest expense resulting from changes in volume and changes in interest rates for the years 2023 versus 2022 and 2022 versus 2021. The changes in interest rate and volume have been allocated to changes in average volume and changes in average rates in proportion to the relationship of absolute dollar amounts of the changes in rates and volume.Table 4:Volume/Rate Analysis Years Ended December 31, 2023 vs. 2022 2022 vs. 2021 Yield/ Yield/ (In thousands, on a fully taxable equivalent basis) Volume Rate Total Volume Rate Total Increase (decrease) in: Interest income: Interest bearing balances due from banks and federal funds sold $ (5,033) $ 13,023 $ 7,990 $ (2,952) $ 5,657 $ 2,705 Investment securities - taxable (14,763) 63,504 48,741 13,996 21,465 35,461 Investment securities - non-taxable (3,182) 2,447 (735) 11,395 3,994 15,389 Mortgage loans held for sale (472) 309 (163) (1,424) 579 (845) Other loans held for sale (791) (2,329) (3,120) 791 2,329 3,120 Loans - including fees 117,561 178,924 296,485 125,617 14,667 140,284 Total 93,320 255,878 349,198 147,423 48,691 196,114 Interest expense: Interest bearing transaction and savings accounts (6,881) 182,830 175,949 3,386 40,079 43,465 Time deposits 57,399 140,522 197,921 2,425 11,987 14,412 Federal funds purchased and securities sold under agreements to repurchase (600) 809 209 (126) 488 362 Other borrowings 308 35,275 35,583 (2,978) 8,417 5,439 Subordinated notes and debentures (1,510) 7,464 5,954 567 645 1,212 Total 48,716 366,900 415,616 3,274 61,616 64,890 Increase (decrease) in net interest income $ 44,604 $ (111,022) $ (66,418) $ 144,149 $ (12,925) $ 131,224 27Provision for Credit Losses Table 4:Volume/Rate Analysis Years Ended December 31 2017 over 2016 2016 over 2015 (In thousands, on a fully Yield/ Yield/ taxable equivalent basis) Volume Rate Total Volume Rate Total Increase (decrease) in Interest income Interest bearing balances due from banks and federal funds sold $ 107 $ 1,070 $ 1,177 $ (506 ) $ 363 $ (143 ) Investment securities - taxable 6,270 541 6,811 (316 ) 4,731 4,415 Investment securities - non-taxable (3,920 ) 3,628 (292 ) 1,669 (4,088 ) (2,419 ) Mortgage loans held for sale (648 ) 151 (497 ) 103 (52 ) 51 Assets held in trading accounts (8 ) (8 ) (16 ) (6 ) 4 (2 ) Loans 92,298 (5,481 ) 86,817 37,901 (40,542 ) (2,641 ) Total 94,099 (99 ) 94,000 38,845 (39,584 ) (739 ) Interest expense Interest bearing transaction and savings accounts 2,533 7,529 10,062 756 (500 ) 256 Time deposits 1,024 1,453 2,477 (459 ) 172 (287 ) Federal funds purchased and securities sold under agreements to repurchase 13 61 74 (4 ) 41 37 Other borrowings 6,115 (1,642 ) 4,473 165 (1,114 ) (949 ) Subordinated debentures 785 404 1,189 156 233 389 Total 10,470 7,805 18,275 614 (1,168 ) (554 ) Increase (decrease) in net interest income $ 83,629 $ (7,904 ) $ 75,725 $ 38,231 $ (38,416 ) $ (185 ) Provision for Loan Lossesloancredit losses represents management'smanagement’s determination of the amount necessary to be charged against the current period'speriod’s earnings in order to maintain the allowance for loancredit losses at a level considered appropriate in relation to the estimated lifetime risk inherent in the loan portfolio. The level of provision to the allowance is based on management'smanagement’s judgment, with consideration given to the composition, maturity and other qualitative characteristics of the portfolio, historical loan loss experience, assessment of current economic conditions, reasonable and supportable forecasts, past due and non-performing loans and historical net loancredit loss experience. It is management'smanagement’s practice to review the allowance on a monthly basis and, after considering the factors previously noted, to determine the level of provision made to the allowance.During 2023, our provision for credit loss expense was $42.0 million, as compared to an expense of $14.1 million during 2022 and a recapture of $32.7 million during 2021. The provision for loan losses for 2017, 2016credit loss expense during 2023 was impacted by several factors throughout the year, including a $47.4 million expense related to loans and 2015, was $26.4 million, $20.1 million and $9.0 million, respectively. The provision increase was necessary to maintain an appropriate allowance for loan losses for the company’s growing legacy portfolio. Significantreflected loan growth, in our markets, both from new loans and from loans acquired migrating to legacy, as well as increasesthe impact of updated economic assumptions, which was partially offset by a $16.3 million release from the reserve for unfunded commitments primarily due to a decline in specific reserves on certain impaired loans, required an allowance to be established for those loans through a provision.Ourunfunded commitments resulting from customers utilizing lines of credit during the year. Additionally, provision expense for the year ending December 31, 2107 included building reserves for three commercial credits from the Wichita market which had specific impairments identified. Charge-offs of $7.6 million wererelated to AFS and HTM securities recorded during the year related to these loans. Collection and recovery remedies continue to be pursued.Our provision expense for the yeartwelve months ended December 31, 2016 included replenishment2023 was $9.1 million and $1.8 million, respectively, primarily due to decreases in the value of select corporate bonds in the investment securities portfolio.43The provision for credit loss expense during 2022 was impacted by several factors throughout the year, including a $5.4$33.8 million single charge-offDay 2 provision expense required for loans and unfunded commitments related to a nonaccrual loan acquired from Metropolitan National Bank. The loan was charged downthe Spirit acquisition, and an expense of $16.0 million related to the appraised liquidation value of the collateral and the charged-off amount was added back to the allowance for loan lossesoverall increase in unfunded commitments during the year, resulting inprimarily made up of commercial construction loans, which receive a higher reserve allocation than other loans. These expenses were partially offset by a release of $16.0 million, which was driven by a reduction to certain industry specific qualitative factors for the increase in provision. The provision expense for 2016 also included replenishmentrestaurant, hospitality, student housing and office space industries due to the improvement from pandemic related stresses. Further recapture during 2022 was driven by the planned exit of a $2.0 million charge-off related to potential customer fraud on an agricultural loan, which carried a pass rating.Finally, a $1.9 million provision was recordedseveral large oil and gas relationships during the year, ended December 31, 2017 as a result of a decrease in expected cash flows fromalong with our required ongoing evaluationimproved asset credit quality metrics and improved Moody’s economic modeling scenarios.The recapture of credit marks on certain purchasedlosses during 2021 was driven by improved credit impaired loans. See Allowancequality metrics, improved macroeconomic factors, and a maturing and amortizing loan portfolio. This recapture was partially offset by $22.7 million in provision for Loan Losses sectioncredit loss expense for additional information.estimated lifetime credit losses for non-purchase credit deteriorated loans acquired through the acquisitions of Landmark and Triumph during the fourth quarter.28Noninterest Income Non-Interest IncomeTotal non-interest income was $138.8 million in 2017, compared to $139.4 million in 2016 and $94.7 million in 2015. Non-interest income for 2017 decreased $617,000, or 0.4%, from 2016.Non-interestNoninterest income is principally derived from recurring fee income, which includes service charges, trustwealth management fees and debit and credit card fees. Non-interestNoninterest income also includes income on the sale of mortgage and SBA loans, investment banking income, income from the increase in cash surrender values of bank owned life insurance and gains (losses) from sales of securities.The decreaseTotal noninterest income was $155.6 million in non-interest2023, compared to $170.1 million in 2022 and $191.8 million in 2021. Noninterest income during 2017for 2023 decreased $14.5 million, or 8.5%, from 2022. Included in 2023 results was primarily due$20.6 million of a certain item related to net gains recordedthe loss on the sale of securities during the period. Included in 2022 results were $4.0 million of $1.1 million compared to $5.8 million in 2016. In addition, non-interest income from mortgage and SBA lending was $3.2 million less than 2016. These decreases were partially offset by the $3.7certain items, primarily made up of a $4.1 million gain on the salean insurance settlement related to a weather event that caused severe damage to one of the property and casualty insurance lines of business and increases in trustour branch locations. Adjusting for these certain items, adjusted noninterest income service charges and debit and credit card fees.There was a $14.8 million increase in non-interest income fromfor the year ended December 31, 20162023 increased $10.1 million, or 6.1%, from the prior year. See the The majority of the decrease in noninterest income during 2023 was related to the same periodloss on sale of 2015securities as compared to 2022. During 2023, we sold approximately $247.9 million of investment securities resulting in a net loss of $20.6 million, while we realized a net loss of $278,000 related to the call of securities during 2022. The sale of securities during 2023 was primarily related to a strategic decision to sell low yield securities and use the proceeds to pay off higher rate wholesale fundings, including both brokered deposits and FHLB advances.Mortgage lending income decreased $2.8 million during 2023 due to the eliminationrising interest rate environment and softening market conditions throughout the year, which continued to slow the demand for mortgage loans. We originated $428.0 million and $751.0 million in mortgage loans during 2023 and 2022, respectively.These decreases in noninterest income during 2023 were partially offset by an increase of $4.0 million in service charges on deposit accounts primarily attributable to a full period including the amortization of the indemnification asset expected to be collectedcustomer base from the FDIC covered loan portfolios asSpirit acquisition and additional transactions due to the changes in customer spending habits. Also included in 2023 results is a result of the early termination of the loss share agreements in September 2015. Excluding the indemnification asset amortization adjustments, non-interest income increased $29.9$4.0 million or 31.6%.A gain of $2.1 million was recorded on the sale of the banking operations located in Salina, Kansas consisting of three branches that occurred in August 2015. Included in the sale were $5.3 million in loans and $77.8 million in deposits.During 2017, 2016 and 2015 we recorded net gains of $264,000, $241,000 and $153,000, respectively, on the sale of several branch locations which was part of our branch right sizing strategy. We actively market our former branch facilities in an effort to dispose of these non-earning assets.44Table 5 shows non-interestnoninterest income for the years ended December 31, 2017, 20162023, 2022 and 2015,2021, respectively, as well as changes in 20172023 from 20162022 and in 20162022 from 2015.Table 5:Non-InterestNoninterest Income 2017 2016 Years Ended December 31 Change from Change from (In thousands) 2017 2016 2015 2016 2015 Trust income $ 18,570 $ 15,442 $ 9,261 $ 3,128 20.26 % $ 6,181 66.74 % Service charges on deposit accounts 36,079 32,414 30,985 3,665 11.31 1,429 4.61 Other service charges and fees 9,919 12,872 8,756 (2,953 ) -22.94 4,116 47.01 Mortgage and SBA lending income 13,316 16,483 11,452 (3,167 ) -19.21 5,031 43.93 Investment banking income 2,793 3,471 2,590 (678 ) -19.53 881 34.02 Debit and credit card fees 34,258 30,740 26,660 3,518 11.44 4,080 15.30 Bank owned life insurance income 3,503 3,324 2,680 179 5.39 644 24.03 Gain on sale of securities, net 1,059 5,848 307 (4,789 ) -81.89 5,541 * Gain on sale of banking operations -- -- 2,110 -- -- (2,110 ) -100.00 Net loss on assets covered by FDIC loss share agreements -- -- (14,812 ) -- -- 14,812 -100.00 Net gain on sale of premises held for sale 264 241 153 23 9.54 88 57.52 Net gain on sale of insurance lines of business 3,708 -- -- 3,708 * -- -- Other income 15,296 18,547 14,519 (3,251 ) -17.53 4,028 27.74 Total non-interest income $ 138,765 $ 139,382 $ 94,661 $ (617 ) -0.44 % $ 44,721 47.24 % Years Ended December 31, 2023
Change from2022
Change from(Dollars in thousands) 2023 2022 2021 2022 2021 Service charges on deposit accounts $ 50,530 $ 46,527 $ 43,231 $ 4,003 8.6 % $ 3,296 7.6 % Debit and credit card fees 31,472 31,203 28,245 269 0.9 2,958 10.5 Wealth management fees 30,203 31,895 31,172 (1,692) (5.3) 723 2.3 Mortgage lending income 7,733 10,522 21,798 (2,789) (26.5) (11,276) (51.7) Bank owned life insurance income 11,717 11,146 8,902 571 5.1 2,244 25.2 Other service charges and fees 9,122 7,616 7,696 1,506 19.8 (80) (1.0) Gain (loss) on sale of securities, net (20,609) (278) 15,498 (20,331) * (15,776) * Gain on sale of branches — — 5,316 — — (5,316) * Gain on insurance settlement — 4,074 — (4,074) * 4,074 * Other income 35,398 27,361 29,957 8,037 29.4 (2,596) (8.7) Total noninterest income $ 155,566 $ 170,066 $ 191,815 $ (14,500) (8.5) % $ (21,749) (11.3) % _________________________*Not meaningfulRecurring fee income (service(total service charges, trustwealth management fees, debit and credit card fees and other fees) for 20172023 was $98.8$121.3 million, an increase of $7.4$4.1 million, or 8.0%3.5%, when compared withto the 20162022 amounts. Trust income increased by $3.1 million, or 20.3%, service charges on deposit accounts increased $3.7 million, or 11.3% and debit and credit card fees increased by $3.5 million, or 11.4%. The increases in service charges and debit and credit card fees were due to additional accounts acquired from OKSB, First Texas and Hardeman. The increase in trust income is from continued positive growth in our existing personal trust and investor management client base.29Recurring fee income (service charges, trust fees, debit and credit card fees and other fees) for 2016 was $91.5 million, an increase of $15.8 million, or 20.9%, when compared with the 2015 amounts. The majority of the increase was due to additional accounts associated with the Citizens acquisition.During 2016, we were intently focused on our bond portfolio strategy that involved actively looking to reduce the number of issuances we held in our portfolio and monitoring the market conditions for opportunities to sell securities and replace with comparable yields while only marginally extending the duration of the portfolio. As a result, our net gains increased significantly during 2016 and we reverted back to a normalized level during 2017, resulting in the current year decrease.Mortgage and SBA lending income decreased by $3.2 million during 2017 compared to 2016 primarily due to the seasonal natureincreased consumer base provided by the Spirit acquisition. We expect service charges to continue to moderate in early 2024 due to the elimination of the mortgage volume as well as the timing of selling the guaranteed portion of SBA loans. Investment banking income decreased $678,000returned item fees for consumer deposit accounts with insufficient funds implemented during 2017 compared to 2016 as a result of the closure of our Institutional Division and exit from its lines of business in the third quarter of 2016.Net loss on assets covered by FDIC loss share agreements2023. Overall, we expect flat to modest growth in 2015 included the $7.5 million expense related to the termination of the loss share agreements. This expense was partially offset by a $2.1 million decrease in the indemnification asset. With the September 2015 termination of the loss-sharing agreements the amortization of the indemnification asset was eliminated.Non-Interest ExpenseNoninterest Expense Non-interestNoninterest expense consists of salaries and employee benefits, occupancy, equipment, foreclosure losses and other expenses necessary for the operation of the Company.our operations. Management remains committed to controlling the level of non-interestnoninterest expense through the continued use of expense control measures. We utilize an extensive profit planning and reporting system involving all subsidiaries. Based on a needs assessment of the business plan for the upcoming year, monthly and annual profit plans are developed, including manpower and capital expenditure budgets. These profit plans are subject to extensive initial reviews and monitored by management on a monthly basis.monthly. Variances from the plan are reviewed monthly and, when required, management takes corrective action intended to ensure financial goals are met. We also regularly monitor staffing levels at each subsidiary to ensure productivity and overhead are in line with existing workload requirements.Non-interestNoninterest expense for 20172023 was $312.4$563.1 million, an increaseas compared to noninterest expense for 2022 of $57.3$566.7 million, a decrease of $3.7 million, or 22.5%0.7%, from 2016. The most significant impactscompared to non-interestthe prior period. Adjusted noninterest expense, were the following items.First,which excludes branch right sizing, merger related costs, FDIC special assessment (for 2023 only), donation to Simmons First Foundation (for 2022 only) and early retirement program costs (for 2023 only), for the year ended December 31, 2023 increased $396,000, or 0.1%, from the prior year. See the Merger related costs for 2023 and 2022 were $1.4 million and $22.5 million, respectively, and were primarily related to the Spirit acquisition.Salaries and employee benefits expense decreased slightly by $865,000 as well ascompared to 2022, while adjusted salaries and employee benefits contributedexpense decreased by $7.1 million as compared to the majority of the increase. During 2017, merger related costs increased $17.1 million and2022. The decrease in adjusted salaries and employee benefits increased $20.9 million. These increases were primarily attributable to incremental costs associated withexpense reflects the Hardeman, OKSB and First Texas acquisitions.Also, professional services and marketing expense increased by $4.9 million and $4.2 million, respectively. The increase in professional services was primarily related to the three 2017 acquisitions and incremental costs for exam fees, auditing and accounting services and general consulting expenses associated with our preparations to pass $10 billion in assets. The increase in marketing expense was also primarily due to the additional costs associated with the 2017 acquisitions.Conversely, branch right sizing expense decreased by $3.2 million during 2017. We closed ten branches during 2016 that contributed to $3.5 millionsuccessful execution of branch right sizing costs last year. We continue to monitor branch operations and profitability as well as changing customer habits.Excluding the non-core merger related costs, branch right sizing expenses, and the $5 million donation to the Simmons Foundation during 2017, non-interest expense for 2017 increased $38.4 million, or 15.6%, from 2016, primarily due to the incremental operating expenses of the acquired companies, such as salaries and employee benefits, and increased professional fees previously discussed.Non-interest expense for 2016 was $255.1 million, a decrease of $1.9 million, or 0.7%, from 2015. This decrease includes approximately $4.8 million of merger related costs for 2016 from our acquisitions of Citizens and the announced mergers that completed during 2017. Also included in non-interest expense are merger related costs of $13.8 million in 2015, primarily attributed to the acquisitions of Community First, Liberty and Ozark Trust.30We recorded $3.6 million in branch rightsizing costs during 2016, primarily associated with the closure and maintenance of ten underperforming branchesprograms as part of our branch right sizing initiative. DueBetter Bank Initiative. Early retirement program costs during 2023 were $6.2 million.45Deposit insurance increased by $18.4 million as compared to 2022. Excluding the close proximityFDIC special assessment of $10.5 million levied to support the closed branches with other Simmons Bank branches, customers will not be negatively impactedDeposit Insurance Fund following the failure of certain banks in 2023, deposit insurance increased by the closings. For the same period in 2015, we had expenses of $3.3$7.9 million associated with the closure and maintenance of twelve branches. In 2015, we also incurred $2.2 million of costs related to early termination agreements which were cash payments and equity expense recorded for several senior management employees for their early retirement. Cash payments of $1.7 million were made due to early retirement agreements negotiated with the employees and an additional $534,000 of expense was recorded due to accelerated vesting of previously awarded equity incentives as part of these early retirement agreements.Salaries and employee benefits decreased to $133.5 million in 2016 from $138.2 million in 2015, a decrease of $4.8 million, or 3.5%, as we recognized the benefits from our ongoing efficiency initiatives and cost savings related to the integration of our 2015 acquisitions. Occupancy expense increased to $18.7 million in 2016 from $16.9 million in 2015, an increase of $1.8 million, or 10.7%. Furniture and fixture expense increased to $16.7 million in 2016 from $14.4 million in 2015, an increase of $2.3 million, or 16.2%. These incremental increases, along with the increases in several other operating expense categories, were a result of the Citizens acquisition in 2016 and 2015 acquisitions.Normalizing for the non-core merger related costs, branch right sizing expenses and early termination agreements, non-interest expense increased $8.9 million, or 3.8%, in 2016 from 2015, primarily due to an increased base rate related to changes in the incremental operating expensesmix of deposits, coupled with the acquired franchises. Seeincrease in deposits from the Reconciliation of Non-GAAP Measures section for details of the non-core items.Amortization of intangibles recorded for the years ended December 31, 2017, 20162023, and 2015,2022 was $7.7 million, $5.9$16.3 million and $4.9$15.9 million, respectively. The current year increase isSee Note 8, Goodwill and Other Intangible Assets, in the result of core deposit intangibles and other intangible assets recorded as part of the Hardeman, OKSB and First Texas acquisitions and a full year of amortization expense relatedaccompanying Notes to the intangibles added from the Citizens acquisition in 2016. The Company’s estimated amortization expenseConsolidated Financial Statements for each of the following five years is: 2018 – $11.35 million; 2019 – $11.04 million; 2020 – $11.03 million; 2021 – $10.97 million; and 2022 – $10.92 million. The estimated amortization expense decreases as intangible assets fully amortize in future years.Table 6 below shows non-interestnoninterest expense for the years ended December 31, 2017, 20162023, 2022 and 2015,2021, respectively, as well as changes in 20172023 from 20162022 and in 20162022 from 2015.Table 6: Non-InterestNoninterest Expense 2017 2016 Years Ended December 31 Change from Change from (In thousands) 2017 2016 2015 2016 2015 Salaries and employee benefits $ 154,314 $ 133,457 $ 138,243 $ 20,857 15.63 % $ (4,786 ) -3.46 % Occupancy expense, net 21,159 18,667 16,858 2,492 13.35 1,809 10.73 Furniture and equipment expense 19,366 16,683 14,352 2,683 16.08 2,331 16.24 Other real estate and foreclosure expense 3,042 4,461 4,861 (1,419 ) -31.81 (400 ) -8.23 Deposit insurance 3,696 3,469 4,201 227 6.54 (732 ) -17.42 Merger related costs 21,923 4,835 13,760 17,088 * (8,925 ) -64.86 Other operating expenses Professional services 19,500 14,630 9,583 4,870 33.29 5,047 52.67 Postage 4,686 4,599 4,219 87 1.89 380 9.01 Telephone 4,262 4,294 4,817 (32 ) -0.75 (523 ) -10.86 Credit card expenses 12,188 11,328 9,157 860 7.59 2,171 23.71 Marketing 11,141 6,929 6,337 4,212 60.79 592 9.34 Operating supplies 1,980 1,824 2,395 156 8.55 (571 ) -23.84 Amortization of intangibles 7,668 5,945 4,889 1,723 28.98 1,056 21.60 Branch right sizing expense 434 3,600 3,297 (3,166 ) -87.94 303 9.19 Other expense 27,020 20,364 20,001 6,656 32.69 363 1.81 Total non-interest expense $ 312,379 $ 255,085 $ 256,970 $ 57,294 22.46 % $ (1,885 ) -0.73 % Years Ended December 31, 2023
Change from2022
Change from(Dollars in thousands) 2023 2022 2021 2022 2021 Salaries and employee benefits $ 279,919 $ 286,982 $ 246,335 $ (7,063) (2.5) % $ 40,647 16.5 % Early retirement program 6,198 — — 6,198 * — — Occupancy expense, net 46,741 44,321 38,797 2,420 5.5 5,524 14.2 Furniture and equipment expense 20,741 20,665 19,890 76 0.4 775 3.9 Other real estate and foreclosure expense 892 1,003 2,121 (111) (11.1) (1,118) (52.7) Deposit insurance 19,465 11,608 6,973 7,857 67.7 4,635 66.5 FDIC special assessment 10,521 — — 10,521 * — — Merger related costs 1,420 22,476 15,911 (21,056) (93.7) 6,565 41.3 Other operating expenses: Professional services 19,612 19,138 18,921 474 2.5 217 1.2 Postage 9,458 8,955 8,276 503 5.6 679 8.2 Telephone 6,965 6,394 6,234 571 8.9 160 2.6 Credit card expenses 13,243 12,243 11,112 1,000 8.2 1,131 10.2 Marketing 24,008 28,870 22,234 (4,862) (16.8) 6,636 29.9 Software and technology 42,530 40,906 40,608 1,624 4.0 298 0.7 Operating supplies 2,591 2,556 2,766 35 1.4 (210) (7.6) Amortization of intangibles 16,306 15,915 13,494 391 2.5 2,421 17.9 Branch right sizing expense 5,467 3,475 (537) 1,992 57.3 4,012 * Other expense 36,984 41,241 30,454 (4,257) (10.3) 10,787 35.4 Total noninterest expense $ 563,061 $ 566,748 $ 483,589 $ (3,687) (0.7) % $ 83,159 17.2 % _________________________*Not meaningfulDue to our Better Bank Initiative and continuous efficiency improvements, we expect marginal growth in noninterest expense during 2024.31Income Taxes Income Taxes20172023 was $62.0$25.5 million, compared to $46.6$50.1 million in 20162022 and $32.9$61.3 million in 2015.2021. The effective income tax rates for the years ended 2017, 20162023, 2022 and 20152021 were 40.0%12.7%, 32.5%16.4% and 30.7%18.4%, respectively.On December 22, 2017, The decrease in the President signedprovision for income taxes during 2023 was primarily due to tax reform legislation (the “2017 Act”) which includesexempt income having a broad rangelarger favorable impact on the rate and lower state taxes in 2023, both driven by the one time charges to income from the loss on sale of tax reform proposals affecting businesses, including corporate tax rates, business deductions, and international tax provisions. The 2017 Act reduces the corporate tax rate from 35% to 21% for tax years beginning after December 31, 2017. Under United States Generally Accepted Accounting Principles (“US GAAP”), deferred tax assets and liabilities are required to be measured at the enacted tax rate expected to apply when temporary differences are to be realized or settledsecurities and the effect of a change in tax law is recorded discretely as a component of the income tax provision related to continuing operations in the period of enactment. As a result, we were required to remeasure our deferred taxes as of December 31, 2017 based upon the new 21% tax rate and the change was recorded in the 2017 income tax provision. The result of the tax reform resulted in a one-time non-cash adjustment to income of $11.5 million.Loan Portfolio46Loan Portfolio Our legacy loan portfolio excluding loans acquired, averaged $5.493$16.65 billion during 20172023 and $3.649$14.42 billion during 2016.2022. As of December 31, 2017,2023, total loans excluding loans acquired, were $5.706$16.85 billion, compared to $4.327$16.14 billion on December 31, 2016,2022, an increase of $1.379 billion,$703.5 million, or 31.9%4.4%. This marksThe increase in the sixth consecutive year that we have seen annualoverall loan balance during 2023 is primarily due to widespread loan growth inthroughout our legacy loan portfolio.geographic markets during the year. The most significant components of the loan portfolio were loans to businesses (commercial loans, commercial real estate loans and agricultural loans) and individuals (consumer loans, credit card loans and single-family residential real estate loans). The growth in the legacy portfolio is attributable to the larger market areas in which we now operate as a result of our acquisitions. We are also seeing increased loan demand across all of our footprint in response to continued improved market conditions. In addition, we have actively recruited and hired new lenders in our growth markets in an effort to continue growing our loan portfolio.Also contributing to our legacy loan growth are acquired loans that have migrated to legacy loans. When we make a credit decision on an acquired loan as a result of the loan maturing or renewing, the outstanding balance of that loan migrates from loans acquired to legacy loans. Our legacy loan growth from December 31, 2016 to December 31, 2017 included $214 million in balances that migrated from acquired loans during the period. These migrated loan balances are included in the legacy loan balances as of December 31, 2017. Excluding the migrated balances from the growth calculation, our legacy loans have grown at a 32.7% rate during 2017.We seek to manage our credit risk by diversifying theour loan portfolio, determining that borrowers have adequate sources of cash flow for loan repayment without liquidation of collateral, obtaining and monitoring collateral, providing an appropriate allowance for loancredit losses and regularly reviewing loans through the internal loan review process. The loan portfolio is diversified by borrower, purpose, and industry and in the case of credit card loans, which are unsecured, by geographic region. We seek to use diversification within the loan portfolio to reduce credit risk, thereby minimizing the adverse impact on the portfolio, if weaknesses develop in either the economy or a particular segment of borrowers. Collateral requirements are based on credit assessments of borrowers and may be used to recover the debt in case of default. We use the allowance for loancredit losses as a method to value the loan portfolio at its estimated collectablecollectible amount. Loans are regularly reviewed to facilitate the identification and monitoring of deteriorating credits.Consumer loans consist of credit card loans and other consumer loans. Consumer loans were $465.5$318.7 million at December 31, 2017,2023, or 8.2%1.9% of total loans, compared to $488.6$349.8 million, or 11.3%2.2% of total loans at December 31, 2016.2022. The decrease isin consumer loans was primarily driven by our exit fromdue to loan payoffs and pay downs within the indirectother consumer installment loan line of business in February 2017.The credit card portfolio balance at December 31, 2017, increased by $831,000 when compared toduring the same period in 2016.year. Our credit card portfolio has remained a stable source of lending for several years.Real estate loans consist of construction loans, single family residential loans and commercial loans. Real estate loans were $4.240 billion at December 31, 2017, or 74.3% of total loans, compared to $3.028 billion, or 70.0% of total loans at December 31, 2016, an increase of $1.2 billion, or 40.0%. Our construction and development (“C&D”) loans, single family residential loans and other commercial real estate (“CRE”) loans. Real estate loans were $13.34 billion at December 31, 2023, or 79.2% of total loans, compared to $12.58 billion, or 77.9% of total loans at December 31, 2022, an increase of $756.9 million, or 6.0%. Our C&D loans increased by $277.4$577.6 million, or 82.4%22.5%, single family residential loans increased by $190.4$95.4 million, or 21.1%3.7%, and commercial real estate (“CRE”)CRE loans increased by $743.7$83.9 million, or 41.6%1.1%. The increases were due to diversified organic growth by type and geographic market during the period. We believe it is importantexpect to note that we have no significant concentrations incontinue to manage our real estate loan portfolio mix. Our C&D loans represent 10.8% of our loan portfolio and CRE loans (excluding C&D) represent 44.4% ofportfolio concentration by developing deeper relationships with our loan portfolio, both of which compare very favorably to our peers.
customers.32Commercial loans consist of non-real estate loans related to businessesbusiness and agricultural loans. CommercialTotal commercial loans were $973.5 million$2.72 billion at December 31, 2017,2023, or 17.1%16.2% of total loans, compared to the $789.9 million,$2.84 billion, or 18.3%17.6% of total loans at December 31, 2016,2022, a decrease of $115.0 million, or 4.1%. The decrease in non-real estate loans related to business of $142.1 million, or 5.4%, was partially offset by the increase in agricultural loans of $27.1 million, or 13.2%.Other loans mainly consists of mortgage warehouse lending and municipal loans. Mortgage volume experienced an increase in demand during 2023 as compared to 2022, and was coupled with continued organic growth in our municipal loans during the period, leading to an increase of $183.6$92.8 million or 23.3%.Although showing signsin other loans.While loan growth was widespread throughout our geographic markets and was generally broad-based by loan type during the period, loan growth during the latter half of improvement in late 2017, the continued depressed market price of oil has affected banks with high loan exposure to oil and gas companies across the U.S. While we do not consider the volume to be excessive or constitute a concentration, it is important to note that the exposure to the oil and gas industry will increase with our recent acquisition of OKSB and First Texas.We have loans to individuals and businesses involved in the healthcare industry, including businesses and personal loans to physicians, dentists and other healthcare professionals, and loans to for-profit hospitals, nursing homes, suppliers and other healthcare-related businesses. These loans expose us to the risk that adverse developments in the healthcare industry will lead to increased levels of nonperforming loans. The laws regarding healthcare have impacted the provision of healthcare in the United States and contribute to prolonged2023 reflected moderating demand and increased uncertaintypayoff activity, as towe focus on maintaining disciplined pricing and conservative underwriting standards given the environment in which healthcare providers will operate. With the recent acquisition of OKSB our exposure to the healthcare industry has increased, however we do not consider the volume to be excessive or constitute a concentration.Table 7 reflects the legacycurrent uncertain economic environment. Our commercial loan portfolio, excluding loans acquired.Table 7:Loan Portfolio Years Ended December 31 (In thousands) 2017 2016 2015 2014 2013 Consumer Credit cards $ 185,422 $ 184,591 $ 177,288 $ 185,380 $ 184,935 Student loans -- -- -- -- 25,906 Other consumer 280,094 303,972 208,380 103,402 98,851 Total consumer 465,516 488,563 385,668 288,782 309,692 Real Estate Construction 614,155 336,759 279,740 181,968 146,458 Single family residential 1,094,633 904,245 696,180 455,563 392,285 Other commercial 2,530,824 1,787,075 1,229,072 714,797 626,333 Total real estate 4,239,612 3,028,079 2,204,992 1,352,328 1,165,076 Commercial Commercial 825,217 639,525 500,116 291,820 164,329 Agricultural 148,302 150,378 148,563 115,658 98,886 Total commercial 973,519 789,903 648,679 407,478 263,215 Other 26,962 20,662 7,115 5,133 4,655 Total loans, excluding loans acquired, before allowance for loan losses $ 5,705,609 $ 4,327,207 $ 3,246,454 $ 2,053,721 $ 1,742,638 Loans AcquiredOn October 19, 2017, we completed the acquisition of OKSB and issued 14,488,604 shares of the Company’s common stock valued at approximately $431.4 million as of October 19, 2017 plus $94.9 million in cash in exchange for all outstanding shares of OKSB common stock. Included in the acquisition were loans with a fair value of $2.0 billion.On October 19, 2017, we completed the acquisition of First Texas and issued 12,999,840 shares of the Company’s common stock valued at approximately $387.1 million as of October 19, 2017 plus $70.0 million in cash in exchange for all outstanding shares of First Texas common stock. Included in the acquisition were loans with a fair value of $2.2 billion.On May 15, 2017, we completed the acquisition of Hardeman and issued 1,599,940 shares of the Company’s common stock valued at approximately $42.6 million as of May 15, 2017 plus $30.0 million in cash in exchange for all outstanding shares of Hardeman common stock. Included in the acquisition were loans with a fair value of $251.6 million.On September 9, 2016, we completed the acquisition of Citizens and issued 1,671,482 shares of the Company’s common stock valued at approximately $41.3 million as of September 9, 2016 plus $35.0 million in cash in exchange for all outstanding shares of Citizens common stock. Included in the acquisition were loans with a fair value of $340.8 million.33On February 27, 2015, we completed the acquisition of Liberty and issued 10,362,674 shares of the Company’s common stock valued at approximately $212.2 million as of February 27, 2015 in exchange for all outstanding shares of Liberty common stock. Included in the acquisition were loans with a fair value of $780.7 million.On February 27, 2015, we also completed the acquisition of Community First and issued 13,105,830 shares of the Company’s common stock valued at approximately $268.3 million as of February 27, 2015, plus $9,974 in cash in exchange for all outstanding shares of Community First common stock. We also issued $30.9 million of preferred stock in exchange for all outstanding shares of Community First preferred stock. Included in the acquisition were loans with a fair value of $1.1 billion.On August 31, 2014, we completed the acquisition of Delta Trust, and issued 3,259,030 shares of the Company’s common stock valued at approximately $65.0 million as of August 29, 2014, plus $2.4 million in cash in exchange for all outstanding shares of Delta Trust common stock. Included in the acquisition were loans with a fair value of $311.7 million and foreclosed assets with a fair value of $1.8 million.On November 25, 2013, we completed the acquisition of Metropolitan, in which the Company purchased all the stock of Metropolitan for $53.6 million in cash. The acquisition was conducted in accordance with the provisions of Section 363 of the United States Bankruptcy Code. Included in the acquisition were loans with a fair value of $457.4 million and foreclosed assets with a fair value of $42.9 million.On September 30, 2013, we acquired a $9.8 million credit card portfolio for a premium of $1.3 million.On September 15, 2015, we entered into an agreement with the FDIC to terminate all loss share agreements. Under the early termination, all rights and obligations of the Company and the FDIC under the FDIC loss share agreements, including the clawback provisions and the settlement of loss share and expense reimbursement claims, have been resolved and terminated. As a result, we have reclassified loans previously covered by FDIC loss share to acquired loans not covered and reclassified foreclosed assets previously covered by FDIC loss share to foreclosed assets not covered.Table 8 reflects the carrying valuepipeline consisting of all acquired loans:Table 8:Loans Acquired Years Ended December 31 (In thousands) 2017 2016 2015 2014 2013 Consumer Credit cards $ -- $ -- $ -- $ -- $ 8,116 Other consumer 51,467 49,677 75,606 8,514 15,242 Total consumer 51,467 49,677 75,606 8,514 23,358 Real Estate Construction 637,032 57,587 77,119 46,911 29,936 Single family residential 793,228 423,176 501,002 175,970 87,861 Other commercial 2,387,777 690,108 854,068 390,877 449,285 Total real estate 3,818,037 1,170,871 1,432,189 613,758 567,082 Commercial Commercial 995,587 81,837 154,533 56,134 71,857 Agricultural 66,576 3,298 10,573 4,507 -- Total commercial 1,062,163 85,135 165,106 60,641 71,857 Other 142,409 -- -- -- -- Total loans acquired (1) $ 5,074,076 $ 1,305,683 $ 1,672,901 $ 682,913 $ 662,297 _________________________(1)Loans acquired are reported net of a $418,000 allowance at December 31, 2017 and a $954,000 allowance at December 31, 2016 and 2015.The majority of the loans originally acquired in the OKSB, First Texas, Hardeman, Citizens, Liberty, Community First, Metropolitan and Delta Trust acquisitions were evaluated and are being accounted for in accordance with ASC Topic 310-20, Nonrefundable Fees and Other Costs. The fair value discount is being accreted into interest income over the weighted average life of the loans using a constant yield method. These loans are not considered to be impaired loans.We evaluated the remaining loans purchased in conjunction with the acquisitions of OKSB, First Texas, Hardeman, Citizens, Liberty, Community First, Metropolitan and Delta Trust for impairment in accordance with the provisions of ASC Topic 310-30, Loans and Debt Securities Acquired with Deteriorated Credit Quality. Purchased loans are considered impaired if there is evidence of credit deterioration since origination and if it is probable that not all contractually required payments will be collected.34Some purchased impaired loans were determined to have experienced additional impairment upon disposition or foreclosure. During 2017, we recorded $1.9commercial loan opportunities was $948.2 million of provision for these loans and charge-offs of $2.4 million, resulting in an allowance for loan losses for purchased impaired loans at December 31, 2017 of $418,000. We recorded $626,000 provision for these loans with a subsequent charge-off, resulting in no increase2023, compared to the allowance for loan losses for purchased impaired loans$1.12 billion at December 31, 2016. During 2015, we recorded $736,000 provision for these2022. The pipeline includes $416.0 million in loans with a subsequent charge-off, resulting in no increaseapproved and ready to close at the allowance for loan losses for purchased impaired loans at December 31, 2015. See Note 2 and Note 6end of the Notes to Consolidated Financial Statements for further discussionyear.47The balances of loans acquired.97, according to type of loan.Table 7:Loan Portfolio Years Ended December 31, (In thousands) 2023 2022 2021 2020 2019 Consumer: Credit cards $ 191,204 $ 196,928 $ 187,052 $ 188,845 $ 204,802 Other consumer 127,462 152,882 168,318 202,379 249,694 Total consumer 318,666 349,810 355,370 391,224 454,496 Real Estate: Construction and development 3,144,220 2,566,649 1,326,371 1,596,255 2,236,861 Single family residential 2,641,556 2,546,115 2,101,975 1,880,673 2,442,064 Other commercial 7,552,410 7,468,498 5,738,904 5,746,863 6,205,599 Total real estate 13,338,186 12,581,262 9,167,250 9,223,791 10,884,524 Commercial: Commercial 2,490,176 2,632,290 1,992,043 2,574,386 2,495,516 Agricultural 232,710 205,623 168,717 175,905 315,454 Total commercial 2,722,886 2,837,913 2,160,760 2,750,291 2,810,970 Other 465,932 373,139 329,123 535,591 275,714 Total loans before allowance for credit losses $ 16,845,670 $ 16,142,124 $ 12,012,503 $ 12,900,897 $ 14,425,704 Table 8 reflects the remaining maturities and interest rate sensitivity of loans atDecember 31, 2017.Table 9:8:Maturity and Interest Rate Sensitivity of Loans Over 1 year 1 year through Over (In thousands) or less 5 years 5 years Total Consumer $ 210,848 $ 232,771 $ 73,364 $ 516,983 Real estate 3,887,548 3,952,475 217,626 8,057,649 Commercial 1,294,028 684,750 56,904 2,035,682 Other 151,077 5,539 12,755 169,371 Total $ 5,543,501 $ 4,875,535 $ 360,649 $ 10,779,685 Predetermined rate $ 2,938,480 $ 2,679,210 $ 107,696 $ 5,725,386 Floating rate 2,605,021 2,196,325 252,953 5,054,299 Total $ 5,543,501 $ 4,875,535 $ 360,649 $ 10,779,685 Asset Quality 1 year Over 1 year through Over 5 years through Over (In thousands) or less 5 years 15 years 15 years Total Consumer $ 71,581 $ 243,638 $ 2,415 $ 1,032 $ 318,666 Real estate 2,958,676 8,461,135 1,726,537 191,838 13,338,186 Commercial 1,407,354 1,218,960 54,770 41,802 2,722,886 Other 219,745 110,673 122,804 12,710 465,932 Total $ 4,657,356 $ 10,034,406 $ 1,906,526 $ 247,382 $ 16,845,670 Predetermined rate Consumer $ 68,027 $ 124,085 $ 2,359 $ 811 $ 195,282 Real estate 1,332,508 5,107,185 904,390 112,158 7,456,241 Commercial 490,569 798,540 46,874 41,797 1,377,780 Other 52,134 109,097 120,436 12,317 293,984 Total $ 1,943,238 $ 6,138,907 $ 1,074,059 $ 167,083 $ 9,323,287 Floating rate Consumer $ 3,554 $ 119,553 $ 56 $ 221 $ 123,384 Real estate 1,626,168 3,353,950 822,147 79,680 5,881,945 Commercial 916,785 420,420 7,896 5 1,345,106 Other 167,611 1,576 2,368 393 171,948 Total $ 2,714,118 $ 3,895,499 $ 832,467 $ 80,299 $ 7,522,383 48A loan is considered impaired when it is probable that we will not receive all amounts due according to the contractual terms of the loans. Impaired loans include non-performing loans (loans past due 90 days or more and nonaccrual loans) and certain other loans identified by management that are still performing.Asset Quality Non-performing loans are comprised of (a) nonaccrual loans, (b) loans that are contractually past due 90 days and (c) other loans for which terms have been restructured to provide a reduction or deferral of interest or principal, because of deterioration in the financial position of the borrower. The subsidiary banks recognizeSimmons Bank recognizes income principally on the accrual basis of accounting. When loans are classified as nonaccrual, generally, the accrued interest is charged off and no further interest is accrued. Loans, excluding credit card loans, are placed on a nonaccrual basis either: (1) when there are serious doubts regarding the collectabilitycollectibility of principal or interest, or (2) when payment of interest or principal is 90 days or more past due and either (i) not fully secured or (ii) not in the process of collection. If a loan is determined by management to be uncollectible, the portion of the loan determined to be uncollectible is then charged to the allowance for loancredit losses.CreditWhen credit card loans are classified as impaired when payment of interest or principal is 90 days past due. When accounts reach 90 days past due and there are attachable assets, the accounts are considered for litigation. Credit card loans are generally charged off when payment of interest andor principal isexceeds 150 days past due. The credit card recovery group pursues account holders until it is determined, on a case-by-case basis, to be uncollectible.Total non-performing assets excluding all loans acquired, increased by $12.2$27.8 million from December 31, 2016,2022 to December 31, 2017. Total non-performing loans increased by $6.8 million from December 31, 2016 to December 31, 2017, primarily due to two credit relationships totaling $11.0 million in the Wichita market.2023. Nonaccrual loans increased by $6.5$24.9 million during 2017, primarily CRE and other consumer loans.During 2017, $3.2 million of previously closed branch buildings and land was reclassified2023, in addition to OREO from premises held for sale. There was no deterioration or further write-down of these properties. Also, as part of the First South Bank conversion, 5 branches were closed during the third quarter 2017. Under ASC Topic 360, there is a one year maximum holding period to classify premises as held for sale. However, under Arkansas State Banking laws former branch buildings must be recorded as OREO. We remain aggressivean increase in the identification, quantification and resolution of problem loans and assets.35Total non-performing assets, excluding all loans acquired, increased by $2.8 million from December 31, 2015, to December 31, 2016. Total non-performing loans increased by $20.5 million from December 31, 2015 to December 31, 2016, while foreclosed assets held for sale decreased by $17.9 million as we were able to rid ourselves of several significant non-performing assets through liquidation during 2016. Nonaccrual loans increased by $21.4 million during 2016, primarily CRE loans.$1.2 million. The increase in nonaccrual assets was primarily due to an increase in nonaccrual loans within our commercial loan portfolio.Non-performing assets, including modifications to borrowers experiencing financial difficulty (“FDMs”, formerly known as troubled debt restructurings, or TDRs) and acquired foreclosed assets, as a percent of total assets were 0.45% at December 31, 2023 compared to 0.23% at December 31, 2022.Total non-performing assets decreased by $13.8 million from December 31, 2021 to December 31, 2022. Nonaccrual loans decreased by $9.8 million during 2022, in addition to a decrease in foreclosed assets held for sale of $3.1 million. The decrease in nonaccrual loans was primarily due to an overall improvement in economic conditions from pandemic related stresses.Total non-performing assets decreased by $67.6 million from December 31, 2020 to December 31, 2021. Nonaccrual loans decreased by $54.7 million during 2021, in addition to a decrease in foreclosed assets held for sale of $12.4 million. The decrease in nonaccrual loans was primarily due to an overall improvement in economic conditions while the non-performing loansdecrease in foreclosed assets held for sale and other real estate owned is primarily the result of a single credit totaling $7.1the disposition of one commercial building in the St. Louis area and the disposition of one piece of commercial land with net book values at the time of sale of $6.5 million and other migrated assets that have deteriorated since acquisition. We believe we are adequately reserved for the potential exposures related to these credits. The majority of these balances were related to acquired loans that have migrated, residential loans that have entered loss mitigation, and certain balances remaining outstanding which were related to potential fraudulent activity on an agricultural loan relationship discussed above.During 2016, $652,000 of previously closed branch buildings and land was reclassified to OREO from premises held for sale. There was no deterioration or further write-down of these properties.Total non-performing assets excluding all loans acquired and foreclosed assets covered by FDIC loss share agreements, increased by $5.9$28.6 million from December 31, 2014,2019 to December 31, 2015. During 2015, $6.12020. Nonaccrual loans increased by $29.5 million of previously closed branch buildings and land was reclassified to OREO from premises held for sale. There was no deterioration or further write-down of these properties. This increase wasduring 2020, partially offset by the reductiona decrease in other foreclosed assets held for sale of $6.0 million.Total non-performing$728,000. The increase in nonaccrual loans increased by $5.9during 2020 is primarily related to one energy loan totaling $22.0 million from December 31, 2014which moved to December 31, 2015.From time to time, certain borrowers are experiencingexperience declines in income and cash flow. As a result, manythese borrowers are seekingseek to reduce contractual cash outlays, the most prominent being debt payments. In an effort to preserve our net interest margin and earning assets, we are open to working with existing customers in order to maximize the collectabilitycollectibility of the debt.When we restructure aWe have internal loan to a borrower that ismodification programs for borrowers experiencing financial difficulty and grant a concession that we would not otherwise consider, a “troubled debt restructuring” results and the Company classifies the loan as a TDR. The Company grants various types of concessions,difficulties. Modifications to borrowers experiencing financial difficulties may include interest rate reductions, principal or interest forgiveness and/or term extensions. We primarily use interest rate reduction and/or payment modifications or extensions, with an occasional forgiveness of principal.Under ASC Topic 310-10-35, Subsequent Measurement, a TDR is considered to be impaired, and an impairment analysis must be performed. We assess the exposure for each modification, either by collateral discounting or by calculationThe financial effects of the present valuemodified loans made to borrowers experiencing financial difficulty in the single family residential real estate and commercial portfolio were not significant during the year ended December 31, 2023 and did not significantly impact our determination of future cash flows, and determine if a specific allocation to the allowance for credit losses on loans during the year.During the year ended December 31, 2023, we modified one loan losses is needed.Once an obligation has been restructured because of such credit problems, it continuesrelated to be considered a TDR until paid in full; or, if an obligation yields a market interest rate and no longer has any concession regarding payment amount or amortization, then it is not considered a TDRthe other CRE portfolio, whereby the borrower was experiencing financial difficulty at the beginningtime of modification. The modification allowed for two months of interest only payments with the remaining balance due at maturity. Upon modification, a charge-off of $9.6 million was recorded in relation to this modified loan during 2023. As a result of the calendar year afterother CRE loan modified during the year in which the improvement takes place. Our TDR balance decreased to $12.9 million atended December 31, 2017, compared2023 being collateral-dependent, the impact to $14.2 million at December 31, 2016.We return TDRs to accrual status only if (1) all contractual amounts due can reasonably be expected to be repaid within a prudent period,our allowance for credit losses on loans was the difference between the fair value of the underlying collateral, adjusted for selling costs, and (2) repayment has been in accordance with the contract for a sustained period, typically at least six months.49We continue to maintain good asset quality, compared to the industry.industry, and strong asset quality remains a primary focus for us. The allowance for loancredit losses as a percent of total legacy loans was 0.73%1.34% as of December 31, 2017.2023. Non-performing loans equaled 0.81%0.50% of total loans,loans. Non-performing assets were 0.33% of total assets, a 10 basis point decreaseincrease from December 31, 2016. Non-performing assets were 0.52% of total assets.2022. The allowance for loancredit losses was 90%267% of non-performing loans. Our annualized net charge-offs to total loans for 20172023 was 0.35%0.12%. Excluding credit cards, the annualized net charge-offs to total loans for the same period was 0.31%0.09%. Annualized net credit card charge-offs to average total credit card loans were 1.61%2.20%, compared to 1.28%1.49% during 2016,2022, and approximately 176129 basis points better than the most recently published industry average charge-off ratio as reported by the Federal Reserve for all banks.We have had substantial growth from new loans and from loans migrating from acquired to legacy. When acquired loans renew, they are evaluated and if considered a pass quality credit they will migrate to the legacy portfolio and require less reserves. In addition, new loans also only require the minimum allowance consideration.We do not own any securities backed by subprime mortgage assets, and offer no mortgage loan products that target subprime borrowers. 36Table 109 presents information concerning non-performing assets, including nonaccrual loans at amortized cost and restructured loans and other real estate owned (excluding all loans acquired and excluding other real estate covered by FDIC loss share agreements).Table 10:9: Non-performing Assets Years Ended December 31 (In thousands, except ratios) 2017 2016 2015 2014 2013 Nonaccrual loans (1) $ 45,642 $ 39,104 $ 17,714 $ 12,038 $ 6,261 Loans past due 90 days or more (principal or interest payments): Government guaranteed student loans (2) -- -- -- -- 2,264 Other loans 520 299 1,191 961 687 Total loans past due 90 days or more 520 299 1,191 961 2,951 Total non-performing loans 46,162 39,403 18,905 12,999 9,212 Other non-performing assets: Foreclosed assets held for sale 32,118 26,895 44,820 44,856 64,820 Other non-performing assets 675 471 211 97 75 Total other non-performing assets 32,793 27,366 45,031 44,953 64,895 Total non-performing assets $ 78,955 $ 66,769 $ 63,936 $ 57,952 $ 74,107 Performing TDRs $ 7,107 $ 10,998 $ 3,031 $ 2,233 $ 9,497 Allowance for loan losses to non-performing loans 90 % 92 % 166 % 223 % 298 % Non-performing loans to total loans 0.81 0.91 0.58 0.63 0.53 Non-performing loans to total loans (excluding government guaranteed student loans) (2) 0.81 0.91 0.58 0.63 0.40 Non-performing assets to total assets (3) 0.52 0.79 0.85 1.25 1.69 Non-performing assets to total assets (excluding government guaranteed student loans) (2) (3) 0.52 0.79 0.85 1.25 1.64 Years Ended December 31, (Dollars in thousands) 2023 2022 2021 2020 2019 Nonaccrual loans (1)$ 83,325 $ 58,434 $ 68,204 $ 122,879 $ 93,330 Loans past due 90 days or more (principal or interest payments) 1,147 507 349 578 856 Total non-performing loans 84,472 58,941 68,553 123,457 94,186 Other non-performing assets: Foreclosed assets held for sale and other real estate owned 4,073 2,887 6,032 18,393 19,121 Other non-performing assets 1,726 644 1,667 2,016 1,964 Total other non-performing assets 5,799 3,531 7,699 20,409 21,085 Total non-performing assets $ 90,271 $ 62,472 $ 76,252 $ 143,866 $ 115,271 Performing FDMs (formerly TDRs) $33,577 $1,849 $4,289 $3,138 $5,887 Allowance for credit losses to non-performing loans 267 % 334 % 300 % 193 % 72 % Non-performing loans to total loans 0.50 % 0.37 % 0.57 % 0.96 % 0.65 % Non-performing assets (including performing FDMs (formerly TDRs)) to total assets 0.45 % 0.23 % 0.33 % 0.66 % 0.57 % Non-performing assets to total assets 0.33 % 0.23 % 0.31 % 0.64 % 0.54 % _________________________(1)Includes nonaccrual TDRs of approximately $5.8 million, $3.2 million, $2.5 million, $1.0 million and $0.7 million at December 31, 2017, 2016, 2015, 2014 and 2013, respectively.(2)Student loans past due 90 days or more are included in non-performing loans. Student loans are guaranteed by the federal government and will be purchased at 97% of principal and accrued interest when they exceed 270 days past due; therefore, non-performing ratios have been calculated excluding these loans.(3)Excludes all loans acquired and excludes other real estate acquired, covered by FDIC loss share agreements, except for their inclusion in total assets.(1) Includes nonaccrual FDMs (formerly known as TDRs) of approximately $282,000, $1.6 million, $2.7 million, $4.4 million and $1.6 million at December 31, 2023, 2022, 2021, 2020 and 2019, respectively.There was no interest income on the nonaccrual loans recorded for the years ended December 31, 2017, 20162023, 2022 and 2015.At December 31, 2017, impaired loans, net of government guarantees and acquired loans, were $43.9 million compared to $43.7 million at December 31, 2016. On an ongoing basis, management evaluates the underlying collateral on all impaired loans and allocates specific reserves, where appropriate, in order to absorb potential losses if the collateral were ultimately foreclosed.Allowance for LoanCredit LossesOverviewThe allowance for loancredit losses is a reserve established through a provision for loancredit losses charged to expense which represents management’s best estimate of probablelifetime expected losses based on reasonable and supportable forecasts, quantitative factors, and other qualitative considerations.Loans with similar risk characteristics such as loan type, collateral type, and internal risk ratings are aggregated for collective assessment. We use statistically-based models that have been incurredleverage assumptions about current and future economic conditions throughout the contractual life of the loan. Expected credit losses are estimated by either lifetime loss rates or expected loss cash flows based on three key parameters: probability-of-default (“PD”), exposure-at-default (“EAD”), and loss-given-default (“LGD”). Future economic conditions are incorporated to the extent that they are reasonable and supportable. Beyond the reasonable and supportable periods, the economic variables revert to a historical equilibrium at a pace dependent on the state of the economy reflected within the existing portfolio of loans. The allowance, in the judgment of management, is necessary to reserve for estimated loan losses and risks inherent in the loan portfolio. The Company’s allowance for loan loss methodology includes allowance allocations calculated in accordance with ASC Topic 310-10, Receivables, and allowance allocations calculated in accordance with ASC Topic 450-20, Loss Contingencies. Accordingly, the methodology is based on our internal grading system, specific impairment analysis,economic scenarios. We also include qualitative and quantitative factors.As mentioned above, allocationsadjustments to the allowance for loan lossesbased on factors and considerations that have not otherwise been fully accounted for.50Loans that have unique risk characteristics are categorized as either specific allocations or general allocations.37Specific AllocationsA loan is considered impaired when it is probable that we will not receive all amounts due according to the contractual terms of the loan, including scheduled principal and interest payments.evaluated on an individual basis. These evaluations are typically performed on loans with a deteriorated internal risk rating. For a collateral dependentcollateral-dependent loan, our evaluation process includes a valuation by appraisal or other collateral analysis.analysis adjusted for selling costs, when appropriate. This valuation is compared to the remaining outstanding principal balance of the loan. If a loss is determined to be probable, the loss is included in the allowance for loancredit losses as a specific allocation. If the loan is not collateral dependent, the measurement of loss is based on the difference between the expected and contractual future cash flows of the loan.General AllocationsThe general allocation is calculated monthly based on management’s assessment of several factors such as (1) historical loss experience based on volumes and types, (2) volume and trends in delinquencies and nonaccruals, (3) lending policies and procedures including those for loan losses, collections and recoveries, (4) national, state and local economic trends and conditions, (5) external factors and pressure from competition, (6) the experience, ability and depth of lending management and staff, (7) seasoning of new products obtained and new markets entered through acquisition and (8) other factors and trends that will affect specific loans and categories of loans. We established general allocations for each major loan category. This category also includes allocationsAdditional information related to loans which are collectively evaluated for loss such as credit cards, one-to-four family owner occupied residential real estate loans and other consumer loans.Reserve for Unfunded CommitmentsIn addition to the allowance for loan losses, we have established a reserve for unfunded commitments, classified in other liabilities. This reserve is maintained at a level sufficient to absorb losses arising from unfunded loan commitments. The adequacy of the reserve for unfunded commitments is determined monthly based on methodology similar to our methodology for determining the allowance for loan losses. Net adjustments to the reserve for unfunded commitments are included in other non-interest expense.38An analysis of the allowance for loan losses for the last five yearsnet charge-offs is shown in table 11.11:10. Table 10:Ratio of Net Charge-offs to Average Loans(Dollars in thousands) Net Charge-offs Average Loans Ratio of Net Charge-offs to Average Loans 2023 Credit cards $ (4,295) $ 195,545 (2.20) % Other consumer (984) 136,865 (0.72) % Real estate (9,999) 13,050,414 (0.08) % Commercial (3,870) 2,815,006 (0.14) % Other — 449,740 — % Total $ (19,148) $ 16,647,570 (0.12) % 2022 Credit cards $ (2,838) $ 190,119 (1.49) % Other consumer (679) 177,420 (0.38) % Real estate 2,794 11,157,499 0.03 % Commercial (11,897) 2,557,060 (0.47) % Other — 337,665 — % Total $ (12,620) $ 14,419,763 (0.09) % Allowance for LoanCredit Losses(In thousands) 2017 2016 2015 2014 2013 Balance, beginning of year $ 36,286 $ 31,351 $ 29,028 $ 27,442 $ 27,882 Loans charged off Credit card 3,905 3,195 3,107 3,188 3,263 Other consumer 3,767 1,975 1,672 1,638 1,561 Real estate 7,989 7,517 1,580 2,684 1,628 Commercial 7,837 3,956 1,415 1,044 382 Total loans charged off 23,498 16,643 7,774 8,554 6,834 Recoveries of loans previously charged off Credit card 1,021 907 890 896 901 Other consumer 2,239 516 538 470 591 Real estate 990 351 203 1,566 592 Commercial 103 365 180 326 192 Total recoveries 4,353 2,139 1,811 3,258 2,276 Net loans charged off 19,145 14,504 5,963 5,296 4,558 Provision for loan losses (1) 24,527 19,439 8,286 6,882 4,118 Balance, end of year (2) $ 41,668 $ 36,286 $ 31,351 $ 29,028 $ 27,442 Net charge-offs to average loans (3) 0.35 % 0.40 % 0.24 % 0.30 % 0.27 % Allowance for loan losses to period-end loans (3) 0.73 % 0.84 % 0.97 % 1.41 % 1.57 % Allowance for loan losses to net charge-offs (3) 217.64 % 250.18 % 525.76 % 548.11 % 602.06 % Allocation (1)Provision for loan losses of $1,866,000 attributable to loans acquired, was excluded from this table for 2017 (total year-to-date provision for loan losses is $26,393,000) and $626,000 was excluded from this table for 2016 (total 2016 provision for loan losses is $20,065,000). Charge offs of $2.4 million on loans acquired were excluded from this table for 2017 and $626,000 for 2016 was subsequently charged-off, resulting in no increase in the allowance related to loans acquired for 2016. Provision for loan losses of $736,000 attributable to acquired loans was excluded from this table for the year ended December 31, 2015 (total provision for loan losses for the year ended December 31, 2015 is $9,022,000).(2)Allowance for loan losses at December 31, 2017 includes a $418,000 allowance for loans acquired (not shown in the table above) and $954,000 allowance for loans acquired for the years ended December 31, 2016 and 2015. The total allowance for loan losses at December 31, 2017, 2016 and 2015 was $42,086,000, $37,240,000 and $32,305,000, respectively.(3)Excludes all acquired loans.Provision for Loan LossesThe amount of provision added to the allowance each year was based on management's judgment, with consideration given to the composition of the portfolio, historical loan loss experience, assessment of current economic conditions, past due and non-performing loans and net loss experience. It is management's practice to review the allowance on a monthly basis, and after considering the factors previously noted, to determine the level of provision made to the allowance.Allowance for Loan Losses AllocationThe Company may also consider additional qualitative factors in future periods for allowance allocations, including, among other factors, (1) seasoning of the loan portfolio, (2) the offering of new loan products, (3) specific industry conditions affecting portfolio segments and (4) the Company’s expansion into new markets. As of December 31, 2017,2023, the allowance for loancredit losses reflectsreflected an increase of approximately $5.4$28.3 million from December 31, 2016,2022, while total loans excluding loans acquired, increased by $1.4 billion$703.5 million over the same period. The allocation in each category within the allowance generally reflects the overall changes in the loan portfolio mix.The increase in the allowance for credit losses during 2023 was predominantly due to the loan growth experienced during the year, as well as refreshed economic forecasts. Our allowance for credit losses at December 31, 2023 was considered appropriate given the current economic environment and other related factors.51The following table sets forth the sum of the amounts of the allowance for loancredit losses attributable to individual loans within each category, or loan categories in general. The table also reflects the percentage of loans in each category to the total loan portfolio excluding loans acquired, for each of the periods indicated. TheseThe allowance amounts have been computed using the Company’s internal grading system,for credit losses by loan category is determined by i) our estimated reserve factors by category including applicable qualitative adjustments and ii) any specific impairment analysis, qualitative and quantitative factor allocations.allowance allocations that are identified on individually evaluated loans. The amounts shown are not necessarily indicative of the actual future losses that may occur within individual categories.39Table 12:11:Allocation of Allowance for LoanCredit Losses December 31 2017 2016 2015 2014 2013 (In thousands) Allowance Amount % of loans(1) Allowance Amount % of loans(1) Allowance Amount % of loans(1) Allowance Amount % of loans(1) Allowance Amount % of loans(1) Credit cards $ 3,784 9.1 % $ 3,779 4.3 % $ 3,893 5.5 % $ 5,445 9.1 % $ 5,430 10.6 % Other consumer 3,489 8.4 2,796 7.0 % 1,853 6.4 % 1,427 5.0 % 1,758 7.2 % Real estate 27,281 65.4 % 21,817 70.0 % 19,522 67.9 % 15,161 65.9 % 16,885 66.9 % Commercial 7,007 16.8 % 7,739 18.2 % 5,985 20.0 % 6,962 19.8 % 3,205 15.1 % Other 107 0.3 % 155 0.5 % 98 0.2 % 33 0.2 % 164 0.2 % Total (2) $ 41,668 100.0 % $ 36,286 100.0 % $ 31,351 100.0 % $ 29,028 100.0 % $ 27,442 100.0 % December 31, 2023 2022 2021 (Dollars in thousands) Allowance Amount % of loans (1)Allowance Amount % of loans (1)Allowance Amount % of loans (1)Credit cards $ 5,868 1.1% $ 5,140 1.2% $ 3,987 1.6% Other consumer 5,716 3.5% 6,614 3.2% 4,617 4.1% Real estate 177,177 79.2% 150,795 78.0% 179,270 76.3% Commercial 36,470 16.2% 34,406 17.6% 17,458 18.0% Total $ 225,231 100.0% $ 196,955 100.0% $ 205,332 100.0% Allowance for credit losses to period-end loans 1.34 % 1.22 % 1.71 % _________________________(1)Percentage of loans in each category to total loans, excluding loans acquired.(2)Allowance for loan losses at December 31, 2017 includes a $418,000 allowance for loans acquired (not shown in the table above) and $954,000 allowance for loans acquired for the years ended December 31, 2016 and 2015. The total allowance for loan losses at December 31, 2017, 2016 and 2015 was $42,086,000, $37,240,000 and $32,305,000, respectively.(1) Percentage of loans in each category to total loans.40Investments and Securities Investments and Securitiesor trading.Held-to-maturity(“AFS”).HTM securities, which include any security for which management haswe have the positive intent and ability to hold until maturity, are carried at historical cost adjusted for amortization of premiums and accretion of discounts. Premiums and discounts are amortized and accreted, respectively, to interest income using the constant effective yield method over the period to maturity. Interestsecurity’s estimated life. Prepayments are anticipated for mortgage-backed and dividendsSBA securities. Premiums on investments in debt and equitycallable securities are included in income when earned.Available-for-saleamortized to their earliest call date.AFS securities, which include any security for which management haswe have no immediate plansplan to sell but which may be sold in the future, are carried at fair value. Realized gains and losses, based on specifically identified amortized cost of the specificindividual security, are included in other income. Unrealized gains and losses are recorded, net of related income tax effects, in stockholders'stockholders’ equity. Premiums and discounts are amortized and accreted, respectively, to interest income using the constant effective yield method over the period to maturity. Interestestimated life of the security. Prepayments are anticipated for mortgage-backed and dividendsSBA securities. Premiums on investments in debt and equitycallable securities are included in income when earned.Our philosophy regarding investments is conservative based on investment type and maturity. Investments in the portfolio primarily include U.S. Treasury securities, U.S. Government agencies, mortgage-backed securities and municipal securities. Our general policy is not to invest in derivative type investments or high-risk securities, except for collateralized mortgage-backed securities for which collection of principal and interest is not subordinated to significant superior rights held by others.Held-to-maturityHTM and available-for-saleAFS investment securities were $368.1 million$3.73 billion and $1.6$3.15 billion, respectively, at December 31, 2017,2023, compared to the held-to-maturityHTM amount of $462.1 million$3.76 billion and available-for-saleAFS amount of $1.2$3.85 billion at December 31, 2016.As of December 31, 2017, $46.92023, $527.9 million, or 12.8%7.7%, of the held-to-maturity securities wereour total portfolio was invested in obligations of U.S. government agencies all of which will mature in less than five years. In the available-for-sale securities, $139.7 million, or 8.8%, were inand U.S. government agency securities, 14.3% of which will mature in less than five years.In order to reduce our income tax burden, $301.5 million, or 81.9%, of the held-to-maturity securitiesTreasury securities. Our investment portfolio as of December 31, 2017, was invested in tax-exempt obligations2023 also included $2.65 billion, or 38.5%, of state and political subdivisions. In the available-for-sale securities, there was $143.2 million invested in tax-exempt obligations of state and political subdivisions. A portion of the state and political subdivision debt obligations are non-ratedrated bonds, and representing relatively small issuances, primarily issued in Arkansas,states in which we are located, and are evaluated on an ongoing basis. There are no securities of any one state or political subdivision issuer exceeding ten percent of our stockholders'stockholders’ equity at December 31, 2017.52We had approximately $16.1 million,$3.10 billion, or 4.4%45.1%, of the held-to-maturityour total portfolio invested in mortgaged-backed securities at December 31, 2017. In2023. These mortgage-backed securities were issued by agencies of the available-for-saleU.S. government.During the quarters ended June 30, 2022 and September 30, 2021, we transferred, at fair value, $1.99 billion and $500.8 million, respectively, of securities approximately $1.2 billion, or 74.7% were invested in mortgaged-backed securities. Investments with limited marketability, such as stock infrom the Federal Reserve Bank andAFS portfolio to the Federal Home Loan Bank, are carried at cost and are reported as other available for sale securities.2017,2023, the held-to-maturity investment portfolio had gross unrealized gains of $6.0 million and grossrelated remaining combined net unrealized losses of $737,000.Additionally, during the third quarter of 2021, we began utilizing interest rate swaps designated as fair value hedges to mitigate the effect of changing interest rates on the fair values of $1.0 billion of fixed rate callable municipal securities held in the AFS portfolio. These swap agreements consist of a two year forward start date and involve the payment of fixed interest rates with a weighted average of 1.21% in exchange for variable interest rates based on federal funds rates, which became effective during the late third quarter of 2023. Securities within these swap agreements have maturity dates varying between 2028 and 2029. For the year ended December 31, 2023, the net amount included in interest income on investment securities in the consolidated statements of income related to these swap agreements was $11.9 million.The adoption of ASU 2016-13 at the beginning of 2020 required us to replace the existing impairment models for financial assets, which includes investment securities. Under this model, an estimate of expected credit losses that represents all contractual cash flows that is deemed uncollectible over the contractual life of the financial asset must be recorded. During 2023, we recorded $9.1 million of provision for credit losses related to AFS securities due to isolated corporate bonds within the portfolio. We charged-off $7.0 million directly related to one corporate bond, which was deemed uncollectible in the period, while the remaining isolated bonds were sold or experienced price recovery on previous impairments prior to the end of the period. Based upon our analysis of the underlying risk characteristics of the AFS portfolio, including credit ratings and other qualitative factors, no allowance for credit losses related to AFS securities was deemed necessary at December 31, 2023 and 2022. Our allowance for credit losses related to HTM securities was $3.2 million and $1.4 million at December 31, 2023 and 2022, respectively.An allowance for credit losses related to mortgage-backed securities and U.S. government agencies was not recorded as of December 31, 2023 due to those securities being explicitly or implicitly guaranteed by the U.S. government, are highly rated by major rating agencies and have a long history of no credit losses. See Note 3, Investment Securities, in the accompanying Notes to Consolidated Financial Statements for additional information related to our allowance for credit losses on investment securities held.We had $2.4 million ofno gross realized gains and $1.3$20.6 million of gross realized losses from the sale of securities during the year ended December 31, 2017. We had $5.8 million2023, compared to $46,000 of gross realized gains and no$324,000 of gross realized losses from the salecall of securities during the year ended December 31, 2016.2022. We had $350,000sold approximately $247.9 million of gross realized gains and $43,000 of realized losses from the sale ofinvestment securities during 2023, while no securities were sold during 2022. Securities sold during 2023 were in large part related to a strategic decision to sell low yield securities and use the year ended December 31, 2015.Trading securities, which include any security held primarily for near-term sale, are carried at fair value. Gainsproceeds to pay off higher rate wholesale fundings, including both brokered deposits and losses on trading securities are included in other income. Our trading account is established and maintained for the benefit of investment banking. The trading account is typically used to provide inventory for resale and is not used to take advantage of short-term price movements. During 2016, we significantly scaled back balances used for trading.Declines in the fair value of held-to-maturity and available-for-sale securities below their cost that are deemed to be other than temporary are reflected in earnings as realized losses. In estimating other-than-temporary impairment losses, management considers, among other things, (i) the length of time and the extent to which the fair value has been less than cost, (ii) the financial condition and near-term prospects of the issuer and (iii) the intent and ability of the Company to retain its investment in the issuer for a period of time sufficient to allow for any anticipated recovery in fair value.
FHLB advances.41Management hasWe have the ability and intent to hold the securities classified as held to maturityHTM until they mature, at which time we expect to receive full value for the securities. The contractual terms of those investments do not permit the issuer to settle the securities at a price less than the amortized cost bases of the investments. We expect the cash flows from principal maturities of securities to provide flexibility to fund future loan growth or reduce wholesale funding. Furthermore, as of December 31, 2017, management2023, we also hadhave the ability and intent to hold the securities classified as available-for-saleAFS for a period of time sufficient for a recovery of amortized cost, we do not have an immediate intent to sell the securities classified as AFS, and we believe the accounting standard of “more likely than not” has not been met regarding whether we would be required to sell any of the AFS securities before recovery of amortized cost. During 2024, we will continue to evaluate targeted sales of AFS securities based on prevailing market conditions and our funding and liquidity positions. The unrealized losses during 2023 are largely due to increases in market interest rates over the yields available at the time the underlying securities were purchased. The fair value is expected to recover as the bonds approach their maturity date or repricing date or if market yields for such investments decline. Management doesAccordingly, as of December 31, 2023, we believe the declines in fair value detailed in the table below are temporary and we do not believe any of the securities are impaired due to reasons of credit quality. Accordingly, as of December 31, 2017, management believes the impairments detailed in the table below are temporary. Should the impairment of any of these securities become other than temporary, the cost basis of the investment will be reduced and the resulting loss recognized in net income in the period the other-than-temporary impairment is identified.53Table 1312 presents the carryingamortized cost, fair value and fair value ofallowance for credit losses on investment securities for each of the years indicated.Table 13:12:Investment Securities Years Ended December 31 2017 2016 Gross Gross Estimated Gross Gross Estimated Amortized Unrealized Unrealized Fair Amortized Unrealized Unrealized Fair (In thousands) Cost Gains (Losses) Value Cost Gains (Losses) Value Held-to-Maturity U.S. Government agencies $ 46,945 $ 7 $ (228 ) $ 46,724 $ 76,875 $ 107 $ (182 ) $ 76,800 Mortgage-backed securities 16,132 8 (287 ) 15,853 19,773 63 (249 ) 19,587 State and political subdivisions 301,491 5,962 (222 ) 307,231 362,532 4,967 (842 ) 366,657 Other securities 3,490 -- -- 3,490 2,916 -- -- 2,916 Total $ 368,058 $ 5,977 $ (737 ) $ 373,298 $ 462,096 $ 5,137 $ (1,273 ) $ 465,960 Available-for-Sale U.S. Treasury $ -- $ -- $ -- $ -- $ 300 $ -- $ -- $ 300 U.S. Government agencies 141,559 116 (1,951 ) 139,724 140,005 67 (2,301 ) 137,771 Mortgage-backed securities 1,208,017 246 (20,946 ) 1,187,317 885,783 178 (17,637 ) 868,324 State and political subdivisions 144,642 532 (2,009 ) 143,165 108,374 38 (5,469 ) 102,943 Other securities 118,106 1,206 (1 ) 119,311 47,022 996 (2 ) 48,016 Total $ 1,612,324 $ 2,100 $ (24,907 ) $ 1,589,517 $ 1,181,484 $ 1,279 $ (25,409 ) $ 1,157,354 42(In thousands) Amortized Cost Allowance
for Credit LossesNet Carrying Amount Gross Unrealized
GainsGross Unrealized
(Losses)Estimated Fair
ValueHeld-to-maturity December 31, 2023 U.S. Government agencies $ 453,121 $ — $ 453,121 $ — $ (89,203) $ 363,918 Mortgage-backed securities 1,161,694 — 1,161,694 354 (107,834) 1,054,214 State and political subdivisions 1,858,680 (2,006) 1,856,674 284 (369,509) 1,487,449 Other securities 256,007 (1,208) 254,799 — (25,010) 229,789 Total HTM $ 3,729,502 $ (3,214) $ 3,726,288 $ 638 $ (591,556) $ 3,135,370 December 31, 2022 U.S. Government agencies $ 448,012 $ — $ 448,012 $ — $ (102,558) $ 345,454 Mortgage-backed securities 1,190,781 — 1,190,781 227 (118,960) 1,072,048 State and political subdivisions 1,861,102 (110) 1,860,992 56 (446,198) 1,414,850 Other securities 261,199 (1,278) 259,921 — (29,040) 230,881 Total HTM $ 3,761,094 $ (1,388) $ 3,759,706 $ 283 $ (696,756) $ 3,063,233 (In thousands) Amortized
CostAllowance for Credit Losses Gross Unrealized
GainsGross Unrealized
(Losses)Estimated Fair
ValueAvailable-for-sale December 31, 2023 U.S. Treasury $ 2,285 $ — $ — $ (31) $ 2,254 U.S. Government agencies 74,460 — 35 (1,993) 72,502 Mortgage-backed securities 2,138,652 — 8 (198,353) 1,940,307 State and political subdivisions 1,035,147 — 187 (132,541) 902,793 Other securities 259,165 — — (24,868) 234,297 Total AFS $ 3,509,709 $ — $ 230 $ (357,786) $ 3,152,153 December 31, 2022 U.S. Treasury $ 2,257 $ — $ — $ (60) $ 2,197 U.S. Government agencies 191,498 — 103 (7,322) 184,279 Mortgage-backed securities 2,809,319 — 20 (266,437) 2,542,902 State and political subdivisions 1,056,124 — 250 (185,300) 871,074 Other securities 272,215 — — (19,813) 252,402 Total AFS $ 4,331,413 $ — $ 373 $ (478,932) $ 3,852,854 54Table 1413 reflects the amortized cost and estimated fair value of securities at December 31, 2017,2023, by contractual maturity and the weighted average yields (for tax-exempt obligations on a fully taxable equivalent basis, assuming a 26.135% tax rate) of such securities. Expected maturities will differ from contractual maturities because borrowers may have the right to call or prepay obligations, with or without call or prepayment penalties.Table 14:13:Maturity Distribution of Investment Securities December 31, 2017 Over Over 1 year 5 years Total 1 year through through Over No fixed Amortized Par Fair (In thousands) or less 5 years 10 years 10 years maturity Cost Value Value Held-to-Maturity U.S. Government agencies $ 29,982 $ 16,963 $ -- $ -- $ -- $ 46,945 $ 47,000 $ 46,724 Mortgage-backed securities -- -- -- -- 16,132 16,132 16,306 15,853 State and political subdivisions 16,337 68,427 91,391 125,336 -- 301,491 300,761 307,231 Other securities 58 61 970 2,401 -- 3,490 3,514 3,490 Total $ 46,377 $ 85,451 $ 92,361 $ 127,737 $ 16,132 $ 368,058 $ 367,581 $ 373,298 Percentage of total 12.6 % 23.2 % 25.1 % 34.7 % 4.4 % 100.0 % Weighted average yield 1.4 % 2.2 % 3.0 % 3.6 % 2.3 % 2.8 % Available-for-Sale U.S. Government agencies $ 10 $ 19,922 $ 16,078 $ 105,549 $ -- $ 141,559 $ 136,843 $ 139,724 Mortgage-backed securities -- -- -- -- 1,208,017 1,208,017 1,171,120 1,187,317 State and political subdivisions 580 15,594 8,125 120,343 -- 144,642 129,245 143,165 Other securities -- 100 -- -- 118,006 118,106 118,106 119,311 Total $ 590 $ 35,616 $ 24,203 $ 225,892 $ 1,326,023 $ 1,612,324 $ 1,555,314 $ 1,589,517 Percentage of total -- % 2.2 % 1.5 % 14.0 % 82.3 % 100.0 % Weighted average yield 1.5 % 2.0 % 2.1 % 2.4 % 2.1 % 2.1 % Deposits December 31, 2023 Over Over 1 year 5 years Total 1 year through through Over No fixed Amortized Par Fair (In thousands) or less 5 years 10 years 10 years maturity Cost Value Value Held-to-Maturity U.S. Government agencies $ — $ 3,345 $ 91,481 $ 358,295 $ — $ 453,121 $ 480,246 $ 363,918 Mortgage-backed securities — — — — 1,161,694 1,161,694 1,216,312 1,054,214 State and political subdivisions 365 5,814 44,074 1,808,427 — 1,858,680 1,869,433 1,487,449 Other securities 1,108 — 252,384 2,515 — 256,007 266,878 229,789 Total $ 1,473 $ 9,159 $ 387,939 $ 2,169,237 $ 1,161,694 $ 3,729,502 $ 3,832,869 $ 3,135,370 Percentage of total 0.1 % 0.2 % 10.4 % 58.2 % 31.1 % 100.0 % Weighted average yield 4.2 % 2.7 % 2.3 % 2.6 % 2.2 % 2.5 % Available-for-Sale U.S. Treasury $ 1,292 $ 993 $ — $ — $ — $ 2,285 $ 2,300 $ 2,254 U.S. Government agencies 633 26,481 13,933 33,413 — 74,460 73,016 72,502 Mortgage-backed securities — — — — 2,138,652 2,138,652 2,095,187 1,940,307 State and political subdivisions 3,461 17,043 19,136 995,507 — 1,035,147 1,091,938 902,793 Other securities 5,032 70,870 183,007 — 256 259,165 267,134 234,297 Total $ 10,418 $ 115,387 $ 216,076 $ 1,028,920 $ 2,138,908 $ 3,509,709 $ 3,529,575 $ 3,152,153 Percentage of total 0.3 % 3.3 % 6.2 % 29.3 % 60.9 % 100.0 % Weighted average yield 3.9 % 5.6 % 4.0 % 2.9 % 2.7 % 3.0 % Deposits Deposits are our primary source of funding for earning assets and are primarily developed through our network of 200234 financial centers.centers as of December 31, 2023. We offer a variety of products designed to attract and retain customers with a continuing focus on developing core deposits. Our core deposits consist of all deposits excluding time deposits of $100,000$250,000 or more and brokered deposits. As of December 31, 2017,2023, core deposits comprised 90.2%79.2% of our total deposits.We continually monitor the funding requirements along with competitive interest rates in the markets we serve. Because of our community banking philosophy, our executives in the local markets, with oversight by the Chief Deposit Officer, Asset Liability Committee and the Bank’s Treasury Department, establish the interest rates offered on both core and non-core deposits. This approach ensures that the interest rates being paid are competitively priced for each particular deposit product and structured to meet the funding requirements. We believe we are paying a competitive rate when compared with pricing in those markets.4355We manage our interest expense through deposit pricing and do not anticipate a significant change in total deposits.pricing. We believe that additional funds can be attracted and deposit growth can be accelerated through deposit pricing if we experience increased loan demand or other liquidity needs. We can also utilize brokered deposits as an additional source of funding to meet liquidity needs.Our total deposits as of December 31, 20172023, were $11.1$22.24 billion, an increasea decrease of $4.4 billion, or 64.7%,$303.1 million from $6.7December 31, 2022. Noninterest bearing transaction accounts, interest bearing transaction accounts and savings accounts totaled $15.80 billion at December 31, 2016. The increase in deposits is due primarily2023, compared to the Hardeman, OKSB and First Texas acquisitions. We have also continued our strategy to move more volatile time deposits to less expensive, revenue enhancing transaction accounts throughout 2017. Non-interest bearing transaction accounts increased $1.2 billion to $2.7$17.78 billion at December 31, 2017, compared2022, a decrease of $1.98 billion. Total time deposits increased $1.68 billion to $1.5$6.45 billion at December 31, 2016. Interest bearing transaction and savings accounts were $6.52023, from $4.77 billion at December 31, 2017, a $2.5 billion increase compared to $4.0 billion on December 31, 2016. Total time deposits increased approximately $645.7 million to $1.933 billion at December 31, 2017, from $1.287 billion at December 31, 2016.2022. We had $159.6 million$2.90 billion and $7.0 million$2.75 billion of brokered deposits at December 31, 20172023, and 2016,December 31, 2022, respectively.The change in the mix of deposits at December 31, 2023 as compared to December 31, 2022 reflects increased market competition and consumer migration toward higher rate deposits, principally certificates of deposit, given the rapid increase in interest rates that has occurred over the past year. We are continuing to refine our product offerings to give customers flexibility of choice while maintaining the ability to adjust interest rates timely in the current rate environment.Table 1514 reflects the classification of the average deposits and the average rate paid on each deposit category which is in excess of 10 percent of average total deposits for the three years ended December 31, 2017.Table 15:14:Average Deposit Balances and Rates December 31 2017 2016 2015 (In thousands) Average Amount Average Rate Paid Average Amount Average Rate Paid Average Amount Average Rate Paid Non-interest bearing transaction accounts $ 1,788,385 -- $ 1,333,965 -- $ 1,133,951 -- Interest bearing transaction and savings deposits 4,594,733 0.39 % 3,637,907 0.22 % 3,304,654 0.24 % Time deposits $100,000 or more 650,560 0.72 % 595,884 0.66 % 511,105 0.62 % Other time deposits 780,141 0.64 % 667,433 0.49 % 833,657 0.52 % Total $ 7,813,819 0.36 % $ 6,235,189 0.24 % $ 5,783,367 0.26 % The Company's December 31, 2023 2022 2021 (In thousands) Average Amount Average Rate Paid Average Amount Average Rate Paid Average Amount Average Rate Paid Noninterest bearing transaction accounts $ 5,201,384 — % $ 5,827,160 — % $ 4,836,839 — % Interest bearing transaction and savings deposits 11,033,263 2.17 % 12,253,164 0.51 % 10,638,665 0.18 % Time deposits 6,038,640 3.87 % 3,094,747 1.16 % 2,804,851 0.77 % Total $ 22,273,287 2.12 % $ 21,175,071 0.47 % $ 18,280,355 0.23 % Our maturities of large denomination time deposits not covered by deposit insurance at December 31, 2017 and 20162023 are presented in table 16.16:15.Table 15:Maturities of Large Denomination Time Deposits Time Certificates of Deposit ($100,000 or more) December 31 2017 2016 (In thousands) Balance Percent Balance Percent Maturing Three months or less $ 415,051 38.0 % $ 175,736 29.3 % Over 3 months to 6 months 150,932 13.8 % 107,985 18.0 % Over 6 months to 12 months 286,611 26.3 % 151,776 25.3 % Over 12 months 239,294 21.9 % 164,783 27.4 % Total $ 1,091,888 100.0 % $ 600,280 100.0 % Fed Funds Purchased and Securities Sold under Agreements to RepurchaseDecember 31, 2023 (In thousands) Balance Percent Maturing Three months or less $ 678,976 61.5 % Over 3 months to 6 months 183,868 16.7 % Over 6 months to 12 months 189,657 17.2 % Over 12 months 50,622 4.6 % Total $ 1,103,123 100.0 % 56Federal Funds Purchased and Securities Sold Under Agreements to Repurchase Federal funds purchased and securities sold under agreements to repurchase were $122.4$68.0 million at December 31, 2017,2023, as compared to $115.0$160.4 million at December 31, 2016.We have historically funded our growth in earning assets through the use of core deposits, large certificates of deposits from local markets, brokered deposits, FHLB borrowings and Federal funds purchased. Management anticipates that these sources will provide necessary funding in the foreseeable future.44Other Borrowings and Subordinated Debentures Other Borrowings and Subordinated Debentures$1.5$1.34 billion and $333.6 million$1.23 billion at December 31, 20172023 and 2016,2022, respectively. The outstanding balance for December 31, 20172023 includes $1.1 billion$953.2 million in FHLB advances; $366.1 million in subordinated notes and unamortized debt issuance costs; and $19.1 million of other long-term debt. FHLB advances outstanding at December 31, 2023, which increased as compared to December 31, 2022 due to a strategic decision to utilize short-term borrowings to elevate our liquidity position given the macroeconomic environment during the year, are primarily fixed rate, fixed term advances, which are due less than one year from origination and therefore are classified as short-term advances.A summary of information related to our FHLB short-term advances, $134.6 millionconsisting of fixed rate, fixed term advances, is presented in FHLB long-term advances, $75.0 million revolving credit agreement, $43.4 million in notes payable and $140.6 million inTable 16.Table 16:Short-Term Borrowings December 31, (Dollars in thousands) 2023 2022 2021 Amount outstanding at year-end $ 950,000 $ 835,000 $ — Weighted-average interest rate at year-end 5.40 % 4.20 % — % Maximum amount outstanding at any month-end during the year $ 1,350,000 $ 1,300,000 $ — Average amount outstanding during the year $ 1,149,387 $ 1,124,314 $ — Weighted-average interest rate for the year 5.20 % 2.08 % — % During the third quarter of 2022, we redeemed the five issuances of trust preferred securities and other subordinated debt.The increase in our total debt during 2017 was primarily attributablewhich had an outstanding aggregate principal amount of $56.2 million. We recorded a loss of $365,000 related to the OKSB, First Texasearly retirement of debt, which represented the unamortized purchase discounts associated with the previously acquired trust preferred securities.In March 2018, we issued $330.0 million in aggregate principal amount of 5.00% Fixed-to-Floating Rate Subordinated Notes (“Notes”) at a public offering price equal to 100% of the aggregate principal amount of the Notes. We incurred $3.6 million in debt issuance costs related to the offering. The Notes will mature on April 1, 2028 and Hardeman acquisitions. are subordinated in right of payment to the payment of our other existing and future senior indebtedness, including all our general creditors. The Notes are obligations of the Company only and are not obligations of, and are not guaranteed by, any of its subsidiaries.We assumed subordinated debtFixed-to-Floating Rate Subordinated Notes in an aggregate principal amount, net of discounts,premium adjustments, of $75.9 million related to OKSB and First Texas and $6.7$37.4 million in connection with the Hardeman acquisition.Also during 2017, the Company entered into a Revolving Credit Agreement with U.S. Bank National AssociationSpirit acquisition in April 2022 (the “Spirit Notes”). The Spirit Notes will mature on July 31, 2030, and executed an unsecured Revolving Credit Note pursuant to which we may borrow, prepay and re-borrow up to $75.0 million, the proceeds of which were primarily used to pay off amounts outstanding under a term note assumed with the First Texas acquisition.The $43.4 million notes payable is unsecured debt from correspondent banksinitially bear interest at a fixed annual rate of 3.85% with6.00%, payable quarterly, principalin arrears, to, but excluding, July 31, 2025. From and including July 31, 2025, to, but excluding, the maturity date or earlier redemption date, the interest payments. The debt hasrate will reset quarterly to an interest rate per annum equal to a ten year amortization with a 5 year balloon payment duebenchmark rate, which is expected to be the then-current three-month Secured Overnight Financing Rate, as published by the Federal Reserve Bank of New York (provided, that in October 2020.57Aggregate annual maturities of long-term debt at December 31, 20172023 are presented in tableTable 17.Table 17:Maturities of Long-Term Debt Annual (In thousands) Year Maturities 2018 $ 1,325,093 2019 7,486 2020 36,222 2021 2,165 2022 1,314 Thereafter 148,309 Total $ 1,520,589 Capital Annual Maturities Year (In thousands) 2024 $ 1,822 2025 1,822 2026 1,824 2027 1,920 2028 332,210 Thereafter 48,909 Total $ 388,507 Capital OverviewOverviewAt December 31, 2017,2023, total capital reached $2.085was $3.43 billion. Capital represents shareholder ownership in the Company – the book value of assets in excess of liabilities. At December 31, 2017,2023, our common equity to asset ratio was 13.9%12.53% compared to 13.7%11.91% at year-end 2016.Capital StockOn February 27, 2009, at a special meeting, our shareholders approved an amendment to the Articles of Incorporation to establish 40,040,000 authorized shares of preferred stock, $0.01 par value. TheOn April 27, 2022, our shareholders approved an amendment to our Articles of Incorporation to remove an $80.0 million cap on the aggregate liquidation preference associated with the preferred stock and increase the number of allauthorized shares of preferred stock cannot exceed $80,000,000.On January 18, 2018, the board of directors of the Company approved a two-for-one stock split of the Corporation’s outstandingour Class A common stock from 175,000,000 to 350,000,000.On October 29, 2019, we filed Amended and Restated Articles of Incorporation (“Common Stock”October Amended Articles”) inwith the formArkansas Secretary of a 100% stock dividend for shareholders of record as of the close of business on January 30, 2018 (“Record Date”).State. The new shares were distributed by the Company’s transfer agent, Computershare,October Amended Articles classified and the Company’s common stock began trading on a split-adjusted basis on the NASDAQ Global Select Market on February 9, 2018. All previously reported share and per share data included in filings subsequent to the Payment Date are restated to reflect the retroactive effect of this two-for-one stock split.On February 27, 2015, as part of the acquisition of Community First, the Company issued 30,852 shares of Senior Non-Cumulative Perpetualdesignated Series D Preferred Stock, Par Value $0.01 Per Share (“Series A (“Simmons Series AD Preferred Stock”) in exchange for the outstanding shares, out of Community First Senior Non-Cumulative Perpetual Preferred Stock, Series C (“Community First Series C Preferred Stock”). Theour authorized preferred stock was held by the United States Department of the Treasury (“Treasury”) as the Community First Series C Preferred Stock was issued when Community First entered into a Small Business Lending Fund Securities Purchase Agreement with the Treasury. The Simmons Series A Preferred Stock qualified as Tier 1 capital and paid quarterly dividends.stock. On January 29, 2016, the CompanyNovember 30, 2021, we redeemed all of the Simmons Series AD Preferred Stock, including accrued and unpaid dividends.
On April 27, 2022, our shareholders approved an amendment to our Articles of Incorporation to remove the classification and designation for the Series D Preferred Stock. As of December 31, 2023, there were no shares of preferred stock issued or outstanding.45On March 31, 2021, we filed a shelf registration with the SEC. The shelf registration statement provides increased flexibility and more efficient access to raise capital from time to time through the sale of common stock, preferred stock, debt securities, depository shares, warrants, purchase contracts, purchase units, subscription rights, units or a combination thereof, subject to market conditions. Specific terms and prices are determined at the time of any offering under a separate prospectus supplement that we are required to file with the SEC at the time of the specific offering.Stock RepurchaseDuring 2007, the Company approved ProgramOn October 22, 2019, we announced a stock repurchase program (the “2019 Program”) under which authorized thewe could repurchase of up to 1,400,000 shares (split adjusted)$60.0 million of common stock.our Class A Common Stock currently issued and outstanding. On March 5, 2020, we announced an amendment to the 2019 Program that increased the maximum amount that could be repurchased under the 2019 Program from $60.0 million to $180.0 million. Effective July 23, 2012, we announced the substantial completion of the existing stock repurchase program and the adoption by2021, our Board of Directors approved another amendment to the 2019 Program that increased the amount of our Class A common stock that may be repurchased from a maximum of $180.0 million to a maximum of $276.5 million and extended the term of the 2019 Program from October 31, 2021, to October 31, 2022.During January 2022, we substantially exhausted the repurchase capacity under the 2019 Program. As a result, our Board of Directors authorized a new stock repurchase program. The current program authorizes thein January 2022 (“2022 Program”) under which we may repurchase of up to 1,700,000 additional shares$175.0 million of our Class A common stock or approximately 5%currently issued and outstanding. Because the 2022 Program was set to terminate on January 31, 2024, our Board of Directors authorized a new stock repurchase program in January 2024 (“2024 Program”) under which we may repurchase up to $175.0 million of our Class A common stock currently issued and outstanding.58During 2023, we repurchased 2,257,049 shares at an average price of $17.72 per share under the 2022 Program. During 2022, we repurchased 513,725 shares outstanding.at an average price of $31.25 per share under the 2019 Program and 3,919,037 shares at an average price of $24.26 per share under the 2022 Program, respectively. The 2022 Program repurchases were all completed during the second and third quarters of 2022.Under the 2024 Program, we may repurchase shares are to be purchased from time to time at prevailing market prices,of our common stock through open market or unsolicitedand privately negotiated transactions depending uponor otherwise. The timing, pricing, and amount of any repurchases under the 2024 Program will be determined by management at its discretion based on a variety of factors, including, but not limited to, trading volume and market conditions. Under theprice of our common stock, corporate considerations, our working capital and investment requirements, general market and economic conditions, and legal requirements. The 2024 Program does not obligate us to repurchase program, there is no time limit for theany common stock repurchases, nor is there a minimum number of shares that we intend to repurchase. Weand may discontinue purchasesbe modified, discontinued, or suspended at any time that management determines additional purchases are not warranted.without prior notice. We intend to use the repurchased shares to satisfy stock option exercises, payment of future stock awards and dividends and general corporate purposes. All share and per share amounts were restatedanticipate funding for the two-for-one stock split during February 2018.We had no stock repurchases during 2016 or 2017.Cash DividendsWe declared cash dividends on our common stock of $0.50 per share (split adjusted) for the twelve months ended December 31, 2017, compared to $0.48 (split adjusted)$0.80 per share for the twelve months ended December 31, 2016.2023, compared to $0.76 per share for the twelve months ended December 31, 2022, an increase of $0.04, or 5%. The timing and amount of future dividends are at the discretion of our Board of Directors and will depend upon our consolidated earnings, financial condition, liquidity and capital requirements, the amount of cash dividends paid to us by our subsidiaries, applicable government regulations and policies and other factors considered relevant by our Board of Directors. Our Board of Directors anticipates that we will continue to pay quarterly dividends in amounts determined based on the factors discussed above. However, there can be no assurance that we will continue to pay dividends on our common stock at the current levels or at all. See Item 5, Market for Registrant’s Common Equity and Related Stockholder Matters, for additional information regarding cash dividends.Parent Company LiquidityThe primary liquidity needs of theSimmons First National Corporation (the Parent CompanyCompany) are the payment of dividends to shareholders, and the funding of debt obligations.obligations and cash needs for acquisitions. The primary sources for meeting these liquidity needs are the current cash on hand at the parent company and the future dividends received from Simmons Bank. Payment of dividends by the subsidiary bankSimmons Bank is subject to various regulatory limitations. The Company continually assesses its capital and liquidity needs and the best way to meet them, including, without limitation, through capital raising in the market via stock or debt offerings. See Item 7A, Liquidity“Quantitative and Qualitative Disclosures About Market Risk,Risk”, for additional information regarding the parent company’s liquidity, which is incorporated herein by reference. The redemption of our trust preferred securities during the third quarter of 2022 did not have a meaningful impact on the Parent Company’s liquidity.Risk-Based CapitalOur bank subsidiariesThe Company and Simmons Bank are subject to various regulatory capital requirements administered by the federal banking agencies. Failure to meet minimum capital requirements can initiate certain mandatory and possibly additional discretionary actions by regulators that, if undertaken, could have a direct material effect on our financial statements. Under capital adequacy guidelines and the regulatory framework for prompt corrective action, we must meet specific capital guidelines that involve quantitative measures of our assets, liabilities and certain off-balance-sheet items as calculated under regulatory accounting practices. Our capital amounts and classifications are also subject to qualitative judgments by the regulators about components, risk weightings and other factors.Quantitative measures established by regulation to ensure capital adequacy require us to maintain minimum amounts and ratios (set forth in the table below) of total, Tier 1 and common equity Tier 1 capital (as defined in the regulations) to risk-weighted assets (as defined) and of Tier 1 capital (as defined) to average assets (as defined). Management believes that, as of December 31, 2017,2023, we meetmet all capital adequacy requirements to which we are subject.As of the most recent notification from regulatory agencies, each subsidiarySimmons Bank was well capitalized under the regulatory framework for prompt corrective action. To be categorized as well capitalized, the Company and the BanksSimmons Bank must maintain minimum total risk-based, Tier 1 risk-based, common equity Tier 1 risk-based and Tier 1 leverage ratios as set forth in the table. There are no conditions or events since that notification that management believes have changed the institutions’bank’s categories.4659Our risk-based capital ratios at December 31, 20172023 and 20162022 are presented in tableTable 18 below:Table 18:Risk-Based Capital December 31 (In thousands, except ratios) 2017 2016 Tier 1 capital Stockholders’ equity $ 2,084,564 $ 1,151,111 Trust preferred securities -- 60,397 Goodwill and other intangible assets (902,371 ) (354,028 ) Unrealized gain on available-for-sale securities, net of income taxes 17,264 15,212 Other -- 15 Total Tier 1 capital 1,199,457 872,707 Tier 2 capital Qualifying unrealized gain on available-for-sale equity securities 1 -- Trust preferred securities and subordinated debt 140,565 Qualifying allowance for loan losses 48,947 40,241 Total Tier 2 capital 189,513 40,241 Total risk-based capital $ 1,388,970 $ 912,948 Risk weighted assets $ 12,234,160 $ 6,039,034 Ratios at end of year Common equity Tier 1 ratio (CET1) 9.80 % 13.45 % Tier 1 leverage ratio 9.21 % 10.95 % Tier 1 risk-based capital ratio 9.80 % 14.45 % Total risk-based capital ratio 11.35 % 15.12 % Minimum guidelines Common equity Tier 1 ratio (CET1) 4.50 % 4.50 % Tier 1 leverage ratio 4.00 % 4.00 % Tier 1 risk-based capital ratio 6.00 % 6.00 % Total risk-based capital ratio 8.00 % 8.00 % December 31, (Dollars in thousands) 2023 2022 Tier 1 capital: Stockholders’ equity $ 3,426,488 $ 3,269,362 CECL transition provision 61,746 92,619 Goodwill and other intangible assets (1,398,810) (1,412,667) Unrealized loss on available-for-sale securities, net of income taxes 404,375 517,560 Total Tier 1 capital 2,493,799 2,466,874 Tier 2 capital: Subordinated notes and debentures 366,141 365,989 Subordinated debt phase out (66,000) — Qualifying allowance for credit losses and reserve for unfunded commitments 170,977 115,627 Total Tier 2 capital 471,118 481,616 Total risk-based capital $ 2,964,917 $ 2,948,490 Risk weighted assets $20,599,238 $20,738,727 Assets for leverage ratio $26,552,988 $26,407,061 Ratios at end of year: Common equity Tier 1 ratio (CET1) 12.11 % 11.90 % Tier 1 leverage ratio 9.39 % 9.34 % Tier 1 risk-based capital ratio 12.11 % 11.90 % Total risk-based capital ratio 14.39 % 14.22 % Minimum guidelines: Common equity Tier 1 ratio (CET1) 4.50 % 4.50 % Tier 1 leverage ratio 4.00 % 4.00 % Tier 1 risk-based capital ratio 6.00 % 6.00 % Total risk-based capital ratio 8.00 % 8.00 % Regulatory Capital ChangesIn July 2013, the Company’s primary federal regulator,December 2018, the Federal Reserve, publishedOffice of the Comptroller of the Currency and Federal Deposit Insurance Corporation (“FDIC”) (collectively, the “agencies”) issued a final rule revising regulatory capital rules in anticipation of the adoption of ASU 2016-13 that provided an option to phase in over a three year period on a straight line basis the day-one impact of the adoption on earnings and Tier 1 capital (the “Basel III Capital Rules”“CECL Transition Provision”) establishing.In March 2020, in response to the COVID-19 pandemic, the agencies issued a new comprehensiveregulatory capital frameworkrule revising the CECL Transition Provision to delay the estimated impact on regulatory capital stemming from the implementation of ASU 2016-13. The rule provides banking organizations that implement CECL before the end of 2020 the option to delay for U.S. banks.two years an estimate of CECL’s effect on regulatory capital, followed by a three-year transition period (the “2020 CECL Transition Provision”). The rules implementCompany elected to apply the Basel Committee’s December 2010 framework known as “Basel III” for strengthening international capital standards. The Basel III Capital Rules substantially revise the risk-based capital requirements applicable to bank holding companies and depository institutions compared to the current U.S. risk-based capital rules.The Basel III Capital Rules define the components of capital and address other issues affecting the numerator in banking institutions’ regulatory capital ratios. The rules also address risk weights and other issues affecting the denominator in banking institutions’ regulatory capital ratios and replace the existing risk-weighting approach with a more risk-sensitive approach.expand theestablished risk-weighting categories from the current four Basel I-derived categories (0%, 20%, 50% and 100%) to a much larger and more risk-sensitive number of categories depending on the nature of the assets, generally ranging from 0% for U.S. government and agency securities, to 600% for certain equity exposures, and resulting in higher risk weights for a variety of asset categories, including many residential mortgages and certain commercial real estate.
exposures.4760The final rules includeincluded a new common equity Tier 1 capital to risk-weighted assets ratio of 4.5% and a common equity Tier 1 capital conservation buffer of 2.5% of risk-weighted assets. The rules also raiseraised the minimum ratio of Tier 1 capital to risk-weighted assets from 4.0% to 6.0% and require a minimum leverage ratio of 4.0%. The Basel III Capital Rules became effective for the Company and its subsidiary bank on January 1, 2015, with full compliance with all of the final rule’s requirements phased in over a multi-year schedule. Management believes that, as of December 31, 2017, the Company and its bank subsidiaries would meet all capital adequacy requirements under the Basel III Capital Rules on a fully phased-in basis if such requirements were currently effective.Prior to December 31, 2017, tierTier 1 capital included common equity tierTier 1 capital and certain additional tierTier 1 items as provided under the Basel III Capital Rules. The tierTier 1 capital for the Company consisted of common equity tierTier 1 capital and trust preferred securities. The Basel III Capital Rules include certain provisions that require trust preferred securities to be phased out of qualifying tierTier 1 capital when assets surpass $15 billion. As of December 31, 2017, the Company exceeded $15 billion in total assets and the grandfather provisions applicable to its trust preferred securities no longer apply and such trust preferred securities are no longer included as tierTier 1 capital. $140.6 millionAll of the Company’s trust preferred securities and qualifyingwere redeemed during the third quarter of 2022. Qualifying subordinated debt of $300.1 million is included as Tier 2 and total capital of the Company as of December 31, 2017.Off-Balance Sheet Arrangements and Aggregate Contractual ObligationsLiquidityIn the normal course of business the Company enterswe have entered into a number of contractual obligations and have made commitments to make future payments. Refer to the accompanying notes to consolidated financial commitments.statements elsewhere in this report for the expected timing of such payments as of December 31, 2023. Examples of these commitments include but are not limited to long-term debt financing (Note 12, Other Borrowings and Subordinated Debentures), operating lease obligations (Note, 6, Right-of-Use Lease Assets and Lease Liabilities), time deposits with stated maturity dates (Note 9, Time Deposits), and unfunded loan commitments and letters of credit.Our long-term debt at December 31, 2017, includes notes payable, FHLB long-term advancescredit (Note 19, Commitments and trust preferred securities, all of which we are contractually obligated to repay in future periods.Operating lease obligations entered into by the Company are generally associated with the operation of a few of our financial centers located throughout the states of Arkansas, Colorado, Kansas, Missouri, Oklahoma, Tennessee and Texas. Our financial obligation on these locations is considered immaterial due to the limited number of financial centers that operate under an agreement of this type. Historically, we have purchased all our automated teller machines (“ATMs”) and depreciated them over their estimated lives. Our operating lease agreement with our service provider to replace and maintain all outdated ATMs and the related operating software terminates in March 2020.Commitments to extend credit and letters of credit are legally binding, conditional agreements generally having fixed expiration or termination dates. These commitments generally require customers to maintain certain credit standards and are established based on management’s credit assessment of the customer. The commitments may expire without being drawn upon. Therefore, the total commitment does not necessarily represent future funding requirements.The funding requirements of the Company's most significant financial commitments at December 31, 2017 are shown in table 19.Table 19:Funding Requirements of Financial Commitments Payments due by period Less than 1-3 3-5 Greater than (In thousands) 1 Year Years Years 5 Years Total Long-term debt $ 23,093 $ 43,708 $ 3,479 $ 148,307 $ 218,587 ATM lease commitments 1,359 1,698 -- -- 3,057 Credit card loan commitments 564,592 -- -- -- 564,592 Other loan commitments 3,086,696 -- -- -- 3,086,696 Letters of credit 47,621 -- -- -- 47,621 48GAAP Reconciliation of Non-GAAP Financial Measures GAAP Reconciliation of Non-GAAP Financial Measurescoreadjusted earnings (net income excluding non-corecertain items {gain on sale of branches, early retirement program costs, loss from early retirement of trust preferred securities, accelerated vesting on retirement agreements,TruPS, gain on sale of merchant services,intellectual property, gain on insurance settlement, donation to Simmons First Foundation, merger related costs, FDIC special assessment, loss (gain) on sale of banking operations, loss on FDIC loss share termination, gains on FDIC-assisted transactions and the related merger costs, liquidation gains and losses from FDIC-assisted transactions and traditional acquisitions, merger related costs, change-in-control payments, charter consolidationsecurities, net branch right sizing costs, and the one-time costs of branch right sizing}Day 2 CECL Provision}) (non-GAAP) and adjusted diluted core earnings per share (non-GAAP) as well as a reconciliationcomputation of tangible book value per common share (non-GAAP), tangible common equity to tangible equityassets (non-GAAP), adjusted noninterest income (non-GAAP), adjusted noninterest expense (non-GAAP), adjusted salaries and employee benefits expense (non-GAAP) and the core net interest margincoverage ratio of uninsured, non-collateralized deposits (non-GAAP). Non-coreAdjusted items are included in financial results presented in accordance with generally accepted accounting principles (GAAP)(US GAAP).We believe the exclusion of these non-corecertain items in expressing earnings and certain other financial measures, including “core“adjusted earnings,” provides a meaningful basebasis for period-to-period and company-to-company comparisons, which management believes will assist investors and analysts in analyzing the coreadjusted financial measures of the Company and predicting future performance. These non-GAAP financial measures are also used by management to assess the performance of the Company’s business because management does not consider these non-corecertain items to be relevant to ongoing financial performance. Management and the Board of Directors utilize “core“adjusted earnings” (non-GAAP) for the following purposes:• Preparation of the Company’s operating budgets• Monthly financial performance reporting• Monthly “flash” reporting of consolidated results (management only)• Investor presentations of Company performanceWe believe the presentation of “core“adjusted earnings” on a diluted per share basis “diluted core earnings per share” (non-GAAP) and core net interest margin (non-GAAP), provides a meaningful basebasis for period-to-period and company-to-company comparisons, which management believes will assist investors and analysts in analyzing the coreadjusted financial measures of the Company and predicting future performance. ThisThese non-GAAP financial measures are also used by management to assess the performance of the Company’s business, because management does not consider these non-corecertain items to be relevant to ongoing financial performance on a per share basis. Management and the Board of Directors utilize “diluted core“adjusted diluted earnings per share” (non-GAAP) for the following purposes:• Calculation of annual performance-based incentives for certain executives• Calculation of long-term performance-based incentives for certain executives• Investor presentations of Company performance61We have $948.7 million$1.43 billion and $401.5 million$1.45 billion total goodwill and other intangible assets for the periods ended December 31, 20172023 and December 31, 2016,2022, respectively. Because of our acquisition strategy has resulted in a high level of intangible assets, management believes a useful calculation is return oncalculations include tangible book value per common share (non-GAAP) and tangible common equity to tangible assets (non-GAAP).We believe that presenting these non-GAAP financial measures will permit investors and analysts to assess the performance of the Company on the same basis as that is applied by management and the Board of Directors.Non-GAAP financial measures have inherent limitations, are not required to be uniformly applied and are not audited. To mitigate these limitations, we have procedures in place to identify and approve each item that qualifies as non-coreadjusted to ensure that the Company’s “core”“adjusted” results are properly reflected for period-to-period comparisons. Although these non-GAAP financial measures are frequently used by stakeholders in the evaluation of a company, they have limitations as analytical tools and should not be considered in isolation or as a substitute for analyses of results as reported under GAAP. In particular, a measure of earnings that excludes non-corecertain items does not represent the amount that effectively accrues directly to stockholders (i.e., non-corecertain items are included in earnings and stockholders’ equity).All per share data has been restated to reflect Additionally, similarly titled non-GAAP financial measures used by other companies may not be computed in the retroactive effectsame or similar fashion.During 2023, adjusted items primarily consisted of the two-for-one stock split which occurred during February 2018.During 2017, non-core items included $22.1 million of merger related andnet branch right sizing costs of $5.5 million, mainly due to branch closures across our footprint during the year, $6.2 million in early retirement program costs related to our Better Bank Initiative, and a one-time non-cash charge$20.6 million loss on sale of $11.5 million from the revaluation of the deferred tax assets and liabilities as a result of the tax reform recently signed into law, as previously discussed, a $5 million donationsecurities due to the Simmons Foundationstrategic sale of AFS securities during the year. Additionally, we recorded $10.5 million related to a FDIC special assessment levied to support the Deposit Insurance Fund following the failure of certain banks in 2023. The net after-tax impact of all adjusted items on net income was $32.7 million, or a $0.26 impact on diluted earnings per share.During 2022, adjusted items primarily consisted of $33.8 million of Day 2 provision expense required for loans and unfunded commitments related to the Spirit acquisition, merger-related costs of $22.5 million, primarily related to the Spirit acquisition, and net branch right sizing costs of $3.6 million, mainly due to branch closures across our footprint during the year. Additionally, we had a $3.7 million gain on insurance settlement of $4.1 million related to a weather event that caused severe damage to one of our branch locations. The net after-tax impact of all adjusted items was $42.4 million, or $0.34 per diluted earnings per share.During 2021, adjusted items primarily consisted of $22.7 million of Day 2 provision expense required for loans related to the Landmark and Triumph acquisitions, $15.9 million of merger-related costs, related to the Landmark and Triumph acquisitions and $15.5 million of gains related to the sale of our property and casualty insurance business lines.securities. Additionally, we had total gains on sale of branches of $5.3 million due to the Illinois Branch Sale. The net after-tax impact of these items was $26.1$12.5 million, or $0.37$0.11 per diluted earnings per share.During 2016, we recorded after-tax merger related costs of $2.9 million, primarily related to the Citizens acquisition, resulting in a nonrecurring charge of $0.10 to diluted earnings per share. During 2016, we incurred $2.0 million in after-tax branch right sizing costs in relation to the closure of ten underperforming branches, resulting in a nonrecurring charge of $0.07 to diluted earnings per share. Also during 2016, we recognized $361,000 in net after-tax gains from the early retirement of trust preferred securities contributing $0.01 to diluted earnings per share.49During 2015, we recorded after-tax merger related costs of $8.4 million, primarily related to the Community First, Liberty and Ozark Trust acquisitions, resulting in a nonrecurring charge of $0.30 to diluted earnings per share. During the second quarter of 2015 we incurred $1.9 million in after-tax branch right sizing costs in relation to the closure of twelve underperforming branches, resulting in a nonrecurring charge of $0.07 to diluted earnings per share. Also during 2015, we recognized $1.3 million in net after-tax gains from the sale of our Salina banking operations contributing $0.04 to diluted earnings per share.During the third quarter of 2015, we terminated the loss-share agreements with the FDIC and incurred $4.5 million after tax one-time charge expense which resulted in a decrease of $0.16 to diluted earnings per share. We incurred after-tax costs of $1.3 million62See Table 19 below for the accelerated vestingreconciliation of retirement agreements duringadjusted earnings, which exclude certain items for the year, resulting in a nonrecurring chargeperiods presented.Table 19:Reconciliation of $0.05 to diluted earnings per share.During 2014, we recorded after-tax merger related costsAdjusted Earnings (non-GAAP)(In thousands, except per share data) 2023 2022 2021 Net income available to common stockholders $ 175,057 $ 256,412 $ 271,109 Certain items: Gain on sale of branches — — (5,316) Loss from early retirement of TruPS — 365 — Gain on sale of intellectual property — (750) — Gain on insurance settlement — (4,074) — FDIC special assessment 10,521 — — Donation to Simmons First Foundation — 1,738 — Merger related costs 1,420 22,476 15,911 Early retirement program 6,198 — — Loss (gain) on sale of securities 20,609 278 (15,498) Branch right sizing, net 5,467 3,628 (906) Day 2 CECL Provision — 33,779 22,688 Tax effect (1)(11,556) (15,012) (4,413) Certain items, net of tax 32,659 42,428 12,466 Adjusted earnings (non-GAAP) $ 207,716 $ 298,840 $ 283,575 Diluted earnings per share $ 1.38 $ 2.06 $ 2.46 Certain items: Gain on sale of branches — — (0.05) Loss from early retirement of TruPS — — — Gain on sale of intellectual property — (0.01) — Gain on insurance settlement — (0.03) — FDIC special assessment 0.08 — — Donation to Simmons First Foundation — 0.01 — Merger related costs 0.01 0.18 0.14 Early retirement program 0.05 — — Loss (gain) on sale of securities 0.17 — (0.14) Branch right sizing, net 0.04 0.03 (0.01) Day 2 CECL Provision — 0.28 0.21 Tax effect (1)(0.09) (0.12) (0.04) Certain items, net of tax 0.26 0.34 0.11 Adjusted diluted earnings per share (non-GAAP) $ 1.64 $ 2.40 $ 2.57 _________________________(1) Effective tax rate of $4.5 million, primarily related to the Delta Trust acquisition, resulting in a nonrecurring charge of $0.27 to diluted earnings per share. During the first quarter of 2014, we closed eleven legacy Simmons Bank branches as part of the initial branch right sizing strategy of the Metropolitan acquisition. Our total after-tax cost of branch right sizing was $2.9 million in 2014, resulting in a nonrecurring charge of $0.17 to diluted earnings per share. Also during 2014 we recognized $4.7 million in net after-tax gains from the sale of former branch locations, primarily the legacy Simmons Bank and acquired Metropolitan closures, contributing $0.27 to diluted earnings per share.During the second quarter of 2014, we recorded an after-tax gain of $608,000 from the sale of our merchant services business, contributing $0.04 to diluted earnings per share. We incurred after-tax costs of $396,000 and $538,000, respectively, for charter consolidations and change-in-control payments during the year, resulting in a nonrecurring charge of $0.05 to diluted earnings per share.During the third and fourth quarter of 2013, we recorded after-tax merger related costs of $3.9 million related to the Metropolitan acquisition, resulting in a nonrecurring charge of $0.25 to diluted earnings per share. During the third and fourth quarters, we closed seven underperforming branches at a cost of $390,000 after-tax, resulting in a nonrecurring charge of $0.02 to diluted earnings per share. Also, as part of our 2012 acquisition strategy, we sold many of the investment securities from Excel and Truman, resulting in an after- tax loss of $117,000.
26.135%.5063See tableTable 20 below for the reconciliation of core earnings, which exclude non-core itemsadjusted noninterest income, adjusted noninterest expense and adjusted salaries and employee benefits expense for the periods presented.Table 20:Reconciliation of Core EarningsAdjusted Noninterest Income (non-GAAP)(In thousands, except share data) 2017 2016 2015 2014 2013 Twelve months ended Net Income $ 92,940 $ 96,790 $ 74,107 $ 35,688 $ 23,231 Non-core items Accelerated vesting on retirement agreements -- -- 2,209 -- -- Gain on sale of merchant services -- -- -- (1,000 ) -- Gain on sale of banking operations -- -- (2,110 ) -- -- Gain from early retirement of trust preferred securities -- (594 ) -- -- -- Gain on sale of insurance lines of business (3,708 ) -- -- -- -- Loss on FDIC loss-share termination -- -- 7,476 -- -- Donation to Simmons Foundation 5,000 -- -- -- -- Merger related costs 21,923 4,835 13,760 7,470 6,376 Change-in-control payments -- -- -- 885 -- Loss from sale of securities -- -- -- -- 193 Branch right sizing 169 3,359 3,144 (3,059 ) 641 Charter consolidation costs -- -- -- 652 -- Tax effect (39.225%) (1) (8,746 ) (2,981 ) (8,964 ) (1,929 ) (2,829 ) Net non-core items (before SAB 118 adjustment) 14,638 4,619 15,515 3,019 4,381 SAB 118 adjustment (2) 11,471 -- -- -- -- Diluted core earnings (non-GAAP) $ 119,049 $ 101,409 $ 89,622 $ 38,707 $ 27,612 Diluted earnings per share $ 1.33 $ 1.56 $ 1.31 $ 1.05 $ 0.71 Non-core items Accelerated vesting on retirement agreements -- -- 0.04 -- -- Gain on sale of merchant services -- -- -- (0.03 ) -- Gain on sale of banking operations -- -- (0.04 ) -- -- Gain from early retirement of trust preferred securities -- (0.01 ) -- -- -- Gain on sale of insurance lines of business (0.04 ) -- -- -- -- Loss on FDIC loss-share termination -- -- 0.14 -- -- Donation to Simmons Foundation 0.07 -- -- -- -- Merger related costs 0.31 0.08 0.25 0.22 0.19 Change-in-control payments -- -- -- 0.03 -- Loss from sale of securities -- -- -- -- 0.01 Branch right sizing -- 0.06 0.06 (0.08 ) 0.02 Charter consolidation costs -- -- -- 0.02 -- Tax effect (39.225%) (1) (0.13 ) (0.05 ) (0.17 ) (0.07 ) (0.09 ) Net non-core items (before SAB 118 adjustment) 0.21 0.08 0.28 0.09 0.13 SAB 118 adjustment (2) 0.16 -- -- -- -- Diluted core earnings per share (non-GAAP) $ 1.70 $ 1.64 $ 1.59 $ 1.14 $ 0.84 (1)Effective tax rate of 39.225%, adjusted for non-deductible merger-related costs and deferred tax items on the sale of the insurance lines of business.(2)Tax adjustment to revalue deferred tax assets and liabilities to account for the future impact of lower corporate tax rates resulting from the 2017 Act, signed into law on December 22, 2017.
, Adjusted Noninterest Expense (non-GAAP) and Adjusted Salaries and Employee Benefits Expense (non-GAAP)51(In thousands) 2023 2022 2021 Noninterest income $ 155,566 $ 170,066 $ 191,815 Certain items: Gain on sale of branches — — (5,316) Gain on insurance settlement — (4,074) — Loss from early retirement of TruPS — 365 — Gain on sale of intellectual property — (750) — Loss (gain) on sale of securities 20,609 278 (15,498) Branch right sizing — 153 (369) Total certain items 20,609 (4,028) (21,183) Adjusted noninterest income (non-GAAP) $ 176,175 $ 166,038 $ 170,632 Noninterest expense $ 563,061 $ 566,748 $ 483,589 Certain items: Merger related costs (1,420) (22,476) (15,911) Donation to Simmons First Foundation — (1,738) — Early retirement program (6,198) — — FDIC special assessment (10,521) — — Branch right sizing (5,467) (3,475) 537 Total certain items (23,606) (27,689) (15,374) Adjusted noninterest expense (non-GAAP) $ 539,455 $ 539,059 $ 468,215 Salaries and employee benefits expense $ 286,117 $ 286,982 $ 246,335 Early retirement program costs (6,198) — — Other 2 — (66) Adjusted salaries and employee benefits expense (non-GAAP) $ 279,921 $ 286,982 $ 246,269 See tableTable 21 below for the reconciliation of tangible book value per common share.Table 21:Reconciliation of Tangible Book Value per Common Share (non-GAAP)(In thousands, except share data) 2017 2016 2015 2014 2013 Total common stockholders’ equity $ 2,084,564 $ 1,151,111 $ 1,046,003 $ 494,319 $ 403,832 Intangible assets: Goodwill (842,651 ) (348,505 ) (327,686 ) (108,095 ) (78,529 ) Other intangible assets (106,071 ) (52,959 ) (53,237 ) (22,526 ) (14,972 ) Total intangibles (948,722 ) (401,464 ) (380,923 ) (130,621 ) (93,501 ) Tangible common stockholders’ equity $ 1,135,842 $ 749,647 $ 665,080 $ 363,698 $ 310,331 Shares of common stock outstanding 92,029,118 62,555,446 60,556,864 36,104,976 32,452,512 Book value per common share $ 22.65 $ 18.40 $ 17.27 $ 13.69 $ 12.44 Tangible book value per common share (non-GAAP) $ 12.34 $ 11.98 $ 10.98 $ 10.07 $ 9.56 (In thousands, except per share data) 2023 2022 2021 Total common stockholders’ equity $ 3,426,488 $ 3,269,362 $ 3,248,841 Intangible assets: Goodwill (1,320,799) (1,319,598) (1,146,007) Other intangible assets (112,645) (128,951) (106,235) Total intangibles (1,433,444) (1,448,549) (1,252,242) Tangible common stockholders’ equity $ 1,993,044 $ 1,820,813 $ 1,996,599 Shares of common stock outstanding 125,184,119 127,046,654 112,715,444 Book value per common share $ 27.37 $ 25.73 $ 28.82 Tangible book value per common share (non-GAAP) $ 15.92 $ 14.33 $ 17.71 64See tableTable 22 below for the calculation of tangible common equity and the reconciliation of tangible common equity to tangible assets.Table 22:Reconciliation of Tangible Common Equity and the Ratio of Tangible Common Equity to Tangible Assets (non-GAAP)(In thousands, except share data) 2017 2016 2015 2014 2013 Total common stockholders’ equity $ 2,084,564 $ 1,151,111 $ 1,046,003 $ 494,319 $ 403,832 Intangible assets: Goodwill (842,651 ) (348,505 ) (327,686 ) (108,095 ) (78,529 ) Other intangible assets (106,071 ) (52,959 ) (53,237 ) (22,526 ) (14,972 ) Total intangibles (948,722 ) (401,464 ) (380,923 ) (130,621 ) (93,501 ) Tangible common stockholders’ equity $ 1,135,842 $ 749,647 $ 665,080 $ 363,698 $ 310,331 Total assets $ 15,055,806 $ 8,400,056 $ 7,559,658 $ 4,643,354 $ 4,383,100 Intangible assets: Goodwill (842,651 ) (348,505 ) (327,686 ) (108,095 ) (78,529 ) Other intangible assets (106,071 ) (52,959 ) (53,237 ) (22,526 ) (14,972 ) Total intangibles (948,722 ) (401,464 ) (380,923 ) (130,621 ) (93,501 ) Tangible assets $ 14,107,084 $ 7,998,592 $ 7,178,735 $ 4,512,733 $ 4,289,599 Ratio of common equity to assets 13.85 % 13.70 % 13.84 % 10.65 % 9.21 % Ratio of tangible common equity to tangible assets (non-GAAP) 8.05 % 9.37 % 9.26 % 8.06 % 7.24 % 52(Dollars in thousands) 2023 2022 2021 Total common stockholders’ equity $ 3,426,488 $ 3,269,362 $ 3,248,841 Intangible assets: Goodwill (1,320,799) (1,319,598) (1,146,007) Other intangible assets (112,645) (128,951) (106,235) Total intangibles (1,433,444) (1,448,549) (1,252,242) Tangible common stockholders’ equity $ 1,993,044 $ 1,820,813 $ 1,996,599 Total assets $ 27,345,674 $ 27,461,061 $ 24,724,759 Intangible assets: Goodwill (1,320,799) (1,319,598) (1,146,007) Other intangible assets (112,645) (128,951) (106,235) Total intangibles (1,433,444) (1,448,549) (1,252,242) Tangible assets $ 25,912,230 $ 26,012,512 $ 23,472,517 Ratio of common equity to assets 12.53 % 11.91 % 13.14 % Ratio of tangible common equity to tangible assets (non-GAAP) 7.69 % 7.00 % 8.51 % See tableTable 23 below for the calculation of return on tangible common equity.Table 23:Calculation of Return on Tangible Common EquityUninsured, Non-Collateralized Deposit Coverage Ratio (non-GAAP)(In thousands, except share data) 2017 2016 2015 2014 2013 Twelve months ended Net income available to common stockholders $ 92,940 $ 96,790 $ 74,107 $ 35,688 $ 23,231 Amortization of intangibles, net of taxes 4,659 3,611 2,972 1,203 365 Total income available to common stockholders $ 97,599 $ 100,401 $ 77,079 $ 36,891 $ 23,596 Average common stockholders’ equity $ 1,390,815 $ 1,105,775 $ 938,521 $ 440,168 $ 435,918 Average intangible assets: Goodwill (455,453 ) (332,974 ) (281,133 ) (88,965 ) (60,655 ) Other intangible assets (68,896 ) (51,710 ) (42,104 ) (15,533 ) (4,054 ) Total average intangibles (524,349 ) (384,684 ) (323,237 ) (104,498 ) (64,709 ) Average tangible common stockholders’ equity $ 866,466 $ 721,091 $ 615,284 $ 335,670 $ 371,209 Return on average common equity 6.68 % 8.75 % 7.90 % 8.11 % 5.33 % Return on average tangible common equity (non-GAAP) 11.26 % 13.92 % 12.53 % 10.99 % 6.36 % See table 24 below for the calculation of core net interest margin for the periods presented.Table 24: Reconciliation of Core Net Interest Margin (non-GAAP)(In thousands, except share data) 2017 2016 2015 2014 2013 Twelve months ended Net interest income $ 354,930 $ 279,206 $ 278,595 $ 171,064 $ 130,850 FTE adjustment 7,723 7,722 8,517 6,840 4,951 Fully tax equivalent net interest income 362,653 286,928 287,112 177,904 135,801 Total accretable yield (27,793 ) (24,257 ) (46,131 ) (37,539 ) (39,604 ) Core net interest income $ 334,860 $ 262,671 $ 240,981 $ 140,365 $ 96,197 Average earning assets $ 8,908,418 $ 6,855,322 $ 6,305,966 $ 3,975,903 $ 3,224,094 Net interest margin 4.07 % 4.19 % 4.55 % 4.47 % 4.21 % Core net interest margin (non-GAAP) 3.76 % 3.83 % 3.82 % 3.53 % 2.98 % 53(In thousands) 2023 2022 Uninsured deposits at Simmons Bank $ 8,328,444 $ 8,913,990 Less: Collateralized deposits (excluding portion that is FDIC insured) 2,846,716 2,759,248 Less: Intercompany eliminations 728,480 529,042 Total uninsured, non-collateralized deposits $ 4,753,248 $ 5,625,700 FHLB borrowing availability $ 5,401,000 $ 5,442,000 Unpledged securities 3,817,000 3,180,000 Fed funds lines, Fed discount window and Bank Term Funding Program 1,998,000 1,982,000 Additional liquidity sources $ 11,216,000 $ 10,604,000 Uninsured, non-collateralized deposit coverage ratio 2.4x 1.9x See table 25 below for the calculation of the efficiency ratio for the periods presented.Table 25:Calculation of Efficiency Ratio(In thousands, except share data) 2017 2016 2015 2014 2013 Twelve months ended Non-interest expense $ 312,379 $ 255,085 $ 256,970 $ 175,721 $ 134,812 Non-core non-interest expense adjustment (27,357 ) (8,435 ) (18,747 ) (13,747 ) (7,017 ) Other real estate and foreclosure expense adjustment (3,042 ) (4,389 ) (4,861 ) (4,507 ) (1,337 ) Amortization of intangibles adjustment (7,666 ) (5,942 ) (4,889 ) (1,979 ) (601 ) Efficiency ratio numerator $ 274,314 $ 236,319 $ 228,473 $ 155,488 $ 125,857 Net-interest income $ 354,930 $ 279,206 $ 278,595 $ 171,064 $ 130,850 Non-interest income 138,765 139,382 94,661 62,192 40,616 Non-core non-interest income adjustment (3,972 ) (835 ) 5,731 (8,780 ) 193 Fully tax-equivalent adjustment 7,723 7,722 8,517 6,840 4,951 (Gain) loss on sale of securities (1,059 ) (5,848 ) (307 ) (8 ) 151 Efficiency ratio denominator $ 496,387 $ 419,627 $ 387,197 $ 231,308 $ 176,761 Efficiency ratio 55.27 % 56.32 % 59.01 % 67.22 % 71.20 % Quarterly Results65Selected unaudited quarterly financial information for the last eight quarters is shown in table 26.Table 26:Quarterly Results Quarter (In thousands, except per share data) First Second Third Fourth Total 2017 Interest income $ 78,427 $ 83,898 $ 87,484 $ 145,195 $ 395,004 Interest expense 6,047 7,086 8,665 18,276 40,074 Net interest income 72,380 76,812 78,819 126,919 354,930 Provision for loan losses 4,307 7,023 5,462 9,601 26,393 Gain (loss) on sale of securities 63 2,236 3 (1,243 ) 1,059 Non-interest income, net of gain (loss) on sale of securities 29,997 33,508 36,329 37,872 137,706 Non-interest expense 66,322 71,408 66,159 108,490 312,379 Net income available to common shareholders 22,120 23,065 28,852 18,903 92,940 Basic earnings per share (1) (2) 0.35 0.36 0.45 0.22 1.34 Diluted earnings per share (1) (2) 0.35 0.36 0.44 0.22 1.33 2016 Interest income $ 75,622 $ 71,900 $ 73,418 $ 80,065 $ 301,005 Interest expense 5,390 5,317 5,355 5,737 21,799 Net interest income 70,232 66,583 68,063 74,328 279,206 Provision for loan losses 2,823 4,616 8,294 4,332 20,065 Gain on sale of securities 329 3,759 315 1,445 5,848 Non-interest income, net of gain on sale of securities 29,174 33,129 36,561 34,670 133,534 Non-interest expense 61,789 64,137 62,434 66,725 255,085 Net income available to common shareholders 23,481 22,909 23,429 26,971 96,790 Basic earnings per share (1) (2) 0.39 0.38 0.39 0.43 1.58 Diluted earnings per share (1) (2) 0.39 0.38 0.38 0.43 1.56 (1)EPS are computed independently for each quarter and therefore the sum of each quarterly EPS may not equal the year-to-date EPS. As a result of the large stock issuances as part of the Company’s acquisitions, the computed independent quarterly average common shares outstanding and the computed year-to-date average common shares may differ significantly. The difference is based on the direct result of the varying denominator for each period presented.(2)The quarterly basic and diluted earnings per share have been retrospectively adjusted to reflect the two-for-one stock split of our common stock effected on February 8, 2018.54ITEM 7A.QUANTITATIVE AND QUALITATIVE DISCLOSURES ABOUT MARKET RISKITEM 7A.QUANTITATIVE AND QUALITATIVE DISCLOSURES ABOUT MARKET RISKLiquidity and Market Risk Management Liquidity and Market Risk Management Parent CompanyThe Company has leveraged its investment in its subsidiary banks,bank and depends upon the dividends paid to it, as the sole shareholder of the subsidiary banks,bank, as a principal source of funds for dividends to shareholders, stock repurchases and debt service requirements. At December 31, 2017,2023, undivided profits of Simmons Bank were approximately $292.8$622.9 million, of which approximately $7.5$54.4 million was available for the payment of dividends to the Company without regulatory approval. In addition to dividends, other sources of liquidity for the Company are the sale of equity securities and the borrowing of funds.Subsidiary BanksGenerally speaking, the Company'sCompany’s subsidiary banks relybank relies upon net inflows of cash from financing activities, supplemented by net inflows of cash from operating activities, to provide cash used in investing activities. Typical of most banking companies, significant financing activities include: deposit gathering; use of short-term borrowing facilities, such as federal funds purchased and repurchase agreements; and the issuance of long-term debt. The subsidiary banks’bank’s primary investing activities include loan originations and purchases of investment securities, offset by loan payoffs and investment cash flows and maturities.Liquidity represents an institution'sinstitution’s ability to provide funds to satisfy demands from depositors and borrowers by either converting assets into cash or accessing new or existing sources of incremental funds. A major responsibility of management is to maximize net interest income within prudent liquidity constraints. Internal corporate guidelines have been established to constantly measure liquid assets as well as relevant ratios concerning earning asset levels and purchased funds. The management and boardBoard of directorsDirectors of the subsidiary banksbank monitor these same indicators and makemakes adjustments as needed. At December 31, 2017, the subsidiary banks and total corporate liquidity remain strong.Liquidity ManagementThe objective of our liquidity management is to access adequate sources of funding to ensure that cash flow requirements of depositors and borrowers are met in an orderly and timely manner. Sources of liquidity are managed so that reliance on any one funding source is kept to a minimum. Our liquidity sources are prioritized for both availability and time to activation.Our liquidity is a primary consideration in determining funding needs and is an integral part of asset/liability management. Pricing of the liability side is a major component of interest margin and spread management. Adequate liquidity is a necessity in addressing this critical task. There are seven primary and secondary sources of liquidity available to the Company. The particular liquidity need and timeframe determine the use of these sources.The first source of liquidity available to the Company is Federalfederal funds. Federal funds are available on a daily basis and are used to meet the normal fluctuations of a dynamic balance sheet. The Company andAs of December 31, 2023, the Bank have approximately $395had approximately $510.0 million in Federalfederal funds lines of credit from upstream correspondent banks that can be accessed, when needed. In order to ensure availability of these upstream funds we test these borrowing lines at least annually. Historical monitoring of these funds has made it possible for us to project seasonal fluctuations and structure our funding requirements on a month-to-month basis.Second, the bank subsidiaries haveSimmons Bank has lines of credit available with the Federal Home Loan Bank. While we use portions of those lines to match off longer-term mortgage loans, we also use those lines to meet liquidity needs. Approximately $2.3$5.4 billion of these lines of credit are currently available, if needed, for liquidity.A third source of liquidity is that we have the ability to access large wholesale deposits from both the public and private sector to fund short-term liquidity needs.A fourth source of liquidity is the retail deposits available through our network of financial centers throughout Arkansas, Colorado, Kansas, Missouri, Oklahoma, Tennessee and Texas. Although this method can be a somewhat more expensive alternative to supplying liquidity, this source can be used to meet intermediate term liquidity needs.Fifth, we use a laddered investment portfolio that ensures there is a steady source of intermediate term liquidity. These funds can be used to meet seasonal loan patterns and other intermediate term balance sheet fluctuations. Approximately 81.2%45.8% of the investment portfolio is classified as available-for-sale.available-for-sale, and we may generate additional liquidity through opportunistic sales of investment securities. We also use securities held in the securities portfolio to pledge when obtaining public funds.5566Sixth, we have a network of downstream correspondent banks from which we can access debt to meet liquidity needs, as was demonstrated by the $52.3 million of unsecured debt issued in the fourth quarter of 2015 and the $75 million line of credit that was executed during the fourth quarter of 2017.Finally, we have the ability to access funds through the Federal Reserve Bank Discount Window.We believe the various sources available are ample liquidity to satisfy our currentfor short-term, intermediate-term and long-term operations.Market Risk ManagementMarket risk arises from changes in interest rates. We have risk management policies to monitor and limit exposure to market risk. In asset and liability management activities, policies designed to minimize structural interest rate risk are in place. The measurement of market risk associated with financial instruments is meaningful only when all related and offsetting on- and off-balance-sheet transactions are aggregated, and the resulting net positions are identified.Interest Rate SensitivityInterest rate risk represents the potential impact of interest rate changes on net income and capital resulting from mismatches in repricing opportunities of assets and liabilities over a period of time. A number of tools are used to monitor and manage interest rate risk, including simulation models and interest sensitivity gap analysis. Management uses simulation models to estimate the effects of changing interest rates and various balance sheet strategies on the level of the Company’s net income and capital. As a means of limiting interest rate risk to an acceptable level, management may alter the mix of floating and fixed-rate assets and liabilities, change pricing schedules, and manage investment maturities during future security purchases.The simulation model incorporates management’s assumptions regarding the level of interest rates or balance changes for indeterminate maturity deposits for a given level of market rate changes. These assumptions have been developed through anticipated pricing behavior. Key assumptions in the simulation models include the relative timing of prepayments, cash flows and maturities. These assumptions are inherently uncertain and, as a result, the model cannot precisely estimate net interest income or precisely predict the impact of a change in interest rates on net income or capital. Actual results will differ from simulated results due to the timing, magnitude and frequency of interest rate changes and changes in market conditions and management strategies, among other factors.As of December 31, 2017,2023, the model simulations projected that 100 and 200 basis point increases in interest rates would result in a positive variancenegative variances in net interest income of 2.78%2.72% and 5.00%5.57%, respectively, relative to the base case over the next 12 months, whilemonths. Interest rate decreases in interest rates of 100 and 200 basis points would result in a negative variancepositive variances in net interest income of -3.54%2.18% and 5.36%, respectively, relative to the base case over the next 12 months. The likelihoodThese results reflect a liability-sensitive balance sheet and are consistent with the Company’s shift toward short-term funding combined with relatively little change in the mix of a decrease in interest rates in excess of 100 basis points as of December 31, 2017 is considered remote given current interest rate levels and recent rate increases by the Federal Reserve.interest-earning assets. These are good faith estimates and assume that the composition of our interest sensitive assets and liabilities existing at each year-end will remain constant over the relevant twelve month measurement period and that changes in market interest rates are instantaneous and sustained across the yield curve regardless of duration of pricing characteristics of specific assets or liabilities. Also, this analysis does not contemplate any actions that we might undertake in response to changes in market interest rates. We believe these estimates are not necessarily indicative of what actually could occur in the event of immediate interest rate increases or decreases of this magnitude. As interest-bearing assets and liabilities reprice in different time frames and proportions to market interest rate movements, various assumptions must be made based on historical relationships of these variables in reaching any conclusion. Since these correlations are based on competitive and market conditions, we anticipate that our future results will likely be different from the foregoing estimates, and such differences could be material.The table below presents our sensitivity to net interest income at December 31, 2017. Table 27:24:Net Interest Income SensitivityInterest Rate Scenario % Change from Base Up 200 basis points (5.57) 5.00% Up 100 basis points (2.72) 2.78% Down 100 basis points 2.18 % Down 200 basis points -3.545.36 % 5667ITEM 8. CONSOLIDATED FINANCIAL STATEMENTS AND SUPPLEMENTARY DATAINDEXITEM 8.CONSOLIDATED FINANCIAL STATEMENTS AND SUPPLEMENTARY DATAINDEXReport of Independent Registered Public Accounting Firm (PCAOB ID 686) Note:Supplementary Data may be found in Item 7 “Management’s Discussion and Analysis of Financial Condition and Results of Operations – Quarterly Results” on page 54 hereof.5768Management’s Report on Internal Control Over Financial ReportingThe management of Simmons First National Corporation (the “Company”) is responsible for establishing and maintaining adequate internal control over financial reporting as defined in Rule 13a-15(f) under the Securities Exchange Act of 1934.1934, as amended. The Company’s internal control over financial reporting is a process designed to provide reasonable assurance regarding the reliability of financial reporting and the preparation and fair presentation of the Company’s financial statements for external purposes in accordance with accounting principles generally accepted in the United States of America.Because of inherent limitations, internal controls over financial reporting may not prevent or detect misstatements. Accordingly, even those systems determined to be effective can provide only reasonable assurance with respect to financial statement preparation and presentation.Management assessed the effectiveness of the Company’s internal control over financial reporting as of December 31, 2017.2023. In making this assessment, management used the criteria set forth in Internal Control – Integrated Framework (2013 edition) issued by the Committee of Sponsoring Organizations of the Treadway Commission (COSO). As permitted by Securities and Exchange Commission guidance, management excluded from its assessment the operations of Southwest Bancorp, Inc. and First Texas BHC, Inc., acquisitions made during 2017, which are described in Note 2 of the Consolidated Financial Statements. The total assets of the entities acquired in the Southwest Bancorp, Inc. and First Texas BHC, Inc. acquisitions represented approximately 18% and 19%, respectively, of the Company’s total consolidated assets as of December 31, 2017. Based on this assessment, management has determined that the Company’s internal control over financial reporting as of December 31, 20172023 is effective based on the specified criteria.BKD,FORVIS, LLP, the independent registered public accounting firm that audited the consolidated financial statements of the Company included in this Annual Report on Form 10-K, has issued an attestationaudit report on the effectiveness of the Company’s internal control over financial reporting as of December 31, 2017.2023. The report, which expresses an unqualified opinion on the effectiveness of the Company’s internal control over financial reporting as of December 31, 2017,2023, immediately follows.5869REPORT OF INDEPENDENT REGISTERED PUBLIC ACCOUNTING FIRMAudit Committee,To the Stockholders, Board of Directors and StockholdersSimmons First National CorporationPine Bluff, ArkansasOpinion on the Internal Control over Financial ReportingWe have audited Simmons First National Corporation’s (the Company) internal control over financial reporting as of December 31, 2017,2023, based on criteria established in Internal Control – Integrated Framework (2013 edition)Framework: (2013) issued by the Committee of Sponsoring Organizations of the Treadway Commission (COSO).In our opinion, the Company maintained, in all material respects, effective internal control over financial reporting as of December 31, 2017,2023, based on criteria established in Internal Control – Integrated Framework (2013 edition)Framework: (2013) issued by COSO.As permitted, the Company excluded the operations of Bank SNB of Oklahoma City, Oklahoma and Southwest Bank of Fort Worth, Texas, financial institutions acquired on October 19, 2017, whose financial statements together constitute 37% and 12% of total assets and total revenues, respectively, from the scope of management’s report on internal control over financial reporting. As such, these entities have also been excluded from the scope of our audit of internal control over financial reporting.We also have audited, in accordance with the standards of the Public Company Accounting Oversight Board (United States) (PCAOB)(“PCAOB”), the consolidated financial statements of the Company as of December 31, 2023 and 2022, and for each of the three years in the period ended December 31, 2023, and our report dated February 28, 2018,27, 2024, expressed an unqualified opinion thereon.Basis for OpinionThe Company’s management is responsible for maintaining effective internal control over financial reporting and for its assessment of the effectiveness of internal control over financial reporting, included in the accompanying management’s report.Management’s Report on Internal Control Over Financial Reporting. Our responsibility is to express an opinion on the Company’s internal control over financial reporting based on our audit.We are a public accounting firm registered with the PCAOB and are required to be independent with respect to the Company in accordance with the U.S. federal securities laws and the applicable rules and regulations of the Securities and Exchange Commission and the PCAOB.We conducted our audit in accordance with the standards of the PCAOB. Those standards require that we plan and perform the audit to obtain reasonable assurance about whether effective internal control over financial reporting was maintained in all material respects.Our audit included obtaining an understanding of internal control over financial reporting, assessing the risk that a material weakness exists and testing and evaluating the design and operating effectiveness of internal control based on the assessed risk. Our audit also included performing such other procedures as we considered necessary in the circumstances. We believe that our audit provides a reasonable basis for our opinion.Definitions and Limitations of Internal Control over Financial ReportingA company’s internal control over financial reporting is a process designed to provide reasonable assurance regarding the reliability of financial reporting and the preparation of reliable financial statements for external purposes in accordance with generally accepted accounting principles. A company’s internal control over financial reporting includes those policies and procedures that (1) pertain to the maintenance of records that, in reasonable detail, accurately and fairly reflect the transactions and dispositions of the assets of the company; (2) provide reasonable assurance that transactions are recorded as necessary to permit preparation of financial statements in accordance with generally accepted accounting principles, and that receipts and expenditures of the company are being made only in accordance with authorizations of management and directors of the company; and (3) provide reasonable assurance regarding prevention or timely detection of unauthorized acquisition, use or disposition of the company’s assets that could have a material effect on the financial statements.Because of its inherent limitations, internal control over financial reporting may not prevent or detect misstatements. Also, projections of any evaluation of effectiveness to future periods are subject to the risk that controls may become inadequate because of changes in conditions or that the degree of compliance with the policies or procedures may deteriorate.FORVIS, LLP BKD, LLP/s/ BKD,FORVIS, LLPLittle Rock, ArkansasFebruary 28, 2018
27, 202459REPORT OF INDEPENDENT REGISTERED PUBLIC ACCOUNTING FIRMAudit Committee,To the Stockholders, Board of Directors and StockholdersSimmons First National CorporationPine Bluff, ArkansasOpinion on the Consolidated Financial StatementsWe have audited the accompanying consolidated balance sheets of Simmons First National Corporation (the Company)“Company”) as of December 31, 20172023 and 2016,2022, the related consolidated statements of income, comprehensive income, stockholders’ equity and cash flows and stockholders’ equity for each of the years in the three-year period ended December 31, 2017,2023, and the related notes (collectively referred to as the financial statements)“financial statements”). In our opinion, the consolidated financial statements referred to above present fairly, in all material respects, the financial position of the Company as of December 31, 20172023 and 2016,2022, and the results of its operations and its cash flows for each of the years in the three-year period ended December 31, 2017,2023, in conformity with accounting principles generally accepted in the United States of America.We also have audited, in accordance with the standards of the Public Company Accounting Oversight Board (United States) (PCAOB)(“PCAOB”), the Company’s internal control over financial reporting as of December 31, 2017,2023, based on criteria established inInternal Control – Integrated Framework (2013 edition)(2013) issued by the Committee of Sponsoring Organizations of the Treadway Commission (COSO) and our report dated December 31, 2017,February 27, 2024, expressed an unqualified opinion on the effectiveness of the Company’s internal control over financial reporting.Basis for OpinionThese financial statements are the responsibility of the Company’sCompany's management. Our responsibility is to express an opinion on the Company’sCompany's financial statements based on our audits.We are a public accounting firm registered with the PCAOB and are required to be independent with respect to the Company in accordance with the U.S. federal securities laws and the applicable rules and regulations of the Securities and Exchange Commission and the PCAOB.We conducted our audits in accordance with the standards of the PCAOB. Those standards require that we plan and perform the audits to obtain reasonable assurance about whether the financial statements are free of material misstatement, whether due to error or fraud. Our audits included performing procedures to assess the risks of material misstatement of the financial statements, whether due to error or fraud, and performing procedures that respond to those risks. Such procedures include examining, on a test basis, evidence regarding the amounts and disclosures in the financial statements. Our audits also included evaluating the accounting principles used and significant estimates made by management, as well as evaluating the overall presentation of the financial statements. We believe that our audits provide a reasonable basis for our opinion.Critical Audit MattersThe critical audit matters communicated below are matters arising from the current-period audit of the consolidated financial statements that were communicated or required to be communicated to the audit committee and that: (1) relate to accounts or disclosures that are material to the financial statements and (2) involved especially challenging, subjective or complex judgments. The communication of critical audit matters does not alter in any way our opinion on the consolidated financial statements, taken as a whole, and we are not, by communicating the critical audit matters below, providing separate opinions on the critical audit matters or on the accounts or disclosures to which they relate.Allowance for Credit LossesThe Company’s loan portfolio totaled $16.85 billion as of December 31, 2023 and the allowance for credit losses on loans was $225.2 million. The Company’s unfunded loan commitments totaled $4.2 billion, with an allowance for credit losses of $25.6 million. The Company’s available-for-sale and held-to-maturity securities portfolios totaled $6.88 billion as of December 31, 2023, and the allowance for credit losses on securities was $3.2 million. Together these amounts represent the allowance for credit losses (“ACL”). As more fully described in Notes 1, 3 and 5 to the Company’s consolidated financial statements:•For loans receivable, the ACL is a contra-asset valuation account, calculated in accordance with Topic 326 that is deducted from the amortized cost basis of loans to present the net amount expected to be collected.•For unfunded loan commitments, the ACL is a liability account calculated in accordance with Topic 326, reported as a component of accrued interest and other liabilities.•For securities, the ACL is a contra-valuation account that is deducted from the recorded basis of the securities.71The amount of each allowance account represents management’s best estimate of current expected credit losses on those financial instruments considering all available information from internal and external sources, relevant to assessing exposure to credit loss over the contractual term of the instrument. Loans with similar risk characteristics are aggregated into homogenous segments for assessment. Expected credit losses are estimated by either lifetime loss rates or expected cash flows based on three key parameters: probability of default (PD), exposure-at-default (EAD) or loss given default (LGD). The estimates include economic forecasts over the reasonable and supportable forecast period based on projected performance of economic variables that have a statistical relationship.Management qualitatively adjusts its model results for risk factors that were not considered within the modeling processes but were still relevant in assessing the expected credit losses within the loan pools. In some cases, management determined that an individual loan exhibited unique characteristics which differentiated the loan from other loans with the identified loan pools. In such cases the loans were evaluated for expected credit losses on an individual basis and excluded from the collective evaluation.Auditing management’s estimate of the ACL involved a high degree of subjectivity due to the nature of the qualitative factor adjustments included in the ACL and complexities due to the implementation of the PD, EAD or LGD models. Management’s identification and measurement of the qualitative factor adjustments is highly judgmental.The primary procedures we performed as of December 31, 2023 to address this critical audit matter included:•Obtained an understanding of the Company’s process for establishing the ACL•Evaluated and tested the design and operating effectiveness of controls over the reliability and accuracy of the data used to calculate and estimate the various components of the ACL including:◦Loan data completeness and accuracy◦Grouping of loans by segment◦Model inputs utilized including PD, LGD, remaining life and prepayment speed◦Approval of model assumptions selected◦Establishment of qualitative factors◦Loan risk ratings•Tested the mathematical accuracy of the calculation of the ACL•Performed reviews of individual credit files to evaluate the reasonableness of loan credit risk ratings•Tested internally prepared loan reviews to evaluate the reasonableness of the loan credit risk ratings•Tested the completeness and accuracy of inputs utilized in the calculation of the ACL•Evaluated the qualitative adjustments to the ACL including assessing the basis for adjustments and the reasonableness of the significant assumptions•Tested the reasonableness of specific reserves on individually reviewed loans•Evaluated credit quality trends in delinquencies, non-accruals, charge-offs and loan risk ratings•Evaluated the overall reasonableness of the ACL and compared to trends identified within peer groups•Tested estimated utilization rate of unfunded loan commitments•Reviewed documentation prepared to assess the methodology utilized by a third party performing the ACL calculation for securities for reasonableness•Evaluated the accuracy and completeness of Accounting Standards Update 2016-13, Financial Instruments - Credit Losses (Topic 326) disclosures in the consolidated financial statements.GoodwillAs reflected in the Company’s consolidated financial statements at December 31, 2023, the Company’s goodwill was $1.32 billion. As disclosed in Note 8 to the consolidated financial statements, goodwill is tested for impairment at least annually or more frequently if indicators of impairment require the performance of an interim impairment assessment.Auditing management’s impairment tests of goodwill was complex and highly judgmental due to the calculation relying on several assumptions that have a level of subjectivity and judgment. These assumptions are dependent on market and economic conditions. Key inputs to estimate terminal fair value of the Company include projected forecasts, noninterest expense savings and a pricing multiple based on a group of peer banks with similar characteristics. These inputs are discounted by the cost of equity, which includes assumptions involving the Company’s beta; equity risk, size and company premiums; and the 20-year treasury rate. Assumptions used in calculating the cost of equity are obtained from market and third-party data.We obtained an understanding, evaluated the design and operating effectiveness of controls over the Company’s goodwill assessment process. For example, we tested the controls over the Company’s review of the significant assumptions utilized in estimating the fair value of the reporting unit.72To test the fair values of the reporting unit, our audit procedures included, among others, assessing methodologies, testing the significant assumptions described above, and testing the completeness and accuracy of the underlying data used by the Company. Our testing procedures over the significant assumptions included, among others, comparing forecasted revenue to current industry and economic trends. We assessed the historical accuracy of management’s estimates by comparing past projections to actual performance and assessed the sensitivity analyses of significant assumptions to evaluate the changes in the fair value of the reporting unit resulting from changes in the assumptions. We also involved an internal valuation professional to assist in evaluating the Company’s models, valuation methodology, and significant assumptions used in the fair value estimates.FORVIS, LLP BKD, LLP/s/ BKD,FORVIS, LLPWe have served as the Company’s auditor since 1972.Little Rock, ArkansasFebruary 28, 2018
27, 20246073Consolidated Balance SheetsDecember 31, 20172023 and 20162022(In thousands, except share data) 2017 2016 (In thousands, except share data) 2023 2022 ASSETS Cash and non-interest bearing balances due from banks $ 205,025 $ 117,007 ASSETS ASSETS Cash and noninterest bearing balances due from banks Interest bearing balances due from banks and federal funds sold 393,017 168,652 Cash and cash equivalents 598,042 285,659 Interest bearing balances due from banks – time 3,314 4,563 Investment securities: Held-to-maturity 368,058 462,096 Available-for-sale 1,589,517 1,157,354 Held-to-maturity, net of allowance for credit losses of $3,214 and $1,388 at December 31, 2023 and 2022, respectively Held-to-maturity, net of allowance for credit losses of $3,214 and $1,388 at December 31, 2023 and 2022, respectively Held-to-maturity, net of allowance for credit losses of $3,214 and $1,388 at December 31, 2023 and 2022, respectively Available-for-sale, at estimated fair value (amortized cost of $3,509,709 and $4,331,413 at December 31, 2023 and 2022, respectively) Total investments 1,957,575 1,619,450 Mortgage loans held for sale 24,038 27,788 Assets held in trading accounts -- 41 Other assets held for sale 165,780 -- Loans: Legacy loans 5,705,609 4,327,207 Allowance for loan losses (41,668 ) (36,286 ) Loans acquired, net of discount and allowance 5,074,076 1,305,683 Loans Allowance for credit losses on loans Net loans 10,738,017 5,596,604 Premises and equipment 287,249 199,359 Premises held for sale -- 6,052 Foreclosed assets and other real estate owned 32,118 26,895 Interest receivable 43,528 27,788 Bank owned life insurance 185,984 138,620 Goodwill 842,651 348,505 Other intangible assets 106,071 52,959 Other assets 71,439 65,773 Total assets $ 15,055,806 $ 8,400,056 LIABILITIES AND STOCKHOLDERS’ EQUITY LIABILITIES AND STOCKHOLDERS’ EQUITY LIABILITIES AND STOCKHOLDERS’ EQUITY Deposits: Non-interest bearing transaction accounts $ 2,665,249 $ 1,491,676 Deposits: Deposits: Noninterest bearing transaction accounts Noninterest bearing transaction accounts Noninterest bearing transaction accounts Interest bearing transaction accounts and savings deposits 6,494,896 3,956,483 Time deposits 1,932,730 1,287,060 Total deposits 11,092,875 6,735,219 Federal funds purchased and securities sold under agreements to repurchase 122,444 115,029 Other borrowings 1,380,024 273,159 Subordinated debentures 140,565 60,397 Other liabilities held for sale 157,366 -- Subordinated notes and debentures Accrued interest and other liabilities 77,968 65,141 Total liabilities 12,971,242 7,248,945 Stockholders’ equity: Common stock, Class A, $0.01 par value; 120,000,000 shares authorized; 92,029,118 and 62,555,446 shares issued and outstanding at December 31, 2017 and 2016, respectively 920 626 Stockholders’ equity: Stockholders’ equity: Common stock, Class A, $0.01 par value; 350,000,000 shares authorized at December 31, 2023 and 2022; 125,184,119 and 127,046,654 shares issued and outstanding at December 31, 2023 and 2022, respectively Common stock, Class A, $0.01 par value; 350,000,000 shares authorized at December 31, 2023 and 2022; 125,184,119 and 127,046,654 shares issued and outstanding at December 31, 2023 and 2022, respectively Common stock, Class A, $0.01 par value; 350,000,000 shares authorized at December 31, 2023 and 2022; 125,184,119 and 127,046,654 shares issued and outstanding at December 31, 2023 and 2022, respectively Surplus 1,586,034 711,663 Undivided profits 514,874 454,034 Accumulated other comprehensive loss (17,264 ) (15,212 ) Total stockholders’ equity 2,084,564 1,151,111 Total liabilities and stockholders’ equity $ 15,055,806 $ 8,400,056 See Notes to Consolidated Financial Statements.6174Consolidated Statements of IncomeYears Ended December 31, 2017, 20162023, 2022 and 20152021(In thousands, except per share data (1)) 2017 2016 2015 (In thousands, except per share data) (In thousands, except per share data) 2023 2022 2021 INTEREST INCOME Loans $ 352,351 $ 265,652 $ 268,367 INTEREST INCOME INTEREST INCOME Loans, including fees Interest bearing balances due from banks and federal funds sold 1,933 756 899 Investment securities 40,115 33,479 30,613 Mortgage loans held for sale 605 1,102 1,051 Assets held in trading accounts -- 16 18 Other loans held for sale TOTAL INTEREST INCOME 395,004 301,005 300,948 INTEREST EXPENSE INTEREST EXPENSE INTEREST EXPENSE Deposits Deposits Deposits 27,756 15,217 15,248 Federal funds purchased and securities sold under agreements to repurchase 347 273 236 Other borrowings 8,621 4,148 5,097 Subordinated debentures 3,350 2,161 1,772 Subordinated notes and debentures TOTAL INTEREST EXPENSE 40,074 21,799 22,353 NET INTEREST INCOME 354,930 279,206 278,595 Provision for loan losses 26,393 20,065 9,022 NET INTEREST INCOME NET INTEREST INCOME Provision for credit losses NET INTEREST INCOME AFTER PROVISION FOR LOAN LOSSES 328,537 259,141 269,573 NET INTEREST INCOME AFTER PROVISION FOR CREDIT LOSSES NET INTEREST INCOME AFTER PROVISION FOR CREDIT LOSSES NET INTEREST INCOME AFTER PROVISION FOR CREDIT LOSSES NON-INTEREST INCOME Trust income 18,570 15,442 9,261 NONINTEREST INCOME NONINTEREST INCOME NONINTEREST INCOME Service charges on deposit accounts 36,079 32,414 30,985 Service charges on deposit accounts Service charges on deposit accounts Debit and credit card fees Wealth management fees Mortgage lending income Bank owned life insurance income Other service charges and fees 9,919 12,872 8,756 Mortgage and SBA lending income 13,316 16,483 11,452 Investment banking income 2,793 3,471 2,590 Debit and credit card fees 34,258 30,740 26,660 Bank owned life insurance income 3,503 3,324 2,680 Gain on sale of securities, net 1,059 5,848 307 Net loss on assets covered by FDIC loss share agreements -- -- (14,812 ) (Loss) gain on sale of securities, net Gain on insurance settlement Other income 19,268 18,788 16,782 TOTAL NON-INTEREST INCOME 138,765 139,382 94,661 TOTAL NONINTEREST INCOME NON-INTEREST EXPENSE NONINTEREST EXPENSE NONINTEREST EXPENSE NONINTEREST EXPENSE Salaries and employee benefits Salaries and employee benefits Salaries and employee benefits 154,314 133,457 138,243 Occupancy expense, net 21,159 18,667 16,858 Furniture and equipment expense 19,366 16,683 14,352 Other real estate and foreclosure expense 3,042 4,461 4,861 Deposit insurance 3,696 3,469 4,201 Merger related costs 21,923 4,835 13,760 Other operating expenses 88,879 73,513 64,695 TOTAL NON-INTEREST EXPENSE 312,379 255,085 256,970 TOTAL NONINTEREST EXPENSE INCOME BEFORE INCOME TAXES INCOME BEFORE INCOME TAXES INCOME BEFORE INCOME TAXES 154,923 143,438 107,264 Provision for income taxes 61,983 46,624 32,900 NET INCOME NET INCOME NET INCOME 92,940 96,814 74,364 Preferred stock dividends -- 24 257 NET INCOME AVAILABLE TO COMMON STOCKHOLDERS $ 92,940 $ 96,790 $ 74,107 BASIC EARNINGS PER SHARE $ 1.34 $ 1.58 $ 1.32 DILUTED EARNINGS PER SHARE $ 1.33 $ 1.56 $ 1.31 (1)All per share amounts have been restated to reflect the effect of the two-for-one stock split on February 8, 2018.See Notes to Consolidated Financial Statements.6275Consolidated Statements of Comprehensive IncomeYears Ended December 31, 2017, 20162023, 2022 and 20152021(In thousands) 2017 2016 2015 NET INCOME $ 92,940 $ 96,814 $ 74,364 OTHER COMPREHENSIVE INCOME (LOSS) Unrealized holding gains (losses) arising during the period on available-for-sale loans and securities 2,645 (14,797 ) (1,880 ) Less: Reclassification adjustment for realized gains included in net income 1,059 5,848 307 Other comprehensive income (loss), before tax effect 1,586 (20,645 ) (2,187 ) Less: Tax effect of other comprehensive income (loss) 622 (8,098 ) (858 ) TOTAL OTHER COMPREHENSIVE INCOME (LOSS) 964 (12,547 ) (1,329 ) COMPREHENSIVE INCOME $ 93,904 $ 84,267 $ 73,035 (In thousands) 2023 2022 2021 NET INCOME $ 175,057 $ 256,412 $ 271,156 OTHER COMPREHENSIVE INCOME (LOSS) Unrealized holding gains (losses) arising during the period on available-for-sale securities 108,612 (593,010) (91,434) Less: Reclassification adjustment for realized (losses) gains included in net income (20,609) (278) 15,498 Less: Realized gains (losses) on available-for-sale securities interest rate hedges 1,960 (98,374) (10,588) Net unrealized (losses) gains on securities transferred from available-for-sale to held-to-maturity during the period — (206,682) 1,106 Less: Amortization of net unrealized losses on securities transferred from available-for-sale to held-to-maturity (25,971) (14,632) (104) Other comprehensive income (loss), before tax effect 153,232 (686,408) (95,134) Less: Tax effect of other comprehensive income (loss) 40,047 (179,393) (24,863) TOTAL OTHER COMPREHENSIVE INCOME (LOSS) 113,185 (507,015) (70,271) COMPREHENSIVE INCOME (LOSS) $ 288,242 $ (250,603) $ 200,885 See Notes to Consolidated Financial Statements.6376Consolidated Statements of Cash FlowsYears Ended December 31, 2017, 20162023, 2022 and 20152021(In thousands) 2017 2016 2015 (In thousands) 2023 2022 2021 OPERATING ACTIVITIES OPERATING ACTIVITIES Net income $ 92,940 $ 96,814 $ 74,364 Adjustments to reconcile net income to net cash provided by (used in) operating activities: Adjustments to reconcile net income to net cash provided by operating activities: Depreciation and amortization 21,062 16,978 13,654 Provision for loan losses 26,393 20,065 9,022 Gain on sale of investments (1,059 ) (5,848 ) (307 ) Net accretion of investment securities and assets not covered by FDIC loss share (38,090 ) (31,928 ) (32,933 ) Depreciation and amortization Depreciation and amortization Provision for credit losses Loss (gain) on sale of investments Net amortization (accretion) of investment securities and assets Net amortization on borrowings 561 421 375 Stock-based compensation expense 10,681 3,418 4,018 Net accretion on assets covered by FDIC loss share -- -- (2,709 ) (Gain) loss on sale of premises and equipment, net of impairment (615 ) (225 ) 381 Gain on sale of premises and equipment, net of impairment Gain on sale of foreclosed assets and other real estate owned (1,076 ) (2,432 ) (4,339 ) Gain on sale of mortgage loans held for sale (12,186 ) (14,683 ) (11,625 ) Fair value write-down of closed branches 325 3,000 1,958 Gain on sale of branches Gain on sale of loans Deferred income taxes 23,251 9,832 13,599 FDIC loss share indemnification loss -- -- 7,476 Gain on sale of banking operation -- -- (2,110 ) Gain on sale of insurance lines of business (3,708 ) -- -- Increase in cash surrender value of bank owned life insurance income (3,503 ) (3,324 ) (2,680 ) Income from bank owned life insurance Loss from early retirement of TruPS Originations of mortgage loans held for sale (507,907 ) (618,453 ) (571,750 ) Proceeds from sale of mortgage loans held for sale 526,245 635,613 574,375 Changes in assets and liabilities: Interest receivable (2,432 ) (1,197 ) 713 Assets held in trading accounts 41 4,381 2,565 Interest receivable Interest receivable Other assets 12,456 (8,254 ) 5,453 Accrued interest and other liabilities (14,194 ) (14,959 ) 1,393 Income taxes payable (14,604 ) 1,915 3,466 Net cash provided by operating activities 114,581 91,134 84,359 INVESTING ACTIVITIES Net originations of loans not covered by FDIC loss share (698,532 ) (368,162 ) (301,323 ) Net collections of loans covered by FDIC loss share -- -- 23,646 Net change in loans Net change in loans Net change in loans Proceeds from sale of loans Decrease in due from banks - time 3,233 9,544 10,879 Purchases of premises and equipment, net (34,216 ) (18,892 ) (14,832 ) Proceeds from sale of premises and equipment 3,475 1,628 5,738 Purchases of other real estate owned (1,021 ) -- -- Proceeds from sale of foreclosed assets and other real estate owned 18,255 29,055 40,988 Proceeds from sale of foreclosed assets held for sale, covered by FDIC loss share -- -- 2,858 Proceeds from sale of available-for-sale securities 679,613 346,273 32,007 Proceeds from maturities of available-for-sale securities 487,717 257,388 435,438 Purchases of available-for-sale securities (854,708 ) (861,572 ) (445,281 ) Proceeds from maturities of held-to-maturity securities 97,494 250,636 281,120 Purchases of held-to-maturity securities (860 ) (6,162 ) (59,486 ) Proceeds from bank owned life insurance death benefits -- 3,039 -- Purchases of bank owned life insurance (143 ) (143 ) (12,143 ) Settlement of FDIC loss share agreements -- -- 2,368 Cash received on FDIC loss share -- -- 3,980 Cash paid on sale of banking operations, net of cash received -- -- (68,273 ) Proceeds from the sale of insurance lines of business 9,296 -- -- Cash paid in business combinations, net of cash received (48,092 ) -- -- Cash received in business combinations, net of cash paid -- 106,419 197,029 Net cash (used in) provided by investing activities (338,489 ) (250,949 ) 134,713 Cash received in business combinations, net Disposition of assets and liabilities held for sale Net cash used in investing activities FINANCING ACTIVITIES Net change in deposits 120,667 139,266 (107,633 ) Repayments of subordinated debentures and subordinated debt (3,000 ) (594 ) -- Net change in deposits Net change in deposits Repayments of subordinated debentures Dividends paid on preferred stock -- (24 ) (257 ) Dividends paid on common stock (35,116 ) (28,743 ) (27,026 ) Net change in other borrowed funds 521,865 106,823 (143,914 ) Net change in federal funds purchased and securities sold under agreements to repurchase (71,003 ) 2,398 (27,418 ) Net shares issued under stock compensation plans 2,260 4,352 3,303 Net shares (cancelled) issued under stock compensation plans Shares issued under employee stock purchase plan 618 586 226 Redemption of preferred stock -- (30,852 ) -- Net cash provided by (used in) financing activities 536,291 193,212 (302,719 ) INCREASE (DECREASE) IN CASH EQUIVALENTS 312,383 33,397 (83,647 ) Repurchase of common stock Retirement of preferred stock Net cash (used in) provided by financing activities DECREASE IN CASH AND CASH EQUIVALENTS CASH AND CASH EQUIVALENTS, BEGINNING OF YEAR 285,659 252,262 335,909 CASH AND CASH EQUIVALENTS, END OF YEAR $ 598,042 $ 285,659 $ 252,262 See Notes to Consolidated Financial Statements.6477Consolidated Statements of Stockholders’ EquityYears Ended December 31, 2017, 20162023, 2022 and 20152021(In thousands, except share data (1)) Preferred Stock Common
Stock Surplus Accumulated
Other
Comprehensive
Income (Loss) Undivided
Profits Total Balance, December 31, 2014 $ -- $ 361 $ 156,388 $ (1,336 ) $ 338,906 $ 494,319 Comprehensive income -- -- -- (1,329 ) 74,364 73,035 Stock issued for employee stock purchase plan – 13,056 shares -- -- 226 -- -- 226 Stock-based compensation plans, net – 291,748 shares -- 3 7,318 -- -- 7,321 Stock issued for Community First acquisition – 30,852 preferred shares; 13,105,830 common shares 30,852 131 268,211 -- -- 299,194 Stock issued for Liberty acquisition – 10,362,674 common shares -- 104 212,072 -- -- 212,176 Stock issued for Ozark Trust acquisition – 678,580 common shares -- 7 17,860 -- -- 17,867 Dividends on preferred stock -- -- -- -- (257 ) (257 ) Cash dividends – $0.46 per share -- -- -- -- (27,026 ) (27,026 ) Balance, December 31, 2015 30,852 606 662,075 (2,665 ) 385,987 1,076,855 Comprehensive income -- -- -- (12,547 ) 96,814 84,267 Stock issued for employee stock purchase plan – 31,470 shares -- -- 586 -- -- 586 Stock-based compensation plans, net – 295,630 shares -- 3 7,767 -- -- 7,770 Stock issued for Citizens National acquisition – 1,671,482 common shares -- 17 41,235 -- -- 41,252 Preferred stock redeemed (30,852 ) -- -- -- -- (30,852 ) Dividends on preferred stock -- -- -- -- (24 ) (24 ) Dividends on common stock – $0.48 per share -- -- -- -- (28,743 ) (28,743 ) Balance, December 31, 2016 -- 626 711,663 (15,212 ) 454,034 1,151,111 Comprehensive income -- -- -- 964 92,940 93,904 Reclassify stranded tax effects due to 2017 tax law changes -- -- -- (3,016 ) 3,016 -- Stock issued for employee stock purchase plan – 26,002 shares -- -- 618 -- -- 618 Stock-based compensation plans, net – 359,286 shares -- 3 12,938 -- -- 12,941 Stock issued for Hardeman acquisition – 1,599,940 common shares -- 16 42,622 -- -- 42,638 Stock issued for OKSB acquisition –14,488,604 common shares -- 145 431,253 -- -- 431,398 Stock issued for First Texas acquisition – 12,999,840 common shares -- 130 386,940 -- -- 387,070 Dividends on common stock – $0.50 per share -- -- -- -- (35,116 ) (35,116 ) Balance, December 31, 2017 $ -- $ 920 $ 1,586,034 $ (17,264 ) $ 514,874 $ 2,084,564 (In thousands, except share data) Preferred Stock Common
StockSurplus Accumulated
Other
Comprehensive
Income (Loss)Undivided
ProfitsTotal Balance, December 31, 2020 $ 767 $ 1,081 $ 2,014,076 $ 59,726 $ 901,006 $ 2,976,656 Comprehensive income — — — (70,271) 271,156 200,885 Stock issued for employee stock purchase plan – 60,697 shares — 1 1,169 — — 1,170 Stock-based compensation plans, net – 474,970 shares — 4 16,154 — — 16,158 Stock issued for Landmark acquisition - 4,499,872 shares — 45 138,146 — — 138,191 Stock issued for Triumph acquisition - 4,164,712 shares — 42 127,857 — — 127,899 Preferred stock retirement (767) — — — — (767) Stock repurchases - 4,562,469 shares — (46) (132,413) — — (132,459) Dividends on preferred stock — — — — (47) (47) Dividends on common stock – $0.72 per share — — — — (78,845) (78,845) Balance, December 31, 2021 — 1,127 2,164,989 (10,545) 1,093,270 3,248,841 Comprehensive income — — — (507,015) 256,412 (250,603) Stock issued for employee stock purchase plan - 59,475 shares — 1 1,150 — — 1,151 Stock-based compensation plans, net - 429,423 shares — 3 10,281 — — 10,284 Stock issued for Spirit acquisition - 18,275,074 shares — 183 464,735 — — 464,918 Stock repurchases - 4,432,762 shares — (44) (111,089) — — (111,133) Dividends on common stock - $0.76 per share — — — — (94,096) (94,096) Balance, December 31, 2022 — 1,270 2,530,066 (517,560) 1,255,586 3,269,362 Comprehensive income — — — 113,185 175,057 288,242 Stock issued for employee stock purchase plan - 42,510 shares — — 833 — — 833 Stock-based compensation plans, net - 352,004 shares — 5 9,330 — — 9,335 Stock repurchases - 2,257,049 shares — (23) (40,299) — — (40,322) Dividends on common stock – $0.80 per share — — — — (100,962) (100,962) Balance, December 31, 2023 $ — $ 1,252 $ 2,499,930 $ (404,375) $ 1,329,681 $ 3,426,488 (1)All share and per share amounts have been restated to reflect the effect of the two-for-one stock split on February 8, 2018.See Notes to Consolidated Financial Statements.6578Notes to Consolidated Financial StatementsNOTE 1:SUMMARY OF SIGNIFICANT ACCOUNTING POLICIESNature of Operations and Principles of ConsolidationSimmons First National Corporation (the “Company”(“Company”) is primarily engaged in providing a full range of banking services to individual and corporate customers through its subsidiaries and their branch banks with offices. We areMid-South financial holding company headquartered in Pine Bluff, Arkansas, and conduct banking operationsthe parent company of Simmons Bank, an Arkansas state-chartered bank that has been in communities throughout Arkansas, Colorado, Kansas, Missouri, Oklahoma, Tennesseeoperation since 1903 (“Simmons Bank” or the “Bank”). Simmons First Insurance Services, Inc. and Texas. WeSimmons First Insurance Services of TN, LLC are wholly-owned subsidiaries of Simmons Bank and are insurance agencies that offer various lines of personal and corporate insurance coverage to individual and commercial customers. The Company, through its subsidiaries, offers, among other things, consumer, real estate and commercial loans,loans; checking, savings and time deposits from our 200 financial centers conveniently located throughout our market areas. Additionally, we offerdeposits; and specialized products and services such(such as credit cards, trust and fiduciary services, investments, agricultural finance lending, equipment lending, insurance and small business administrationSmall Business Administration (“SBA”) lending. The Company is subject to regulationlending) from approximately 234 financial centers as of certain federalDecember 31, 2023, located throughout market areas in Arkansas, Kansas, Missouri, Oklahoma, Tennessee and state agencies and undergoes periodic examinations by those regulatory authorities.The consolidated financial statements include the accounts of Simmons First National Corporationthe Company and its subsidiaries, including Simmons Bank, Bank SNB and Southwest Bank.subsidiaries. Significant intercompany accounts and transactions have been eliminated in consolidation.Simmons Bank is an Arkansas state-chartered bank and a member of the Federal Reserve System through the Federal Reserve Bank of St. Louis. Due to the Company’s typical acquisition process, there may be brief periods of time during which the Company may operate another subsidiary bank that the Company acquired through a merger with a target bank holding company as a separate subsidiary while preparing for the merger and integration of that subsidiary bank into Simmons Bank. However, it is the Company’s intent to generally maintain Simmons Bank as the Company’s sole subsidiary bank.Operating SegmentsOperating segments are components of an enterprise about which separate financial information is available that is regularly evaluated by the chief operating decision maker in deciding how to allocate resources and in assessing performance. The Company is organized on a divisional basis.with community and commercial banking groups. Each of the divisionsthese groups provide a group ofone or more similar community banking services, including such products and services as loans; time deposits, checking and savings accounts; personaltreasury management; and corporate trust services; credit cards; investment management; insurance; and securities and investment services.cards. Loan products include consumer, real estate, commercial, agricultural, equipment, warehouse lending and SBA lending. The individual bank divisionsbanking groups have similar operating and economic characteristics. While the chief operating decision maker monitors the revenue streams of the various products, services, branch locations, divisions and divisions,groups, operations are managed, financial performance is evaluated, and management makes decisions on how to allocate resources, on a Company-wide basis. Accordingly, the divisionsrespective groups are considered by management to be aggregated into one reportable operating segment, community banking.The Company also considers its trust, investment and insurance services to be operating segments. Information on these segments is not reported separately since they do not meet the quantitative thresholds under Accounting Standards Codification (“ASC”) Topic 280-10-50-12.Use of EstimatesThe preparation of financial statements in accordance with accounting principles generally accepted in the United States (“US GAAP”),GAAP requires management to make estimates and assumptions that affect the reported amounts of assets, liabilities, income items and expenses and disclosure of contingent assets and liabilities. The estimates and assumptions used in the accompanying consolidated financial statements are based upon management’s evaluation of the relevant facts and circumstances as of the date of the consolidated financial statements and actual results may differ from these estimates.79Material estimates that are particularly susceptible to significant change relate to the determination of the allowance for loancredit losses, the valuation of real estate acquired in connection with foreclosures or in satisfaction of loans and the valuation of acquired loans, valuation of goodwill and related indemnification asset.subsequent impairment analysis, stock-based compensation plans and income taxes. Management obtains third party valuations to assist in valuing certain aspects of these material estimates, as appropriate, including independent appraisals for significant properties in connection with the determination of the allowance for loancredit losses and the valuationfair value of foreclosed assets.ReclassificationsCertain gains and fees were reclassified within non-interest income categoriesacquired loans. Assumptions used in the 2016 statementsgoodwill impairment analysis involve internally projected forecasts, coupled with market and third-party data. These material estimates could change as a result of incomethe uncertainty in current macroeconomic conditions and other factors that are beyond the Company’s control and could cause actual results to conform to the 2017 presentation. differ materially from those projected.ReclassificationsVarious other items within the accompanying consolidated financial statements for previous years have been reclassified to provide more comparative information. These reclassifications were not material to the consolidated financial statements.Cash EquivalentsThe Company considers all liquid investments with original maturities of three months or less to be cash equivalents. For purposes of the consolidated statements of cash flows, cash and cash equivalents are considered to include cash and non-interestnoninterest bearing balances due from banks, interest bearing balances due from banks and federal funds sold and securities purchased under agreements to resell.
At December 31, 2023, nearly all of the interest-bearing and noninterest bearing deposits were uninsured with nearly all of these balances held at the Federal Reserve Bank.66Investment SecuritiesHeld-to-maturity securities (“HTM”), which include any security for which the Company has the positive intent and ability to hold until maturity, are carried at historical cost adjusted for amortization of premiums and accretion of discounts. Premiums and discounts are amortized and accreted, respectively, to interest income using the constant effective yield method over the periodestimated life of the security. Prepayments are anticipated for mortgage-backed and SBA securities. Premiums on callable securities are amortized to maturity.Available-for-sale securities (“AFS”), which include any security for which the Company has no immediate plan to sell but which may be sold in the future, are carried at fair value. Realized gains and losses, based on specifically identified amortized cost of the individual security, are included in other income. Unrealized gains and losses are recorded, net of related income tax effects, in stockholders'stockholders’ equity. Premiums and discounts are amortized and accreted, respectively, to interest income using the constant effective yield method over the periodestimated life of the security. Prepayments are anticipated for mortgage-backed and SBA securities. Premiums on callable securities are amortized to maturity.Trading securities, if any, which include any security held primarily for near-term sale, are carried at fair value. Gains and losses on trading securities are included in other income.Allowance for Credit Losses - Investment SecuritiesAllowance for Credit Losses - HTM Securities - The Company applies accounting guidance relatedmeasures expected credit losses on HTM securities on a collective basis by major security type, with each type sharing similar risk characteristics. The estimate of expected credit losses considers historical credit loss information that is adjusted for current conditions and reasonable and supportable forecasts. The Company has made the election to recognitionexclude accrued interest receivable on HTM securities from the estimate of credit losses and presentation of other-than-temporary impairment under ASC Topic 320-10. Whenreport accrued interest separately on the consolidated balance sheets.80Allowance for Credit Losses - AFS Securities - For AFS securities in an unrealized loss position, the Company does not intendfirst evaluates whether it intends to sell, a debt security, andor whether it is more likely than not the Companythat it will not havebe required to sell, the security before recovery of its amortized cost basis. If either of these criteria regarding intent or requirement to sell is met, the AFS security amortized cost basis it recognizesis written down to fair value through income. If the criteria is not met, the Company is required to assess whether the decline in fair value has resulted from credit losses or noncredit-related factors. If the assessment indicates a credit loss exists, the present value of cash flows expected to be collected from the security are compared to the amortized cost basis of the security. If the present value of cash flows expected to be collected is less than the amortized cost basis, a credit loss exists, and an allowance for credit loss is recorded through income as a component of an other-than-temporary impairment ofprovision for credit loss expense. If the assessment indicates that a debt securitycredit loss does not exist, the Company records the decline in earnings and the remaining portion in other comprehensive income. For held-to-maturity debt securities, the amount of an other-than-temporary impairment recorded infair value through other comprehensive income, net of related income tax effects. The Company has made the election to exclude accrued interest receivable on AFS securities from the estimate of credit losses and report accrued interest separately on the consolidated balance sheets. Changes in the allowance for credit losses are recorded as provision for (or reversal of) credit loss expense. Losses are charged against the noncredit portionallowance when management believes the uncollectibility of a previous other-than-temporary impairmentan AFS security is amortized prospectively over the remaining lifeconfirmed or when either of the security on the basis of the timing of future estimated cash flows of the security.As a result of this guidance, the Company’s consolidated statements of income reflect the full impairment (that is, the difference between the security’s amortized cost basis and fair value) on debt securities that the Company intendscriteria regarding intent or requirement to sell or would more likely than not be required to sell before the expected recovery of the amortized cost basis. For available-for-sale and held-to-maturity debt securities that management has no intent to sell and believes that it more likely than not will not be required to sell prior to recovery, only the credit loss component of the impairment is recognized in earnings, while the noncredit loss is recognized in accumulated other comprehensive income. The credit loss component recognized in earnings is identified as the amount of principal cash flows not expected to be received over the remaining term of the security as projected based on cash flow projections.Mortgage Loans Held For SaleMortgage loans heldLoans Held for saleSale are carried at the lower of cost or fair value which is determined usingon an aggregate basis. Write-downsAdjustments to fair value are recognized as a chargemonthly and reflected in earnings. The Company regularly sells mortgages into the capital markets to earnings atmitigate the effects of interest rate volatility during the period from the time an interest rate lock commitment (“IRLC”) is issued until the decline in value occurs. Forward commitments to sellIRLC funds creating a mortgage loans are acquired to reduce market risk on mortgage loans in the process of origination and mortgage loansloan held for sale. The forward commitments acquired bysale and its subsequent sale into the secondary/capital markets. Loan sales are typically executed on a mandatory basis. Under a mandatory commitment, the Company for mortgageagrees to deliver a specified dollar amount with predetermined terms by a certain date. Generally, the commitment is not loan specific, and any combination of loans in processcan be delivered into the outstanding commitment provided the terms fall within the parameters of origination are not mandatory forward commitments. These commitments are structured on a best efforts basis; therefore,the commitment. Upon failure to deliver, the Company is not requiredsubject to substitute another loan or to buy back the commitment if the original loan does not fund. Typically, the Company delivers the mortgage loans within a few days after the loans are funded. These commitmentsfees based on market movement.The IRLCs are derivative instruments andinstruments; their fair values at December 31, 20172023 and 2016 are2022 were not material. Gains and losses resulting from sales of mortgage loans are recognized when the respective loans are sold to investors.correspondent lenders, investors or aggregators. Gains and losses are determined by the difference between the sellingsale price and the carrying amount ofin the loans sold, net of discounts collected, or premiums paid. Fees received from borrowers to guarantee the fundingHedge instruments are, likewise, carried at fair value and associated gains/losses are realized at time of mortgage loans held for sale are recognized as income or expense when the loans are sold or when it becomes evident that the commitment will not be used.LoansLoans that management has the intent and ability to hold for the foreseeable future or until maturity or pay-offs are reported at their amortized cost basis, which is the unpaid principal balance outstanding, principal adjusted for anynet of unearned income, deferred loan fees and costs, premiums and discounts associated with acquisition date fair value adjustments on acquired loans, charged off, the allowance for loan losses and any unamortized deferred fees or costs on originateddirect principal charge-offs. The Company has made a policy election to exclude accrued interest from the amortized cost basis of loans and unamortized premiums or discountsreport accrued interest separately from the related loan balance on purchased loans.For loans amortized at cost, interest income is accrued based on the unpaid principal balance. Loan origination fees, net of certain direct origination costs, as well as premiums and discounts, are deferred and amortized as a level yield adjustment over the respective term of the loan.The accrual of interest on loans, except on certain government guaranteed loans, is discontinued at the time the loan is 90 days past due unless the credit is well-secured and in process of collection. Past due status is based on contractual terms of the loan. In all cases, loans are placed on nonaccrualnon-accrual or charged off at an earlier date if collection of principal or interest is considered doubtful.67Discounts and premiums on purchased residential real estate loans are amortized to income using the interest method over the remaining period to contractual maturity, adjusted for anticipated prepayments. Discounts and premiums on purchased consumer loans are recognized over the expected lives of the loans using methods that approximate the interest method.ForFurther information regarding accounting policies related to past due loans, non-accrual loans, and modifications to borrowers experiencing financial difficulty is presented in Note 5, Loans and Allowance for Credit Losses. Additionally, for discussion of the Company’s accounting for acquired loans, see Acquisition Accounting, Covered Loans and Related Indemnification Asset later in this section.81Allowance for LoanCredit LossesThe allowance for loancredit losses is a reserve established through a provision for credit losses charged to expense which represents management’s best estimate of probablelifetime expected losses inbased on reasonable and supportable forecasts, quantitative factors, and other qualitative considerations.Loans with similar risk characteristics such as loan type, collateral type, and internal risk ratings are aggregated for collective assessment. The Company uses statistically-based models that leverage assumptions about current and future economic conditions throughout the loan portfolio. Loancontractual life of the loan. Expected credit losses are charged against the allowance when management believes the uncollectability of a loan balance is confirmed. Subsequent recoveries, if any,estimated by either lifetime loss rates or expected loss cash flows based on three key parameters: probability-of-default (“PD”), exposure-at-default (“EAD”), and loss-given-default (“LGD”). Future economic conditions are creditedincorporated to the allowance.Allocationsextent that they are reasonable and supportable. Beyond the reasonable and supportable periods, the economic variables revert to a historical equilibrium at a pace dependent on the state of the economy reflected within the economic scenarios. The Company also includes qualitative adjustments to the allowance for loan losses are categorized as either general reserves or specific reserves.The allowance for loan losses is calculated monthly based on management’s assessment of several factors such as (1) historical loss experience based on volumes and types, (2) volume and trends in delinquencies and nonaccruals, (3) lending policies and procedures including those for loan losses, collections and recoveries, (4) national, state and local economic trends and conditions, (5) external factors and pressure from competition, (6) the experience, ability and depth of lending management and staff, (7) seasoning of new products obtained and new markets entered through acquisition and (8)considerations that have not otherwise been fully accounted for.Loans that have unique risk characteristics are evaluated on an individual basis. These evaluations are typically performed on loans with a deteriorated internal risk rating. For a collateral-dependent loan, our evaluation process includes a valuation by appraisal or other factors and trends that will affect specific loans and categories of loans. The Company establishes general allocationscollateral analysis adjusted for each major loan category.selling costs, when appropriate. This category also includes allocations to loans which are collectively evaluated for loss such as credit cards, one-to-four family owner occupied residential real estate loans and other consumer loans. General reserves have been established, based upon the aforementioned factors and allocatedvaluation is compared to the individual loan categories.Specific reserves are provided on loans that are considered impaired when it is probable that we will not receive all amounts due according to the contractual termsremaining outstanding principal balance of the loan, including scheduled principal and interest payments. This includes loans that are delinquent 90 days or more, nonaccrual loans and certain other loans identified by management. Certain other loans identified by management consist of performing loans where management expects thatloan. If a loss is determined to be probable, the Company will not receive all amounts due according to the contractual terms of the loan, including scheduled principal and interest payments. Specific reserves are accrued for probable losses on specific loans evaluated for impairment for which the basis of each loan, including accrued interest, exceeds the discounted amount of expected future collections of interest and principal or, alternatively, the fair value of loan collateral. Accrual of interestloss is discontinued and interest accrued and unpaid is removed at the time such amounts are delinquent 90 days unless management is aware of circumstances which warrant continuing the interest accrual. Interest is recognized for nonaccrual loans only upon receipt and only after all principal amounts are current according to the terms of the contract.Management’s evaluation ofincluded in the allowance for loancredit losses is inherently subjective as it requires material estimates. The actual amounts of loan losses realized in the near term could differ from the amounts estimated in arriving at the allowance for loan losses reported in the financial statements.Reserve for Unfunded CommitmentsIn addition to the allowance for loancredit losses, the Company has established a reserve for unfunded commitments, classified in other liabilities.liabilities, representing expected credit losses over the contractual period for which the Company is exposed to credit risk resulting from a contractual obligation to extend credit. This reserve is maintained at a level management believes to be sufficient to absorb losses arising from unfunded loan commitments. The adequacy of the reserve for unfunded commitments is determined monthlyquarterly based on methodology similar to the Company’s methodology for determining the allowance for loancredit losses. Net adjustmentsThe allowance for credit loss is reported as a component of accrued interest and other liabilities in the consolidated balance sheets. Adjustments to the reserveallowance are reported in the income statement as a component of the provision for unfunded commitments are included in other non-interest expense.Acquisition Accounting, Acquired LoansThe Company accounts for its acquisitions under ASC Topic 805, Business Combinations, which requires the use of the acquisition method of accounting. All identifiable assets acquired, including loans, are recorded at fair value. No allowanceThe fair value for loan losses related to the acquired loans at the time of acquisition is recordedbased on the acquisition date asa variety of factors including discounted expected cash flows, adjusted for estimated prepayments and credit losses. In accordance with ASC 326, the fair value adjustment is recorded as premium or discount to the unpaid principal balance of each acquired loan. Loans that have been identified as having experienced a more-than-insignificant deterioration in credit quality since origination is a purchased credit deteriorated (“PCD”) loan. The net premium or discount on PCD loans is adjusted by the loans acquired incorporates assumptions regardingCompany’s allowance for credit risk. Loans acquired arelosses recorded at fair value in accordance with the fair value methodology prescribed in ASC Topic 820.time of acquisition. The fair value estimates associated with the loans include estimates related to expected prepayments and the amount and timing of undiscounted expected principal, interest and other cash flows.The Company evaluates non-impaired loans acquired in accordance with the provisions of ASC Topic 310-20, Nonrefundable Fees and Other Costs. The fair valueremaining net premium or discount on these loans is accreted or amortized into interest income over the weighted averageremaining life of the loan using a constant yield method. The net premium or discount on loans that are not classified as PCD (“non-PCD”), that includes credit and non-credit components, is accreted or amortized into interest income over the remaining life of the loan using a constant yield method. The Company evaluates purchased impairedthen records the necessary allowance for credit losses on the non-PCD loans in accordance with the provisions of ASC Topic 310-30, Loans and Debt Securities Acquired with Deteriorated Credit Quality. Purchased loans are considered impaired if there is evidence of credit deterioration since origination and if it is probable that not all contractually required payments will be collected.68For impaired loans accounted for under ASC Topic 310-30, the Company continues to estimate cash flows expected to be collected on purchased credit impaired loans. The Company evaluates at each balance sheet date whether the present value of the purchased credit impaired loans determined using the effective interest rates has decreased significantly and if so, recognize athrough provision for loan loss in our consolidated statement of income. For any significant increases in cash flows expected to be collected, the Company adjusts the amount of accretable yield recognized on a prospective basis over the remaining life of the purchased credit impaired loan.Covered Loans and Related Indemnification AssetIn September 2015, Simmons Bank entered into an agreement with the FDIC to terminate all loss share agreements which were entered into in 2010 and 2012 in conjunction with the Company’s acquisition of substantially all of the assets (“covered assets”) and assumption of substantially all of the liabilities of four failed banks in FDIC-assisted transactions. Under the early termination, all rights and obligations of the Company and the FDIC under the FDIC loss share agreements, including the clawback provisions and the settlement of loss share and expense reimbursement claims, have been resolved and terminated.Under the terms of the agreement, the FDIC made a net payment of $2,368,000 to the Bank as consideration for the early termination of the loss share agreements. The early termination was recorded in the Company’s financial statements by removing the FDIC Indemnification Asset, receivable from FDIC, the FDIC True-up liability and recording a one-time, pre-tax charge of $7,476,000. As a result, all FDIC-acquired assets are now classified as non-covered.For further discussion of ourthe Company’s acquisition and loan accounting, see Note 2, Acquisitions, and Note 6,5, Loans Acquired.Trust AssetsTrust assets (other than cash deposits) held by the Company in fiduciary or agency capacities for its customers are not included in the accompanying consolidated balance sheets since such items are not assets of the Company.82Premises and EquipmentDepreciable assets are stated at cost less accumulated depreciation. Depreciation is charged to expense using the straight-line method over the estimated useful lives of the assets. Leasehold improvements are capitalized and amortized by the straight-line method over the terms of the respective leases or the estimated useful lives of the improvements, whichever is shorter.Premises Held for SaleThe Company records premises held for sale at the lower of (1) cost less accumulated depreciation or (2) fair value less estimated selling expenses. These Right-of-use lease assets are assessed for impairment at the time theyoperating leases with a term greater than one year and are reclassified as held for saleincluded in premises and periodically thereafter.Foreclosed Assets Held For SaleAssets acquired by foreclosure or in settlement of debt and held for sale are valued at estimated fair value less estimated cost to sell as of the date of foreclosure, and a related valuation allowance is provided for estimated costs to sell the assets.foreclosure. Management evaluates the value of foreclosed assets held for sale periodically and increases the valuation allowance for any subsequent declines in fair value. Changesdecreases in the valuation allowancefair value are charged or credited to other expense.Bank Owned Life InsuranceThe Company maintains bank-owned life insurance policies on certain current and former employees and directors, which are recorded at their cash surrender values as determined by the insurance carriers. The appreciation in the cash surrender value of the policies is recognized as a component of non-interestnoninterest income in the Company’s consolidated statements of income.Goodwill and Intangible AssetsGoodwill represents the excess of the cost of an acquisition over the fair value of the net assets acquired. Other intangible assets represent purchased assets that also lack physical substance but can be separately distinguished from goodwill because of contractual or other legal rights or because the asset is capable of being sold or exchanged either on its own or in combination with a related contract, asset or liability. The Company performs an annual goodwill impairment test, and more frequentlythan annually if circumstances warrant, in accordance with ASC Topic 350, Intangibles – Goodwill and Other,as amended by Accounting Standards Update (“ASU”) 2011-08 - Testing Goodwill for Impairment. ASC Topic 350 requires that goodwill and intangible assets that have indefinite lives be reviewed for impairment annually, or more frequently if certain conditions occur. Intangible assets with finite lives are amortized over the estimated life of the asset, and are reviewed for impairment whenever events or changes in circumstances indicated that the carrying value may not be recoverable. Impairment losses on recorded goodwill, if any, will be recorded as operating expenses.69Derivative Financial InstrumentsThe Company may enter into derivative contracts for the purposes of managing exposure to interest rate risk to meet the financing needs of its customers. A derivative instrument is a financial tool which derives its value from the value of some other financial instrument, or variable index, including certain hedging instruments embedded in other contracts. These products are primarily designed to reduce interest rate risk for either the Company or its customers who proactively manage these risks.The Company records all derivatives on the balance sheet at fair value. In an effort to meet the financing needs of its customers and mitigate the impact of changing interest rates on the fair value of AFS securities, the Company has entered into limited fair value hedges. Fair value hedges include interest rate swap agreements on fixed rate loans.loans and fixed rate callable AFS securities. To qualify for hedge accounting, derivatives must be highly effective at reducing the risk associated with the exposure being hedged and must be designated as a hedge at the point of inception of the derivative contract.For derivatives designated as hedging the exposure to changes in the fair value of the hedged item, the gain or loss is recognized in earnings in the period of change together with the offsetting loss or gain of the hedging instrument. The fair value hedges are considered to be highly effective and any hedge ineffectiveness was deemed not material. Fair value adjustments related to cash flow hedges are recorded in other comprehensive income and are reclassified to earnings when the hedged transaction is reflected in earnings.The notional amount of the swaps was $303.5 million at December 31, 2017, and $99.2 million at December 31, 2016.83Securities Sold Under Agreements to RepurchaseThe Company sells securities under agreements to repurchase to meet customer needs for sweep accounts. At the point funds deposited by customers become investable, those funds are used to purchase securities owned by the Company and held in its general account with the designation of Customers’ Securities. A third party maintains control over the securities underlying overnight repurchase agreements. The securities involved in these transactions are generally U.S. Treasury or Federal Agency issues. Securities sold under agreements to repurchase generally mature on the banking day following that on which the investment was initially purchased and are treated as collateralized financing transactions which are recorded at the amounts at which the securities were sold plus accrued interest. Interest rates and maturity dates of the securities involved vary and are not intended to be matched with funds from customers.Revenue from Contracts with CustomersASC Topic 606, Revenue from Contracts with Customers, applies to all contracts with customers to provide goods or services in the ordinary course of business. However, Topic 606 specifically does not apply to revenue related to financial instruments, guarantees, insurance contracts, leases, or nonmonetary exchanges. Given these scope exceptions, interest income recognition and measurement related to loans and investments securities, the Company’s two largest sources of revenue, are not accounted for under Topic 606. Also, the Company does not use Topic 606 to account for gains or losses on its investments in securities, loans, and derivatives due to the scope exceptions.Certain revenue streams, such as service charges on deposit accounts, gains or losses on the sale of Other Real Estate Owned (“OREO”), and trust income, fall under the scope of Topic 606 and the Company must recognize revenue at an amount that reflects the consideration to which the Company expects to be entitled in exchange for transferring goods or services to a customer. Topic 606 is applied using five steps: 1) identify the contract with the customer, 2) identify the performance obligations in the contract, 3) determine the transaction price, 4) allocate the transaction price to the performance obligations in the contract, and 5) recognize revenue when (or as) the entity satisfies a performance obligation.The Company has evaluated the nature of all contracts with customers that fall under the scope of Topic 606 and determined that further disaggregation of revenue from contracts with customers into categories was not necessary. There has not been significant revenue recognized in the current reporting periods resulting from performance obligations satisfied in previous periods. In addition, there has not been a significant change in timing of revenues received from customers.A description of performance obligations for each type of contract with customers is as follows:Service charges on deposit accounts – The Company’s primary source of funding comes from deposit accounts with its customers. Customers pay certain fees to access their cash on deposit including, but not limited to, non-transactional fees such as account maintenance, dormancy or statement rendering fees, and certain transaction-based fees such as ATM, wire transfer, overdraft or returned check fees. The Company generally satisfies its performance obligations as services are rendered. The transaction prices are fixed, and are charged either on a periodic basis or based on activity.Sale of OREO – In the normal course of business, the Company will enter into contracts with customers to sell OREO, which has generally been foreclosed upon by the Company. The Company generally satisfies its performance obligation upon conveyance of property from the Company to the customer, generally by way of an executed agreement. The transaction price is fixed, and on occasion the Company will finance a portion of the proceeds the customers uses to purchase the property. These properties are generally sold without recourse or warranty.Wealth Management Fees – The Company enters into contracts with its customers to manage assets for investment, and/or transact on their accounts. The Company generally satisfies its performance obligations as services are rendered. The management fee is a fixed percentage-based fee calculated upon the average balance of assets under management and is charged to customers on a monthly basis.Bankcard Fee Income – Periodic bankcard fees, net of direct origination costs, are recognized as revenue on a straight-line basis over the period the fee entitles the cardholder to use the card.84Income TaxesThe Company accounts for income taxes in accordance with income tax accounting guidance in ASC Topic 740, Income Taxes. The income tax accounting guidance results in two components of income tax expense: current and deferred. Current income tax expense reflects taxes to be paid or refunded for the current period by applying the provisions of the enacted tax law to the taxable income or excess of deductions over revenues. The Company determines deferred income taxes using the liability (or balance sheet) method. Under this method, the net deferred tax asset or liability is based on the tax effects of the differences between the book and tax bases of assets and liabilities, and enacted changes in tax rates and laws are recognized in the period in which they occur.Deferred income tax expense results from changes in deferred tax assets and liabilities between periods. Deferred tax assets are recognized if it is more likely than not, based on the technical merits, that the tax position will be realized or sustained upon examination. The term more likely than not means a likelihood of more than 50 percent; the terms examined and upon examination also include resolution of the related appeals or litigation processes, if any. A tax position that meets the more-likely-than-not recognition threshold is initially and subsequently measured as the largest amount of tax benefit that has a greater than 50 percent likelihood of being realized upon settlement with a taxing authority that has full knowledge of all relevant information. The determination of whether or not a tax position has met the more-likely-than-not recognition threshold considers the facts, circumstances and information available at the reporting date and is subject to management’s judgment. Deferred tax assets are reduced by a valuation allowance if, based on the weight of evidence available, it is more likely than not that some portion or all of a deferred tax asset will not be realized.The Company files consolidated income tax returns with its subsidiaries.Earnings Per ShareBasic earnings per share are computed based on the weighted average number of shares outstanding during each year. Diluted earnings per share are computed using the weighted average common shares and all potential dilutive common shares outstanding during the period. All share and per share amounts have been restated to reflect the effect of the two-for-one stock split during February 2018.70The computation of per share earnings is as follows:(In thousands, except per share data) 2017 2016 2015 (In thousands, except per share data) 2023 2022 2021 Net income available to common stockholders Net income available to common shareholders $ 92,940 $ 96,790 $ 74,107 Average common shares outstanding Average common shares outstanding Average common shares outstanding 69,385 61,291 56,168 Average potential dilutive common shares 468 636 252 Average diluted common shares 69,853 61,927 56,420 Basic earnings per share $ 1.34 $ 1.58 $ 1.32 Basic earnings per share Basic earnings per share Diluted earnings per share $ 1.33 $ 1.56 $ 1.31 There were 410,490 stock options excluded from the year ended December 31, 2023 earnings per share calculation due to the related stock option exercise price exceeding the average market price of the Company’s stock. There were no stock options excluded from the earnings per share calculation due to the related exercise price exceeding the average market pricecalculations for the years ended December 31, 2017, 20162022 and 2015.Stock-Based CompensationThe Company has adopted various stock-based compensation plans. The plans provide for the grant of incentive stock options, nonqualified stock options, stock appreciation rights, restricted stock awards, restricted stock units and bonusperformance stock awards.units. Pursuant to the plans, shares are reserved for future issuance by the Company, upon exercise of stock options or awarding of performance or bonus shares granted to directors, officers and other key employees.14,15, Employee Benefit Plans.85NOTE 2:ACQUISITIONS71NOTE 2:ACQUISITIONSSouthwest Bancorp, Inc.October 19, 2017,April 8, 2022, the Company completed the acquisitionits merger with Spirit of Southwest Bancorp,Texas Bancshares, Inc. (“OKSB”Spirit”) headquartered in Stillwater, Oklahoma, including its wholly-owned bank subsidiary, Bank SNB.pursuant to the terms of the Agreement and Plan of Merger dated as of November 18, 2021 (“Spirit Agreement”), at which time Spirit merged with and into the Company, with the Company continuing as the surviving corporation. The Company issued 14,488,60418,275,074 shares of its common stock valued at approximately $431.4$464.9 million as of October 19, 2017,April 8, 2022, plus $95.0 million$1,393,508.90 in cash, in exchange for all outstanding shares of OKSBSpirit capital stock (and common stock.Prior to the acquisition, OKSBSpirit, headquartered in Conroe, Texas, conducted banking business through its subsidiary bank, Spirit of Texas Bank SSB, from 2935 branches located primarily in Texas, Oklahoma, Kansas and Colorado. In addition, OKSB owned a loan production office in Denver, Colorado. Including the effects of the acquisition method accounting adjustments, the Company acquired approximately $2.7 billion in assets, including approximately $2.0 billion in loans (inclusive of loan discounts) and approximately $2.0 billion in deposits. The systems conversion is planned to occur during May 2018, at which time the subsidiary bank will be merged into Simmons Bank.Goodwill of $228.9 million was recorded as a result of the transaction. The acquisition allowed us to enter the Texas Oklahoma,Triangle - consisting of Dallas-Fort Worth, Houston, San Antonio and Colorado banking markets and it also strengthened our Kansas franchise and our product offeringsAustin metropolitan areas - with additional locations in the healthcareBryan-College Station, Corpus Christi and real estate industries, all of which gave rise to the goodwill recorded. The goodwill will not be deductible for tax purposes.A summary, at fair value, of the assets acquiredTyler metropolitan areas, along with offices in North Central and liabilities assumed in the OKSB transaction, as of the acquisition date, is as follows:(In thousands) Acquired from
OKSB Fair Value
Adjustments Fair
Value Assets Acquired Cash and due from banks $ 79,517 $ -- $ 79,517 Investment securities 485,468 (1,295 ) 484,173 Loans acquired 2,039,524 (43,071 ) 1,996,453 Allowance for loan losses (26,957 ) 26,957 -- Foreclosed assets 6,284 (1,127 ) 5,157 Premises and equipment 21,210 5,457 26,667 Bank owned life insurance 28,704 -- 28,704 Goodwill 13,545 (13,545 ) -- Core deposit intangible 1,933 40,191 42,124 Other intangibles 3,806 -- 3,806 Other assets 33,455 (8,929 ) 24,526 Total assets acquired $ 2,686,489 $ 4,638 $ 2,691,127 Liabilities Assumed Deposits: Non-interest bearing transaction accounts $ 485,971 $ -- $ 485,971 Interest bearing transaction accounts and savings deposits 869,252 -- 869,252 Time deposits 613,345 (2,213 ) 611,132 Total deposits 1,968,568 (2,213 ) 1,966,355 Securities sold under agreement to repurchase 11,256 -- 11,256 Other borrowings 347,000 -- 347,000 Subordinated debentures 46,393 -- 46,393 Accrued interest and other liabilities 17,440 5,364 22,804 Total liabilities assumed 2,390,657 3,151 2,393,808 Equity 295,832 (295,832 ) -- Total equity assumed 295,832 (295,832 ) -- Total liabilities and equity assumed $ 2,686,489 $ (292,681 ) $ 2,393,808 Net assets acquired 297,319 Purchase price 526,251 Goodwill $ 228,932 72The purchase price allocation and certain fair value measurements remain preliminary due to the timing of the acquisition. Management will continue to review the estimated fair values and evaluate the assumed tax positions. The Company expects to finalize its analysis of the acquired assets and assumed liabilities in this transaction over the next few months, within one year of the acquisition. Therefore, adjustments to the estimated amounts and carrying values may occur. The Company’s operating results for 2017 include the operating results of the acquired assets and assumed liabilities of OKSB subsequent to the acquisition date.First Texas BHC, Inc.On October 19, 2017, the Company completed the acquisition of First Texas BHC, Inc. (“First Texas”) headquartered in Fort Worth, Texas, including its wholly-owned bank subsidiary, Southwest Bank. The Company issued 12,999,840 shares of its common stock valued at approximately $387.1 million as of October 19, 2017, plus $70.0 million in cash in exchange for all outstanding shares of First Texas common stock.Prior to the acquisition, First Texas operated 15 banking centers, a trust office and a limited service branch in north Texas and a loan production office in Austin,South Texas. Including the effects of the acquisition method accounting adjustments, the Company acquired approximately $2.4$3.11 billion in assets, including approximately $2.2$2.29 billion in loans (inclusive of loan discounts), and approximately $1.9$2.72 billion in deposits. The Company completed the systems conversion and merged First Texas into Simmons Bank in February 2018.Goodwill of $238.0 million was recorded as a result of the transaction. The acquisition allowed us to enter the Texas banking markets and it also strengthened our specialty product offerings in the area of SBA lending and trust services, all of which gave rise to the goodwill recorded. The goodwill will not be deductible for tax purposes.73A summary, at fair value, of the assets acquired and liabilities assumed in the First Texas transaction, as of the acquisition date, is as follows:(In thousands) Acquired from
First Texas Fair Value
Adjustments Fair
Value Assets Acquired Cash and due from banks $ 59,277 $ -- $ 59,277 Investment securities 81,114 (596 ) 80,518 Loans acquired 2,246,212 (37,834 ) 2,208,378 Allowance for loan losses (20,864 ) 20,664 (200 ) Premises and equipment 24,864 10,123 34,987 Bank owned life insurance 7,190 -- 7,190 Goodwill 37,227 (37,227 ) -- Core deposit intangible -- 7,328 7,328 Other assets 18,263 12,703 30,966 Total assets acquired $ 2,453,283 $ (24,839 ) $ 2,428,444 Liabilities Assumed Deposits: Non-interest bearing transaction accounts $ 74,410 $ -- $ 74,410 Interest bearing transaction accounts and savings deposits 1,683,298 -- 1,683,298 Time deposits 124,233 (283 ) 123,950 Total deposits 1,881,941 (283 ) 1,881,658 Securities sold under agreement to repurchase 50,000 -- 50,000 Other borrowings 235,000 -- 235,000 Subordinated debentures 30,323 (811 ) 29,512 Accrued interest and other liabilities 11,727 1,463 13,190 Total liabilities assumed 2,208,991 369 2,209,360 Equity 244,292 (244,292 ) -- Total equity assumed 244,292 (244,292 ) -- Total liabilities and equity assumed $ 2,453,283 $ (243,923 ) $ 2,209,360 Net assets acquired 219,084 Purchase price 457,103 Goodwill $ 238,019 The purchase price allocation and certain fair value measurements remain preliminary due to the timing of the acquisition. Management will continue to review the estimated fair values and evaluate the assumed tax positions. The Company expects to finalize its analysis of the acquired assets and assumed liabilities in this transaction over the next few months, within one year of the acquisition. Therefore, adjustments to the estimated amounts and carrying values may occur. The Company’s operating results for 2017 include the operating results of the acquired assets and assumed liabilities of First Texas subsequent to the acquisition date.Summary of Unaudited Pro forma InformationThe unaudited pro forma information below for the years ended December 31, 2017 and 2016 gives effect to the OKSB and First Texas acquisitions as if the acquisitions had occurred on January 1, 2016. Pro forma earnings for the year ended December 31, 2017 were adjusted to exclude $9.4 million of acquisition-related costs, net of tax, incurred by Simmons during 2017. The pro forma financial information is not necessarily indicative of the results of operations if the acquisitions had been effective as of this date.(In thousands, except per share data) 2017 2016 Revenue (1) $ 654,358 $ 620,461 Net income $ 130,947 $ 136,199 Diluted earnings per share $ 1.43 $ 1.52 _________________________(1) Net interest income plus noninterest income.74Consolidated year-to-date 2017 results included approximately $29.2 million of revenue and $10.5 million of net income attributable to the OKSB acquisition and $27.6 million of revenue and $5.7 million of net income attributable to the First Texas acquisition.Hardeman County Investment Company, Inc.On May 15, 2017, the Company completed the acquisition of Hardeman County Investment Company, Inc. (“Hardeman”), headquartered in Jackson, Tennessee, including its wholly-owned bank subsidiary, First South Bank. The Company issued 1,599,940 shares of its common stock valued at approximately $42.6 million as of May 15, 2017, plus $30.0 million in cash in exchange for all outstanding shares of Hardeman common stock.Prior to the acquisition, Hardeman conducted banking business from 10 branches located in western Tennessee. Including the effects of the acquisition method accounting adjustments, the Company acquired approximately $462.9 million in assets, including approximately $251.6 million in loans (inclusive of loan discounts) and approximately $389.0 million in deposits. The Company completed the systems conversion and merged Hardeman into Simmons Bank in September 2017. As part of the systems conversion, five existing Simmons Bank and First South Bank branches were consolidated or closed.Goodwill of $29.4$174.1 million was recorded as a result of the transaction. The merger strengthened the Company’s position in the western TennesseeTexas market and brought forth additional opportunities in the Company will be able to achieve cost savings by integrating the two companies and combining accounting, data processing, and other administrative functions, all ofCompany’s current footprint, which gave rise to the goodwill recorded. The goodwill will not be deductible for tax purposes.A summary, at fair value, of the assets acquired and liabilities assumed in the Hardeman transaction,Spirit acquisition, as of the acquisition date, is as follows:(In thousands) Acquired from
Hardeman Fair Value
Adjustments Fair
Value Assets Acquired Cash and due from banks $ 8,001 $ -- $ 8,001 Interest bearing balances due from banks - time 1,984 -- 1,984 Investment securities 170,654 (285 ) 170,369 Loans acquired 257,641 (5,992 ) 251,649 Allowance for loan losses (2,382 ) 2,382 -- Foreclosed assets 1,083 (452 ) 631 Premises and equipment 9,905 1,258 11,163 Bank owned life insurance 7,819 -- 7,819 Goodwill 11,485 (11,485 ) -- Core deposit intangible -- 7,840 7,840 Other intangibles -- 830 830 Other assets 2,639 (1 ) 2,638 Total assets acquired $ 468,829 $ (5,905 ) $ 462,924 Liabilities Assumed Deposits: Non-interest bearing transaction accounts $ 76,555 $ -- $ 76,555 Interest bearing transaction accounts and savings deposits 214,872 -- 214,872 Time deposits 97,917 (368 ) 97,549 Total deposits 389,344 (368 ) 388,976 Securities sold under agreement to repurchase 17,163 -- 17,163 Other borrowings 3,000 -- 3,000 Subordinated debentures 6,702 -- 6,702 Accrued interest and other liabilities 1,891 1,924 3,815 Total liabilities assumed 418,100 1,556 419,656 Equity 50,729 (50,729 ) -- Total equity assumed 50,729 (50,729 ) -- Total liabilities and equity assumed $ 468,829 $ (49,173 ) $ 419,656 Net assets acquired 43,268 Purchase price 72,639 Goodwill $ 29,371 The purchase price allocation and certain fair value measurements remain preliminary due to(In thousands) Acquired from Spirit Fair Value Adjustments Fair Value Assets Acquired Cash and due from banks $ 277,790 $ — $ 277,790 Investment securities 362,088 (13,401) 348,687 Loans acquired 2,314,085 (19,925) 2,294,160 Allowance for credit losses on loans (17,005) 7,382 (9,623) Premises and equipment 84,135 (19,074) 65,061 Bank owned life insurance 36,890 — 36,890 Goodwill 77,681 (77,681) — Core deposit and other intangible assets 6,245 32,386 38,631 Other assets 58,403 (3,411) 54,992 Total assets acquired $ 3,200,312 $ (93,724) $ 3,106,588 Liabilities Assumed Deposits: Noninterest bearing transaction accounts $ 825,228 $ (534) $ 824,694 Interest bearing transaction accounts and savings deposits 1,383,663 — 1,383,663 Time deposits 509,209 1,081 510,290 Total deposits 2,718,100 547 2,718,647 Other borrowings 37,547 503 38,050 Subordinated debentures 36,491 879 37,370 Accrued interest and other liabilities 23,667 (3,311) 20,356 Total liabilities assumed 2,815,805 (1,382) 2,814,423 Equity 384,507 (384,507) — Total equity assumed 384,507 (384,507) — Total liabilities and equity assumed $ 3,200,312 $ (385,889) $ 2,814,423 Net assets acquired 292,165 Purchase price 466,311 Goodwill $ 174,146 86During 2023, the timing of the acquisition. Management will continue to review the estimated fair values and evaluate the assumed tax positions. The Company expects to finalizefinalized its analysis of the loans acquired along with other acquired assets and assumed liabilities in this transaction over the next few months, within one year of the acquisition. Therefore, adjustmentsrelated to the estimated amounts and carrying values may occur.
Spirit acquisition.75The Company’s operating results for 2017 include the operating results of the acquired assets and assumed liabilities of HardemanSpirit subsequent to the acquisition date.Citizens NationalSummary of Unaudited Pro forma InformationThe unaudited pro forma information below for the years ended December 31, 2022 and 2021 gives effect to the Spirit acquisition as if the acquisition had occurred on January 1, 2021. Pro forma earnings for the year ended December 31, 2022 were adjusted to exclude $18.7 million of acquisition-related costs, net of tax, incurred by the Company during 2022. The pro forma financial information is not necessarily indicative of the results of operations if the acquisition had been effective as of this date.(In thousands, except per share data) 2022 2021 Revenue(1)$ 912,631 $ 927,061 Net income $ 264,522 $ 307,752 Diluted earnings per share $ 2.04 $ 2.40 _________________________(1) Net interest income plus non-interest income.As previously discussed, the Company’s acquisition of Spirit was completed on April 8, 2022, at which time Spirit was fully integrated into the Company’s operations. As a result, it is impracticable for the Company to provide certain post-closing information, such as revenue and earnings, as it relates to the Spirit acquisition.Landmark Community BankOn September 9, 2016,October 8, 2021, the Company completed theits acquisition of Citizens NationalLandmark Community Bank (“Citizens”Landmark”) pursuant to the terms of the Agreement and Plan of Merger dated as of June 4, 2021 (“Landmark Agreement”), headquartered in Athens, Tennessee.at which time Landmark merged with and into Simmons Bank, with Simmons Bank continuing as the surviving entity. The Company issued 1,671,4824,499,872 shares of its common stock valued at approximately $41.3$138.2 million as of September 9, 2016,October 8, 2021, plus $35.0 million$6,451,727.43 in cash, in exchange for all outstanding shares of CitizensLandmark capital stock (and common stock.Prior to the acquisition, CitizensLandmark, headquartered in Collierville, Tennessee, conducted banking business from 98 branches located in east Tennessee.the Memphis and Nashville, Tennessee, metropolitan areas. Including the effects of the acquisition method accounting adjustments, the Company acquired approximately $585.1$968.8 million in assets, including approximately $340.9$789.5 million in loans (inclusive of loan discounts), and approximately $509.9$802.7 million in deposits. The Company completed the systems conversion and merged Citizens into Simmons Bank in October 2016.Goodwill of $23.4$31.4 million was recorded as a result of the transaction. The merger strengthened the Company’s positionmarket share and brought forth additional opportunities in the east Tennessee market and the Company is able to achieve cost savings by integrating the two companies and combining accounting, data processing, and other administrative functions all ofCompany’s current footprint, which gave rise to the goodwill recorded. The goodwill will be deductible for tax purposes.A summary, at fair value, of the assets acquired and liabilities assumed in the Citizens transaction, as of the acquisition date, is as follows:(In thousands) Acquired from
Citizens Fair Value
Adjustments Fair
Value Assets Acquired Cash and due from banks $ 131,467 $ (351 ) $ 131,116 Federal funds sold 10,000 -- 10,000 Investment securities 61,987 1 61,988 Loans acquired 350,361 (9,511 ) 340,850 Allowance for loan losses (4,313 ) 4,313 -- Foreclosed assets 4,960 (1,518 ) 3,442 Premises and equipment 6,746 1,339 8,085 Bank owned life insurance 6,632 -- 6,632 Core deposit intangible -- 5,075 5,075 Other intangibles -- 591 591 Other assets 17,364 6 17,370 Total assets acquired $ 585,204 $ (55 ) $ 585,149 Liabilities Assumed Deposits: Non-interest bearing transaction accounts $ 109,281 $ -- $ 109,281 Interest bearing transaction accounts and savings deposits 204,912 -- 204,912 Time deposits 195,664 -- 195,664 Total deposits 509,857 -- 509,857 Securities sold under agreement to repurchase 13,233 -- 13,233 FHLB borrowings 4,000 47 4,047 Accrued interest and other liabilities 3,558 1,530 5,088 Total liabilities assumed 530,648 1,577 532,225 Equity 54,556 (54,556 ) -- Total equity assumed 54,556 (54,556 ) -- Total liabilities and equity assumed $ 585,204 $ (52,979 ) $ 532,225 Net assets acquired 52,924 Purchase price 76,300 Goodwill $ 23,376 During 2017, the Company finalized its analysis of the loans acquired along with the other acquired assets and assumed liabilities in this transaction.76The Company’s operating results for 2017 and 2016 include the operating results of the acquired assets and assumed liabilities of Citizens subsequent to the acquisition date.Liberty Bancshares, Inc.On February 27, 2015, the Company completed the acquisition of Liberty Bancshares, Inc. (“Liberty”), headquartered in Springfield, Missouri, including its wholly-owned bank subsidiary Liberty Bank (“LB”). The Company issued 10,362,674 shares of its common stock valued at approximately $212.2 million as of February 27, 2015 in exchange for all outstanding shares of Liberty common stock.Prior to the acquisition, Liberty conducted banking business from 24 branches located in southwest Missouri. Including the effects of the acquisition method accounting adjustments, the Company acquired approximately $1.1 billion in assets, including approximately $780.7 million in loans (inclusive of loan discounts) and approximately $874.7 million in deposits. The Company completed the systems conversion and merged LB into Simmons Bank in April 2015.Goodwill of $95.2 million was recorded as a result of the transaction. The merger strengthened the Company’s position in the southwest Missouri market and the Company is able to achieve cost savings by integrating the two companies and combining accounting, data processing, and other administrative functions all of which give rise to the goodwill recorded. The goodwill will not be deductible for tax purposes.A summary, at fair value, of the assets acquired and liabilities assumed in the Liberty transaction, as of the acquisition date, is as follows:(In thousands) Acquired from
Liberty Fair Value
Adjustments Fair
Value Assets Acquired Cash and due from banks, including time deposits $ 102,637 $ (14 ) $ 102,623 Federal funds sold 7,060 -- 7,060 Investment securities 99,123 (335 ) 98,788 Loans acquired, not covered by FDIC loss share 790,493 (9,835 ) 780,658 Allowance for loan losses (10,422 ) 10,422 -- Premises and equipment 34,239 (3,215 ) 31,024 Bank owned life insurance 16,972 -- 16,972 Core deposit intangible 699 13,857 14,556 Other intangibles 3,063 (3,063 ) -- Other assets 17,703 (3,112 ) 14,591 Total assets acquired $ 1,061,567 $ 4,705 $ 1,066,272 Liabilities Assumed Deposits: Non-interest bearing transaction accounts $ 146,618 $ -- $ 146,618 Interest bearing transaction accounts and savings deposits 543,183 -- 543,183 Time deposits 184,913 -- 184,913 Total deposits 874,714 -- 874,714 FHLB borrowings 46,128 223 46,351 Subordinated debentures 20,620 (510 ) 20,110 Accrued interest and other liabilities 7,828 300 8,128 Total liabilities assumed 949,290 13 949,303 Equity 112,277 (112,277 ) -- Total equity assumed 112,277 (112,277 ) -- Total liabilities and equity assumed $ 1,061,567 $ (112,264 ) $ 949,303 Net assets acquired 116,969 Purchase price 212,176 Goodwill $ 95,207 During 2015 the Company finalized its analysis of the acquired loans and subordinated debentures along with the other acquired assets and assumed liabilities. The Company’s operating results for all periods presented include the operating results of the acquired assets and assumed liabilities of Liberty subsequent to the acquisition date.77Community First Bancshares, Inc.On February 27, 2015, the Company completed the acquisition of Community First Bancshares, Inc. (“Community First”), headquartered in Union City, Tennessee, including its wholly-owned bank subsidiary First State Bank (“FSB”). The Company issued 13,105,830 shares of its common stock valued at approximately $268.3 million as of February 27, 2015, plus $9,974 in cash in exchange for all outstanding shares of Community First common stock. The Company also issued $30.9 million of preferred stock in exchange for all outstanding shares of Community First preferred stock. On January 29, 2016, the Company redeemed all of the preferred stock, including accrued and unpaid dividends.Prior to the acquisition, Community First conducted banking business from 33 branches located across Tennessee. Including the effects of the acquisition method accounting adjustments, the Company acquired approximately $1.9 billion in assets, including approximately $1.1 billion in loans (inclusive of loan discounts) and approximately $1.5 billion in deposits. The Company completed the systems conversion and merged FSB into Simmons Bank in September 2015.Goodwill of $110.4 million was recorded as a result of the transaction. The merger allowed the Company’s entrance into the Tennessee market and served as a launching platform for expansion into adjacent areas. The Company is able to achieve cost savings by integrating the two companies and combining accounting, data processing, and other administrative functions. Furthermore, the Company will benefit from the addition of Community First's small-business lending platform while cross-selling its trust products in Community First’s market. This combination of factors gave rise to the goodwill recorded. The goodwill will not be deductible for tax purposes.87A summary, at fair value, of the assets acquired and liabilities assumed in the Community First transaction,Landmark acquisition, as of the acquisition date, is as follows:(In thousands) Acquired from
Community First Fair Value
Adjustments Fair
Value(In thousands) Acquired from Landmark Fair Value Adjustments Fair Value Assets Acquired Cash and due from banks $ 39,848 $ -- $ 39,848 Federal funds sold 76,508 -- 76,508 Cash and due from banks Cash and due from banks Due from banks - time Investment securities 570,199 (3,381 ) 566,818 Loans acquired, not covered by FDIC loss share 1,163,398 (26,855 ) 1,136,543 Allowance for loan losses (14,635 ) 14,635 -- Foreclosed assets not covered by FDIC loss share 747 -- 747 Loans acquired Allowance for credit losses on loans Premises and equipment 44,837 (2,794 ) 42,043 Bank owned life insurance 22,149 -- 22,149 Goodwill 100 (100 ) -- Core deposit intangible -- 11,273 11,273 Other intangibles -- 420 420 Deferred tax asset 3,700 3,538 7,238 Other assets 11,474 -- 11,474 Total assets acquired $ 1,918,325 $ (3,264 ) $ 1,915,061 Liabilities Assumed Liabilities Assumed Liabilities Assumed Deposits: Non-interest bearing transaction accounts $ 103,825 $ -- $ 103,825 Deposits: Deposits: Noninterest bearing transaction accounts Noninterest bearing transaction accounts Noninterest bearing transaction accounts Interest bearing transaction accounts and savings deposits 995,207 -- 995,207 Time deposits 436,181 849 437,030 Total deposits 1,535,213 849 1,536,062 Federal funds purchased and securities sold under agreement to repurchase 16,230 -- 16,230 FHLB borrowings 143,047 674 143,721 Subordinated debentures 21,754 (840 ) 20,914 Other borrowings Accrued interest and other liabilities 8,769 601 9,370 Total liabilities assumed 1,725,013 1,284 1,726,297 Equity 193,312 (193,312 ) -- Total equity assumed 193,312 (193,312 ) -- Total liabilities and equity assumed $ 1,918,325 $ (192,028 ) $ 1,726,297 Net assets acquired 188,764 Purchase price 299,204 Goodwill $ 110,440 During 20152022, the Company finalized its analysis of the acquired loans and subordinated debenturesacquired along with the other acquired assets and assumed liabilities.
liabilities related to Landmark.78The Company’s operating results for all periods presented include the operating results of the acquired assets and assumed liabilities of Community FirstLandmark subsequent to the acquisition date.Ozark Trust & Investment CorporationTriumph Bancshares, Inc.On October 29, 2015,8, 2021, the Company completed its merger with Triumph Bancshares, Inc. (“Triumph”) pursuant to the acquisition of Ozark Trust & Investment Corporation (“Ozark Trust”), headquartered in Springfield, Missouri, including its wholly-owned non-deposit trust company, Trust Companyterms of the OzarksAgreement and Plan of Merger dated as of June 4, 2021 (“TCO”Triumph Agreement”). Simmons, at which time Triumph merged with and into the Company, with the Company continuing as the surviving corporation. The Company issued 678,5804,164,712 shares of its common stock valued at approximately $17.9$127.9 million as of October 29, 2015,8, 2021, plus $5.8 million$1,693,402.93 in cash, in exchange for all outstanding shares of Ozark TrustTriumph capital stock (and common stock.Prior to the acquisition, Ozark Trust had over $1 billionTriumph, headquartered in Memphis, Tennessee, conducted banking business through its subsidiary bank, Triumph Bank, from 6 branches located in the Memphis and Nashville, Tennessee, metropolitan areas. Including the effects of the acquisition method accounting adjustments, the Company acquired approximately $847.2 million in assets, under management.including approximately $698.8 million in loans (inclusive of loan discounts), and approximately $719.7 million in deposits.Goodwill of $39.9 million was recorded as a result of the transaction. The Company owned 1,000 shares of Ozark Trust’s common stock,merger strengthened the Company’s market share and brought forth additional opportunities in the Company’s current footprint, which it acquired through its acquisition of Liberty in February 2015.gave rise to the goodwill recorded. The purchase price is allocated among the net assets of Ozark Trust acquired as appropriate, with the remaining balance being reported as goodwill.88A summary, at fair value, of the assets acquired and liabilities assumed in the Ozark Trust transaction,Triumph acquisition, as of the acquisition date, is as follows:(In thousands) Acquired from
Ozark Trust Fair Value
Adjustments Fair
Value(In thousands) Acquired from Triumph Fair Value Adjustments Fair Value Assets Acquired Cash $ 1,756 $ -- $ 1,756 Cash and due from banks Cash and due from banks Cash and due from banks Due from banks - time Investment securities 241 -- 241 Loans acquired Allowance for credit losses on loans Premises and equipment 1,126 418 1,544 Other intangibles -- 9,733 9,733 Goodwill Core deposit intangible Other assets 752 869 1,621 Total assets acquired $ 3,875 $ 11,020 $ 14,895 Liabilities Assumed Deferred tax liability 63 4,175 4,238 Accrued and other liabilities 302 -- 302 Liabilities Assumed Liabilities Assumed Deposits: Deposits: Deposits: Noninterest bearing transaction accounts Noninterest bearing transaction accounts Noninterest bearing transaction accounts Interest bearing transaction accounts and savings deposits Time deposits Total deposits Other borrowings Subordinated debentures Accrued interest and other liabilities Total liabilities assumed 365 4,175 4,540 Equity 3,510 (3,510 ) -- Total equity assumed 3,510 (3,510 ) -- Total liabilities and equity assumed $ 3,875 $ 665 $ 4,540 Net assets acquired 10,355 Purchase price 23,623 Goodwill $ 13,268 During 20152022, the Company finalized its analysis of the acquired loans and subordinated debenturesacquired along with the other acquired assets and assumed liabilities.The Company’s operating results for all periods presented include the operating results of the acquired assets and assumed liabilities of Ozark TrustTriumph subsequent to the acquisition date.Total acquisition-related costs of $1.4 million, $22.5 million, and $15.9 million were recorded during the years ended 2023, 2022 and 2021, respectively.The following is a description of the methods used to determine the fair values of significant assets and liabilities presented in the acquisitions above.Cash and due from banks and time deposits due from banks and federal funds sold – The carrying amount of these assets is a reasonable estimate of fair value based on the short-term nature of these assets.Investment securities – Investment securities were acquired with an adjustment to fair value based upon quoted market prices if material. Otherwise, the carrying amount of these assets was deemed to be a reasonable estimate of fair value.89Loans acquired – Fair values for loans were based on a discounted cash flow methodology that considered factors including the type of loan and related collateral, classification status, fixed or variable interest rate, term of loan and whether or not the loan was amortizing, and current discount rates. The discount rates used for loans are based on current market rates for new originations of comparable loans and include adjustments for liquidity concerns. The discount rate does not include a factor for credit losses as that has been included in the estimated cash flows. Loans were grouped together according to similar characteristics and were treated in the aggregate when applying various valuation techniques.
See Note 5, Loans and Allowance for Credit Losses, in the accompanying Notes to Consolidated Financial Statements for additional information related to purchased financial assets with credit deterioration.79Foreclosed assets – These assets are presented at the estimated present values that management expects to receive when the properties are sold, net of related costs of disposal.Premises and equipment – Bank premises and equipment were acquired with an adjustment to fair value, which represents the difference between the Company’s current analysis of property and equipment values completed in connection with the acquisition and book value acquired.Bank owned life insurance – Bank owned life insurance is carried at its current cash surrender value, which is the most reasonable estimate of fair value.Goodwill – The consideration paid as a result of the acquisition exceeded the fair value of the assets acquired, resulting in an intangible asset, goodwill. Goodwill established prior to the acquisitions, if applicable, was written off.Core deposit intangible – This intangible asset represents the value of the relationships that the acquired banks had with their deposit customers. The fair value of this intangible asset was estimated based on a discounted cash flow methodology that gave appropriate consideration to expected customer attrition rates, cost of the deposit base and the net maintenance cost attributable to customer deposits. CoreAny core deposit intangible established prior to the acquisitions, if applicable, was written off.Other intangibles – These intangible assets represent the value of the relationships that Citizens and Ozarks Trust had with their trust customers and Hardeman and Community First had with their insurance customers. The fair value of these intangible assets was estimated based on a combination of discounted cash flow methodology and a market valuation approach. Intangible assets for the OKSB acquisition represent mortgage servicing rights. Other intangibles established prior to the acquisitions, if applicable, were written off.Other assets – The fair value adjustment results from certain assets whose value was estimated to be more or less than book value, such as certain prepaid assets, receivables and other miscellaneous assets. Otherwise, the carrying amount of these assets was deemed to be a reasonable estimate of fair value.Deposits – The fair values used for the demand and savings deposits that comprise the transaction accounts acquired, by definition equal the amount payable on demand at the acquisition date. The Company performed a fair value analysis of the estimated weighted average interest rate of the certificates of deposits compared to the current market rates and recorded a fair value adjustment for the difference when material.Federal funds purchased and securitiesSecurities sold under agreement to repurchase– The carrying amount of federal funds purchased and securities sold under agreement to repurchase is a reasonable estimate of fair value based on the short-term nature of these liabilities.FHLB and otherOther borrowings– The fair value of Federal Home Loan Bank and other borrowings is estimated based on borrowing rates currently available to the Company for borrowings with similar terms and maturities.Subordinated debentures –The fair value of subordinated debentures is estimated based on borrowing rates currently available to the Company for borrowings with similar terms and maturities. Due to the floating rate nature of the debenture, the fair value approximates book value as of the date acquired.Accrued interest and other liabilities– The fair value adjustment results from certain liabilities whose value was estimated to be more or less than book value, such as certain accounts payable and other miscellaneous liabilities. The adjustment also establishes a liability for unfunded commitments equal to the fair value of that liability at the date of acquisition.
The carrying amount of accrued interest and the remainder of other liabilities was deemed to be a reasonable estimate of fair value.8090NOTE 3: INVESTMENT SECURITIESHeld-to-maturity (“HTM”) securities, which include any security for which the Company has both the positive intent and ability to hold until maturity, are carried at historical cost adjusted for amortization of premiums and accretion of discounts. Premiums and discounts are amortized and accreted, respectively, to interest income using the constant effective yield method over the security’s estimated life. Prepayments are anticipated for mortgage-backed and SBA securities. Premiums on callable securities are amortized to their earliest call date.Available-for-sale (“AFS”) securities, which include any security for which the Company has no immediate plan to sell but which may be sold in the future, are carried at fair value. Realized gains and losses, based on specifically identified amortized cost of the individual security, are included in other income. Unrealized gains and losses are recorded, net of related income tax effects, in stockholders’ equity, further discussed below. Premiums and discounts are amortized and accreted, respectively, to interest income using the constant effective yield method over the estimated life of the security. Prepayments are anticipated for mortgage-backed and SBA securities. Premiums on callable securities are amortized to their earliest call date.During the quarters ended June 30, 2022 and September 30, 2021, the Company transferred, at fair value, $1.99 billion and $500.8 million, respectively, of securities from the AFS portfolio to the HTM portfolio. As of December 31, 2023, the related remaining combined net unrealized losses of $126.4 million in accumulated other comprehensive income (loss) will be amortized over the remaining life of the securities. No gains or losses on these securities were recognized at the time of transfer.The amortized cost, and fair value and allowance for credit losses of investment securities that are classified as held-to-maturity (“HTM”) and available-for-sale (“AFS”)HTM are as follows: Years Ended December 31 2017 2016 (In thousands) Amortized
Cost Gross
Unrealized
Gains Gross
Unrealized
(Losses) Estimated
Fair
Value Amortized
Cost Gross
Unrealized
Gains Gross
Unrealized
(Losses) Estimated
Fair
Value Held-to-Maturity U.S. Government agencies $ 46,945 $ 7 $ (228 ) $ 46,724 $ 76,875 $ 107 $ (182 ) $ 76,800 Mortgage-backed securities 16,132 8 (287 ) 15,853 19,773 63 (249 ) 19,587 State and political subdivisions 301,491 5,962 (222 ) 307,231 362,532 4,967 (842 ) 366,657 Other securities 3,490 -- -- 3,490 2,916 -- -- 2,916 Total HTM $ 368,058 $ 5,977 $ (737 ) $ 373,298 $ 462,096 $ 5,137 $ (1,273 ) $ 465,960 Available-for-Sale U.S. Treasury $ -- $ -- $ -- $ -- $ 300 $ -- $ -- $ 300 U.S. Government agencies 141,559 116 (1,951 ) 139,724 140,005 67 (2,301 ) 137,771 Mortgage-backed securities 1,208,017 246 (20,946 ) 1,187,317 885,783 178 (17,637 ) 868,324 State and political subdivisions 144,642 532 (2,009 ) 143,165 108,374 38 (5,469 ) 102,943 Other securities 118,106 1,206 (1 ) 119,311 47,022 996 (2 ) 48,016 Total AFS $ 1,612,324 $ 2,100 $ (24,907 ) $ 1,589,517 $ 1,181,484 $ 1,279 $ (25,409 ) $ 1,157,354 Securities with limited marketability, such as stock in the Federal Reserve Bank(In thousands) Amortized Cost Allowance
for Credit LossesNet Carrying Amount Gross Unrealized
GainsGross Unrealized
(Losses)Estimated Fair
ValueHeld-to-maturity December 31, 2023 U.S. Government agencies $ 453,121 $ — $ 453,121 $ — $ (89,203) $ 363,918 Mortgage-backed securities 1,161,694 — 1,161,694 354 (107,834) 1,054,214 State and political subdivisions 1,858,680 (2,006) 1,856,674 284 (369,509) 1,487,449 Other securities 256,007 (1,208) 254,799 — (25,010) 229,789 Total HTM $ 3,729,502 $ (3,214) $ 3,726,288 $ 638 $ (591,556) $ 3,135,370 December 31, 2022 U.S. Government agencies $ 448,012 $ — $ 448,012 $ — $ (102,558) $ 345,454 Mortgage-backed securities 1,190,781 — 1,190,781 227 (118,960) 1,072,048 State and political subdivisions 1,861,102 (110) 1,860,992 56 (446,198) 1,414,850 Other securities 261,199 (1,278) 259,921 — (29,040) 230,881 Total HTM $ 3,761,094 $ (1,388) $ 3,759,706 $ 283 $ (696,756) $ 3,063,233 Mortgage-backed securities (“MBS”) are commercial MBS, secured by commercial properties, and the Federal Home Loan Bank, are carried at cost and are reported as other AFSresidential MBS, generally secured by single-family residential properties. All mortgage-backed securities included in the table above.Certainabove were issued by U.S. government agencies or corporations. As of December 31, 2023, HTM MBS consisted of $141.6 million and $1.02 billion of commercial MBS and residential MBS, respectively. As of December 31, 2022, HTM MBS consisted of $149.2 million and $1.04 billion of commercial MBS and residential MBS, respectively.91The amortized cost, fair value and allowance for credit losses of investment securities that are valued at less than their historical cost. Total fair valueclassified as AFS are as follows:(In thousands) Amortized
CostAllowance for Credit Losses Gross Unrealized
GainsGross Unrealized
(Losses)Estimated Fair
ValueAvailable-for-sale December 31, 2023 U.S. Treasury $ 2,285 $ — $ — $ (31) $ 2,254 U.S. Government agencies 74,460 — 35 (1,993) 72,502 Mortgage-backed securities 2,138,652 — 8 (198,353) 1,940,307 State and political subdivisions 1,035,147 — 187 (132,541) 902,793 Other securities 259,165 — — (24,868) 234,297 Total AFS $ 3,509,709 $ — $ 230 $ (357,786) $ 3,152,153 December 31, 2022 U.S. Treasury $ 2,257 $ — $ — $ (60) $ 2,197 U.S. Government agencies 191,498 — 103 (7,322) 184,279 Mortgage-backed securities 2,809,319 — 20 (266,437) 2,542,902 State and political subdivisions 1,056,124 — 250 (185,300) 871,074 Other securities 272,215 — — (19,813) 252,402 Total AFS $ 4,331,413 $ — $ 373 $ (478,932) $ 3,852,854 All mortgage-backed securities included in the table above were issued by U.S. government agencies or corporations. As of these investmentsDecember 31, 2023, AFS MBS consisted of $710.1 million and $1.23 billion of commercial MBS and residential MBS, respectively. As of December 31, 2022, AFS MBS consisted of $1.07 billion and $1.47 billion of commercial MBS and residential MBS, respectively.Accrued interest receivable on HTM and AFS securities at December 31, 20172023 was $20.6 million and 2016, was $1.4 billion$24.7 million, respectively, and $1.2 billion, which is approximately 73.5% and 75.7%, respectively,included in interest receivable on the consolidated balance sheets. The Company has made the election to exclude all accrued interest receivable from securities from the estimate of the Company’s combined AFS and HTM investment portfolios.
credit losses.81The following table shows the gross unrealized losses and fair value ofsummarizes the Company’s AFS investments within an unrealized losses,loss position for which an allowance for credit loss has not been recorded as of December 31, 2023, aggregated by investment category and length of time that individual securities have been in a continuous unrealized loss position: Less Than 12 Months 12 Months or More Total (In thousands) Estimated
Fair
ValueGross
Unrealized
LossesEstimated
Fair
ValueGross
Unrealized
LossesEstimated
Fair
ValueGross
Unrealized
LossesAvailable-for-sale U.S. Treasury $ — $ — $ 2,254 $ (31) $ 2,254 $ (31) U.S. Government agencies 8,614 (39) 59,732 (1,954) 68,346 (1,993) Mortgage-backed securities 9,182 (135) 1,930,105 (198,218) 1,939,287 (198,353) State and political subdivisions 3,050 (163) 869,379 (132,378) 872,429 (132,541) Other securities 11,016 (2,654) 223,025 (22,214) 234,041 (24,868) Total AFS $ 31,862 $ (2,991) $ 3,084,495 $ (354,795) $ 3,116,357 $ (357,786) As of December 31, 2023, the Company’s investment portfolio included $3.15 billion of AFS securities, of which $3.12 billion, or 98.9%, were in an unrealized loss position at: Less Than 12 Months 12 Months or More Total (In thousands) Estimated
Fair
Value Gross
Unrealized
Losses Estimated
Fair
Value Gross
Unrealized
Losses Estimated
Fair
Value Gross
Unrealized
LossesDecember 31, 2017 Held-to-Maturity U.S. Government agencies $ 11,961 $ 6 $ 32,778 $ 222 $ 44,739 $ 228 Mortgage-backed securities 5,471 47 8,946 240 14,417 287 State and political subdivisions 40,299 198 1,887 24 42,186 222 Total HTM $ 57,731 $ 251 $ 43,611 $ 486 $ 101,342 $ 737 Available-for-Sale U.S. Government agencies $ 91,988 $ 921 $ 25,742 $ 1,030 $ 117,730 $ 1,951 Mortgage-backed securities 510,770 4,516 609,329 16,430 1,120,099 20,946 State and political subdivisions 25,049 202 75,404 1,807 100,453 2,009 Other securities -- -- 99 1 99 1 Total AFS $ 627,807 $ 5,639 $ 710,574 $ 19,268 $ 1,338,381 $ 24,907 December 31, 2016 Held-to-Maturity U.S. Government agencies $ 32,859 $ 141 $ 19,959 $ 41 $ 52,818 $ 182 Mortgage-backed securities 11,833 205 1,465 44 13,298 249 State and political subdivisions 104,974 841 330 1 105,304 842 Total HTM $ 149,666 $ 1,187 $ 21,754 $ 86 $ 171,420 $ 1,273 Available-for-Sale U.S. Government agencies $ 126,325 $ 2,301 $ -- $ -- $ 126,325 $ 2,301 Mortgage-backed securities 833,393 17,637 -- -- 833,393 17,637 State and political subdivisions 94,922 5,469 -- -- 94,922 5,469 Other securities 99 2 -- -- 99 2 Total AFS $ 1,054,739 $ 25,409 $ -- $ -- $ 1,054,739 $ 25,409 These declines primarily resulted fromthat are not deemed to have credit losses. A portion of the unrealized losses were related to the Company’s MBS, which are issued and guaranteed by U.S. government-sponsored entities and agencies, and the Company’s state and political subdivision securities, specifically investments in insured fixed rate municipal bonds for thesewhich the issuers continue to make timely principal and interest payments under the contractual terms of the securities.92Furthermore, the decline in fair value for each of the above AFS securities is attributable to the rates for those investments yielding less than current market rates. Based on evaluation of available evidence, management believes the declines in fair value for these securities are temporary. Management does not have the intent to sell these securities and management believes it is more likely than not the Company will not have to sell these securities before recovery of their amortized cost basis less any current period credit losses.Declines in the fair value of HTM and AFS securities below their cost that are deemed to be other than temporary are reflected in earnings as realized losses. In estimating other-than-temporary impairment losses, management considers, among other things, (i) the length of time and the extent to which the fair value has been less than cost, (ii) the financial condition and near-term prospects of the issuer, and (iii) the intent and ability of the Company to retain its investment in the issuer for a period of time sufficient to allow for any anticipated recovery in fair value.82Management has the ability and intent to hold the securities classified as HTM until they mature, at which time the Company expects to receive full value for the securities. Furthermore, as of December 31, 2017, management also had the ability and intent to hold the securities classified as AFS for a period of time sufficient for a recovery of cost. The unrealized losses are largely due to increases in market interest rates over the yields available at the time the underlying securities were purchased. The fair value is expected to recover as the bonds approach their maturity date or repricing date or if market yields for such investments decline. Management does not believe any of the securities are impaired due to reasons of credit quality. Management believes the declines in fair value for the securities are temporary. Management does not have the immediate intent to sell the securities, and management believes the accounting standard of “more likely than not” has not been met regarding whether the Company would be required to sell any of the AFS securities before recovery of amortized cost.Allowance for Credit LossesAll MBS held by the Company are issued by U.S. government-sponsored entities and agencies. These securities are either explicitly or implicitly guaranteed by the U.S. government, are highly rated by major rating agencies and have a long history of no credit losses. Accordingly, no allowance for credit losses has been recorded for these securities.Regarding securities issued by state and political subdivisions and other HTM securities, the adequacy of the reserve for credit loss is determined quarterly based on methodology similar to the methodology for determining the allowance for credit losses on loans. The methodology considers, but is not limited to: (i) issuer bond ratings, (ii) issuer geography, (iii) whether issuers continue to make timely principal and interest payments under the contractual terms of the securities, (iv) probability-weighted multiple scenario forecasts, and (v) the issuers’ size.The following table details activity in the allowance for credit losses by investment security type for the years ended December 31, 2023 and 2022 on the Company’s HTM and AFS securities held.(In thousands) State and Political Subdivisions Other Securities Total December 31, 2023 Held-to-maturity Beginning balance, January 1, 2023 $ 110 $ 1,278 $ 1,388 Provision for credit loss expense 824 1,002 1,826 Net increase (decrease) in allowance on previously impaired securities 1,072 (1,072) — Ending balance, December 31, 2023 $ 2,006 $ 1,208 $ 3,214 Available-for-sale Beginning balance, January 1, 2023 $ — $ — $ — Provision for credit loss expense — 12,800 12,800 Reduction due to sales — (2,078) (2,078) Securities charged-off — (7,000) (7,000) Net decrease in allowance on previously impaired securities — (3,722) (3,722) Ending balance, December 31, 2023 $ — $ — $ — December 31, 2022 Held-to-maturity Beginning balance, January 1, 2022 $ 1,197 $ 82 $ 1,279 Provision for credit loss expense — — — Net increase (decrease) in allowance on previously impaired securities (1,180) 1,180 — Recoveries 93 16 109 Ending balance, December 31, 2022 $ 110 $ 1,278 $ 1,388 Based upon the Company’s analysis of the underlying risk characteristics of its AFS portfolio, including credit ratings and other qualitative factors, as previously discussed, the provision for credit losses related to AFS securities recorded during the twelve months ended December 31, 2023 was $9.1 million. During the year ended December 31, 2023, the Company charged-off $7.0 million directly related to one corporate bond which was deemed uncollectible during the period. There was no provision for credit losses related to AFS securities recorded during the year ended December 31, 2022.93The following table summarizes bond ratings for the Company’s HTM portfolio issued by state and political subdivisions and other securities as of December 31, 2017, management believes the impairments detailed2023:State and Political Subdivisions (In thousands) Not Guaranteed or Pre-Refunded Other Credit Enhancement or Insurance Pre-Refunded Total Other Securities Aaa/AAA $ 179,585 $ 299,910 $ — $ 479,495 $ — Aa/AA 635,749 524,037 — 1,159,786 — A 46,932 161,189 — 208,121 102,393 Baa/BBB — 4,376 — 4,376 153,614 Not Rated 6,902 — — 6,902 — Total $ 869,168 $ 989,512 $ — $ 1,858,680 $ 256,007 Historical loss rates associated with securities having similar grades as those in the table aboveCompany’s portfolio have generally not been significant. Pre-refunded securities, if any, have been defeased by the issuer and are temporary. Shouldfully secured by cash and/or U.S. Treasury securities held in escrow for payment to holders when the impairmentunderlying call dates of anythe securities are reached. Securities with other credit enhancement or insurance continue to make timely principal and interest payments under the contractual terms of the securities. Accordingly, no allowance for credit losses has been recorded for these securities become other than temporary, the cost basisas there is no current expectation of the investment will be reduced and the resulting loss recognized in net income in the period the other-than-temporary impairment is identified.Income earned on securities for the years ended December 31, 2017, 20162023, 2022 and 2015,2021, is as follows:(In thousands) 2017 2016 2015 (In thousands) 2023 2022 2021 Taxable Taxable: Taxable: Held-to-maturity $ 2,521 $ 3,778 $ 5,162 Available-for-sale 25,996 17,928 12,129 Non-taxable Non-taxable: Non-taxable: Non-taxable: Held-to-maturity Held-to-maturity Held-to-maturity 8,693 10,641 11,635 Available-for-sale 2,905 1,132 1,687 Total $ 40,115 $ 33,479 $ 30,613 The amortized cost and estimated fair value by maturity of securities are shown in the following table.table as of December 31, 2023. Securities are classified according to their contractual maturities without consideration of principal amortization, potential prepayments or call options. Accordingly, actual maturities may differ from contractual maturities. Held-to-Maturity Available-for-Sale Held-to-Maturity Available-for-Sale (In thousands) Amortized
Cost Fair
Value Amortized
Cost Fair Value (In thousands) Amortized
CostFair
ValueAmortized
CostFair
Value One year or less $ 46,377 $ 46,255 $ 590 $ 591 After one through five years 85,451 85,581 35,616 35,246 After five through ten years 92,361 93,400 24,203 23,953 After ten years 127,737 132,209 225,892 223,198 Securities not due on a single maturity date 16,132 15,853 1,208,017 1,187,317 Other securities (no maturity) -- -- 118,006 119,212 Total $ 368,058 $ 373,298 $ 1,612,324 $ 1,589,517 The carrying value, which approximates the fair value, of securities pledged as collateral, to secure public deposits and for other purposes, amounted to $1.2$3.32 billion at December 31, 20172023 and $915.2 million$3.96 billion at December 31, 2016.94The Company sold approximately $247.9 million of investment securities during 2023 and approximately $342.6 million of investment securities during 2021. No securities were sold during 2022. Securities sold in 2023 were in large part related to a strategic decision by the Company to sell low yield securities and use the proceeds to pay off higher rate wholesale fundings, including both brokered deposits and Federal Home Loan Bank (“FHLB”) advances, while the securities sold during 2021 were part of a strategic plan to realize gains on securities with projected calls within the short-term period. The net losses on the sale and call of securities in 2023 and 2022 as compared to 2021 reflect the rising interest rate environment experienced over the comparative period. There were $2.4 million ofno gross realized gains and $1.3approximately $20.6 million of gross realized losses from the sale of securities during the year ended December 31, 2017.2023. There were $5.8approximately $46,000 of gross realized gains and $324,000 of gross realized losses from the call of securities during the year ended December 31, 2022. There were approximately $15.9 million of gross realized gains and no$422,000 of gross realized losses from the sale of securities during the year ended December 31, 2016. There were $350,000 of gross realized gains and $43,000 of realized losses from the sale of securities during the year ended December 31, 2015.2021. The income tax expense/benefit related to security gains/losses was 39.225%26.135% of the gross amounts.The stateCompany has entered into various fair value hedging transactions to mitigate the impact of changing interest rates on the fair value of AFS securities. See Note 21, Derivative Instruments, for disclosure of the gains and political subdivision debt obligations are predominately non-rated bonds representing small issuances, primarily in Arkansas, Missouri, Oklahoma, Tennesseelosses recognized on derivative instruments and Texas issues, which are evaluated on an ongoing basis.
the cumulative fair value hedging adjustments to the carrying amount of the hedged securities.83NOTE 4: OTHER ASSETS AND OTHER LIABILITIES HELD FOR SALEIllinois Branch SaleIn August 2017,On November 30, 2020, Simmons Bank entered into a Branch Purchase and Assumption Agreement (the “Citizens Equity Agreement”) with Citizens Equity First Credit Union (“CEFCU”).On March 12, 2021, CEFCU completed its purchase of certain assets and assumption of certain liabilities (the “Illinois Branch Sale”) associated with four Simmons Bank locations in the Metro East area of Southern Illinois, near St. Louis (collectively, the “Illinois Branches”). Pursuant to the terms of the Citizens Equity Agreement, CEFCU assumed certain deposit liabilities and acquired certain loans, as well as cash, personal property and other fixed assets associated with the Illinois Branches. The loan and deposit balances of the Illinois Branches were $354,000 and $137.9 million, respectively.During 2021, the Company through its bank subsidiary, Simmons Bank,recognized a gain on sale of $5.3 million related to the Illinois Branches.Spirit AcquisitionIn connection with the acquisition of Spirit, the Company acquired the stocka portfolio of Heartland Bank at a public auction to satisfy certain indebtedness of its holding company, Rock Bancshares, Inc. The Company has $165.8 million of other assetsloans which were identified as held for sale and $157.4by the acquired bank prior to the completion of the acquisition. These loans were valued at $35.2 million, net of fair value discounts, at the date of acquisition with no remaining balance as of December 31, 2022.As of December 31, 2023, there were no outstanding other assets and other liabilities held for sale, at fair value at December 31, 2017.In December 2017, Heartland Bank announced the sale of the majority of its branches, as well as all of its deposits, to Relyance Bank, N.A. The completion of the transaction is contingent on the approval of regulatory agencies and the satisfaction of other conditions set forth in the purchase and assumption agreement. The transaction is expected to close in March 2018 and the Company will continue to work through the disposition of Heartland Bank’s remaining assets and expects to be complete within one year of the acquisition.The following is a description of the methods used to determine the purchase price allocation for fair values of significant assets and liabilities presented in the Heartland Bank transaction.Cash and due from banks, time deposits due from banks and federal funds sold – The carrying amount of these assets is a reasonable estimate of fair value based on the short-term nature of these assets.Investment securities – The carrying amount of these assets was deemed to be a reasonable estimate of fair value, as there were no material differences to fair value based upon quoted market prices.Loans acquired – Fair values for loans were based on a discounted cash flow methodology that considered factors including the type of loan and related collateral, classification status, fixed or variable interest rate, term of loan and whether or not the loan was amortizing, and current discount rates. The discount rates used for loans are based on current market rates for new originations of comparable loans and include adjustments for liquidity concerns. The discount rate does not include a factor for credit losses as that has been included in the estimated cash flows. Loans were grouped together according to similar characteristics and were treated in the aggregate when applying various valuation techniques.Premises and equipment – Bank premises and equipment were acquired with an adjustment to fair value, which represents the difference between the Company’s current analysis of property and equipment values completed in connection with the acquisition and book value acquired.Core deposit intangible – This intangible asset represents the value of the relationships that Heartland Bank had with its deposit customers. The fair value of this intangible asset was estimated based on a discounted cash flow methodology that gave appropriate consideration to expected customer attrition rates, cost of the deposit base and the net maintenance cost attributable to customer deposits.Deposits – The fair values used for the demand and savings deposits that comprise the transaction accounts acquired, by definition equal the amount payable on demand at the acquisition date. The Company performed a fair value analysis of the estimated weighted average interest rate of the certificates of deposits compared to the current market rates and determined the difference was not material.
sale.8495NOTE 5:LOANS AND ALLOWANCE FOR LOANCREDIT LOSSESAt December 31, 2017,2023, the Company’s loan portfolio was $10.78$16.85 billion, compared to $5.63$16.14 billion at December 31, 2016.2022. The various categories of loans are summarized as follows:(In thousands) 2017 2016 (In thousands) 2023 2022 Consumer: Consumer: Credit cards $ 185,422 $ 184,591 Other consumer 280,094 303,972 Total consumer 465,516 488,563 Real estate: Construction 614,155 336,759 Construction and development Construction and development Construction and development Single family residential 1,094,633 904,245 Other commercial 2,530,824 1,787,075 Total real estate 4,239,612 3,028,079 Commercial: Commercial 825,217 639,525 Commercial Commercial Agricultural 148,302 150,378 Total commercial 973,519 789,903 Other 26,962 20,662 Loans 5,705,609 4,327,207 Loans acquired, net of discount and allowance (1) 5,074,076 1,305,683 Total loans $ 10,779,685 $ 5,632,890 ______________________ (1)See Note 6, Loans Acquired, for segregation of loans acquired by loan class.The above table presents total loans at amortized cost. The difference between amortized cost and unpaid principal balance is primarily premiums and discounts associated with acquisition date fair value adjustments on acquired loans as well as deferred origination costs and fees totaling $6.7 million and $26.4 million at December 31, 2023 and 2022, respectively.Accrued interest on loans, which is excluded from the amortized cost of loans held for investment, totaled $77.1 million and $65.4 million at December 31, 2023 and 2022, respectively, and is included in interest receivable on the consolidated balance sheets.Loan Origination/Risk Management – The Company seeks to manage its credit risk by diversifying its loan portfolio, determining that borrowers have adequate sources of cash flow for loan repayment without liquidation of collateral; obtaining and monitoring collateral; and providing an adequate allowance for loanscredit losses by regularly reviewing loans through the internal loan review process. The loan portfolio is diversified by borrower, purpose and industry. The Company seeks to use diversification within the loan portfolio to reduce its credit risk, thereby minimizing the adverse impact on the portfolio if weaknesses develop in either the economy or a particular segment of borrowers. Collateral requirements are based on credit assessments of borrowers and may be used to recover the debt in case of default. Furthermore, a factor that influenced the Company’s judgment regarding the allowance for loan losses consists of a eight-year historical loss average segregated by each primary loan sector. On an annual basis, historical loss rates are calculated for each sector.Consumer – The consumer loan portfolio consists of credit card loans and other consumer loans. Credit card loans are diversified by geographic region to reduce credit risk and minimize any adverse impact on the portfolio. Although they are regularly reviewed to facilitate the identification and monitoring of creditworthiness, credit card loans are unsecured loans, making them more susceptible to be impacted by economic downturns resultingthat result in increasingincreased unemployment. Other consumer loans include direct and indirect installment loans and account overdrafts. Loans in this portfolio segment are sensitive to unemployment and other key consumer economic measures.Real estate – The real estate loan portfolio consists of construction and development loans (“C&D”), single family residential loans and commercial loans. Construction and development loans (“C&D”)&D and commercial real estate loans (“CRE”) loans can be particularly sensitive to valuation of real estate. Commercial real estateCRE cycles are inevitable. The long planning and production process for new properties and rapid shifts in business conditions and employment create an inherent tension between supply and demand for commercial properties. While general economic trends often move individual markets in the same direction over time, the timing and magnitude of changes are determined by other forces unique to each market. CRE cycles tend to be local in nature and longer than other credit cycles. Factors influencing the CRE market are traditionally different from those affecting residential real estate markets; thereby making predictions for one market based on the other difficult. Additionally, submarkets within commercial real estateCRE – such as office, industrial, apartment, retail and hotel – also experience different cycles, providing an opportunity to lower the overall risk through diversification across types of CRE loans. Management realizes that local demand and supply conditions will also mean that different geographic areas will experience cycles of different amplitude and length. The Company monitors these loans closely. 96Commercial – The commercial loan portfolio includes commercial and agricultural loans, representing loans to commercial customers and farmers for use in normal business or farming operations to finance working capital needs, equipment purchases or other expansion projects. Paycheck Protection Program (“PPP”) loans are also included in the commercial loan portfolio. Collection risk in this portfolio is driven by the creditworthiness of the underlying borrowers, particularly cash flow from customers’ business or farming operations. The Company continues its efforts to keep loan terms short, reducing the negative impact of upward movement in interest rates. Term loans are generally set up with one or three year balloons, and the Company has instituted a pricing mechanism for commercial loans. It is standard practice to require personal guaranties on commercial loans for closely-held or limited liability entities.85Paycheck Protection Program Loans - The Company originated loans pursuant to multiple PPP appropriations of the Coronavirus Aid, Relief and Economic Security Act which provided 100% federally guaranteed loans for small businesses to cover up to 24 weeks of payroll costs and assistance with mortgage interest, rent and utilities. Notably, these small business loans may be forgiven by the SBA if borrowers maintain their payrolls and satisfy certain other conditions. PPP loans have a zero percent risk-weight for regulatory capital ratios. As of December 31, 2023 and 2022, the total outstanding balance of PPP loans was $4.8 million and $8.9 million, respectively.Other – The other loan portfolio includes mortgage warehouse loans, representing warehouse lines of credit to mortgage originators for the disbursement of newly originated 1-4 family residential loans. Also included in the other loan portfolio are loans to public sector customers, including state and local governments.Nonaccrual and Past Due Loans – Loans are considered past due if the required principal and interest payments have not been received as of the date such payments were due. Loans are placed on nonaccrual status when, in management’s opinion, the borrower may be unable to meet payment obligations as they become due, as well as when required by regulatory provisions. Loans may be placed on nonaccrual status regardless of whether or not such loans are considered past due. When interest accrual is discontinued, all unpaid accrued interest is reversed. Interest income is subsequently recognized only to the extent cash payments are received in excess of principal due. Loans are returned to accrual status when all the principal and interest amounts contractually due are brought current and future payments are reasonably assured.NonaccrualThe amortized cost basis of nonaccrual loans excluding loans acquired, at December 31, 2017 and 2016, segregated by class of loans are as follows:(In thousands) 2017 2016 Consumer: Credit cards $ 170 $ 373 Other consumer 4,605 1,793 Total consumer 4,775 2,166 Real estate: Construction 2,242 3,411 Single family residential 13,431 12,139 Other commercial 16,054 12,385 Total real estate 31,727 27,935 Commercial: Commercial 6,980 7,765 Agricultural 2,160 1,238 Total commercial 9,140 9,003 Total $ 45,642 $ 39,104 86(In thousands) 2023 2022 Consumer: Credit cards $ 487 $ 349 Other consumer 589 433 Total consumer 1,076 782 Real estate: Construction and development 2,457 2,799 Single family residential 27,209 22,319 Other commercial 11,960 14,998 Total real estate 41,626 40,116 Commercial: Commercial 39,886 17,356 Agricultural 734 177 Total commercial 40,620 17,533 Other 3 3 Total $ 83,325 $ 58,434 As of December 31, 2023 and 2022, nonaccrual loans for which there was no related allowance for credit losses had an amortized cost of $3.2 million and $16.9 million, respectively. These loans are individually assessed and do not hold an allowance due to being adequately collateralized under the collateral-dependent valuation method.97An age analysis of the amortized cost basis of past due loans, excludingincluding nonaccrual loans, acquired, segregated by class of loans is as follows:(In thousands) Gross
30-89 Days
Past Due 90 Days
or More
Past Due Total
Past Due Current Total
Loans 90 Days
Past Due &
Accruing December 31, 2017 Consumer: Credit cards $ 707 $ 672 $ 1,379 $ 184,043 $ 185,422 $ 332 Other consumer 5,009 3,298 8,307 271,787 280,094 10 Total consumer 5,716 3,970 9,686 455,830 465,516 342 Real estate: Construction 411 1,210 1,621 612,534 614,155 -- Single family residential 8,071 6,460 14,531 1,080,102 1,094,633 1 Other commercial 2,388 8,031 10,419 2,520,405 2,530,824 -- Total real estate 10,870 15,701 26,571 4,213,041 4,239,612 1 Commercial: Commercial 1,523 6,125 7,648 817,569 825,217 -- Agricultural 50 2,120 2,170 146,132 148,302 Total commercial 1,573 8,245 9,818 963,701 973,519 -- Other -- -- -- 26,962 26,962 -- Total $ 18,159 $ 27,916 $ 46,075 $ 5,659,534 $ 5,705,609 $ 343 December 31, 2016 Consumer: Credit cards $ 716 $ 275 $ 991 $ 183,600 $ 184,591 $ 275 Other consumer 3,786 1,027 4,813 299,159 303,972 11 Total consumer 4,502 1,302 5,804 482,759 488,563 286 Real estate: Construction 1,420 1,246 2,666 334,093 336,759 -- Single family residential 6,310 5,927 12,237 892,008 904,245 14 Other commercial 4,212 6,722 10,934 1,776,141 1,787,075 -- Total real estate 11,942 13,895 25,837 3,002,242 3,028,079 14 Commercial: Commercial 2,040 5,296 7,336 632,189 639,525 -- Agricultural 121 1,215 1,336 149,042 150,378 -- Total commercial 2,161 6,511 8,672 781,231 789,903 -- Other -- -- -- 20,662 20,662 -- Total $ 18,605 $ 21,708 $ 40,313 $ 4,286,894 $ 4,327,207 $ 300 Impaired Loans – A(In thousands) Gross
30-89 Days
Past Due90 Days
or More
Past DueTotal
Past DueCurrent Total
Loans90 Days
Past Due &
AccruingDecember 31, 2023 Consumer: Credit cards $ 1,734 $ 892 $ 2,626 $ 188,578 $ 191,204 $ 791 Other consumer 1,471 216 1,687 125,775 127,462 — Total consumer 3,205 1,108 4,313 314,353 318,666 791 Real estate: Construction and development 3,171 2,190 5,361 3,138,859 3,144,220 — Single family residential 30,697 12,522 43,219 2,598,337 2,641,556 7 Other commercial 4,702 3,612 8,314 7,544,096 7,552,410 — Total real estate 38,570 18,324 56,894 13,281,292 13,338,186 7 Commercial: Commercial 13,799 22,750 36,549 2,453,627 2,490,176 349 Agricultural 92 516 608 232,102 232,710 — Total commercial 13,891 23,266 37,157 2,685,729 2,722,886 349 Other — 3 3 465,929 465,932 — Total $ 55,666 $ 42,701 $ 98,367 $ 16,747,303 $ 16,845,670 $ 1,147 December 31, 2022 Consumer: Credit cards $ 1,297 $ 409 $ 1,706 $ 195,222 $ 196,928 $ 225 Other consumer 852 214 1,066 151,816 152,882 — Total consumer 2,149 623 2,772 347,038 349,810 225 Real estate: Construction and development 4,677 443 5,120 2,561,529 2,566,649 — Single family residential 23,625 11,075 34,700 2,511,415 2,546,115 106 Other commercial 2,759 7,100 9,859 7,458,639 7,468,498 — Total real estate 31,061 18,618 49,679 12,531,583 12,581,262 106 Commercial: Commercial 5,034 7,575 12,609 2,619,681 2,632,290 176 Agricultural 111 67 178 205,445 205,623 — Total commercial 5,145 7,642 12,787 2,825,126 2,837,913 176 Other 61 3 64 373,075 373,139 — Total $ 38,416 $ 26,886 $ 65,302 $ 16,076,822 $ 16,142,124 $ 507 98Loan Modifications to Borrowers Experiencing Financial DifficultyThe Company has internal loan is considered impaired when it is probable that themodification programs for borrowers experiencing financial difficulties. Modifications to borrowers experiencing financial difficulties may include interest rate reductions, principal or interest forgiveness and/or term extensions. The Company will not receive all amounts due according to the contractual termsprimarily uses interest rate reduction and/or payment modifications or extensions, with an occasional forgiveness of principal.The following table presents a summary of the loans, including scheduled principal and interest payments. This includes loans that are delinquent 90 days or more, nonaccrualamortized cost basis of loan modifications granted to borrowers experiencing financial difficulty, segregated by class of loans and certain othertype of loan modification, for the year ended December 31, 2023.Percent of Percent of Total Class Total Class (Dollars in thousands) Rate Reduction of Loans Term Extension of Loans Real estate: Single family residential $ 79 — % $ — — % Other commercial — — % 30,493 0.40 % Total real estate 79 30,493 Commercial: Commercial — — % 746 0.03 % Total commercial — 746 Total $ 79 $ 31,239 The financial effects of the modified loans identified by management. Certain other loans identified by management consist of performing loans with specific allocationsmade to borrowers experiencing financial difficulty in the single family residential real estate and commercial portfolio were not significant during the year ended December 31, 2023 and did not significantly impact the Company’s determination of the allowance for credit losses on loans during the year.During the year ended December 31, 2023, the Company modified one loan losses. Impairedfor a borrower experiencing financial difficulty related to the CRE portfolio, whereby the modification allowed for two months of interest only payments with the remaining balance due at maturity. Upon modification, a charge-off of $9.6 million was recorded in relation to this modified loan during 2023. As a result of this CRE loan modified during the year ended December 31, 2023 being collateral-dependent, the impact to the Company’s allowance for credit losses on loans are carried atwas the present value of estimated future cash flows using the loan’s existing rate, ordifference between the fair value of the underlying collateral, ifadjusted for selling costs, and the loan is collateral dependent. Impairment is evaluated in total for smaller-balance loansremaining outstanding principal balance of a similar nature and on an individual loan basis for other loans. Impaired loans, or portions thereof, are charged-off when deemed uncollectible.
the loan.87Impaired loans, net of government guarantees and excluding loans acquired, segregated by classThe Company closely monitors the performance of loans that are modified to borrowers experiencing financial difficulty. Loans modified during the year ended December 31, 2023 were all current at December 31, 2023, with no loans in past due status. Additionally, there were no modified loans for which a payment default occurred during the year ended December 31, 2023 and were modified within twelve months prior to default. In relation to loans modified to borrowers experiencing financial difficulty, the Company defines a payment default as follows:a payment received more than 90 days after its due date.(In thousands) Unpaid
Contractual
Principal
Balance Recorded
Investment
With No
Allowance Recorded
Investment
With
Allowance Total
Recorded
Investment Related
Allowance Average
Investment in
Impaired
Loans Interest
Income
Recognized December 31, 2017 Consumer: Credit cards $ 170 $ 170 $ -- $ 170 $ -- $ 268 $ 47 Other consumer 4,755 4,605 -- 4,605 -- 3,089 106 Total consumer 4,925 4,775 -- 4,775 -- 3,357 153 Real estate: Construction 2,522 1,347 895 2,242 249 2,711 93 Single family residential 14,347 12,725 706 13,431 53 12,904 443 Other commercial 22,308 6,732 9,133 15,865 36 18,624 639 Total real estate 39,177 20,804 10,734 31,538 338 34,239 1,175 Commercial: Commercial 9,954 4,306 2,269 6,575 -- 11,670 400 Agricultural 3,278 1,035 -- 1,035 -- 1,522 52 Total commercial 13,232 5,341 2,269 7,610 -- 13,192 452 Total $ 57,334 $ 30,920 $ 13,003 $ 43,923 $ 338 $ 50,788 $ 1,780 December 31, 2016 Consumer: Credit cards $ 373 $ 373 $ -- $ 373 $ -- $ 346 $ 20 Other consumer 1,836 1,797 3 1,800 1 1,066 47 Total consumer 2,209 2,170 3 2,173 1 1,412 67 Real estate: Construction 4,275 1,038 2,374 3,412 156 4,436 196 Single family residential 12,970 10,630 1,753 12,383 162 9,486 419 Other commercial 20,993 6,891 7,315 14,206 99 14,932 659 Total real estate 38,238 18,559 11,442 30,001 417 28,854 1,274 Commercial: Commercial 11,848 2,734 7,573 10,307 262 4,666 206 Agricultural 2,226 1,215 -- 1,215 -- 1,046 46 Total commercial 14,074 3,949 7,573 11,522 262 5,712 252 Total $ 54,521 $ 24,678 $ 19,018 $ 43,696 $ 680 $ 35,978 $ 1,593 At December 31, 2017,2023 and 2022, the Company had $2.5 million and $3.0 million, respectively, of consumer mortgage loans secured by residential real estate properties for which formal foreclosure proceedings are in process. At December 31, 2016, impaired loans, net2023 and 2022, the Company had $506,000 and $853,000, respectively, of government guarantees and excluding loans acquired, totaled $43.9 million and $43.7 million, respectively. AllocationsOREO secured by residential real estate properties.Troubled Debt Restructurings (Prior to the adoption of the allowance for loan losses relative to impaired loans were $338,000 and $680,000 at December 31, 2017 and 2016, respectively. Approximately $1.8 million, $1.6 million and $1.2 million of interest income was recognized on average impaired loans of $50.8 million, $36.0 million and $16.7 million for 2017, 2016 and 2015, respectively. Interest recognized on impaired loans on a cash basis during 2017, 2016 and 2015 was not material.Included in certain impaired loan categories are troubled debt restructurings (“TDRs”). ASU 2022-02)When the Company restructuresrestructured a loan to a borrower that iswas experiencing financial difficulty and grantsgranted a concession that it would not otherwise consider, a “troubled debt restructuring” results(“TDR”) resulted, and the Company classifiesclassified the loan as a TDR. The Company grantsgranted various types of concessions, primarily interest rate reduction and/or payment modifications or extensions, with an occasional forgiveness of principal.Under ASC Topic 310-10-35 – Subsequent Measurement, a TDR is considered to be impaired, and an impairment analysis must be performed. The Company assesses the exposure for each modification, either by collateral discounting or by calculation of the present value of future cash flows, and determines if a specific allocation to the allowance for loan losses is needed.88Once an obligation has beenwas restructured because of such credit problems, it continuescontinued to be considered a TDR until paid in full; or, if an obligation yieldsyielded a market interest rate and no longer has any concession regarding payment amount or amortization, then it iswas not considered a TDR at the beginning of the calendar year after the year in which the improvement takeshad taken place. The Company returnsreturned TDRs to accrual status only if (1) all contractual amounts due canwere reasonably be expected to be repaid within a prudent period and (2) repayment has beenwas in accordance with the contract for a sustained period, typically at least six months.99TDRs were individually evaluated for expected credit losses. The Company assessed the exposure for each modification, either by the fair value of the underlying collateral or the present value of expected cash flows, and determined if a specific allowance for credit losses was needed.The following table presents a summary of troubled debt restructurings, excluding loans acquired,TDRs segregated by class of loans. Accruing TDR Loans Nonaccrual TDR Loans Total TDR Loans (Dollars in thousands) Number Balance Number Balance Number Balance December 31, 2017 Real estate: Construction -- $ -- $ 1 $ 420 $ 1 $ 420 Single-family residential 4 141 15 954 19 1,095 Other commercial 4 4,322 5 3,712 9 8,034 Total real estate 8 4,463 21 5,086 29 9,549 Commercial: Commercial 5 2,644 6 745 11 3,389 Total commercial 5 2,644 6 745 11 3,389 Total 13 $ 7,107 27 $ 5,831 40 $ 12,938 December 31, 2016 Consumer: Other consumer -- $ -- 1 $ 3 1 $ 3 Total consumer -- -- 1 3 1 3 Real estate: Construction -- -- 1 18 1 18 Single-family residential 3 167 29 2,078 32 2,245 Other commercial 23 9,048 2 780 25 9,828 Total real estate 26 9,215 32 2,876 58 12,091 Commercial: Commercial 15 1,783 5 297 20 2,080 Total commercial 15 1,783 5 297 20 2,080 Total 41 $ 10,998 38 $ 3,176 79 $ 14,174
loans as of December 31, 2022.89 Accruing TDR Loans Nonaccrual TDR Loans Total TDR Loans (Dollars in thousands) Number Balance Number Balance Number Balance December 31, 2022 Real estate: Single-family residential 24 $ 1,849 12 $ 1,589 36 $ 3,438 Total real estate 24 1,849 12 1,589 36 3,438 Commercial: Commercial — — 1 33 1 33 Total commercial — — 1 33 1 33 Total 24 $ 1,849 13 $ 1,622 37 $ 3,471 The following table presents loans that were restructured as TDRs during the yearsyear ended December 31, 2017 and 2016, excluding loans acquired, segregated by class of loans.2022. Modification Type (Dollars in thousands) Number of
Loans Balance Prior
to TDR Balance at
December 31 Change in
Maturity
Date Change in
Rate Financial Impact
on Date of
Restructure Year Ended December 31, 2017 Real estate: Construction 1 $ 456 $ 456 $ 456 $ -- $ -- Single-family residential 1 139 130 130 -- -- Other commercial 3 7,715 7,715 7,715 -- 33 Total real estate 5 8,310 8,301 8,301 -- 33 Commercial: Commercial 11 2,691 2,604 2,565 39 -- Total commercial 11 2,691 2,604 2,565 39 -- Total 16 $ 11,001 $ 10,905 $ 10,866 $ 39 $ 33 Year Ended December 31, 2016 Consumer: Other consumer 2 $ 50 $ 11 $ 11 $ -- $ -- Total consumer 2 50 11 11 -- -- Real estate: Single-family residential 23 1,570 1,518 964 554 -- Other commercial 28 10,291 10,260 9,128 1,132 -- Total real estate 51 11,861 11,778 10,092 1,686 -- Commercial: Commercial 17 1,996 1,968 1,968 -- -- Total commercial 17 1,996 1,968 1,968 -- -- Total 70 $ 13,907 $ 13,757 $ 12,071 $ 1,686 $ -- Modification Type (Dollars in thousands) Number of
LoansBalance Prior
to TDRBalance at December 31, Change in
Maturity
DateChange in
RateFinancial Impact
on Date of
RestructureYear Ended December 31, 2022 Real estate: Single-family residential 4 $ 760 $ 730 $ — $ 730 $ — Total real estate 4 $ 760 $ 730 $ — $ 730 $ — During the year ended December 31, 2017,2022, the Company modified sixteenfour loans with a total recorded investment of $11.0 million$760,000 prior to modification which were deemed troubled debt restructuring.TDRs. The restructured loans were modified by deferring amortized principal payments, changingreducing the maturity date and requiring interest only payments for a period of up to 12 months. Basedrate on the fair value of the collateral, aloan. No specific reserve of $26,000 was determined necessary forrecorded with respect to these loans. Also, the financial impact from the restructuring of these loans was $33,000 from the charge-off of interest on the date of restructure. During the year ended December 31, 2017, thirteen of the previously restructured loans with prior balances of $1.2 million were paid off.During year ended December 31, 2016, the Company modified seventy loans with a total recorded investment of $13.9 million prior to modification which were deemed troubled debt restructuring. The restructured loans were modified by various terms, including changing the maturity date, deferring amortized principal payments and requiring interest only payments for a period of 12 months. Based on the fair value of the collateral, a specific reserve of $402,000 was determined necessary for these loans.TDRs. Also, there was no immediate financial impact from the restructuring of these loans, as it was not considered necessary to charge-off interest or principal on the date of restructure. During the year ended December 31, 2016, fifteen of the previously restructured loans with prior balances of $3.7 million were paid off.ThereAdditionally, there was one commercial real estate loan with an outstanding balance of $7,800 considered a TDR for which a payment default occurred during the year ended December 31, 2017, that had been modified as a TDR within 12 months or less of the payment default, excluding loans acquired. A charge off of approximately $440,000 was recorded for this loan during the third quarter 2017. Also, there was one single-family residential loan for which a payment default occurred during the year ended December 31, 2017, that had been modified as a TDR within 12 months or less of the payment default, for which formal foreclosure proceedings are in process. We define2022. The Company defines a payment default as a payment received more than 90 days after its due date.During the year ended December 31, 2016, there was one consumer loan for which a payment default occurred that had been modified as a TDR within 12 months or less of the payment default. A charge off of $39,000 was recorded for this loan. There was also one single-family residential loan for which a payment default occurred during the year ended December 31, 2016, that had been modified as a TDR within 12 months or less of the payment default. A charge off of $31,000 was recorded for this loan and $69,000 was transferred to other real estate owned (“OREO”).In addition to the TDRs that occurred during the period provided in the preceding tables, the Company hadwere no TDRs with pre-modification loan balances of $236,000 at December 31, 2016 for which OREO was received in full or partial satisfaction of the loans. The majority of such TDRs were in commercial real estate and residential real estate. There were no TDRs atloans during the year ended December 31, 2017 for which OREO was received in full or partial satisfaction of the loans. At December 31, 2017 and 2016, the Company had $5,057,000 and $1,714,000, respectively, of consumer mortgage loans secured by residential real estate properties for which formal foreclosure proceedings are in process. At December 31, 2017 and 2016, the Company had $3,828,000 and $5,094,000, respectively, of OREO secured by residential real estate properties.
2022.90100Credit Quality Indicators – As part of the on-going monitoring of the credit quality of the Company’s loan portfolio, management tracks certain credit quality indicators including trends related to (i) the weighted-average risk rating of commercial and real estate loans, (ii) the level of classified commercial and real estate loans, (iii) net charge-offs, (iv) non-performing loans (see details above) and (v) the general economic conditions inof the States of Arkansas, Colorado, Kansas, Missouri, Oklahoma, Tennessee and Texas.The Company utilizes a risk rating matrix to assign a risk rate to each of its commercial and real estate loans. LoansRisk ratings are ratedupdated on a scale of 1an ongoing basis and are subject to 8.change by continuous loan monitoring processes including lending management monitoring, executive management and board committee oversight, and independent credit review. A description of the general characteristics of the 8 risk ratings is as follows:·Risk Rate 1 – Pass (Excellent) – This category includes loans which are virtually free of credit risk. Borrowers in this category represent the highest credit quality and greatest financial strength.·Risk Rate 2 – Pass (Good) - Loans under this category possess a nominal risk of default. This category includes borrowers with strong financial strength and superior financial ratios and trends. These loans are generally fully secured by cash or equivalents (other than those rated “excellent”).·Risk Rate 3 – Pass (Acceptable – Average) - Loans in this category are considered to possess a normal level of risk. Borrowers in this category have satisfactory financial strength and adequate cash flow coverage to service debt requirements. If secured, the perfected collateral should be of acceptable quality and within established borrowing parameters.·Risk Rate 4 – Pass (Monitor) - Loans in the Watch (Monitor) category exhibit an overall acceptable level of risk, but that risk may be increased by certain conditions, which represent “red flags”. These “red flags” require a higher level of supervision or monitoring than the normal “Pass” rated credit. The borrower may be experiencing these conditions for the first time, or it may be recovering from weakness, which at one time justified a higher rating. These conditions may include: weaknesses in financial trends; marginal cash flow; one-time negative operating results; non-compliance with policy or borrowing agreements; poor diversity in operations; lack of adequate monitoring information or lender supervision; questionable management ability/stability.·Risk Rate 5 – Special Mention - A loan in this category has potential weaknesses that deserve management's close attention. If left uncorrected, these potential weaknesses may result in deterioration of the repayment prospects for the asset or in the institution's credit position at some future date. Special Mention loans are not adversely classified (although they are “criticized”) and do not expose an institution to sufficient risk to warrant adverse classification. Borrowers may be experiencing adverse operating trends, or an ill-proportioned balance sheet. Non-financial characteristics of a Special Mention rating may include management problems, pending litigation, a non-existent, or ineffective loan agreement or other material structural weakness, and/or other significant deviation from prudent lending practices.·Risk Rate 6 – Substandard•Pass (Excellent) – This category includes loans which are virtually free of credit risk. Borrowers in this category represent the highest credit quality and greatest financial strength.•Pass (Good) - Loans under this category possess a nominal risk of default. This category includes borrowers with strong financial strength and superior financial ratios and trends. These loans are generally fully secured by cash or equivalents (other than those rated “excellent”).•Pass (Acceptable – Average) - Loans in this category are considered to possess a normal level of risk. Borrowers in this category have satisfactory financial strength and adequate cash flow coverage to service debt requirements. If secured, the perfected collateral should be of acceptable quality and within established borrowing parameters.•Pass (Monitor) - Loans in the Watch (Monitor) category exhibit an overall acceptable level of risk, but that risk may be increased by certain conditions, which represent “red flags”. These “red flags” require a higher level of supervision or monitoring than the normal “Pass” rated credit. The borrower may be experiencing these conditions for the first time, or it may be recovering from weakness, which at one time justified a higher rating. These conditions may include: weaknesses in financial trends; marginal cash flow; one-time negative operating results; non-compliance with policy or borrowing agreements; poor diversity in operations; lack of adequate monitoring information or lender supervision; questionable management ability/stability.•Special Mention - A loan in this category has potential weaknesses that deserve management’s close attention. If left uncorrected, these potential weaknesses may result in deterioration of the repayment prospects for the asset or in the institution’s credit position at some future date. Special Mention loans are not adversely classified (although they are “criticized”) and do not expose an institution to sufficient risk to warrant adverse classification. Borrowers may be experiencing adverse operating trends or an ill-proportioned balance sheet. Non-financial characteristics of a Special Mention rating may include management problems, pending litigation, a non-existent or ineffective loan agreement or other material structural weakness, and/or other significant deviation from prudent lending practices.•Substandard - A Substandard loan is inadequately protected by the current sound worth and paying capacity of the borrower or of the collateral pledged, if any. Loans so classified must have a well-defined weakness, or weaknesses, that jeopardize the liquidation of the debt. The loans are characterized by the distinct possibility that the Company will sustain some loss if the deficiencies are not corrected. This does not imply ultimate loss of the principal, but may involve burdensome administrative expenses and the accompanying cost to carry the loan.·Risk Rate 7 – Doubtful - A loan classified Doubtful has all the weaknesses inherent in a substandard loan except that the weaknesses make collection or liquidation in full (on the basis of currently existing facts, conditions, and values) highly questionable and improbable. Doubtful borrowers are usually in default, lack adequate liquidity, or capital, and lack the resources necessary to remain an operating entity. The possibility of loss is extremely high, but because of specific pending events that may strengthen the asset, its classification as loss is deferred. Pending factors include: proposed merger or acquisition; liquidation procedures; capital injection; perfection of liens on additional collateral; and refinancing plans. Loans classified as Doubtful are placed on nonaccrual status.·Risk Rate 8 – Loss - Loans classified Loss are considered uncollectible and of such little value that their continuance as bankable assets is not warranted. This classification does not mean that the loans has absolutely no recovery or salvage value, but rather it is not practical or desirable to defer writing off this basically worthless loan, even though partial recovery may be affected in the future. Borrowers in the Loss category are often in bankruptcy, have formally suspended debt repayments, or have otherwise ceased normal business operations. Loans should be classified as Loss and charged-off in the period in which they become uncollectible.91Loans acquired are evaluated using this internal grading system. Loans acquired are evaluated individually and include purchased credit impaired loans of $17.1 million and $17.8 million that are accounted for under ASC Topic 310-30 and are classified as substandard (Risk Rating 6) as of December 31, 2017 and 2016, respectively. Of the remaining loans acquired and accounted for under ASC Topic 310-20, $76.3 million and $47.8 million were classified (Risk Ratings 6, 7 and 8 – see classified loans discussion below) at December 31, 2017 and 2016, respectively.Loans acquired, covered by loss share agreements, had additional protection provided by the FDIC prior to the termination of the loss share agreements. During the 2015 quarterly impairment testing on the estimated cash flows of the credit impaired loans, the Company established that some of the loans covered by loss share from our FDIC-assisted transactions had experienced material projected credit deterioration. As a result, the Company established a $954,000 allowance for loan losses on covered loans by recording a provision for loan losses of $0.4 million (net of FDIC-loss share adjustments) during the period ended December 31, 2015. There was no further projected credit deterioration and no addition to the allowance for covered loans in 2016 or 2017. The $954,000 allowance was reclassified to allowance on acquired non-covered loans subsequent to the agreement with the FDIC to terminate the loss share agreements. See Note 6, Loans Acquired, for further discussion of the acquired loans, loan pools and loss sharing agreements.Purchased credit impaired loans are loans that showed evidence of deterioration of credit quality since origination and for which it is probable, at acquisition, that the Company will be unable to collect all amounts contractually owed. Their fair value was initially based onsustain some loss if the estimate of cash flows, both principal and interest, expected to be collected or estimated collateral values if cash flowsdeficiencies are not estimable, discounted at prevailing market ratescorrected. This does not imply ultimate loss of interest. The difference between the undiscounted cash flows expected at acquisitionprincipal, but may involve burdensome administrative expenses and the fairaccompanying cost to carry the loan.•Doubtful - A loan classified Doubtful has all the weaknesses inherent in a substandard loan except that the weaknesses make collection or liquidation in full (on the basis of currently existing facts, conditions, and values) highly questionable and improbable. Doubtful borrowers are usually in default, lack adequate liquidity or capital, and lack the resources necessary to remain an operating entity. The possibility of loss is extremely high, but because of specific pending events that may strengthen the asset, its classification as loss is deferred. Pending factors include: proposed merger or acquisition; liquidation procedures; capital injection; perfection of liens on additional collateral; and refinancing plans. Loans classified as Doubtful are placed on nonaccrual status.•Loss - Loans classified Loss are considered uncollectible and of such little value at acquisitionthat their continuance as bankable assets is recognizednot warranted. This classification does not mean that the loans has absolutely no recovery or salvage value, but rather it is not practical or desirable to defer writing off this basically worthless loan, even though partial recovery may be affected in the future. Borrowers in the Loss category are often in bankruptcy, have formally suspended debt repayments, or have otherwise ceased normal business operations. Loans should be classified as interest income on a level-yield method overLoss and charged-off in the lifeperiod in which they become uncollectible.101The Company monitors credit quality in the consumer portfolio by delinquency status. The delinquency status of loans is updated daily. A description of the loan. Contractually requireddelinquency credit quality indicators is as follows:•Current - Loans in this category are either current in payments for interest and principal that exceed the undiscounted cash flows expected at acquisitionor are not recognized as a yield adjustment. Increases in expected cash flows subsequent to the initial investment are recognized prospectively through adjustment of the yield on the loan over its remaining life. Decreases in expected cash flows are recognized as impairment.Classifiedunder 30 days past due. These loans for the Company include loans in Risk Ratings 6, 7 and 8. Loans may be classified, but not considered impaired, due to one of the following reasons: (1) The Company has established minimum dollar amount thresholds for loan impairment testing. Loans rated 6 – 8 that fall under the threshold amount are not tested for impairment and therefore are not included in impaired loans. (2) Of the loans that are above the threshold amount and tested for impairment, after testing, some are considered to not be impairedhave a normal level of risk.•30-89 Days Past Due - Loans in this category are between 30 and 89 days past due and are notsubject to the Company’s loss mitigation process. These loans are considered to have a moderate level of risk.•90+ Days Past Due - Loans in this category are 90 days or more past due and are placed on nonaccrual status. These loans have been subject to the Company’s loss mitigation process and foreclosure and/or charge-off proceedings have commenced.The Company uses a dual risk rating scale that utilizes quantitative models and qualitative factors (“score cards”) to assist in determining the appropriate risk rating for its commercial loans. This dual risk rating methodology incorporates a “probability of default” analysis which utilizes quantified metrics such as loan terms and financial performance, as well as a “loss given default” analysis which utilizes collateral values and economics of the market, among other attributes. Model outputs are reviewed and analyzed to ensure the projected risk levels are commensurate with underwriting and credit leader expectations. The risk rating scale includes Probability of Default levels of 1 – 16 and Loss Given Default levels of A – I. The scale allows for more granular recognition of risk and diversification of grading among traditional Pass grades.The following is a reconciliation between the expanded risk rating scale and the Company’s traditional risk rating segments utilized within the commercial loan classes presented in the credit quality indicator tables.•Pass - Includes loans with an expanded risk rating of 1 through 11. Loans with a risk rating of 10 and 11 equate to loans included on management’s “watch list” and is intended to be utilized on a temporary basis for pass grade borrowers where a significant risk-modifying action is anticipated in impaired loans. Total classifiedthe near term.•Special Mention - Includes loans excludingwith an expanded risk rating of 12.•Substandard - Includes loans accounted for under ASC Topic 310-30, were $175.6 millionwith an expanded risk rating of 13 and $166.0 million as14.•Doubtful and loss - Includes loans with an expanded risk rating of December 31, 201715 and December 31, 2016, respectively.
16.92102The following table presents a summary of loans by credit risk rating,quality indicator, as of December 31, 2023, segregated by class of loans.(In thousands) Risk Rate
1-4 Risk Rate
5 Risk Rate
6 Risk Rate
7 Risk Rate
8 Total December 31, 2017 Consumer: Credit cards $ 184,920 $ -- $ 502 $ -- $ -- $ 185,422 Other consumer 275,160 -- 4,934 -- -- 280,094 Total consumer 460,080 -- 5,436 -- -- 465,516 Real estate: Construction 603,126 5,795 5,218 16 -- 614,155 Single family residential 1,066,902 3,954 23,490 287 -- 1,094,633 Other commercial 2,480,293 19,581 30,950 -- -- 2,530,824 Total real estate 4,150,321 29,330 59,658 303 -- 4,239,612 Commercial: Commercial 736,377 74,254 14,402 50 134 825,217 Agricultural 146,065 24 2,190 23 -- 148,302 Total commercial 882,442 74,278 16,592 73 134 973,519 Other 26,962 -- -- -- -- 26,962 Loans acquired 4,782,384 198,314 93,378 -- -- 5,074,076 Total $ 10,302,189 $ 301,922 $ 175,064 $ 376 $ 134 $ 10,779,685 (In thousands) Risk Rate
1-4 Risk Rate
5 Risk Rate
6 Risk Rate
7 Risk Rate
8 Total December 31, 2016 Consumer: Credit cards $ 183,943 $ -- $ 648 $ -- $ -- $ 184,591 Other consumer 301,632 26 2,314 -- -- 303,972 Total consumer 485,575 26 2,962 -- -- 488,563 Real estate: Construction 330,080 98 6,565 16 -- 336,759 Single family residential 875,603 4,024 24,460 158 -- 904,245 Other commercial 1,738,207 6,874 41,994 -- -- 1,787,075 Total real estate 2,943,890 10,996 73,019 174 -- 3,028,079 Commercial: Commercial 616,805 558 22,162 -- -- 639,525 Agricultural 148,218 104 2,033 -- 23 150,378 Total commercial 765,023 662 �� 24,195 -- 23 789,903 Other 20,662 -- -- -- -- 20,662 Loans acquired 1,217,886 22,181 64,075 1,541 -- 1,305,683 Total $ 5,433,036 $ 33,865 $ 164,251 $ 1,715 $ 23 $ 5,632,890 93Term Loans Amortized Cost Basis by Origination Year (In thousands) 2023 2022 2021 2020 2019 2018 and Prior Lines of Credit (“LOC”) Amortized Cost Basis LOC Converted to Term Loans Amortized Cost Basis Total Consumer - credit cards Delinquency: Current $ — $ — $ — $ — $ — $ — $ 188,578 $ — $ 188,578 30-89 days past due — — — — — — 1,734 — 1,734 90+ days past due — — — — — — 892 — 892 Total consumer - credit cards — — — — — — 191,204 — 191,204 Current-period consumer - credit cards gross charge-offs — — — — — — 5,303 — 5,303 Consumer - other Delinquency: Current 55,091 35,904 12,115 3,838 1,471 1,106 16,250 — 125,775 30-89 days past due 400 719 127 53 2 16 154 — 1,471 90+ days past due 35 127 46 — — — 8 — 216 Total consumer - other 55,526 36,750 12,288 3,891 1,473 1,122 16,412 — 127,462 Current-period consumer - other gross charge-offs 220 826 493 79 29 128 449 — 2,224 Real estate - C&D Risk rating: Pass 138,749 143,711 52,081 45,027 10,278 13,632 2,710,853 504 3,114,835 Special mention — 1,143 7,284 — — 396 16,682 — 25,505 Substandard — 101 48 — — 247 3,484 — 3,880 Doubtful and loss — — — — — — — — — Total real estate - C&D 138,749 144,955 59,413 45,027 10,278 14,275 2,731,019 504 3,144,220 Current-period real estate - C&D gross charge-offs — 1,148 — — — 8 349 — 1,505 Real estate - SF residential Delinquency: Current 371,326 620,933 352,589 238,128 121,416 504,675 388,705 565 2,598,337 30-89 days past due 5,222 5,061 3,667 2,283 1,741 9,759 2,964 — 30,697 90+ days past due 1,313 2,443 1,810 1,661 120 3,465 1,710 — 12,522 Total real estate - SF residential 377,861 628,437 358,066 242,072 123,277 517,899 393,379 565 2,641,556 Current-period real estate - SF residential gross charge-offs — 111 12 73 — 677 232 — 1,105 Real estate - other commercial Risk rating: Pass 729,602 1,651,010 1,237,810 621,595 171,230 417,122 2,333,637 — 7,162,006 Special mention 37,302 8,458 10,149 7,844 1,364 11,604 84,978 — 161,699 Substandard 40,664 10,290 4,495 16,646 6,293 9,861 140,454 — 228,703 Doubtful and loss — — — 2 — — — — 2 Total real estate - other commercial 807,568 1,669,758 1,252,454 646,087 178,887 438,587 2,559,069 — 7,552,410 Current-period real estate - other commercial gross charge-offs — — — 7 2 35 9,731 — 9,775 Net (charge-offs)/recoveries for the years ended103Term Loans Amortized Cost Basis by Origination Year (In thousands) 2023 2022 2021 2020 2019 2018 and Prior Lines of Credit (“LOC”) Amortized Cost Basis LOC Converted to Term Loans Amortized Cost Basis Total Commercial Risk rating: Pass 440,872 354,016 200,941 67,320 27,374 42,953 1,271,826 — 2,405,302 Special mention 157 14,117 316 367 98 889 8,228 — 24,172 Substandard 1,998 11,874 6,272 2,934 1,722 3,392 32,510 — 60,702 Doubtful and loss — — — — — — — — — Total commercial 443,027 380,007 207,529 70,621 29,194 47,234 1,312,564 — 2,490,176 Current-period commercial - gross charge-offs 463 2,081 778 197 244 815 1,351 — 5,929 Commercial - agriculture Risk rating: Pass 39,680 30,075 13,940 6,280 2,071 303 134,180 — 226,529 Special mention 363 733 1,068 — — — 3,257 — 5,421 Substandard 518 37 71 104 26 — 4 — 760 Doubtful and loss — — — — — — — — — Total commercial - agriculture 40,561 30,845 15,079 6,384 2,097 303 137,441 — 232,710 Current-period commercial - agriculture gross charge-offs — 7 — — — 26 — — 33 Other Delinquency: Current 45,234 144,732 28,413 2,543 3,255 36,719 205,033 — 465,929 30-89 days past due — — — — — — — — — 90+ days past due — — — — — 3 — — 3 Total other 45,234 144,732 28,413 2,543 3,255 36,722 205,033 — 465,932 Current-period other - gross charge-offs — — — — — — 298 — 298 Total $ 1,908,526 $ 3,035,484 $ 1,933,242 $ 1,016,625 $ 348,461 $ 1,056,142 $ 7,546,121 $ 1,069 $ 16,845,670 104The following table presents a summary of loans by credit quality indicator, as of December 31, 2017 and 2016, excluding loans acquired,2022 segregated by class of loans, were as follows:loans.(In thousands) 2017 2016 Consumer: Credit cards $ (2,884 ) $ (2,288 ) Other consumer (1,528 ) (1,459 ) Total consumer (4,412 ) (3,747 ) Real estate: Construction 100 (16 ) Single family residential (1,045 ) (706 ) Other commercial (6,054 ) (6,444 ) Total real estate (6,999 ) (7,166 ) Commercial: Commercial (7,734 ) (1,255 ) Agricultural -- (2,336 ) Total commercial (7,734 ) (3,591 ) Total $ (19,145 ) $ (14,504 ) Term Loans Amortized Cost Basis by Origination Year (In thousands) 2022 2021 2020 2019 2018 2017 and Prior Lines of Credit (“LOC”) Amortized Cost Basis LOC Converted to Term Loans Amortized Cost Basis Total Consumer - credit cards Delinquency: Current $ — $ — $ — $ — $ — $ — $ 195,222 $ — $ 195,222 30-89 days past due — — — — — — 1,297 — 1,297 90+ days past due — — — — — — 409 — 409 Total consumer - credit cards — — — — — — 196,928 — 196,928 Consumer - other Delinquency: Current 86,303 26,339 10,071 3,804 2,671 2,275 20,350 3 $ 151,816 30-89 days past due 298 241 135 13 34 119 12 — 852 90+ days past due 121 47 2 1 2 41 — — 214 Total consumer - other 86,722 26,627 10,208 3,818 2,707 2,435 20,362 3 152,882 Real estate - C&D Risk rating: Pass 237,304 68,916 50,912 16,920 13,625 9,611 2,163,776 334 $ 2,561,398 Special mention — — — — — 41 1,342 — 1,383 Substandard 1,091 116 36 13 31 103 2,478 — 3,868 Doubtful and loss — — — — — — — — — Total real estate - C&D 238,395 69,032 50,948 16,933 13,656 9,755 2,167,596 334 2,566,649 Real estate - SF residential Delinquency: Current 700,976 411,885 295,365 141,608 192,176 440,931 324,282 4,192 $ 2,511,415 30-89 days past due 3,105 3,415 1,290 2,018 3,129 8,626 2,042 — 23,625 90+ days past due 586 871 885 968 1,017 6,312 436 — 11,075 Total real estate - SF residential 704,667 416,171 297,540 144,594 196,322 455,869 326,760 4,192 2,546,115 Real estate - other commercial Risk rating: Pass 1,917,352 1,482,049 768,630 254,986 179,729 428,027 2,093,379 19,469 7,143,621 Special mention 19,538 32,831 38,821 206 2,261 20,741 104,431 — 218,829 Substandard 24,639 3,399 27,399 2,544 2,026 15,217 30,824 — 106,048 Doubtful and loss — — — — — — — — — Total real estate - other commercial 1,961,529 1,518,279 834,850 257,736 184,016 463,985 2,228,634 19,469 7,468,498 Commercial Risk rating: Pass 595,256 300,650 168,539 41,924 31,329 35,447 1,401,402 24,940 2,599,487 Special mention 199 1,700 11 32 — 927 2,708 80 5,657 Substandard 5,257 2,435 3,328 802 891 1,290 11,337 1,805 27,145 Doubtful and loss — — — — — — — 1 1 Total commercial 600,712 304,785 171,878 42,758 32,220 37,664 1,415,447 26,826 2,632,290 Commercial - agriculture Risk rating: Pass 44,377 22,901 12,044 4,483 1,029 369 119,342 310 204,855 Special mention 8 — — — — — — — 8 Substandard 55 8 78 49 10 — 560 — 760 Doubtful and loss — — — — — — — — — Total commercial - agriculture 44,440 22,909 12,122 4,532 1,039 369 119,902 310 205,623 Other Delinquency: Current 152,086 29,362 8,181 4,742 20,018 25,349 132,384 953 373,075 30-89 days past due — — — — — 61 — — 61 90+ days past due — — — — — 3 — — 3 Total other 152,086 29,362 8,181 4,742 20,018 25,413 132,384 953 373,139 Total $ 3,788,551 $ 2,387,165 $ 1,385,727 $ 475,113 $ 449,978 $ 995,490 $ 6,608,013 $ 52,087 $ 16,142,124 105Allowance for LoanCredit LossesAllowance for LoanCredit Losses – The allowance for loancredit losses is a reserve established through a provision for loancredit losses charged to expense, which represents management’s best estimate of probablelifetime expected losses that have been incurred within the existing portfolio of loans.based on reasonable and supportable forecasts, quantitative factors, and other qualitative considerations. The allowance, in the judgment of management, is necessary to reserve for estimatedexpected loan losses and risks inherent in the loan portfolio. The Company’s allowance for loancredit loss methodology includes allowance allocationsreserve factors calculated to estimate current expected credit losses to amortized cost balances over the remaining contractual life of the portfolio, adjusted for prepayments, in accordance with ASC Topic 310-10, Receivables, and allowance allocations calculated in accordance with ASC Topic 450-20, Loss Contingencies326-20, Financial Instruments - Credit Losses. Accordingly, the methodology is comprised of two components: individual assessments on loans with unique risk characteristics and collective assessments for loans that share similar risk characteristics. Loans with similar risk characteristics such as loan type, collateral type, and internal risk ratings are aggregated for collective assessment. The Company uses statistically-based models that leverage assumptions about current and future economic conditions throughout the contractual life of the loan. Expected credit losses are estimated by either lifetime loss rates or expected loss cash flows based on three key parameters: probability-of-default (“PD”), exposure-at-default (“EAD”), and loss-given-default (“LGD”). Future economic conditions are incorporated to the Company’s internal grading system, specific impairment analysis,extent that they are reasonable and supportable. Beyond the reasonable and supportable periods, the economic variables revert to a historical equilibrium at a pace dependent on the state of the economy reflected within the economic scenarios. To determine the best estimate of credit losses as of December 31, 2023, the Company utilized a probability-weighted, multiple-scenario approach consisting of Baseline, Upside (S1), and Downside (S3) scenarios published by Moody’s Analytics in December 2023 that was updated to reflect the U.S. economic outlook. The Company also includes qualitative and quantitative factors.As mentioned above, allocationsadjustments to the allowance based on factors and considerations that have not otherwise been fully accounted for. These factors may include but are not limited to portfolio trends and considerations, other economic considerations, policy actions, concentration risk, or imprecision risk.Loans with similar risk characteristics such as loan type, collateral type, and internal risk ratings are aggregated into homogeneous segments for loan lossesassessment. Reserve factors are categorized as either specific allocations or general allocations.A loan is considered impaired when it is probablebased on estimated probability of default and loss given default for each segment. The estimates are determined based on economic forecasts over the reasonable and supportable forecast period based on projected performance of economic variables that have a statistical relationship with the Company will not receive all amounts due according to the contractual termshistorical loss experience of the loan, including scheduled principal and interest payments.segments.Loans that have unique risk characteristics are evaluated on an individual basis. These evaluations are typically performed on loans with a deteriorated internal risk rating. For a collateral dependentcollateral-dependent loan, the Company’s evaluation process includes a valuation by appraisal or other collateral analysis.analysis adjusted for selling costs, when appropriate. This valuation is compared to the remaining outstanding principal balance of the loan. If a loss is determined to be probable, the loss is included in the allowance for loancredit losses as a specific allocation. IfLoans for which the loanrepayment is notexpected to be provided substantially through the operation or sale of collateral dependent,and where the measurementborrower is experiencing financial difficulty had an amortized cost of loss is based on$144.6 million and $70.9 million as of December 31, 2023 and 2022, respectively, as further detailed in the difference between the expected and contractual future cash flowstable below. The collateral securing these loans consist of the loan.The general allocation is calculated monthly based on management’s assessment of several factors such as (1) historical loss experience based on volumes and types, (2) volume and trends in delinquencies and nonaccruals, (3) lending policies and procedures including those for loan losses, collections and recoveries, (4) national, state and local economic trends and conditions, (5) external factors and pressure from competition, (6) the experience, ability and depth of lending management and staff, (7) seasoning of new products obtained and new markets entered through acquisition and (8) other factors and trends that will affect specific loans and categories of loans. The Company establishes general allocations for each major loan category. This category also includes allocations to loans which are collectively evaluated for loss such as credit cards, one-to-four family owner occupied residentialcommercial real estate loansproperties, residential properties, and other consumer loans.
business assets.94(In thousands) Real Estate Collateral Other Collateral Total December 31, 2023 Construction and development $ 43,826 $ — $ 43,826 Single family residential 3,870 — 3,870 Other commercial real estate 76,229 — 76,229 Commercial — 20,679 20,679 Total $ 123,925 $ 20,679 $ 144,604 December 31, 2022 Construction and development $ 2,156 $ — $ 2,156 Single family residential — — — Other commercial real estate 65,450 — 65,450 Commercial — 3,320 3,320 Total $ 67,606 $ 3,320 $ 70,926 106The following table details activity in the allowance for loancredit losses by portfolio segment for the years ended December 31, 20172023, 2022 and 2016.2021. Allocation of a portion of the allowance to one category of loans does not preclude its availability to absorb losses in other categories.(In thousands) Commercial Real
Estate Credit
Card Other
Consumer
and Other Total December 31, 2017 Balance, beginning of year (2) $ 7,739 $ 21,817 $ 3,779 $ 2,951 $ 36,286 Provision for loan losses (1) 7,002 12,463 2,889 2,173 24,527 Charge-offs (7,837 ) (7,989 ) (3,905 ) (3,767 ) (23,498 ) Recoveries 103 990 1,021 2,239 4,353 Net charge-offs (7,734 ) (6,999 ) (2,884 ) (1,528 ) (19,145 ) Balance, end of year (2) $ 7,007 $ 27,281 $ 3,784 $ 3,596 $ 41,668 Period-end amount allocated to: Loans individually evaluated for impairment $ -- $ 338 $ -- $ -- $ 338 Loans collectively evaluated for impairment 7,007 26,943 3,784 3,596 41,330 Balance, end of year (2) $ 7,007 $ 27,281 $ 3,784 $ 3,596 $ 41,668 December 31, 2016 Balance, beginning of year (2) $ 5,985 $ 19,522 $ 3,893 $ 1,951 $ 31,351 Provision for loan losses (1) 5,345 9,461 2,174 2,459 19,439 Charge-offs (3,956 ) (7,517 ) (3,195 ) (1,975 ) (16,643 ) Recoveries 365 351 907 516 2,139 Net charge-offs (3,591 ) (7,166 ) (2,288 ) (1,459 ) (14,504 ) Balance, end of year (2) $ 7,739 $ 21,817 $ 3,779 $ 2,951 $ 36,286 Period-end amount allocated to: Loans individually evaluated for impairment $ 262 $ 417 $ -- $ 1 $ 680 Loans collectively evaluated for impairment 7,477 21,400 3,779 2,950 35,606 Balance, end of year (2) $ 7,739 $ 21,817 $ 3,779 $ 2,951 $ 36,286 (1)Provision for loan losses of $1,866,000 attributable to loans acquired was excluded from this table for the year ended December 31, 2017 (total provision for loan losses for the year ended December 31, 2017 was $26,393,000). There was $2.4 million in charge-offs for loans acquired during the year ended December 31, 2017 resulting in an ending balance in the allowance related to loans acquired of $418,000. Provision for loan losses of $626,000 attributable to loans acquired was excluded from this table for the year ended December 31, 2016 (total provision for loan losses for the year ended December 31, 2016 was $20,065,000). The $626,000 was subsequently charged-off, resulting in no increase to the ending balance in the allowance related to loans acquired.(2)Allowance for loan losses at December 31, 2017 includes $418,000 allowance for loans acquired (not shown in the table above). Allowance for loan losses at December 31, 2016 and 2015 includes $954,000 allowance for loans acquired. The total allowance for loan losses at December 31, 2017, 2016 and 2015 was $42,086,000, $37,240,000 and $32,305,000, respectively.95(In thousands) Commercial Real
EstateCredit
CardOther
Consumer
and OtherTotal December 31, 2023 Beginning balance, January 1, 2023 $ 34,406 $ 150,795 $ 5,140 $ 6,614 $ 196,955 Provision for credit loss expense 5,934 36,381 5,023 86 47,424 Charge-offs (5,962) (12,385) (5,303) (2,522) (26,172) Recoveries 2,092 2,386 1,008 1,538 7,024 Net charge-offs (3,870) (9,999) (4,295) (984) (19,148) Ending balance, December 31, 2023 $ 36,470 $ 177,177 $ 5,868 $ 5,716 $ 225,231 December 31, 2022 Beginning balance, January 1, 2022 $ 17,458 $ 179,270 $ 3,987 $ 4,617 $ 205,332 Acquisition adjustment for PCD loans 6,433 3,187 — 2 9,622 Provision for credit loss expense 22,412 (34,456) 3,991 2,674 (5,379) Charge-offs (14,270) (4,122) (3,862) (1,876) (24,130) Recoveries 2,373 6,916 1,024 1,197 11,510 Net charge-offs (11,897) 2,794 (2,838) (679) (12,620) Ending balance, December 31, 2022 $ 34,406 $ 150,795 $ 5,140 $ 6,614 $ 196,955 December 31, 2021 Beginning balance, January 1, 2021 $ 42,093 $ 182,868 $ 7,472 $ 5,617 $ 238,050 Acquisition adjustment for PCD loans 3,349 10,101 — 1 13,451 Provision for credit loss expense (22,031) (7,918) (908) (352) (31,209) Charge-offs (10,613) (10,691) (3,625) (2,053) (26,982) Recoveries 4,660 4,910 1,048 1,404 12,022 Net charge-offs (5,953) (5,781) (2,577) (649) (14,960) Ending balance, December 31, 2021 $ 17,458 $ 179,270 $ 3,987 $ 4,617 $ 205,332 Activity inAs of December 31, 2023, the Company’s allowance for credit losses was considered sufficient based upon expected loan losseslevel cash flows that were supported by economic forecasts. The provision expense for the period ended December 31, 2023 was primarily due to the loan growth experienced during the period, as well as the impact of updated economic assumptions.For the year ended December 31, 20152022, provision expense related to loans was as follows:(In thousands) Commercial Real
Estate Credit
Card Other
Consumer
and Other Total December 31, 2015 Balance, beginning of year $ 6,962 $ 15,161 $ 5,445 $ 1,460 $ 29,028 Provision for loan losses 258 5,738 665 1,625 8,286 Charge-offs (1,415 ) (1,580 ) (3,107 ) (1,672 ) (7,774 ) Recoveries 180 203 890 538 1,811 Net charge-offs (1,235 ) (1,377 ) (2,217 ) (1,134 ) (5,963 ) Balance, end of year $ 5,985 $ 19,522 $ 3,893 $ 1,951 $ 31,351 recorded investment in loans, excludingimproved asset credit quality metrics, which combined with improved Moody’s economic modeling scenarios, more than offset the $30.3 million Day 2 provision expense required for loans acquired by the Company in the Spirit acquisition.107Reserve for Unfunded CommitmentsIn addition to the allowance for credit losses, the Company has established a reserve for unfunded commitments, classified in other liabilities. This reserve is maintained at a level management believes to be sufficient to absorb losses arising from unfunded loan commitments. The reserve for unfunded commitments was $25.6 million and $41.9 million, as of December 31, 20172023 and 2016 related2022 respectively. The adequacy of the reserve for unfunded commitments is determined quarterly based on methodology similar to each balance inthe methodology for determining the allowance for loan losses by portfolio segment oncredit losses. During 2023, $16.3 million was released from the basis of the Company’s impairment methodology was as follows:(In thousands) Commercial Real
Estate Credit
Card Other
Consumer
and Other Total December 31, 2017 Loans individually evaluated for impairment $ 7,610 $ 31,538 $ 170 $ 4,605 $ 43,923 Loans collectively evaluated for impairment 965,909 4,208,074 185,252 302,451 5,661,686 Balance, end of period $ 973,519 $ 4,239,612 $ 185,422 $ 307,056 $ 5,705,609 December 31, 2016 Loans individually evaluated for impairment $ 11,522 $ 30,001 $ 373 $ 1,800 $ 43,696 Loans collectively evaluated for impairment 778,381 2,998,078 184,218 322,834 4,283,511 Balance, end of period $ 789,903 $ 3,028,079 $ 184,591 $ 324,634 $ 4,327,207 96NOTE 6:LOANS ACQUIREDDuring the fourth quarter of 2017, the Company evaluated $1.985 billion of net loans ($2.021 billion gross loans less $36.3 million discount) purchasedreserve for unfunded commitments primarily due to a decline in conjunction with the acquisition of OKSB, described in Note 2, Acquisitions, in accordance with the provisions of ASC Topic 310-20, Nonrefundable Fees and Other Costs. The fair value discount is being accreted into interest income over the weighted average life of the loans using a constant yield method. These loans are not considered to be impaired loans. The Company evaluated the remaining $11.4 million of net loans ($18.1 million gross loans less $6.7 million discount) purchased in conjunction with the acquisition of OKSB for impairment in accordance with the provisions of ASC Topic 310-30, Loans and Debt Securities Acquired with Deteriorated Credit Quality. Purchased loans are considered impaired if there is evidenceunfunded commitments resulting from customers utilizing lines of credit deterioration since origination and if it is probable that not all contractually required payments will be collected.Also during the fourth quarteryear. During 2022, an adjustment to the reserve for unfunded commitments resulted in an expense of 2017,$16.0 million due to the Company evaluated $2.208 billionoverall increase in unfunded commitments, primarily made up of netcommercial construction loans, ($2.246 billion gross loans less $37.8which receive a higher reserve allocation than other loans. Additionally, an adjustment to the reserve for unfunded commitments resulted in an expense of $3.5 million discount) purchased in conjunction withwhich was due to the acquisition of First Texas, described in NoteDay 2 Acquisitions, in accordance withprovision expense required for unfunded commitments related to the provisions of ASC Topic 310-20, Nonrefundable Fees and Other Costs. The fair value discount is being accreted into interest income over the weighted average life of the loans using a constant yield method.Spirit acquisition. These loans are not considered to be impaired loans.During the second quarter of 2017, the Company evaluated $249.2 million of net loans ($254.2 million gross loans less $5.0 million discount) purchased in conjunction with the acquisition of Hardeman, described in Note 2, Acquisitions, in accordance with the provisions of ASC Topic 310-20, Nonrefundable Fees and Other Costs. The fair value discount is being accreted into interest income over the weighted average life of the loans using a constant yield method. These loans are not considered to be impaired loans. The Company evaluated the remaining $2.4 million of net loans ($3.4 million gross loans less $990,000 discount) purchased in conjunction with the acquisition of Hardeman for impairment in accordance with the provisions of ASC Topic 310-30, Loans and Debt Securities Acquired with Deteriorated Credit Quality.During the third quarter of 2016, the Company evaluated $340.1 million of net loans ($348.8 million gross loans less $8.7 million discount) purchased in conjunction with the acquisition of Citizens, described in Note 2, Acquisitions, in accordance with the provisions of ASC Topic 310-20, Nonrefundable Fees and Other Costs. The fair value discount is being accreted into interest income over the weighted average life of the loans using a constant yield method. These loans are not considered to be impaired loans. The Company evaluated the remaining $757,000 of net loans ($1.6 million gross loans less $848,000 discount) purchased in conjunction with the acquisition of Citizens for impairment in accordance with the provisions of ASC Topic 310-30, Loans and Debt Securities Acquired with Deteriorated Credit Quality.During the first quarter of 2015, the Company evaluated $769.9 million of net loans ($774.8 million gross loans less $4.9 million discount) purchased in conjunction with the acquisition of Liberty, described in Note 2, Acquisitions, in accordance with the provisions of ASC Topic 310-20, Nonrefundable Fees and Other Costs. The fair value discount is being accreted into interest income over the weighted average life of the loans using a constant yield method. These loans are not considered to be impaired loans. The Company evaluated the remaining $10.7 million of net loans ($15.7 million gross loans less $5.0 million discount) purchased in conjunction with the acquisition of Liberty for impairment in accordance with the provisions of ASC Topic 310-30.Also during the first quarter of 2015, the Company evaluated $1.13 billion of net loans ($1.15 billion gross loans less $23.7 million discount) purchased in conjunction with the acquisition of Community First, described in Note 2, Acquisitions, in accordance with the provisions of ASC Topic 310-20. The fair value discount is being accreted into interest income over the weighted average life of the loans using a constant yield method. These loans are not considered to be impaired loans. The Company evaluated the remaining $7.0 million of net loans ($10.1 million gross loans less $3.1 million discount) purchased in conjunction with the acquisition of Community First for impairment in accordance with the provisions of ASC Topic 310-30.See Note 2, Acquisitions, for further discussion of loans acquired.On September 15, 2015, the Company entered into an agreement with the FDIC to terminate all loss share agreements whichadjustments were entered into in 2010 and 2012 in conjunction with the Company’s acquisition of substantially all of the assets (“covered assets”) and assumption of substantially all of the liabilities of four failed banks in FDIC-assisted transactions. Under the early termination, all rights and obligations of the Company and the FDIC under the FDIC loss share agreements, including the clawback provisions and the settlement of loss share and expense reimbursement claims, have been resolved and terminated.97Under the terms of the agreement, the FDIC made a net payment of $2,368,000 to Simmons Bank as consideration for the early termination of the loss share agreements. The early termination was recordedincluded in the Company’s financial statements by removing the FDIC Indemnification Asset, receivable from FDIC, the FDIC True-up liability and recording a one-time, pre-tax charge of $7,476,000. As a result, the Company reclassified loans previously covered by FDIC loss share to loans acquired, not covered by FDIC loss share. Foreclosed assets previously covered by FDIC loss share were reclassified to foreclosed assets not covered by FDIC loss share.The following table reflects the carrying value of all loans acquired as of December 31, 2017 and 2016: Loans Acquired
At December 31,(In thousands) 2017 2016 Consumer: Other consumer $ 51,467 $ 49,677 Total consumer 51,467 49,677 Real estate: Construction 637,032 57,587 Single family residential 793,228 423,176 Other commercial 2,387,777 690,108 Total real estate 3,818,037 1,170,871 Commercial: Commercial 995,587 81,837 Agricultural 66,576 3,298 Total commercial 1,062,163 85,135 Other 142,409 -- Total loans acquired (1) $ 5,074,076 $ 1,305,683 (1)Loans acquired are reported net of a $418,000 and $954,000 allowance as of December 31, 2017 and 2016, respectively.Nonaccrual loans acquired, excluding purchased credit impaired loans accountedprovision for under ASC Topic 310-30, segregated by class of loans, are as follows (see Note 5, Loans and Allowance for Loan Losses, for discussion of nonaccrual loans):(In thousands) December 31,
2017 December 31,
2016 Consumer: Other consumer $ 334 $ 456 Total consumer 334 456 Real estate: Construction 1,767 7,961 Single family residential 12,151 13,366 Other commercial 7,401 22,045 Total real estate 21,319 43,372 Commercial: Commercial 1,748 2,806 Agricultural 84 198 Total commercial 1,832 3,004 Total $ 23,485 $ 46,832 98An age analysis of past due loans acquired segregated by class of loans, is as follows (see Note 5, Loans and Allowance for Loan Losses, for discussion of past due loans):(In thousands) Gross
30-89 Days
Past Due 90 Days
or More
Past Due Total
Past Due Current Total
Loans 90 Days
Past Due &
Accruing December 31, 2017 Consumer: Other consumer $ 889 $ 260 $ 1,149 $ 50,318 $ 51,467 $ 108 Total consumer 889 260 1,149 50,318 51,467 108 Real estate: Construction 2,577 1,448 4,025 633,007 637,032 279 Single family residential 12,936 3,302 16,238 776,990 793,228 126 Other commercial 17,176 5,647 22,823 2,364,954 2,387,777 2,565 Total real estate 32,689 10,397 43,086 3,774,951 3,818,037 2,970 Commercial: Commercial 2,344 1,039 3,383 992,204 995,587 67 Agricultural 51 -- 51 66,525 66,576 -- Total commercial 2,395 1,039 3,434 1,058,729 1,062,163 67 Other 15 -- 15 142,394 142,409 -- Total $ 35,988 $ 11,696 $ 47,684 $ 5,026,392 $ 5,074,076 $ 3,145 December 31, 2016 Consumer: Other consumer $ 571 $ 189 $ 760 $ 48,917 $ 49,677 $ -- Total consumer 571 189 760 48,917 49,677 -- Real estate: Construction 132 7,332 7,464 50,123 57,587 -- Single family residential 8,358 4,857 13,215 409,961 423,176 11 Other commercial 2,836 10,741 13,577 676,531 690,108 -- Total real estate 11,326 22,930 34,256 1,136,615 1,170,871 11 Commercial: Commercial 723 2,153 2,876 78,961 81,837 -- Agricultural 48 -- 48 3,250 3,298 -- Total commercial 771 2,153 2,924 82,211 85,135 -- Total $ 12,668 $ 25,272 $ 37,940 $ 1,267,743 $ 1,305,683 $ 11 99The following table presents a summary of loans acquired by credit risk rating, segregated by class of loans (see Note 5, Loans and Allowance for Loan Losses, for discussion of loan risk rating). Loans accounted for under ASC Topic 310-30 are all included in Risk Rate 1-4 in this table.(In thousands) Risk Rate
1-4 Risk Rate
5 Risk Rate
6 Risk Rate
7 Risk Rate
8 Total December 31, 2017 Consumer: Other consumer $ 50,625 $ 21 $ 821 $ -- $ -- $ 51,467 Total consumer Real estate: Construction 468,610 166,710 1,712 -- -- 637,032 Single family residential 770,954 2,618 19,656 -- -- 793,228 Other commercial 2,337,097 15,064 35,616 -- -- 2,387,777 Total real estate 3,576,661 184,392 56,984 3,818,037 Commercial: Commercial 946,322 13,901 35,364 -- -- 995,587 Agricultural 66,367 -- 209 -- -- 66,576 Total commercial 1,012,689 13,901 35,573 -- -- 1,062,163 Other 142,409 -- -- -- -- 142,409 Total $ 4,782,384 $ 198,314 $ 93,378 $ -- $ -- $ 5,074,076 December 31, 2016 Consumer: Other consumer $ 48,992 $ 14 $ 671 $ -- $ -- $ 49,677 Total consumer 48,992 14 671 -- -- 49,677 Real estate: Construction 50,704 88 6,795 -- -- 57,587 Single family residential 400,553 2,696 18,392 1,535 -- 423,176 Other commercial 641,018 17,384 31,706 -- -- 690,108 Total real estate 1,092,275 20,168 56,893 1,535 -- 1,170,871 Commercial: Commercial 73,609 1,965 6,257 6 -- 81,837 Agricultural 3,010 34 254 -- -- 3,298 Total commercial 76,619 1,999 6,511 6 -- 85,135 Total $ 1,217,886 $ 22,181 $ 64,075 $ 1,541 $ -- $ 1,305,683 Loans acquired were individually evaluated and recorded at estimated fair value, including estimated credit losses atin the timestatement of acquisition. These loans are systematically reviewedincome. No adjustment was made to the reserve for unfunded commitments during 2021 as it was considered sufficient to cover any loss expectations.Provision for Credit LossesProvision for credit losses is determined by the Company as the amount to determine the risk of losses that may exceed those identified at the time of the acquisition. Techniques used in determining risk of loss are similarbe added to the Company’s legacy loan portfolio, with most focus being placed on thoseallowance for credit loss accounts for various types of financial instruments including loans, securities and off-balance-sheet credit exposure after net charge-offs have been deducted to bring the allowance to a level which, include the larger loan relationships and those loans which exhibit higher risk characteristics.The followingin management's best estimate, is a summary of the loans acquired in the OKSB acquisition on October 19, 2017, as of the date of acquisition.(In thousands) Not Impaired Impaired Contractually required principal and interest at acquisition $ 2,021,388 $ 18,136 Non-accretable difference (expected losses and foregone interest) -- (6,731 ) Cash flows expected to be collected at acquisition 2,021,388 11,405 Accretable yield (36,340 ) -- Basis in acquired loans at acquisition $ 1,985,048 $ 11,405 100The following is a summary of the loans acquired in the First Texas acquisition on October 19, 2017, as of the date of acquisition.(In thousands) Not Impaired Impaired Contractually required principal and interest at acquisition $ 2,246,212 $ -- Non-accretable difference (expected losses and foregone interest) -- -- Cash flows expected to be collected at acquisition 2,246,212 -- Accretable yield (37,834 ) -- Basis in acquired loans at acquisition $ 2,208,378 $ -- The following is a summary of the loans acquired in the Hardeman acquisition on May 15, 2017, as of the date of acquisition.(In thousands) Not Impaired Impaired Contractually required principal and interest at acquisition $ 254,189 $ 3,452 Non-accretable difference (expected losses and foregone interest) -- (990 ) Cash flows expected to be collected at acquisition 254,189 2,462 Accretable yield (5,002 ) -- Basis in acquired loans at acquisition $ 249,187 $ 2,462 The following is a summary of the loans acquired in the Citizens acquisition on September 9, 2016, as of the date of acquisition.(In thousands) Not Impaired Impaired Contractually required principal and interest at acquisition $ 348,756 $ 1,605 Non-accretable difference (expected losses and foregone interest) -- (848 ) Cash flows expected to be collected at acquisition 348,756 757 Accretable yield (8,663 ) -- Basis in acquired loans at acquisition $ 340,093 $ 757 The following is a summary of the loans acquired in the Liberty acquisition on February 27, 2015, as of the date of acquisition.(In thousands) Not Impaired Impaired Contractually required principal and interest at acquisition $ 774,777 $ 15,716 Non-accretable difference (expected losses and foregone interest) -- (4,978 ) Cash flows expected to be collected at acquisition 774,777 10,738 Accretable yield (4,869 ) 12 Basis in acquired loans at acquisition $ 769,908 $ 10,750 The following is a summary of the loans acquired in the Community First acquisition on February 27, 2015, as of the date of acquisition.(In thousands) Not Impaired Impaired Contractually required principal and interest at acquisition $ 1,153,255 $ 10,143 Non-accretable difference (expected losses and foregone interest) -- (3,247 ) Cash flows expected to be collected at acquisition 1,153,255 6,896 Accretable yield (23,712 ) 104 Basis in acquired loans at acquisition $ 1,129,543 $ 7,000 In additionnecessary to the accretable yield on acquired loans not considered to be impaired, the amount of the estimated cash flowsabsorb expected to be received from the purchased credit impaired loans in excess of the fair values recorded for the purchased credit impaired loans is referred to as the accretable yield. The accretable yield is recognized as interest incomelosses over the estimated lives of the loans. Each quarter, the Company estimates the cash flows expected to be collected from the acquired purchasedrespective financial instruments.The components of provision for credit impaired loans, and adjustments may or may not be required. This has resulted in an increase in interest income that is spread on a level-yield basis over the remaining expected lives of the loans. For those loans previously covered by FDIC loss share, the increases in expected cash flows also reduced the amount of expected reimbursements under the loss sharing agreements with the FDIC, which was recorded as indemnification assets. The estimated adjustments to the indemnification assets were amortized on a level-yield basis over the remainder of the loss-sharing agreements or the remaining expected lives of the loans, whichever was shorter. Because the Company’s loss share agreements with the FDIC have been terminated, there will be no further indemnification asset amortization in future quarters.101The impact of these adjustments on the Company’s financial resultslosses for the years ended December 31 2017, 2016were as follows:(In thousands) 2023 2022 2021 Provision for credit losses related to: Loans $ 47,424 $ (5,379) $ (31,209) Unfunded commitments (16,300) 19,453 — Securities - HTM 1,826 — (1,183) Securities - AFS 9,078 — (312) Total $ 42,028 $ 14,074 $ (32,704) Purchased Credit Deteriorated LoansPurchased loans that reflect a more-than-insignificant deterioration of credit from origination are considered PCD. For PCD loans, the initial estimate of expected credit losses is recognized in the allowance for credit loss on the date of acquisition using the same methodology as discussed in the Allowance for Credit Losses section included above.The following table provides a summary of loans purchased as part of the Spirit acquisition with credit deterioration at acquisition:(In thousands) Commercial Real
EstateCredit
CardOther
Consumer
and OtherTotal Unpaid principal balance $ 8,258 $ 66,534 $ — $ 59 $ 74,851 PCD allowance for credit loss at acquisition (6,433) (3,187) — (2) (9,622) Non-credit related discount (378) (998) — (1) (1,377) Fair value of PCD loans $ 1,447 $ 62,349 $ — $ 56 $ 63,852 108The following table provides a summary of loans purchased as part of the Landmark acquisition with credit deterioration at acquisition:(In thousands) Commercial Real
EstateCredit
CardOther
Consumer
and OtherTotal Unpaid principal balance $ 11,046 $ 55,549 $ — $ 67 $ 66,662 PCD allowance for credit loss at acquisition (350) (2,008) — (1) (2,359) Non-credit related discount (160) (2,415) — (2) (2,577) Fair value of PCD loans $ 10,536 $ 51,126 $ — $ 64 $ 61,726 The following table provides a summary of loans purchased as part of the Triumph acquisition with credit deterioration at acquisition:(In thousands) Commercial Real
EstateCredit
CardOther
Consumer
and OtherTotal Unpaid principal balance $ 40,466 $ 80,803 $ — $ 15 $ 121,284 PCD allowance for credit loss at acquisition (2,999) (8,093) — — (11,092) Non-credit related discount (279) (1,314) — (1) (1,594) Fair value of PCD loans $ 37,188 $ 71,396 $ — $ 14 $ 108,598 NOTE 6:RIGHT-OF-USE LEASE ASSETS AND LEASE LIABILITIESThe Company accounts for its leases in accordance with ASC Topic 842, Leases, which requires recognition of most leases, including operating leases, with a term greater than 12 months on the balance sheet. At lease commencement, the lease contract is reviewed to determine whether the contract is a finance lease or an operating lease; a lease liability is recognized on a discounted basis, related to the Company’s obligation to make lease payments; and 2015a right-of-use asset is shown below:(In thousands) 2017 2016 2015 Impact on net interest income $ 4,105 $ 3,072 $ 19,995 Non-interest income (1) -- -- (7,719 ) Net impact to pre-tax income 4,105 3,072 12,276 Net impact, net of taxes $ 2,495 $ 1,867 $ 7,461 (1)Negative non-interest income resulted from the amortization of the FDIC indemnification assets. Because the Company’s loss share agreements with the FDIC have been terminated, there will be no further indemnification asset amortization.These adjustmentsalso recognized related to the Company’s right to use, or control the use of, a specified asset for the lease term. The Company accounts for lease and non-lease components (such as taxes, insurance and common area maintenance costs) separately as such amounts are generally readily determinable under the lease contracts. Lease payments over the expected term are discounted using the Company’s FHLB advance rates for borrowings of similar term. If it is reasonably certain that a renewal or termination option will be recognizedexercised, the effects of such options are included in the determination of the expected lease term. Leases with an initial term of 12 months or less are not recorded on the balance sheet; the Company recognizes lease expense for these leases on a straight-line basis over the remaining liveslease term.The Company’s leases are classified as operating leases with a term, including expected renewal or termination options, greater than one year, and are related to certain office facilities and office equipment. The following table presents information as of December 31, 2023 and 2022 related to the purchased credit impaired loans. The accretable yield adjustments recordedCompany’s right-of-use lease assets, included in future periods will change as the Company continues to evaluate expected cash flows from the purchased credit impaired loans.Changespremises and equipment, and lease liabilities, included in the carrying amount of the accretable yield for all purchased impaired loans were as followsaccrued interest and other liabilities.(Dollars in thousands) 2023 2022 Right-of-use lease assets $ 67,267 $ 46,845 Lease liabilities 68,788 47,850 Weighted average remaining lease term 8.81 years 6.69 years Weighted average discount rate 3.52 % 2.41 % Operating lease cost for the years ended December 31, 2017, 20162023, 2022 and 2015.2021 was $15.7 million, $14.2 million, and $11.5 million, respectively.(In thousands) Accretable
Yield Carrying
Amount of
Loans Balance, January 1, 2015 $ 20,635 $ 169,098 Additions (116 ) 17,750 Accretable yield adjustments 6,593 -- Accretion (21,038 ) 21,038 Payments and other reductions, net (5,120 ) (184,417 ) Balance, December 31, 2015 954 23,469 Additions 19 757 Accretable yield adjustments 5,122 -- Accretion (4,440 ) 4,440 Payments and other reductions, net -- (10,864 ) Balance, December 31, 2016 1,655 17,802 Additions -- 13,793 Accretable yield adjustments 4,893 -- Accretion (5,928 ) 5,928 Payments and other reductions, net -- (20,407 ) Balance, December 31, 2017 $ 620 $ 17,116 Purchased impaired loans109The Company’s remaining undiscounted minimum lease payments on operating leases as of December 31, 2023 are evaluated on an individual borrower basis. Because some loans evaluated by the Company were determined to have experienced impairment in the estimated credit quality or cash flows, the Company recorded a provisionas follows:Year (In thousands) 2024 $ 13,064 2025 11,212 2026 10,147 2027 7,732 2028 6,792 Thereafter 33,044 Total undiscounted minimum lease payments 81,991 Less: Net present value adjustment 13,203 Lease liability included in other liabilities $ 68,788 NOTE 7:PREMISES AND EQUIPMENTPremises and established an allowance for loan losses for loans acquired resulting in a total allowance on loans acquired of $418,000equipment are stated at cost less accumulated depreciation and amortization. Total premises and equipment, net at December 31, 20172023 and $954,000 at December 31, 2016 and 2015.
2022 were as follows:102The purchase and assumption agreements for the FDIC-assisted acquisitions allowed for the FDIC to recover a portion of the funds previously paid out under the indemnification agreement in the event losses failed to reach the expected loss level under a claw back provision (“true-up provision”). The amount of the true-up provision for each acquisition was measured and recorded at Day 1 fair values. It was calculated as the difference between management’s estimated losses on covered loans and covered foreclosed assets and the loss threshold contained in each loss share agreement, multiplied by the applicable clawback provisions contained in each loss share agreement, then discounted back to net present value.Under the terms of the loss share termination agreement, the FDIC made a net payment of $2.4 million to Simmons Bank as consideration for early termination. The early termination was recorded in the Company’s financial statements by removing the FDIC indemnification asset, receivable from FDIC, the FDIC true-up provision and recording a one-time, pre-tax charge of $7.5 million.The following table presents a summary of the changes in the FDIC true-up provision for the year ended December 31, 2015 which were included in other assets on the balance sheet. Due to the termination of the FDIC agreements in September 2015 there was no amortization expense recorded for the years ended December 31, 2017 and 2016.(In thousands) FDIC True-up
Provision Balance, January 1, 2015 $ 8,308 Amortization expense 107 Adjustments related to changes in expected losses 720 Loss share termination agreement (9,135 ) Balance, December 31, 2015 $ -- (In thousands) 2023 2022 Right-of-use lease assets $ 67,267 $ 46,845 Premises and equipment: Land 122,093 122,841 Buildings and improvements 388,675 370,530 Furniture, fixtures and equipment 112,133 122,029 Software 61,242 70,984 Construction in progress 14,142 15,488 Accumulated depreciation and amortization (194,874) (199,976) Total premises and equipment, net $ 570,678 $ 548,741 NOTE 7:8:GOODWILL AND OTHER INTANGIBLE ASSETSGoodwill is tested annually, or more often than annually, if circumstances warrant, for impairment. If the implied fair value of goodwill is lower than its carrying amount, goodwill impairment is indicated, and goodwill is written down to its implied fair value. Subsequent increases in goodwill value are not recognized in the financial statements. Goodwill totaled $842.7 million$1.32 billion at December 31, 20172023 and $348.52022. Goodwill increased $1.2 million atduring the year ended December 31, 2016.The Company recorded $228.9 million, $238.0 million and $29.4 million of goodwill as a result of its acquisitions of OKSB, First Texas and Hardeman, respectively, partially offset by $4.1 million2023 primarily due to the salecontinued assessment of the Company’s propertyfair value and casualty insurance linesassumed tax position of business during the third quarter 2017. The Company recorded $21.5 million of goodwill during 2016 as a result of its CitizensSpirit acquisition. The Company recorded $95.2 million, $110.4 million and $13.3 million of goodwill during 2015 as a result of its acquisitions of Liberty, Community First and Ozark Trust, respectively. Goodwill impairment was neither indicated nor recorded in 2017, 20162023, 2022 or 2015. The goodwill recorded2021. During March of 2023, the Company’s share price began to decline as markets in the Citizens acquisition will be deductible for tax purposes.During 2022, the Company performed an annual goodwill impairment analysis and concluded no impairment existed. Additionally during 2022, the Company’s share price declined as markets in the United States responded to record inflation and other economic pressures. As a result of the effect on share price, the Company performed interim goodwill impairment assessments during the second, third and fourth quarters of 2022 and concluded no impairment existed during the periods.110While the goodwill impairment analysis indicated no impairment at December 31, 2023, the Company’s assessment depends on several assumptions which are dependent on market and economic conditions, and future changes in those conditions could impact the Company’s assessment in the future.Core deposit premiums represent the value of the relationships that acquired banks had with their deposit customers and are amortized over periods ranging from 10 years to 15 years and are periodically evaluated, at least annually, as to the recoverability of their carrying value. Core deposit premiumsOther intangible assets represent the value of $42.1 million, $7.3 million,other acquired relationships, including relationships with trust and $7.8 million were recorded during 2017 as part of the OKSB, First Texaswealth management customers, and Hardeman acquisitions, respectively. Core deposit premiums of $5.1 million were recorded in 2016 as part of the Citizens acquisition. Core deposit premiums of $11.3 million and $14.6 million were recorded in 2015 as part of the Community First and Liberty acquisitions, respectively. During the third quarter of 2015, the Company sold the Salina, Kansas banking operations and as a result reduced the related core deposit premium by $382,000.Intangible assets are being amortized over various periods ranging from 108 years to 15 years. The Company recorded $830,000 of intangible assets during 2017 related to the insurance operationsChanges in the Hardeman acquisition. The Company recorded $591,000carrying amount and accumulated amortization of intangible assets during 2016 related to the trust operations acquired in the Citizens acquisition. The Community First acquisition included an insurance line of businessCompany’s core deposit premiums and the Company recorded an intangible asset of $420,000 during 2015. Additionally, during 2015, the Company recorded $9.7 million of intangible related to the trust operations acquired in the Ozark Trust merger. Intangible assets decreased by $1.3 million due to the sale of insurance lines of business during the third quarter of 2017.The Company recorded $3.8 million of other intangible assets at December 31, 2023 and 2022 were as follows:(In thousands) 2023 2022 Core deposit premiums: Balance, beginning of year $ 116,016 $ 93,862 Acquisitions(1)— 36,500 Amortization (14,672) (14,346) Balance, end of year 101,344 116,016 Books of business and other intangibles: Balance, beginning of year 12,935 12,373 Acquisitions(2)— 2,131 Amortization (1,634) (1,569) Balance, end of year 11,301 12,935 Total other intangible assets, net $ 112,645 $ 128,951 _________________________(1) A core deposit premium of $36.5 million was recorded during 20172022 as part of the OKSBSpirit acquisition.
See Note 2, Acquisitions, for additional information on acquisitions.103Company’s goodwill and other intangibles (carryingCompany recorded $2.1 million during 2022 related to servicing assets acquired as part of the Spirit acquisition. See Note 2, Acquisitions, for additional information on acquisitions.The carrying basis and accumulated amortization)amortization of the Company’s other intangible assets at December 31, 20172023 and 20162022 were as follows:(In thousands) 2017 2016 Goodwill $ 842,651 $ 348,505 Core deposit premiums: Gross carrying amount 105,984 48,692 Accumulated amortization (16,659 ) (10,625 ) Core deposit premiums, net 89,325 38,067 Books of business intangible: Gross carrying amount 15,414 15,884 Accumulated amortization (2,827 ) (1,716 ) Books of business intangible, net 12,587 14,168 Other intangibles: Gross carrying amount 6,037 2,068 Accumulated amortization (1,878 ) (1,344 ) Other intangibles, net 4,159 724 Other intangible assets, net 106,071 52,959 Total goodwill and other intangible assets $ 948,722 $ 401,464 (In thousands) 2023 2022 Core deposit premiums: Gross carrying amount $ 187,467 $ 189,996 Accumulated amortization (86,123) (73,980) Core deposit premiums, net 101,344 116,016 Books of business and other intangibles: Gross carrying amount 22,068 22,068 Accumulated amortization (10,767) (9,133) Books of business and other intangibles, net 11,301 12,935 Total other intangible assets, net $ 112,645 $ 128,951 Core deposit premium amortization expense recorded for the years ended December 31, 2017, 20162023, 2022 and 20152021 was $6.0$14.7 million, $4.4$14.3 million and $3.9$12.1 million, respectively. Amortization expense recorded for purchased credit card relationshipsbooks of business and other intangibles was $1.6 million, $1.6 million, and $1.4 million for the years ended December 31, 2017, 20162023, 2022 and 2015 was $414,000. Book of business amortization expense recorded for the year ended December 31, 2017, 2016 and 2015 was $1.1 million, $1.1 million and $528,000,2021, respectively.111The Company’s estimated remaining amortization expense on intangiblesother intangible assets as of December 31, 20172023 is as follows:Year (In thousands) 2018 $ 11,355 2019 11,045 2020 11,032 2021 10,970 2022 10,918 Thereafter 50,751 Total $ 106,071 Year (In thousands) 2024 $ 15,403 2025 12,819 2026 12,346 2027 12,218 2028 11,312 Thereafter 48,547 Total $ 112,645 NOTE 8:9:TIME DEPOSITSTime deposits included approximately $735,970,000$1.73 billion and $600,280,000$1.08 billion of certificates of deposit of $100,000 or more, at December 31, 2017 and 2016, respectively. Of this total approximately $396,771,000 and $193,596,000 of certificates of deposit were over $250,000 at December 31, 20172023 and 2016,2022, respectively.Brokered time deposits were $159,586,000$2.90 billion and $7,040,000$2.75 billion at December 31, 20172023 and 2016,2022, respectively. Maturities of all time deposits at December 31, 2023 are as follows: 2018 – $966,158,000; 2019 – $660,371,000; 2020 – $170,969,000; 2021 – $75,599,000; 2022 – $59,633,000.Year (In thousands) 2024 $ 6,089,586 2025 287,651 2026 56,173 2027 6,705 2028 5,125 Thereafter 1,433 Total $ 6,446,673 Deposits are the Company'sCompany’s primary funding source for loans and investment securities. The mix and repricing alternatives can significantly affect the cost of this source of funds and, therefore, impact the interest margin.NOTE 10:INCOME TAXES104NOTE 9:INCOME TAXES(In thousands) 2017 2016 2015 Income taxes currently payable $ 38,732 $ 36,792 $ 19,301 Deferred income taxes 23,251 9,832 13,599 Provision for income taxes $ 61,983 $ 46,624 $ 32,900 (In thousands) 2023 2022 2021 Income taxes currently payable $ 28,006 $ 35,215 $ 50,369 Deferred income taxes (2,460) 14,933 10,937 Provision for income taxes $ 25,546 $ 50,148 $ 61,306 112The tax effects of temporary differences between the tax basis of assets and liabilities and their financial reporting amounts that give rise to deferred income tax assets and liabilities, and their approximate tax effects, are as follows as of December 31, 20172023 and 2016:2022:(In thousands) 2017 2016 (In thousands) 2023 2022 Deferred tax assets: Deferred tax assets: Loans acquired $ 19,885 $ 7,986 Allowance for loan losses 10,773 14,754 Allowance for credit losses Valuation of foreclosed assets 2,852 3,958 Tax NOLs from acquisition 7,821 13,077 Deferred compensation payable 2,433 2,785 Accrued equity and other compensation 5,302 8,107 Acquired securities 578 1,098 Unrealized loss on available-for-sale securities 6,107 9,559 Right-of-use lease liability Unrealized loss on AFS securities Allowance for unfunded commitments Other 8,813 7,101 Gross deferred tax assets 64,564 68,425 Deferred tax liabilities: Deferred tax liabilities: Goodwill and other intangible amortization (32,572 ) (29,601 ) Accumulated depreciation (8,945 ) (5,370 ) Right-of-use lease asset Unrealized gain on swaps Other (4,413 ) (5,877 ) Gross deferred tax liabilities (45,930 ) (40,848 ) Net deferred tax asset, included in other assets $ 18,634 $ 27,577 Net deferred tax asset A reconciliation of income tax expense at the statutory rate to the Company'sCompany’s actual income tax expense is shown below for the years ended December 31:(In thousands) 2017 2016 2015 Computed at the statutory rate (35%) $ 54,223 $ 50,203 $ 37,543 Increase (decrease) in taxes resulting from: State income taxes, net of federal tax benefit 1,582 2,121 2,097 Discrete items related to ASU 2016-09 (1,480 ) -- -- Tax exempt interest income (5,135 ) (5,112 ) (5,432 ) Impact of DTA remeasurement 11,471 -- -- Section 382 adjustment -- -- (2,293 ) Other differences, net 1,322 (588 ) 985 Actual tax provision $ 61,983 $ 46,624 $ 32,900 105(In thousands) 2023 2022 2021 Computed at the statutory rate $ 42,127 $ 64,378 $ 69,807 Increase (decrease) in taxes resulting from: State income taxes, net of federal tax benefit (983) 3,249 4,452 Discrete items related to share-based compensation 596 (74) (17) Tax exempt interest income (15,357) (14,484) (11,510) Tax exempt earnings on bank owned life insurance (2,607) (1,918) (1,212) Federal tax credits (218) (1,708) (2,260) Other differences, net 1,988 705 2,046 Actual tax provision $ 25,546 $ 50,148 $ 61,306 113The Company follows ASC Topic 740,Income Taxes, which prescribes a recognition threshold and a measurement attribute for the financial statement recognition and measurement of a tax position taken or expected to be taken in a tax return. Benefits from tax positions should be recognized in the financial statements only when it is more likely than not that the tax position will be sustained upon examination by the appropriate taxing authority that would have full knowledge of all relevant information. A tax position that meets the more-likely-than-not recognition threshold is measured at the largest amount of benefit that is greater than fifty percent likely of being realized upon ultimate settlement. Tax positions that previously failed to meet the more-likely-than-not recognition threshold should be recognized in the first subsequent financial reporting period in which that threshold is met. Previously recognized tax positions that no longer meet the more-likely-than-not recognition threshold should be derecognized in the first subsequent financial reporting period in which that threshold is no longer met. ASC Topic 740 also provides guidance on the accounting for and disclosure of unrecognized tax benefits, interest and penalties. The Company has no history of expiring net operating loss carryforwards and is projecting significant pre-tax and financial taxable income in 2018 and in future years. The Company expects to fully realize its deferred tax assets in the future.On December 22, 2017, the President signed tax reform legislation (the “2017 Act”) which includes a broad range of tax reform proposals affecting businesses, including corporate tax rates, business deductions, and international tax provisions. The 2017 Act reduces the corporate tax rate from 35% to 21% for tax years beginning after December 31, 2017. Under US GAAP, deferred tax assets and liabilities are required to be measured at the enacted tax rate expected to apply when temporary differences are to be realized or settled and the effect of a change in tax law is recorded discretely as a component of the income tax provision related to continuing operations in the period of enactment. As a result, we were required to remeasure our deferred taxes as of December 22, 2017 based upon the new 21% tax rate and the change was recorded in the 2017 income tax provision. The result of the tax reform resulted in a one-time non-cash adjustment to income of $11.5 million.On December 22, 2017, the SEC issued Staff Accounting Bulletin No. 118 (“SAB 118”), which provides guidance on accounting for the tax effects of the 2017 Act. SAB 118 provides a measurement period that should not extend beyond one year from the 2017 Act enactment date for companies to complete the accounting under ASC 740, Income Taxes. As such, the company’s financial results reflect the income tax effects for the 2017 Act for which the accounting under ASC 740 is complete and provisional amounts for those specific income tax effects of the 2017 Act for which the accounting under ASC 740 is incomplete but a reasonable estimate could be determined. The company did not identify items for which the income tax effects of the 2017 Act have not been completed and a reasonable estimate could not be determined as of December 31, 2017. The tax expense recorded in 2017 is a reasonable estimate based on published guidance available at this time and is considered provisional. The ultimate impact of the 2017 Act may differ from these estimates due to changes in interpretations and assumptions made by the Company, as well as additional regulatory guidance. Any adjustments will be reflected in the Company’s financial statements in future periods.In February 2018, the Financial Accounting Standards Board (“FASB”) issued Accounting Standard Update (“ASU”) No. 2018-02, Income Statement-Reporting Comprehensive Income (Topic 220) (“ASU 2018-02”), that allows a reclassification from accumulated other comprehensive income (“AOCI”) to retained earnings for stranded tax effects resulting from the 2017 Act. Current US GAAP requires the remeasurement of deferred tax assets and liabilities as a result of a change in tax laws or rates to be presented in net income from continuing operations. Consequently, the original deferred tax amount recorded through AOCI at the old rate will remain in AOCI despite the fact that its related deferred tax asset/liability will be reduced through continuing operations to reflect the new rate, resulting in “stranded” tax effects in AOCI. ASU 2018-02 requires a reclassification from AOCI to retained earnings for those stranded tax effects resulting from the newly enacted federal corporate income tax rate. As permitted, the Company elected to early adopt the provisions of ASU 2018-02 during the fourth quarter 2017, which resulted in a reclassification from AOCI to retained earnings in the amount of $3.0 million.The amount of unrecognized tax benefits may increase or decrease in the future for various reasons including adding amounts for current tax year positions, expiration of open income tax returns due to the statutes of limitation, changes in management’s judgment about the level of uncertainty, status of examinations, litigation and legislative activity and the addition or elimination of uncertain tax positions.Section 382 of the Internal Revenue Code imposes an annual limit on the ability of a corporation that undergoes an “ownership change” to use its U.S. net operating losses to reduce its tax liability. The Company closed a stock acquisitionhas engaged in 2015 that invoked thefour tax-free reorganization transactions in which acquired net operating losses are limited pursuant to Section 382 annual limitation. Approximately $35.6382. In total, approximately $39.4 million of federal net operating losses subject to the IRC SecSection 382 annual limitation are expected to be utilized by the company. TheCompany. All of the acquired net operating loss carryforwards expire between 2028 and 2035.The Company files income tax returns in the U.S. federal jurisdiction. The Company’s U.S. federal income tax returns are open and subject to examinations from the 20142020 tax year and forward. The Company’s various state income tax returns are generally open from the 20142020 and later tax return years based on individual state statute of limitations.106NOTE 10:11: SECURITIES SOLD UNDER AGREEMENTS TO REPURCHASEWe utilizeThe Company utilizes securities sold under agreements to repurchase to facilitate the needs of ourits customers and to facilitate secured short-term funding needs. Securities sold under agreements to repurchase are stated at the amount of cash received in connection with the transaction. We monitorThe Company monitors collateral levels on a continuous basis. WeThe Company may be required to provide additional collateral based on the fair value of the underlying securities. Securities pledged as collateral under repurchase agreements are maintained with ourthe Company’s safekeeping agents.The gross amount of recognized liabilities for repurchase agreements was $122.0$67.6 million and $102.4$152.4 million at December 31, 20172023 and 2016,2022, respectively. The remaining contractual maturity of the securities sold under agreements to repurchase in the consolidated balance sheets as of December 31, 20172023 and 20162022 is presented in the following tables. Remaining Contractual Maturity of the Agreements (In thousands) Overnight and
Continuous Up to 30 Days 30-90 Days Greater than
90 Days Total December 31, 2017 Repurchase agreements: U.S. Government agencies $ 122,019 $ -- $ -- $ -- $ 122,019 December 31, 2016 Repurchase agreements: U.S. Government agencies $ 101,647 $ -- $ -- $ 757 $ 102,404 107 Remaining Contractual Maturity of the Agreements (In thousands) Overnight and
ContinuousUp to 30 Days 30-90 Days Greater than
90 DaysTotal December 31, 2023 Repurchase agreements: U.S. Government agencies $ 67,569 $ — $ — $ — $ 67,569 December 31, 2022 Repurchase agreements: U.S. Government agencies $ 152,403 $ — $ — $ — $ 152,403 114NOTE 11:12:OTHER BORROWINGS AND SUBORDINATED NOTES AND DEBENTURES20172023 and 20162022 consisted of the following components.(In thousands) 2017 2016 Other Borrowings FHLB advances, net of discount, due 2018 to 2033, 1.20% to 7.37% secured by residential real estate loans $ 1,261,642 $ 225,230 Revolving credit agreement, due 10/5/2018, floating rate of 1.50% above the one month LIBOR rate, unsecured 75,000 -- Notes payable, due 10/15/2020, 3.85%, fixed rate, unsecured 43,382 47,929 Total other borrowings 1,380,024 273,159 Subordinated Debentures Trust preferred securities, due 12/30/2033, floating rate of 2.80% above the three month LIBOR rate, reset quarterly, callable without penalty 20,620 20,620 Trust preferred securities, net of discount, due 6/30/2035, floating rate of 1.75% above the three month LIBOR rate, reset quarterly, callable without penalty 9,327 9,225 Trust preferred securities, net of discount, due 9/15/2037, floating rate of 1.37% above the three month LIBOR rate, reset quarterly 10,284 10,130 Trust preferred securities, net of discount, due 12/5/2033, floating rate of 2.88% above the three month LIBOR rate, reset quarterly, callable without penalty 5,156 5,161 Trust preferred securities, net of discount, due 10/18/2034, floating rate of 2.00% above the three month LIBOR rate, reset quarterly, callable without penalty 5,148 5,105 Trust preferred securities, net of discount, due 6/6/2037, floating rate of 1.57% above the three month LIBOR rate, reset quarterly, callable without penalty 10,288 10,156 Trust preferred securities, due 12/15/2035, floating rate of 1.45% above the three month LIBOR rate, reset quarterly, callable without penalty 6,702 -- Trust preferred securities, due 6/26/2033, floating rate of 3.10% above the three month LIBOR rate, reset quarterly, callable without penalty 20,619 -- Trust preferred securities, due 10/7/2033, floating rate of 2.85% above the three month LIBOR rate, reset quarterly, callable without penalty 25,774 -- Trust preferred securities, due 9/15/2037, floating rate of 2.00% above the three month LIBOR rate, reset quarterly, callable without penalty 8,248 -- Other subordinated debentures, net of discount, due 9/30/2023, floating rate equal to daily average of prime rate, reset quarterly 18,399 -- Total subordinated debentures 140,565 60,397 Total other borrowings and subordinated debentures $ 1,520,589 $ 333,556 (In thousands) 2023 2022 Other Borrowings FHLB advances, net of discount, due 2024 to 2033, 4.56% to 5.68%, secured by real estate loans $ 953,222 $ 838,487 Other long-term debt 19,144 20,809 Total other borrowings 972,366 859,296 Subordinated Notes and Debentures Subordinated notes payable, due 4/1/2028, fixed-to-floating rate (fixed rate of 5.00% through 3/31/2023, floating rate of 2.15% above the three month LIBOR rate, reset quarterly)(1)330,000 330,000 Subordinated notes payable, net of premium adjustments, due 7/31/2030, fixed-to-floating rate (fixed rate of 6.00% through 7/30/2025, floating rate of 5.92% above the three month SOFR rate, reset quarterly) 37,171 37,285 Unamortized debt issuance costs (1,030) (1,296) Total subordinated notes and debentures 366,141 365,989 Total other borrowings and subordinated debt $ 1,338,507 $ 1,225,285 _________________________ (1) The Company transitioned from the three month London Interbank Offered Rate (“LIBOR”) to the three month Secured Overnight Financing Rate (“SOFR”), plus a comparable spread adjustment of 26.16 basis points, beginning with interest accrued on the notes from and after October 1, 2023.In connectionMarch 2018, the Company issued $330.0 million in aggregate principal amount, of 5.00% Fixed-to-Floating Rate Subordinated Notes (“Notes”) at a public offering price equal to 100% of the aggregate principal amount of the Notes. The Company incurred $3.6 million in debt issuance costs related to the offering during March 2018. The Notes will mature on April 1, 2028 and initially bore interest at a fixed rate of 5.00% per annum, payable semi-annually in arrears. From and including April 1, 2023 to, but excluding, the maturity date or the date of earlier redemption, the interest rate resets quarterly to an annual interest rate equal to the “then-current three month LIBOR rate” plus 215 basis points, payable quarterly in arrears, and the Company transitioned from the “then-current three month LIBOR rate” to the “three month SOFR, plus a comparable spread adjustment of 26.16 basis points,” beginning with interest accrued on the OKSBNotes from and First Texas acquisitions onafter October 19, 2017,1, 2023. The Notes will be subordinated in right of payment to the payment of the Company’s other existing and future senior indebtedness, including all of its general creditors. The Notes are obligations of the Company only and are not obligations of, and are not guaranteed by, any of its subsidiaries. The Company used a portion of the net proceeds from the sale of the Notes to repay certain outstanding indebtedness. The Notes qualify for Tier 2 capital treatment.The Company assumed subordinated debt in an aggregate principal amount, net of discounts,premium adjustments, of $75.9 million. The Company assumed subordinated debt of $6.7$37.4 million in connection with the HardemanSpirit acquisition in May 15, 2017.In October 2017,April 2022 (the “Spirit Notes”). The Spirit Notes will mature on July 31, 2030, and initially bear interest at a fixed annual rate of 6.00%, payable quarterly, in arrears, to, but excluding, July 31, 2025. From and including July 31, 2025, to, but excluding, the Company entered intomaturity date or earlier redemption date, the interest rate will reset quarterly to an interest rate per annum equal to a Revolving Credit Agreement (the “Credit Agreement”) with U.S. Bank National Association and executed an unsecured Revolving Credit Note pursuantbenchmark rate, which is expected to whichbe the Company may borrow, prepay and re-borrow up to $75.0 million, the proceeds of which were primarily used to pay off amounts outstanding under a term note assumed with the First Texas acquisition. The Credit Agreement contains customary representations, warranties, and covenants of the Company, including, among other things, covenants that impose various financial ratio requirements. The line of credit available to the Company under the Credit Agreement expires on October 5, 2018, at which time all amounts borrowed, together with applicable interest, fees, and other amounts owedthen-current three-month SOFR rate, as published by the Company shallFederal Reserve Bank of New York (provided, that in the event the benchmark rate is less than zero, the benchmark rate will be due and payable.During October 2015, the Company borrowed $52.3 million from correspondent banks at a rate of 3.85% withdeemed to be zero) plus 592 basis points, payable quarterly, principal and interest payments. The debt has a 10 year amortization with a 5 year balloon payment due in October 2020. The Company used approximately $36.0 million of this borrowing to refinance the debt issued during 2013 that was used to partially fund the acquisition of Metropolitan.
arrears.108At December 31, 2017, the Company had $1.1 billion of Federal Home Loan Bank (“FHLB”) advances outstanding with original maturities of one year or less.The Company had total FHLB advances of $1.3 billion$953.2 million and $838.5 million at December 31, 2017, with approximately $2.258 billion of additional2023 and 2022, respectively, which are primarily fixed rate, fixed term advances, availablewhich are due less than one year from origination and therefore are classified as short-term advances by the FHLB. TheCompany. At December 31, 2023, the FHLB advances areoutstanding were secured by mortgage loans and investment securities totaling approximately $3.785$6.94 billion at December 31, 2017.Theand the Company had approximately $5.40 billion of additional advances available from the FHLB.115During the third quarter of 2022, the Company redeemed the five issuances of trust preferred securities are tax-advantaged issues that qualified for Tier 1 capital treatment until December 31, 2017, whenwhich had an outstanding aggregate principal amount of $56.2 million. The Company recorded a loss of $365,000 related to the Company reached $15 billion in assets. They still qualify for inclusion as Tier 2 capital at December 31, 2017. Distributions on these securities are included in interest expense on long-term debt.early retirement of debt, which represented the unamortized purchase discounts associated with the previously acquired trust preferred securities. Each of the trusts iswas a statutory business trust organized for the sole purpose of issuing trust securities and investing the proceeds thereof in junior subordinated debentures of the Company, the sole asset of each trust. The preferred securities of each trust representrepresented preferred beneficial interests in the assets of the respective trusts and arewere subject to mandatory redemption upon payment of the junior subordinated debentures held by the trust. The common securities of each trust arewere wholly-owned by the Company. Each trust’s ability to pay amounts due on theThe trust preferred securities is solely dependent upon the Company making payment on the related junior subordinated debentures. The Company’s obligations under the junior subordinated securities and other relevant trust agreements, in aggregate, constitute a full and unconditional guarantee by the Company of each respective trust’s obligations under the trust securities issued by each respective trust.The Company’s long-term debt primarily includes subordinated debt and other notes payable and FHLB advances with an original maturity of greater than one year.payable. Aggregate annual maturities of long-term debt at December 31, 20172023, are as follows:Year (In thousands) 2018 $ 23,093 2019 7,486 2020 36,222 2021 2,165 2022 1,314 Thereafter 148,307 Total $ 218,587 Year (In thousands) 2024 $ 1,822 2025 1,822 2026 1,824 2027 1,920 2028 332,210 Thereafter 48,909 Total $ 388,507 NOTE 12:13:CAPITAL STOCKOn February 27, 2009, at a special meeting, the Company’s shareholders approved an amendment to the Articles of Incorporation to establish 40,040,000 authorized shares of preferred stock, $0.01 par value. TheOn April 27, 2022, the Company’s shareholders approved an amendment to the Company’s Articles of Incorporation to remove an $80.0 million cap on the aggregate liquidation preference associated with the preferred stock and increase the number of allauthorized shares of preferred stock cannot exceed $80,000,000. On January 18, 2018, the board of directors of the Company approved a two-for-one stock split of the Corporation’s outstandingCompany’s Class A common stock from 175,000,000 to 350,000,000.On October 29, 2019, the Company filed Amended and Restated Articles of Incorporation (“CommonOctober Amended Articles”) with the Arkansas Secretary of State. The October Amended Articles classified and designated Series D Preferred Stock, Par Value $0.01 Per Share (“Series D Preferred Stock”) in the form of a 100% stock dividend for shareholders of record as, out of the close of business on JanuaryCompany’s authorized preferred stock. On November 30, 2018 (“Record Date”). The new shares were distributed by the Company’s transfer agent, Computershare, and the Company’s common stock began trading on a split-adjusted basis on the NASDAQ Global Select Market on February 9, 2018. All previously reported share and per share data included in filings subsequent to the Payment Date are restated to reflect the retroactive effect of this two-for-one stock split.On February 27, 2015, as part of the acquisition of Community First, the Company issued 30,852 shares of Senior Non-Cumulative Perpetual Preferred Stock, Series A (“Simmons Series A Preferred Stock”) in exchange for the outstanding shares of Community First Senior Non-Cumulative Perpetual Preferred Stock, Series C (“Community First Series C Preferred Stock”). The preferred stock was held by the United States Department of the Treasury (“Treasury”) as the Community First Series C Preferred Stock was issued when Community First entered into a Small Business Lending Fund Securities Purchase Agreement with the Treasury. The Simmons Series A Preferred Stock qualified as Tier 1 capital and paid quarterly dividends. The rate remained fixed at 1% through February 18, 2016, at which time it would convert to a fixed rate of 9%. On January 29, 2016,2021, the Company redeemed all of the preferred stock,Series D Preferred Stock, including accrued and unpaid dividends.On March 31, 2021, the Company filed a shelf registration with the SEC. The shelf registration statement provides increased flexibility and more efficient access to raise capital from time to time through the sale of common stock, preferred stock, debt securities, depository shares, warrants, purchase contracts, purchase units, subscription rights, units or a combination thereof, subject to market conditions. Specific terms and prices are determined at the time of any offering under a separate prospectus supplement that the Company is required to file with the SEC at the time of the specific offering. Effective July 23, 2012,2021, the CompanyCompany’s Board of Directors approved aan amendment to the Company’s stock repurchase program which authorizedoriginally established in October 2019 (“2019 Program”) that increased the repurchaseamount of up to 850,000 shares (split adjusted) ofthe Company’s Class A common stock or approximately 5%that may be repurchased under the 2019 Program from a maximum of $180.0 million to a maximum of $276.5 million and extended the term of the 2019 Program from October 31, 2021, to October 31, 2022.During January 2022, the Company substantially exhausted the repurchase capacity under the 2019 Program. As a result, the Company’s Board of Directors authorized a new stock repurchase program in January 2022 (“2022 Program”) under which the Company may repurchase up to $175.0 million of its Class A common stock currently issued and outstanding. Because the 2022 Program was set to terminate on January 31, 2024, the Company’s Board of Directors authorized a new stock repurchase program in January 2024 (“2024 Program”) under which the Company may repurchase up to $175.0 million of its Class A common stock currently issued and outstanding.116During 2023, the Company repurchased 2,257,049 shares outstanding.at an average price of $17.72 per share under the 2022 Program. Market conditions and the Company’s capital needs will drive decisions regarding additional, future stock repurchases. During 2022, the Company repurchased 513,725 shares at an average price of $31.25 per share under the 2019 Program and 3,919,037 shares at an average price of $24.26 per share under the 2022 Program, respectively. The 2022 Program repurchases were all completed during the second and third quarters of 2022.Under the 2024 Program, which replaced the 2022 Program, the Company may repurchase shares are to be purchased from time to time at prevailing market prices,of its common stock through open market or unsolicitedand privately negotiated transactions depending uponor otherwise. The timing, pricing, and amount of any repurchases under the 2024 Program will be determined by the Company’s management at its discretion based on a variety of factors, including, but not limited to, trading volume and market conditions. Underprice of the repurchase program, there is no time limit forCompany’s common stock, corporate considerations, the stock repurchases, nor is there a minimum number of shares thatCompany’s working capital and investment requirements, general market and economic conditions, and legal requirements. The 2024 Program does not obligate the Company intends to repurchase. The Companyrepurchase any common stock and may discontinue purchasesbe modified, discontinued, or suspended at any time that management determines additional purchases are not warranted.without prior notice. The Company intendsanticipates funding for this 2024 Program to use the repurchased shares to satisfy stock option exercises, paymentcome from available sources of liquidity, including cash on hand and future stock awards and dividends and general corporate purposes.
cash flow.109NOTE 13:14:TRANSACTIONS WITH RELATED PARTIESAt December 31, 20172023 and 2016,2022, Simmons Bank had extensions of credit to executive officers and directors and to companies in which Simmons Bank’s executive officers or directors were principal owners in the amount of $58.9$3.2 million in 2017at December 31, 2023 and $65.8$3.7 million in 2016.at December 31, 2022.(In thousands) 2017 2016 (In thousands) 2023 2022 Balance, beginning of year $ 65,834 $ 58,404 New extensions of credit 9,092 18,298 Repayments (16,059 ) (10,868 ) Balance, end of year $ 58,867 $ 65,834 In management'smanagement’s opinion, such loans and other extensions of credit, deposits and depositsvendor contracts (which were not material) were made in the ordinary course of business and were made on substantially the same terms (including interest rates and collateral) as those prevailing at the time for comparable transactions with other persons.unrelated persons or through a competitive bid process. Further, in management'smanagement’s opinion, these extensions of credit did not involve more than the normal risk of collectability or present other unfavorable features.117NOTE 14:15:EMPLOYEE BENEFIT PLANSRetirement Plans Retirement PlansThe Company hasoffers a qualified 401(k) retirement plan thatPlan in which the Company makes matching contributions to encourage employees to save money for their retirement. The 401(k) Plan covers substantially all employees. TheUnder the terms of the 401(k) Plan, employees may defer a portion of their eligible pay, up to the maximum allowed by I.R.S. regulation, and the Company has also historically hadmatches 100% of the first 3% of compensation and 50% of the next 2% of compensation for a discretionary profit sharing and employee stock ownership plan (“ESOP”) covering substantially all employees. Effective December 31, 2016,total match of 4% of eligible pay for each participant who defers 5% or more of his or her eligible pay. Additionally, the ESOP was merged intoCompany may make profit-sharing contributions to the Company’s 401(k) retirement plan. This merger allowsPlan which are allocated among participants based upon 401(k) Plan compensation without regard to fully diversify their ESOP account balance and have reporting access to all retirement account balances in one place.participant contributions. Contribution expense to the plansplan totaled $6,343,000, $5,488,000$11.9 million, $13.0 million and $6,278,000$13.9 million in 2017, 20162023, 2022 and 2015,2021, respectively.The Company also provides deferred compensation agreements with certain active and retired officers. The agreements provide monthly payments of retirement compensation for either stated periods or for the life of the participant. There was a $316,000 benefit to income related to the plans for 2023. This benefit was primarily due to a reduction in the present value of the liability resulting from a significant increase in the discount factor used, as compared to previous years. The Company also reversed the accrued unvested liability during 2023 related to a former participant. The charges to income for the plans were $1,596,000$2.2 million for 2017, $1,056,0002022 and $2.7 million for 2016 and $804,000 for 2015.2021. Such charges reflect the straight-line accrual over the employment period of the present value of benefits due each participant, as of their full eligibility date, using an appropriate discount factor.Employee Stock Purchase PlanThe Company established an Employee Stock Purchase Plan in 2015 which generally allows participants to make contributions of up to $25,000 per year, for the purpose of acquiring the Company’s common stock. At the end of each plan year, full shares of the Company’s stock are purchased for each employee based on that employee’s contributions. The Company has issued both general and special stock offerings under the plan. Substantially all employees are eligible for the general stock offering, under which full shares of the Company’s stock are purchased for an amount equal to 95% of their fair market value at the end of the plan year, or, if lower, 95% of their fair market value at the beginning of the plan year.The special stock offering is available to substantially all non-highly compensated employees with at least six months of service, and these employees may allocate up to $10,000 to this offering. Under the special stock offering, full shares of the Company’s stock are purchased for an amount equal to 85% of their fair market value at the end of the plan year, or, if lower, 85% of their fair market value at the beginning of the plan year.110Stock-Based Compensation PlansThe Company’s Board of Directors has adopted various stock-based compensation plans. The plans provide for the grant of incentive stock options, nonqualified stock options, stock appreciation rights, restricted stock awards, restricted stock units and bonusperformance stock awards.units. Pursuant to the plans, shares are reserved for future issuance by the Company upon exercise of stock options or awardingawards of bonus sharesrestricted stock, restricted stock units, or performance stock units granted to directors, officers and other key employees.Stock-based compensation expense for all stock-based compensation awards granted after January 1, 2006, is based on the grant date fair value. For all awards except stock option awards, the grant date fair value is the market value per share as of the grant date. For stock option awards, the fair value is estimated at the date of grant using the Black-Scholes option-pricing model. This model requires the input of highly subjective assumptions, changes to which can materially affect the fair value estimate. Additionally, there may be other factors that would otherwise have a significant effect on the value of employee stock options granted but are not considered by the model. Accordingly, while management believes that the Black-Scholes option-pricing model provides a reasonable estimate of fair value, the model does not necessarily provide the best single measure of fair value for the Company'sCompany’s employee stock options.118The fair value of each option award is estimated on the date of grant using the Black-Scholes option-pricing model that uses various assumptions. Expected volatility is based on historical volatility of the Company’s stock and other factors. The Company uses historical data to estimate option exercise and employee termination within the valuation model. The expected term of options granted is derived from the output of the option valuation model and represents the period of time that options granted are expected to be outstanding. The risk-free rate for periods within the contractual life of the option is based on the U.S. Treasury yield curve in effect at the time of grant. Forfeitures are estimated at the time of grant, and are based partially on historical experience.111Share and per share information regarding Stock-Based Compensation Plans has been adjusted to reflect the effects of the Company’s two-for-one stock split which became effective on February 8, 2018. The table below summarizes the transactions under the Company'sCompany’s active stock compensation plans at December 31, 2017, 20162023, 2022 and 2015,2021, and changes during the years then ended: Stock Options
Outstanding Stock Awards
Outstanding Stock Units
Outstanding Number
of Shares
(000) Weighted
Average
Exercise
Price Number
of Shares
(000) Weighted
Average
Exercise
Price Number
of Shares
(000) Weighted
Average
Exercise
Price Balance, December 31, 2014 240 $ 13.86 454 $ 15.94 -- $ -- Granted 750 22.35 190 21.73 40 18.58 Stock Options Exercised (142 ) 11.29 -- -- -- -- Stock Options from Acquisitions 132 10.22 -- -- -- -- Stock Awards/Units Vested -- -- (262 ) 17.39 -- -- Forfeited/Expired (10 ) 12.25 (40 ) 17.68 -- -- Balance, December 31, 2015 970 20.31 342 17.83 40 18.58 Granted 116 23.51 272 23.46 216 23.48 Stock Options Exercised (128 ) 15.14 -- -- -- -- Stock Awards/Units Vested -- -- (318 ) 20.96 (25 ) 22.77 Forfeited/Expired (12 ) 17.53 (18 ) 21.85 (6 ) 23.51 Balance, December 31, 2016 946 21.43 278 20.48 225 22.70 Granted -- -- -- -- 849 28.86 Stock Options Exercised (122 ) 17.66 -- -- -- -- Stock Awards/Units Vested -- -- (91 ) 19.40 (392 ) 27.13 Forfeited/Expired (12 ) 22.67 (25 ) 21.91 (30 ) 25.76 Balance, December 31, 2017 812 $ 21.98 162 $ 20.86 652 $ 27.92 Exercisable, December 31, 2017 711 $ 21.85 Stock Options
OutstandingNon-vested Stock Awards Outstanding Non-vested Stock Units Outstanding (1)(Shares in thousands) Number of Shares Weighted
Average
Exercise
PriceNumber of Shares Weighted Average Grant-Date Fair Value Number of Shares Weighted Average Grant-Date Fair Value Balance, December 31, 2020 658 $ 22.48 5 $ 22.35 1,032 $ 24.53 Granted — — — — 674 28.94 Stock options exercised (185) 22.42 — — — — Stock awards/units vested (earned) — — (3) 22.48 (434) 25.61 Forfeited/expired — — — — (87) 25.86 Balance, December 31, 2021 473 22.50 2 22.20 1,185 26.51 Granted — — — — 719 26.42 Stock options exercised (3) 13.30 — — — — Stock awards/units vested (earned) — — (2) 22.20 (609) 26.30 Forfeited/expired — — — — (98) 25.68 Balance, December 31, 2022 470 22.56 — — 1,197 26.63 Granted — — — — 798 21.15 Stock options exercised (1) 10.65 — — — — Stock awards/units vested (earned) — — — — (490) 24.73 Forfeited/expired (22) 22.87 — — (232) 24.81 Balance, December 31, 2023 447 $ 22.56 — $ — 1,273 $ 24.23 Exercisable, December 31, 2023 447 $ 22.56 _________________________(1) All stock units (including performance stock units).119The following table summarizes information about stock options under the plans outstanding at December 31, 2017:2023: Options Outstanding Options Exercisable Range of
Exercise Prices Number
of Shares
(000) Weighted
Average
Remaining
Contractual
Life (Years) Weighted
Average
Exercise
Price Number
of Shares
(000) Weighted
Average
Exercise
Price $8.78 - $10.57 7 2.36 $ 9.64 7 $ 9.64 10.65 - 10.65 7 5.06 10.65 4 10.65 10.76 - 10.76 3 2.05 10.76 3 10.76 15.16 - 15.16 36 0.41 15.16 36 15.16 20.29 - 20.29 78 7.00 20.29 78 20.29 20.36 - 20.36 3 6.88 20.36 2 20.36 22.20 - 22.20 82 6.93 22.20 57 22.20 22.75 - 22.75 481 7.15 22.75 481 22.75 23.51 - 23.51 108 7.82 23.51 36 23.51 24.07 - 24.07 7 7.71 24.07 7 24.07 $8.78 - $24.07 812 6.83 $ 21.98 711 $ 21.85 Options Outstanding Options Exercisable Range of Exercise Prices Number
of Shares
(In thousands)Weighted
Average
Remaining
Contractual
Life (Years)Weighted
Average
Exercise
PriceNumber
of Shares
(In thousands)Weighted
Average
Exercise
Price$ 20.29 — $ 20.29 47 0.90 $20.29 47 $20.29 22.20 — 22.20 51 1.24 22.20 51 22.20 22.75 — 22.75 274 1.46 22.75 274 22.75 23.51 — 23.51 68 1.89 23.51 68 23.51 24.07 — 24.07 7 1.71 24.07 7 24.07 $ 20.29 — $ 24.07 447 1.45 $22.56 447 $22.56 The table below summarizes the Company’s performance stock unit activity for the years ended December 31, 2023, 2022 and 2021:(In thousands) 112Performance Stock Units Non-vested, December 31, 2020 222 Granted 171 Vested (earned) (57) Forfeited (5) Non-vested, December 31, 2021 331 Granted 184 Vested (earned) (149) Forfeited (14) Non-vested, December 31, 2022 352 Granted 302 Vested (earned) (72) Forfeited (90) Non-vested, December 31, 2023 492 Stock-based compensation expense was $11,763,000$12.2 million in 2017, $5,451,0002023, $15.3 million in 20162022 and $4,018,000$15.9 million in 2015.2021. Stock-based compensation expense is recognized ratably over the requisite service period for all stock-based awards. There was $264,000 ofno unrecognized stock-based compensation expense related to stock options at December 31, 2017.2023. Unrecognized stock-based compensation expense related to non-vested stock awards and stock units was $23.3$14.5 million at December 31, 2017.2023. At such date, the weighted-average period over which this unrecognized expense is expected to be recognized was 2.31.4 years.TheThere was no intrinsic value of stock options outstanding and stock options exercisable at December 31, 2017 was $5,342,000 and $4,761,000.2023. Aggregate intrinsic value represents the difference between the Company’s closing stock price on the last trading day of the period, which was $28.55$19.84 at December 31, 2017,2023, and the exercise price multiplied by the number of options outstanding. There were 122,012900 stock options exercised in 2017,2023 with an intrinsic value of $1,329,000.$8,000. There were 127,4242,750 stock options exercised in 2016,2022 with no intrinsic value. There were 184,888 stock options exercised in 2021 with an intrinsic value of $2,031,000. There were 142,736 stock options exercised in 2015, with an intrinsic value of $2,054,000. The fair value of the Company’s employee stock options granted is estimated on the date of grant using the Black-Scholes option-pricing model. This model requires the input of highly subjective assumptions, changes to which can materially affect the fair value estimate. There were no stock options granted during the year ended December 31, 2017. The weighted-average fair value of stock options granted during the year ended December 31, 2016 was $5.82 per share. The weighted-average fair value of stock options granted during the year ended December 31, 2015 was $3.91 per share. The Company estimated expected market price volatility and expected term of the options based on historical data and other factors. The weighted-average assumptions used to determine the fair value of options granted for the years ended December 31, 20162023, 2022 and 2015 are detailed in the table below:2021. 2016 2015 Expected dividend yield 1.96 % 2.06 % Expected stock price volatility 27.34 % 16.96 % Risk-free interest rate 2.01 % 2.17 % Expected life of options (in years) 7 10 120NOTE 15:16:ADDITIONAL CASH FLOW INFORMATIONThe following is a summary of the Company’s additional cash flow information during the years ended December 31:(In thousands) 2017 2016 2015 Interest paid $ 39,384 $ 22,069 $ 21,700 Income taxes paid 35,770 39,824 20,127 Transfers of loans not covered by FDIC loss share to foreclosed assets and other real estate owned 6,983 4,604 16,456 Transfers of loans acquired covered by FDIC loss share to foreclosed assets covered by FDIC loss share -- -- 4,349 Transfers of foreclosed assets covered by FDIC loss share to foreclosed assets and other real estate owned -- -- 13,895 Transfers of loans acquired covered by FDIC loss share to loans acquired not covered by FDIC loss share -- -- 88,922 Transfers of premises to foreclosed assets and other real estate owned 5,422 -- -- Transfers of premises held for sale to foreclosed assets and other real estate owned 3,188 652 6,126 113(In thousands) 2023 2022 2021 Interest paid $ 540,816 $ 134,980 $ 82,914 Income taxes paid 20,948 25,084 55,202 Transfers of loans to foreclosed assets held for sale 3,075 1,219 4,322 Transfer of premises held for sale to other real estate owned — — 4,368 Transfer of premises held for sale to premises — — 5,610 Transfers of assets held for sale to other assets — 100 — Transfers of available-for-sale to held-to-maturity securities — 1,992,542 500,809 In connection with the OKSB, First Texas, Hardeman, Citizens, Community First, Liberty, and Ozark Trust acquisitions, accounted for by using the purchase method, the Company acquired assets and assumed liabilities as follows:(In thousands) 2017 2016 2015 Assets acquired $ 5,582,495 $ 585,500 $ 2,996,228 Liabilities assumed 5,022,824 530,695 2,680,140 Purchase price 1,055,993 76,300 535,003 Goodwill $ 496,322 $ 21,495 $ 218,915 16:17:OTHER INCOME AND OTHER OPERATING EXPENSESOther income for the years ended December 31, 2023 and 2022 was $35.4 million and $27.4 million, respectively. Other income for the year ended December 31, 2023 included a $4.0 million legal reserve recapture associated with previously disclosed legal matters. Other income for the year ended December 31, 2021 was $35.3 million and included the gain on sale related to the Illinois Branch Sale of $5.3 million.Other operating expenses consistconsisted of the following:(In thousands) 2017 2016 2015 Professional services $ 19,500 $ 14,630 $ 9,583 Postage 4,686 4,599 4,219 Telephone 4,262 4,294 4,817 Credit card expense 12,188 11,328 9,157 Marketing 11,141 6,929 6,337 Operating supplies 1,980 1,824 2,395 Amortization of intangibles 7,668 5,945 4,889 Branch right sizing expense 434 3,600 3,297 Other expense 27,020 20,364 20,001 Total other operating expenses $ 88,879 $ 73,513 $ 64,695 The Company had aggregate annual equipment rental expense of approximately $2.2 million in 2017, $2.3 million in 2016 and $2.6 million in 2015. The Company leasesfollowing during the majority of its ATMs, accounting for approximately $1,335,000, $1,338,000 and $1,463,000 of the 2017, 2016 and 2015, respectively, of rental expense. The Company had aggregate annual occupancy rental expense of approximately $5,580,000 in 2017, $4,643,000 in 2016 and $4,216,000 in 2015.(In thousands) 2023 2022 2021 Professional services $ 19,612 $ 19,138 $ 18,921 Postage 9,458 8,955 8,276 Telephone 6,965 6,394 6,234 Credit card expense 13,243 12,243 11,112 Marketing 24,008 28,870 22,234 Software and technology 42,530 40,906 40,608 Operating supplies 2,591 2,556 2,766 Amortization of intangibles 16,306 15,915 13,494 Branch right sizing expense 5,467 3,475 (537) Other expense 36,984 41,241 30,454 Total other operating expenses $ 177,164 $ 179,693 $ 153,562 121NOTE 17:18:FAIR VALUE MEASUREMENTSASC Topic 820, Fair Value Measurements defines fair value, establishes a framework for measuring fair value and expands disclosures about fair value measurements.ASC Topic 820 defines fair value as the price that would be received to sell an asset or paid to transfer a liability in an orderly transaction between market participants at the measurement date. The guidance also establishes a fair value hierarchy that requires the use of observable inputs and minimizes the use of unobservable inputs when measuring fair value. ASC Topic 820 describes three levels of inputs that may be used to measure fair value:·Level 1 Inputs – Quoted prices in active markets for identical assets or liabilities.·Level 2 Inputs – Observable inputs other than Level 1 prices, such as quoted prices for similar assets or liabilities in active markets; quoted prices for similar assets or liabilities in markets that are not active; or other inputs that are observable or can be corroborated by observable market data for substantially the full term of the assets or liabilities.·Level 3 Inputs – Unobservable inputs that are supported by little or no market activity and that are significant to the fair value of the assets or liabilities.•Level 1 Inputs – Quoted prices in active markets for identical assets or liabilities.•Level 2 Inputs – Observable inputs other than Level 1 prices, such as quoted prices for similar assets or liabilities in active markets; quoted prices for similar assets or liabilities in markets that are not active; or other inputs that are observable or can be corroborated by observable market data for substantially the full term of the assets or liabilities.•Level 3 Inputs – Unobservable inputs that are supported by little or no market activity and that are significant to the fair value of the assets or liabilities.In general, fair value is based upon quoted market prices, where available. If such quoted market prices are not available, fair value is based upon internally developed models that primarily use, as inputs, observable market-based parameters. Valuation adjustments may be made to ensure that financial instruments are recorded at fair value. These adjustments may include amounts to reflect counterparty credit quality and the Company’s creditworthiness, among other things, as well as unobservable parameters. Any such valuation adjustments are applied consistently over time. The Company’s valuation methodologies may produce a fair value calculation that may not be indicative of net realizable value or reflective of future fair values. While management believes the Company’s valuation methodologies are appropriate and consistent with other market participants, the use of different methodologies or assumptions to determine the fair value of certain financial instruments could result in a different estimate of fair value at the reporting date. Furthermore, the reported fair value amounts have not been comprehensively revalued since the presentation dates, and therefore, estimates of fair value after the balance sheet date may differ significantly from the amounts presented herein. A more detailed description of the valuation methodologies used for assets and liabilities measured at fair value, as well as the general classification of such instruments pursuant to the valuation hierarchy, is set forth below.114Following is a description of the inputs and valuation methodologies used for assets measured at fair value on a recurring basis and recognized in the accompanying consolidated balance sheets, as well as the general classification of such assets pursuant to the valuation hierarchy.Available-for-sale securities– Where quoted market prices are available in an active market, securities are classified within Level 1 of the valuation hierarchy. Level 1 securities would include highly liquid government bonds, mortgage products and exchange traded equities.certain other financial products. Other securities classified as available-for-sale are reported at fair value utilizing Level 2 inputs. For these securities, the Company obtains fair value measurements from an independent pricing service. The fair value measurements consider observable data that may include dealer quotes, market spreads, cash flows, the U.S. Treasury yield curve, live trading levels, trade execution data, market consensus prepayment speeds, credit information and the security’s terms and conditions, among other things. In order to ensure the fair values are consistent with ASC Topic 820, wethe Company periodically checkchecks the fair values by comparing them to another pricing source, such as Bloomberg. The availability of pricing confirms Level 2 classification in the fair value hierarchy. The third-party pricing service is subject to an annual review of internal controls (SSAE 16), which is made available to us for our review.controls. In certain cases where Level 1 or Level 2 inputs are not available, securities are classified within Level 3 of the hierarchy. The Company’s investment in U.S. Treasury securities, if any, is reported at fair value utilizing Level 1 inputs. The remainder of the Company'sCompany’s available-for-sale securities are reported at fair value utilizing Level 2 inputs.AssetsMortgage loans held in trading accountsfor sale – The Company’s assetsMortgage loans held in trading accountsfor sale are reported at fair value utilizingon an aggregate basis. Adjustments to fair value are recognized monthly and reflected in earnings. In determining the fair value of loans held for sale, the Company may consider outstanding investor commitments, discounted cash flow analyses with market assumptions or the fair value of the collateral if the loan is collateral dependent. Such loans are classified within either Level 2 inputs.Derivative instruments – The Company’s derivative instruments are reported at fair value utilizing Level 2 inputs. The Company obtains fair value measurements from dealer quotes.115122The following table sets forth the Company’s financial assets by level within the fair value hierarchy that were measured at fair value on a recurring basis as of December 31, 20172023 and 2016.2022. Fair Value Measurements (In thousands) Fair Value Quoted Prices in
Active Markets for
Identical Assets
(Level 1) Significant Other
Observable Inputs
(Level 2) Significant
Unobservable Inputs
(Level 3) December 31, 2017 Available-for-sale securities U.S. Government agencies $ 139,724 $ -- $ 139,724 $ -- Mortgage-backed securities 1,187,317 -- 1,187,317 -- States and political subdivisions 143,165 -- 143,165 -- Other securities 119,311 -- 119,311 -- Other assets held for sale 165,780 -- -- 165,780 Derivative asset 3,634 -- 3,634 -- Other liabilities held for sale (157,366 ) -- -- (157,366 ) Derivative liability (3,068 ) -- (3,068 ) -- December 31, 2016 Available-for-sale securities U.S. Treasury $ 300 $ 300 $ -- $ -- U.S. Government agencies 137,771 -- 137,771 -- Mortgage-backed securities 868,324 -- 868,324 -- States and political subdivisions 102,943 -- 102,943 -- Other securities 48,016 -- 48,016 -- Assets held in trading accounts 41 -- 41 -- Derivative asset 1,199 -- 1,199 -- Derivative liability (1,274 ) -- (1,274 ) -- Fair Value Measurements (In thousands) Fair Value Quoted Prices in
Active Markets for
Identical Assets
(Level 1)Significant Other
Observable Inputs
(Level 2)Significant
Unobservable Inputs
(Level 3)December 31, 2023 Available-for-sale securities U.S. Treasury $ 2,254 $ 2,254 $ — $ — U.S. Government agencies 72,502 — 72,502 — Mortgage-backed securities 1,940,307 — 1,940,307 — State and political subdivisions 902,793 — 902,793 — Other securities 234,297 — 234,297 — Mortgage loans held for sale 9,373 — — 9,373 Derivative asset 130,271 — 130,271 — Derivative liability (27,584) — (27,584) — December 31, 2022 Available-for-sale securities U.S. Treasury $ 2,197 $ 2,197 $ — $ — U.S. Government agencies 184,279 — 184,279 — Mortgage-backed securities 2,542,902 — 2,542,902 — State and political subdivisions 871,074 — 871,074 — Other securities 252,402 — 252,402 — Mortgage loans held for sale 3,486 — — 3,486 Derivative asset 139,323 — 139,323 — Derivative liability (34,440) — (34,440) — Certain financial assets and liabilities are measured at fair value on a nonrecurring basis; that is, the instruments are not measured at fair value on an ongoing basis but are subject to fair value adjustments in certain circumstances (for example, when there is evidence of impairment). Financial assetscircumstances. Assets and liabilities measured at fair value on a nonrecurring basis include the following:ImpairedIndividually assessed loans (collateral dependent) (collateral-dependent)– Loan impairment is reportedWhen the Company has a specific expectation to initiate, or has initiated, foreclosure proceedings, and when full payment under the loan terms is not expected. Allowable methods for determining the amount of impairment include estimating fair value using the fair value of the collateral for collateral-dependent loans. If the impaired loan is identified as collateral dependent, then the fair value method of measuring the amount of impairment is utilized. This method requires obtaining a current independent appraisal of the collateral and applying a discount factor to the value. A portion of the allowance for loan losses is allocated to impaired loans if the value of such loans is deemed to be less than the unpaid balance. If these allocations cause the allowance for loan losses to require an increase, such increase is reported as a component of the provision for loan losses. Loan losses are charged against the allowance when management believes the uncollectabilityrepayment of a loan is confirmed. Impairedexpected to be substantially dependent on the liquidation of underlying collateral, the relationship is deemed collateral-dependent. Fair value of the loan is determined by establishing an allowance for credit loss for any exposure based on the valuation of the underlying collateral. The valuation of the collateral is determined by either an independent third-party appraisal or other collateral analysis. Discounts can be made by the Company based upon the overall evaluation of the independent appraisal. Collateral-dependent loans that are collateral dependent are classified within Level 3 of the fair value hierarchy when impairment is determined usingdue to the unobservable inputs used in determining their fair value method.Appraisalssuch as collateral values and the borrower’s underlying financial condition. Collateral values supporting the individually assessed loans are updated at renewal, if not more frequently,evaluated quarterly for all collateral dependent loans that are deemed impaired by way of impairment testing. Impairment testing is performed on all loans over $1.5 million rated Substandardupdates to appraised values or worse, all existing impaired loans regardless of size and all TDRs. All collateral dependent impaired loans meeting these thresholds have had updated appraisals or internally prepared evaluations within the last oneadjustments due to two years and these updated valuations are considered in the quarterly review and discussion of the corporate Special Asset Committee. On targeted CRE loans, appraisals/internally prepared valuations may be updated before the typical 1-3 year balloon/maturity period. If an updated valuation results in decreased value, a specific (ASC 310) impairment is placed against the loan, or a partial charge-down is initiated, depending on the circumstances and anticipation of the loan’s ability to remain a going concern, possibility of foreclosure, certain market factors, etc.
non-current valuations.116Foreclosed assets and other real estate owned – Foreclosed assets and other real estate owned are reported at fair value, less estimated costs to sell. At foreclosure, if the fair value, less estimated costs to sell, of the real estate acquired is less than the Company’s recorded investment in the related loan, a write-down is recognized through a charge to the allowance for loancredit losses. Additionally, valuations are periodically performed by management and any subsequent reduction in value is recognized by a charge to income. The fair value of foreclosed assets and other real estate owned is estimated using Level 3 inputs based on unobservable market data. As of December 31, 2017 and 2016, the fair value of foreclosed assets and other real estate owned less estimated costs to sell was $32.1 million and $26.9 million, respectively.123The significant unobservable inputs (Level 3) used in the fair value measurement of collateral for collateral-dependent impaired loans and foreclosed assets primarily relate to the specialized discounting criteria applied to the borrower’s reported amount of collateral. The amount of the collateral discount depends upon the condition and marketability of the collateral, as well as other factors which may affect the collectability of the loan. Management’s assessment of the significance of a particular input to the fair value measurement in its entirety requires judgment and considers factors specific to the asset. It is reasonably possible that a change in the estimated fair value for instruments measured using Level 3 inputs could occur in the future. As the Company’s primary objective in the event of default would be to liquidate the collateral to settle the outstanding balance of the loan, collateral that is less marketable would receive a larger discount. During the reported periods, collateral discounts ranged from 10% to 40% for commercial and residential real estate collateral.Mortgage loans held for sale – Mortgage loans held for sale are reported at fair value if, on an aggregate basis, the fair value of the loans is less than cost. In determining whether the fair value of loans held for sale is less than cost when quoted market prices are not available, the Company may consider outstanding investor commitments, discounted cash flow analyses with market assumptions or the fair value of the collateral if the loan is collateral dependent. Such loans are classified within either Level 2 or Level 3 of the fair value hierarchy. Where assumptions are made using significant unobservable inputs, such loans held for sale are classified as Level 3. At December 31, 2017 and 2016, the aggregate fair value of mortgage loans held for sale exceeded their cost. Accordingly, no mortgage loans held for sale were marked down and reported at fair value.The following table sets forth the Company’s financial assets by level within the fair value hierarchy that were measured at fair value on a nonrecurring basis as of December 31, 20172023 and 2016.2022. Fair Value Measurements Using (In thousands) Fair Value Quoted Prices in
Active Markets for
Identical Assets
(Level 1) Significant Other
Observable Inputs
(Level 2) Significant
Unobservable Inputs
(Level 3) December 31, 2017 Impaired loans (1) (2) (collateral dependent) $ 11,229 $ -- $ -- $ 11,229 Foreclosed assets and other real estate owned (1) 24,093 -- -- 24,093 December 31, 2016 Impaired loans (1) (2) (collateral dependent) $ 17,154 $ -- $ -- $ 17,154 Foreclosed assets held for sale (1) 17,806 -- -- 17,806 Fair Value Measurements Using (In thousands) Fair Value Quoted Prices in
Active Markets for
Identical Assets
(Level 1)Significant Other
Observable Inputs
(Level 2)Significant
Unobservable Inputs
(Level 3)December 31, 2023 Individually assessed loans (1) (2) (collateral-dependent)$ 144,604 $ — $ — $ 144,604 Foreclosed assets and other real estate owned (1)3,646 — — 3,646 December 31, 2022 Individually assessed loans (1) (2) (collateral-dependent)$ 70,926 $ — $ — $ 70,926 Foreclosed assets and other real estate owned (1)2,418 — — 2,418 ______________________(1) These amounts represent the resulting carrying amounts on the Consolidated Balance Sheetsconsolidated balance sheets for impaired collateral dependentcollateral-dependent loans and foreclosed assets and other real estate owned for which fair value re-measurements took place during the period.(2) Specific allocationsIdentified reserves of $2,195,000$18.7 million and $2,384,000$5.2 million were related to the impaired collateral dependentcollateral-dependent loans for which fair value re-measurements took place during the periodsyears ended December 31, 20172023 and 2016,2022, respectively.ASC Topic 825, Financial Instruments, requires disclosure in annual and interim financial statements of the fair value of financial assets and financial liabilities, including those financial assets and financial liabilities that are not measured and reported at fair value on a recurring basis or nonrecurring basis. The following methods and assumptions were used to estimate the fair value of each class of financial instruments not previously disclosed.117Cash and cash equivalents – The carrying amount for cash and cash equivalents approximates fair value (Level 1).Interest bearing balances due from banks – The fair value of interest bearing balances due from banks – time is estimated using a discounted cash flow calculation that applies the rates currently offered on deposits of similar remaining maturities (Level 2).Held-to-maturity securities – Fair values for held-to-maturity securities equal quoted market prices, if available, such as for highly liquid government bonds (Level 1). If quoted market prices are not available, fair values are estimated based on quoted market prices of similar securities. For these securities, the Company obtains fair value measurements from an independent pricing service. The fair value measurements consider observable data that may include dealer quotes, market spreads, cash flows, the U.S. Treasury yield curve, live trading levels, trade execution data, market consensus prepayment speeds, credit information and the security’s terms and conditions, among other things (Level 2). In certain cases where Level 1 or Level 2 inputs are not available, securities are classified within Level 3 of the hierarchy.124Loans – The fair value of loans excluding loans acquired, is estimated by discounting the future cash flows, using the current rates at which similar loans would be made to borrowers with similar credit ratings and for the same remaining maturities. Loans with similar characteristics were aggregated for purposes of the calculations (Level 3).Loans acquired – Fair values of loans acquired are based on a discounted cash flow methodology that considersAdditional factors includingconsidered include the type of loan and related collateral, variable or fixed rate, classification status, remaining term, interest rate, historical delinquencies, loan to value ratios, current market rates and remaining loan balance. The loans were grouped together according to similar characteristics and were treated in the aggregate when applying various valuation techniques. The discount rates used for loans were based on current market rates for new originations of similar loans. Estimated credit losses were also factored into the projected cash flows of the loans. The fair value of loans is estimated on an exit price basis incorporating the above factors (Level 3).Deposits – The fair value of demand deposits, savings accounts and money market deposits is the amount payable on demand at the reporting date (i.e., their carrying amount) (Level 2). The fair value of fixed-maturity time deposits is estimated using a discounted cash flow calculation that applies the rates currently offered for deposits of similar remaining maturities (Level 3).Federal Funds purchased, securities sold under agreement to repurchase and short-term debt – The carrying amount for Federalfederal funds purchased, securities sold under agreement to repurchase and short-term debt are a reasonable estimate of fair value (Level 2).Other borrowings– For short-term instruments, the carrying amount is a reasonable estimate of fair value. For long-term debt, rates currently available to the Company for debt with similar terms and remaining maturities are used to estimate the fair value (Level 2).Subordinated debentures– The fair value of subordinated debentures is estimated using the rates that would be charged for subordinated debentures of similar remaining maturities (Level 2).Accrued interest receivable/payable – The carrying amounts of accrued interest approximated fair value (Level 2).Commitments to extend credit, letters of credit and lines of credit– The fair value of commitments is estimated using the fees currently charged to enter into similar agreements, taking into account the remaining terms of the agreements and the present creditworthiness of the counterparties. For fixed rate loan commitments, fair value also considers the difference between current levels of interest rates and the committed rates. The fair values of letters of credit and lines of credit are based on fees currently charged for similar agreements or on the estimated cost to terminate or otherwise settle the obligations with the counterparties at the reporting date.The fair value of a financial instrument is the current amount that would be exchanged between willing parties, other than in a forced liquidation. Fair value is best determined based upon quoted market prices. However, in many instances, there are no quoted market prices for the Company’s various financial instruments. In cases where quoted market prices are not available, fair values are based on estimates using present value or other valuation techniques. Those techniques are significantly affected by the assumptions used, including the discount rate and estimates of future cash flows. Accordingly, the fair value estimates may not be realized in an immediate settlement of the instrument.118125The estimated fair values, and related carrying amounts, of the Company’s financial instruments are as follows: Carrying Fair Value Measurements Carrying Fair Value Measurements (In thousands) Amount Level 1 Level 2 Level 3 Total (In thousands) Amount Level 1 Level 2 Level 3 Total December 31, 2017 December 31, 2023 December 31, 2023 Financial assets: Financial assets: Cash and cash equivalents $ 598,042 $ 598,042 $ -- $ -- $ 598,042 Interest bearing balances due from banks - time 3,314 -- 3,314 -- 3,314 Held-to-maturity securities 368,058 -- 373,298 -- 373,298 Mortgage loans held for sale 24,038 -- -- 24,038 24,038 Held-to-maturity securities, net Interest receivable 43,528 -- 43,528 -- 43,528 Legacy loans (net of allowance) 5,663,941 -- -- 5,646,505 5,646,505 Loans acquired (net of allowance) 5,074,076 -- -- 5,058,455 5,058,455 Loans, net Financial liabilities: Non-interest bearing transaction accounts 2,665,249 -- 2,665,249 -- 2,665,249 Financial liabilities: Financial liabilities: Noninterest bearing transaction accounts Interest bearing transaction accounts and savings deposits 6,494,896 -- 6,494,896 -- 6,494,896 Time deposits 1,932,730 -- -- 1,915,539 1,915,539 Federal funds purchased and securities sold under agreements to repurchase 122,444 -- 122,444 -- 122,444 Other borrowings 1,380,024 -- 1,381,365 -- 1,381,365 Subordinated debentures 140,565 -- 136,474 -- 136,474 Subordinated notes and debentures Interest payable 4,564 -- 4,564 -- 4,564 December 31, 2016 Financial assets December 31, 2022 December 31, 2022 December 31, 2022 Financial assets: Financial assets: Cash and cash equivalents $ 285,659 $ 285,659 $ -- $ -- $ 285,659 Interest bearing balances due from banks - time 4,563 -- 4,563 -- 4,563 Held-to-maturity securities 462,096 -- 465,960 -- 465,960 Mortgage loans held for sale 27,788 -- -- 27,788 27,788 Held-to-maturity securities, net Interest receivable 27,788 -- 27,788 -- 27,788 Legacy loans (net of allowance) 4,290,921 -- -- 4,305,165 4,305,165 Loans acquired (net of allowance) 1,305,683 -- -- 1,310,017 1,310,017 Loans, net Financial liabilities: Non-interest bearing transaction accounts 1,491,676 -- 1,491,676 -- 1,491,676 Financial liabilities: Financial liabilities: Noninterest bearing transaction accounts Interest bearing transaction accounts and savings deposits 3,956,483 -- 3,956,483 -- 3,956,483 Time deposits 1,287,060 -- -- 1,278,339 1,278,339 Federal funds purchased and securities sold under agreements to repurchase 115,029 -- 115,029 -- 115,029 Other borrowings 273,159 -- 292,367 -- 292,367 Subordinated debentures 60,397 -- 55,318 -- 55,318 Subordinated notes and debentures Interest payable 1,668 -- 1,668 -- 1,668 The fair value of commitments to extend credit, letters of credit and lines of credit is not presented since management believes the fair value to be insignificant.119126NOTE 18:19:COMMITMENTS AND CREDIT RISKThe Company grants agri-business,agribusiness, commercial and residential loans to customers primarily throughout Arkansas, Colorado, Kansas, Missouri, Oklahoma, Tennessee and Texas, along with credit card loans to customers throughout the United States. Commitments to extend credit are agreements to lend to a customer as long as there is no violation of any condition established in the contract. Commitments generally have fixed expiration dates or other termination clauses and may require payment of a fee. Since a portion of the commitments may expire without being drawn upon, the total commitment amounts do not necessarily represent future cash requirements. Each customer'scustomer’s creditworthiness is evaluated on a case-by-case basis. The amount of collateral obtained, if deemed necessary, is based on management'smanagement’s credit evaluation of the counterparty. Collateral held varies, but may include accounts receivable, inventory, property, plant and equipment, commercial real estate and residential real estate.At December 31, 2017,2023, the Company had outstanding commitments to extend credit aggregating approximately $564,592,000$738.2 million and $3,086,696,000$4.17 billion for credit card commitments and other loan commitments, respectively. At December 31, 2016,2022, the Company had outstanding commitments to extend credit aggregating approximately $562,527,000$696.7 million and $1,220,137,000$5.64 billion for credit card commitments and other loan commitments, respectively.As of December 31, 2023 and 2022, the Company had outstanding commitments to originate fixed-rate mortgage loans of approximately $16.6 million and $21.1 million respectively. The commitments extend over varying periods of time with the majority being disbursed within a thirty-day period.Standby letters of credit are conditional commitments issued by the Company to guarantee the performance of a customer to a third party. Those guarantees are primarily issued to support public and private borrowing arrangements, including commercial paper, bond financing and similar transactions. The credit risk involved in issuing letters of credit is essentially the same as that involved in extending loans to customers. The Company had total outstanding letters of credit amounting to $47,621,000$54.2 million and $29,362,000$44.4 million at December 31, 20172023 and 2016,2022, respectively, with terms ranging from 9 months to 15 years. At December 31, 20172023 and 2016,2022, the Company had no deferred revenue under standby letter of credit agreements.The Company has purchased letters of credit from the FHLB as security for certain public deposits. The amount of the letters of credit was $580.8 million and $265.7 million at December 31, 2023 and 2022, respectively, and they expire in less than one year from issuance.At December 31, 2017,2023, the Company did not have concentrations of 5% or more of the investment portfolio in bonds issued by a single municipality.NOTE 19:20:NEW ACCOUNTING STANDARDSRecently Adopted Accounting StandardsReporting Comprehensive Income –Investment-Income Taxes - In February 2018,March 2023, the FASBFinancial Accounting Standards Board (“FASB”) issued ASU No. 2018-02, Income Statement-Reporting Comprehensive Income2023-02, Investments-Equity Method and Joint Ventures (Topic 220) (“323): Accounting for Investments in Tax Credit Structures Using the Proportional Amortization Method (“ASU 2018-02”2023-02”), that allows a reclassification from AOCIintroduced the option to retained earningsapply the proportional amortization method to account for strandedinvestments made primarily for the purpose of receiving income tax effects resulting fromcredits and other income tax benefits when certain requirements are met. The proportional amortization method results in the 2017 Act. Current US GAAP requirescost of the remeasurementinvestment being amortized in proportion to the income tax credits and other income tax benefits received, with the amortization of deferredthe investment and the income tax assets and liabilitiescredits being presented net in the income statement as a resultcomponent of a change in tax laws or rates to be presented in net income from continuing operations. Consequently, the original deferred tax amount recorded through AOCI at the old rate will remain in AOCI despite the fact that its related deferred tax asset/liability will be reduced through continuing operations to reflect the new rate, resulting in “stranded” tax effects in AOCI. ASU 2018-02 requires a reclassification from AOCI to retained earnings for those stranded tax effects resulting from the newly enacted federal corporate income tax rate. The amount of reclassification would be the difference between 1) the amount initially charged or credited directly to other comprehensive income at the previous enacted federal corporate income tax rate that remains in AOCIexpense (benefit). ASU 2023-02 is effective for public business entities for fiscal years, and 2) the amount that would have been charged or credited using the newly enacted federal corporate income tax rate, excluding the effect of any valuation allowance previously charged to income from continuing operations. The effective date is forinterim periods within those fiscal years, beginning after December 15, 2018, including interim periods within those fiscal years. As permitted, we31, 2023, with early adoption permitted. The Company elected to early adopt ASU 2023-02 and apply the provisions of ASU 2018-02 during the fourth quarter 2017, which resulted in a reclassification from AOCI to retained earnings in the amount of $3.0 million related to the change in federal corporateproportional amortization method for all income tax rate.Premium Amortization on Purchased Callable Debt Securities – In March 2017, the FASB issued ASU No. 2017-08, Receivables – Nonrefundable Fees and Other Costs (Topic 310-20): Premium Amortization on Purchased Callable Debt Securities (“ASU 2017-08”), that amends the amortization period for certain purchased callable debt securities held at a premium. Specifically, the amendments shorten the amortization period by requiring that the premium be amortized to the earliest call date. Under previous US GAAP, entities generally amortize the premium as an adjustment of yield over the contractual life of the instrument. The amendments do not require an accounting change for securities held at a discount; the discount continues to be amortized to maturity. The effective date is for fiscal years beginning after December 15, 2018, including interim periods within those fiscal years. As permitted, we elected to early adopt the provisions of ASU 2017-08credits during the first quarter 2017.of 2023 by utilizing the modified retrospective method. The adoption of this standardASU 2023-02 did not have a material effect on our results of operations, financial position or disclosures.Employee Share-Based Payments – In March 2016, the FASB issued ASU No. 2016-09, Compensation – Stock Compensation (Topic 718): Improvements to Employee Share-Based Payment Accounting (“ASU 2016-09”), which requires all excess tax benefits and tax deficiencies related to share-based payment awards be recognized as income tax expense or benefit in the income statement during the period in which they occur. Previously, such amounts were recorded in the pool of excess tax benefits included in additional paid-in capital, if such pool was available. Due to excess tax benefits no longer recognized in additional paid-in capital, the assumed proceeds from applying the treasury stock method when computing earnings per share should exclude the amount of excess tax benefits that would have previously been recognized in additional paid-in capital. Additionally, excess tax benefits should be classified along with other income tax cash flows as an operating activity rather than a financing activity, as was previously the case. ASU 2016-09 also provides that an entity can make an entity-wide accounting policy election to either estimate the number of awards that are expected to vest (current US GAAP) or account for forfeitures when they occur. ASU 2016-09 changes the threshold to qualify for equity classification (rather than as a liability) to permit withholding up to the maximum statutory tax rates (rather than the minimum as was previously the case) in the applicable jurisdictions. ASU 2016-09 became effective for annual and interim periods beginning after December 15, 2016. The prospective adoption of this standard has not had a material effect on our results of operations, financial position or disclosures. The impact of the requirement to report those income tax effects in earnings reduced reported federal and state income tax expense by approximately $1.7 million for the year ended December 31, 2017.120Business Combinations: Pushdown Accounting - In September 2015, the FASB issued ASU 2015-16 – Business Combinations: Simplifying the Accounting for Measurement-Period Adjustments (“ASU 2015-16”). ASU 2015-16 requires entities to recognize measurement period adjustments during the reporting period in which the adjustments are determined. The income effects, if any, of a measurement period adjustment are cumulative and are to be reported in the period in which the adjustment to a provisional amount is determined. Also, ASU 2015-16 requires presentation on the face of the income statement or in the notes, the effect of the measurement period adjustment as if the adjustment had been recognized at acquisition date. ASU 2015-16 is effective for fiscal periods beginning after December 15, 2016 and should be applied prospectively to measurement period adjustments that occur after the effective date. The adoption of this standard did not have a material effect on the Company’s results of operations, financial position or disclosures.Business Combinations: Pushdown Accounting127Credit Losses on Financial Instruments - In May 2015, the FASB issued ASU 2015-08 – Business Combinations: Pushdown Accounting – Amendments to SEC Paragraphs Pursuant to Staff Accounting Bulletin No. 115 (“ASU 2015-08”). ASU 2015-08 removes references to the SEC’s Staff Accounting Bulletin (SAB) Topic 5.J on pushdown accounting from ASC 805-50, thereby conforming the FASB’s guidance on pushdown accounting with the SEC’s guidance on this topic. ASU 2015-08 became effective upon issuance. The adoption of this standard did not have a material effect on the Company’s results of operations, financial position or disclosures.Consolidation Analysis - In February 2015, the FASB issued ASU 2015-02, Consolidation (Topic 810): Amendments to the Consolidation Analysis (“ASU 2015-02”). ASU 2015-02 amends the consolidation requirements of ASU 810 by changing the consolidation analysis required under GAAP. The revised guidance amends the consolidation analysis based on certain fee arrangements or relationships to the reporting entity and, for limited partnerships, requires entities to consider the limited partner’s rights relative to the general partner. ASU 2015-02 became effective for annual and interim periods beginning after December 15, 2015. The adoption of this standard did not have a material effect on the Company’s results of operations, financial position or disclosures.Recently Issued Accounting StandardsDerivatives and Hedging: Targeted Improvements – In August 2017,March 2022, the FASB issued ASU No. 2017-12, Derivatives2022-02, Hedging (Topic 815): Targeted Improvements to Accounting for Hedging ActivitiesVintage Disclosures (“ASU 2017-12”2022-02”), that changes both the designation and measurement guidance for qualifying hedging relationships and the presentation of hedge results in order to better align a company’s risk management activities and financial reporting for hedging relationships. In summary, this amendment 1) expands the types of transactions eligible for hedge accounting; 2)which eliminates the separate measurementaccounting guidance on troubled debt restructurings (“TDRs”) for creditors in ASC 310-40 and presentationamends the guidance on “vintage disclosures” to require disclosure of hedge ineffectiveness; 3) simplifiescurrent-period gross write-offs by year of origination. The ASU also updates the requirements around the assessment of hedge effectiveness; 4) provides companies more timerelated to finalize hedge documentation;accounting for credit losses under ASC 326 and 5) enhances presentationadds enhanced disclosures for creditors with respect to loan refinancings and disclosure requirements. Therestructurings made to borrowers experiencing financial difficulty. ASU 2022-02 was effective date isfor public business entities for fiscal years, beginning after December 15, 2018, and interim periods within those fiscal years, with early adoption permitted. All transition requirements and elections should be applied to existing hedging relationships on the date of adoption and the effects should be reflected as of the beginning of the fiscal year of adoption. We are currently evaluating the impact this standard will have on our results of operations, financial position or disclosures, but it is not expected to have a material impact.Stock Compensation: Scope of Modification Accounting – In May 2017, the FASB issued ASU No. 2017-09, Compensation – Stock Compensation (Topic 718): Scope of Modification Accounting (“ASU 2017-09”), that provides clarity and reduces both (1) diversity in practice and (2) cost and complexity when applying the guidance in Topic 718, to a change to the terms or conditions of a share-based payment award. An entity may change the terms or conditions of a share-based payment award for many different reasons, and the nature and effect of the change can vary significantly. The guidance clarifies which changes to the terms or conditions of a share-based payment award require an entity to apply modification accounting and the guidance should be applied prospectively to an award modified on or after the adoption date. ASU 2017-09 is effective for interim and annual reporting periods beginning after December 15, 2017,2022, with early adoption permitted. The Company doesadopted ASU 2022-02 effective January 1, 2023 on a prospective basis. As a result, comparative disclosures to prior periods will not planbe available until such time as both periods disclosed are subject to modify any existing awards and therefore the new guidance. The adoption of ASU 2017-09 is2022-02 did not expected to have a significant impact on our financial position, results of operations, or disclosures.121Goodwill Impairment – In January 2017, the FASB issued ASU No. 2017-04, Intangibles – Goodwill and Other (Topic 350): Simplifying the Test for Goodwill Impairment (“ASU 2017-04”), that eliminates Step 2 from the goodwill impairment test which required entities to compare the implied fair value of goodwill to its carrying amount. Under the amendments, the goodwill impairment will be measured as the excess of the reporting unit’s carrying amount over its fair value. An impairment charge should be recognized for the amount by which the carrying amount exceeds the reporting unit’s fair value; however, the loss recognized should not exceed the total amount of goodwill allocated to that reporting unit. The effective date is for fiscal years beginning after December 15, 2019, with early adoption permitted for interim or annual impairment tests beginning in 2017. ASU 2017-04 is not expected to have a material effect on our results of operations, financial position or disclosures.Statement of Cash Flows – In August 2016, the FASB issued ASU No. 2016-15, Statement of Cash Flows (Topic 230): Classification of Certain Cash Receipts and Cash Payments (“ASU 2016-15”), designed to address the diversity in how certain cash receipts and cash payments are presented and classified in the statement of cash flows, including debt prepayment or extinguishment costs, settlement of certain debt instruments, contingent consideration payments made after a business combination, proceeds from the settlement of insurance claims, and distributions received from equity method investees. The amendments also provide guidance on when an entity should separate or aggregate cash flows based on the predominance principle. The effective date is for fiscal years beginning after December 15, 2017, including interim periods within those fiscal years. The new standard is required to be applied retrospectively, but may be applied prospectively if retrospective application would be impracticable. Since the amendment applies to the classification of cash flows, no impact is anticipated on our financial position or results of operations. Additionally, we do not expect it to have a material impact on our financial statement disclosures.Credit Losses on Financial Instruments – In June 2016, the FASB issued ASU No. 2016-13, Financial Instruments – Credit Losses (Topic 326): Measurement of Credit Losses on Financial Instruments (“ASU 2016-13”), which requires earlier measurement of credit losses, expands the range of information considered in determining expected credit losses and enhances disclosures. The main objective of ASU 2016-13 is to provide financial statement users with more decision-useful information about the expected credit losses on financial instruments and other commitments to extend credit held by a reporting entity at each reporting date. The amendments replace the incurred loss impairment methodology in current US GAAP with a methodology that reflects expected credit losses and requires consideration of a broader range of reasonable and supportable information to inform credit loss estimates. The effective date for these amendments is for fiscal years beginning after December 15, 2019, including interim periods within those fiscal years. We have formed a cross functional team that is assessing our data and system needs and evaluating the potential impact of adopting the new guidance. We anticipate a significant change in the processes and procedures to calculate the loan losses, including changes in assumptions and estimates to consider expected credit losses over the life of the loan versus the current accounting practice that utilizes the incurred loss model. We expect to recognize a one-time cumulative effect adjustment to the allowance for loan losses as of the beginning of the first reporting period in which the new standard is effective, but cannot yet determine the magnitude of any such one-time adjustment or the overall impact on our results of operations, financial position or disclosures. However, we have begun developing processes and procedures to ensure we are fully compliant at the required adoption date. Among other things, we have initiated data gathering and assessment to support forecasting of asset quality, loan balances, and portfolio net charge-offs and developing asset quality forecast models in preparation for the implementation of this standard.Leases – In February 2016, the FASB issued ASU No. 2016-02, Leases (Topic 842) (“ASU 2016-02”), that establish the principles to report transparent and economically neutral information about the assets and liabilities that arise from leases. The new guidance results in a more consistent representation of the rights and obligations arising from leases by requiring lessees to recognize the lease asset and lease liabilities that arise from leases in the statement of financial position and to disclose qualitative and quantitative information about lease transactions, such as information about variable lease payments and options to renew and terminate leases. The effective date is for fiscal years beginning after December 15, 2018, including interim periods within those fiscal years. Based upon leases that were outstanding as of December 31, 2017, we do not expect the new standard to have a material impact on our results of operations, but anticipate increases in our assets and liabilities. Decisions to repurchase, modify or renew leases prior to the implementation date will impact the level of materiality.Financial Assets and Financial Liabilities – In January 2016, the FASB issued ASU No. 2016-01, Financial Instruments – Overall (Subtopic 825-10): Recognition and Measurement of Financial Assets and Financial Liabilities (“ASU 2016-01”), that makes changes primarily affecting the accounting for equity investments, financial liabilities under the fair value option, and the presentation and disclosure requirements for financial instruments. In addition, the FASB clarified guidance related to the valuation allowance assessment when recognizing deferred tax assets resulting from unrealized losses on available-for-sale debt securities. The effective date is for fiscal periods beginning after December 15, 2017, including interim periods within those fiscal years. ASU 2016-01 is not expected to have a material impact on the Company’s results of operations or financial position. However, this new guidance requires the disclosed fair value of our loan portfolio to be based on an exit price calculation, which considers liquidity, creditSee Note 5, Loans and nonperformance risk of our loans. We are completing our final assessment of this guidance but we do not expect a material impact on our fair value disclosures.
Allowance for Credit Losses, for additional information.122Revenue Recognition –Fair Value Hedging - In May 2014,March 2022, the FASB issued ASU No. 2014-09,Revenue from Contracts with Customers2022-01, Derivatives and Hedging (Topic 606)815): Fair Value Hedging - Portfolio Layer Method (“ASU 2014-09”2022-01”), which clarifies the guidance on fair value hedge accounting of interest rate risk for portfolios of financial assets. This ASU amends the guidance in ASU 2017-12 that, outlines a single comprehensive revenue recognition modelamong other things, established the “last-of-layer” method for making the fair value hedge accounting for these portfolios more accessible. ASU 2022-01 renames that method the “portfolio layer” method and expands the scope of this guidance to allow entities to follow inapply the portfolio layer method to portfolios of all financial assets, including both prepayable and nonprepayable financial assets. This scope expansion is consistent with the FASB’s efforts to simplify hedge accounting and allows entities to apply the same method to similar hedging strategies. ASU 2022-01 was effective for revenue from contractspublic business entities for fiscal years, and interim periods within those fiscal years, beginning after December 15, 2022, with customers.early adoption permitted. The core principleadoption of this revenue model is that an entity should recognize revenue for2022-01 did not have a material impact on the transferCompany’s results of promised goodsoperations, financial position or services to customers in an amount that reflects the consideration to which the entity expects to be entitled to receive for those goods or services.disclosures.Reference Rate Reform – In July 2015,March 2020, the FASB issued ASU No. 2015-14, deferring2020-04, Reference Rate Reform (Topic 848): Facilitation of the Effects of Reference Rate Reform on Financial Reporting (“ASU 2020-04”), which provides relief for companies preparing for discontinuation of interest rates such as LIBOR. LIBOR is a benchmark interest rate referenced in a variety of agreements that are used by numerous entities. On March 5, 2021, the U.K. Financial Conduct Authority (“FCA”) announced that the majority of LIBOR rates will no longer be published after December 31, 2021. Effective January 1, 2022, the ICE Benchmark Administration Limited, the administrator of the LIBOR, ceased the publication of one-week and two-month USD LIBOR and as of June 30, 2023, ceased the publications of the remaining tenors of USD LIBOR (one, three, six and 12-month).Other interest rates used globally could also be discontinued for similar reasons. ASU 2020-04 provides optional expedients and exceptions to contracts, hedging relationships and other transactions affected by reference rate reform. The main provisions for contract modifications include optional relief by allowing the modification as a continuation of the existing contract without additional analysis and other optional expedients regarding embedded features. Optional expedients for hedge accounting permits changes to critical terms of hedging relationships and to the designated benchmark interest rate in a fair value hedge and also provides relief for assessing hedge effectiveness for cash flow hedges. Companies are able to apply ASU 2020-04 immediately; however, the guidance will only be available for a limited time (generally through December 31, 2022). The Company formed a LIBOR Transition Team in 2020, has created standard LIBOR replacement language for new and modified loan notes, and is monitoring the remaining loans with LIBOR rates monthly to ensure progress in updating these loans with acceptable LIBOR replacement language or converting them to other interest rates. During 2021, the Company did not offer LIBOR-indexed rates on loans which it originated, although it did participate in some shared credit agreements originated by other banks subject to the Company’s determination that the LIBOR replacement language in the loan documents met the Company’s standards. Pursuant to the Joint Regulatory Statement on LIBOR transition issued in October 2021, the Company’s policy, as of January 1, 2022, is not to enter into any new LIBOR-based credit agreements and not extend, renew, or modify prior LIBOR credit agreements without requiring conversion of the agreements to other interest rates. The adoption of ASU 2020-04 has not had a material impact on the Company’s financial position or results of operations.In January 2021, the FASB issued ASU No. 2021-01, Reference Rate Reform (Topic 848): Scope (“ASU 2021-01”), which clarifies that certain optional expedients and exceptions in ASC 848 for contract modifications and hedge accounting apply to derivatives that are affected by the changes in the interest rates used for margining, discounting, or contract price alignment for derivative instruments that are being implemented as part of the market-wide transition to new reference rates (commonly referred to as the “discounting transition”). ASU 2021-01 also amends the expedients and exceptions in ASC 848 to capture the incremental consequences of the scope clarification and to tailor the existing guidance to derivative instruments affected by the discounting transition. ASU 2021-01 was effective upon issuance and generally can be applied through December 31, 2022. ASU 2021-01 did not have a material impact on the Company’s financial position or results of operations.128In December 2022, the FASB issued ASU No. 2022-06, Reference Rate Reform (Topic 848): Deferral of the Sunset Date of Topic 848 (“ASU 2022-06”). ASU 2022-06 defers the sunset date of Topic 848 from December 31, 2022 to annualDecember 31, 2024, after which entities will no longer be permitted to apply the relief in Topic 848.Leases - In July 2021, the FASB issued ASU No. 2021-05, Leases (Topic 842): Lessors-Certain Leases with Variable Lease Payments (“ASU 2021-05”), that amends lease classification requirements for lessors. In accordance with ASU 2021-05, lessors should classify and account for a lease that have variable lease payments that do not depend on a reference index rate as an operating lease if both of the following criteria are met: i) the lease would have been classified as a sales-type lease or a direct financing lease under the previous lease classification criteria and ii) sales-type or direct financing lease classification would result in a Day 1 loss. ASU 2021-05 was effective for public business entities for fiscal years, and interim periods within those fiscal years, beginning after December 15, 2017.2021, with early adoption permitted. The adoption of ASU 2021-05 did not have a material impact on the Company’s results of operations, financial position or disclosures.Income Taxes – In December 2019, the FASB issued ASU No. 2019-12, Income Taxes (Topic 740): Simplifying the Accounting for Income Taxes (“ASU 2019-12”), that removes certain exceptions for investments, intraperiod allocations and interim calculations, and adds guidance to reduce complexity in accounting for income taxes. ASU 2019-12 introduces the following new guidance: i) guidance to evaluate whether a step-up in tax basis of goodwill relates to a business combination in which book goodwill was recognized or a separate transaction and ii) a policy election to not allocate consolidated income taxes when a member of a consolidated tax return is not subject to income tax. Additionally, ASU 2019-12 changes the following current guidance: i) making an intraperiod allocation, if there is a loss in continuing operations and gains outside of continuing operations, ii) determining when a deferred tax liability is recognized after an investor in a foreign entity transitions to or from the equity method of accounting, iii) accounting for tax law changes and year-to-date losses in interim periods, and iv) determining how to apply the income tax guidance to franchise taxes that are partially based on income. ASU 2019-12 is effective for fiscal years, and interim periods within those fiscal years beginning after December 15, 2020. The adoption of ASU 2019-12 did not have a material impact on the Company’s operations, financial position or disclosures.Recently Issued Accounting StandardsIncome Taxes - In December 2023, the FASB issued ASU No. 2023-09, Income Taxes (Topic 740): Improvements to Income Tax Disclosures (“ASU 2023-09”), primarily focused on income tax disclosures regarding effective tax rates and cash income taxes paid. ASU 2023-09 requires public business entities, on an annual basis, to disclose specific categories in the rate reconciliation and provide additional information for reconciling items that meet a quantitative threshold (if the effect of those reconciling items is equal to or greater than 5 percent of the amount computed by multiplying pretax income by the applicable statutory income tax rate). ASU 2023-09 is effective for fiscal years, and interim periods within those fiscal years beginning after December 15, 2024, with early adoption permitted. The Company will complete an evaluation of the impact this standard will have on its results of operations, financial position or disclosures.Segment Reporting - In November 2023, the FASB issued ASU No. 2023-07, Segment Reporting (Topic 280): Improvements to Reportable Segment Disclosures (“ASU 2023-07”), which expands reportable segment disclosure requirements through enhanced disclosures about significant segment expenses. The amendments in this update introduce a new requirement to disclose significant segment expenses regularly provided to the chief operating decision maker, extend certain annual disclosures to interim periods, clarify that single reportable segment entities must apply Topic 280 in its entirety, permit more than one measure of segment profit or loss to be reported under certain conditions and require disclosure of the title and position of the chief operating decision maker. ASU 2023-07 is effective for public business entities for fiscal years beginning after December 15, 2023, and interim periods within fiscal years beginning after December 15, 2024, with early adoption permitted. The adoption of ASU 2023-07 is not expected to have a material effectimpact on our results ofthe Company’s operations, financial position or disclosures. The guidance does not apply to revenue associated with financial instruments, including loans and securities that are accounted for under other US GAAP, which comprises a significant portion of our revenue stream. From our analysis, we believe that for most revenue streams within the scope of ASU 2015-14, the amendments will not change the timing of when the revenue is recognized. ASU 2014-09 will require us to change how we recognize certain recurring revenue streams within trust and investment management fees and other insignificant components of non-interest income; however, these changes will not have a material impact on our results of operations or financial position. Additionally, although we do not expect a material impact, we do expect additional disclosures in our notes to the consolidated financial statements required by this guidance.Presently, the Company is not aware of any other changes to the Accounting Standards Codification that will have a material impact on the Company’s present or future financial position or results of operations.129NOTE 21:DERIVATIVE INSTRUMENTSThe Company utilizes derivative instruments to manage exposure to various types of interest rate risk for itself and its customers within policy guidelines. Transactions should only be entered into with an associated underlying exposure. All derivative instruments are carried at fair value.Derivative contracts involve the risk of dealing with institutional derivative counterparties and their ability to meet contractual terms. Institutional counterparties must have an investment grade credit rating and be approved by the Company’s asset/liability management committee. In arranging these products for its customers, the Company assumes additional credit risk from the customer and from the dealer counterparty with whom the transaction is undertaken. Credit risk exists due to the default credit risk created in the exchange of the payments over a period of time. Credit exposure on interest rate swaps is limited to the net favorable value and interest payments of all swaps with each counterparty. Access to collateral in the event of default is reasonably assured. Therefore, credit exposure may be reduced by the amount of collateral pledged by the counterparty.Hedge StructuresThe Company will seek to enter derivative structures that most effectively address the risk exposure and structural terms of the underlying position being hedged. The term and notional principal amount of a hedge transaction will not exceed the term or principal amount of the underlying exposure. In addition, the Company will use hedge indices which are the same as, or highly correlated to, the index or rate on the underlying exposure. Derivative credit exposure is monitored on an ongoing basis for each customer transaction and aggregate exposure to each counterparty is tracked. The Company has set a maximum outstanding notional contract amount at 10% of the Company’s assets.Fair Value HedgesFor derivative instruments that are designated and qualify as a fair value hedge, the gain or loss on the derivative instrument as well as the offsetting loss or gain on the hedged asset or liability attributable to the hedged risk are recognized in current earnings. The gain or loss on the derivative instrument is presented on the same income statement line item as the earnings effect of the hedged item. During the third quarter of 2021, the Company began utilizing interest rate swaps designated as fair value hedges to mitigate the effect of changing interest rates on the fair values of fixed rate callable AFS securities. The hedging strategy converts the fixed interest rates to variable interest rates based on federal funds rates. The two year forward start date for these swaps occurred during late third quarter of 2023 and involves the payment of fixed interest rates with a weighted average of 1.21% in exchange for variable interest rates based on federal funds rates. For the year ended December 31, 2023, the net amount included in interest income on investment securities in the consolidated statements of income related to fair value hedges was $11.9 million.The following table summarizes the fair value hedges recorded in the accompanying consolidated balance sheets.December 31, 2023 December 31, 2022 (In thousands) Balance Sheet Location Weighted Average Pay Rate Receive Rate Notional Fair Value Notional Fair Value Derivative assets Other assets 1.21% Federal Funds $ 1,001,715 $ 102,644 $ 1,001,715 $ 104,833 The following amounts were recorded on the balance sheet related to carrying amounts and cumulative basis adjustments for fair value hedges.Carrying Amount of Hedged Assets Cumulative Amount of Fair Value Hedging Adjustment Included in the Carrying Amount of Hedged Assets Line Item on the Balance Sheet (In thousands) 2023 2022 2023 2022 Investment securities - Available-for-sale $ 940,010 $ 944,115 $ 104,408 $ 106,321 130Customer Risk Management Interest Rate SwapsThe Company’s qualified loan customers have the opportunity to participate in its interest rate swap program for the purpose of managing interest rate risk on their variable rate loans with the Company. The Company enters into such agreements with customers, then offsetting agreements are executed between the Company and an approved dealer counterparty to minimize market risk from changes in interest rates. The counterparty contracts are identical to customer contracts in terms of notional amounts, interest rates, and maturity dates, except for a fixed pricing spread or fee paid to the Company by the dealer counterparty. These interest rate swaps carry varying degrees of credit, interest rate and market or liquidity risks. The fair value of these derivative instruments is recognized as either derivative assets or liabilities in the accompanying consolidated balance sheets. The Company has a limited number of swaps that are standalone without a similar agreement with the loan customer.The following table summarizes the fair values of loan derivative contracts recorded in the accompanying consolidated balance sheets for the years ended December 31, 2023 and 2022.2023 2022 (In thousands) Notional Fair Value Notional Fair Value Derivative assets $ 551,314 $ 27,627 $ 413,968 $ 34,490 Derivative liabilities 552,274 27,584 414,955 34,440 Risk Participation AgreementsThe Company has a limited number of Risk Participation Agreement swaps, that are associated with loan participations, where the Company is not the counterparty to the interest rate swaps that are associated with the risk participation sold. The interest rate swap mark to market only impacts the Company if the swap is in a liability position to the counterparty and the customer defaults on payments to the counterparty. The notional amount of these contingent agreements is $19.7 million as of December 31, 2023.Energy HedgingThe Company, from time-to-time, has provided energy derivative services to qualifying, high quality oil and gas borrowers for hedging purposes. The Company has served as an intermediary on energy derivative products between the Company’s borrowers and dealers. The Company will only enter into back-to-back trades, thus maintaining a balanced book between the dealer and the borrower.The energy hedging risk exposure to the Company’s customer would increase as energy prices for crude oil and natural gas rise. As prices decrease, exposure to the exchange would increase. These risks are mitigated by customer credit underwriting policies and establishing a predetermined hedge line for each borrower and by monitoring the exchange margin.During the second quarter of 2023, the Company’s remaining energy hedge swap contracts expired and there were no outstanding notional values related to these contracts as of December 31, 2023. The outstanding notional value as of December 31, 2022 for energy hedging Customer Sell to Company swaps were $2.6 million and the corresponding Company Sell to Dealer swaps were $2.6 million and the corresponding net fair value of the derivative asset and derivative liability was $49,000. Currently, the Company generally does not intend to offer hedging services to any remaining energy related customers.131NOTE 20:22:CONTINGENT LIABILITIESIn the ordinary course of its operations, the Company and its subsidiaries are parties to various legal proceedings incidental to the conduct of its business, including proceedings based on breach of contract claims, lender liability claims, and other ordinary-course claims, some of which seek substantial relief or damages.The Company and/or its subsidiaries have various unrelatedestablishes reserves for legal proceedings which,when potential losses become probable and can be reasonably estimated. While the ultimate resolution (including amounts thereof) of any legal proceedings cannot be determined at this time, based on information presently available and after consultation with legal counsel, management believes that the ultimate outcome in such proceedings, either individually or in the aggregate, arewill not expected to have a material adverse effect on the Company’s business, consolidated results of operations, financial positioncondition, or cash flows. It is possible, however, that future developments could result in an unfavorable outcome for or resolution of any of these proceedings, which may be material to the Company and its subsidiaries.Company’s results of operations for a given fiscal period.NOTE 21:23:STOCKHOLDERS’ EQUITYTheSimmons Bank, the Company’s subsidiary banks arebank, is subject to a legal limitations on dividends that can be paid to the parent company without prior approval of the applicable regulatory agencies. For the lead subsidiary bank, Simmons Bank, theThe approval of the Commissioner of the Arkansas State Bank Department is required if the total of all dividends declared by an Arkansas state bank in any calendar year exceeds seventy-five percent (75%) of the total of its net profits, as defined, for that year combined with seventy-five percent (75%) of its retained net profits of the preceding year. The other bank subsidiaries that were in operation as of December 31, 2017 are limited by the regulations of the state of Oklahoma and Texas. At December 31, 2017, the Company’s subsidiary banks2023, Simmons Bank had approximately $7.5$54.4 million available for payment of dividends to the Company, without prior regulatory approval.The Company’s bank subsidiary banks areis subject to various regulatory capital requirements administered by the federal banking agencies. Failure to meet minimum capital requirements can initiate certain mandatory and possibly additional discretionary actions by regulators that, if undertaken, could have a direct material effect on the Company’s financial statements. Under capital adequacy guidelines and the regulatory framework for prompt corrective action, the Company and its bank subsidiary must meet specific capital guidelines that involve quantitative measures of the Company’stheir assets, liabilities and certain off-balance-sheet items as calculated under regulatory accounting practices. The Company’s capital amounts and classifications are also subject to qualitative judgments by the regulators about components, risk weightings and other factors. Furthermore,The risk-based capital guidelines of the Company’s regulators could require adjustments to regulatory capital not reflected in these financial statements.EffectiveFederal Reserve Board and the Arkansas State Bank Department include the definitions for (1) a well-capitalized institution, (2) an adequately-capitalized institution, and (3) an undercapitalized institution. Under the Basel III Rules effective January 1, 2015, the Companycriteria for a well-capitalized institution are: a 5% “Tier l leverage capital” ratio, an 8% “Tier 1 risk-based capital” ratio, 10% “total risk-based capital” ratio; and the Banks became subject to new capital regulations (the “Basel III Capital Rules”) adopted by the Federal Reserve in July 2013 establishing a new comprehensive capital framework for U.S. Banks. The Basel III Capital Rules substantially revise the risk-based capital requirements applicable to bank holding companies and depository institutions compared to the previous U.S. risk-based capital rules. Full compliance with all of the final rule’s requirements will be phased in over a multi-year schedule. The final rules include a new common6.5% “common equity Tier 1 capital to risk-weighted assets (CET1) ratio of 4.5% and a common equity Tier 1 capital conservation buffer of 2.5% of risk-weighted assets.” ratio. CET1 generally consists of common stock; retained earnings; accumulated other comprehensive income and certain minority interests; all subject to applicable regulatory adjustments and deductions.The newCompany and Simmons Bank must hold a capital conservation buffer requirement began being phasedof 2.5% composed of CET1 capital above its minimum risk-based capital requirements. Failure to meet this capital conservation buffer would result in beginningadditional limits on January 1, 2016 when a buffer greater than 0.625% of risk-weighted assets was required, which amount will increase each year until the buffer requirement is fully implemented on January 1, 2019.Quantitative measures established by regulation to ensure capital adequacy require the Company to maintain minimum amounts and ratios (set forth in the table below) of total, Tier 1 and common equity Tier 1 capital (as defined in the regulations) to risk-weighted assets (as defined) and of Tier 1 capital (as defined) to average assets (as defined). Management believes that, asAs of December 31, 2017,2023, the Company meetsand its subsidiary bank met all capital adequacy requirements to which it is subject.
under the Basel III Capital Rules and exceeded the fully phased in capital conservation buffer.123As of the most recent notification from regulatory agencies, the bank subsidiaries wereSimmons Bank was well capitalized under the regulatory framework for prompt corrective action. To be categorized as well capitalized, the Company and its subsidiary banksthe Bank must maintain minimum total risk-based, Tier 1 risk-based, common equity Tier 1 risk-based and Tier 1 leverage ratios as set forth in the table. There are no conditions or events since that notification that management believes have changed the institutions’these categories.132The Company’s and the subsidiary banks’Bank’s actual capital amounts and ratios are presented in the following table. Actual Minimum
For Capital
Adequacy Purposes To Be Well
Capitalized Under
Prompt Corrective
Action Provision(In thousands) Amount Ratio (%) Amount Ratio (%) Amount Ratio (%) As of December 31, 2017 Total Risk-Based Capital Ratio Simmons First National Corporation $ 1,388,970 11.4 $ 974,716 8.0 $ N/A Simmons Bank 877,728 12.1 580,316 8.0 725,395 10.0 Bank SNB 259,077 10.9 190,148 8.0 237,685 10.0 Southwest Bank 297,164 11.0 216,119 8.0 270,149 10.0 Tier 1 Risk-Based Capital Ratio Simmons First National Corporation 1,199,457 9.8 734,361 6.0 N/A Simmons Bank 835,787 11.5 436,063 6.0 581,417 8.0 Bank SNB 255,360 10.7 143,193 6.0 190,923 8.0 Southwest Bank 294,874 10.9 162,316 6.0 216,421 8.0 Common Equity Tier 1 Capital Ratio Simmons First National Corporation 1,199,457 9.8 550,771 4.5 N/A Simmons Bank 835,787 11.5 327,047 4.5 472,401 6.5 Bank SNB 255,360 10.7 107,394 4.5 155,125 6.5 Southwest Bank 294,874 10.9 121,737 4.5 175,842 6.5 Tier 1 Leverage Ratio Simmons First National Corporation 1,199,457 9.2 521,503 4.0 N/A Simmons Bank 835,787 9.2 363,386 4.0 454,232 5.0 Bank SNB 255,360 10.1 101,133 4.0 126,416 5.0 Southwest Bank 294,874 12.2 96,680 4.0 120,850 5.0 As of December 31, 2016 Total Risk-Based Capital Ratio Simmons First National Corporation $ 912,948 15.1 $ 483,681 8.0 $ N/A Simmons Bank 830,921 13.8 481,693 8.0 602,117 10.0 Tier 1 Risk-Based Capital Ratio Simmons First National Corporation 872,707 14.5 361,120 6.0 N/A Simmons Bank 790,673 13.2 359,397 6.0 479,196 8.0 Common Equity Tier 1 Capital Ratio Simmons First National Corporation 812,310 13.5 270,770 4.5 N/A Simmons Bank 790,673 13.2 269,548 4.5 389,347 6.5 Tier 1 Leverage Ratio Simmons First National Corporation 872,707 11.0 317,348 4.0 N/A Simmons Bank 790,673 10.0 316,269 4.0 395,337 5.0 124 Actual Minimum
For Capital
Adequacy PurposesTo Be Well
Capitalized Under
Prompt Corrective
Action Provision(In thousands) Amount Ratio (%) Amount Ratio (%) Amount Ratio (%) December 31, 2023 Total Risk-Based Capital Ratio Simmons First National Corporation $ 2,964,917 14.4 $ 1,647,176 8.0 N/A Simmons Bank 2,834,126 13.8 1,642,972 8.0 2,053,714 10.0 Tier 1 Risk-Based Capital Ratio Simmons First National Corporation 2,493,799 12.1 1,236,595 6.0 N/A Simmons Bank 2,663,153 13.0 1,229,148 6.0 1,638,863 8.0 Common Equity Tier 1 Capital Ratio Simmons First National Corporation 2,493,799 12.1 927,446 4.5 N/A Simmons Bank 2,663,153 13.0 921,861 4.5 1,331,577 6.5 Tier 1 Leverage Ratio Simmons First National Corporation 2,493,799 9.4 1,061,191 4.0 N/A Simmons Bank 2,663,153 10.0 1,065,261 4.0 1,331,577 5.0 December 31, 2022 Total Risk-Based Capital Ratio Simmons First National Corporation $ 2,948,490 14.2 $ 1,661,121 8.0 N/A Simmons Bank 2,743,625 13.3 1,650,301 8.0 2,062,876 10.0 Tier 1 Risk-Based Capital Ratio Simmons First National Corporation 2,466,874 11.9 1,243,802 6.0 N/A Simmons Bank 2,628,002 12.7 1,241,576 6.0 1,655,434 8.0 Common Equity Tier 1 Capital Ratio Simmons First National Corporation 2,466,874 11.9 932,852 4.5 N/A Simmons Bank 2,628,002 12.7 931,182 4.5 1,345,040 6.5 Tier 1 Leverage Ratio Simmons First National Corporation 2,466,874 9.3 1,061,021 4.0 N/A Simmons Bank 2,628,002 10.0 1,051,201 4.0 1,314,001 5.0 133NOTE 22:24:CONDENSED FINANCIAL INFORMATION (PARENT COMPANY ONLY)CONDENSED BALANCE SHEETSDECEMBER 31, 2017 and 2016(In thousands) 2017 2016 ASSETS Cash and cash equivalents $ 19,101 $ 93,266 Investment securities 2,789 79 Investments in wholly-owned subsidiaries 2,288,687 1,141,294 Loans 993 1,083 Intangible assets, net 133 133 Premises and equipment 10,369 11,534 Other assets 31,181 27,955 TOTAL ASSETS $ 2,353,253 $ 1,275,344 LIABILITIES Short-term debt $ 75,000 $ -- Long-term debt 183,947 108,326 Other liabilities 9,742 15,907 Total liabilities 268,689 124,233 STOCKHOLDERS’ EQUITY Common stock 920 626 Surplus 1,586,034 711,663 Undivided profits 514,874 454,034 Accumulated other comprehensive loss Unrealized depreciation on available-for-sale securities, net of income taxes of ($6,108) and ($9,818) at December 31, 2017 and 2016 respectively (17,264 ) (15,212 ) Total stockholders’ equity 2,084,564 1,151,111 TOTAL LIABILITIES AND STOCKHOLDERS’ EQUITY $ 2,353,253 $ 1,275,344 CONDENSED STATEMENTS OF INCOMEYEARS ENDED DECEMBER 31, 2017, 2016 and 2015(In thousands) 2017 2016 2015 INCOME Dividends from subsidiaries $ 69,107 $ 83,710 $ 84,128 Other income 4,111 2,465 2,303 Income 73,218 86,175 86,431 EXPENSE 32,234 21,990 24,594 Income before income taxes and equity in undistributed net income of subsidiaries 40,984 64,185 61,837 Provision for income taxes (12,311 ) (7,557 ) (8,251 ) Income before equity in undistributed net income of subsidiaries 53,295 71,742 70,088 Equity in undistributed net income of subsidiaries 39,645 25,072 4,276 NET INCOME 92,940 96,814 74,364 Preferred stock dividends -- 24 257 NET INCOME AVAILABLE TO COMMON SHAREHOLDERS $ 92,940 $ 96,790 $ 74,107 125CONDENSED STATEMENTS OF COMPREHENSIVE INCOMEYEARS ENDED DECEMBERCondensed Balance SheetsDecember 31, 2017, 20162023 and 20152022(In thousands) 2017 2016 2015 NET INCOME $ 92,940 $ 96,814 $ 74,364 OTHER COMPREHENSIVE INCOME Equity in other comprehensive income (loss) income of subsidiaries 964 (12,547 ) (1,329 ) COMPREHENSIVE INCOME $ 93,904 $ 84,267 $ 73,035 CONDENSED STATEMENTS OF CASH FLOWSYEARS ENDED DECEMBER(In thousands) 2023 2022 ASSETS Cash and cash equivalents $ 164,439 $ 116,915 Investments in wholly-owned subsidiaries 3,603,066 3,453,961 Loans 102 1,412 Intangible assets, net 133 133 Premises and equipment 20,498 22,083 Other assets 50,642 86,622 TOTAL ASSETS $ 3,838,880 $ 3,681,126 LIABILITIES Long-term debt $ 385,285 $ 386,798 Other liabilities 27,107 24,966 Total liabilities 412,392 411,764 STOCKHOLDERS’ EQUITY Common stock 1,252 1,270 Surplus 2,499,930 2,530,066 Undivided profits 1,329,681 1,255,586 Accumulated other comprehensive loss: Unrealized depreciation on available-for-sale securities, net of income taxes of $(143,076) and $(183,124) at December 31, 2023 and 2022, respectively (404,375) (517,560) Total stockholders’ equity 3,426,488 3,269,362 TOTAL LIABILITIES AND STOCKHOLDERS’ EQUITY $ 3,838,880 $ 3,681,126 134Condensed Statements of IncomeYears Ended December 31, 2017, 20162023, 2022 and 2015(In thousands) 2017 2016 2015 CASH FLOWS FROM OPERATING ACTIVITIES Net income $ 92,940 $ 96,814 $ 74,364 Items not requiring (providing) cash Stock-based compensation expense 10,681 3,418 4,018 Depreciation and amortization 1,183 700 317 Deferred income taxes 1,190 (2,526 ) 1,287 Equity in undistributed net income of bank subsidiaries (39,645 ) (25,072 ) (4,276 ) Changes in Other assets 8,585 2,816 (15,232 ) Other liabilities (6,769 ) (1,358 ) 13,121 Net cash provided by operating activities 68,165 74,792 73,599 CASH FLOWS FROM INVESTING ACTIVITIES Net originations of loans 90 (1,710 ) -- Net purchases of premises and equipment (18 ) (6,896 ) 56 Additional investment in subsidiary (15,000 ) -- -- Proceeds from maturities of available-for-sale securities 42 1,973 -- Purchases of available-for-sale securities (2,752 ) (3 ) (354 ) Cash received (paid) in business combinations (100,468 ) (35,048 ) 44,173 Net cash (used in) provided by investing activities (118,106 ) (41,684 ) 43,875 CASH FLOWS FROM FINANCING ACTIVITIES Issuance (repayment) of long-term debt, net 8,014 (4,544 ) 8,126 Issuance of common stock, net 2,878 4,938 3,529 Dividends paid on preferred stock -- (24 ) (257 ) Dividends paid on common stock (35,116 ) (28,743 ) (27,026 ) Redemption of preferred stock -- (30,852 ) -- Net cash used in financing activities (24,224 ) (59,225 ) (15,628 ) (DECREASE) INCREASE IN CASH AND CASH EQUIVALENTS (74,165 ) (26,117 ) 101,846 CASH AND CASH EQUIVALENTS, BEGINNING OF YEAR 93,266 119,383 17,537 CASH AND CASH EQUIVALENTS, END OF YEAR $ 19,101 $ 93,266 $ 119,383
2021126(In thousands) 2023 2022 2021 INCOME Dividends from subsidiaries $ 166,874 $ 219,868 $ 227,310 Other income 303 508 1,080 Income 167,177 220,376 228,390 EXPENSE 44,685 46,133 44,847 Income before income taxes and equity in undistributed net income of subsidiaries 122,492 174,243 183,543 Provision for income taxes (10,790) (9,391) (11,314) Income before equity in undistributed net income of subsidiaries 133,282 183,634 194,857 Equity in undistributed net income (loss) of subsidiaries 41,775 72,778 76,299 NET INCOME 175,057 256,412 271,156 Preferred stock dividends — — 47 NET INCOME AVAILABLE TO COMMON STOCKHOLDERS $ 175,057 $ 256,412 $ 271,109 Condensed Statements of Comprehensive IncomeYears Ended December 31, 2023, 2022 and 2021(In thousands) 2023 2022 2021 NET INCOME $ 175,057 $ 256,412 $ 271,156 OTHER COMPREHENSIVE INCOME (LOSS) Equity in other comprehensive income (loss) of subsidiaries 113,185 (507,015) (70,271) COMPREHENSIVE INCOME (LOSS) $ 288,242 $ (250,603) $ 200,885 135Condensed Statements of Cash FlowsYears Ended December 31, 2023, 2022 and 2021(In thousands) 2023 2022 2021 CASH FLOWS FROM OPERATING ACTIVITIES Net income $ 175,057 $ 256,412 $ 271,156 Items not requiring (providing) cash Stock-based compensation expense 12,189 15,317 15,868 Depreciation and amortization 1,637 1,981 1,805 Deferred income taxes (1,742) (652) 3,347 Equity in undistributed net income (loss) of bank subsidiaries (41,775) (72,778) (76,299) Changes in: Other assets 37,720 (26,775) (2,099) Other liabilities 2,293 (28,745) 11,109 Net cash provided by operating activities 185,379 144,760 224,887 CASH FLOWS FROM INVESTING ACTIVITIES Net collections (originations) of loans 1,310 1,198 (2,139) Net purchases of premises and equipment (52) (21) (83) Cash acquired (paid) in business combinations — 60,126 (6,818) Other, net 5,856 1,688 2 Net cash provided by (used in) investing activities 7,114 62,991 (9,038) CASH FLOWS FROM FINANCING ACTIVITIES Repayment of long-term debt, net (1,664) (57,436) (1,563) (Cancellation) issuance of common stock, net (2,021) (3,882) 1,460 Stock repurchases (40,322) (111,133) (132,459) Dividends paid on preferred stock — — (47) Dividends paid on common stock (100,962) (94,096) (78,845) Preferred stock retirement — — (767) Net cash used in financing activities (144,969) (266,547) (212,221) INCREASE (DECREASE) IN CASH AND CASH EQUIVALENTS 47,524 (58,796) 3,628 CASH AND CASH EQUIVALENTS, BEGINNING OF YEAR 116,915 175,711 172,083 CASH AND CASH EQUIVALENTS, END OF YEAR $ 164,439 $ 116,915 $ 175,711 136ITEM 9.CHANGES IN AND DISAGREEMENTS WITH ACCOUNTANTS ON ACCOUNTING AND FINANCIAL DISCLOSURENo items are reportable.ITEM 9. CHANGES IN AND DISAGREEMENTS WITH ACCOUNTANTS ON ACCOUNTING AND FINANCIAL DISCLOSURENone.ITEM 9A.CONTROLS AND PROCEDURESITEM 9A. CONTROLS AND PROCEDURES(a) Evaluation of disclosure controlsDisclosure Controls and procedures. The Company'sProcedures. Under the supervision and with the participation of our management, including the Company’s Chief Executive Officer, and Chief Financial Officer have reviewed and evaluatedChief Accounting Officer, an evaluation of the effectiveness of the Company'sCompany’s disclosure controls and procedures (as defined in Rule 13a-15(e) and Rule 15d-15(e) under the Exchange Act) was carried out as of December 31, 2017.the end of the period covered by this Annual Report on Form 10-K. Based upon that evaluation, the Chief Executive Officer, Chief Financial Officer and Chief FinancialAccounting Officer have concluded that the Company'sCompany’s current disclosure controls and procedures were effective foras of the period.(b) Changes in Internal Controls. The Company’sOur management, including the Company’s Chief Executive Officer, Chief Financial Officer and Chief Accounting Officer, regularly review our disclosure controls and procedures and make changes intended to ensure the quality of our financial reporting. Otherwise, thereThere were no changes in our internal control over financial reporting during the Company’s fourth quarter of its 20172023 fiscal year that hashave materially affected, or isare reasonably likely to materially affect, the Company’s internal control over financial reporting.(c) Management’s Report on Internal Control Over Financial Reporting. Management’s report on internal control over financial reporting, as well as the audit report of FORVIS, LLP on the Company’s internal control over financial reporting are included in Item 8, Consolidated Financial Statements and Supplementary Data, of this Annual Report on Form 10-K and are incorporated herein by this reference.ITEM 9B.OTHER INFORMATIONNo itemsITEM 9B. OTHER INFORMATIONDuring the three months ended December 31, 2023, none of our directors or officers (as defined in Rule 16a-1(f) of the Securities Exchange Act of 1934, as amended) adopted, modified or terminated a Rule 10b5-1 trading arrangement or non-Rule 10b5-1 trading arrangement (as such terms are reportable.ITEM 9C. DISCLOSURE REGARDING FOREIGN JURISDICTIONS THAT PREVENT INSPECTIONSNot applicable.137PART IIIITEM 10.DIRECTORS, EXECUTIVE OFFICERS AND CORPORATE GOVERNANCEIncorporatedITEM 10. DIRECTORS, EXECUTIVE OFFICERS AND CORPORATE GOVERNANCEThis information is incorporated herein by reference from the Company'sCompany’s definitive proxy statement for the Annual Meeting of StockholdersShareholders to be held April 19, 2018,23, 2024, to be filed pursuant to Regulation 14A on or about March 14, 2018.within 120 days of the Company’s fiscal year-end (the “Proxy Statement”) under the captions “Proposal 2 - Election of Directors,” “Audit Committee,” “Delinquent Section 16(a) Reports,” as applicable, “Codes of Ethics,” “ Executive Officers,” and the last two paragraphs under the caption “Transactions with Related Persons.”The table below also sets forth the names and principal occupations of the Company’s executive officers.Name Principal Occupation George A. Makris, Jr. Executive Chairman and Chairman of the Board* Robert A. Fehlman Chief Executive Officer* James M. Brogdon President* Charles D. Hobbs Executive Vice President and Chief Financial Officer* Stephen C. Massanelli Senior Executive Vice President and Chief Administrative Officer* George A. Makris III Executive Vice President, General Counsel and Secretary* Jennifer B. Compton Executive Vice President and Chief People Officer* David W. Garner Executive Vice President and Chief Accounting Officer* Ann Madea Executive Vice President and Chief Information Officer* Brad Yaney Executive Vice President of Credit Risk Management, Simmons Bank _________________* The officer holds the positions at both the Company and Simmons Bank.The table below also sets forth the names, principal occupations, and employers of the Company’s directors.Name Principal Occupation and Employer Dean Bass Retired Chairman and Chief Executive Officer, Spirit of Texas Bancshares, Inc. and Spirit of Texas Bank, SSB Jay Burchfield Retired Chairman, Ozark Trust and Investment Corp. Marty D. Casteel Retired Senior Executive Vice President of the Company; Retired Chairman, President and Chief Executive Officer of Simmons Bank William E. Clark, II Chairman and Chief Executive Officer, Clark Contractors, LLC Steven A. Cossé Retired President and Chief Executive Officer, Murphy Oil Corporation Mark C. Doramus Chief Financial Officer, Stephens Inc. Edward Drilling Retired Senior Vice President of External and Regulatory Affairs, AT&T Inc. Eugene Hunt Attorney, Hunt Law Firm Jerry Hunter Senior Counsel, Bryan Cave Leighton Paisner LLP Susan Lanigan Retired Executive Vice President and General Counsel, Chico’s FAS, Inc. George A. Makris, Jr. Executive Chairman and Chairman of the Board, the Company and Simmons Bank W. Scott McGeorge Chairman, Pine Bluff Sand and Gravel Company Tom Purvis Partner, L2L Development Advisors, LLC Robert L. Shoptaw Retired Executive, Arkansas Blue Cross and Blue Shield Julie Stackhouse Retired Executive Vice President, Federal Reserve Bank of St. Louis Russell W. Teubner Distinguished Engineer, Broadcom, Inc. Mindy West Executive Vice President, Chief Financial Officer and Treasurer, Murphy USA Inc 138ITEM 11.EXECUTIVE COMPENSATIONIncorporatedITEM 11. EXECUTIVE COMPENSATIONThis information is incorporated herein by reference from the Company's definitive proxy statement forProxy Statement under the Annual Meetingcaptions “Compensation Committee Interlocks and Insider Participation,” “Compensation Discussion and Analysis,” “Relationship of StockholdersCompensation Policies and Practices to be held April 19, 2018,Risk Management,” “Summary of Compensation and Other Payments to be filed pursuant to Regulation 14A on or about March 14, 2018.the Named Executive Officers,” “2023 Pay Ratio Disclosure,” “Director Compensation,” and “2023 Director Compensation.”ITEM 12.SECURITY OWNERSHIP OF CERTAIN BENEFICIAL OWNERS AND MANAGEMENT AND RELATED STOCKHOLDER MATTERSIncorporatedITEM 12. SECURITY OWNERSHIP OF CERTAIN BENEFICIAL OWNERS AND MANAGEMENT AND RELATED STOCKHOLDER MATTERSThis information is incorporated herein by reference from the Company's definitive proxy statement forProxy Statement under the Annual Meetingcaptions “Security Ownership of Stockholders to be held April 19, 2018, to be filed pursuant to Regulation 14A on or about March 14, 2018.Certain Beneficial Owners” and “Equity Compensation Plan Information.”ITEM 13.CERTAIN RELATIONSHIPS AND RELATED TRANSACTIONS, AND DIRECTOR INDEPENDENCEIncorporatedITEM 13. CERTAIN RELATIONSHIPS AND RELATED TRANSACTIONS, AND DIRECTOR INDEPENDENCEThis information is incorporated herein by reference from the Company's definitive proxy statementProxy Statement under the captions “Transactions with Related Persons,” “Policies and Procedures for Approval of Related Party Transactions,” and the Annual Meetingfirst two paragraphs under the caption “Proposal 2 – Election of Stockholders to be held April 19, 2018, to be filed pursuant to Regulation 14A on or about March 14, 2018.Directors.”ITEM 14.PRINCIPAL ACCOUNTING FEES AND SERVICESIncorporatedITEM 14. PRINCIPAL ACCOUNTANT FEES AND SERVICESThis information is incorporated herein by reference from the Company's definitive proxy statement forProxy Statement under the Annual Meeting of Stockholders to be held April 19, 2018, to be filed pursuant to Regulation 14A on or about March 14, 2018.
caption “Principal Accountant Fees” and the fourth paragraph under the caption “Audit Committee.”127PART IVITEM 15.EXHIBITS AND FINANCIAL STATEMENT SCHEDULESITEM 15. EXHIBITS AND FINANCIAL STATEMENT SCHEDULES(a) 1 and 2. Financial Statements and any Financial Statement SchedulesThe financial statements and financial statement schedules listed in the accompanying index to the consolidated financial statements and financial statement schedules are filed as part of this report.(b) Listing of ExhibitsExhibit No. Description Purchase and Assumption Agreement, dated as of May 14, 2010, among Federal Insurance Deposit Corporation, Receiver of Southwest Community Bank, Springfield, Missouri, Federal Deposit Insurance Corporation and Simmons First National Bank (incorporated by reference to Exhibit 2.1 to Simmons First National Corporation’s Current Report on Form 8-K, as amended, for May 19, 2010 (File No. 000-06253)).2.2Purchase and Assumption Agreement, dated as of October 15, 2010, among Federal Insurance Deposit Corporation, Receiver of Security Savings Bank F.S.B., Olathe, Kansas, Federal Deposit Insurance Corporation and Simmons First National Bank (incorporated by reference to Exhibit 2.1 to Simmons First National Corporation’s Current Report on Form 8-K, as amended, for October 21, 2010 (File No. 000-06253)).2.3Purchase and Assumption Agreement Whole Bank All Deposits, among Federal Insurance Deposit Corporation, Receiver of Truman Bank, St. Louis, Missouri, Federal Deposit Insurance Corporation, and Simmons First National Bank, Pine Bluff, Arkansas, dated as of September 14, 2012 (incorporated by reference to Exhibit 2.1 to Simmons First National Corporation’s Current Report on Form 8-K, as amended, for September 20, 2012 (File No. 000-06253)).2.4Loan Sale Agreement, by and between Federal Deposit Insurance Corporation, as Receiver for Truman Bank, St. Louis, Missouri, and Simmons First National Bank, Pine Bluff, Arkansas, dated as of September 14, 2012 (incorporated by reference to Exhibit 2.2 to Simmons First National Corporation’s Current Report on Form 8-K, as amended, for September 20, 2012 (File No. 000-06253)).2.5Purchase and Assumption Agreement Whole Bank All Deposits, among Federal Insurance Deposit Corporation, Receiver of Excel Bank, Sedalia, Missouri, Federal Deposit Insurance Corporation, and Simmons First National Bank, Pine Bluff, Arkansas, dated as of October 19, 2012 (incorporated by reference to Exhibit 2.1 to Simmons First National Corporation’s Current Report on Form 8-K, as amended, for October 25, 2012 (File No. 000-06253)).2.6Stock Purchase Agreement by and between Simmons First National Corporation and Rogers Bancshares, Inc., dated as of September 10, 2013 (incorporated by reference to Exhibit 10.1 to Simmons First National Corporation’s Current Report on Form 8-K forfiled on September 12,17, 2013 (File No. 000-06253)).Agreement and Plan of Merger, dated as of March 24, 2014, by and between Simmons First National Corporation and Delta Trust & Banking Corporation (incorporated by reference to Annex A to the Joint Proxy Statement/Prospectus filed by Simmons First National Corporation on July 23, 2014 (File No. 000-06253)). Agreement and Plan of Merger, dated as of May 6, 2014, by and between Simmons First National Corporation and Community First Bancshares, Inc., as amended on September 11, 2014 (incorporated by reference to Annex A to the Joint Proxy Statement/Prospectus filed by Simmons First National Corporation on October 8, 2014 (File No. 000-06253)). Agreement and Plan of Merger, dated as of May 27, 2014, by and between Simmons First National Corporation and Liberty Bancshares, Inc., as amended on September 11, 2014 (incorporated by reference to Annex B to the Joint Proxy Statement/Prospectus filed by Simmons First National Corporation on October 8, 2014 (File No. 000-06253)). 1282.10Agreement and Plan of Merger, dated as of April 28, 2015, by and between Simmons First National Corporation and Ozark Trust & Investment Corporation (incorporated by reference to Exhibit 10.1 to Simmons First National Corporation’s Current Report on Form 8-K for April 29, 2015 (File No. 000-06253)). 139Exhibit No. Description Stock Purchase Agreement by and among Citizens National Bank, Citizens National Bancorp, Inc. and Simmons First National Corporation, dated as of May 18, 2016 (incorporated by reference to Exhibit 2.1 to Simmons First National Corporation’s Current Report on Form 8-K for May 18, 2016 (File No. 000-06253)). Agreement and Plan of Merger, dated as of November 17, 2016, by and between Simmons First National Corporation and Hardeman County Investment Company, Inc. (incorporated by reference to Exhibit 2.1 to Simmons First National Corporation’s Current Report on Form 8-K for November 17, 2016 (File No. 000-06253)). Agreement and Plan of Merger, dated as of December 14, 2016, by and between Simmons First National Corporation and Southwest Bancorp, Inc., as amended on July 19, 2017 (incorporated by reference to Exhibit 2.11 to Simmons First National Corporation’s Quarterly Report on Form 10-Q for the Quarterquarter ended June 30, 2017 (File No. 000-06253)).Agreement and Plan of Merger, dated as of January 23, 2017, by and between Simmons First National Corporation and First Texas, BHC, Inc., as amended on July 19, 2017 (incorporated by reference to Exhibit 2.12 to Simmons First National Corporation’s Quarterly Report on Form 10-Q for the Quarterquarter ended June 30, 2017 (File No. 000-06253)).Agreement and Plan of Merger, dated as of November 13, 2018, by and between Simmons First National Corporation and Reliance Bancshares, Inc., as amended on February 11, 2019 (incorporated by reference to Annex A to the Proxy Statement/Prospectus filed pursuant to Rule 424(b)(3) by Simmons First National Corporation filed on March 4, 2019 (File No. 333-229378)). Agreement and Plan of Merger, dated as of July 30, 2019, by and between Simmons First National Corporation and The Landrum Company (incorporated by reference to Exhibit 2.1 to Simmons First National Corporation Current Report on Form 8-K filed on July 31, 2019 (File No. 000-6253)). Agreement and Plan of Merger, dated as of June 4, 2021, by and among Simmons First National Corporation, Simmons Bank and Landmark Community Bank (incorporated by reference to Annex A to the Registration Statement on Form S-4 filed under the Securities Act of 1933 by Simmons First National Corporation on July 21, 2021 (File No. 333-258059)). Agreement and Plan of Merger, dated as of June 4, 2021, by and between Simmons First National Corporation and Triumph Bancshares, Inc. (incorporated by reference to Annex B to the Registration Statement on Form S-4 filed under the Securities Act of 1933 by Simmons First National Corporation on July 21, 2021 (File No. 333-258059)). Agreement and Plan of Merger, dated as of November 18, 2021, by and between Simmons First National Corporation and Spirit of Texas Bancshares, Inc. (incorporated by reference to Annex A to the Registration Statement on Form S-4 filed under the Securities Act of 1933 by Simmons First National Corporation on January 18, 2022 (File No. 333-261842)). Amended and Restated Articles of Incorporation of Simmons First National Corporation, as amended on July 14, 2021 (incorporated by reference to Exhibit 3.1 to the Registration Statement on Form S-4 filed under the Securities Act of 1933 by Simmons First National Corporation’s Quarterly ReportCorporation on Form 10-Q for the Quarter ended March 31, 2009July 21, 2021 (File No. 000-06253)333-258059)).Articles of Amendment to the Amended By-Lawsand Restated Articles of Incorporation of Simmons First National Corporation, dated August 3, 2022 (incorporated by reference to Exhibit 3.2 to Simmons First National Corporation’s Quarterly Report on Form 10-Q for the Quarterquarter ended JuneSeptember 30, 20172022 (File No. 000-06253)).Certificate of Designation of Senior Non-Cumulative Perpetual Preferred Stock, Series AAmended and Restated By-Laws of Simmons First National Corporation dated February 27, 2015 (incorporated by reference to Exhibit 3.1 to Simmons First National Corporation’s Current Report on Form 8-K filed on February 27, 2015December 26, 2023 (File No. 000-06253)).4.1 Instruments defining the rights of security holders, including indentures. Simmons First National Corporation hereby agrees to furnish copies of instruments defining the rightrights of holders of long-term debt of the Corporation and its consolidated subsidiaries to the U.S. Securities and Exchange Commission upon request. No issuance of debt exceeds ten percent of the total assets of the Corporation and its subsidiaries on a consolidated basis.140Exhibit No. Description Amended and Restated Deferred Compensation Agreement for Barry K. Ledbetter effective February 27, 2017Description of Registrant’s Securities (incorporated by reference to Exhibit 10.244.2 to Simmons First National Corporation’s Annual Report on Form 10-K for the Yearyear ended December 31, 20162022 (File No. 000-06253)).Second Amended and Restated Simmons First National Corporation 2015 Incentive Plan (incorporated by reference to Exhibit 10.1 to Amendment No. 1 to Simmons First National Corporation’s Current Report on Form 8-K filed on April 7, 2020 (File No. 000-06253)).^ Form of Associate Restricted Stock Unit Award Certificate and Terms and Conditions (incorporated by reference to Exhibit 10.2 to Simmons First National Corporation’s Annual Report on Form 10-K for the year ended December 31, 2020 (File No. 000-06253)).^ Form of Associate Restricted Stock Unit Award Certificate and Terms and Conditions (2022) (incorporated by reference to Exhibit 10.2 to Simmons First National Corporation’s Quarterly Report on Form 10-Q for the quarter ended March 31, 2022 (File No. 000-06253)).^ Form of Associate Performance Share Unit Award Certificate and Terms and Conditions (2020) (incorporated by reference to Exhibit 10.3 to Simmons First National Corporation’s Annual Report on Form 10-K for the year ended December 31, 2020 (File No. 000-06253)).^ Form of Associate Performance Share Unit Award Certificate and Terms and Conditions (2021) (incorporated by reference to Exhibit 10.4 to Simmons First National Corporation’s Annual Report on Form 10-K for the year ended December 31, 2021 (File No. 000-06253)).^ Form of Associate Performance Share Unit Award Certificate and Terms and Conditions (2022) (incorporated by reference to Exhibit 10.3 to Simmons First National Corporation’s Quarterly Report on Form 10-Q for the quarter ended March 31, 2022 (File No. 000-06253)).^ Form of Associate Cash Award Certificate and Terms and Conditions (incorporated by reference to Exhibit 10.5 to Simmons First National Corporation’s Annual Report on Form 10-K for the year ended December 31, 2021 (File No. 000-06253)).^ Form of Associate Cash Award Certificate and Terms and Conditions (2022) (incorporated by reference to Exhibit 10.4 to Simmons First National Corporation’s Quarterly Report on Form 10-Q for the quarter ended March 31, 2022 (File No. 000-06253)).^ Form of Director Restricted Stock Unit Award Certificate and Terms and Conditions (incorporated by reference to Exhibit 10.5 to Simmons First National Corporation’s Annual Report on Form 10-K for the year ended December 31, 2020 (File No. 000-06253)).^ Form of Director Restricted Stock Unit Award Certificate and Terms and Conditions (2022) (incorporated by reference to Exhibit 10.5 to Simmons First National Corporation’s Quarterly Report on Form 10-Q for the quarter ended March 31, 2022 (File No. 000-06253)).^ Deferred Compensation Agreement for Marty D. Casteel dated January 22, 2018 (incorporated by reference to Exhibit 10.3 to Simmons First National Corporation’s Annual Report on Form 10-K for the year ended December 31, 2017 (File No. 000-06253)).^ Deferred Compensation Agreement for George A. Makris, Jr. dated January 2, 2013 (incorporated by reference to Exhibit 10.2 to Simmons First National Corporation’s Current Report on Form 8-K filed on January 7, 2013 (File No. 000-06253)).^ Amendment to Deferred Compensation Agreement for George A. Makris, Jr. dated January 25, 2018 (incorporated by reference to Exhibit 10.4 to Simmons First National Corporation’s Annual Report on Form 10-K for the year ended December 31, 2017 (File No. 000-06253)).^ Amended and Restated Deferred Compensation Agreement for Robert A. Fehlman effective February 27, 2017 (incorporated by reference to Exhibit 10.25 to Simmons First National Corporation’s Annual Report on Form 10-K for the Yearyear ended December 31, 2016 (File No. 000-06253)).^First Amended and Restated Executive Change in Control Severance Agreement for George A. Makris, Jr. dated March 26, 2021 (incorporated by reference to Exhibit 10.2 to Simmons First National Corporation’s Current Report on Form 8-K filed on April 1, 2021 (File No. 000-06253)).^ 141Exhibit No. Description First Amended and Restated Executive Change in Control Severance Agreement for Stephen C. Massanelli dated March 26, 2021 (incorporated by reference to Exhibit 10.3 to Simmons First National Corporation’s Current Report on Form 8-K filed on April 1, 2021 (File No. 000-06253)).^ Deferred Compensation Agreement for Marty D. Casteel dated January 22, 2018.*25, 2010 (incorporated by reference to Exhibit 10.3 to Simmons First National Corporation’s Current Report on Form 8-K filed on January 29, 2010 (File No. 000-06253)).^Amended and Restated Executive Severance Agreement for Robert A. Fehlman dated March 1, 2006 (incorporated by reference to Exhibit 10.3 to Simmons First National Corporation’s Current Report on Form 8-K filed on March 2, 2006 (File No. 000-06253)).^ 10.4First Amendment to Amended and Restated Executive Severance Agreement for Robert A. Fehlman dated March, 1, 2006. (incorporated by reference to Exhibit 10.14 to Simmons First National Corporation’s Annual Report on Form 10-K for the year ended December 31, 2020 (File No. 000-06253)).^ Second Amendment to Amended and Restated Executive Severance Agreement for Robert A. Fehlman dated March 1, 2006. (incorporated by reference to Exhibit 10.15 to Simmons First National Corporation’s Annual Report on Form 10-K for the year ended December 31, 2020 (File No. 000-06253)).^ Deferred Compensation Agreement for Jennifer B. Compton dated February 28, 2017 (incorporated by reference to Exhibit 10.11 to Simmons First National Corporation’s Annual Report on Form 10-K for the year ended December 31, 2019 (File No. 000-06235)).^ First Amendment to Deferred Compensation Agreement for Jennifer B. Compton dated July 27, 2022 (incorporated by reference to Exhibit 10.1 to Simmons First National Corporation’s Quarterly Report on Form 10-Q for the quarter ended September 30, 2022 (File No. 000-06235)).^ First Amended and Restated Executive Change in Control Severance Agreement for Jennifer B. Compton dated March 26, 2021 (incorporated by reference to Exhibit 10.5 to Simmons First National Corporation’s Quarterly Report on Form 10-Q for the quarter ended March 31, 2021 (File No. 000-06253)).^ First Amended and Restated Executive Change in Control Severance Agreement for David Garner dated March 26, 2021 (incorporated by reference to Exhibit 10.7 to Simmons First National Corporation’s Quarterly Report on Form 10-Q for the quarter ended March 31, 2021 (File No. 000-06253)).^ First Amended and Restated Executive Change in Control Severance Agreement for George A. Makris III dated March 26, 2021 (incorporated by reference to Exhibit 10.6 to Simmons First National Corporation’s Quarterly Report on Form 10-Q for the quarter ended March 31, 2021 (File No. 000-06253)).^ Deferred Compensation Agreement for George A. Makris III dated March 11, 2022 (incorporated by reference to Exhibit 10.1 to Simmons First National Corporation’s Quarterly Report on Form 10-Q for the quarter ended March 31, 2022 (File No. 000-06253)).^ First Amendment to Deferred Compensation Agreement for George A. Makris III dated January 25, 2018.*10.5Revolving Credit Agreement, dated as of October 6, 2017,July 27, 2022 (incorporated by and betweenreference to Exhibit 10.2 to Simmons First National Corporation and U.S. BankCorporation’s Quarterly Report on Form 10-Q for the quarter ended September 30, 2022 (File No. 000-06235)).^Deferred Compensation Agreement for Matthew Reddin dated March 7, 2017. (incorporated by reference to Exhibit 10.23 to Simmons First National AssociationCorporation’s Annual Report on Form 10-K for the year ended December 31, 2020 (File No. 000-06253)).^First Amendment to Deferred Compensation Agreement for Matthew Reddin dated August 4, 2022 (incorporated by reference to Exhibit 10.3 to Simmons First National Corporation’s Quarterly Report on Form 10-Q for the quarter ended September 30, 2022 (File No. 000-06235)).^ Deferred Compensation Agreement for David Garner dated January 2, 2020 (incorporated by reference to Exhibit 10.1 to Simmons First National Corporation’s Quarterly Report on Form 10-Q for the quarter ended March 31, 2020 (File No. 000-06253)).^ Form of Indemnification Agreement (incorporated by reference to Exhibit 10.1 to Simmons First National Corporation’s Quarterly Report on Form 10-Q for the quarter ended March 31, 2021 (File No. 000-06253)).^ 142Exhibit No. Description Indemnification Agreement for James M. Brogdon dated July 30, 2021 (incorporated by reference to Exhibit 10.1 to Simmons First National Corporation’s Current Report on Form 8-K filed October 11, 2017on August 5, 2021 (File No. 000-06253)).^Revolving Credit Note,Executive Change in Control Severance Agreement for James M. Brogdon dated October 6, 2017, by Simmons First National Corporation in favor of U.S. Bank National AssociationJuly 30, 2021 (incorporated by reference to Exhibit 10.2 to Simmons First National Corporation’s Current Report on Form 8-K filed October 11, 2017on August 5, 2021 (File No. 000-06253)).^Deferred Compensation Agreement for James M. Brogdon dated July 30, 2021 (incorporated by reference to Exhibit 10.3 to Simmons First National Corporation’s Current Report on Form 8-K filed on August 5, 2021 (File No. 000-06253)).^ Computation of Ratios of EarningsSimmons First National Corporation Directors Deferred Compensation Plan (Amended and Restated Effective December 31, 2022) (incorporated by reference to Fixed Charges.*Exhibit 10.36 to Simmons First National Corporation’s Annual Report on Form 10-K for the year ended December 31, 2022 (File No. 000-06253)).^Separation Agreement and Release among Simmons First National Corporation, Simmons Bank, and Matthew Reddin dated July 26, 2023 (incorporated by reference to Exhibit 10.1 to Simmons First National Corporation’s Current Report on Form 8-K filed on July 28, 2023 (File No. 000-06253)).^ Indemnification Agreement for Dean Bass dated July 27, 2023 (incorporated by reference to Exhibit 10.5 to Simmons First National Corporation’s Quarterly Report on Form 10-Q for the quarter ended June 30, 2023 (File No. 000-06253)).^ Second Amendment to Deferred Compensation Agreement for George A. Makris, Jr. dated January 25, 2023 (incorporated by reference to Exhibit 10.1 to Simmons First National Corporation’s Current Report on Form 8-K filed January 25, 2023 (File No. 000-06253)).^ Form of Associate Restricted Stock Unit Award Certificate and Terms of Conditions (2015 Plan - 2023) (incorporated by reference to Exhibit 10.2 to Simmons First National Corporation’s Quarterly Report on Form 10-Q for the quarter ended March 31, 2023 (File No. 000-06253)).^ Form of Associate Performance Share Unit Award Certificate and Terms and Conditions (2015 Plan - 2023) (incorporated by reference to Exhibit 10.3 to Simmons First National Corporation’s Quarterly Report on Form 10-Q for the quarter ended March 31, 2023 (File No. 000-06253)).^ Form of Associate Cash Award Certificate and Terms and Conditions (2015 Plan - 2023) (incorporated by reference to Exhibit 10.4 to Simmons First National Corporation’s Quarterly Report on Form 10-Q for the quarter ended March 31, 2023 (File No. 000-06253)).^ Executive Change in Control Severance Agreement for Ann Madea dated November 12, 2021 (incorporated by reference to Exhibit 10.5 to Simmons First National Corporation’s Quarterly Report on Form 10-Q for the quarter ended March 31, 2023 (File No. 000-06253)).^ Indemnification Agreement for Ann Madea dated November 12, 2021 (incorporated by reference to Exhibit 10.6 to Simmons First National Corporation’s Quarterly Report on Form 10-Q for the quarter ended March 31, 2023 (File No. 000-06253)).^ First Amended and Restated Executive Change in Control Agreement for Chad Rawls dated November 8, 2022 (incorporated by reference to Exhibit 10.7 to Simmons First National Corporation’s Quarterly Report on Form 10-Q for the quarter ended March 31, 2023 (File No. 000-06253)).^ Indemnification Agreement for Chad Rawls dated November 8, 2022 (incorporated by reference to Exhibit 10.8 to Simmons First National Corporation’s Quarterly Report on Form 10-Q for the quarter ended March 31, 2023 (File No. 000-06253)).^ Executive Change in Control Agreement for Brad Yaney dated November 4, 2022 (incorporated by reference to Exhibit 10.9 to Simmons First National Corporation’s Quarterly Report on Form 10-Q for the quarter ended March 31, 2023 (File No. 000-06253)).^ 143Exhibit No. Description Indemnification Agreement for Brad Yaney dated November 4, 2022 (incorporated by reference to Exhibit 10.10 to Simmons First National Corporation’s Quarterly Report on Form 10-Q for the quarter ended March 31, 2023 (File No. 000-06253)).^ Simmons First National Corporation 2023 Stock and Incentive Plan (incorporated by reference to Exhibit 10.1 to Simmons First National Corporation’s Current Report on Form 8-K filed on April 19, 2023 (File No. 000-06253)).^ Form of Non-Employee Director Restricted Stock Unit Award Agreement (2023 Plan – for awards on or after April 18, 2023) (incorporated by reference to Exhibit 10.2 to Simmons First National Corporation’s Quarterly Report on Form 10-Q for the quarter ended June 30, 2023 (File No. 000-06253)).^ Form of Associate Restricted Stock Unit Award Agreement (2023 Plan – for awards on or after May 23, 2023) (incorporated by reference to Exhibit 10.3 to Simmons First National Corporation’s Quarterly Report on Form 10-Q for the quarter ended June 30, 2023 (File No. 000-06253)).^ Indemnification Agreement for C. Daniel Hobbs dated January 25, 2024 (incorporated by reference to Exhibit 10.1 to Simmons First National Corporation’s Current Report on Form 8-K filed on January 26, 2024 (File No. 000-06253)).^ Executive Change in Control Agreement for C. Daniel Hobbs dated January 25, 2024 (incorporated by reference to Exhibit 10.2 to Simmons First National Corporation’s Current Report on Form 8-K filed on January 26, 2024 (File No. 000-06253)).^ Deferred Compensation Agreement for C. Daniel Hobbs dated January 25, 2024 (incorporated by reference to Exhibit 10.3 to Simmons First National Corporation’s Current Report on Form 8-K filed on January 26, 2024 (File No. 000-06253)).^ Simmons First National Corporation Code of Ethics dated(as amended and restated on December 13, 201719, 2023) (incorporated by reference to Exhibit 14.1 to Simmons First National Corporation’s Current Report on Form 8-K filed on December 15, 201726, 2023 (File No. 000-06253)).Simmons First National Corporation Finance Group Code of Ethics, dated July 2003(as amended and restated on December 19, 2023) (incorporated by reference to Exhibit 1414.2 to Simmons First National Corporation’s AnnualCurrent Report on Form 10-K for the Year ended8-K filed on December 31, 200326, 2023 (File No. 000-06253)).Subsidiaries of the Registrant.* Consent of FORVIS, LLP.* 23Consent of BKD, LLP.*129Rule 13a-15(e) and 15d-15(e) Certification – George A. Makris, Jr., Chairman and Chief Executive Officer.*31.2Rule 13a-15(e) and 15d-15(e) Certification – Robert A. Fehlman, SeniorChief Executive Officer.*Rule 13a-15(e) and 15d-15(e) Certification – C. Daniel Hobbs, Executive Vice President and Chief Financial Officer and Treasurer.Officer.*Rule 13a-15(e) and 15d-15(e) Certification – David W. Garner, Executive Vice President Controller and Chief Accounting Officer.*Certification Pursuant to 18 U.S.C. Sections 1350, as Adopted Pursuant to Section 906 of the Sarbanes-Oxley Act of 2002 – George A. Makris, Jr., Chairman and Chief Executive Officer.*32.2Certification Pursuant to 18 U.S.C. Sections 1350, as Adopted Pursuant to Section 906 of the Sarbanes-Oxley Act of 2002 – Robert A. Fehlman, SeniorChief Executive Officer.*Certification Pursuant to 18 U.S.C. Sections 1350, as Adopted Pursuant to Section 906 of the Sarbanes-Oxley Act of 2002 – C. Daniel Hobbs, Executive Vice President and Chief Financial Officer and Treasurer.Officer.*Certification Pursuant to 18 U.S.C. Sections 1350, as Adopted Pursuant to Section 906 of the Sarbanes-Oxley Act of 2002 – David W. Garner, Executive Vice President Controller and Chief Accounting Officer.*Simmons First National Corporation Compensation Clawback Policy.*^ 101.INS101.INS XBRL Instance Document.Document - the instance document does not appear in the Interactive Data File because its XBRL tags are embedded within the Inline XBRL document. ** / **144Exhibit No. Description 101.SCH Inline XBRL Taxonomy Extension Schema.* * / **101.CAL Inline XBRL Taxonomy Extension Calculation Linkbase.* * / **101.DEF Inline XBRL Taxonomy Extension Definition Linkbase.* * / **101.LAB Inline XBRL Taxonomy Extension Labels Linkbase. * / ** 101.PRE Inline XBRL Taxonomy Extension Presentation Linkbase.* **Filed herewith / **104 Cover Page Interactive Data File (formatted as Inline XBRL and contained in Exhibit 101). ** * Filed herewith ** Pursuant to Rule 406T of Regulation S-T, these interactive data files are deemed not filed or part of a registration statement or prospectus for purposes of Sections 11 or 12 of the Securities Act of 1933, as amended, are deemed not filed for purposes of Section 18 of the Securities Exchange Act of 1934, as amended, and otherwise are not subject to liability under those sections. ^ 130Management contract or a compensatory plan or arrangement. ITEM 16. FORM 10-K SUMMARYNone.145SIGNATURESPursuant to the requirements of Section 13 or 15 (d) of the Securities Exchange Act of 1934, the Registrant has duly caused this report to be signed on its behalf by the undersigned, thereunto duly authorized./s/ Patrick A. BurrowJames M. BrogdonFebruary 28, 201827, 2024Patrick A. Burrow, SecretaryJames M. Brogdon, PresidentPursuant to the requirements of the Securities and Exchange Act of 1934, this report has been signed below by the following persons on behalf of the registrant and in the capacities indicated on or about February 28, 2018.27, 2024.Signature Title /s/ George A. Makris, Jr. Executive Chairman and Chief Executive OfficerDirectorGeorge A. Makris, Jr. and Director/s/ Robert A. Fehlman Senior Chief Executive OfficerRobert A. Fehlman (Principal Executive Officer) /s/ James M. Brogdon President James M. Brogdon /s/ Charles D. Hobbs Executive Vice President Robert A. Fehlman and Chief Financial Officer and TreasurerCharles D. Hobbs (Principal Financial Officer) /s/ David W. Garner Executive Vice President Controller and Chief Accounting OfficerDavid W. Garner Chief Accounting Officer(Principal Accounting Officer) /s/ Dean Bass Director Dean Bass /s/ Jay D. BurchfieldDirector Jay D. Burchfield/s/ Marty D. Casteel Director Marty D. Casteel /s/ William E. Clark, II Director William E. Clark, II /s/ Director Steven A. Cossé DirectorSteven A. Cossé/s/ Mark C. Doramus Director Mark C. Doramus /s/ Edward Drilling Director Edward Drilling 146/s/ Eugene Hunt Director Eugene Hunt /s/ Jerry M. Hunter Director Jerry M. Hunter /s/ Christopher R. KirklandDirectorChristopher R. Kirkland/s/ Susan S. LaniganDirector Susan S. Lanigan/s/ W. Scott McGeorge Director W. Scott McGeorge /s/ Tom Purvis Director Tom Purvis /s/ Robert L. Shoptaw Director Robert L. Shoptaw /s/ Julie Stackhouse Director Julie Stackhouse /s/ Russell W. Teubner Director Russell W. Teubner /s/ Malynda K. WestDirector Malynda K.Mindy West131147