
UNITED STATES SECURITIES AND EXCHANGE COMMISSION
WASHINGTON, D.C. 20549
FORM 10-K
(Mark one)
☑ | ANNUAL REPORT PURSUANT TO SECTION 13 OR 15(d) OFTHE SECURITIES EXCHANGE ACT OF 1934 |
☑ ANNUAL REPORT PURSUANT TO SECTION 13 OR 15(d) OFTHE SECURITIES EXCHANGE ACT OF 1934
For the fiscal year ended December 31, 20222023
or
☐ | TRANSITION REPORT PURSUANT TO SECTION 13 OR 15(d) OFTHE SECURITIES EXCHANGE ACT OF 1934 |
For the transition period from ______________ to______________.
Commission File Number: 001-09383
WESTAMERICA BANCORPORATION
(Exact name of the registrant as specified in its charter)
California | 94-2156203 |
(State or Other Jurisdiction | (I.R.S. Employer |
of Incorporation or Organization) | Identification Number) |
1108 FIFTH AVENUE, SAN RAFAEL, California 94901
(Address of principal executive offices) (zip code)
Registrant’s telephone number, including area code: (707) 863-6000
Securities registered pursuant to Section 12(b) of the Act:
Title of each class | Trading Symbol(s) | Name of each exchange on which registered |
Common Stock, no par value | WABC | The Nasdaq Stock Market, LLC |
Securities registered pursuant to Section 12(g) of the Act: None
Indicate by check mark if the registrant is a well-known seasoned issuer, as defined in Rule 405 of the Securities Act. Yes ☑ No ☐
Indicate by check mark if the registrant is not required to file reports pursuant to Section 13 or Section 15(d) of the Act. Yes ☐ No ☑
Indicate by check mark whether the registrant: (1) has filed all reports required to be filed by Section 13 or 15(d) of the Securities Exchange Act of 1934 during the preceding 12 months (or for such shorter period that the registrant was required to file such reports), and (2) has been subject to such filing requirements for the past 90 days. Yes ☑ No ☐
Indicate by check mark if whether the registrant has submitted electronically every Interactive Data File required to be submitted pursuant to Rule 405 of Regulation S-T (section 232.405 of this chapter) during the preceding 12 months (or for such shorter period that the registrant was required to submit such files.) Yes ☑ No ☐
Indicate by check mark whether the registrant is a large accelerated filer, an accelerated filer, a non-accelerated filer, a smaller reporting company, or an emerging growth company. See the definitions of "large accelerated filer,” “accelerated filer,” “smaller reporting company,” and “emerging growth company” in Rule 12b-2 of the Exchange Act.
Large accelerated filer ☑ | Accelerated filer ☐ | Non-accelerated filer ☐ | |
Smaller reporting company ☐ | Emerging growth company ☐ |
If an emerging growth company, indicate by check mark if the registrant has elected not to use the extended transition period for complying with any new or revised financial accounting standards provided pursuant to Section 13(a) of the Exchange Act. ☐
Indicate by check mark whether the registrant has filed a report on and attestation to its management’s assessment of the effectiveness of its internal control over financial reporting under Section 404(b) of the Sarbanes-Oxley Act (15 U.S.C. 7262(b)) by the registered public accounting firm that prepared or issued its audit report. ☑
If securities are registered pursuant to Section 12(b) of the Act, indicate by check mark whether the financial statements of the registrant included in the filing reflect the correction of an error to previously issued financial statements. ☐
Indicate by check mark whether any of those error corrections are restatements that required a recovery analysis of incentive-based compensation received by any of the registrant’s executive officers during the relevant recovery period pursuant ☐
to §240.10D-1(b). ☐
Indicate by check mark whether the registrant is a shell company (as defined in Rule 12b-2 of the Exchange Act). Yes ☐ No ☑
The aggregate market value of the Common Stock held by non-affiliates of the registrant as of June 30, 20222023 as reported on the NASDAQ Global Select Market, was $860,255,341.78. Shares of Common Stock held by each executive officer and director and by each person who owns 10% or more of the outstanding Common Stock have been excluded in that such persons may be deemed to be affiliates. This determination of affiliate status is not necessarily a conclusive determination for other purposes.$687,093,519.16.
Number of shares outstanding of each of the registrant’s classes of common stock, as of the close of business on February 15, 2023: 26,912,7722024: 26,671,215 Shares
DOCUMENTS INCORPORATED BY REFERENCE
Portions of the definitive Proxy Statement relating to registrant’s 20232024 Annual Meeting of Shareholders, are incorporated by reference in Items 10, 11, 12, 13 and 14 of Part III to the extent described therein.
TABLE OF CONTENTS
FORWARD-LOOKING STATEMENTS
This Report on Form 10-K contains forward-looking statements about Westamerica Bancorporation for which it claims the protection of the safe harbor provisions contained in the Private Securities Litigation Reform Act of 1995.
Examples of forward-looking statements include, but are not limited to: (i) projections of revenues, expenses, future credit quality and performance, the appropriateness of the allowance for credit losses, loan growth or reduction, mitigation of risk in the Company’s loan and investment securities portfolios, income or loss, earnings or loss per share, the payment or nonpayment of dividends, stock repurchases, capital structure and other financial items; (ii) statements of plans, objectives and expectations of the Company or its management or board of directors, including those relating to products or services; (iii) statements of future economic performance; and (iv) statements of assumptions underlying such statements. Words such as "believes", "anticipates", "expects", “estimates”, "intends", "targeted", "projected", “forecast”, "continue", "remain", "will", "should", "may" and other similar expressions are intended to identify forward-looking statements but are not the exclusive means of identifying such statements.
These forward-looking statements are based on Management’sthe current knowledge and belief of the management (“Management”) of Westamerica Bancorporation (the “Company”) and include information concerning the Company’s possible or assumed future financial condition and results of operations. A number of factors, some of which are beyond the Company’s ability to predict or control, could cause future results to differ materially from those contemplated.
These factors include but are not limited to (1) the length and severity of any difficulties in the global, national and California economies and the effects of government efforts to address those difficulties; (2) liquidity levels in capital markets; (3) fluctuations in asset prices including, but not limited to stocks, bonds, real estate, and commodities; (4) the effect of acquisitions and integration of acquired businesses; (5) economic uncertainty created by riots, terrorist threats and attacks on the United States, the actions taken in response, and the uncertain effect of these events on the local, regional and national economies; (6) changes in the interest rate environment and monetary policy; (7) changes in the regulatory environment; (8) competitive pressure in the banking industry; (9) operational risks including a failure or breach in data processing or security systems or those of third party vendors and other service providers, including as a result of cyber attacks or fraud; (10) volatility of interest rate sensitive loans, deposits and investments;investments, particularly the impact of rising interest rates on the Company’s securities portfolio; (11) asset/liability management risks and liquidity risks; (12) liquidity risks including the impact of recent adverse developments in the banking industry; (13) the effect of climate change, natural disasters, including earthquakes, hurricanes, fire, flood, drought, and other disasters, on the uninsured value of the Company’s assets and of loan collateral, the financial condition of debtors and issuers of investment securities, the economic conditions affecting the Company’s market place, and commodities and asset values; (13)(14) changes in the securities markets; (14)(15) the duration and severity of the COVID-19 pandemicpandemics and governmental and customer responses to the pandemic; (15)responses; (16) inflation and (16)(17) the outcome of contingencies, such as legal proceedings. However, the reader should not consider the above-mentioned factors to be a complete set of all potential risks or uncertainties.
Forward-looking statements speak only as of the date they are made. The Company undertakes no obligation to update any forward-looking statements in this report to reflect circumstances or events that occur after the date forward looking statements are made, except as may be required by law. The reader is directed to Part II – Item 1A “Risk Factors” of this report and other risk factors discussed elsewhere in this report, for further discussion of factors which could affect the Company's business and cause actual results to differ materially from those expressed in any forward-looking statement made in this report.
PART I
Westamerica Bancorporation (the “Company”) is a bank holding company registered under the Bank Holding Company Act of 1956, as amended (“BHCA”). Its legal headquarters are located at 1108 Fifth Avenue, San Rafael, California 94901. Its principal administrative offices are located at 4550 Mangels Boulevard, Fairfield, California 94534, its telephone number is (707) 863-6000 and its website address is www.westamerica.com. The Company provides a full range of banking services to individual and commercial customers in Northern and Central California through its subsidiary bank, Westamerica Bank (the “Bank”). The Bank is a California-chartered commercial bank whose deposit are insuranceinsured by the Federal Deposit Insurance Corporation (the “FDIC”) up to applicable limits. The principal communities served are located in Northern and Central California, from Mendocino, Lake and Nevada Counties in the north to Kern County in the south. The Company’s strategic focus is on the banking needs of small businesses. In addition, the Bank owns 100% of the capital stock of Community Banker Services Corporation (“CBSC”), a company engaged in providing the Company and its subsidiaries with data processing services and other support functions.
The Company was incorporated under the laws of the State of California in 1972 as “Independent Bankshares Corporation” pursuant to a plan of reorganization among three previously unaffiliated Northern California banks. The Company operated as a multi-bank holding company until mid-1983, at which time the then six subsidiary banks were merged into a single bank named Westamerica Bank and the name of the holding company was changed to Westamerica Bancorporation.
The Company acquired five banks within its immediate market area during the early to mid 1990’s. In April 1997, the Company acquired ValliCorp Holdings, Inc., parent company of ValliWide Bank, the largest independent bank holding company headquartered in Central California. Under the terms of all of the merger agreements, the Company issued shares of its common stock in exchange for all of the outstanding shares of the acquired institutions. The subsidiary banks acquired were merged with and into the Bank. These six aforementioned business combinations were accounted for as poolings-of-interests.
During the period 2000 through 2005, the Company acquired three additional banks. These acquisitions were accounted for using the purchase accounting method.
On February 6,In 2009 Westamericaand 2010, the Bank acquired the banking operations of two failed banks, the former County Bank (“County”)and Sonoma Valley Bank, from the Federal Deposit Insurance Corporation (“FDIC”). On August 20, 2010, Westamerica BankThe acquired assets and assumed liabilities of the former Sonoma Valley Bank (“Sonoma”) from the FDIC. The County and Sonoma acquired assets and assumed liabilitiesFDIC were measured at estimated fair values, as required by Financial Accounting Standards Board (“FASB”) Accounting Standards Codification (“ASC”) 805, Business Combinations.
At December 31, 2022,2023, the Company had consolidated assets of approximately $7.0$6.4 billion, deposits of approximately $6.2$5.5 billion and shareholders’ equity of approximately $602$773 million.
The Company assesses and is careful to address potential health, safety, and environmental risks. The Company cares for the environment and works to mitigate pollution and the potential risks related to climate change by implementing practices such as recycling and reusing materials, and controlling energy usage.
The Company’s Annual Report on Form 10-K, quarterly reports on Form 10-Q, current reports on Form 8-K and any amendments to those reports as well as beneficial ownership reports on Forms 3, 4 and 5 are available through the SEC’s website (https://www.sec.gov). Such documents as well as the Company’s director, officer and employee Code of Conduct and Ethics are also available free of charge from the Company by request to:
Westamerica Bancorporation
Corporate Secretary A-2M
Post Office Box 1200
Suisun City, California 94585-1200
Human Capital Resources
The Company and its subsidiaries employed 594641 full-time equivalent staff or 664669 employees as of December 31, 2022.2023. The employees are not represented by a collective bargaining unit, and the Company believes its relationship with its employees is good.
The Company’s ability to attract and retain employees is a key to its success. Employees receive a comprehensive benefits package that includes paid time off, sick time, company contributions of up to 6% to qualified retirement plans, discretionary profit-sharing retirement plan contributions, and other health and wellness benefits including participation in Company paid or subsidized medical, dental, term-life, accidental death and dismemberment (AD&D), long-term disability, and employee assistance programs. Certain employees participate in one of the Company’s performance-based incentive programs, which may include additional bonus and incentive compensation, company contributions to supplemental retirement plans, and equity-based awards. Certain benefits are subject to eligibility, vesting, and performance requirements. Employee performance is measured at least quarterly and formal performance evaluations are conducted at least annually.
The Company’s code of ethics prohibits discrimination or harassment. The Company requires all employees to agree to the code of ethics and participate in harassment prevention training annually.
Supervision and Regulation
The following is not intended to be an exhaustive description of the statutes and regulations applicable to the Company’s or the Bank’s business. The description of statutory and regulatory provisions is qualified in its entirety by reference to the particular statutory or regulatory provisions. Moreover, major new legislation and other regulatory changes affecting the Company, the Bank, and the financial services industry in general have occurred in the last several years and can be expected to occur in the future. The nature, timing and impact of new and amended laws and regulations cannot be accurately predicted.
Regulation and Supervision of Bank Holding Companies
The Company is a bank holding company that is subject to the BHCA. The Company files reports with and is subject to examination and supervision by the Board of Governors of the Federal Reserve System (“FRB”). The FRB also has the authority to examine the Company’s subsidiaries. The Company is a bank holding company within the meaning of Section 3700 of the California Financial Code. As such, the Company and the Bank are subject to examination by, and may be required to file reports with, the Commissioner of the California Department of Financial Protection and Innovation (the “Commissioner”).
The FRB has significant supervisory and regulatory authority over the Company and its affiliates. Among other things, the FRB requires the Company to maintain certain levels of capital. See “Capital Standards.” The FRB also has the authority to take enforcement action against any bank holding company that commits any unsafe or unsound practice, or violates certain laws, regulations or conditions imposed in writing by the FRB. Under the BHCA, the Company is required to obtain the prior approval of the FRB before it acquires, merges or consolidates with any bank or bank holding company. Any company seeking to acquire control of or to merge or consolidate with the Company also would be required to obtain the prior approval of the FRB.
The Company is generally prohibited under the BHCA from acquiring ownership or control of more than 5% of any class of voting shares of any company that is not a bank or bank holding company and from engaging directly or indirectly in activities other than banking, managing banks, or providing services to affiliates of the holding company. However, a bank holding company, with the approval of the FRB, may engage, or acquire the voting shares of companies engaged, in activities that the FRB has determined to be closely related to banking or managing or controlling banks. A bank holding company must demonstrate that the benefits to the public of the proposed activity will outweigh the possible adverse effects associated with such activity.
The FRB generally prohibits a bank holding company from declaring or paying a cash dividend that would impose undue pressure on the capital of subsidiary banks or would be funded only through borrowing or other arrangements which might adversely affect a bank holding company’s financial position. Under the FRB policy, a bank holding company should not continue its existing rate of cash dividends on its common stock unless its net income is sufficient to fully fund each dividend and its prospective rate of earnings retention appears consistent with its capital needs, asset quality and overall financial condition. See the section entitled “Restrictions on Dividends and Other Distributions” for additional restrictions on the ability of the Company and the Bank to pay dividends.
Transactions between the Company and the Bank are restricted under the FRB’s Regulation W and Sections 23A and 23B of the Federal Reserve Act. In general, subject to certain specified exemptions, a bank or its subsidiaries are limited in their ability to engage in “covered transactions” with affiliates: (a) to an amount equal to 10% of the bank’s capital and surplus, in the case of covered transactions with any one affiliate; and (b) to an amount equal to 20% of the bank’s capital and surplus, in the case of covered transactions with all affiliates. The Company is considered to be an affiliate of the Bank. A “covered transaction” includes, among other things, a loan or extension of credit to an affiliate; a purchase of securities issued by an affiliate; a purchase of assets from an affiliate, with some exceptions; and the issuance of a guarantee, acceptance or letter of credit on behalf of an affiliate.
Federal regulations governing bank holding companies and change in bank control (Regulation Y) provide for a streamlined and expedited review process for bank acquisition proposals submitted by well-run bank holding companies. These provisions of Regulation Y are subject to numerous qualifications, limitations and restrictions. In order for a bank holding company to qualify as “well-run,” both it and the insured depository institutions which it controls must meet the “well capitalized” and “well managed” criteria set forth in Regulation Y.
The Gramm-Leach-Bliley Act (the “GLBA”), or the Financial Services Act of 1999, repealed provisions of the Glass-Steagall Act, which had prohibited commercial banks and securities firms from affiliating with each other and engaging in each other’s businesses. Thus, many of the barriers prohibiting affiliations between commercial banks and securities firms have been eliminated.
The BHCA was also amended by the GLBA to allow new “financial holding companies” (“FHCs”) to offer banking, insurance, securities and other financial products to consumers. Specifically, the GLBA amended section 4 of the BHCA in order to provide for a framework for the engagement in new financial activities. A bank holding company (“BHC”) may elect to become an FHC if all its subsidiary depository institutions are well capitalized and well managed. If these requirements are met, a BHC may file a certification to that effect with the FRB and declare that it elects to become an FHC. After the certification and declaration is filed, the FHC may engage either de novo or through an acquisition in any activity that has been determined by the FRB to be financial in nature or incidental to such financial activity. BHCs may engage in financial activities without prior notice to the FRB if those activities qualify under the list of permissible activities in section 4(k) of the BHCA. However, notice must be given to the FRB within 30 days after an FHC has commenced one or more of the financial activities. The Company has not elected to become an FHC.
Regulation and Supervision of Banks
The Bank is a California state-chartered Federal Reserve member bank and its deposits are insured by the FDIC. The Bank is subject to regulation, supervision and regular examination by the California Department of Financial Protection and Innovation and the FRB. The regulations of these agencies affect most aspects of the Bank’s business and prescribe permissible types of loans and investments, the amount of required reserves, requirements for branch offices, the permissible scope of its activities and various other requirements.
In addition to federal banking law, the Bank is also subject to applicable provisions of California law. Under California law, the Bank is subject to various restrictions on, and requirements regarding, its operations and administration including the maintenance of branch offices and automated teller machines, capital requirements, deposits and borrowings, and investment and lending activities.
In addition, the Federal Deposit Insurance Corporation Improvement Act (“FDICIA”) imposes limitations on the activities and equity investments of state chartered, federally insured banks. FDICIA also prohibits a state bank from making an investment or engaging in any activity as a principal that is not permissible for a national bank, unless the Bank is adequately capitalized and the FDIC approves the investment or activity after determining that such investment or activity does not pose a significant risk to the deposit insurance fund.
On July 21, 2010, financial regulatory reform legislation entitled the "Dodd-Frank Wall Street Reform and Consumer Protection Act" (the "Dodd-Frank Act") was signed into law. The Dodd-Frank Act implemented far-reaching changes across the financial regulatory landscape, including provisions that, among other things:
● | Centralized responsibility for consumer financial protection by creating a new agency, the Consumer Financial Protection Bureau, responsible for implementing, examining and (as to banks with $10 billion or more in assets) enforcing compliance with federal consumer financial laws. |
● | Required large, publicly traded bank holding companies to create a risk committee responsible for the oversight of enterprise risk management. |
● | Made permanent the $250 thousand limit for federal deposit insurance. |
● | Amended the Electronic Fund Transfer Act ("EFTA") to, among other things, give the FRB the authority to establish rules regarding interchange fees charged for electronic debit transactions by payment card issuers having assets over $10 billion and to enforce a new statutory requirement that such fees be reasonable and proportional to the actual cost of a transaction to the issuer. While the Company’s assets were less than $10 billion as of December 31, |
Provisions in the legislation that affect the payment of interest on demand deposits and interchange fees may increase the costs associated with deposits as well as place limitations on certain revenues those deposits may generate.
Capital Standards
The federal banking agencies have adopted pursuant the Dodd-Frank Act, which are risk-based capital adequacy guidelines intended to provide a measure of capital adequacy that reflects the degree of risk associated with a banking organization’s operations for both transactions resulting in assets being recognized on the balance sheet as assets, and the extension of credit facilities such as letters of credit and recourse arrangements, which are recorded as off balance sheet items. Under these guidelines, nominal dollar amounts of assets and credit equivalent amounts of off balance sheet items are multiplied by one of several risk adjustment percentages, which range from 0% for assets with low credit risk, such as certain U.S. government securities, to 1250% for assets with relatively higher credit risk, such as certain securitizations. A banking organization’s risk-based capital ratios are obtained by dividing its qualifying capital by its total risk-adjusted assets and off balance sheet items.
The federal banking agencies take into consideration concentrations of credit risk and risks from nontraditional activities, as well as an institution’s ability to manage those risks, when determining the adequacy of an institution’s capital. This evaluation is made as a part of the institution’s regular safety and soundness examination. The federal banking agencies also consider interest rate risk (related to the interest rate sensitivity of an institution’s assets and liabilities, and its off balance sheet financial instruments) in the evaluation of a bank’s capital adequacy.
On July 2, 2013, the Federal Reserve Board approved a final rule that implements changes to the regulatory capital framework for all banking organizations over a transitional period 2015 through 2018. As of December 31, 2022,2023, the Company’s and the Bank’s respective regulatory capital ratios exceeded applicable regulatory minimum capital requirements. See Note 9 to the consolidated financial statements included in this Report for capital ratios of the Company and the Bank, compared to minimum capital requirements and for the Bank the standards for well capitalized depository institutions.
In November 2019, the federal banking regulators published final rules implementing community bank leverage ratio, which is a simplified measure of capital adequacy for certain banking organizations that have less than $10 billion in total consolidated assets. A qualifying community banking organization that elects to use the community bank leverage ratio framework and that maintains a leverage ratio of greater than 9% is considered to have satisfied the generally applicable risk-based and leverage capital requirements and, if applicable, is considered to have met the “well capitalized” ratio requirements for purposes of its primary federal regulator’s prompt corrective action rules, discussed below. The Company does not have any immediate plans to elect to use the community bank leverage ratio framework but may make such an election in the future.
See the sections entitled “Capital Resources and Capital to Risk-Adjusted Assets” in Item 7, Management’s Discussion and Analysis of Financial Condition and Results of Operations for additional information.
Prompt Corrective Action and Other Enforcement Mechanisms
FDICIA requires each federal banking agency to take prompt corrective action to resolve the problems of insured depository institutions, including but not limited to those that fall below one or more prescribed minimum capital ratios.
An institution that, based upon its capital levels, is classified as “well capitalized,” “adequately capitalized” or “undercapitalized” may be treated as though it were in the next lower capital category if the appropriate federal banking agency, after notice and opportunity for hearing, determines that an unsafe or unsound condition or an unsafe or unsound practice warrants such treatment. At each successive lower capital category, an insured depository institution is subject to more restrictions. In addition to measures taken under the prompt corrective action provisions, commercial banking organizations may be subject to potential enforcement actions by the federal banking agencies for unsafe or unsound practices in conducting their businesses or for violations of any law, rule, regulation or any condition imposed in writing by the agency or any written agreement with the agency.
Safety and Soundness Standards
FDICIA has implemented certain specific restrictions on transactions and required federal banking regulators to adopt overall safety and soundness standards for depository institutions related to internal control, loan underwriting and documentation, and asset growth. Among other things, FDICIA limits the interest rates paid on deposits by undercapitalized institutions, restricts the use of brokered deposits, limits the aggregate extensions of credit by a depository institution to an executive officer, director, principal shareholder or related interest, and reduces deposit insurance coverage for deposits offered by undercapitalized institutions for deposits by certain employee benefits accounts. The federal banking agencies may require an institution to submit an acceptable compliance plan as well as have the flexibility to pursue other more appropriate or effective courses of action given the specific circumstances and severity of an institution’s noncompliance with one or more standards.
Federal banking agencies require banks to maintain adequate valuation allowances for potential credit losses. The Company has an internal staff that continually reviews loan quality and reports to the Board of Directors. This analysis includes a detailed review of the classification and categorization of problem loans, assessment of the overall quality and collectability of the loan portfolio, consideration of loan loss experience, trends in problem loans, concentration of credit risk, and current economic conditions, particularly in the Bank’s market areas. Based on this analysis, Management, with the review and approval of the Board, determines the adequate level of allowance required. The allowance is allocated to different segments of the loan portfolio, but the entire allowance is available for the loan portfolio in its entirety.
Restrictions on Dividends and Other Distributions
The Company’s ability to pay dividends to its shareholders is subject to the restrictions set forth in the California General Corporation Law (“CGCL”). The CGCL provides that a corporation may make a distribution to its shareholders if (i) the corporation’s retained earnings equal or exceed the amount of the proposed distribution plus unpaid accrued dividends (if any) on securities with a dividend preference, or (ii) immediately after the dividend, the corporation’s total assets equal or exceed total liabilities plus unpaid accrued dividends (if any) on securities with a dividend preference.
The Company’s ability to pay dividends depends in part on the Bank’s ability to pay cash dividends to the Company. The power of the board of directors of an insured depository institution to declare a cash dividend or other distribution with respect to capital is subject to statutory and regulatory restrictions which limit the amount available for such distribution depending upon the earnings, financial condition and cash needs of the institution, as well as general business conditions. FDICIA prohibits insured depository institutions from paying management fees to any controlling persons or, with certain limited exceptions, making capital distributions, including dividends, if, after such transaction, the institution would be undercapitalized.
In addition to the restrictions imposed under federal law, banks chartered under California law generally may only pay cash dividends to the extent such payments do not exceed the lesser of retained earnings of the bank or the bank’s net income for its last three fiscal years (less any distributions to shareholders during this period). In the event a bank desires to pay cash dividends in excess of such amount, the bank may pay a cash dividend with the prior approval of the Commissioner in an amount not exceeding the greatest of the bank’s retained earnings, the bank’s net income for its last fiscal year or the bank’s net income for its current fiscal year.
The federal banking agencies also have the authority to prohibit a depository institution or its holding company from engaging in business practices which are considered to be unsafe or unsound, possibly including payment of dividends or other payments under certain circumstances even if such payments are not expressly prohibited by statute. The Federal Reserve Board has issued guidance indicating its expectations that a bank holding company will inform and consult with Federal Reserve supervisory staff sufficiently in advance of (i) declaring and paying a dividend that could raise safety and soundness concerns (e.g., declaring and paying a dividend that exceeds earnings for the period for which the dividend is being paid); (ii) redeeming or repurchasing regulatory capital instruments when the bank holding company is experiencing financial weaknesses; or (iii) redeeming or repurchasing common stock or perpetual preferred stock that would result in a net reduction as of the end of the quarter in the amount of such equity instruments outstanding compared with the beginning of the quarter in which the redemption or repurchase occurred.
Premiums for Deposit Insurance and FDIC Regulation
Substantially all of the deposits of the Bank are insured up to applicable limits by the DIF of the FDICFDIC’s Deposit Insurance Fund (“DIF”) and are subject to deposit insurance assessments to maintain the DIF. The FDIC utilizes a risk-based assessment system that imposes insurance premiums based upon a risk matrix that takes into account a bank's capital level, asset quality and supervisory rating.
In July 2010, Congress in the Dodd-Frank Act increased the minimum for the DIF reserve ratio, the ratio of the amount in the fund to insured deposits, from 1.15% to 1.35% and required that the ratio reach that level by September 30, 2020. Further, the Dodd-Frank Act made banks with $10 billion or more in assets responsible for the increase from 1.15% to 1.35%, among other provisions.
Extraordinary growth in insured deposits during the first and second quarters of 2020 caused the DIF reserve ratio to decline below the statutory minimum of 1.35%. The Federal Deposit Insurance Act (the “FDI Act”) requires that the FDIC’s Board of Directors adopt a restoration plan when the DIF reserve ratio falls below 1.35% or is expected to within 6 months. Under the FDI Act, the restoration plan must restore the reserve ratio to at least 1.35% within 8 years of establishing the Plan, absent extraordinary circumstances. The FDIC established the following Restoration Plan (the “Plan”) on September 15, 2020.
• | The FDIC will monitor deposit balance trends, potential losses, and other factors that affect the reserve ratio; | |
| The FDIC will maintain the current schedule of assessment rates for all insured depository institutions; and | |
| At least semiannually, the FDIC will update its analysis and projections for the DIF and, if necessary, recommend any modifications to the Plan, such as increasing assessment rates. |
The Plan was amended in June 2022, to restore the DIF reserve ratio to at least 1.35% by September 30, 2028. On October 18, 2022 the FDIC adopted a final rule to increase initial base deposit insurance assessment rates for insured depository institutions by 2 basis points, beginning with the first quarterly assessment period of 2023. The increased assessment rate schedules will remain in effect unless and until the reserve ratio of the DIF meets or exceeds 2%. A significant increase in DIF insurance premiums would have an adverse effect on the operating expenses and results of operations of the Bank. The Company cannot provide any assurance as to the effect of any future changes in its deposit insurance premium rates.
While the FDIC is not Bank's primary federal regulator, as the insurer of the Bank's deposits, the FDIC is authorized to conduct examinations of and to require reporting by FDIC-insured institutions. It also may prohibit any FDIC-insured institution from engaging in any activity the FDIC determines by regulation or order poses a serious risk to the DIF. The FDIC also has authority to initiate enforcement actions against any FDIC-insured institution after giving its primary federal regulator the opportunity to take such action, and may seek to terminate the deposit insurance if it determines that the institution has engaged in unsafe or unsound practices or is in an unsafe or unsound condition. Finally, the FDIC may terminate deposit insurance upon a finding that the institution has engaged in unsafe or unsound practices, is in an unsafe or unsound condition to continue operations, or has violated any applicable law, regulation, rule, order, or condition imposed by the FDIC.
Economic Growth, Regulatory Relief and Consumer Protection Act
On May 24, 2018, President Trump signed into law the first major financial services reform bill since the enactment of the Dodd-Frank Act. The Economic Growth, Regulatory Relief, and Consumer Protection Act (the “Relief Act”) modifies or eliminates certain requirements on community and regional banks and nonbank financial institutions. For instance, under the Relief Act and related rule making:
| banks that have less than $10 billion in total consolidated assets and total trading assets and trading liabilities of less than five percent of total consolidated assets are exempt from Section 619 of the Dodd-Frank Act, known as the “Volcker Rule”, which prohibits “proprietary trading” and the ownership or sponsorship of private equity or hedge funds that are referred to as “covered funds”; and | |
| a new “community bank leverage ratio” was adopted, which is applicable to certain banks and bank holding companies with total assets of less than $10 billion (as described above under “Capital |
Community Reinvestment Act and Fair Lending Laws
The Bank is subject to certain fair lending requirements and reporting obligations involving home mortgage lending operations and Community Reinvestment Act (“CRA”) activities. The CRA generally requires the federal banking agencies to evaluate the record of financial institutions in meeting the credit needs of their local communities, including low and moderate income neighborhoods. In addition to substantive penalties and corrective measures that may be required for a violation of certain fair lending laws, the federal banking agencies may take compliance with such laws and CRA into account when regulating and supervising other activities including merger applications. In May 2022, the federal banking agencies released for public comment proposed rules to modernize CRA regulations. The Company continues to evaluate the impact of any changes to the CRA regulations.
Financial Privacy Legislation and Customer Information Security
The GLBA, in addition to the previously described changes in permissible nonbanking activities permitted to banks, BHCs and FHCs, also required the federal banking agencies, among other federal regulatory agencies, to adopt regulations governing the privacy of consumer financial information. The Bank is subject to the FRB’s regulations in this area. The federal bank regulatory agencies have established standards for safeguarding nonpublic personal information about customers that implement provisions of the GLBA (the “Guidelines”). Among other things, the Guidelines require each financial institution, under the supervision and ongoing oversight of its Board of Directors or an appropriate committee thereof, to develop, implement and maintain a comprehensive written information security program designed to ensure the security and confidentiality of customer information, to protect against any anticipated threats or hazards to the security or integrity of such information, and to protect against unauthorized access to or use of such information that could result in substantial harm or inconvenience to any customer.
Anti-Money Laundering Laws
The Bank Secrecy Act, as amended by the USA PATRIOT Act, gives the federal government powers to address money laundering and terrorist threats through enhanced domestic security measures, expanded surveillance powers and mandatory transaction reporting obligations. The Bank Secrecy Act and related regulations require financial institutions to report currency transactions that exceed certain thresholds and transactions determined to be suspicious, establish due diligence requirements for accounts and take certain steps to verify customer identification when accounts are opened. The Bank Secrecy Act also requires financial institutions to develop and maintain a program reasonably designed to ensure and monitor compliance with its requirements, to train employees to comply with and to test the effectiveness of the program. Any failure to meet the requirements of the Bank Secrecy Act can result in the imposition of substantial penalties and in adverse regulatory action against the offending bank.
The Anti-Money Laundering Act of 2020 (“AMLA”), which amends the Bank Secrecy Act, was enacted in January 2021. The AMLA is a comprehensive reform and modernization to U.S. bank secrecy and anti-money laundering laws. Among other things, it codifies a risk-based approach to anti-money laundering compliance for financial institutions; requires the development of standards for evaluating technology and internal processes for Bank Secrecy Act compliance; expands enforcement and investigative authority, including increasing available sanctions for certain Bank Secrecy Act violations and instituting Bank Secrecy Act whistleblower incentives and protections.
Programs To Mitigate Identity Theft
In November 2007, federal banking agencies together with the National Credit Union Administration and Federal Trade Commission adopted regulations under the Fair and Accurate Credit Transactions Act of 2003 to require financial institutions and other creditors to develop and implement a written identity theft prevention program to detect, prevent and mitigate identity theft in connection with certain new and existing accounts. Covered accounts generally include consumer accounts and other accounts that present a reasonably foreseeable risk of identity theft. Each institution’s program must include policies and procedures designed to: (i) identify indicators, or “red flags,” of possible risk of identity theft; (ii) detect the occurrence of red flags; (iii) respond appropriately to red flags that are detected; and (iv) ensure that the program is updated periodically as appropriate to address changing circumstances. The regulations include guidelines that each institution must consider and, to the extent appropriate, include in its program.
Pending Legislation
Changes to state laws and regulations (including changes in interpretation or enforcement) can affect the operating environment of BHCs and their subsidiaries in substantial and unpredictable ways. From time to time, various legislative and regulatory proposals are introduced. These proposals, if codified, may change banking statutes and regulations and the Company’s operating environment in substantial and unpredictable ways. If codified, these proposals could increase or decrease the cost of doing business, limit or expand permissible activities or affect the competitive balance among banks, savings associations, credit unions and other financial institutions. The Company cannot accurately predict whether those changes in laws and regulations will occur, and, if those changes occur, the ultimate effect they would have upon its financial condition or results of operations. It is likely, however, that the current level of enforcement and compliance-related activities of federal and state authorities will continue and potentially increase.
Competition
The Bank’s principal competitors for deposits and loans are major banks and smaller community banks, savings and loan associations and credit unions. To a lesser extent, competitors include thrift and loans, mortgage brokerage companies and insurance companies. Other institutions, such as brokerage houses, mutual fund companies, credit card companies, and certain retail establishments offer investment vehicles that also compete with banks for deposit business. Federal legislation in recent years has encouraged competition between different types of financial institutions and fostered new entrants into the financial services market.
Legislative changes, as well as technological and economic factors, can be expected to have an ongoing impact on competitive conditions within the financial services industry. While the future impact of regulatory and legislative changes cannot be predicted with certainty, the business of banking will remain highly competitive.
Readers and prospective investors in the Company’s securities should carefully consider the following risk factors as well as the other information contained or incorporated by reference in this Report.
The risks and uncertainties described below are not the only ones facing the Company. Additional risks and uncertainties that Management is not aware of or focused on or that Management currently deems immaterial may also impair the Company’s business operations. This Report is qualified in its entirety by these risk factors.
If any of the following risks actually occur, the Company’s financial condition and results of operations could be materially and adversely affected. If this were to happen, the value of the company’s securities could decline significantly, and investors could lose all or part of their investment in the Company’s common stock.
Market and Interest Rate Risk
Changes in interest rates could reduce income and cash flow.
The Company’s income and cash flow depend to a great extent on the difference between the interest earned on loans and investment securities and the interest paid on deposits and other borrowings, and the Company’s success in competing for loans and deposits. The Company cannot control or prevent changes in the level of interest rates which fluctuate in response to general economic conditions, the policies of various governmental and regulatory agencies, in particular, the FRB’s FOMC,Federal Open Market Committee of the Federal Reserve Board (the” FOMC”), and pricing practices of the Company’s competitors. Changes in monetary policy, including changes in interest rates, will influence the origination of loans, the purchase of investments, the generation of deposits and other borrowings, and the rates received on loans and investment securities and paid on deposits and other liabilities. The discussion in this Report under “Item 7 Management’s Discussion and Analysis of Financial Condition and Results of Operations – Asset, Liability and Market Risk Management” and “- Liquidity and Funding” and “Item 7A, Quantitative and Qualitative Disclosures About Market Risk” is incorporated by reference in this paragraph.
The Company could realize losses if it were required to sell securities in its held-to-maturity securities portfolio to meet liquidity needs.
As a result of increases in interest rates over the last year, the market value of previously issued government and other debt securities has declined significantly, resulting in unrealized losses in the held-to-maturity portion of the Company’s securities portfolios. While the Company does not currently expect or intend to sell these securities, if the Company were required to sell such securities to meet liquidity needs, it may incur losses, which could impair the Company’s capital financial condition and results of operations. Further, while the Company has taken actions to maximize its funding sources, there is no guarantee that such funding sources will be available or sufficient in the event of sudden liquidity needs.
Changes in capital market conditions could reduce asset valuations.
Capital market conditions, including interest rates, liquidity, investor confidence, bond issuer credit worthiness, perceived counter-party risk, the supply of and demand for financial instruments, the financial strength of market participants, and other factors can materially impact the value of the Company’s assets. An impairment in the value of the Company’s assets could result in asset write-downs, reducing the Company’s asset values, earnings, and equity.
The value of securities in the Company’s investment securities portfolio may be negatively affected by disruptions in securities markets.
The market for some of the investment securities held in the Company’s portfolio can be extremely volatile. Volatile market conditions may detrimentally affect the value of these securities, such as through reduced valuations due to the perception of heightened credit and liquidity risks. There can be no assurance that the declines in market value will not result in other than temporary impairments of these assets, which would lead to loss recognition that could have a material adverse effect on the Company’s net income and capital levels.
Negative developments affecting the banking industry, such as bank failures, may have a material adverse effect on the Company.
The banking industry could experience significant volatility with multiple bank failures during 2023. Industrywide concerns could develop related to liquidity, deposit outflows and unrealized losses on investment debt securities. While the Company cannot predict with certainty whether or how these developments may affect the banking industry, the Company faces the risks of increased FDIC deposit insurance premium expenses; increased regulation or supervisory scrutiny; and decreased confidence in banks among depositors and investors, any of which could, adversely affect the trading price of the Company’s common stock, its ability to manage its liquidity or its ability to effectively fund its operations. Any one or a combination of such risk factors, or other factors, could materially adversely affect the Company's business, financial condition, results of operations and prospects.
The weakness of other financial institutions could adversely affect the Company.
Financial services institutions are interrelated as a result of trading, clearing, counterparty, or other relationships. The Company routinely executes transactions with counterparties in the financial services industry, including brokers and dealers, commercial banks, investment banks, and other institutional clients. Many of these transactions expose the Company to credit risk in the event of default of the Company’s counterparty or client. In addition, the Company’s credit risk may be increased when the collateral the Company holds cannot be realized or is liquidated at prices not sufficient to recover the full amount of the secured obligation. There is no assurance that any such losses would not materially and adversely affect the Company’s results of operations or earnings.
Shares of Company common stock eligible for future sale or grant of stock options and other equity awards could have a dilutive effect on the market for Company common stock and could adversely affect the market price.
The Articles of Incorporation of the Company authorize the issuance of 150 million shares of common stock (and two additional classes of 1 million shares each, denominated “Class B Common Stock” and “Preferred Stock”, respectively) of which approximately 26.926.7 million shares of common stock were outstanding at December 31, 2022.2023. Pursuant to its stock option plans, at December 31, 2022,2023, the Company had outstanding options for 854973 thousand shares of common stock, of which 508614 thousand were currently exercisable. As of December 31, 2022, 8562023, 705 thousand shares of Company common stock remained available for grants under the Company’s equity incentive plans. Sales of substantial amounts of Company common stock in the public market could adversely affect the market price of its common stock.
The Company’s payment of dividends on common stock could be eliminated or reduced.
Holders of the Company’s common stock are entitled to receive dividends only when, as, and if declared by the Company’s Board of Directors. The Company’s ability to pay dividends is limited by banking and corporate laws, and depends, among other things, on the Company’s regulatory capital levels and earnings prospectus, as well as the Bank’s ability to pay cash dividends to the Company. Although the Company has historically paid cash dividends on the Company’s common stock, the Company is not required to do so and the Company’s Board of Directors could reduce or eliminate the Company’s common stock dividend in the future.
The Company could repurchase shares of its common stock at price levels considered excessive.
The Company repurchasesmay repurchase and retiresretire its common stock in accordance with Board of Directors-approved share repurchase programs. At December 31, 2022, 1.75 million shares remained availableprograms from time to repurchase under such plans.time. The Company has been active in repurchasing and retiring shares of its common stock when alternative uses of excess capital, such as acquisitions, have been limited. The Company could repurchase shares of its common stock at price levels considered excessive, thereby spending more cash on such repurchases as deemed reasonable and effectively retiring fewer shares than would be retired if repurchases were effected at lower prices.
Risks Related to the Nature and Geographical Location of the Company’s Business
The Company invests in loans that contain inherent credit risks that may cause the Company to incur losses.
The risk that borrowers may not pay interest or repay their loans as agreed is an inherent risk of the banking business. The Company strives to mitigate this risk by adhering to sound and proven underwriting practices, managed by experienced and knowledgeable credit professionals. Nonetheless, the Company may incur losses on loans that meet its underwriting criteria, and these losses may exceed the amounts set aside as reserves. The Company can provide no assurance that the credit quality of the loan portfolio will not deteriorate in the future and that such deterioration will not adversely affect the Company or its results of operations.
The Company’s operations are concentrated geographically in California, and poor economic conditions may cause the Company to incur losses.
Substantially all of the Company’s business is located in California. A portion of the loan portfolio of the Company is dependent on real estate. At December 31, 2022,2023, real estate served as the principal source of collateral with respect to approximately 54%59% of the Company’s loan portfolio. The Company’s financial condition and operating results will be subject to changes in economic conditions in California. Much of the California real estate market could experience a decline in values of varying degrees. This decline could have an adverse impact on the business of some of the Company’s borrowers and on the value of the collateral for many of the Company’s loans. Generally, the counties surrounding and near San Francisco Bay could recover more soundly from the recession than counties in the California “Central Valley,” from Sacramento in the north to Bakersfield in the south, where many of the Bank’s customers are located . Approximately 22%25% of the Company’s loans were to borrowers in the California “Central Valley” as of December 31, 2022.2023. Economic conditions in California’s diverse geographic markets can be vastly different and are subject to various uncertainties, including the condition of the construction and real estate sectors, the effect of drought on the agricultural sector and its infrastructure, and the California state and municipal governments’ budgetary and fiscal conditions. The Company can provide no assurance that conditions in any sector or geographic market of the California economy will not deteriorate in the future and that such deterioration will not adversely affect the Company.
The markets in which the Company operates are subject to the risk of earthquakes, fires, storms and other natural disasters.
All of the properties of the Company are located in California. Also, most of the real and personal properties which currently secure a majority of the Company’s loans are located in California. Further, the Company invests in securities issued by companies and municipalities operating throughout the United States, and in mortgage-backed securities collateralized by real property located throughout the United States. California and other regions of the United States are prone to earthquakes, brush and wildfires, flooding, drought and other natural disasters. In addition to possibly sustaining uninsured damage to its own properties, if there is a major earthquake, flood, drought, fire or other natural disaster, the Company faces the risk that many of its debtors may experience uninsured property losses, or sustained business or employment interruption and/or loss which may materially impair their ability to meet the terms of their debt obligations. A major earthquake, flood, prolonged drought, fire or other natural disaster in California or other regions of the United States could have a material adverse effect on the Company’s business, financial condition, results of operations and cash flows.
Adverse changes in general business or economic conditions, including inflation, could have a material adverse effect on the Company’s financial condition and results of operations.
A sustained or continuing weakness or weakening in business and economic conditions generally or specifically in the principal markets in which the Company does business could have one or more of the following adverse impacts on the Company’s business:
● | a decrease in the demand for loans and other products and services offered by the Company; |
● | an increase or decrease in the usage of unfunded credit commitments; |
● | an increase or decrease in the amount of deposits; |
● | a decrease in non-depository funding available to the Company; |
● | an impairment of certain intangible assets, including goodwill; |
● | an increase in the number of clients and counterparties who become delinquent, file for protection under bankruptcy laws or default on their loans or other obligations to the Company, which could result in a higher level of nonperforming assets, net charge-offs, provision for credit losses, reduced interest revenue and cash flows, and valuation adjustments on assets; |
● | an impairment in the value of investment securities; |
● | an impairment in the value of life insurance policies owned by the Company; |
● | an impairment in the value of real estate owned by the Company; and |
● | an increase in operating costs |
The 2008 - 2009 financial crisis led to the failure or merger of a number of financial institutions. Financial institution failures can result in further losses as a consequence of defaults on securities issued by them and defaults under contracts entered into with such entities as counterparties. The failure of institutions with FDIC insured deposits can cause the DIF reserve ratio to decline, resulting in increased deposit insurance assessments on surviving FDIC insured institutions. Weak economic conditions can significantly weaken the strength and liquidity of financial institutions.
The Company’s financial performance generally, and in particular the ability of borrowers to pay interest on and repay principal of outstanding loans and the value of collateral securing those loans, is highly dependent upon the business environment in the markets where the Company operates, in the State of California and in the United States as a whole. A favorable business environment is generally characterized by, among other factors, economic growth, healthy labor markets, efficient capital markets, low inflation, high business and investor confidence, and strong business earnings. Unfavorable or uncertain economic and market conditions can be caused by: declines in economic growth, high rates of unemployment, deflation, pandemics, declines in business activity or consumer, investor or business confidence; limitations on the availability of or increases in the cost of credit and capital; increases in inflation; natural disasters; or a combination of these or other factors.
Such business conditions could adversely affect the credit quality of the Company’s loans, the demand for loans, loan volumes and related revenue, securities valuations, amounts of deposits, availability of funding, results of operations and financial condition.
Regulatory Risks
Restrictions on dividends and other distributions could limit amounts payable to the Company.
As a holding company, a substantial portion of the Company’s cash flow typically comes from dividends paid by the Bank. Various statutory provisions restrict the amount of dividends the Company’s subsidiaries can pay to the Company without regulatory approval. A reduction in subsidiary dividends paid to the Company could limit the capacity of the Company to pay dividends. In addition, if any of the Company’s subsidiaries were to liquidate, that subsidiary’s creditors will be entitled to receive distributions from the assets of that subsidiary to satisfy their claims against it before the Company, as a holder of an equity interest in the subsidiary, will be entitled to receive any of the assets of the subsidiary.
The Company’s payment of dividends on common stock could be eliminated or reduced.
Holders of the Company’s common stock are entitled to receive dividends only when, as, and if declared by the Company’s Board of Directors. The Company’s ability to pay dividends is limited by banking and corporate laws, and depends, among other things, on the Company’s regulatory capital levels and earnings prospects, as well as the Bank’s ability to pay cash dividends to the Company. Although the Company has historically paid cash dividends on the Company’s common stock, the Company is not required to do so and the Company’s Board of Directors could reduce or eliminate the Company’s common stock dividend in the future.
Adverse effects of changes in banking or other laws and regulations or governmental fiscal or monetary policies could adversely affect the Company.
The Company is subject to significant federal and state regulation and supervision, which is primarily for the benefit and protection of the Company’s customers and not for the benefit of investors. In the past, the Company’s business has been materially affected by these regulations.
Laws, regulations or policies, including accounting standards and interpretations currently affecting the Company and the Company’s subsidiaries, may change at any time. Regulatory authorities may also change their interpretation of these statutes and regulations. Therefore, the Company’s business may be adversely affected by any future changes in laws, regulations, policies or interpretations or regulatory approaches to compliance and enforcement including future acts of terrorism, major U.S. corporate bankruptcies and reports of accounting irregularities at U.S. public companies.
Additionally, the Company’s business is affected significantly by the fiscal and monetary policies of the federal government and its agencies. The Company is particularly affected by the policies of the FRB, which regulates the supply of money and credit in the United States of America. Among the instruments of monetary policy available to the FRB are (a) conducting open market operations in U.S. government securities, (b) changing the discount rates of borrowings by depository institutions, (c) changing interest rates paid on balances financial institutions deposit with the FRB, and (d) imposing or changing reserve requirements against certain borrowings by banks and their affiliates. These methods are used in varying degrees and combinations to directly affect the availability of bank loans and deposits, as well as the interest rates charged on loans and paid on deposits. The policies of the FRB may have a material effect on the Company’s business, results of operations and financial condition. Under long- standing policy of the FRB, a BHC is expected to act as a source of financial strength for its subsidiary banks. As a result of that policy, the Company may be required to commit financial and other resources to its subsidiary bank in circumstances where the Company might not otherwise do so.
Federal and state governments could pass legislation detrimental to the Company’s performance.
As an example, the Company could experience higher credit losses because of federal or state legislation or regulatory action that reduces the amount the Bank's borrowers are otherwise contractually required to pay under existing loan contracts. Also, the Company could experience higher credit losses because of federal or state legislation or regulatory action that limits or delays the Bank's ability to foreclose on property or other collateral or makes foreclosure less economically feasible. Federal, state and local governments could pass tax legislation causing the Company to pay higher levels of taxes.
The FDIC insures deposits at insured financial institutions up to certain limits. The FDIC charges insured financial institutions premiums to maintain the Deposit Insurance Fund. The FDIC may increase premium assessments to maintain adequate funding of the Deposit Insurance Fund.
The behavior of depositors in regard to the level of FDIC insurance could cause the Bank’s existing customers to reduce the amount of deposits held at the Bank, and could cause new customers to open deposit accounts at the Bank. The level and composition of the Bank's deposit portfolio directly impacts the Bank's funding cost and net interest margin.
Systems, Accounting and Internal Control Risks
The accuracy of the Company’s judgments and estimates about financial and accounting matters will impact operating results and financial condition.
The Company makes certain estimates and judgments in preparing its financial statements. For example, the Company maintains a reserve for potential loan defaults and non-performance. There is no precise method of predicting loans losses and determining the adequacy of the reserve requires the Company’s management to make a number of estimates and judgments. If the estimates or judgments prove to be incorrect, the Company could be required to increase its provisions for credit losses, which could reduce its income or could cause it to incur operating losses in the future. The Company also uses models to estimate the effects of changing interest rates, which are based on estimates and assumptions that may prove to be inaccurate, particularly in times of market stress or unforeseen circumstances. Therefore, the quality and accuracy of management’s estimates and judgments will have an impact on the Company’s operating results and financial condition. For additional information, please see the discussion under “Item 7 Management’s Discussion and Analysis of Financial Condition and Results of Operations - Critical Accounting Policies” in this Report, which is incorporated by reference in this paragraph.
The Company’s information systems or those of its vendors may experience an interruption or breach in security.
The Company relies heavily on communications and information systems, including those of third party vendors and other service providers, to conduct its business. Any failure, interruption or breach in security of these systems could result in failures or disruptions in the Company’s data processing, accounting, customer relationship management and other systems. Communication and information systems failures can result from a variety of risks including, but not limited to, events that are wholly or partially out of the Company’s control, such as telecommunication line integrity, weather, terrorist acts, natural disasters, accidental disasters, unauthorized breaches of security systems, energy delivery systems, cyber attacks,cybersecurity incidents, and other events. Although the Company devotes significant resources to maintain and regularly upgrade its systems and processes that are designed to protect the security of the Company’s computer systems, software, networks and other technology assets and the confidentiality, integrity and availability of information belonging to the Company and its customers, there is no assurance that any such failures, interruptions or security breaches will not occur or, if they do occur, that they will be adequately corrected by the Company or its vendors. The occurrence of any such failures, interruptions or security breaches could result in the loss or theft of customer or employee data, damage the Company’s reputation, impair or disrupt the Company’s business operations, result in a loss of customer business, subject the Company to additional regulatory scrutiny, or expose the Company to litigation and possible financial liability, any of which could have a material adverse effect on the Company’s financial condition and results of operations.
For example, during the second quarter 2023, the Company was notified that there may have been a compromise of a specific set of files processed by a third party vendor that could have affected a limited number of customers. This incident did not occur on a Company system and the Company does not use the software that may have been compromised. The Company has implemented data security safeguards with its third party vendors designed to quickly identify and contain improper access to sensitive information. The Company notified the affected customers as required by law. As of December 31, 2023, to the Company’s knowledge, there is no indication that any information has been subject to misuse as a result of the incident.
The Company’s controls and procedures may fail or be circumvented.
Management regularly reviews and updates the Company’s internal control over financial reporting, disclosure controls and procedures, and corporate governance policies and procedures. The Company maintains controls and procedures to mitigate against risks such as processing system failures and errors, and customer or employee fraud, and maintains insurance coverage for certain of these risks. Any system of controls and procedures, however well designed and operated, is based in part on certain assumptions and can provide only reasonable, not absolute, assurances that the objectives of the system are met. Events could occur which are not prevented or detected by the Company’s internal controls or are not insured against or are in excess of the Company’s insurance limits or insurance underwriters’ financial capacity. Any failure or circumvention of the Company’s controls and procedures or failure to comply with regulations related to controls and procedures could have a material adverse effect on the Company’s business, results of operations and financial condition.
[The remainder of this page intentionally left blank]
Operational Risks
Climate change and the transition to renewable energy and a net zero emissions economy pose operational, commercial and regulatory risks.
Climate change may increase the frequency or severity of extreme weather events, and if the Company is not adequately resilient to deal with acute climate events, its operations may be impacted. Extreme weather events could also impact the activities of its customers or third-party vendors. The physical commodities and assets underlying some of its markets or investments may also be impacted by climate change.
Our risk management practices incorporate the challenges brought about by climate change. The operations conducted in our centralized facilities and branch locations can be disrupted by acute physical risks such as flooding and windstorms, and by chronic physical risks such as rising sea levels, sustained higher temperatures, drought, and increased wildfires. Over the intermediate and longer-term, the Company can be subject to transition risks such as market demand, and policy and law changes.
None of the Company’s physical locations are located near sea level, and only a limited number of branches are located in flood zones. Our principal electricity supplier reports a Power Content Label of 100% greenhouse gas free using the California Energy Commission’s methodology. Our principal information technology vendor’s goal is to achieve 100 percent carbon neutrality for Scope 1 and 2 greenhouse gas emissions by 2025. The Company and its critical vendors maintain property and casualty insurance, and maintain and regularly test disaster recovery plans, which include redundant operational locations and power sources. The Company’s operations do not use a significant amount of water in producing our products and services.
The Company monitors the climate risks of our loan customers. Borrowers with real estate loan collateral located in flood zones must carry flood insurance under the loans’ terms. The Company has $21$18 million in loans to agricultural borrowers; Management continuously monitors these customers’ access to adequate water sources as well as their ability to sustain low crop yields without encountering financial hardship. The Company makes automobile loans; changes in consumer demand, or governmental laws or policies, regarding gasoline, electric and hybrid vehicles is not considered a risk to the Company’s automobile lending practices.
The Company considers climate risk in its underwriting of corporate bonds, and avoids purchasing bonds of issuers, which, in Management’s judgement, have elevated climate risk.
In addition, the transition to renewable energy and a net zero emissions economy involves changes to consumer and institutional preferences for energy consumption, and other products and services, and the possible failure of its services to facilitate the needs of customers during the transition to renewable energy and changes in customer preferences could adversely impact its business and revenues. Changing preferences could also have an adverse impact on the operations or financial condition of its customers, which could result in reduced revenues from those customers. The Company is also subject to risks relating to new or heightened climate change-related regulations or legislation, which could impact its customers.
The risks associated with climate change and the transition to renewable energy and a net zero emissions economy continue to evolve rapidly, and climate change-related risks may change or increase over time.
The continuing effects of the COVID-19 pandemicpandemics and itstheir impact are highly unpredictable and could be significant, and could harm the Company’s business, financial condition, and operating results.
The Company’s business, operations and financial performance have been, and may continue to be affected by the macroeconomic impacts resulting from COVID-19,pandemics, and the Company’s financial results in future periods maycould differ significantly from the Company’s historical results. The extent to which the Company’s business will continue to be affected will depend on a variety of factors, many of which are outside of the Company’s control, including the persistence of the pandemic, the actions of governmental authorities, changes in customer preferences, impacts on economic activity, and the possibility of recession or continued financial market instability.
If the Company loses the services of any of our key management personnel, its business could suffer.
Our future success significantly depends on the continued service and performance of our key management personnel. Our senior management team has significant industry experience and would be difficult to replace. In particular, David L. Payne, our Chairman, President and Chief Executive Officer, has led the Company for over 30 years. Competition for these employees is intense and we may not be able to attract and retain key personnel. If we are unable to attract or retain appropriately qualified personnel, we may not be successful in originating loans and servicing our customers, which could have a materially adverse effect on our business, financial condition and results of operations.
The Company competes with many banks and other traditional, non-traditional, brick and mortar and online financial service providers.
Competition among providers of financial services in markets, particularly within California, is intense. The Company competes with other financial and bank holding companies, state and national commercial banks, savings and loan associations, consumer finance companies, credit unions, securities brokerages, insurance companies, mortgage banking companies, money market mutual funds, asset-based non-bank lenders, government sponsored or subsidized lenders and other financial services providers. Many of these competitors have substantially greater financial resources, lending limits and technological resources than the Company and are able to offer a broader range of products and services. Many competitors offer lower interest rates and more liberal loan terms that appeal to borrowers but adversely affect net interest margin and assurance of repayment. The Company is increasingly faced with competition in many of its products and services by non-bank providers who may have competitive advantages of size, access to potential customers and fewer regulatory requirements, such as “fintech” lenders. Failure to compete effectively for deposit, loan and other banking customers in any of the lines of business could cause the Company to lose market share, slow or reverse growth rate or suffer adverse effects on financial condition, results of operations or profitability.
The Company must continue to attract, retain and develop key personnel.
The Company’s success depends to a significant extent upon its ability to attract, develop and retain experienced personnel in each of its lines of business and markets including managers in operational areas, compliance and other support areas to build and maintain the infrastructure and controls required to support continuing growth. Competition for the best people in the industry can be intense, and there is no assurance that the Company will continue to attract or retain talent or develop personnel. Factors that affect its ability to attract, develop and retain key employees include compensation and benefits programs, profitability, ability to establish appropriate succession plans for key talent, reputation for rewarding and promoting qualified employees and market competition for employees with certain skills, including information systems development and security. The cost of employee compensation is a significant portion of operating expenses and can materially impact results of operations or profitability, especially during periods of wage inflation. The unanticipated loss of the services of key personnel could have an adverse effect on the business.
The Company is subject to environmental liability risk associated with lending activitiesactivities.
A significant portion of our loan portfolio is secured by real property. During the ordinary course of business, we foreclose on and take title to properties securing certain loans. In doing so, there is a risk that hazardous or toxic substances could be found on these properties. If hazardous or toxic substances are found, we may be liable for remediation costs, as well as for personal injury and property damage. Environmental laws may require us to incur substantial expenses and may materially reduce the affected property’s value or limit our ability to use or ability to sell the affected property. Environmental reviews of real property before initiating foreclosure actions may not be sufficient to detect all potential environmental hazards. The remediation costs and any other financial liabilities associated with an environmental hazard could have a material adverse effect on our business, financial condition and results of operations.
ITEM 1B. UNRESOLVED STAFF COMMENTS
None
The Company has developed and implemented an Information Security Program based on the Cybersecurity Framework (CSF) best practices and recommendations from the National Institute of Standards and Technology (NIST), applicable regulatory guidance, and other industry standards. Components of the program include a risk assessment program to identify, assess, and mitigate cybersecurity risk; a vendor management program to address third-party cybersecurity risk; and an incident response program documenting cybersecurity incident response and notification procedures. The Company's Information Security Officer (ISO) oversees the programs and reports on their statuses to management committees including the Information Security Review Committee (ISRC) and the Information Systems Steering Committee (ISSC). The ISO has several years of professional experience in cybersecurity and vendor management, and holds multiple relevant professional certifications. The ISO provides an update to the Board of Directors on a quarterly basis. The Information Security Program is approved by the Board annually.
The ISO maintains risk assessments for key IT systems. A third party cybersecurity risk assessment tool, as well as the FFIEC's Cybersecurity Assessment Tool (CAT) are also used annually to assess cybersecurity risk.
ITEM 1B. UNRESOLVED STAFF COMMENTSThird parties are assessed and categorized according to service type, compliance risk, financial risk, operational risk, and security risk. The level of due diligence and ongoing monitoring that is performed is based on inherent risk as well as specifics such as if the vendor hosts data in the cloud or has access to consumer information.
NoneThe Company uses a training system to educate new and existing employees on cybersecurity risks. In addition to this training program, simulated phishing attempts are sent to employees on a regular basis to evaluate their understanding of these risks.
The Company uses data loss prevention and web filtering software to ensure malicious data does not enter the Company's network, and sensitive information does not leave the network unless properly secured. Penetration tests and vulnerability scanning are performed on a regular basis. All Company networks are secured behind firewalls. Additionally, Security Information and Event Management (SIEM) technology, an Intrusion Detection System (IDS), and an Intrusion Prevention System (IPS) are used.
Access to data on the Company's networks is granted only if needed for job functions. Data Security Analysts review changes to access to ensure they are authorized and appropriate.
An Incident Response Committee that includes representatives from key areas of the Company meets in the event of cybersecurity incidents. The Committee ensures the proper notifications are made in order to comply with all relevant laws, rules and regulations.
During the year ended December 31, 2023, there were no cybersecurity incidents that materially affected or are reasonably likely to materially affect the Company. For discussion of the risks from cybersecurity threats, including potential impact to the Company’s business strategy, results of operations, and financial condition, refer to “Item 1A – Risk Factors – The Company’s information systems may experience an interruption or breach in security” in this Report, which is incorporated by reference in this paragraph.
Branch Offices and Facilities
The Bank is engaged in the banking business through 77 branch offices in 2120 counties in Northern and Central California. The Bank believes all of its offices are constructed and equipped to meet prescribed security requirements.
The Company owns 28 banking office locations and one centralized administrative service center facility and leases 55 facilities. Most of the leases contain renewal options and provisions for rental increases, principally for changes in the cost of living index, and for changes in other operating costs such as property taxes and maintenance.
Due to the nature of its business, the Company is subject to various threatened or filed legal cases. Neither the Company nor any of its subsidiaries is a party to any material pending legal proceeding, nor is their property the subject of any material pending legal proceeding, other than ordinary routine legal proceedings arising in the ordinary course of the Company’s business. Based on the advice of legal counsel, the Company does not expect such cases will have a material, adverse effect on its business, financial position or results of operations. Legal liabilities are accrued when obligations become probable and the amount can be reasonably estimated.
ITEM 4. MINE SAFETY DISCLOSURES
Not applicable
PART II
ITEM 5. MARKET FOR REGISTRANT’S COMMON EQUITY, RELATED STOCKHOLDER MATTERS AND ISSUER PURCHASES OF EQUITY SECURITIES
The Company’s common stock is traded on the NASDAQ Stock Market (“NASDAQ”) under the symbol “WABC”. As of January 31, 2023,2024, there were approximately 4,8004,700 shareholders of record of the Company’s common stock.
The Company has paid cash dividends on its common stock in every quarter since its formation in 1972. See Item 8, Financial Statements and Supplementary Data, Note 19 to the consolidated financial statements for recent quarterly dividend information. It is currently the intention of the Board of Directors of the Company to continue payment of cash dividends on a quarterly basis. There is no assurance, however, that any dividends will be paid since they are dependent upon earnings, cash balances, financial condition and capital requirements of the Company and its subsidiaries as well as policies of the FRB pursuant to the BHCA. See Item 1, “Business - Supervision and Regulation.”
The notes to the consolidated financial statements included in this Report contain additional information regarding the Company’s capital levels, capital structure, regulations affecting subsidiary bank dividends paid to the Company, the Company’s earnings, financial condition and cash flows, and cash dividends declared and paid on common stock.
Stock performance
The following chart compares the cumulative return on the Company’s stock during the ten years ended December 31, 20222023 with the cumulative return on the S&P 500 composite stock index and NASDAQ’S Bank Index. The comparison assumes $100 invested in each on December 31, 20122013 and reinvestment of all dividends.
December 31, | ||||||||||||||||||||||||
2013 | 2014 | 2015 | 2016 | 2017 | 2018 | |||||||||||||||||||
Westamerica Bancorporation (WABC) | $ | 100.00 | $ | 89.54 | $ | 88.30 | $ | 122.54 | $ | 119.28 | $ | 114.52 | ||||||||||||
S&P 500 (SPX) | 100.00 | 113.57 | 115.09 | 128.83 | 156.90 | 149.95 | ||||||||||||||||||
NASDAQ Bank Index (CBNK) | 100.00 | 104.86 | 114.02 | 157.13 | 165.51 | 138.51 | ||||||||||||||||||
December 31, | ||||||||||||||||||||
2019 | 2020 | 2021 | 2022 | 2023 | ||||||||||||||||
Westamerica Bancorporation (WABC) | $ | 143.05 | $ | 120.04 | $ | 128.93 | $ | 135.57 | $ | 134.51 | ||||||||||
S&P 500 (SPX) | 197.00 | 233.39 | 300.27 | 245.75 | 310.24 | |||||||||||||||
NASDAQ Bank Index (CBNK) | 172.04 | 159.11 | 227.27 | 190.13 | 183.55 | |||||||||||||||
[The remainder of this page intentionally left blank]
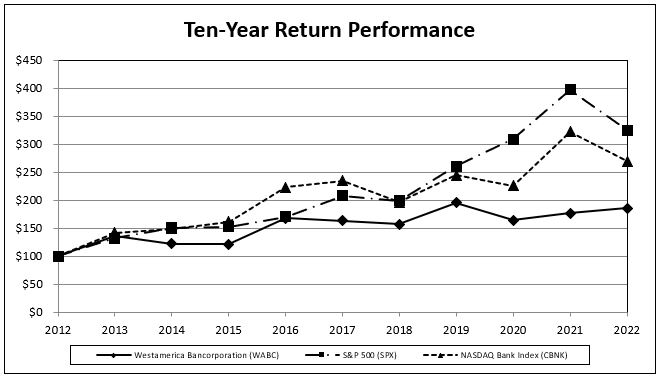
December 31, | ||||||||||||||||||||||||
2012 | 2013 | 2014 | 2015 | 2016 | 2017 | |||||||||||||||||||
Westamerica Bancorporation (WABC) | $ | 100.00 | $ | 136.76 | $ | 122.46 | $ | 120.76 | $ | 167.59 | $ | 163.13 | ||||||||||||
S&P 500 (SPX) | 100.00 | 132.31 | 150.27 | 152.29 | 170.46 | 207.60 | ||||||||||||||||||
NASDAQ Bank Index (CBNK) | 100.00 | 141.82 | 148.71 | 161.71 | 222.84 | 234.72 | ||||||||||||||||||
December 31, | ||||||||||||||||||||
2018 | 2019 | 2020 | 2021 | 2022 | ||||||||||||||||
Westamerica Bancorporation (WABC) | $ | 156.62 | $ | 195.64 | $ | 164.17 | $ | 176.33 | $ | 185.41 | ||||||||||
S&P 500 (SPX) | 198.40 | 260.65 | 308.81 | 397.30 | 325.17 | |||||||||||||||
NASDAQ Bank Index (CBNK) | 196.44 | 243.39 | 225.65 | 322.32 | 269.64 | |||||||||||||||
The following chart compares the cumulative return on the Company’s stock during the five years ended December 31, 20222023 with the cumulative return on the S&P 500 composite stock index and NASDAQ’S Bank Index. The comparison assumes $100 invested in each on December 31, 20172018 and reinvestment of all dividends.
[The remainder of this page intentionally left blank]

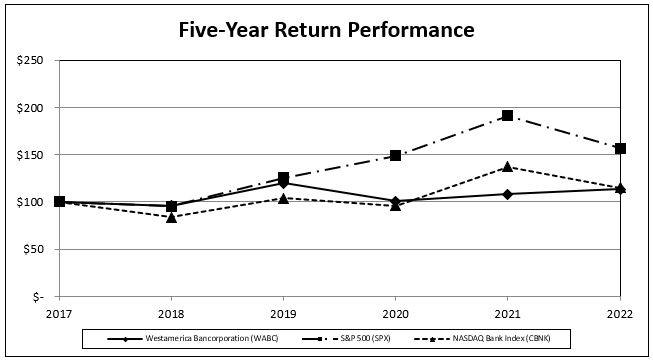
December 31, | December 31, | |||||||||||||||||||||||||||||||||||||||||||||||
2017 | 2018 | 2019 | 2020 | 2021 | 2022 | 2018 | 2019 | 2020 | 2021 | 2022 | 2023 | |||||||||||||||||||||||||||||||||||||
Westamerica Bancorporation (WABC) | $ | 100.00 | $ | 96.01 | $ | 119.93 | $ | 100.63 | $ | 108.09 | $ | 113.65 | $ | 100.00 | $ | 124.91 | $ | 104.82 | $ | 112.58 | $ | 118.38 | $ | 117.45 | ||||||||||||||||||||||||
S&P 500 (SPX) | 100.00 | 95.57 | 125.56 | 148.75 | 191.38 | 156.63 | 100.00 | 131.38 | 155.65 | 200.25 | 163.89 | 206.90 | ||||||||||||||||||||||||||||||||||||
NASDAQ Bank Index (CBNK) | 100.00 | 83.69 | 103.95 | 96.14 | 137.32 | 114.88 | 100.00 | 124.21 | 114.87 | 164.08 | 137.27 | 132.52 | ||||||||||||||||||||||||||||||||||||
ISSUER PURCHASES OF EQUITY SECURITIES
The table below sets forth the information with respect to purchases made by or on behalf of Westamerica Bancorporation or any “affiliated purchaser”, as defined in Rule 10b-18(a)(3) under the Securities Exchange Act of 1934, as amended (the “Exchange Act”), of common stock during the quarter ended December 31, 2022 (in thousands, except per share data).
| ||||||||||||||||
|
|
|
|
| ||||||||||||
| ||||||||||||||||
| ||||||||||||||||
| ||||||||||||||||
| ||||||||||||||||
| ||||||||||||||||
The Company repurchases shares of its common stock in the open market to optimize the Company’s use of equity capital and enhance shareholder value and with the intention of lessening the dilutive impact of issuing new shares under stock option plans, and other ongoing requirements. The repurchase plan approved July 28, 2022 expired September 1, 2023. There is no replacement plan in place currently. No shares were repurchased during the period from October 1, 20222023 through December 31, 2022. The current repurchase program was approved by the Board of Directors on July 28, 2022 authorizing the purchase of up to 1,750 thousand shares of the Company’s common stock from time to time prior to September 1, 2023.
[The remainder of this page intentionally left blank]
ITEM 7. MANAGEMENT’S DISCUSSION AND ANALYSIS OF FINANCIAL CONDITION AND RESULTS OF OPERATIONS
The following financial information for the fivethree years ended December 31, 20222023 has been derived from the Company’s audited consolidated financial statements. This information should be read in conjunction with those statements, notes and other information included elsewhere herein.
WESTAMERICA BANCORPORATION | ||||||||||||||||||||
FINANCIAL SUMMARY | ||||||||||||||||||||
For the Years Ended December 31, | ||||||||||||||||||||
2022 | 2021 | 2020 | 2019 | 2018 | ||||||||||||||||
(In thousands, except per share data and ratios) | ||||||||||||||||||||
Interest and loan fee income | $ | 221,756 | $ | 173,443 | $ | 165,856 | $ | 158,682 | $ | 151,723 | ||||||||||
Interest expense | 1,925 | 1,955 | 1,824 | 1,888 | 1,959 | |||||||||||||||
Net interest and loan fee income | 219,831 | 171,488 | 164,032 | 156,794 | 149,764 | |||||||||||||||
Provision for credit losses | - | - | 4,300 | - | - | |||||||||||||||
Noninterest income: | ||||||||||||||||||||
Life insurance gains | 930 | - | - | 433 | 585 | |||||||||||||||
Gains on sales of property | - | - | 3,536 | - | 216 | |||||||||||||||
Securities gains (losses) | - | 34 | 71 | 217 | (52 | ) | ||||||||||||||
Other noninterest income | 44,191 | 43,311 | 42,030 | 46,758 | 47,400 | |||||||||||||||
Total noninterest income | 45,121 | 43,345 | 45,637 | 47,408 | 48,149 | |||||||||||||||
Noninterest expense: | ||||||||||||||||||||
Loss contingency | - | - | - | 553 | 3,500 | |||||||||||||||
Other noninterest expense | 99,361 | 97,806 | 98,566 | 98,433 | 103,416 | |||||||||||||||
Total noninterest expense | 99,361 | 97,806 | 98,566 | 98,986 | 106,916 | |||||||||||||||
Income before income taxes | 165,591 | 117,027 | 106,803 | 105,216 | 90,997 | |||||||||||||||
Income tax provision | 43,557 | 30,518 | 26,390 | 24,827 | 19,433 | |||||||||||||||
Net income | $ | 122,034 | $ | 86,509 | $ | 80,413 | $ | 80,389 | $ | 71,564 | ||||||||||
Average common shares outstanding | 26,895 | 26,855 | 26,942 | 26,956 | 26,649 | |||||||||||||||
Average diluted common shares outstanding | 26,907 | 26,870 | 26,960 | 27,006 | 26,756 | |||||||||||||||
Common shares outstanding at December 31, | 26,913 | 26,866 | 26,807 | 27,062 | 26,730 | |||||||||||||||
Per common share: | ||||||||||||||||||||
Basic earnings | $ | 4.54 | $ | 3.22 | $ | 2.98 | $ | 2.98 | $ | 2.69 | ||||||||||
Diluted earnings | 4.54 | 3.22 | 2.98 | 2.98 | 2.67 | |||||||||||||||
Book value at December 31, | 22.37 | 30.79 | 31.51 | 27.03 | 23.03 | |||||||||||||||
Financial ratios: | ||||||||||||||||||||
Return on assets | 1.65 | % | 1.23 | % | 1.30 | % | 1.44 | % | 1.27 | % | ||||||||||
Return on common equity | 15.21 | % | 11.52 | % | 11.30 | % | 11.90 | % | 11.35 | % | ||||||||||
Net interest margin (FTE)(1) | 3.17 | % | 2.62 | % | 2.91 | % | 3.11 | % | 2.98 | % | ||||||||||
Net loan losses to average loans | 0.32 | % | 0.03 | % | 0.16 | % | 0.16 | % | 0.14 | % | ||||||||||
Efficiency ratio(2) | 37.2 | % | 45.0 | % | 46.2 | % | 47.4 | % | 52.5 | % | ||||||||||
Equity to assets | 8.66 | % | 11.09 | % | 12.52 | % | 13.02 | % | 11.05 | % | ||||||||||
Period end balances: | ||||||||||||||||||||
Assets | $ | 6,950,317 | $ | 7,461,026 | $ | 6,747,931 | $ | 5,619,555 | $ | 5,568,526 | ||||||||||
Loans | 958,488 | 1,068,126 | 1,256,243 | 1,126,664 | 1,207,202 | |||||||||||||||
Allowance for credit losses | 20,284 | 23,514 | 23,854 | 19,484 | 21,351 | |||||||||||||||
Investment securities | 5,247,657 | 4,945,258 | 4,578,783 | 3,816,918 | 3,641,026 | |||||||||||||||
Deposits | 6,225,290 | 6,413,956 | 5,687,979 | 4,812,621 | 4,866,839 | |||||||||||||||
Identifiable intangible assets and goodwill | 122,256 | 122,508 | 122,777 | 123,064 | 123,602 | |||||||||||||||
Short-term borrowed funds | 57,792 | 146,246 | 102,545 | 30,928 | 51,247 | |||||||||||||||
Shareholders' equity | 602,110 | 827,102 | 844,809 | 731,417 | 615,591 | |||||||||||||||
Capital ratios at period end: | ||||||||||||||||||||
Total risk based capital | 15.64 | % | 15.47 | % | 16.68 | % | 16.83 | % | 17.03 | % | ||||||||||
Tangible equity to tangible assets | 7.03 | % | 9.60 | % | 10.90 | % | 11.07 | % | 9.04 | % | ||||||||||
Dividends paid per common share | $ | 1.68 | $ | 1.65 | $ | 1.64 | $ | 1.63 | $ | 1.60 | ||||||||||
Common dividend payout ratio | 37 | % | 51 | % | 55 | % | 55 | % | 60 | % | ||||||||||
WESTAMERICA BANCORPORATION
FINANCIAL SUMMARY
For the Years Ended December 31, | ||||||||||||
2023 | 2022 | 2021 | ||||||||||
(In thousands, except per share data and ratios) | ||||||||||||
Interest and loan fee income | $ | 284,013 | $ | 221,756 | $ | 173,443 | ||||||
Interest expense | 3,890 | 1,925 | 1,955 | |||||||||
Net interest and loan fee income | 280,123 | 219,831 | 171,488 | |||||||||
Reversal of provision for credit losses | (1,150 | ) | - | - | ||||||||
Noninterest income: | ||||||||||||
Life insurance gains | 279 | 930 | - | |||||||||
Securities (losses) gains | (125 | ) | - | 34 | ||||||||
Other noninterest income | 43,368 | 44,191 | 43,311 | |||||||||
Total noninterest income | 43,522 | 45,121 | 43,345 | |||||||||
Noninterest expense | 103,216 | 99,361 | 97,806 | |||||||||
Income before income taxes | 221,579 | 165,591 | 117,027 | |||||||||
Income tax provision | 59,811 | 43,557 | 30,518 | |||||||||
Net income | $ | 161,768 | $ | 122,034 | $ | 86,509 | ||||||
Average common shares outstanding | 26,703 | 26,895 | 26,855 | |||||||||
Average diluted common shares outstanding | 26,706 | 26,907 | 26,870 | |||||||||
Common shares outstanding at December 31, | 26,671 | 26,913 | 26,866 | |||||||||
Per common share: | ||||||||||||
Basic earnings | $ | 6.06 | $ | 4.54 | $ | 3.22 | ||||||
Diluted earnings | 6.06 | 4.54 | 3.22 | |||||||||
Book value at December 31, | 28.98 | 22.37 | 30.79 | |||||||||
Financial ratios: | ||||||||||||
Return on assets | 2.35 | % | 1.65 | % | 1.23 | % | ||||||
Return on common equity | 18.08 | % | 15.21 | % | 11.52 | % | ||||||
Net interest margin (FTE)(1) | 4.37 | % | 3.17 | % | 2.62 | % | ||||||
Net loan losses to average loans | 0.25 | % | 0.32 | % | 0.03 | % | ||||||
Efficiency ratio(2) | 31.7 | % | 37.2 | % | 45.0 | % | ||||||
Equity to assets | 12.14 | % | 8.66 | % | 11.09 | % | ||||||
Period end balances: | ||||||||||||
Assets | $ | 6,364,592 | $ | 6,950,317 | $ | 7,461,026 | ||||||
Loans | 866,602 | 958,488 | 1,068,126 | |||||||||
Allowance for credit losses | 16,867 | 20,284 | 23,514 | |||||||||
Investment securities | 4,878,198 | 5,247,657 | 4,945,258 | |||||||||
Deposits | 5,474,267 | 6,225,290 | 6,413,956 | |||||||||
Identifiable intangible assets and goodwill | 122,020 | 122,256 | 122,508 | |||||||||
Short-term borrowed funds | 58,162 | 57,792 | 146,246 | |||||||||
Shareholders' equity | 772,894 | 602,110 | 827,102 | |||||||||
Capital ratios at period end: | ||||||||||||
Total risk based capital | 19.15 | % | 15.64 | % | 15.47 | % | ||||||
Tangible equity to tangible assets | 10.43 | % | 7.03 | % | 9.60 | % | ||||||
Dividends paid per common share | $ | 1.72 | $ | 1.68 | $ | 1.65 | ||||||
Common dividend payout ratio | 28 | % | 37 | % | 51 | % | ||||||
(1) Yields on securities and certain loans have been adjusted upward to a "fully taxable equivalent" ("FTE") basis in order to reflect the effect of income which is exempt from federal income taxation at the current statutory tax rate.
(2) The efficiency ratio is defined as noninterest expense divided by total revenue (net interest income on an FTE basis and noninterest income).
The following discussion addresses information pertaining to the financial condition and results of operations of Westamerica Bancorporation and subsidiaries (the “Company”) that may not be otherwise apparent from a review of the consolidated financial statements and related footnotes. It should be read in conjunction with those statements and notes found on pages 5152 through 90,89, as well as with the other information presented throughout this Report.
Critical Accounting Policies
The Company’s consolidated financial statements are prepared in accordance with accounting principles generally accepted in the United States of America and follow general practices within the banking industry. Application of these principles requires the Company to make certain estimates, assumptions, and judgments that affect the amounts reported in the financial statements and accompanying notes. These estimates, assumptions, and judgments are based on information available as of the date of the financial statements; accordingly, as this information changes, the financial statements could reflect different estimates, assumptions, and judgments. Certain accounting policies inherently have a greater reliance on the use of estimates, assumptions and judgments and as such have a greater possibility of producing results that could be materially different than originally reported. Estimates, assumptions and judgments are necessary when assets and liabilities are required to be recorded at fair value, when a decline in the value of an asset not carried on the financial statements at fair value warrants an impairment writedown or valuation reserve to be established, or when an asset or liability needs to be recorded contingent upon a future event. Carrying assets and liabilities at fair value inherently results in more financial statement volatility. The fair values and the information used to record valuation adjustments for certain assets and liabilities are based either on quoted market prices or are provided by other third-party sources, when available.
The most significant accounting policies followed by the Company are presented in Note 1 to the consolidated financial statements. These policies, along with the disclosures presented in the other financial statement notes and in this discussion, provide information on how significant assets and liabilities are valued in the financial statements and how those values are determined. Based on the valuation techniques used and the sensitivity of financial statement amounts to the methods, assumptions, and estimates underlying those amounts, Management has identified the allowance for credit losses on loans accounting to be a critical accounting estimate. The accounting for the allowance for credit losses on loans requires the most subjective or complex judgments, and as such could be most subject to revision as new information becomes available. The methodology, significant inputs and assumptions for the allowance for credit losses on loans are discussed in the section “Allowance for Credit Losses on Loans” below. Additional discussion of the factors affecting accounting for the allowance for credit losses on loans is included in the “Loan Portfolio Credit Risk” discussion below. The Company’s allowance for credit losses on loans is established to provide for expected losses based on the available estimates at that point in time. Changes in economic conditions could significantly impact the estimated losses and could materially affect the Company’s operating results.
Financial Overview
Westamerica Bancorporation and subsidiaries’ (collectively, the “Company”)The Company reported net income of $122.0$161.8 million or $4.54$6.06 diluted earnings per common share (“EPS”) in 20222023 compared with net income of $122.0 million or $4.54 EPS in 2022 and net income of $86.5 million or $3.22 EPS in 20212021. 2023 results included a $1.2 million reversal of provision for credit losses, net of a $400 thousand provision for credit losses, a $279 thousand life insurance gain and neta $492 thousand increase to reconcile the 2022 income of $80.4 million or $2.98 EPS in 2020.tax provision to the filed 2022 tax returns. 2022 results included a $1.2 million reconciling payment from a payments network and a $930 thousand life insurance gain equivalent to combined EPS of $0.07. 2021 results included “make-whole” interest income on corporate bonds redeemed prior to maturity of $2.8 million. 2020 results included a provision for credit losses of $4.3 million, which reduced EPS $0.11, representing Management’s estimate of additional reserves needed over the remaining life of its loans due to increased credit-risk from deteriorating economic conditions caused by the COVID-19 pandemic, and $3. 5 million gain on sales of a closed branch building.
The Company’s primary and wholly-owned subsidiary, Westamerica Bank (the “Bank”), continued to support its customers during the pandemic. The Bank originated $106 million in loans under the second round of the Paycheck Protection Program (“PPP”) during the first six months of 2021. PPP loans meaningfully increased interest-earning assets and related interest and fee income. The Bank continues to work with loan customers who requested deferral of loan payments due to economic weakness caused by the pandemic. At December 31, 2021, loans granted deferrals under the CARES Act included $84 thousand, all of which were consumer automobile loans.
In response to the high levels of inflation during a period of tight employment conditions, the Federal Open Market Committee of the Federal Reserve Board (“FOMC”) has tightened monetary policy through reduced bond purchases and increases to the overnight federal funds interest rate. Therate starting in March 2022. On January 31, 2024, the FOMC starteddecided to increasemaintain the target range for the federal funds rate in March 2022. A February 1, 2023at the range of 5.25% to 5.50%. The January 31, 2024 Federal Reserve press release stated, “Recent indicators point to modest growth in spending and production.suggest that economic activity has been expanding at a solid pace. Job gains have been robust in recent months,moderated since early last year but remain strong, and the unemployment rate has remained low. Inflation has eased somewhatover the past year but remains elevated. Russia’s war against Ukraine is causing tremendous human and economic hardship and is contributing to elevated global uncertainty. The Committee seeks to achieve maximum employment and inflation at the rate of 2 percent over the longer run. The Committee judges that the risks to achieving its employment and inflation goals are moving into better balance. The economic outlook is uncertain, and Committee remains highly attentive to inflation risks…Therisks. In support of its goals, the Committee anticipates that ongoing increases indecided to maintain the target range for the federal funds rate at 5.25% to 5.50%. In considering any adjustments to the target range for the federal funds rate, the Committee will carefully assess incoming data, the evolving outlook, and the balance of risks. The Committee does not expect it will be appropriate in order to attain areduce the target range until it has gained greater confidence that inflation is moving sustainably toward 2 percent… The Committee would be prepared to adjust the stance of monetary policy as appropriate if risks emerge that is sufficiently restrictive to return inflation to 2 percent over time.could impede the attainment of the Committee’s goals.” On February 1, 2023, the FOMC announced its decision to increase the target federal funds ranging from 4.50% to 4.75% and theThe interest rate paid on reserve balances to 4.65% effective February 2, 2023.at the Federal Reserve Bank remained at 5.40%. The Bank maintains depositreserve balances at the Federal Reserve Bank; the amount that earns interest is identified as “interest-bearing cash”.
Management continues to evaluate the impacts of inflation, the Federal Reserve’s monetary policy and climate changes the COVID-19 pandemic and the tensions in Ukraine on the Company’s business and its customers. Recently, the banking industry experienced significant volatility with several regional bank failures in the first half of 2023. Industrywide concerns remained related to liquidity, deposit outflows and unrealized losses on debt securities. These events could adversely affect the Company’s funding of its operations. The extent of the impact on the Company’s results of operations, cash flow liquidity, and financial performance, as well as the Company’s ability to execute near- and long-term business strategies and initiatives, will depend on numerous evolving factors and future developments, which are highly uncertain and cannot be reasonably predicted.
The Company presents its net interest margin and net interest income on a fully taxable equivalent (“FTE”) basis using the current statutory federal tax rate. Management believes the FTE basis is valuable to the reader because the Company’s loan and investment securities portfolios contain municipal loans and securities that are federally tax exempt. The Company’s tax exempt loans and securities composition may not be similar to that of other banks, therefore in order to reflect the impact of the federally tax exempt loans and securities on the net interest margin and net interest income for comparability with other banks, the Company presents its net interest margin and net interest income on an FTE basis.
The Company’s significant accounting policies (see Note 1 “Summary of Significant Accounting Policies” to the Consolidated Financial Statements below) are fundamental to understanding the Company’s results of operations and financial condition. The Company adopted the following new accounting guidance:
FASB ASU 2022-02, Financial Instruments - Credit Losses (Topic 326): Troubled Debt Restructurings and Vintage Disclosures, issued March 2022, eliminates the recognition and measurement guidance for troubled debt restructurings and requires enhanced disclosures about loan modifications for borrowers experiencing financial difficulty. This ASU also requires enhanced disclosure for loans that have been charged off. The ASU became effective January 1, 2023 under a prospective approach. The Company adopted the provisions to remove the recognition and measurement guidance for troubled debt restructurings and/or modify relevant disclosures in the “Loans” note to the consolidated financial statements. The requirement to include additional disclosures was adopted by the Company January 1, 2023. The additional disclosures did not affect the financial results upon adoption.
FASB Accounting Standards Update (“ASU”) 2019-12, Income Taxes (Topic 740): Simplifying the Accounting for Income Taxes, was issued December 2019. The ASU is intended to simplify various aspects related to accounting for income taxes, eliminates certain exceptions to the general principles in ASC Topic 740 related to intra-period tax allocation, simplifies when companies recognize deferred taxes in an interim period, and clarifies certain aspects of the current guidance to promote consistent application. This guidance was effective for public entities for fiscal years beginning after December 15, 2020, and for interim period within those fiscal years, with early adoption permitted. The Company adopted the ASU provisions on January 1, 2021 and the adoption of the ASU provisions did not have a significant impact on the Company’s consolidated financial statements.
FASB ASU 2016-13,Financial Instruments – Credit Losses (Topic 326): Measurement of Credit Losses on Financial Instruments, was issued on June 16, 2016. The ASU significantly changed estimates for credit losses related to financial assets measured at amortized cost and certain other contracts. For estimating credit losses, the FASB replaced the incurred loss model with the current expected credit loss (CECL) model, which accelerated recognition of credit losses. Additionally, credit losses relating to debt securities available-for-sale are recorded through an allowance for credit losses under the new standard. The Company is also required to provide additional disclosures related to the financial assets within the scope of the new standard.
The Company adopted the ASU provisions on January 1, 2020. Management evaluated available data, defined portfolio segments of loans with similar attributes, and selected loss estimate models for each identified loan portfolio segment. Management measured historical loss rates for each portfolio segment. Management also segmented debt securities held to maturity, selected methods to estimate losses for each segment, and measured a loss estimate. Agency mortgage-backed securities were assigned no credit loss allowance due to the perceived backing of government sponsored entities. Municipal securities were evaluated for risk of default based on credit rating and remaining term to maturity using Moody’s risk of default factors; Moody’s loss upon default factors were applied to the assumed defaulted principal amounts to estimate the amount for credit loss allowance. The adjustment to the allowance for credit losses was recorded through an offsetting after-tax adjustment to shareholders’ equity. The implementing entry increased allowance for credit losses on loans by $2,017 thousand, reduced allowance for unfunded credit commitments by $2,107 thousand and increased retained earnings by $52 thousand.
[The remainder of this page intentionally left blank]
Net Income
Following is a summary of the components of net income for the periods indicated:
For the Years Ended December 31, | For the Years Ended December 31, | |||||||||||||||||||||||
2022 | 2021 | 2020 | 2023 | 2022 | 2021 | |||||||||||||||||||
($ in thousands, except per share data) | ($ in thousands, except per share data) | |||||||||||||||||||||||
Net interest and loan fee income | $ | 219,831 | $ | 171,488 | $ | 164,032 | $ | 280,123 | $ | 219,831 | $ | 171,488 | ||||||||||||
FTE adjustment | 1,944 | 2,663 | 3,650 | 1,550 | 1,944 | 2,663 | ||||||||||||||||||
Net interest and loan fee income (FTE) | 221,775 | 174,151 | 167,682 | 281,673 | 221,775 | 174,151 | ||||||||||||||||||
Provision for credit losses | - | - | (4,300 | ) | ||||||||||||||||||||
Reversal of provision for credit losses | 1,150 | - | - | |||||||||||||||||||||
Noninterest income | 45,121 | 43,345 | 45,637 | 43,522 | 45,121 | 43,345 | ||||||||||||||||||
Noninterest expense | (99,361 | ) | (97,806 | ) | (98,566 | ) | (103,216 | ) | (99,361 | ) | (97,806 | ) | ||||||||||||
Income before income taxes (FTE) | 167,535 | 119,690 | 110,453 | 223,129 | 167,535 | 119,690 | ||||||||||||||||||
Income taxes (FTE) | (45,501 | ) | (33,181 | ) | (30,040 | ) | (61,361 | ) | (45,501 | ) | (33,181 | ) | ||||||||||||
Net income | $ | 122,034 | $ | 86,509 | $ | 80,413 | $ | 161,768 | $ | 122,034 | $ | 86,509 | ||||||||||||
Net income per average fully-diluted common share | $ | 4.54 | $ | 3.22 | $ | 2.98 | $ | 6.06 | $ | 4.54 | $ | 3.22 | ||||||||||||
Net income as a percentage of average shareholders' equity | 15.21 | % | 11.52 | % | 11.30 | % | 18.08 | % | 15.21 | % | 11.52 | % | ||||||||||||
Net income as a percentage of average total assets | 1.65 | % | 1.23 | % | 1.30 | % | 2.35 | % | 1.65 | % | 1.23 | % | ||||||||||||
Net income for 2023 increased $39.7 million compared with 2022. Net interest and loan fee income (FTE) increased $59.9 million in 2023 compared with 2022 due to higher yield on interest-earning assets and higher average balances of investment debt securities, partially offset by lower average balances of loans and interest-bearing cash and higher rate on interest-bearing liabilities. The Company recorded a $1.2 million reversal of provision for credit losses in 2023, reflecting a $2.2 million recovery on a previously charged off loan in the first quarter 2023 and a $400 thousand credit loss provision, based on the results of the Company’s current expected credit loss (“CECL”) model and Management’s estimate of credit losses over the remaining life of its loans and debt securities held to maturity. The Company provided no provision for credit losses in 2022, based on Management’s estimate of credit losses over the remaining life of its loans and debt securities held to maturity. Noninterest income in 2023 decreased $1.6 million compared with 2022 primarily because 2022 included a $1.2 million reconciling payment from a payments network and higher gains on life insurance. Noninterest expense in 2023 increased $3.9 million compared with 2022 primarily due to increases in salaries and benefits, occupancy and equipment expenses, and increased FDIC insurance assessments for all insured depository institutions. Lower professional fees partially offset the increases in noninterest expense in 2023 compared with 2022. The tax rate (FTE) was 27.5% in 2023 and 27.2% in 2022. 2023 tax provision included a $492 thousand increase to reconcile the 2022 income tax provision to the filed 2022 tax returns.
Net income for 2022 increased $35.5 million compared with 2021. Net interest and loan fee income (FTE) increased $47.6 million in 2022 compared with 2021 due to higher average balances of investment debt securities and higher yield on interest-earning assets, partially offset by lower average balances of loans. The provision for credit losses was zero for 2022 and 2021, reflecting Management's estimate of credit losses over the remaining life of its loans and investment debt securities. Noninterest income in 2022 increased $1.8 million compared with 2021 primarily due to a $1.2 million reconciling payment from a payments network, a $930 thousand life insurance gain and higher fee income on deposit accounts. The increases in 2022 compared 2021 was partially offset by decreases in merchant processing service income and other noninterest income. Noninterest expense in 2022 increased $1.6 million compared with 2021. Limited partnership operating losses increased $3.1 million due to higher estimated operating losses on limited partnership investments in low-income housing and occupancy and equipment expense increased primarily due to software upgrades. The increase in 2022 compared with 2021 was partially offset by a decrease in salaries and related benefits resulting from attrition and lower professional fees. The effective tax ratesrate (FTE) werewas 27.2% in 2022 compared with 27.7% in 2021.
Comparing 2021 with 2020, net income increased $6.1 million. Net interest and loan fee (FTE) income increased $6.5 million due to higher average balances of investments, higher average balances of interest-bearing cash and higher yield on PPP loans, partially offset by lower yield on investments, interest-earning cash and loans excluding PPP loans. Results for 2021 included “make-whole” interest income on corporate bonds redeemed prior to maturity of $2.8 million. The Company provided no provision for credit losses in 2021, reflecting Management's evaluation of credit risk over the remaining life of loans and bonds. Results for 2020 included a provision of credit losses of $4.3 million, representing Management’s estimate of additional reserves needed over the remaining life of its loans due to credit-risk from economic weakness caused by the COVID-19 pandemic. Noninterest income decreased $2.3 million in 2021 compared with 2020 primarily because 2020 included $3.5 million in gains on sales of a closed branch building and a $603 thousand recovery on previously charged off loans. Fee income from merchant card processing, debit cards and trust accounts increased in 2021 compared with 2020. In 2021 noninterest expense decreased $760 thousand compared with 2020 due to lower salaries and related benefits, partially offset by higher professional fees and other noninterest expense. The tax rate (FTE) was 27.7% for 2021 and 27.2% for 2020.
[The remainder of this page intentionally left blank]
Net Interest and Loan Fee Income (FTE)
The Company's primary source of revenue is net interest income, or the difference between interest income earned on loans and investment securities and interest expense paid on interest-bearing deposits and other borrowings.
Components of Net Interest and Loan Fee Income (FTE)
For the Years Ended December 31, | For the Years Ended December 31, | |||||||||||||||||||||||
2022 | 2021 | 2020 | 2023 | 2022 | 2021 | |||||||||||||||||||
($ in thousands) | ($ in thousands) | |||||||||||||||||||||||
Interest and loan fee income | $ | 221,756 | $ | 173,443 | $ | 165,856 | $ | 284,013 | $ | 221,756 | $ | 173,443 | ||||||||||||
FTE adjustment | 1,944 | 2,663 | 3,650 | 1,550 | 1,944 | 2,663 | ||||||||||||||||||
Interest and loan fee income (FTE) | 223,700 | 176,106 | 169,506 | 285,563 | 223,700 | 176,106 | ||||||||||||||||||
Interest expense | (1,925 | ) | (1,955 | ) | (1,824 | ) | (3,890 | ) | (1,925 | ) | (1,955 | ) | ||||||||||||
Net interest and loan fee income (FTE) | $ | 221,775 | $ | 174,151 | $ | 167,682 | $ | 281,673 | $ | 221,775 | $ | 174,151 | ||||||||||||
Net interest margin (FTE) | 3.17 | % | 2.62 | % | 2.91 | % | 4.37 | % | 3.17 | % | 2.62 | % | ||||||||||||
Net interest and loan fee income (FTE) increased $59.9 million in 2023 compared with 2022 due to higher yield on interest-earning assets (up 1.23%) and higher average balances of investment debt securities (up $31 million), partially offset by lower average balances of loans (down $86 million) and interest-bearing cash (down $486 million) and higher rate on interest-bearing liabilities (up 0.07%).
Net interest and loan fee income (FTE) increased $47.6 million in 2022 compared with 2021 due to higher average balances of investment securities (up $723 million) and higher yield on interest-earning assets (up 0.55%), partially offset by lower average balances of loans (down $197 million).
Net interest and loan fee income (FTE) increased $6.5 million in 2021 compared with 2020 due to higher average balances of investments (up $431 million), higher average balances of interest-bearing cash (up $486 million) and higher yield on PPP loans (up 0.71%), partially offset by lower yield on investments (down 0.20%), interest-earning cash (down 0.18%) and loans excluding PPP loans. Results for 2021 included “make-whole” interest income on corporate bonds redeemed prior to maturity of $2.8 million.
The net interest margin (FTE) was 4.37% in 2023, 3.17% in 2022 and 2.62% in 2021 and 2.91% in 2020.2021. The yield on earning assets (FTE) was 4.43% in 2023, 3.20% in 2022 and 2.65% in 2021 and 2.94% in 2020. Market interest rates increased in 2022 compared with 2021 and 2020.2021.
The Company’s funding costs were 0.06% in 2023, compared with 0.03% in 2022 2021 and 2020.2021. Noninterest bearing deposits represented 47% of average deposits in 2023 and 2022, while higher-cost time deposits represented 2% for both periods. Average balances of time deposits in 20222023 declined $13$24 million from 2021 while average balances of checking and savings deposits grew 6% from 2021 to 2022. Average balances of checking and saving deposits accounted for 97.8%98.0% of average total deposits in 20222023 compared with 97.5%97.8% in 20212022. The customer deposits and 96.9% in 2020.shareholders’ equity fully funded the Company’s interest earning assets for 2023 and 2022; there was no borrowing from the Federal Reserve Bank or correspondent banks.
Net Interest Margin (FTE)
The following summarizes the components of the Company's net interest margin (FTE) for the periods indicated.
For the Years Ended December 31, | For the Years Ended December 31, | |||||||||||||||||||||||
2022 | 2021 | 2020 | 2023 | 2022 | 2021 | |||||||||||||||||||
Yield on earning assets (FTE) | 3.20 | % | 2.65 | % | 2.94 | % | 4.43 | % | 3.20 | % | 2.65 | % | ||||||||||||
Rate paid on interest-bearing liabilities | 0.05 | % | 0.06 | % | 0.06 | % | 0.12 | % | 0.05 | % | 0.06 | % | ||||||||||||
Net interest spread (FTE) | 3.15 | % | 2.59 | % | 2.88 | % | 4.31 | % | 3.15 | % | 2.59 | % | ||||||||||||
Benefit of noninterest-bearing demand deposits | 0.02 | % | 0.03 | % | 0.03 | % | 0.06 | % | 0.02 | % | 0.03 | % | ||||||||||||
Net interest margin (FTE) | 3.17 | % | 2.62 | % | 2.91 | % | 4.37 | % | 3.17 | % | 2.62 | % | ||||||||||||
The increase in the Company’s yield on earning assets has been generated primarily by collateralized loan obligations (CLOs), held in debt securities available for sale portfolio, and interest-bearing cash. The CLOs have interest coupons that change once every three months by the amount of change in the three-month LIBOR and SOFR base rates. The average balances and yields of CLOs for 2023 and 2022 was $1,543 million yielding 6.99% and 2021 was $1,567 million yielding 3.62% and $1,177 million yielding 2.02%, respectively. The interest-bearing cash yield changes by the amount of change in the overnight federal funds rate on the effective date declared by the FOMC. The average balance and yields of interest-bearing cash for 2023 and 2022 was $205 million yielding 5.21% and 2021 was $691 million yielding 1.13% and $857 million yielding 0.13%, respectively. The Company has other earning assets with variable yields such as commercial loans and lines of credit, consumer lines of credit and adjustable rate residential real estate loans, which are included in “other taxable loans” in the following “Summary of Average Balances, Yields/Rates and Interest Differential.”
Summary of Average Balances, Yields/Rates and Interest Differential
The following tables present information regarding the consolidated average assets, liabilities and shareholders’ equity, the amounts of interest income earned from average interest earning assets and the resulting yields, and the amounts of interest expense incurred on average interest-bearing liabilities and the resulting rates. Average loan balances include nonperforming loans. Interest income includes reversal of previously accrued interest on loans placed on non-accrual status during the period and proceeds from loans on nonaccrual status only to the extent cash payments have been received and applied as interest income and accretion of purchased loan discounts. Yields on tax-exempt securities and loans have been adjusted upward to reflect the effect of income exempt from federal income taxation at the federal statutory tax rate of 21 percent.
Distribution of Assets, Liabilities & Shareholders’ Equity and Yields, Rates & Interest Margin
For the Year Ended December 31, 2022 | For the Year Ended December 31, 2023 | |||||||||||||||||||||||
Interest | Interest | |||||||||||||||||||||||
Average | Income/ | Yields/ | Average | Income/ | Yields/ | |||||||||||||||||||
Balance | Expense | Rates | Balance | Expense | Rates | |||||||||||||||||||
($ in thousands) | ($ in thousands) | |||||||||||||||||||||||
Assets | ||||||||||||||||||||||||
Investment securities: | ||||||||||||||||||||||||
Taxable | $ | 5,093,921 | $ | 158,465 | 3.11 | % | $ | 5,176,278 | $ | 221,742 | 4.28 | % | ||||||||||||
Tax-exempt (1) | 209,725 | 7,390 | 3.52 | % | 158,433 | 5,668 | 3.58 | % | ||||||||||||||||
Total investments (1) | 5,303,646 | 165,855 | 3.13 | % | 5,334,711 | 227,410 | 4.26 | % | ||||||||||||||||
Loans: | ||||||||||||||||||||||||
Taxable: | ||||||||||||||||||||||||
PPP loans | 17,604 | 2,435 | 13.83 | % | ||||||||||||||||||||
Other | 933,912 | 45,839 | 4.91 | % | ||||||||||||||||||||
Total taxable | 951,516 | 48,274 | 5.07 | % | ||||||||||||||||||||
Taxable | 868,255 | 45,739 | 5.27 | % | ||||||||||||||||||||
Tax-exempt (1) | 46,448 | 1,781 | 3.83 | % | 44,061 | 1,743 | 3.96 | % | ||||||||||||||||
Total loans (1) | 997,964 | 50,055 | 5.02 | % | 912,316 | 47,482 | 5.20 | % | ||||||||||||||||
Total interest-bearing cash | 691,086 | 7,790 | 1.13 | % | 204,794 | 10,671 | 5.21 | % | ||||||||||||||||
Total Interest-earning assets (1) | 6,992,696 | 223,700 | 3.20 | % | 6,451,821 | 285,563 | 4.43 | % | ||||||||||||||||
Other assets | 420,312 | 419,545 | ||||||||||||||||||||||
Total assets | $ | 7,413,008 | $ | 6,871,366 | ||||||||||||||||||||
Liabilities and shareholders' equity | ||||||||||||||||||||||||
Noninterest-bearing demand | $ | 3,018,350 | $ | - | - | % | $ | 2,748,544 | $ | - | - | % | ||||||||||||
Savings and interest-bearing transaction | 3,257,858 | 1,510 | 0.05 | % | 2,922,909 | 3,450 | 0.12 | % | ||||||||||||||||
Time less than $100,000 | 77,007 | 180 | 0.23 | % | 67,832 | 204 | 0.30 | % | ||||||||||||||||
Time $100,000 or more | 62,411 | 156 | 0.25 | % | 48,076 | 116 | 0.24 | % | ||||||||||||||||
Total interest-bearing deposits | 3,397,276 | 1,846 | 0.05 | % | 3,038,817 | 3,770 | 0.12 | % | ||||||||||||||||
Securities sold under agreements to repurchase | 109,282 | 79 | 0.07 | % | ||||||||||||||||||||
Federal funds purchased | 1 | - | 4.68 | % | ||||||||||||||||||||
Short-term borrowed funds | 89,298 | 120 | 0.13 | % | ||||||||||||||||||||
Total interest-bearing liabilities | 3,506,559 | 1,925 | 0.05 | % | 3,128,115 | 3,890 | 0.12 | % | ||||||||||||||||
Other liabilities | 85,610 | 100,097 | ||||||||||||||||||||||
Shareholders' equity | 802,489 | 894,610 | ||||||||||||||||||||||
Total liabilities and shareholders' equity | $ | 7,413,008 | $ | 6,871,366 | ||||||||||||||||||||
Net interest spread (1) (2) | 3.15 | % | 4.31 | % | ||||||||||||||||||||
Net interest and fee income and interest margin (1) (3) | $ | 221,775 | 3.17 | % | $ | 281,673 | 4.37 | % | ||||||||||||||||
(1) Amounts calculated on an FTE basis using the current statutory federal tax rate.
(2) Net interest spread represents the average yield earned on interest-earning assets less the average rate incurred on interest-bearing liabilities.
(3) Net interest margin is computed by calculating the difference between interest income and expense, divided by the average balance of interest-earning assets. The net interest margin is greater than the net interest spread due to the benefit of noninterest-bearing demand deposits.
Distribution of Assets, Liabilities & Shareholders’ Equity and Yields, Rates & Interest Margin
For the Year Ended December 31, 2021 | For the Year Ended December 31, 2022 | |||||||||||||||||||||||
Interest | Interest | |||||||||||||||||||||||
Average | Income/ | Yields/ | Average | Income/ | Yields/ | |||||||||||||||||||
Balance | Expense | Rates | Balance | Expense | Rates | |||||||||||||||||||
($ in thousands) | ($ in thousands) | |||||||||||||||||||||||
Assets | ||||||||||||||||||||||||
Investment securities: | ||||||||||||||||||||||||
Taxable | $ | 4,267,522 | $ | 106,329 | 2.49 | % | $ | 5,093,921 | $ | 158,465 | 3.11 | % | ||||||||||||
Tax-exempt (1) | 312,946 | 10,677 | 3.41 | % | 209,725 | 7,390 | 3.52 | % | ||||||||||||||||
Total investments (1) | 4,580,468 | 117,006 | 2.55 | % | 5,303,646 | 165,855 | 3.13 | % | ||||||||||||||||
Loans: | ||||||||||||||||||||||||
Taxable: | ||||||||||||||||||||||||
PPP loans | 152,149 | 7,639 | 5.02 | % | ||||||||||||||||||||
Other | 992,454 | 48,376 | 4.87 | % | ||||||||||||||||||||
Total taxable | 1,144,603 | 56,015 | 4.89 | % | ||||||||||||||||||||
Taxable | 951,516 | 48,274 | 5.07 | % | ||||||||||||||||||||
Tax-exempt (1) | 50,532 | 1,953 | 3.87 | % | 46,448 | 1,781 | 3.83 | % | ||||||||||||||||
Total loans (1) | 1,195,135 | 57,968 | 4.85 | % | 997,964 | 50,055 | 5.02 | % | ||||||||||||||||
Total interest-bearing cash | 857,029 | 1,132 | 0.13 | % | 691,086 | 7,790 | 1.13 | % | ||||||||||||||||
Total Interest-earning assets (1) | 6,632,632 | 176,106 | 2.65 | % | 6,992,696 | 223,700 | 3.20 | % | ||||||||||||||||
Other assets | 406,652 | 420,312 | ||||||||||||||||||||||
Total assets | $ | 7,039,284 | $ | 7,413,008 | ||||||||||||||||||||
Liabilities and shareholders' equity | ||||||||||||||||||||||||
Noninterest-bearing demand | $ | 2,897,244 | $ | - | - | % | $ | 3,018,350 | $ | - | - | % | ||||||||||||
Savings and interest-bearing transaction | 3,050,859 | 1,445 | 0.05 | % | 3,257,858 | 1,510 | 0.05 | % | ||||||||||||||||
Time less than $100,000 | 83,580 | 167 | 0.20 | % | 77,007 | 180 | 0.23 | % | ||||||||||||||||
Time $100,000 or more | 69,165 | 265 | 0.38 | % | 62,411 | 156 | 0.25 | % | ||||||||||||||||
Total interest-bearing deposits | 3,203,604 | 1,877 | 0.06 | % | 3,397,276 | 1,846 | 0.05 | % | ||||||||||||||||
Securities sold under agreements to repurchase | 114,266 | 78 | 0.07 | % | ||||||||||||||||||||
Federal Funds purchased | 1 | - | 0.87 | % | ||||||||||||||||||||
Other borrowed funds | 53 | - | 0.35 | % | ||||||||||||||||||||
Short-term borrowed funds | 109,283 | 79 | 0.07 | % | ||||||||||||||||||||
Total interest-bearing liabilities | 3,317,924 | 1,955 | 0.06 | % | 3,506,559 | 1,925 | 0.05 | % | ||||||||||||||||
Other liabilities | 73,447 | 85,610 | ||||||||||||||||||||||
Shareholders' equity | 750,669 | 802,489 | ||||||||||||||||||||||
Total liabilities and shareholders' equity | $ | 7,039,284 | $ | 7,413,008 | ||||||||||||||||||||
Net interest spread (1) (2) | 2.59 | % | 3.15 | % | ||||||||||||||||||||
Net interest and fee income and interest margin (1) (3) | $ | 174,151 | 2.62 | % | $ | 221,775 | 3.17 | % | ||||||||||||||||
(1) Amounts calculated on an FTE basis using the current statutory federal tax rate.
(2) Net interest spread represents the average yield earned on interest-earning assets less the average rate incurred on interest-bearing liabilities.
(3) Net interest margin is computed by calculating the difference between interest income and expense, divided by the average balance of interest-earning assets. The net interest margin is greater than the net interest spread due to the benefit of noninterest-bearing demand deposits.
[The remainder of this page intentionally left blank]
Distribution of Assets, Liabilities & Shareholders’ Equity and Yields, Rates & Interest Margin
For the Year Ended December 31, 2020 | ||||||||||||
Interest | ||||||||||||
Average | Income/ | Yields/ | ||||||||||
Balance | Expense | Rates | ||||||||||
($ in thousands) | ||||||||||||
Assets | ||||||||||||
Investment securities: | ||||||||||||
Taxable | $ | 3,689,769 | $ | 93,163 | 2.52 | % | ||||||
Tax-exempt (1) | 460,191 | 15,395 | 3.35 | % | ||||||||
Total investments (1) | 4,149,960 | 108,558 | 2.62 | % | ||||||||
Loans: | ||||||||||||
Taxable: | ||||||||||||
PPP loans | 151,320 | 6,516 | 4.31 | % | ||||||||
Other | 1,039,724 | 51,336 | 4.94 | % | ||||||||
Total taxable | 1,191,044 | 57,852 | 4.86 | % | ||||||||
Tax-exempt (1) | 48,100 | 1,931 | 4.01 | % | ||||||||
Total loans (1) | 1,239,144 | 59,783 | 4.82 | % | ||||||||
Total interest-bearing cash | 371,444 | 1,165 | 0.31 | % | ||||||||
Total Interest-earning assets (1) | 5,760,548 | 169,506 | 2.94 | % | ||||||||
Other assets | 413,922 | |||||||||||
Total assets | $ | 6,174,470 | ||||||||||
Liabilities and shareholders' equity | ||||||||||||
Noninterest-bearing demand | $ | 2,538,819 | $ | - | - | % | ||||||
Savings and interest-bearing transaction | 2,603,476 | 1,258 | 0.05 | % | ||||||||
Time less than $100,000 | 91,519 | 193 | 0.21 | % | ||||||||
Time $100,000 or more | 72,363 | 319 | 0.44 | % | ||||||||
Total interest-bearing deposits | 2,767,358 | 1,770 | 0.06 | % | ||||||||
Securities sold under agreements to repurchase | 80,455 | 53 | 0.07 | % | ||||||||
Federal funds purchased | 1 | - | 0.88 | % | ||||||||
Other borrowed funds | 174 | 1 | 0.35 | % | ||||||||
Total interest-bearing liabilities | 2,847,988 | 1,824 | 0.06 | % | ||||||||
Other liabilities | 76,109 | |||||||||||
Shareholders' equity | 711,554 | |||||||||||
Total liabilities and shareholders' equity | $ | 6,174,470 | ||||||||||
Net interest spread (1) (2) | 2.88 | % | ||||||||||
Net interest and fee income and interest margin (1) (3) | $ | 167,682 | 2.91 | % | ||||||||
(1) Amounts calculated on an FTE basis using the current statutory federal tax rate.
(2) Net interest spread represents the average yield earned on interest-earning assets less the average rate incurred on interest-bearing liabilities.
(3) Net interest margin is computed by calculating the difference between interest income and expense, divided by the average balance of interest-earning assets. The net interest margin is greater than the net interest spread due to the benefit of noninterest-bearing demand deposits.
[The remainder of this page intentionally left blank]
Distribution of Assets, Liabilities & Shareholders’ Equity and Yields, Rates & Interest Margin
For the Year Ended December 31, 2021 | ||||||||||||
Interest | ||||||||||||
Average | Income/ | Yields/ | ||||||||||
Balance | Expense | Rates | ||||||||||
($ in thousands) | ||||||||||||
Assets | ||||||||||||
Investment securities: | ||||||||||||
Taxable | $ | 4,267,522 | $ | 106,329 | 2.49 | % | ||||||
Tax-exempt (1) | 312,946 | 10,677 | 3.41 | % | ||||||||
Total investments (1) | 4,580,468 | 117,006 | 2.55 | % | ||||||||
Loans: | ||||||||||||
Taxable | 1,144,603 | 56,015 | 4.89 | % | ||||||||
Tax-exempt (1) | 50,532 | 1,953 | 3.87 | % | ||||||||
Total loans (1) | 1,195,135 | 57,968 | 4.85 | % | ||||||||
Total interest-bearing cash | 857,029 | 1,132 | 0.13 | % | ||||||||
Total Interest-earning assets (1) | 6,632,632 | 176,106 | 2.65 | % | ||||||||
Other assets | 406,652 | |||||||||||
Total assets | $ | 7,039,284 | ||||||||||
Liabilities and shareholders' equity | ||||||||||||
Noninterest-bearing demand | $ | 2,897,244 | $ | - | - | % | ||||||
Savings and interest-bearing transaction | 3,050,859 | 1,445 | 0.05 | % | ||||||||
Time less than $100,000 | 83,580 | 167 | 0.20 | % | ||||||||
Time $100,000 or more | 69,165 | 265 | 0.38 | % | ||||||||
Total interest-bearing deposits | 3,203,604 | 1,877 | 0.06 | % | ||||||||
Short-term borrowed funds | 114,320 | 78 | 0.07 | % | ||||||||
Total interest-bearing liabilities | 3,317,924 | 1,955 | 0.06 | % | ||||||||
Other liabilities | 73,447 | |||||||||||
Shareholders' equity | 750,669 | |||||||||||
Total liabilities and shareholders' equity | $ | 7,039,284 | ||||||||||
Net interest spread (1) (2) | 2.59 | % | ||||||||||
Net interest and fee income and interest margin (1) (3) | $ | 174,151 | 2.62 | % | ||||||||
(1) Amounts calculated on an FTE basis using the current statutory federal tax rate.
(2) Net interest spread represents the average yield earned on interest-earning assets less the average rate incurred on interest-bearing liabilities.
(3) Net interest margin is computed by calculating the difference between interest income and expense, divided by the average balance of interest-earning assets. The net interest margin is greater than the net interest spread due to the benefit of noninterest-bearing demand deposits.
[The remainder of this page intentionally left blank]
Summary of Changes in Interest Income and Expense due to Changes in Average Asset & Liability Balances and Yields Earned & Rates Paid
The following tables set forth a summary of the changes in interest income and interest expense due to changes in average assets and liability balances (volume) and changes in average interest yields/rates for the periods indicated. Changes not solely attributable to volume or yields/rates have been allocated in proportion to the respective volume and yield/rate components.
Summary of Changes in Interest Income and Expense
For the Year Ended December 31, 2022 | ||||||||||||
Compared with | ||||||||||||
For the Year Ended December 31, 2021 | ||||||||||||
Volume | Yield/Rate | Total | ||||||||||
(In thousands) | ||||||||||||
Increase (decrease) in interest and loan fee income: | ||||||||||||
Investment securities: | ||||||||||||
Taxable | $ | 20,590 | $ | 31,546 | $ | 52,136 | ||||||
Tax-exempt (1) | (3,522 | ) | 235 | (3,287 | ) | |||||||
Total investments (1) | 17,068 | 31,781 | 48,849 | |||||||||
Loans: | ||||||||||||
Taxable: | ||||||||||||
PPP loans | (18,610 | ) | 13,406 | (5,204 | ) | |||||||
Other | (2,854 | ) | 317 | (2,537 | ) | |||||||
Total taxable | (21,464 | ) | 13,723 | (7,741 | ) | |||||||
Tax-exempt (1) | (158 | ) | (14 | ) | (172 | ) | ||||||
Total loans (1) | (21,622 | ) | 13,709 | (7,913 | ) | |||||||
Total interest-bearing cash | (219 | ) | 6,877 | 6,658 | ||||||||
Total (decrease) increase in interest and loan fee income (1) | (4,773 | ) | 52,367 | 47,594 | ||||||||
Increase (decrease) in interest expense: | ||||||||||||
Deposits: | ||||||||||||
Savings and interest-bearing transaction | 98 | (33 | ) | 65 | ||||||||
Time less than $100,000 | (13 | ) | 26 | 13 | ||||||||
Time $100,000 or more | (26 | ) | (83 | ) | (109 | ) | ||||||
Total interest-bearing deposits | 59 | (90 | ) | (31 | ) | |||||||
Securities sold under agreements to repurchase | (3 | ) | 4 | 1 | ||||||||
Total increase (decrease) in interest expense | 56 | (86 | ) | (30 | ) | |||||||
(Decrease) increase in net interest and loan fee income (1) | $ | (4,829 | ) | $ | 52,453 | $ | 47,624 | |||||
For the Year Ended December 31, 2023 | ||||||||||||
Compared with | ||||||||||||
For the Year Ended December 31, 2022 | ||||||||||||
Volume | Yield/Rate | Total | ||||||||||
(In thousands) | ||||||||||||
Increase (decrease) in interest and loan fee income: | ||||||||||||
Investment securities: | ||||||||||||
Taxable | $ | 2,562 | $ | 60,715 | $ | 63,277 | ||||||
Tax-exempt (1) | (1,807 | ) | 85 | (1,722 | ) | |||||||
Total investments (1) | 755 | 60,800 | 61,555 | |||||||||
Loans: | ||||||||||||
Taxable | (4,224 | ) | 1,689 | (2,535 | ) | |||||||
Tax-exempt (1) | (92 | ) | 54 | (38 | ) | |||||||
Total loans (1) | (4,316 | ) | 1,743 | (2,573 | ) | |||||||
Total interest-bearing cash | (5,482 | ) | 8,363 | 2,881 | ||||||||
Total (decrease) increase in interest and loan fee income (1) | (9,043 | ) | 70,906 | 61,863 | ||||||||
(Decrease) increase in interest expense: | ||||||||||||
Deposits: | ||||||||||||
Savings and interest-bearing transaction | (155 | ) | 2,095 | 1,940 | ||||||||
Time less than $100,000 | (21 | ) | 45 | 24 | ||||||||
Time $100,000 or more | (36 | ) | (4 | ) | (40 | ) | ||||||
Total interest-bearing deposits | (212 | ) | 2,136 | 1,924 | ||||||||
Short-term borrowed funds | (14 | ) | 55 | 41 | ||||||||
Total (decrease) increase in interest expense | (226 | ) | 2,191 | 1,965 | ||||||||
(Decrease) increase in net interest and loan fee income (1) | $ | (8,817 | ) | $ | 68,715 | $ | 59,898 | |||||
(1) Amounts calculated on an FTE basis using the current statutory federal tax rate.
[The remainder of this page intentionally left blank]
Summary of Changes in Interest Income and Expense
For the Year Ended December 31, 2021 | ||||||||||||
Compared with | ||||||||||||
For the Year Ended December 31, 2020 | ||||||||||||
Volume | Yield/Rate | Total | ||||||||||
(In thousands) | ||||||||||||
Increase (decrease) in interest and loan fee income: | ||||||||||||
Investment securities: | ||||||||||||
Taxable | $ | 14,588 | $ | (1,422 | ) | $ | 13,166 | |||||
Tax-exempt (1) | (4,926 | ) | 208 | (4,718 | ) | |||||||
Total investments (1) | 9,662 | (1,214 | ) | 8,448 | ||||||||
Loans: | ||||||||||||
Taxable: | ||||||||||||
PPP loans | 42 | 1,081 | 1,123 | |||||||||
Other | (2,334 | ) | (626 | ) | (2,960 | ) | ||||||
Total taxable | (2,292 | ) | 455 | (1,837 | ) | |||||||
Tax-exempt (1) | 98 | (76 | ) | 22 | ||||||||
Total loans (1) | (2,194 | ) | 379 | (1,815 | ) | |||||||
Total interest-bearing cash | 1,523 | (1,556 | ) | (33 | ) | |||||||
Total increase (decrease) in interest and loan fee income (1) | 8,991 | (2,391 | ) | 6,600 | ||||||||
Increase (decrease) in interest expense: | ||||||||||||
Deposits: | ||||||||||||
Savings and interest-bearing transaction | 216 | (29 | ) | 187 | ||||||||
Time less than $100,000 | (17 | ) | (9 | ) | (26 | ) | ||||||
Time $100,000 or more | (14 | ) | (40 | ) | (54 | ) | ||||||
Total interest-bearing deposits | 185 | (78 | ) | 107 | ||||||||
Securities sold under agreements to repurchase | 22 | 3 | 25 | |||||||||
Other borrowed funds | (1 | ) | - | (1 | ) | |||||||
Total increase (decrease) in interest expense | 206 | (75 | ) | 131 | ||||||||
Increase (decrease) in net interest and loan fee income (1) | $ | 8,785 | $ | (2,316 | ) | $ | 6,469 | |||||
(1) Amounts calculated on an FTE basis using the current statutory federal tax rate.
For the Year Ended December 31, 2022 | ||||||||||||
Compared with | ||||||||||||
For the Year Ended December 31, 2021 | ||||||||||||
Volume | Yield/Rate | Total | ||||||||||
(In thousands) | ||||||||||||
Increase (decrease) in interest and loan fee income: | ||||||||||||
Investment securities: | ||||||||||||
Taxable | $ | 20,590 | $ | 31,546 | $ | 52,136 | ||||||
Tax-exempt (1) | (3,522 | ) | 235 | (3,287 | ) | |||||||
Total investments (1) | 17,068 | 31,781 | 48,849 | |||||||||
Loans: | ||||||||||||
Taxable | (21,464 | ) | 13,723 | (7,741 | ) | |||||||
Tax-exempt (1) | (158 | ) | (14 | ) | (172 | ) | ||||||
Total loans (1) | (21,622 | ) | 13,709 | (7,913 | ) | |||||||
Total interest-bearing cash | (219 | ) | 6,877 | 6,658 | ||||||||
Total (decrease) increase in interest and loan fee income (1) | (4,773 | ) | 52,367 | 47,594 | ||||||||
Increase (decrease) in interest expense: | ||||||||||||
Deposits: | ||||||||||||
Savings and interest-bearing transaction | 98 | (33 | ) | 65 | ||||||||
Time less than $100,000 | (13 | ) | 26 | 13 | ||||||||
Time $100,000 or more | (26 | ) | (83 | ) | (109 | ) | ||||||
Total interest-bearing deposits | 59 | (90 | ) | (31 | ) | |||||||
Short-term borrowed funds | (3 | ) | 4 | 1 | ||||||||
Total increase (decrease) in interest expense | 56 | (86 | ) | (30 | ) | |||||||
(Decrease) increase in net interest and loan fee income (1) | $ | (4,829 | ) | $ | 52,453 | $ | 47,624 | |||||
(1) Amounts calculated on an FTE basis using the current statutory federal tax rate. | ||||||||||||
Provision for Credit Losses
The Company manages credit costs by consistently enforcing conservative underwriting and administration procedures and aggressively pursuing collection efforts with debtors experiencing financial difficulties. The provision for credit losses reflects Management's assessment of credit risk in the loan portfolio and debt securities held to maturity during each of the periods presented.
The Company recorded a $1.2 million reversal of provision for credit losses in 2023 which reflected a $2.2 million recovery in the first quarter 2023 on a previously charged off loan and a $400 thousand provision for credit losses in the third quarter of 2023, based on the results of the CECL model and Management’s estimate of credit losses over the remaining life of its loans and debt securities held to maturity. The Company provided no provision for credit losses in 2022 and 2021 based on Management’s estimate of reserves needed over the remaining life of its loans and investments. The Company provided a provision for credit losses of $4.3 million recorded in 2020. The 2020 provision represented Management’s estimate of additional reserves needed over the remaining life of its loans and investments due to credit-risk from weakened economic conditions caused by the COVID-19 pandemic. For further information regarding credit risk, net credit losses and the allowance for credit losses, see the “Loan Portfolio Credit Risk” and “Allowance for Credit Losses” sections of this Report.
[The remainder of this page intentionally left blank]
Noninterest Income
Components of Noninterest Income
For the Years Ended December 31, | For the Years Ended December 31, | |||||||||||||||||||||||
2022 | 2021 | 2020 | 2023 | 2022 | 2021 | |||||||||||||||||||
(In thousands) | (In thousands) | |||||||||||||||||||||||
Service charges on deposit accounts | $ | 14,490 | $ | 13,697 | $ | 14,149 | $ | 14,169 | $ | 14,490 | $ | 13,697 | ||||||||||||
Merchant processing services | 11,623 | 11,998 | 10,208 | 11,280 | 11,623 | 11,998 | ||||||||||||||||||
Debit card fees | 7,879 | 6,859 | 6,181 | 7,185 | 7,879 | 6,859 | ||||||||||||||||||
Trust fees | 3,216 | 3,311 | 3,012 | 3,122 | 3,216 | 3,311 | ||||||||||||||||||
ATM processing fees | 2,160 | 2,280 | 2,273 | 2,618 | 2,160 | 2,280 | ||||||||||||||||||
Other service fees | 1,808 | 1,884 | 1,837 | 1,765 | 1,808 | 1,884 | ||||||||||||||||||
Financial services commissions | 417 | 356 | 372 | 336 | 417 | 356 | ||||||||||||||||||
Life insurance gains | 930 | - | - | 279 | 930 | - | ||||||||||||||||||
Gains on sales of real property | - | - | 3,536 | |||||||||||||||||||||
Securities gains | - | 34 | 71 | |||||||||||||||||||||
Securities (losses) gains | (125 | ) | - | 34 | ||||||||||||||||||||
Other noninterest income | 2,598 | 2,926 | 3,998 | 2,893 | 2,598 | 2,926 | ||||||||||||||||||
Total Noninterest Income | $ | 45,121 | $ | 43,345 | $ | 45,637 | $ | 43,522 | $ | 45,121 | $ | 43,345 | ||||||||||||
Noninterest income in 2023 decreased $1.6 million compared with 2022 primarily due to lower gains on life insurance and because debit card fees in 2022 included a $1.2 million reconciling payment from a payments network. Merchant processing service fees decreased in 2023 compared with 2022 primarily due to lower transaction volumes and increased lower-margin transactions. Service charges on deposit accounts decreased in 2023 compared with 2022 primarily due to lower fee income on analyzed deposit accounts, partially offset by fees generated from time deposits redeemed before maturity. ATM processing fee income increased in 2023 compared with 2022 primarily due to increased transaction volumes. Other noninterest income in 2023 included higher recoveries of interest and fees on previously charged off loans compared 2022.
Noninterest income in 2022 increased $1.8 million compared with 2021 primarily due to a $1.2 million reconciling payment from a payments network, a $930 thousand life insurance gain and higher fee income on deposit accounts. Higher fee income on deposit accounts in 2022 compared with 2021 was primarily attributable to increased fee income from overdrawn deposit accounts. The increases in 2022 compared 2021 waswere partially offset by decreases in merchant processing service income and other noninterest income.
In 2021, noninterest income decreased $2.3 million compared with 2020 primarily because 2020 results included a $3.5 million gain on the sale of a closed branch building, a $603 thousand recovery in excess of previously charged off loan amounts, and higher service charges on deposit accounts. Decreases in 2021 results, compared with 2020, were partially offset by higher transaction volumes from merchant processing services and debit cards, and increases in trust fees.
Noninterest Expense
Components of Noninterest Expense
For the Years Ended December 31, | For the Years Ended December 31, | |||||||||||||||||||||||
2022 | 2021 | 2020 | 2023 | 2022 | 2021 | |||||||||||||||||||
(In thousands) | (In thousands) | |||||||||||||||||||||||
Salaries and related benefits | $ | 46,125 | $ | 48,011 | $ | 50,749 | $ | 47,871 | $ | 46,125 | $ | 48,011 | ||||||||||||
Occupancy and equipment | 19,884 | 19,139 | 19,637 | 20,520 | 19,884 | 19,139 | ||||||||||||||||||
Outsourced data processing services | 9,684 | 9,601 | 9,426 | 9,846 | 9,684 | 9,601 | ||||||||||||||||||
Limited partnership operating losses | 5,724 | 2,620 | 2,440 | 5,754 | 5,724 | 2,620 | ||||||||||||||||||
Professional fees | 2,628 | 3,253 | 2,423 | 1,751 | 2,628 | 3,253 | ||||||||||||||||||
Courier service | 2,614 | 2,177 | 2,001 | 2,652 | 2,614 | 2,177 | ||||||||||||||||||
Other noninterest expense | 12,702 | 13,005 | 11,890 | 14,822 | 12,702 | 13,005 | ||||||||||||||||||
Total Noninterest Expense | $ | 99,361 | $ | 97,806 | $ | 98,566 | $ | 103,216 | $ | 99,361 | $ | 97,806 | ||||||||||||
Noninterest expense in 2023 increased $3.9 million compared with 2022. Salaries and benefits increased in 2023 compared with 2022 due to increased staff, annual merit increases and higher group health insurance costs for the employees. Occupancy and equipment expenses increased in 2023 compared with 2022 primarily due to increases in repair and maintenance. Other noninterest expense increased in 2023 compared with 2022 primarily due to higher FDIC insurance assessments for all insured depository institutions and losses on unauthorized transactions of customer debit and ATM cards. Professional fees decreased in 2023 compared with 2022 primarily due to lower legal fees.
Noninterest expense in 2022 increased $1.6 million compared with 2021. Limited partnership operating losses increased $3.1 million due to higher estimated operating losses on limited partnership investments in low-income housing. Occupancy and equipment expense in 2022 increased primarily due to computer software upgrades. The increase in 2022 compared with 2021 was partially offset by a decrease in salaries and related benefits resulting from attrition. Professional fees decreased in 2022 compared with 2021 due to lower legal fees.
In 2021, noninterest expense decreased $760 thousand compared with 2020. The decrease in salaries and related benefits in 2021 compared with 2020 was attributable to attrition. Occupancy and equipment expenses decreased due to lower depreciation expense. These decreases were partially offset by higher professional fees and other noninterest expense.
Provision for Income Tax
The Company’s income tax provision (FTE) was $61.4 million in 2023 compared with $45.5 million in 2022 compared withand $33.2 million in 2021 and $30.0 million in 2020.2021. The 2023 income tax provision included a $492 thousand increase to reconcile the 2022 income tax provision to the filed 2022 tax returns. The effective tax rates (FTE) were 27.5% in 2023 compared with 27.2% in 2022 compared withand 27.7% in 2021 and 27.2% in 2020.2021. See Note 10 to the consolidated financial statements for additional information related to income taxes.
Investment Securities Portfolio
The Company maintains an investment securities portfolio consisting of securities issued by U.S. Government sponsored entities, state and political subdivisions, corporations, collateralized loan obligations and agency mortgage-backed securities. The Company had no marketable equity securities at December 31, 2023 and December 31, 2022.
Management manages the investment securities portfolio in response to anticipated changes in interest rates, and changes in deposit and loan volumes. The carrying value of the Company’s investment securities portfolio was $4.9 billion at December 31, 2023 and $5.2 billion at December 31, 2022 and $4.9 billion at December 31, 2021.2022. The following table lists debt securities in the Company’s portfolio by type as of the indicated dates.dates indicated. Debt securities held to maturity are listed at amortized cost before related reserve for expected credit losses of $1 thousand at December 31, 20222023 and $7 thousand at December 31, 2021.2022. Debt securities available for sale are listed at fair value.
At December 31, 2022 | At December 31, 2021 | At December 31, 2023 | At December 31, 2022 | |||||||||||||||||||||||||||||
Carrying Value | As a percent of total investment securities | Carrying Value | As a percent of total investment securities | Carrying Value | As a percent of total investment securities | Carrying Value | As a percent of total investment securities | |||||||||||||||||||||||||
($ in thousands) | ($ in thousands) | |||||||||||||||||||||||||||||||
Securities of U.S. Government sponsored entities | $ | 290,853 | 6 | % | $ | - | - | % | $ | 294,919 | 6 | % | $ | 290,853 | 6 | % | ||||||||||||||||
Agency residential mortgage-backed securities ("MBS") | 390,900 | 7 | % | 559,358 | 11 | % | 318,019 | 7 | % | 390,900 | 7 | % | ||||||||||||||||||||
Obligations of states and political subdivisions | 171,212 | 3 | % | 251,933 | 5 | % | 142,465 | 3 | % | 171,212 | 3 | % | ||||||||||||||||||||
Corporate securities | 2,821,809 | 54 | % | 2,746,735 | 56 | % | 2,638,198 | 54 | % | 2,821,809 | 54 | % | ||||||||||||||||||||
Collateralized loan obligations | 1,572,883 | 30 | % | 1,386,355 | 28 | % | 1,484,597 | 30 | % | 1,572,883 | 30 | % | ||||||||||||||||||||
Other | - | - | % | 877 | - | % | ||||||||||||||||||||||||||
Total | $ | 5,247,657 | 100 | % | $ | 4,945,258 | 100 | % | $ | 4,878,198 | 100 | % | $ | 5,247,657 | 100 | % | ||||||||||||||||
Debt securities available for sale | $ | 4,331,743 | $ | 4,638,855 | $ | 3,999,801 | $ | 4,331,743 | ||||||||||||||||||||||||
Debt securities held to maturity | 915,914 | 306,403 | 878,397 | 915,914 | ||||||||||||||||||||||||||||
Total | $ | 5,247,657 | $ | 4,945,258 | $ | 4,878,198 | $ | 5,247,657 | ||||||||||||||||||||||||
Management continually evaluates the Company’s investment securities portfolio in response to established asset/liability management objectives, changing market conditions that could affect profitability, liquidity, and the level of interest rate risk to which the Company is exposed. These evaluations may cause Management to change the level of funds the Company deploys into investment securities and change the composition of the Company’s investment securities portfolio.
At December 31, 2022,2023, substantially all of the Company’s investment securities were investment grade as rated by one or more major rating agencies.agency. In addition to monitoring credit rating agency evaluations, Management performs its own evaluations regarding the credit worthiness of the issuer or the securitized assets underlying asset-backed securities. The Company’s procedures for evaluating investments in securities are in accordance with guidance issued by the Board of Governors of the Federal Reserve System, “Investing in Securities without Reliance on Nationally Recognized Statistical Rating Agencies” (SR 12-15) and other regulatory guidance.
The Company had no marketable equity securities at December 31, 2022 and December 31, 2021.
The following table shows the fair value carrying amount of the Company’s equity securities and debt securities available for sale as of the dates indicated:
At December 31, | At December 31, | |||||||||||||||||||||||
2022 | 2021 | 2020 | 2023 | 2022 | 2021 | |||||||||||||||||||
(In thousands) | (In thousands) | |||||||||||||||||||||||
Debt securities available for sale: | ||||||||||||||||||||||||
Securities of U.S. Government sponsored entities | $ | 290,853 | $ | - | $ | - | $ | 294,919 | $ | 290,853 | $ | - | ||||||||||||
Agency residential MBS | 286,048 | 411,726 | 652,952 | 239,454 | 286,048 | 411,726 | ||||||||||||||||||
Securities of U.S. Government entities | - | 119 | 154 | - | - | 119 | ||||||||||||||||||
Obligations of states and political subdivisions | 82,004 | 93,920 | 111,010 | 71,283 | 82,004 | 93,920 | ||||||||||||||||||
Corporate securities | 2,099,955 | 2,746,735 | 2,117,978 | 1,909,548 | 2,099,955 | 2,746,735 | ||||||||||||||||||
Commercial paper | - | - | 24,990 | |||||||||||||||||||||
Collateralized Loan Obligations | 1,572,883 | 1,386,355 | 1,156,101 | |||||||||||||||||||||
Collateralized loan obligations | 1,484,597 | 1,572,883 | 1,386,355 | |||||||||||||||||||||
Total debt securities available for sale | $ | 4,331,743 | $ | 4,638,855 | $ | 4,063,185 | $ | 3,999,801 | $ | 4,331,743 | $ | 4,638,855 | ||||||||||||
The following table sets forth the relative maturities and contractual yields of the Company’s debt securities available for sale (stated at fair value) at December 31, 2022.2023. Yields on state and political subdivision securities have been calculated on a fully taxable equivalent basis using the current federal statutory rate. Mortgage-backedCollateralized loan obligations and mortgage-backed securities are shown separately because they are typically paid in quarterly and monthly installments, respectively, over a number of years.
Debt Securities Available for Sale Maturity Distribution
At December 31, 2022 | At December 31, 2023 | |||||||||||||||||||||||||||||||||||||||||||
Within one year | After one but | After five but | After ten years | Mortgage- backed | Total | Within one year | After one but | After five but | CLO and Mortgage- backed | Total | ||||||||||||||||||||||||||||||||||
($ in thousands) | ($ in thousands) | |||||||||||||||||||||||||||||||||||||||||||
Securities of U.S. Government sponsored entities | $ | - | $ | 16,619 | $ | 274,234 | $ | - | $ | - | $ | 290,853 | $ | - | $ | 16,654 | $ | 278,265 | $ | - | $ | 294,919 | ||||||||||||||||||||||
Interest rate | - | % | 4.13 | % | 3.49 | % | - | % | - | % | 3.63 | % | - | % | 4.12 | % | 3.48 | % | - | % | 3.60 | % | ||||||||||||||||||||||
Obligations of states and political subdivisions | 8,795 | 31,406 | 41,803 | - | - | 82,004 | 7,244 | 28,602 | 35,437 | - | 71,283 | |||||||||||||||||||||||||||||||||
Interest rate | 3.15 | % | 3.25 | % | 2.96 | % | - | % | - | % | 3.04 | % | 2.92 | % | 3.12 | % | 2.99 | % | - | % | 3.04 | % | ||||||||||||||||||||||
Corporate securities | 241,522 | 500,762 | 1,357,671 | - | - | 2,099,955 | 45,113 | 675,923 | 1,188,512 | - | 1,909,548 | |||||||||||||||||||||||||||||||||
Interest rate | 3.08 | % | 3.47 | % | 2.57 | % | - | % | - | % | 2.80 | % | 4.02 | % | 3.26 | % | 2.49 | % | - | % | 2.76 | % | ||||||||||||||||||||||
Collaterized loan obligations | - | 5,809 | 896,451 | 670,623 | - | 1,572,883 | ||||||||||||||||||||||||||||||||||||||
Subtotal | 52,357 | 721,179 | 1,502,214 | - | 2,275,750 | |||||||||||||||||||||||||||||||||||||||
Interest rate | - | % | 5.99 | % | 5.83 | % | 5.84 | % | - | % | 5.83 | % | 3.87 | % | 3.27 | % | 2.69 | % | - | % | 2.88 | % | ||||||||||||||||||||||
Subtotal | 250,317 | 554,596 | 2,570,159 | 670,623 | - | 4,045,695 | ||||||||||||||||||||||||||||||||||||||
Collaterized loan obligations (CLO) | - | - | - | 1,484,597 | 1,484,597 | |||||||||||||||||||||||||||||||||||||||
Interest rate | 3.09 | % | 3.51 | % | 3.81 | % | 5.84 | % | - | % | 4.04 | % | - | % | - | % | - | % | 7.28 | % | 7.28 | % | ||||||||||||||||||||||
MBS | - | - | - | - | 286,048 | 286,048 | - | - | - | 239,454 | 239,454 | |||||||||||||||||||||||||||||||||
Interest rate | - | % | - | % | - | % | - | % | 2.41 | % | 2.41 | % | - | % | - | % | - | % | 2.45 | % | 2.45 | % | ||||||||||||||||||||||
Total | $ | 250,317 | $ | 554,596 | $ | 2,570,159 | $ | 670,623 | $ | 286,048 | $ | 4,331,743 | $ | 52,357 | $ | 721,179 | $ | 1,502,214 | $ | 1,724,051 | $ | 3,999,801 | ||||||||||||||||||||||
Interest rate | 3.09 | % | 3.51 | % | 3.81 | % | 5.84 | % | 2.41 | % | 3.85 | % | 3.87 | % | 3.27 | % | 2.69 | % | 6.60 | % | 4.40 | % | ||||||||||||||||||||||
The following table shows the amortized cost carrying amount and fair value before related reserve for expected credit losses of $1 thousand at December 31, 2023 and December 31, 2022, and $7 thousand at December 31, 2021, and $9 thousand at December 31, 2020, of the Company’s debt securities held to maturity as of the dates indicated:
At December 31, | At December 31, | |||||||||||||||||||||||
2022 | 2021 | 2020 | 2023 | 2022 | 2021 | |||||||||||||||||||
(In thousands) | (In thousands) | |||||||||||||||||||||||
Agency residential MBS | $ | 104,852 | $ | 148,390 | $ | 241,676 | $ | 78,565 | $ | 104,852 | $ | 148,390 | ||||||||||||
Obligations of states and political subdivisions | 89,208 | 158,013 | 273,922 | 71,182 | 89,208 | 158,013 | ||||||||||||||||||
Corporate securities | 721,854 | - | - | 728,650 | 721,854 | - | ||||||||||||||||||
Total | $ | 915,914 | $ | 306,403 | $ | 515,598 | $ | 878,397 | $ | 915,914 | $ | 306,403 | ||||||||||||
Fair value | $ | 873,511 | $ | 312,562 | $ | 529,687 | $ | 849,562 | $ | 873,511 | $ | 312,562 | ||||||||||||
The following table sets forth the relative maturities and contractual yields of the Company’s debt securities held to maturity at December 31, 2022.2023. Yields on state and political subdivision securities have been calculated on a fully taxable equivalent basis using the current federal statutory rate. Mortgage-backed securities are shown separately because they are typically paid in monthly installments over a number of years.
Debt Securities Held to Maturity Maturity Distribution
At December 31, 2022 | At December 31, 2023 | |||||||||||||||||||||||||||||||||||||||||||||||
Within one year | After one but | After five but within ten | After ten years | Mortgage- backed | Total | Within one year | After one but | After five but within ten | After ten years | Mortgage- backed | Total | |||||||||||||||||||||||||||||||||||||
($ in thousands) | ($ in thousands) | |||||||||||||||||||||||||||||||||||||||||||||||
Obligations of states and political subdivisions | $ | 12,676 | $ | 74,465 | $ | 2,067 | $ | - | $ | - | $ | 89,208 | $ | 15,117 | $ | 55,359 | $ | 706 | $ | - | $ | - | $ | 71,182 | ||||||||||||||||||||||||
Interest rate | 3.84 | % | 3.49 | % | 4.00 | % | - | % | - | % | 3.54 | % | 3.57 | % | 3.51 | % | 4.08 | % | - | % | - | % | 3.54 | % | ||||||||||||||||||||||||
Corporate securities | - | 87,188 | 634,666 | - | - | 721,854 | - | 257,488 | 471,162 | - | - | 728,650 | ||||||||||||||||||||||||||||||||||||
Interest rate | - | % | 4.08 | % | 4.36 | % | - | % | - | % | 4.33 | % | - | % | 4.17 | % | 4.32 | % | - | % | - | % | 4.29 | % | ||||||||||||||||||||||||
Subtotal | 12,676 | 161,653 | 636,733 | - | - | 811,062 | 15,117 | 312,847 | 471,868 | - | - | 799,832 | ||||||||||||||||||||||||||||||||||||
Interest rate | 3.84 | % | 3.81 | % | 4.36 | % | - | % | - | % | 4.24 | % | 3.57 | % | 4.05 | % | 4.32 | % | - | % | - | % | 4.22 | % | ||||||||||||||||||||||||
MBS | - | - | - | - | 104,852 | 104,852 | - | - | - | - | 78,565 | 78,565 | ||||||||||||||||||||||||||||||||||||
Interest rate | - | % | - | % | - | % | - | % | 2.09 | % | 2.09 | % | - | % | - | % | - | % | - | % | 2.25 | % | 2.25 | % | ||||||||||||||||||||||||
Total | $ | 12,676 | $ | 161,653 | $ | 636,733 | $ | - | $ | 104,852 | $ | 915,914 | $ | 15,117 | $ | 312,847 | $ | 471,868 | $ | - | $ | 78,565 | $ | 878,397 | ||||||||||||||||||||||||
Interest rate | 3.84 | % | 3.81 | % | 4.36 | % | - | % | 2.09 | % | 3.99 | % | 3.57 | % | 4.05 | % | 4.32 | % | - | % | 2.25 | % | 4.04 | % | ||||||||||||||||||||||||
The Company had corporate securities as shown below at the dates indicated:
Corporate securities | Corporate securities | |||||||||||||||||||||||||||||||
At December 31, 2022 | At December 31, 2021 | At December 31, 2023 | At December 31, 2022 | |||||||||||||||||||||||||||||
Amortized | Fair | Amortized | Fair | Amortized | Fair | Amortized | Fair | |||||||||||||||||||||||||
Cost | Value | Cost | Value | Cost | Value | Cost | Value | |||||||||||||||||||||||||
(In thousands) | (In thousands) | |||||||||||||||||||||||||||||||
Debt securities available for sale | $ | 2,406,566 | $ | 2,099,955 | $ | 2,692,792 | $ | 2,746,735 | $ | 2,129,103 | $ | 1,909,548 | $ | 2,406,566 | $ | 2,099,955 | ||||||||||||||||
Debt securities held to maturity | 721,854 | 687,406 | - | - | 728,650 | 705,356 | 721,854 | 687,406 | ||||||||||||||||||||||||
Total corporate securities | $ | 3,128,420 | $ | 2,787,361 | $ | 2,692,792 | $ | 2,746,735 | $ | 2,857,753 | $ | 2,614,904 | $ | 3,128,420 | $ | 2,787,361 | ||||||||||||||||
The following table summarizes total corporate securities by credit rating:
At December 31, 2022 | At December 31, 2021 | At December 31, 2023 | At December 31, 2022 | |||||||||||||||||||||||||||||
Fair value | As a percent of total corporate securities | Fair value | As a percent of total corporate securities | Fair value | As a percent of total corporate securities | Fair value | As a percent of total corporate securities | |||||||||||||||||||||||||
($ in thousands) | ($ in thousands) | |||||||||||||||||||||||||||||||
AAA | $ | 20,667 | 1 | % | $ | 21,400 | 1 | % | $ | - | - | % | $ | 20,667 | 1 | % | ||||||||||||||||
AA+ | 19,840 | 1 | % | 20,479 | 1 | % | - | - | % | 19,840 | 1 | % | ||||||||||||||||||||
AA | 19,234 | 1 | % | 19,781 | 1 | % | - | - | % | 19,234 | 1 | % | ||||||||||||||||||||
AA- | 110,552 | 4 | % | 105,373 | 4 | % | 73,016 | 3 | % | 110,552 | 4 | % | ||||||||||||||||||||
A+ | 255,381 | 9 | % | 128,325 | 5 | % | 250,322 | 9 | % | 255,381 | 9 | % | ||||||||||||||||||||
A | 503,437 | 18 | % | 539,062 | 19 | % | 380,257 | 14 | % | 503,437 | 18 | % | ||||||||||||||||||||
A- | 695,865 | 25 | % | 628,089 | 23 | % | 825,882 | 32 | % | 695,865 | 25 | % | ||||||||||||||||||||
BBB+ | 821,102 | 29 | % | 797,860 | 29 | % | 723,767 | 28 | % | 821,102 | 29 | % | ||||||||||||||||||||
BBB | 304,957 | 11 | % | 474,648 | 17 | % | 361,660 | 14 | % | 304,957 | 11 | % | ||||||||||||||||||||
BBB- | 36,326 | 1 | % | 11,718 | - | % | - | - | % | 36,326 | 1 | % | ||||||||||||||||||||
Total corporate securities | $ | 2,787,361 | 100 | % | $ | 2,746,735 | 100 | % | $ | 2,614,904 | 100 | % | $ | 2,787,361 | 100 | % | ||||||||||||||||
[The remainder of this page intentionally left blank]
The following table summarizes total corporate securities by the industry sector in which the issuing companies operate:
At December 31, 2022 | At December 31, 2021 | At December 31, 2023 | At December 31, 2022 | |||||||||||||||||||||||||||||
Fair value | As a percent of total corporate securities | Fair value | As a percent of total corporate securities | Fair value | As a percent of total corporate securities | Fair value | As a percent of total corporate securities | |||||||||||||||||||||||||
($ in thousands) | ($ in thousands) | |||||||||||||||||||||||||||||||
Financial | $ | 1,539,361 | 55 | % | $ | 1,421,317 | 52 | % | $ | 1,516,147 | 58 | % | $ | 1,539,361 | 55 | % | ||||||||||||||||
Utilities | 285,016 | 10 | % | 208,522 | 7 | % | 274,929 | 10 | % | 285,016 | 10 | % | ||||||||||||||||||||
Industrial | 237,554 | 9 | % | 217,065 | 8 | % | 215,428 | 8 | % | 237,554 | 9 | % | ||||||||||||||||||||
Consumer, Non-cyclical | 173,736 | 6 | % | 271,069 | 10 | % | 170,423 | 7 | % | 173,736 | 6 | % | ||||||||||||||||||||
Communications | 162,270 | 6 | % | 161,537 | 6 | % | 158,495 | 6 | % | 162,270 | 6 | % | ||||||||||||||||||||
Consumer, Cyclical | 103,666 | 4 | % | 125,686 | 4 | % | ||||||||||||||||||||||||||
Technology | 101,255 | 4 | % | 127,853 | 5 | % | ||||||||||||||||||||||||||
Basic Materials | 98,072 | 3 | % | 114,964 | 4 | % | 100,693 | 4 | % | 98,072 | 3 | % | ||||||||||||||||||||
Energy | 86,431 | 3 | % | 98,722 | 4 | % | 69,331 | 3 | % | 86,431 | 3 | % | ||||||||||||||||||||
Technology | 63,185 | 2 | % | 101,255 | 4 | % | ||||||||||||||||||||||||||
Consumer, Cyclical | 46,273 | 2 | % | 103,666 | 4 | % | ||||||||||||||||||||||||||
Total corporate securities | $ | 2,787,361 | 100 | % | $ | 2,746,735 | 100 | % | $ | 2,614,904 | 100 | % | $ | 2,787,361 | 100 | % | ||||||||||||||||
The following table summarizes total corporate securities by the location of the issuers’ headquarters; all the bonds are denominated in United States dollars:
At December 31, 2022 | At December 31, 2023 | At December 31, 2022 | ||||||||||||||||||||||
Fair value | As a percent of total corporate securities | Fair value | As a percent of total corporate securities | Fair value | As a percent of total corporate securities | |||||||||||||||||||
($ in thousands) | ($ in thousands) | |||||||||||||||||||||||
United States of America | $ | 1,997,328 | 72 | % | $ | 1,811,463 | 69 | % | $ | 1,997,328 | 72 | % | ||||||||||||
Canada | 192,475 | 7 | % | 195,979 | 7 | % | 192,475 | 7 | % | |||||||||||||||
Japan | 164,948 | 6 | % | 161,804 | 6 | % | ||||||||||||||||||
United Kingdom | 171,819 | 6 | % | 162,794 | 6 | % | 171,819 | 6 | % | |||||||||||||||
Japan | 161,804 | 6 | % | |||||||||||||||||||||
Switzerland | 93,898 | 4 | % | 86,396 | 3 | % | ||||||||||||||||||
France | 87,781 | 3 | % | 91,726 | 4 | % | 87,781 | 3 | % | |||||||||||||||
Switzerland | 86,396 | 3 | % | |||||||||||||||||||||
Netherlands | 33,216 | 1 | % | 35,381 | 1 | % | 33,216 | 1 | % | |||||||||||||||
Australia | 23,870 | 1 | % | 24,800 | 1 | % | 23,870 | 1 | % | |||||||||||||||
Belgium | 20,243 | 1 | % | 20,894 | 1 | % | 20,243 | 1 | % | |||||||||||||||
Germany | 12,429 | - | % | 13,021 | 1 | % | 12,429 | - | % | |||||||||||||||
Total corporate securities | $ | 2,787,361 | 100 | % | $ | 2,614,904 | 100 | % | $ | 2,787,361 | 100 | % | ||||||||||||
The following table summarizes the above corporate securities with issuer’s headquarters located outside of the United States of America by the industry sector in which the issuing companies operate; all the bonds are denominated in United States dollars:
At December 31, 2022 | At December 31, 2023 | At December 31, 2022 | ||||||||||||||||||||||
Fair value | As a percent of total foreign corporate securities | Fair value | As a percent of total foreign corporate securities | Fair value | As a percent of total foreign corporate securities | |||||||||||||||||||
($ in thousands) | ($ in thousands) | |||||||||||||||||||||||
Financial | $ | 680,956 | 86 | % | $ | 702,892 | 87 | % | $ | 680,956 | 86 | % | ||||||||||||
Energy | 31,970 | 4 | % | 30,600 | 4 | % | ||||||||||||||||||
Basic materials | 24,800 | 3 | % | 23,870 | 3 | % | ||||||||||||||||||
Consumer, Non-cyclical | 32,684 | 4 | % | 20,895 | 3 | % | 32,684 | 4 | % | |||||||||||||||
Energy | 30,600 | 4 | % | |||||||||||||||||||||
Basic Materials | 23,870 | 3 | % | |||||||||||||||||||||
Consumer, Cyclical | 12,429 | 2 | % | 13,021 | 2 | % | 12,429 | 2 | % | |||||||||||||||
Utilities | 9,494 | 1 | % | 9,863 | 1 | % | 9,494 | 1 | % | |||||||||||||||
Total foreign corporate securities | $ | 790,033 | 100 | % | $ | 803,441 | 100 | % | $ | 790,033 | 100 | % | ||||||||||||
The Company’s $1.5 billion (fair value) in collateralized loan obligations at December 31, 2023, consist of investments in 142 issues that are within the senior tranches of their respective fund securitization structures. The following table summarizes total collateralized loan obligations by credit rating:
At December 31, 2023 | ||||||||
Amortized | Fair | |||||||
Cost | Value | |||||||
(In thousands) | ||||||||
AAA | $ | 536,185 | $ | 532,729 | ||||
AA | 965,063 | 951,868 | ||||||
Total | $ | 1,501,248 | $ | 1,484,597 | ||||
The Company’s $1.6 billion (fair value) in collateralized loan obligations at December 31, 2022, consist of investments in 169 issues that are within the senior tranches of their respective fund securitization structures. The following table summarizes total collateralized loan obligations by credit rating:
At December 31, 2022 | ||||||||
Amortized | Fair | |||||||
Cost | Value | |||||||
(In thousands) | ||||||||
AAA | $ | 559,239 | $ | 553,673 | ||||
AA | 1,028,087 | 1,019,210 | ||||||
Total | $ | 1,587,326 | $ | 1,572,883 | ||||
The following tables summarize the total general obligation and revenue bonds issued by states and political subdivisions held in the Company’s investment securities portfolios as of the dates indicated, identifying the state in which the issuing government municipality or agency operates.
At December 31, 2023, the Company’s investment securities portfolios included securities issued by 123 state and local government municipalities and agencies located within 31 states. The largest exposure to any one municipality or agency was $4.8 million (fair value) represented by two general obligation bonds.
At December 31, 2023 | ||||||||
Amortized | Fair | |||||||
Cost | Value | |||||||
(In thousands) | ||||||||
Obligations of states and political subdivisions: | ||||||||
General obligation bonds: | ||||||||
California | $ | 23,713 | $ | 23,562 | ||||
Washington | 10,999 | 10,937 | ||||||
Texas | 8,129 | 8,016 | ||||||
Massachusetts | 7,883 | 7,826 | ||||||
Michigan | 7,047 | 6,961 | ||||||
Other (22 states) | 56,020 | 55,067 | ||||||
Total general obligation bonds | $ | 113,791 | $ | 112,369 | ||||
Revenue bonds: | ||||||||
California | $ | 9,947 | $ | 9,777 | ||||
Kentucky | 5,054 | 5,039 | ||||||
Virginia | 3,651 | 3,614 | ||||||
Colorado | 3,157 | 3,150 | ||||||
Other (8 states) | 8,261 | 8,228 | ||||||
Total revenue bonds | $ | 30,070 | $ | 29,808 | ||||
Total obligations of states and political subdivisions | $ | 143,861 | $ | 142,177 | ||||
At December 31, 2022, the Company’s investment securities portfolios included securities issued by 142 state and local government municipalities and agencies located within 32 states. The largest exposure to any one municipality or agency was $4.8 million (fair value) represented by three general obligation bonds.
At December 31, 2022 | ||||||||
Amortized | Fair | |||||||
Cost | Value | |||||||
(In thousands) | ||||||||
Obligations of states and political subdivisions: | ||||||||
General obligation bonds: | ||||||||
California | $ | 34,621 | $ | 34,252 | ||||
Washington | 11,445 | 11,332 | ||||||
Texas | 8,561 | 8,405 | ||||||
Massachusetts | 8,214 | 8,073 | ||||||
Michigan | 7,126 | 7,017 | ||||||
Other (23 states) | 63,818 | 62,679 | ||||||
Total general obligation bonds | $ | 133,785 | $ | 131,758 | ||||
Revenue bonds: | ||||||||
California | $ | 13,917 | $ | 13,620 | ||||
Kentucky | 7,605 | 7,556 | ||||||
Virginia | 3,684 | 3,618 | ||||||
Colorado | 3,155 | 3,124 | ||||||
Washington | 2,070 | 2,068 | ||||||
Other (8 states) | 9,016 | 9,003 | ||||||
Total revenue bonds | $ | 39,447 | $ | 38,989 | ||||
Total obligations of states and political subdivisions | $ | 173,232 | $ | 170,747 | ||||
[The remainder of this page intentionally left blank]
At December 31, 2021, the Company’s investment securities portfolios included securities issued by 197 state2023 and local government municipalities and agencies located within 33 states. The largest exposure to any one municipality or agency was $7.4 million (fair value) represented by five general obligation bonds.
At December 31, 2021 | ||||||||
Amortized | Fair | |||||||
Cost | Value | |||||||
(In thousands) | ||||||||
Obligations of states and political subdivisions: | ||||||||
General obligation bonds: | ||||||||
California | $ | 48,332 | $ | 49,829 | ||||
Washington | 13,460 | 13,924 | ||||||
Texas | 11,653 | 12,024 | ||||||
Other (27 states) | 110,722 | 114,132 | ||||||
Total general obligation bonds | $ | 184,167 | $ | 189,909 | ||||
Revenue bonds: | ||||||||
California | $ | 14,912 | $ | 15,208 | ||||
Kentucky | 8,846 | 9,093 | ||||||
Virginia | 7,576 | 7,809 | ||||||
Colorado | 6,158 | 6,241 | ||||||
Indiana | 5,747 | 5,821 | ||||||
Other (12 states) | 20,714 | 20,934 | ||||||
Total revenue bonds | $ | 63,953 | $ | 65,106 | ||||
Total obligations of states and political subdivisions | $ | 248,120 | $ | 255,015 | ||||
At December 31, 2022, and December 31, 2021, the revenue bonds in the Company’s investment securities portfolios were issued by state and local government municipalities and agencies to fund public services such as water utility, sewer utility, recreational and school facilities, and general public and economic improvements. The revenue bonds were payable from 11 revenue sources at December 31, 20222023 and 14 revenue sources at December 31, 2021.2022. The revenue sources that represent 5% or more individually of the total revenue bonds are summarized in the following tables.
At December 31, 2022 | At December 31, 2023 | |||||||||||||||
Amortized | Fair | Amortized | Fair | |||||||||||||
Cost | Value | Cost | Value | |||||||||||||
(In thousands) | (In thousands) | |||||||||||||||
Revenue bonds by revenue source: | ||||||||||||||||
Water | $ | 6,105 | $ | 6,115 | ||||||||||||
Lease (renewal) | 5,590 | 5,536 | ||||||||||||||
Sewer | 5,523 | 5,480 | $ | 4,840 | $ | 4,828 | ||||||||||
Lease (appropriation) | 4,556 | 4,518 | 4,553 | 4,544 | ||||||||||||
Water | 4,028 | 4,025 | ||||||||||||||
Special Assessment | 4,080 | 3,788 | 3,695 | 3,516 | ||||||||||||
Lease (renewal) | 2,865 | 2,844 | ||||||||||||||
Lease (abatement) | 3,702 | 3,694 | 2,389 | 2,386 | ||||||||||||
Sales tax | 3,185 | 3,187 | ||||||||||||||
Other (4 sources) | 6,706 | 6,671 | ||||||||||||||
Appropriations | 1,984 | 1,954 | ||||||||||||||
Lease (non-terminable) | 1,930 | 1,926 | ||||||||||||||
Other (3 sources) | 3,786 | 3,785 | ||||||||||||||
Total revenue bonds by revenue source | $ | 39,447 | $ | 38,989 | $ | 30,070 | $ | 29,808 | ||||||||
[The remainder of this page intentionally left blank]
At December 31, 2021 | At December 31, 2022 | |||||||||||||||
Amortized | Fair | Amortized | Fair | |||||||||||||
Cost | Value | Cost | Value | |||||||||||||
(In thousands) | (In thousands) | |||||||||||||||
Revenue bonds by revenue source: | ||||||||||||||||
Water | $ | 10,123 | $ | 10,222 | $ | 6,105 | $ | 6,115 | ||||||||
Lease (renewal) | 5,590 | 5,536 | ||||||||||||||
Sewer | 8,525 | 8,828 | 5,523 | 5,480 | ||||||||||||
Sales tax | 8,203 | 8,304 | ||||||||||||||
Lease (renewal) | 6,969 | 7,175 | ||||||||||||||
Lease (abatement) | 6,922 | 7,010 | ||||||||||||||
Lease (appropriation) | 4,564 | 4,618 | 4,556 | 4,518 | ||||||||||||
Special Assessment | 4,080 | 4,197 | 4,080 | 3,788 | ||||||||||||
Intergovernmental Agreement | 3,860 | 3,926 | ||||||||||||||
Other (6 sources) | 10,707 | 10,826 | ||||||||||||||
Lease (abatement) | 3,702 | 3,694 | ||||||||||||||
Sales tax | 3,185 | 3,187 | ||||||||||||||
Other (4 sources) | 6,706 | 6,671 | ||||||||||||||
Total revenue bonds by revenue source | $ | 63,953 | $ | 65,106 | $ | 39,447 | $ | 38,989 | ||||||||
See Note 2 to the consolidated financial statements for additional information related to the investment securities.
Loan Portfolio
The Company originates loans with the intent to hold such assets until principal is repaid. Management follows written loan underwriting policies and procedures which are approved by the Bank’s Board of Directors. Loans are underwritten following approved underwriting standards and lending authorities within a formalized organizational structure. The Board of Directors also approves independent real estate appraisers to be used in obtaining estimated values for real property serving as loan collateral. Prevailing economic trends and conditions are also taken into consideration in loan underwriting practices.
All loan applications must be for clearly defined legitimate purposes with a determinable primary source of repayment, and as appropriate, secondary sources of repayment. All loans are supported by appropriate documentation such as current financial statements, tax returns, credit reports, collateral information, guarantor asset verification, title reports, appraisals, and other relevant documentation.
During 2020 and the first six months of 2021, the Bank processed customer PPPPayment Protection Program (“PPP”) loan applications as established by the Coronavirus Aid, Relief, and Economic Security Act (the “CARES Act”). The United States Small Business Administration guarantees PPP loans; given this guarantee, the PPP loans are not considered to have default risk. PPP loans, net of deferred fees and costs, were $586 thousand at December 31, 2022 and $46 million at December 31, 2021.
Commercial loans represent term loans used to acquire durable business assets or revolving lines of credit used to finance working capital. Underwriting practices evaluate each borrower’s cash flow as the principal source of loan repayment. Commercial loans are generally secured by the borrower’s business assets as a secondary source of repayment. Commercial loans are evaluated for credit-worthiness based on prior loan performance and borrower financial information including cash flow, borrower net worth and aggregate debt. PPP loans are included in commercial loans.
Commercial real estate loans represent term loans used to acquire or refinance real estate to be operated by the borrower in a commercial capacity. Underwriting practices evaluate each borrower’s global cash flow as the principal source of loan repayment, independent appraisal of value of the property, and other relevant factors. Commercial real estate loans are generally secured by a first lien on the property as a secondary source of repayment.
Real estate construction loans represent the financing of real estate development. Loan principal disbursements are controlled through the use of project budgets, and disbursements are approved based on construction progress, which is validated by project site inspections. A first lien on the real estate serves as collateral to secure the loan.
Residential real estate loans generally represent first lien mortgages used by the borrower to purchase or refinance a principal residence. For interest-rate risk purposes, the Company offers only fully-amortizing, adjustable-rate mortgages. In underwriting first lien mortgages, the Company evaluates each borrower’s ability to repay the loan, an independent appraisal of the value of the property, and other relevant factors. The Company does not offer riskier mortgage products, such as non-amortizing “interest-only” mortgages and “negative amortization” mortgages.
For loans secured by real estate, the Bank requires title insurance to insure the status of its lien and each borrower is obligated to insure the real estate collateral, naming the Company as loss payee, in an amount sufficient to repay the principal amount outstanding in the event of a property casualty loss.
Consumer installment and other loans are predominantly comprised of indirect automobile loans with underwriting based on credit history and scores, personal income, debt service capacity, and collateral values.
Loan volumes have declined due to payoffs and problem loan workout activities, particularly with purchased loans, and reduced volumes of loan originations. The Company did not take an aggressive posture relative to loan portfolio growth during the post-recession period of historically low interest rates. Management increased investment securities as loan volumes declined.
The following table shows the composition of the loan portfolio of the Company by type of loan and type of borrower, on the dates indicated:
Loan Portfolio
At December 31, | At December 31, | |||||||||||||||||||||||||||||||||||||||
2022 | 2021 | 2020 | 2019 | 2018 | 2023 | 2022 | 2021 | 2020 | 2019 | |||||||||||||||||||||||||||||||
(In thousands) | (In thousands) | |||||||||||||||||||||||||||||||||||||||
PPP loans | $ | 586 | $ | 45,888 | $ | 186,945 | $ | - | $ | - | ||||||||||||||||||||||||||||||
Other commercial | 169,031 | 187,202 | 207,861 | 222,085 | 275,080 | |||||||||||||||||||||||||||||||||||
Total commercial | 169,617 | 233,090 | 394,806 | 222,085 | 275,080 | |||||||||||||||||||||||||||||||||||
Commercial | $ | 136,550 | $ | 169,617 | $ | 233,090 | $ | 394,806 | $ | 222,085 | ||||||||||||||||||||||||||||||
Commercial real estate | 491,107 | 535,261 | 564,300 | 578,758 | 580,480 | 487,523 | 491,107 | 535,261 | 564,300 | 578,758 | ||||||||||||||||||||||||||||||
Construction | 3,088 | 48 | 129 | 1,618 | 3,982 | 5,063 | 3,088 | 48 | 129 | 1,618 | ||||||||||||||||||||||||||||||
Residential real estate | 13,834 | 18,133 | 23,471 | 32,748 | 44,866 | 9,935 | 13,834 | 18,133 | 23,471 | 32,748 | ||||||||||||||||||||||||||||||
Consumer installment and other | 280,842 | 281,594 | 273,537 | 291,455 | 302,794 | 227,531 | 280,842 | 281,594 | 273,537 | 291,455 | ||||||||||||||||||||||||||||||
Total loans | $ | 958,488 | 1,068,126 | 1,256,243 | 1,126,664 | 1,207,202 | $ | 866,602 | $ | 958,488 | $ | 1,068,126 | $ | 1,256,243 | $ | 1,126,664 | ||||||||||||||||||||||||
The following table shows the maturity distribution and interest rate sensitivity of loans at December 31, 2022.2023. There were no loans with a remaining maturity of over fifteen years as of December 31, 2022.2023.
Loan Maturity Distribution
At December 31, 2022 | At December 31, 2023 | |||||||||||||||||||||||||||||||
Within One Year | One to Five Years | Five to Fifteen Years | Total | Within One Year | One to Five Years | Five to Fifteen Years | Total | |||||||||||||||||||||||||
(In thousands) | (In thousands) | |||||||||||||||||||||||||||||||
Commercial | $ | 54,580 | $ | 62,705 | $ | 52,332 | $ | 169,617 | $ | 42,122 | $ | 65,815 | $ | 28,613 | $ | 136,550 | ||||||||||||||||
Commercial real estate | 95,529 | 216,927 | 178,651 | 491,107 | 99,789 | 229,763 | 157,971 | 487,523 | ||||||||||||||||||||||||
Construction | 3,088 | - | - | 3,088 | 5,063 | - | - | 5,063 | ||||||||||||||||||||||||
Residential real estate | 4,187 | 5,681 | 3,966 | 13,834 | 3,202 | 4,109 | 2,624 | 9,935 | ||||||||||||||||||||||||
Consumer and other installment | 78,440 | 188,050 | 14,352 | 280,842 | 67,778 | 152,413 | 7,340 | 227,531 | ||||||||||||||||||||||||
Total | $ | 235,824 | $ | 473,363 | $ | 249,301 | $ | 958,488 | $ | 217,954 | $ | 452,100 | $ | 196,548 | $ | 866,602 | ||||||||||||||||
Loans with fixed interest rates | 147,496 | 246,411 | 15,849 | 409,756 | 138,085 | 209,073 | 7,160 | 354,318 | ||||||||||||||||||||||||
Loans with floating or adjustable interest rates | 88,328 | 226,952 | 233,452 | 548,732 | 79,869 | 243,027 | 189,388 | 512,284 | ||||||||||||||||||||||||
Total | $ | 235,824 | $ | 473,363 | $ | 249,301 | $ | 958,488 | $ | 217,954 | $ | 452,100 | $ | 196,548 | $ | 866,602 | ||||||||||||||||
Commitments and Letters of Credit
The Company issues formal commitments on lines of credit to well-established and financially responsible commercial enterprises. Such commitments can be either secured or unsecured and are typically in the form of revolving lines of credit for seasonal working capital needs. Occasionally, such commitments are in the form of letters of credit to facilitate the customers’ particular business transactions. Commitment fees are generally charged for commitments and letters of credit. Commitments on lines of credit and letters of credit typically mature within one year. For further information, see the accompanying notes to the consolidated financial statements.
[The remainder of this page intentionally left blank]
Loan Portfolio Credit Risk
The Company extends loans to commercial and consumer customers which expose the Company to the risk that the borrowers will default, causing loss. The Company’s lending activities are exposed to various qualitative risks. All loan segments are exposed to risks inherent in the economy and market conditions. Significant risk characteristics related to the commercial loan segment include the borrowers’ business performance and financial condition, and the value of collateral for secured loans. Significant risk characteristics related to the commercial real estate segment include the borrowers’ business performance and the value of properties collateralizing the loans. Significant risk characteristics related to the construction loan segment include the borrowers’ performance in successfully developing the real estate into the intended purpose and the value of the property collateralizing the loans. Significant risk characteristics related to the residential real estate segment include the borrowers’ financial wherewithal to service the mortgages and the value of the property collateralizing the loans. Significant risk characteristics related to the consumer loan segment include the financial condition of the borrowers and the value of collateral securing the loans.
During 2020 and the first six months of 2021, the Bank processed customer PPP loan applications pursuant to the CARES Act. The United States Small Business Administration guarantees PPP loans; given this guarantee, the PPP loans are not considered to have default risk and do not carry an allowance for credit losses. The outstanding balances of PPP loans, net of deferred fees and costs, were $586 thousand at December 31, 2022.
The preparation of the financial statements requires Management to estimate the amount of expected losses in the loan portfolio and establish an allowance for credit losses. The allowance for credit losses is maintained by assessing or reversing a provision for credit losses through the Company’s earnings. In estimating credit losses, Management must exercise judgment in evaluating information deemed relevant, such as financial information regarding individual borrowers, overall loss experience, the amount of past due, nonperforming and classified loans, recommendations of regulatory authorities, prevailing economic conditions and other information. The amount of ultimate losses on the loan portfolio can vary from the estimated amounts. Management follows a systematic methodology to estimate loss potential in an effort to reduce the differences between estimated and actual losses.
The Company closely monitors the markets in which it conducts its lending operations and follows a strategy to control exposure to loans with high credit risk. The Bank’s organizationorganizational structure separates the functions of business development and loan underwriting; Management believes this segregation of duties avoids inherent conflicts of combining business development and loan approval functions. In measuring and managing credit risk, the Company adheres to the following practices:
● | The Bank maintains a Loan Review Department which reports directly to the audit committee of the Board of Directors. The Loan Review Department performs independent evaluations of loans to challenge the credit risk grades assigned by Management, using grading standards employed by bank regulatory agencies. Those loans judged to carry higher risk attributes are referred to as “classified loans.” Classified loans receive elevated Management attention in order to maximize collection. | |
● | The Bank maintains two loan administration offices whose sole responsibility is to manage and collect classified loans. |
Classified loans with higher levels of credit risk are further designated as “nonaccrual loans.” Management places classified loans on nonaccrual status when full collection of contractual interest and principal payments is in doubt. Uncollected interest previously accrued on loans placed on nonaccrual status is reversed as a charge against interest income. The Company does not accrue interest income on loans following placement on nonaccrual status. Interest payments received on nonaccrual loans are applied to reduce the carrying amount of the loan unless the carrying amount is well secured by loan collateral. “Nonperforming assets” include nonaccrual loans, loans 90 or more days past due and still accruing, and repossessed loan collateral (commonly referred to as “Other Real Estate Owned”).
[The remainder of this page intentionally left blank]Nonperforming Loans
Nonperforming Assets | ||||||||||||||||||||||||||||||||||||||||
At December 31, | At December 31, | |||||||||||||||||||||||||||||||||||||||
2022 | 2021 | 2020 | 2019 | 2018 | 2023 | 2022 | 2021 | 2020 | 2019 | |||||||||||||||||||||||||||||||
(In thousands) | (In thousands) | |||||||||||||||||||||||||||||||||||||||
Nonperforming nonaccrual loans | $ | 146 | $ | 265 | $ | 526 | $ | 659 | $ | 998 | $ | 401 | $ | 146 | $ | 265 | $ | 526 | $ | 659 | ||||||||||||||||||||
Performing nonaccrual loans | - | 427 | 3,803 | 3,781 | 3,870 | 2 | - | 427 | 3,803 | 3,781 | ||||||||||||||||||||||||||||||
Total nonaccrual loans | 146 | 692 | 4,329 | 4,440 | 4,868 | 403 | 146 | 692 | 4,329 | 4,440 | ||||||||||||||||||||||||||||||
Accruing loans 90 or more days past due | 628 | 339 | 450 | 440 | 551 | 388 | 628 | 339 | 450 | 440 | ||||||||||||||||||||||||||||||
Total nonperforming loans | 774 | 1,031 | 4,779 | 4,880 | 5,419 | 791 | 774 | 1,031 | 4,779 | 4,880 | ||||||||||||||||||||||||||||||
Other real estate owned | - | - | - | 43 | 350 | - | - | - | - | 43 | ||||||||||||||||||||||||||||||
Total nonperforming assets | $ | 774 | $ | 1,031 | $ | 4,779 | $ | 4,923 | $ | 5,769 | $ | 791 | $ | 774 | $ | 1,031 | $ | 4,779 | $ | 4,923 | ||||||||||||||||||||
At December 31, 2022,2023, nonaccrual loans consisted of sixfour loans with an average carrying value of $24$101 thousand and the largest carrying value was $192 thousand.
Management believes the overall credit quality of the loan portfolio is reasonably stable; however, classified and nonperforming assets could fluctuate from period to period. The performance of any individual loan can be affected by external factors such as the interest rate environment, economic conditions, pandemics, and collateral values or factors particular to the borrower. No assurance can be given that additional increases in nonaccrual and delinquent loans will not occur in the future.
Allowance for Credit Losses
The following table summarizes allowance for credit losses at the dates indicated:
At December 31, | ||||||||
2022 | 2021 | |||||||
(In thousands) | ||||||||
Allowance for Credit Losses on Loans | $ | 20,284 | $ | 23,514 | ||||
Allowance for Credit Losses on Held to Maturity Debt Securities | 1 | 7 | ||||||
Total Allowance for Credit Losses | $ | 20,285 | $ | 23,521 | ||||
Allowance for unfunded credit commitments | $ | 201 | $ | 201 | ||||
At December 31, | ||||||||
2023 | 2022 | |||||||
(In thousands) | ||||||||
Allowance for credit losses on loans | $ | 16,867 | $ | 20,284 | ||||
Allowance for credit losses on held to maturity debt securities | 1 | 1 | ||||||
Total allowance for credit losses | $ | 16,868 | $ | 20,285 | ||||
Allowance for unfunded credit commitments | $ | 201 | $ | 201 | ||||
Allowance for Credit Losses on Debt Securities Held to Maturity
Management segmented debt securities held to maturity, selected methods to estimate losses for each segment, and measured a loss estimate. Agency mortgage-backed securities were assigned no credit loss allowance due to the perceived backing of government sponsored entities. Corporate securities held to maturity were individually evaluated for expected credit loss by evaluating the issuer’s financial condition, profitability, cash flows, and credit ratings. The Company has evaluated each issuer’s historical financial performance and ability to service debt payments throughout and following the 2008-2009 recession. The Company has an expectation that nonpayment of the amortized cost basis continues to be zero. At December 31, 2022,2023, no credit loss allowance was assigned to corporate securities held to maturity.maturity based on evaluation of each individual issuer’s historical financial performance throughout full business cycles. Municipal securities were evaluated for risk of default based on credit rating and remaining term to maturity using Moody’s risk of default factors; Moody’s loss upon default factors were applied to the assumed defaulted principal amounts to estimate the amount for credit loss allowance. Allowance for credit losses related to debt securities held to maturity was $1 thousand credit loss related to municipal securities at December 31, 20222023 and $7 thousand at December 31, 2021,2022, reflecting the expected credit losses on debt securities held to maturity.
Allowance for Credit Losses on Loans
The Company’s allowance for credit losses on loans represents Management’s estimate of forecasted credit losses in the loan portfolio based on the current expected credit loss model. In evaluating credit risk for loans, Management measures the loss potential of the carrying value of loans. As described above, payments received on nonaccrual loans may be applied against the principal balance of the loans until such time as full collection of the remaining recorded balance is expected.
The Company extends loans to commercial and consumer customers primarily in Northern and Central California. These lending activities expose the Company to the risk borrowers will default, causing loan losses. The Company’s lending activities are exposed to various qualitative risks. All loan segments are exposed to risks inherent in the economy and market conditions. Significant risk characteristics related to the commercial loan segment include the borrowers’ business performance and financial condition, and the value of collateral for secured loans. Significant risk characteristics related to the commercial real estate segment include the borrowers’ business performance and the value of properties collateralizing the loans. Significant risk characteristics related to the construction loan segment include the borrowers’ performance in successfully developing the real estate into the intended purpose and the valuepreparation of the property collateralizing the loans. Significant risk characteristics related to the residential real estate segment include the borrowers’ financial wherewithal to service the mortgages and the value of the property collateralizing the loans. Significant risk characteristics related to the consumer loan segment include the financial condition of the borrowers and the value of collateral securing the loans.
The preparation of these financial statements requires Management to estimate the amount of expected losses over the expected contractual life of the Bank’s existing loan portfolio and establish an allowance for credit losses. Loan agreements generally include a maturity date, and the Company considers the contractual life of a loan agreement to extend from the date of origination to the contractual maturity date. In estimating credit losses, Management must exercise significant judgment in evaluating information deemed relevant. The amount of ultimate losses on the loan portfolio can vary from the estimated amounts. Management follows a systematic methodology to estimate loss potential in an effort to reduce the differences between estimated and actual losses.
The allowance for credit losses is established through provisions for credit losses charged to income. Losses on loans are charged to the allowance for credit losses when all or a portion of the recorded amount of a loan is deemed to be uncollectible. Recoveries of loans previously charged off are credited to the allowance when realized. The Company’s allowance for credit losses is maintained at a level considered adequate to provide for expected losses based on historical loss rates adjusted for current and expected conditions over a forecast period. These include conditions unique to individual borrowers, as well as overall credit loss experience, the amount of past due, nonperforming and classified loans, recommendations of regulatory authorities, prevailing economic conditions, or credit protection agreements and other factors.
Loans that share common risk characteristics are segregated into pools based on common characteristics, which is primarily determined by loan, borrower, or collateral type. Historical loss rates are determined for each pool. For consumer installment loans, primarily secured by automobiles, historical loss rates are determined using a vintage methodology, which tracks losses based on period of origination. For commercial, construction, and commercial real estate, historical loss rates are determined using an open pool methodology where losses are tracked over time for all loans included in the pool at the historical measurement date. Historical loss rates are adjusted for factors that are not reflected in the historical loss rates that are attributable to national or local economic or industry trends which have occurred but have not yet been recognized in past loan charge-off history, estimated losses based on management’s reasonable and supportable expectation of economic trends over a forecast horizon of up to two years, and other factors that impact credit loss expectations that are not reflected in the historical loss rates. Other factors include, but are not limited to, the effectiveness of the Company’s loan review system, adequacy of lending Management and staff, loan policies and procedures, problem loan trends, and concentrations of credit. At the end of the two-year forecast period loss rates revert immediately to the historical loss rates. The results of this analysis are applied to the amortized cost of the loans included within each pool.
Loans that do not share risk characteristics with other loans in the pools are evaluated individually. A loan is considered ‘collateral-dependent’ when the borrower is experiencing financial difficulty and repayment is expected to be provided substantially through the operation or sale of the collateral. A credit loss reserve for collateral-dependent loans is established at the difference between the amortized cost basis in the loan and the fair value of the underlying collateral adjusted for costs to sell. For other individually evaluated loans that are not collateral dependent, a credit loss reserve is established at the difference between the amortized cost basis in the loan and the present value of expected future cash flows discounted at the loan’s effective interest rate. The impact of an expected TDR modification to be made to loans to borrowers experiencing financial difficulty is included in the allowance for credit losses when management determines a TDRsuch modification is likely.
Accrued interest is recorded in other assets and is excluded from the estimation of expected credit loss. Accrued interest is reversed through interest income when amounts are determined to be uncollectible, which generally occurs when the underlying receivable is placed on nonaccrual status or charged off.
[The remainder of this page intentionally left blank]
The following table summarizes the allowance for credit losses, chargeoffs and recoveries for the periods indicated. The allowance for loan losses for 2018 and 2019 is shown under legacy GAAP.
At and For the Years Ended December 31, | At and For the Years Ended December 31, | |||||||||||||||||||||||||||||||||||||||
2022 | 2021 | 2020 | 2019 | 2018 | 2023 | 2022 | 2021 | 2020 | 2019 | |||||||||||||||||||||||||||||||
($ in thousands) | ($ in thousands) | |||||||||||||||||||||||||||||||||||||||
Analysis of the Allowance for Credit Losses | ||||||||||||||||||||||||||||||||||||||||
Balance, end of prior period | $ | 23,514 | $ | 23,854 | $ | 19,484 | $ | 21,351 | $ | 23,009 | $ | 20,284 | $ | 23,514 | $ | 23,854 | $ | 19,484 | $ | 21,351 | ||||||||||||||||||||
Adoption of ASU 2016-13 | - | - | 2,017 | - | - | - | - | - | 2,017 | - | ||||||||||||||||||||||||||||||
Balance, beginning of period | 23,514 | 23,854 | 21,501 | 21,351 | 23,009 | 20,284 | 23,514 | 23,854 | 21,501 | 21,351 | ||||||||||||||||||||||||||||||
Provision for (reversal of) credit losses on loans | 6 | 2 | 4,307 | - | - | (1,150 | ) | 6 | 2 | 4,307 | - | |||||||||||||||||||||||||||||
Loans charged off: | ||||||||||||||||||||||||||||||||||||||||
Commercial | (20 | ) | (56 | ) | (236 | ) | (97 | ) | (513 | ) | (410 | ) | (20 | ) | (56 | ) | (236 | ) | (97 | ) | ||||||||||||||||||||
Commercial real estate | - | - | - | - | (240 | ) | (45 | ) | - | - | - | - | ||||||||||||||||||||||||||||
Consumer and other installment | (6,205 | ) | (3,192 | ) | (3,963 | ) | (4,473 | ) | (4,124 | ) | (7,499 | ) | (6,205 | ) | (3,192 | ) | (3,963 | ) | (4,473 | ) | ||||||||||||||||||||
Total chargeoffs | (6,225 | ) | (3,248 | ) | (4,199 | ) | (4,570 | ) | (4,877 | ) | (7,954 | ) | (6,225 | ) | (3,248 | ) | (4,199 | ) | (4,570 | ) | ||||||||||||||||||||
Recoveries of loans previously charged off: | ||||||||||||||||||||||||||||||||||||||||
Commercial | 376 | 228 | 351 | 768 | 1,447 | 2,359 | 376 | 228 | 351 | 768 | ||||||||||||||||||||||||||||||
Commercial real estate | 62 | 743 | 49 | 196 | - | 71 | 62 | 743 | 49 | 196 | ||||||||||||||||||||||||||||||
Consumer and other installment | 2,551 | 1,935 | 1,845 | 1,739 | 1,772 | 3,257 | 2,551 | 1,935 | 1,845 | 1,739 | ||||||||||||||||||||||||||||||
Total recoveries | 2,989 | 2,906 | 2,245 | 2,703 | 3,219 | 5,687 | 2,989 | 2,906 | 2,245 | 2,703 | ||||||||||||||||||||||||||||||
Net loan losses | (3,236 | ) | (342 | ) | (1,954 | ) | (1,867 | ) | (1,658 | ) | (2,267 | ) | (3,236 | ) | (342 | ) | (1,954 | ) | (1,867 | ) | ||||||||||||||||||||
Balance, end of period | $ | 20,284 | $ | 23,514 | $ | 23,854 | $ | 19,484 | $ | 21,351 | $ | 16,867 | $ | 20,284 | $ | 23,514 | $ | 23,854 | $ | 19,484 | ||||||||||||||||||||
Net loan losses as a percentage of average loans | 0.32 | % | 0.03 | % | 0.16 | % | 0.16 | % | 0.14 | % | 0.25 | % | 0.32 | % | 0.03 | % | 0.16 | % | 0.16 | % | ||||||||||||||||||||
Selected financial data: | ||||||||||||||||||||||||||||||||||||||||
Selected financial data: (at period end) | ||||||||||||||||||||||||||||||||||||||||
Loans | $ | 958,488 | $ | 1,068,126 | $ | 1,256,243 | $ | 1,126,664 | $ | 1,207,202 | $ | 866,602 | $ | 958,488 | $ | 1,068,126 | $ | 1,256,243 | $ | 1,126,664 | ||||||||||||||||||||
Nonaccrual loans | 146 | 692 | 4,329 | 4,440 | 4,868 | 403 | 146 | 692 | 4,329 | 4,440 | ||||||||||||||||||||||||||||||
Allowance for credit losses as a percentage of loans | 2.12 | % | 2.20 | % | 1.90 | % | 1.73 | % | 1.77 | % | 1.95 | % | 2.12 | % | 2.20 | % | 1.90 | % | 1.73 | % | ||||||||||||||||||||
Nonaccrual loans as a percentage of loans | 0.02 | % | 0.06 | % | 0.34 | % | 0.39 | % | 0.40 | % | 0.05 | % | 0.02 | % | 0.06 | % | 0.34 | % | 0.39 | % | ||||||||||||||||||||
Allowance for credit losses to nonaccrual loans | 13893.15 | % | 3397.98 | % | 551.03 | % | 438.83 | % | 438.60 | % | 4185.36 | % | 13893.15 | % | 3397.98 | % | 551.03 | % | 438.83 | % | ||||||||||||||||||||
The following table summarizes net (chargeoffs) recoveries and the ratio of net charge-offs (recoveries) to average loans for the periods indicated:
For the Years ended December 31, | For the Year Ended December 31, | |||||||||||||||||||||||||||||||||||||||||||||||||||||||||||
2022 | 2021 | 2020 | 2023 | 2022 | 2021 | |||||||||||||||||||||||||||||||||||||||||||||||||||||||
As a percentage | As a percentage | As a percentage | As a percentage | As a percentage | As a percentage | |||||||||||||||||||||||||||||||||||||||||||||||||||||||
of Net chargeoffs | of Net chargeoffs | of Net chargeoffs | Average | of Net chargeoffs | Average | of Net chargeoffs | Average | of Net chargeoffs | ||||||||||||||||||||||||||||||||||||||||||||||||||||
Net (chargeoffs) | (recoveries) | Net (chargeoffs) | (recoveries) | Net (chargeoffs) | (recoveries) | Net (chargeoffs) | Loan | (recoveries) | Net (chargeoffs) | Loan | (recoveries) | Net (chargeoffs) | Loan | (recoveries) | ||||||||||||||||||||||||||||||||||||||||||||||
Recoveries | to Average loans | Recoveries | to Average loans | Recoveries | to Average loans | Recoveries | Balances | to Average loans | Recoveries | Balances | to Average loans | Recoveries | Balances | to Average loans | ||||||||||||||||||||||||||||||||||||||||||||||
($ in thousands) | ($ in thousands) | |||||||||||||||||||||||||||||||||||||||||||||||||||||||||||
Commercial | $ | 356 | (0.19 | )% | $ | 172 | (0.05 | )% | $ | 115 | (0.03 | )% | $ | 1,949 | $ | 149,137 | (1.31 | )% | $ | 356 | $ | 191,805 | (0.19 | )% | $ | 172 | $ | 349,882 | (0.05 | )% | ||||||||||||||||||||||||||||||
Commercial real estate | 62 | (0.01 | )% | 743 | (0.14 | )% | 49 | (0.01 | )% | 26 | 492,183 | (0.01 | )% | 62 | 504,713 | (0.01 | )% | 743 | 546,750 | (0.14 | )% | |||||||||||||||||||||||||||||||||||||||
Construction | - | - | % | - | - | % | - | - | % | - | 4,362 | - | % | - | 1,676 | - | % | - | 98 | - | % | |||||||||||||||||||||||||||||||||||||||
Residential real estate | - | - | % | - | - | % | - | - | % | - | 12,080 | - | % | - | 15,694 | - | % | - | 20,337 | - | % | |||||||||||||||||||||||||||||||||||||||
Consumer and other installment | (3,654 | ) | 1.29 | % | (1,257 | ) | 0.45 | % | (2,118 | ) | 0.76 | % | (4,242 | ) | 254,554 | 1.67 | % | (3,654 | ) | 284,076 | 1.29 | % | (1,257 | ) | 278,067 | 0.45 | % | |||||||||||||||||||||||||||||||||
Total | $ | (3,236 | ) | 0.32 | % | $ | (342 | ) | 0.03 | % | $ | (1,954 | ) | 0.16 | % | $ | (2,267 | ) | $ | 912,316 | 0.25 | % | $ | (3,236 | ) | $ | 997,964 | 0.32 | % | $ | (342 | ) | $ | 1,195,135 | 0.03 | % | ||||||||||||||||||||||||
The Company's allowance for credit losses on loans is maintained at a level considered adequate to provide for expected losses based on historical loss rates adjusted for current and expected conditions over a forecast period. These include conditions unique to individual borrowers, as well as overall loan loss experience, the amount of past due, nonperforming and classified loans, recommendations of regulatory authorities, prevailing and forecasted economic conditions, or credit protection agreements and other factors. Loans that share common risk characteristics are segregated into pools based on common characteristics, which isare primarily determined by loan, borrower, or collateral type. Historical loss rates are determined for each pool. Loans that do not share risk characteristics with other loans in the pools are evaluated individually. See Note 1 to the consolidated financial statements for additional information.
[The remainder of this page intentionally left blank]
The following table presents the allocation of the allowance for credit losses as of December 31 for the periods indicated. The allowance for loan losses for 2018 and 2019 is shown under legacy GAAP.
At December 31, | ||||||||||||||||||||||||||||||||||||||||
2023 | 2022 | 2021 | 2020 | 2019 | ||||||||||||||||||||||||||||||||||||
Allocation of the Allowance Balance | Loans as Percent of Total Loans | Allocation of the Allowance Balance | Loans as Percent of Total Loans | Allocation of the Allowance Balance | Loans as Percent of Total Loans | Allocation of the Allowance Balance | Loans as Percent of Total Loans | Allocation of the Allowance Balance | Loans as Percent of Total Loans | |||||||||||||||||||||||||||||||
($ in thousands) | ||||||||||||||||||||||||||||||||||||||||
Commercial | $ | 4,216 | 16 | % | $ | 6,138 | 18 | % | $ | 6,966 | 22 | % | $ | 9,205 | 31 | % | $ | 4,959 | 20 | % | ||||||||||||||||||||
Commercial real estate | 5,925 | 56 | % | 5,888 | 51 | % | 6,529 | 50 | % | 5,660 | 45 | % | 4,064 | 51 | % | |||||||||||||||||||||||||
Construction | 245 | 1 | % | 150 | - | % | 2 | - | % | 6 | - | % | 109 | - | % | |||||||||||||||||||||||||
Residential real estate | 26 | 1 | % | 32 | 2 | % | 45 | 2 | % | 47 | 2 | % | 206 | 3 | % | |||||||||||||||||||||||||
Consumer installment and other | 6,455 | 26 | % | 8,076 | 29 | % | 9,972 | 26 | % | 8,936 | 22 | % | 6,445 | 26 | % | |||||||||||||||||||||||||
Unallocated portion | - | - | % | - | - | % | - | - | % | - | - | % | 3,701 | - | % | |||||||||||||||||||||||||
Total | $ | 16,867 | 100 | % | $ | 20,284 | 100 | % | $ | 23,514 | 100 | % | $ | 23,854 | 100 | % | $ | 19,484 | 100 | % | ||||||||||||||||||||
At December 31, | ||||||||||||||||||||||||||||||||||||||||
2022 | 2021 | 2020 | 2019 | 2018 | ||||||||||||||||||||||||||||||||||||
Allocation of the Allowance Balance | Loans as Percent of Total Loans | Allocation of the Allowance Balance | Loans as Percent of Total Loans | Allocation of the Allowance Balance | Loans as Percent of Total Loans | Allocation of the Allowance Balance | Loans as Percent of Total Loans | Allocation of the Allowance Balance | Loans as Percent of Total Loans | |||||||||||||||||||||||||||||||
($ in thousands) | ||||||||||||||||||||||||||||||||||||||||
Commercial | $ | 6,138 | 18 | % | $ | 6,966 | 22 | % | $ | 9,205 | 31 | % | $ | 4,959 | 20 | % | $ | 6,311 | 23 | % | ||||||||||||||||||||
Commercial real estate | 5,888 | 51 | % | 6,529 | 50 | % | 5,660 | 45 | % | 4,064 | 51 | % | 3,884 | 48 | % | |||||||||||||||||||||||||
Construction | 150 | - | % | 2 | - | % | 6 | - | % | 109 | - | % | 1,465 | - | % | |||||||||||||||||||||||||
Residential real estate | 32 | 2 | % | 45 | 2 | % | 47 | 2 | % | 206 | 3 | % | 869 | 4 | % | |||||||||||||||||||||||||
Consumer installment and other | 8,076 | 29 | % | 9,972 | 26 | % | 8,936 | 22 | % | 6,445 | 26 | % | 5,645 | 25 | % | |||||||||||||||||||||||||
Unallocated portion | - | - | % | - | - | % | - | - | % | 3,701 | - | % | 3,177 | - | % | |||||||||||||||||||||||||
Total | $ | 20,284 | 100 | % | $ | 23,514 | 100 | % | $ | 23,854 | 100 | % | $ | 19,484 | 100 | % | $ | 21,351 | 100 | % | ||||||||||||||||||||
Allowance for Credit Losses | Allowance for Credit Losses | |||||||||||||||||||||||||||||||||||||||||||||||
For the Year Ended Decmber 31, 2022 | For the Year Ended December 31, 2023 | |||||||||||||||||||||||||||||||||||||||||||||||
Consumer | Consumer | |||||||||||||||||||||||||||||||||||||||||||||||
Commercial | Residential | Installment | Commercial | Residential | Installment | |||||||||||||||||||||||||||||||||||||||||||
Commercial | Real Estate | Construction | Real Estate | and Other | Total | Commercial | Real Estate | Construction | Real Estate | and Other | Total | |||||||||||||||||||||||||||||||||||||
(In thousands) | (In thousands) | |||||||||||||||||||||||||||||||||||||||||||||||
Allowance for credit losses: | ||||||||||||||||||||||||||||||||||||||||||||||||
Balance at beginning of period | $ | 6,966 | $ | 6,529 | $ | 2 | $ | 45 | $ | 9,972 | $ | 23,514 | $ | 6,138 | $ | 5,888 | $ | 150 | $ | 32 | $ | 8,076 | $ | 20,284 | ||||||||||||||||||||||||
(Reversal) provision | (1,184 | ) | (703 | ) | 148 | (13 | ) | 1,758 | 6 | (3,871 | ) | 11 | 95 | (6 | ) | 2,621 | (1,150 | ) | ||||||||||||||||||||||||||||||
Chargeoffs | (20 | ) | - | - | - | (6,205 | ) | (6,225 | ) | (410 | ) | (45 | ) | - | - | (7,499 | ) | (7,954 | ) | |||||||||||||||||||||||||||||
Recoveries | 376 | 62 | - | - | 2,551 | 2,989 | 2,359 | 71 | - | - | 3,257 | 5,687 | ||||||||||||||||||||||||||||||||||||
Total allowance for credit losses | $ | 6,138 | $ | 5,888 | $ | 150 | $ | 32 | $ | 8,076 | $ | 20,284 | $ | 4,216 | $ | 5,925 | $ | 245 | $ | 26 | $ | 6,455 | $ | 16,867 | ||||||||||||||||||||||||
Management considers the $20.3$16.9 million allowance for credit losses on loans to be adequate as a reserve against current expected credit losses in the loan portfolio as of December 31, 2022.2023.
See Note 3 to the consolidated financial statements for additional information related to the loan portfolio, loan portfolio credit risk, and allowance for credit losses.
Climate-Related Financial Risk
Climate change presents risk to the Company, our critical vendors and our customers. Our risk management practices incorporate the challenges brought about by climate change. The operations conducted in our centralized facilities and branch locations can be disrupted by acute physical risks such as flooding and windstorms, and by chronic physical risks such as rising sea levels, sustained higher temperatures, drought, and increased wildfires. Over the intermediate and longer-term, the Company can be subject to transition risks such as market demand, and policy and law changes.
None of the Company’s physical locations are located near sea level, and only a limited number of branches are located in flood zones. Our principal electricity supplier reports a Power Content Label of 100% greenhouse gas free using the California Energy Commission’s methodology. Our principal information technology vendor’s goal is to achieve 100 percent carbon neutrality for Scope 1 and 2 greenhouse gas emissions by 2025. The Company and its critical vendors maintain property and casualty insurance, and maintain and regularly test disaster recovery plans, which include redundant operational locations and power sources. The Company’s operations do not use a significant amount of water in producing our products and services.
The Company monitors the climate risks of our loan customers. Borrowers with real estate loan collateral located in flood zones must carry flood insurance under the loans’ terms. TheAt December 31, 2023, the Company has $21had $18 million in loans to agricultural borrowers; Management continuously monitors these customers’ access to adequate water sources as well as their ability to sustain low crop yields without encountering financial hardship. The Company makes automobile loans; changes in consumer demand, or governmental laws or policies, regarding gasoline, electric and hybrid vehicles isare not considered a riskto be material risks to the Company’s automobile lending practices.
The Company considers climate risk in its underwriting of corporate bonds, and avoids purchasing bonds of issuers, which, in Management’s judgement, have elevated climate risk.
While the Company follows risk management practices related to climate risk, the Company may experience financial losses could occur in the future.due to climate risk despite these precautions.
Asset/Liability and Market Risk Management
Asset/liability management involves the evaluation, monitoring and management of interest rate risk, market risk, liquidity and funding. The fundamental objective of the Company's management of assets and liabilities is to maximize its economic value while maintaining adequate liquidity and a conservative level of interest rate risk.
Interest Rate Risk
Interest rate risk is a significant market risk affecting the Company. Many factors affect the Company’s exposure to interest rates, such as general economic and financial conditions, customer preferences, historical pricing relationships, and re-pricing characteristics of financial instruments. Financial instruments may mature or re-price at different times. Financial instruments may re-price at the same time but by different amounts. Short-term and long-term market interest rates may change by different amounts. The timing and amount of cash flows of various financial instruments may change as interest rates change. In addition, the changing levels of interest rates may have an impact on bond portfolio volumes, accumulated other comprehensive (loss) income, loan demand and demand for various deposit products.
The Company’s earnings are affected not only by general economic conditions, but also by the monetary and fiscal policies of the United States government and its agencies, particularly the FOMC. The monetary policies of the FOMC can influence the overall demand for loans and growth of deposits and the level of interest rates earned on loans and investment securities and paid for deposits and other borrowings. The nature and impact of future changes in monetary policies are generally not predictable.
Management attempts to manage interest rate risk while enhancing the net interest margin and net interest income. At times, depending on expected increases or decreases in market interest rates, the relationship between long and short-term interest rates, market conditions and competitive factors, Management may adjust the Company's interest rate risk position. The Company's results of operations and net portfolio values remain subject to changes in interest rates and to fluctuations in the difference between long, intermediate, and short-term interest rates.
Management monitors the Company’s interest rate risk using a purchased simulation model, which is periodically assessed using supervisory guidance issued by the Board of Governors of the Federal Reserve System, SR 11-7 “Guidance on Model Risk Management.” Management measures its exposure to interest rate risk using a dynamic composition simulation and static simulation. Within the dynamic composition simulation, Management makes assumptions regarding the expected change in the volume of financial instruments given the assumed change in market interest rates. Within the static simulation, cash flows are assumed redeployed into like financial instruments at prevailing rates and yields, except cash flows from PPP loans are reinvested into interest-bearing cash.yields. Both simulations are used to measure expected changes in net interest income assuming various levels of change in market interest rates.
The Company’s asset and liability position was generally “asset sensitive” at December 31, 2022,2023, based on the interest rate assumptions applied to the simulation model. An “asset sensitive” position results in a larger change in interest income than in interest expense resulting from application of assumed interest rate changes. However, in the dynamic simulation, an assumed decline in interest rates is expected to result in improved deposit balances funding higher earning asset levels. Further, in the dynamic simulation, no change in interest rates is expected to result in a decline in net interest income as asset yields remain stable and deposit costs rise as the Bank negotiates deposit rates with customers in the current environment.
At December 31, 2022,2023, Management’s most recent measurements of estimated changes in net interest income were:
Dynamic Simulation (balance sheet composition changes): | ||||||||||||
Assumed Change in Interest Rates Over 1 Year | -1.00 | % | 1.00 | % | 2.00 | % | ||||||
First Year Change in Net Interest Income | 0.30 | % | 2.70 | % | 5.10 | % | ||||||
Dynamic simulation (balance sheet composition changes): | ||||||||||||||||||||
Assumed change in interest rates over 1 year | -2.00 | % | -1.00 | % | 0.00 | % | +1.00 | % | +2.00 | % | ||||||||||
First year change in net interest income | -2.20 | % | -0.40 | % | -0.80 | % | +1.80 | % | +3.20 | % | ||||||||||
Static simulation (balance sheet composition unchanged): | ||||||||||||||||||||
Assumed immediate change in interest rates | -2.00 | % | -1.00 | % | 0.00 | % | +1.00 | % | +2.00 | % | ||||||||||
First year change in net interest income | -11.50 | % | -5.60 | % | 0.00 | % | +5.70 | % | +11.00 | % |
Static Simulation (balance sheet composition unchanged): | ||||||||||||
Assumed Immediate Change in Interest Rates | -1.00 | % | 1.00 | % | 2.00 | % | ||||||
First Year Change in Net Interest Income | -7.60 | % | 6.70 | % | 12.90 | % |
Simulation estimates depend on, and will change with, the size and mix of the actual and projected composition of financial instruments at the time of each simulation. Assumptions made in the simulation may not materialize and unanticipated events and circumstances may occur. In addition, the simulation does not take into account any future actions Management may undertake to mitigate the impact of interest rate changes, loan prepayment estimates and spread relationships, which may change regularly.
The Company does not currently engage in trading activities or use derivative instruments to manage interest rate risk, even though such activities may be permitted with the approval of the Company's Board of Directors.
Market Risk - Equity Markets
Equity price risk can affect the Company. Preferred or common stock holdings, as permitted by banking regulations, can fluctuate in value. Changes in value of preferred or common stock holdings are recognized in the Company's income statement.
Fluctuations in the Company's common stock price can impact the Company's financial results in several ways. First, the Company has at times repurchased and retired its common stock; the market price paid to retire the Company's common stock affects the level of the Company's shareholders' equity, cash flows and shares outstanding. Second, the Company's common stock price impacts the number of dilutive equivalent shares used to compute diluted earnings per share. Third, fluctuations in the Company's common stock price can motivate holders of options to purchase Company common stock through the exercise of such options thereby increasing the number of shares outstanding and potentially adding volatility to the book tax provision. Finally, the amount of compensation expense and tax deductions associated with share based compensation fluctuates with changes in and the volatility of the Company's common stock price.
Market Risk - Other
Market values of loan collateral can directly impact the level of loan chargeoffs and the provision for credit losses. The financial condition and liquidity of debtors issuing bonds and debtors whose mortgages or other obligations are securitized can directly impact the credit quality of the Company’s investment securities portfolio requiring the Company to establish or increase reserves for expected credit losses. Other types of market risk, such as foreign currency exchange risk, are not significant in the normal course of the Company's business activities.
Liquidity and Funding
The objective of liquidity management is to manage cash flow and liquidity reserves so that they are adequate to fund the Bank's operations and meet obligations and other commitments on a timely basis and at a reasonable cost. The Bank achieves this objective through the selection of asset and liability maturity mixes that it believes best meet its needs. The Bank's liquidity position is enhanced by its ability to raise additional funds as needed by borrowing from correspondent banks or in the wholesale markets, or by selling debt securities available-for-sale or borrowing in the wholesale markets.available for sale.
In recent years, the Bank's deposit base has provided the majority of the Bank's funding requirements. This relatively stable and low-cost source of funds, along with shareholders' equity, provided 97% of funding for average total assets in the yearsyear ended December 31, 20222023 and December 31, 2021.2022, respectively. The stability of the Bank’s funding from customer deposits is in part reliant on the confidence clients have in the Bank. The Bank places a very high priority in maintaining this confidence through conservative credit risk and capital management practices and by maintaining an appropriate level of liquidity.
Total deposits were $5,474 million at December 31, 2023 and $6,225 million at December 31, 2022. Total time deposits were $97 million at December 31, 2023 and $131 million at December 31, 2022. The Company has no foreign time deposits. The standard FDIC deposit insurance amount is $250,000 per depositor, for each account ownership category. At December 31, 2023, estimated federally uninsured deposits and time deposits were $2,544 million and $4 million, respectively.
Banking industry deposits, including for Westamerica Bank, grew rapidly in 2020 and 2021 due to the injection of fiscal stimulus into the United States economy, including Paycheck Protection Program loans, and an easing of Federal Reserve monetary policy, both in response to the COVID pandemic. Federal Reserve monetary policy easing included reduction in the federal funds rate to a range of 0.00% to 0.25% and net purchases of Treasury securities and agency mortgage-backed securities, which increase the money supply and aggregate bank deposits. Subsequently, inflation rose considerably while employment conditions remained strong. In 2022 and 2023, the Federal Reserve’s monetary policy reversed to tightening, in an effort to reduce inflation. The monetary policy tightening included increasing and keeping the federal funds rate to a range of 5.25% to 5.50% and net reductions of Treasury securities and agency mortgage-backed securities, which reduce the money supply and aggregate bank deposits. Westamerica Bank’s deposit totals are subject to both the fiscal policies of the United States government and monetary policies of the Federal Reserve; the 2023 decline in Westamerica Bank deposits is influenced by these fiscal and monetary policies. In addition, the Internal Revenue Service (“IRS”) declared every county in which Westamerica Bank operates as Natural Disaster Areas due to 2022-2023 winter storms; the IRS and California Franchise Tax Board extended the 2022 tax filing deadline and 2023 tax installment payment due dates to November 16, 2023. As Westamerica Bank management expected this deferment of tax payment deadlines impacted deposit totals in the fourth quarter 2023 as customers paid their federal and California tax obligations.
The following table shows the time remaining to maturity of the Company’s estimated amounts of uninsured time deposits with a balance greater than $250,000 per depositor per category:
At December 31, 2023 | ||||
(In thousands) | ||||
Three months or less | $ | 1,926 | ||
Over three through six months | 309 | |||
Over six through twelve months | 1,947 | |||
Over twelve months | 163 | |||
Total | $ | 4,345 | ||
Liquidity is further provided by assets such as balances held at the Federal Reserve Bank, investment securities, and amortizing loans. The Bank's investmentAt December 31, 2023, the Company had $190,314 thousand in cash balances. During the twelve months ending December 31, 2024, the Company expects to receive $265,000 thousand in principal payments from its debt securities. If additional operational liquidity is required, the Company can pledge debt securities portfolio provides a substantial secondary source of liquidity. The Bank held $5.2 billion in total investment securitiesas collateral for borrowing purposes; at December 31, 2022. Under certain deposit,2023, the Company’s debt securities which qualify as collateral for borrowing and other arrangements,totaled $3,915,867 thousand. In the Bank must hold and pledge investmentordinary course of business, the Company pledges debt securities as collateral. Atcollateral for certain depository customers; at December 31, 2022, such collateral requirements totaled approximately $1.2 billion. At December 31, 2022,2023, the Company had linespledged $708,439 thousand in debt securities for depository customers. In the ordinary course of credit for overnight borrowings from corresponding banks totaling $100 million. Additionally,business, the Company had access topledges debt securities as collateral for borrowing from the Federal Reserve up to $225 millionBank; at December 31, 2023, the Company had pledged $996,935 thousand in debt securities at the Federal Reserve Bank. During the year ended December 31, 2023, the Company’s average borrowings from the Federal Reserve Bank and other correspondent banks were $-0- thousand, respectively, and at December 31, 2023, the Company’s borrowings from the Federal Reserve Bank and other correspondent banks were $-0- thousand. At December 31, 2023, the Company’s estimated unpledged collateral qualifying debt securities totaled $1,945,176 thousand based on the Federal Reserve Bank borrowing programs. On January 24, 2024, the Federal Reserve Board announced the Bank Term Funding Program would cease making new loans as scheduled on March 11, 2024. Debt securities eligible as collateral pledgedare shown at December 31, 2022. There were no outstanding amounts under the above-mentioned borrowings at December 31, 2022.market value unless otherwise noted:
At December 31, 2023 | ||||
(in thousands) | ||||
Debt Securities Eligible as Collateral: | ||||
Corporate Securities | $ | 2,614,904 | ||
Collateralized Loan Obligations rated AAA | 517,796 | |||
Obligations of States and Political Subdivisions | 142,178 | |||
Agency Mortgage Backed Securities | 314,156 | |||
Securities of U.S. Government Sponsored Entities (Par Value) | 326,833 | |||
Total Debt Securities Eligible as Collateral | $ | 3,915,867 | ||
Debt Securities Pledged as Collateral: | ||||
Deposits by Public Entities | $ | (708,439 | ) | |
Short-term Borrowed Funds (Deposit Sweep) | (259,616 | ) | ||
Other | (5,701 | ) | ||
Total Debt Securities Pledged as Collateral | $ | (973,756 | ) | |
Debt Securities Pledged at the Federal Reserve Bank | $ | (996,935 | ) | |
Estimated Debt Securities Available to Pledge | $ | 1,945,176 | ||
Liquidity risk can result from the mismatching of asset and liability cash flows, or from disruptions in the financial markets. The Bank performs liquidity stress tests on a periodic basis to evaluate the sustainability of its liquidity. Under the stress testing, the Bank assumes outflows of funds increase beyond expected levels. Measurement of such heightened outflows considers the composition of the Bank’s deposit base, including any concentration of deposits, non-deposit funding such as short-term borrowings, and unfunded lending commitments. The composition of the Bank’s deposits is considered including the broad industry and geographic diversification in the Bank’s market area. The Bank evaluates its stock of highly liquid assets to meet the assumed higher levels of outflows. Highly liquid assets include cash and amounts due from other banks from daily transaction settlements, reduced by branch cash needs and any Federal Reserve Bank reserve requirements, and investment securities based on regulatory risk-weighting guidelines. Based on the results of the most recent liquidity stress test, Management is satisfied with the liquidity condition of the Bank. However, no assurance can be given the Bank will not experience a period of reduced liquidity.
Management continually monitors the Bank’s cash levels. Loan demand from credit worthy borrowers will be dictated by economic and competitive conditions. The Bank aggressively solicits non-interest bearing demand deposits and money market checking deposits, which are the least sensitive to changes in interest rates. The growth of these deposit balances is subject to heightened competition, the success of the Bank's sales efforts, delivery of superior customer service, new regulations and market conditions. The Bank does not aggressively solicit higher-costing time deposits. Changes in interest rates, most notably rising interest rates or increased consumer spending, could impact deposit volumes. Depending on economic conditions, interest rate levels, liquidity management and a variety of other conditions, any deposit growth may be used to fund loans or purchase investment securities. However, due to possible volatility in economic conditions, competition and political uncertainty, loan demand and levels of customer deposits are not certain. Shareholder dividends are expected to continue subject to the Board's discretion and continuing evaluation of capital levels, earnings, asset quality and other factors.
Westamerica Bancorporation ("Parent Company") is a separate entity apart from the Bank and must provide for its own liquidity. In addition to its operating expenses, the Parent Company is responsible for the payment of dividends declared for its shareholders, and interest and principal on any outstanding debt. The Parent Company currently hashad no debt.debt as of December 31, 2023. Substantially all of the Parent Company's revenues are obtained from subsidiary dividends and service fees.
The Bank’s dividends paid to the Parent Company, proceeds from the exercise of stock options, and Parent Company cash balances provided adequate cash for the Parent Company to pay shareholder dividends of $46 million in the year ended December 31, 2023 and $45 million in the year ended December 31, 2022 and $44 million in the year ended December 31, 2021 and retire common stock in the amounts of $218 thousand$14 million and $232$218 thousand, respectively. Payment of dividends to the Parent Company by the Bank is limited under California and Federal laws. The Company believes these regulatory dividend restrictions will not have an impact on the Parent Company's ability to meet its ongoing cash obligations. The Parent Company’s cash balance was $155 million at December 31, 2023 and $99 million at December 31, 2022.
Capital Resources
The Company has historically generated high levels of earnings, which provide a means of accumulating capital. The Company's net income as a percentage of average shareholders' equity (“return on equity” or “ROE”) was 18.1% for the year ended December 31, 2023 and 15.2% for the year ended December 31, 2022 and 11.5% for the year ended December 31, 2021.2022. The Company also raises capital as employees exercise stock options. Capital raised through the exercise of stock options was $950 thousand in the year ended December 31, 2023 and $2.3 million in the year ended December 31, 2022 and $3.0 million in the year ended December 31, 2021.2022.
The Company paid common dividends totaling $46 million in the year ended December 31, 2023 and $45 million in the year ended December 31, 2022, and $44 million in the year ended December 31, 2021, which represent dividends per common share of $1.68$1.72 and $1.65,$1.68, respectively. The Company's earnings have historically exceeded dividends paid to shareholders. The amount of earnings in excess of dividends provides the Company resources to finance growth and maintain appropriate levels of shareholders' equity. In the absence of profitable growth opportunities, the Company has at times repurchased and retired its common stock as another means to return capital to shareholders. The Company repurchased and retired 274 thousand shares valued at $14 million in the year ended December 31, 2023 and 3 thousand shares valued at $218 thousand in the year ended December 31, 2022 and 4 thousand shares valued at $232 thousand in the year ended December 31, 2021.2022.
The Company's primary capital resource is shareholders' equity, which was $773 million at December 31, 2023 compared with $602 million at December 31, 2022 compared with $827 million at December 31, 2021.2022. The Company's ratio of equity to total assets was 12.14% at December 31, 2023 and 8.7% at December 31, 2022 and 11.1% at December 31, 2021.2022.
The Company performs capital stress tests on a periodic basis to evaluate the sustainability of its capital. Under the stress testing, the Company assumes various scenarios such as deteriorating economic and operating conditions, and unanticipated asset devaluations. The Company measures the impact of these scenarios on its earnings and capital. Based on the results of the most recent stress tests, Management is satisfied with the capital condition of the Bank and the Company. However, no assurance can be given the Bank or Company will not experience a period of reduced earnings or a reduction in capital from unanticipated events and circumstances.
[The remainder of this page intentionally left blank]
Capital to Risk-Adjusted Assets
The capital ratios for the Company and the Bank under current regulatory capital standards are presented in the tables below, on the dates indicated. For Common Equity Tier I Capital, Tier 1 Capital and Total Capital, the minimum percentage required for regulatory capital adequacy purposes include a 2.5% “capital conservation buffer.”
To Be | To Be | |||||||||||||||||||||||||||||||
Well-capitalized | Well-capitalized | |||||||||||||||||||||||||||||||
Required for | Under Prompt | Required for | Under Prompt | |||||||||||||||||||||||||||||
At December 31, 2022 | Capital Adequacy | Corrective Action | At December 31, 2023 | Capital Adequacy | Corrective Action | |||||||||||||||||||||||||||
Company | Bank | Purposes | Regulations (Bank) | Company | Bank | Purposes | Regulations (Bank) | |||||||||||||||||||||||||
Common Equity Tier I Capital | 15.22 | % | 12.37 | % | 7.00 | % | 6.50 | % | 18.76 | % | 14.46 | % | 7.00 | % | 6.50 | % | ||||||||||||||||
Tier I Capital | 15.22 | % | 12.37 | % | 8.50 | % | 8.00 | % | 18.76 | % | 14.46 | % | 8.50 | % | 8.00 | % | ||||||||||||||||
Total Capital | 15.64 | % | 12.93 | % | 10.50 | % | 10.00 | % | 19.15 | % | 14.98 | % | 10.50 | % | 10.00 | % | ||||||||||||||||
Leverage Ratio | 10.18 | % | 8.26 | % | 4.00 | % | 5.00 | % | 12.86 | % | 9.88 | % | 4.00 | % | 5.00 | % | ||||||||||||||||
To Be | To Be | |||||||||||||||||||||||||||||||
Well-capitalized | Well-capitalized | |||||||||||||||||||||||||||||||
Required for | Under Prompt | Required for | Under Prompt | |||||||||||||||||||||||||||||
At December 31, 2021 | Capital Adequacy | Corrective Action | At December 31, 2022 | Capital Adequacy | Corrective Action | |||||||||||||||||||||||||||
Company | Bank | Purposes | Regulations (Bank) | Company | Bank | Purposes | Regulations (Bank) | |||||||||||||||||||||||||
Common Equity Tier I Capital | 14.93 | % | 12.48 | % | 7.00 | % | 6.50 | % | 15.22 | % | 12.37 | % | 7.00 | % | 6.50 | % | ||||||||||||||||
Tier I Capital | 14.93 | % | 12.48 | % | 8.50 | % | 8.00 | % | 15.22 | % | 12.37 | % | 8.50 | % | 8.00 | % | ||||||||||||||||
Total Capital | 15.47 | % | 13.17 | % | 10.50 | % | 10.00 | % | 15.64 | % | 12.93 | % | 10.50 | % | 10.00 | % | ||||||||||||||||
Leverage Ratio | 9.06 | % | 7.55 | % | 4.00 | % | 5.00 | % | 10.18 | % | 8.26 | % | 4.00 | % | 5.00 | % | ||||||||||||||||
The Company and the Bank routinely project capital levels by analyzing forecasted earnings, credit quality, shareholder dividends, asset volumes, share repurchase activity, stock option exercise proceeds, and other factors. Based on current capital projections, the Bank expects to maintain regulatory capital levels in excess of the minimum required to be considered well-capitalized under the prompt corrective action framework. The Company expects to continue paying quarterly dividends to shareholders. No assurance can be given that changes in capital management plans will not occur.
[The remainder of this page intentionally left blank]
Deposit Categories
The Company primarily attracts deposits from local businesses and professionals, as well as through retail savings and checking accounts, and, to a more limited extent, certificates of deposit. The following table summarizes the Company’s average daily amount of deposits and the rates paid for the periods indicated:
Deposit Distribution and Average Rates Paid
For the Years Ended December 31, | For the Years Ended December 31, | |||||||||||||||||||||||||||||||||||||||||||||||||||||||||||||||||||||||
2022 | 2021 | 2020 | 2023 | 2022 | 2021 | |||||||||||||||||||||||||||||||||||||||||||||||||||||||||||||||||||
Average Balance | Percentage of Total Deposits | Rate | Average Balance | Percentage of Total Deposits | Rate | Average Balance | Percentage of Total Deposits | Rate | Average Balance | Percentage of Total Deposits | Rate | Average Balance | Percentage of Total Deposits | Rate | Average Balance | Percentage of Total Deposits | Rate | |||||||||||||||||||||||||||||||||||||||||||||||||||||||
($ In thousands) | ($ In thousands) | |||||||||||||||||||||||||||||||||||||||||||||||||||||||||||||||||||||||
Noninterest-bearing demand | $ | 3,018,350 | 47.0 | % | - | % | $ | 2,897,244 | 47.5 | % | - | % | $ | 2,538,819 | 47.8 | % | - | % | $ | 2,748,544 | 47.5 | % | - | % | $ | 3,018,350 | 47.0 | % | - | % | $ | 2,897,244 | 47.5 | % | - | % | ||||||||||||||||||||||||||||||||||||
Interest bearing: | ||||||||||||||||||||||||||||||||||||||||||||||||||||||||||||||||||||||||
Transaction | 1,289,956 | 20.1 | % | 0.03 | % | 1,208,269 | 19.8 | % | 0.03 | % | 1,008,758 | 19.0 | % | 0.03 | % | 1,156,684 | 20.0 | % | 0.04 | % | 1,289,956 | 20.1 | % | 0.03 | % | 1,208,269 | 19.8 | % | 0.03 | % | ||||||||||||||||||||||||||||||||||||||||||
Savings | 1,967,902 | 30.7 | % | 0.06 | % | 1,842,590 | 30.2 | % | 0.06 | % | 1,594,718 | 30.1 | % | 0.06 | % | 1,766,225 | 30.5 | % | 0.17 | % | 1,967,902 | 30.7 | % | 0.06 | % | 1,842,590 | 30.2 | % | 0.06 | % | ||||||||||||||||||||||||||||||||||||||||||
Time less than $100 thousand | 77,007 | 1.2 | % | 0.23 | % | 83,580 | 1.4 | % | 0.20 | % | 91,519 | 1.7 | % | 0.21 | % | 67,832 | 1.2 | % | 0.30 | % | 77,007 | 1.2 | % | 0.23 | % | 83,580 | 1.4 | % | 0.20 | % | ||||||||||||||||||||||||||||||||||||||||||
Time $100 thousand or more | 62,411 | 1.0 | % | 0.25 | % | 69,165 | 1.1 | % | 0.38 | % | 72,363 | 1.4 | % | 0.44 | % | 48,076 | 0.8 | % | 0.24 | % | 62,411 | 1.0 | % | 0.25 | % | 69,165 | 1.1 | % | 0.38 | % | ||||||||||||||||||||||||||||||||||||||||||
Total (1) | $ | 6,415,626 | 100.0 | % | 0.05 | % | $ | 6,100,848 | 100.0 | % | 0.06 | % | $ | 5,306,177 | 100.0 | % | 0.06 | % | $ | 5,787,361 | 100.0 | % | 0.12 | % | $ | 6,415,626 | 100.0 | % | 0.05 | % | $ | 6,100,848 | 100.0 | % | 0.06 | % | ||||||||||||||||||||||||||||||||||||
(1) The rates for total deposits were calculated using the average balances of interest-bearing deposits.
The Company’s strategy includes building the value of its deposit base by building balances of lower-costing deposits and avoiding reliance on higher-costing time deposits. Average balances of higher costing time deposits declined 15%24% to $139$116 million from 20202021 to 2022.2023. The Company’s average balances of checking and savings accounts represented 98% of average balances of total deposits in 2023, 98% in 2022 compared withand 97% in 2021 and 2020. Estimated uninsured deposits were $2.9 billion at December 31, 2022 and $3.1 billion at December 31, 2021.
Total time deposits were $131$97 million and $144$131 million at December 31, 20222023 and December 31, 2021,2022, respectively. The following table sets forth, by time remaining to maturity, the Company’s total domestic time deposits. The Company has no foreign time deposits.
Time Deposits Maturity Distribution
At December 31, 2022 | ||||
(In thousands) | ||||
2023 | $ | 98,771 | ||
2024 | 18,844 | |||
2025 | 7,764 | |||
2026 | 2,511 | |||
2027 | 2,833 | |||
Thereafter | 32 | |||
Total | $ | 130,755 | ||
The standard FDIC deposit insurance amount is $250,000 per depositor, for each account ownership category. The following table shows the time remaining to maturity of the Company’s time deposits with a balance greater than $250,000:
At December 31, 2022 | ||||
(In thousands) | ||||
Three months or less | $ | 8,989 | ||
Over three through six months | 2,362 | |||
Over six through twelve months | 4,962 | |||
Over twelve months | 5,747 | |||
Total | $ | 22,060 | ||
At December 31, 2023 | ||||
(In thousands) | ||||
2024 | $ | 77,625 | ||
2025 | 10,606 | |||
2026 | 3,347 | |||
2027 | 2,526 | |||
2028 | 2,653 | |||
Thereafter | 45 | |||
Total | $ | 96,802 | ||
Short-term Borrowings
The following table sets forth the short-term borrowings of the Company:
Short-Term Borrowings Distribution
At December 31, | At December 31, | |||||||||||||||||||||||
2022 | 2021 | 2020 | 2023 | 2022 | 2021 | |||||||||||||||||||
(In thousands) | (In thousands) | |||||||||||||||||||||||
Securities sold under agreements to repurchase the securities | $ | 57,792 | $ | 146,246 | $ | 102,545 | $ | 58,162 | $ | 57,792 | $ | 146,246 | ||||||||||||
Total short-term borrowings | $ | 57,792 | $ | 146,246 | $ | 102,545 | $ | 58,162 | $ | 57,792 | $ | 146,246 | ||||||||||||
Further detail of federal funds purchased and other borrowed funds is as follows:
For the Years Ended December 31, | For the Years Ended December 31, | |||||||||||||||||||||||
2022 | 2021 | 2020 | 2023 | 2022 | 2021 | |||||||||||||||||||
($ in thousands) | ($ in thousands) | |||||||||||||||||||||||
Federal funds purchased balances and rates paid on outstanding amount: | ||||||||||||||||||||||||
Average balance for the year | $ | 1 | $ | 1 | $ | 1 | $ | - | $ | 1 | $ | 1 | ||||||||||||
Maximum month-end balance during the year | - | - | - | - | - | - | ||||||||||||||||||
Average interest rate for the year | 4.68 | % | 0.87 | % | 0.88 | % | - | % | 4.68 | % | 0.87 | % | ||||||||||||
Average interest rate at period end | - | % | - | % | - | % | - | % | - | % | - | % | ||||||||||||
Securities sold under agreements to repurchase the securities balances and rates paid on outstanding amount: | ||||||||||||||||||||||||
Average balance for the year | $ | 109,282 | $ | 114,266 | $ | 80,455 | $ | 89,298 | $ | 109,282 | $ | 114,266 | ||||||||||||
Maximum month-end balance during the year | 257,560 | 146,552 | 110,846 | 138,005 | 257,560 | 146,552 | ||||||||||||||||||
Average interest rate for the year | 0.07 | % | 0.07 | % | 0.07 | % | 0.13 | % | 0.07 | % | 0.07 | % | ||||||||||||
Average interest rate at period end | 0.06 | % | 0.07 | % | 0.07 | % | 0.31 | % | 0.06 | % | 0.07 | % | ||||||||||||
PPPLF balances and rates paid on outstanding amount: | ||||||||||||||||||||||||
Average balance for the year | $ | - | $ | 53 | $ | 174 | $ | - | $ | - | $ | 53 | ||||||||||||
Maximum month-end balance during the year | - | - | - | - | - | - | ||||||||||||||||||
Average interest rate for the year | - | % | 0.35 | % | 0.35 | % | - | % | - | % | 0.35 | % | ||||||||||||
Average interest rate at period end | - | % | - | % | - | % | - | % | - | % | - | % | ||||||||||||
Financial Ratios
The following table shows key financial ratios for the periods indicated:
At and For the Years Ended December 31, | At and For the Years Ended December 31, | |||||||||||||||||||||||
2022 | 2021 | 2020 | 2023 | 2022 | 2021 | |||||||||||||||||||
Return on average total assets | 1.65 | % | 1.23 | % | 1.30 | % | 2.35 | % | 1.65 | % | 1.23 | % | ||||||||||||
Return on average common shareholders' equity | 15.21 | % | 11.52 | % | 11.30 | % | 18.08 | % | 15.21 | % | 11.52 | % | ||||||||||||
Average shareholders' equity as a percentage of: | ||||||||||||||||||||||||
Average total assets | 10.83 | % | 10.66 | % | 11.52 | % | 13.02 | % | 10.83 | % | 10.66 | % | ||||||||||||
Average total loans | 80.41 | % | 62.81 | % | 57.42 | % | 98.06 | % | 80.41 | % | 62.81 | % | ||||||||||||
Average total deposits | 12.51 | % | 12.30 | % | 13.41 | % | 15.46 | % | 12.51 | % | 12.30 | % | ||||||||||||
Common dividend payout ratio | 37 | % | 51 | % | 55 | % | 28 | % | 37 | % | 51 | % | ||||||||||||
[The remainder of this page intentionally left blank]
ITEM 7A. QUANTITATIVE AND QUALITATIVE DISCLOSURES ABOUT MARKET RISK
The Company does not currently engage in trading activities or use derivative instruments to control interest rate risk, even though such activities may be permitted with the approval of the Company’s Board of Directors.
Credit risk and interest rate risk are the most significant market risks affecting the Company, and equity price risk can also affect the Company’s financial results. These risks are described in the preceding sections regarding “Loan Portfolio Credit Risk,” and “Asset/Liability and Market Risk Management.” Other types of market risk, such as foreign currency exchange risk and commodity price risk, are not significant in the normal course of the Company’s business activities.
Operational risk is the risk to current or projected financial condition and resilience arising from inadequate or failed internal processes or systems, people (including human errors or misconduct), or adverse external events, including the risk of loss resulting from breaches in data security. Operational risk can also include the risk of loss due to failures by third parties with which the Company does business.
ITEM 8. FINANCIAL STATEMENTS AND SUPPLEMENTARY DATA
INDEX TO FINANCIAL STATEMENTS
MANAGEMENT’S REPORT ON INTERNAL CONTROL OVER FINANCIAL REPORTING
Management of Westamerica Bancorporation and subsidiaries (the “Company”) is responsible for establishing and maintaining adequate internal control over financial reporting, and for performing an assessment of the effectiveness of internal control over financial reporting as of December 31, 2022.2023. Internal control over financial reporting is a process designed to provide reasonable assurance regarding the reliability of financial reporting and the preparation of financial statements for external purposes in accordance with generally accepted accounting principles. The Company’s system of internal control over financial reporting includes those policies and procedures that (i) pertain to the maintenance of records that, in reasonable detail, accurately and fairly reflect the transactions and dispositions of the assets of the Company; (ii) provide reasonable assurance that transactions are recorded as necessary to permit preparation of financial statements in accordance with generally accepted accounting principles, and that receipts and expenditures of the Company are being made only in accordance with authorizations of Management and Directors of the Company; and (iii) provide reasonable assurance regarding prevention or timely detection of unauthorized acquisition, use or disposition of the Company’s assets that could have a material effect on the financial statements.
Management performed an assessment of the effectiveness of the Company’s internal control over financial reporting as of December 31, 20222023 based upon criteria in Internal Control — Integrated Framework (2013) issued by the Committee of Sponsoring Organizations of the Treadway Commission (“COSO”). Based on this assessment, Management determined that the Company’s internal control over financial reporting was effective as of December 31, 20222023 based on the criteria in Internal Control - Integrated Framework (2013) issued by COSO.
The Company’s independent registered public accounting firm has issued an attestation report on the Company’s internal control over financial reporting. Their opinion and attestation on internal control over financial reporting appear on page 91.90.
Dated: February 28, 2023
2024
WESTAMERICA BANCORPORATION
CONSOLIDATED BALANCE SHEETS
At December 31, | ||||||||
2023 | 2022 | |||||||
(In thousands) | ||||||||
Assets: | ||||||||
Cash and due from banks | $ | 190,314 | $ | 294,236 | ||||
Debt securities available for sale | 3,999,801 | 4,331,743 | ||||||
Debt securities held to maturity, net of allowance for credit losses of $1 at December 31, 2023 and $1 at December 31, 2022 (Fair value of $849,562 at December 31, 2023 and $873,511 at December 31, 2022) | 878,396 | 915,913 | ||||||
Loans | 866,602 | 958,488 | ||||||
Allowance for credit losses on loans | (16,867 | ) | (20,284 | ) | ||||
Loans, net of allowance for credit losses on loans | 849,735 | 938,204 | ||||||
Premises and equipment, net | 27,016 | 28,819 | ||||||
Identifiable intangibles, net | 347 | 583 | ||||||
Goodwill | 121,673 | 121,673 | ||||||
Other assets | 297,310 | 319,146 | ||||||
Total Assets | $ | 6,364,592 | $ | 6,950,317 | ||||
Liabilities: | ||||||||
Noninterest-bearing deposits | $ | 2,605,844 | $ | 2,947,277 | ||||
Interest-bearing deposits | 2,868,423 | 3,278,013 | ||||||
Total deposits | 5,474,267 | 6,225,290 | ||||||
Short-term borrowed funds | 58,162 | 57,792 | ||||||
Other liabilities | 59,269 | 65,125 | ||||||
Total Liabilities | 5,591,698 | 6,348,207 | ||||||
Contingencies (Note 12) | ||||||||
Shareholders' Equity: | ||||||||
Common stock (no par value), authorized - 150,000 shares Issued and outstanding: 26,671 at December 31, 2023 and 26,913 at December 31, 2022 | 473,136 | 475,086 | ||||||
Deferred compensation | 35 | 35 | ||||||
Accumulated other comprehensive loss | (190,282 | ) | (256,105 | ) | ||||
Retained earnings | 490,005 | 383,094 | ||||||
Total Shareholders' Equity | 772,894 | 602,110 | ||||||
Total Liabilities and Shareholders' Equity | $ | 6,364,592 | $ | 6,950,317 | ||||
See accompanying notes to consolidated financial statements.
WESTAMERICA BANCORPORATION
CONSOLIDATED STATEMENTS OF INCOME
At December 31, | ||||||||
2022 | 2021 | |||||||
(In thousands) | ||||||||
Assets: | ||||||||
Cash and due from banks | $ | 294,236 | $ | 1,132,085 | ||||
Debt securities available for sale | 4,331,743 | 4,638,855 | ||||||
Debt securities held to maturity, net of allowance for credit losses of $1 at December 31, 2022 and $7 at December 31, 2021 (Fair value of $873,511 at December 31, 2022 and $312,562 at December 31, 2021) | 915,913 | 306,396 | ||||||
Loans | 958,488 | 1,068,126 | ||||||
Allowance for credit losses on loans | (20,284 | ) | (23,514 | ) | ||||
Loans, net of allowance for credit losses on loans | 938,204 | 1,044,612 | ||||||
Premises and equipment, net | 28,819 | 31,155 | ||||||
Identifiable intangibles, net | 583 | 835 | ||||||
Goodwill | 121,673 | 121,673 | ||||||
Other assets | 319,146 | 185,415 | ||||||
Total Assets | $ | 6,950,317 | $ | 7,461,026 | ||||
Liabilities: | ||||||||
Noninterest-bearing deposits | $ | 2,947,277 | $ | 3,069,080 | ||||
Interest-bearing deposits | 3,278,013 | 3,344,876 | ||||||
Total deposits | 6,225,290 | 6,413,956 | ||||||
Short-term borrowed funds | 57,792 | 146,246 | ||||||
Other liabilities | 65,125 | 73,722 | ||||||
Total Liabilities | 6,348,207 | 6,633,924 | ||||||
Contingencies (Note 12) | ||||||||
Shareholders' Equity: | ||||||||
Common stock (no par value), authorized - 150,000 shares Issued and outstanding: 26,913 at December 31, 2022 and 26,866 at December 31, 2021 | 475,086 | 471,008 | ||||||
Deferred compensation | 35 | 35 | ||||||
Accumulated other comprehensive (loss) income | (256,105 | ) | 49,664 | |||||
Retained earnings | 383,094 | 306,395 | ||||||
Total Shareholders' Equity | 602,110 | 827,102 | ||||||
Total Liabilities and Shareholders' Equity | $ | 6,950,317 | $ | 7,461,026 | ||||
For the Years Ended December 31, | ||||||||||||
2023 | 2022 | 2021 | ||||||||||
(In thousands, except per share data) | ||||||||||||
Interest and Loan Fee Income: | ||||||||||||
Loans | $ | 47,116 | $ | 49,682 | $ | 57,558 | ||||||
Nonmarketable equity securities | 630 | 537 | 458 | |||||||||
Debt securities available for sale | 190,039 | 144,646 | 105,420 | |||||||||
Debt securities held to maturity | 35,557 | 19,101 | 8,875 | |||||||||
Interest-bearing cash | 10,671 | 7,790 | 1,132 | |||||||||
Total Interest and Loan Fee Income | 284,013 | 221,756 | 173,443 | |||||||||
Interest Expense: | ||||||||||||
Deposits | 3,770 | 1,846 | 1,877 | |||||||||
Short-term borrowed funds | 120 | 79 | 78 | |||||||||
Total Interest Expense | 3,890 | 1,925 | 1,955 | |||||||||
Net Interest and Loan Fee Income | 280,123 | 219,831 | 171,488 | |||||||||
Reversal of Provision for Credit Losses | (1,150 | ) | - | - | ||||||||
Net Interest and Loan Fee Income After Provision For Credit Losses | 281,273 | 219,831 | 171,488 | |||||||||
Noninterest Income: | ||||||||||||
Service charges on deposit accounts | 14,169 | 14,490 | 13,697 | |||||||||
Merchant processing services | 11,280 | 11,623 | 11,998 | |||||||||
Debit card fees | 7,185 | 7,879 | 6,859 | |||||||||
Trust fees | 3,122 | 3,216 | 3,311 | |||||||||
ATM processing fees | 2,618 | 2,160 | 2,280 | |||||||||
Other service fees | 1,765 | 1,808 | 1,884 | |||||||||
Financial services commissions | 336 | 417 | 356 | |||||||||
Life insurance gains | 279 | 930 | - | |||||||||
Securities (losses) gains | (125 | ) | - | 34 | ||||||||
Other noninterest income | 2,893 | 2,598 | 2,926 | |||||||||
Total Noninterest Income | 43,522 | 45,121 | 43,345 | |||||||||
Noninterest Expense: | ||||||||||||
Salaries and related benefits | 47,871 | 46,125 | 48,011 | |||||||||
Occupancy and equipment | 20,520 | 19,884 | 19,139 | |||||||||
Outsourced data processing services | 9,846 | 9,684 | 9,601 | |||||||||
Limited partnership operating losses | 5,754 | 5,724 | 2,620 | |||||||||
Courier service | 2,652 | 2,614 | 2,177 | |||||||||
Professional fees | 1,751 | 2,628 | 3,253 | |||||||||
Other noninterest expense | 14,822 | 12,702 | 13,005 | |||||||||
Total Noninterest Expense | 103,216 | 99,361 | 97,806 | |||||||||
Income Before Income Taxes | 221,579 | 165,591 | 117,027 | |||||||||
Provision for income taxes | 59,811 | 43,557 | 30,518 | |||||||||
Net Income | $ | 161,768 | $ | 122,034 | $ | 86,509 | ||||||
Average Common Shares Outstanding | 26,703 | 26,895 | 26,855 | |||||||||
Diluted Average Common Shares Outstanding | 26,706 | 26,907 | 26,870 | |||||||||
Per Common Share Data: | ||||||||||||
Basic earnings | $ | 6.06 | $ | 4.54 | $ | 3.22 | ||||||
Diluted earnings | 6.06 | 4.54 | 3.22 | |||||||||
Dividends paid | 1.72 | 1.68 | 1.65 | |||||||||
See accompanying notes to consolidated financial statements.
WESTAMERICA BANCORPORATION
CONSOLIDATED STATEMENTS OF COMPREHENSIVE INCOME (LOSS)
| ||||||||||||
For the Years Ended December 31, | ||||||||||||
2022 | 2021 | 2020 | ||||||||||
(In thousands, except per share data) | ||||||||||||
Interest and Loan Fee Income: | ||||||||||||
Loans | $ | 49,682 | $ | 57,558 | $ | 59,377 | ||||||
Equity securities | 537 | 458 | 419 | |||||||||
Debt securities available for sale | 144,646 | 105,420 | 91,343 | |||||||||
Debt securities held to maturity | 19,101 | 8,875 | 13,552 | |||||||||
Interest-bearing cash | 7,790 | 1,132 | 1,165 | |||||||||
Total Interest and Loan Fee Income | 221,756 | 173,443 | 165,856 | |||||||||
Interest Expense: | ||||||||||||
Deposits | 1,846 | 1,877 | 1,770 | |||||||||
Short-term borrowed funds | 79 | 78 | 53 | |||||||||
Other borrowed funds | - | - | 1 | |||||||||
Total Interest Expense | 1,925 | 1,955 | 1,824 | |||||||||
Net Interest and Loan Fee Income | 219,831 | 171,488 | 164,032 | |||||||||
Provision for Credit Losses | - | - | 4,300 | |||||||||
Net Interest and Loan Fee Income After Provision For Credit Losses | 219,831 | 171,488 | 159,732 | |||||||||
Noninterest Income: | ||||||||||||
Service charges on deposit accounts | 14,490 | 13,697 | 14,149 | |||||||||
Merchant processing services | 11,623 | 11,998 | 10,208 | |||||||||
Debit card fees | 7,879 | 6,859 | 6,181 | |||||||||
Trust fees | 3,216 | 3,311 | 3,012 | |||||||||
ATM processing fees | 2,160 | 2,280 | 2,273 | |||||||||
Other service fees | 1,808 | 1,884 | 1,837 | |||||||||
Financial services commissions | 417 | 356 | 372 | |||||||||
Gains on sales of real property | - | - | 3,536 | |||||||||
Life insurance gains | 930 | - | - | |||||||||
Securities gains | - | 34 | 71 | |||||||||
Other noninterest income | 2,598 | 2,926 | 3,998 | |||||||||
Total Noninterest Income | 45,121 | 43,345 | 45,637 | |||||||||
Noninterest Expense: | ||||||||||||
Salaries and related benefits | 46,125 | 48,011 | 50,749 | |||||||||
Occupancy and equipment | 19,884 | 19,139 | 19,637 | |||||||||
Outsourced data processing services | 9,684 | 9,601 | 9,426 | |||||||||
Limited Partnership Operating Losses | 5,724 | 2,620 | 2,440 | |||||||||
Professional fees | 2,628 | 3,253 | 2,423 | |||||||||
Courier service | 2,614 | 2,177 | 2,001 | |||||||||
Other noninterest expense | 12,702 | 13,005 | 11,890 | |||||||||
Total Noninterest Expense | 99,361 | 97,806 | 98,566 | |||||||||
Income Before Income Taxes | 165,591 | 117,027 | 106,803 | |||||||||
Provision for income taxes | 43,557 | 30,518 | 26,390 | |||||||||
Net Income | $ | 122,034 | $ | 86,509 | $ | 80,413 | ||||||
Average Common Shares Outstanding | 26,895 | 26,855 | 26,942 | |||||||||
Diluted Average Common Shares Outstanding | 26,907 | 26,870 | 26,960 | |||||||||
Per Common Share Data: | ||||||||||||
Basic earnings | $ | 4.54 | $ | 3.22 | $ | 2.98 | ||||||
Diluted earnings | 4.54 | 3.22 | 2.98 | |||||||||
Dividends paid | 1.68 | 1.65 | 1.64 | |||||||||
For the Years Ended December 31, | ||||||||||||
2023 | 2022 | 2021 | ||||||||||
(In thousands) | ||||||||||||
Net Income | $ | 161,768 | $ | 122,034 | $ | 86,509 | ||||||
Other comprehensive income (loss): | ||||||||||||
Changes in net unrealized losses/gains on debt securities available for sale | 93,326 | (434,107 | ) | (91,891 | ) | |||||||
Deferred tax (expense) benefit | (27,591 | ) | 128,338 | 27,167 | ||||||||
Reclassification of losses (gains) included in net income | 125 | - | (34 | ) | ||||||||
Deferred tax (benefit on losses) expense on gains included in net income | (37 | ) | - | 10 | ||||||||
Changes in unrealized losses/gains on debt securities available for sale, net of tax | 65,823 | (305,769 | ) | (64,748 | ) | |||||||
Total Comprehensive Income (Loss) | $ | 227,591 | $ | (183,735 | ) | $ | 21,761 | |||||
See accompanying notes to consolidated financial statements.
WESTAMERICA BANCORPORATION
CONSOLIDATED STATEMENTS OF CHANGES IN SHAREHOLDERS' EQUITY
| ||||||||||||
For the Years Ended December 31, | ||||||||||||
2022 | 2021 | 2020 | ||||||||||
(In thousands) | ||||||||||||
Net Income | $ | 122,034 | $ | 86,509 | $ | 80,413 | ||||||
Other comprehensive (loss) income: | ||||||||||||
Changes in net unrealized (losses) gains on debt securities available for sale | (434,107 | ) | (91,891 | ) | 125,519 | |||||||
Deferred tax benefit (expense) | 128,338 | 27,167 | (37,108 | ) | ||||||||
Reclassification of gains included in net income | - | (34 | ) | (71 | ) | |||||||
Deferred tax expense on gains included in net income | - | 10 | 21 | |||||||||
Changes in unrealized (losses) gains on debt securities available for sale, net of tax | (305,769 | ) | (64,748 | ) | 88,361 | |||||||
Total Comprehensive (Loss) Income | $ | (183,735 | ) | $ | 21,761 | $ | 168,774 | |||||
See accompanying notes to consolidated financial statements.
| ||||||||||||||||||||||||
Accumulated | Accumulated | |||||||||||||||||||||||||||||||||||||||||||||||
Common | Other | Common | Other | |||||||||||||||||||||||||||||||||||||||||||||
Shares | Common | Deferred | Comprehensive | Retained | Shares | Common | Deferred | Comprehensive | Retained | |||||||||||||||||||||||||||||||||||||||
Outstanding | Stock | Compensation | Income (Loss) | Earnings | Total | Outstanding | Stock | Compensation | Income (Loss) | Earnings | Total | |||||||||||||||||||||||||||||||||||||
(In thousands, except per share data) | (In thousands, except per share data) | |||||||||||||||||||||||||||||||||||||||||||||||
Balance, December 31, 2019 | 27,062 | $ | 465,460 | $ | 771 | $ | 26,051 | $ | 239,135 | $ | 731,417 | |||||||||||||||||||||||||||||||||||||
Adoption of ASU 2016-13 | 52 | 52 | ||||||||||||||||||||||||||||||||||||||||||||||
Adjusted Balance, January 1, 2020 | 27,062 | 465,460 | 771 | 26,051 | 239,187 | 731,469 | ||||||||||||||||||||||||||||||||||||||||||
Net income for the year 2020 | 80,413 | 80,413 | ||||||||||||||||||||||||||||||||||||||||||||||
Other comprehensive income | 88,361 | 88,361 | ||||||||||||||||||||||||||||||||||||||||||||||
Exercise of stock options | 52 | 2,838 | 2,838 | |||||||||||||||||||||||||||||||||||||||||||||
Restricted stock activity | 10 | 1,270 | (736 | ) | 534 | |||||||||||||||||||||||||||||||||||||||||||
Stock based compensation | - | 1,875 | 1,875 | |||||||||||||||||||||||||||||||||||||||||||||
Stock awarded to employees | 2 | 100 | 100 | |||||||||||||||||||||||||||||||||||||||||||||
Retirement of common stock | (319 | ) | (5,537 | ) | (10,959 | ) | (16,496 | ) | ||||||||||||||||||||||||||||||||||||||||
Dividends ($1.64 per share) | (44,285 | ) | (44,285 | ) | ||||||||||||||||||||||||||||||||||||||||||||
Balance, December 31, 2020 | 26,807 | 466,006 | 35 | 114,412 | 264,356 | 844,809 | 26,807 | $ | 466,006 | $ | 35 | $ | 114,412 | $ | 264,356 | $ | 844,809 | |||||||||||||||||||||||||||||||
Net income for the year 2021 | 86,509 | 86,509 | 86,509 | 86,509 | ||||||||||||||||||||||||||||||||||||||||||||
Other comprehensive loss | (64,748 | ) | (64,748 | ) | (64,748 | ) | (64,748 | ) | ||||||||||||||||||||||||||||||||||||||||
Exercise of stock options | 53 | 3,017 | 3,017 | 53 | 3,017 | 3,017 | ||||||||||||||||||||||||||||||||||||||||||
Restricted stock activity | 9 | 526 | 526 | 9 | 526 | 526 | ||||||||||||||||||||||||||||||||||||||||||
Stock based compensation | - | 1,419 | 1,419 | - | 1,419 | 1,419 | ||||||||||||||||||||||||||||||||||||||||||
Stock awarded to employees | 1 | 106 | 106 | 1 | 106 | 106 | ||||||||||||||||||||||||||||||||||||||||||
Retirement of common stock | (4 | ) | (66 | ) | (166 | ) | (232 | ) | (4 | ) | (66 | ) | (166 | ) | (232 | ) | ||||||||||||||||||||||||||||||||
Dividends ($1.65 per share) | (44,304 | ) | (44,304 | ) | (44,304 | ) | (44,304 | ) | ||||||||||||||||||||||||||||||||||||||||
Balance, December 31, 2021 | 26,866 | 471,008 | 35 | 49,664 | 306,395 | 827,102 | 26,866 | 471,008 | 35 | 49,664 | 306,395 | 827,102 | ||||||||||||||||||||||||||||||||||||
Net income for the year 2022 | 122,034 | 122,034 | 122,034 | 122,034 | ||||||||||||||||||||||||||||||||||||||||||||
Other comprehensive loss | (305,769 | ) | (305,769 | ) | (305,769 | ) | (305,769 | ) | ||||||||||||||||||||||||||||||||||||||||
Exercise of stock options | 40 | 2,255 | 2,255 | 40 | 2,255 | 2,255 | ||||||||||||||||||||||||||||||||||||||||||
Restricted stock activity | 8 | 492 | 492 | 8 | 492 | 492 | ||||||||||||||||||||||||||||||||||||||||||
Stock based compensation | - | 1,309 | 1,309 | - | 1,309 | 1,309 | ||||||||||||||||||||||||||||||||||||||||||
Stock awarded to employees | 2 | 87 | 87 | 2 | 87 | 87 | ||||||||||||||||||||||||||||||||||||||||||
Retirement of common stock | (3 | ) | (65 | ) | (153 | ) | (218 | ) | (3 | ) | (65 | ) | (153 | ) | (218 | ) | ||||||||||||||||||||||||||||||||
Dividends ($1.68 per share) | (45,182 | ) | (45,182 | ) | (45,182 | ) | (45,182 | ) | ||||||||||||||||||||||||||||||||||||||||
Balance, December 31, 2022 | 26,913 | $ | 475,086 | $ | 35 | $ | (256,105 | ) | $ | 383,094 | $ | 602,110 | 26,913 | 475,086 | 35 | (256,105 | ) | 383,094 | 602,110 | |||||||||||||||||||||||||||||
Net income for the year 2023 | 161,768 | 161,768 | ||||||||||||||||||||||||||||||||||||||||||||||
Other comprehensive income | 65,823 | 65,823 | ||||||||||||||||||||||||||||||||||||||||||||||
Exercise of stock options | 22 | 950 | 950 | |||||||||||||||||||||||||||||||||||||||||||||
Restricted stock activity | 9 | 508 | 508 | |||||||||||||||||||||||||||||||||||||||||||||
Stock based compensation | - | 1,356 | 1,356 | |||||||||||||||||||||||||||||||||||||||||||||
Stock awarded to employees | 1 | 80 | 80 | |||||||||||||||||||||||||||||||||||||||||||||
Retirement of common stock | (274 | ) | (4,844 | ) | (8,903 | ) | (13,747 | ) | ||||||||||||||||||||||||||||||||||||||||
Dividends ($1.72 per share) | (45,954 | ) | (45,954 | ) | ||||||||||||||||||||||||||||||||||||||||||||
Balance, December 31, 2023 | 26,671 | $ | 473,136 | $ | 35 | $ | (190,282 | ) | $ | 490,005 | $ | 772,894 | ||||||||||||||||||||||||||||||||||||
See accompanying notes to consolidated financial statements.
WESTAMERICA BANCORPORATION
CONSOLIDATED STATEMENTS OF CASH FLOWS
| ||||||||||||
For the Years Ended December 31, | For the Years Ended December 31, | |||||||||||||||||||||||
2022 | 2021 | 2020 | 2023 | 2022 | 2021 | |||||||||||||||||||
Operating Activities: | (In thousands) | (In thousands) | ||||||||||||||||||||||
| Net income | $ | 122,034 | $ | 86,509 | $ | 80,413 | $ | 161,768 | $ | 122,034 | $ | 86,509 | ||||||||||||
| Adjustments to reconcile net income to net cash provided by operating activities: | ||||||||||||||||||||||||
| Depreciation and amortization/accretion | 16,565 | 16,617 | 22,647 | 11,774 | 16,565 | 16,617 | ||||||||||||||||||
| Provision for credit losses | - | - | 4,300 | |||||||||||||||||||||
| Reversal of Provision for credit losses | (1,150 | ) | - | - | ||||||||||||||||||||
| Net amortization of deferred loan fees | (1,704 | ) | (5,576 | ) | (4,442 | ) | (573 | ) | (1,704 | ) | (5,576 | ) | ||||||||||||
| Stock option compensation expense | 1,309 | 1,419 | 1,875 | 1,356 | 1,309 | 1,419 | ||||||||||||||||||
| Life insurance gains | (930 | ) | - | - | (279 | ) | (930 | ) | - | |||||||||||||||
| Securities gains | - | (34 | ) | (71 | ) | |||||||||||||||||||
| Gains on sales of premises and equipment | - | - | (3,536 | ) | ||||||||||||||||||||
| Gain on disposal of premises and equipment | - | - | (71 | ) | ||||||||||||||||||||
| Securities losses (gains) | 125 | - | (34 | ) | ||||||||||||||||||||
| Net changes in: | ||||||||||||||||||||||||
| Interest income receivable | (18,037 | ) | (2,499 | ) | (4,225 | ) | (1,010 | ) | (18,037 | ) | (2,499 | ) | ||||||||||||
| Net deferred tax liability | 697 | 3,899 | (246 | ) | ||||||||||||||||||||
| Net deferred taxes | (1,995 | ) | 697 | 3,899 | ||||||||||||||||||||
| Other assets | (2,415 | ) | (3,534 | ) | (3,528 | ) | (3,443 | ) | (2,415 | ) | (3,534 | ) | ||||||||||||
| Income taxes payable | 3,020 | (1,054 | ) | 353 | (869 | ) | 3,020 | (1,054 | ) | |||||||||||||||
| Interest expense payable | (10 | ) | (72 | ) | (5 | ) | (12 | ) | (10 | ) | (72 | ) | ||||||||||||
| Other liabilities | (6,827 | ) | (6,940 | ) | 14,280 | (7,484 | ) | (6,827 | ) | (6,940 | ) | |||||||||||||
Net Cash Provided by Operating Activities | 113,702 | 88,735 | 107,744 | 158,208 | 113,702 | 88,735 | ||||||||||||||||||
Investing Activities: | ||||||||||||||||||||||||
| Net repayments (disbursements) of loans | 108,107 | 193,755 | (126,682 | ) | ||||||||||||||||||||
| Net repayments of loans | 90,192 | 108,107 | 193,755 | |||||||||||||||||||||
| Proceeds from life insurance policies | 3,041 | - | - | 604 | 3,041 | - | ||||||||||||||||||
| Purchases of debt securities available for sale | (636,228 | ) | (1,909,370 | ) | (2,102,983 | ) | - | (636,228 | ) | (1,909,370 | ) | |||||||||||||
| Proceeds from sale/maturity/calls of debt securities available for sale | 500,160 | 1,204,455 | 1,260,846 | 416,447 | 500,160 | 1,204,455 | ||||||||||||||||||
| Purchases of debt securities held to maturity | (718,940 | ) | - | - | - | (718,940 | ) | - | ||||||||||||||||
| Proceeds from maturity/calls of debt securities held to maturity | 111,059 | 206,400 | 218,164 | 43,518 | 111,059 | 206,400 | ||||||||||||||||||
| Purchase of Federal Reserve Bank stock | (2,326 | ) | - | - | ||||||||||||||||||||
| Proceeds from redemption of Federal Reserve Bank stock | 2,326 | - | - | - | 2,326 | - | ||||||||||||||||||
| Purchases of premises and equipment | (811 | ) | (1,324 | ) | (2,200 | ) | (1,161 | ) | (811 | ) | (1,324 | ) | ||||||||||||
| Proceeds from sale of premises and equipment | - | - | 3,819 | |||||||||||||||||||||
| Proceeds from sale of foreclosed assets | - | - | 114 | |||||||||||||||||||||
Net Cash Used in Investing Activities | (631,286 | ) | (306,084 | ) | (748,922 | ) | ||||||||||||||||||
Net Cash Provided by (Used in) Investing Activities | 547,274 | (631,286 | ) | (306,084 | ) | |||||||||||||||||||
Financing Activities: | ||||||||||||||||||||||||
| Net change in deposits | (188,666 | ) | 725,977 | 875,358 | (751,023 | ) | (188,666 | ) | 725,977 | |||||||||||||||
| Net change in short-term borrowings | (88,454 | ) | 43,701 | 71,617 | 370 | (88,454 | ) | 43,701 | ||||||||||||||||
| Exercise of stock options | 2,255 | 3,017 | 2,838 | 950 | 2,255 | 3,017 | ||||||||||||||||||
| Retirement of common stock | (218 | ) | (232 | ) | (16,496 | ) | (13,747 | ) | (218 | ) | (232 | ) | ||||||||||||
| Common stock dividends paid | (45,182 | ) | (44,304 | ) | (44,285 | ) | (45,954 | ) | (45,182 | ) | (44,304 | ) | ||||||||||||
Net Cash (Used in) Provided by Financing Activities | (320,265 | ) | 728,159 | 889,032 | (809,404 | ) | (320,265 | ) | 728,159 | |||||||||||||||
Net Change In Cash and Due from Banks | (837,849 | ) | 510,810 | 247,854 | (103,922 | ) | (837,849 | ) | 510,810 | |||||||||||||||
Cash and Due from Banks at Beginning of Period | 1,132,085 | 621,275 | 373,421 | 294,236 | 1,132,085 | 621,275 | ||||||||||||||||||
Cash and Due from Banks at End of Period | $ | 294,236 | $ | 1,132,085 | $ | 621,275 | $ | 190,314 | $ | 294,236 | $ | 1,132,085 | ||||||||||||
Supplemental Cash Flow Disclosures: | ||||||||||||||||||||||||
| Supplemental disclosure of noncash activities: | ||||||||||||||||||||||||
| Right-of-use assets acquired in exchange for operating lease liabilities | $ | 3,533 | $ | 5,105 | $ | 7,697 | $ | 8,866 | $ | 3,533 | $ | 5,105 | ||||||||||||
| Securities purchases pending settlement | - | - | 29,000 | |||||||||||||||||||||
| Supplemental disclosure of cash flow activities: | ||||||||||||||||||||||||
| Cash paid for amounts included in operating lease liabilities | 6,037 | 6,309 | 6,516 | 6,217 | 6,037 | 6,309 | ||||||||||||||||||
| Interest paid for the period | 1,935 | 2,027 | 1,830 | 3,902 | 1,935 | 2,027 | ||||||||||||||||||
| Income tax payments for the period | 39,840 | 27,673 | 26,462 | 64,017 | 39,840 | 27,673 | ||||||||||||||||||
See accompanying notes to consolidated financial statements.
WESTAMERICA BANCORPORATION
NOTES TO CONSOLIDATED FINANCIAL STATEMENTS
Note 1: Business and Accounting Policies
Westamerica Bancorporation, a registered bank holding company (the “Company”), provides a full range of banking services to corporate and individual customers in Northern and Central California through its wholly-owned subsidiary bank, Westamerica Bank (the “Bank”). The Bank is subject to competition from both financial and nonfinancial institutions and to the regulations of certain agencies and undergoes periodic examinations by those regulatory authorities. All of the financial service operations are considered by management to be aggregated in one reportable operating segment.
The Company has evaluated events and transactions subsequent to the balance sheet date. Based on this evaluation, the Company is not aware of any events or transactions that occurred subsequent to the balance sheet date but prior to filing that would require recognition or disclosure in its consolidated financial statements. Certain amounts in prior periods have been reclassified to conform to the current presentation.
Certain risks, uncertainties and other factors may cause actual future resultsManagement continues to differ materially fromactively evaluate the results discussed in this report on Form 10-K. Recent events that could affect the Company’s operations include the COVID-19 pandemic,impacts of inflation, and the Federal Reserve’s monetary policy and climate changes and the war in Ukraine. Management continues to actively monitor their impact on the Company’s business. During the first half of 2023, the banking industry experienced significant volatility with several bank failures. Industrywide concerns developed related to liquidity, deposit outflows and unrealized losses on investment debt securities. These events could adversely affect the Company’s ability to effectively fund its operations. Any one or a combination of such risk factors, or other factors, could materially adversely affect the Company's business, financial condition, results of operations and prospects. The extent of the impact on the Company’s results of operations, cash flow, liquidity, and financial performance, as well as the Company’s ability to execute near- and long-term business strategies and initiatives, will depend on numerous evolving factors and future developments, which are highly uncertain and cannot be reasonably predicted. Any one or a combination of such risk factors, or other factors, could materially adversely affect the Company's business, financial condition, results of operations and prospects.
Summary of Significant Accounting Policies
The consolidated financial statements are prepared in conformity with accounting principles generally accepted in the United States of America. The accounting policies, along with the disclosures presented in the other financial statement notes and in this discussion, provide information on how significant assets and liabilities are valued in the financial statements and how those values are determined. Based on the valuation techniques used and the sensitivity of financial statement amounts to the methods, assumptions, and estimates underlying those amounts, it is reasonably possible conditions could change materially affecting results of operations and financial conditions. The following is a summary of significant policies used in the preparation of the accompanying financial statements.
Accounting Estimates. Certain accounting policies underlying the preparation of these financial statements require Management to make estimates, assumptions, and judgments that affect the amounts reported in the financial statements and accompanying notes. These estimates, assumptions, and judgments are based on information available as of the date of the financial statements; accordingly, as this information changes, the financial statements could reflect different estimates, assumptions, and judgments and as such have a greater possibility of producing results that could be materially different than originally reported. Estimates, assumptions, and judgments are necessary when assets and liabilities are required to be recorded at fair value, when a decline in fair value of an asset not carried on the financial statements at fair value warrants an impairment writedown or valuation reserve to be established, or when an asset or liability needs to be recorded contingent upon a future event. The allowance for credit losses accounting is an area requiring the most subjective or complex judgments, and as such could be most subject to revision as new information becomes available. A discussion of the factors affecting the accounting for the allowance for credit losses on loans is included in the following “Loans” and “Allowance for Credit Losses” sections. Carrying assets and liabilities at fair value inherently results in financial statement volatility. The fair values and the information used to record valuation adjustments for certain assets and liabilities are based either on quoted market prices or are provided by other third party sources, when available. The “Securities” section discusses the factors that may affect the valuation of the Company’s securities. Although the estimates contemplate current conditions actual results can change.
Principles of Consolidation. The consolidated financial statements include the accounts of the Company and all the Company’s subsidiaries. Significant intercompany transactions have been eliminated in consolidation. The Company does not maintain or conduct transactions with any unconsolidated special purpose entities.
Cash. Cash includes Due From Banks balances which are readily convertible to known amounts of cash and are generally 90 days or less from maturity at the time of initiation, presenting insignificant risk of changes in value due to interest rate changes.
Equity Securities. Equity securities consist of marketable equity securities and mutual funds which are recorded at fair value. Unrealized gains and losses are included in net income. There were no equity securities at December 31, 20222023 and December 31, 2021.
2022.
Debt Securities. Debt securities consist of the U.S. Treasury, securities of government sponsored entities, states, counties, municipalities, corporations, agency and non-agency mortgage-backed securities, collateralized loan obligations and commercial paper. Securities transactions are recorded on a trade date basis. The Company classifies its debt securities in one of three categories: trading, available for sale or held to maturity. Trading securities are bought and held principally for the purpose of selling them in the near term. Trading securities are recorded at fair value with unrealized gains and losses included in net income. Held to maturity debt securities are those securities which the Company has the ability and intent to hold until maturity. Held to maturity debt securities are recorded at cost, adjusted for the amortization of premiums or accretion of discounts. Securities not included in trading or held to maturity are classified as available for sale debt securities. Available for sale debt securities are recorded at fair value. Unrealized gains and losses, net of the related tax effect, on available for sale debt securities are included in accumulated other comprehensive income. Accrued interest is recorded within other assets and reversed against interest income if it is not received.
The Company utilizes third-party sources to value its investment securities; securities individually valued using quoted prices in active markets are classified as Level 1 assets in the fair value hierarchy, and securities valued using quoted prices in active markets for similar securities (commonly referred to as “matrix” pricing) are classified as Level 2 assets in the fair value hierarchy. The Company validates the reliability of third-party provided values by comparing individual security pricing for securities between more than one third-party source. When third-party information is not available, valuation adjustments are estimated in good faith by Management and classified as Level 3 in the fair value hierarchy.
The Company follows the guidance issued by the Board of Governors of the Federal Reserve System, “Investing in Securities without Reliance on Nationally Recognized Statistical Rating Agencies” (SR 12-15) and other regulatory guidance when performing investment security pre-purchase analysis or evaluating investment securities for credit loss. Credit ratings issued by recognized rating agencies are considered in the Company’s analysis only as a guide to the historical default rate associated with similarly-rated bonds.
To the extent that debt securities in the held-to-maturity portfolio share common risk characteristics, estimated expected credit losses are calculated in a manner like that used for loans held for investment. That is, for pools of such securities with common risk characteristics, the historical lifetime probability of default and severity of loss in the event of default is derived or obtained from external sources and adjusted for the expected effects of reasonable and supportable forecasts over the expected lives of the securities on those historical credit losses. Expected credit loss on each security in the held-to-maturity portfolio that do not share common risk characteristics with any of the pools of debt securities is individually evaluated and a reserve for credit losses is established at the difference between the discounted value of the expected future cash flows, based on the original effective interest rate, and the recorded amortized cost basis of the security. For certain classes of debt securities, the bank considers the history of credit losses, current conditions and reasonable and supportable forecasts, which may indicate that the expectation that nonpayment of the amortized cost basis is or continues to be zero. Therefore, for those securities, the bank does not record expected credit losses.
Available for sale debt securities in unrealized loss positions are evaluated for credit related loss at least quarterly. For available for sale debt securities, a decline in fair value due to credit loss results in recording an allowance for credit losses to the extent the fair value is less than the amortized cost basis. Declines in fair value that have not been recorded through an allowance for credit losses, such as declines due to changes in market interest rates, are recorded through other comprehensive income, net of applicable taxes. Although these evaluations involve significant judgment, an unrealized loss in the fair value of a debt security is generally considered to not be related to credit when the fair value of the security is below the carrying value primarily due to changes in risk-free interest rates, there has not been significant deterioration in the financial condition of the issuer, and the Company does not intend to sell nor does it believe it will be required to sell the security before the recovery of its cost basis.
If the Company intends to sell a debt security or more likely than not will be required to sell the security before recovery of its amortized cost basis, the debt security is written down to its fair value and the write down is charged against the allowance for credit losses with any incremental loss reported in earnings.
Purchase premiums are amortized to the earliest call date and purchase discounts are amortized to maturity as an adjustment to yield using the effective interest method. Unamortized premiums, unaccreted discounts, and early payment premiums are recognized as a component of gain or loss on sale upon disposition of the related security. Interest and dividend income are recognized when earned. Realized gains and losses from the sale of available for sale debt securities are included in earnings using the specific identification method.
Nonmarketable Equity Securities. Nonmarketable equity securities include securities that are not publicly traded, such as Visa Class B common stock, and securities acquired to meet regulatory requirements, such as Federal Reserve Bank stock, which are restricted. These restricted securities are accounted for under the cost method and are included in other assets. The Company reviews those assets accounted for under the cost method at least quarterly. The Company’s review typically includes an analysis of the facts and circumstances of each investment, the expectations for the investment’s cash flows and capital needs, the viability of its business model and any exit strategy. When the review indicates that impairment exists the asset value is reduced to fair value. The Company recognizes the estimated loss in noninterest income.
Loans. Loans are stated at the principal amount outstanding, net of unearned discount and unamortized deferred fees and costs. Interest is accrued daily on the outstanding principal balances and included in other assets. Loans which are more than 90 days delinquent with respect to interest or principal, unless they are well secured and in the process of collection, and other loans on which full recovery of principal or interest is in doubt, are placed on nonaccrual status. Interest previously accrued on loans placed on nonaccrual status is charged against interest income. In addition, some loans secured by real estate and commercial loans to borrowers experiencing financial difficulties are placed on nonaccrual status even though the borrowers continue to repay the loans as scheduled. When the ability to fully collect nonaccrual loan principal is in doubt, payments received are applied against the principal balance of the loans on a cost-recovery method until such time as full collection of the remaining recorded balance is expected. Any additional interest payments received after that time are recorded as interest income on a cash basis. Nonaccrual loans are reinstated to accrual status when none of the loan’s principal and interest is past due and improvements in credit quality eliminate doubt as to the full collectability of both principal and interest, or the loan otherwise becomes well secured and in the process of collection. Certain consumer loans or auto receivables are charged off against the allowance for credit losses when they become 120 days past due.
A troubled debt restructuring (“TDR”) occurs when the Company, for reasons related to a borrower’s financial difficulties, grants a concession to the borrower it would not otherwise consider. The Company follows its general nonaccrual policy for TDRs. Performing TDRs are reinstated to accrual status when improvements in credit quality eliminate the doubt as to full collectability of both principal and interest. Under the Coronavirus Aid, Relief, and Economic Security Act (the “CARES Act”), banks may elect to deem that loan modifications do not result in TDRs if they are (1) related to the novel coronavirus disease; (2) executed on a loan that was not more than 30 days past due as of December 31, 2019; and (3) executed between March 1, 2020, and the earlier of (A) 60 days after the date of termination of the National Emergency or (B) December 31, 2020.The Consolidated Appropriations Act, 2021, extended the period during which banks may elect to deem that qualified loan modifications do not result in TDR classification through January 1, 2022.
Allowance for Credit Losses. The Company extends loans to commercial and consumer customers primarily in Northern and Central California. These lending activities expose the Company to the risk borrowers will default, causing loan losses. The Company’s lending activities are exposed to various qualitative risks. All loan segments are exposed to risks inherent in the economy and market conditions. Significant risk characteristics related to the commercial loan segment include the borrowers’ business performance and financial condition, and the value of collateral for secured loans. Significant risk characteristics related to the commercial real estate segment include the borrowers’ business performance and the value of properties collateralizing the loans. Significant risk characteristics related to the construction loan segment include the borrowers’ performance in successfully developing the real estate into the intended purpose and the value of the property collateralizing the loans. Significant risk characteristics related to the residential real estate segment include the borrowers’ financial wherewithal to service the mortgages and the value of the property collateralizing the loans. Significant risk characteristics related to the consumer loan segment include the financial condition of the borrowers and the value of collateral securing the loans.
The preparation of these financial statements requires Management to estimate the amount of expected losses over the expected contractual life of the Bank’s existing loan portfolio and establish an allowance for credit losses. Loan agreements generally include a maturity date, and the Company considers the contractual life of a loan agreement to extend from the date of origination to the contractual maturity date. In estimating credit losses, Management must exercise significant judgment in evaluating information deemed relevant. The amount of ultimate losses on the loan portfolio can vary from the estimated amounts. Management follows a systematic methodology to estimate loss potential in an effort to reduce the differences between estimated and actual losses.
The allowance for credit losses is established through provisions for credit losses charged to income. Losses on loans are charged to the allowance for credit losses when all or a portion of the recorded amount of a loan is deemed to be uncollectible. Recoveries of loans previously charged off are credited to the allowance when realized. The Company’s allowance for credit losses is maintained at a level considered adequate to provide for expected losses based on historical loss rates adjusted for current and expected conditions over a forecast period. These include conditions unique to individual borrowers, as well as overall credit loss experience, the amount of past due, nonperforming and classified loans, recommendations of regulatory authorities, prevailing economic conditions, or credit protection agreements and other factors.
Loans that share common risk characteristics are segregated into pools based on common characteristics, which is primarily determined by loan, borrower, or collateral type. Historical loss rates are determined for each pool. For consumer installment loans, primarily secured by automobiles, historical loss rates are determined using a vintage methodology, which tracks losses based on period of origination. For commercial, construction, and commercial real estate, historical loss rates are determined using an open pool methodology where losses are tracked over time for all loans included in the pool at the historical measurement date. Historical loss rates are adjusted for factors that are not reflected in the historical loss rates that are attributable to national or local economic or industry trends which have occurred but have not yet been recognized in past loan charge-off history, estimated losses based on management’s reasonable and supportable expectation of economic trends over a forecast horizon of up to two years, and other factors that impact credit loss expectations that are not reflected in the historical loss rates. Other factors include, but are not limited to, the effectiveness of the Company’s loan review system, adequacy of lending Management and staff, loan policies and procedures, problem loan trends, and concentrations of credit. At the end of the two-year forecast period loss rates revert immediately to the historical loss rates. The results of this analysis are applied to the amortized cost of the loans included within each pool.
Loans that do not share risk characteristics with other loans in the pools are evaluated individually. A loan is considered ‘collateral-dependent’ when the borrower is experiencing financial difficulty and repayment is expected to be provided substantially through the operation or sale of the collateral. A credit loss reserve for collateral-dependent loans is established at the difference between the amortized cost basis in the loan and the fair value of the underlying collateral adjusted for costs to sell. For other individually evaluated loans that are not collateral dependent, a credit loss reserve is established at the difference between the amortized cost basis in the loan and the present value of expected future cash flows discounted at the loan’s effective interest rate. The impact of an expected TDR modification to be made to loans to borrowers experiencing financial difficulty is included in the allowance for credit losses when management determines a TDRsuch modification is likely.
Accrued interest is recorded in other assets and is excluded from the estimation of expected credit loss. Accrued interest is reversed through interest income when amounts are determined to be uncollectible, which generally occurs when the underlying receivable is placed on nonaccrual status or charged off.
Liability for Off-Balance Sheet Credit Exposures. Off-balance sheet credit exposures relate to letters of credit and unfunded loan commitments for commercial, construction and consumer loans. The Company maintains a separate allowance for credit losses from off-balance-sheet credit exposures, which is included within other liabilities on the consolidated statements of financial condition. Increases or reductions to the Company’s allowance for credit losses from off-balance sheet credit exposures are recorded in other expenses. Management estimates the amount of expected losses by estimating expected usage exposures that are not unconditionally cancellable by the Company and applying the loss factors used in the allowance for credit loss methodology to estimate the liability for credit losses related to unfunded commitments. No credit loss estimate is reported for off-balance-sheet credit exposures that are unconditionally cancellable by the Company or for undrawn amounts under such arrangements that may be drawn prior to the cancellation of the arrangement.
Nonrefundable fees and certain costs associated with originating or acquiring loans are deferred and amortized as an adjustment to interest income over the contractual loan lives. Upon prepayment, unamortized loan fees, net of costs, are immediately recognized in interest income. Other fees, including those collected upon principal prepayments, are included in interest income when received. Loans held for sale are identified upon origination and are reported at the lower of cost or market value on an aggregate loan basis.
Other Real Estate Owned. Other real estate owned is comprised of property acquired through foreclosure proceedings, acceptances of deeds-in-lieu of foreclosure and, if applicable, vacated bank properties. Losses recognized at the time of acquiring property in full or partial satisfaction of debt are charged against the allowance for credit losses. Other real estate owned is recorded at the fair value of the collateral, generally based upon an independent property appraisal, less estimated disposition costs. Losses incurred subsequent to acquisition due to any decline in annual independent property appraisals are recognized as noninterest expense. Routine holding costs, such as property taxes, insurance and maintenance, and losses from sales and dispositions, are recognized as noninterest expense.
Premises and Equipment. Premises and equipment are stated at cost, less accumulated depreciation and amortization. Depreciation is computed substantially on the straight-line method over the estimated useful life of each type of asset. Estimated useful lives of premises and equipment range from 20 to 50 years and from 3 to 20 years, respectively. Leasehold improvements are amortized over the terms of the lease or their estimated useful life, whichever is shorter.
Revenue Recognition. The Company recognizes revenue as it is earned based on contractual terms, as transactions occur, or as services are provided and collectability is reasonably assured. In certain circumstances, noninterest income is reported net of associated expenses that are directly related to variable volume-based sales or revenue sharing arrangements or when the Company acts on an agency basis for others.
Life Insurance Cash Surrender Value. The Company has purchased life insurance policies on certain directors and officers as well as acquired such assets as part of the acquisition of other banks. Company owned life insurance is recorded at the amount that can be realized under the insurance contract at the balance sheet date, which is the cash surrender value adjusted for other charges or other amounts due that are probable at settlement. These assets are included in other assets on the consolidated balance sheets.
Intangible Assets. Intangible assets are comprised of goodwill, core deposit intangibles and other identifiable intangibles acquired in business combinations. Intangible assets with finite useful lives are amortized on an accelerated basis over their respective estimated useful lives not exceeding 15 years. Intangible assets with a finite useful life are reviewed at least annually for impairment. Any goodwill and any intangible asset acquired in a business combination determined to have an indefinite useful life is not amortized and is reviewed at least annually for impairment. If management determines, based on a qualitative review of events and circumstances, that it is more likely than not that the carrying value of the intangible asset will not be realized, an impairment test is performed to determine whether the asset’s fair value is less than the carrying amount of the asset.
Impairment of Long-Lived Assets. The Company reviews its long-lived and certain intangible assets for impairment whenever events or changes indicate that the carrying amount of an asset may not be recoverable. If such assets are considered to be impaired, the impairment to be recognized is measured by the amount by which the carrying amount of the assets exceeds the fair value of the assets. Assets to be disposed of are reported at the lower of the carrying amount or fair value less costs to sell.
Income Taxes. The Company and its subsidiaries file consolidated tax returns. The Company accounts for income taxes in accordance with FASB ASC 740, Income Taxes, resulting in two components of income tax expense: current and deferred. Current income tax expense approximates taxes to be paid or refunded for the current period. The Company determines deferred income taxes using the balance sheet method. Under this method, the net deferred tax asset or liability is based on the tax effects of the differences between the book and tax bases of assets and liabilities, and recognizes enacted changes in tax rates and laws in the period in which they occur. Deferred income tax expense results from changes in deferred tax assets and liabilities between periods. Deferred tax assets are recognized subject to Management’s judgment that realization is more likely than not. A tax position that meets the more likely than not recognition threshold is measured to determine the amount of benefit to recognize. The tax position is measured at the largest amount of benefit that is greater than fifty percent likely of being realized upon settlement. Interest and penalties are recognized as a component of income tax expense.
Stock-based
Stock-Based Compensation. The Company applies FASB ASC 718 – Compensation – Stock Compensation, to account for stock based awards granted to employees using the fair value method. The Company recognizes compensation expense for restricted performance share grants over the relevant attribution period. Restricted performance share grants have no exercise price, therefore, the intrinsic value is measured using an estimated per share price at the vesting date for each restricted performance share. The estimated per share price is adjusted during the attribution period to reflect actual stock price performance. The Company’s obligation for unvested outstanding restricted performance share grants is classified as a liability until the vesting date due to a cash settlement feature, at which time the issued shares become classified as shareholders’ equity.
Other. Securities and other property held by the Bank in a fiduciary or agency capacity are not included in the financial statements since such items are not assets of the Company or its subsidiaries.
Recently Adopted Accounting Standards
In the year ended December 31, 2021, the Company adopted the following new accounting guidance:
FASB ASU 2019-12, Income Taxes (Topic 740): Simplifying the Accounting for Income Taxes, was issued December 2019. The ASU is intended to simplify various aspects related to accounting for income taxes, eliminates certain exceptions to the general principles in ASC Topic 740 related to intra-period tax allocation, simplifies when companies recognize deferred taxes in an interim period, and clarifies certain aspects of the current guidance to promote consistent application. This guidance effective for public entities for fiscal years beginning after December 15, 2020, and for interim period within those fiscal years, with early adoption permitted. The Company adopted the ASU provisions on January 1, 2021 and the adoption of the ASU provisions did not have a significant impact on the Company’s consolidated financial statements.
In the year ended 2020,December 31, 2023, the Company adopted the following new accounting guidance:
FASB ASU 20162022-13,02, Financial Instruments –- Credit Losses (Topic 326): Measurement of Credit Losses on Financial Instruments,Troubled Debt Restructurings and Vintage Disclosures was, issued on June 16, 2016.March 2022, eliminates the recognition and measurement guidance for troubled debt restructurings and requires enhanced disclosures about loan modifications for borrowers experiencing financial difficulty. This ASU also requires enhanced disclosure for loans that have been charged off. The ASU significantly changed estimates for credit losses related to financial assets measured at amortized cost and certain other contracts. For estimating credit losses, the FASB replaced the incurred loss model with the current expected credit loss (CECL) model, which accelerated recognition of credit losses. Additionally, credit losses relating to debt securities available-for-sale are recorded through an allowance for credit losses became effective January 1, 2023 under the new standard. The Company is also required to provide additional disclosures related to the financial assets within the scope of the new standard.
a prospective approach. The Company adopted the ASU provisions on a modified retrospective basis onto remove the recognition and measurement guidance for troubled debt restructurings and/or modify relevant disclosures in the “Loans” note to the consolidated financial statements. The requirement to include additional disclosures was adopted by the Company January 1, 2020.2023. Management evaluated available data, defined portfolio segments of loans with similar attributes, and selected loss estimate models for each identified loan portfolio segment. Management measured historical loss rates for each portfolio segment. Management also segmented debt securities held to maturity, selected methods to estimate losses for each segment, and measured a loss estimate. Agency mortgage-backed securities were assignedThe additional disclosures did nonot credit loss allowance due toaffect the perceived backing of government sponsored entities. Municipal securities were evaluated for risk of default based on credit rating and remaining term to maturity using Moody’s risk of default factors; Moody’s lossfinancial results upon default factors were applied to the assumed defaulted principal amounts to estimate the amount for credit loss allowance. The adjustment to the allowance for credit losses was recorded through an offsetting after-tax adjustment to shareholders’ equity. The implementing entry increased allowance for credit losses by $2,017 thousand, reduced allowance for credit losses for unfunded credit commitments by $2,107 thousand and increased retained earnings by $52 thousand.
The following table summarizes the impact of adoption of ASU 2016-13.adoption.
January 1, 2020 | ||||||||||||
Balance, | Impact of | As reported | ||||||||||
prior to adoption | adoption of | under | ||||||||||
of ASU 2016-13 | ASU 2016-13 | ASU 2016-13 | ||||||||||
(In thousands) | ||||||||||||
Assets: | ||||||||||||
Allowance for credit losses on loans: | ||||||||||||
Commercial | $ | 4,959 | $ | 3,385 | $ | 8,344 | ||||||
Commercial real estate | 4,064 | 618 | 4,682 | |||||||||
Construction | 109 | (31 | ) | 78 | ||||||||
Residential real estate | 206 | (132 | ) | 74 | ||||||||
Consumer and other installment loans | 6,445 | 1,878 | 8,323 | |||||||||
Unallocated | 3,701 | (3,701 | ) | - | ||||||||
Allowance for credit losses on loans: | $ | 19,484 | $ | 2,017 | $ | 21,501 | ||||||
Allowance for credit losses on debt securities held to maturity | - | 16 | 16 | |||||||||
Liabilities: | ||||||||||||
Allowance for credit losses for unfunded commitments | 2,160 | (2,107 | ) | 53 | ||||||||
Recently Issued Accounting Standards
FASB ASU 2020-04, Reference Rate Reform (Topic 848): Facilitation of the Effects of Reference Rate Reform on Financial Reporting, was issued March 2020. The ASU provides optional expedients and exceptions for applying GAAP to loan and lease agreements, derivative contracts, and other transactions affected by the anticipated transition away from LIBOR toward new interest rate benchmarks. For transactions that are modified because of reference rate reform and that meet certain scope guidance (i) modifications of loan agreements should be accounted for by prospectively adjusting the effective interest rate and the modification will be considered "minor" so that any existing unamortized origination fees/costs would carry forward and continue to be amortized and (ii) modifications of lease agreements should be accounted for as a continuation of the existing agreement with no reassessments of the lease classification and the discount rate or remeasurements of lease payments that otherwise would be required for modifications not accounted for as separate contracts. ASU 2020-04 also provides numerous optional expedients for derivative accounting. In December 2022, the FASB issued ASU 2022-06, Reference Rate Reform (Topic 848): Deferral of the Sunset Date of Topic 848.” The ASU 2022-06 deferred the sunset date of ASU 2020-04 to December 2024. Once elected for a Topic or an Industry Subtopic within the Codification, the amendments in this ASU must be applied prospectively for all eligible contract modifications for that Topic or Industry Subtopic. The Company does not expect any material impact on its consolidated financial statements sincestatements.
FASB ASU 2022-03, Fair Value Measurement (Topic 820): Fair Value Measurement of Equity Securities Subject to Contractual Sale Restrictions, was issued June 2022. The ASU clarifies the guidance in Topic 820 when measuring the fair value of an equity security subject to contractual restrictions that prohibit the sale of an equity security. Additionally, the ASU requires specific disclosures related to equity securities that are subject to contractual sale restrictions. The required disclosures include (1) the fair value of such equity securities reflected in the balance sheet, (2) the nature and remaining duration of the corresponding restrictions, and (3) any circumstances that could cause a lapse in the restrictions. The ASU is effective for fiscal years beginning after December 15, 2023, and interim periods within those fiscal years, with early adoption permitted. The Company has an insignificant numberis currently evaluating the impact of this ASU on its consolidated financial instruments applicable to this ASU.statements.
FASB ASU 20222023-02, Financial Instruments - Credit LossesInvestments – Equity Method and Joint Ventures (Topic 326323): Troubled Debt Restructurings and Vintage DisclosuresAccounting for Investments in Tax Credit Structures Using the Proportional Amortization Method, was issued March 2022.2023. The ASU eliminatesexpands the recognition and measurement guidance for troubled debt restructurings and requires enhanced disclosures about loan modifications for borrowers experiencing financial difficulty. Thisuse of the proportional amortization method of accounting, currently only available to investments in low-income housing tax credit structures, to equity investments in other tax credit structures that meet certain criteria. The ASU also requires enhanced disclosureadditional disclosures for loans that have been charged off.any tax credit program where the proportional amortization method is elected. The ASU is effective infor fiscal years beginning after January 1,December 15, 2023, under a prospective approach. Adoptionand interim periods within those fiscal years, with early adoption permitted. The Company is currently evaluating the impact of this ASU is not expected to have a material impact on the Company’sits consolidated financial statements.
[The remainder of this page intentionally left blank]
Note 2: Investment Securities
An analysis of the amortized cost and fair value by major categories of debt securities available for sale, which are carried at fair value with net unrealized gains (losses) reported on an after-tax basis as a component of accumulated other comprehensive income, and debt securities held to maturity, which are carried at amortized cost, before allowance for credit losses of $1 thousand at December 31, 20222023 and $7 thousand at December 31, 2021,2022, follows:follows. In accordance with GAAP, unrealized gains and losses on held to maturity securities have not been recognized in the Company’s financial statements.
At December 31, 2022 | ||||||||||||||||
Gross | Gross | |||||||||||||||
Amortized | Unrealized | Unrealized | Fair | |||||||||||||
Cost | Gains | Losses | Value | |||||||||||||
(In thousands) | ||||||||||||||||
Debt securities available for sale | ||||||||||||||||
Agency residential mortgage-backed securities ("MBS") | $ | 311,089 | $ | 4 | $ | (25,045 | ) | $ | 286,048 | |||||||
Securities of U.S. Government sponsored entities | 306,336 | 3 | (15,486 | ) | 290,853 | |||||||||||
Obligations of states and political subdivisions | 84,024 | 59 | (2,079 | ) | 82,004 | |||||||||||
Corporate securities | 2,406,566 | 1,032 | (307,643 | ) | 2,099,955 | |||||||||||
Collateralized loan obligations | 1,587,326 | 527 | (14,970 | ) | 1,572,883 | |||||||||||
Total debt securities available for sale | 4,695,341 | 1,625 | (365,223 | ) | 4,331,743 | |||||||||||
Debt securities held to maturity | ||||||||||||||||
Agency residential MBS | 104,852 | 13 | (7,503 | ) | 97,362 | |||||||||||
Obligations of states and political subdivisions | 89,208 | 73 | (538 | ) | 88,743 | |||||||||||
Corporate securities | 721,854 | - | (34,448 | ) | 687,406 | |||||||||||
Total debt securities held to maturity | 915,914 | 86 | (42,489 | ) | 873,511 | |||||||||||
Total | $ | 5,611,255 | $ | 1,711 | $ | (407,712 | ) | $ | 5,205,254 | |||||||
At December 31, 2021 | ||||||||||||||||
Gross | Gross | |||||||||||||||
Amortized | Unrealized | Unrealized | Fair | |||||||||||||
Cost | Gains | Losses | Value | |||||||||||||
(In thousands) | ||||||||||||||||
Debt securities available for sale | ||||||||||||||||
Agency residential MBS | $ | 399,997 | $ | 11,766 | $ | (37 | ) | $ | 411,726 | |||||||
Securities of U.S. Government entities | 119 | - | - | 119 | ||||||||||||
Obligations of states and political subdivisions | 90,107 | 3,842 | (29 | ) | 93,920 | |||||||||||
Corporate securities | 2,692,792 | 63,573 | (9,630 | ) | 2,746,735 | |||||||||||
Collateralized loan obligations | 1,385,331 | 1,743 | (719 | ) | 1,386,355 | |||||||||||
Total debt securities available for sale | 4,568,346 | 80,924 | (10,415 | ) | 4,638,855 | |||||||||||
Debt securities held to maturity | ||||||||||||||||
Agency residential MBS | 148,390 | 3,114 | (37 | ) | 151,467 | |||||||||||
Obligations of states and political subdivisions | 158,013 | 3,082 | - | 161,095 | ||||||||||||
Total debt securities held to maturity | 306,403 | 6,196 | (37 | ) | 312,562 | |||||||||||
Total | $ | 4,874,749 | $ | 87,120 | $ | (10,452 | ) | $ | 4,951,417 | |||||||
[The remainder of this page intentionally left blank]
At December 31, 2023 | ||||||||||||||||
Gross | Gross | |||||||||||||||
Amortized | Unrealized | Unrealized | Fair | |||||||||||||
Cost | Gains | Losses | Value | |||||||||||||
(In thousands) | ||||||||||||||||
Debt securities available for sale: | ||||||||||||||||
Agency residential mortgage-backed securities ("MBS") | $ | 258,150 | $ | 6 | $ | (18,702 | ) | $ | 239,454 | |||||||
Securities of U.S. Government sponsored entities | 308,768 | 2 | (13,851 | ) | 294,919 | |||||||||||
Obligations of states and political subdivisions | 72,679 | 42 | (1,438 | ) | 71,283 | |||||||||||
Corporate securities | 2,129,103 | 480 | (220,035 | ) | 1,909,548 | |||||||||||
Collateralized loan obligations | 1,501,248 | 830 | (17,481 | ) | 1,484,597 | |||||||||||
Total debt securities available for sale | 4,269,948 | 1,360 | (271,507 | ) | 3,999,801 | |||||||||||
Debt securities held to maturity: | ||||||||||||||||
Agency residential MBS | 78,565 | 17 | (5,270 | ) | 73,312 | |||||||||||
Obligations of states and political subdivisions | 71,182 | 47 | (335 | ) | 70,894 | |||||||||||
Corporate securities | 728,650 | 84 | (23,378 | ) | 705,356 | |||||||||||
Total debt securities held to maturity | 878,397 | 148 | (28,983 | ) | 849,562 | |||||||||||
Total | $ | 5,148,345 | $ | 1,508 | $ | (300,490 | ) | $ | 4,849,363 | |||||||
At December 31, 2022 | ||||||||||||||||
Gross | Gross | |||||||||||||||
Amortized | Unrealized | Unrealized | Fair | |||||||||||||
Cost | Gains | Losses | Value | |||||||||||||
(In thousands) | ||||||||||||||||
Debt securities available for sale: | ||||||||||||||||
Agency residential MBS | $ | 311,089 | $ | 4 | $ | (25,045 | ) | $ | 286,048 | |||||||
Securities of U.S. Government sponsored entities | 306,336 | 3 | (15,486 | ) | 290,853 | |||||||||||
Obligations of states and political subdivisions | 84,024 | 59 | (2,079 | ) | 82,004 | |||||||||||
Corporate securities | 2,406,566 | 1,032 | (307,643 | ) | 2,099,955 | |||||||||||
Collateralized loan obligations | 1,587,326 | 527 | (14,970 | ) | 1,572,883 | |||||||||||
Total debt securities available for sale | 4,695,341 | 1,625 | (365,223 | ) | 4,331,743 | |||||||||||
Debt securities held to maturity: | ||||||||||||||||
Agency residential MBS | 104,852 | 13 | (7,503 | ) | 97,362 | |||||||||||
Obligations of states and political subdivisions | 89,208 | 73 | (538 | ) | 88,743 | |||||||||||
Corporate securities | 721,854 | - | (34,448 | ) | 687,406 | |||||||||||
Total debt securities held to maturity | 915,914 | 86 | (42,489 | ) | 873,511 | |||||||||||
Total | $ | 5,611,255 | $ | 1,711 | $ | (407,712 | ) | $ | 5,205,254 | |||||||
The amortized cost and fair value of debt securities by contractual maturity are shown in the following tablestable s at the dates indicated:
At December 31, 2022 | At December 31, 2023 | |||||||||||||||||||||||||||||||
Debt Securities Available | Debt Securities Held | Debt Securities Available | Debt Securities Held | |||||||||||||||||||||||||||||
for Sale | to Maturity | for Sale | to Maturity | |||||||||||||||||||||||||||||
Amortized | Fair | Amortized | Fair | Amortized | Fair | Amortized | Fair | |||||||||||||||||||||||||
Cost | Value | Cost | Value | Cost | Value | Cost | Value | |||||||||||||||||||||||||
(In thousands) | (In thousands) | |||||||||||||||||||||||||||||||
Maturity in years: | ||||||||||||||||||||||||||||||||
1 year or less | $ | 251,578 | $ | 250,317 | $ | 12,676 | $ | 12,659 | $ | 52,703 | $ | 52,357 | $ | 15,117 | $ | 15,095 | ||||||||||||||||
Over 1 to 5 years | 584,707 | 554,596 | 161,653 | 158,409 | 756,658 | 721,179 | 312,847 | 307,557 | ||||||||||||||||||||||||
Over 5 to 10 years | 2,869,559 | 2,570,159 | 636,733 | 605,081 | 1,701,189 | 1,502,214 | 471,868 | 453,598 | ||||||||||||||||||||||||
Over 10 years | 678,408 | 670,623 | - | - | ||||||||||||||||||||||||||||
Subtotal | 4,384,252 | 4,045,695 | 811,062 | 776,149 | 2,510,550 | 2,275,750 | 799,832 | 776,250 | ||||||||||||||||||||||||
MBS | 311,089 | 286,048 | 104,852 | 97,362 | ||||||||||||||||||||||||||||
Collateralized loan obligations | 1,501,248 | 1,484,597 | - | - | ||||||||||||||||||||||||||||
Agency residential MBS | 258,150 | 239,454 | 78,565 | 73,312 | ||||||||||||||||||||||||||||
Total | $ | 4,695,341 | $ | 4,331,743 | $ | 915,914 | $ | 873,511 | $ | 4,269,948 | $ | 3,999,801 | $ | 878,397 | $ | 849,562 | ||||||||||||||||
At December 31, 2021 | At December 31, 2022 | |||||||||||||||||||||||||||||||
Debt Securities Available | Debt Securities Held | Debt Securities Available | Debt Securities Held | |||||||||||||||||||||||||||||
for Sale | to Maturity | for Sale | to Maturity | |||||||||||||||||||||||||||||
Amortized | Fair | Amortized | Fair | Amortized | Fair | Amortized | Fair | |||||||||||||||||||||||||
Cost | Value | Cost | Value | Cost | Value | Cost | Value | |||||||||||||||||||||||||
(In thousands) | (In thousands) | |||||||||||||||||||||||||||||||
Maturity in years: | ||||||||||||||||||||||||||||||||
1 year or less | $ | 306,333 | $ | 309,257 | $ | 15,836 | $ | 15,941 | $ | 251,578 | $ | 250,317 | $ | 12,676 | $ | 12,659 | ||||||||||||||||
Over 1 to 5 years | 707,062 | 738,057 | 125,001 | 127,539 | 578,886 | 548,787 | 161,653 | 158,409 | ||||||||||||||||||||||||
Over 5 to 10 years | 2,320,559 | 2,347,242 | 17,176 | 17,615 | 1,966,462 | 1,673,708 | 636,733 | 605,081 | ||||||||||||||||||||||||
Over 10 years | 834,395 | 832,573 | - | - | ||||||||||||||||||||||||||||
Subtotal | 4,168,349 | 4,227,129 | 158,013 | 161,095 | 2,796,926 | 2,472,812 | 811,062 | 776,149 | ||||||||||||||||||||||||
MBS | 399,997 | 411,726 | 148,390 | 151,467 | ||||||||||||||||||||||||||||
Collateralized loan obligations | 1,587,326 | 1,572,883 | - | - | ||||||||||||||||||||||||||||
Agency residential MBS | 311,089 | 286,048 | 104,852 | 97,362 | ||||||||||||||||||||||||||||
Total | $ | 4,568,346 | $ | 4,638,855 | $ | 306,403 | $ | 312,562 | $ | 4,695,341 | $ | 4,331,743 | $ | 915,914 | $ | 873,511 | ||||||||||||||||
Expected maturities of mortgage-related securities can differ from contractual maturities because borrowers have the right to call or prepay obligations with or without call or prepayment penalties. In addition, such factors as prepayments and interest rates may affect the yield on the carrying value of mortgage-related securities.
An analysis of the gross unrealized losses of the debt securities available for sale portfolio follows:
Debt Securities Available for Sale | ||||||||||||||||||||||||||||||||||||
At December 31, 2023 | ||||||||||||||||||||||||||||||||||||
No. of | Less than 12 months | No. of | 12 months or longer | No. of | Total | |||||||||||||||||||||||||||||||
Investment | Unrealized | Investment | Unrealized | Investment | Unrealized | |||||||||||||||||||||||||||||||
Positions | Fair Value | Losses | Positions | Fair Value | Losses | Positions | Fair Value | Losses | ||||||||||||||||||||||||||||
($ in thousands) | ||||||||||||||||||||||||||||||||||||
Agency residential MBS | 1 | $ | 115 | $ | (2 | ) | 107 | $ | 238,642 | $ | (18,700 | ) | 108 | $ | 238,757 | $ | (18,702 | ) | ||||||||||||||||||
Securities of U.S. Government sponsored entities | 2 | 9,746 | (15 | ) | 19 | 278,265 | (13,836 | ) | 21 | 288,011 | (13,851 | ) | ||||||||||||||||||||||||
Obligations of states and political subdivisions | 2 | 2,280 | (15 | ) | 50 | 57,614 | (1,423 | ) | 52 | 59,894 | (1,438 | ) | ||||||||||||||||||||||||
Corporate securities | - | - | - | 151 | 1,894,602 | (220,035 | ) | 151 | 1,894,602 | (220,035 | ) | |||||||||||||||||||||||||
Collateralized loan obligations | 34 | 428,363 | (8,914 | ) | 67 | 578,643 | (8,567 | ) | 101 | 1,007,006 | (17,481 | ) | ||||||||||||||||||||||||
Total | 39 | $ | 440,504 | $ | (8,946 | ) | 394 | $ | 3,047,766 | $ | (262,561 | ) | 433 | $ | 3,488,270 | $ | (271,507 | ) | ||||||||||||||||||
Debt Securities Available for Sale | ||||||||||||||||||||||||||||||||||||
At December 31, 2022 | ||||||||||||||||||||||||||||||||||||
No. of | Less than 12 months | No. of | 12 months or longer | No. of | Total | |||||||||||||||||||||||||||||||
Investment | Unrealized | Investment | Unrealized | Investment | Unrealized | |||||||||||||||||||||||||||||||
Positions | Fair Value | Losses | Positions | Fair Value | Losses | Positions | Fair Value | Losses | ||||||||||||||||||||||||||||
($ in thousands) | ||||||||||||||||||||||||||||||||||||
Agency residential MBS | 107 | $ | 279,139 | $ | (24,222 | ) | 9 | $ | 6,110 | $ | (823 | ) | 116 | $ | 285,249 | $ | (25,045 | ) | ||||||||||||||||||
Securities of U.S. Government sponsored | 22 | 289,067 | (15,486 | ) | - | - | - | 22 | 289,067 | (15,486 | ) | |||||||||||||||||||||||||
Obligations of states | 56 | 65,633 | (1,902 | ) | 8 | 3,265 | (177 | ) | 64 | 68,898 | (2,079 | ) | ||||||||||||||||||||||||
Corporate securities | 133 | 1,521,294 | (170,453 | ) | 56 | 555,727 | (137,190 | ) | 189 | 2,077,021 | (307,643 | ) | ||||||||||||||||||||||||
Collateralized loan | 58 | 518,074 | (13,772 | ) | 20 | 192,692 | (1,198 | ) | 78 | 710,766 | (14,970 | ) | ||||||||||||||||||||||||
Total | 376 | $ | 2,673,207 | $ | (225,835 | ) | 93 | $ | 757,794 | $ | (139,388 | ) | 469 | $ | 3,431,001 | $ | (365,223 | ) | ||||||||||||||||||
An analysis of gross unrecognized losses of the debt securities held to maturity portfolio follows:
Debt Securities Held to Maturity | Debt Securities Held to Maturity | |||||||||||||||||||||||||||||||||||||||||||||||||||||||||||||||||||||||
At December 31, 2022 | At December 31, 2023 | |||||||||||||||||||||||||||||||||||||||||||||||||||||||||||||||||||||||
No. of | Less than 12 months | No. of | 12 months or longer | No. of | Total | No. of | Less than 12 months | No. of | 12 months or longer | No. of | Total | |||||||||||||||||||||||||||||||||||||||||||||||||||||||||||||
Investment | Unrecognized | Investment | Unrecognized | Investment | Unrecognized | Investment | Unrecognized | Investment | Unrecognized | Investment | Unrecognized | |||||||||||||||||||||||||||||||||||||||||||||||||||||||||||||
Positions | Fair Value | Losses | Positions | Fair Value | Losses | Positions | Fair Value | Losses | Positions | Fair Value | Losses | Positions | Fair Value | Losses | Positions | Fair Value | Losses | |||||||||||||||||||||||||||||||||||||||||||||||||||||||
($ in thousands) | ($ in thousands) | |||||||||||||||||||||||||||||||||||||||||||||||||||||||||||||||||||||||
Agency residential MBS | 97 | $ | 95,814 | $ | (7,404 | ) | 2 | $ | 682 | $ | (99 | ) | 99 | $ | 96,496 | $ | (7,503 | ) | 1 | $ | - | $ | - | 93 | $ | 72,376 | $ | (5,270 | ) | 94 | $ | 72,376 | $ | (5,270 | ) | |||||||||||||||||||||||||||||||||||||
Obligations of states | 54 | 53,536 | (538 | ) | - | - | - | 54 | 53,536 | (538 | ) | 23 | 18,599 | (90 | ) | 26 | 25,466 | (245 | ) | 49 | 44,065 | (335 | ) | |||||||||||||||||||||||||||||||||||||||||||||||||
Corporate securities | 49 | 672,406 | (34,448 | ) | - | - | - | 49 | 672,406 | (34,448 | ) | 3 | 26,567 | (1,184 | ) | 46 | 641,598 | (22,194 | ) | 49 | 668,165 | (23,378 | ) | |||||||||||||||||||||||||||||||||||||||||||||||||
Total | 200 | $ | 821,756 | $ | (42,390 | ) | 2 | $ | 682 | $ | (99 | ) | 202 | $ | 822,438 | $ | (42,489 | ) | 27 | $ | 45,166 | $ | (1,274 | ) | 165 | $ | 739,440 | $ | (27,709 | ) | 192 | $ | 784,606 | $ | (28,983 | ) | ||||||||||||||||||||||||||||||||||||
Based upon the Company’s December 31, 20222023 evaluation, the unrealized losses on debt securities were caused by market conditions for these types of securities. In the twelve months ended December 31, 2022, the market yields on five-year and ten-year Treasury notes increased 2.74% and 2.36%, respectively; these increasingIncreasing risk-free interest rates have caused large declines in bond values generally. Additionally, market rates for non-Treasury bonds are determined by the risk-free interest rate plus a risk premium spread; such spreads for investment grade, fixed rate, taxable corporate bonds have increased, 0.38% in the twelve months ended December 31, 2022, also broadly reducing corporate bond values. The Company continually monitors interest rate changes, risk premium spread changes, credit rating changes for issuers of bonds owned, collateralized loan obligations’ collateral levels, and corporate bond issuers’ common stock price changes. All collateralized loan obligations and corporate bondssecurities were investment grade rated at December 31, 2022.2023.
The Company does not intend to sell any debt securities available for sale with an unrealized loss and has concluded that it is more likely than not that it will not be required to sell the debt securities prior to recovery of the amortized cost basis.
The Company evaluates held to maturity corporate securities individually, monitoring each issuer’s financial condition, profitability, cash flows and credit rating agency conclusions. The Company has evaluated each issuer’s historical financial performance and ability to service debt payments throughout and following the 2008-2009 recession. The Company has an expectation that nonpayment of the amortized cost basis continues to be zero.
The fair values of debt securities could decline in the future if interest rates increase, the general economy deteriorates, inflation increases, credit ratings decline, the issuers’ financial condition deteriorates, or the liquidity for debt securities declines. As a result, significant credit losses on debt securities may occur in the future.
As of December 31, 20222023 and December 31, 2021,2022, the Company hadCompany’s debt securities pledged to secure public deposits, Federal Reserve Bank borrowings and short-term borrowed funds had a carrying amount of $1,180,010$2,034,706 thousand and $1,021,566$1,180,010 thousand, respectively.
An analysis of the gross unrealized losses of the debt securities available for sale portfolio follows:
Debt Securities Available for Sale | ||||||||||||||||||||||||||||||||||||
At December 31, 2022 | ||||||||||||||||||||||||||||||||||||
No. of | Less than 12 months | No. of | 12 months or longer | No. of | Total | |||||||||||||||||||||||||||||||
Investment | Unrealized | Investment | Unrealized | Investment | Unrealized | |||||||||||||||||||||||||||||||
Positions | Fair Value | Losses | Positions | Fair Value | Losses | Positions | Fair Value | Losses | ||||||||||||||||||||||||||||
($ in thousands) | ||||||||||||||||||||||||||||||||||||
Agency residential MBS | 107 | $ | 279,139 | $ | (24,222 | ) | 9 | $ | 6,110 | $ | (823 | ) | 116 | $ | 285,249 | $ | (25,045 | ) | ||||||||||||||||||
Securities of U.S. Government sponsored entities | 22 | 289,067 | (15,486 | ) | - | - | - | 22 | 289,067 | (15,486 | ) | |||||||||||||||||||||||||
Obligations of states and political subdivisions | 56 | 65,633 | (1,902 | ) | 8 | 3,265 | (177 | ) | 64 | 68,898 | (2,079 | ) | ||||||||||||||||||||||||
Corporate securities | 133 | 1,521,294 | (170,453 | ) | 56 | 555,727 | (137,190 | ) | 189 | 2,077,021 | (307,643 | ) | ||||||||||||||||||||||||
Collateralized loan obligations | 58 | 518,074 | (13,772 | ) | 20 | 192,692 | (1,198 | ) | 78 | 710,766 | (14,970 | ) | ||||||||||||||||||||||||
Total | 376 | $ | 2,673,207 | $ | (225,835 | ) | 93 | $ | 757,794 | $ | (139,388 | ) | 469 | $ | 3,431,001 | $ | (365,223 | ) | ||||||||||||||||||
Debt Securities Available for Sale | ||||||||||||||||||||||||||||||||||||
At December 31, 2021 | ||||||||||||||||||||||||||||||||||||
No. of | Less than 12 months | No. of | 12 months or longer | No. of | Total | |||||||||||||||||||||||||||||||
Investment | Unrealized | Investment | Unrealized | Investment | Unrealized | |||||||||||||||||||||||||||||||
Positions | Fair Value | Losses | Positions | Fair Value | Losses | Positions | Fair Value | Losses | ||||||||||||||||||||||||||||
($ in thousands) | ||||||||||||||||||||||||||||||||||||
Agency residential MBS | 7 | $ | 8,900 | $ | (37 | ) | 2 | $ | 47 | $ | - | 9 | $ | 8,947 | $ | (37 | ) | |||||||||||||||||||
Securities of U.S. | - | - | - | 1 | 119 | - | 1 | 119 | - | |||||||||||||||||||||||||||
Obligations of states | 6 | 2,859 | (27 | ) | 2 | 669 | (2 | ) | 8 | 3,528 | (29 | ) | ||||||||||||||||||||||||
Corporate securities | 56 | 691,555 | (9,630 | ) | - | - | - | 56 | 691,555 | (9,630 | ) | |||||||||||||||||||||||||
Collateralized loan | 19 | 208,199 | (521 | ) | 8 | 51,523 | (198 | ) | 27 | 259,722 | (719 | ) | ||||||||||||||||||||||||
Total | 88 | $ | 911,513 | $ | (10,215 | ) | 13 | $ | 52,358 | $ | (200 | ) | 101 | $ | 963,871 | $ | (10,415 | ) | ||||||||||||||||||
An analysis of gross unrecognized losses of the debt securities held to maturity portfolio follows:
Debt Securities Held to Maturity | Debt Securities Held to Maturity | |||||||||||||||||||||||||||||||||||||||||||||||||||||||||||||||||||||||
At December 31, 2021 | At December 31, 2022 | |||||||||||||||||||||||||||||||||||||||||||||||||||||||||||||||||||||||
No. of | Less than 12 months | No. of | 12 months or longer | No. of | Total | No. of | Less than 12 months | No. of | 12 months or longer | No. of | Total | |||||||||||||||||||||||||||||||||||||||||||||||||||||||||||||
Investment | Unrecognized | Investment | Unrecognized | Investment | Unrecognized | Investment | Unrecognized | Investment | Unrecognized | Investment | Unrecognized | |||||||||||||||||||||||||||||||||||||||||||||||||||||||||||||
Positions | Fair Value | Losses | Positions | Fair Value | Losses | Positions | Fair Value | Losses | Positions | Fair Value | Losses | Positions | Fair Value | Losses | Positions | Fair Value | Losses | |||||||||||||||||||||||||||||||||||||||||||||||||||||||
($ in thousands) | ($ in thousands) | |||||||||||||||||||||||||||||||||||||||||||||||||||||||||||||||||||||||
Agency residential MBS | 1 | $ | 542 | $ | (19 | ) | 3 | $ | 530 | $ | (18 | ) | 4 | $ | 1,072 | $ | (37 | ) | 97 | $ | 95,814 | $ | (7,404 | ) | 2 | $ | 682 | $ | (99 | ) | 99 | $ | 96,496 | $ | (7,503 | ) | ||||||||||||||||||||||||||||||||||||
Obligations of states and political subdivisions | 54 | 53,536 | (538 | ) | - | - | - | 54 | 53,536 | (538 | ) | |||||||||||||||||||||||||||||||||||||||||||||||||||||||||||||
Corporate securities | 49 | 672,406 | (34,448 | ) | - | - | - | 49 | 672,406 | (34,448 | ) | |||||||||||||||||||||||||||||||||||||||||||||||||||||||||||||
Total | 1 | $ | 542 | $ | (19 | ) | 3 | $ | 530 | $ | (18 | ) | 4 | $ | 1,072 | $ | (37 | ) | 200 | $ | 821,756 | $ | (42,390 | ) | 2 | $ | 682 | $ | (99 | ) | 202 | $ | 822,438 | $ | (42,489 | ) | ||||||||||||||||||||||||||||||||||||
The Company evaluates debt securities on a quarterly basis including changes in security ratings issued by rating agencies, changes in the financial condition of the issuer, and, for mortgage-backed and asset-backed securities, collateral levels, delinquency and loss information with respect to the underlying collateral, changes in the levels of subordination for the Company’s particular position within the repayment structure and remaining credit enhancement as compared to expected credit losses of the security. In addition to monitoring credit rating agency evaluations, Management performs its own evaluations regarding the credit worthiness of the issuer or the securitized assets underlying asset backed securities.
The following table presents the activity in the allowance for credit losses for debt securities held to maturity:
For the Years Ended December 31, | For the Years Ended December 31, | |||||||||||||||||||||||
2022 | 2021 | 2020 | 2023 | 2022 | 2021 | |||||||||||||||||||
(In thousands) | (In thousands) | |||||||||||||||||||||||
Allowance for credit losses: | ||||||||||||||||||||||||
Balance, end of prior period | $ | 7 | $ | 9 | $ | - | ||||||||||||||||||
Impact of adopting ASU 2016-13 | - | - | 16 | |||||||||||||||||||||
Beginning balance | 7 | 9 | 16 | $ | 1 | $ | 7 | $ | 9 | |||||||||||||||
Reversal of provision for credit losses | (6 | ) | (2 | ) | (7 | ) | - | (6 | ) | (2 | ) | |||||||||||||
Chargeoffs | - | - | - | - | - | - | ||||||||||||||||||
Recoveries | - | - | - | - | - | - | ||||||||||||||||||
Total ending balance | $ | 1 | $ | 7 | $ | 9 | $ | 1 | $ | 1 | $ | 7 | ||||||||||||
Agency mortgage-backed securities were assigned no credit loss allowance due to the perceived backing of government sponsored entities. Municipal securities were evaluated for risk of default based on credit rating and remaining term to maturity using Moody’s risk of default factors; Moody’s loss upon default factors were applied to the assumed defaulted principal amounts to estimate the amount for credit loss allowance. Corporate securities held to maturity were individually evaluated for expected credit loss by evaluating the issuer’s financial condition, profitability, cash flows, and credit ratings. At December 31, 2022,2023, no credit loss allowance was assigned to corporate securities held to maturity.
The following table summarizes the amortized cost of debt securities held to maturity at December 31, 2022,2023, aggregated by credit rating:
Credit Risk Profile by Credit Rating | Credit Risk Profile by Credit Rating | |||||||||||||||||||||||||||||||||||
At December 31, 2022 | At December 31, 2023 | |||||||||||||||||||||||||||||||||||
AAA/AA/A | BBB+ | B- | Not Rated | Total | AAA/AA/A | BBB+ | Not Rated | Total | ||||||||||||||||||||||||||||
(In thousands) | (In thousands) | |||||||||||||||||||||||||||||||||||
Agency residential MBS | $ | 104,324 | $ | - | $ | 481 | $ | 47 | $ | 104,852 | $ | 78,092 | $ | - | $ | 473 | $ | 78,565 | ||||||||||||||||||
Obligations of states and political subdivisions | 88,943 | - | - | 265 | 89,208 | 71,002 | - | 180 | 71,182 | |||||||||||||||||||||||||||
Corporate securities | 467,962 | 253,892 | - | - | 721,854 | 506,508 | 222,142 | - | 728,650 | |||||||||||||||||||||||||||
Total | $ | 661,229 | $ | 253,892 | $ | 481 | $ | 312 | $ | 915,914 | $ | 655,602 | $ | 222,142 | $ | 653 | $ | 878,397 | ||||||||||||||||||
There were no debt securities held to maturity on nonaccrual status or past due 30 days or more as of December 31, 2022.2023.
[The remainder of this page intentionally left blank]
The following table provides information about the amount of interest income earned on investment securities which is fully taxable and which is exempt from federal income tax:
For the Years Ended December 31, | For the Years Ended December 31, | |||||||||||||||||||||||
2022 | 2021 | 2020 | 2023 | 2022 | 2021 | |||||||||||||||||||
(In thousands) | (In thousands) | |||||||||||||||||||||||
Taxable | $ | 158,465 | $ | 106,329 | $ | 93,163 | $ | 221,742 | $ | 158,465 | $ | 106,329 | ||||||||||||
Tax-exempt from regular federal income tax | 5,819 | 8,424 | 12,151 | 4,484 | 5,819 | 8,424 | ||||||||||||||||||
Total interest income from investment securities | $ | 164,284 | $ | 114,753 | $ | 105,314 | $ | 226,226 | $ | 164,284 | $ | 114,753 | ||||||||||||
Note 3: Loans and Allowance for Credit Losses
A summary of the major categories of loans outstanding is shown in the following tables at the dates indicated.indicated:
At December 31, | ||||||||
2022 | 2021 | |||||||
(In thousands) | ||||||||
Commercial: | ||||||||
Paycheck Protection Program ("PPP") loans | $ | 586 | $ | 45,888 | ||||
Other | 169,031 | 187,202 | ||||||
Total Commercial | 169,617 | 233,090 | ||||||
Commercial Real Estate | 491,107 | 535,261 | ||||||
Construction | 3,088 | 48 | ||||||
Residential Real Estate | 13,834 | 18,133 | ||||||
Consumer Installment & Other | 280,842 | 281,594 | ||||||
Total | 958,488 | $ | 1,068,126 | |||||
At December 31, | At December 31, | |||||||
2023 | 2022 | |||||||
(In thousands) | ||||||||
Commercial | $ | 136,550 | $ | 169,617 | ||||
Commercial real estate | 487,523 | 491,107 | ||||||
Construction | 5,063 | 3,088 | ||||||
Residential real estate | 9,935 | 13,834 | ||||||
Consumer installment & other | 227,531 | 280,842 | ||||||
Total | $ | 866,602 | $ | 958,488 | ||||
PPP loans are guaranteed by the Small Business Administration (“SBA”). PPP loan proceeds used for eligible payroll and certain other operating costs are eligible for forgiveness, with repayment of loan principal and accrued interest made by the SBA. Management does not expect credit losses on PPP loans. Therefore, there is no allowance for such loans. The following summarizes activity in the allowance for credit losses.losses:
Allowance for Credit Losses | Allowance for Credit Losses | |||||||||||||||||||||||||||||||||||||||||||||||
For the Year Ended Decmber 31, 2022 | For the Year Ended December 31, 2023 | |||||||||||||||||||||||||||||||||||||||||||||||
Consumer | Consumer | |||||||||||||||||||||||||||||||||||||||||||||||
Commercial | Residential | Installment | Commercial | Residential | Installment | |||||||||||||||||||||||||||||||||||||||||||
Commercial | Real Estate | Construction | Real Estate | and Other | Total | Commercial | Real Estate | Construction | Real Estate | and Other | Total | |||||||||||||||||||||||||||||||||||||
(In thousands) | (In thousands) | |||||||||||||||||||||||||||||||||||||||||||||||
Allowance for credit losses: | ||||||||||||||||||||||||||||||||||||||||||||||||
Balance at beginning of period | $ | 6,966 | $ | 6,529 | $ | 2 | $ | 45 | $ | 9,972 | $ | 23,514 | $ | 6,138 | $ | 5,888 | $ | 150 | $ | 32 | $ | 8,076 | $ | 20,284 | ||||||||||||||||||||||||
(Reversal) provision | (1,184 | ) | (703 | ) | 148 | (13 | ) | 1,758 | 6 | (3,871 | ) | 11 | 95 | (6 | ) | 2,621 | (1,150 | ) | ||||||||||||||||||||||||||||||
Chargeoffs | (20 | ) | - | - | - | (6,205 | ) | (6,225 | ) | (410 | ) | (45 | ) | - | - | (7,499 | ) | (7,954 | ) | |||||||||||||||||||||||||||||
Recoveries | 376 | 62 | - | - | 2,551 | 2,989 | 2,359 | 71 | - | - | 3,257 | 5,687 | ||||||||||||||||||||||||||||||||||||
Total allowance for credit losses | $ | 6,138 | $ | 5,888 | $ | 150 | $ | 32 | $ | 8,076 | $ | 20,284 | $ | 4,216 | $ | 5,925 | $ | 245 | $ | 26 | $ | 6,455 | $ | 16,867 | ||||||||||||||||||||||||
[The remainder of this page intentionally left blank]
Allowance for Credit Losses | ||||||||||||||||||||||||
For the Year Ended December 31, 2021 | ||||||||||||||||||||||||
Consumer | ||||||||||||||||||||||||
Commercial | Residential | Installment | ||||||||||||||||||||||
Commercial | Real Estate | Construction | Real Estate | and Other | Total | |||||||||||||||||||
(In thousands) | ||||||||||||||||||||||||
Allowance for credit losses: | ||||||||||||||||||||||||
Balance at beginning of period | $ | 9,205 | $ | 5,660 | $ | 6 | $ | 47 | $ | 8,936 | $ | 23,854 | ||||||||||||
(Reversal) provision | (2,411 | ) | 126 | (4 | ) | (2 | ) | 2,293 | 2 | |||||||||||||||
Chargeoffs | (56 | ) | - | - | - | (3,192 | ) | (3,248 | ) | |||||||||||||||
Recoveries | 228 | 743 | - | - | 1,935 | 2,906 | ||||||||||||||||||
Total allowance for credit losses | $ | 6,966 | $ | 6,529 | $ | 2 | $ | 45 | $ | 9,972 | $ | 23,514 | ||||||||||||
Allowance for Credit Losses | ||||||||||||||||||||||||||||
For the Year Ended December 31, 2020 | ||||||||||||||||||||||||||||
Consumer | ||||||||||||||||||||||||||||
Commercial | Residential | Installment | ||||||||||||||||||||||||||
Commercial | Real Estate | Construction | Real Estate | and Other | Unallocated | Total | ||||||||||||||||||||||
(In thousands) | ||||||||||||||||||||||||||||
Allowance for credit losses: | ||||||||||||||||||||||||||||
Balance at beginning of period, prior to adoption of ASU 2016-13 | $ | 4,959 | $ | 4,064 | $ | 109 | $ | 206 | $ | 6,445 | $ | 3,701 | $ | 19,484 | ||||||||||||||
Impact of adopting ASU 2016-13 | 3,385 | 618 | (31 | ) | (132 | ) | 1,878 | (3,701 | ) | 2,017 | ||||||||||||||||||
Adjusted beginning balance | 8,344 | 4,682 | 78 | 74 | 8,323 | - | 21,501 | |||||||||||||||||||||
Provision (reversal) | 746 | 929 | (72 | ) | (27 | ) | 2,731 | - | 4,307 | |||||||||||||||||||
Chargeoffs | (236 | ) | - | - | - | (3,963 | ) | - | (4,199 | ) | ||||||||||||||||||
Recoveries | 351 | 49 | - | - | 1,845 | - | 2,245 | |||||||||||||||||||||
Total allowance for credit losses | $ | 9,205 | $ | 5,660 | $ | 6 | $ | 47 | $ | 8,936 | $ | - | $ | 23,854 | ||||||||||||||
Allowance for Credit Losses | ||||||||||||||||||||||||
For the Year Ended December 31, 2022 | ||||||||||||||||||||||||
Consumer | ||||||||||||||||||||||||
Commercial | Residential | Installment | ||||||||||||||||||||||
Commercial | Real Estate | Construction | Real Estate | and Other | Total | |||||||||||||||||||
(In thousands) | ||||||||||||||||||||||||
Allowance for credit losses: | ||||||||||||||||||||||||
Balance at beginning of period | $ | 6,966 | $ | 6,529 | $ | 2 | $ | 45 | $ | 9,972 | $ | 23,514 | ||||||||||||
(Reversal) provision | (1,184 | ) | (703 | ) | 148 | (13 | ) | 1,758 | 6 | |||||||||||||||
Chargeoffs | (20 | ) | - | - | - | (6,205 | ) | (6,225 | ) | |||||||||||||||
Recoveries | 376 | 62 | - | - | 2,551 | 2,989 | ||||||||||||||||||
Total allowance for credit losses | $ | 6,138 | $ | 5,888 | $ | 150 | $ | 32 | $ | 8,076 | $ | 20,284 | ||||||||||||
Allowance for Credit Losses | ||||||||||||||||||||||||
For the Year Ended December 31, 2021 | ||||||||||||||||||||||||
Consumer | ||||||||||||||||||||||||
Commercial | Residential | Installment | ||||||||||||||||||||||
Commercial | Real Estate | Construction | Real Estate | and Other | Total | |||||||||||||||||||
(In thousands) | ||||||||||||||||||||||||
Allowance for credit losses: | ||||||||||||||||||||||||
Balance at beginning of period | $ | 9,205 | $ | 5,660 | $ | 6 | $ | 47 | $ | 8,936 | $ | 23,854 | ||||||||||||
(Reversal) provision | (2,411 | ) | 126 | (4 | ) | (2 | ) | 2,293 | 2 | |||||||||||||||
Chargeoffs | (56 | ) | - | - | - | (3,192 | ) | (3,248 | ) | |||||||||||||||
Recoveries | 228 | 743 | - | - | 1,935 | 2,906 | ||||||||||||||||||
Total allowance for credit losses | $ | 6,966 | $ | 6,529 | $ | 2 | $ | 45 | $ | 9,972 | $ | 23,514 | ||||||||||||
The Company’s customers are primarily small businesses, professionals and consumers. Given the scale of these borrowers, corporate credit rating agencies do not evaluate the borrowers’ financial condition. The Bank maintains a Loan Review Department which reports directly to the Audit Committee of the Board of Directors. The Loan Review Department performs independent evaluations of loans and validates management assigned credit risk grades on evaluated loans using grading standards employed by bank regulatory agencies. Loans judged to carry lower-risk attributes are assigned a “pass” grade, with a minimal likelihood of loss. Loans judged to carry higher-risk attributes are referred to as “classified loans,” and are further disaggregated, with increasing expectations for loss recognition, as “substandard,” “doubtful,” and “loss.” The Loan Review Department performs continuous evaluations throughout the year. If the Bank becomes aware of deterioration in a borrower’s performance or financial condition between Loan Review Department examinations, assigned risk grades are re-evaluated promptly. Credit risk grades assigned by management and validated by the Loan Review Department are subject to review by the Bank’s regulatory authorities during regulatory examinations.
The following summarizes the credit risk profile by internally assigned grade:
Credit Risk Profile by Internally Assigned Grade | ||||||||||||||||||||||||
At December 31, 2023 | ||||||||||||||||||||||||
Commercial | Commercial Real Estate | Construction | Residential Real Estate | Consumer Installment and Other | Total | |||||||||||||||||||
(In thousands) | ||||||||||||||||||||||||
Grade: | ||||||||||||||||||||||||
Pass | $ | 130,001 | $ | 475,870 | $ | 5,063 | $ | 9,606 | $ | 225,089 | $ | 845,629 | ||||||||||||
Substandard | 6,549 | 11,653 | - | 329 | 377 | 18,908 | ||||||||||||||||||
Doubtful | - | - | - | - | 1,479 | 1,479 | ||||||||||||||||||
Loss | - | - | - | - | 586 | 586 | ||||||||||||||||||
Total | $ | 136,550 | $ | 487,523 | $ | 5,063 | $ | 9,935 | $ | 227,531 | $ | 866,602 | ||||||||||||
Credit Risk Profile by Internally Assigned Grade | Credit Risk Profile by Internally Assigned Grade | |||||||||||||||||||||||||||||||||||||||||||||||
At Decmber 31, 2022 | At December 31, 2022 | |||||||||||||||||||||||||||||||||||||||||||||||
Commercial | Commercial Real Estate | Construction | Residential Real Estate | Consumer Installment and Other | Total | Commercial | Commercial Real Estate | Construction | Residential Real Estate | Consumer Installment and Other | Total | |||||||||||||||||||||||||||||||||||||
(In thousands) | (In thousands) | |||||||||||||||||||||||||||||||||||||||||||||||
Grade: | ||||||||||||||||||||||||||||||||||||||||||||||||
Pass | $ | 169,040 | $ | 477,842 | $ | 3,088 | $ | 13,457 | $ | 278,223 | $ | 941,650 | $ | 169,040 | $ | 477,842 | $ | 3,088 | $ | 13,457 | $ | 278,223 | $ | 941,650 | ||||||||||||||||||||||||
Substandard | 577 | 13,265 | - | 377 | 1,079 | 15,298 | 577 | 13,265 | - | 377 | 1,079 | 15,298 | ||||||||||||||||||||||||||||||||||||
Doubtful | - | - | - | - | 752 | 752 | - | - | - | - | 752 | 752 | ||||||||||||||||||||||||||||||||||||
Loss | - | - | - | - | 788 | 788 | - | - | - | - | 788 | 788 | ||||||||||||||||||||||||||||||||||||
Total | $ | 169,617 | $ | 491,107 | $ | 3,088 | $ | 13,834 | $ | 280,842 | $ | 958,488 | $ | 169,617 | $ | 491,107 | $ | 3,088 | $ | 13,834 | $ | 280,842 | $ | 958,488 | ||||||||||||||||||||||||
Credit Risk Profile by Internally Assigned Grade | ||||||||||||||||||||||||
At December 31, 2021 | ||||||||||||||||||||||||
Commercial | Commercial Real Estate | Construction | Residential Real Estate | Consumer Installment and Other | Total | |||||||||||||||||||
(In thousands) | ||||||||||||||||||||||||
Grade: | ||||||||||||||||||||||||
Pass | $ | 232,710 | $ | 521,300 | $ | 48 | $ | 16,874 | $ | 278,922 | $ | 1,049,854 | ||||||||||||
Substandard | 380 | 13,961 | - | 1,259 | 1,207 | 16,807 | ||||||||||||||||||
Doubtful | - | - | - | - | 931 | 931 | ||||||||||||||||||
Loss | - | - | - | - | 534 | 534 | ||||||||||||||||||
Total | $ | 233,090 | $ | 535,261 | $ | 48 | $ | 18,133 | $ | 281,594 | $ | 1,068,126 | ||||||||||||
[The remainder of this page intentionally left blank]
The following tables summarize loans by delinquency and nonaccrual status:
Summary of Loans by Delinquency and Nonaccrual Status | Summary of Loans by Delinquency and Nonaccrual Status | |||||||||||||||||||||||||||||||||||||||||||||||
At December 31, 2022 | At December 31, 2023 | |||||||||||||||||||||||||||||||||||||||||||||||
Current and Accruing | 30-59 Days Past Due and Accruing | 60-89 Days Past Due and Accruing | Past Due 90 Days or More and Accruing | Nonaccrual | Total Loans | Current and Accruing | 30-59 Days Past Due and Accruing | 60-89 Days Past Due and Accruing | Past Due 90 Days or More and Accruing | Nonaccrual | Total Loans | |||||||||||||||||||||||||||||||||||||
(In thousands) | (In thousands) | |||||||||||||||||||||||||||||||||||||||||||||||
Commercial | $ | 169,337 | $ | 172 | $ | 58 | $ | - | $ | 50 | $ | 169,617 | $ | 136,421 | $ | 58 | $ | - | $ | - | $ | 71 | $ | 136,550 | ||||||||||||||||||||||||
Commercial real estate | 490,354 | 508 | 192 | - | 53 | 491,107 | 485,476 | 951 | 766 | - | 330 | 487,523 | ||||||||||||||||||||||||||||||||||||
Construction | 3,088 | - | - | - | - | 3,088 | 5,063 | - | - | - | - | 5,063 | ||||||||||||||||||||||||||||||||||||
Residential real estate | 13,430 | 377 | - | - | 27 | 13,834 | 9,933 | - | - | - | 2 | 9,935 | ||||||||||||||||||||||||||||||||||||
Consumer installment and other | 273,247 | 5,101 | 1,850 | 628 | 16 | 280,842 | 220,357 | 5,544 | 1,242 | 388 | - | 227,531 | ||||||||||||||||||||||||||||||||||||
Total | $ | 949,456 | $ | 6,158 | $ | 2,100 | $ | 628 | $ | 146 | $ | 958,488 | $ | 857,250 | $ | 6,553 | $ | 2,008 | $ | 388 | $ | 403 | $ | 866,602 | ||||||||||||||||||||||||
Summary of Loans by Delinquency and Nonaccrual Status | Summary of Loans by Delinquency and Nonaccrual Status | |||||||||||||||||||||||||||||||||||||||||||||||
At December 31, 2021 | At December 31, 2022 | |||||||||||||||||||||||||||||||||||||||||||||||
Current and Accruing | 30-59 Days Past Due and Accruing | 60-89 Days Past Due and Accruing | Past Due 90 Days or More and Accruing | Nonaccrual | Total Loans | Current and Accruing | 30-59 Days Past Due and Accruing | 60-89 Days Past Due and Accruing | Past Due 90 Days or More and Accruing | Nonaccrual | Total Loans | |||||||||||||||||||||||||||||||||||||
(In thousands) | (In thousands) | |||||||||||||||||||||||||||||||||||||||||||||||
Commercial | $ | 232,444 | $ | 383 | $ | 263 | $ | - | $ | - | $ | 233,090 | $ | 169,337 | $ | 172 | $ | 58 | $ | - | $ | 50 | $ | 169,617 | ||||||||||||||||||||||||
Commercial real estate | 534,748 | 223 | - | - | 290 | 535,261 | 490,354 | 508 | 192 | - | 53 | 491,107 | ||||||||||||||||||||||||||||||||||||
Construction | 48 | - | - | - | - | 48 | 3,088 | - | - | - | - | 3,088 | ||||||||||||||||||||||||||||||||||||
Residential real estate | 17,855 | 141 | - | - | 137 | 18,133 | 13,430 | 377 | - | - | 27 | 13,834 | ||||||||||||||||||||||||||||||||||||
Consumer installment and other | 276,793 | 3,184 | 1,013 | 339 | 265 | 281,594 | 273,247 | 5,101 | 1,850 | 628 | 16 | 280,842 | ||||||||||||||||||||||||||||||||||||
Total | $ | 1,061,888 | $ | 3,931 | $ | 1,276 | $ | 339 | $ | 692 | $ | 1,068,126 | $ | 949,456 | $ | 6,158 | $ | 2,100 | $ | 628 | $ | 146 | $ | 958,488 | ||||||||||||||||||||||||
There was no allowance for credit losses allocated to loans on nonaccrual status as of December 31, 20222023 or December 31, 2021.2022. There were no commitments to lend additional funds to borrowers whose loans were on nonaccrual status at December 31, 20222023 or December 31, 2021.2022.
The following tables provide information on troubled debt restructurings (TDRs):
Troubled Debt Restructurings | ||||||||||||||||
At December 31, 2022 | ||||||||||||||||
Period-End | ||||||||||||||||
Individual | ||||||||||||||||
Number of | Pre-Modification | Period-End | Credit Loss | |||||||||||||
Contracts | Carrying Value | Carrying Value | Allowance | |||||||||||||
($ in thousands) | ||||||||||||||||
Commercial real estate | 2 | $ | 2,785 | $ | 1,752 | $ | - | |||||||||
Total | 2 | $ | 2,785 | $ | 1,752 | $ | - | |||||||||
Troubled Debt Restructurings | ||||||||||||||||
At December 31, 2021 | ||||||||||||||||
Period-End | ||||||||||||||||
Individual | ||||||||||||||||
Number of | Pre-Modification | Period-End | Credit Loss | |||||||||||||
Contracts | Carrying Value | Carrying Value | Allowance | |||||||||||||
($ in thousands) | ||||||||||||||||
Commercial real estate | 2 | $ | 2,785 | $ | 1,793 | $ | - | |||||||||
Residential real estate | 1 | 241 | 172 | - | ||||||||||||
Total | 3 | $ | 3,026 | $ | 1,965 | $ | - | |||||||||
DuringThere were no loan modifications made to borrowers experiencing financial difficulty during the year ended December 31, 2022, the Company did not modify any loans that were considered TDRs. During the year ended December 31, 2021, the Company did not modify any loans that were considered TDRs for accounting purposes. Section 4013 of the CARES Act allowed certain loan modifications for borrowers impacted by the COVID-19 pandemic to be excluded from TDR accounting. This relief ended on January 1, 2022. During the year ended December 31, 2021, the Company modified loans under Section 4013 of the CARES Act, granting 90 day deferrals of principal and interest payments. As of December 31, 2021, loans deferred under the CARES Act that are not considered TDRs consisted of consumer loans totaling $84 thousand. There were no chargeoffs related to TDRs made during the years ended December 31, 20222023 and December 31, 2021. During the years ended December 31, 2022 and December 31, 2021, no TDR loans defaulted within 12 months of the modification date. A TDR is considered to be in default when payments are 90 days or more past due.
No loans on nonaccrual status were included in TDRs of $1,752 thousand at December 31, 2022 and $1,965 thousand at December 31, 2021.2022.
A loan is considered collateral dependent when the borrower is experiencing financial difficulty and repayment is expected to be provided substantially through the operation or sale of the collateral. Loans that were considered collateral dependent at December 31, 2023 included the following: nine commercial real estate loans totaling $10.9 million secured by real property and $377 thousand of indirect consumer installment loans secured by personal property. There were no other collateral dependent loans at December 31, 2023. Loans that were considered collateral dependent at December 31, 2022 included the following: five commercial real estate loans totaling $8.1 million secured by real property, and $625 thousand of indirect consumer installment loans secured by personal property. There were no other collateral dependent loans at December 31, 2022.Loans that were considered collateral dependent at December 31, 2021 included the following: five commercial real estate loans totaling $8.4 million secured by real property, $394 thousand of indirect consumer installment loans secured by personal property, one commercial loan with a balance of $57 thousand secured by business assets, and three residential real estate loans totaling $420 thousand secured by real property. There were no other collateral dependent loans at December 31, 2021.
Based on the most recent analysis performed, the risk category of loans by class of loans is as follows:
At December 31, 2022 | At December 31, 2023 | |||||||||||||||||||||||||||||||||||||||||||||||||||||||||||||||||||||||
Line of | Line of | |||||||||||||||||||||||||||||||||||||||||||||||||||||||||||||||||||||||
Credit | Credit | |||||||||||||||||||||||||||||||||||||||||||||||||||||||||||||||||||||||
Term Loans Amortized Cost Basis by Origination Year | Total | Amortized | Term Loans Amortized Cost Basis by Origination Year | Total | Amortized | |||||||||||||||||||||||||||||||||||||||||||||||||||||||||||||||||||
Prior | 2018 | 2019 | 2020 | 2021 | 2022 | Term Loans | Cost Basis | Total | Prior | 2019 | 2020 | 2021 | 2022 | 2023 | Term Loans | Cost Basis | Total | |||||||||||||||||||||||||||||||||||||||||||||||||||||||
(In thousands) | (In thousands) | |||||||||||||||||||||||||||||||||||||||||||||||||||||||||||||||||||||||
Commercial loans by grade | ||||||||||||||||||||||||||||||||||||||||||||||||||||||||||||||||||||||||
Commercial loans by grade: | ||||||||||||||||||||||||||||||||||||||||||||||||||||||||||||||||||||||||
Pass | $ | 23,891 | $ | 5,549 | $ | 12,557 | $ | 17,293 | $ | 53,928 | $ | 23,966 | $ | 137,184 | $ | 31,856 | $ | 169,040 | $ | 20,554 | $ | 4,471 | $ | 12,601 | $ | 31,770 | $ | 22,146 | $ | 13,112 | $ | 104,654 | $ | 25,347 | $ | 130,001 | ||||||||||||||||||||||||||||||||||||
Substandard | 12 | - | - | - | - | - | 12 | 565 | 577 | 12 | 2,492 | - | 2,835 | - | - | 5,339 | 1,210 | 6,549 | ||||||||||||||||||||||||||||||||||||||||||||||||||||||
Doubtful | - | - | - | - | - | - | - | - | - | - | - | - | - | - | - | - | - | - | ||||||||||||||||||||||||||||||||||||||||||||||||||||||
Loss | - | - | - | - | - | - | - | - | - | - | - | - | - | - | - | - | - | - | ||||||||||||||||||||||||||||||||||||||||||||||||||||||
Total | $ | 23,903 | $ | 5,549 | $ | 12,557 | $ | 17,293 | $ | 53,928 | $ | 23,966 | $ | 137,196 | $ | 32,421 | $ | 169,617 | $ | 20,566 | $ | 6,963 | $ | 12,601 | $ | 34,605 | $ | 22,146 | $ | 13,112 | $ | 109,993 | $ | 26,557 | $ | 136,550 | ||||||||||||||||||||||||||||||||||||
Current gross chargeoffs on commercial loans: | Current gross chargeoffs on commercial loans: | |||||||||||||||||||||||||||||||||||||||||||||||||||||||||||||||||||||||
For the year ended December 31, 2023 | For the year ended December 31, 2023 | |||||||||||||||||||||||||||||||||||||||||||||||||||||||||||||||||||||||
| $ | - | $ | - | $ | 3 | $ | 135 | $ | - | $ | - | $ | 138 | $ | 272 | $ | 410 | |||||||||||||||||||||||||||||||||||||||||||||||||||||||
At December 31, 2021 | ||||||||||||||||||||||||||||||||||||
Line of | ||||||||||||||||||||||||||||||||||||
Credit | ||||||||||||||||||||||||||||||||||||
Term Loans Amortized Cost Basis by Origination Year | Total | Amortized | ||||||||||||||||||||||||||||||||||
Prior | 2017 | 2018 | 2019 | 2020 | 2021 | Term Loans | Cost Basis | Total | ||||||||||||||||||||||||||||
(In thousands) | ||||||||||||||||||||||||||||||||||||
Commercial loans by grade | ||||||||||||||||||||||||||||||||||||
Pass | $ | 34,784 | $ | 3,999 | $ | 8,690 | $ | 16,919 | $ | 30,694 | $ | 98,799 | $ | 193,885 | $ | 38,825 | $ | 232,710 | ||||||||||||||||||
Substandard | 32 | - | - | - | - | 57 | 89 | 291 | 380 | |||||||||||||||||||||||||||
Doubtful | - | - | - | - | - | - | - | - | - | |||||||||||||||||||||||||||
Loss | - | - | - | - | - | - | - | - | - | |||||||||||||||||||||||||||
Total | $ | 34,816 | $ | 3,999 | $ | 8,690 | $ | 16,919 | $ | 30,694 | $ | 98,856 | $ | 193,974 | $ | 39,116 | $ | 233,090 | ||||||||||||||||||
At December 31, 2022 | ||||||||||||||||||||||||||||||||||||
Line of | ||||||||||||||||||||||||||||||||||||
Credit | ||||||||||||||||||||||||||||||||||||
Term Loans Amortized Cost Basis by Origination Year | Total | Amortized | ||||||||||||||||||||||||||||||||||
Prior | 2018 | 2019 | 2020 | 2021 | 2022 | Term Loans | Cost Basis | Total | ||||||||||||||||||||||||||||
(In thousands) | ||||||||||||||||||||||||||||||||||||
Commercial loans by grade: | ||||||||||||||||||||||||||||||||||||
Pass | $ | 23,891 | $ | 5,549 | $ | 12,557 | $ | 17,293 | $ | 53,928 | $ | 23,966 | $ | 137,184 | $ | 31,856 | $ | 169,040 | ||||||||||||||||||
Substandard | 12 | - | - | - | - | - | 12 | 565 | 577 | |||||||||||||||||||||||||||
Doubtful | - | - | - | - | - | - | - | - | - | |||||||||||||||||||||||||||
Loss | - | - | - | - | - | - | - | - | - | |||||||||||||||||||||||||||
Total | $ | 23,903 | $ | 5,549 | $ | 12,557 | $ | 17,293 | $ | 53,928 | $ | 23,966 | $ | 137,196 | $ | 32,421 | $ | 169,617 | ||||||||||||||||||
At December 31, 2022 | At December 31, 2023 | |||||||||||||||||||||||||||||||||||||||||||||||||||||||||||||||||||||||
Line of | Line of | |||||||||||||||||||||||||||||||||||||||||||||||||||||||||||||||||||||||
Credit | Credit | |||||||||||||||||||||||||||||||||||||||||||||||||||||||||||||||||||||||
Term Loans Amortized Cost Basis by Origination Year | Total | Amortized | Term Loans Amortized Cost Basis by Origination Year | Total | Amortized | |||||||||||||||||||||||||||||||||||||||||||||||||||||||||||||||||||
Prior | 2018 | 2019 | 2020 | 2021 | 2022 | Term Loans | Cost Basis | Total | Prior | 2019 | 2020 | 2021 | 2022 | 2023 | Term Loans | Cost Basis | Total | |||||||||||||||||||||||||||||||||||||||||||||||||||||||
(In thousands) | (In thousands) | |||||||||||||||||||||||||||||||||||||||||||||||||||||||||||||||||||||||
Commercial real estate loans by grade | ||||||||||||||||||||||||||||||||||||||||||||||||||||||||||||||||||||||||
Commercial real estate loans by grade: | Commercial real estate loans by grade: | |||||||||||||||||||||||||||||||||||||||||||||||||||||||||||||||||||||||
Pass | $ | 146,588 | $ | 58,473 | $ | 71,440 | $ | 74,016 | $ | 71,618 | $ | 55,707 | $ | 477,842 | $ | - | $ | 477,842 | $ | 172,925 | $ | 68,156 | $ | 69,324 | $ | 68,891 | $ | 50,899 | $ | 45,675 | $ | 475,870 | $ | - | $ | 475,870 | ||||||||||||||||||||||||||||||||||||
Substandard | 8,083 | - | 2,112 | 806 | - | 2,264 | 13,265 | - | 13,265 | 10,056 | 811 | 786 | - | - | - | 11,653 | - | 11,653 | ||||||||||||||||||||||||||||||||||||||||||||||||||||||
Doubtful | - | - | - | - | - | - | - | - | - | - | - | - | - | - | - | - | - | - | ||||||||||||||||||||||||||||||||||||||||||||||||||||||
Loss | - | - | - | - | - | - | - | - | - | - | - | - | - | - | - | - | - | - | ||||||||||||||||||||||||||||||||||||||||||||||||||||||
Total | $ | 154,671 | $ | 58,473 | $ | 73,552 | $ | 74,822 | $ | 71,618 | $ | 57,971 | $ | 491,107 | $ | - | $ | 491,107 | $ | 182,981 | $ | 68,967 | $ | 70,110 | $ | 68,891 | $ | 50,899 | $ | 45,675 | $ | 487,523 | $ | - | $ | 487,523 | ||||||||||||||||||||||||||||||||||||
Current gross chargeoffs on commercial real estate loans: | Current gross chargeoffs on commercial real estate loans: | |||||||||||||||||||||||||||||||||||||||||||||||||||||||||||||||||||||||
For the year ended December 31, 2023 | For the year ended December 31, 2023 | |||||||||||||||||||||||||||||||||||||||||||||||||||||||||||||||||||||||
| $ | 45 | $ | - | $ | - | $ | - | $ | - | $ | - | $ | 45 | $ | - | $ | 45 | |||||||||||||||||||||||||||||||||||||||||||||||||||||||
At December 31, 2022 | ||||||||||||||||||||||||||||||||||||
Line of | ||||||||||||||||||||||||||||||||||||
Credit | ||||||||||||||||||||||||||||||||||||
Term Loans Amortized Cost Basis by Origination Year | Total | Amortized | ||||||||||||||||||||||||||||||||||
Prior | 2018 | 2019 | 2020 | 2021 | 2022 | Term Loans | Cost Basis | Total | ||||||||||||||||||||||||||||
(In thousands) | ||||||||||||||||||||||||||||||||||||
Commercial real estate loans by grade: | ||||||||||||||||||||||||||||||||||||
Pass | $ | 146,588 | $ | 58,473 | $ | 71,440 | $ | 74,016 | $ | 71,618 | $ | 55,707 | $ | 477,842 | $ | - | $ | 477,842 | ||||||||||||||||||
Substandard | 8,083 | - | 2,112 | 806 | - | 2,264 | 13,265 | - | 13,265 | |||||||||||||||||||||||||||
Doubtful | - | - | - | - | - | - | - | - | - | |||||||||||||||||||||||||||
Loss | - | - | - | - | - | - | - | - | - | |||||||||||||||||||||||||||
Total | $ | 154,671 | $ | 58,473 | $ | 73,552 | $ | 74,822 | $ | 71,618 | $ | 57,971 | $ | 491,107 | $ | - | $ | 491,107 | ||||||||||||||||||
At December 31, 2023 | ||||||||||||||||||||||||||||||||||||
Line of | ||||||||||||||||||||||||||||||||||||
Credit | ||||||||||||||||||||||||||||||||||||
Term Loans Amortized Cost Basis by Origination Year | Total | Amortized | ||||||||||||||||||||||||||||||||||
Prior | 2019 | 2020 | 2021 | 2022 | 2023 | Term Loans | Cost Basis | Total | ||||||||||||||||||||||||||||
(In thousands) | ||||||||||||||||||||||||||||||||||||
Residential real estate loans by grade: | ||||||||||||||||||||||||||||||||||||
Pass | $ | 9,606 | $ | - | $ | - | $ | - | $ | - | $ | - | $ | 9,606 | $ | - | $ | 9,606 | ||||||||||||||||||
Substandard | 329 | - | - | - | - | - | 329 | - | 329 | |||||||||||||||||||||||||||
Doubtful | - | - | - | - | - | - | - | - | - | |||||||||||||||||||||||||||
Loss | - | - | - | - | - | - | - | - | - | |||||||||||||||||||||||||||
Total | $ | 9,935 | $ | - | $ | - | $ | - | $ | - | $ | - | $ | 9,935 | $ | - | $ | 9,935 | ||||||||||||||||||
Current gross chargeoffs on residential real estate loans: | ||||||||||||||||||||||||||||||||||||
For the year ended December 31, 2023 | ||||||||||||||||||||||||||||||||||||
| $ | - | $ | - | $ | - | $ | - | $ | - | $ | - | $ | - | $ | - | $ | - | |||||||||||||||||||
At December 31, 2022 | ||||||||||||||||||||||||||||||||||||
Line of | ||||||||||||||||||||||||||||||||||||
Credit | ||||||||||||||||||||||||||||||||||||
Term Loans Amortized Cost Basis by Origination Year | Total | Amortized | ||||||||||||||||||||||||||||||||||
Prior | 2018 | 2019 | 2020 | 2021 | 2022 | Term Loans | Cost Basis | Total | ||||||||||||||||||||||||||||
(In thousands) | ||||||||||||||||||||||||||||||||||||
Residential real estate loans by grade: | ||||||||||||||||||||||||||||||||||||
Pass | $ | 13,457 | $ | - | $ | - | $ | - | $ | - | $ | - | $ | 13,457 | $ | - | $ | 13,457 | ||||||||||||||||||
Substandard | 377 | - | - | - | - | - | 377 | - | 377 | |||||||||||||||||||||||||||
Doubtful | - | - | - | - | - | - | - | - | - | |||||||||||||||||||||||||||
Loss | - | - | - | - | - | - | - | - | - | |||||||||||||||||||||||||||
Total | $ | 13,834 | $ | - | $ | - | $ | - | $ | - | $ | - | $ | 13,834 | $ | - | $ | 13,834 | ||||||||||||||||||
[The remainder of this page intentionally left blank]
At December 31, 2021 | ||||||||||||||||||||||||||||||||||||
Line of | ||||||||||||||||||||||||||||||||||||
Credit | ||||||||||||||||||||||||||||||||||||
Term Loans Amortized Cost Basis by Origination Year | Total | Amortized | ||||||||||||||||||||||||||||||||||
Prior | 2017 | 2018 | 2019 | 2020 | 2021 | Term Loans | Cost Basis | Total | ||||||||||||||||||||||||||||
(In thousands) | ||||||||||||||||||||||||||||||||||||
Commercial real estate loans by grade | ||||||||||||||||||||||||||||||||||||
Pass | $ | 116,181 | $ | 87,921 | $ | 78,200 | $ | 78,647 | $ | 83,642 | $ | 76,709 | $ | 521,300 | $ | - | $ | 521,300 | ||||||||||||||||||
Substandard | 10,993 | - | - | 2,016 | 823 | 129 | 13,961 | - | 13,961 | |||||||||||||||||||||||||||
Doubtful | - | - | - | - | - | - | - | - | - | |||||||||||||||||||||||||||
Loss | - | - | - | - | - | - | - | - | - | |||||||||||||||||||||||||||
Total | $ | 127,174 | $ | 87,921 | $ | 78,200 | $ | 80,663 | $ | 84,465 | $ | 76,838 | $ | 535,261 | $ | - | $ | 535,261 | ||||||||||||||||||
At December 31, 2023 | ||||||||||||||||||||||||||||||||||||
Line of | ||||||||||||||||||||||||||||||||||||
Credit | ||||||||||||||||||||||||||||||||||||
Term Loans Amortized Cost Basis by Origination Year | Total | Amortized | ||||||||||||||||||||||||||||||||||
Prior | 2019 | 2020 | 2021 | 2022 | 2023 | Term Loans | Cost Basis | Total | ||||||||||||||||||||||||||||
(In thousands) | ||||||||||||||||||||||||||||||||||||
Construction loans by grade: | ||||||||||||||||||||||||||||||||||||
Pass | $ | - | $ | - | $ | - | $ | - | $ | - | $ | - | $ | - | $ | 5,063 | $ | 5,063 | ||||||||||||||||||
Substandard | - | - | - | - | - | - | - | - | - | |||||||||||||||||||||||||||
Doubtful | - | - | - | - | - | - | - | - | - | |||||||||||||||||||||||||||
Loss | - | - | - | - | - | - | - | - | - | |||||||||||||||||||||||||||
Total | $ | - | $ | - | $ | - | $ | - | $ | - | $ | - | $ | - | $ | 5,063 | $ | 5,063 | ||||||||||||||||||
Current gross chargeoffs on construction loans: | ||||||||||||||||||||||||||||||||||||
For the year ended December 31, 2023 | ||||||||||||||||||||||||||||||||||||
| $ | - | $ | - | $ | - | $ | - | $ | - | $ | - | $ | - | $ | - | $ | - | |||||||||||||||||||
At December 31, 2022 | At December 31, 2022 | |||||||||||||||||||||||||||||||||||||||||||||||||||||||||||||||||||||||
Line of | Line of | |||||||||||||||||||||||||||||||||||||||||||||||||||||||||||||||||||||||
Credit | Credit | |||||||||||||||||||||||||||||||||||||||||||||||||||||||||||||||||||||||
Term Loans Amortized Cost Basis by Origination Year | Total | Amortized | Term Loans Amortized Cost Basis by Origination Year | Total | Amortized | |||||||||||||||||||||||||||||||||||||||||||||||||||||||||||||||||||
Prior | 2018 | 2019 | 2020 | 2021 | 2022 | Term Loans | Cost Basis | Total | Prior | 2018 | 2019 | 2020 | 2021 | 2022 | Term Loans | Cost Basis | Total | |||||||||||||||||||||||||||||||||||||||||||||||||||||||
(In thousands) | (In thousands) | |||||||||||||||||||||||||||||||||||||||||||||||||||||||||||||||||||||||
Residential real estate loans by grade | ||||||||||||||||||||||||||||||||||||||||||||||||||||||||||||||||||||||||
Construction loans by grade: | ||||||||||||||||||||||||||||||||||||||||||||||||||||||||||||||||||||||||
Pass | $ | 13,457 | $ | - | $ | - | $ | - | $ | - | $ | - | $ | 13,457 | $ | - | $ | 13,457 | $ | - | $ | - | $ | - | $ | - | $ | - | $ | - | $ | - | $ | 3,088 | $ | 3,088 | ||||||||||||||||||||||||||||||||||||
Substandard | 377 | - | - | - | - | - | 377 | - | 377 | - | - | - | - | - | - | - | - | - | ||||||||||||||||||||||||||||||||||||||||||||||||||||||
Doubtful | - | - | - | - | - | - | - | - | - | - | - | - | - | - | - | - | - | - | ||||||||||||||||||||||||||||||||||||||||||||||||||||||
Loss | - | - | - | - | - | - | - | - | - | - | - | - | - | - | - | - | - | - | ||||||||||||||||||||||||||||||||||||||||||||||||||||||
Total | $ | 13,834 | $ | - | $ | - | $ | - | $ | - | $ | - | $ | 13,834 | $ | - | $ | 13,834 | $ | - | $ | - | $ | - | $ | - | $ | - | $ | - | $ | - | $ | 3,088 | $ | 3,088 | ||||||||||||||||||||||||||||||||||||
At December 31, 2021 | ||||||||||||||||||||||||||||||||||||
Line of | ||||||||||||||||||||||||||||||||||||
Credit | ||||||||||||||||||||||||||||||||||||
Term Loans Amortized Cost Basis by Origination Year | Total | Amortized | ||||||||||||||||||||||||||||||||||
Prior | 2017 | 2018 | 2019 | 2020 | 2021 | Term Loans | Cost Basis | Total | ||||||||||||||||||||||||||||
(In thousands) | ||||||||||||||||||||||||||||||||||||
Residential Real Estate loans by grade | ||||||||||||||||||||||||||||||||||||
Pass | $ | 16,874 | $ | - | $ | - | $ | - | $ | - | $ | - | $ | 16,874 | $ | - | $ | 16,874 | ||||||||||||||||||
Substandard | 1,259 | - | - | - | - | - | 1,259 | - | 1,259 | |||||||||||||||||||||||||||
Doubtful | - | - | - | - | - | - | - | - | - | |||||||||||||||||||||||||||
Loss | - | - | - | - | - | - | - | - | - | |||||||||||||||||||||||||||
Total | $ | 18,133 | $ | - | $ | - | $ | - | $ | - | $ | - | $ | 18,133 | $ | - | $ | 18,133 | ||||||||||||||||||
At December 31, 2022 | ||||||||||||||||||||||||||||||||||||
Line of | ||||||||||||||||||||||||||||||||||||
Credit | ||||||||||||||||||||||||||||||||||||
Term Loans Amortized Cost Basis by Origination Year | Total | Amortized | ||||||||||||||||||||||||||||||||||
Prior | 2018 | 2019 | 2020 | 2021 | 2022 | Term Loans | Cost Basis | Total | ||||||||||||||||||||||||||||
(In thousands) | ||||||||||||||||||||||||||||||||||||
Construction loans by grade | ||||||||||||||||||||||||||||||||||||
Pass | $ | - | $ | - | $ | - | $ | - | $ | - | $ | - | $ | - | $ | 3,088 | $ | 3,088 | ||||||||||||||||||
Substandard | - | - | - | - | - | - | - | - | - | |||||||||||||||||||||||||||
Doubtful | - | - | - | - | - | - | - | - | - | |||||||||||||||||||||||||||
Loss | - | - | - | - | - | - | - | - | - | |||||||||||||||||||||||||||
Total | $ | - | $ | - | $ | - | $ | - | $ | - | $ | - | $ | - | $ | 3,088 | $ | 3,088 | ||||||||||||||||||
At December 31, 2021 | ||||||||||||||||||||||||||||||||||||
Line of | ||||||||||||||||||||||||||||||||||||
Credit | ||||||||||||||||||||||||||||||||||||
Term Loans Amortized Cost Basis by Origination Year | Total | Amortized | ||||||||||||||||||||||||||||||||||
Prior | 2017 | 2018 | 2019 | 2020 | 2021 | Term Loans | Cost Basis | Total | ||||||||||||||||||||||||||||
(In thousands) | ||||||||||||||||||||||||||||||||||||
Construction loans by grade | ||||||||||||||||||||||||||||||||||||
Pass | $ | - | $ | - | $ | - | $ | - | $ | - | $ | - | $ | - | $ | 48 | $ | 48 | ||||||||||||||||||
Substandard | - | - | - | - | - | - | - | - | - | |||||||||||||||||||||||||||
Doubtful | - | - | - | - | - | - | - | - | - | |||||||||||||||||||||||||||
Loss | - | - | - | - | - | - | - | - | - | |||||||||||||||||||||||||||
Total | $ | - | $ | - | $ | - | $ | - | $ | - | $ | - | $ | - | $ | 48 | $ | 48 | ||||||||||||||||||
[The remainder of this page intentionally left blank]
The Company considers the delinquency and nonaccrual status of the consumer loan portfolio and its impact on the allowance for credit losses. The following table presents the amortized cost in consumer installment and other loans based on delinquency and nonaccrual status:
At December 31, 2022 | At December 31, 2023 | |||||||||||||||||||||||||||||||||||||||||||||||||||||||||||||||||||||||
Line of | Line of | |||||||||||||||||||||||||||||||||||||||||||||||||||||||||||||||||||||||
Credit | Credit | |||||||||||||||||||||||||||||||||||||||||||||||||||||||||||||||||||||||
Term Loans Amortized Cost Basis by Origination Year | Total | Amortized | Term Loans Amortized Cost Basis by Origination Year | Total | Amortized | |||||||||||||||||||||||||||||||||||||||||||||||||||||||||||||||||||
Prior | 2018 | 2019 | 2020 | 2021 | 2022 | Term Loans | Cost Basis | Total | Prior | 2019 | 2020 | 2021 | 2022 | 2023 | Term Loans | Cost Basis | Total | |||||||||||||||||||||||||||||||||||||||||||||||||||||||
(In thousands) | (In thousands) | |||||||||||||||||||||||||||||||||||||||||||||||||||||||||||||||||||||||
Consumer installment and other loans by delinquency and nonaccrual status | ||||||||||||||||||||||||||||||||||||||||||||||||||||||||||||||||||||||||
Consumer installment and other loans by delinquency and nonaccrual status: | Consumer installment and other loans by delinquency and nonaccrual status: | |||||||||||||||||||||||||||||||||||||||||||||||||||||||||||||||||||||||
Current | $ | 6,017 | $ | 13,147 | $ | 22,330 | $ | 35,783 | $ | 76,126 | $ | 99,414 | $ | 252,817 | $ | 20,430 | $ | 273,247 | $ | 6,545 | $ | 12,144 | $ | 22,700 | $ | 51,055 | $ | 71,388 | $ | 38,699 | $ | 202,531 | $ | 17,826 | $ | 220,357 | ||||||||||||||||||||||||||||||||||||
30-59 days past due | 117 | 268 | 572 | 1,014 | 1,709 | 1,359 | 5,039 | 62 | 5,101 | 160 | 277 | 600 | 2,345 | 1,733 | 332 | 5,447 | 97 | 5,544 | ||||||||||||||||||||||||||||||||||||||||||||||||||||||
60-89 days past due | 42 | 65 | 67 | 275 | 635 | 750 | 1,834 | 16 | 1,850 | 31 | 51 | 153 | 410 | 430 | 122 | 1,197 | 45 | 1,242 | ||||||||||||||||||||||||||||||||||||||||||||||||||||||
Past due 90 days or more | 3 | 20 | 16 | 61 | 284 | 241 | 625 | 3 | 628 | - | 8 | 88 | 143 | 138 | - | 377 | 11 | 388 | ||||||||||||||||||||||||||||||||||||||||||||||||||||||
Nonaccrual | - | - | - | - | - | - | - | 16 | 16 | - | - | - | - | - | - | - | - | - | ||||||||||||||||||||||||||||||||||||||||||||||||||||||
Total | $ | 6,179 | $ | 13,500 | $ | 22,985 | $ | 37,133 | $ | 78,754 | $ | 101,764 | $ | 260,315 | $ | 20,527 | $ | 280,842 | $ | 6,736 | $ | 12,480 | $ | 23,541 | $ | 53,953 | $ | 73,689 | $ | 39,153 | $ | 209,552 | $ | 17,979 | $ | 227,531 | ||||||||||||||||||||||||||||||||||||
Current gross chargeoffs on consumer installment and other loans: | Current gross chargeoffs on consumer installment and other loans: | |||||||||||||||||||||||||||||||||||||||||||||||||||||||||||||||||||||||
For the year ended December 31, 2023 | For the year ended December 31, 2023 | |||||||||||||||||||||||||||||||||||||||||||||||||||||||||||||||||||||||
| $ | 246 | $ | 161 | $ | 843 | $ | 2,329 | $ | 3,191 | $ | 453 | $ | 7,223 | $ | 276 | $ | 7,499 | |||||||||||||||||||||||||||||||||||||||||||||||||||||||
At December 31, 2021 | At December 31, 2022 | |||||||||||||||||||||||||||||||||||||||||||||||||||||||||||||||||||||||
Line of | Line of | |||||||||||||||||||||||||||||||||||||||||||||||||||||||||||||||||||||||
Credit | Credit | |||||||||||||||||||||||||||||||||||||||||||||||||||||||||||||||||||||||
Term Loans Amortized Cost Basis by Origination Year | Total | Amortized | Term Loans Amortized Cost Basis by Origination Year | Total | Amortized | |||||||||||||||||||||||||||||||||||||||||||||||||||||||||||||||||||
Prior | 2017 | 2018 | 2019 | 2020 | 2021 | Term Loans | Cost Basis | Total | Prior | 2018 | 2019 | 2020 | 2021 | 2022 | Term Loans | Cost Basis | Total | |||||||||||||||||||||||||||||||||||||||||||||||||||||||
(In thousands) | (In thousands) | |||||||||||||||||||||||||||||||||||||||||||||||||||||||||||||||||||||||
Consumer installment and other loans by delinquency and nonaccrual status | ||||||||||||||||||||||||||||||||||||||||||||||||||||||||||||||||||||||||
Consumer installment and other loans by delinquency and nonaccrual status: | Consumer installment and other loans by delinquency and nonaccrual status: | |||||||||||||||||||||||||||||||||||||||||||||||||||||||||||||||||||||||
Current | $ | 7,884 | $ | 10,162 | $ | 25,932 | $ | 37,999 | $ | 58,178 | $ | 113,899 | $ | 254,054 | $ | 22,739 | $ | 276,793 | $ | 6,017 | $ | 13,147 | $ | 22,330 | $ | 35,783 | $ | 76,126 | $ | 99,414 | $ | 252,817 | $ | 20,430 | $ | 273,247 | ||||||||||||||||||||||||||||||||||||
30-59 days past due | 197 | 139 | 634 | 504 | 662 | 1,034 | 3,170 | 14 | 3,184 | 117 | 268 | 572 | 1,014 | 1,709 | 1,359 | 5,039 | 62 | 5,101 | ||||||||||||||||||||||||||||||||||||||||||||||||||||||
60-89 days past due | 5 | 20 | 156 | 150 | 186 | 408 | 925 | 88 | 1,013 | 42 | 65 | 67 | 275 | 635 | 750 | 1,834 | 16 | 1,850 | ||||||||||||||||||||||||||||||||||||||||||||||||||||||
Past due 90 days or more | 1 | 17 | 81 | 62 | 109 | 40 | 310 | 29 | 339 | 3 | 20 | 16 | 61 | 284 | 241 | 625 | 3 | 628 | ||||||||||||||||||||||||||||||||||||||||||||||||||||||
Nonaccrual | - | - | - | - | - | - | - | 265 | 265 | - | - | - | - | - | - | - | 16 | 16 | ||||||||||||||||||||||||||||||||||||||||||||||||||||||
Total | $ | 8,087 | $ | 10,338 | $ | 26,803 | $ | 38,715 | $ | 59,135 | $ | 115,381 | $ | 258,459 | $ | 23,135 | $ | 281,594 | $ | 6,179 | $ | 13,500 | $ | 22,985 | $ | 37,133 | $ | 78,754 | $ | 101,764 | $ | 260,315 | $ | 20,527 | $ | 280,842 | ||||||||||||||||||||||||||||||||||||
There were no loans held for sale at December 31, 20222023 and December 31, 2021.2022.
The Company held no other real estate owned (OREO) at December 31, 20222023 and December 31, 2021.2022. The amount ofAt December 31, 2023 and December 31, 2022, there were no consumer mortgage loans outstanding secured by residential real estate properties for which formal foreclosure proceedings were in process was $-0- thousand at December 31, 2022 and $247 thousand at December 31, 2021.process.
[The remainder of this page intentionally left blank]
Note 4: Concentration of Credit Risk
Under the California Financial Code, credit extended to any one person owing to a commercial bank at any one time shall not exceed the following limitations as applicable to the Bank:limitations: (a) unsecured credits shall not exceed 15 percent of the sum of the common stock outstanding and unimpaired, perpetual preferred stock outstanding and unimpaired, capital surplus, undivided profits, andBank’s shareholders’ equity, allowance for creditloan losses, less intangible assets of the Bank,capital notes, and debentures, or (b) secured and unsecured credits in all shall not exceed 25 percent of the sum of the common stock outstanding and unimpaired, perpetual preferred stock outstanding and unimpaired, capital surplus, undivided profits, andBank’s shareholders’ equity, allowance for creditloan losses, less intangible assets of the Bank.capital notes, and debentures. At December 31, 2022,2023, the Bank did not have credit extended to any one entity exceeding these limits. At December 31, 2022,2023, the Bank had 2725 lending relationships each with aggregate amounts of $5 million or more. The Company has significant credit arrangements that are secured by real estate collateral. In addition to real estate loans outstanding as disclosed in Note 3, the Company had loan commitments related to real estate loans of $34,790$30,888 thousand and $34,226$34,790 thousand at December 31, 20222023 and December 31, 2021,2022, respectively. The Company requires collateral on all real estate loans with loan-to-value ratios at origination generally no greater than 75% on commercial real estate loans and no greater than 80% on residential real estate loans. At December 31, 2022,2023, the Bank held corporate bonds in 118107 issuing entities that exceeded $5 million for each issuer.
Note 5: Premises, Equipment, Other Assets and Other Liabilities
Premises and equipment consisted of the following:
At December 31, | At December 31, | |||||||||||||||||||||||
Cost | Accumulated Depreciation and Amortization | Net Book Value | Cost | Accumulated Depreciation and Amortization | Net Book Value | |||||||||||||||||||
(In thousands) | (In thousands) | |||||||||||||||||||||||
2023 | ||||||||||||||||||||||||
Land | $ | 11,453 | $ | - | $ | 11,453 | ||||||||||||||||||
Building and improvements | 43,185 | (31,742 | ) | 11,443 | ||||||||||||||||||||
Leasehold improvements | 7,622 | (6,550 | ) | 1,072 | ||||||||||||||||||||
Furniture and equipment | 26,586 | (23,538 | ) | 3,048 | ||||||||||||||||||||
Total | $ | 88,846 | $ | (61,830 | ) | $ | 27,016 | |||||||||||||||||
2022 | ||||||||||||||||||||||||
Land | $ | 11,453 | $ | - | $ | 11,453 | $ | 11,453 | $ | - | $ | 11,453 | ||||||||||||
Building and improvements | 42,528 | (30,601 | ) | 11,927 | 42,528 | (30,601 | ) | 11,927 | ||||||||||||||||
Leasehold improvements | 8,157 | (6,897 | ) | 1,260 | 8,157 | (6,897 | ) | 1,260 | ||||||||||||||||
Furniture and equipment | 26,766 | (22,587 | ) | 4,179 | 26,766 | (22,587 | ) | 4,179 | ||||||||||||||||
Total | $ | 88,904 | $ | (60,085 | ) | $ | 28,819 | $ | 88,904 | $ | (60,085 | ) | $ | 28,819 | ||||||||||
2021 | ||||||||||||||||||||||||
Land | $ | 11,453 | $ | - | $ | 11,453 | ||||||||||||||||||
Building and improvements | 43,009 | (30,069 | ) | 12,940 | ||||||||||||||||||||
Leasehold improvements | 7,567 | (5,967 | ) | 1,600 | ||||||||||||||||||||
Furniture and equipment | 26,642 | (21,480 | ) | 5,162 | ||||||||||||||||||||
Total | $ | 88,671 | $ | (57,516 | ) | $ | 31,155 | |||||||||||||||||
Depreciation and amortization of premises and equipment included in noninterest expense amounted to $2,942 thousand in 2023,$2,899 thousand in 2022, and $2,978 thousand in 2021 and $3,683 thousand in 2020.2021.
[The remainder of this page intentionally left blank]
Other assets consisted of the following:
At December 31, | At December 31, | At December 31, | At December 31, | |||||||||||||
2022 | 2021 | 2023 | 2022 | |||||||||||||
(In thousands) | (In thousands) | |||||||||||||||
Cost method equity investments: | ||||||||||||||||
Federal Reserve Bank stock (1) | $ | 11,743 | $ | 14,069 | $ | 14,069 | $ | 11,743 | ||||||||
Other investments | 158 | 158 | 158 | 158 | ||||||||||||
Total cost method equity investments | 11,901 | 14,227 | 14,227 | 11,901 | ||||||||||||
Life insurance cash surrender value | 63,816 | 63,107 | 66,611 | 63,816 | ||||||||||||
Net deferred tax asset | 125,140 | - | 99,507 | 125,140 | ||||||||||||
Right-of-use asset | 15,746 | 17,980 | 18,814 | 15,746 | ||||||||||||
Limited partnership investments | 34,421 | 37,145 | 28,667 | 34,421 | ||||||||||||
Interest receivable | 53,558 | 35,521 | 54,568 | 53,558 | ||||||||||||
Prepaid assets | 4,894 | 4,757 | 5,200 | 4,894 | ||||||||||||
Other assets | 9,670 | 12,678 | 9,716 | 9,670 | ||||||||||||
Total other assets | $ | 319,146 | $ | 185,415 | $ | 297,310 | $ | 319,146 | ||||||||
(1) A bank applying for membership in the Federal Reserve System is required to subscribe to stock in the Federal Reserve Bank (FRB) in its district in a sum equal to six percent of the bank’s paid-up capital stock and surplus. One-half of the amount of the bank's subscription shall be paid to the FRB and the remaining half will be subject to call when deemed necessary by the Board of Governors of the Federal Reserve System.
The Company owns 211 thousand shares of Visa Inc. (“Visa”) class B common stock which have transfer restrictions; the carrying value is $-0- thousand. Visa Inc. disclosed a revised conversion rate applicable to its class B common stock in its Form 8-K dated January 5,October 2, 2023. The conversion rate of class B common stock into class A common stock, which is unrestricted and trades actively on the New York Stock Exchange, was reduced from 1.60591.5902 to 1.59911.5875 per share, effective as of December 29, 2022.September 28, 2023. Visa Inc. class A common stock had a closing price of $207.76$260.35 per share on December 30, 2022,29, 2023, the last day of stock market trading for the fourth quarter 2022.2023. The ultimate value of the Company’s Visa Inc. class B shares is subject to the extent of Visa Inc.’s future litigation escrow fundings, the resulting conversion rate to class A common stock, and current and future trading restrictions on the class B common stock. At its Annual Meeting held January 23, 2024, Visa proposed a Class B Exchange Offer Program authorizing Visa to conduct one or more exchange offers that would allow Class B stockholders to exchange portions of their Class B common stock into freely tradable shares. The proposal was approved by Visa stockholders. Under an initial exchange offer, current Class B shares will be exchanged into Class B-1 shares. In potential exchange offers, a Class B-1 stockholder can elect to exchange a portion of its Class B-1 shares for Class C common stock which is transferable and convertible to Class A common stock. Any exchange of Class B-1 shares into Class C common stock requires the stockholder to execute an indemnification agreement with Visa for Visa’s related unresolved litigation.
The Company invests in flow-through limited liability entities that manage or invest in affordable housing projects that qualify for low-income housing tax credits. At December 31, 2023, these investments totaled $28,667 thousand and $15,561 thousand of this amount represents outstanding equity capital commitments that are included in other liabilities. At December 31, 2022, these investments totaled $34,421 thousand and $22,647 thousand of this amount represents outstanding equity capital commitments that are included in other liabilities. At December 31, 2021, these investments totaled $37,145 thousand and $26,485 thousand of this amount represents outstanding equity capital commitments that are included in other liabilities. At December 31, 2022,2023, the $22,647$15,561 thousand of outstanding equity capital commitments are expected to be paid as follows: $10,992 thousand in 2023, $10,499$14,077 thousand in 2024, $359$600 thousand in 2025, $59$145 thousand in 2026, $190$189 thousand in 2027, and $548$550 thousand in 2028 or thereafter.
The amounts recognized in net income for these investments include:
For the Years Ended December 31, | For the Years Ended December 31, | |||||||||||||||||||||||
2022 | 2021 | 2020 | 2023 | 2022 | 2021 | |||||||||||||||||||
(In thousands) | (In thousands) | |||||||||||||||||||||||
Investment loss included in pre-tax income | $ | 5,724 | $ | 2,620 | $ | 2,440 | $ | 5,754 | $ | 5,724 | $ | 2,620 | ||||||||||||
Tax credits recognized in provision for income taxes | 3,250 | 2,300 | 900 | 3,435 | 3,250 | 2,300 | ||||||||||||||||||
[The remainder of this page intentionally left blank]
Other liabilities consisted of the following:
At December 31, | At December 31, | At December 31, | ||||||||||||||
2022 | 2021 | 2023 | 2022 | |||||||||||||
(In thousands) | (In thousands) | |||||||||||||||
Net deferred tax liability | $ | - | $ | 2,501 | ||||||||||||
Operating lease liability | 15,746 | 17,980 | $ | 18,814 | $ | 15,746 | ||||||||||
Other liabilities | 49,379 | 53,241 | 40,455 | 49,379 | ||||||||||||
Total other liabilities | $ | 65,125 | $ | 73,722 | $ | 59,269 | $ | 65,125 | ||||||||
The Company has entered into leases for most branch locations and certain other offices that were classified as operating leases primarily with original terms of five years. Certain lease arrangements contain extension options, which can be exercised at the Company’s option, for one or more additional five year terms. Unexercised extension options are not considered reasonably certain of exercise and have not been included in the lease term used to determine the lease liability or right-of-use asset. The Company did not have any finance leases as of December 31, 2022.2023.
As of December 31, 2022,2023, the Company’s lease liability and right-of-use asset were $15,746$18,814 thousand. The weighted average remaining life of operating leases and weighted average discount rate used to determine operating lease liabilities were 3.7 years and 1.87%2.94%, respectively, at December 31, 2022.2023. The Company did not have any material lease incentives, unamortized initial direct costs, prepaid lease expense, or accrued lease expense as of December 31, 2022.2023.
Total lease costs of $6,604 thousand, $6,575 thousand $6,581 thousand and $6,699$6,581 thousand, during the year ended December 31, 2022,2023, December 31, 2021 2022and December 31, 2020, 2021,respectively, were recorded within occupancy and equipment expense. The Company did not have any material short-term or variable leases costs or sublease income during the year ended December 31, 2022,2023, December 31, 2021 2022and December 31, 2020.2021.
[The remainder of this page intentionally left blank]
The following table summarizes the remaining lease payments of operating lease liabilities:
Minimum | Minimum | |||||||
At December 31, | At December 31, | |||||||
2022 | 2023 | |||||||
(In thousands) | (In thousands) | |||||||
2023 | $ | 5,843 | ||||||
2024 | 4,267 | $ | 6,067 | |||||
2025 | 3,033 | 5,178 | ||||||
2026 | 1,408 | 3,518 | ||||||
2027 | 709 | 2,621 | ||||||
2028 | 1,865 | |||||||
Thereafter | 1,015 | 818 | ||||||
Total minimum lease payments | 16,275 | 20,067 | ||||||
Less: discount | (529 | ) | (1,253 | ) | ||||
Present value of lease liability | $ | 15,746 | $ | 18,814 | ||||
See Note 10 to the consolidated financial statements for additional information related to the net deferred tax liability.asset.
Note 6: Goodwill and Identifiable Intangible Assets
The Company has recorded goodwill and other identifiable intangibles associated with purchase business combinations. Goodwill is not amortized, but is evaluated for impairment at least annually. The Company did not recognize impairment during the year ended December 31, 20222023 and December 31, 2021.2022, as no triggering events occurred during such periods. Identifiable intangibles are amortized to their estimated residual values over their expected useful lives. Such lives and residual values are also periodically reassessed to determine if any amortization period adjustments are indicated. During the year ended December 31, 20222023 and December 31, 20212022, no such adjustments were recorded.
[The remainder of this page intentionally left blank]
The carrying values of goodwill were:
At December 31, 2022 | At December 31, 2021 | |||||||
(In thousands) | ||||||||
Goodwill | $ | 121,673 | $ | 121,673 | ||||
At December 31, 2023 | At December 31, 2022 | |||||||
(In thousands) | ||||||||
Goodwill | $ | 121,673 | $ | 121,673 | ||||
The gross carrying amount of identifiable intangible assets and accumulated amortization was:were:
At December 31, 2022 | At December 31, 2021 | |||||||||||||||
Gross | Gross | |||||||||||||||
Carrying | Accumulated | Carrying | Accumulated | |||||||||||||
Amount | Amortization | Amount | Amortization | |||||||||||||
(In thousands) | ||||||||||||||||
Core deposit intangibles | $ | 56,808 | $ | (56,225 | ) | $ | 56,808 | $ | (55,973 | ) | ||||||
At December 31, 2023 | At December 31, 2022 | |||||||||||||||
Gross | Gross | |||||||||||||||
Carrying | Accumulated | Carrying | Accumulated | |||||||||||||
Amount | Amortization | Amount | Amortization | |||||||||||||
(In thousands) | ||||||||||||||||
Core deposit intangibles | $ | 56,808 | $ | (56,461 | ) | $ | 56,808 | $ | (56,225 | ) | ||||||
As of December 31, 2022,2023, the current period and estimated future amortization expense for identifiable intangible assets, to be fully amortized in 2025, was:
Total | Total | |||||||
Core | Core | |||||||
Deposit | Deposit | |||||||
Intangibles | Intangibles | |||||||
(In thousands) | (In thousands) | |||||||
For the year ended December 31, 2022 (actual) | $ | 252 | ||||||
2023 | 236 | |||||||
For the year ended December 31, 2023 (actual) | $ | 236 | ||||||
2024 | 222 | 222 | ||||||
2025 | 125 | 125 | ||||||
Note 7: Deposits and Borrowed Funds
The following table provides additional detail regarding deposits.
Deposits | Deposits | |||||||||||||||
At December 31, | At December 31, | At December 31, | At December 31, | |||||||||||||
2022 | 2021 | 2023 | 2022 | |||||||||||||
(In thousands) | (In thousands) | |||||||||||||||
Noninterest-bearing | $ | 2,947,277 | $ | 3,069,080 | $ | 2,605,844 | $ | 2,947,277 | ||||||||
Interest-bearing: | ||||||||||||||||
Transaction | 1,273,143 | 1,260,869 | 1,072,233 | 1,273,143 | ||||||||||||
Savings | 1,874,115 | 1,940,395 | 1,699,388 | 1,874,115 | ||||||||||||
Time deposits less than $100 thousand | 65,962 | 72,527 | 56,100 | 65,962 | ||||||||||||
Time deposits $100 thousand through $250 thousand | 42,733 | 47,666 | 31,107 | 42,733 | ||||||||||||
Time deposits more than $250 thousand | 22,060 | 23,419 | 9,595 | 22,060 | ||||||||||||
Total deposits | $ | 6,225,290 | $ | 6,413,956 | $ | 5,474,267 | $ | 6,225,290 | ||||||||
Demand deposit overdrafts of $995$620 thousand and $611 thousand$995thousand were included as loan balances at December 31, 20222023 and December 31, 2021,2022, respectively. Interest expense for aggregate time deposits with individual account balances in excess of $100 thousand was $116 thousand in 2023,$156 thousand in 2022, and $265 thousand in 2021 and $319 thousand in 2020.2021.
[The remainder of this page intentionally left blank]
The following table provides additional detail regarding short-term borrowed funds.
Repurchase Agreements (Sweep) | ||||||||
Remaining Contractual Maturity of the Agreements | ||||||||
Overnight and Continuous | ||||||||
At December 31, | At December 31, | |||||||
2023 | 2022 | |||||||
Repurchase agreements: | (In thousands) | |||||||
Collateral securing borrowings: | ||||||||
Agency residential MBS | $ | 25,669 | $ | 30,108 | ||||
Corporate securities | 233,947 | 203,774 | ||||||
Total collateral carrying value | $ | 259,616 | $ | 233,882 | ||||
Total short-term borrowed funds | $ | 58,162 | $ | 57,792 | ||||
The following table provides additional detail regarding short-term borrowed funds.
Repurchase Agreements (Sweep) | ||||||||
Remaining Contractual Maturity of the Agreements | ||||||||
Overnight and Continuous | ||||||||
At December 31, | At December 31, | |||||||
2022 | 2021 | |||||||
Repurchase agreements: | (In thousands) | |||||||
Collateral securing borrowings: | ||||||||
Agency residential MBS | $ | 30,108 | $ | 42,295 | ||||
Corporate securities | 203,774 | 254,005 | ||||||
Total collateral carrying value | $ | 233,882 | $ | 296,300 | ||||
Total short-term borrowed funds | $ | 57,792 | $ | 146,246 | ||||
For the Years Ended December 31, | ||||||||
2022 | 2021 | |||||||
Highest Balance at Any Month-end | ||||||||
(In thousands) | ||||||||
Securities sold under repurchase agreements | $ | 257,560 | $ | 146,552 | ||||
For the Years Ended December 31, | ||||||||
2023 | 2022 | |||||||
Highest Balance at Any Month-end | ||||||||
(In thousands) | ||||||||
Securities sold under repurchase agreements | $ | 138,005 | $ | 257,560 | ||||
At December 31, 2022,2023, the Company had uncommitted lines of credit for overnight borrowings from correspondingcorrespondent banks totaling $100 million. Additionally, the Company had access to borrowing from the Federal Reserve up to $225 million$996,935 thousand based on the collateral pledged at December 31, 2022.2023. There were no outstanding amounts under the above-mentioned borrowings at December 31, 2022.2023. For the year ended December 31, 2023, the average balances of the above-mentioned borrowings were $-0- thousand. At December 31, 2023, the Company’s estimated unpledged debt securities collateral qualifying for Federal Reserve borrowing totaled $1,945,176 thousand.
Note 8: Shareholders’ Equity
The Company grants stock options and restricted performance shares to employees in exchange for employee services, pursuant to the shareholder-approved 2019 Omnibus Equity Incentive Plan. Prior to shareholder approval of the 2019 Omnibus Equity Incentive Plan on April 25, 2019, the Company granted stock options and restricted performance shares under its 1995 Stock Option Plan, which was last amended and restated in 2012. Nonqualified stock option grants (“NQSO”) are granted with an exercise price equal to the fair market value of the related common stock on the grant date. NQSO generally become exercisable in equal annual installments over a three-year period with each installment vesting on the anniversary date of the grant. Each NQSO has a maximum ten-year term. A restricted performance share grant becomes vested after three years of being awarded, provided the Company has attained its performance goals for such three-year period.
[The remainder of this page intentionally left blank]
The following table summarizes information about stock options granted under the Plans as of December 31, 2022.2023. The intrinsic value is calculated as the difference between the market valuevolume weighted average price as of December 31, 20222023 and the exercise price of the shares. The market value as of December 30, 2022,29, 2023, the last day of stock market trading for the fourth quarter 2022,2023, was $59.01$56.41 as reported by the NASDAQ Global Select Market:
Options Outstanding | Options Exercisable | |||||||||||||||||||||||||||||||||||
At December 31, 2022 | For the Year Ended December 31, 2022 | At December 31, 2022 | For the Year Ended December 31, 2022 | |||||||||||||||||||||||||||||||||
Range of Exercise Price | Number Outstanding | Aggregate Intrinsic Value | Weighted Average Remaining Contractual Life | Weighted Average Exercise Price | Number Exercisable | Aggregate Intrinsic Value | Weighted Average Remaining Contractual Life | Weighted Average Exercise Price | ||||||||||||||||||||||||||||
(In thousands) | (Years) | (In thousands) | (Years) | |||||||||||||||||||||||||||||||||
| $ | 40 | - | 45 | 32 | $ | 527 | 2.8 | $ | 42 | 32 | $ | 527 | 2.8 | $ | 42 | |||||||||||||||||||||
| 45 | - | 50 | - | - | - | - | - | - | - | - | ||||||||||||||||||||||||||
| 50 | - | 55 | 6 | 33 | 1.1 | 53 | 6 | 33 | 1.1 | 53 | ||||||||||||||||||||||||||
| 55 | - | 60 | 416 | 515 | 7.9 | 58 | 117 | 220 | 5.8 | 57 | ||||||||||||||||||||||||||
| 60 | - | 65 | 258 | - | 5.6 | 62 | 258 | - | 5.6 | 62 | ||||||||||||||||||||||||||
| 65 | - | 70 | 142 | - | 7.1 | 66 | 95 | - | 7.1 | 66 | ||||||||||||||||||||||||||
| $ | 40 | - | 70 | 854 | $ | 1,075 | 6.8 | 60 | 508 | $ | 780 | 5.7 | 61 | |||||||||||||||||||||||
Options Outstanding | Options Exercisable | |||||||||||||||||||||||||||||||||||
At December 31, 2023 | For the Year Ended December 31, 2023 | At December 31, 2023 | For the Year Ended December 31, 2023 | |||||||||||||||||||||||||||||||||
Range of Exercise Price | Number Outstanding | Aggregate Intrinsic Value | Weighted Average Remaining Contractual Life | Weighted Average Exercise Price | Number Exercisable | Aggregate Intrinsic Value | Weighted Average Remaining Contractual Life | Weighted Average Exercise Price | ||||||||||||||||||||||||||||
(In thousands) | (Years) | (In thousands) | (Years) | |||||||||||||||||||||||||||||||||
| $ | 40 | - | 45 | 12 | $ | 149 | 1.9 | $ | 42 | 12 | $ | 149 | 1.9 | $ | 42 | |||||||||||||||||||||
| 45 | - | 50 | - | - | - | - | - | - | - | - | ||||||||||||||||||||||||||
| 50 | - | 55 | 4 | 8 | 0.1 | 53 | 4 | 8 | 0.1 | 53 | ||||||||||||||||||||||||||
| 55 | - | 60 | 572 | - | 7.6 | 57 | 213 | - | 6.1 | 58 | ||||||||||||||||||||||||||
| 60 | - | 65 | 247 | - | 4.6 | 62 | 247 | - | 4.6 | 62 | ||||||||||||||||||||||||||
| 65 | - | 70 | 138 | - | 6.1 | 66 | 138 | - | 6.1 | 66 | ||||||||||||||||||||||||||
| $ | 40 | - | 70 | 973 | $ | 157 | 6.5 | 60 | 614 | $ | 157 | 5.4 | 61 | |||||||||||||||||||||||
The Company applies the Roll-Geske option pricing model (Modified Roll) to determine grant date fair value of stock option grants. This model modifies the Black-Scholes Model to take into account dividends and American options. During the year ended December 31, 2022,2023, 20212022 and 2020,2021, the Company granted 225 thousand, 229 thousand, 193 thousand and 184193 thousand stock options, respectively. The following weighted average assumptions were used in the option pricing to value stock options granted in the periods indicated:
For the Years Ended December 31, | For the Years Ended December 31, | |||||||||||||||||||||||
2022 | 2021 | 2020 | 2023 | 2022 | 2021 | |||||||||||||||||||
Expected volatility (1) | 19 | % | 20 | % | 20 | % | 20 | % | 19 | % | 20 | % | ||||||||||||
Expected life in years (2) | 4.6 | 4.7 | 3.5 | 4.7 | 4.6 | 4.7 | ||||||||||||||||||
Risk-free interest rate (3) | 1.73 | % | 0.46 | % | 1.52 | % | 3.60 | % | 1.73 | % | 0.46 | % | ||||||||||||
Expected dividend yield | 3.02 | % | 2.79 | % | 2.59 | % | 3.66 | % | 3.02 | % | 2.79 | % | ||||||||||||
Fair value per award | $ | 7.90 | $ | 7.50 | $ | 8.64 | $ | 8.50 | $ | 7.90 | $ | 7.50 | ||||||||||||
(1) Measured using daily price changes of Company’s stock over respective expected term of the option and the implied volatility derived from the market prices of the Company’s stock and traded options.
(2) The number of years that the Company estimates that the options will be outstanding prior to exercise.
(3) The risk-free rate over the expected life based on the US Treasury yield curve in effect at the time of the grant.
Employee stock option grants are being expensed by the Company over the grants’ three year vesting period. The Company issues new shares upon the exercise of options. The number of shares authorized to be issued for options at December 31, 20222023 is 856705 thousand.
[The remainder of this page intentionally left blank]
A summary of option activity during the year ended December 31, 20222023 is presented below:
Shares | Weighted Average Exercise Price | Weighted Average Remaining Contractual Term | Shares | Weighted Average Exercise Price | Weighted Average Remaining Contractual Term | |||||||||||||||||||
(In thousands) | (Years) | (In thousands) | (Years) | |||||||||||||||||||||
Outstanding at January 1, 2022 | 793 | $ | 60.48 | |||||||||||||||||||||
Outstanding at January 1, 2023 | 854 | $ | 60.02 | |||||||||||||||||||||
Granted | 229 | 58.51 | 225 | 55.47 | ||||||||||||||||||||
Exercised | (40 | ) | 56.03 | (22 | ) | 43.30 | ||||||||||||||||||
Forfeited or expired | (128 | ) | 61.46 | (84 | ) | 55.26 | ||||||||||||||||||
Outstanding at December 31, 2022 | 854 | 60.02 | 6.8 | |||||||||||||||||||||
Exercisable at December 31, 2022 | 508 | 60.60 | 5.7 | |||||||||||||||||||||
Outstanding at December 31, 2023 | 973 | 59.50 | 6.5 | |||||||||||||||||||||
Exercisable at December 31, 2023 | 614 | 61.17 | 5.4 | |||||||||||||||||||||
A summary of the Company’s nonvested option activity during the year ended December 31, 20222023 is presented below:
Shares | Weighted Average Grant Date Fair Value | Shares | Weighted Average Grant Date Fair Value | |||||||||||||
(In thousands) | (In thousands) | |||||||||||||||
Nonvested at January 1, 2022 | 347 | $ | 8.31 | |||||||||||||
Nonvested at January 1, 2023 | 346 | $ | 7.88 | |||||||||||||
Granted | 229 | 7.90 | 225 | 8.50 | ||||||||||||
Vested | (168 | ) | 8.76 | (164 | ) | 7.99 | ||||||||||
Forfeited | (62 | ) | 7.98 | (48 | ) | 8.18 | ||||||||||
Nonvested at December 31, 2022 | 346 | $ | 7.88 | |||||||||||||
Nonvested at December 31, 2023 | 359 | $ | 8.18 | |||||||||||||
The estimated grant date fair value for options granted under the Company’s stock option plan during the twelve months ended December 31, 2022,2023, 20212022 and 20202021 was $8.50, $7.90 $7.50 and $8.64$7.50 per share, respectively. The total remaining unrecognized compensation cost related to nonvested awards as of December 31, 20222023 is $2,164$1,581 thousand and the weighted average period over which the cost is expected to be recognized is 1.7 years.
The total intrinsic value of options exercised during the year ended December 31, 2022,2023, 20212022 and 20202021 was $113 thousand, $165 thousand $454 thousand and $693$454 thousand, respectively. The total fair value of Restricted Performance Shares (“RPSs”) that vested during the year ended December 31, 2022,2023, 20212022 and 20202021 was $508 thousand, $492 thousand $527 thousand and $534$527 thousand, respectively. The total fair value of options vested during the year ended December 31, 2022,2023, 20212022 and 20202021 was $1,309 thousand, $1,464 thousand and $1,783 thousand, and $1,735respectively. During the year ended December 31, 2023, 22 thousand respectively.shares were issued due to the exercise of nonqualified stock options resulting in a tax deduction less than the related share based compensation expense by $16 thousand. During the year ended December 31, 2022, 40 thousand shares were issued due to the exercise of nonqualified stock options resulting in a tax deduction less than the related share based compensation expense by $143 thousand. The lesser deduction in 2022 resulted in a $30 thousand increase in tax provision. During the year ended December 31, 2021, 53 thousand shares were issued due to the exercise of nonqualified stock options resulting in a tax deduction equal to the related share based compensation expense. During the year ended December 31, 2020, 52 thousand shares were issued due to the exercise of nonqualified stock options resulting in a tax deduction exceeding related share based compensation by $295 thousand. The excesslessor deductions resulting from the exercise of nonqualified stock options reducedincreased the income tax provision by $-0-$5 thousand in 2021 and $87 thousand in 2020.2023.
A summary of the status of the Company’s restricted performance shares as of December 31, 20222023 and 20212022 and changes during the years ended on those dates, follows:
2022 | 2021 | 2023 | 2022 | |||||||||||||
(In thousands) | (In thousands) | |||||||||||||||
Outstanding at January 1, | 30 | 28 | 31 | 30 | ||||||||||||
Granted | 12 | 13 | 12 | 12 | ||||||||||||
Issued upon vesting | (8 | ) | (9 | ) | (9 | ) | (8 | ) | ||||||||
Forfeited | (3 | ) | (2 | ) | (2 | ) | (3 | ) | ||||||||
Outstanding at December 31, | 31 | 30 | 32 | 31 | ||||||||||||
As of December 31, 20222023 and 2021,2022, the restricted performance shares had a weighted-average contractual life of 1.2 years and 1.4 years, respectively. The compensation cost that was charged against income for the Company’s restricted performance shares granted was $250 thousand, $525 thousand $610 thousand and $533$610 thousand for the year ended December 31, 2022,2023, 20212022 and 2020,2021, respectively. There were no stock appreciation rights or incentive stock options granted in the year ended December 31, 2022,2023, 20212022 and 2020.2021.
The Company repurchases shares of its common stock in the open market to optimize the Company’s use of equity capital and enhance shareholder value and with the intention of lessening the dilutive impact of issuing new shares under stock option plans, and other ongoing requirements. The Company repurchases and retires its common stock in accordance with Board of Directors approved share repurchase programs. AtThe repurchase plan approved December 31,July 28, 2022 1,750 thousand shares remained available to repurchase under such plans.expired September 1, 2023. There is no replacement plan in place currently.
The Company’s articles of incorporation authorized two additional classes of stock of one million shares each, to be denominated “Class B Common Stock” and “Preferred Stock,” respectively, in addition to the 150 million shares of common stock presently authorized. At December 31, 2022,2023, no shares of Class B Common Stock or Preferred Stock were outstanding.
Note 9: Regulatory Capital
Banks and bank holding companies are subject to regulatory capital requirements administered by federal banking agencies. Capital adequacy guidelines and, additionally for banks, prompt corrective action regulations, involve quantitative measures of assets, liabilities, and certain off-balance-sheet items calculated under regulatory accounting practices. Capital amounts and classifications are also subject to qualitative judgments by regulators. Failure to meet capital requirements can result in regulatory action. The Basel Committee on Banking Supervision’s capital guidelines for U.S. banks (Basel III rules) require the Company to maintain a capital conservation buffer of 2.5% above the adequately capitalized risk-based capital ratios to avoid restrictions on dividends and equity repurchases and other payments such as discretionary bonuses to executive officers. The net unrealized gain or loss on available for sale securities is not included in computing regulatory capital. Management believes as of December 31, 20222023 and December 31, 2021,2022, the Company and Bank met all capital adequacy requirements to which they are subject.
Prompt corrective action regulations provide five classifications: well capitalized, adequately capitalized, undercapitalized, significantly undercapitalized, and critically undercapitalized, although these terms are not used to represent overall financial condition. If adequately capitalized, regulatory approval is required to accept brokered deposits. If undercapitalized, capital distributions are limited, as is asset growth and expansion, and capital restoration plans are required. At year-end 20222023 and 2021,2022, the Bank met the capital requirements to be well capitalized under the regulatory framework for prompt corrective action. Management believes that there are no conditions or events that would change the institution’s category since December 31, 2022.2023.
The capital ratios for the Company and the Bank as of the dates indicated are presented in the table below. For Common Equity Tier 1 Capital, Tier 1 Capital and Total Capital, the required percentages for capital adequacy purposes include the 2.5% capital conservation buffer.
At December 31, 2022 | Required | To Be Well-capitalized | ||||||||||||||||||||||
Amount | Ratio | Amount | Ratio | Amount | Ratio | |||||||||||||||||||
($ in thousands) | ||||||||||||||||||||||||
Common Equity Tier 1 Capital | ||||||||||||||||||||||||
Company | $ | 736,414 | 15.22 | % | $ | 338,748 | 7.00 | % | N/A | N/A | ||||||||||||||
Bank | 592,804 | 12.37 | % | 335,351 | 7.00 | % | $ | 311,397 | 6.50 | % | ||||||||||||||
Tier 1 Capital | ||||||||||||||||||||||||
Company | 736,414 | 15.22 | % | 411,337 | 8.50 | % | N/A | N/A | ||||||||||||||||
Bank | 592,804 | 12.37 | % | 407,212 | 8.50 | % | 383,258 | 8.00 | % | |||||||||||||||
Total Capital | ||||||||||||||||||||||||
Company | 756,900 | 15.64 | % | 508,123 | 10.50 | % | N/A | N/A | ||||||||||||||||
Bank | 619,290 | 12.93 | % | 503,026 | 10.50 | % | 479,073 | 10.00 | % | |||||||||||||||
Leverage Ratio (1) | ||||||||||||||||||||||||
Company | 736,414 | 10.18 | % | 289,259 | 4.00 | % | N/A | N/A | ||||||||||||||||
Bank | 592,804 | 8.26 | % | 287,229 | 4.00 | % | 359,036 | 5.00 | % | |||||||||||||||
At December 31, 2023 | Required | To Be Well-capitalized | ||||||||||||||||||||||
Amount | Ratio | Amount | Ratio | Amount | Ratio | |||||||||||||||||||
($ in thousands) | ||||||||||||||||||||||||
Common Equity Tier 1 Capital | ||||||||||||||||||||||||
Company | $ | 841,611 | 18.76 | % | $ | 313,959 | 7.00 | % | N/A | N/A | ||||||||||||||
Bank | 641,252 | 14.46 | % | 310,362 | 7.00 | % | $ | 288,193 | 6.50 | % | ||||||||||||||
Tier 1 Capital | ||||||||||||||||||||||||
Company | 841,611 | 18.76 | % | 381,236 | 8.50 | % | N/A | N/A | ||||||||||||||||
Bank | 641,252 | 14.46 | % | 376,868 | 8.50 | % | 354,700 | 8.00 | % | |||||||||||||||
Total Capital | ||||||||||||||||||||||||
Company | 858,680 | 19.15 | % | 470,939 | 10.50 | % | N/A | N/A | ||||||||||||||||
Bank | 664,321 | 14.98 | % | 465,543 | 10.50 | % | 443,375 | 10.00 | % | |||||||||||||||
Leverage Ratio (1) | ||||||||||||||||||||||||
Company | 841,611 | 12.86 | % | 261,739 | 4.00 | % | N/A | N/A | ||||||||||||||||
Bank | 641,252 | 9.88 | % | 259,617 | 4.00 | % | 324,521 | 5.00 | % | |||||||||||||||
(1) The leverage ratio consists of Tier 1capital divided by the most recent quarterly average total assets, excluding certain intangible assets.
[The remainder of this page intentionally left blank]
At December 31, 2021 | Required | To Be Well-capitalized | At December 31, 2022 | Required | To Be Well-capitalized | |||||||||||||||||||||||||||||||||||||||||||
Amount | Ratio | Amount | Ratio | Amount | Ratio | Amount | Ratio | Amount | Ratio | Amount | Ratio | |||||||||||||||||||||||||||||||||||||
($ in thousands) | ($ in thousands) | |||||||||||||||||||||||||||||||||||||||||||||||
Common Equity Tier 1 Capital | ||||||||||||||||||||||||||||||||||||||||||||||||
Company | $ | 653,026 | 14.93 | % | $ | 306,277 | 7.00 | % | N/A | N/A | $ | 736,414 | 15.22 | % | $ | 338,748 | 7.00 | % | N/A | N/A | ||||||||||||||||||||||||||||
Bank | 540,538 | 12.48 | % | 303,111 | 7.00 | % | $ | 281,460 | 6.50 | % | 592,804 | 12.37 | % | 335,351 | 7.00 | % | $ | 311,397 | 6.50 | % | ||||||||||||||||||||||||||||
Tier 1 Capital | ||||||||||||||||||||||||||||||||||||||||||||||||
Company | 653,026 | 14.93 | % | 371,908 | 8.50 | % | N/A | N/A | 736,414 | 15.22 | % | 411,337 | 8.50 | % | N/A | N/A | ||||||||||||||||||||||||||||||||
Bank | 540,538 | 12.48 | % | 368,063 | 8.50 | % | 346,412 | 8.00 | % | 592,804 | 12.37 | % | 407,212 | 8.50 | % | 383,258 | 8.00 | % | ||||||||||||||||||||||||||||||
Total Capital | ||||||||||||||||||||||||||||||||||||||||||||||||
Company | 676,749 | 15.47 | % | 459,416 | 10.50 | % | N/A | N/A | 756,900 | 15.64 | % | 508,123 | 10.50 | % | N/A | N/A | ||||||||||||||||||||||||||||||||
Bank | 570,260 | 13.17 | % | 454,666 | 10.50 | % | 433,016 | 10.00 | % | 619,290 | 12.93 | % | 503,026 | 10.50 | % | 479,073 | 10.00 | % | ||||||||||||||||||||||||||||||
Leverage Ratio (1) | ||||||||||||||||||||||||||||||||||||||||||||||||
Company | 653,026 | 9.06 | % | 288,423 | 4.00 | % | N/A | N/A | 736,414 | 10.18 | % | 289,259 | 4.00 | % | N/A | N/A | ||||||||||||||||||||||||||||||||
Bank | 540,538 | 7.55 | % | 286,432 | 4.00 | % | 358,040 | 5.00 | % | 592,804 | 8.26 | % | 287,229 | 4.00 | % | 359,036 | 5.00 | % | ||||||||||||||||||||||||||||||
(1) The leverage ratio consists of Tier 1capital divided by the most recent quarterly average total assets, excluding certain intangible assets.
Note 10: Income Taxes
Deferred tax assets and liabilities are recognized for future tax consequences attributable to differences between the amounts reported in the financial statements of existing assets and liabilities and their respective tax basis and operating loss and tax credit carryforwards. Deferred tax assets and liabilities are measured using enacted tax rates expected to apply to taxable income in the years in which those temporary differences are expected to be recovered or settled. Amounts for the current year are based upon estimates and assumptions as of the date of these financial statements and could vary significantly from amounts shown on the tax returns as filed. Net deferred tax assets are included with other assets in the consolidated balance sheets.
The components of the net deferred tax liabilityasset is as follows:
At December 31, | At December 31, | |||||||||||||||
2022 | 2021 | 2023 | 2022 | |||||||||||||
(In thousands) | (In thousands) | |||||||||||||||
Deferred tax asset | ||||||||||||||||
Allowance for credit losses | $ | 5,858 | $ | 6,852 | $ | 4,853 | $ | 5,858 | ||||||||
Unrealized losses on securities available for sale | 107,493 | - | ||||||||||||||
Securities available for sale | 79,865 | 107,493 | ||||||||||||||
State franchise taxes | 3,805 | 2,518 | 4,816 | 3,805 | ||||||||||||
Deferred compensation | 4,091 | 4,524 | 3,828 | 4,091 | ||||||||||||
Purchased assets and assumed liabilities | 229 | 475 | 321 | 229 | ||||||||||||
Post-retirement benefits | 405 | 445 | 367 | 405 | ||||||||||||
Employee benefit accruals | 3,096 | 2,792 | 3,454 | 3,096 | ||||||||||||
VISA Class B shares | 507 | 348 | 343 | 507 | ||||||||||||
Impaired capital assets | - | 2,673 | ||||||||||||||
Accrued liabilities | 840 | 748 | 1,172 | 840 | ||||||||||||
Premises and equipment | 1,193 | 1,001 | 1,175 | 1,193 | ||||||||||||
Lease liability | 4,548 | 5,263 | 5,413 | 4,548 | ||||||||||||
Other | 99 | 103 | 69 | 99 | ||||||||||||
Sub total deferred tax asset | 132,164 | 27,742 | ||||||||||||||
Tax valuation | - | (1,776 | ) | |||||||||||||
Total deferred tax asset | 132,164 | 25,966 | 105,676 | 132,164 | ||||||||||||
Deferred tax liability | ||||||||||||||||
Net deferred loan fees | 193 | 196 | ||||||||||||||
Unrealized gains on securities available for sale | - | 20,845 | ||||||||||||||
Net deferred loan costs | - | 193 | ||||||||||||||
Right-of-use asset | 4,548 | 5,263 | 5,413 | 4,548 | ||||||||||||
Intangible assets | 453 | 459 | 451 | 453 | ||||||||||||
Limited partnership investments | 1,830 | 1,704 | 305 | 1,830 | ||||||||||||
Total deferred tax liability | 7,024 | 28,467 | 6,169 | 7,024 | ||||||||||||
Net deferred tax asset (liability) | $ | 125,140 | $ | (2,501 | ) | |||||||||||
Net deferred tax asset | $ | 99,507 | $ | 125,140 | ||||||||||||
Based on Management’s judgment, a valuation allowance is not needed to reduce the gross deferred tax asset because it is more likely than not that the gross deferred tax asset will be realized through recoverable taxes or future taxable income. Net deferred tax assets are included with other assets in the consolidated balance sheets.
At December 31, 2021, the Company had $2,673 thousand deferred tax asset related to California capital loss carryforwards, which will expire if unutilized within five years of the year incurred. At December 31, 2021, a valuation allowance recorded for the portion of the tax benefit that was expected to expire was $1,776 thousand. At December 31, 2022, the California capital loss carryforwards and related valuation allowance were zero due to expiration in 2022.
The provision for federal and state income taxes consists of amounts currently payable and amounts deferred as follows:
For the Years Ended December 31, | For the Years Ended December 31, | |||||||||||||||||||||||
2022 | 2021 | 2020 | 2023 | 2022 | 2021 | |||||||||||||||||||
(In thousands) | (In thousands) | |||||||||||||||||||||||
Current income tax expense: | ||||||||||||||||||||||||
Federal | $ | 26,785 | $ | 15,299 | $ | 15,982 | $ | 38,075 | $ | 26,785 | $ | 15,299 | ||||||||||||
State | 16,075 | 11,320 | 10,654 | 23,731 | 16,075 | 11,320 | ||||||||||||||||||
Total current | 42,860 | 26,619 | 26,636 | 61,806 | 42,860 | 26,619 | ||||||||||||||||||
Deferred income tax (benefit) expense: | ||||||||||||||||||||||||
Federal | (1,349 | ) | 1,281 | (538 | ) | (1,197 | ) | (1,349 | ) | 1,281 | ||||||||||||||
State | 2,046 | 842 | 292 | (798 | ) | 2,046 | 842 | |||||||||||||||||
Total deferred | 697 | 2,123 | (246 | ) | (1,995 | ) | 697 | 2,123 | ||||||||||||||||
Provision for income taxes | ||||||||||||||||||||||||
Federal | - | (472 | ) | - | - | - | (472 | ) | ||||||||||||||||
State | - | 2,248 | - | - | - | 2,248 | ||||||||||||||||||
Total change in valuation reserve | - | 1,776 | - | - | - | 1,776 | ||||||||||||||||||
Provision for income taxes | $ | 43,557 | $ | 30,518 | $ | 26,390 | $ | 59,811 | $ | 43,557 | $ | 30,518 | ||||||||||||
The provision for income taxes differs from the provision computed by applying the statutory federal income tax rate to income before taxes, as follows:
For the Years Ended December 31, | For the Years Ended December 31, | |||||||||||||||||||||||
2022 | 2021 | 2020 | 2023 | 2022 | 2021 | |||||||||||||||||||
(In thousands) | (In thousands) | |||||||||||||||||||||||
Federal income taxes due at statutory rate | $ | 34,774 | $ | 24,576 | $ | 22,429 | $ | 46,532 | $ | 34,774 | $ | 24,576 | ||||||||||||
Additions (reductions) in income taxes resulting from: | ||||||||||||||||||||||||
(Reductions) additions in income taxes resulting from: | ||||||||||||||||||||||||
Interest on state and municipal securities and loans not taxable for federal income tax purposes | (1,484 | ) | (2,070 | ) | (2,808 | ) | (1,188 | ) | (1,484 | ) | (2,070 | ) | ||||||||||||
State franchise taxes, net of federal income tax benefit | 14,315 | 9,757 | 8,647 | 18,117 | 14,315 | 9,757 | ||||||||||||||||||
Change in valuation reserve | - | 1,776 | - | - | - | 1,776 | ||||||||||||||||||
Stock compensation deduction less than (in excess of) book expense | 30 | - | (62 | ) | 3 | 30 | - | |||||||||||||||||
Tax credits | (3,439 | ) | (2,621 | ) | (1,061 | ) | (2,943 | ) | (3,439 | ) | (2,621 | ) | ||||||||||||
Dividend received deduction | (56 | ) | (48 | ) | (44 | ) | (66 | ) | (56 | ) | (48 | ) | ||||||||||||
Cash value life insurance | (421 | ) | (389 | ) | (383 | ) | (597 | ) | (421 | ) | (389 | ) | ||||||||||||
Other | (162 | ) | (463 | ) | (328 | ) | (47 | ) | (162 | ) | (463 | ) | ||||||||||||
Provision for income taxes | $ | 43,557 | $ | 30,518 | $ | 26,390 | $ | 59,811 | $ | 43,557 | $ | 30,518 | ||||||||||||
At December 31, 20222023 and December 31, 2021,2022, the Company had no uncertain tax positions related to previous years’ tax returns which were under examination.
The Company classifies interest and penalties as a component of the provision for income taxes. For tax years 2022,20212023 and 2020,2022, no interest or penalties were recognized as a component of the provision for income taxes. At December 31, 2022,2023, the tax years ended December 31, 2021,2022, 20202021 and 20192020 remain subject to examination by the Internal Revenue Service and the tax years ended December 31, 2021,2022, 2020,2021, 20192020 and 20182019 remain subject to examination by the California Franchise Tax Board.
Note 11: Fair Value Measurements
The Company uses fair value measurements to record fair value adjustments to certain assets and liabilities and to determine fair value disclosures. Debt securities available for sale are recorded at fair value on a recurring basis. Additionally, from time to time, the Company may be required to record at fair value other assets on a nonrecurring basis, such as other real estate owned, loans individually evaluated for credit loss, certain loans held for investment, debt securities held to maturity, and other assets. These nonrecurring fair value adjustments typically involve the lower-of-cost or fair-value accounting of individual assets.
In accordance with the Fair Value Measurement and Disclosure topic of the FASB Accounting Standards Codification, the Company bases its fair values on the price that would be received to sell an asset or paid to transfer a liability in the principal market or most advantageous market for an asset or liability in an orderly transaction between market participants on the measurement date under current market conditions. A fair value measurement reflects all of the assumptions that market participants would use in pricing the asset or liability, including assumptions about the risk inherent in a particular valuation technique, the effect of a restriction on the sale or use of an asset, and the risk of nonperformance.
The Company groups its assets and liabilities measured at fair value into a three-level hierarchy, based on the markets in which the assets and liabilities are traded and the reliability of the assumptions used to determine fair value. When the valuation assumptions used to measure the fair value of the asset or liability are categorized within different levels of the fair value hierarchy, the asset or liability is categorized in its entirety within the lowest level of the hierarchy. These levels are:
Level 1 – Valuation is based upon quoted prices for identical instruments traded in active exchange markets, such as the New York Stock Exchange. Level 1 includes U.S. Treasury and equity securities, which are traded by dealers or brokers in active markets. Valuations are obtained from readily available pricing sources for market transactions involving identical assets or liabilities.
Level 2 – Valuation is based upon quoted prices for similar instruments in active markets, quoted prices for identical or similar instruments in markets that are not active, and model-based valuation techniques for which all significant assumptions are observable in the market. Level 2 includes mutual funds, federal agency securities, mortgage-backed securities, corporate securities, commercial paper, collateralized loan obligations, municipal bonds and securities of U.S government entities and U.S. government sponsored entities.
Level 3 – Valuation is generated from model-based techniques that use significant assumptions not observable in the market. These unobservable assumptions reflect the Company’s estimates of assumptions that market participants would use in pricing the asset or liability. Valuation techniques include use of option pricing models, discounted cash flow models and similar techniques.
The Company relies on independent vendor pricing services to measure fair value for equity securities, debt securities available for sale and debt securities held to maturity. The Company employs three pricing services. To validate the pricing of these vendors, the Company compares vendors’ pricing for each of the securities for consistency; significant pricing differences, if any, are evaluated using all available independent quotes with the quote most closely reflecting the market generally used as the fair value estimate. In addition, the Company evaluates debt securities for credit losses on a quarterly basis. As with any valuation technique used to estimate fair value, changes in underlying assumptions used could significantly affect the results of current and future values. Accordingly, these fair value estimates may not be realized in an actual sale of the securities.
The Company regularly reviews the valuation techniques and assumptions used by its vendors and determines which valuation techniques are utilized based on observable market inputs for the type of securities being measured. The Company uses the information to determine the placement in the fair value hierarchy as level 1, 2 or 3.
[The remainder of this page intentionally left blank]
Assets Recorded at Fair Value on a Recurring Basis
The tables below present assets measured at fair value on a recurring basis on the dates indicated.
At December 31, 2023 | ||||||||||||||||
Fair Value | Quoted Prices in Active Markets for Identical Assets | Significant Other Observable Inputs | Significant Unobservable Inputs | |||||||||||||
(In thousands) | ||||||||||||||||
Debt securities available for sale: | ||||||||||||||||
Agency residential MBS | $ | 239,454 | $ | - | $ | 239,454 | $ | - | ||||||||
Securities of U.S. Government sponsored entities | 294,919 | - | 294,919 | - | ||||||||||||
Obligations of states and political subdivisions | 71,283 | - | 71,283 | - | ||||||||||||
Corporate securities | 1,909,548 | - | 1,909,548 | - | ||||||||||||
Collateralized loan obligations | 1,484,597 | - | 1,484,597 | - | ||||||||||||
Total debt securities available for sale | $ | 3,999,801 | $ | - | $ | 3,999,801 | $ | - | ||||||||
(1)There were no transfers in to or out of level 3 during the year ended December 31, 2023.
At December 31, 2022 | ||||||||||||||||
Fair Value | Quoted Prices in Active Markets for Identical Assets | Significant Other Observable Inputs | Significant Unobservable Inputs | |||||||||||||
(In thousands) | ||||||||||||||||
Debt securities available for sale: | ||||||||||||||||
Agency residential MBS | $ | 286,048 | $ | - | $ | 286,048 | $ | - | ||||||||
Securities of U.S. Government sponsored entities | 290,853 | - | 290,853 | - | ||||||||||||
Obligations of states and political subdivisions | 82,004 | - | 82,004 | - | ||||||||||||
Corporate securities | 2,099,955 | - | 2,099,955 | - | ||||||||||||
Collateralized loan obligations | 1,572,883 | - | 1,572,883 | - | ||||||||||||
Total debt securities available for sale | $ | 4,331,743 | $ | - | $ | 4,331,743 | $ | - | ||||||||
(1) There were no transfers in to or out of level 3 during the year ended December 31, 2022.
At December 31, 2021 | ||||||||||||||||
Fair Value | Quoted Prices in Active Markets for Identical Assets | Significant Other Observable Inputs | Significant Unobservable Inputs | |||||||||||||
(In thousands) | ||||||||||||||||
Debt securities available for sale: | ||||||||||||||||
Agency residential MBS | $ | 411,726 | $ | - | $ | 411,726 | $ | - | ||||||||
Securities of U.S. Government entities | 119 | - | 119 | - | ||||||||||||
Obligations of states and political subdivisions | 93,920 | - | 93,920 | - | ||||||||||||
Corporate securities | 2,746,735 | - | 2,746,735 | - | ||||||||||||
Collateralized loan obligations | 1,386,355 | - | 1,386,355 | - | ||||||||||||
Total debt securities available for sale | $ | 4,638,855 | $ | - | $ | 4,638,855 | $ | - | ||||||||
(1)There were no transfers in to or out of level 3 during the year ended December 31, 2021.
Assets Recorded at Fair Value on a Nonrecurring Basis
The Company may be required, from time to time, to measure certain assets at fair value on a nonrecurring basis in accordance with GAAP. These adjustments to fair value usually result from the application of lower-of-cost or fair-value accounting of individual assets. For assets measured at fair value on a nonrecurring basis that were recorded in the balance sheet at December 31, 20222023 and December 31, 2021,2022, the following tables provide the level of valuation assumptions used to determine each adjustment and the carrying value of the related assets at period end.
For the | For the | |||||||||||||||||||||||||||||||||||||||
Year Ended | Year Ended | |||||||||||||||||||||||||||||||||||||||
At December 31, 2022 | December 31, 2022 | At December 31, 2023 | December 31, 2023 | |||||||||||||||||||||||||||||||||||||
Carrying Value | Level 1 | Level 2 | Level 3 | Total Losses | Carrying Value | Level 1 | Level 2 | Level 3 | Total Losses | |||||||||||||||||||||||||||||||
(In thousands) | (In thousands) | |||||||||||||||||||||||||||||||||||||||
Loans: | ||||||||||||||||||||||||||||||||||||||||
Commercial real estate | $ | 225 | $ | - | $ | - | $ | 225 | $ | - | $ | 110 | $ | - | $ | - | $ | 110 | $ | - | ||||||||||||||||||||
Total assets measured at fair value on a nonrecurring basis | $ | 225 | $ | - | $ | - | $ | 225 | $ | - | $ | 110 | $ | - | $ | - | $ | 110 | $ | - | ||||||||||||||||||||
For the | For the | |||||||||||||||||||||||||||||||||||||||
Year Ended | Year Ended | |||||||||||||||||||||||||||||||||||||||
At December 31, 2021 | December 31, 2021 | At December 31, 2022 | December 31, 2022 | |||||||||||||||||||||||||||||||||||||
Carrying Value | Level 1 | Level 2 | Level 3 | Total Losses | Carrying Value | Level 1 | Level 2 | Level 3 | Total Losses | |||||||||||||||||||||||||||||||
(In thousands) | (In thousands) | |||||||||||||||||||||||||||||||||||||||
Loans: | ||||||||||||||||||||||||||||||||||||||||
Commercial real estate | $ | 225 | $ | - | $ | - | $ | 225 | $ | - | $ | 225 | $ | - | $ | - | $ | 225 | $ | - | ||||||||||||||||||||
Residential real estate | 172 | - | - | 172 | - | |||||||||||||||||||||||||||||||||||
Total assets measured at fair value on a nonrecurring basis | $ | 397 | $ | - | $ | - | $ | 397 | $ | - | $ | 225 | $ | - | $ | - | $ | 225 | $ | - | ||||||||||||||||||||
Level 3 – Valuation is based upon present value of expected future cash flows, independent market prices, estimated liquidation values of loan collateral or appraised value of the collateral as determined by third-party independent appraisers, less 10% for selling costs, generally. The unobservable inputs and qualitative information about the unobservable inputs are not presented as the inputs were not developed by the Company.
Disclosures about Fair Value of Financial Instruments
The tables below are a summary of fair value estimates for financial instruments and the level of the fair value hierarchy within which the fair value measurements are categorized, excluding financial instruments recorded at fair value on a recurring basis. The values assigned do not necessarily represent amounts which ultimately may be realized for assets or paid to settle liabilities. In addition, these values do not give effect to adjustments to fair value which may occur when financial instruments are sold or settled in larger quantities. The carrying amounts in the following tables are recorded in the balance sheet under the indicated captions.
The Company has not included assets and liabilities that are not financial instruments such as goodwill, long-term relationships with deposit, merchant processing and trust customers, other purchased intangibles, premises and equipment, deferred taxes, and other assets and liabilities. The total estimated fair values do not represent, and should not be construed to represent, the underlying value of the Company.
At December 31, 2022 | ||||||||||||||||||||
Carrying Amount | Estimated Fair Value | Quoted Prices in Active Markets for Identical Assets | Significant Other Observable Inputs | Significant Unobservable Inputs | ||||||||||||||||
Financial Assets: | (In thousands) | |||||||||||||||||||
Cash and due from banks | $ | 294,236 | $ | 294,236 | $ | 294,236 | $ | - | $ | - | ||||||||||
Debt securities held to maturity | 915,913 | 873,511 | - | 873,511 | - | |||||||||||||||
Loans | 938,204 | 905,720 | - | - | 905,720 | |||||||||||||||
Financial Liabilities: | ||||||||||||||||||||
Deposits | $ | 6,225,290 | $ | 6,224,791 | $ | - | $ | 6,094,535 | $ | 130,256 | ||||||||||
Short-term borrowed funds | 57,792 | 57,792 | - | 57,792 | - | |||||||||||||||
At December 31, 2021 | ||||||||||||||||||||
Carrying Amount | Estimated Fair Value | Quoted Prices in Active Markets for Identical Assets | Significant Other Observable Inputs | Significant Unobservable Inputs | ||||||||||||||||
Financial Assets: | (In thousands) | |||||||||||||||||||
Cash and due from banks | $ | 1,132,085 | $ | 1,132,085 | $ | 1,132,085 | $ | - | $ | - | ||||||||||
Debt securities held to maturity | 306,396 | 312,562 | - | 312,562 | - | |||||||||||||||
Loans | 1,044,612 | 1,059,072 | - | - | 1,059,072 | |||||||||||||||
Financial Liabilities: | ||||||||||||||||||||
Deposits | $ | 6,413,956 | $ | 6,413,244 | $ | - | $ | 6,270,344 | $ | 142,900 | ||||||||||
Short-term borrowed funds | 146,246 | 146,246 | - | 146,246 | - | |||||||||||||||
At December 31, 2023 | ||||||||||||||||||||
Carrying Amount | Estimated Fair Value | Quoted Prices in Active Markets for Identical Assets | Significant Other Observable Inputs | Significant Unobservable Inputs | ||||||||||||||||
Financial Assets: | (In thousands) | |||||||||||||||||||
Cash and due from banks | $ | 190,314 | $ | 190,314 | $ | 190,314 | $ | - | $ | - | ||||||||||
Debt securities held to maturity | 878,396 | 849,562 | - | 849,562 | - | |||||||||||||||
Loans | 849,735 | 847,031 | - | - | 847,031 | |||||||||||||||
Financial Liabilities: | ||||||||||||||||||||
Deposits | $ | 5,474,267 | $ | 5,474,012 | $ | - | $ | 5,377,465 | $ | 96,547 | ||||||||||
Short-term borrowed funds | 58,162 | 58,162 | - | 58,162 | - | |||||||||||||||
At December 31, 2022 | ||||||||||||||||||||
Carrying Amount | Estimated Fair Value | Quoted Prices in Active Markets for Identical Assets | Significant Other Observable Inputs | Significant Unobservable Inputs | ||||||||||||||||
Financial Assets: | (In thousands) | |||||||||||||||||||
Cash and due from banks | $ | 294,236 | $ | 294,236 | $ | 294,236 | $ | - | $ | - | ||||||||||
Debt securities held to maturity | 915,913 | 873,511 | - | 873,511 | - | |||||||||||||||
Loans | 938,204 | 905,720 | - | - | 905,720 | |||||||||||||||
Financial Liabilities: | ||||||||||||||||||||
Deposits | $ | 6,225,290 | $ | 6,224,791 | $ | - | $ | 6,094,535 | $ | 130,256 | ||||||||||
Short-term borrowed funds | 57,792 | 57,792 | - | 57,792 | - | |||||||||||||||
The majority of the Company’s standby letters of credit and other commitments to extend credit carry current market interest rates if converted to loans. No premium or discount was ascribed to these commitments because virtually all funding would be at current market rates.
Note 12: Commitments and Contingent Liabilities
Loan commitments are agreements to lend to a customer provided there is no violation of any condition established in the agreement. Certain agreements provide the Company the right to cancel or reduce its obligations to lend to customers. The portions that are not unconditionally cancellable by the Company aggregated $29,958 thousand at December 31, 2023 and $31,889 thousand at December 31, 2022. Commitments generally have fixed expiration dates or other termination clauses. Since many of the commitments are expected to expire without being drawn upon, the total commitment amounts do not necessarily represent future funding requirements. Loan commitments are subject to the Company’s normal credit policies and collateral requirements. Unfunded loan commitments were $206,028 thousand at December 31, 2023 and $202,696 thousand at December 31, 2022 and $233,850 thousand at December 31, 2021.2022. Standby letters of credit commit the Company to make payments on behalf of customers when certain specified future events occur. Standby letters of credit are primarily issued to support customers’ short-term financing requirements and must meet the Company’s normal credit policies and collateral requirements. Financial and performance standby letters of credit outstanding totaled $2,044 thousand at December 31, 2023 and $1,948 thousand at December 31, 2022 and $3,693 thousand at December 31, 2021.2022. Commitments for commercial and similar letters of credit totaled $95 thousand at December 31, 20222023 and$95 thousand at December 31, 2021.2022. The Company had $950$1,000 thousand in outstanding full recourse guarantees to a third party credit card company at December 31, 20222023 and $580$950 thousand at December 31, 2021.2022. At December 31, 2022,2023, the Company had a reserve for unfunded commitments of $201 thousand for the above-mentioned loan commitments of $31,889$29,958 thousand that are not unconditionally cancellable by the Company. The Company’s reserve for unfunded commitments was $201 thousand at December 31, 2021.2022. The reserve for unfunded commitments is included in other liabilities.
Due to the nature of its business, the Company is subject to various threatened or filed legal cases. Based on the advice of legal counsel, the Company does not expect such cases will have a material, adverse effect on its financial position or results of operations. Legal liabilities are accrued when obligations become probable and the amount can be reasonably estimated.
Note 13: Retirement Benefit Plans
The Company sponsors a qualified defined contribution Deferred Profit-Sharing Plan covering substantially all of its salaried employees with one or more years of service. The costs charged to noninterest expense related to discretionary Company contributions to the Deferred Profit-Sharing Plan were $1,090 thousand in 2023,$1,030 thousand in 2022, and $1,028 thousand in 2021 and $917 thousand in 2020.2021.
The Company also sponsors a qualified defined contribution Tax Deferred Savings/Retirement Plan (ESOP) covering salaried employees who become eligible to participate upon completion of a 90-day introductory period. The Tax Deferred Savings/ Retirement Plan (ESOP) allows employees to defer, on a pretax or after-tax basis, a portion of their salaries as contributions to this Plan. Participants may invest in several funds, including one fund that invests primarily in Westamerica Bancorporation common stock. The Company funds contributions to match participating employees’ contributions, subject to certain limits. The matching contributions charged to compensation expense were $873 thousand in 2023,$921 thousand in 2022, and $972 thousand in 2021 and $995 thousand in 2020.2021.
The Company offers a continuation of group insurance coverage to eligible employees electing early retirement, for the period from the date of retirement until age 65. For eligible employees the Company pays a portion of these early retirees’ group insurance premiums. The Company also reimburses a portion of Medicare Part B premiums for all qualifying retirees over age 65 and, if eligible, their spouses. Eligibility for post-retirement medical benefits is based on age and years of service, and restricted to employees hired prior to February 1, 2006 who elect early retirement prior to January 1, 2023.2024. The Company uses an actuarial-based accrual method of accounting for post-retirement benefits. The Company used a December 31 measurement date for determining post-retirement medical benefit calculations.
[The remainder of this page intentionally left blank]
The following tables set forth the net periodic post-retirement benefit cost and the change in the benefit obligation for the year ended December 31 and the funded status of the post-retirement benefit plan as of December 31:
Net Periodic Benefit Cost
At December 31, | At December 31, | |||||||||||||||||||||||
2022 | 2021 | 2020 | 2023 | 2022 | 2021 | |||||||||||||||||||
(In thousands) | (In thousands) | |||||||||||||||||||||||
Service benefit | $ | (19 | ) | $ | (15 | ) | $ | (35 | ) | $ | (56 | ) | $ | (19 | ) | $ | (15 | ) | ||||||
Interest cost | 38 | 30 | 52 | 70 | 38 | 30 | ||||||||||||||||||
Net periodic cost | $ | 19 | $ | 15 | $ | 17 | $ | 14 | $ | 19 | $ | 15 | ||||||||||||
Obligation and Funded Status
At December 31, | At December 31, | |||||||||||||||||||||||
2022 | 2021 | 2020 | 2023 | 2022 | 2021 | |||||||||||||||||||
Change in benefit obligation | (In thousands) | (In thousands) | ||||||||||||||||||||||
Benefit obligation at beginning of year | $ | 1,527 | $ | 1,654 | $ | 1,782 | $ | 1,401 | $ | 1,527 | $ | 1,654 | ||||||||||||
Service benefit | $ | (19 | ) | (15 | ) | (35 | ) | (56 | ) | (19 | ) | (15 | ) | |||||||||||
Interest cost | 38 | 30 | 52 | 70 | 38 | 30 | ||||||||||||||||||
Benefits paid | (145 | ) | (142 | ) | (145 | ) | (139 | ) | (145 | ) | (142 | ) | ||||||||||||
Benefit obligation at end of year | $ | 1,401 | $ | 1,527 | $ | 1,654 | $ | 1,276 | $ | 1,401 | $ | 1,527 | ||||||||||||
Accumulated post-retirement benefit obligation attributable to: | ||||||||||||||||||||||||
Retirees | $ | 1,401 | $ | 1,527 | $ | 1,654 | $ | 1,276 | $ | 1,401 | $ | 1,527 | ||||||||||||
Other | - | - | - | - | - | - | ||||||||||||||||||
Total | $ | 1,401 | $ | 1,527 | $ | 1,654 | $ | 1,276 | $ | 1,401 | $ | 1,527 | ||||||||||||
Fair value of plan assets | - | - | - | - | - | - | ||||||||||||||||||
Accumulated post-retirement benefit obligation in excess of plan assets | $ | 1,401 | $ | 1,527 | $ | 1,654 | $ | 1,276 | $ | 1,401 | $ | 1,527 | ||||||||||||
[The remainder of this page intentionally left blank]
Additional Information
Assumptions
At December 31, | At December 31, | |||||||||||||||||||||||
2022 | 2021 | 2020 | 2023 | 2022 | 2021 | |||||||||||||||||||
Weighted-average assumptions used to determine benefit obligations | ||||||||||||||||||||||||
Discount rate | 5.01 | % | 2.46 | % | 1.80 | % | 4.75 | % | 5.01 | % | 2.46 | % | ||||||||||||
Weighted-average assumptions used to determine net periodic benefit cost | ||||||||||||||||||||||||
Discount rate | 2.46 | % | 1.80 | % | 2.90 | % | 5.01 | % | 2.46 | % | 1.80 | % | ||||||||||||
The above discount rate is based on the expected return of a portfolio of Corporate Aa debt, the term of which approximates the term of the benefit obligations. The Company reserves the right to terminate or alter post-employment health benefits. Post-retirement medical benefits are currently fixed amounts without provision for future increases; as a result, the assumed annual average rate of inflation used to measure the expected cost of benefits covered by this program is zero percent for 20222024 and beyond.
Estimated future benefit payments | Estimated future benefit payments | |||||||
(In thousands) | (In thousands) | |||||||
2023 | $ | 144 | ||||||
2024 | 144 | $ | 133 | |||||
2025 | 144 | 133 | ||||||
2026 | 141 | 133 | ||||||
2027 | 132 | 127 | ||||||
Years 2028-2032 | 522 | |||||||
2028 | 118 | |||||||
Years 2029-2033 | 424 | |||||||
Note 14: Related Party Transactions
Certain of the Directors, executive officers and their associates have had banking transactions with subsidiaries of the Company in the ordinary course of business. The table below reflects information concerning loans to certain directors and executive officers and/or family members during 20222023 and 2021:2022:
2022 | 2021 | 2023 | 2022 | |||||||||||||
($ in thousands) | ($ in thousands) | |||||||||||||||
Balance at January 1, | $ | 454 | $ | 499 | $ | 400 | $ | 454 | ||||||||
Originations | - | - | - | - | ||||||||||||
Principal reductions | $ | (54 | ) | (45 | ) | (51 | ) | (54 | ) | |||||||
Balance at December 31, | $ | 400 | $ | 454 | $ | 349 | $ | 400 | ||||||||
Percent of total loans outstanding. | 0.04 | % | 0.04 | % | 0.04 | % | 0.04 | % | ||||||||
Note 15: Regulatory Matters
Payment of dividends to the Company by the Bank is limited under regulations for state chartered banks. The amount that can be paid in any calendar year, without prior approval from regulatory agencies, cannot exceed the net profits (as defined) for the preceding three calendar years less dividends paid. The Company consistently has paid quarterly dividends to its shareholders since its formation in 1972.
[The remainder of this page intentionally left blank]
Note 16: Other Comprehensive Income (loss)
The components of other comprehensive income (loss) and other related tax effects were:
2023 | ||||||||||||
Before tax | Tax effect | Net of tax | ||||||||||
(In thousands) | ||||||||||||
Debt securities available for sale: | ||||||||||||
Changes in net unrealized losses arising during the year | $ | 93,326 | $ | (27,591 | ) | $ | 65,735 | |||||
Reclassification of losses included in net income | 125 | (37 | ) | 88 | ||||||||
Other comprehensive income | $ | 93,451 | $ | (27,628 | ) | $ | 65,823 | |||||
2022 | ||||||||||||
Before tax | Tax effect | Net of tax | ||||||||||
(In thousands) | ||||||||||||
Debt securities available for sale: | ||||||||||||
Changes in net unrealized losses/gains arising during the year | $ | (434,107 | ) | $ | 128,338 | $ | (305,769 | ) | ||||
Other comprehensive loss | $ | (434,107 | ) | $ | 128,338 | $ | (305,769 | ) | ||||
2021 | ||||||||||||
Before tax | Tax effect | Net of tax | ||||||||||
(In thousands) | ||||||||||||
Debt securities available for sale: | ||||||||||||
Changes in net unrealized gains arising during the year | $ | (91,891 | ) | $ | 27,167 | $ | (64,724 | ) | ||||
Reclassification of gains included in net income | (34 | ) | 10 | (24 | ) | |||||||
Other comprehensive loss | $ | (91,925 | ) | $ | 27,177 | $ | (64,748 | ) | ||||
2020 | ||||||||||||
Before tax | Tax effect | Net of tax | ||||||||||
(In thousands) | ||||||||||||
Debt securities available for sale: | ||||||||||||
Changes in net unrealized gains arising during the year | $ | 125,519 | $ | (37,108 | ) | $ | 88,411 | |||||
Reclassification of gains included in net income | (71 | ) | 21 | (50 | ) | |||||||
Other comprehensive income | $ | 125,448 | $ | (37,087 | ) | $ | 88,361 | |||||
Accumulated other comprehensive income (loss) balances were:
Accumulated Other Comprehensive Income (Loss) | ||||
(In thousands) | ||||
Balance, December 31, 2020 | $ | 114,412 | ||
Changes in unrealized gains on debt securities available for sale, net of tax | (64,748 | ) | ||
Balance, December 31, 2021 | 49,664 | |||
Changes in unrealized losses/gains on debt securities available for sale, net of tax | (305,769 | ) | ||
Balance, December 31, 2022 | (256,105 | ) | ||
Changes in unrealized losses on debt securities available for sale, net of tax | 65,823 | |||
Balance, December 31, 2023 | $ | (190,282 | ) | |
[The remainder of this page intentionally left blank]
Accumulated other comprehensive income (loss) balances were:
Accumulated Other Comprehensive Income (Loss) | ||||
(In thousands) | ||||
Balance, December 31, 2019 | $ | 26,051 | ||
Changes in unrealized gains on debt securities available for sale, net of tax | 88,361 | |||
Balance, December 31, 2020 | 114,412 | |||
Changes in unrealized gains on debt securities available for sale, net of tax | (64,748 | ) | ||
Balance, December 31, 2021 | 49,664 | |||
Changes in unrealized losses/gains on debt securities available for sale, net of tax | (305,769 | ) | ||
Balance, December 31, 2022 | $ | (256,105 | ) | |
Note 17: Earnings Per Common Share
The table below shows earnings per common share and diluted earnings per common share. Basic earnings per common share are computed by dividing net income by the average number of common shares outstanding during the period. Diluted earnings per common share are computed by dividing net income by the average number of common shares outstanding during the period plus the impact of common stock equivalents.
For the Years Ended December 31, | For the Years Ended December 31, | |||||||||||||||||||||||
2022 | 2021 | 2020 | 2023 | 2022 | 2021 | |||||||||||||||||||
(In thousands, except per share data) | (In thousands, except per share data) | |||||||||||||||||||||||
Net income (numerator) | $ | 122,034 | $ | 86,509 | $ | 80,413 | $ | 161,768 | $ | 122,034 | $ | 86,509 | ||||||||||||
Basic earnings per common share | ||||||||||||||||||||||||
Weighted average number of common shares outstanding - basic (denominator) | 26,895 | 26,855 | 26,942 | 26,703 | 26,895 | 26,855 | ||||||||||||||||||
Basic earnings per common share | $ | 4.54 | $ | 3.22 | $ | 2.98 | $ | 6.06 | $ | 4.54 | $ | 3.22 | ||||||||||||
Diluted earnings per common share | ||||||||||||||||||||||||
Weighted average number of common shares outstanding - basic | 26,895 | 26,855 | 26,942 | 26,703 | 26,895 | 26,855 | ||||||||||||||||||
Add common stock equivalents for options | 12 | 15 | 18 | 3 | 12 | 15 | ||||||||||||||||||
Weighted average number of common shares outstanding - diluted (denominator) | 26,907 | 26,870 | 26,960 | 26,706 | 26,907 | 26,870 | ||||||||||||||||||
Diluted earnings per common share | $ | 4.54 | $ | 3.22 | $ | 2.98 | $ | 6.06 | $ | 4.54 | $ | 3.22 | ||||||||||||
For the years ended December 31, 2022,2023, 20212022 and 2020,2021, options to purchase 983 thousand, 787 thousand 649 thousand and 577649 thousand shares of common stock, respectively, were outstanding but not included in the computation of diluted earnings per common share because the option exercise price exceeded the fair value of the stock such that their inclusion would have had an anti-dilutive effect.
[The remainder of this page intentionally left blank]
Note 18: Westamerica Bancorporation (Parent Company Only Condensed Financial Information)
Statements of Income and Comprehensive Income
For the Years Ended December 31, | For the Years Ended December 31, | |||||||||||||||||||||||
2022 | 2021 | 2020 | 2023 | 2022 | 2021 | |||||||||||||||||||
(In thousands) | (In thousands) | |||||||||||||||||||||||
Dividends from subsidiaries | $ | 70,267 | $ | 29,279 | $ | 10,783 | $ | 110,769 | $ | 70,267 | $ | 29,279 | ||||||||||||
Interest income | 49 | 44 | 56 | 57 | 49 | 44 | ||||||||||||||||||
Other income | 11,386 | 11,608 | 11,438 | 11,935 | 11,386 | 11,608 | ||||||||||||||||||
Total income | 81,702 | 40,931 | 22,277 | 122,761 | 81,702 | 40,931 | ||||||||||||||||||
Salaries and benefits | 5,832 | 6,612 | 7,107 | 5,710 | 5,832 | 6,612 | ||||||||||||||||||
Other expense | 2,609 | 2,279 | 2,206 | 2,315 | 2,609 | 2,279 | ||||||||||||||||||
Total expense | 8,441 | 8,891 | 9,313 | 8,025 | 8,441 | 8,891 | ||||||||||||||||||
Income before taxes and equity in undistributed income of subsidiaries | 73,261 | 32,040 | 12,964 | 114,736 | 73,261 | 32,040 | ||||||||||||||||||
Income tax expense | (881 | ) | (645 | ) | (454 | ) | (1,179 | ) | (881 | ) | (645 | ) | ||||||||||||
Earnings of subsidiaries greater than subsidiary dividends | 49,654 | 55,114 | 67,903 | 48,211 | 49,654 | 55,114 | ||||||||||||||||||
Net income | 122,034 | 86,509 | 80,413 | 161,768 | 122,034 | 86,509 | ||||||||||||||||||
Other comprehensive (loss) income, net of tax | (305,769 | ) | (64,748 | ) | 88,361 | |||||||||||||||||||
Comprehensive (loss) income | $ | (183,735 | ) | $ | 21,761 | $ | 168,774 | |||||||||||||||||
Other comprehensive income (loss), net of tax | 65,823 | (305,769 | ) | (64,748 | ) | |||||||||||||||||||
Comprehensive income (loss) | $ | 227,591 | $ | (183,735 | ) | $ | 21,761 | |||||||||||||||||
Balance Sheets
At December 31, | ||||||||
2022 | 2021 | |||||||
(In thousands) | ||||||||
Assets | ||||||||
Cash | $ | 99,478 | $ | 69,943 | ||||
Investment in Westamerica Bank | 464,500 | 720,614 | ||||||
Investment in non-bank subsidiaries | 453 | 454 | ||||||
Premises and equipment, net | 9,411 | 9,968 | ||||||
Accounts receivable from Westamerica Bank | 245 | 224 | ||||||
Other assets | 44,831 | 42,026 | ||||||
Total assets | $ | 618,918 | $ | 843,229 | ||||
Liabilities | ||||||||
Accounts payable to Westamerica Bank | $ | 40 | $ | 62 | ||||
Other liabilities | 16,768 | 16,065 | ||||||
Total liabilities | 16,808 | 16,127 | ||||||
Shareholders' equity | 602,110 | 827,102 | ||||||
Total liabilities and shareholders' equity | $ | 618,918 | $ | 843,229 | ||||
[The remainder of this page intentionally left blank]
Balance Sheets
At December 31, | ||||||||
2023 | 2022 | |||||||
(In thousands) | ||||||||
Assets | ||||||||
Cash | $ | 154,999 | $ | 99,478 | ||||
Investment in Westamerica Bank | 578,535 | 464,500 | ||||||
Investment in non-bank subsidiaries | 451 | 453 | ||||||
Premises and equipment, net | 9,123 | 9,411 | ||||||
Accounts receivable from Westamerica Bank | 341 | 245 | ||||||
Other assets | 45,694 | 44,831 | ||||||
Total assets | $ | 789,143 | $ | 618,918 | ||||
Liabilities | ||||||||
Accounts payable to Westamerica Bank | $ | 71 | $ | 40 | ||||
Other liabilities | 16,178 | 16,768 | ||||||
Total liabilities | 16,249 | 16,808 | ||||||
Shareholders' equity | 772,894 | 602,110 | ||||||
Total liabilities and shareholders' equity | $ | 789,143 | $ | 618,918 | ||||
Statements of Cash Flows
For the Years Ended December 31, | For the Years Ended December 31, | |||||||||||||||||||||||
2022 | 2021 | 2020 | 2023 | 2022 | 2021 | |||||||||||||||||||
(In thousands) | (In thousands) | |||||||||||||||||||||||
Operating Activities | ||||||||||||||||||||||||
Net income | $ | 122,034 | $ | 86,509 | $ | 80,413 | $ | 161,768 | $ | 122,034 | $ | 86,509 | ||||||||||||
Adjustments to reconcile net income to net cash provided by operating activities: | ||||||||||||||||||||||||
Depreciation and amortization | 563 | 569 | 608 | 539 | 563 | 569 | ||||||||||||||||||
(Increase) decrease in accounts receivable from affiliates | (771 | ) | 117 | (150 | ) | |||||||||||||||||||
Decrease (increase) in accounts receivable from affiliates | 1,224 | (771 | ) | 117 | ||||||||||||||||||||
Increase in other assets | (1,639 | ) | (1,223 | ) | (2,421 | ) | (2,048 | ) | (1,639 | ) | (1,223 | ) | ||||||||||||
Stock option compensation expense | 1,309 | 1,419 | 1,875 | 1,356 | 1,309 | 1,419 | ||||||||||||||||||
Provision for deferred income tax | 881 | 645 | 428 | 1,179 | 881 | 645 | ||||||||||||||||||
(Decrease) increase in other liabilities | (38 | ) | 254 | 855 | (1,326 | ) | (38 | ) | 254 | |||||||||||||||
Earnings of subsidiaries greater than subsidiary dividends | (49,654 | ) | (55,114 | ) | (67,903 | ) | (48,211 | ) | (49,654 | ) | (55,114 | ) | ||||||||||||
Gain on disposal of premises and equipment | - | - | (61 | ) | ||||||||||||||||||||
Net Cash Provided by Operating Activities | 72,685 | 33,176 | 13,644 | 114,481 | 72,685 | 33,176 | ||||||||||||||||||
Investing Activities | ||||||||||||||||||||||||
Purchases of equipment | (5 | ) | (78 | ) | - | (209 | ) | (5 | ) | (78 | ) | |||||||||||||
Net Cash Used in Investing Activities | (5 | ) | (78 | ) | - | (209 | ) | (5 | ) | (78 | ) | |||||||||||||
Financing Activities | ||||||||||||||||||||||||
Exercise of stock options | 2,255 | 3,017 | 2,838 | 950 | 2,255 | 3,017 | ||||||||||||||||||
Retirement of common stock | (218 | ) | (232 | ) | (16,496 | ) | (13,747 | ) | (218 | ) | (232 | ) | ||||||||||||
Common stock dividends paid | (45,182 | ) | (44,304 | ) | (44,285 | ) | (45,954 | ) | (45,182 | ) | (44,304 | ) | ||||||||||||
Net Cash Used in Financing Activities | (43,145 | ) | (41,519 | ) | (57,943 | ) | (58,751 | ) | (43,145 | ) | (41,519 | ) | ||||||||||||
Net change in cash and due from banks | 29,535 | (8,421 | ) | (44,299 | ) | 55,521 | 29,535 | (8,421 | ) | |||||||||||||||
Cash and due from banks at beginning of period | 69,943 | 78,364 | 122,663 | 99,478 | 69,943 | 78,364 | ||||||||||||||||||
Cash and due from banks at end of period | $ | 99,478 | $ | 69,943 | $ | 78,364 | $ | 154,999 | $ | 99,478 | $ | 69,943 | ||||||||||||
Supplemental Cash Flow Disclosures: | ||||||||||||||||||||||||
Supplemental disclosure of cash flow activities: | ||||||||||||||||||||||||
Interest paid for the period | $ | - | $ | - | $ | - | ||||||||||||||||||
Income tax payments for the period | 39,840 | 27,673 | 26,462 | $ | 64,017 | 39,840 | 27,673 | |||||||||||||||||
[The remainder of this page intentionally left blank]
Note 19: Quarterly Financial Information (Unaudited)
For the Three Months Ended | ||||||||||||||||||||||||
March 31, | June 30, | September 30, | December 31, | |||||||||||||||||||||
(In thousands, except per share data and | ||||||||||||||||||||||||
price range of common stock) | ||||||||||||||||||||||||
2023 | ||||||||||||||||||||||||
Interest and loan fee income | $ | 69,624 | $ | 70,489 | $ | 72,848 | $ | 71,052 | ||||||||||||||||
Net interest income | 69,153 | 69,882 | 71,715 | 69,373 | ||||||||||||||||||||
(Reversal of ) provision for loan losses | (1,550 | ) | - | 400 | - | |||||||||||||||||||
Noninterest income | 10,549 | 10,700 | 11,281 | 10,992 | ||||||||||||||||||||
Noninterest expense | 26,210 | 25,839 | 25,650 | 25,517 | ||||||||||||||||||||
Income before taxes | 55,042 | 54,743 | 56,946 | 54,848 | ||||||||||||||||||||
Net income | 40,451 | 40,248 | 41,601 | 39,468 | ||||||||||||||||||||
Basic earnings per common share | 1.51 | 1.51 | 1.56 | 1.48 | ||||||||||||||||||||
Diluted earnings per common share | 1.51 | 1.51 | 1.56 | 1.48 | ||||||||||||||||||||
Dividends paid per common share | 0.42 | 0.42 | 0.44 | 0.44 | ||||||||||||||||||||
Price range, common stock | 44.04 | - | 58.34 | 36.85 | - | 43.50 | 38.87 | - | 49.87 | 42.59 | - | 57.21 | ||||||||||||
2022 | ||||||||||||||||||||||||
Interest and loan fee income | $ | 43,759 | $ | 47,997 | $ | 60,802 | $ | 69,198 | ||||||||||||||||
Net interest income | 43,279 | 47,514 | 60,315 | 68,723 | ||||||||||||||||||||
Provision for loan losses | - | - | - | - | ||||||||||||||||||||
Noninterest income | 11,576 | 11,264 | 11,818 | 10,463 | ||||||||||||||||||||
Noninterest expense | 24,875 | 24,629 | 24,767 | 25,090 | ||||||||||||||||||||
Income before taxes | 29,980 | 34,149 | 47,366 | 54,096 | ||||||||||||||||||||
Net income | 22,616 | 25,314 | 34,760 | 39,344 | ||||||||||||||||||||
Basic earnings per common share | 0.84 | 0.94 | 1.29 | 1.46 | ||||||||||||||||||||
Diluted earnings per common share | 0.84 | 0.94 | 1.29 | 1.46 | ||||||||||||||||||||
Dividends paid per common share | 0.42 | 0.42 | 0.42 | 0.42 | ||||||||||||||||||||
Price range, common stock | 57.54 | - | 62.76 | 55.66 | - | 61.30 | 52.29 | - | 61.52 | 52.22 | - | 63.39 | ||||||||||||
2021 | ||||||||||||||||||||||||
Interest and loan fee income | $ | 42,316 | $ | 44,276 | $ | 43,810 | $ | 43,041 | ||||||||||||||||
Net interest income | 41,841 | 43,792 | 43,318 | 42,537 | ||||||||||||||||||||
Provision for loan losses | - | - | - | - | ||||||||||||||||||||
Noninterest income | 10,189 | 11,032 | 11,282 | 10,842 | ||||||||||||||||||||
Noninterest expense | 24,906 | 24,291 | 24,697 | 23,912 | ||||||||||||||||||||
Income before taxes | 27,124 | 30,533 | 29,903 | 29,467 | ||||||||||||||||||||
Net income | 20,147 | 22,579 | 22,063 | 21,720 | ||||||||||||||||||||
Basic earnings per common share | 0.75 | 0.84 | 0.82 | 0.81 | ||||||||||||||||||||
Diluted earnings per common share | 0.75 | 0.84 | 0.82 | 0.81 | ||||||||||||||||||||
Dividends paid per common share | 0.41 | 0.41 | 0.41 | 0.42 | ||||||||||||||||||||
Price range, common stock | 55.82 | - | 66.43 | 57.67 | - | 64.80 | 54.03 | - | 58.55 | 53.78 | - | 58.00 | ||||||||||||
[The remainder of this page intentionally left blank]
Note 19: Quarterly Financial Information (Unaudited)
For the Three Months Ended | ||||||||||||||||||||||||
March 31, | June 30, | September 30, | December 31, | |||||||||||||||||||||
(In thousands, except per share data and | ||||||||||||||||||||||||
price range of common stock) | ||||||||||||||||||||||||
2022 | ||||||||||||||||||||||||
Interest and loan fee income | $ | 43,759 | $ | 47,997 | $ | 60,802 | $ | 69,198 | ||||||||||||||||
Net interest income | 43,279 | 47,514 | 60,315 | 68,723 | ||||||||||||||||||||
Provision for loan losses | - | - | - | - | ||||||||||||||||||||
Noninterest income | 11,576 | 11,264 | 11,818 | 10,463 | ||||||||||||||||||||
Noninterest expense | 24,875 | 24,629 | 24,767 | 25,090 | ||||||||||||||||||||
Income before taxes | 29,980 | 34,149 | 47,366 | 54,096 | ||||||||||||||||||||
Net income | 22,616 | 25,314 | 34,760 | 39,344 | ||||||||||||||||||||
Basic earnings per common share | 0.84 | 0.94 | 1.29 | 1.46 | ||||||||||||||||||||
Diluted earnings per common share | 0.84 | 0.94 | 1.29 | 1.46 | ||||||||||||||||||||
Dividends paid per common share | 0.42 | 0.42 | 0.42 | 0.42 | ||||||||||||||||||||
Price range, common stock | 57.54 | - | 62.76 | 55.66 | - | 61.30 | 52.29 | - | 61.52 | 52.22 | - | 63.39 | ||||||||||||
2021 | ||||||||||||||||||||||||
Interest and loan fee income | $ | 42,316 | $ | 44,276 | $ | 43,810 | $ | 43,041 | ||||||||||||||||
Net interest income | 41,841 | 43,792 | 43,318 | 42,537 | ||||||||||||||||||||
Provision for loan losses | - | - | - | - | ||||||||||||||||||||
Noninterest income | 10,189 | 11,032 | 11,282 | 10,842 | ||||||||||||||||||||
Noninterest expense | 24,906 | 24,291 | 24,697 | 23,912 | ||||||||||||||||||||
Income before taxes | 27,124 | 30,533 | 29,903 | 29,467 | ||||||||||||||||||||
Net income | 20,147 | 22,579 | 22,063 | 21,720 | ||||||||||||||||||||
Basic earnings per common share | 0.75 | 0.84 | 0.82 | 0.81 | ||||||||||||||||||||
Diluted earnings per common share | 0.75 | 0.84 | 0.82 | 0.81 | ||||||||||||||||||||
Dividends paid per common share | 0.41 | 0.41 | 0.41 | 0.42 | ||||||||||||||||||||
Price range, common stock | 55.82 | - | 66.43 | 57.67 | - | 64.80 | 54.03 | - | 58.55 | 53.78 | - | 58.00 | ||||||||||||
2020 | ||||||||||||||||||||||||
Interest and loan fee income | $ | 39,991 | $ | 41,539 | $ | 41,365 | $ | 42,961 | ||||||||||||||||
Net interest income | 39,549 | 41,104 | 40,899 | 42,480 | ||||||||||||||||||||
Provision for loan losses | 4,300 | - | - | - | ||||||||||||||||||||
Noninterest income | 11,648 | 9,554 | 10,476 | 13,959 | ||||||||||||||||||||
Noninterest expense | 24,664 | 24,754 | 24,603 | 24,545 | ||||||||||||||||||||
Income before taxes | 22,233 | 25,904 | 26,772 | 31,894 | ||||||||||||||||||||
Net income | 16,962 | 19,562 | 20,051 | 23,838 | ||||||||||||||||||||
Basic earnings per common share | 0.63 | 0.72 | 0.74 | 0.89 | ||||||||||||||||||||
Diluted earnings per common share | 0.63 | 0.72 | 0.74 | 0.89 | ||||||||||||||||||||
Dividends paid per common share | 0.41 | 0.41 | 0.41 | 0.41 | ||||||||||||||||||||
Price range, common stock | 47.37 | - | 68.01 | 53.40 | - | 64.86 | 51.84 | - | 63.58 | 51.49 | - | 59.70 | ||||||||||||
[The remainder of this page intentionally left blank]
REPORT OF INDEPENDENT REGISTERED PUBLIC ACCOUNTING FIRM
Shareholders and the Board of Directors of
Westamerica Bancorporation
San Rafael, California
Opinions on the Financial Statements and Internal Control over Financial Reporting
We have audited the accompanying consolidated balance sheets of Westamerica Bancorporation (the "Company") as of December 31, 20222023 and 2021,2022, the related consolidated statements of income, comprehensive income (loss), changes in shareholders’ equity, and cash flows for each of the years in the three-year period ended December 31, 2022,2023, and the related notes (collectively referred to as the "financial statements"). We also have audited the Company’s internal control over financial reporting as of December 31, 2022,2023, based on criteria established in Internal Control – Integrated Framework: (2013) issued by the Committee of Sponsoring Organizations of the Treadway Commission (COSO).
In our opinion, the financial statements referred to above present fairly, in all material respects, the financial position of the Company as of December 31, 20222023 and 2021,2022, and the results of its operations and its cash flows for each of the years in the three-year period ended December 31, 20222023 in conformity with accounting principles generally accepted in the United States of America. Also in our opinion, the Company maintained, in all material respects, effective internal control over financial reporting as of December 31, 2022,2023, based on criteria established in Internal Control – Integrated Framework: (2013) issued by COSO.
Basis for Opinions
The Company’s management is responsible for these financial statements, for maintaining effective internal control over financial reporting, and for its assessment of the effectiveness of internal control over financial reporting, included in the accompanying Management’s Report on Internal Control Over Financial Reporting. Our responsibility is to express an opinion on the Company’s financial statements and an opinion on the Company’s internal control over financial reporting based on our audits. We are a public accounting firm registered with the Public Company Accounting Oversight Board (United States) ("PCAOB") and are required to be independent with respect to the Company in accordance with the U.S. federal securities laws and the applicable rules and regulations of the Securities and Exchange Commission and the PCAOB.
We conducted our audits in accordance with the standards of the PCAOB. Those standards require that we plan and perform the audits to obtain reasonable assurance about whether the financial statements are free of material misstatement, whether due to error or fraud, and whether effective internal control over financial reporting was maintained in all material respects.
Our audits of the financial statements included performing procedures to assess the risks of material misstatement of the financial statements, whether due to error or fraud, and performing procedures that respond to those risks. Such procedures included examining, on a test basis, evidence regarding the amounts and disclosures in the financial statements. Our audits also included evaluating the accounting principles used and significant estimates made by management, as well as evaluating the overall presentation of the financial statements. Our audit of internal control over financial reporting included obtaining an understanding of internal control over financial reporting, assessing the risk that a material weakness exists, and testing and evaluating the design and operating effectiveness of internal control based on the assessed risk. Our audits also included performing such other procedures as we considered necessary in the circumstances. We believe that our audits provide a reasonable basis for our opinions.
(Continued)
Definition and Limitations of Internal Control Over Financial Reporting
A company’s internal control over financial reporting is a process designed to provide reasonable assurance regarding the reliability of financial reporting and the preparation of financial statements for external purposes in accordance with generally accepted accounting principles. A company’s internal control over financial reporting includes those policies and procedures that (1) pertain to the maintenance of records that, in reasonable detail, accurately and fairly reflect the transactions and dispositions of the assets of the company; (2) provide reasonable assurance that transactions are recorded as necessary to permit preparation of financial statements in accordance with generally accepted accounting principles, and that receipts and expenditures of the company are being made only in accordance with authorizations of management and directors of the company; and (3) provide reasonable assurance regarding prevention or timely detection of unauthorized acquisition, use, or disposition of the company’s assets that could have a material effect on the financial statements.
Because of its inherent limitations, internal control over financial reporting may not prevent or detect misstatements. Also, projections of any evaluation of effectiveness to future periods are subject to the risk that controls may become inadequate because of changes in conditions, or that the degree of compliance with the policies or procedures may deteriorate.
Critical Audit Matter
The critical audit matter communicated below is a matter arising from the current period audit of the financial statements that was communicated or required to be communicated to the audit committee and that: (1) relates to accounts or disclosures that are material to the financial statements and (2) involved our especially challenging, subjective, or complex judgments. The communication of the critical audit matter does not alter in any way our opinion on the financial statements, taken as a whole, and we are not, by communicating the critical audit matter below, providing a separate opinion on the critical audit matter or on the accounts or disclosures to which it relates.
Allowance for Credit Losses on Loans – Reasonable and Supportable Forecasts - Refer to Notes 1 and 3 to the financial statements
The allowance for credit losses on loans is an accounting estimate of expected credit losses over the estimated life of loans. ASC 326, Financial Instruments – Credit Losses, requires a financial asset (or a group of financial assets), including the Company's loan portfolio, measured at amortized cost, to be presented at the net amount expected to be collected. The allowance for credit losses on loans as of December 31, 20222023 was $20,284,000.$16,867,000.
The Company estimates the amount of expected losses over the life of its existing loan portfolio and establishes an allowance for credit losses. Loans that share common risk characteristics are segregated into pools based on those characteristics. Historical loss rates are determined for each pool. Historical loss rates are adjusted for estimated losses based on current conditions and management’s reasonable and supportable forecasts of economic trends over a forecast horizon of up to two years. Significant management judgments are required in the development and application of reasonable and supportable forecasts.
We identified the development and application of reasonable and supportable forecasts as a critical audit matter because of the significant auditor judgment and audit effort to evaluate the subject judgments made by management, including the need to involve more experienced audit personnel.
The primary procedures we performed to address this critical audit matter included:
● | Testing the effectiveness of controls over the application of reasonable and supportable forecasts, including controls addressing: |
o | The reasonable and supportable forecasts methodology, | |
o | Significant judgments and assumptions in the reasonable and supportable forecasts methodology, including the selection and application of economic variables, and | |
o | The accuracy of the reasonable and supportable forecasts |
(Continued)
● | Substantively testing management’s process for the application of reasonable and supportable forecasts, including: |
o | Evaluation of the reasonable and supportable forecasts methodology, | |
o | Evaluation of significant judgments and assumptions in the reasonable and supportable forecasts methodology, including the selection and application of economic variables, and | |
o | Evaluation of the accuracy of the reasonable and supportable forecasts |
/s/ Crowe LLP
Crowe LLP
We have served as the Company's auditor since 2015.
Sacramento, California
February 28, 20232024
ITEM 9. CHANGES IN AND DISAGREEMENTS WITH ACCOUNTANTS ON ACCOUNTING AND FINANCIAL DISCLOSURE
None.
ITEM 9A. CONTROLS AND PROCEDURES
The Company’s principal executive officer and principal financial officer have evaluated the effectiveness of the Company’s “disclosure controls and procedures,” as such term is defined in Rule 13a-15(e) of the Securities Exchange Act of 1934, as amended, as of December 31, 2022.2023.
Based upon their evaluation, the principal executive officer and principal financial officer concluded that the Company’s disclosure controls and procedures are effective to ensure that material information required to be disclosed by the Company in the reports that it files or submits under the Exchange Act is recorded, processed, summarized and reported as and when required and that such information is communicated to the Company’s management, including the principal executive officer and the principal financial officer, to allow for timely decisions regarding required disclosures. The evaluation did not identify any change in the Company’s internal control over financial reporting that occurred during the quarter ended December 31, 20222023 that has materially affected, or is reasonably likely to materially affect, the Company’s internal control over financial reporting. Management’s Report on Internal Control Over Financial Reporting and the attestation Report of Independent Registered Public Accounting Firm are found on pages 5051 and 91,90, respectively.
None.Rule 10b5-1 Trading Plans
During the quarter ended December 31, 2023, none of the Company’s directors or executive officers adopted or terminated any contract, instruction or written plan for the purchase or sale of Company securities that was intended to satisfy the affirmative defense conditions of Rule 10b5-1(c) or any “non-Rule 10b5-1 trading arrangement” as defined in Item 408 of Regulation S-K.
ITEM 9C. DISCLOSURE REGARDING FOREIGN JURISDICTIONS THAT PREVENT INSPECTIONS
Not applicable.
PART III
ITEM 10. DIRECTORS, EXECUTIVE OFFICERS OF THE REGISTRANT AND CORPORATE GOVERNANCE
The information required by this Item 10 of this Annual Report on Form 10-K is incorporated by reference from the information contained in the Company’s Proxy Statement for its 20232024 Annual Meeting of Shareholders which will be filed pursuant to Regulation 14A of the Exchange Act.
The Company has adopted a Code of Ethics (as defined in Item 406 of Regulation S-K of the Securities Act of 1933) that is applicable to its senior financial officers including its chief executive officer, chief financial officer, and principal accounting officer.
ITEM 11. EXECUTIVE COMPENSATION
The information required by this Item 11 of this Annual Report on Form 10-K is incorporated by reference from the information contained in the Company’s Proxy Statement for its 20232024 Annual Meeting of Shareholders which will be filed pursuant to Regulation 14A of the Exchange Act.
[The remainder of this page intentionally left blank]
ITEM 12. SECURITY OWNERSHIP OF CERTAIN BENEFICIAL OWNERS AND MANAGEMENT AND RELATED STOCKHOLDER MATTERS
The information required by this Item 12 of this Annual Report on Form 10-K is incorporated by reference from the information contained in the Company’s Proxy Statement for its 20232024 Annual Meeting of Shareholders which will be filed pursuant to Regulation 14A of the Exchange Act.
Securities Authorized for Issuance Under Equity Compensation Plans
The following table summarizes the status of the Company’s equity compensation plans as of December 31, 2022:2023:
At December 31, 2022 | At December 31, 2023 | |||||||||||||||||||||||
Plan category | Number of securities to be issued upon exercise of outstanding options, warrants and rights | Weighted-average exercise price of outstanding options, warrants and rights | Number of securities remaining available for future issuance under equity compensation plans (excluding securities reflected in column (a)) | Number of securities to be issued upon exercise of outstanding options, warrants and rights | Weighted-average exercise price of outstanding options, warrants and rights | Number of securities remaining available for future issuance under equity compensation plans (excluding securities reflected in column (a)) | ||||||||||||||||||
(In thousands, except exercise price) | (In thousands, except exercise price) | |||||||||||||||||||||||
(a) | (b) | (c) | (a) | (b) | (c) | |||||||||||||||||||
Equity compensation plans approved by security holders | 854 | $ | 60 | 856 | 973 | $ | 60 | 705 | ||||||||||||||||
Equity compensation plans not approved by security holders | - | N/A | - | - | N/A | - | ||||||||||||||||||
Total | 854 | $ | 60 | 856 | 973 | $ | 60 | 705 | ||||||||||||||||
ITEM 13. CERTAIN RELATIONSHIPS, RELATED TRANSACTIONS AND DIRECTOR INDEPENDENCE
The information required by this Item 13 of this Annual Report on Form 10-K is incorporated by reference from the information contained in the Company’s Proxy Statement for its 20232024 Annual Meeting of Shareholders, which will be filed pursuant to Regulation 14A of the Exchange Act.
ITEM 14. PRINCIPAL ACCOUNTANT FEES AND SERVICES
The information required by this Item 14 of this Annual Report on Form 10-K is incorporated by reference from the information contained in the Company’s Proxy Statement for its 20232024 Annual Meeting of Shareholders which will be filed pursuant to Regulation 14A of the Exchange Act.
PART IV
ITEM 15. EXHIBITS AND FINANCIAL STATEMENT SCHEDULES
(a) | 1. | Financial Statements:
See Index to Financial Statements on page
|
(a) | 2. | Financial statement schedules required. No financial statement schedules are filed as part of this Report since the required information is included in the consolidated financial statements, including the notes thereto, or the circumstances requiring inclusion of such schedules are not present.
|
(a) | 3. | Exhibits:
The following documents are included or incorporated by reference in this Annual Report on Form 10‑K. |
Exhibit Number | |
101.INS | Inline XBRL Instance Document – The instance document does not appear in the Interactive Data File because its XBRL tags are embedded within the Inline XBRL document. |
101.SCH | Inline XBRL Taxonomy Extension Schema Document |
101.CAL | Inline XBRL Taxonomy Extension Calculation Linkbase Document |
101.DEF | Inline XBRL Taxonomy Extension Definitions Linkbase Document |
101.LAB | Inline XBRL Taxonomy Extension Label Linkbase Document |
101.PRE |
|
104 | The Cover page of Westamerica Bancorporation’s Annual Report on Form 10-K for the year ended December 31, |
* Indicates management contract or compensatory plan or arrangement.
The exhibits listed above are available through the SEC’s website (https://www.sec.gov). Alternatively, the Company will furnish to shareholders a copy of any exhibit listed above, but not contained herein, upon written request to the Office of the Corporate Secretary A-2M, Westamerica Bancorporation, P.O. Box 1200, Suisun City, California 94585-1200, and payment to the Company of $.25 per page.page, provided that a copy of the Code of Ethics will be provided without charge.
None
[The remainder of this page intentionally left blank]
SIGNATURES
Pursuant to the requirements of Section 13 or 15(d) of the Securities Exchange Act of 1934, the Registrant has duly caused this report to be signed on its behalf by the undersigned, thereunto duly authorized.
WESTAMERICA BANCORPORATION
/s/ Jesse LeavittJohn “Robert” Thorson
Jesse LeavittJohn “Robert” Thorson
Senior Vice President
and Chief Financial Officer
(Principal Financial and Accounting Officer)
Date: February 28, 20232024
Pursuant to the requirements of the Securities Exchange Act of 1934, this report has been signed below by the following persons on behalf of the Registrant and in the capacities and on the date indicated.
Signature | Title | Date | ||
/s/ David L. Payne
| Chairman of the Board and Directors | February 28, 2024 | ||
David L. Payne | President and Chief Executive Officer (Principal Executive Officer) |
| ||
/s/
| Senior Vice President and Chief Financial Officer | February 28, 2024 | ||
| John “Robert” Thorson | (Principal Financial and Accounting Officer) |
| ||
/s/
| Director | February 28, | ||
| Alisa Belew | ||||
/s/
| Director | February 28, | ||
| E. Joseph Bowler | ||||
| Director | February 28, 2024 | |||
| Martin Camsey | ||||
/s/
| Director | February 28, | ||
| Melanie Martella Chiesa | ||||
/s/
| Director | February 28, | ||
| Michele Hassid | ||||
/s/
| Lead Independent Director | February 28, | ||
| Edward B. Sylvester | ||||
/s/
|
| February 28, | ||
| Inez Wondeh | ||||
|
|
|