UNITED STATES
SECURITIES AND EXCHANGE COMMISSION
Washington, D.C. 20549
FORM 10-K
|
| |
| x | Annual report pursuant to Section 13 or 15(d) of the Securities Exchange Act of 1934. |
| | |
| | For the fiscal year ended October 31, 20112013 |
| | |
| | OR |
| | |
| o | Transition report pursuant to Section 13 or 15(d) of the Securities Exchange Act of 1934. |
| | |
| | For the transition period from to . |
| | |
| | COMMISSION FILE NUMBER 000-51277 |
GRANITE FALLS ENERGY, LLC
(Exact name of registrant as specified in its charter)
|
| | | | |
| Minnesota | | 41-1997390 |
(State or other jurisdiction of incorporation or organization) | | (I.R.S. Employer Identification No.) |
| | | |
| 15045 Highway 23 SE, Granite Falls, MN 56241-0216 |
| (Address of principal executive offices) |
| |
| (320) 564-3100 |
| (Registrant's telephone number, including area code) |
Securities registered pursuant to Section 12(b) of the Act: None
Securities registered pursuant to Section 12(g) of the Act: Membership Units
Indicate by check mark if the registrant is a well-known seasoned issuer, as defined in Rule 405 of the Securities Act.
o Yes x No
Indicated by check mark if the registrant is not required to file reports pursuant to Section 13 or Section 15(d) of the Act.
o Yes x No
Indicate by check mark whether the registrant (1) has filed all reports required to be filed by Section 13 or 15(d) of the Securities Exchange Act of 1934 during the preceding 12 months (or for such shorter period that the registrant was required to file such reports), and (2) has been subject to such filing requirements for the past 90 days.
x Yes o No
Indicate by check mark whether the registrant has submitted electronically and posted on its corporate Web site, if any, every Interactive Data File required to be submitted and posted pursuant to Rule 405 of Regulation S-T (§232.405 of this chapter) during the preceding 12 months (or for such shorter period that the registrant was required to submit and post such files).
x Yes o No
Indicate by check mark if disclosure of delinquent filers pursuant to Item 405 of Regulation S-K (§229.405 of this chapter) is not contained herein, and will not be contained, to the best of registrant's knowledge, in definitive proxy information statements incorporated by reference in Part III of this Form 10-K or any amendment to this Form 10-K. x
Indicate by check mark whether the registrant is a large accelerated filer, an accelerated filer, a non-accelerated filer, or a smaller reporting company. See the definitions of "large accelerated filer," "accelerated filer" and "smaller reporting company" in Rule 12b-2 of the Exchange Act:
|
| |
Large Accelerated Filer o | Accelerated Filer o |
Non-Accelerated Filer x | Smaller Reporting Company o |
Indicate by check mark whether the registrant is a shell company (as defined in Rule 12b-2 of the Exchange Act).
o Yes x No
The aggregate market value of the Company’s Unitsmembership units held by non-affiliates isof the registrant was $21,185,000 as of April 30, 2013. The membership units are not able to be calculated. The Company is a limited liability company whose outstanding common equity, consisting of its Units, islisted on an exchange or otherwise publicly traded. Additionally, the membership units are subject to significant restrictions on transfer under the registrant's operating and member control agreement. The value of the membership units for this purpose has been based solely upon the initial offering price of the membership units. In determining this value, the registrant has assumed that all of its Member Control Agreement. No public marketgovernors, chief executive officer, chief financial officer and beneficial owners of 5% or more of its outstanding membership units are affiliates, but this assumption shall not apply to or be conclusive for common equity of Granite Falls Energy, LLC is established and it is unlikely in the foreseeable future that a public market for its common equity will develop.
any other purpose.
As of January 30, 201229, 2014, there were 30,606 membership units outstanding.
DOCUMENTS INCORPORATED BY REFERENCE
The registrant has incorporated by reference into Part III of this Annual Report on Form 10-K portions of its definitive proxy statement to be filed with the Securities and Exchange Commission within 120 days after the close of the fiscal year covered by this Annual Report (October 31, 2011)2013). This proxy statement is referred to in this report as the 20122014 Proxy Statement.
INDEX
PART I
CAUTIONARY STATEMENTS REGARDING FORWARD-LOOKING STATEMENTS
This annual report contains historical information, as well as forward-looking statements that involve known and unknown risks and relate to future events, our future financial performance, or our expected future operations and actions. In some cases, you can identify forward-looking statements by terminology such as “may,” “will,” “should,” “expect,” “plan,” “anticipate,” “believe,” “estimate,” “future,” “intend,” “could,” “hope,” “predict,” “target,” “potential,” or “continue” or the negative of these terms or other similar expressions. These forward-looking statements are only our predictions based on current information and involve numerous assumptions, risks and uncertainties. Our actual results or actions may differ materially from these forward-looking statements for many reasons, including the reasons described in this report. While it is impossible to identify all such factors, factors that could cause actual results to differ materially from those estimated by us include:
Changes in the availability and price of corn and natural gas;
Demand for corn exceeding supply; and corresponding corn price increases;
Changes in our business strategy, capital improvements or development plans;
Our ability to profitably operate the ethanol plant and maintain a positive spread between the selling price of our products and our raw materials costs;
Results of our hedging transactions and other risk management strategies;
Decreases in the market prices of ethanol and distillers grains;
Ethanol supply exceeding demand; and corresponding ethanol price reductions;
Changes in the environmental regulations that apply to our plant operations and changes in our ability to comply with such regulations;
Changes in plant production capacity or technical difficulties in operating the plant;
The performance of Heron Lake BioEnergy, LLC, an ethanol production company in which we indirectly own approximately 60.8% of the outstanding membership units;
Changes in general economic conditions or the occurrence of certain events causing an economic impact in the agriculture, oil or automobile industries;
Lack of transport, storage and blending infrastructure preventing ethanol from reaching high demand markets;
Changes in federal and/or state laws;laws or regulations, including the elimination or modification of the federal renewable fuels standard;
Changes and advances in ethanol production technology;
Effects of mergers, consolidations or contractions in the ethanol industry;
Competition from alternative fuel additives;
The development of infrastructure related to the sale and distribution of ethanol;
Our inelastic demand for corn, as it is the only available feedstock for our plant;
Our ability to retain key employees and maintain labor relations;
The imposition of tariffs or other duties on ethanol imported into Europe;
The performance of our modified water intake system; and
Volatile commodity and financial markets.
The cautionary statements referred to in this section also should be considered in connection with any subsequent written or oral forward-looking statements that may be issued by us or persons acting on our behalf. We do not undertake any duty to update forward-looking statements after the date they are made or to conform forward-looking statements to actual results or to changes in circumstances or expectations. Furthermore, we cannot guarantee future results, events, levels of activity, performance, or achievements. We caution you not to put undue reliance on any forward-looking statements, which speak only as of the date of this report. You should read this report and the documents that we reference in this report and have filed as exhibits, completely and with the understanding that our actual future results may be materially different from what we currently expect. We qualify all of our forward-looking statements by these cautionary statements.
The cautionary statements referred to in this section also should be considered in connection with any subsequent written or oral forward-looking statements that may be issued by us or any persons acting on our behalf. We undertake no duty to update these forward-looking statements, even though our situation may change in the future. Furthermore, we cannot guarantee future results, events, levels of activity, performance, or achievements. We caution you not to put undue reliance on any forward-looking statements, which speak only as of the date of this report. You should read this report and the documents that we reference in this report and have filed as exhibits, completely and with the understanding that our actual future results may be materially different from what we currently expect. We qualify all of our forward-looking statements by these cautionary statements.
AVAILABLE INFORMATION
Information about us is also available at our website at www.granitefallsenergy.com, under “SEC Compliance,” which includes links to reports we have filed with the Securities and Exchange Commission, including annual, quarterly and current reports. The contents of our website are not incorporated by reference in this Annual Report on Form 10-K. The Securities and Exchange Commission also maintains an Internet site (http://www.sec.gov) through which the public can access our reports.
PART I
ITEM 1. BUSINESS
Business Development
Granite Falls Energy, LLC (“Granite Falls”Falls Energy” or the “Company”) is a Minnesota limited liability company formed on December 29, 2000. We are currently producing fuel-grade ethanol, distillers grains and crude corn oil for sale. Our plant has an approximate annual production capacity of 60 million gallons of denatured ethanol.ethanol, but is currently permitted to produce up to 70 million gallons of undenatured ethanol on a twelve month rolling sum basis. We intend to continue working toward increasing production to take advantage of the additional production allowed pursuant to our permit as long as we believe it is profitable to do so.
Our operating results are largely driven by the prices at which we sell our ethanol, distillers grains, and corn oil as well as the other costs related to production.the production of these products. The price of ethanol has historically fluctuated with the price of petroleum-based products such as unleaded gasoline, heating oil and crude oil. The price of distillers grains has historically been influenced by the price of corn as a substitute livestock feed. We expect these price relationships to continue for the foreseeable future. Our largest costs of production are corn, natural gas, depreciation and manufacturing chemicals. Our cost of corn is largely impacted by geopolitical supply and demand factors and the outcome of our risk management strategies. Prices for natural gas, manufacturing chemicals and denaturant are tied directly to the overall energy sector, crude oil and unleaded gasoline.
During the second quarterOn July 31, 2013, we acquired a majority interest in Heron Lake BioEnergy, LLC ("Heron Lake" or "HLBE"), a Minnesota limited liability company. Heron Lake owns an ICM/Fagen designed plant that started production in September 2007. Heron Lake produces fuel-grade ethanol, distillers grains and crude corn oil for sale. HLBE's plant has an approximate annual production capacity of fiscal 2011, we obtained an amendment to our environmental permits allowing us55 million gallons, but is currently permitted to produce up to 7059.2 million gallons of undenatured ethanol on a twelve month rolling sum basis. We intend to continue working toward increasing production to take advantage of the underutilized capacity of our plant as long as we believe it is profitable to do so. per year.
On August 26, 2011, we repaid our outstanding note payable to the City of Granite Falls in the amount of approximately $187,000. Granite Falls Energy had been making scheduled payments on this loan since February 2006 and was scheduled to have the the loan repaid in June 2014. Granite Falls Energy decided to repay the loan early and is now free of all long term debt obligations.
In November 2010, we declared a cash distribution of $300 per unit or $9,196,800 for unit holders of record as of November 23, 2010. The distribution was paid on December 15, 2010. In October 2011, we declared an additional cash distribution of $300 per unit or $9,196,800 for unit holders of record as of October 27, 2011. The distribution was paid on December 15, 2011.
As of the date of this report, we have 37 full time employees. Ten of these employees are involved primarily in management and administration. The remaining employees are involved primarily in plant operations. We do not currently anticipate any significant change in the number of employees at our plant.
Financial Information
Please refer to “Item 7 - Management's Discussion and Analysis of Financial Condition and Results of Operations” for information about our revenue, profit and loss measurements and total assets and liabilities and “Item 8 - Financial Statements and Supplementary Data” for our financial statements and supplementary data.
Principal Products
The principal products we produce are ethanol, distillers grains and corn oil.
Ethanol
Ethanol is ethyl alcohol, a fuel component made primarily from corn and various other grains, which can be used as: (i) an octane enhancer in fuels; (ii) an oxygenated fuel additive for the purpose of reducing ozone and carbon monoxide vehicle emissions; and (iii) a non-petroleum-based gasoline substitute. More than 99% of all ethanolEthanol produced in the United States is primarily used in its primary form for blending with unleaded gasoline and other fuel products. The principal purchasers of ethanol are generally wholesale gasoline marketers or blenders. The principal markets for our ethanol are petroleum terminals in the continental United States.
Approximately 83.0%77.2% of our consolidated revenue, net of derivative activity, was derived from the sale of ethanol during our fiscal year ended October 31, 2011.2013. Ethanol sales accounted for approximately 85.0%79.1% and 83.0% of our consolidated revenue, net of derivative activity, for the fiscal years ended October 31, 20102012 and 2009,2011, respectively.
Distillers Grains
A principal co-product of the ethanol production process is distillers grains, a high protein, high-energy animal feed supplement primarily marketed to the dairy, swine, poultry and beef industries. Distillers grains contain by-pass protein that is superior to other protein supplements such as cottonseed meal and soybean meal. By-pass proteins are more digestible to the animal, thus generating greater lactation in milk cows and greater weight gain in beef cattle and swine. Distillers grains can also be included in the rations of breeder hens and laying hens which can potentially contain up to 20% and 15% percent distillers grains, respectively.
Approximately 14.5%19.7% of our consolidated revenue was derived from the sale of distillers grains during our fiscal year ended October 31, 2011.2013. Distillers grains sales accounted for approximately 13.0%18.4% and 16.0%14.5% of our consolidated revenue for the fiscal years ended October 31, 20102012 and 2009,2011, respectively.
Corn Oil
In May 2008 the corn oil extraction equipment we installed at our plant became operational. Corn oil is used primarily as a biodiesel feedstock and as a supplement for animal feed. Corn oil sales accounted for approximately 2.5%2.9% of our revenuesconsolidated revenue during our fiscal year ended October 31, 2013 and 2.5% for our fiscal years ended October 31, 20112012 and 2010 and 1% for our fiscal year ended October 31, 2009.2011.
Principal Product Markets
As described below in “Distribution of Principal Products”, we market and distribute all of our ethanol and all of our distillers grains shipped by rail through professional third party marketers. Our ethanol and distillers grains marketers make all decisions with regard to where our products are marketed. Our ethanol and distillers grains are primarily sold in the domestic market. As distillers grains become more accepted as an animal feed substitute throughout the world, distillers grains exporting may increase.
We expect our ethanol and distillers grains marketers to explore all markets for our products, including export markets. However, due to high transportation costs, and the fact that we are not located near a major international shipping port, we expect our products to continue to be marketed primarily domestically.
Distribution of Principal Products
Our ethanol plant is located near Granite Falls, Minnesota in Chippewa County. We selected the Granite Falls site because of its accessibility to road and rail transportation and its proximity to grain supplies. It is served by the TC&W Railway which provides connection to the Canadian Pacific and Burlington Northern Santa Fe Railroads. The completion of our rail loop during our 2012 fiscal year enables us to load unit trains. Our site is in close proximity to major highways that connect to major population centers such as Minneapolis, Minnesota; Chicago, Illinois; and Detroit, Michigan.
The ethanol plant owned by HLBE is located near Heron Lake, Minnesota. That plant is served by the Union Pacific Railroad.
Ethanol Distribution
Eco-Energy, Inc. (“Eco-Energy”) is our ethanol marketer.marketer for both the Granite Falls plant and the HLBE plant. Pursuant to the agreementagreements we have with Eco-Energy, they haveit has agreed to market the entire ethanol output of our ethanol plantplants and to arrange for the transportation of ethanol; however, we are responsible for securing all of the rail cars necessary for the transportation of ethanol by rail.ethanol. We pay Eco-Energy a certain percentage of the FOB plant price in consideration of Eco-Energy's services.
Distillers Grains Distribution
On December 10, 2010 we executed a new distillers grains marketing agreement withSince February 1, 2011, Renewable Products Marketing Group, LLC (“RPMG”). The effective date of this marketing agreement with RPMG was February 1, 2011. has served as the distillers' grains marketer for our Granite Falls plant. Pursuant to this new agreement, RPMG now markets all the distillers grains produced at our Granite Falls plant.
During fiscal 2010, CHS, Inc. (“CHS”) marketed our distillersGavilon Ingredients, LLC serves as the distillers' grains throughout the continental United States. CHS marketedmarketer for HLBE pursuant to an off-take agreement that became effective as of November 1, 2013. Under this agreement, Gavilon Ingredients, LLC purchases all of the distillersdistillers' grains that were shipped by rail fromproduced at our plant. The remainder of our distillers grains product was transported by truck and we had the discretion to designate the portion of the trucked distillers grains marketed by CHS. Granite Falls independently marketed the remainder of its distillers grains, which were shipped from theHeron Lake ethanol plant by truck to livestock producers, exporters and other marketers. Our distillers grains must meet minimum quality feed trade standards.in exchange for a service fee.
Corn Oil Distribution
RPMG is also our corn oil marketer.marketer for both the Granite Falls plant and the HLBE plant. Currently, RPMG markets our corn oil, which is used primarily as a biodiesel feedstock and as a supplement for animal feed. Our corn oil is transported by truck to end users located primarily in the upper Midwest. We pay RPMG a commission based on each pound of corn oil sold by RPMG under the agreement.
New Products and Services
We did not introduce any new products or services during our fiscal year ended October 31, 2011.2013.
Sources and Availability of Raw Materials
Corn Supply
To produce approximately 60 million gallons of undenatured ethanol per year our Granite Falls ethanol plant needs approximately 2021.5 million bushels of corn per year, or approximately 60,000 bushels per day, as the feedstock for its dry milling process. The grain supply for our Granite Falls plant is obtained from the Farmers Cooperative Elevator Company ("FCE"), our exclusive grain procurement agent. Our members are not obligated to deliver corn to our Granite Falls plant. We will be forced to seek alternative corn suppliers if the FCE cannot meet our needs. The term of our agreement with FCE expires in November 2017.
On January 12, 2012,The HLBE ethanol plant requires approximately 18 million bushels of corn per year. HLBE generally does not have long-term, fixed price contracts for the purchase of corn and its members are not obligated to deliver corn to HLBE. Typically, HLBE purchases its corn directly from grain elevators, farmers, and local dealers within approximately 80 miles of Heron Lake, Minnesota.
Drought conditions in the United States Departmentin 2012 negatively impacted corn yields and resulted in increased corn prices. However, in 2013, despite delayed corn planting throughout much of Agriculture (“USDA”) released its Crop Production report, which estimated the 2011 graincorn belt, a record corn crop at 12.36 billion bushels. The January 12, 2012 estimate of the 2011 cornwas harvested. This crop is approximately 1.0% below the USDA's estimate of the 2010 corn crop of 12.45 billion bushels. Corn prices can be volatile as a result of a number of factors, the most important of which are weather, current and anticipated stocks, domestic and exporthas led to decreased prices and supports andabundant supplies of corn. Management does not currently anticipate difficulty in securing the government's current and anticipated agricultural policy. The pricenecessary quantities of corn was volatileneeded for our plants to operate at capacity during our 20112014 fiscal year and we anticipate that it will continue to be volatile in the future. Increases in the price of corn significantly increase our cost of goods sold. If these increases in cost of goods sold are not offset by corresponding increases in the prices we receive from the sale of our products, these increases in cost of goods sold can have a significant negative impact on our financial performance.year.
Although the area surrounding the plant produces a significant amount of corn and we do not anticipate encountering problems sourcing corn, a shortage of corn could develop, particularly if there were an extended drought or other production problem. Poor weatherWe can be a major factor in increasing corn prices. We canattempt to mitigate fluctuations in the corn and ethanol markets by locking in a favorable margin through the use of hedging activities, including forward contracts. We recognize thatHowever, we are not always presented with an opportunity to lock in a favorable margin and that our plant's profitability may be negatively impacted during periods of high grain prices.
Utilities
Natural Gas. Natural gas is a significant input to our manufacturing process. We estimate our natural gas usage at approximately 120,000 million British thermal units (“mmBTU”) per month. We use natural gas to dry our distillers grains product to moisture contents at which it can be stored for long periods and transported greater distances. Our dried distillers grains can then be marketed to broader livestock markets, including poultry and swine markets in the continental United States, and can be shipped to international markets.
WeAt our Granite Falls plant, we pay Center Point Energy/Minnegasco a per unit fee to move the natural gas through the pipeline and have guaranteed to move a minimum of 1,400,000 mmBTU annually through December 31, 2015, which is the ending date of the agreement.
We also have an agreement with U.S. Energy Services, Inc. On our behalf, U.S. Energy Services procures contracts with various natural gas vendors to supply the natural gas necessary to operate the plant. We determined that sourcing our natural gas from a variety of vendors is more cost-efficient than using an exclusive supplier.
At the HLBE plant, we have a facilities agreement with Northern Border Pipeline Company which allows us access to an existing interstate natural gas pipeline located approximately 16 miles north from the plant. Agrinatural Gas, LLC ("Agrinatural Gas"), owned by our subsidiary, HLBE Pipeline Company, LLC, and Rural Energy Solutions, was formed to own and operate the pipeline and transports gas to HLBE pursuant to a transportation agreement. HLBE Pipeline Company, LLC owns 73% of Agrinatural Gas. HLBE also has a base agreement for the sale and purchase of natural gas with Constellation NewEnergy—Gas Division, LLC ("Constellation"). HLBE buys all of its natural gas from Constellation and this agreement runs for a three year period from November 1, 2011 to October 31, 2014.
Electricity. Our plant requiresplants require a continuous supply of 4.5 megawatts of electricity. We have an agreement with Minnesota Valley Electric Cooperative ("MVEC")agreements in place to supply electricity to our plant. Under this agreement, we pay MVEC a monthly base fee plus regular energy and demand charges for electricity delivered to our plant.plants.
Water. We currently obtain the water necessary to operate our plant from the Minnesota River. In addition to an intake structure in the Minnesota River andOur plants also require a water pipeline to the plant from the Minnesota River, we have two ground water wells that provide a redundantcontinuous supply of water to our plant. We also have a water treatment facility to pre-treat the river water we use for operations. The water pipeline and water treatment equipment became operational in February 2007 and the Minnesota River is our primary source of water. In connectionOctober 2013, we finished upgrading the water intake structure for our Granite Falls plant to an adjustable gravity-flow intake system that has been fully operational since November 5, 2013. This followed the removal of a dam located downstream from our previous water intake structure.
HLBE obtains its water pursuant to an industrial water supply agreement with our efforts to obtain permits to increase production at our facility we havethe City of Heron Lake and Jackson County, Minnesota.
implemented a water recycling program that allows our plant to meet certain zero liquid discharge criteria. Recycling our waste water has allowed us to reduce water usage from a rate of 4.0 gallons of water per gallon of ethanol produced to 2.2 gallons of water per gallon of ethanol produced, a 45.0% reduction in water usage.
Xcel Energy is the owner of a dam on the Minnesota River located downstream from our water intake structure. We have been notified that Xcel Energy intends to remove that dam during the summer of 2012. In the event Xcel Energy does proceed with the dam removal, we expect that the water level around our intake structure will be lowered by approximately 15 feet. This change in the pool level would require us to invest capital to upgrade our intake structure to draw water from the Minnesota River. We are encouraging the City of Granite Falls and counties of Yellow Medicine and Chippewa to take public ownership of the dam and to preserve the current pool level for the benefit of area residents, local business, and Granite Falls Energy.
Patents, Trademarks, Licenses, Franchises and Concessions
We do not currently hold any patents, trademarks, franchises or concessions. We were granted a license by ICM to use certain ethanol production technology necessary to operate our ethanol plant. The cost of the license granted by ICM was included in the amount we paid to Fagen, Inc. to design and build our ethanol plant.
Seasonality of Ethanol Sales
We experience some seasonality of demand for our ethanol. Since ethanol is predominantly blended with conventional gasoline for use in automobiles, ethanol demand tends to shift in relation to gasoline demand. As a result, we experience some seasonality of demand for ethanol in the summer months related to increased driving. In addition, we experience some increased ethanol demand during holiday seasons related to increased gasoline demand.
Working Capital
We primarily use our working capital for purchases of raw materials necessary to operate the ethanol plant. The Companyplants. Granite Falls Energy has a Loan Agreement with Minnwest Bank M.V. of Marshall, MN (the “Bank”). Under the Loan Agreement, the Company has a revolving line of credit with United FCS, PCA. CoBank serves as administrative agent for this facility. The line of credit allows the Company to borrow, repay, and reborrow up to $6,000,000 subject to a maximumborrowing base calculation and outstanding letters of $6,000,000 available which iscredit. The line of credit and another credit facility provided by United FCS are secured by substantially all of our assets. As of October 31, 2011, the Company has outstanding letters of credit in the amount of approximately $436,000. These letters of credit reduce the amount availableAmounts borrowed under the revolving line of credit to approximately $5,564,000. Thebear interest at one of three interest rate on the revolving line of credit isoptions selected by us, (i) at 0.25 percentage pointsa variable weekly rate equal to 2.65% above the prime rate as reportedquoted by the Wall Street Journal, withBritish Bankers Association for the offering of one-month U.S. Dollar deposits, (ii) at a minimumfixed rate of 4.5%to be quoted by CoBank, or (iii) at a fixed rate for up to 12 months equal to LIBOR plus 2.65%. AtInterest on amounts borrowed is payable monthly in arrears. As of October 31, 2011,2013, the Company had no outstanding balance on this line of credit.
As of October 31, 2013, the Company had letters of credit totaling approximately $340,000, which reduced the amount available under this facility to $5,660,000.
HLBE has a revolving term note with AgStar Financial Services, PCA ("AgStar") used for working capital purposes. The revolving term note allows HLBE to borrow up to $18.5 million subject to letters of credit outstanding. All of HLBE's assets and real property are subject to security interests and mortgages in favor of AgStar as security for the obligations of the master loan agreement, including the revolving term note. Amounts outstanding on the term revolving loan bear interest at a variable rate equal to the greater of a LIBOR rate plus 3.50% or 5.0%, payable monthly. At October 31, 2013, the revolving term loan carried an interest rate of 5.0%. HLBE also pays an unused commitment fee on the unused portion of the term revolving term loan commitment at the rate of 0.35% per annum, payable in arrears in quarterly installments during the term of the revolving term loan. At October 31, 2013, HLBE had $6.0 million outstanding under the revolving term loan, which does not include a debt premium of approximately $280,000, and an additional $12.5 million was available. The amount available under the revolving term loan is reduced by $2.0 million at October 31 each year until September 2016, when the unpaid balance is due.
Dependence on One or a Few Major Customers
As discussed above, we have an exclusive ethanol marketing agreementagreements with Eco-Energy; andEco-Energy. Additionally, we have agreements with RPMG to market ourall of the distillers grains and corn oil.oil produced at the Granite Falls plant; and agreements with Gavilon and RPMG to market all of the distillers grains and corn oil, respectively, produced at the Heron Lake plant. We rely on Eco-Energy, RPMG and RPMGGavilon for the sale and distribution of all of our products. Therefore, we are highly dependent on Eco-Energy, RPMG and RPMGGavilon for the successful marketing of our products. Any loss of Eco-Energy or RPMGthese companies as our marketing agentagents for our ethanol, distillers grains, or corn oil could have a negative impact on our revenues.
Competition
We are in direct competition with numerous ethanol producers, many of whom have greater resources than we do. While management believes we are a lower cost producer of ethanol, larger ethanol producers may be able to take advantages of economies of scale due to their larger size and increased bargaining power with both customers and raw material suppliers. Following the significant growth in the ethanol industry during 2005 and 2006, the ethanol industry has grown at a much slower pace. As of January 3, 2012,6, 2014, the Renewable Fuels Association ("RFA") estimates that there are 209211 ethanol production facilities in the United States with capacity to produce approximately 14.714.8 billion gallons of ethanol and another 96 plants under expansion or construction with capacity to produce an additional 261165 million gallons.gallons per year. However, the RFA estimates that approximately 3.4%8% of the ethanol production capacity in the United States was not operating as of January 3, 2012. The ethanol industry is continuing to experience a consolidation where a few larger ethanol producers are increasing their production capacities and are controlling a larger portion of United States ethanol production.6, 2014. The largest ethanol producers include
Archer Daniels Midland, POET, Valero Renewable Fuels, and Green Plains Renewable Energy, POET, and Valero Renewable Fuels, each of which are capable of producing significantly more ethanol than we produce.
The following table identifies the largest ethanol producers in the United States along with their production capacities.
U.S. FUEL ETHANOL PRODUCTION CAPACITY BY TOP PRODUCERS
Producers of Approximately 4001,000 million gallons per year (mmgy) or more
|
| | |
| Company | CurrentNameplate Capacity
(mmgy) |
| Archer Daniels Midland | 1,750.01,720.0 |
|
| POET Biorefining | 1,629.0 |
|
| Valero Renewable Fuels | 1,130.0 |
|
| Green Plains Renewable Energy | 740.0 |
|
Aventine Renewable Energy, LLC | 460.01,004.0 |
|
Updated: January 3, 20126, 2014, Renewable Fuels Association
Ethanol is a commodity product where competition in the industry is predominantly based on price. Larger ethanol producers may be able to realize economies of scale in their operations that we are unable to realize. This could put us at a competitive disadvantage to other ethanol producers.
In 2008, Valero Renewable Fuels, which is a subsidiary of a major gasoline refining company, purchased several ethanol plants from the VeraSun Energy bankruptcy auction. Currently, Valero Renewable Fuels owns 10 ethanol plants with capacity to produce approximately 1.1 billion gallons of ethanol annually. This makes Valero Renewable Fuels one of the largest ethanol producers in the United States. Further, since the parent company of Valero Renewable Fuels is a gasoline blender, Valero Renewable Fuels has an established customer for the ethanol it produces which may allow Valero Renewable Fuels to be more competitive in the ethanol industry than we are able. At times when ethanol demand may be lower, it is unlikely that Valero Renewable Fuels will have difficulty selling the ethanol it produces due to the fact that it is a subsidiary of a company that is required to blend a significant amount of ethanol. While Valero is currently the largest oil company which has purchased ethanol production capacity, other large oil companies may follow the lead of Valero in the future. Should other large oil companies become involved in the ethanol industry, it may be increasingly difficult for us to compete. While we believe that we are a lower cost producer of ethanol, increased competition in the ethanol industry may make it more difficult for us to operate the ethanol plant profitably.
We anticipate increased competition from renewable fuels that do not use corn as the feedstock. Many of the current ethanol production incentives are designed to encourage the production of renewable fuels using raw materials other than corn. One type of ethanol production feedstock that is being explored is cellulose. Cellulose is the main component of plant cell walls and is the most common organic compound on earth. Cellulose is found in wood chips, corn stalks, rice straw, amongst other common plants. Cellulosic ethanol is ethanol produced from cellulose. Currently, cellulosic ethanol production technology is not sufficiently advanced to produce cellulosic ethanol on a commercial scale. However, due to government incentives designed to encourage innovation in the production of cellulosic ethanol, we anticipate that commercially viable cellulosic ethanol technology will be developed in the future. Several companies and researchers have commenced pilot projects to study the feasibility of commercially producing cellulosic ethanol.ethanol and some companies have started constructing commercial scale plants. If this technology can be profitably employed on a commercial scale, it could potentially lead to ethanol that is less expensive to produce than corn based ethanol, especially when corn prices are high. Cellulosic ethanol may also capture more government subsidies and assistance than corn based ethanol. This could decrease demand for our product or result in competitive disadvantages for our ethanol production process.
A number of automotive, industrial and power generation manufacturers are developing alternative clean power systems using fuel cells, plug-in hybrids, electric cars or clean burning gaseous fuels. Like ethanol, the emerging fuel cell industry offers a technological option to address worldwide energy costs, the long-term availability of petroleum reserves and environmental concerns. Fuel cells have emerged as a potential alternative to certain existing power sources because of their higher efficiency, reduced noise and lower emissions. Fuel cell industry participants are currently targeting the transportation, stationary power and portable power markets in order to decrease fuel costs, lessen dependence on crude oil and reduce harmful emissions. If the fuel cell industry continues to expand and gain broad acceptance and becomes readily available to consumers for motor vehicle use, we may not be able to compete effectively. This additional competition could reduce the demand for ethanol, which would negatively impact our profitability.
Research and DevelopmentProcess Improvement
We are continually working to develop new methods of operating the ethanol plantplants more efficiently. We continue to conduct research and developmentprocess improvement activities in order to realize these efficiency improvements.
Governmental Regulation and Federal Ethanol Supports
Federal Ethanol Supports
The ethanol industry is dependent on several economic incentives to produce ethanol, including federal tax incentives and ethanol use mandates. One significantprimary federal ethanol support is the Federal Renewable Fuels Standard (the “RFS”). The RFS requires that in each year, a certain amount of renewable fuels must be used in the United States. The RFS is a national program that does not require that any renewable fuels be used in any particular area or state, allowing refiners to use renewable fuel blends in those areas where it is most cost-effective. The RFS requirement increases incrementally each year until the United States is required to use 36 billion gallons of renewable fuels by 2022. Starting in 2009, the RFS required that a portion of the RFS must be met by certain “advanced” renewable fuels. These advanced renewable fuels include ethanol that is not made from corn, such as cellulosic ethanol and biomass based biodiesel. The use of these advanced renewable fuels increases each year as a percentage of the total renewable fuels required to be used in the United States. The RFS requirement for corn-based ethanol, such as the ethanol we produce, is capped at 15 billion gallons starting in 2015. For 2013, the RFS for corn-based ethanol was approximately 13.8 billion
In February 2010,gallons, and the RFS for 2014 for corn-based ethanol was expected to be 14.4 billion gallons. However, the EPA issued new regulations governing the RFS. These new regulations have been called RFS2. The most controversial part of RFS2 involves what is commonly referredhas proposed a significant reduction to as the lifecycle analysis of green house gas emissions. Specifically, the EPA adopted rules to determine which renewable fuels provided sufficient reductions in green house gases, compared to conventional gasoline, to qualify under the RFS, program. RFS2 establishesresulting in an RFS for 2014 of 13.01 billion gallons. Current domestic ethanol production capacity may meet or exceed the current RFS for corn-based ethanol. If the EPA's proposal becomes a tiered approach, where regular renewable fuels are required to accomplish a 20% green house gas reduction compared to gasoline, advanced biofuels and biomass-based biodiesel must accomplish a 50% reduction in green house gases, and cellulosic biofuels must accomplish a 60% reduction in green house gases. Any fuels that fail to meet this standard cannot be used by fuel blenders to satisfy their obligations underfinal rule, or if the RFS program. The scientific method of calculating these green house gas reductions has been a contentious issue. Many inwere to be otherwise reduced or eliminated by the ethanol industry were concerned that corn based ethanol would not meet the 20% green house gas reduction requirement based on certain partsexercise of the environmental impact model that many inEPA's waiver authority or by Congress, the ethanol industry believed was scientifically suspect. However, RFS2 as adopted by the EPA provides that corn-based ethanol from modern ethanol production processes does meet the definition of a renewable fuel under the RFS program. Our ethanol plant was grandfathered into the RFS due to the fact that it was constructed prior to the effective date of the lifecycle green house gas requirement and is not required to prove compliance with the lifecycle green house gas reductions. In addition to the lifecycle green house gas reductions, many in the ethanol industry are concerned that certain provisions of RFS2 as adopted may disproportionately benefit ethanol produced from sugarcane. This could make sugarcane based ethanol, which is primarily produced in Brazil, more competitive in the United States ethanol market. If this were to occur, it could reduce demand for the ethanol that we produce.may be negatively impacted.
Many in the ethanol industry believe that it will be difficult to meet the RFS requirement in future years without an increase in the percentage of ethanol that can be blended with gasoline for use in standard (non-flex fuel) vehicles. Most ethanol that is used in the United States is sold in a blend called E10. E10 is a blend of 10% ethanol and 90% gasoline. E10 is approved for use in all standard vehicles. Estimates indicate that gasoline demand in the United States is approximately 135134 billion gallons per year. Assuming that all gasoline in the United States is blended at a rate of 10% ethanol and 90% gasoline, the maximum demand for ethanol is 13.513.4 billion gallons per year. This is commonly referred to as the “blend wall,” which represents a theoretical limit where more ethanol cannot be blended into the national gasoline pool. This is a theoretical limit because it is believed that it would not be possible to blend ethanol into every gallon of gasoline that is being used in the United States and it discounts the possibility of additional ethanol used in higher percentage blends such as E85 used in flex fuel vehicles. Many in the ethanol industry believe that we will reach this blend wall in 2012, since the RFS requirement for 2012 is 15 billion gallons, much of which will come from ethanol. The RFS requires that 36 billion gallons of renewable fuels must be used each year by 2022, which equates to approximately 27% renewable fuels used per gallon of gasoline sold. In order to meet the RFS mandate and expand demand for ethanol, management believes higher percentage blends of ethanol must be utilized in standard vehicles.
The RFS for 2011 was approximately 14 billion gallons, of which corn based ethanol could be used to satisfy approximately 12 billion gallons. The RFS for 2012 is approximately 15.2 billion gallons, of which corn based ethanol can be used to satisfy approximately 13.2 billion gallons. Current ethanol production capacity exceeds the 2012 RFS requirement which can be satisfied by corn based ethanol.
The United States Environmental Protection AgencyEPA has allowedapproved the use of E15, gasoline which is blended at a rate of 15% ethanol and 85% gasoline, in vehicles manufactured in the model year 20072001 and later. Management believesAlthough many positive steps have been taken at the federal level to bring E15 to market, several states have a regulatory framework that many gasoline retailers will refuse to providemay prevent sales of E15 due toin the fact that not all standard vehicles will be allowed to use E15 and due to the
labeling requirements the EPA may impose. The EPA is considering instituting labeling requirements associated with E15 which may unfairly discourage consumers from purchasing E15. As a result, the approvalshort term. Additionally, sales of E15 may not significantly increase demand for ethanol. In addition to E15, the ethanol industrybe limited because (i) it is pushing the use of an intermediate blend of 12% ethanol and 88% gasoline called E12. Management believes that E12 may be more beneficial to the ethanol industry than E15 because many believe that E12 could benot approved for use in all standard vehicles. Managementvehicles, (ii) the EPA requires a label that management believes this will make it easier formay discourage consumers from using E15, and (iii) retailers may choose not to supply E12 comparedsell E15 due to concerns regarding liability. In addition, different gasoline blendstocks may be required at certain times of the year in order to use E15 unlessdue to federal regulations related to fuel evaporative emissions. This may prevent E15 is approved for usefrom being used during certain times of the year in all standard vehicles. various states. As a result, management believes that E15 may not have an immediate impact on ethanol demand in the United States.
Historically, the ethanol industry has depended onbenefited from the Volumetric Ethanol Excise Tax Credit (“VEETC”). VEETC provides, which provided gasoline blenders with a volumetric ethanol excise tax credit of 45 cents per gallon of ethanol blended with gasoline. However, VEETC expired as of December 31, 2011. The expiration of this tax credit may have a negative impact on the price of ethanol and demand for ethanol in the market due to reduced discretionary blending of ethanol. Discretionary blending is when gasoline blenders use ethanol to reduce the cost of blended gasoline.
Management believes that the expiration of VEETC may effectuate a short term reduction in the demand for ethanol during the first two or three months of calendar year 2012. This may be a result of blenders having blended a disproportionate number of gallons of ethanol at the end of 2011 to take advantage of the VEETC which may curtail demand in early 2012 as those gallons make their way through the blended fuel supply chain. However, dueDue to the RFS, we anticipate that in the longer term the demand for ethanol will continue to mirror the RFS requirement. If the RFS is reduced or eliminated, the decrease in demand for ethanol related to the elimination of VEETC may be more substantial.further reduced.
United States ethanol production was also formerly benefited by a 54 cent per gallon tariff imposed on ethanol imported into the United States. The 54 cent per gallon tariff expired December 31, 2011. In response, ethanol imports into the United States have generally increased. These imports increase supply in the United States, which in turn puts downward pressure on ethanol prices.
Effect of Governmental Regulation
The government's regulation of the environment changes constantly. We are subject to extensive air, water and other environmental regulations and we have been required to obtain a number of environmental permits to construct, expand and operate the plant.plants. It is possible that more stringent federal or state environmental rules or regulations could be adopted, which could increase our operating costs and expenses. It also is possible that federal or state environmental rules or regulations could be adopted that could have an adverse effect on the use of ethanol. Plant operations are governed by the Occupational Safety and Health Administration (“OSHA”). OSHA regulations may change such that the costs of operating the plantplants may increase. Any of these regulatory factors may result in higher costs or other adverse conditions effecting our operations, cash flows and financial performance.
United States ethanol production is currently benefited by a 54 cent per gallon tariff imposed on ethanol imported into the United States. The 54 cent per gallon tariff expired December 31, 2011. This could lead to the importation of ethanol produced in other countries, especially in areas of the United States that are easily accessible by international shipping ports. Ethanol imported from other countries may be a less expensive alternative to domestically produced ethanol and may affect our ability to sell our ethanol profitably.
Environmental Permitting
We are subject to extensive air, water and other environmental regulations and we have been required to obtain a number of environmental permits to construct and operate the plant. As such, any changes that are made to the plant or its operations must be reviewed to determine if amended permits need to be obtained in order to implement these changes.
In June 2009, we submitted an application package to the MPCA to allow the facility to operate at a production rate of 70 million gallons per year of undenatured ethanol. The application submittal required numerous documents covering all aspects of the facility including: Environmental Assessment Worksheet (“EAW”), air modeling, Air Permit, NPDES/SDS permit, Aboveground Storage Tank (“AST”) permit, Construction Stormwater permit, and various other support documentation. The renewal application for the NPDES/SDS permit was also incorporated into this package and resubmitted for MPCA consideration. In the second quarter of fiscal 2011, we obtained an amendment to our environmental permits allowing us to produce up to 70 million gallons of undenatured ethanol on a twelve month rolling sum basis.
We currently have obtained all of the necessary permits to operate the plantplants at itstheir respective permitted rate.rates. In the fiscal year ended October 31, 2011,2013, we incurred costs and expenses of approximately $63,000$164,280 complying with environmental laws, including the cost of pursuing permit amendments. Any retroactive change in environmental regulations, either at the federal or state level, could require us to obtain additional or new permits or spend considerable resources in complying with such regulations.
Employees
As of the date of this report, we have 3775 full time employees. Tenemployees at our two consolidated ethanol plants. Seventeen of these employees are involved primarily in management and administration. The remaining employees are involved primarily in plant operations. We do not currently anticipate any significant change in the number of employees at our plant.
Financial Information about Geographic Areas
All of our operations are domiciled in the United States. All of the products sold to our customers for fiscal years 2011, 20102013, 2012 and 20092011 were produced in the United States and all of our long-lived assets are domiciled in the United States. We have engaged third-party professional marketers who decide where our products are marketed and we have no control over the marketing decisions made by our third-party professional marketers. These third-party marketers may decide to sell our products in countries other than the United States. However, we anticipate that our products will primarily be sold in the United States.
ItemITEM 1A. Risk FactorsRISK FACTORS
You should carefully read and consider the risks and uncertainties below and the other information contained in this report. The risks and uncertainties described below are not the only ones we may face. The following risks, together with additional risks and uncertainties not currently known to us or that we currently deem immaterial could impair our financial condition and results of operation.
The Federal Volumetric Ethanol Excise Tax Credit (“VEETC”) expired on December 31, 2011 and its absence could negatively impact our profitability. The ethanol industry has historically been benefited by VEETC which is a federal excise tax credit of 45 cents per gallon of ethanol blended with gasoline. This excise tax credit expired on December 31, 2011. It is unclear exactly how the absence of this tax credit will affect the ethanol market but it could negatively impact the price we receive for our ethanol and could negatively impact our profitability.
The Secondary Tariff on Imported Ethanol was eliminated in December 2011, and its absence could negatively impact our profitability. The secondary tariff on imported ethanol was allowed to expire in December 2011. Accordingly, it is possible that we could see an increase in ethanol produced in foreign countries being marketed in the Untied States which could negatively impact our profitability. The secondary tariff on imported ethanol was a 54 cent per gallon tariff on ethanol imports from certain foreign countries. If market prices make importing ethanol to the United States profitable for foreign producers, we could see an influx of imported ethanol on the domestic ethanol market which could have a significant negative impact on domestic ethanol prices and our profitability.
Increases in the price of corn may reduce our profitability.Our results of operations and financial condition are significantly affected by the price and supply of corn. Changes in the price and supply of corn are subject to and determined by market forces over which we have little control. Ethanol production requires substantial amounts of corn. Generally, higher corn prices will produce lower profit margins and, therefore, negatively affect our financial performance. If a period of high corn prices were to be sustained for some time, such pricing may reduce our ability to generate income because of the higher cost of operating our plant. This may make ethanol production unprofitable. We may not be able to offset any increase in the price of corn by increasing the price of our products. If we cannot offset increases in the price of corn, our financial performance may be materially and adversely affected.
Risks Relating to Our Business
Increases in the price of corn or natural gas would reduce our profitability. Our primary source of revenue is from the sale of ethanol, distillers grains and corn oil. Our results of operations and financial condition are significantly affected by the cost and supply of corn and natural gas. Changes in the price and supply of corn and natural gas are subject to and determined by market forces over which we have no control, including weather and general economic factors.
Ethanol production requires substantial amounts of corn. Generally, higher corn prices will produce lower profit margins and, therefore, negatively affect our financial performance. If a period of high corn prices were to be sustained for some time, such pricing may reduce our ability to operate profitably because of the higher cost of operating our plant. We may not be able to offset any increase in the price of corn by increasing the price of our products. If we cannot offset increases in the price of corn, our financial performance may be negatively affected.
The prices for and availability of natural gas are subject to volatile market conditions. These market conditions often are affected by factors beyond our control such as higher prices as a result of colder than average weather conditions or natural disasters,
overall economic conditions and foreign and domestic governmental regulations and relations. Significant disruptions in the supply of natural gas could impair our ability to manufacture ethanol and more significantly, dried distillers grains for our customers. Furthermore, increases in natural gas prices or changes in our natural gas costs relative to natural gas costs paid by competitors may adversely affect our results of operations and financial condition. We seek to minimize the risks from fluctuations in the prices of corn and natural gas through the use of hedging instruments. However, these hedging transactions also involve risks to our business. See “Risks Relating to Our Business - We engage in hedging transactions which involve risks that could harm our business.” If we were to experience relatively higher corn and natural gas costs compared to the selling prices of our products for an extended period of time, the value of our units may be reduced.
Declines in the price of ethanol or distillers grains would significantly reduce our revenues. The sales prices of ethanol and distillers grains can be volatile as a result of a number of factors such as overall supply and demand, the price of gasoline and corn prices, levels of government support, and the availability and price of competing products. We are dependent on a favorable spread between the price we receive for our ethanol and distillers grains and the price we pay for corn and natural gas. Any lowering of ethanol and distillers grains prices, especially if it is associated with increases in corn and natural gas prices, may affect our ability to operate profitably. We anticipate the price of ethanol and distillers grains to continue to be volatile in our 20122014 fiscal year as a result of the net effect of changes in the price of gasoline and corn prices and increased ethanol supply offset by increased ethanol demand.year. Declines in the prices we receive for our ethanol and distillers grains will lead to decreased revenues and may result in our inability to operate the ethanol plant profitably for an extended period of time which could decrease the value of our units.
The prices of ethanol and distillers grains may decline as a result of antidumping and antisubsidy investigations being conductedtrade barriers imposed by foreign countries with respect to ethanol and distillers grains originating in the United Sates. An increasing amount of our industry's products are being exported. If producers and exporters of ethanol and distillers grains are subjected to trade barriers when selling products to foreign customers there may be a reduction in the price of these products in the United States. Declines in the price we receive for our products will lead to decreased revenues and may result in our inability to operate the ethanol plant profitably.
We engage in hedging transactions which involve risks that could harm our business. We are exposed to market risk from changes in commodity prices. Exposure to commodity price risk results from our dependence on corn and natural gas in the ethanol production process. We seek to minimize the risks from fluctuations in the prices of corn, natural gas and ethanol through the use of hedging instruments. The effectiveness of our hedging strategies is dependent on the price of corn, natural gas and ethanol and our ability to sell sufficient products to use all of the corn and natural gas for which we have futures contracts. Our hedging activities may not successfully reduce the risk caused by price fluctuation which may leave us vulnerable to high corn and natural gas prices, as well as low ethanol prices.
Our business is not diversified. Our success depends largely on our ability to profitably operate our ethanol plant.plants. We do not have any other lines of business or other sources of revenue if we are unable to operate our ethanol plant and manufacture ethanol and distillers grains. If economic or political factors adversely affect the market for ethanol and distillers grains, we have no other line of business to fall back on. Our business would also be significantly harmed if the ethanol plant could not operate at full capacity for any extended period of time.
We depend on our management and key employees, and the loss of these relationships could negatively impact our ability to operate profitably. We are highly dependent on our management team to operate our ethanol plant.plants. We may not be able to replace these individuals should they decide to cease their employment with us, or if they become unavailable for any other reason. Any loss of these officers and key employees may prevent us from operating the ethanol plant profitably and could decrease the value of our units.
Risks Related to Ethanol Industry
Decreasing gasoline prices may negatively impact the selling price of ethanol which could reduce our ability to operate profitably. The price of ethanol tends to change partially in relation to the price of gasoline. Decreases in the price of ethanol reduce our revenue. Our profitability depends on a favorable spread between our corn and natural gas costs and the price we receive for our ethanol. If gasoline prices fall and ethanol prices fallfollow during times when corn and/or natural gas prices are high, we may not be able to operate our ethanol plant profitably.
We operate in an intensely competitive industry and compete with larger, better financed entities which could impact our ability to operate profitably. There is significant competition among ethanol producers. There are numerous producer-owned and privately-owned ethanol plants planned and operating throughout the Midwest and elsewhere in the United States. We also face competition from outside of the United States. The passage of the Energy Policy Act of 2005 included a renewable fuels
mandate. The RFS was increased in December 2007 to 36 billion gallons by 2022. Further, some states have passed renewable fuel mandates. All of these increases in ethanol demand have encouraged companies to enter the ethanol industry. The largest ethanol producers include Archer Daniels Midland, POET, Valero Renewable Fuels, and Green Plains Renewable Energy, POET, and Valero Renewable Fuels, alleach of which are each capable of producing significantly more ethanol than we produce. Further, many believe that there will be further consolidation occurring in the ethanol industry in the near future, which will likely lead to a few companies who control a significant portion of the ethanol production market. We may not be able to compete with these larger entities. These larger ethanol producers may be able to affect the ethanol market in ways that are not beneficial to us which could negatively impact our financial performance.
Competition from the advancement of alternative fuels may lessen the demand for ethanol. Alternative fuels, gasoline oxygenates and ethanol production methods are continually under development. A number of automotive, industrial and power generation manufacturers are developing alternative clean power systems using fuel cells, plug-in hybrids or clean burning gaseous fuels. Like ethanol, these emerging technologies offer an option to address worldwide energy costs, the long-term availability of petroleum reserves and environmental concerns. Fuel cells have emerged as a potential alternative to certain existing power sources because of their higher efficiency, reduced noise and lower emissions. Fuel cell industry participants are currently targeting the transportation, stationary power and portable power markets in order to decrease fuel costs, lessen dependence on crude oil and reduce harmful emissions. If these alternative technologies continue to expand and gain broad acceptance and become readily available to consumers for motor vehicle use, we may not be able to compete effectively. This additional competition could reduce the demand for ethanol, resulting in lower ethanol prices that might adversely affect our results of operations and financial condition.
Consumer resistance to the use of ethanol based on the belief that ethanol is expensive, adds to air pollution, harms engines and/or takes more energy to produce than it contributes may affect the demand for ethanol. Certain individuals believe that the use of ethanol will have a negative impact on gasoline prices at the pump. ManySome also believe that ethanol adds to air pollution and harms car and truck engines. Still other consumers believe that the process of producing ethanol actually uses more fossil energy, such as oil and natural gas, than the amount of energy that is produced. These consumer beliefs could potentially be wide-spread and may be increasing as a result of recent efforts to increase the allowable percentage of ethanol that may be blended for use in conventional automobiles. If consumers choose not to buy ethanol based on these beliefs, it would affect the demand for the ethanol we produce which could negatively affect our profitability and financial condition.
Sustained negative operating margins may require some ethanol producers to temporarily limit or cease production. Our ability and the ability of other ethanol producers to operate profitably is largely determined by the spread between the price paid for corn and the price received for ethanol. If this spread is narrow or is negative for a sustained period, some ethanol producers may elect to temporarily limit or cease production until their possibility for profitability returns. Although we currently have no plans to limit or cease ethanol production, we may be required to do so if we experience a period of sustained negative operating margins. In such an event, we would still incur certain fixed costs, which would impact our financial performance.
Risks Related to Regulation and Governmental Action
Because federal and state regulation heavily influence the supply of and demand for ethanol, changes in government regulation that adversely affect demand or supply will have a material adverse effect on our business. Various federal and state laws, regulations and programs impact the supply of and demand for ethanol. Some government regulation, for example those that provide economic incentives to ethanol producers, stimulate supply of ethanol by encouraging production and the increased capacity of ethanol plants. Others, such as a federal excise tax incentive program that provides gasoline distributors who blended ethanol with gasoline to receive a federal excise tax rate reduction for each blended gallon they sell, stimulate demand for ethanol by making it price competitive with other oxygenates. Further, tariffs generally apply to the import of ethanol from certain other countries, where the cost of production can be significantly less than in the U.S. These tariffs are designed to increase the cost of imported ethanol to a level more comparable to the cost of domestic ethanol by offsetting the benefit of the federal excise tax program. Tariffs have the effect of maintaining demand for domestic ethanol.
Additionally, the Environmental Protection Agency has established a revised annual renewable fuel standard (RFS2) that sets minimum national volume standards for use of renewable fuels. The RFS2 also sets volume standards for specific categories of renewable fuels: cellulosic, biomass-based diesel and total advanced renewable fuels. While our ethanol does not qualify as one of the new volume categories of renewable fuels, we believe that the overall renewable fuels requirement of RFS2 creates an incentive for the use of ethanol. Other federal and state programs that require or provide incentives for the use of ethanol create demand for ethanol. Government regulation and government programs that create demand for ethanol may also indirectly create supply for ethanol as additional producers expand or new companies enter the ethanol industry to capitalize on demand. In the case of the RFS2, while it creates a demand for ethanol, the existence of specific categories of renewable fuels also creates a demand for these types of renewable fuels and will likely provide an incentive for companies to further develop these products to capitalize on that demand. In these circumstances, the RFS2 may also reduce demand for ethanol in favor of the renewable fuels for which specific categories exist.
There have been proposals in Congress to reduce or eliminate RFS2. Additionally, in November 2013 the Environmental Protection Agency issued a proposed rule that would reduce the RFS2 levels for 2014 from the statutory volume requirement of 18.15 billion gallons to 15.21 billion gallons, and reduce the renewable volume obligations that can be satisfied by corn-based ethanol from 14.4 billion gallons to 13 billion gallons, which is less than the 2013 volume requirement of 13.8 billion gallons. If the Environmental Protection Agency's proposal becomes a final rule, or if RFS2 were to be otherwise reduced or eliminated by the exercise of the Environmental Protection Agency's waiver authority or by Congress, the demand for ethanol may be negatively impacted.
Changes in environmental regulations or violations of the regulations could be expensive and reduce our profitability. We are subject to extensive air, water supply, water discharge and other environmental laws and regulations. In addition, some of these laws require our plant to operate under a number of environmental permits which must be renewed from time to time. These laws, regulations and permits can often require expensive pollution control equipment or operation changes to limit actual or potential impacts to the environment. A violation of these laws and regulations or permit conditions can result in substantial fines, damages, criminal sanctions, permit revocations, permit non-renewals, capital expenditures and/or plant shutdowns. In the future, we may be subject to legal actions brought by environmental advocacy groups and other parties for actual or alleged violations of environmental laws or our permits. Additionally, any changes in environmental laws and regulations, both at the federal and state level, could require us to spend considerable resources in order to comply with future environmental regulations. The expense of compliance could be significant enough to reduce our profitability and negatively affect our financial condition.
ITEM 1B.UNRESOLVED STAFF COMMENTS
This Item is not applicable to Granite Falls Energy because Granite Falls Energy is not an accelerated filer, a large accelerated filer or a well-known seasoned issuer, as those terms are defined in the rules of the Securities and Exchange Commission.
ITEM 2. PROPERTIES.
Our Granite Falls ethanol plant is located on a 56-acre site located approximately three miles east of Granite Falls, Minnesota in Chippewa County at the junction of Highways 212 and 23. The plant's address is 15045 Highway 23 SE, Granite Falls, Minnesota. We produce all of our ethanol, distillers grains and corn oil at this site. The ethanol plant has capacity to producesits on approximately 60 million gallons of ethanol per year. The ethanol plant consists of the following buildings and equipment:
A river water intake structure in the Minnesota River and a water pipeline to the plant from the Minnesota River to provide our primary water supply and two groundwater wells that provide a redundant water supply;
A Cold Lime Softening Water Treatment System for pre-treating the plant's water supply;
A processing216 acres. This site includes an administrative building which contains processing equipment, laboratories, control room, maintenance area and offices;
A grain receiving and shipping building, which contains corn storage silos, distillers grains storage and associated equipment;
A fermentation area comprised principally of four fermentation tanks;
Corn oil extraction equipment;
A mechanical building, which contains the boiler, thermal oxidizer and distillers grains dryers; and
An administrative building, along with furniture and fixtures, office equipment and computer and telephone systems.
serves as our headquarters. The site also contains improvements such as rail tracksincludes corn, ethanol, and a rail spur, landscaping, drainage systems and paved access roads. Our plant was placed in service in November 2005 and is in excellent condition and is capable of functioning at 100 percent of its production capacity. Subsequent to the fiscal year ended October 31, 2011, we entered into contracts to purchase certain real estate in exchange for an aggregate commitment of approximately $3,400,000.
distilers' grains handling facilities. All of our tangible and intangible property, real and personal, serves as the collateral for our $6,000,000 revolving linecredit facilities with United FCS, PCA.
HLBE's ethanol plant is sited on approximately 216 acres of land located near Heron Lake, Minnesota. The site includes corn, coal, ethanol, and distillers' grains storage and handling facilities. Located on these 216 acres is an approximately 7,320 square foot building that serves as HLBE's headquarters. The plant's address is 91246 390th Avenue, Heron Lake, Minnesota 56137-3175. All of HLBE's real property is subject to mortgages in favor of AgStar as security for loan obligations.
Our credit with Minnwest Bank M.V. of Marshall, Minnesota. Our revolving line of credit isfacilities are discussed in more detail under "MANAGEMENT'S DISCUSSION AND ANALYSIS OF FINANCIAL CONDITION AND RESULTS OF OPERATIONS - Indebtedness".
ITEM 3. LEGAL PROCEEDINGS
From time to time in the ordinary course of business, Granite Falls Energy, LLC or its subsidiaries may be named as a defendant in legal proceedings related to various issues, including workers' compensation claims, tort claims, or contractual disputes. We are not currently involved in any material legal proceedings.
ITEM 4. (REMOVED AND RESERVED)MINE SAFETY DISCLOSURES
None.
PART II
ITEM 5. MARKET FOR REGISTRANT'S MEMBERSHIP UNITS,COMMON EQUITY, RELATED MEMBERSTOCKHOLDER MATTERS AND ISSUER PURCHASES OF EQUITY SECURITIES.
There is no public trading market for our units.
However, we have established through Alerus SecuritiesFNC Ag Stock Trade, LLC, a Unit Trading Bulletin Board, a private online matching service, in order to facilitate trading among our members. The Unit Trading Bulletin Board has been designed to comply with federal tax laws and IRS regulations establishing a “qualified matching service,” as well as state and federal securities laws. Our Unit Trading Bulletin Board consists of an electronic bulletin board that provides a list of interested buyers with a list of interested sellers, along with their non-firm price quotes. The Unit Trading Bulletin Board does not automatically affect matches between potential sellers and buyers and it is the sole responsibility of sellers and buyers to contact each other to make a determination as to whether an agreement to transfer units may be reached. We do not become involved in any purchase or sale negotiations arising from our Unit Trading Bulletin Board and have no role in effecting the transactions beyond approval, as required under our operating and member control agreement, and the issuance of new certificates. We do not give advice regarding the merits or shortcomings of any particular transaction. We do not receive, transfer or hold funds or securities as an incident of operating the Unit Trading Bulletin Board. We do not receive any compensation for creating or maintaining the Unit Trading Bulletin Board. In advertising our qualified matching service, we do not characterize Granite Falls Energy as being a broker or dealer or an exchange. We do not use the Unit Trading Bulletin Board to offer to buy or sell securities other than in compliance with the securities laws, including any applicable registration requirements.
There are detailed timelines that must be followed under the Unit Trading Bulletin Board Rules and Procedures with respect to offers and sales of membership units. All transactions must comply with the Unit Trading Bulletin Board Rules, our operating and member control agreement, and are subject to approval by our board of governors.
As of October 31, 20112013, there were approximately 970951 holders of record of our membership units.
The following table contains historical information by fiscal quarter for the past two fiscal years regarding the actual unit transactions that were completed by our unit-holders during the periods specified. We believe this most accurately represents the current trading value of the Company's units. The information was compiled by reviewing the completed unit transfers that occurred on our qualified matching service bulletin board during the quarters indicated.
|
| | | |
| Fiscal Quarter | Low Per Unit Price | | High Per Unit Price |
2010 1st | $850 | | $975 |
2010 2nd | $1,000 | | $1,075 |
2010 3rd | $1,211 | | $1,375 |
2010 4th | $1,200 | | $1,250 |
2011 1st | $1,375 | | $1,375 |
2011 2nd | $1,326 | | $1,500 |
2011 3rd | $1,325 | | $1,425 |
2011 4th | $1,350 | | $1,400 |
|
| | |
| Fiscal Quarter | Low Per Unit Price | High Per Unit Price |
2012 1st | $1,390 | $1,400 |
2012 2nd | $1,405 | $1,500 |
2012 3rd | $1,475 | $1,600 |
2012 4th | $1,525 | $1,575 |
2013 1st | $1,265 | $1,330 |
2013 2nd | $1,200 | $1,551 |
2013 3rd | $1,350 | $1,605 |
2013 4th | $1,310 | $1,925 |
As a limited liability company, we are required to restrict the transfers of our membership units in order to preserve our partnership tax status. Our membership units may not be traded on any established securities market or readily tradetraded on a secondary market (or the substantial equivalent thereof). All transfers are subject to a determination that the transfer will not cause Granite Falls Energy to be deemed a publicly traded partnership.
DISTRIBUTIONS
Distributions by the Company to our unit holders are in proportion to the number of units held by each unit holder. A unit holder's distribution is determined by multiplying the number of units by distribution per unit declared. Our board of governors has complete discretion over the timing and amount of distributions to our unit holders, however, our member control agreement requiresholders. However, GFE's Master Loan Agreement with United FCS, PCA provides that we may not declare any distributions other than, for each fiscal year, one or more distributions up to an aggregate of 75% of the boardnet profit (determined according to GAAP) for such fiscal year; provided that the we are and will remain in compliance with all of governors to endeavor to make cash distributions at such timesthe covenants, terms and in such amounts as will permit our unit holders to satisfy their income tax liability related to owning our units in a timely fashion.conditions of the Master Loan Agreement. Our expectations with respect to our ability to make future distributions are discussed in greater detail in “MANAGEMENT'S DISCUSSION AND ANALYSIS.” We do not currently have any plans to declare a future distribution.
Below is a table representing the cash distributions madedeclared or paid to the members of Granite Falls Energy sinceduring the company commenced operations in 2005. The Company has distributed $1,370 per unit in cashfiscal years ended October 31, 2013, 2012 and 2011, and subsequent to members who have held their investment in Granite Falls Energy since its inception.our fiscal year ended October 31, 2013. Based on the covenants discussed above, all of the below distributions were approved by our lender prior to distribution.
|
| | | | | | | |
| Date Declared to Members of Record: | Total Distribution | Distribution Per Unit | Distributed to Members on: |
| October 27, 2011 | $ | 9,196,800 |
| $ | 300 |
| December 15, 2011 |
| November 23, 2010 | $ | 9,196,800 |
| $ | 300 |
| December 15, 2010 |
| November 19, 2009 | $ | 4,598,400 |
| $ | 150 |
| December 16, 2009 |
| October 19, 2007 | $ | 6,231,200 |
| $ | 200 |
| November 30, 2007 |
| March 15, 2007 | $ | 3,115,600 |
| $ | 100 |
| April 2, 2007 |
| July 10, 2006 | $ | 9,999,830 |
| $ | 320 |
| July 31, 2006 |
|
| | | | | | | |
| Date Declared to Members of Record: | Total Distribution | Distribution Per Unit | Distributed to Members on: |
| December 19, 2013 | $ | 5,509,080 |
| $ | 180 |
| December 31, 2013 |
| October 27, 2011 | $ | 9,196,800 |
| $ | 300 |
| December 15, 2011 |
| November 23, 2010 | $ | 9,196,800 |
| $ | 300 |
| December 15, 2010 |
PERFORMANCE GRAPH
The following graph shows a comparison of cumulative total member return since October 1, 2005,31, 2008, calculated on a dividend reinvested basis, for the Company, the NASDAQ Composite Index (the “NASDAQ”) and an index of other companies that have the same SIC code as the Company (the “Industry Index”). The graph assumes $100 was invested in each of the Company's units, the NASDAQ, and the Industry Index on October 1, 2005.31, 2008. Data points on the graph are annual. Note that historic stock price performance is not necessarily indicative of future unit price performance.
Pursuant to the rules and regulations of the Securities and Exchange Commission, the performance graph and the information set forth therein shall not be deemed to be filed for purposes of Section 18 of the Securities Exchange Act of 1934, and shall not be deemed to be incorporated by reference in any filing under the Securities Act of 1933, as amended, or the Exchange Act, except as shall be expressly set forth by specific reference in such a filing.
ITEM 6. SELECTED FINANCIAL DATA
The following table presents selected consolidated financial and operating data as of the dates and for the periods indicated. Due to the acquisition of a majority ownership of HLBE on July 31, 2013, the following information includes consolidated financial and operating data as of the fiscal year 2013 of Granite Falls and the fourth quarter of fiscal year 2013 of Heron Lake. The selected balance sheet financial data as of October 31, 2009, 20082011, 2010 and 20072009 and the selected statement of operations data and other financial data for the years ended October 31, 20082010 and 20072009 have been derived from our audited financial statements that are not included in this Form 10-K. The selected balance sheet financial data as of October 31, 20112013 and 20102012 and the selected statement of operations data and other financial data for each of the years in the three yearthree-year period ended October 31, 20112013 have been derived from the audited financial statements included elsewhere in this Form 10-K. You should read the following table in conjunction with Item 7 “Management Discussion and Analysis of Financial Condition and Results of Operations” and the consolidated financial statements and the accompanying notes included elsewhere in this Form 10-K. Among other things, those financial statements include more detailed information regarding the basis of presentation for the following consolidated financial data.
The consolidated financial statements consolidate the operating results and financial position of Granite Falls Energy, LLC and its wholly owned subsidiary, Project Viking, L.L.C. ("Project Viking"), which owns 60.8% of Heron Lake BioEnergy, LLC (“HLBE”). The remaining 39.2% ownership of HLBE is included in the consolidated financial statements as a non-controlling interest.
|
| | | | | | | | | | | | | | | | | | | | |
| Statement of Operations Data: | | 2011 | | 2010 | | 2009 | | 2008 | | 2007 |
| Revenues | | $ | 156,521,489 |
| | $ | 95,289,452 |
| | $ | 91,282,031 |
| | $ | 99,393,373 |
| | $ | 94,776,725 |
|
| Cost Goods Sold | | 142,353,416 |
| | 85,146,261 |
| | 87,464,936 |
| | 102,396,467 |
| | 75,772,701 |
|
| Lower of Cost or Market Adjustment | | — |
| | — |
| | — |
| | 1,947,000 |
| | — |
|
| Gross Profit (Loss) | | 14,168,073 |
| | 10,143,191 |
| | 3,817,095 |
| | (4,950,094 | ) | | 19,004,024 |
|
| Operating Expenses | | 2,002,706 |
| | 1,957,742 |
| | 2,045,615 |
| | 2,916,170 |
| | 2,807,130 |
|
| Operating Income (Loss) | | 12,165,367 |
| | 8,185,449 |
| | 1,771,480 |
| | (7,866,264 | ) | | 16,196,894 |
|
| Other Income (Expense) | | 126,489 |
| | 176,863 |
| | (685,300 | ) | | 188,005 |
| | (265,153 | ) |
| Net Income (Loss) | | $ | 12,291,856 |
| | $ | 8,362,312 |
| | $ | 1,086,180 |
| | $ | (7,678,259 | ) | | $ | 15,931,741 |
|
| Weighted Average Units Outstanding - Basic and Diluted | | 30,656 |
| | 30,656 |
| | 30,781 |
| | 31,156 |
| | 31,156 |
|
| Net Income (Loss) Per Capital Unit | | $ | 400.96 |
| | $ | 272.78 |
| | $ | 35.29 |
| | $ | (246.45 | ) | | $ | 511.35 |
|
| Cash Distributions per Capital Unit | | $ | 600.00 |
| | $ | 150.00 |
| | $ | — |
| | $ | — |
| | $ | 300.00 |
|
| | | | | | | | | | |
| Balance Sheet Data: | | 2011 | | 2010 | | 2009 | | 2008 | | 2007 |
| Current Assets | | $ | 27,542,361 |
| | $ | 23,429,993 |
| | $ | 14,015,271 |
| | $ | 9,382,784 |
| | $ | 15,901,679 |
|
| Net Property and Equipment | | 35,898,961 |
| | 36,327,497 |
| | 42,425,018 |
| | 48,648,041 |
| | 54,677,788 |
|
| Other Assets | | — |
| | 10,050 |
| | 32,894 |
| | 35,694 |
| | 38,493 |
|
| Total Assets | | $ | 63,441,322 |
| | $ | 59,767,540 |
| | $ | 56,473,183 |
| | $ | 58,066,519 |
| | $ | 70,617,960 |
|
| Current Liabilities | | 13,680,184 |
| | 3,733,360 |
| | 4,004,077 |
| | 6,108,632 |
| | 10,908,043 |
|
| Long-Term Debt | | — |
| | 171,298 |
| | 370,136 |
| | 445,097 |
| | 518,868 |
|
| Members' Equity | | $ | 49,761,138 |
| | $ | 55,862,882 |
| | $ | 52,098,970 |
| | $ | 51,512,790 |
| | $ | 59,191,049 |
|
| Book Value Per Capital Unit | | $ | 1,623.21 |
| | $ | 1,822.25 |
| | $ | 1,699.47 |
| | $ | 1,653.38 |
| | $ | 1,899.83 |
|
|
| | | | | | | | | | | | | | | | | | | | |
| Statement of Operations Data for the fiscal years ended October 31, | | 2013 | | 2012 | | 2011 | | 2010 | | 2009 |
| Revenues | | $ | 224,100,934 |
| | $ | 175,162,043 |
| | $ | 156,521,489 |
| | $ | 95,289,452 |
| | $ | 91,282,031 |
|
| Cost Goods Sold | | 210,077,621 |
| | 172,708,074 |
| | 142,353,416 |
| | 85,146,261 |
| | 87,464,936 |
|
| Gross Profit | | 14,023,313 |
| | 2,453,969 |
| | 14,168,073 |
| | 10,143,191 |
| | 3,817,095 |
|
| Operating Expenses | | 2,988,583 |
| | 2,449,596 |
| | 2,002,706 |
| | 1,957,742 |
| | 2,045,615 |
|
| Operating Income | | 11,034,730 |
| | 4,373 |
| | 12,165,367 |
| | 8,185,449 |
| | 1,771,480 |
|
| Other Income (Expense) | | (475,957 | ) | | 156,234 |
| | 126,489 |
| | 176,863 |
| | (685,300 | ) |
| Net Income | | 10,558,773 |
| | 160,607 |
| | 12,291,856 |
| | 8,362,312 |
| | 1,086,180 |
|
| Net Income Attributable to Noncontrolling Interest | | 526,752 |
| | — |
| | — |
| | — |
| | — |
|
| Net Income Attributable to Granite Falls Energy, LLC | | $ | 10,032,021 |
| | $ | 160,607 |
| | $ | 12,291,856 |
| | $ | 8,362,312 |
| | $ | 1,086,180 |
|
| Amounts Attributable to Granite Falls Energy, LLC | | | | | | | | | | |
| Weighted Average Units Outstanding - Basic and Diluted | | 30,606 |
| | 30,614 |
| | 30,656 |
| | 30,656 |
| | 30,781 |
|
| Net Income Per Capital Unit | | $ | 327.78 |
| | $ | 5.25 |
| | $ | 400.96 |
| | $ | 272.78 |
| | $ | 35.29 |
|
| Distributions per Capital Unit | | $ | — |
| | $ | — |
| | $ | 600.00 |
| | $ | 150.00 |
| | $ | — |
|
| | | | | | | | | | | |
| Balance Sheet Data at October 31, | | 2013 | | 2012 | | 2011 | | 2010 | | 2009 |
| Current Assets | | $ | 21,469,978 |
| | $ | 20,715,050 |
| | $ | 27,542,361 |
| | $ | 23,429,993 |
| | $ | 14,015,271 |
|
| Net Property, Plant and Equipment | | 88,808,855 |
| | 40,418,082 |
| | 35,898,961 |
| | 36,327,497 |
| | 42,425,018 |
|
| Goodwill | | 1,372,473 |
| | — |
| | — |
| | — |
| | — |
|
| Other Assets | | 1,021,916 |
| | — |
| | — |
| | 10,050 |
| | 32,894 |
|
| Total Assets | | $ | 112,673,222 |
| | $ | 61,133,132 |
| | $ | 63,441,322 |
| | 59,767,540 |
| | 56,473,183 |
|
| Current Liabilities | | 11,323,264 |
| | 6,002,937 |
| | 13,680,184 |
| | 3,733,360 |
| | 4,004,077 |
|
| Long-Term Debt, less current portion | | 32,981,955 |
| | 5,274,870 |
| | — |
| | 171,298 |
| | 370,136 |
|
| Members' Equity: | | | | | | | | | | |
| Members' Equity Attributable to Granite Falls Energy, LLC | | 59,887,346 |
| | 49,855,325 |
| | 49,761,138 |
| | 55,862,882 |
| | 52,098,970 |
|
| Noncontrolling interest | | 8,480,657 |
| | — |
| | — |
| | — |
| | — |
|
| Total Members' Equity | | $ | 68,368,003 |
| | $ | 49,855,325 |
| | $ | 49,761,138 |
| | $ | 55,862,882 |
| | $ | 52,098,970 |
|
| Book Value Per Capital Unit | | $ | 1,956.72 |
| | $ | 1,628.94 |
| | $ | 1,623.21 |
| | $ | 1,822.25 |
| | $ | 1,699.47 |
|
* See Item 7. Management's Discussion and Analysis of Financial Condition and Results of Operations for further discussion of our financial results.
ITEM 7. MANAGEMENT'S DISCUSSION AND ANALYSIS OF FINANCIAL CONDITION AND RESULTS OF OPERATIONS.
This report contains forward-looking statements that involve future events, our future performance and our expected future operations and actions. In some cases you can identify forward-looking statements by the use of words such as “may,” “will,” “should,” “anticipate,” “believe,” “expect,” “plan,” “future,” “intend,” “could,” “estimate,” “predict,” “hope,” “potential,” “continue,” or the negative of these terms or other similar expressions. These forward-looking statements are only our predictions and involve numerous assumptions, risks and uncertainties. Our actual results or actions may differ materially from these forward-looking statements for many reasons, including the reasons described in this report. We are not under any duty to update the forward-looking statements contained in this report. We cannot guarantee future results, levels of activity, performance or achievements. We caution you not to put undue reliance on any forward-looking statements, which speak only as of the date of this report. You should read this report and the documents that we reference in this report and have filed as exhibits, completely and with the understanding that our actual future results may be materially different from what we currently expect. We qualify all of our forward-looking statements by these cautionary statements.
Overview
Granite Falls Energy, LLC (“Granite Falls”Falls Energy” or the “Company”) is a Minnesota Limited Liability Company formed on December 29, 2000.
We are currently producing fuel-grade ethanol, distillers grains and crude corn oil for sale. Our Granite Falls, Minnesota plant has an approximate annual production capacity of 60 million gallons of denatured ethanol. During the second quarter of fiscal 2011, we obtained an amendment to our environmental permits allowing usethanol, but is currently permitted to produce up to 70 million gallons of undenatured ethanol on a twelve month rolling sum basis. We intend to continue working toward increasing production to take advantage of the underutilized capacity ofadditional production allowed pursuant to our plantpermit as long as we believe it is profitable to do so. Any
On July 31, 2013, we indirectly acquired 63.3% of the outstanding membership units of Heron Lake BioEnergy, LLC (“HLBE”) through our purchase of 100% of the membership units of Project Viking, L.L.C. (“Project Viking”), for a total purchase price of $17,024,500. HLBE owns a 50 million gallon per year ethanol plant bottlenecks are assessedlocated in Heron Lake, Minnesota, but is currently permitted to produce up to 59.2 million gallons. Since this acquisition, we converted all of Project Viking's convertible subordinated notes in HLBE to equity. This conversion, combined with other such conversions by third parties and sales of additional equity by HLBE to third parties, resulted in Project Viking's ownership of 60.8% of the outstanding membership units of HLBE as of October 31, 2013. As a cost benefit analysisresult of Project Viking's majority ownership, under HLBE's member control agreement, Project Viking is performedentitled to appoint five (5) of the nine (9) governors to HLBE's board of governors. As part of the acquisition, we entered into a Management Services Agreement with HLBE. Under the Management Services Agreement, we agreed to supply our personnel to act as part-time officers and managers of HLBE for the positions of Chief Executive Officer, Chief Financial Officer, and Commodity Risk Manager. The initial term of the Management Services Agreement is three years. At the expiration of the initial term, the Management Services Agreement will automatically renew for successive one-year terms unless and until either party gives the other party 90 days written notice of termination prior to further capital investment. Our recent de-bottlenecking projects include:
•Modifications to our CO2 scrubber column equipment;
•Modifications to our distillation equipment;
•Installationexpiration of the initial term or the start of a Continuous Emissions Monitoring System (CEMS);
•Installation of a larger sieve feed pump;
•Installation of a fourth mole sieve;
•Addition of a second slurry tank and a third liquefaction tank; and
•Addition of a third hammer mill.renewal term. The Management Services Agreement may also be terminated by either party for cause under certain circumstances.
Our operating results are largely driven by the prices at which we sell our ethanol, distillers grains, and corn oil as well as the other costs related to their production. The price of ethanol has historically fluctuated with the price of petroleum-based products such as unleaded gasoline, heating oil and crude oil. The price of distillers grains has historically been influenced by the price of corn as a substitute livestock feed. We expect these price relationships to continue for the foreseeable future, although recent volatility in the commodities markets makes historical price relationships less reliable. Our largest costs of production are corn, natural gas, depreciation and manufacturing chemicals. Our cost of corn is largely impacted by geopolitical supply and demand factors and the outcome of our risk management strategies. Prices for natural gas, manufacturing chemicals and denaturant are tied directly to the overall energy sector, crude oil and unleaded gasoline.
17
As of the date of this report, we have 37 full time employees. Ten of these employees are involved primarily in management and administration. The remaining employees are involved primarily in plant operations. We do not currently anticipate any significant change in the number of employees at our plant.
Results of Operations for the Fiscal YearYears Ended October 31, 20112013 and 20102012
The following table shows the results of our operations and the approximate percentage of revenues, costs of goods sold, operating expenses and other items to total revenues in our audited statements of operations for the fiscal years ended October 31, 20112013 and 20102012:
| | | | 2011 | | 2010 | 2013 | | | | 2012 | | |
| Income Statement Data | Amount | | % | | Amount | | % | Amount | | % | | Amount | | % |
| Revenue | $ | 156,521,489 |
| | 100.0 | % | | $ | 95,289,452 |
| | 100.0 | % | $ | 224,100,934 |
| | 100.0 | % | | 175,162,043 |
| | 100.0 | % |
| Cost of Goods Sold | 142,353,416 |
| | 90.9 | % | | 85,146,261 |
| | 89.4 | % | 210,077,621 |
| | 93.7 | % | | 172,708,074 |
| | 98.6 | % |
| Gross Profit | 14,168,073 |
| | 9.1 | % | | 10,143,191 |
| | 10.6 | % | 14,023,313 |
| | 6.3 | % | | 2,453,969 |
| | 1.4 | % |
| Operating Expenses | 2,002,706 |
| | 1.3 | % | | 1,957,742 |
| | 2.1 | % | 2,988,583 |
| | 1.3 | % | | 2,449,596 |
| | 1.4 | % |
| Operating Income | 12,165,367 |
| | 7.8 | % | | 8,185,449 |
| | 8.6 | % | 11,034,730 |
| | 4.9 | % | | 4,373 |
| | — | % |
| Other Income, net | 126,489 |
| | 0.1 | % | | 176,863 |
| | 0.2 | % | |
| Other Income (Expense), net | | (475,957 | ) | | (0.2 | )% | | 156,234 |
| | 0.1 | % |
| Net Income | $ | 12,291,856 |
| | 7.9 | % | | $ | 8,362,312 |
| | 8.8 | % | $ | 10,558,773 |
| | 4.7 | % | | $ | 160,607 |
| | 0.1 | % |
| Net Income attributable to Noncontrolling interest | | $ | 526,752 |
| | 0.2 | % | | $ | — |
| | — | % |
| Net Income attributable to Granite Falls Energy, LLC | | $ | 10,032,021 |
| | 4.5 | % | | $ | 160,607 |
| | 0.1 | % |
Revenues
Our revenues from operations come from three primary sources: sales of fuel ethanol, sales of distillers grains and sales of corn oil.
The following table shows the sources of our revenue for the fiscal year ended October 31, 20112013:
| | | Revenue Sources | Amount | | Percentage of Total Revenues | Amount | | Percentage of Total Revenues |
| | | | | | | |
| Ethanol sales | $ | 129,936,624 |
| | 83.0 |
| % | $ | 173,032,042 |
| | 77.2 |
| % |
| Distillers grains sales | 22,745,766 |
| | 14.5 |
| % | 44,137,409 |
| | 19.7 |
| % |
| Corn oil sales | 3,843,725 |
| | 2.5 |
| % | 6,482,239 |
| | 2.9 |
| % |
| Ethanol derivative activity losses | (4,626 | ) | | — |
| % | |
| Other/Miscellaneous | | 449,244 |
| | 0.2 |
| % |
| Total Revenues | $ | 156,521,489 |
| | 100.0 |
| % | $ | 224,100,934 |
| | 100.0 |
| % |
The following table shows the sources of our revenue for the fiscal year ended October 31, 20102012:
|
| | | | | | | |
| Revenue Sources | Amount | | Percentage of Total Revenues |
| | | | |
| Ethanol sales | $ | 81,317,691 |
| | 85.0 |
| % |
| Distillers grains sales | 12,250,393 |
| | 12.5 |
| % |
| Corn oil sales | 1,721,368 |
| | 2.5 |
| % |
| Ethanol derivative activity losses | — |
| | — |
| % |
| Total Revenues | $ | 95,289,452 |
| | 100.0 |
| % |
Revenues |
| | | | | | | |
| Revenue Sources | Amount | | Percentage of Total Revenues |
| | | | |
| Ethanol sales | $ | 138,628,048 |
| | 79.1 |
| % |
| Distillers grains sales | 32,214,496 |
| | 18.4 |
| % |
| Corn oil sales | 4,319,499 |
| | 2.5 |
| % |
| Total Revenues | $ | 175,162,043 |
| | 100.0 |
| % |
We experienced a significant27.9% increase in our revenues for our 20112013 fiscal year compared to our 20102012 fiscal year. Management attributes this increase in revenues primarily to the higher average prices we received for our products during fiscal year 2011 compared to fiscal year 2010 and to a lesser extent an increase in the productionquantities sold as a result of our products. Our volumeindirect acquisition of ethanol soldHLBE, since its results of operations were consolidated into our statements of operations beginning as of our fourth fiscal quarter in 2011 was approximately 7.5% higher than the volume sold in 2010.2013 . For our 20112013 fiscal year, ethanol sales comprised approximately 83.0%77.2% of our revenue, distillers grains comprised approximately 14.5%19.7% of our revenue and corn oil sales comprised approximately 2.9% of our revenue. For our 2012 fiscal year, ethanol sales comprised approximately 79.1% of our revenue, distillers grains comprised approximately 18.4% of our revenue and corn oil sales comprised approximately 2.5% of our revenue. For our 2010 fiscal year, ethanol sales comprised approximately 85% of our revenue, distillers grains comprised approximately 12.5% of our revenue and corn oil sales comprised approximately 2.5% of our revenue.
Ethanol
The average price we received for our ethanol increased by approximately 48.0%remained steady during our 20112013 fiscal year compared to our 20102012 fiscal year. Management attributes this increase in theOur average price we received per gallon of ethanol with higher petroleum pricessold was $2.24 in 2013 and increased ethanol exports during$2.23 in 2012. We also experienced a 24.3% increase in the number of gallons sold in our 2011 fiscal year ended October 31, 2013, primarily as a result of the HLBE acquisition, although we also sold 3.4% more gallons at our Granite Falls plant in fiscal year 2013 compared to the prior year.
Management anticipates that if the U.S. Environmental Protection Agency's ("EPA's") proposed rule reducing Renewable Fuels Standard ("RFS") levels for 2014 from the statutory volume becomes effective, domestic demand for ethanol could decrease and ethanol prices could be volatile during our 2012 fiscal year. Management anticipates industry wide ethanol production in 2012 will be comparable to that of 2011, provided the ethanol industry can maintain current ethanol prices. However, in the event ethanol prices decrease significantly, the industry may be forced to reduce ethanol production if operating margins are unfavorable. Further, our operating margins depend on corn prices which can affect the spread between the price we receive for our ethanol and our raw material costs. In times when this spread decreases or becomes negative, we may reduce or terminate ethanol production until these spreads become more favorable.decrease.
Distillers Grains
We produce distillers grains for sale in two separate forms, distillers dried grains with solubles (DDGS) and modified/wet distillers grains (MWDG). During our 2011 fiscal year, we produced and sold the same ratio of DDGS to MWDS compared to the previous year. Market factors dictate whether we sell more DDGS versus MWDG. We experienced an increase in the average
Distillers grains represent a slightly larger portion of our revenues during our 2013 fiscal year compared to our 2012 fiscal year as a result of higher prices and greater quantities of distillers grains sold. The price we received for our distillers grains both DDGS and MWDG, duringin our 20112013 fiscal year compared towas approximately 7.8% higher than the same period of 2010. We experienced an increase of approximately 76.2% in the average price we received for our dried distillers grains during our 2011 fiscal year compared to our 2010 fiscal year and an increase of approximately 45.3% in the average price we received for our modified/wet distillers grains during the same period. This change is the prices we received for our distillers grains is coupled with an increase of approximately 5.5% in the overall volume of distillers grains sold in 2011 compared to 2010.
Management anticipates demand for distillers grains will remain steady, especially if corn prices trend higher during our 2012 fiscal year. Management believes thatthese higher distillers grains prices could decrease significantly if export demand forare a result of the high price of other feed products available to livestock producers during much of our 2013 fiscal year. More recently, the price of other feed products has decreased in connection with a record 2013 corn harvest. We anticipate that the market price of our distillers grains decreases. This couldwill continue to be especially truevolatile as a result of changes in the summer months whenprice of corn and competing animal feed substitutes such as soybean meal. Volatility in distillers grains demandsupplies related to changes in ethanol production is loweranother factor that may impact the sales price of our distillers grains. Additionally, our quantity of distillers grains sold increased approximately 27.1% in our 2013 fiscal year compared to our 2012 fiscal year. This increase in quantity sold was largely a result of the United States.HLBE acquisition, although we also sold 6.4% more distillers grains at our Granite Falls plant in fiscal year 2013 compared to the prior year. The price and quantity increases, combined with the relatively smaller increases in ethanol prices and quantities discussed above, resulted in distillers grains sales comprising a larger percentage of our total revenues during our 2013 fiscal year relative to our 2012 fiscal year.
Corn Oil
Separating the corn oil from our distillers grains decreases the total tons of distillers grains that we sell,sell; however, our corn oil has a higher per ton value than our distillers grains. The average price we received per pound of corn oil sold during our 20112013 fiscal year was approximately 75.0% greater that8.7% less than the average price received during our 20102012 fiscal year. This increaseManagement attributes the decrease in corn oil prices coupled with an increaseto additional corn oil entering the market. However, increased use of approximately 27.6% in thecorn oil by biodiesel producers and animal feeders have continued to support demand.
Offsetting this price decrease, our volume of corn oil sold causedincreased approximately 64.3% during our annual corn oil revenue2013 fiscal year relative to our 2012 fiscal year as a result of the HLBE acquisition and a 34.8% increase from approximately $1,720,000 in 2010quantities sold at our Granite Falls plant due to approximately $3,840,000increased extraction efficiencies. The net effect of the price decrease and increase in 2011.
Management attributes thisvolume sold was an increase in corn oil pricesrevenue from $4,319,499 in 2012 to increased use of corn oil$6,482,239 in biodiesel production and animal feed. However, management anticipates that corn oil prices may not be sustainable in the future as more corn oil enters the market or if the incentives for biodiesel production are reduced or eliminated. This could negatively impact our corn oil revenue.2013.
Hedging and Volatility of Sales
We occasionally engage in hedging activities with respect to our ethanol sales. We recognize the gains or losses that result from the changes in the value of these derivative instruments in revenues as the changes occur. As ethanol prices fluctuate, the value of our derivative instruments are impacted, which affects our financial performance. We anticipate continued volatility in our revenues due to the timing of the changes in value of theHowever, we did not have any ethanol related derivative instruments relative to the price and volume of the ethanol being hedged. During fiscal 2011, revenue was reduced by approximately $4,600 due to ethanol derivative losses.
other than forward sales contracts as discussed below under "Commodity Price Risk Protection."
Our results of operations for our 20122014 fiscal year will continue to be affected by volatility in the commodity markets. If plant operating margins are negative for an extended period of time, management anticipates that this could impact our liquidity. Management believes the industry will need to continue to grow demand and further develop an ethanol distribution system to facilitate additional blending of ethanol and gasoline to offset oversupply issues within the increased supplyindustry. The EPA's approval of E15 for use in certain vehicles has led us to be optimistic that over time, as E15 is brought to market and gains market acceptance, demand for ethanol will increase. However, we do not anticipate that the marketplace by additional production. Going forward, we are optimistic thatEPA's approval of E15 will impact ethanol demand will continue to grow and ethanol distribution will continue to expand as a resultor pricing in the near term. Additionally, any reduction in or waiver of the positive blend economics that are currently available to the gasoline refiners and blenders.RFS levels may negatively impact demand for ethanol.
Cost of Sales
Our two primary costs of producing ethanol, distillers grains and corn oil are corn costs and natural gas costs. We experienced a significantan increase in our cost of goods sold for our 2011fiscal2013 fiscal year compared to our 20102012 fiscal year. Our cost of goods sold increased to $210,077,621 for our fiscal year ended October 31, 2013 from $172,708,074 in our fiscal year ended October 31, 2012.
Our costs of goods sold as a percentage of revenues were 90.9%93.7% for our fiscal year ended October 31, 20112013 compared to 89.4%98.6% for the same period of 2010.2012. Our two largest costs of production are corn (83.3%(82.5% of cost of goods sold for our fiscal year ended October 31, 20112013) and natural gas (5.0%(4.2% of cost of goods sold for our fiscal year ended October 31, 20112013). Our cost of goods sold increased to $142,353,416 for our fiscal year ended October 31, 2011 from $85,146,261 in our fiscal year ended October 31, 2010. Our per bushel corn costs increased by approximately 84.6% for the year ended October 31, 2011 as compared
to the same period for our 2010 fiscal year. Our increased cost of corn was the primary factor driving up our costs of goods sold. Management anticipates that corn prices will remain high throughout the 2012 fiscal year, especially if domestic corn production is lower than current USDA forecasts. We expect continued volatility in the corn market through 2012 fiscal year.
Corn Costs
We experienced an increase of approximately 96.7%18.5% in the total amount we paid for corn for our 20112013 fiscal year compared to our 20102012 fiscal year. This was the net result of a 26.8% increase was due primarilyin the quantity of bushels we purchased, offset by a 6.6% decrease in our per bushel cost. A tight corn supply following the 2012 harvest put upward pressure on corn prices throughout much of our 2013 fiscal year. However, the record 2013 corn harvest eased prices substantially in our fourth fiscal quarter. Due to the per bushel price2013 harvest, we paid since the volume of corn we used in 2011 was only 6.5% higher than the volume of corn we used in 2010.
Marketexpect corn prices increased during our 2011 fiscal year starting in January 2011 and continuing to remain lower over the beginning of September 2011 when the marketnext several months than what we have experienced a decline in corn prices followed by a stronger corn market during December 2011. Management attributes this increase in corn prices with uncertainty regarding weather factors that resulted in decreased yields in some parts of the United States. Parts of the upper Midwest experienced these lower yields which reduced the amount of corn harvested in the fall of 2011. Management believes that corn prices may continue to increase during the first halffist several months of our 20122013 fiscal year prompting more producers to plant corn as opposed to soybeans.year.
Natural Gas Costs
WeFor our 2013 fiscal year, we experienced a decreasean increase of approximately 47.7% in the average price we paid per MMBtu ofour overall natural gas during our 2011 fiscal yearcosts compared to our 20102012 fiscal year. The average priceThis increase was primarily the result of the HLBE acquisition (approximately $1.8 million, or a 30% increase), although we paid per MMBtu of natural gas during our 2011 fiscal year was approximately 5.7% lower than the average price we paid during our 2010 fiscal year. Management attributes this decreasealso experienced a 15.6% in our natural gas costs with lowerat our Granite Falls plant in fiscal year 2013 compared to the prior year. We expect the market price for natural gas prices due to increasedremain steady in the near term as we continue to enjoy an abundant supply of domestic natural gas, supplies and relatively stabledue in part to the continued commissioning of new, highly productive natural gas demand.
Management anticipates that natural gas prices will remain steady during our 2012 fiscal year unless demand significantly increases due to improved global economic conditions. Management anticipates that our natural gas consumption will be comparable to that of our 2011 fiscal year unless our ethanol and distillers grains production increases significantly as our de-bottlenecking efforts allow us to increase production beyond our current ethanol production rate of approximately 60 million gallons of undenatured ethanol per year.wells.
Hedging and Volatility of Purchases
Realized and unrealized gains and losses related to our corn natural gas, and denaturant derivative instruments resulted in a decreasean increase of approximately $1,275,000$155,563 in our cost of goods sold for our 20112013 fiscal year compared to a decrease of approximately $2,250,000$1,651,799 in our cost of goods sold for our 20102012 fiscal year. We recognize the gains or losses that result from the changes in the value of our derivative instruments related to corn in cost of goods sold as the changes occur. As corn prices fluctuate, the value of our derivative instruments are impacted, which affects our financial performance. We anticipate continued volatility in our cost of goods sold due to the timing of the changes in value of the derivative instruments relative to the cost and use of the commodity being hedged.
Operating Expense
Operating expenses as a percentage of revenues were steady, decreasing from 1.4% of revenues for our fiscal year ended October 31, 2012 to 1.3% of revenues for our fiscal year ended October 31, 2013. We continue to focus on increasing our operating efficiency as we strive to lower our operating expenses. We expect that going forward our operating expenses will remain relatively steady.
Operating Income
Our income from operations for our fiscal year ended October 31, 2013 was 4.9% of our revenues compared to income of a negligible amount of our revenues for our fiscal year ended October 31, 2012. For our fiscal year ended October 31, 2013, we reported operating income of $11,034,730 and for our fiscal year ended October 31, 2012, we had operating income of $4,373.
Other Income (Expense), Net
We had total other expense for our fiscal year ended October 31, 2013 of $475,957, compared to total other income of $156,234 for our fiscal year ended October 31, 2012. We had an increase in interest expense during our fiscal year ended October 31, 2013 compared to the same period of 2012 due to increased borrowings on our credit facilities, including the facilities of HLBE.
Additionally, our other income, net decreased from $182,186 of income for our fiscal year ended October 31, 2012 to $48,373 of expense for our fiscal year ended October 31, 2013.
Results of Operations
Comparison of Fiscal Years Ended October 31, 2012 and 2011
|
| | | | | | | | | | | |
| | 2012 | | | | 2011 | | |
| Income Statement Data | Amount | | % | | Amount | | % |
| Revenues | $ | 175,162,043 |
| | 100.0 | | $ | 156,521,489 |
| | 100.0 |
| Cost of Goods Sold | 172,708,074 |
| | 98.6 | | 142,353,416 |
| | 90.9 |
| Gross Profit | 2,453,969 |
| | 1.4 | | 14,168,073 |
| | 9.1 |
| Operating Expenses | 2,449,596 |
| | 1.4 | | 2,002,706 |
| | 1.3 |
| Operating Income | 4,373 |
| | — | | 12,165,367 |
| | 7.8 |
| Other Income, net | 156,234 |
| | 0.1 | | 126,489 |
| | 0.1 |
| Net Income | $ | 160,607 |
| | 0.1 | | $ | 12,291,856 |
| | 7.9 |
Revenues
The following table shows the sources of our revenue for the year ended October 31, 2012.
|
| | | | | | |
| Revenue Sources | Amount | | Percentage of Total Revenues |
| Ethanol sales | $ | 138,628,048 |
| | 79.1 | % |
| Distillers grains sales | | 32,214,496 |
| | 18.4 | % |
| Corn oil sales | | 4,319,499 |
| | 2.5 | % |
| Total Revenues | $ | 175,162,043 |
| | 100.0 | % |
The following table shows the sources of our revenue for the year ended October 31, 2011:
|
| | | | | | |
| Revenue Sources | Amount | | Percentage of Total Revenues |
| Ethanol sales | $ | 129,936,623 |
| | 83.0 | % |
| Distillers grains sales | | 22,745,766 |
| | 14.5 | % |
| Corn oil sales | | 3,843,726 |
| | 2.5 | % |
| Ethanol derivative activity losses | | (4,626 | ) | | — | % |
| Total Revenues | $ | 156,521,489 |
| | 100.0 | % |
We experienced an 11.9% increase in our revenues for our 2012 fiscal year compared to our 2011 fiscal year. Management attributes this increase in revenues primarily to an increase in the production of our products. Our volume of ethanol sold in 2012 was approximately15.4% higher than the volume sold in 2011. For our 2012 fiscal year, ethanol sales comprised approximately 79.1% of our revenue, distillers grains comprised approximately 18.4% of our revenue and corn oil sales comprised approximately 2.5% of our revenue. For our 2011 fiscal year, ethanol sales comprised approximately 83.0% of our revenue, distillers grains comprised approximately 14.5% of our revenue and corn oil sales comprised approximately 2.5% of our revenue.
Ethanol
The average price we received for our ethanol decreased by approximately 7.5% during our 2012 fiscal year compared to our 2011 fiscal year. Management attributes this decrease in our average ethanol sales price to sustained market oversupply resulting form anticipation of the Federal Volumetric Ethanol Tax Credit "VEETC") on December 31, 2011. In an effort to capture as much of the VEETC as possible, blenders maximized the amount of ethanol they could blend at the end of calendar 2011. As a result of that timing, demand slowed during the beginning of calendar 2012, resulting in increased ethanol inventories, which pressured ethanol prices downward.
Distillers Grains
Distillers grains represent a larger portion of our revenues during our 2012 fiscal year compared to our 2011 fiscal year as a result of higher prices and greater quantities of distillers grains produced and sold. The price we received for our distillers grains in our 2012 fiscal year was approximately 25.2% higher than the price we received during our 2011 fiscal year. Management believes these higher distillers grains prices are a result of the high price of other feed products available to livestock producers. Additionally, our quantity of distillers grains sold increased approximately 13.1% in our 2012 fiscal year compared to our 2011 fiscal year. This increase in quantity sold was largely a result of increased production of our products during our 2012 fiscal year compared to our 2011 fiscal year. The price and quantity increases, combined with the decrease in ethanol prices discussed above, resulted in distillers grains sales comprising a larger percentage of our total revenues during our 2012 fiscal year relative to our 2011 fiscal year.
Corn Oil
The average price we received per pound of corn oil sold during our 2012 fiscal year was approximately 8.9% less than the average price received during our 2011 fiscal year. Management attributes the decrease in corn oil prices to additional corn oil entering the market. However, increased use of corn oil by biodiesel producers and animal feeders have continued to support demand.
Offsetting this price decrease, our volume of corn oil sold increased approximately 23.3% during our 2012 fiscal year relative to our 2011 fiscal year as a result of higher production rates at our facility and increased extraction efficiencies. The net effect of the price decrease and increase in volume sold was an increase in corn oil revenue from $3,843,726 in 2011 to $4,319,499 in 2012.
Cost of Goods Sold and Gross Profit
Our costs of goods sold as a percentage of revenues were 98.6% for our fiscal year ended October 31, 2012 compared to 90.9% for the same period of 2011. Our two largest costs of production were corn (84.7% of cost of goods sold for our fiscal year ended October 31, 2012) and natural gas (3.4% of cost of goods sold for our fiscal year ended October 31, 2012). Our cost of goods sold increased to $172,708,074 for our fiscal year ended October 31, 2012 from $142,353,416 in our fiscal year ended October 31, 2011. Our per bushel corn costs increased by approximately 8.8% for the year ended October 31, 2012 as compared to the same period for our 2011 fiscal year. Additionally, our volume of corn used in our 2012 fiscal year was approximately 13.5% greater as compared to our 2011 fiscal year due to increased production. Our increased cost and volume of corn were the primary factors driving up our costs of goods sold.
Corn Costs
We experienced an increase of approximately 23.5% in the total amount we paid for corn for our 2012 fiscal year compared to our 2011 fiscal year. This increase was primarily due to our increased per bushel cost and volume of corn used discussed above. Widespread drought in 2012 in several corn producing states, combined with continued corn demand from other sectors, resulted in increasing corn prices.
Natural Gas Costs
We experienced a decrease of approximately 15.9% in our overall natural gas costs in our 2012 fiscal year compared to our 2011 fiscal year. Falling natural gas prices decreased our natural gas costs, even though our natural gas consumption rose as a result of our increased ethanol production during our 2012 fiscal year as compared to our 2011 fiscal year.
Hedging
Realized and unrealized gains and losses related to our corn derivative instruments resulted in a decrease of $1,651,799 in our cost of goods sold for our 2012 fiscal year compared to an increase of $1,280,413 in our cost of goods sold for our 2011 fiscal year. We recognize the gains or losses that result from the changes in the value of our derivative instruments related to corn, natural gas, and denaturant in cost of goods sold as the changes occur. As corn, natural gas, and denaturant prices fluctuate, the value of our derivative instruments are impacted, which affects our financial performance. We anticipate continued volatility in our cost of goods sold due to the timing of the changes in value of the derivative instruments relative to the cost and use of the commodity being hedged.
Operating Expenses
Operating Expense
Operating expenses as a percentage were relatively steady for the fiscal year ended October 31, 2011 totaled approximately $2,000,000 for our fiscal years ended October 31, 2011 and 2010.2012 compared to the same period in 2011. Our operating expenses as a percentage of revenues were lower for the fiscal year ended October 31, 2011 when compared to the same period ended October 31, 2010. However, this decrease is primarily due to the extreme increase in our revenues and not an actual reduction in operating expenses. We expect that going forward our operating expenses will remain relatively steady.
Operating Income
Our income from operations for our fiscal year ended October 31, 2011 was 7.8% of our revenues compared to income of approximately 8.6% of our revenues for our fiscal year ended October 31, 2010. For our fiscal year ended October 31, 2011, we reported operating income of $12,165,367 and for our fiscal year ended October 31, 2010, we had operating income of $8,185,449. This increase in our operating income is primarily due to the increases in our crush margins and to a lesser extent the increase in the volume of ethanol produced at our facility.
Other Income and Expense
We had other income for our fiscal year ended October 31, 2011 of $126,489 compared to other income of $176,863 for our fiscal year ended October 31, 2010.
Included in other income and expense is our interest income and expense. Interest expense for the fiscal year ended October 31, 2011, was less that one tenth of one percent of our revenue and totaled $4,358, compared to $10,704 of interest expense for the year ended October 31, 2010. The interest expense incurred during our fiscal year ended October 31, 2011 is attributable to our low interest loan obtained through a local economic development authority and the upfront one percent fee on our letters of credit. On August 26, 2011, the board of governors decided to repay this loan in the amount of approximately $187,000.
Our interest income was steady for our fiscal year ended October 31, 2011 when compared to the same period ended October 31, 2010.
Results of Operations
Comparison of Fiscal Years Ended October 31, 2010 and 2009
|
| | | | | | | | | | | | | |
| | 2010 | | | | 2009 | | |
| Income Statement Data | Amount | | % | | Amount | | % |
| Revenues | $ | 95,289,452 |
| | 100.0 |
| | $ | 91,282,031 |
| | 100.0 |
| Cost of Goods Sold | 85,146,261 |
| | 89.4 |
| | 87,464,936 |
| | 95.8 |
|
| Gross Profit | 10,143,191 |
| | 10.6 |
| | 3,817,095 |
| | 4.2 |
|
| Operating Expenses | 1,957,742 |
| | 2.1 |
| | 2,045,615 |
| | 2.2 |
|
| Operating Income | 8,185,449 |
| | 8.6 |
| | 1,771,480 |
| | 2.0 |
|
| Other Income (Expense) | 176,863 |
| | 0.2 |
| | (685,300 | ) | | (0.8 | ) |
| Net Income | $ | 8,362,312 |
| | 8.8 |
| | $ | 1,086,180 |
| | 1.2 |
|
The following table shows the sources of our revenue for the year ended October 31, 2010.
|
| | | | | | | |
| Revenue Sources | Amount | | Percentage of Total Revenues |
| Ethanol sales | $ | 81,317,691 |
| | 85.3 |
| % |
| Distillers grains sales | | 12,250,393 |
| | 12.9 |
| % |
| Corn oil sales | | 1,721,368 |
| | 1.8 |
| % |
| Total Revenues | $ | 95,289,452 |
| | 100.00 |
| % |
The following table shows the sources of our revenue for the year ended October 31, 2009:
|
| | | | | | | |
| Revenue Sources | Amount | | Percentage of Total Revenues |
| Ethanol sales | $ | 75,081,066 |
| | 82.3 |
| % |
| Distillers grains sales | | 14,931,188 |
| | 16.3 |
| % |
| Corn oil sales | | 1,269,777 |
| | 1.4 |
| % |
| Total Revenues | $ | 91,282,031 |
| | 100.00 |
| % |
Revenues
We experienced an increase in our revenues for our 2010 fiscal year compared to our 2009 fiscal year. Management attributes this increase primarily to increases we experienced in the average prices we received for our ethanol and distillers grains during fiscal year 2010 compared to fiscal year 2009. Our volume of ethanol and distillers grains sold in 2010 was comparable to that sold in 2009. For our 2010 fiscal year, ethanol sales comprised approximately 85% of our revenue, distillers grains comprised approximately 13% of our revenue and corn oil sales comprised less than 2% of our revenue. For our 2009 fiscal year, ethanol sales comprised approximately 82% of our revenue, distillers grains comprised approximately 16% of our revenue and corn oil sales comprised less than 1.5% of our revenue.
Ethanol
The average price we received for our ethanol increased by approximately 8.7% during our 2010 fiscal year compared to our 2009 fiscal year. Management attributes this increase in the average price we received per gallon of ethanol with higher corn prices and increased ethanol exports during our 2010 fiscal year. These increases in ethanol exports and corn prices mostly occurred during our fourth quarter of 2010.
Distillers Grains
We produce distillers grains for sale in two separate forms, distillers dried grains with solubles (DDGS) and modified/wet distillers grains (MWDG). During our 2010 fiscal year, we experienced a slight shift in the mix of distillers grains we sold in the form of DDGS versus MWDG compared to previous years. During our 2010 fiscal year, we sold approximately 97% of our total distillers grains in the form of DDGS and approximately 3% of our total distillers grains in the form of MWDG. During our 2009 fiscal year, we sold approximately 89% of our total distillers grains in the form of DDGS and approximately 11% of our total distillers grains in the form of MWDG. Management attributes this shift in the mix of our distillers grains sales with an increase in export demand for distillers grains during our 2010 fiscal year compared to our 2009 fiscal year. As more of our distillers grains are shipped outside of our local market, we sell more of our distillers grains in the dried form since it is less expensive to ship DDGS and the shelf life of DDGS is much longer than MWDG. Market factors dictate whether we sell more DDGS versus MWDG. We also experienced a decrease in the average prices we received for our distillers grains, both DDGS and MWDG, during our 2010 fiscal year compared to the same period of 2009. We experienced a decrease of approximately 30.4% in the average price we received for our distillers grains during our 2010 fiscal year compared to our 2009 fiscal year.
Corn Oil
Our 2009 fiscal year was the first fiscal year in which we produced and sold corn oil during each fiscal quarter. Separating the corn oil from our distillers grains results in decreased revenue from our distillers grains due to the decrease in the total tons of distillers grains that wesell, thereby decreasing our distillers grains revenue. However, our corn oil has a higher per ton value than our distillers grains. The average price we received per pound of corn oil sold during our 2010 fiscal year was approximately 29% greater compared to our 2009 fiscal year.
During our 2010 fiscal year, we experienced an increase in the total pounds of corn oil we sold of approximately 5% compared to our 2009 fiscal year. We produced more corn oil during our 2010 fiscal year compared to our 2009 fiscal year due to increased functionality of the corn oil extraction equipment.
Cost of Goods Sold and Gross Profit
Our two primary costs of producing ethanol, distillers grains and corn oil are corn costs and natural gas costs. We experienced a decrease in our cost of goods sold for our 2010 fiscal year compared to our 2009 fiscal year.
Corn Costs
Our largest cost associated with the production of ethanol, distillers grains and corn oil is corn costs. We experienced an increase in the total amount we paid for corn of approximately 2% for our 2010 fiscal year compared to our 2009 fiscal year. This was due primarily to the per bushel price we paid since the volume of corn we used in 2010 was comparable to 2009.
Market corn prices increased during our 2010 fiscal year starting in July and continuing into the middle of November 2010. Management attributes this increase in corn prices with uncertainty regarding weather factors that resulted in decreased yields in some parts of the United States. Parts of Iowa experienced these lower yields which reduced the amount of corn harvested in the fall of 2010. This led to fears regarding an imbalance between corn supply and demand, which had a negative impact on corn prices. While corn prices decreased from the middle of November until the end of November, corn prices have since increased significantly. Management believes that the corn market was correcting in November following the corn price increases during the fall of 2010.
Natural Gas Costs
We experienced a significant decrease in the average price we paid per MMBtu of natural gas during our 2010 fiscal year compared to our 2009 fiscal year. The average price we paid per MMBtu of natural gas during our 2010 fiscal year was approximately 30% lower than the average price we paid during our 2009 fiscal year. Management attributes this decrease in our natural gas costs with lower market natural gas prices due to increased natural gas supplies and relatively stable natural gas demand.
Hedging
Realized and unrealized gains and losses related to our corn, natural gas, and denaturant derivative instruments resulted in a decrease of approximately $2,233,000 in our cost of goods sold for our 2010 fiscal year compared to an increase of approximately $282,000 in our cost of goods sold for our 2009 fiscal year. We recognize the gains or losses that result from the changes in the value of our derivative instruments related to corn, natural gas, and denaturant in cost of goods sold as the changes occur.
Operating Expenses
Operating expenses1.4% for the fiscal year ended October 31, 2010 totaled approximately $1,958,000, a decrease from approximately $2,046,0002012 and 1.3% for the same period of 2009. This decrease in operating expenses is primarily due to increased operating efficiencies and a concerted effort by management and staff to lower our operating expenses.ended October 31, 2011.
Other Income, (Expense)Net
We had other income, duringnet for our 2010 fiscal year ended October 31, 2012 of $156,234 compared to other expense duringincome of $126,489 for our 2009 fiscal year. We had moreyear ended October 31, 2011. Our other income, net increased from $37,281 for our fiscal year ended October 31, 2011 to $182,186 for our fiscal year ended October 31, 2012 primarily as a result of income related to land rent and other miscellaneous income.
Our interest income duringwas lower for our 2010 fiscal year ended October 31, 2012 compared to our 2009 fiscal year due tothe same period of 2011 as a result of having moreless cash on hand during the 20102012 period. We experienced an increase in otherOur interest expense (net)was greater for our 2009 fiscal year primarily asended October 31, 2012 compared to the same period of 2011 due to the note we took to purchase a result of paying approximately $780,000 to Aventine Renewable Energy, Inc. as a termination fee we incurredShuttlewagon Railcar Mover in connection with the termination of our ethanol marketing agreement during our fiscal quarter ended January 31, 2009.December 2011.
Changes in Financial Condition for the Fiscal Year Ended October 31, 20112013 and 20102012
The following table highlights the changes in our financial condition for the fiscal year ended ended October 31, 20112013 from our previous fiscal year ended October 31, 20102012:
| | | | October 31, 2011 | | October 31, 2010 | October 31, 2013 |
| | October 31, 2012 |
| Current Assets | $ | 27,542,361 |
| | $ | 23,429,993 |
| $ | 21,469,978 |
| | $ | 20,715,050 |
|
| Total Assets | | $ | 112,673,222 |
| | $ | 61,133,132 |
|
| Current Liabilities | $ | 13,680,184 |
| | $ | 3,733,360 |
| $ | 11,323,264 |
| | $ | 6,002,937 |
|
| Long-Term Debt | $ | — |
| | $ | 171,298 |
| $ | 32,981,955 |
| | $ | 5,274,870 |
|
| Members' Equity | $ | 49,761,138 |
| | $ | 55,862,882 |
| |
| Members' Equity attributable to Granite Falls Energy, LLC | | $ | 59,887,346 |
| | $ | 49,855,325 |
|
| Noncontrolling Interest | | $ | 8,480,657 |
| | $ | — |
|
Total assets were approximately $63,441,000$112,673,222 at October 31, 20112013 compared to approximately $59,768,000$61,133,132 at October 31, 20102012. This increase in total assets is, primarily as a result of a more inventory on hand for the fiscal year ended of our 2011 fiscal year compared to October 31, 2010. Also includedan increase in our total assets this period is approximately $367,000 in construction in progress. This is down from approximately $746,000 at October 31, 2010. Our construction in progress isproperty, plant and equipment related to the de-bottlenecking process we are implementing at our plant as we move toward an increased annual run rate.indirect acquisition of majority ownership of HLBE. As of the datea result of this reportacquisition, our de-bottlenecking activitiesassets now also include the addition of a fourth mole sieve, a third hammer mill, a third liquefaction tank$1,372,473 in goodwill and a second slurry tank.$1,021,916 in other assets.
Current assets totaled approximately $27,540,000$21,469,978 at October 31, 20112013, which is more than our current assets as of October 31, 20102012 which totaled approximately $23,430,000.$20,715,050. The increase is primarily due to an increase in cash and prepaid expenses and other current assets, offset slightly by a decrease in accounts receivable.
Total current liabilities increased and totaled approximately $13,680,000$11,323,264 at October 31, 20112013 and $3,733,360approximately $6,002,937 at October 31, 20102012. This change isincrease was primarily due to our distribution payable in the amount of approximately $9,200,000. Long term debt decreased from approximately $171,300 at October 31, 2010 to $0 at October 31, 2011 as we paid off our EDA loan.
Changes in Financial Condition for Fiscal Years Ended October 31, 2010 and 2009
Our current assets were 67% higher at October 31, 2010 compared to October 31, 2009. We had more cash and inventory on hand on October 31, 2010 compared to October 31, 2009. We were accumulating cash in anticipation of paying a distribution to our members after the conclusion of our fiscal year ended October 31, 2010. In November 2010, we declared a distribution of approximately $9,200,000, which was paid out to our members in December 2010.
The asset value of our property and equipment was lower at October 31, 2010 compared to October 31, 2009 as a result of an increase in accumulated depreciation.the current portion of our long-term debt and and increase in our corn payable to FCE.
Long-term debt totaled $32,981,955 at October 31, 2013 which is more than our long-term debt as of October 31, 2012 which totaled $5,274,870. The increase was primarily the result of the consolidation of HLBE’s debt facilities due to the indirect acquisition of a majority ownership of HLBE during the year.
Members’ equity attributable to Granite Falls Energy, LLC totaled $59,887,346 at October 31, 2013 which is more than our Members’ equity attributable to Granite Falls Energy, LLC as of October 31, 2012 which totaled $49,855,325. The increase was directly related to the net income attributable to Granite Falls Energy, LLC of $10,032,021 for the year ended October 31, 2013.
Noncontrolling interest totaled $8,480,657 at October 31, 2013 compared to $0 at October 31, 2012. This is directly related to recognition of the 36.6% noncontrolling interest in HLBE at the date of the GFE acquisition along with the issuance of subsidiary units and net income attributable to the noncontrolling interest during the fourth quarter of fiscal 2013.
Our current liabilities were 6.7% lower at October 31, 2010 compared to October 31, 2009. This is primarily due to a reduction in the amount outstanding on derivative instruments.
Our long-term liabilities at October 31, 2010 were approximately $171,000 compared to approximately $370,000 at October 31, 2009, primarily as a result of our scheduled payments on these obligations.
Plant Operations
We are currently producing fuel-grade ethanol, distillers grains and crude corn oil for sale. Our Granite Falls plant has an approximate annual production capacity of 60 million gallons of denatured ethanol. During the second quarter of fiscal 2011, weWe have obtained an amendment to our environmental permits allowing us to produce up to 70 million gallons of undenatured ethanol on a twelve month rolling sum basis. WeOur Heron Lake plant has an approximate annual production capacity of 50 million gallon per year, but is currently permitted to produce up to 59.2 million gallons.We intend to continue working to increase production to take advantage of the underutilized capacity of our plant.plants. Any plant bottlenecks are assessed and a cost benefit analysis is performed prior to further capital investment.
Our recentWe have completed several de-bottlenecking projects include:
•Modifications toat our CO2 scrubber column equipment;
•Modifications toGranite Falls plant and we are in the process of completing our distillation equipment;
•Installation of a Continuous Emissions Monitoring System (CEMS);
•Installation of a larger sieve feed pump;
•Installation of a fourth mole sieve;
•Addition of a second slurry tank and a third liquefaction tank; and
•Addition of a third hammer mill.
remaining projects. Each of these projects helphelps our facility to be more efficient, productive and improve the environmental aspects of our process. As ofFor the fiscal year ended October 31, 20112013, we have incurred approximately $4,000,000$1,342,000 in costs associated with our equipment construction projects. Since starting our de-bottlenecking projects we have incurred approximately $6,477,000 associated with the cost of these equipment improvements.
We expect to have sufficient cash generated by continuing operations, current lines of credit and cash reserves to cover our usual operating costs, which consist primarily of our corn supply, ourand natural gas supply, de-bottlenecking projects, staffing expense,and office expense, audit and legal compliance, working capital costs and debt service obligations.
Trends and Uncertainties Impacting the Ethanol and Distillers Grains Industries and Our Future Revenues
Our revenues primarily consist of sales of the ethanol and distillers grains we produce; however, we also realize revenue from the sale of corn oil we separate from our distillers syrup. The ethanol industry needs to continue to expand the market for ethanol and distillers grains in order to maintain current price levels.
The following chart shows the generalaverage cash price information released byper gallon of ethanol in the United States from December 2011 through October 2013, as compiled with data from the USDA in their National Weekly Energy Round-Up Report for ethanol through December 2011.Agricultural Statistics Service.
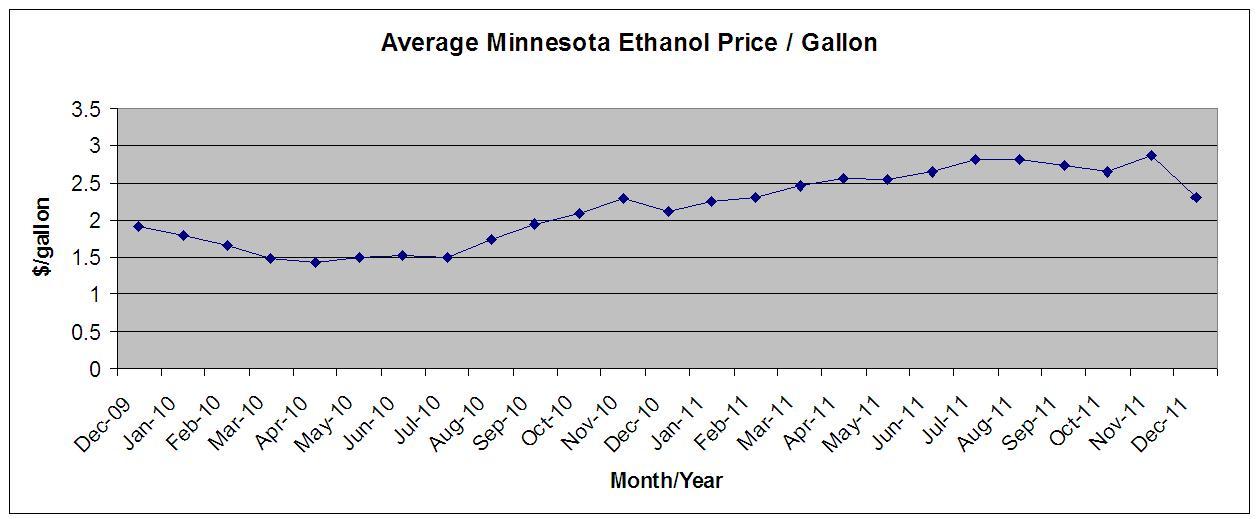

According to the Renewable Fuels Association (“RFA”), as of January 3, 2012,6, 2014, there were 209211 ethanol plants nationwide with the capacity to produce approximately 14.714.8 billion gallons of ethanol annually. The RFA estimates that plants with an annualthe operating production capacity ofnationwide is approximately 14.213.6 billion gallons are currently operatingof ethanol annually and that approximately 3.4%8% of the nameplate production capacity is not currently operational. Management believes the production capacity of the ethanol industry is greater than ethanol demand which may begincontinue to depress ethanol prices. This overcapacity issue may be exacerbated by increased VEETC
production from plants that had previously slowed their rate of production or idled altogether due to poor operating margins.
Currently, ethanol is primarily blended with conventional gasoline for use in standard (non-flex fuel) vehicles to create a blend which is 10% ethanol and 90% conventional gasoline. Estimates indicate that approximately 135 billion gallons of gasoline are sold in the United States each year. However, gasoline demand may be shrinking in the United States as a result of the global economic slowdown and improved fuel efficiency. Assuming that all gasoline in the United States is blended at a rate of 10% ethanol and 90% gasoline, the maximum demand for ethanol is 13.5 billion gallons. This is commonly referred to as the “blend wall”, which represents a limit where more ethanol cannot be blended into the national gasoline pool. This is a theoretical limit since it is believed it would not be possible to blend ethanol into every gallon of gasoline that is used in the United States and it discounts higher percentage blends of ethanol such as E15 and E85 used in flex fuel vehicles. In April 2012, the U.S. Environmental Protection Agency ("EPA") approved the first applications for registering ethanol for use in making E15. As E15 is brought to market and gains market acceptance, management believes that demand for ethanol will increase. However, we do not expect the EPA's acceptance of applications for registering ethanol for use in making E15 to impact ethanol demand or pricing in the near term.
The United States ethanol industry is exportinghas exported an increasing amount of ethanol. The Company'sGranite Falls Energy, through the use of its ethanol marketer, recently began to exporthas exported a portion of its ethanol. The Company recently obtained a Distilled Spirits Permit ("DSP") and the certificate of compliance withethanol production to the European Union's Renewable Energy Directive ("RED"), both of which are required for the Company's ethanol to be eligible for export at maximum prices.market. The exportation of domestic ethanol has helped to mitigate the effects of the blend wall and has thereby helped to maintain ethanol price levels. We are excited to be participating in the export market, but would prefer that all of our domestically produced fuel could be utilized by the domestic market. Whether the export market continues to make economic sense for Granite Falls Energy will depend on domestic blend rates as well as global supply and demand for our product.
The federal Renewable Fuels Standard, known as RFS2, requires the use of a specified amount of renewable fuels in the United States. In 2013, RFS2 required approximately 16.55 billion gallons, of which corn based ethanol could be used to satisfy approximately 13.8 billion gallons. If the mandate is not changed, in 2014, the RFS2 will require approximately 18.15 billion gallons, of which corn based ethanol can be used to satisfy approximately 14.4 billion gallons. However, in November 2013 the EPA issued a proposed rule that would reduce the RFS2 levels for 2014 from the statutory volume requirement of 18.15 billion gallons to 15.21 billion gallons, and reduce the renewable volume obligations that can be satisfied by corn-based ethanol from 14.4 billion gallons to 13 billion gallons, which is less than the 2013 volume requirement of 13.8 billion gallons. If the EPA's proposal becomes a final rule, or if RFS2 were to be otherwise reduced or eliminated by the exercise of the EPA's waiver authority or by Congress, the demand for ethanol may be negatively impacted.
Trends and Uncertainties Impacting the Corn and Natural Gas Markets and Our Future Cost of Goods Sold
Our costs of our goods sold consist primarily of costs relating to the corn and natural gas supplies necessary to produce ethanol and distillers grains for sale. We grind approximately 1,700,0001,800,000 bushels of corn each month.month at the Granite Falls plant and approximately 1,640,000 bushels of corn each month at the Heron Lake plant. For the fiscal year ended October 31, 20112013, our average cost of corn per bushel, net of hedging activity, was approximately 85.0% higher$0.454 lower than our per bushel cost of corn for the same period ended October 31, 20102012.
The market price ofCorn prices remain above historical averages. A widespread drought during the 2012 growing season in several corn started to increase during January 2011 and hasproducing states, combined with continued to rise through the first of September 2011. Management attributes this increasecorn demand from other sectors, resulted in increasing corn prices with uncertainty regarding an imbalance betweenfor much of our 2013 fiscal year. However, the 2013 corn supply and demand. Management anticipates that corn prices will continueharvest set domestic records for bushels harvested. This led to be volatile and will be subject to weather factors that may influencea decrease in corn prices during the 2012 growing season. On January 12, 2012fourth fiscal quarter of our 2013 fiscal year. We expect corn prices to remain comparatively lower during the USDA forecast domesticnext several months. If corn production to be 12.36 billion bushes, down 1 percent from 2010. Ifprices increase again, and if a period of high corn prices were to be sustained for some time, such pricing may reduce our ability to generate income because of the higher cost of operating our plant.
Natural gas is also an important input commodity to our manufacturing process. Our natural gas usage is approximately 120,000 million British thermal units (mmBTU) per month.month at the Granite Falls plant and approximately 138,000 mmBTU per month at the Heron Lake plant. We continue to work to find ways to limit our natural gas price risk through efficient usage practices, research of new technologies, and pricing and hedging strategies. We use a marketing firm and an energy consultant for our natural gas procurement and will work with them on an ongoing basis to mitigate our exposure to volatile gas prices.
Management anticipates that natural gas prices will be relatively stable in the next several months as a result of ample amount of gas in the supply chain. However, should we experience any natural gas supply disruptions, including disruptions from hurricane activity, we may experience significant increases in natural gas prices.
Compliance with Environmental Laws
We are subject to extensive air, water and other environmental regulations and we have been required to obtain a number of environmental permits to construct and operate the plant. As such, any changes that are made to the plant or its operations must be reviewed to determine if amended permits need to be obtained in order to implement these changes.
Contracting Activity
Farmers Cooperative Elevator Company supplies corn to our corn.Granite Falls plant. We do not have an exclusive corn supplier for the Heron Lake plant. Eco-Energy, LLC markets our ethanol at both plants and RPMG markets our distillers grains at the Granite Falls plant and our corn oil.oil at both plants. Gavilon markets our distillers grains at the Heron Lake plant. Each of these contracts is critical to our success and we are very dependent on each of these companies. Accordingly, the financial stability of these partners is critical to the successful operation of our business.
We independently market a small portion of our ethanol production as E-85 to local retailers.
Commodity Price Risk Protection
We seek to minimize the risks from fluctuations in the prices of corn, ethanol, denaturant and natural gas through the use of derivative instruments. In practice, as markets move, we actively manage our risk and adjust hedging strategies as appropriate. Although our risk management strategy accomplishes our goal of an economic hedge, weWe do not use hedge accounting which would match the gain or loss on our hedge positions to the specific commodity contracts being hedged. Instead, we are using fair value accounting for our hedge positions, which means that as the current market price of our hedge positions changes, the gains and losses are immediately recognized in our revenue or cost of goods sold.sold depending on the commodity that is hedged. The immediate recognition of hedging gains and losses under fair value accounting can cause net income to be volatile from quarter to quarter due to the timing of the change in value of the derivative instruments relative to the cost and use of the commodity being hedged.
As of October 31, 2011, the fair values of our derivative instruments are reflected as net assets in the amount of $404,050 As of October 31, 20102013, we recorded a net assetliability for our derivative instruments in the amount of $752,500.$75,113. As of October 31, 2012, we recorded a net liability for our derivative instruments in the amount of $45,563. There are several variables that could affect the extent to which our derivative instruments are impacted by fluctuations in the price of corn, ethanol, denaturant or natural gas. However, it is likely that commodity cash prices will have the greatest impact on the derivative instruments with delivery dates nearest the current cash price. As we move forward, additional protection may be necessary. As the prices of these hedged commodities move in reaction to market trends and information, our statement of operations will be affected depending on the impact such market movements have on the value of our derivative instruments. Depending on market movements, crop prospects and weather, these price protection positions may cause immediate adverse effects, but are expected to produce long-term positive growth for Granite Falls.Falls Energy.
As of October 31, 20112013, weGFE had entered into derivative instrumentsforward contracts to hedge 2,580,000 bushelssell approximately $6,283,000 of our future corn purchasesethanol for various periods through December 2013. GFE also had forward contracts to sell approximately $3,052,000 of distillers grains for delivery through March 2012. This includes 500,0002014 as of October 31, 2013.
As of October 31, 2013, GFE had approximately 350,000 bushels of fixed basis contracts for forward corn purchase commitments through December 2011 and 460,000 bushels of stored corn totaling $2,862,550 with FCE that is includedfor delivery in inventory . TheseNovember 2013. Through these contracts we hope to minimize risk from future market price fluctuations ansand basis fluctuations.
As of October 31, 20112013, weGFE had price protection in place for approximately 56.7% of ourno forward purchase contracts to purchase natural gas needs through March 2012.gas. As we move forward, we may determine that additional price protection for natural gas purchases is necessary to reduce our susceptibility to price increases. However, we may not be able to secure natural gas for prices less than current market price and we may not recover high costs of production resulting from high natural gas prices, which may raise our costs of production and reduce our net income.
As of October 31, 2013, HLBE did not have any ethanol or corn derivative instruments. HLBE had natural gas agreements with a minimum commitment of approximately 1.6 million MMBTU per year until October 31, 2014.
The derivative accounts are reported at fair value. We have categorized the cash flows related to the hedging activities with cash provided by operations, in the same category as the item being hedged. We expect substantially all of our hedge positions outstanding as of October 31, 2011 to be realized and recognized by December 2011.
Critical Accounting Estimates
Management uses estimates and assumptions in preparing our financial statements in accordance with generally accepted accounting principles. These estimates and assumptions affect the reported amounts of assets and liabilities, the disclosure of contingent assets and liabilities, and the reported revenues and expenses. Of the significant accounting policies described in the notes to our financial statements, we believe that the following are the most critical:
Inventory
We value our inventory at the lower of cost or market. Our estimates are based upon assumptions believed to be reasonable, but which are inherently uncertain and unpredictable. These valuations require the use of management’s assumptions which do not reflect unanticipated events and circumstances that may occur. In our analysis, we consider future corn costs and ethanol prices, break-even points for our plant and our risk management strategies in place through our use of derivative instruments. Given the significant assumptions required and the possibility that actual conditions will differ, we consider the valuation of the lower of cost or market on inventory to be a critical accounting estimate.
Property, Plant and Equipment
Management’s estimate of the depreciable lives of property, plant, and equipment is based on the estimated useful lives. We review long-lived assets for impairment whenever events or changes in circumstances indicate that the related carrying amounts may not be recoverable. Impairment testing for assets requires various estimates and assumptions, including an allocation of cash flows to those assets and, if required, an estimate of the fair value of those assets. Given the significant assumptions required and the possibility that actual conditions will differ, we consider the assessment of the useful lives of property and equipment to be a
critical accounting estimate.
Accounting for Business Combinations
In accounting for business combinations, we apply the accounting requirements of ASC 805, “Business Combinations,” (“ASC 805”), which requires the recording of net assets of acquired businesses at fair value. In developing estimates of fair value of acquired assets and assumed liabilities, we analyze a variety of factors including market data, estimated future cash flows of the acquired operations, industry growth rates and assumptions for certain future commodity prices. Such a valuation requires management to make significant estimates and assumptions, especially with respect to the future commodity prices.
In determining the fair value of the Company’s assets associated with the purchase of HBLE on July 31, 2013, we utilized the following valuation methods:
Market approach: This method estimates fair value based on market prices in actual transactions and on asking prices for assets currently available for sale. This valuation process is essentially that of comparison and correlation between other similar assets and those of HLBE.
Cost approach: This method estimates fair value based on the replacement cost of a comparable asset at prices at the time of the acquisition reduced for depreciation of the asset.
See Note 3 of the Notes to the Consolidated Financial Statements for a further discussion of the acquisition of HLBE.
Liquidity and Capital Resources
The following table shows our cash flows for the fiscal years ended October 31, 20112013 and 20102012:
| | | | 2011 | | 2010 | 2013 | | 2012 |
| Net cash provided by operating activities | $ | 11,879,586 |
| | $ | 14,079,296 |
| |
| Net cash provided by (used in) operating activities | | $ | 22,715,888 |
| | $ | (953,958 | ) |
| Net cash used in investing activities | (50,020 | ) | | (4,320,511 | ) | $ | (9,073,284 | ) | | $ | (7,551,142 | ) |
| Net cash used in financing activities | (9,429,231 | ) | | (4,811,066 | ) | $ | (13,169,658 | ) | | $ | (3,873,632 | ) |
Operating Cash Flows. Cash provided by operating activities was approximately $11,880,000$22,715,888 for the fiscal year ended ended October 31, 20112013, which was less than thecompared to cash used in operating activities of approximately $14,080,000 provided by operating activities$953,958 for the fiscal year ended ended October 31, 20102012. The difference is primarily attributable to an increase in net income for the significant depreciation taken during the periodfiscal year ended October 31, 2010.2013 compared to the
fiscal year ended October 31, 2012. We also had significant changes in accounts receivable and inventory during the fiscal year ended October 31, 2013 compared to the fiscal year ended October 31, 2012, which provided cash flow from operating activities of approximately $3,911,000 and $1,946,000, respectively. Currently, our capital needs are being adequately met through cash flows from our operating activities and our currently available credit facilities.
Investing Cash Flows.Cash used in investing activities was $9,073,284 for the fiscal year endedOctober 31, 2013, compared to cash used in investing activities of $7,551,142 for the fiscal year endedOctober 31, 2012. During the fiscal year endedOctober 31, 2013, we used approximately $6,977,000 to indirectly acquire a majority interest in HLBE. Additionally, during our 2013 fiscal year we used cash totaling approximately $2,636,000 for capital expenditures, construction in process and land acquisitions, compared to payments of approximately $7,551,000 during the same period in 2012. We also had proceeds of $540,000 during fiscal 2013 related to the sale of land.
Financing Cash Flows.Cash used in financing activities was $13,169,658 for the fiscal year endedOctober 31, 2013, compared to $3,873,632 for the fiscal year endedOctober 31, 2012. The difference is primarily attributable to increases in payments on our long-term debt associated with our credit facilities during our 2013 fiscal year. We also received proceeds from the issuance of subordinated convertible notes in fiscal year 2013, discussed below under "Indebtedness." In our 2012 fiscal year, we received proceeds from our long-term debt and also paid a member distribution.
The following table shows our cash flows for the fiscal years ended October 31, 2012 and 2011:
|
| | | | | | | |
| | 2012 | | 2011 |
| Net cash provided by (used in) operating activities | $ | (953,958 | ) | | $ | 11,879,586 |
|
| Net cash used in investing activities | $ | (7,551,142 | ) | | $ | (50,020 | ) |
| Net cash used in financing activities | $ | (3,873,632 | ) | | $ | (9,429,231 | ) |
Operating Cash Flows.Cash used in operating activities was approximately $954,000 for the fiscal year ended October 31, 2012, compared to cash provided by operating activities of approximately $11,880,000 for the fiscal year ended October 31, 2011. The difference is primarily attributable to our decrease in net income for the fiscal year ended October 31, 2012 compared to the fiscal year ended October 31, 2011. We also purchased approximately $6,500,000 of corn during the fourth quarter of 2012 that we used during fiscal 2013.
Investing Cash Flows. Cash used in investing activities was approximately $50,000$7,551,000 for the fiscal year ended ended October 31, 2011,2012, compared to cash used in investing activities of $4,320,000approximately $50,000 for the fiscal year ended ended October 31, 2010.2011. During the fiscal year ended October 31, 2012, we made payments totaling approximately $7,551,000 for capital expenditures, construction in process and land acquisitions, compared to payments of approximately $3,550,000 during the same period in 2011. Additionally, during the fiscal year ended October 31, 2011 we had positive investing cash flow from the maturity of certain short term investments (certificates of deposit) in the amount of $3,500,000. These proceeds were offset by payment for construction in progress in the amount of approximately $3,100,000.
Financing Cash Flows. Cash used in financing activities was approximately $9,430,000$3,874,000 for the fiscal year ended ended October 31, 2011,2012, compared to $4,810,000approximately $9,429,000 for the fiscal year ended ended October 31, 2010. In2011. The difference is primarily attributable to approximately $5,491,000 in long-term debt proceeds from our revolving term loan with United FCS during the fiscal year ended ended October 31, 2011, cash was used to pay a distribution to our members totaling approximately $9,200,000 and to repay the principal balance on our remaining EDA loan.2012.
Indebtedness
Granite Falls Energy
Short-Term Debt Sources
In August 2012, we entered into two new credit facilities, one short-term and one long-term, with United FCS. CoBank serves as administrative agent for these new credit facilities. The Company has a Loan AgreementCompany's short-term credit facility with Minnwest Bank M.V. of Marshall, MN (the “Bank”). Under the Loan Agreement, the Company hasUnited FCS is a revolving line of credit. This facility allows us to borrow, repay, and reborrow up to $6,000,000 subject to a borrowing base calculation. Final payment of amounts borrowed under this credit withfacility is due August 1, 2014. Amounts borrowed under the revolving line of credit bear interest at one of three interest rate options selected by us, (i) at a maximumvariable weekly rate equal to 2.65% above the rate quoted by the British Bankers Association for the offering of $6,000,000 available whichone-month U.S. Dollar deposits, (ii) at a fixed rate to be quoted by CoBank, or (iii) at a fixed rate for up to 12 months equal to LIBOR plus 2.65%. Interest on amounts borrowed is secured by a first mortgagepayable monthly in arrears. We expect to utilize this credit facility to finance inventory and receivables as needed. We have not yet made any advances on substantially allthis line of our assets. As of October 31, 2011, thecredit.
The Company also has outstanding letters of credit intotaling $337,928 as part of a credit requirement of Northern Natural Gas. In August 2012, these letters of credit were transferred to United FCS as part of the amount of approximately $436,000.new credit facilities. These letters of credit reduce the amount available under the revolvingour line of credit to approximately $5,564,000. The interest rate on the revolving line of credit is at 0.25 percentage points above the prime rate as reported by the Wall Street Journal, with a minimum rate of 4.5%. The minimum interest rate was reduced in April 2011 from 5.0% to 4.5%. At October 31, 2011, the Company had no outstanding balance on this line of credit.$5,662,000.
Long-Term Debt Sources
The Company's long-term credit facility with United FCS is a revolving term loan. Under this facility we may borrow, repay, and reborrow up to $8,000,000. However, the amount available for borrowing under this facility reduces by $1,000,000 every six months, beginning September 1, 2013, with final payment due March 1, 2017. Therefore, at October 31, 2013, the amount we may borrow under this facility is $7,000,000. Amounts borrowed under the revolving term loan bear interest at one of three interest rate options selected by us, (i) at a variable weekly rate equal to 2.90% above the rate quoted by the British Bankers Association for the offering of one-month U.S. Dollar deposits, (ii) at a fixed rate to be quoted by CoBank, or (iii) at a fixed rate for up to 12 months equal to LIBOR plus 2.90%. Interest on amounts borrowed is payable monthly in arrears. We have used this credit facility to fund our rail infrastructure improvement project. As of October 31, 2012, the outstanding balance on our revolving term loan was $2,513,674 and the interest rate as of that date was 3.22%.
The Company's credit facilities with United FCS require the Company to comply with certain financial covenants, including (i) maintaining working capital of at least $10,000,000, (ii) maintaining local net worth, defined as total assets, minus total liabilities, minus investments by the Company in other entities, of at least $45,000,000, and (iii) achieving a debt service coverage ratio of at least 2.0 to 1.0. Our debt service coverage ratio is calculated as follows: (1) net income, plus depreciation and amortization, minus extraordinary gains (plus extraordinary losses), minus gain on asset sales (plus loss on asset sales); (2) divided by $2,000,000. As of October 31, 2013, we were in compliance with our financial covenants.
Our credit facilities with United FCS are secured by substantially all our assets. There are no savings account balance collateral requirements as part of this credit facility.
In December 2011, the Company purchased a Shuttlewagon Railcar Mover for use at its facility. The Company financed the entire purchase price through Capital One Equipment Leasing and Finance. As of October 31, 2013, the loan balance was approximately $383,000. The note is on a five-year term at a fixed annual interest rate of 3.875%.
Heron Lake BioEnergy
Credit Arrangements with AgStar
HLBE entered into an amended and restated master loan agreement with AgStar Financial Services, PCA ("AgStar") under which it has two forms of debt as of October 31, 2013: a term note and a revolving term note. HLBE's total indebtedness to AgStar as of October 31, 2013 was approximately $22.6 million, consisting of approximately $16.6 million under the term note and approximately $6.0 million under the revolving term note.
HLBE's loan agreements with AgStar are secured by substantially all business assets and are subject to various financial and non-financial covenants that limit distributions and debt and require minimum debt service coverage, net worth, and working capital requirements. HLBE was in compliance with the covenants of its loan agreements with AgStar as of October 31, 2013. In the past, HLBE’s failure to comply with the covenants of the master loan agreement and failure to timely pay required installments of principal has resulted in events of default under the master loan agreement, entitling AgStar to accelerate and declare due all amounts outstanding under the master loan agreement. If AgStar accelerated and declared due all amounts outstanding under the master loan agreement, HLBE would not have adequate cash to repay the amounts due, resulting in a loss of control of its business or bankruptcy. There can be no assurance that HLBE will be able to maintain compliance with its agreements with AgStar. Upon an occurrence of an event of default or an event that will lead to HLBE's default, AgStar may upon notice terminate its commitment to loan funds and declare the entire unpaid principal balance of the loans, plus accrued interest, immediately due and payable. An event of default includes, but is not limited to, HLBE's failure to make payments when due, insolvency, any material adverse change in HLBE's financial condition or HLBE's breach of any of the covenants, representations or warranties we have given in connection with the transaction.
Term Note
With respect to the term loan, HLBE must make equal monthly payments of principal and interest on the term loan based on a 10-year amortization, provided the entire principal balance and accrued and unpaid interest on the term loan is due and payable in full on the maturity date of September 1, 2016. In addition, HLBE is required to make additional payments annually on debt
for up to 25% of the excess cash flow, as defined by the agreement, up to $2 million per year. Through September 1, 2014, the loan bears interest at 5.75% as long as HLBE is in compliance with its debt covenants. On August 26,September 1, 2014, the interest on the term loan will be adjusted to LIBOR plus 3.50%, but the total interest rate shall not be less than 5%.
Revolving Term Note
With respect to the revolving term loan, the loan matures in September 2016. Amounts borrowed by HLBE under the term revolving loan can be repaid and may be re-borrowed at any time prior to maturity date of the term revolving loan, provided that outstanding advances may not exceed the amount of the term revolving loan commitment. Amounts outstanding on the term revolving loan bear interest at a variable rate equal to the greater of a LIBOR rate plus 3.50% or 5.0%, payable monthly. At October 31, 2013, the revolving term loan carried an interest rate of 5.0%. HLBE also pays an unused commitment fee on the unused portion of the term revolving term loan commitment at the rate of 0.35% per annum, payable in arrears in quarterly installments during the term of the revolving term loan. At October 31, 2013, HLBE had $6.0 million outstanding under the revolving term loan and an additional $12.5 million was available. The amount available under the revolving term loan is reduced by $2 million at October 31 each year until September 2016, when the unpaid balance is due.
Subordinated Convertible Debt
On September 18, 2013, HLBE entered into an indenture with U.S. Bank National Association (“U.S. Bank”), as trustee and collateral agent, in connection with the closing of HLBE's offering of a maximum of $12 million aggregate principal amount of 7.25% Secured Subordinated Notes due 2018 (the “Notes”). On September 18, 2013, HLBE sold an aggregate principal amount of approximately $2.8 million of the Notes. Additionally, subscribers from HLBE's prior interim subordinated notes offering holding an aggregate principal amount of approximately $1.3 million of HLBE's interim subordinated notes elected to exchange their notes for Notes under the indenture, per the original terms of the interim subordinated notes. Therefore HLBE has an aggregate principal amount of approximately $4.1 million in Notes. The Notes are subordinated secured obligations, with interest payable on April 1 and October 1 of each year, beginning April 1, 2014, through the maturity date of October 1, 2018 at a rate of 7.25% per annum. The Notes are secured by a second mortgage and lien position on, among other assets, HLBE's property, plant and equipment located in Heron Lake, Minnesota, which mortgage and lien position are junior to and subordinated to HLBE's senior debt with AgStar. Beginning on October 1, 2014, and each anniversary date thereafter prior to the maturity date of the Notes, and on the maturity date of the Notes, and prior to the effective time of certain corporate actions, each holder of Notes has the right, at such holder’s option, to irrevocably convert all (but not less than all) of such holder’s Notes into HLBE's membership units at the rate of $0.30 of principal amount per unit. In addition to the anniversary and event conversion rights, prior to any prepayment date, each holder of Notes has the right, at such holder’s option, to irrevocably convert the principal amount to be prepaid into HLBE's membership units at the rate of $0.30 of principal amount per unit. Subject to this conversion right, HLBE may, by at least 45 days but not more than 60 days notice to the holders thereof, prepay the outstanding amount of the Notes in whole or in part with accrued interest to the date of such prepayment on the amount prepaid, without penalty or premium, provided that any prepayment of Notes must be done pro rata to all holders of Notes.
Other Credit Arrangements
In addition to HLBE's primary credit arrangement with AgStar and our subordinated convertible debt, HLBE has other material credit arrangements and debt obligations.
In October 2003, HLBE entered into an industrial water supply development and distribution agreement with the City of Heron Lake, Jackson County, and Minnesota Soybean Processors. In consideration of this agreement, HLBE and Minnesota Soybean Processors are allocated equally the debt service on $735,000 in water revenue bonds that were issued by the City to support this project that mature in February 2019. The parties have agreed that prior to the scheduled expiration of the agreement, they will negotiate in good faith to replace the agreement with a further agreement regarding the wells and related facilities. In May 2006, HLBE entered into an industrial water supply treatment agreement with the City of Heron Lake and Jackson County. Under this agreement, HLBE pays monthly installments over 24 months starting January 1, 2007 equal to one years' debt service on approximately $3.6 million in water revenue bonds, which will be returned to HLBE if any funds remain after final payment in full on the bonds and assuming HLBE complies with all payment obligations under the agreement. As of October 31, 2013 and 2012, there was a total of $2.6 million and $2.9 million in outstanding water revenue bonds, respectively. HLBE classifies its obligations under these bonds as assessments payable. The interest rates on the bonds range from 0.50% to 8.73%.
In November 2007, HLBE entered into a shared savings contract with Interstate Power and Light Company ("IPL"), its electrical service provider. Under the agreement, IPL is required to pay $1,850,000 to fund project costs for the purchase and installation of electrical equipment. In exchange, HLBE is required to share a portion of the energy savings with IPL that may be derived from the decreased energy consumption from the new equipment. HLBE isrequired to pay IPL approximately $30,000
for the first thirteen billing cycles, $140,000 at the end of the thirteenth billing cycle, and thereafter, approximately $30,000 for the remainder of the billing cycles. These amounts represent IPL's portion of the shared savings. HLBE also granted IPL a security interest in the electrical equipment to be installed on its site. The shared savings contract expired December 31, 2012.
To fund the purchase of the distribution system and substation for the plant, HLBE entered into a loan agreement with Federated Rural Electric Association pursuant to which HLBE borrowed $600,000 by a secured promissory note. Under the note HLBE is required to make monthly payments to Federated Rural Electric Association of $6,250 consisting of principal and an annual fee of 1% beginning on October 10, 2009. In exchange for this loan, Federated Rural Electric Association was granted a security interest in the distribution system and substation for the plant. The balances of this loan at October 31, 2013 and 2012 were $298,750 and $368,750, respectively.
HLBE has a note payable in connection with the construction of its pipeline assets. This loan was initially due in December 2011, Granite Falls Energy repaid an outstandingbut was converted in February 2012 to a term loan with a three-year repayment period. The balances of this loan at October 31, 2013 and 2012 were $1,013,132 and $818,884, respectively. Interest on the loan is at 5.29%. The note is secured by the assets of Agrinatural Gas, LLC.
HLBE financed its corn oil separation equipment from the equipment vendor. HLBE pays approximately $40,000 per month on this debt, conditioned upon revenue generated from the corn oil separation equipment. The monthly payment includes implicit interest of 5.57% until maturity in May 2015. The note is secured by the corn oil separation equipment. The balances of this loan at October 31, 2013 and 2012 were $640,653 and $1,072,310, respectively.
HLBE also has a note payable to the Cityminority owner of Granite FallsAgrinatural Gas, LLC in the amount of approximately $187,000. Granite Falls Energy had been making scheduled payments$300,000 at October 31, 2013. Interest on this loan since February 2006the note is 5.43% and was scheduled to have the the loan repaidnote has a maturity date in JuneOctober 2014. Granite Falls Energy decided to repay the loan early and is now free of all long term debt obligations.
Contractual Obligations
The following table provides information regarding the contractual obligations of the Company as of October 31, 2011:2013:
|
| | | | | | | | | | | | | | | | | | | | |
| | | Total | | Less than One Year | | One to Three Years | | Three to Five Years | | Greater Than Five Years |
| Operating Lease Obligations (1) | | $ | 5,969,426 |
| | $ | 1,769,844 |
| | $ | 2,777,433 |
| | $ | 1,233,829 |
| | $ | 188,320 |
|
| Purchase Commitments (2) | | $ | 1,797,600 |
| | $ | 1,797,600 |
| | | | | | |
| Total Contractual Obligations | | $ | 7,767,026 |
| | $ | 3,567,444 |
| | $ | 2,777,433 |
| | $ | 1,233,829 |
| | $ | 188,320 |
|
|
| | | | | | | | | | | | | | | | | | | | |
|
| Total |
| Less than One Year |
| One to Three Years |
| Three to Five Years |
| Greater Than Five Years |
| Long-Term Debt Obligations (1) |
| $ | 37,687,311 |
|
| $ | 4,501,215 |
|
| $ | 24,292,098 |
|
| $ | 7,751,238 |
|
| $ | 1,142,760 |
|
| Operating Lease Obligations (2) |
| $ | 11,175,639 |
|
| $ | 3,525,671 |
|
| $ | 6,781,468 |
|
| $ | 868,500 |
|
| $ | — |
|
| Total Contractual Obligations |
| $ | 48,862,950 |
|
| $ | 8,026,886 |
|
| $ | 31,073,566 |
|
| $ | 8,619,738 |
|
| $ | 1,142,760 |
|
(1) Long-term debt obligations include both principal and interest payments.
(2) Operating lease obligations include the Company's rail car lease (Note 8)7).
(2) Purchase commitments include fixed price utility forward contracts.
Off-Balance Sheet Arrangements.
We currently have no off-balance sheet arrangements.
ITEM 7A. QUANTITATIVE AND QUALITATIVE DISCLOSURES ABOUT MARKET RISK
We are exposed to the impact of market fluctuations associated with interest rates and commodity prices as discussed below. We have no exposure to foreign currency risk as all of our business is conducted in U.S. Dollars. We use derivative financial instruments as part of an overall strategy to manage market risk. We use cash, futures and option contracts to hedge changes to the commodity prices of corn, ethanol and natural gas. We do not enter into these derivative financial instruments for trading or speculative purposes, nor do we designate these contracts as hedges for accounting purposes pursuant to the requirements of Generally Accepted Accounting Principles ("GAAP").
Interest Rate Risk
We are generally exposed to market risk from changes in interest rates. Exposure to interest rate risk results primarily from our revolving line of credit facilities with United FCS, PCA and letters of credit with Minnwest Bank. AsAgStar Financial Services, PCA. Specifically, we have $25,071,191 outstanding in variable rate debt as of October 31, 20112013, we did not have an outstanding balance on this revolving line of credit.. The specifics of these credit facilities are discussed in greater detail in “Item 27 - Management's Discussion and Analysis of Financial Condition and Results of Operations - Short-Term Debt Sources.Indebtedness.”
Below is a sensitivity analysis we prepared regarding our income exposure to changes in interest rates. The sensitivity analysis below shows the anticipated effect on our income from a 10% adverse change in interest rates for a one-year period.
|
| | | | | |
| Outstanding Variable Rate Debt at October 31, 2013 | Interest Rate at October 31, 2013 | Interest Rate Following 10% Adverse Change | Annual Adverse Change to Income |
| $2,513,674 | 3.22 | % | 3.542 | % | $8,119 |
| $16,577,641 | 5.75 | % | 6.325 | % | $95,321 |
| $5,979,876 | 5.00 | % | 5.500 | % | $29,899 |
Commodity Price Risk
We seek to minimize the risks from fluctuations in the prices of raw material inputs, such as corn and natural gas, and finished products, such as ethanol and distillers grains, through the use of hedging instruments. In practice, as markets move, we actively manage our risk and adjust hedging strategies as appropriate. Although we believe our hedge positions accomplish an economic hedge against our future purchases and sales, management has chosen not to use hedge accounting, which would match the gain or loss on our hedge positions to the specific commodity purchase being hedged. We are using fair value accounting for our hedge positions, which means as the current market price of our hedge positions changes, the realized or unrealized gains and losses are immediately recognized in our cost of goods sold or as an offset to revenues. The immediate recognition of hedging gains and losses under fair value accounting can cause net income to be volatile from quarter to quarter due to the timing of the change in value of the derivative instruments relative to the cost and use of the commodity being hedged.
As corn prices move in reaction to market trends and information, our income statement will be affected depending on the impact such market movements have on the value of our derivative instruments. Depending on market movements, crop prospects and weather, these price protection positions may cause immediate adverse effects, but are expected to produce long-term positive growth for us.
A sensitivity analysis has been prepared to estimate our exposure to ethanol, corn and natural gas price risk. Market risk related to these factors is estimated as the potential change in income resulting from a hypothetical 10% adverse change in the fair valuespot prices of our corn, and natural gas, prices and average ethanol price as of October 31, 20112013, net of the forward and future contracts used to hedge our market risk for corn and natural gas usage requirements. The volumes are based on our expected use and sale of these commodities for a one year period from October 31, 20112013. As of October 31, 2011, approximately 12.9% of our estimated corn usage, 56.7% of our anticipated natural gas usage and 10.2% of our ethanol sales over the next 12 months were subject to fixed price or index contracts where a price has been established with an exchange. The results of this analysis, which may differ from actual results, are as follows:
| | | | Estimated Volume Requirements for the next 12 months (net of forward and futures contracts) | Unit of Measure | Adverse Change in Price as of October 31, 2011 |
| Approximate Adverse Change to Income | Estimated Volume Requirements for the next 12 months (net of forward and futures contracts) | Unit of Measure | Hypothetical Adverse Change in Price as of October 31, 2013 | Approximate Adverse Change to Income |
| Natural Gas | 1,080,000 |
| MMBTU | 10 | % | $ | 430,000 |
| 3,000,000 |
| MMBTU | 10 | % | $ | 1,395,000 |
|
| Ethanol | 53,881,000 |
| Gallons | 10 | % | $ | 13,039,000 |
| 119,300,000 |
| Gallons | 10 | % | $ | 21,474,000 |
|
| Corn | 17,420,000 |
| Bushels | 10 | % | $ | 11,323,000 |
| 40,750,000 |
| Bushels | 10 | % | $ | 17,107,500 |
|
Participation in Captive Reinsurance Company
We participate in a captive reinsurance company (“Captive”). The Captive reinsures losses related to workman's compensation, commercial property and general liability. Premiums are accrued by a charge to income for the period to which the premium relates and is remitted by our insurer to the captive reinsurer. The Captive reinsures losses in excess of a predetermined amount. The Captive insurer has estimated and collected a premium amount in excess of expected losses but less than the aggregate loss limits reinsured by the Captive. We have contributed limited capital surplus to the Captive that is available to fund losses should the actual losses sustained exceed premium funding. So long as the Captive is fully-funded through premiums and capital contributions to the aggregate loss limits reinsured, and the fronting insurers are financially strong, we can notcannot be assessed over the amount of our current contributions.
ITEM 8. FINANCIAL STATEMENTS AND SUPPLEMENTARY DATA
REPORT OF INDEPENDENT REGISTERED PUBLIC ACCOUNTING FIRM
Board of Governors
Granite Falls Energy, LLC and Subsidiaries
Granite Falls, MN
Minnesota
We have audited the accompanying consolidated balance sheets of Granite Falls Energy, LLC and Subsidiaries as of October 31, 20112013 and 20102012, and the related consolidated statements of operations, changes in members’ equity, and cash flows for each of the three fiscal years in the three-year period ended October 31, 2011. These2013. Granite Falls Energy, LLC’s management is responsible for these consolidated financial statements are the responsibility of the Company’s management.statements. Our responsibility is to express an opinion on these consolidated financial statements based on our audits.
We conducted our audits in accordance with the standards of the Public Company Accounting Oversight Board (United States). Those standards require that we plan and perform the audit to obtain reasonable assurance about whether the consolidated financial statements are free of material misstatement. The company is not required to have, nor were we engaged to perform, an audit of its internal control over financial reporting. Our audit included consideration of internal control over financial reporting as a basis for designing audit procedures that are appropriate in the circumstances, but not for the purpose of expressing an opinion on the effectiveness of the company’s internal control over financial reporting. Accordingly, we express no such opinion. An audit also includes examining, on a test basis, evidence supporting the amounts and disclosures in the consolidated financial statements, assessing the accounting principles used and significant estimates made by management, as well as evaluating the overall financial statement presentation. We believe that our audits provide a reasonable basis for our opinion.
In our opinion, the consolidated financial statements referred to above present fairly, in all material respects, the financial position of Granite Falls Energy, LLC and Subsidiaries as of October 31, 20112013 and 2010,2012, and the results of theirits operations and theirits cash flows for each of the three fiscal years in the three-year period ended October 31, 2011,2013 in conformity with accounting principles generally accepted in the United States of America.
|
| |
| | /s/ Boulay Heutmaker, Zibell & Co. P.L.L.P.PLLP |
| | Certified Public Accountants |
| | |
| Minneapolis, Minnesota | |
January 30, 201229, 2014 | |
GRANITE FALLS ENERGY, LLC AND SUBSIDIARIES
Consolidated Balance Sheets
| | | ASSETS | | October 31, 2011 | | October 31, 2010 | | October 31, 2013 |
| | October 31, 2012 |
| |
| |
| |
| |
|
| Current Assets | |
| |
| |
| |
|
| Cash | | $ | 13,064,560 |
| | $ | 10,664,225 |
| | $ | 1,158,774 |
| | $ | 685,828 |
|
| Short-term investments | | — |
| | 3,500,000 |
| |
| Restricted cash | | 1,503,000 |
| | 901,500 |
| | 393,750 |
| | 494,000 |
|
| Accounts receivable | | 3,777,547 |
| | 3,164,209 |
| | 6,450,694 |
| | 7,356,534 |
|
| Inventory | | 8,615,411 |
| | 4,330,670 |
| | 12,370,277 |
| | 12,013,169 |
|
| Commodity derivative instruments | | 404,050 |
| | 752,500 |
| |
| Prepaid expenses and other current assets | | 177,793 |
| | 116,889 |
| | 1,096,483 |
| | 165,519 |
|
| Total current assets | | 27,542,361 |
| | 23,429,993 |
| | 21,469,978 |
| | 20,715,050 |
|
| |
| |
| |
| |
|
| Property, Plant and Equipment | |
| |
| |
| |
|
| Land and improvements | | 3,627,973 |
| | 3,496,697 |
| | 12,307,063 |
| | 7,095,172 |
|
| Railroad improvements | | 4,121,148 |
| | 4,121,148 |
| | 8,005,523 |
| | 4,121,148 |
|
| Process equipment and tanks | | 63,592,688 |
| | 59,897,350 |
| | 110,440,407 |
| | 64,678,860 |
|
| Administration building | | 279,734 |
| | 279,734 |
| | 1,015,361 |
| | 279,734 |
|
| Office equipment | | 154,072 |
| | 135,912 |
| | 265,792 |
| | 154,072 |
|
| Rolling stock | | 642,908 |
| | 558,633 |
| | 1,691,857 |
| | 1,305,395 |
|
| Construction in progress | | 366,979 |
| | 746,008 |
| | 2,067,213 |
| | 3,831,263 |
|
| | | 72,785,502 |
| | 69,235,482 |
| | 135,793,216 |
| | 81,465,644 |
|
| Less accumulated depreciation | | 36,886,541 |
| | 32,907,985 |
| | 46,984,361 |
| | 41,047,562 |
|
| Net property, plant and equipment | | 35,898,961 |
| | 36,327,497 |
| | 88,808,855 |
| | 40,418,082 |
|
| |
| |
| |
|
| |
|
| Goodwill | | | 1,372,473 |
| | — |
|
| | |
|
| |
|
| Other Assets | |
| |
| | 1,021,916 |
| | — |
|
| Deferred financing costs, net of amortization | | — |
| | 10,050 |
| |
| | | | | | |
|
| |
|
| Total Assets | | $ | 63,441,322 |
| | $ | 59,767,540 |
| | $ | 112,673,222 |
| | $ | 61,133,132 |
|
Notes to the Consolidated Financial Statements are an integral part of this Statement.
GRANITE FALLS ENERGY, LLC
Balance Sheets
|
| | | | | | | | |
| LIABILITIES AND MEMBERS' EQUITY | | October 31, 2011 | | October 31, 2010 |
| |
| |
|
| Current Liabilities | |
| |
|
| Current portion long-term debt | | $ | — |
| | $ | 61,133 |
|
| Accounts payable | | 1,591,036 |
| | 1,305,062 |
|
| Corn payable to FCE - related party | | 2,516,923 |
| | 1,931,226 |
|
| Accrued liabilities | | 375,425 |
| | 435,939 |
|
| Distribution payable | | 9,196,800 |
| | — |
|
| Total current liabilities | | 13,680,184 |
| | 3,733,360 |
|
| |
| |
|
| Long-Term Debt, less current portion | | — |
| | 171,298 |
|
| |
| |
|
| Commitments and Contingencies | |
| |
|
| |
| |
|
| Members' Equity, 30,656 units authorized, issued and outstanding | | 49,761,138 |
| | 55,862,882 |
|
| |
| |
|
| Total Liabilities and Members’ Equity | | $ | 63,441,322 |
| | $ | 59,767,540 |
|
| | | | | |
| | | | | |
Notes to Financial Statements are an integral part of this Statement.
GRANITE FALLS ENERGY, LLC
Statements of Operations
|
| | | | | | | | | |
| For the fiscal years ended, | October 31, 2011 | October 31, 2010 | October 31, 2009 |
|
|
|
|
| | | | |
| Revenues | $ | 156,521,489 |
| $ | 95,289,452 |
| $ | 91,282,031 |
|
|
|
|
|
| Cost of Goods Sold - primarily related party | 142,353,416 |
| 85,146,261 |
| 87,464,936 |
|
|
|
|
|
| Gross Profit | 14,168,073 |
| 10,143,191 |
| 3,817,095 |
|
|
|
|
|
| Operating Expenses | 2,002,706 |
| 1,957,742 |
| 2,045,615 |
|
|
|
|
|
| Operating Income | 12,165,367 |
| 8,185,449 |
| 1,771,480 |
|
|
|
|
|
| Other Income (Expense) |
|
|
|
| Other income (expense) | 37,281 |
| 89,890 |
| (618,035 | ) |
| Interest income | 93,566 |
| 97,677 |
| 14,886 |
|
| Interest expense | (4,358 | ) | (10,704 | ) | (82,151 | ) |
| Total other income (expense), net | 126,489 |
| 176,863 |
| (685,300 | ) |
|
|
|
|
| Net Income | $ | 12,291,856 |
| $ | 8,362,312 |
| $ | 1,086,180 |
|
|
|
|
|
| Weighted Average Units Outstanding - Basic and Diluted | 30,656 |
| 30,656 |
| 30,781 |
|
| | | | |
| Net Income Per Unit - Basic and Diluted | $ | 400.96 |
| $ | 272.78 |
| $ | 35.29 |
|
| | | | |
| Distributions Per Unit | $ | 600.00 |
| $ | 150.00 |
| $ | — |
|
| | | | |
Notes to Financial Statements are an integral part of this Statement.
GRANITE FALLS ENERGY, LLC AND SUBSIDIARIES
Statement of Changes in Members' EquityConsolidated Balance Sheets
|
| | | | |
| Balance - October 31, 2008 |
| $ | 51,512,790 |
|
|
|
|
| Repurchase of 500 Membership units at $1,000 per unit, December 2008 |
| (500,000 | ) |
|
|
|
| Net income for the year ended October 31, 2009 |
| 1,086,180 |
|
|
|
|
| Balance - October 31, 2009 |
| 52,098,970 |
|
|
|
|
| Member distributions |
| (4,598,400 | ) |
|
|
|
| Net income for the year ended October 31, 2010 |
| 8,362,312 |
|
|
|
|
| Balance - October 31, 2010 |
| 55,862,882 |
|
|
|
|
| Member distributions |
| (18,393,600 | ) |
|
|
|
| Net income for the year ended October 31, 2011 |
| 12,291,856 |
|
|
|
|
| Balance - October 31, 2011 |
| $ | 49,761,138 |
|
|
| | | | | | | | |
| LIABILITIES AND MEMBERS' EQUITY | | October 31, 2013 |
| | October 31, 2012 |
| |
| |
|
| Current Liabilities | |
| |
|
| Current portion of long-term debt | | $ | 3,490,808 |
| | $ | 114,718 |
|
| Accounts payable | | 3,058,633 |
| | 3,527,840 |
|
| Corn payable to FCE | | 4,001,852 |
| | 1,995,997 |
|
| Commodity derivative instruments | | 75,113 |
| | 45,563 |
|
| Accrued liabilities | | 696,858 |
| | 318,819 |
|
| Total current liabilities | | 11,323,264 |
| | 6,002,937 |
|
| | | | | |
| Long-Term Debt, less current portion | | 32,981,955 |
| | 5,274,870 |
|
| | | | | |
| Commitments and Contingencies | |
| |
|
| | | | | |
| Members' Equity | |
| |
|
| Members' equity attributable to Granite Falls Energy, LLC consists of 30,606 units authorized, issued, and outstanding | | 59,887,346 |
| | 49,855,325 |
|
| Noncontrolling interest | | 8,480,657 |
| | — |
|
| Total members' equity | | 68,368,003 |
| | 49,855,325 |
|
| |
| |
|
| Total Liabilities and Members' Equity | | $ | 112,673,222 |
| | $ | 61,133,132 |
|
Notes to the Consolidated Financial Statements are an integral part of this Statement.
GRANITE FALLS ENERGY, LLC AND SUBSIDIARIES
Consolidated Statements of Operations
|
| | | | | | | | | |
| For the fiscal years ended, | October 31, 2013 |
| October 31, 2012 | October 31, 2011 |
|
|
|
|
|
| Revenues | $ | 224,100,934 |
| $ | 175,162,043 |
| $ | 156,521,489 |
|
|
|
|
|
|
| Cost of Goods Sold | 210,077,621 |
| 172,708,074 |
| 142,353,416 |
|
| |
|
|
|
|
| Gross Profit | 14,023,313 |
| 2,453,969 |
| 14,168,073 |
|
|
|
|
|
|
| Operating Expenses | 2,988,583 |
| 2,449,596 |
| 2,002,706 |
|
|
|
|
|
|
| Operating Income | 11,034,730 |
| 4,373 |
| 12,165,367 |
|
|
|
|
|
|
| Other Income (Expense): |
|
|
|
|
| Other income (expense), net | (48,373 | ) | 182,186 |
| 37,281 |
|
| Interest income | 813 |
| 18,050 |
| 93,566 |
|
| Interest expense | (428,397 | ) | (44,002 | ) | (4,358 | ) |
| Total other income (expense), net | (475,957 | ) | 156,234 |
| 126,489 |
|
|
|
|
|
|
| Net Income | 10,558,773 |
| 160,607 |
| 12,291,856 |
|
|
|
|
|
|
| Net Income Attributable to Noncontrolling Interest | 526,752 |
| — |
| — |
|
|
|
|
|
|
| Net Income Attributable to Granite Falls Energy, LLC | $ | 10,032,021 |
| $ | 160,607 |
| $ | 12,291,856 |
|
|
|
|
|
|
| Weighted Average Units Outstanding - Basic and Diluted | 30,606 |
| 30,614 |
| 30,656 |
|
|
|
|
|
|
| Amounts attributable to Granite Falls Energy, LLC | | | |
| | | | |
| Net Income Per Unit - Basic and Diluted | $ | 327.78 |
| $ | 5.25 |
| $ | 400.96 |
|
| | | | |
| Distributions Per Unit - Basic and Diluted | $ | — |
| $ | — |
| $ | 600.00 |
|
Notes to the Consolidated Financial Statements are an integral part of this Statement.
GRANITE FALLS ENERGY, LLC AND SUBSIDIARIES
Consolidated Statement of Changes in Members' Equity
|
| | | | | | | | | |
| | Members' Equity Attributable to Granite Falls Energy, LLC | Noncontrolling Interest | Total Members' Equity |
| Balance - October 31, 2010 | $ | 55,862,882 |
| $ | — |
| $ | 55,862,882 |
|
|
|
|
|
| Member distributions | (18,393,600 | ) | — |
| (18,393,600 | ) |
|
|
|
|
| Net income for the year ended October 31, 2011 | 12,291,856 |
| — |
| 12,291,856 |
|
|
|
|
|
| Balance - October 31, 2011 | 49,761,138 |
| — |
| 49,761,138 |
|
|
|
|
|
| Repurchase of 50 membership units in December 2011 | (66,420 | ) | — |
| (66,420 | ) |
|
|
|
|
| Net income for the year ended October 31, 2012 | 160,607 |
| — |
| 160,607 |
|
|
|
|
|
| Balance - October 31, 2012 | 49,855,325 |
| — |
| 49,855,325 |
|
|
|
|
|
| Recognition of noncontrolling interest upon acquisition of business | — |
| 7,159,741 |
| 7,159,741 |
|
| Distribution attributable to noncontrolling interest | — |
| (38,336 | ) | (38,336 | ) |
| Issuance of subsidiary units attributable to noncontrolling interest | — |
| 832,500 |
| 832,500 |
|
| Net income attributable to noncontrolling interest | — |
| 526,752 |
| 526,752 |
|
| Net income attributable to Granite Falls Energy, LLC | 10,032,021 |
| — |
| 10,032,021 |
|
|
|
|
|
| Balance - October 31, 2013 | $ | 59,887,346 |
| 8,480,657 |
| 68,368,003 |
|
Notes to the Consolidated Financial Statements are an integral part of this Statement.
GRANITE FALLS ENERGY, LLC AND SUBSIDIARIES
Consolidated Statements of Cash Flows
| | | For the fiscal years ended, | October 31, 2011 | | October 31, 2010 | | October 31, 2009 | October 31, 2013 |
|
| October 31, 2012 |
| October 31, 2011 |
|
| |
| |
|
| |
| |
|
| Cash Flows from Operating Activities |
| |
| |
| |
| Cash Flows from Operating Activities: | |
| |
| |
|
| Net income | $ | 12,291,856 |
| | $ | 8,362,312 |
| | $ | 1,086,180 |
| $ | 10,558,773 |
| | $ | 160,607 |
| | $ | 12,291,856 |
|
| Adjustments to reconcile net income to net cash provided by operations: |
| |
| |
| |
| Adjustments to reconcile net income to net cash provided by (used in) operations: | |
| |
| |
|
| Depreciation and amortization | 3,988,606 |
| | 6,940,876 |
| | 6,814,057 |
| 5,549,204 |
| | 4,161,021 |
| | 3,988,606 |
|
| Change in fair value of derivative instruments | (1,271,242 | ) | | (1,889,836 | ) | | 552,654 |
| (155,563 | ) | | 1,651,799 |
| | (1,271,242 | ) |
| Change in operating assets and liabilities |
| |
| |
| |
| Change in operating assets and liabilities: | |
| |
| |
|
| Restricted cash | (601,500 | ) | | 209,173 |
| | (460,673 | ) | 611,205 |
| | 1,009,000 |
| | (601,500 | ) |
| Commodity derivative instruments | 1,619,692 |
| | 1,498,772 |
| | (345,268 | ) | |
| Derivative instruments | | 185,113 |
| | (1,202,186 | ) | | 1,619,692 |
|
| Accounts receivable | (613,338 | ) | | 175,809 |
| | (49,564 | ) | 3,910,961 |
| | (3,578,987 | ) | | (613,338 | ) |
| Inventory | (4,284,741 | ) | | (1,479,030 | ) | | 1,023,684 |
| 1,946,049 |
| | (3,397,758 | ) | | (4,284,741 | ) |
| Prepaid expenses and other current assets | (60,904 | ) | | 62,733 |
| | (69,211 | ) | 176,061 |
| | 12,274 |
| | (60,904 | ) |
| Accounts payable | 871,671 |
| | 141,558 |
| | 1,743,035 |
| (5,995 | ) | | 286,878 |
| | 871,671 |
|
| Due to broker | — |
| | — |
| | (238,581 | ) | |
| Accrued liabilities | (60,514 | ) | | 56,929 |
| | (1,505,075 | ) | (59,920 | ) | | (56,606 | ) | | (60,514 | ) |
| Net Cash Provided by Operating Activities | 11,879,586 |
| | 14,079,296 |
| | 8,551,238 |
| |
| Net Cash Provided by (Used in) Operating Activities | | 22,715,888 |
| | (953,958 | ) | | 11,879,586 |
|
|
| |
| |
|
| |
| |
|
| Cash Flows from Investing Activities |
| |
| |
| |
| Proceeds from (payments for) short-term investments | 3,500,000 |
| | (3,500,000 | ) | | — |
| |
| Cash Flows from Investing Activities: | |
| |
| |
|
| Proceeds from maturity of short-term investments | | — |
| | — |
| | 3,500,000 |
|
| Payments for capital expenditures | (3,183,041 | ) | | (80,415 | ) | | (81,071 | ) | (2,636,048 | ) | | (4,083,943 | ) | | (3,550,020 | ) |
| Payments for construction in process | (366,979 | ) | | (740,096 | ) | | (513,576 | ) | |
| Proceeds from sale of equipment | — |
| | — |
| | 6,413 |
| |
| Payments from sale of land | | 540,000 |
| | — |
| | — |
|
| Payments for land acquisitions | | — |
| | (3,467,199 | ) | | — |
|
| Payments for acquisition of Project Viking, net of cash acquired | | (6,977,236 | ) | | — |
| | — |
|
| Net Cash Used in Investing Activities | (50,020 | ) | | (4,320,511 | ) | | (588,234 | ) | (9,073,284 | ) | | (7,551,142 | ) | | (50,020 | ) |
|
| |
| |
|
| |
| |
|
| Cash Flows from Financing Activities |
| |
| |
| |
| Payments on revolving line of credit | — |
| | — |
| | (2,560,500 | ) | |
| Cash Flows from Financing Activities: | |
| |
| |
|
| Proceeds from long-term debt | | — |
| | 5,490,926 |
| | — |
|
| Payments on long-term debt | (232,431 | ) | | (212,666 | ) | | (73,771 | ) | (16,840,158 | ) | | (101,338 | ) | | (232,431 | ) |
| Restricted cash | — |
| | — |
| | 350,000 |
| |
| Proceeds from issuance of subsidiary convertible notes | | 3,670,500 |
| | — |
| | — |
|
| Payments for membership unit redemption | | — |
| | (66,420 | ) | | — |
|
| Member distributions paid | (9,196,800 | ) | | (4,598,400 | ) | | — |
| — |
| | (9,196,800 | ) | | (9,196,800 | ) |
| Net Cash Used in Financing Activities | (9,429,231 | ) | | (4,811,066 | ) | | (2,284,271 | ) | (13,169,658 | ) | | (3,873,632 | ) | | (9,429,231 | ) |
|
| |
| |
|
| |
| |
|
| Net Increase in Cash | 2,400,335 |
| | 4,947,719 |
| | 5,678,733 |
| |
| Net Increase (Decrease) in Cash | | 472,946 |
| | (12,378,732 | ) | | 2,400,335 |
|
|
| |
| |
|
| |
| |
|
| Cash - Beginning of Period | 10,664,225 |
| | 5,716,506 |
| | 37,773 |
| 685,828 |
| | 13,064,560 |
| | 10,664,225 |
|
|
| |
| |
|
| |
| |
|
| Cash - End of Period | $ | 13,064,560 |
| | $ | 10,664,225 |
| | $ | 5,716,506 |
| $ | 1,158,774 |
| | $ | 685,828 |
| | $ | 13,064,560 |
|
|
| |
| |
|
| |
| |
|
| Supplemental Cash Flow Information |
| |
| |
|
| |
| |
|
| Cash paid during the period for: |
| |
| |
|
| |
| |
|
| Interest expense | $ | 6,857 |
| | $ | 11,611 |
| | $ | 72,955 |
| $ | 388,306 |
| | $ | 44,002 |
| | $ | 6,857 |
|
|
| |
| |
|
| |
| |
|
| Supplemental Disclosure of Noncash Investing and Financing Activities |
| |
| |
| |
| Member distributions included in distribution payable | $ | 9,196,800 |
| | $ | — |
| | $ | — |
| |
| Transfer of construction in process to fixed assets | $ | 746,008 |
| | $ | 231,916 |
| | $ | 368,305 |
| |
| Accounts receivable offset by repurchase of membership units | $ | — |
| | $ | — |
| | $ | 500,000 |
| |
Notes to the Consolidated Financial Statements are an integral part of this Statement.
GRANITE FALLS ENERGY, LLC AND SUBSIDIARIES
Consolidated Statements of Cash Flows
|
| | | | | | | | | | | |
| For the fiscal years ended, | October 31, 2013 |
|
| October 31, 2012 |
| October 31, 2011 |
| | | | | | |
| Supplemental Disclosure of Noncash Investing, Operating and Financing Activities |
| |
| |
|
| Conversion of subsidiary subordinated convertible notes | $ | 934,500 |
| | $ | — |
| | $ | — |
|
| Distribution to non-controlling interest in accrued expenses | $ | 38,336 |
| | $ | — |
| | $ | — |
|
| Member distributions included in distribution payable | $ | — |
| | $ | — |
| | $ | 9,196,800 |
|
| Capital expenditures and construction in process included in accounts payable | $ | 605,750 |
| | $ | 1,129,000 |
| | $ | — |
|
Notes to the Consolidated Financial Statements are an integral part of this Statement.
GRANITE FALLS ENERGY, LLC AND SUBSIDIARIES
Notes to Consolidated Financial Statements
October 31, 20112013 and 20102012
1. SUMMARY OF SIGNIFICANT ACCOUNTING POLICIES
The accompanying audited financial statementsPrinciples of Granite Falls Energy, LLC have been prepared pursuant to the rules and regulations of the Securities and Exchange Commission. As used in this report in Form 10-K, the “Company” represents Granite Falls Energy, LLC (“GFE”).Consolidation
NatureThe accompanying consolidated financial statements consolidate the operating results and financial position of Business
Granite Falls Energy, LLC (“GFE” or the “Company”), and its wholly owned subsidiary, Project Viking, L.L.C. ("Project Viking") which owns 60.8% of Heron Lake BioEnergy, LLC (“HLBE”). The remaining 39.2% ownership of HLBE is included in the consolidated financial statements as a non-controlling interest. All intercompany balances and transactions are eliminated in consolidation. The acquisition occurred on July 31, 2013 and therefore the consolidated statements of operations only include the three month period ended October 31, 2013 of HLBE. See Note 3 for details of acquisition.
Nature of Business
GFE is a Minnesota limited liability company currently producing fuel-grade ethanol, distillers grains, and crude corn oil near Granite Falls, Minnesota and sells these products, pursuant to marketing agreements, throughout the continental United States and on the international market. GFE's plant has an approximate annual production capacity of 60 million gallons. However, until recently the plant was only gallons, but is currently permitted to produce 49.9up to 70 million gallons of undenatured ethanol on a twelve month rolling sum basis. During
HLBE is a Minnesota limited liability company currently producing fuel-grade ethanol, distillers grains, and crude corn oil near Heron Lake, Minnesota and sells these products, pursuant to marketing agreements, throughout the second quartercontinental United States. HLBE's plant has an approximate annual production capacity of fiscal 2011, the Company obtained an amendment to its environmental permits allowing the Company55 million gallons, but is currently permitted to produce up to 7059.2 million gallons of undenatured ethanol on a twelve month rolling sum basis.gallons.
Fiscal Reporting Period
The Company has adopted a fiscal year ending October 31 for financial reporting purposes.
Accounting Estimates
Management uses estimates and assumptions in preparing these condensed financial statements in accordance with generally accepted accounting principles in the United States of America. Those estimates and assumptions affect the reported amounts of assets and liabilities, the disclosure of contingent assets and liabilities, and the reported revenues and expenses. The Company uses estimates and assumptions in accounting for the following significant matters, among others: realizability of accounts receivable, valuation of commodity derivatives and inventory, the economic lives of property, plant, and equipment, valuation of commodity derivatives and inventory, and the assumptions used in the impairment analysis of long-lived assets.assets and the assumptions used to estimate the fair value of acquired assets and liabilities, which includes goodwill. Actual results may differ from previously estimated amounts, and such differences may be material to our condensed financial statements. The Company periodically reviews estimates and assumptions, and the effects of revisions are reflected in the period in which the revision is made.
Cash and Short-Term Investments
The Company maintains itits accounts primarily at two financial institutions, of which one is a member of the Company. Certificates of deposit with original maturities over three months were classified as short-term investments. At times throughout the year, the Company's cash and short-term investment balances may exceed amounts insured by the Federal Deposit Insurance Corporation. At October 31, 2011 and 2010 such uninsured funds approximated $13,028,000 and $11,143,000, respectively. The Company does not believe it is exposed to any significant credit risk on its cash balances.
Restricted Cash
The Company has restricted cash balances relating to its revolving line of credit agreement discussed in Note 6 and its margin requirements with the Company's commodity derivative broker based on open commodity contracts discussed in Note 5.
Accounts Receivable
Credit terms are extended to customers in the normal course of business. The Company performs ongoing credit evaluations of its customers' financial condition and, generally, requires no collateral.
GRANITE FALLS ENERGY, LLC AND SUBSIDIARIES
Notes to Consolidated Financial Statements
October 31, 2013 and 2012
Accounts receivable are recorded at their estimated net realizable value. Accounts are considered past due if payment is not made on a timely basis in accordance with the Company's credit terms. Accounts considered uncollectible are written off. The Company follows a policy of providing an allowance for doubtful accounts; however, based on historical experience, and its evaluation of the current status of receivables, the Company is of the belief that such accounts will be collectible in all material respects and thus an allowance was not necessary at October 31, 20112013 or 2010.2012. It is at least possible this estimate will change in the future.
GRANITE FALLS ENERGY, LLC
Notes to Financial Statements
October 31, 2011 and 2010
Inventory
Inventory is stated at the lower of cost or market. Cost for all inventories is determined using the first in first out method (FIFO). Market is based on current replacement values except that it does not exceed net realizable values and it is not less than net realizable values reduced by allowances from normal profit margin. Inventory consists of raw materials, work in process, finished goods, and spare parts. Corn is the primary raw material along with other raw materials. Finished goods consist of ethanol, distillers grains, and corn oil.
Property, Plant, and Equipment
Property, plant, and equipment are stated at cost. Depreciation is provided over the following estimated useful lives by use of the straight-line method.
|
| |
| Asset Description | Years |
| Land improvements | 5-20 years |
| Buildings | 10-30 years |
| Grain handling equipment | 5-15 years |
| Mechanical equipment | 5-15 years |
| Equipment | 5-10 years |
Maintenance and repairs are expensed as incurred; major improvements and betterments are capitalized. Construction in progress expenditures will be depreciated using the straight-line method over their estimated useful lives once the assets are placed into service. Depreciation expense totaled approximately $5,937,000, $4,161,000, and $3,979,000 for the fiscal years ended October 31, 2013, 2012, and 2011, respectively.
Long-Lived Assets
Long-lived assets, such as property, plant, and equipment, and purchased intangible assets subject to amortization, are reviewed for impairment whenever events or changes in circumstances indicate that the carrying amount of an asset may not be recoverable. If circumstances require a long-lived asset be tested for possible impairment, the Company first compares undiscounted cash flows expected to be generated by an asset to the carrying value of the asset. If the carrying value of the long-lived asset is not recoverable on an undiscounted cash flow basis, impairment is recognized to the extent that the carrying value exceeds its fair value. Fair value is determined through various valuation techniques including, but not limited to, discounted cash flow models, quoted market values and third-party independent appraisals, as considered necessary. No indicators of impairment existed during fiscal 20112013 or 20102012 that would have triggered impairment testing, and therefore, no impairment expense was recorded during 20112013 or 2010.
Deferred Financing Costs
Costs related to the Company's debt financing discussed in Note 7 were capitalized as incurred. The Company amortized these costs over the term of the related debt using the effective interest method. Amortization expense for the fiscal years ended October 31, 2011, 2010 and 2009 totaled $10,050, $22,844, and $2,800, respectively. As discussed in Note 7, the Company paid off the remaining EDA loan during fiscal 2011 and has expensed the remaining unamortized financing costs accordingly.2012.
Revenue Recognition
The Company generally sells ethanol and related products pursuant to marketing agreements. Revenues from the production of ethanol and the related products are recorded when the customer has taken title and assumed the risks and rewards of ownership, prices are fixed or determinable and collectability is reasonably assured. Ethanol and related products are generally shipped free on board (FOB) shipping point. The Company believes there are no ethanol sales, during any given month, which should be considered contingent and recorded as deferred revenue.
In accordance with the Company's agreements for the marketing and sale of ethanol and related products, marketing fees and commissions due to the marketers are deducted from the gross sales price as earned. These fees and commissions are recorded net
GRANITE FALLS ENERGY, LLC
Notes to Financial Statements
October 31, 2011 and 2010
of revenues, as they do not provide an identifiable benefit that is sufficiently separable from the sale of ethanol and related
GRANITE FALLS ENERGY, LLC AND SUBSIDIARIES
Notes to Consolidated Financial Statements
October 31, 2013 and 2012
products. Shipping costs paid by the Company to the marketer in the sale of ethanol are not specifically identifiable and, as a result, are recorded based on the net selling price reported to the Company from the marketer. Shipping costs incurred by the Company in the sale of distillers grains and corn oil are included in cost of goods sold.
Fair Value of Financial Instruments
The Company's accounting for fair value measurements of assets and liabilities that are recognized or disclosed at fair value in the financial statements on a recurring or nonrecurring basis adhere to the Financial Accounting Standards Board (FASB) fair value hierarchy that prioritizes the inputs to valuation techniques used to measure fair value. The Company has adopted guidance for fair value measurement related to nonfinancial items that are recognized and disclosed at fair value in the financial statements on a nonrecurring basis. The guidance establishes a fair value hierarchy that prioritizes the inputs to valuation techniques used to measure fair value. The hierarchy gives the highest priority to unadjusted quoted prices in active markets for identical assets or liabilities (Level 1 measurements) and the lowest priority to measurements involving significant unobservable inputs (Level 3 measurements).
The three levels of the fair value hierarchy are as follows:
Level 1 inputs are quoted prices (unadjusted) in active markets for identical assets or liabilities that the Company has the ability to access at the measurement date.
Level 2 inputs are inputs other than quoted prices included within Level 1 that are observable for the asset or liability, either directly or indirectly, for substantially the full term of the asset or liability.
Level 3 inputs are unobservable inputs for the asset or liability.
The level in the fair value hierarchy within which a fair measurement in its entirety falls is based on the lowest level input that is significant to the fair value measurement in its entirety.
Except for those assets and liabilities which are required by authoritative accounting guidance to be recorded at fair value in our balance sheets, the Company has elected not to record any other assets or liabilities at fair value. No events occurred during the fiscal years ended October 31, 20112013 or 20102012 that required adjustment to the recognized balances of assets or liabilities, which are recorded at fair value on a nonrecurring basis.
The carrying value of cash, short-term investments, restricted cash, accounts receivable, accounts payable and accrued liabilities approximates fair value due to the short maturity of these instruments. The Company obtains fair value measurements from an independent pricing service for corn natural gas, and ethanolderivative contracts. The fair value measurements consider observable data that may include dealer quotes and live trading levels from the Chicago Board of Trade and New York Mercantile Exchange markets. The fair value of the long-term debt is estimated based on anticipated interest rates which management believes would currently be available to the Company for similar issues of debt, taking into account the current credit risk of the Company and other market factors. The Company believes the carrying value of the debt instruments approximate fair value.
Derivative Instruments
From time to time the Company enters into derivative transactions to hedge its exposures to commodity price fluctuations. The Company is required to record these derivatives in the balance sheetsheets at fair value.
In order for a derivative to qualify as a hedge, specific criteria must be met and appropriate documentation maintained. Gains and losses from derivatives that do not qualify as hedges, or are undesignated, must be recognized immediately in earnings. If the derivative does qualify as a hedge, depending on the nature of the hedge, changes in the fair value of the derivative will be either offset against the change in fair value of the hedged assets, liabilities, or firm commitments through earnings or recognized in other comprehensive income until the hedged item is recognized in earnings. Changes in the fair value of undesignated derivatives are recorded in earnings.
Additionally, the Company is required to evaluate its contracts to determine whether the contracts are derivatives. Certain contracts that literally meet the definition of a derivative may be exempted as “normal purchases or normal sales”. Normal purchases and
GRANITE FALLS ENERGY, LLC AND SUBSIDIARIES
Notes to Consolidated Financial Statements
October 31, 20112013 and 20102012
normal sales are contracts that provide for the purchase or sale of something other than a financial instrument or derivative instrument that will be delivered in quantities expected to be used or sold over a reasonable period in the normal course of business.
Contracts that meet the requirements of normal purchases or sales are documented as normal and exempted from accounting and reporting requirements, and therefore, are not marked to market in our financial statements.
In order to reduce the risks caused by market fluctuations, the Company occasionally hedges its anticipated corn, natural gas, and denaturant purchases and ethanol sales by entering into options and futures contracts. These contracts are used with the intention to fix the purchase price of anticipated requirements for corn in the Company's ethanol production activities and the related sales price of ethanol. The fair value of these contracts is based on quoted prices in active exchange-traded or over-the-counter market conditions. Although the Company believes its commodity derivative positions are economic hedges, none have been formally designated as a hedge for accounting purposes and derivative positions are recorded on the balance sheet at their fair market value, with changes in fair value recognized in current period earnings or losses. The Company does not enter into financial instruments for trading or speculative purposes.
The Company has adopted authoritative guidance related to “Derivatives and Hedging,” and has included the required enhanced quantitative and qualitative disclosure about objectives and strategies for using derivatives, quantitative disclosures about fair value amounts of gains and losses from derivative instruments, and disclosures about credit-risk-related contingent features in derivative agreements. See further discussion in Note 5.
Income Taxes
The Company is treated as a partnership for federal and state income tax purposes, and generally does not incur income taxes. Instead its earnings and losses are included in the income tax returns of its members. Therefore, no provision or liability for federal or state income taxes has been included in these financial statements. The Company had no significant uncertain tax positions as of October 31, 20112013 or 2010.2012. For years before fiscal 2009,2011, the Company is no longer subject to U.S. Federal or state income tax examinations.
Environmental Liabilities
The Company's operations are subject to environmental laws and regulations adopted by various governmental entities in the jurisdiction in which it operates. These laws require the Company to investigate and remediate the effects of the release or disposal of materials at its location. Accordingly, the Company has adopted policies, practices, and procedures in the areas of pollution control, occupational health, and the production, handling, storage, and use of hazardous materials to prevent material environmental or other damage, and to limit the financial liability, which could result from such events. Environmental liabilities are recorded when the liability is probable and the costs can be reasonablereasonably estimated. No expense has been recorded for the fiscal year'syears ended October 31, 2011, 2010,2013, 2012, or 2009.2011.
Net Income per Unit
Basic net income per unit is computed by dividing net income by the weighted average number of members' units outstanding during the period. Diluted net income per unit is computed by dividing net income by the weighted average number of members' units and members' unit equivalents outstanding during the period. There were no member unit equivalents outstanding during the periods presented; accordingly, for all periods presented, the calculations of the Company's basic and diluted net income per unit are the same.
Business Combinations
The Company allocates the total purchase price of a business combination to the assets acquired and the liabilities assumed based on their estimated fair values at the acquisition date, with the excess purchase price recorded as goodwill. The Company used current market data to assist them in determining the fair value of the assets acquired and liabilities assumed, including goodwill, based on recognized business valuation methodology. Subsequent to the acquisition but not to exceed one year from the acquisition date, the Company will record any material adjustments retrospectively to the initial estimate based on new information obtained about facts and circumstances that existed as of the acquisition date. The Company expenses any acquisition-related costs as incurred in connection with business combinations. An income, market or cost valuation method may be utilized to estimate the
GRANITE FALLS ENERGY, LLC AND SUBSIDIARIES
Notes to Consolidated Financial Statements
October 31, 2013 and 2012
fair value of the assets acquired or liabilities assumed in a business combination. The income valuation method represents the present value of future cash flows over the life of the asset using (i) discrete financial forecasts, which rely on management's estimates of revenue and operating expenses, (ii) long-term growth rates, and (iii) an appropriate discount rate. The market valuation method uses prices paid for a reasonably similar asset by other purchasers in the market, with adjustments relating to any differences between the assets. The cost valuation method is based on the replacement cost of a comparable asset at prices at the time of the acquisition reduced for depreciation of the asset.
Goodwill
Goodwill represents the cost in excess of the fair value of net assets acquired. The Company conducts impairment assessments annually or when events indicate a triggering event has occurred.
2. RISKS AND UNCERTAINTIES
The Company has certain risks and uncertainties that it experiences during volatile market conditions. These volatilities can have a severe impact on operations. The Company's revenues are derived from the sale and distribution of ethanol, and distillers grains, and corn oil to customers primarily located in the United States and internationally.States. Corn for the production process is supplied to our plant primarily from local agricultural producers and from purchases on the open market. Ethanol sales typically average approximately 83%80-85% of total revenues and corn costs averaged 84%typically average 70-80% of cost of goods sold.
The Company's operating and financial performance is largely driven by the prices at which they sell ethanol and the net expense
GRANITE FALLS ENERGY, LLC
Notes to Financial Statements
October 31, 2011 and 2010
of corn. The price of ethanol is influenced by factors such as supply and demand, the weather, government policies and programs, and unleaded gasoline prices and the petroleum markets as a whole. Excess ethanol supply in the market, in particular, puts downward pressure on the price of ethanol. Our largest cost of production is corn. The cost of corn is generally impacted by factors such as supply and demand, the weather, government policies and programs. The Company follows aprograms, and our risk management program used to protect against the price volatility of these commodities.
3. CONCENTRATIONSBUSINESS COMBINATION
On July 31, 2013, the Company acquired 63.3% of the outstanding membership units of Heron Lake BioEnergy, LLC (“HLBE”) through its purchase of 100% of the membership units of Project Viking, L.L.C. (“Project Viking”), for a total purchase price of $17,024,500. HLBE is a 50 million gallon per year ethanol plant located in Heron Lake, Minnesota. Project Viking was formed by the previous investor to only hold equity interests in HLBE and the debt incurred to obtain those interests and did not have any other assets or liabilities. The previous owner of Project Viking also owned approximately 12.82% of the outstanding membership units of the Company at July 31, 2013.
Immediately following the closing, the Company, through its 100% ownership of Project Viking, owned 24,080,949 Class A units and 15,000,000 Class B units of HLBE, for a total of 39,080,949 units, or 63.3% of the 61,697,104 outstanding units. As a result, under HLBE's member control agreement, Project Viking is entitled to appoint five (5) of the nine (9) governors to HLBE's board of governors.
On July 31, 2013, the Company entered into a Management Services Agreement with HLBE. Under the Management Services Agreement, the Company agreed to supply its own personnel to act as part-time officers and managers of HLBE for the positions of Chief Executive Officer, Chief Financial Officer, and Commodity Risk Manager. The initial term of the Management Services Agreement is three years. The Company will be paid $35,000 per month by HLBE for the first year of the Management Services Agreement. During years two and three of the agreement, HLBE agreed to pay the Company 50% of the total salary, bonuses, and other expenses and costs incurred by the Company for the three management positions. At the expiration of the initial term, the Management Services Agreement will automatically renew for successive one-year terms unless and until the Company or HLBE gives the other party 90-days written notice of termination prior to expiration of the initial term or the start of a renewal term.
GRANITE FALLS ENERGY, LLC AND SUBSIDIARIES
Notes to Consolidated Financial Statements
October 31, 2013 and 2012
The acquisition date fair value of the consideration transferred consisted of the following:
|
| | | |
| Cash | $ | 8,000,000 |
|
| Note payable | 4,024,500 |
|
| Assumption of note payable to Granite Falls Bank | 5,000,000 |
|
| Total Consideration | $ | 17,024,500 |
|
The assets and liabilities of Project Viking were recorded at their respective estimated fair values as of the date of the acquisition using generally accepted accounting principles for business combinations. The Company used a combination of the market and cost approaches that included unobservable level 3 inputs, to estimate the fair values of the assets acquired and liabilities assumed. The fair value of the long-term debt acquired was determined based on the present value of future contractual cash flows discounted at an interest rate that reflects the current borrowing rates available to the Company for loans with similar terms. The fair market value of the debt assumed was approximately $36.5 million and resulted in a debt premium balance of approximately $2.3 million being recorded as of the acquisition date. The debt premium is amortized as a reduction of interest expense over the term of the debt using the effective interest method. The value of the 36.66% noncontrolling interest was determined by using the fair value method by using the most recent arms-length transaction of HLBE's units that did not include a control premium. The goodwill is attributable to the synergies expected to arise after the acquisition in the purchasing of inputs and the sale of outputs. Goodwill is not expected to be deductible for tax purposes. The fair value of the assets acquired includes account receivables of approximately $3,107,000, all of which are expected to be collectible.
Subsequent to the initial purchase price allocation and within the one year measurement period, new information was obtained about facts and circumstances that existed as of the acquisition date. As such, the purchase price allocation of the HLBE acquisition was retroactively adjusted to include the effect of this measurement period adjustment. An adjustment of approximately $273k was recorded to adjust the fair value of a noncontrolling interest in HLBE, which was adjusted through goodwill during the fourth quarter ended October 31, 2013. The retroactively adjusted purchase price allocation is as follows:
|
| | | | |
| Cash | $ | 1,022,764 | |
| Restricted cash | 510,955 | |
| Accounts receivable | 3,107,121 | |
| Inventory | 2,303,157 | |
| Prepaid expenses | 1,107,025 | |
| Property, plant, and equipment | 51,625,774 | |
| Other assets | 924,252 | |
| Goodwill | 1,372,473 | |
| Total assets acquired | $ | 61,973,521 | |
| | |
| Accounts payable | $ | (936,893 | ) |
| Accrued expenses | (399,623 | ) |
| Notes payable | (36,452,764 | ) |
| Non-controlling interest | (7,159,741 | ) |
| Net purchase price | $ | 17,024,500 | |
The acquisition occurred on the last day of the Company's fiscal third quarter, therefore the Company consolidated three months of HLBE's revenues and expenses in the consolidated statements of operations. HLBE contributed revenues of $38,560,522 and earnings of $1,305,044 to the Company for the three month period from August 1, 2013 to October 31, 2013. The net income attributable to non-controlling interests for the year ended October 31, 2013 totaled approximately $527,000.
The Company has identified certain concentrations that are present in their business operations. The Company's revenue from ethanol sales is derived from a single customer under an ethanol marketing agreement described in Note 13. Sales under that agreement account for approximately 83%, 86%, and 83%following represents the unaudited pro forma consolidated statement of operations as if the transaction occurred at the beginning of the Company's revenues, net of derivative activity, during fiscal 2011, 2010,following periods:
GRANITE FALLS ENERGY, LLC AND SUBSIDIARIES
Notes to Consolidated Financial Statements
October 31, 2013 and 2009, respectively. Accordingly, a significant portion2012
|
| | | | | | | | | |
| For the years ended |
| | October 31, 2013 | October 31, 2012 | October 31, 2011 |
| | Unaudited | Unaudited | Unaudited |
| | | | |
| Revenues | $ | 349,304,556 |
| $ | 343,821,978 |
| $ | 320,641,864 |
|
| Net income, including portion attributable to non-controlling interest of $712,289, ($20,702,684), and $361,351, respectively | $ | 4,864,820 |
| $ | (31,794,779 | ) | $ | 13,612,987 |
|
| Earnings per share (30,606, 30,614, and 30,656 weighted average units outstanding - basic and diluted, respectively) | $ | 116.16 |
| $ | (617.00 | ) | $ | 412.75 |
|
The pro forma financial information is presented for informational purposes only and is not indicative of the Company's receivables are regularly due fromresults of operations that same customer.would have been achieved if the acquisition had taken place at the beginning of each of the periods presented. These amounts have been calculated after adjusting the results of HLBE to reflect the additional amortization of the debt premium that would have occurred assuming the fair value adjustment to long-term debt had been applied at the beginning of each period presented.
4. INVENTORY
Inventories consist of the following:
| | | | October 31, 2011 | | October 31, 2010 | October 31, 2013 | October 31, 2012 |
| Raw materials | $ | 5,323,615 |
| | $ | 1,549,762 |
| $ | 4,652,465 |
| $ | 8,977,820 |
|
| Spare parts | 584,011 |
| | 497,793 |
| 1,636,466 |
| 584,011 |
|
| Work in process | 1,150,239 |
| | 827,299 |
| 1,643,574 |
| 1,150,239 |
|
| Finished goods | 1,557,546 |
| | 1,455,816 |
| 4,437,772 |
| 1,557,546 |
|
| Totals | $ | 8,615,411 |
| | $ | 4,330,670 |
| $ | 12,370,277 |
| $ | 12,013,169 |
|
The Company performs a lower of cost or market analysis on inventory to determine if the market values of certain inventories are less than their carrying value, which is attributable primarily to decreases in market prices of corn and ethanol. Based on the lower of cost or market analysis, the Company did not record a lower of cost or market charge on certain inventories for the fiscal years ended October 31, 2011, 20102013 or 2009.2011. The Company recorded a lower of cost or market charge on certain inventories for the fiscal year ended October 31, 2012 for approximately $77,000.
5. DERIVATIVE INSTRUMENTS
As of October 31, 2011,2013, the total notional amount of the Company's outstanding corn derivative instruments was approximately 2,580,0001,125,000 bushels that were entered into to hedge forecasted corn purchases through March 2012.December 2013. There may be offsetting positions that are not shown on a net basis that could lower the notional amount of positions outstanding as disclosed above.
The following tables provide details regarding the Company's derivative instruments at October 31, 2011,2013, none of which were designated as hedging instruments:
| | | | Balance Sheet location | | Assets | | Liabilities | Balance Sheet location | | Assets | | Liabilities |
| | | | | | | | | | | |
| Corn contracts | Commodity derivative instruments | | $ | 404,050 |
| | $ | — |
| Commodity derivative instruments | | $ | — |
| | $ | (75,113 | ) |
| | | | | | | | | | | |
| Totals | | | $ | 404,050 |
| | $ | — |
| | | $ | — |
| | $ | (75,113 | ) |
In addition, as of October 31, 20112013 the Company maintained approximately $903,000$393,750 of restricted cash related to margin requirements for the Company's commodity derivative instrument positions.
GRANITE FALLS ENERGY, LLC AND SUBSIDIARIES
Notes to Consolidated Financial Statements
October 31, 2013 and 2012
As of October 31, 2010,2012, the total notional amount of the Company's outstanding corn derivative instruments was approximately 1,005,0001,235,000 bushels that were entered into to hedge forecasted corn purchases through November 2010.March 2013. There may be offsetting positions that are not shown on a net basis that could lower the notional amount of positions outstanding as disclosed above.
GRANITE FALLS ENERGY, LLC
Notes to Financial Statements
October 31, 2011 and 2010
The following tables provide details regarding the Company's derivative instruments at October 31, 2010,2012, none of which were designated as hedging instruments:
| | | | Balance Sheet location | | Assets | | Liabilities | Balance Sheet location | | Assets | | Liabilities |
| | | | | | | | | | | |
| Corn contracts | Derivative instruments | | $ | 752,500 |
| | $ | — |
| Commodity derivative instruments | | $ | — |
| | $ | (45,563 | ) |
| | | | | | | | | | | |
| Totals | | | $ | 752,500 |
| | $ | — |
| | | $ | — |
| | $ | (45,563 | ) |
In addition, as of October 31, 20102012 the Company maintained $301,500approximately $494,000 of restricted cash related to margin requirements for the Company's commodity derivative instrument positions.
The following tables provide details regarding the gains and (losses) from Company's derivative instruments in statements of operations, none of which are designated as hedging instruments:
| | | | | Statement of | | Fiscal Years Ended October 31, | | Statement of | | Fiscal Years Ended October 31, |
| | | Operations location | | 2011 | | 2010 | | 2009 | | Operations location | | 2013 | | | 2012 |
| | 2011 |
|
| | | | | | | | | | | | | | | | | |
| Ethanol contracts | | Revenue | | $ | (4,626 | ) | | $ | (343,448 | ) | | $ | (270,169 | ) | | Revenue | | $ | — | | | $ | — |
| | $ | (4,626 | ) |
| Corn contracts | | Cost of Goods Sold | | 1,280,413 | | | 2,339,286 |
| | (190,425 | ) | | Cost of Goods Sold | | 155,563 | | | (1,651,799 | ) | | 1,280,413 |
|
| Natural gas contracts | | Cost of Goods Sold | | (4,545 | ) | | (113,710 | ) | | (274,914 | ) | | Cost of Goods Sold | | — | | | — |
| | (4,545 | ) |
| Denaturant contracts | | Cost of Goods Sold | | — | | | 7,708 |
| | 182,854 |
| |
| | | | | | | | | | | | | | |
| Total gain (loss) | | $ | 1,271,242 | | | $ | 1,889,836 |
| | $ | (552,654 | ) | | | $ | 155,563 | | | $ | (1,651,799 | ) | | $ | 1,271,242 |
|
6. REVOLVING LINE OF CREDITDEBT FACILITIES
Granite Falls Energy:
GFE has two credit facilities with a lender. The first is a seasonal revolving operating loan facility in the amount of $5,660,000. The second is a revolving term loan facility in the amount of $18,000,000. However, the amount available for borrowing under this facility reduces by $2,000,000 semi-annually beginning September 1, 2014, with final payment due March 1, 2018.
The Company has a Loan Agreement with a bank. Underinterest rates for both facilities are based on the Loan Agreement,bank's "One Month LIBOR Index Rate," plus 2.8% and 3.05% on the Company has aseasonal and revolving line of credit with a maximum of $6,000,000term commitments, respectively. The facilities are available through AprilMarch 31, 2017 and March 31, 2018, respectfully. The outstanding balance on the revolving term loan on October 31, 2013 and October 31, 2012 was $2,513,674 and is$4,891,952, respectively. GFE currently has no outstanding balance on the seasonal revolving operating loan facility.
The credit facilities require GFE to comply with certain financial covenants. As of October 31, 2013 and October 31, 2012, GFE was in compliance with these financial covenants and expects to be in compliance throughout fiscal 2014.
The credit facilities are secured by substantially all assets of the Company's assets. The interest rate on the revolving line of credit is at 0.25 percentage points above the prime rate as reported by the Wall Street Journal, with a minimum rate of 4.5% and 5.0% at October 31, 2011 and 2010, respectively. The interest rate on the revolving line of credit at October 31, 2011 and 2010 was 4.5% and 5.0%, respectively, the minimum rate under the terms of the agreement. At October 31, 2011 and 2010, the Company hadCompany. There are no outstanding balance on this line of credit. The Company is required to maintain a savings account balance with the Bank totaling 10%collateral requirements as part of the maximum amount available on the line ofthis credit to serve as collateral on this line of credit. At both October 31, 2011 and 2010, this amount totaled $600,000 and is included in restricted cash.facility.
At October 31, 2011, the Company2013, GFE also had letters of credit totaling $435,928$337,928 with the bank as part of a credit requirement of Northern Natural Gas. These letters of credit reducewere reduced by $49,000 in November 2013.
As part of the acquisition of Project Viking discussed in Note 3, GFE assumed a note payable with Granite Falls Bank with a principal amount of $5,000,000. This note was paid in full on August 19, 2013.
GRANITE FALLS ENERGY, LLC AND SUBSIDIARIES
Notes to Consolidated Financial Statements
October 31, 2013 and 2012
Also, as part of the acquisition of Project Viking discussed in Note 3, GFE issued a note payable to the previous owners of Project Viking with a principal amount of $4,024,500. The note matured on August 30, 2013 and interest accrued on the note at a rate of 4% per annum. This note was paid in full on August 26, 2013.
Heron Lake BioEnergy:
Term Note Payable
On May 17, 2013, HLBE renegotiated its term loan with AgStar in the amount availableof $17,400,000. HLBE must make equal monthly payments of principal and interest on the term loan based on a 10-year amortization, provided the entire principal balance and accrued and unpaid interest on the term loan is due and payable in full on the maturity date of September 1, 2016. In addition, HLBE is required to make additional payments annually on debt for up to 25%of the excess cash flow, as defined by the agreement, up to $2,000,000 per year. Through September 1, 2014, the loan bears interest at 5.75% as long as HLBE is in compliance with their debt covenants.
On September 1, 2014, the interest term loan will be adjusted to LIBOR plus 3.50% but not less than 5%. The loan agreements are secured by substantially all business assets and are subject to various financial and non-financial covenants that limit distributions and debt and require minimum debt service coverage, net worth, and working capital requirements. HLBE was in compliance with the covenants of its master loan agreement with AgStar as of October 31, 2013.
Revolving Term Note
HLBE also obtained a three-year term revolving loan commitment in the amount of $20,500,000, under which AgStar agreed to make periodic advances to HLBE up to this original amount until September 1, 2016. Amounts borrowed by HLBE under the term revolving lineloan and repaid or prepaid may be re-borrowed at any time prior to maturity date of creditthe term revolving loan, provided that outstanding advances may not exceed the amount of the term revolving loan commitment. Amounts outstanding on the term revolving loan bear interest at a variable rate equal to the greater of a LIBOR rate plus 3.50% or 5.0%, payable monthly. HLBE also pays an unused commitment fee on the unused portion of the term revolving loan commitment at the rate of 0.35% per annum, payable in arrears in quarterly installments during the term of the term revolving loan. Under the terms of the new agreement, the term revolving loan commitment is scheduled to decline by $2,000,000 annually, beginning on October 31, 2013 and each anniversary date thereafter. The maturity date of the term revolving loan is September 1, 2016.
Subordinated Convertible Debt
On May 17, 2013, HLBE’s previous Board of Governors loaned the Company approximately $5,564,000.$1,400,000 as part of the convertible secured debt offering. An additional $3,700,000 was raised as part of a convertible debt offering during September 2013. The convertible secured debt is subordinated to the AgStar debt. The notes bear interest at 7.25% and are due in May 2018. On October 1, 2014, or immediately prior to the sale of all or effectively all of HLBE assets, each note is convertible to Class A stock at a rate of $0.30 per Class A unit. HLBE reserves the right to issue Class B units upon conversion if the principal balance of the convertible debt exceeds the authorized Class A units at the conversion rate. At the issuance, each debt holder had the option to convert to Class A units. As a result, holders elected to convert $934,500 in September for 3,115,000 Class A units.
GRANITE FALLS ENERGY, LLC AND SUBSIDIARIES
Notes to Consolidated Financial Statements
October 31, 2013 and 2012
7. LONG-TERM DEBT
Long-term debt consists of the following:
|
| | | | | | | |
| | October 31, 2011 | | October 31, 2010 |
| Economic Development Authority (“EDA”) Loans: | | | |
| City of Granite Fall/Minnesota Investment Fund | $ | — |
| | $ | 232,431 |
|
| Less: Current Maturities | — |
| | (61,133 | ) |
| | | | |
| Total Long-Term Debt | $ | — |
| | $ | 171,298 |
|
|
| | | | | | |
| | October 31, 2013 |
| October 31, 2012 |
|
| GRANITE FALLS ENERGY: | | |
| Capital One Shuttlewagon Railcar Mover (5 year term at 3.875%, due in monthly installments of $10,995) | $ | 382,918 |
| $ | 497,636 |
|
| Revolving Term Loan | 2,513,674 |
| 4,891,952 |
|
|
|
|
| HERON LAKE BIOENERGY: |
|
|
| Term note payable to lending institution (including premium of approximately $1.74m) | 18,317,800 |
| — |
|
| Revolving term note payable to lending institution (including premium of approximately $283k) | 6,263,158 |
| — |
|
| Assessment payable as part of water treatment agreement, due in semi-annual installments of $189,393 with interest at 6.55%, enforceable by statutory lien, with the final payment due in 2021. The Company made deposits for one years' worth of debt service payments that are held on deposit to be applied with the final payments of the assessment. | 2,246,771 |
| — |
|
| Assessment payable as part of water treatment agreement, due in semi-annual installments of $25,692 with interest at 0.50%, enforceable by statutory lien, with the final payment due in 2016. | 152,698 |
| — |
|
| Assessment payable as part of water supply agreement, due in monthly installments of $3,942 with interest at 8.73%, enforceable by statutory lien, with the final payment due in 2019. | 205,209 |
| — |
|
| Note payable to electrical company with monthly payments of $6,250 with a 1% maintenance fee due each October, due September 2017. The electrical company is a member of the Company. | 293,750 |
| — |
|
| Note payable to a lending institution for the construction of the pipeline assets initially due in December 2011, converted in February 2012 to a term loan with a three year repayment period. Interest is at 5.29% and the note, along with the line of credit in Note 8, is secured by substantially all assets of Agrinatural. | 1,013,132 |
| — |
|
| Note payable to noncontrolling interest member of Agrinatural. Interest is at 5.425%, with a maturity date of October 2014. | 300,000 |
| — |
|
| Equipment payable on corn oil separation equipment from a vendor. The Company pays approximately $40,000 per month conditioned upon revenue generated from the corn oil equipment. The monthly payment includes implicit interest of 5.57% until maturity in May 2015 and the note is secured by the equipment. | 640,653 |
| — |
|
| Subordinated Convertible Debt with interest of 7.25% paid on a semi-annual basis. | 4,143,000 |
| — |
|
| Totals | 36,472,763 |
| 5,389,588 |
|
| Less amounts due within one year | 3,490,808 |
| 114,718 |
|
| Net long-term debt | $ | 32,981,955 |
| $ | 5,274,870 |
|
GRANITE FALLS ENERGY, LLC AND SUBSIDIARIES
Notes to Consolidated Financial Statements
October 31, 20112013 and 20102012
EDA Loans:
On February 1, 2006, the Company signed a Loan Agreement with the CityEstimated maturities of Granite Falls, MN (“EDA Loan Agreement”) for amounts to be borrowed from several state and regional economic development authorities. The original amounts for the City of Granite Falls / Minnesota Investment Fund (“MIF”)long-term debt at October 31, 2013 are as follows:
|
| | |
Original Amount: | | $500,000 |
Interest Rate: | | 1% |
Principal and Interest Payments: | | Semi-Annual |
Initial Maturity Date: | | June 15, 2014 |
|
| | | |
| 2014 | $ | 3,490,808 |
|
| 2015 | 2,846,762 |
|
| 2016 | 21,602,578 |
|
| 2017 | 522,563 |
|
| 2018 | 7,022,813 |
|
| After 2018 | 987,239 |
|
| Total long-term debt | $ | 36,472,763 |
|
Amounts borrowed under the EDA Loan Agreements were secured by a second mortgage on all of the assets of the Company. On August 26, 2011, the MIF loan was paid in full and there were no prepayment penalties assessed.
8.7. LEASES
The CompanyGFE has a lease agreement with a leasing company for 75 hopper cars to assist with the transport of distiller's grains by rail. In November 2010, the original lease was renewed for an additional five-year period. Based on final manufacturing and interest costs, the Company will pay the leasing company $620 per month plus $0.03 per mile traveled in excess of 36,000 miles per year. Rent expense for these leases was $553,000, $604,000$557,000, $552,000 and $604,000$553,000 for the fiscal years ended October 31, 2011, 20102013, 2012 and 2009,2011, respectively.
At October 31, 2011, the Company hadGFE has lease agreements with three leasing companies for 147176 rail car leases for the transportation of the Company's ethanol with various maturity dates through October 2017. The rail car lease payments are due monthly in the aggregate amount of approximately $89,000.$121,000. Rent expense for these leases was $1,171,000, $1,058,000$1,437,000, $1,278,000 and $721,000$1,171,000 for the fiscal years ended October 31, 2011, 20102013, 2012 and 2009,2011, respectively.
In March 2011, the Company amended an existing lease for an additional 30HLBE leases equipment, primarily rail cars, under operating leases through 2017. Rent expense for the transportation of the Company's ethanol. The lease term is for five years. The rail car lease payments are due monthly in the aggregate amount offiscal 2013, 2012, and 2011 was approximately $16,350 ($545 per car).
$1,800,000, $2,200,000, and $1,800,000, respectively.
At October 31, 2011,2013, the Company had the following minimum commitments for payments of rentals under operating leases which at inception had a non-cancelable termsterm of more than one year:
|
| | | | |
| Periods Ending October 31, | |
| 2012 | | $ | 1,769,844 |
|
| 2013 | 1,525,314 | |
| 2014 | 1,252,119 | |
| 2015 | 978,339 | |
| 2016 | 255,490 | |
| Thereafter | 188,320 | |
| Total minimum lease commitments | | $ | 5,969,426 |
|
|
| | | | |
| November 1, 2013 to October 31, 2014 | | $ | 2,602,286 |
|
| November 1, 2014 to October 31, 2015 | | 1,640,775 |
|
| November 1, 2015 to October 31, 2016 | | 940,910 |
|
| November 1, 2016 to October 31, 2017 | | 474,004 |
|
| November 1, 2017 to October 31, 2018 | | 60,816 |
|
| Total minimum lease commitments | | $ | 5,718,791 |
|
GRANITE FALLS ENERGY, LLC
Notes to Financial Statements
October 31, 2011 and 2010
9.8. FAIR VALUE
The following table provides information on those derivative assets measured at fair value on a recurring basis at October 31, 2011:2013:
| | | |
Carrying Amount in Balance Sheet October 31, 2011 |
Fair Value October 31, 2011 | Fair Value Measurement Using |
Carrying Amount in Balance Sheet October 31, 2013 |
Fair Value October 31, 2013 | Fair Value Measurement Using |
Quoted Prices in Active Markets (Level 1) | Significant Other Observable Inputs (Level 2) |
Significant unobservable inputs (Level 3) | Quoted Prices in Active Markets (Level 1) | Significant Other Observable Inputs (Level 2) |
Significant unobservable inputs (Level 3) |
| Financial Assets: | | |
| Financial Liabilities: | | |
| Derivative Instruments | $ | 404,050 |
| $ | 404,050 |
| $ | 404,050 |
| $ | — |
| $ | — |
| $ | (75,113 | ) | $ | (75,113 | ) | $ | (75,113 | ) | $ | — |
| $ | — |
|
GRANITE FALLS ENERGY, LLC AND SUBSIDIARIES
Notes to Consolidated Financial Statements
October 31, 2013 and 2012
The following table provides information on those derivative assets measured at fair value on a recurring basis at October 31, 2010:2012:
| | | |
Carrying Amount in Balance Sheet October 31, 2010 |
Fair Value October 31, 2010 | Fair Value Measurement Using |
Carrying Amount in Balance Sheet October 31, 2012 |
Fair Value October 31, 2012 | Fair Value Measurement Using |
Quoted Prices in Active Markets (Level 1) | Significant Other Observable Inputs (Level 2) |
Significant unobservable inputs (Level 3) | Quoted Prices in Active Markets (Level 1) | Significant Other Observable Inputs (Level 2) |
Significant unobservable inputs (Level 3) |
| Financial Assets: | | |
| Financial Liabilities: | | |
| Derivative Instruments | $ | 752,500 |
| $ | 752,500 |
| $ | 752,500 |
| $ | — |
| $ | — |
| $ | (45,563 | ) | $ | (45,563 | ) | $ | (45,563 | ) | $ | — |
| $ | — |
|
We determine the fair value of commodity derivative instruments by obtaining fair value measurements from an independent pricing service. The fair value measurements consider observable data that may include dealer quotes and live trading levels from the Chicago Board of Trade market and New York Mercantile Exchange.
10.9. MEMBERS' EQUITY
The Company has one class of membership units. The units have no par value and have identical rights, obligations and privileges. Income and losses are allocated to all members based upon their respective percentage of units held. As of October 31, 2011, 20102013, 2012 and 2009,2011, the Company had 30,606, 30,606 and 30,656 membership units authorized, issued, and outstanding.outstanding, respectfully.
InSubsequent to year end, in December 2008, the Company redeemed 500 membership units totaling $500,000 from its former ethanol marketer.
In November 2009,2013, the Board of Governors declared a cash distribution of $150$180 per unit or $4,598,400$5,509,080 for unit holders of record as of NovemberDecember 19, 2009.2013. The distribution was paid on December 16, 2009.31, 2013.
In November 2010,December 2011, the Board of Governors declaredexercised its discretion to redeem 50 membership units totaling $66,420 from an investor due to a cash distribution of $300 per unit or $9,196,800 for unit holders of record as of November 23, 2010. The distribution was paidunique restriction on December 15, 2010.transfers situation.
In October 2011, the Board of Governors declared a cash distribution of $300 per unit or $9,196,800 for unit holders of record as of October 27, 2011. The distribution was paid on December 15, 2011.
In December 2011November 2010, the Board of Governors exercised its discretion to redeem 50 membership units totaling $66,250 from an investor due todeclared a unique restrictioncash distribution of $300 per unit or $9,196,800 for unit holders of record as of November 23, 2010. The distribution was paid on transfers situation.December 15, 2010.
11.10. EMPLOYEE BENEFIT PLANS
The Company has a defined contribution plan available to all of its qualified employees. The Company contributes a match of 50% of the participant's salary deferral up to a maximum of 3% of the employee's salary. Company contributions totaled approximately $46,000, $44,000,$50,000, $51,000, and $41,000$46,000 for the fiscal years ended October 31, 2013, 2012, and 2011, 2010, and 2009, respectively.
GRANITE FALLS ENERGY, LLC AND SUBSIDIARIES
Notes to Consolidated Financial Statements
October 31, 20112013 and 20102012
12.11. INCOME TAXES
The differences between the financial statement basis and tax basis of assets are based on the following:
| | | | October 31, 2011 | | October 31, 2010 | October 31, 2013 | October 31, 2012 |
| | | | |
|
| Financial statement basis of assets | $ | 63,441,322 |
| | $ | 59,767,540 |
| $ | 112,673,222 |
| $ | 61,133,132 |
|
| Organization & start-up costs capitalized for tax purposes, net | 821,605 |
| | 893,886 |
| 625,720 |
| 715,109 |
|
| Tax depreciation greater than book depreciation | (27,702,345 | ) | | (24,936,468 | ) | (24,977,852 | ) | (25,653,678 | ) |
| Unrealized derivatives gains | (404,050 | ) | | (752,500 | ) | |
| Unrealized derivatives losses | | 75,113 |
| 45,563 |
|
| Capitalized inventory | 20,000 |
| | 12,200 |
| 35,761 |
| 10,957 |
|
| | |
| | |
| |
| Net effect of consolidation of acquired subsidiary | | (10,396,697 | ) | — |
|
| Income tax basis of assets | $ | 36,176,532 |
| | $ | 34,984,658 |
| $ | 78,035,267 |
| $ | 36,251,083 |
|
| | | | |
| | |
|
| Financial statement basis of liabilities | | $ | 44,305,219 |
| $ | 11,277,807 |
|
| Debt premium - acquisition fair value adjustment | | (2,023,441 | ) | — |
|
| Income tax basis of liabilities | | $ | 42,281,778 |
| $ | 11,277,807 |
|
| | | | |
|
There were no material differences between the financial statement basis and tax basis of the Company's liabilities.
13.12. COMMITMENTS AND CONTINGENCIES
Corn Storage and Grain Handling Agreement and Purchase Commitments
The CompanyGFE has a corn storage and grain handling agreement with Farmers Cooperative Elevator (FCE), a member. Under the agreement, the Company agrees to purchase all of the corn needed for the operation of the plant FCE. The price of the corn purchased will be the bid price FCE establishes for the plant plus a set fee of per bushel.
At October 31, 2011, the Company2013, GFE had basis contracts for forward corn purchase commitments with FCE for 500,000350,000 bushels for delivery in December 2011.November 2013. At October 31, 2011,2013, the Company also had 460,000550,000 bushels of stored corn totaling $2,862,550approximately $2,346,000 with FCE that is included in inventory.
The Company purchased approximately $153,216,000 of corn from the member during fiscal 2013, of which approximately $4,002,000 is included in corn payable at October 31, 2013. The Company purchased approximately $148,289,000 of corn from the member during fiscal 2012, of which approximately $1,996,000 is included in corn payable at October 31, 2012. The Company purchased approximately $123,676,000 of corn from the member during fiscal 2011, of which approximately $2,517,000 is included in corn payable at October 31, 2011. The Company purchased approximately $63,089,000 of corn from the member during fiscal 2010, of which approximately $1,931,000 is included in corn payable at October 31, 2010. The Company purchased approximately $60,390,000 of corn from the member during fiscal 2009.
Ethanol Marketing Agreement
Granite FallsGFE currently has an Ethanol Marketing Agreement (“Eco Agreement”) with Eco-Energy, Inc. (“Eco-Energy”). Pursuant to the Eco Agreement, Eco-Energy agrees to purchase the entire ethanol output of GFE's ethanol plant and to arrange for the transportation of ethanol; however, GFE is responsible for securing all of the rail cars necessary for the transport of ethanol by rail. GFE will pay Eco-Energy a certain percentage of the FOB plant price in consideration of Eco-Energy's services. The contract had an initial term of one year, and will continue to remain in effect until terminated by either party at its unqualified option, by providing written notice of not less than 90 days to the other party.
Ethanol marketing fees and commissions totaled approximately $1,006,000, $825,000,$796,000, $743,000, and 622,000$1,006,000 for the fiscal years ended October 31, 2011, 20102013, 2012 and 20092011 respectively, and are included net within revenues.
During the fourth quarter of fiscal year 2013, HLBE entered into a new marketing agreement with Eco-Energy, for the sale of ethanol. Under this ethanol agreement, Eco-Energy will purchase, market and resell 100% of the ethanol produced at the Company's
GRANITE FALLS ENERGY, LLC AND SUBSIDIARIES
Notes to Consolidated Financial Statements
October 31, 2013 and 2012
ethanol production facility and the Company will pay Eco-Energy a marketing fee based on a percentage of the applicable sale price of the ethanol. The marketing fee was negotiated based on prevailing market-rate conditions for comparable ethanol marketing services.
Ethanol Contracts
At October 31, 2011, the Company2013, GFE had forward contracts to sell approximately $15,667,000$6,283,000 of ethanol for various delivery periods from November 20112013 through December 20112013 which approximates 61%36% of its anticipated ethanol sales during that period.
At October 31, 2010, the Company2012, GFE had forward contracts to sell approximately $12,250,000$8,747,000 of ethanol for various delivery periods fromin November 2010 through December 2010.2012.
GRANITE FALLS ENERGY, LLC
Notes to Financial Statements
October 31, 2011 and 2010
Distillers Grain Marketing Agreement
During fiscal 2010, the Company hadGFE has a marketing agreement with a related company, CHS, Inc., for the purpose of marketing and selling all the distillers grains the Company elected to ship by rail from the plant. On October 29, 2010, the Company served a 90 day termination notice to CHS in accordance with the Marketing Agreement with an effective date of January 29, 2011. In December 2010, the Company entered into a new Marketing Agreement with RPMG, an unrelated party, for the purpose of marketing and selling all distillers grains produced by the Company. The contract commenced on February 1, 2011 with an initial term of one year, and will continue to remain in effect until terminated by either party at its unqualified option, by providing written notice of not less than 90 days to the other party. Distillers grain commissions totaled approximately $460,000, $210,000$745,000, $650,000 and $160,000$460,000 for the fiscal years ended October 31, 2011, 20102013, 2012 and 20092011 respectively, and are included net within revenues.
At October 31, 2011, the Company2013, GFE had forward contracts to sell approximately $4,624,000$3,052,000 of distillers grains for various delivery periods fromin November 20112013 through January 2012March 2014 which approximates 65%27% of its anticipated distillers grain sales during that period.
At October 31, 2010, the Company2012, GFE had forward contracts to sell approximately $1,153,000$1,773,000 of distillers grains for various delivery periods fromin November 2012 which approximates 65%.
Gavilon Ingredients, LLC serves as the distillers' grains marketer for HLBE pursuant to an off-take agreement that became effective as of November 1, 2013. Under this agreement, Gavilon Ingredients, LLC purchases all of the distillers' grains produced at our Heron Lake ethanol plant in exchange for a service fee.
Corn Oil Marketing Agreement
GFE has a Marketing Agreement with RPMG, an unrelated party, for the purpose of marketing and selling all corn oil produced by the Company. The contract commenced on April 29, 2010 through June 2011.with an initial term of one year, and will continue to remain in effect until terminated by either party at its unqualified option, by providing written notice of not less than 90 days to the other party. Corn oil commissions totaled approximately $74,000, $55,000 and $44,000 for the fiscal years ended October 31, 2013, 2012 and 2011 respectively, and are included net within revenues.
Natural Gas Contracts
At October 31, 2011, the Company2013, GFE had no forward contracts to purchase natural gas.
At October 31, 2012, GFE had forward contracts to purchase $1,797,600$719,000 of natural gas at prices with delivery periods from November 20112012 through March 2012 which approximates 57% of its anticipated2013.
HLBE has natural gas purchases during that period.
Atagreements with a minimum purchase commitment of approximately 1,600,000 MMBTU per year until October 31, 2010, the Company had forward contracts to purchase $1,842,000 of natural gas at prices with delivery periods from November 2010 through March 2011.2014.
Contract for Natural Gas Pipeline to Plant
The CompanyGFE has an agreement with an unrelated company for the construction of and maintenance of 9.5 miles of natural gas pipeline that will serve the plant. The agreement requires the Company to receive a minimum of 1,400,000 DT of natural gas annually through the term of the agreement. The Company is charged a fee based on the amount of natural gas delivered through the pipeline.
This agreement will continue in effect until December 31, 2015 at which time it will automatically renew for consecutive terms of one year. A twelve monthmonths prior written notice is required to be given by either party to terminate this agreement.
GRANITE FALLS ENERGY, LLC AND SUBSIDIARIES
Notes to Consolidated Financial Statements
October 31, 2013 and 2012
At the HLBE plant, we have a facilities agreement with Northern Border Pipeline Company which allows us access to an existing interstate natural gas pipeline located approximately 16 miles north from the plant. Agrinatural Gas, LLC ("Agrinatural Gas"), owned by our subsidiary, HLBE Pipeline Company, LLC, and Rural Energy Solutions, was formed to own and operate the pipeline and transports gas to HLBE pursuant to a transportation agreement. HLBE Pipeline Company, LLC owns 73% of Agrinatural Gas. HLBE also has a base agreement for the sale and purchase of natural gas with Constellation NewEnergy—Gas Division, LLC ("Constellation"). HLBE buys all of its natural gas from Constellation and this agreement runs for a three year period from November 1, 2011 to October 31, 2014.
13. CONCENTRATIONS
Commitment to Purchase Real EstateThe Company has identified certain concentrations that are present in their business operations. GFE's revenue from ethanol sales is derived from a single customer under an ethanol marketing agreement described in Note 12. Sales under that agreement account for approximately
Subsequent to64%, 80% and 83% of the Company's consolidated revenues, net of derivative activity, during fiscal year ended2013, 2012 and 2011, respectively. Accordingly, 65% and 81% of the Company's consolidated receivable balance at October 31, 2013 and 2012, respectively, is related to that same customer. GFE's revenue from distillers grain and corn oil sales is derived from a single customer under a marketing agreement described in Note 12. Sales under that agreement account for approximately 19%, 21% and 17% of the Company's consolidated revenues, net of derivative activity, during fiscal 2013, 2012 and 2011, respectively. Accordingly, 20% and 18% of the Company entered into contractsCompany's consolidated receivable balance at October 31, 2013 and 2012, respectively, is related to purchase certain real estate in exchange for an aggregate commitment of approximately $3,400,000.that same customer.
14. LEGAL PROCEEDINGS
From time to time in the ordinary course of business, the Company may be named as a defendant in legal proceedings related to various issues, including without limitation, workers' compensation claims, tort claims, or contractual disputes. We are not currently a party to any material pending legal proceedings and we are not currently aware of any such proceedings contemplated by governmental authorities.
GRANITE FALLS ENERGY, LLC AND SUBSIDIARIES
Notes to Consolidated Financial Statements
October 31, 20112013 and 20102012
15. QUARTERLY FINANCIAL DATA (UNAUDITED)
Summary quarterly results are as follows:
| | | | First Quarter | | Second Quarter | | Third Quarter | | Fourth Quarter | | First Quarter | | Second Quarter | | Third Quarter | | Fourth Quarter |
| Fiscal year ended October 31, 2011 | | | | | | | | |
| Fiscal year ended October 31, 2013 | | | | | | | | | |
| Revenues | $ | 30,716,346 |
| | $ | 34,537,750 |
| | $ | 45,414,923 |
| | $ | 45,852,470 |
| | $ | 47,117,122 |
| | $ | 48,020,602 |
| | $ | 48,884,076 |
| | $ | 80,079,134 |
|
| Gross profit | 3,533,733 |
| | 3,704,535 |
| | 2,068,381 |
| | 4,861,424 |
| | 832,144 |
| | 3,629,972 |
| | 2,710,179 |
| | 6,581,018 |
|
| Operating income | 2,975,612 |
| | 3,245,729 |
| | 1,550,481 |
| | 4,393,545 |
| | 269,449 |
| | 3,047,007 |
| | 2,197,158 |
| | 5,521,116 |
|
| Net income | 3,011,596 |
| | 3,270,110 |
| | 1,586,882 |
| | 4,423,268 |
| |
| Basic and diluted earnings per unit | 98.24 |
| | 106.67 |
| | 51.76 |
| | 144.29 |
| |
| Net income attributable to GFE | | | 221,427 |
| | 3,031,943 |
| | 2,173,701 |
| | 4,874,950 |
|
| Basic and diluted earnings per unit attributable to GFE | | | 7.23 |
| | 99.06 |
| | 71.02 |
| | 159.31 |
|
|
| | | | | | | | | | | | | | | | | |
| | | First Quarter | | Second Quarter | | Third Quarter | | Fourth Quarter |
| Fiscal year ended October 31, 2010 | | | | | | |
| | |
|
| Revenues | | $ | 23,424,562 |
| | $ | 22,237,999 |
| | $ | 23,632,382 |
| 23,632,382 |
| $ | 25,994,509 |
|
| Gross profit | | 2,346,940 |
| | 1,730,098 |
| | 1,386,818 |
| | 4,679,335 |
|
| Operating income | | 1,837,999 |
| | 1,267,328 |
| | 919,429 |
| | 4,160,693 |
|
| Net income | | 1,927,176 |
| | 1,298,247 |
| | 939,019 |
| | 4,197,870 |
|
| Basic and diluted earnings per unit | | 62.86 |
| | 42.35 |
| | 30.63 |
| | 136.94 |
|
|
| | | | | | | | | | | | | | | | |
| | | First Quarter | | Second Quarter | | Third Quarter | | Fourth Quarter |
| Fiscal year ended October 31, 2012 | | | | | | |
| | |
|
| Revenues | | $ | 43,745,776 |
| | $ | 39,025,122 |
| | $ | 42,435,763 |
| | $ | 49,955,382 |
|
| Gross profit (loss) | | 3,687,950 |
| | 657,416 |
| | 54,694 |
| | (1,946,091 | ) |
| Operating income (loss) | | 3,024,214 |
| | 66,935 |
| | (597,187 | ) | | (2,489,589 | ) |
| Net income (loss) | | 3,042,288 |
| | 116,466 |
| | (565,637 | ) | | (2,432,510 | ) |
| Basic and diluted earnings (loss) per unit | | 99.29 |
| | 3.81 |
| | (18.49 | ) | | (79.36 | ) |
|
| | | | | | | | | | | | | | | | |
| | | First Quarter | | Second Quarter | | Third Quarter | | Fourth Quarter |
| Fiscal year ended October 31, 2009 | | | | | | | | |
| Revenues | | $ | 20,782,742 |
| | $ | 21,529,863 |
| | $ | 25,829,076 |
| | $ | 23,140,350 |
|
| Gross profit (loss) | | (289,074 | ) | | (559,732 | ) | | 1,929,793 |
| | 2,736,655 |
|
| Operating income (loss) | | (810,049 | ) | | (1,078,241 | ) | | 1,395,798 |
| | 2,263,972 |
|
| Net income (loss) | | (1,506,486 | ) | | (1,071,243 | ) | | 1,395,123 |
| | 2,268,786 |
|
| Basic and diluted earnings (loss) per unit | | (48.36 | ) | | (34.94 | ) | | 45.51 |
| | 74.01 |
|
|
| | | | | | | | | | | | | | | | |
| | | First Quarter | | Second Quarter | | Third Quarter | | Fourth Quarter |
| Fiscal year ended October 31, 2011 | | | | | | | | |
| Revenues | | $ | 30,716,346 |
| | $ | 34,537,750 |
| | $ | 45,414,923 |
| | $ | 45,852,470 |
|
| Gross profit | | 3,533,733 |
| | 3,704,535 |
| | 2,068,381 |
| | 4,861,424 |
|
| Operating income | | 2,975,612 |
| | 3,245,729 |
| | 1,550,481 |
| | 4,393,545 |
|
| Net income | | 3,011,596 |
| | 3,270,110 |
| | 1,586,882 |
| | 4,423,268 |
|
| Basic and diluted earnings per unit | | 98.24 |
| | 106.67 |
| | 51.76 |
| | 144.29 |
|
The above quarterly financial data is unaudited, but in the opinion of management, all adjustments necessary for a fair presentation of the selected data for these periods presented have been included.
ITEM 9. CHANGES IN AND DISAGREEMENTS WITH ACCOUNTANTS ON ACCOUNTING AND FINANCIAL DISCLOSURE.
None.
ITEM 9A. CONTROLS AND PROCEDURES
Disclosure Controls and Procedures
We maintain disclosure controls and procedures that are designed to ensure that information required to be disclosed in the reports that we file or submit pursuant to the Securities Exchange Act of 1934 (the “Exchange Act”) is recorded, processed, summarized and reported within the time periods specified in the Securities and Exchange Commission's rules and forms, and that such information is accumulated and communicated to our management, including our Chief Executive Officer and Chief Financial Officer, as appropriate, to allow for timely decisions regarding required disclosures.
Our management, including our Chief Executive Officer and General Manager (the principal executive officer), Tracey Olson,Steve Christensen, along with our Chief Financial Officer (the principal financial and accounting officer), Stacie Schuler, have reviewed and evaluated the effectiveness of our disclosure controls and procedures (as defined in Rule 13a-15(e) and Rule 15d-15(e) under the Securities Exchange Act of 1934, as amended) as of October 31, 2011.2013. Based onupon this review and evaluation, these officers have concluded that our disclosure controls and procedures are effective to ensure that information required to be disclosed in the reports that we file or submit under the Exchange Act is recorded, processed, summarized and reported within the time periods required by the forms and rules of the Securities and Exchange Commission; and to ensure that the information required to be disclosed by an issuer in the reports that it files or submits under the Exchange Act is accumulated and communicated to our management, including our principal executive and principal financial officers, or persons performing similar functions, as appropriate to allow timely decisions regarding required disclosure.
Internal Control Over Financial Reporting
Inherent Limitations Over Internal Controls
The Company’s internal control over financial reporting is designed to provide reasonable assurance regarding the reliability of financial reporting and the preparation of financial statements for external purposes in accordance with generally accepted accounting principles. The Company’s internal control over financial reporting includes those policies and procedures that:
(i) pertain to the maintenance of records that, in reasonable detail, accurately and fairly reflect the transactions and dispositions of the Company’s assets;
(ii) provide reasonable assurance that transactions are recorded as necessary to permit preparation of financial statements in accordance with generally accepted accounting principles, and that the Company’s receipts and expenditures are being made only in accordance with authorizations of the Company’s management and governors; and
(iii) provide reasonable assurance regarding prevention or timely detection of unauthorized acquisition, use, or disposition of the Company’s assets that could have a material effect on the financial statements.
Management, including the Company’s Chief Executive Officer and Chief Financial Officer, does not expect that the Company’s internal controls will prevent or detect all errors and all fraud. A control system, no matter how well designed and operated, can provide only reasonable, not absolute, assurance that the objectives of the control system are met. Further, the design of a control system must reflect the fact that there are resource constraints, and the benefits of controls must be considered relative to their costs. Because of the inherent limitations in all control systems, no evaluation of internal controls can provide absolute assurance that all control issues and instances of fraud, if any, have been detected. Also, any evaluationevaluations of the effectiveness of controls in future periods are subject to the risk that those internal controls may become inadequate because of changes in business conditions, or that the degree of compliance with the policies or procedures may deteriorate.
Management’s Annual Report on Internal Control Over Financial Reporting.
Our management is responsible for establishing and maintaining adequate internal control over financial reporting (as defined in Rule 13a-15(f) under the Securities Exchange Act, of 1934, as amended) to provide reasonable assurance regarding the reliability of our financial reporting and the preparation of our financial statements for external purposes in accordance with U.S. generally accepted accounting purposes.principles.
Management conducted an evaluation of the effectiveness of the Company’s internal control over financial reporting based on the criteria set forth in Internal Control—IntegratedControl-Integrated Framework issued by the Committee of Sponsoring Organizations of the Treadway Commission (“COSO”). Management’s assessment included evaluation of elements such as the design and operating effectiveness of key financial reporting controls, process documentation, accounting policies, and overall control environment.Commission. Based on this evaluation, management has concluded that the Company’s internal control over financial reporting
was effective as of October 31, 2011.2013.
This annual report does not include anAn attestation report offrom our registered public accounting firm regardingon our internal control over financial reporting. Management’sreporting is not included in this annual report was not subject tobecause an attestation by our registered public accounting firm pursuant to temporary rulesreport is only required under the regulations of the Securities and Exchange Commission that permit us to provide only management’s report in this annual report.for accelerated filers and large accelerated filers.
Changes in Internal Control Over Financial Reporting.
There were no changes in our internal control over financial reporting during the fourth quarter of our 20112013 fiscal year, which were identified in connection with management’s evaluation required by paragraph (d) of rules 13a-15 andor 15d-15 under the Exchange Act, that have materially affected, or are reasonably likely to materially affect, our internal control over financial reporting.
ITEM 9B. OTHER INFORMATION
None.Entry into a Material Definitive Agreement
On August 27, 2013, HLBE finalized Amendment No. 1 to Sixth Amended and Restated Master Loan Agreement (the “Amendment”) with AgStar Financial Services, PCA (“AgStar”). The Amendment amends certain provisions of the Sixth Amended and Restated Master Loan Agreement dated May 17, 2013 (the “MLA”) by and between HLBE and AgStar. The Amendment was effective as of July 31, 2013, which is the same date on which GFE indirectly, through Project Viking, L.L.C. (“Project Viking”), acquired a majority of HLBE's outstanding membership units and the same date on which GFE and HLBE entered into a Management Services Agreement, under which GFE supplies its personnel to act as part-time officers and managers of HLBE for the positions of Chief Executive Officer, Chief Financial Officer and Commodity Risk Manager. The following material amendments to the MLA are set forth in the Amendment: (i) the power of Project Viking or its affiliates to appoint a majority of HLBE’s governors is not defined as a “change of control” of HLBE; (ii) revolving advances under HLBE’s term revolving loan may be used for the purchase of corn inventory; (iii) The remaining amounts raised by HLBE in its offering (the “Offering”) of a maximum of $12 million in aggregate principal amount of promissory notes titled “7.25% Secured Subordinated Notes due 2018” (the "Notes") were to be paid to AgStar on or before October 1, 2013, whether subscribers in the Offering confirmed their subscriptions for notes or instead elected to convert the principal amount of their subscription into a subscription for HLBE’s membership units; and (iv) in light of the Management Services Agreement by and between GFE and HLBE, the prior requirements to identify and hire an interim and permanent Chief Executive Officer reasonably acceptable to AgStar by specified dates were removed. The Amendment is attached to this Annual Report as Exhibit 10.36.
On September 5, 2013, HLBE finalized a Corn Oil Marketing Agreement with RPMG, Inc. (“RPMG”) dated September 4, 2013. Pursuant to this agreement, HLBE will sell to RPMG, and RPMG will purchase and market, all of the corn oil produced by HLBE at HLBE's Heron Lake, Minnesota ethanol production plant. HLBE will pay RPMG a commission based on each pound of corn oil sold by RPMG. The agreement became effective as of September 16, 2013 and is attached to this Annual Report as Exhibit 10.37.
On September 19, 2013, HLBE finalized an Ethanol Marketing Agreement dated September 17, 2013 with Eco-Energy, LLC (“Eco-Energy”). Under the agreement, Eco-Energy will purchase the entire ethanol output of HLBE's Heron Lake, Minnesota ethanol production plant. Eco-Energy is required to use commercially reasonable efforts to solicit competitive market offers for the ethanol purchased from HLBE and to use reasonable efforts to optimize freight, fuel characteristics, and other marketing tools to provide competitive market pricing for HLBE's ethanol production. HLBE will pay Eco-Energy a marketing fee for its services under the agreement, as well as a lease fee for railcars leased from Eco-Energy to HLBE. The term of the agreement commenced on November 1, 2013. The agreement is attached to this Annual Report as Exhibit 10.38.
On September 24, 2013, HLBE finalized a Distiller's Grain Off-Take Agreement with Gavilon Ingredients, LLC (“Gavilon”). Under the agreement, Gavilon will purchase all of the distillers grains produced at HLBE's ethanol production facility in Heron Lake, Minnesota. Gavilon is required to use commercially reasonable efforts to achieve the highest price available under prevailing market conditions based on bids from Gavilon's customers and taking into account freight and other logistics costs. HLBE will pay Gavilon a service fee for its services under the agreement. The term of the agreement commenced on November 1, 2013. The agreement is attached to this Annual Report as Exhibit 10.39.
Entry into a Material Definitive Agreement and Creation of a Direct Financial Obligation or an Obligation under an Off-Balance Sheet Arrangement of a Registrant
On September 18, 2013, HLBE entered into an indenture (the “Indenture”) between HLBE and U.S. Bank National Association (“U.S. Bank”), as trustee and collateral agent, in connection with the closing of HLBE's Offering of the Notes. An aggregate principal amount of $4,143,000 of the Notes are governed by the Indenture. The Notes are subordinated secured obligations of HLBE, with interest payable on April 1 and October 1 of each year, beginning April 1, 2014, through the maturity date of October 1, 2018 at a rate of 7.25% per annum. The Notes are secured by a second mortgage and lien position on, among other assets, HLBE’s property, plant and equipment located in Heron Lake, Minnesota, which mortgage and lien position are junior to and subordinated to HLBE’s senior debt. Beginning on October 1, 2014, and each anniversary date thereafter prior to the maturity date of the Notes, and on the maturity date of the Notes, and prior to the effective time of any sale of all or substantially all of the assets of HLBE or merger or consolidation of HLBE with another person, subject to and upon compliance with the provisions of Article 4 of the Indenture, each holder of Notes has the right, at such holder’s option, to irrevocably convert all (but not less than all) of such holder’s Notes into the HLBE’s membership units at the rate of $0.30 of principal amount per unit. In addition to the anniversary and event conversion rights, prior to any prepayment date, each holder of Notes has the right, at such holder’s option, to irrevocably convert the principal amount to be prepaid into HLBE’s membership units at the rate of $0.30 of principal amount per unit. Subject to this conversion right, HLBE may, with at least 45 days but not more than 60 days notice to the holders thereof, prepay the outstanding amount of the Notes in whole or in part with accrued interest to the date of such prepayment on the amount prepaid, without penalty or premium, provided that any prepayment of Notes must be done pro rata to all holders of Notes. The Indenture provides for customary events of default.
PART III
Pursuant to General Instruction G(3), we omit Part III, Items 10, 11, 12, 13 and 14 and incorporate such items by reference to an amendment to this Annual Report on Form 10-K or to a definitive proxy statement to be filed with the Securities and Exchange Commission within 120 days after the close of the fiscal year covered by this Annual Report (October 31, 2010)2013).
ITEM 10. GOVERNORS,DIRECTORS, EXECUTIVE OFFICERS AND CORPORATE GOVERNANCE
The Information required by this Item is incorporated by reference to the 20122014 Proxy Statement.
ITEM 11. EXECUTIVE COMPENSATION
The Information required by this Item is incorporated by reference to the 20122014 Proxy Statement.
ITEM 12. SECURITY OWNERSHIP OF CERTAIN BENEFICIAL OWNERS AND MANAGEMENT AND RELATED MEMBERSTOCKHOLDER MATTERS.
The Information required by this Item is incorporated by reference to the 20122014 Proxy Statement.
ITEM 13. CERTAIN RELATIONSHIPS AND RELATED TRANSACTIONS, AND GOVERNORDIRECTOR INDEPENDENCE
The Information required by this Item is incorporated by reference to the 20122014 Proxy Statement.
ITEM 14. PRINCIPAL ACCOUNTANT FEES AND SERVICES.
The Information required by this Item is incorporated by reference to the 20122014 Proxy Statement.
PART IV
ITEM 15. EXHIBITS, FINANCIAL STATEMENT SCHEDULES
Exhibits Filed as Part of this Report and Exhibits Incorporated by Reference.
The following exhibits and financial statements are filed as part of, or are incorporated by reference into, this report:
The financial statements appear beginning at page 3234 of this report.
| |
| (2) | Financial Statement Schedules |
All supplemental schedules are omitted as the required information is inapplicable or the information is presented in the financial statements or related notes.
|
| | | | | |
Exhibit No. | Exhibit | | Filed Herewith | | Incorporated by Reference |
2.1 | Plan of merger between GS Acquisition, Inc. and Gopher State Ethanol, LLC dated April 13, 2006. | | | | Exhibit 2.1 to the registrant's Form 10-QSB filed with the Commission on June 12, 2006. |
3.1 | Articles of Organization of the registrant. | | | | Exhibit 3.1 to the registrant's Form 10-QSB filed with the Commission on August 15, 2005. |
3.2 | Second Amendment to the Fifth Amended and Restated Operating and Member Control Agreement of the Company. | | | | Exhibit 3.2 to the registrant's Form 10-QSB filed with the Commission on September 14, 2006. |
4.1 | Form of Membership Unit Certificate. | | | | Exhibit 4.1 to the registrant's 1st amendment to the registration statement on Form SB-2 (Commission File 333-99065). |
10.1 | Corn Storage and Delivery Agreement and Pre-Closing Memorandum dated October 6, 2003 between the Company and Farmers Cooperative Elevator Company. | | | | Exhibit 10.2 to the registrant's Form 10-QSB filed with the Commission on November 14, 2003. |
10.2 | Debt financing commitment from First National Bank of Omaha. | | | | Exhibit 10.7 to the registrant's post effective amendment No. 3 to the registration statement on Form SB-2 (Commission File 333-112567). |
10.3 | Fagen, Inc. qualifying bridge loan documents. | | | | Exhibit 10.8 to the registrant's post effective amendment No. 3 to the registration statement on Form SB-2 (Commission File 333-112567). |
10.4 | Glacial Lakes Energy, LLC qualifying bridge loan documents. | | | | Exhibit 10.9 to the registrant's post effective amendment No. 3 to the registration statement on Form SB-2 (Commission File 333-112567). |
10.5 | Grain Procurement Agreement with Farmers Cooperative Elevator Company. | | | | Exhibit 10.2 to the registrant's Form 10-QSB filed with the Commission on November 15, 2004. |
10.6 | Operating and Management Agreement with Glacial Lakes Energy, LLC. | | | | Exhibit 10.4 to the registrant's Form 10-QSB filed with the Commission on November 15, 2004. |
10.7 | Consulting Agreement with Glacial Lakes Energy, LLC. | | | | Exhibit 10.5 to the registrant's Form 10-QSB filed with the Commission on November 15, 2004. |
10.8 | Rail Construction Agreement with MGA Railroad Construction, Inc. dated October 30, 2004. | | | | Exhibit 10.12 to the registrant's Form 10-QSB filed with the Commission on November 15, 2004. |
10.9 | Design Build Agreement dated August 31, 2004 with Fagen, Inc. | | | | Exhibit 10.10 to the registrant's Form 10-KSB filed with the Commission on March 31, 2005. |
10.10 | Ethanol Marketing Agreement dated August 31, 2004 with Aventine Renewable Energy, Inc.+ | | | | Exhibit 10.11 to the registrant's Form 10-KSB filed with the Commission on March 31, 2005. |
10.11 | Electric Service Agreement dated August, 2004 with Minnesota Valley Cooperative Light and Power. | | | | Exhibit 10.13 to the registrant's Form 10-KSB filed with the Commission on March 31, 2005. |
10.12 | Loan Agreement with First National Bank of Omaha. | | | | Exhibit 10.14 to the registrant's Form 10-KSB filed with the Commission on March 31, 2005. |
10.13 | Distiller's Grain Marketing Agreement with Commodity Specialists Company. | | | | Exhibit 10.15 to the registrant's Form 10-KSB filed with the Commission on March 31, 2005. |
10.14 | Trinity Rail Proposal for Rail Cars. | | | | Exhibit 10.16 to the registrant's Form 10-KSB filed with the Commission on March 31, 2005. |
10.15 | Job Opportunity Building Zone Business Subsidy Agreement. | | | | Exhibit 10.17 to the registrant's Form 10-KSB filed with the Commission on March 31, 2005. |
10.16 | Agreement Regarding Plan of Reorganization between Gopher State Ethanol, LLC and Granite Falls Energy, LLC dated May 3, 2005. | | | | Exhibit 10.1 to the registrant's Form 10-QSB filed with the Commission on May 16, 2005. |
10.17 | Lease agreement between Granite Falls Energy, LLC and GS Acquisition, Inc. dated April 13, 2006. | | | | Exhibit 10.1 to the registrant's Form 10-QSB filed with the Commission on June 12, 2006. |
See the "Exhibit Index" following the signature pages.
|
| | | | | |
10.18 | Loan agreement between the City of Granite Falls, MN and Granite Falls Energy, LLC dated February 1, 2006. | | | | Exhibit 10.2 to the registrant's Form 10-QSB filed with the Commission on June 12, 2006. |
10.19 | Promissory note to the City of Granite Falls, MN dated February 1, 2006. | | | | Exhibit 10.3 to the registrant's Form 10-QSB filed with the Commission on June 12, 2006. |
10.20 | Statutory mortgage in favor of the City of Granite Falls, MN dated February 1, 2006. | | | | Exhibit 10.4 to the registrant's Form 10-QSB filed with the Commission on June 12, 2006. |
10.21 | Joint powers and participation agreement dated February 1, 2006. | | | | Exhibit 10.5 to the registrant's Form 10-QSB filed with the Commission on June 12, 2006. |
10.22 | Termination of development agreement dated February 1, 2006. | | | | Exhibit 10.6 to the registrant's Form 10-QSB filed with the Commission on June 12, 2006. |
10.23 | Lease Termination Agreement dated October 10, 2006, between Granite Falls Energy, LLC and
Gopher State Ethanol, LLC.
| | | | Exhibit 99.1 to the registrant's Form 8-K filed with the Commission on October 13, 2006. |
10.24 | Pipeline Construction Agreement with Wagner Construction dated August 16, 2006. | | | | Exhibit 10.18 to the registrant's Form 10-KSB filed with the Commission on January 29, 2007. |
10.25 | Pump Station Construction Contract with Rice Lake Construction Group dated August 16, 2006. | | | | Exhibit 10.19 to the registrant's Form 10-KSB filed with the Commission on January 29, 2007. |
10.26 | Consent to Assignment and Assumption of Marketing Agreement dated August 23, 2007. | | | | Exhibit 10.1 to the registrant's Form 10-QSB filed with the Commission on September 13, 2007. |
10.27 | Ethanol Marketing Agreement with Eco-Energy, Inc. dated December 24, 3008. + | | | | Exhibit 10.1 to the registrant's Form 10-K filed with the Commission on January 27, 2009. |
10.28 | Corn Oil Marketing Agreement between the registrant and Renewable Products Marketing Group, LLC dated April 29, 2010. + | | | | Exhibit 10.1 to the registrant's Form 10-Q filed with the Commission on June 14, 2010. |
10.29 | Amendment to Distiller's Grain Marketing Agreement between the registrant and CHS, Inc. dated June 7, 2010. | | | | Exhibit 10.2 to the registrant's Form 10-Q filed with the Commission on June 14, 2010. |
10.30 | Amended Employment Contract between Granite Falls Energy, LLC and Tracey Olson dated November 22, 2010. | | | | Exhibit 10.30 to the registrant's Form 10-K filed with the Commission on January 26, 2011. |
10.31 | Distillers Grains Marketing Agreement between RPMG, Inc. and Granite Falls Energy, LLC dated December 10, 2010.+ | | | | Exhibit 10.31 to the registrant's Form 10-K filed with the Commission on January 26, 2011. |
10.32 | Insider Trading Policy of Granite Falls Energy, LLC dated February 17, 2011. | | | | Exhibit 10.1 to the registrant's Form 10-Q filed with the Commission on March 16, 2011. |
10.33 | Ethanol Marketing Agreement Amendment No. 2 between Eco-Energy, Inc. and Granite Falls Energy, LLC dated August 30, 2011. + | | | | Exhibit 99.1 to the registrant's Form 8-K filed with the Commission on September 1, 2011. |
10.34 | Amended Employment Contract between Tracey L. Olson and Granite Falls Energy, LLC dated November 21, 2011. | | X | | |
14.1 | Code of Ethics | | | | Exhibit 14.1 to the registrant's 10-KSB filed with the Commission on March 30, 2004. |
31.1 | Certificate Pursuant to 17 CFR 240.13a-14(a) | | X | | |
31.2 | Certificate Pursuant to 17 CFR 240.13a-14(a) | | X | | |
32.1 | Certificate Pursuant to 18 U.S.C. Section 1350 | | X | | |
32.2 | Certificate Pursuant to 18 U.S.C. Section 1350 | | X | | |
|
| | | | | |
101 | The following financial information from Granite Falls Ethanol, LLC's Annual Report on Form 10-K for the fiscal year ended October 31, 2011, formatted in XBRL (eXtensible Business Reporting Language): (i) Balance Sheets as of October 31, 2011 and October 31, 2010, (ii) Statements of Operations for the fiscal years ended October 31, 2011, 2010, and 2009, (iii) Statement of Changes in Members' Equity; (iv) Statements of Cash Flows for the fiscal years ended October 31, 2011, 2010, and 2009, and (v) the Notes to Financial Statements.** | | | | |
(+) Confidential Treatment Requested.
(**) Furnished herewith.
SIGNATURES
Pursuant to the requirements of Section 13 or 15(d) of the Securities Exchange Act of 1934, the registrant has duly caused this report to be signed on its behalf by the undersigned, thereunto duly authorized.
|
| | |
| | | GRANITE FALLS ENERGY, LLC |
| | | |
| Date: | January 30, 201229, 2014 | /s/ Tracey L. OlsonSteve Christensen |
| | | Tracey L. OlsonSteve Christensen |
| | | Chief Executive Officer |
| | | |
| Date: | January 30, 201229, 2014 | /s/ Stacie Schuler |
| | | Stacie Schuler |
| | | Chief Financial Officer |
| | | |
Pursuant to the requirements of the Securities Exchange Act of 1934, this report has been signed below by the following persons on behalf of the registrant and in the capacities and on the dates indicated.
|
| | | |
| Date: | January 30, 201229, 2014 | | /s/ Tracey OlsonSteve Christensen |
| | | | Tracy Olson,Steve Christensen, Chief Executive Officer and General Manager |
| | | | (Principal Executive Officer) |
| | | | |
| Date: | January 30, 201229, 2014 | | /s/ Stacie Schuler |
| | | | Stacie Schuler, Chief Financial Officer |
| | | | (Principal Financial and Accounting Officer) |
| | | | |
| Date: | January 30, 201229, 2014 | | /s/ Paul Enstad |
| | | | Paul Enstad, Governor and Chairman |
| | | | |
| Date: | January 30, 201229, 2014 | | /s/ Rodney R. Wilkison |
| | | | Rodney R. Wilkison, Governor and Vice Chairman |
| | | | |
| Date: | January 30, 201229, 2014 | | /s/ Dean Buesing |
| | | | Dean Buesing, Governor |
| | | |
Date: | January 30, 2012 | | /s/ Julie Oftedahl-Volstad |
| | | Julie Oftedahl-Volstad, Governor and Secretary |
| | | | |
| Date: | January 30, 201229, 2014 | | /s/ Leslie Bergquist |
| | | | Dennis Wagner,Leslie Bergquist, Governor |
| | | | |
| Date: | January 30, 201229, 2014 | | /s/ Steven CoreMarten Goulet |
| | | | Steven Core,Marten Goulet, Governor |
| | | | |
| Date: | January 30, 201229, 2014 | | /s/ Kenton Johnson |
| | | Kenton Johnson, Governor |
| | | |
| Date: | January 29, 2014 | | /s/ Shannon Johnson |
| | | Shannon Johnson, Governor |
| | | |
| Date: | January 29, 2014 | | /s/ Myron Peterson |
| | | | Myron Peterson, Governor |
| | | | |
| Date: | January 30, 2012 | | /s/ Shannon Johnson |
| | | Shannon Johnson, Governor |
| | | |
Date: | January 30, 201229, 2014 | | /s/ David Thompson |
| | | | David Thompson, Governor |
| | | | |
| Date: | January 30, 201229, 2014 | | /s/ Marty Seifert |
| | | | Marty Seifert, Alternate Governor |
GRANITE FALLS ENERGY, LLC
INDEX TO EXHIBITS TO FORM 10-K FOR FISCAL YEAR ENDED OCTOBER 31, 2013
|
| | | | | | |
| Exhibit No. | Exhibit | | Filed Herewith | | Incorporated by Reference To: |
| 3.1 | Articles of Organization | | | | Exhibit 3.1 to the registrant's Form SB-2 filed with the Commission on August 30, 2002 (File No. 000-51277). |
| 3.2 | Amendment of Articles of Organization | | | | Exhibit 3.1 to the registrant's Form 10-QSB filed with the Commission on August 15, 2005 (File No. 000-51277). |
| 3.3 | Fifth Amended and Restated Operating and Member Control Agreement, First Amendment to the Fifth Amended and Restated Operating and Member Control Agreement and Second Amendment to the Fifth Amended and Restated Member Control Agreement | | | | Exhibit 3.2 to the registrant's Form 10-QSB filed with the Commission on September 14, 2006 (File No. 000-51277). |
| 3.4 | Third Amendment to the Fifth Amended and Restated Operating and Member Control Agreement | | | | Exhibit 3.1 to the registrant's Form 10-Q filed with the Commission on June 14, 2013 (File No. 000-51277). |
| 4.1 | Form of Membership Unit Certificate. | | | | Exhibit 4.1 to the registrant's Pre-Effective Amendment No. 1 to Form SB-2 filed with the Commission on December 20, 2002 (File No. 000-51277). |
| 10.1 | Corn Storage and Delivery Agreement and Pre-Closing Memorandum dated October 6, 2003 between the Company and Farmers Cooperative Elevator Company. | | | | Exhibit 10.2 to the registrant's Form 10-QSB filed with the Commission on November 14, 2003 (File No. 000-51277). |
| 10.2 | Grain Procurement Agreement with Farmers Cooperative Elevator Company. | | | | Exhibit 10.2 to the registrant's Form 10-QSB filed with the Commission on November 15, 2004 (File No. 000-51277). |
| 10.3 | Electric Service Agreement dated August, 2004 with Minnesota Valley Cooperative Light and Power. | | | | Exhibit 10.13 to the registrant's Form 10-KSB filed with the Commission on March 31, 2005 (File No. 000-51277). |
| 10.4 | Trinity Rail Proposal for Rail Cars. | | | | Exhibit 10.16 to the registrant's Form 10-KSB filed with the Commission on March 31, 2005 (File No. 000-51277). |
| 10.5 | Job Opportunity Building Zone Business Subsidy Agreement. | | | | Exhibit 10.17 to the registrant's Form 10-KSB filed with the Commission on March 31, 2005 (File No. 000-51277). |
| 10.6 | Ethanol Marketing Agreement with Eco-Energy, Inc. dated December 24, 2008. (+) | | | | Exhibit 10.1 to the registrant's Form 10-K filed with the Commission on January 27, 2009 (File No. 000-51277). |
| 10.7 | Corn Oil Marketing Agreement between the registrant and Renewable Products Marketing Group, LLC dated April 29, 2010. (+) | | | | Exhibit 10.1 to the registrant's Form 10-Q filed with the Commission on June 14, 2010 (File No. 000-51277). |
| 10.8 | Distillers Grains Marketing Agreement between RPMG, Inc. and Granite Falls Energy, LLC dated December 10, 2010. (+) | | | | Exhibit 10.31 to the registrant's Form 10-K filed with the Commission on January 26, 2011 (File No. 000-51277). |
| 10.9 | Amended Employment Contract between Granite Falls Energy, LLC and Tracey Olson dated November 22, 2010. | | | | Exhibit 10.30 to the registrant's Form 10-K filed with the Commission on January 26, 2011 (File No. 000-51277). |
| 10.10 | Insider Trading Policy of Granite Falls Energy, LLC dated February 17, 2011. | | | | Exhibit 10.1 to the registrant's Form 10-Q filed with the Commission on March 16, 2011 (File No. 000-51277). |
| 10.11 | Ethanol Marketing Agreement Amendment No. 2 between Eco-Energy, Inc. and Granite Falls Energy, LLC dated August 30, 2011. (+) | | | | Exhibit 99.1 to the registrant's Form 8-K filed with the Commission on September 1, 2011 (File No. 000-51277). |
|
| | | | | | |
| 10.12 | Amended Employment Contract between Tracey L. Olson and Granite Falls Energy, LLC dated November 21, 2011. | | | | Exhibit 10.34 to the registrant's Form 10-K filed with the Commission on January 30, 2012 (File No. 000-51277). |
| 10.13 |
| CEO/GM Employment Contract between Steve Christensen and Granite Falls Energy, LLC dated April 19, 2012. | | | | Exhibit 10.1 to the registrant's Form 10-Q filed with the Commission on June 14, 2012 (File No. 000-51277). |
| 10.14 |
| Master Loan Agreement between United FCS, PCA and Granite Falls Energy, LLC dated August 22, 2012. | | | | Exhibit 10.14 to the registrant's Form 10-K filed with the Commission on January 29, 2013 (File No. 000-51277). |
| 10.15 |
| Revolving Term Loan Supplement between United FCS, PCA and Granite Falls Energy, LLC dated August 22, 2012. | | | | Exhibit 10.15 to the registrant's Form 10-K filed with the Commission on January 29, 2013 (File No. 000-51277). |
| 10.16 |
| Monitored Revolving Credit Supplement between United FCS, PCA and Granite Falls Energy, LLC dated August 22, 2012. | | | | Exhibit 10.16 to the registrant's Form 10-K filed with the Commission on January 29, 2013 (File No. 000-51277). |
| 10.17 | Membership Interest Purchase Agreement effective July 31, 2013 by and between Granite Falls Energy, LLC and Roland J. Fagen and Diane K. Fagen. | | | | Exhibit 10.1 to the registrant's Form 10-Q filed with the Commission on September 16, 2013 (File No. 000-51277). |
| 10.18 | Subscription Agreement Including Investment Representations, dated July 31, 2013, by and between Heron Lake BioEnergy, LLC and Project Viking, L.L.C. | | | | Exhibit 10.2 to the registrant's Form 10-Q filed with the Commission on September 16, 2013 (File No. 000-51277). |
| 10.19 | Subscription Supplement Agreement dated July 31, 2013, by and among Heron Lake BioEnergy, LLC, Granite Falls Energy, LLC and Project Viking, L.L.C. | | | | Exhibit 10.3 to the registrant's Form 10-Q filed with the Commission on September 16, 2013 (File No. 000-51277). |
| 10.20 | Management Services Agreement effective as of July 31, 2013 between Granite Falls Energy, LLC and Heron Lake BioEnergy, LLC. | | | | Exhibit 10.4 to the registrant's Form 10-Q filed with the Commission on September 16, 2013 (File No. 000-51277). |
| 10.21 | Secured Promissory Note dated July 31, 2013, between Roland (Ron) J. Fagen and Diane K. Fagen, jointly as Holder, and Granite Falls Energy, LLC, as Borrower. | | | | Exhibit 10.5 to the registrant's Form 10-Q filed with the Commission on September 16, 2013 (File No. 000-51277). |
| 10.22 | Promissory Note, dated July 23, 2013, between Granite Falls Bank, as Lender, and Project Viking, L.L.C. and Roland J. (Ron) Fagen, as Borrower. | | | | Exhibit 10.6 to the registrant's Form 10-Q filed with the Commission on September 16, 2013 (File No. 000-51277). |
| 10.23 | Assumption Agreement among Granite Falls Energy, LLC, Project Viking, L.L.C., Roland J. Fagen and Granite Falls Bank. | | | | Exhibit 10.7 to the registrant's Form 10-Q filed with the Commission on September 16, 2013 (File No. 000-51277). |
| 10.24 | Creditor and Debtors Agreement dated July 31, 2013 by and among Granite Falls Energy, LLC, Project Viking, L.L.C., Roland “Ron” J. Fagen and Granite Falls Bank. | | | | Exhibit 10.8 to the registrant's Form 10-Q filed with the Commission on September 16, 2013 (File No. 000-51277). |
| 10.25 | Revolving Credit Supplement dated July 26, 2013 between United FCS, PCA and Granite Falls Energy, LLC. | | | | Exhibit 10.9 to the registrant's Form 10-Q filed with the Commission on September 16, 2013 (File No. 000-51277). |
| 10.26 | Member Control Agreement of Heron Lake BioEnergy, LLC, as amended through August 30, 2011. | | | | Exhibit 3.2 to Heron Lake BioEnergy, LLC's ("HLBE's") Form 8-K dated September 2, 2011 (File No. 000-51825). |
| 10.27 | Indenture dated as of September 18, 2013, by and between Heron Lake BioEnergy, LLC and U.S. Bank National Association. | | | | Exhibit 4.1 to HLBE's Form 8-K dated September 8, 2013 (File No. 000-51825). |
| 10.28 | Industrial Water Supply Development and Distribution Agreement dated October 27, 2003 among Heron Lake BioEnergy, LLC (f/k/a Generation II Ethanol, LLC), City of Heron Lake, Jackson County, and Minnesota Soybean Processors. | | | | Exhibit 10.10 to HLBE's Registration Statement on Form 10 filed on August 22, 2008 (the "2008 Registration Statement") (File No. 000-51825). |
|
| | | | | | |
| 10.29 | Industrial Water Supply Treatment Agreement dated May 23, 2006 among Heron Lake BioEnergy, LLC, City of Heron Lake and County of Jackson. | | | | Exhibit 10.11 to HLBE's 2008 Registration Statement (File No. 000-51825). |
| 10.30 | Secured Promissory Note issued December 28, 2007 by Heron Lake BioEnergy, LLC as borrower to Federated Rural Electric Association as lender in principal amount of $600,000. | | | | Exhibit 10.20 to HLBE's 2008 Registration Statement (File No. 000-51825). |
| 10.31 | Electric Service Agreement dated October 17, 2007 by and between Interstate Power and Light Company and Heron Lake BioEnergy, LLC. | | | | Exhibit 10.22 to HLBE's 2008 Registration Statement (File No. 000-51825). |
| 10.32 | Sixth Amended and Restated Master Loan Agreement dated to be effective as of May 17, 2013 by and among AgStar Financial Services, PCA and Heron Lake BioEnergy, LLC. | | | | Exhibit 10.1 to HLBE's Form 10-Q for the quarter ended April 30, 2013 (File No. 000-51825). |
| 10.33 | Second Amended and Restated Term Note dated May 17, 2013 in principal amount of $17,404,344 by Heron Lake BioEnergy, LLC to AgStar Financial Services, PCA as lender. | | | | Exhibit 10.2 to HLBE's Form 10-Q for the quarter ended April 30, 2013 (File No. 000-51825). |
| 10.34 | Second Amended and Restated Term Revolving Note dated May 17, 2013 in principal amount of $20,500,000 by Heron Lake BioEnergy, LLC to AgStar Financial Services, PCA as lender. | | | | Exhibit 10.3 to HLBE's Form 10-Q for the quarter ended April 30, 2013 (File No. 000-51825). |
| 10.35 | Sixth Amended and Restated Mortgage, Security Agreement and Assignment of Rents and Leases dated May 17, 2013 between Heron Lake BioEnergy, LLC and AgStar Financial Services, PCA. | | | | Exhibit 10.4 to HLBE's Form 10-Q for the quarter ended April 30, 2013 (File No. 000-51825). |
| 10.36 | Amendment No. 1 to Sixth Amended and Restated Master Loan Agreement dated effective as of July 31, 2013 between Heron Lake BioEnergy, LLC and AgStar Financial Services, PCA. | | | | Exhibit 10.1 to HLBE's Form 8-K dated August 27, 2013 (File No. 000-51825). |
| 10.37 | Corn Oil Marketing Agreement dated September 4, 2013 by and among Heron Lake BioEnergy, LLC and RPMG, Inc. (+) | | | | Exhibit 10.76 to HLBE's Form 10-K for the year ended October 31, 2013 (File No. 000-51825). |
| 10.38 | Ethanol Marketing Agreement dated September 17, 2013 by and among Heron Lake BioEnergy, LLC and Eco-Energy, LLC. (+) | | | | Exhibit 10.77 to HLBE's Form 10-K for the year ended October 31, 2013 (File No. 000-51825). |
| 10.39 | Distiller's Grain Off-Take Agreement dated September 24, 2013 by and among Heron Lake Bio-Energy, LLC and Gavilon Ingredients, LLC. (+) | | | | Exhibit 10.78 to HLBE's Form 10-K for the year ended October 31, 2013 (File No. 000-51825). |
| 10.40 | Amendment No. 3 Ethanol Marketing Agreement dated September 17, 2013 by and between Eco-Energy, LLC and Granite Falls Energy, LLC. (+) | | X | | |
| 14.1 | Code of Ethics | | | | Exhibit 14.1 to the registrant's Form 10-KSB filed with the Commission on March 30, 2004 (File No. 000-51277). |
| 21.1 | Subsidiaries of the registrant | | X | | |
| 31.1 | Certification of Chief Executive Officer pursuant to 17 CFR 240.13a-14(a) | | X | | |
| 31.2 | Certification of Chief Financial Officer pursuant to 17 CFR 240.13a-14(a) | | X | | |
| 32.1 | Certification of Chief Executive Officer pursuant to 18 U.S.C. Section 1350 | | X | | |
|
| | | | | | |
| 32.2 | Certification of Chief Financial Officer pursuant to 18 U.S.C. Section 1350 | | X | | |
| 101 | The following financial information from Granite Falls Ethanol, LLC's Annual Report on Form 10-K for the fiscal year ended October 31, 2013, formatted in XBRL (eXtensible Business Reporting Language): (i) Balance Sheets as of October 31, 2013 and October 31, 2012, (ii) Statements of Operations for the fiscal years ended October 31, 2013, 2012, and 2011, (iii) Statement of Changes in Members' Equity; (iv) Statements of Cash Flows for the fiscal years ended October 31, 2013, 2012, and 2011, and (v) the Notes to Financial Statements.** | | | | |
(+) Confidential Treatment Requested.
(**) Furnished herewith.