UNITED STATES
SECURITIES AND EXCHANGE COMMISSION
Washington, DC 20549
Form 10-K
Annual Report Pursuant to Section 13 or 15(d) of the Securities Exchange Act of 1934
For the fiscal year ended January 31, 202128, 2024
Commission file number 000-25349

HOOKER FURNITUREFURNISHINGS CORPORATION
(Exact name of registrant as specified in its charter)
Virginia | 54-0251350 |
(State or other jurisdiction of incorporation or organization) | ( |
440 East Commonwealth Boulevard, Martinsville, VA 24112
(Address of principal executive offices, Zip Code)
(276) 632-2133
(Registrant’s telephone number, including area code)
(Former name, if changed since last report)
Securities registered pursuant to Section 12(b) of the Act:
Title of | Trading Symbol(s) | Name of on |
Common Stock, no par value | HOFT | NASDAQ Global Select Market |
Securities registered pursuant to Section 12(g) of the Act: None
Indicate by check mark if the registrant is a well-known seasoned issuer, as defined in Rule 405 of the Securities Act. Yes ☐ No ☒
Indicate by check mark if the registrant is not required to file reports pursuant to Section 13 or Section 15(d) of the Act. Yes ☐ No ☒
Indicate by check mark whether the registrant (1) has filed all reports required to be filed by Section 13 or 15(d) of the Securities Exchange Act of 1934 during the preceding 12 months (or for such shorter period that the registrant was required to file such reports), and (2) has been subject to such filing requirements for the past 90 days. Yes ☒ No ☐
Indicate by check mark whether the registrant has submitted electronically, every Interactive Data File required to be submitted pursuant to Rule 405 of Regulation S-T (Section 232.405 of this chapter) during the preceding 12 months (or for such shorter period that the registrant was required to submit such files). Yes ☒ No ☐
Indicate by check mark whether the registrant is a large accelerated filer, an accelerated filer, a non-accelerated filer, a smaller reporting company, or an emerging growth company. See the definitions of “large accelerated filer,” “accelerated filer”, “smaller reporting company”, and “emerging growth company” in Rule 12b-2 of the Exchange Act.
Large accelerated Filer ☐ | Accelerated filer ☒ |
Non-accelerated Filer ☐ | Smaller reporting company ☐ |
Emerging growth company ☐ |
If an emerging growth company, indicate by check mark if the registrant has elected not to use the extended transition period for complying with any new or revised financial accounting standards provided pursuant to Section 13(a) of the Exchange Act. ☐
Indicate by check mark whether the registrant has filed a report on and attestation to its management’s assessment of the effectiveness of its internal control over financial reporting under Section 404(b) of the Sarbanes-Oxley Act (15 U.S.C. 7262(b)) by the registered public accounting firm that prepared or issued its audit report. ☒
If securities are registered pursuant to Section 12(b) of the Act, indicate by check mark whether the financial statements of the registrant included in the filing reflect the correction of an error to previously issued financial statements. ☐
Indicate by check mark whether any of those error corrections are restatements that required a recovery analysis of incentive-based compensation received by any of the registrant’s executive officers during the relevant recovery period pursuant to §240.10D-1(b). ☐
Indicate by check mark whether the registrant is a shell company (as defined in Rule 12b-2 of the Exchange Act). Yes ☐ No ☒
State the aggregate market value of the voting and non-voting common equity held by non-affiliates computed by reference to the price at which the common equity was last sold, or the average bid and asked price of such common equity, as of the last business day of the registrant’s most recently completed second fiscal quarter: $247.1$214.8 million.
Indicate the number of shares outstanding of each of the registrant’s classes of common stock as of April 13, 2021:8, 2024:
Common stock, no par value |
|
(Class of common stock) | (Number of shares) |
Documents incorporated by reference: Portions of the registrant’s definitive Proxy Statement for its Annual Meeting of Shareholders scheduled to be held June 3, 20214, 2024 are incorporated by reference into Part III.
Hooker Furniture Corporation
Hooker Furnishings Corporation
TABLE OF CONTENTS
Part I | Page | |
Item 1. |
| |
Item 1A. |
| |
Item 1B. |
| |
Item 1C. | 19 | |
Item 2. |
| |
Item 3. |
| |
Item 4. |
| |
| ||
Part II | ||
Item 5. |
| |
Item 6. |
| |
Item 7. | Management’s Discussion and Analysis of Financial Condition and Results of Operations |
|
Item 7A. | 36 | |
Item 8. | 36 | |
Item 9. | Changes in and Disagreements With Accountants on Accounting and Financial Disclosure | 36 |
Item 9A. | 37 | |
Item 9B. | 37 | |
Item 9C. | Disclosure Regarding Foreign Jurisdictions that Prevent Inspections | 37 |
Part III | ||
Item 10. | 38 | |
Item 11. | 38 | |
Item 12. | Security Ownership of Certain Beneficial Owners and Management and Related Stockholder Matters | 38 |
Item 13. | Certain Relationships and Related Transactions, and Director Independence | 38 |
Item 14. | 38 | |
Part IV | ||
Item 15. | 39 | |
Item 16. | 41 | |
42 | ||
F-1 | ||
All references to 2024, 2023, 2022, 2021 2020, 2019, 2018, and 20172020 or other years are referring to our fiscal years, unless otherwise stated. Our fiscal years end on the Sunday closest to January 31, with fiscal 20212024 ending on January 31, 2021.28, 2024. Our quarterly periods are based on thirteen-week “reporting periods” (which end on a Sunday) rather than quarterly periods consisting of three calendar months. As a result, each quarterly period generally is thirteen weeks, or 91 days, long, except as noted below.days. In some years (generally once every six years) the fourth quarter will be fourteen weeks long and the fiscal year will consist of fifty-three weeks. The 2019
On January 31, 2022, the first day of our 2023 fiscal year, that ended on February 3, 2019 was a 53-weekwe entered into an Asset Purchase Agreement with Sunset HWM, LLC (“Sunset West”) and its three members to acquire substantially all of the assets of Sunset West (the “Sunset Acquisition”). The results of operations of Sunset West are included in the Domestic Upholstery segment’s results beginning with the fiscal 2023 first quarter. Consequently, Sunset West’s results are not included in our results prior to the 2023 fiscal year.
All references to the “Company,” “we,” “us” and “our” in this document refer to Hooker FurnitureFurnishings Corporation and its consolidated subsidiaries, unless specifically referring to segment information. All references to the “Hooker,”, “Hooker DivisionDivision(s),”, “Hooker Legacy Brands” or “traditional Hooker” divisions or companies refer to all current business units and brands except for those in the current components of ourHome Meridian segment. The Hooker Branded segment theincludes Hooker Casegoods and Hooker Upholstery. The Domestic Upholstery Segment includingsegment includes Bradington-Young, HF Custom (formerly Sam Moore, andMoore), Shenandoah Furniture and Sunset West. All Other which includes H Contract, Lifestyle Brands, and Lifestyle Brands.BOBO Intriguing Objects, a business acquired during fiscal 2024.
Forward-Looking Statements
Certain statements made in this report, including statements under Part II, Item 7. “Management’s Discussion and Analysis of Financial Condition and Results of Operations” and in the notes to the consolidated financial statements included in this report, are not based on historical facts, but are forward-looking statements. These statements reflect our reasonable judgment with respect to future events and typically can be identified by the use of forward-looking terminology such as “believes,” “expects,” “projects,” “intends,” “plans,” “may,” “will,” “should,” “would,” “could” or “anticipates,” or the negative thereof, or other variations thereon, or comparable terminology, or by discussions of strategy. Forward-looking statements are subject to risks and uncertainties that could cause actual results to differ materially from those in the forward-looking statements. Those risks and uncertainties include but are not limited to:
■ |
|
| general economic or business conditions, both domestically and internationally, including the current macro-economic uncertainties and challenges to the retail environment for home furnishings along with instability in the financial and credit markets, in part due to inflation and rising interest rates, including their potential impact on (i) our |
■ |
|
■ |
|
■ | changes in consumer preferences, including |
■ | difficulties in |
■ | risks associated with our reliance on offshore sourcing and the cost of imported goods, including fluctuation in the prices of purchased finished goods, |
■ |
|
■ |
|
|
|
|
|
■ |
|
■ | risks associated with our |
■ | risks associated with domestic manufacturing operations, including fluctuations in capacity utilization and the prices and availability of key raw materials, as well as changes in transportation, warehousing and domestic labor costs, availability of skilled labor, and environmental compliance and remediation costs; |
■ | risks associated with Home Meridian segment restructuring and cost-savings efforts, including our ability to timely reduce expenses and continue to return the segment to profitability; |
■ | the risks related to the Sunset Acquisition including maintaining Sunset West’s existing customer relationships, debt service costs, interest rate volatility, the use of operating cash flows to service debt to the detriment of other corporate initiatives or strategic opportunities, the possible loss of key employees from Sunset West, the disruption of ongoing business or inconsistencies in standards, controls, procedures and policies across the business which could adversely affect our internal control or information systems and the costs of bringing them into compliance and failure to realize benefits anticipated from the Sunset Acquisition; |
■ | the risks related to the BOBO Intriguing Objects acquisition, including the possible loss of a key BOBO employee, inconsistencies in standards, controls, procedures and policies across the business which could adversely affect our internal control or information systems and failure to realize benefits anticipated from the BOBO acquisition; |
■ | changes in U.S. and foreign government regulations and in the political, social and economic climates of the countries from which we source our products; |
■ | risks associated with product defects, including higher than expected costs associated with product quality and safety, regulatory compliance costs (such as the costs associated with the US Consumer Product Safety Commission’s new mandatory furniture tip-over standard, STURDY) related to the sale of consumer products and costs related to defective or non-compliant products, product liability claims and costs to recall defective products and the adverse effects of negative media coverage; |
■ | disruptions and damage (including those due to weather) affecting our Virginia or Georgia warehouses, our Virginia, North Carolina or California administrative facilities, our High Point, Las Vegas, and Atlanta showrooms or our representative offices or warehouses in Vietnam and China; |
■ | the risks specifically related to the concentrations of a material part of our sales and accounts receivable in only a few customers, including the loss of several large customers through business consolidations, failures or other reasons, or the loss of significant sales programs with major customers; |
■ | our inability to collect amounts owed to us or significant delays in collecting such amounts; |
■ |
|
|
|
| achieving and managing growth and change, and the risks associated with new business lines, acquisitions, including the selection of suitable acquisition targets, restructurings, strategic alliances and international operations; |
|
|
■ | capital requirements and costs; |
■ | risks associated with distribution through third-party retailers, such as non-binding dealership arrangements; |
■ | the cost and difficulty of marketing and selling our products in foreign |
■ | changes in domestic and international monetary policies and fluctuations in foreign currency exchange rates affecting the price of our imported products and raw materials; |
|
|
■ | price competition in the furniture |
|
|
|
|
Our forward-looking statements could be wrong in light of these and other risks, uncertainties and assumptions. The future events, developments or results described in this report could turn out to be materially different. Any forward-looking statement we make speaks only as of the date of that statement, and we undertake no obligation, except as required by law, to update any forward-looking statements whether as a result of new information, future events or otherwise and you should not expect us to do so.
Also, our business is subject to a number of significant risks and uncertainties any of which can adversely affect our business, results of operations, financial condition or future prospects. For a discussion of risks and uncertainties that we face, see the Forward-Looking Statements detailed above and Item 1A, “Risk Factors” below.
Investors should also be aware that while we occasionally communicate with securities analysts and others, it is against our policy to selectively disclose to them any material nonpublic information or other confidential commercial information. Accordingly, investors should not assume that we agree with any projection, forecast or report issued by any analyst regardless of the content of the statement or report, as we have a policy against confirming information issued by others.
Hooker FurnitureFurnishings Corporation
Part I
ITEM 1. BUSINESS
Hooker FurnitureFurnishings Corporation, incorporated in Virginia in 1924, is a designer, marketer and importer of casegoods (wooden and metal furniture), leather furniture, and fabric-upholstered furniture, lighting, accessories, and home decor for the residential, hospitality and contract markets. We also domestically manufacture premium residential custom leather, and custom fabric-upholstered furniture. We are ranked among the nation’s top five largest publicly traded furniture sources, based on 2019 shipments to U.S. retailers, according to a 2020 survey by a leading trade publication.
We believe that consumer tastes and channels in which they shop for furniture are evolving at a rapid pace and we continue to change to meet these demands. Our strategy is to leverage the financial strength afforded us by Hooker’s slower-growing but highly profitable traditional businesses in order to boost revenues and earnings both organically and by acquiring companies selling in faster-growing channels of distribution in which our traditional businesses are under-represented. Consequently, Hooker acquired Home Meridian on February 1, 2016 and Shenandoah Furniture on September 29, 2017.outdoor furniture.
Reportable Segments
FurnitureFurnishings sales account for all of our net sales. For financial reporting purposes and as described further below, we are organized into three reportable segments, Hooker Branded, Home Meridian and Domestic Upholstery. Our other businesses are aggregated into “All Other”. See Note 1718 -Segment Information to our consolidated financial statementsConsolidated Financial Statements for additional financial information regarding our operating segments.
Products
Our product lines cover the design spectrum of residential furniture:furnishings: traditional, contemporary and transitional. Further, our product lines are in the “good”, “better” and “best” product categories, which carry medium and upper price pointspoints. Hooker Furnishings Corporation consists of the following three operating segments and consist of:“All Other”:
■ | The Hooker Branded segment which includes two businesses: |
□ | Hooker Casegoods, which covers a wide range of design categories and includes home entertainment, home office, accent, dining and bedroom furniture in the upper-medium price points sold under the Hooker Furniture brand; and |
□ | Hooker Upholstery, imported upholstered furniture targeted at the upper-medium price-range. |
■ | The Home Meridian segment which includes the following brands/marketing units: |
□ |
|
| Pulaski Furniture, casegoods covering the complete design spectrum in a wide range of bedroom, dining room, accent and display cabinets at medium price points; |
□ | Samuel Lawrence Furniture, value-conscious offerings in bedroom, dining room, home office and youth furnishings; |
□ | Prime Resources International, value-conscious imported leather motion upholstery; and |
□ | Samuel Lawrence Hospitality, a designer and supplier of hotel furnishings targeted toward four and five-star |
|
|
■ | The Domestic Upholstery segment which includes the following operations: |
□ | Bradington-Young, a seating specialist in upscale motion and stationary leather furniture; |
□ | HF Custom (formerly Sam Moore |
□ | Shenandoah Furniture, an upscale upholstered furniture business specializing in private label sectionals, modulars, sofas, chairs, ottomans, benches, beds and dining chairs in the upper-medium price points for lifestyle specialty |
□ | Sunset West, a designer and manufacturer of comfortable, stylish and high-quality outdoor furniture. |
■ | All Other consisting of: |
□ | The H Contract product line which supplies upholstered seating and casegoods to upscale senior living and assisted living facilities through designers, design firms, industry dealers and distributors that service that market; |
□ | BOBO Intriguing Objects, a lighting, accessories and home décor source acquired in fiscal 2024 that offers a variety of one-of-a-kind designs; and |
□ | Lifestyle Brands, a business started in fiscal 2019 targeted at the interior designer channel. |
Sourcing
Imported Products
We have sourced products from foreign manufacturers for over thirty years, predominantly from Asia. Imported casegoods and upholstered furniture together accounted for approximately 83% of our net sales in both fiscal 2021 and fiscal 2020 and 84%70% of our net sales in fiscal 2019.2024, 72% of our net sales in fiscal 2023, and 82% of our net sales in fiscal 2022.
Our imported furniture business is subject to inherent risks in importing products manufactured abroad, including, but not limited to, supply disruptions and delays due to a variety of reasons, including our foreign suppliers’ factory capacities, factory shutdowns, and delays including those caused by the coronavirus (COVID-19)COVID-19 pandemic and possible similar health-related issues, much higher ocean freight costs, container and vessel space availability, currency exchange rate fluctuations, transportation-related issues, economic and political developments and instability, as well as the laws, policies and actions of foreign governments and the United States. These laws, policies and actions may include regulations affecting trade or the application of tariffs, much like the current 25% tariff on certain goods imported into the United States from China, including almost all furniture and furniture components manufactured in China since fiscal 2019. In response to these tariffs, we began re-sourcing products from non-tariff countries, primarily Vietnam, and reduced our Chinese imports to less than 20% by the end of fiscal 2021.tariffs.
Because of the large number and diverse nature of the foreign suppliers from which we source our imported products, we have flexibility in the sourcing of products among any particular supplier or country. However, a disruption in our supply chain from a major supplier or from Vietnam or China in general, could significantly compromise our ability to fill customer orders for products manufactured at that factory or in that country. Supply disruptions and delays on selected items could occur for six months or longer. If we were to be unsuccessful in obtaining those products from other sources or at a comparable cost, a disruption in our supply chain from a major furniture supplier, or from Vietnam or China in general, could decrease our sales, earnings and liquidity.
In fiscal 2021, many of our Chinese suppliers were closed or operating at reduced capacity due to the effects of COVID-19 and we experienced some out-of-stocks on better selling items. We offered and sold available goods on hand and in transit but were unable to fully mitigate the entire sales loss from these out-of-stocks. These suppliers were in the process of returning to full capacity when the COVID-19 crisis hit the U.S., resulting in order cancellations by many furniture customers, which caused many furniture wholesalers in the U.S. to cancel production orders with their Asian suppliers. Consequently, some supplier locations closed temporarily or reduced capacity and we experienced outages in select products as a result. While most of our Asian suppliers have returned to near full capacity, demand for furniture products has surged to historic levels. This unusually high demand has caused delays in the receipt of goods as suppliers scramble to fill orders, obtain shipping containers and steamship bookings. Additionally, port congestion has led to delays in unloading furniture once it reaches US ports. All of these factors, combined with the production halt that regularly occurs at Chinese and Vietnamese New Year holidays, have significantly lengthened the time it takes to receive goods and our order backlog is at historic levels.
Given the sourcing capacity available in Vietnam China and other low-cost producing countries such as Mexico, Malaysia, and India, as well as our supply chain diversification efforts, we currently believe the risks from these potential supply disruptions are manageable; however, we have limitedmanageable in the long-term. However, our insight into the extent to which our business could be further impacted by COVID-19 and there are many unknowns including, how long we will be impacted, the severity of the impacts and the probability of a recurrence ofwide scale global or regional disruption or pandemic, like the recent COVID-19 or similar regional or global pandemics.pandemic, remains limited. See Item 1A, “Risk Factors” for additional information on our risks related to imported products.
For imported products, we generally negotiate firm pricing with foreign suppliers in U.S. Dollars, typically for a term of at least one year. However, under certain circumstances, we may re-negotiate pricing during the year. Due to the global supply chain crisis and inflation pressure in Asia and the U.S., we were forced to re-negotiate prices multiple times during fiscal 2022 and 2023. We largely did not have to re-negotiate prices during fiscal 2024 as these pressures stabilized. We accept the exposure to exchange rate movements during these negotiated periods. We do not use derivative financial instruments to manage this risk but could choose to do so in the future. Since we transact our imported product purchases in U.S. Dollars, a relative decline in the value of the U.S. Dollar compared to the currencies from which we obtain our imported products could increase the price we pay for imported products beyond the negotiated periods. We generally expect to reflect substantially all of the effects of any price increases from suppliers in the prices we charge for imported products. However, these price changes could adversely impact sales volume and profit margin during the affected periods. Conversely, a relative increase in the value of the U.S. Dollar compared to the currencies from which we obtain our imported products could decrease the cost of imported products and favorably impact net sales and profit margins during the affected period. However, due to other factors, such as inflationary pressure, in China and other countries, we may not fully realize savings when exchange rates fall. Therefore, lower exchange rates may only have a tempering effect on future price increases by merely delaying cost increases on imported products. See also Item 7A. “Quantitative and Qualitative Disclosures About Market Risk.”
Raw Materials
Significant materials used in manufacturing our domestic upholstered furniture products include leather, fabric, foam, wooden and metal frames and electronic mechanisms. Most of the leather is imported from Italy and South America, and China, and is purchased as full hides and cut and sewn in our facilities or is purchased as pre-cut and sewn kits processed by our vendors to our pattern specifications. We believe our sources for raw materials are adequate and that we are not dependent on any one supplier. However, we have seen some delays in some pre-cut and sewn kits imported from China as a result of COVID-19 and our domestic upholstery segment is currently experiencing foam shortages due to a recent severe weather event in Texas that affected production of the by-products used in foam production. Our five largest domestic upholstery suppliers accounted for 28%35% of our raw materials purchases for domestic upholstered furniture manufacturing operations in fiscal 2021.2024. Should disruptions with these suppliers occur, other than macro disruptions affecting all such suppliers, we believe we could successfully source these products from other suppliers without significant disruption to our operations. For example, due to the Russian invasion of Ukraine, there was a shortage of Russian Birch which was the third largest source of US hardwood plywood imports in calendar 2021. Prior to the invasion, a large portion of the plywood used at one division of our Domestic Upholstery segment was Russian Birch. We were able to find an alternative plywood source at a higher price during fiscal 2023 and this issue was mitigated as of early calendar 2023.
Customers
Our home furnishings products are sold through a variety of retailers including independent furniture stores, department stores, mass merchants, national chains, warehouse clubs, catalog merchants, interior designers, and e-commerce retailers. OneNo single customer (Wayfair LLC and its subsidiaries) accounted for approximately 12%more than 6% of our consolidated sales in fiscal 2021.2024. Our top five customers accounted for approximately 30%22% of our fiscal 20212024 consolidated sales. The loss of any one or more of these customers would have a material adverse impact on our business. RoughlyLess than 2% of our sales in fiscal 20212024 were to international customers. We define sales to international customers which we define as sales to customers outside of the United States and Canada.Canada since our independent domestic sales force services both countries.
Competition
The furniture industry is highly competitive and includes a large number of foreign and domestic manufacturers and importers, none of which dominates the market in our price points. While the markets in which we compete include a large number of relatively small and medium-sized manufacturers, certain competitors have substantially greater sales volumes and financial resources than we do. U.S. imports of furniture produced overseas, such as from Vietnam, and China, have stabilized in recent years. The primary competitive factors for home furnishings in our price points include price, style, availability, service, quality and durability. Competitive factors in the hospitality and contract furniture markets include product value and utility, lead times, on-time delivery and the ability to respond to requests for special and non-standard products. We believe our design capabilities, ability to import and/or manufacture upholstered furniture, product value, longstanding customer and supplier relationships, significant sales, distribution and inventory capabilities, ease of ordering, financial strength, experienced management and customer support are significant competitive advantages.
Warehousing and Distribution
We distribute furniture to retailers directly from factories and warehouses in Asia via our container direct programs and from our distribution centersfacilities in Virginia, North Carolina, Georgia and California, and in limited cases, from customer operated warehouses in strategic locations. We are inDue to our exit from the processAccentrics Home (“ACH”) business unit which demanded significant amounts of consolidating our Home Meridian segment’s East Coast warehousing operations into an 800,000inventory to meet the quick shipping requirements of its e-commerce model, we reduced the physical footprint of the Georgia warehouse by 400,000 square foot distribution center in Liberty County, Georgia. We believe that this strategically located facility nearfeet over the Portcourse of Savannah and major interstate highways will allow us to more efficiently service our customers, reduce transportation costs and better position us for future growth. This leased facility is currently under construction and we expect to occupy it in the Fall of 2021. It is our policy and industry practice to allow order cancellation for casegoods up to the time of shipment or, in the case of container direct orders, up until the time the container is booked with the ocean freight carrier, therefore, customer orders for casegoods are not firm. However, domestically produced upholstered products are predominantly custom-built and consequently, cannot be cancelled once the leather or fabric has been cut. Additionally, our hospitality products are highly customized and are generally not cancellable.fiscal 2024.
Working Capital Practices
Inventory: Inventory
We generally import casegoods inventory and certain upholstery items in amounts that enable us to meet the delivery requirements of our customers, our internal in-stock goals and minimum purchase requirements from our sourcing partners. However, during fiscal 2019 and 2020 we accelerated the delivery and subsequently increased inventory levelsThe majority of some imported products from China due to the threat of tariffs on those products. Inventory levels fell significantly during fiscal 2021 as compared to the end of fiscal 2020 due primarily to the COVID-19 crisis. In early calendar 2020, Asian factories closed as COVID levels spiked in Asia. They began to slowly re-open as levels spiked in the US and the demand for home furnishings plummeted. As the initial crisis subsided in the US and demand surged, Asian manufacturing capacity was strained, and receipts of products slowed. Additionally, container availability and steamship capacity became scarce. We expect these conditions to improve as we move through fiscal 2022. AHooker Branded segment are shipped from our U.S. warehouses, while a large percentage of products sold at our Home Meridian segment are not warehoused by us but ship directly to our customers and thus are not included asin our inventory. Our Domestic Upholstery segment products are made to order and shipped shortly after they are produced; however, this segment carries significant amounts of raw materials for production. We do not carry significant amounts of domestically produced upholstery inventory or hospitality products, as most of these products are built to order and are shipped shortly after their manufacture.manufacture directly to the customer.
The majority of products in the Hooker Branded segment are shipped from our U.S. warehouses. In calendar 2021, the COVID-19 related lockdowns at our suppliers in Vietnam and Malaysia, along with the supply chain disruptions, resulted in low inventory levels within the Hooker Branded segment in early fiscal 2023. Inventory availability began to improve in mid-to-late fiscal 2023, finally stabilizing in fiscal 2024.
Home Meridian’s warehoused inventory increased significantly during fiscal 2023 due primarily to increased inventory in the ACH division, which is focused on the e-commerce channel. A slowing in the ecommerce business, coupled with an aggressive backlog reduction by our Asian suppliers after the end of COVID-19-related lockdowns in the late-summer of 2021, resulted in a substantial ACH inventory increase in fiscal 2023. Due to low profitability, low rates of sales and a general slowing of furniture sales in the e-commerce space, we decided to exit this division and recorded $24 million write-downs of ACH inventories and other excess inventories during the fourth quarter of fiscal 2023. During fiscal 2024, we liquidated substantially all of these inventories.
Accounts receivable: receivable
Substantially all of our trade accounts receivable are due from retailers and dealers that sell residential home furnishings or commercial purchasers of our hospitality and senior living products, which consist of a large number of entities with a broad geographic dispersion. We perform credit evaluations of our customers and generally do not require collateral. For qualified customers, we offer payment terms, generally requiring payment 30 days from shipment. However, we may offer extended payment terms in certain circumstances, including to promote sales of our product. We purchase accounts receivable insurance on certain customers or factor their receivables if their risk profile warrants it and the insurance is available. Due to the highly-customizedhighly customized nature of our hospitality products, we typically require a 50% deposit withupon order, a 40% deposit before goods reach a U.S. port and the remaining 10% balance due within 30 days of the receipt of goods by the customer. For our outdoor furnishings, smaller orders require full prepayment and most larger orders require a 50% deposit upon order and the balance when production is started. Additionally, some customers request and qualify for payment terms.
Accounts payable: payable
Payment for our imported products warehoused first in Asia is due ten10 to fourteen14 days after our quality audit inspections are complete and the vendor invoice is presented. Payment for goods which are shipped to our US warehouses or container direct to our customers FOB Origin (free on board origin, which means the buyer is responsible for the costs and liability of the freight during transport) is generally due upon proof of lading onto a US-bound vessel and invoice presentation; however, payment terms, depending on the supplier, can stretch up to 45 days from invoice date. Payment terms for domestic raw materials and non-inventory related charges vary but are generally 30 days from invoice date.
Order Backlog
At January 31, 2021,28, 2024, our backlog of unshipped orders was as follows:
Order Backlog | Order Backlog | |||||||||||||||||||||||||||||||
(Dollars in 000s) | (Dollars in 000s) | |||||||||||||||||||||||||||||||
January 28, 2024 | January 29, 2023 | |||||||||||||||||||||||||||||||
January 31, 2021 | February 2, 2020 | |||||||||||||||||||||||||||||||
Reporting Entity | Dollars | Weeks | Dollars | Weeks | ||||||||||||||||||||||||||||
Reporting Segment | Dollars | Weeks | Dollars | Weeks | ||||||||||||||||||||||||||||
Hooker Branded | $ | 34,776 | 11.1 | $ | 10,979 | 3.5 | $ | 15,416 | 5.1 | $ | 20,567 | 5.2 | ||||||||||||||||||||
Home Meridian | 180,188 | 33.2 | 85,556 | 13.1 | 36,013 | 13.0 | 43,052 | 10.3 | ||||||||||||||||||||||||
Domestic Upholstery | 30,271 | 18.8 | 14,705 | 8.0 | 18,920 | 7.8 | 29,696 | 9.9 | ||||||||||||||||||||||||
All Other | 2,845 | 12.8 | 2,520 | 10.5 | 1,475 | 12.2 | 2,071 | 26.2 | ||||||||||||||||||||||||
Consolidated | $ | 248,080 | 23.9 | $ | 113,760 | 9.7 | $ | 71,824 | 8.6 | $ | 95,386 | 8.5 | ||||||||||||||||||||
In the discussion below and herein, we reference changes in sales orders or “orders” and sales order backlog (unshipped orders at a point in time) or “backlog” over and compared to certain periods of time and changes discussed are in sales dollars and not units of inventory, unless stated otherwise. We believe orders are generally good current indicators of sales momentum and business conditions. However, except for custom or proprietary products, orders may be cancelled before shipment. If the items ordered are in stock and the customer has requested immediate delivery, we generally ship products in about seven days or less from receipt of order; however, orders may be shipped later if they are out of stock or there are production or shipping delays or the customer has requested the order to be shipped at a later date. It is our policy and industry practice to allow order cancellation for casegoods up to the time of shipment or, in the case of container direct orders, up until the time the container is booked with the ocean freight carrier; therefore, customer orders for casegoods are not firm. However, domestically produced upholstered products are predominantly custom-built and consequently, cannot be cancelled once the leather or fabric has been cut. Additionally, our hospitality products are highly customized and are generally not cancellable.
For the Hooker Branded and Domestic Upholstery segments and All Other, we generally consider unshipped order backlogs to be one helpful indicator of sales for the upcoming 30-day period, but because of our relatively quick delivery and our cancellation policies, we do not consider order backlogs to be a reliable indicator of expected long-term sales. We generally consider the Home Meridian segment’s backlog to be one helpful indicator of that segment’s sales for the upcoming 90-day period. Due to (i) Home Meridian’s sales volume, (ii) the average sales order sizes of its mass club and mega account channels of distribution, (iii)(ii) the proprietary nature of many of its products and (iv)(iii) the project nature of its hospitality business, for which average order sizes tend to be larger and consequently, itsthe Home Meridien segment’s order backlog tends to be larger.
There arehave been exceptions to the general predictive nature of our orders and backlogs noted in this paragraph, due to currentsuch as during times of extremely high demand and supply chain challenges relatedas experienced during the immediate aftermath of the initial COVID-19 crisis and subsequent recovery. Orders were not being converted to the COVID-19 pandemic. They are discussed in greater detail below and are essential to understanding our prospects.
At the end of fiscal 2021, order backlog increased $134.3 million or 118%shipments as quickly as would be expected compared to the prior-year due to increased incoming orders in all three reportable segments as well as the supply chain disruptions in the Home Meridian segment and production delays in the Domestic Upholstery segment. We are very encouraged by the current historic levels of orders and backlogs; however,pre-pandemic environment due to the current supply chain issues including the lack and cost of shipping containers and vessel space andas well as limited overseas vendor capacity,capacity. As a result, backlogs were significantly elevated and reached historical levels at the end of fiscal 2021 and 2022. At the end of fiscal 2024, order backlog decreased by $23.6 million or 25%, as compared to the prior year end. The decrease was largely attributable to normalized levels of shipping, soft incoming orders are not converting to shipments as quickly as could be expecteddriven by a decrease in overall demand, and absence of ACH orders and backlog in the pre-pandemic environment and we expect that to continue at least into the fiscal 2022 first quarter. The current logistics challenges are slowing order fulfillment, particularly for Home Meridian whose average order sizes tend to be larger and more episodic versus orders for the traditional Hooker businesses, which tend to be smaller and more predictable. Additionally, Home Meridian orders are programmed out and scheduled for delivery to its larger accounts further into the future than usual, which is also contributing to the increased backlog.segment.
Seasonality
Generally, sales in our fiscal first quarter are lower than our other fiscal quarters due to the post-Chinesepost-Lunar New Year shipping lag and sales in our fiscal fourth quarter are generally stronger due to the pre-Chinesepre-Lunar New Year surge in shipments from Asia and the product introduction schedule of a major customer.Asia.
Environmental Matters
As a part of our business operations, our manufacturing sites generate both non-hazardous and hazardous wastes; the treatment, storage, transportation and disposal of which are subject to various local, state and nationalfederal laws relating to environmental protection. Our policy is to record monitoring commitments and environmental liabilities when expenses are probable and can be reasonably estimated. The costs associated with our environmental responsibilities, compliance with federal, state and local laws regulating the discharge of materials into the environment, or costs otherwise relating to the protection of the environment, have not had and are not expected to have a material effect on our financial position, results of operations, capital expenditures or competitive position.
We are actively working to refine and align our environmental stewardship based on current best practices, shareholder expectations and regulatory developments through our ESG-focused employee committee called CARE (Community Action & Responsibility for our Environment). It regularly updates management and updates the Board at least quarterly on these initiatives. We note the following recent and ongoing activities and new developments:
■ | We have put in place several initiatives focused on promoting sustainability and preserving natural resources. We have completed a corporate-wide inventory of 2022 to 2023 Greenhouse Gas Emissions (GHG). Third-party verification of GHG data is in process and on target to be completed in calendar 2024. We are in the process of establishing a functional baseline to be able to measure whether future improvement initiatives reduce our carbon footprint. Going forward, each material facility will have its carbon footprint measured annually. |
■ | Since 2021, we have started projects to reduce our carbon footprint by investment in renewable energy and in projects to reduce energy consumption. We have purchased renewable energy from solar farms for several domestic manufacturing facilities since 2022. Sunset West is operating on 100% renewable resources; HF Custom (formerly Sam Moore) is operating on 50% renewable energy with a plan expected to achieve 100% in calendar 2024; and the Savannah distribution center is operating on 30% renewable energy. All remaining facilities are expected to participate in renewable energy programs by the end of calendar 2024. The multi-year project of switching to LED lighting in the manufacturing facilities and distribution centers resulted in an electrical usage reduction of 20% to 30% in the year 2021 and 2022. We are recognized as Appalachian Power 2023 Top Performer for energy efficiency in the Martinsville area. The project is expected to be completed by 2025. |
■ | We continue to partner with the Arbor Day Foundation, the Sustainable Furnishings Council, and the Eco Ambassador Council for their commitment to environmental responsibility and sustainability, including financial assistance, educating employees on the necessity of preserving and replenishing resources, and supporting various projects within the Dan River Basin area. |
Human Capital Resources
As of January 31, 2021,28, 2024, we had 1,1481,203 full-time employees, of which 213312 were employed in our Hooker Branded segment, 318202 were employed in our Home Meridian segment, 611671 were employed in our Domestic Upholstery segment and 618 were employed in All Other. By geographical area, 1,030 employees were located in the United States and 173 were located in Asia. None of our employees are represented by a labor union. We consider our relations with our employees to be good.
We are committed to creating a diverse, equitable and inclusive space for all our employees, customers and retail partners. The core values of our companyCompany include integrity, caring and inclusivity that affirms every individual. Our leadership team is committed to fostering an environment where everyone is welcome,welcomed, respected, listened to and valued for their unique contributions to the organization.organization, and to providing a work environment that is free from all forms of harassment, discrimination and inequality. We focus on taking meaningful steps towards positive changerecruit, employ, train, promote and open mindedness. Thecompensate our employees without regard to race, ethnicity, age, gender, gender identity, religion, national origin, citizenship, marital status, veteran’s status or disability. All facilities have established human resource departments with formal hiring processes and controls in place to ensure ethical and fair hiring practices. Some of the action steps that we have taken recently or are working on currently include:
■ |
|
o | compensating employees competitively relative to the industry and local labor markets, and in accordance with all applicable federal, state, and local wage, work hour, overtime, and benefits laws; and |
o | providing affordable and comprehensive health benefits to employees focused on financial, emotional, and physical health and well-being, including a standardized process of reporting worker’s compensation claims which we believe promotes health and safety of our employees. |
■ | We |
|
|
|
|
■ | We are committed to |
■ | We are committed to creating a diverse, equitable, and inclusive space for all employees: |
We offer competitive benefits to support the well-being
o | we have partnered with Centro Latino, Bedford Adult Education Center, Veteran Centric Organizations, and Historically Black Colleges and Universities (HBCU) Partnerships to improve recruitment and retention of a diverse workforce. In 2023, the Company’s demographic composition of U.S.-based employees included 65% White, 16% Black or African American, 15% Hispanic or Latino, and other racial groups; |
o | in 2023, more than 40% of executive and senior level employees were female, demonstrating the Company's commitment to gender diversity. Earlier in 2023, the Company was selected by Furniture Today, a leading information source of the furniture industry, as one of the advocates for women’s empowerment in the home furnishings industry and presented with the Furniture Today “Empowering Women Award.” |
■ | We maintain a Code of Business Conduct and Ethics. All employees are required to sign off on the Code at hiring and reaffirm their understanding and compliance with the Code, as well as anti-corruption and anti-bribery training on an annual basis. In addition, the Company has launched the effort to have domestic suppliers to sign a Vendor Code of Conduct. The Company has also started periodic audits of its international vendors to ensure compliance and produce a scorecard that can be used in future purchasing decisions based upon their performance. |
Patents and Trademarks
The Hooker Furnishings, Hooker Furniture, Bradington-Young, Sam Moore, Pulaski Furniture, Samuel Lawrence Furniture, Samuel Lawrence Hospitality, Room Gear, Right2Home, Home Meridian International, Prime Resources International, Accentrics Home, HMidea, Shenandoah, H Contract, Homeware, and MARQSunset West trade names represent many years of continued business. We believe these trade names, in addition to the recently obtained “M” brand, HF Custom and BOBO, are well-recognized and associated with quality and service in the furnishings industry. We also own a number of patents and trademarks, both domestically and internationally, none of which is considered to be material.
Governmental Regulations
Our company is subject to U.S. federal, state and local laws and regulations in the areas of safety, health, employment and environmental pollution controls, as well as U.S. and international trade laws and regulations. We are also subject to foreign laws and regulations. In the past, compliance with these laws and regulations has not had any material effect on our earnings, capital expenditures or competitive position in excess of those affecting others in our industry; however, the effect of compliance in the future cannot be predicted. We believe we are in material compliance with applicable U.S. and international laws and regulations.
Additional Information
You may visit us online at hookerfurnishings.com, hookerfurniture.com, bradington-young.com, sammoore.com,hfcustomfurniture.com, shenandoahfurniture.com, mfurnishings.com, sunsetwestusa.com, homemeridian.com, pulaskifurniture.com, slf-co.com, slh-co.com, hcontractfurniture.com, and hcontractfurniture.com.bobointriguingobjects.com. We make available, free of charge through our Hooker FurnitureFurnishings website hookerfurnishings.com, our annual report on Form 10-K, quarterly reports on Form 10-Q, current reports on Form 8-K, amendments to those reports, and other documents as soon as practical after they are filed with or furnished to the Securities and Exchange Commission.Commission (“SEC”). A free copy of our annual report on Form 10-K may also be obtained by contacting Earl Armstrong, Senior Vice-President Finance and Corporate Controller and Secretary at earmstrong@hookerfurnishings.comCorpSec@hookerfurnishings.com or by calling 276-632-2133.
ITEM 1A.RISK FACTORS
Our business is subject to a variety of risks. The risk factors discussed below should be considered in conjunction with the other information contained in this annual report on Form 10-K. If any of these risks actually materialize, our business, results of operations, financial condition or future prospects could be negatively impacted. These risks are not the only ones we face. There may be additional risks that are presently unknown to us or that we currently believe to be immaterial that could affect us.
|
The impact of COVID-19Economic downturns could result in decreased sales, earnings and future pandemics could adversely affect our business, results of operations, financial condition and liquidity, and stock price.liquidity.
The furniture industry is particularly sensitive to cyclical variations in the general economy and the current macro-economic uncertainties, including the economic downturn caused by pandemics such as COVID-19, pandemic ispersistent inflation and higher interest rates, and slow housing market. Home furnishings are generally considered a serious threatpostponable purchase by most consumers. Economic downturns could affect consumer spending habits by decreasing the overall demand for home furnishings. Changes in interest rates, consumer confidence, new housing starts, existing home sales, the availability of consumer credit and broader national or geopolitical factors have particularly significant effects on our business. We have seen negative effects on all of these measures due to healththe COVID-19 pandemic. A recovery in our sales could lag significantly behind a general recovery in the economy after an economic downturn, due to, among other things, the nature and economic well-beingrelatively significant cost of home furnishings purchases resulting in a temporary shift in consumer discretionary spending away from home furnishings, or scarcity of transportation and Asian manufacturing capacity during times of increased demand. These events could also impact retailers, who are our primary customers, possibly adversely affecting our customers, our associatessales, earnings, financial condition and our suppliers. Home furnishings purchases are largely postponable and heavily influenced by consumer confidence and most of our customers’ businesses are classified as non-essential. Consequently, traffic to our customers’ stores and demand for our products significantly decreased at the initial height of the pandemic, our sales deteriorated and our earnings were negatively impacted. COVID-19 also impacted our Asian supply chain, particularly as a result of mandatory shutdowns in locations where our products are manufactured, and we experienced out-of-stocks and lost sales as a result. Additionally, the demand surge that occurred after the initial height of the pandemic has caused supplier capacity restraints, shipping container and steamship space shortages. These logistics issues have increased costs, led to out-of-stocks and adversely affected our sales and earnings. Additionally, our sales order backlog is at historic levels due to these factors, and we cannot assure that we will be able to convert this backlog into sales at a normal pace or at all. We face the risk that current consumer demand could soften, or our customers could go elsewhere for products if our competitors are able to solve the current issues and we cannot. Alternatively, solving these issues may significantly diminish our profit margins if we are unable to offset these additional costs.
The extent of the continued impact of COVID-19 on our business and financial results depends on future developments, including the emergence of new and different strains of the virus and the effectiveness of vaccinations and other public health measures. Other pandemics are also possible with similar or worse public health outcomes.
The sweeping nature of pandemics makes it extremely difficult to predict how our business and operations could be affected in the longer run. However, the likely overall economic impact of pandemics is viewed as highly negative to the general economy. Any of the foregoing factors, or other cascading effects of this or other pandemics, could materially increase our costs, negatively impact our sales and damage the company’s results of operations and its liquidity, possibly to a significant degree. The duration of any such impacts cannot be predicted.liquidity.
The implementation of our Enterprise Resource Planning (“ERP”) system could disrupt our business.
We are in the process of implementing a common ERP system across all divisions. The ERP system went live at Sunset West in December 2022 and in the legacy Hooker divisions and for consolidated reporting in early September 2023. We expect the ERP system to go live in the Home Meridian segment during fiscal 2026. Although we currently expect the ERP implementation to increase efficiencies by leveraging a common, cloud-based system throughout all divisions and standardizing processes and reporting, our ERP system implementation may not result in improvements that outweigh its costs and may disrupt our operations. Our inability to mitigate existing and future disruptions could adversely affect our sales, earnings, financial condition and liquidity. When the ERP system went live at Sunset West and legacy Hooker divisions, the conversion process significantly impacted shipping activities and negatively impacted sales and profitability in the respective periods, due to longer than expected post-implementation stabilization. The ERP system implementation subjects us to substantial costs and inherent risks associated with migrating from our legacy systems. These costs and risks could include, but are not limited to:
● |
|
● | Disruptions to our |
● | Inability to fill customer orders accurately and on a timely basis, or at all; |
● | Inability to process payments to suppliers, vendors and associates accurately and in a timely manner; |
● | Disruption to our system of internal controls; |
● | Inability to fulfill our SEC or other governmental reporting requirements in a timely or accurate manner; |
● | Inability to fulfill international, federal, state or local tax filing requirements in a timely or accurate manner; and |
● | Increased demands on management and staff time to the detriment of other corporate initiatives. |
We rely on offshore sourcing from Vietnam and China for most of our sales. Consequently:
■ | A disruption in supply from Vietnam or |
In fiscal 2021,2024, imported products sourced from Vietnam and China accounted for 91%88% of our import purchases and our top five suppliers in Vietnam and China accounted for 45%60% of our fiscal 20212024 import purchases. Our supply chain could be adversely impacted by the uncertainties of health concerns such as COVID-19 or similar pandemics and governmental restrictions. A disruption in our supply chain, or from Vietnam or China in general, such as the COVID-19 related lockdown in certain parts of Asia in the Summer of calendar 2021, could significantly impact our ability to fill customer orders for products manufactured in those countries. Our supply chain could be adversely impacted by the uncertainties of health concerns and governmental restrictions. For example, in early calendar 2020, the COVID-19 outbreak in China resulted in the temporary shutdown or reduced capacity of our vendors’ factories and significantly slowed the post-Chinese New Year production recovery. Consequently, we experienced some out-of-stocks, but inIn some cases, were able to provide substitutions out of inventory on hand, in-transit and from our domestic warehouses, but not enough to entirely mitigate the lost sales. Although many of our vendors’ factories are now back online, limitations on supply include scarcity of some raw materials and components, limited availability of shipping containers and ocean vessel space, and production delays from some import suppliers. Consequently, we have been faced with shortages of certain products. If such disruptions were to occur again, we believe that we would have sufficient inventory on hand and in transitin-transit or be able to our U.S. warehouses in Virginia, North Carolina and California to adequately meet demand for several months or slightly longer with an additional month’s worth of demand available for immediate shipmentprovide substitutions from our domestic warehouses in Asia, assuming an adequate number of shipping containers and vessels were available. We believe we could, most likely at higher cost, source most ofbut may not be enough to entirely mitigate the products currently sourced in Vietnam or China from factories in other countries, again assuming an adequate number of shipping containers and vessels were available, and could produce certain upholstered products domestically at our own factories. However, supplylost sales. Supply disruptions and delays on selected items could occur for six months or longer before the impact of remedial measures would be reflected in our results. If we were to beare unsuccessful in obtaining those products from other sources or at comparable cost, a disruption in our supply chain from our largest import furniture suppliers, or from Vietnam or China in general, could adversely affect our sales, earnings, financial condition and liquidity.
|
|
Ocean freight costs on imported products currently represent a significant portion of the cost of our imported products. Ocean freight rates on our imported products are affected by a myriad of factors including the global economy, petroleum prices and ocean freight carrier capacity. We have seen a significant spike in ocean freight costs over the past year and have been able to partially offset these increases through price increases and temporary freight surcharges. However, there can be no assurance that we will be successful in increasing prices or receiving freight surcharges in the future. Also, increased ocean freight rates in the future would likely adversely affect earnings, financial condition and liquidity.
|
|
We rely heavily on suppliers we do not own or control, including a large number of non-US suppliers. All of our suppliers may not provide goods that meet our quality, design or other specifications in a timely manner and at a competitive price. If our suppliers do not meet our specifications, we may need to find alternative suppliers, potentially at a higher cost, or may be forced to discontinue products. Also, delivery of goods from non-U.S. suppliers may be delayed for reasons not typically encountered for domestically manufactured furniture, such as shipment delays caused by customs issues, labor issues, port-related issues such as weather, congestion or port equipment, decreased availability of shipping containers and/or the inability to secure space aboard shipping vessels to transport our products. Our failure to timely fill customer orders due to an extended business interruption for a major supplier, or due to transportation issues, could negatively impact existing customer relationships and adversely affect our sales, earnings, financial condition and liquidity.
■ | Our inability to accurately forecast demand for our imported products could cause us to purchase too much, too little or the wrong mix of inventory. |
Manufacturing and delivery lead times for our imported products necessitate that we make forecasts and assumptions regarding current and future demand for these products. If our forecasts and assumptions are inaccurate, we may purchase excess or insufficient amounts of inventory. If we purchase too much or the wrong mix of inventory, we may be forced to sell it at lower margins, which could adversely affect our sales, earnings, financial condition and liquidity. If we purchase too little or the wrong mix of inventory, we may not be able to fill customer orders and may lose market share and weaken or damage customer relationships, which also could adversely affect our sales, earnings, financial condition and liquidity.
■ | Increased transportation costs, including freight costs on imported products could decrease earnings and liquidity. |
Transportation costs on our imported products are affected by a myriad of factors including the global economy, petroleum prices and ocean freight carrier capacity. In the recent past, especially after the COVID-19 pandemic, transportation costs, including ocean freight costs and domestic trucking costs, on imported products represented a significant portion of the cost of those products. We saw a significant spike in these costs during that time and our profitability was materially impacted. To mitigate the increased costs, we implemented price increases and surcharges; however, there can be no assurance that we will be successful in increasing prices or receiving freight surcharges in the future or that we can do it quickly enough to offset increased costs. Increased transportation costs, both domestically and internationally, in the future would likely adversely affect earnings, financial condition and liquidity.
■ | Our dependence on suppliers could, over time, adversely affect our ability to service customers. |
We rely heavily on suppliers we do not own or control, including a large number of non-U.S. suppliers. All of our suppliers may not provide goods that meet our quality, design or other specifications in a timely manner and at a competitive price. If our suppliers do not meet our specifications, we may need to find alternative suppliers, potentially at a higher cost, or may be forced to discontinue products. Also, delivery of goods from non-U.S. suppliers may be delayed for reasons not typically encountered for domestically manufactured furniture, such as shipment delays caused by customs issues, labor issues, port-related issues such as weather, congestion or port equipment, decreased availability of shipping containers and/or the inability to secure space aboard shipping vessels to transport our products. Our failure to timely fill customer orders due to an extended business interruption for a major supplier, or due to transportation issues, could negatively impact existing customer relationships and adversely affect our sales, earnings, financial condition and liquidity.
■ | Potential future increases in tariffs |
Effective September 24, 2018, the prior U.S. administration imposed a 10% tariff on certain goods imported into the United States from China, including all furniture and furniture components manufactured in China, which increased to 25% in May 2019 and such tariffs have not been repealed. New tariffs could be imposed on manufactured goods from other countries from which we source, including Vietnam. Inability to reduce product costs, pass through price increases or find other suitable manufacturing sources outside of China may have a material adverse impact on sales volume, earnings and liquidity. In addition, the tariffs, and our responses to the tariffs, may cause our products to become less competitive due to price increases or less profitable due to lower margins. Our inability to effectively manage the negative impacts of changing U.S. and foreign trade policies could adversely affect our business and financial results.
■ | We are subject to changes in U.S. and foreign government regulations and in the political, social and economic climates of the countries from which we source our products. |
Changes in political, economic and social conditions, as well as in the laws and regulations in the foreign countries from which we source our products could adversely affect our sales, earnings, financial condition and liquidity. These changes could make it more difficult to provide products and service to our customers or could increase the cost of those products. International trade regulations and policies of the United States and the countries from which we source finished products could adversely affect us. Imposition of trade sanctions relating to imports, taxes, import duties and other charges on imports affecting our products could increase our costs and decrease our earnings. For example, the U.S. Department of Commerce imposes tariffs on wooden bedroom furniture coming into the United States from China. In this case, none of the rates imposed have been of sufficient magnitude to alter our import strategy in any meaningful way; however, these and other tariffs are subject to review and could be increased or new tariffs implemented in the future.
■ | Changes in the value of the U.S. Dollar compared to the currencies for the countries from which we obtain our imported products could adversely affect our sales, earnings, financial condition and liquidity. |
For imported products, we generally negotiate firm pricing with our foreign suppliers in U.S. Dollars, typically for periods of at least one year. We accept the exposure to exchange rate movements during these negotiated periods. We do not use derivative financial instruments to manage this risk but could choose to do so in the future. Since we transact our imported product purchases in U.S. Dollars, a relative decline in the value of the U.S. Dollar could increase the price we must pay for imported products beyond the negotiated periods. These price changes could decrease our sales, earnings, financial condition and liquidity during the affected periods.
■ | Supplier transitions, including cost or quality issues, could result in longer lead times and shipping delays. |
In the past, inflation concerns, and to a lesser extent quality and supplier viability concerns, affecting some of our imported product suppliers located in China prompted us to source more of our products from lower cost suppliers located in other countries, such as Vietnam. As discussed above, during fiscal 2020 and fiscal 2021Additionally, we transitioned a significant portion of our imported product purchases from China to Vietnam due to the imposition of tariffs on most furniture and component parts imported from China. As conditions dictate, we could be forced to make similar transitions in the future. When undertaken, transitions of this type involve significant planning and coordination by and between us and our new suppliers in these countries. Despite our best efforts and those of our new sourcing partners, these transition efforts are likely to result in longer lead times and shipping delays over the short term. Risks associated with product defects, including higher than expected costs associated with product quality and safety, and regulatory compliance costs related to the sale of consumer products and costs related to defective or non-compliant products, including product liability claims and costs to recall defective products. One or a combination of these issues could adversely affect our sales, earnings, financial condition and liquidity.
A disruption affecting our domestic facilities could disrupt our business.
The warehousesfacilities in which we store our inventory in Virginia, North Carolina, Georgia and California are critical to our success. Our corporate and divisional headquarters, which house our administration, sourcing, sales, finance, merchandising, customer service and logistics functions for our imported and domestic products are located in Virginia, North Carolina and California. Additionally, our primary showrooms are located in North Carolina. Additionally, we are in the process of consolidating our Home Meridian segment’s East Coast warehousing operations into an 800,000 square foot distribution center in Liberty County, Georgia. We believe that this strategically located facility near the Port of Savannah and major interstate highways will allow us to more efficiently service our customers, reduce transportation costs and better position us for future growth. This leased facility is currently under construction and we expect to occupy it in the Fall of 2021. Risks associated with our newly leased warehouse space in Georgia, include delays in construction and occupancy and risks associated with our move to the facility, including information systems, access to warehouse labor and the inability to realize anticipated cost savings.
Our domestic upholstery manufacturing facilities are located in Virginia, North Carolina and North Carolina.California. Furniture manufacturing creates large amounts of highly flammable wood dust and utilizesmay utilize other highly flammable materials such as varnishes and solvents in its manufacturing processes and is therefore subject to the risk of losses arising from explosions and fires. Additionally, our domestic operations have beencould be negatively affected by public health events, such as the COVID-19 and experienced some COVID-related employee absences. It has become increasingly difficult to recruit skilled labor into our domestic upholstery plants and training and turnover costs have increased. We activated business continuity plans in early calendar 2020 and many administrative employees have been telecommuting given recommendations for social distancing. We also instituted increased cleaning regimens and have instituted social distancing and masking protocols for office, manufacturing and warehousing associates.pandemic. Any disruption affecting our domestic facilities, for even a relatively short period of time, could adversely affect our ability to ship our furniture products and disrupt our business, which could adversely affect our sales, earnings, financial condition and liquidity.
Fluctuations in the price, availability or quality of raw materials for our domestically manufactured upholstered furniture could cause manufacturing delays, adversely affect our ability to provide goods to our customers or increase our costs.
We use various types of wood, leather, fabric, foam and other filling material, high carbon spring steel, bar and wire stock and other raw materials in manufacturing upholstered furniture. We depend on outside suppliers for raw materials and must obtain sufficient quantities of quality raw materials from these suppliers at acceptable prices and in a timely manner. We do not have long-term supply contracts with our suppliers. Unfavorable fluctuations in the price, quality or availability of required raw materials could negatively affect our ability to meet the demands of our customers. For example, our domestic upholstery segment is currently facing foam allocations of between 60-75% of requested amounts. We may not always be able to pass price increases inon raw materials through to our customers due to competition and other market pressures. In addition, the price increases are frequently implemented on future orders instead of existing order backlogs. Considering our lead times during periods of high demand, the benefits of new pricing could be offset by continued price increases from our suppliers that could impact us before we realize the benefit from our price increases. The inability to meet customers’ demands or recover higher costs could adversely affect our sales, earnings, financial condition and liquidity.
If demand for our domestically manufactured upholstered furniture declines, we may respond by realigning manufacturing.manufacturing or need to implement cost-saving measures.
Our domestic manufacturing operations make only upholstered furniture. A decline in demand for our domestically produced upholstered furniture could result in the realignment of our domestic manufacturing operations and capabilities and the implementation of cost-saving measures. These programs could include the consolidation and integration of facilities, functions, systems and procedures. We may decide to source certain products from other suppliers instead of continuing to manufacture them. These realignments and cost-saving measures typically involve initial upfront costs and could result in decreases in our near-term earnings before the expected cost savings are realized, if they are realized at all. We may not always accomplish these actions as quickly as anticipated and may not achieve the expected cost savings, which could adversely affect our sales, earnings, financial condition and liquidity.
We may not be able to maintain, raise prices, or raise prices in a timely manner in response to inflation and increasing costs.
Competitive and market forces could prohibit or delay future successful price increases for our products in order to offset increased costs of labor, finished goods, raw materials, freight and other product-related costs on a timely basis, which could adversely affect our sales, earnings, financial condition and liquidity.
We may experience impairment of our long-lived assets, which would decrease our earnings and net worth.
At January 28, 2024, we had $72.8 million in net long-lived assets, consisting primarily of property, plant and equipment, trademarks, trade names and goodwill. Our goodwill, some trademarks and tradenames have indefinite useful lives and, consequently, are not subject to amortization for financial reporting purposes, but are tested for impairment annually or more frequently if events or circumstances indicate that the asset might be impaired. Our definite-lived assets consist of property, plant and equipment and certain intangible assets related to our recent acquisitions and are tested for impairment whenever events or circumstances indicate that the carrying amount of the asset may not be recoverable. The outcome of impairment testing could result in the write-down of all or a portion of the value of these assets. A write-down of our assets would, in turn, reduce our earnings and net worth. See Notes 8 and 10 to our Consolidated Financial Statements for additional information.
Our sales and operating results could be adversely affected by product safety concerns.
If our product offerings do not meet applicable safety standards or consumers' expectations regarding safety, we could experience decreased sales, increased costs and/or be exposed to legal and reputational risk. Events that give rise to actual, potential or perceived product safety concerns could expose us to regulatory enforcement action and/or private litigation. While we carry general and umbrella liability insurance for such events, settlements or jury awards could exceed our policy limits. Reputational damage caused by real or perceived product safety concerns or failure to prevail in private litigation against us could adversely affect our business, sales, earnings, financial condition and liquidity.
A material part of our sales and accounts receivable are concentrated in a few customers. The loss of several large customers through business consolidations or otherwise, the loss of a major customer or significant sales programs with major customers, failures or other reasons, including economic downturn and the adverse economic effects of the COVID-19a future pandemic or similar events, could adversely affect our business.
One customer accounted for approximately 12%6% of our consolidated sales in fiscal 2021,2024, and our top five customers accounted for about 30%22% of our fiscal 20212024 consolidated sales. Approximately half16% of our consolidated accounts receivable is concentrated in our top five customers. Should any one of these receivables become uncollectible, it would have an immediate and material adverse impact on our financial condition and liquidity. The loss of any one or more of these customers could adversely affect our sales, earnings, financial condition and liquidity. The loss of several of our major customers through business consolidations, the loss of major product placements, failures or otherwise, could adversely affect our sales, earnings, financial condition and liquidity and the resulting loss in sales may be difficult or impossible to replace.
Sales and earnings in the Clubs channel of our Home Meridian segment are subject to higher volatility than other distribution channels subject to our success or failure in developing suitable products at acceptable prices for this channel. Given the relatively liberal return policies in this channel, we are subject to higher-than-normal customer chargebacks. While we accrue estimated amounts for chargebacks based on sales and chargeback history, those accruals may not be adequate and given the relative size of customers in this channel, we may not be successful in negotiating resolutions to these extra costs. Consequently, our sales and earnings could be adversely affected.
Should the negative economic effects of COVID-19 persist, or another similar event or events occur, the negative developments described in this paragraph would be more likely to occur. Amounts owed to us by a customer whose business fails, or is failing, may become uncollectible (in whole or in part), and we could lose future sales, any of which could adversely affect our sales, earnings, financial condition and liquidity.
We may not be able to collect amounts owed to us.
We grant payment terms to most customers ranging from 30 to 60 days and do not generally require collateral. However, in some instances we provide longer payment terms. We purchase credit insurance on certain customers’ receivables and factor certain other customer accounts. Some of our customers have experienced, and may in the future experience, credit-related issues. Were the negative economic effects ofdownturn, COVID-19 to persist or a similar pandemic or another major, unexpected event with negative economic effects occur, we may not be able to collect amounts owed to us or such payment may only occur after significant delay. While we perform credit evaluations of our customers, those evaluations may not prevent uncollectible trade accounts receivable. Credit evaluations involve significant management diligence and judgment, especially in the current environment. We may be unable to obtain sufficient credit insurance on certain customers’ receivable balances. Should more customers than we anticipate experience liquidity issues, if payment is not received on a timely basis, or if a customer declares bankruptcy or closes stores, we may have difficulty collecting amounts owed to us by these customers, which could adversely affect our sales, earnings, financial condition and liquidity.
Our sales
Labor shortages and operating resultsrising labor costs could be adversely affected by product safety concerns.disrupt operations at our domestic warehousing and manufacturing facilities.
IfAt times, especially during the post COVID-19 demand surge, we have experienced difficulties in recruiting skilled labor into our product offerings do not meet applicable safety standardsdomestic upholstery plants and warehouses and in some skilled or consumers' expectations regarding safety, we could experience decreased sales,professional positions. Lack of qualified workers and high turnover in a variety of positions caused increased costs and/or be exposed to legal and reputational risk. Events that give rise to actual, potential or perceived product safety concerns could expose us to regulatory enforcement action and/or private litigation. While we carry general and umbrella liability insurance for such events, settlements or jury awards could exceed our policy limits. Reputational damage caused by real or perceived product safety concerns or failure to prevail in private litigation against us could adversely affect our business, sales, earnings, financial condition and liquidity.
The implementation of our Enterprise Resource Planning system could disrupt our business.
We are in the beginning phases of implementing a common Enterprise Resource Planning (ERP) system across all divisions. Although we currently expect the ERP implementation to increase efficiencies by leveraging a common, cloud-based system throughout all divisions and standardizing processes and reporting, our ERP system implementation may not result in improvements that outweigh itstraining costs and may disruptadversely affected our operations. Our inabilityproduction schedules and the ability to mitigate existingship our furniture products. Furthermore, we experienced higher labor costs and persistent inflationary pressure. Should these issues re-occur or increase due to future disruptions could adversely affectpandemics or for other reasons, our sales, earnings, financial condition and liquidity. The ERP system implementation subjects us to substantial costs and inherent risks associated with migrating from our legacy systems. These costs and risksliquidity could include, but are not limited to:again be adversely affected.
|
|
|
|
|
|
|
|
|
|
|
|
|
|
|
|
We may engage in acquisitions and investments in companies, form strategic alliances and pursue new business lines. These activities could disrupt our business, divert management attention from our current business, pose integration concerns or difficulties, dilute our earnings per share, decrease the value of our common stock and decrease our earnings and liquidity.
We have publicly stated our goal of reaching $1 billion in salesGrowth by our 100th anniversary in 2024. Achieving that goalacquisition is highly dependent upon finding attractive targets and there can be no assurance those targets will be found. We may acquire or invest in businesses such as those that offer complementary products or that we believe offer competitive advantages. However, we may fail to identify significant liabilities or risks that could negatively affect us or result in our paying more for the acquired company or assets than they are worth. We may also have difficulty assimilating and integrating the operations and personnel of an acquired business into our current operations. Acquisitions or strategic alliances may disrupt or distract management from our ongoing business. We may pay for future acquisitions using cash, stock, the assumption of debt or a combination of these. Future acquisitions could result in dilution to existing shareholders and to earnings per share and decrease the value of our common stock. We may pursue new business lines in which we have limited or no prior experience or expertise. These pursuits may require substantial investment of capital, personnel and management attention. New business initiatives may fail outright or fail to produce an adequate return, which could adversely affect our earnings, financial condition and liquidity.
We may experience impairment of our long-lived assets, which would decrease our earnings and net worth.
At January 31, 2021, we had $53.5 million in net long-lived assets, consisting primarily of property, plant and equipment, trademarks, trade names and goodwill. Our goodwill, some trademarks and tradenames have indefinite useful lives and, consequently, are not subject to amortization for financial reporting purposes, but are tested for impairment annually or more frequently if events or circumstances indicate that the asset might be impaired. COVID-19 had a material impact on our financial performance in the fiscal 2021 first quarter and on the market valuations, discount rates and other inputs used in our intangibles valuation analysis. We determined that an immediate intangible asset valuation was necessary given our performance and changing market dynamics. As a result of the intangible asset valuation analysis, in the fiscal 2021 first quarter, we recorded $44.3 million in non-cash impairment charges to write down goodwill and certain tradenames in the Home Meridian segment and goodwill in the Shenandoah division of its Domestic Upholstery segment. Our definite-lived assets consist of property, plant and equipment and certain intangible assets related to our recent acquisitions and are tested for impairment whenever events or circumstances indicate that the carrying amount of the asset may not be recoverable. The outcome of impairment testing could result in the write-down of all or a portion of the value of these assets. A write-down of our assets would, in turn, reduce our earnings and net worth. See Notes 8 and 9 for additional information.
We may lose market share due to furniture retailers by-passing us and sourcing directly from non-U.S. furnishings sources.
Some large furniture retailers are sourcing directly from non-U.S. furniture factories. Over time, this practice may expand to smaller retailers. As a result, we are continually subject to the risk of losing market share to these non-U.S. furnishings sources, which could adversely affect our sales, earnings, financial condition and liquidity.
Failure to anticipate or timely respond to changes in fashion and consumer tastes could adversely impact our business.
Furniture is a styled product and is subject to rapidly changing fashion trends and consumer tastes, as well as to increasingly shorter product life cycles. If we fail to anticipate or promptly respond to these changes, we may lose market share or be faced with the decision of whether to sell excess inventory at reduced prices. This could adversely affect our sales, earnings, financial condition and liquidity.
Our results of operations for any quarter are not necessarily indicative of our results of operations for a full year.
Home furnishings sales fluctuate from quarter to quarter due to factors such as changes in economic and competitive conditions, seasonality, weather conditions, availability of raw materials and finished inventory and changes in consumer order patterns. From time to time, we have experienced, and may continue to experience, volatility with respect to availability of and demand for our home furnishing products. Accordingly, our results of operations for any quarter are not necessarily indicative of the results of operations to be expected for a full year.year or the next quarter.
|
The interruption, inadequacy or security failure of our information systems or information technology infrastructure or the internet or inadequate levels of cyber-insurance could adversely impact our business,sales, earnings, financial condition and liquidity.
Our information systems (software) and information technology (hardware) infrastructure platforms and those of third parties who provide these services to us, including internet service providers and third parties who store data for us on their servers (“the cloud”), facilitate and support every facet of our business, including the sourcing of raw materials and finished goods, planning, manufacturing, warehousing, customer service, shipping, accounting, payroll and human resources. Our systems, and those of third parties who provide services to us, are vulnerable to disruption or damage caused by a variety of factors including, but not limited to: power disruptions or outages; natural disasters or other so-called “Acts of God”; computer system or network failures; viruses or malware; physical or electronic break-ins; the theft of computers, tablets and smart phones utilized by our employees or contractors; unauthorized access, phishing and cyber-attacks. The risk of cyberattacks also includes attempted breaches of contractors, business partners, vendors and other third parties. We have a cybersecurity program designed to protect and preserve the integrity of our information systems. Additionally, we implemented a multi-factor authentication process in order to enhance the security of our remote work environment. We have experienced and expect to continue to experience actual or attempted cyber-attacks of our information systems or networks; however, none of these actual or attempted cyber-attacks had a material impact on our operations or financial condition. Additionally, while we carry cyber insurance, including insurance for social engineering fraud, the amounts of insurance we carry may be inadequate due either to inadequate limits available from the insurance markets or inadequate coverage purchased. Because cyber threat scenarios are inherently difficult to predict and can take many forms, cyber insurance may not cover certain risks. Further, legislative or regulatory action in these areas is evolving, and we may be unable to adapt our information systems or to manage the information systems of third parties to accommodate these changes. If these information systems or technologies are interrupted or fail, or we are unable to adapt our systems or those of third parties as a result of legislative or regulatory actions, our operations and reputation may be adversely affected, we may be subject to legal proceedings, including regulatory investigations and actions, which could diminish investor and customer confidence which could adversely affect our sales, earnings, financial condition and liquidity.
Economic downturns could result in decreased sales, earnings and liquidity.
The furniture industry is particularly sensitive to cyclical variations in the general economy and to uncertainty regarding future economic prospects, including the current and evolving negative economic effects of the COVID-19 pandemic. Home furnishings are generally considered a postponable purchase by most consumers. Economic downturns could affect consumer spending habits by decreasing the overall demand for home furnishings. Changes in interest rates, consumer confidence, new housing starts, existing home sales, the availability of consumer credit and broader national or geopolitical factors have particularly significant effects on our business. We have seen negative effects on all of these measures due to the COVID-19 pandemic. A recovery in our sales could lag significantly behind a general recovery in the economy after an economic downturn, due to, among other things, the postponable nature and relatively significant cost of home furnishings purchases. These events could also impact retailers, who are our primary customers, possibly adversely affecting our sales, earnings, financial condition and liquidity.
Unauthorized disclosure of confidential information provided to us by our customers, employees, or third parties could harm our business.
We rely on the internet and other electronic methods to transmit confidential information and we store confidential information on our networks. If there was a disclosure of confidential information by our employees or contractors, including accidental loss, inadvertent disclosure or unapproved dissemination of information, or if a third party were to gain access to the confidential information we possess, our reputation could be harmed, and we could be subject to civil or criminal liability and regulatory actions. A claim that is brought against us, successful or unsuccessful, that is uninsured or under-insured could harm our business, result in substantial costs, divert management attention and adversely affect our sales, earnings, financial condition and liquidity.
We may not be able to maintain or raise prices in response to inflation and increasing costs.
Competitive and market forces could prohibit future successful price increases for our products in order to offset increased costs of finished goods, raw materials, freight and other product-related costs, which could adversely affect our sales, earnings, financial condition and liquidity.
ITEM 1B.UNRESOLVED STAFF COMMENTS
None.
ITEM 1C. CYBERSECURITY
Risk Management and Strategy
The Company's cybersecurity risk management program is integrated into the overall risk management framework, including risk identification, assessment, and mitigation across all business areas. We have collaborated with external consultants and built a cybersecurity program designed to protect and safeguard the integrity of our information systems, which aligns with industry best practices and regulatory requirements. To continually enhance the effectiveness of the practice, we regularly assess the program’s measures, contractual obligations, and compliance with industry standards. Additionally, we maintain cyber insurance coverage, including protection against social engineering fraud, to further mitigate potential financial losses from cybersecurity incidents.
We have previously experienced actual or attempted cyber-attacks on our information systems or networks; however, none of these incidents had a material impact on our operations or financial condition. For additional information on the impact of cyber risks, refer to Part I, Item 1A. Risk Factors on page 13.
Governance
The board of directors oversees the Company’s practice for assessing, identifying and managing material risks from cybersecurity threats. The Audit Committee, consisting of all of the board’s independent directors with one member holding the CERT Certificate in Cybersecurity Oversight, reviews and discusses with management and the independent auditor on the Company’s significant financial risk exposures for matters related to cybersecurity risk, including the steps management has taken to monitor and manage such exposures.
The Company’s Chief Information Officer leads the overall cybersecurity strategy and risk management program. This includes overseeing risk assessments, developing security policies and procedures, and managing the IT security team. Senior executives, including the Company’s CEO and CFO, integrate cybersecurity risks into the overall business strategy and financial planning. The IT department executes daily security tasks such as vulnerability scanning, threat detection, and incident response. The Chief Information Officer and IT security team provide regular reports to senior management on the Company’s cybersecurity posture, identified vulnerabilities, and ongoing incident management activities. Management provides the Audit Committee with quarterly updates on the Company's cybersecurity practices.
ITEM 2. PROPERTIES
Set forth below is information with respect to our principal properties on April 16, 2021.12, 2024. We believe all of these properties are well-maintained and in good condition. During fiscal 2021,2024, we estimate our upholstery plants operated at approximately 85%60% of capacity on a one-shift basis. All our production facilities are equipped with automatic sprinkler systems. All facilities maintain modern fire and spark detection systems, which we believe are adequate. We have leased certain warehouse facilities for our distribution and import operations, typically on a short or medium-term basis. We expect that we will be able to renew or extend these leases or find alternative facilities to meet our warehousing and distribution needs at a reasonable cost. All facilities set forth below are active and operational, representing in the aggregate approximately 4.13.3 million square feet of owned space, leased space or properties utilized under third-party operating agreements.
Location | Segment Use | Primary Use | Approximate Size in Square Feet | Owned or Leased | ||||
Martinsville, | All segments | Corporate Headquarters, Distribution, Manufacturing and Warehousing | 1,489,766 | Owned / Leased | ||||
High Point, N.C. | All segments | Office |
| Leased | ||||
| All segments | Showrooms and warehousing | 72,813 | Leased | ||||
Midway, GA | HM, DU | Warehouse |
|
| ||||
|
|
|
| Leased | ||||
Bedford, | DU | Manufacturing and Offices | 327,000 | Owned | ||||
Hickory, N.C. | DU | Manufacturing and Offices | 166,000 | Owned | ||||
Mt. Airy, N.C. | DU | Manufacturing and warehousing | 104,150 | Leased | ||||
Valdese, N.C. | DU | Manufacturing and warehousing | 102,905 | Leased | ||||
Cherryville, N.C. | DU | Manufacturing Supply Plant | 53,000 | Owned | ||||
|
|
|
| Leased | ||||
|
|
|
| Leased | ||||
Ho Chi Minh City, VN | HB, HM | Office, Warehouse and Distribution |
| Leased | ||||
| HB, HM | Office |
| Leased | ||||
HB=Hooker Branded, HM=Home Meridian, DU=Domestic Upholstery, AO=All Other | ||||||||
HB=Hooker Branded, HM=Home Meridian, DU=Domestic Upholstery
ITEM 3. LEGAL PROCEEDINGS
None.
ITEM 4. MINE SAFETY DISCLOSURES
None.
INFORMATION ABOUT OUR EXECUTIVE OFFICERS
Hooker Furniture’sFurnishings’ executive officers and their ages as of April 16, 202112, 2024 and the calendar year each joined the Company are as follows:
Name | Age | Position | Year Joined Company | Age | Position | Year Joined Company | ||||||
Jeremy R. Hoff | 47 | Chief Executive Officer and Director | 2017 | 50 | Chief Executive Officer and Director | 2017 | ||||||
Paul A. Huckfeldt | 63 | Chief Financial Officer and | 2004 | 66 | Chief Financial Officer and Senior Vice President - Finance and Accounting | 2004 | ||||||
Senior Vice President - Finance and Accounting | ||||||||||||
Anne J. Smith | 59 | Chief Administration Officer and President-Domestic Upholstery | 2008 | 62 | Chief Administration Officer and President - Domestic Upholstery | 2008 | ||||||
D. Lee Boone | 58 | President - Home Meridian segment | 2016 | |||||||||
| Tod R. Phelps | 52 | Chief Information Officer and Senior Vice President - Operations | 2017 | 55 | Senior Vice President - Operations and Chief Information Officer | 2017 | ||||||
Jeremy R. Hoff has been Chief Executive Officer and Director since February 2021. Mr. Hoff served as President of Hooker Legacy Brands from February 2020 to January 2021, President of the Hooker Branded segment from April 2018 to January 2020. Mr. Hoff joined the Company in August of 2017 as President of Hooker Upholstery. Prior to that, Mr. Hoff served as President of Theodore Alexander USA from December 2015 to August 2017.
Paul A. Huckfeldt has been Senior Vice President - Finance and Accounting since September 2013 and Chief Financial Officer since January 2011. Mr. Huckfeldt served as Vice President – Finance and Accounting from December 2010 to September 2013, Corporate Controller and Chief Accounting Officer from January 2010 to January 2011, Manager of Operations Accounting from March 2006 to December 2009 and led the Company’s Sarbanes-Oxley implementation and subsequent compliance efforts from April 2004 to March 2006.
Anne J. Smith has been Chief Administration Officer and President – Domestic Upholstery since February 2021. Ms. Smith served as Chief Administration Officer from July 2018 to January 2021, Senior Vice President – Administration from January 2014 to June 2018, Vice President- HR and Administration from January 2011 to January 2014 and Vice President-Human Resources from November 2008 to January 2011. Ms. Smith joined the Company in January of 2008 as Director of Human Resources.
D. Lee Boone has been President of the Home Meridian segment since November 2020. Mr. Boone served as Co-President of the Home Meridian segment from June 2018 to November 2020. He joined the Company upon the acquisition of Home Meridian’s assets by the Company in February 2016 as President of Samuel Lawrence Furniture, a division of Home Meridian International. Prior to that, Mr. Boone served as President of Legacy Classic Furniture from 2006 to 2012.
Tod R. Phelpshas been Chief Information Officer and Senior Vice President – Operations since February 2021. Mr. Phelps joined the Company in April 2017 as Chief Information Officer. From March 2014 to April 2017, he served as Chief Technology Officer of Heritage Home Group, LLC.
Hooker FurnitureFurnishings Corporation
Part II
ITEM 5. MARKET FOR REGISTRANT’S COMMON EQUITY, RELATED STOCKHOLDER MATTERS AND ISSUER PURCHASES OF EQUITY SECURITIES
Our stock is traded on the NASDAQ Global Select Market under the symbol “HOFT”. As of January 31, 2021,28, 2024, we had approximately 7,6007,500 beneficial shareholders. As we have done in the past, we currently expect that future regular quarterly dividends will be declared and paid in the months of March, June, September and December. Although we presently intend to continue to declare regular cash dividends on a quarterly basis for the foreseeable future, the determination as to the payment and the amount of any future dividends will be made by the Board of Directors on a quarterly basis and will depend on our then-current financial condition, capital requirements, results of operations and any other factors then deemed relevant by the Board of Directors.
Performance Graph (1)
The following graph compares cumulative total shareholder return for the Company with a broad performance indicator, the Russell 2000® Index (2), and a published industry index, the Household Furniture Index (3), for the period from January 31, 2016February 3, 2019 to January 31, 2021.28, 2024.
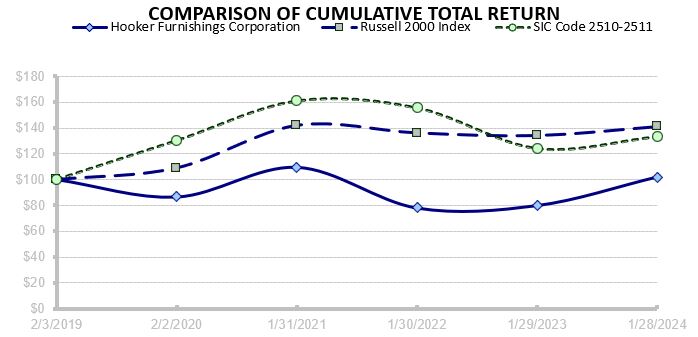
(1) | The graph shows the cumulative total return on $100 invested at the beginning of the measurement period in our common stock or the specified index, including reinvestment of dividends. |
(2) | The Russell 2000® Index, prepared by Frank Russell Company, measures the performance of the 2,000 smallest companies out of the 3,000 largest U.S. companies based on total market capitalization and includes the Company. |
(3) | Household Furniture Index as prepared by Zacks Investment Research, Inc. consists of companies under Standard Industrial Classification (SIC) Codes 2510 and 2511, which includes home furnishings companies that are publicly traded in the United States or Canada. At January |
ITEM 6. SELECTED FINANCIAL DATA
SEC disclosure rules no longer require the presentation of selected financial data; however, based on shareholder and internal feedback we continue to provide this information. The following selected financial data for each of our last five fiscal years has been derived from our audited, consolidated financial statements. The selected financial data should be read in conjunction with the consolidated financial statements, including the related notes and Management’s Discussion and Analysis of Financial Condition and Results of Operations included elsewhere in this report. Additionally, we face a number of significant risks and uncertainties, as more fully discussed in Item 1A, “Risk Factors”, above. If any or a combination of these risks and uncertainties were to occur, the information below may not be fully indicative of our future financial condition or results of operations.
Fiscal Year Ended (1) | Fiscal Year Ended (1) | |||||||||||||||||||||||||||||||||||||||
January 31, | February 2, | February 3, | January 28, | January 29, | January 28, | January 29, | January 30, | January 31, | February 2, | |||||||||||||||||||||||||||||||
2021 | 2020 | 2019 | 2018 | 2017 | 2024 | 2023 | 2022 | 2021 | 2020 | |||||||||||||||||||||||||||||||
(In thousands, except per share data) | (In thousands, except per share data) | |||||||||||||||||||||||||||||||||||||||
Income Statement Data: | ||||||||||||||||||||||||||||||||||||||||
Statement of Operations Data: | ||||||||||||||||||||||||||||||||||||||||
Net sales | $ | 540,081 | $ | 610,824 | $ | 683,501 | $ | 620,632 | $ | 577,219 | $ | 433,226 | $ | 583,102 | $ | 593,612 | $ | 540,081 | $ | 610,824 | ||||||||||||||||||||
Cost of sales | 427,333 | 496,866 | 536,014 | 485,815 | 451,098 | 322,705 | 461,056 | 488,508 | 426,810 | 494,365 | ||||||||||||||||||||||||||||||
Casualty loss (2) | - | - | 500 | - | - | |||||||||||||||||||||||||||||||||||
Inventory valuation expense | 1,829 | 28,752 | (2) | 3,402 | 523 | 2,501 | ||||||||||||||||||||||||||||||||||
Gross profit | 112,748 | 113,958 | 146,987 | 134,817 | 126,121 | 108,692 | 93,294 | 101,702 | 112,748 | 113,958 | ||||||||||||||||||||||||||||||
Selling and administrative expenses | 80,410 | 88,867 | 91,928 | 87,279 | 83,186 | 92,678 | 95,815 | 84,475 | 80,410 | 88,867 | ||||||||||||||||||||||||||||||
Goodwill impairment | 39,568 | - | - | - | - | - | - | - | 39,568 | - | ||||||||||||||||||||||||||||||
Trade names impairment | 4,750 | - | - | - | - | - | 13 | - | 4,750 | - | ||||||||||||||||||||||||||||||
Intangible asset amortization | 2,384 | 2,384 | 2,384 | 2,084 | 3,134 | 3,656 | 3,512 | 2,384 | 2,384 | 2,384 | ||||||||||||||||||||||||||||||
Operating (loss)/income (3) | (14,364 | ) | 22,707 | 52,675 | 45,454 | 39,801 | ||||||||||||||||||||||||||||||||||
Operating income/(loss) | 12,358 | (6,046 | ) | 14,843 | (14,364 | ) | 22,707 | |||||||||||||||||||||||||||||||||
Other income, net | 336 | 458 | 369 | 1,566 | 349 | 1,653 | 416 | 373 | 336 | 458 | ||||||||||||||||||||||||||||||
Interest Expense, net | 540 | 1,238 | 1,454 | 1,248 | 954 | 1,573 | 519 | 110 | 540 | 1,238 | ||||||||||||||||||||||||||||||
(Loss)/Income before income taxes | (14,568 | ) | 21,927 | 51,590 | 45,772 | 39,196 | ||||||||||||||||||||||||||||||||||
Income tax (benefit)/expense | (4,142 | ) | 4,844 | 11,717 | 17,522 | 13,909 | ||||||||||||||||||||||||||||||||||
Net (loss)/income | (10,426 | ) | 17,083 | 39,873 | 28,250 | 25,287 | ||||||||||||||||||||||||||||||||||
Income/(loss) before income taxes | 12,438 | (6,149 | ) | 15,106 | (14,568 | ) | 21,927 | |||||||||||||||||||||||||||||||||
Income tax expense/(benefit) | 2,573 | (1,837 | ) | 3,388 | (4,142 | ) | 4,844 | |||||||||||||||||||||||||||||||||
Net income/(loss) | 9,865 | (4,312 | ) | 11,718 | (10,426 | ) | 17,083 | |||||||||||||||||||||||||||||||||
Per Share Data: | ||||||||||||||||||||||||||||||||||||||||
Basic (loss)/earnings per share | $ | (0.88 | ) | $ | 1.44 | $ | 3.38 | $ | 2.42 | $ | 2.19 | |||||||||||||||||||||||||||||
Diluted (loss)/earnings per share | (0.88 | ) | 1.44 | 3.38 | 2.42 | 2.18 | ||||||||||||||||||||||||||||||||||
Basic earnings/(loss) per share | $ | 0.91 | $ | (0.37 | ) | $ | 0.99 | $ | (0.88 | ) | $ | 1.44 | ||||||||||||||||||||||||||||
Diluted earnings/(loss) per share | 0.91 | (0.37 | ) | 0.97 | (0.88 | ) | 1.44 | |||||||||||||||||||||||||||||||||
Cash dividends per share | 0.66 | 0.61 | 0.57 | 0.50 | 0.42 | 0.89 | 0.82 | 0.74 | 0.66 | 0.61 | ||||||||||||||||||||||||||||||
Net book value per share | 21.76 | 23.25 | 22.37 | 19.53 | 17.16 | 21.54 | 21.33 | 22.01 | 21.76 | 23.25 | ||||||||||||||||||||||||||||||
Weighted average shares outstanding (basic) | 11,822 | 11,784 | 11,759 | 11,633 | 11,531 | |||||||||||||||||||||||||||||||||||
Weighted average number of shares outstanding (basic) | 10,838 | 11,593 | 11,852 | 11,822 | 11,784 | |||||||||||||||||||||||||||||||||||
Balance Sheet Data: | ||||||||||||||||||||||||||||||||||||||||
Cash and cash equivalents | $ | 65,841 | $ | 36,031 | $ | 11,435 | $ | 30,915 | $ | 39,792 | $ | 43,159 | $ | 19,002 | $ | 69,366 | $ | 65,841 | $ | 36,031 | ||||||||||||||||||||
Trade accounts receivable | 83,290 | 87,653 | 112,557 | 92,803 | 92,578 | 51,280 | 62,129 | 73,727 | 83,290 | 87,653 | ||||||||||||||||||||||||||||||
Inventories | 70,159 | 92,813 | 105,204 | 84,459 | 75,303 | 61,815 | 96,675 | 75,023 | 70,159 | 92,813 | ||||||||||||||||||||||||||||||
Working capital | 169,612 | 171,838 | 170,516 | 153,162 | 147,856 | 123,389 | 137,265 | 170,777 | 169,612 | 171,838 | ||||||||||||||||||||||||||||||
Total assets | 352,273 | 393,708 | 369,716 | 350,058 | 318,696 | 343,586 | 381,716 | 374,559 | 352,273 | 393,708 | ||||||||||||||||||||||||||||||
Long-term debt (including current maturities) | - | 30,138 | 35,508 | 53,425 | 47,710 | 22,874 | 24,266 | - | - | 30,138 | ||||||||||||||||||||||||||||||
Shareholders' equity | 257,503 | 274,121 | 263,176 | 229,460 | 197,927 | 225,975 | 236,021 | 261,128 | 257,503 | 274,121 | ||||||||||||||||||||||||||||||
(1) | Our fiscal years end on the Sunday closest to January |
(2) | Represents the |
(3) |
|
| Represents impairment charges and amortization expense on acquisition-related intangibles. |
| Net book value per share is derived by dividing “shareholders’ equity” by the number of common shares issued and outstanding, excluding unvested restricted shares, all determined as of the end of each fiscal period. |
| Long-term debt (including current maturities): Fiscal 2024 and 2023 amounts consist of acquisition related term loans to fund the Sunset Acquisition. Fiscal 2020 amounts consisted of term loans incurred to fund a portion of the Home Meridian and Shenandoah |
ITEM 7. MANAGEMENT’S DISCUSSION AND ANALYSIS OF FINANCIAL CONDITION AND RESULTS OF OPERATIONS
As you read Management’s Discussion and Analysis, please refer to the selected financial data and the consolidated financial statements, including the related notes, contained elsewhere in this annual report. We especially encourage you to familiarize yourself with:
■ | All of our recent public filings made with the |
■ | The forward-looking statements disclaimer contained prior to Item 1 of this report, which describe the significant risks and uncertainties that could cause actual results to differ materially from those forward-looking statements made in this report, including those contained in this section of our annual report on Form 10-K; |
■ | The company-specific risks found in Item 1A. “Risk Factors” of this report. This section contains critical information regarding significant risks and uncertainties that we face. If any of these risks materialize, our business, financial condition and future prospects could be adversely impacted; and |
■ | Our commitments and contractual obligations and off-balance sheet arrangements described on page |
In Management’s Discussion and Analysis, we analyze and explain the annual changes in some specific line items in the consolidated financial statements for fiscal 20212024 compared to fiscal 2020.2023. We also provide information regarding the performance of each of our operating segments and All Other. The analysis and discussions of fiscal 20202023 compared to fiscal 20192022 results are in our 2020 Form 10-K2023 Form-10K available through Hooker FurnitureFurnishings and Securities and Exchange CommissionSEC websites.
Unless otherwise indicated, references to the “Company”, "we," "our"“Company,” “we,” “our” or "us"“us” refer to Hooker FurnitureFurnishings Corporation and its consolidated subsidiaries, unless specifically referring to segment information. All references to the “Hooker”,“Hooker,” “Hooker Division”,Division,” “Hooker Legacy Brands” or “traditional Hooker” divisions or companies refer to the current components of our Hooker Branded segment, the Domestic Upholstery segment including Bradington-Young, Sam MooreHF Custom, Shenandoah Furniture and Shenandoah Furniture,Sunset West, and All Other which includes H Contract, Lifestyle Brands and Lifestyle Brands.BOBO Intriguing Objects.
FurnitureFurnishings sales account for all of our net sales. For financial reporting purposes, we are organized into three reportable segments- Hooker Branded, Home Meridian and Domestic Upholstery, with our other businesses included in All Other. We continuallyregularly monitor our reportable segments for changes in facts and circumstances to determine whether changes in the identification or aggregation of operating segments are necessary. InBefore the fourthfiscal 2024 third quarter, H Contract’s results included sales of fiscal 2020, we updated our reportable segments as follows: Domestic upholstery producers Bradington-Young, Sam Moore and Shenandoah Furniture were movedproducts sourced from All Other and aggregated into a new reportable segment called “Domestic Upholstery.” All Other now consists of H Contract and Lifestyle Brands. Lifestyle Brands is a business in its start-up phase targeted at the interior designer channel. The Hooker Branded and Home Meridian segments were unchanged.Domestic Upholstery segments. Due to a change in the way management internally evaluates operating performance, beginning with fiscal 2024 third quarter, Hooker Branded and Domestic Upholstery segments’ results now include sales of products formerly included in H Contract’s results. Fiscal 20202024 and 2019fiscal 2023 results discussed below have been recast to reflect this change. The Home Meridian segment is unchanged. Additionally, based on our analysis and the re-compositionrequirements of our operating segments duringASC 280: Segment Reporting, the 2020 fourth quarter.operational results of the newly acquired BOBO Intriguing Objects division are included in All Other starting in the second quarter of fiscal 2024 on a prospective basis. See Note 1718 to our consolidated financial statements for additional financial information regarding our segments.
Overview
Hooker Furniture Corporation, incorporated in Virginia in 1924, is a designer, marketer and importer of casegoods (wooden and metal furniture), leather furniture and fabric-upholstered furniture for the residential, hospitality and contract markets. We also domestically manufacture premium residential custom leather and custom fabric-upholstered furniture. We are ranked among the nation’s top five largest publicly traded furniture sources, based on 2019 shipments to U.S. retailers, according to a 2020 survey by a leading trade publication.
We believe that consumer tastes and channels in which they shop for furniture are evolving at a rapid pace and we continue to change to meet these demands.
Our strategy is to leverage the financial strength afforded us by Hooker’s slower-growing but highly profitable traditional businesses in order to boost revenues and earnings both organically and by acquiring companies selling in faster-growing channels of distribution in which our traditional businesses are under-represented. Consequently, Hooker acquired Home Meridian on February 1, 2016 (the “Home Meridian acquisition”) and Shenandoah Furniture on September 29, 2017(the “Shenandoah acquisition”).
We believe our acquisition of Home Meridian has better positioned us in some of the fastest growing and advantaged channels of distribution, including e-commerce, warehouse membership clubs and contract hospitality furniture. While growing faster than industry average, these channels tend to operate at lower margins.
We also believe our acquisition of Shenandoah Furniture, a North Carolina-based domestic upholsterer, has better positioned us in the “lifestyle specialty” retail distribution channel. For that channel, domestically- produced, customizable upholstery is extremely viable and preferred by the end consumers who shop at retailers in that channel.
Executive Summary- Fiscal 20212024 Results of Operations
AsFiscal 2024 consolidated net sales were $433.2 million, a decrease of $149.9 million or 25.7%, compared to the previous fiscal year. This decline was attributed to industry-wide soft demand and the exit of unprofitable product lines in the Home Meridian segment, the latter of which resulted in an approximate $21 million reduction in revenue. All three segments experienced sales declines with Home Meridian’s net sales down by $72.8 million or 33.7%, Hooker Branded’s net sales down by $49.3 million or 24.0%, and Domestic Upholstery’s net sales down by $29.9 million or 19.1%, all compared to each respective segment’s prior fiscal year sales. Despite the sales decrease, consolidated gross profit increased by $15.4 million and gross margin improved by 910 bps, compared to the prior fiscal year, due primarily to the one-time $24.4 million inventory write-down in fiscal 2023 at Home Meridian, as well as increased gross margin at Hooker Branded in fiscal 2024. The Company recorded a consolidated operating income of $12.4 million compared to an operating loss of $6.0 million in the prior fiscal year. Consolidated net income was $9.9 million, or $0.91 per diluted share, compared to a net loss of $4.3 million or ($0.37) per diluted share in the prior fiscal year.
Our fiscal 2024 performance is discussed in greater detail below under “Review” and “Results of Operations” below, the following are the primary factors that affected our consolidated fiscal 2021 operations:.
|
|
|
|
|
|
|
|
|
|
|
|
|
|
|
|
|
|
Review
Fiscal 20212024 marked the third full fiscal year since the initial COVID crisis and was onea pivotal year for us. Since 2020, we have navigated through some of the most challenging years of our 100-year history: the economic downturn of the pandemic, a demand surge for home furnishings, supply chain disruptions, inventory unavailability, historical high ocean freight costs, significant, persistent inflation and higher interest rates, a slow housing market, and a temporary shift in consumer discretionary spending away from home furnishings. Against the backdrop of these historical disruptions and anemic industry demand, we were able to leverage the strength of our nearly 97-year history as we experienced the upsbalance sheet and downsmake necessary strategic investments in our business under the COVID-19 global pandemic. We experienced steep declines in orders and sales early in fiscal 2021 when many2024 while improving profitability, strengthening our balance sheet and continuing our over 50-year history of dividend payments, including our customers’ stores were closed and the retail environment was severely impactedeighth consecutive annual dividend increase. On top of that, we completed a $25 million share re-purchase program during fiscal 2024. Among other investments in fiscal 2024 were: (1) a new cloud-based Enterprise Resource Planning system, which went live in our Legacy Hooker divisions in early September 2023, (2) expanding our showroom footprints by the initial pandemic. When the economy reopenedinvesting in the second quarter,much larger and better-located showroom in High Point and new showrooms in Atlanta and Las Vegas, (3) acquiring BOBO Intriguing Objects, an accessories and home décor resource (4) adding east coast distribution to the Sunset West outdoor product line, including leveraging our existing facilities at both HF Custom and our Savannah distribution facility by adding assembly operations at each to support east coast distribution. In addition to these investments, we were encouragedmade substantial progress at Home Meridian by increased incoming orders whichliquidating the inventory from its exited low-margin e-commerce division and setting it on an expected path of sustainable profitability. We believe these investments and improvements will act as a springboard to much improved profitability once demand improves. We were attributable to increased demand of home furnishings due to renewed consumer focus on the home, higher levels of consumer confidence, the strong housing market and less competition from other discretionary spending categories, such as travel, dining out and sporting events and other forms of entertainment. However, our business continues to be impacted by supply chain disruptions, which include industry-wide scarcity of shipping containers and ocean vessel space, limited capacity of our overseas vendors, and production delays at our domestic manufacturing plants. On a more positive note, we are pleased to report that incoming orders increased by 5.8%a consolidated profit for fiscal 2024 despite a challenging and backlog more than doubled, both on consolidated basis, as compared to the prior fiscal year, showing solid improvements from the initial pandemic conditions encountered early in fiscal 2021.difficult environment for home furnishings.
The Hooker Branded segment recovered at the fastest pace among all our reportable segments. Net sales rebounded in the third and fourth fiscal quarters and the segment finished fiscal 2021 with essentially flat net sales compared to the prior fiscal year. The majority of this segment’s customers are traditional furniture stores and small or regional chains, which were deemed non-essential businesses and were closed early in the fiscal year. Demand for our products increased as our customers’ stores reopened during the second quarter, leading to double-digit monthly increases in incoming orders starting in June 2020 and through fiscal year end. The Hooker Branded segment finished the year with backlog more than tripled compared to the prior year-end backlog. This segment reported $22.8 million operating income or 14.1% operating margin, an increase of $1.3 million or 6.1% as compared to prior year. Given the economic conditions in fiscal 2021, we are pleased to have maintained and improved Hooker Branded segment profitability as compared to the prior year.
Home Meridian segment’s net sales decreased by $58.2$49.3 million or 17.1% in fiscal 2021 due primarily to sales declines in the hospitality business and major furniture chains, and to a lesser extent sales declines in the Accentrics Home (“ACH”) division which focuses on the e-commerce channel. The sales decline at Samuel Lawrence Hospitality (“SLH”) represented 45% of Home Meridian’s net sales decrease, as the hospitality division was severely impacted by COVID-19 pandemic’s negative effects on remodeling and new construction activity in the hospitality industry. The Pulaski Furniture (“PFC”) and Samuel Lawrence Furniture (“SLF”) divisions experienced a spike in order cancellations early in fiscal 2021 as their customers’ stores were closed or operated under restrictions. Incoming orders started to recover in mid-year; however, lack of container availability limited shipments and led to decreased sales as compared to the prior year period. Sales declines in ACH comprised the remaining sales decrease, which was attributable to Asian vendor production capacity challenges and container availability. HMidea net sales increased slightly due to steady sales in the Club business. Prime Resources International (“PRI”) net sales were essentially flat as compared to prior year despite the COVID-19 crisis, due to the additions of mass merchant customers. Home Meridian segment incoming orders increased by 3.8% and backlog doubled as compared to prior year. The segment’s $26.1 million operating loss was attributable to $27.9 million intangible asset impairment charge. Absent the impairment charge necessitated by our low stock price at the end of our first fiscal quarter at the initial height of the COVID-19 economic crisis, segment operating performance improved compared to a $7.2 million operating loss in the prior fiscal year.
Domestic Upholstery segment net sales decreased by $12.0 million or 12.5% due to decreased sales volume in all three domestic manufacturing divisions attributable to factory shutdowns and production delays. In response to COVID-19 restrictions and significantly reduced orders, in April we temporarily closed our manufacturing plants at Bradington-Young and Shenandoah for a month, while Sam Moore operated at 50% capacity. All three divisions experienced labor shortages and staffing issues when they resumed operations. The segment’s $12.4 million operating loss was attributable to $16.4 million intangible asset impairment charge. Additionally, profitability in this segment was negatively impacted by operating inefficiencies, partially mitigated by cost reduction measures. At the end of the fiscal year, Domestic Upholstery incoming orders were at the same level as prior year-end and backlog had doubled. We are pleased with the current historic levels of orders and backlog and as of year-end we were operating at full capacity in all three domestic manufacturing plants.
All Other net sales decreased by $1.0 million or 7.9% as24.0% compared to the prior fiscal year due principallyto soft demand for home furnishings. This decrease was further amplified by the strong sales in the prior year, driven by a surge in demand after the COVID crisis and fulfillment of historically high order backlog carried over from fiscal 2022. Hooker Branded’s fiscal 2024 net sales were at 97% of the pre-pandemic level in fiscal 2020. The sales decline resulted in a decrease of $3.2 million in gross profit; however, gross margin increased by 720 bps due to the combination of reduced ocean freight costs and the lingering effect of price increases implemented in the prior year. We implemented price decreases and promotions on orders effective from August 2023 onward to align with lower ocean freight costs and the current discounting levels within the home furnishings market. Warehousing and distribution costs decreased due to lower demurrage expenses and lower labor costs attributed to decreased inventory volume resulting from adjusted inventory planning, as inventory levels decreased by $20.7 million compared to the previous year-end. The easing of port and warehouse congestion was the primary reason for lower demurrage expenses. Sales and administrative expenses increased due to investments in new showrooms and High Point Market, higher salary expenses due to increased headcount and wage inflation, as well as increased professional service expenses supporting other growth initiatives. Despite decreased sales, this segment delivered a solid operating income of $16.8 million and operating margin of 10.8%, compared to $22 million and 10.7% in the prior year. Incoming orders remained flat compared to the prior year and the backlog was 25% lower than the previous year-end but remained 40% higher than the fiscal 2020 year-end.
The Home Meridian segment’snet sales decreased by $72.8 million, or 33.7% compared to the prior fiscal year due to sales decline at H Contract. The senior living industry, which comprisesdeclines across our major customers including traditional furniture chains, mass merchants and e-commerce. Additionally, closeout sales of exited product lines accounted for 26% of total sales decrease. On a more positive note, SLH achieved robust sales growth with a 38% increase, attributed to the majority of H Contract’songoing recovery in the hospitality industry. Despite reduced revenue, we were encouraged by the progress made from the business is struggling underrestructuring and re-organization decisions made in the COVID-19 crisis. Factorssegment in the prior year such as postponed new constructions, low occupancy rates,as: (1) returns and COVID-related expenses resulted in reduced spending on furnishings and reduced demand for our product. H Contract incoming ordersallowances decreased by 11.8% for150 bps compared to the prior year, reaching the lowest level in five years; (2) gross margin reached a five-year high, due to the absence of inventory write-downs as well as improved profitability in four existing divisions, as all four existing divisions exceeded their pre-pandemic gross margins from fiscal 2021; however, we believe vaccine rollouts are beginning to help the senior living industry as the decline2020; (3) with inventory levels decreased by over 60% in order rates slowed somewhatthis segment, reduced footprints in the fourth quarter. H Contract finishedGeorgia warehouse and the year with backlog 4.9% higherexit of California and North Carolina warehouses yielded a $3.7 million savings in fiscal 2024; and (4) personnel changes and other cost cutting initiatives contributed to a $3.5 million savings in operating expenses in fiscal 2024. However, these positive developments were not sufficient to offset substantial sales volume loss. While the segment still reported an operating loss of $5.5 million (3.9%), this represented the lowest loss since fiscal 2020. Incoming orders increased by $74.4 million, more than doubling compared to the prior year, end. Despite sales declinedue primarily to our efforts to broaden product offerings and unfavorable product mix, All Other contributed $1.3 million operating income to a lesser extent the consolidated results.absence of order cancellations from exited businesses in the current year. The year-end backlog was 16% lower than the previous year-end but increased by 30% compared to fiscal 2024 third quarter end.
DespiteThe Domestic Upholstery segment’snet sales decreased by $29.9 million, or 19.1% compared to the all-time record sales this segment achieved in the prior fiscal year due to fulfillment of historical high order backlog. Net sales at Bradington Young, HF Custom and Shenandoah exceeded the pre-pandemic levels in fiscal 2020. Early in the year, we adjusted production levels at select factories to align with current demand and backlog levels. Sales decreases led to factories operating lossbelow full capacity, which wasresulted in under-absorbed indirect costs, which were 360 bps higher than the prior year. Material costs decreased by 270 bps due to more stable raw materials costs and reduced freight-in costs. Sunset West’s operating income increased over 30% mostly due to decreased material costs, reduced operating expenses, and the absence of disruptions experienced during the prior year due to the implementation of the new ERP system. Bradington Young also recorded increased operating income and margin compared to the prior year. Profitability declined at HF Custom and Shenandoah driven by $44.3double-digit sales decreases. Incoming orders increased across all four divisions in fiscal 2024. The year-end order backlog was 36% lower than the prior year-end. Excluding Sunset West, year-end order backlog was 7% higher than the fiscal 2020 year-end.
Financial strength: We continued to improve our balance sheet, with cash increasing by $24.2 million to $43.2 million at year end. Additionally, we adjusted inventory levels to better align with our current business structure and demand, resulting in intangible assets impairment charges,a reduction of $34.9 million or 36% compared to the previous year-end. During fiscal 2024, we used $55.5 million generated $68.3 million from operating activities to fund $11.7 million repurchase of 620,634 shares, $9.7 million cash dividends to our shareholders, $6.8 million capital expenditures including investments in our new High Point, Atlanta and paid offVegas showrooms, $5.1 million for continued implementation of our new ERP system, $2.8 million principal and interests payments on term loans, and $2.4 million for the remaining $24.3BOBO acquisition. In addition to our cash balance, we had $28.3 million available under our $35 million revolving credit facility with BofA (the “Existing Revolver”) to fund working capital needs and have access to $28.5 million in term loans near year-end.cash surrender value of Company-owned life insurance policies. With strategic inventory management, reasonable capital expenditures, and prudent expense management, we believe we have the financial resources to support our business operations for the foreseeable future.
Commitment to shareholders: Our $25 million share repurchase program was completed during fiscal 2024. We purchased and retired approximately 1.4 million shares of our common stock since the share repurchase program began in the second quarter of fiscal 2023. In addition, in the third quarter of fiscal 2021, our2024, the Board of Directors approved the increase of ourthe quarterly dividend to $0.18$0.23 per share, an increase of 12.5% or $0.02 per share, for a total of $0.664.5% over the previous quarterly dividend, representing the eighth consecutive annual dividend increase. In fiscal 2024, dividends totaled $0.89 per share or $7.8$9.7 million paid in fiscal 2021,the aggregate, an increase of 8.2%8.5% or $0.05$0.07 per share compared to the prior year. Cash and cash equivalents stood at $65.8 million at fiscal 2021 year-end, an increase of nearly $30 million compared to the balance at prior year end. Based on existing cash balances, no debt, and an aggregate $28.7 million available under our revolver,Notably, we are confident in our financial position.have continuously paid annual dividends since 1969.
Results of Operations
The following table sets forth the percentage relationship to net sales of certain items for the annual periods included in the consolidated statements of operations:
Fifty-two | Fifty-two | Fifty-three | ||||||||||
weeks ended | weeks ended | weeks ended | ||||||||||
January 31, | February 2, | February 3, | ||||||||||
2021 | 2020 | 2019 | ||||||||||
Net sales | 100.0 | % | 100.0 | % | 100.0 | % | ||||||
Cost of sales | 79.1 | 81.3 | 78.5 | |||||||||
Gross profit | 20.9 | 18.7 | 21.5 | |||||||||
Selling and administrative expenses | 14.9 | 14.5 | 13.4 | |||||||||
Goodwill impairment charges | 7.3 | - | - | |||||||||
Trade name impairment charges | 0.9 | - | - | |||||||||
Intangible asset amortization | 0.4 | 0.4 | 0.3 | |||||||||
Operating (loss)/income | (2.7 | ) | 3.7 | 7.7 | ||||||||
Other income, net | 0.1 | 0.1 | 0.1 | |||||||||
Interest expense, net | 0.1 | 0.2 | 0.2 | |||||||||
(Loss)/income before income taxes | (2.7 | ) | 3.6 | 7.5 | ||||||||
Income tax (benefit)/expense | (0.8 | ) | 0.8 | 1.7 | ||||||||
Net (loss)/income | (1.9 | ) | 2.8 | 5.8 | ||||||||
Fiscal 2021 Compared to Fiscal 2020
| Net Sales | ||||||||||||||||||||||||
Fifty-two weeks ended | ||||||||||||||||||||||||
January 31, 2021 | February 2, 2020 | $ Change | % Change | |||||||||||||||||||||
% Net Sales | % Net Sales | |||||||||||||||||||||||
Hooker Branded | $ | 162,442 | 30.1 | % | $ | 161,990 | 26.4 | % | $ | 452 | 0.3 | % | ||||||||||||
Home Meridian | 282,423 | 52.3 | % | 340,630 | 55.8 | % | (58,207 | ) | -17.1 | % | ||||||||||||||
Domestic Upholstery | 83,678 | 15.5 | % | 95,670 | 15.7 | % | (11,992 | ) | -12.5 | % | ||||||||||||||
All Other | 11,538 | 2.1 | % | 12,534 | 2.1 | % | (996 | ) | -7.9 | % | ||||||||||||||
Consolidated | $ | 540,081 | 100 | % | $ | 610,824 | 100 | % | $ | (70,743 | ) | -11.6 | % | |||||||||||
Fifty-two weeks ended | ||||||||
January 28, | January 29, | |||||||
2024 | 2023 | |||||||
Net sales | 100.0 | % | 100.0 | % | ||||
Cost of sales | 74.5 | 79.1 | ||||||
| Inventory valuation expense | 0.4 | 4.9 | ||||||
Gross profit | 25.1 | 16.0 | ||||||
Selling and administrative expenses | 21.4 | 16.4 | ||||||
Intangible asset amortization | 0.8 | 0.6 | ||||||
Operating income / (loss) | 2.9 | (1.0 | ) | |||||
Other income, net | 0.4 | 0.1 | ||||||
Interest expense, net | 0.4 | 0.1 | ||||||
Income / (Loss) before income taxes | 2.9 | (1.0 | ) | |||||
Income tax expense / (benefit) | 0.6 | (0.3 | ) | |||||
Net income / (loss) | 2.3 | (0.7 | ) | |||||
Fiscal 2024 Compared to Fiscal 2023
Net Sales
Fifty-two weeks ended | ||||||||||||||||||||||||
January 28, 2024 | January 29, 2023 | $ Change | % Change | |||||||||||||||||||||
% Net Sales | % Net Sales | |||||||||||||||||||||||
Hooker Branded | $ | 156,590 | 36.2 | % | $ | 205,935 | 35.3 | % | $ | (49,345 | ) | -24.0 | % | |||||||||||
Home Meridian | 143,538 | 33.1 | % | 216,338 | 37.1 | % | (72,800 | ) | -33.7 | % | ||||||||||||||
Domestic Upholstery | 126,827 | 29.3 | % | 156,717 | 26.9 | % | (29,890 | ) | -19.1 | % | ||||||||||||||
All Other | 6,271 | 1.4 | % | 4,112 | 0.7 | % | 2,159 | 52.5 | % | |||||||||||||||
Consolidated | $ | 433,226 | 100 | % | $ | 583,102 | 100 | % | $ | (149,876 | ) | -25.7 | % | |||||||||||
Unit Volume and Average Selling Price (“ASP”)
Unit Volume | FY21 % Increase/ -Decrease vs. FY20 | Average Selling Price | FY21 % Increase/ -Decrease vs. FY20 | FY24 % Increase / (Decrease) vs. FY23 | Average Selling Price | FY24 % Increase / (Decrease) vs. FY23 | ||||||||||
Hooker Branded | -1.9% | Hooker Branded | 1.3% | -21.6 | % | Hooker Branded | -0.1 | % | ||||||||
Home Meridian | -17.4% | Home Meridian | 2.0% | -23.0 | % | Home Meridian | -13.2 | % | ||||||||
Domestic Upholstery | -11.4% | Domestic Upholstery | -1.6% | -24.2 | % | Domestic Upholstery | 7.7 | % | ||||||||
All Other | -7.6% | All Other | -1.3% | 0.2 | % | All Other | -6.9 | % | ||||||||
Consolidated | -15.1% | Consolidated | 4.6% | -22.7 | % | Consolidated | -2.6 | % | ||||||||
Consolidated net sales decreased compared to prior year due primarily to sales decline in the Home Meridian segment, and to a lesser extent the decreases in the Domestic Upholstery segment and All Other.all segments.
■ | Hooker Branded |
■ | Home Meridian |
■ | Domestic |
|
|
| Gross Profit and Margin | ||||||||||||||||||||||||
Fifty-two weeks ended | ||||||||||||||||||||||||
January 31, 2021 | February 2, 2020 | $ Change | % Change | |||||||||||||||||||||
% Segment Net Sales | % Segment Net Sales | |||||||||||||||||||||||
Hooker Branded | $ | 51,832 | 31.9 | % | $ | 51,462 | 31.8 | % | $ | 370 | 0.7 | % | ||||||||||||
Home Meridian | 39,832 | 14.1 | % | 36,936 | 10.8 | % | 2,896 | 7.8 | % | |||||||||||||||
Domestic Upholstery | 17,121 | 20.5 | % | 21,120 | 22.1 | % | (3,999 | ) | -18.9 | % | ||||||||||||||
All Other | 3,963 | 34.4 | % | 4,440 | 35.4 | % | (477 | ) | -10.7 | % | ||||||||||||||
Consolidated | $ | 112,748 | 20.9 | % | $ | 113,958 | 18.7 | % | $ | (1,210 | ) | -1.1 | % | |||||||||||
ConsolidatedGross Profit/(Loss) and Margin
Fifty-two weeks ended | ||||||||||||||||||||||||
January 28, 2024 | January 29, 2023 | $ Change | % Change | |||||||||||||||||||||
% Segment Net Sales | % Segment Net Sales | |||||||||||||||||||||||
Hooker Branded | $ | 57,671 | 36.8 | % | $ | 60,871 | 29.6 | % | $ | (3,200 | ) | -5.3 | % | |||||||||||
Home Meridian | 24,367 | 17.0 | % | (2,620 | ) | -1.2 | % | 26,987 | 1030.0 | % | ||||||||||||||
Domestic Upholstery | 24,048 | 19.0 | % | 32,633 | 20.8 | % | (8,585 | ) | -26.3 | % | ||||||||||||||
All Other | 2,606 | 41.5 | % | 2,410 | 58.6 | % | 196 | 8.1 | % | |||||||||||||||
Consolidated | $ | 108,692 | 25.1 | % | $ | 93,294 | 16.0 | % | $ | 15,398 | 16.5 | % | ||||||||||||
Despite sales decreases across segments, consolidated gross profit decreased slightly in absolute terms butand margin both increased as a percentage of net sales as compared to the prior fiscal year.year, primarily attributable to the absence of the inventory write-down at the Home Meridian segment in the current period.
■ | The Hooker Branded |
■ | The Home Meridian |
■ | Domestic Upholstery segment experienced a decrease in both gross profit |
Selling and Administrative Expenses (“S&A”) |
|
| Selling and Administrative Expenses (S&A) | ||||||||||||||||||||||||||||||||||||||||||||||||
Fifty-two weeks ended | Fifty-two weeks ended | |||||||||||||||||||||||||||||||||||||||||||||||
January 31, 2021 | February 2, 2020 | $ Change | % Change | January 28, 2024 | January 29, 2023 | $ Change | % Change | |||||||||||||||||||||||||||||||||||||||||
% Segment Net Sales | % Segment Net Sales | % Segment Net Sales | % Segment Net Sales | |||||||||||||||||||||||||||||||||||||||||||||
Hooker Branded | $ | 29,005 | 17.9 | % | $ | 29,949 | 18.5 | % | $ | (944 | ) | -3.2 | % | $ | 40,829 | 26.1 | % | $ | 38,840 | 18.9 | % | $ | 1,989 | 5.1 | % | |||||||||||||||||||||||
Home Meridian | 36,632 | 13.0 | % | 42,771 | 12.6 | % | (6,139 | ) | -14.4 | % | 28,575 | 19.9 | % | 33,215 | 15.4 | % | (4,640 | ) | -14.0 | % | ||||||||||||||||||||||||||||
Domestic Upholstery | 12,108 | 14.5 | % | 13,433 | 14.0 | % | (1,325 | ) | -9.9 | % | 20,582 | 16.2 | % | 21,584 | 13.8 | % | (1,002 | ) | -4.6 | % | ||||||||||||||||||||||||||||
All Other | 2,665 | 23.1 | % | 2,714 | 21.7 | % | (49 | ) | -1.8 | % | 2,692 | 42.9 | % | 2,176 | 52.9 | % | 516 | 23.7 | % | |||||||||||||||||||||||||||||
Consolidated | $ | 80,410 | 14.9 | % | $ | 88,867 | 14.5 | % | $ | (8,457 | ) | -9.5 | % | $ | 92,678 | 21.4 | % | $ | 95,815 | 16.4 | % | $ | (3,137 | ) | -3.3 | % | ||||||||||||||||||||||
Consolidated selling and administrative expenses decreased in absolute terms butdue to reduced costs at Home Meridian and Domestic Upholstery segments, though partially offset by increased expenses in the Hooker Branded segment. Consolidated S&A expenses increased as a percentage of net sales due to a decrease in fiscal 2021.net sales.
■ | Hooker Branded |
■ | Home Meridian |
|
|
■ |
|
Goodwill impairment charges | ||||||||||||||||||||||||
Fifty-Two Weeks Ended | ||||||||||||||||||||||||
January 31, 2021 | February 2, 2020 | $ Change | % Change | |||||||||||||||||||||
% Net Sales | % Net Sales | |||||||||||||||||||||||
Home Meridian | $ | 23,187 | 8.2 | % | $ | - | 0.0 | % | $ | 23,187 | ||||||||||||||
Domestic Upholstery | 16,381 | 19.6 | % | - | 0.0 | % | 16,381 | |||||||||||||||||
Consolidated | 39,568 | 7.3 | % | - | 39,568 | |||||||||||||||||||
Trade name impairment charges | ||||||||||||||||||||||||
Fifty-Two Weeks Ended | ||||||||||||||||||||||||
January 31, 2021 | February 2, 2020 | $ Change | % Change | |||||||||||||||||||||
% Net Sales | % Net Sales | |||||||||||||||||||||||
Home Meridian | $ | 4,750 | 1.7 | % | $ | - | $ | 4,750 | ||||||||||||||||
Consolidated | $ | 4,750 | 0.9 | % | $ | - | 4,750 | |||||||||||||||||
In the first quarter of fiscal 2021, we recorded $23.2 million and $16.4 million in non-cash impairment charges to write down goodwill in the Home Meridian segment and the Shenandoah division of the Domestic Upholstery segment, respectively. We also recorded $4.8 million in non-cash impairment charges to write down tradenames in the Home Meridian segment. See Note 9 for additional details on these impairment charges.Intangible Asset Amortization
| Intangible Asset Amortization | ||||||||||||||||||||||||
Fifty-two Weeks Ended | ||||||||||||||||||||||||
January 31, 2021 | February 2, 2020 | $ Change | % Change | |||||||||||||||||||||
% Net Sales | % Net Sales | |||||||||||||||||||||||
Intangible asset amortization | $ | 2,384 | 0.4 | % | $ | 2,384 | 0.4 | % | $ | - | 0.0 | % | ||||||||||||
Fifty-two weeks ended | ||||||||||||||||||||||||
January 28, 2024 | January 29, 2023 | $ Change | % Change | |||||||||||||||||||||
% Net Sales | % Net Sales | |||||||||||||||||||||||
Intangible asset amortization | $ | 3,656 | 0.8 | % | $ | 3,512 | 0.6 | % | $ | 144 | 4.1 | % | ||||||||||||
Intangible asset amortization expense was unchanged comparedhigher in fiscal 2024 due to the prior year period.reassessment and amortization of Sam Moore trade name. See Note 910 Intangible Assets and Goodwill to our Consolidated Financial Statements for additional information about our amortizable intangible assets.
| Operating (Loss)/Profit and Margin | ||||||||||||||||||||||||
Fifty-two weeks ended | ||||||||||||||||||||||||
January 31, 2021 | February 2, 2020 | $ Change | % Change | |||||||||||||||||||||
%Segment Net Sales | %Segment Net Sales | |||||||||||||||||||||||
Hooker Branded | $ | 22,827 | 14.1 | % | $ | 21,512 | 13.3 | % | $ | 1,315 | 6.1 | % | ||||||||||||
Home Meridian | (26,071 | ) | -9.2 | % | (7,169 | ) | -2.1 | % | (18,902 | ) | 263.7 | % | ||||||||||||
Domestic Upholstery | (12,418 | ) | -14.8 | % | 6,637 | 6.9 | % | (19,055 | ) | -287.1 | % | |||||||||||||
All Other | 1,298 | 11.3 | % | 1,727 | 13.8 | % | (429 | ) | -24.8 | % | ||||||||||||||
Consolidated | $ | (14,364 | ) | -2.7 | % | $ | 22,707 | 3.7 | % | $ | (37,071 | ) | -163.3 | % | ||||||||||
Operating Profit / (Loss) and Margin
Fifty-two weeks ended | ||||||||||||||||||||||||
January 28, 2024 | January 29, 2023 | $ Change | % Change | |||||||||||||||||||||
%Segment Net Sales | %Segment Net Sales | |||||||||||||||||||||||
Hooker Branded | $ | 16,844 | 10.8 | % | $ | 22,030 | 10.7 | % | $ | (5,186 | ) | -23.5 | % | |||||||||||
Home Meridian | (5,530 | ) | -3.9 | % | (37,181 | ) | -17.2 | % | 31,651 | 85.1 | % | |||||||||||||
Domestic Upholstery | 1,131 | 0.9 | % | 8,871 | 5.7 | % | (7,740 | ) | -87.3 | % | ||||||||||||||
All Other | (87 | ) | -1.4 | % | 234 | 5.7 | % | (321 | ) | -137.2 | % | |||||||||||||
Consolidated | $ | 12,358 | 2.9 | % | $ | (6,046 | ) | -1.0 | % | $ | 18,404 | 304.4 | % | |||||||||||
OperatingConsolidated operating profitability decreasedincreased both in absolute terms and as a percentage of net sales in fiscal 20212024 compared to the same prior-year period due to the factors discussed above.
| Interest Expense, net | ||||||||||||||||||||||||
Fifty-two Weeks Ended | ||||||||||||||||||||||||
January 31, 2021 | February 2, 2020 | $ Change | % Change | |||||||||||||||||||||
% Net Sales | % Net Sales | |||||||||||||||||||||||
Interest expense, net | $ | 540 | 0.1 | % | $ | 1,238 | 0.2 | % | $ | (698 | ) | -56.4 | % | |||||||||||
Interest Expense, net
Fifty-two Weeks Ended | ||||||||||||||||||||||||
January 28, 2024 | January 29, 2023 | $ Change | % Change | |||||||||||||||||||||
% Net Sales | % Net Sales | |||||||||||||||||||||||
Interest expense, net | $ | 1,573 | 0.4 | % | $ | 519 | 0.1 | % | $ | 1,054 | 203.1 | % | ||||||||||||
Consolidated interest expense increased in fiscal 2021 decreased2024 due to lower balancesinterest incurred for the entire year on ourthe term loans, which we entered in July of 2022 as well as lowerhigher interest rates.
| Income Taxes | ||||||||||||||||||||||||
Fifty-two weeks ended | ||||||||||||||||||||||||
January 31, 2021 | February 2, 2020 | $ Change | % Change | |||||||||||||||||||||
% Net Sales | % Net Sales | |||||||||||||||||||||||
Consolidated income tax (benefit)/expense | $ | (4,142 | ) | -0.8 | % | $ | 4,844 | 0.8 | % | $ | (8,986 | ) | -185.5 | % | ||||||||||
Effective Tax Rate | 28.4 | % | 22.1 | % | ||||||||||||||||||||
Income Taxes
Fifty-two weeks ended | |||||||||||||||||||||||||
January 28, 2024 | January 29, 2023 | $ Change | % Change | ||||||||||||||||||||||
% Net Sales | % Net Sales | ||||||||||||||||||||||||
Consolidated income tax expense / (benefit) | $ | 2,573 | 0.6 | % | $ | (1,837 | ) | -0.3 | % | $ | 4,410 | 240.1 | % | ||||||||||||
Effective Tax Rate | 20.7 | % | 29.9 | % | |||||||||||||||||||||
We recorded income tax benefitexpense of $4.1$2.6 million for fiscal 2021, of which an2024, compared to income tax benefit of $10.6 was recorded related to goodwill and trade name impairment charges, compared to $4.8$1.8 million income tax expense for the same prior year period.fiscal 2023. The effective tax rates for the fiscal 20212024 and 2020fiscal 2023 were 28.4%20.7% and 22.1%29.9%, respectively. OurThe effective tax rate was higher in fiscal 20212023 due primarily to the Employer Retention Credit for employers affected by qualified disasters underimpact of state tax benefits and the Consolidated Appropriations Actcash surrender value of 2020 and increased state income taxes.company-owned life insurance which were added to the favorable tax impact of the pretax loss, versus a subtraction from tax expense in the case of a pretax profit in the current year. See Note 16 “Income Taxes”17 Income Taxes to our Consolidated Financial Statements for additional information about our income taxes.
| Net (Loss)/Income and (Loss)/Earnings Per Share | ||||||||||||||||||||||||
Fifty-two weeks ended | ||||||||||||||||||||||||
January 31, 2021 | February 2, 2020 | $ Change | % Change | |||||||||||||||||||||
Net (Loss)/Income | % Net Sales | % Net Sales | ||||||||||||||||||||||
Consolidated | $ | (10,426 | ) | -1.9 | % | $ | 17,083 | 2.8 | % | $ | (27,509 | ) | -161.0 | % | ||||||||||
Diluted (loss)/earnings per share | $ | (0.88 | ) | $ | 1.44 | |||||||||||||||||||
Net Income / (Loss) and Earnings (Loss) Per Share
Fifty-two weeks ended | ||||||||||||||||||||||||
January 28, 2024 | January 29, 2023 | $ Change | % Change | |||||||||||||||||||||
Net income / (loss) | % Net Sales | % Net Sales | ||||||||||||||||||||||
Consolidated | $ | 9,865 | 2.3 | % | $ | (4,312 | ) | -0.7 | % | $ | 14,177 | 328.8 | % | |||||||||||
Diluted earnings / (loss) per share | $ | 0.91 | $ | (0.37 | ) | |||||||||||||||||||
The analysis and discussion of fiscal 20202023 compared to fiscal 20192022 results isare available in Item 7 of our 20202023 Annual Report on Form 10-KForm-10K available through Hooker FurnitureFurnishings and Securities and Exchange CommissionSEC websites.
Financial Condition, Liquidity and Capital Resources
Summary Cash Flow Information – Operating, Investing and Financing Activities
Fifty-Two Weeks Ended | Fifty-Two Weeks Ended | Fifty-Three Weeks Ended | ||||||||||
January 31, | February 2, | February 3, | ||||||||||
2021 | 2020 | 2019 | ||||||||||
Net cash provided by operating activities | $ | 68,263 | $ | 41,429 | $ | 9,662 | ||||||
Net cash used in investing activities | (476 | ) | (4,254 | ) | (4,511 | ) | ||||||
Net cash used in financing activities | (37,977 | ) | (12,579 | ) | (24,631 | ) | ||||||
Net increase (decrease) in cash and cash equivalents | $ | 29,810 | $ | 24,596 | $ | (19,480 | ) | |||||
Fifty-Two Weeks Ended | ||||||||||||
January 28, | January 29, | January 30, | ||||||||||
2024 | 2023 | 2022 | ||||||||||
Net cash provided by/(used in) operating activities | $ | 55,471 | $ | (21,718 | ) | $ | 19,209 | |||||
Net cash used in investing activities | (8,558 | ) | (29,965 | ) | (6,862 | ) | ||||||
Net cash (used in)/provided by financing activities | (22,756 | ) | 1,319 | (8,822 | ) | |||||||
Net increase/(decrease) in cash and cash equivalents | $ | 24,157 | $ | (50,364 | ) | $ | 3,525 | |||||
During fiscal 2021,2024, we used existing cash, a portion of the $68.3$55.5 million cash generated from operations and $1.3$1.0 million in life insurance proceeds to retire our $30.1fund $11.7 million in outstanding term loans related to the Home Meridian acquisition, pay $7.8share repurchases, $9.7 million in cash dividends $1.2to our shareholders, $6.8 million in capital expenditures to enhanceincluding investments in our systemsnew showrooms, $5.1 million for development of our cloud-based ERP system, $2.4 million on the BOBO acquisition, and facilities and to pay $555,000 for$406,000 in life insurance premiums on Company-owned life insurance policies. Company-owned life insurance policies are in place to compensate us for the loss of key employees and to facilitate business continuity.
During fiscal 2020,2023, we used somea portion of the $41.4$25 million generated from operationsterm-loan proceeds and $1.4existing cash and cash equivalents on hand to fund the $25 million proceeds received from a note receivable toSunset Acquisition, pay $7.2$13.3 million in purchases and retirement of common stock, build up inventory levels by $19 million, $9.6 million in cash dividends, $6.4$5.4 million principal payments and interest towardsfor the development of our term loans, $5.1new cloud-based ERP system, $4.2 million in capital expenditures to expand our domestic manufacturing capacities and to enhance our business systems and facilities, and $590,000 for$492,000 in life insurance premiums on Company-owned life insurance policies.
During fiscal 2019, $9.72022, we used a portion of the $19.2 million generated from operations $1.2 millionand $372,000 in life insurance proceeds and cash on hand helped make $17.9 million in principal payments on our term loans, $6.7to pay $8.8 million in cash dividends, $5.2$6.7 million ofin capital expenditures to enhance our systems and $652,000facilities and $560,000 for insurance premiums on Company-owned life insurance policies.
Liquidity, Financial Resources and Capital Expenditures
Our financial resources include:sources of liquidity are:
■ | available cash and cash equivalents, which are highly dependent on incoming order rates and our operating performance; |
■ | expected cash flow from operations; |
■ | available lines of credit; and |
■ | cash surrender value of Company-owned life-insurance. |
We believe these resourcesThe most significant components of our working capital are sufficientinventory, accounts receivable and cash and cash equivalents reduced by accounts payable and accrued expenses.
Our most significant ongoing short-term cash requirements relate primarily to meetfunding operations (including expenditures for inventory, lease payments and payroll), quarterly dividend payments and capital expenditures related primarily to our business requirementsERP project, showroom renovations and upgrading systems, buildings and equipment. The timing of our working capital needs can vary greatly depending on demand for and availability of raw materials and imported finished goods but is generally the paymentgreatest in the mid-summer as a result of dividends through fiscal 2022 andinventory build-up for the foreseeable future, including expected capital expenditurestraditional fall selling season. Long-term cash requirements relate primarily to repayment of long-term debt and working capital needs.funding lease payments.
Loan Agreements and Revolving Credit Facility
We paid off the term loans which were related to the Home Meridian acquisition at the end of fiscal 2021 and currently have one $35 million revolving credit facility (the “Existing Revolver”). The credit facility was provided for in the amended and restated loan agreement (the “Original Loan Agreement”), whichOn July 26, 2022, we entered into on February 1, 2016the Fourth Amendment to the Second Amended and Restated Loan Agreement (the “Amendment”) with Bank of America, N. A.N.A. (“BofA”) in connection withto replenish cash used to make the Home Meridian acquisition. We entered aSunset Acquisition. The Second Amended and Restated Loan Agreement dated as of September 29, 2017, (the “Second Amended and Restated Loan Agreement”),had previously been amended by a First Amendment to Second Amended and Restated Loan Agreement dated as of January 31, 2019, a Second Amendment to Second Amended and Restated Loan Agreement dated as of November 4, 2020, and a Third Amendment to the Second Amended and Restated Loan Agreement dated as of January 27, 2021.2021 (as so amended, the “Existing Loan Agreement”). Details of our revolvingthe individual credit facilityfacilities provided for in the Amendment are outlined below:as follows:
■ |
|
|
|
| then current Bloomberg Short-Term Bank Yield Index (“BSBY”) (adjusted periodically) plus 1.00%. The |
|
|
| interest rate will be adjusted on a monthly basis. The actual daily amount of undrawn letters of credit is subject to a quarterly fee equal to a per annum rate of 1% |
■ | 2022 Secured Term Loan. The Amendment provided us with a $18 million term loan (the “Secured Term Loan”), which was disbursed to us on July 26, 2022. We |
■ |
|
We may prepay any outstanding principal amounts borrowed under either the Secured Term Loan or the Unsecured Term Loan at any time, without penalty provided that any payment is accompanied by all accrued interest owed. As of Contents
We incurred $37,500 in debt issuance costs in connection with our term loans. As of January 28, 2024, unamortized loan costs of $26,250 were netted against the carrying value of our term loans on our consolidated balance sheets.
The loan covenants agreed to under the Second Amended and Restated Loan Agreement continue to apply to us. They includeAmendment also included customary representations and warranties and requires us to comply with customary covenants, including, among other things, the following financial covenants:
● | Maintain a ratio of funded debt to EBITDA not |
o | 2.25:1.0 through July 30, 2024; and |
o | 2.00:1.00 thereafter. |
● | A basic fixed charge coverage ratio of at least 1.25:1.00; and |
● | Limit capital expenditures to no more than $15.0 million during any fiscal year. |
TheyThe Existing Loan Agreement also limitlimits our right to incur other indebtedness, make certain investments and create liens upon our assets, subject to certain exceptions, among other restrictions. They doThe Existing Loan Agreement does not restrict our ability to pay cash dividends on, or repurchase, shares of our common stock, subject to our compliance with the financial covenants discussed above, if we are not otherwise in default under the agreements.Existing Loan Agreement.
We were in compliance with each of these financial covenants at January 31, 202128, 2024 and expect to remain in compliance with existing covenants for the foreseeable future. We believe we have financial resources to weather the expected short-term impacts of COVID-19; however, an extended impact may materially and adversely affect our sales, earnings and liquidity.
Revolving Credit Facility Availability
As of January 31, 2021,28, 2024, we had an aggregate $28.7$28.3 million available under theour $35 million Existing Revolver to fund working capital needs. Standby letters of credit in the aggregate amount of $6.3$6.7 million, used to collateralize certain insurance arrangements and for imported product purchases, were outstanding under the revolving credit facilityExisting Revolver as of January 31, 2021.28, 2024. There were no additional borrowings outstanding under the Existing Revolver as of January 31, 2021.28, 2024.
Share Repurchase Authorization
In fiscal 2023, our Board of Directors authorized the repurchase of up to $20 million of the Company’s common shares. The authorization did not obligate us to acquire a specific number of shares during any period and did not have an expiration date, but it could be modified, suspended, or discontinued at any time at the discretion of our Board of Directors. Repurchases could be made from time to time in the open market, or through privately negotiated transactions or otherwise, in compliance with applicable laws, rules and regulations, and subject to our cash requirements for other purposes, compliance with the covenants under the loan agreement for our revolving credit facility and other factors we deem relevant. In fiscal 2024 second quarter, our Board of Directors approved an additional $5 million for the repurchase of our common shares, adding to the $20 million authorization it approved in fiscal 2023.
During fiscal 2024, we had used approximately $11.7 million of the authorization to purchase 620,634 of our common shares at an average price of $18.79 per share. The share repurchase program was completed during the fiscal 2024 third quarter.
Capital Expenditures
We expect to spend approximately $7between $3 million to $4 million in capital expenditures in fiscal 20222025 to maintain and enhance our operating systems and facilities. Of those amounts, we expect to spend approximately:
|
|
|
|
Enterprise Resource Planning
In earlyDuring calendar 2021, our Board of Directors approved an upgrade to our current ERP system and implementation efforts began shortly thereafter. We expect to implementThe ERP system went live at Sunset West in December 2022 and in the ERP upgrade in our legacy Hooker divisions by mid calendar 2022, within early September 2023. We expect it to go live in the Home Meridian and Shenandoah following afterwards.segment in fiscal 2026. To complete the ERP system implementation as anticipated, we will be required to expend significant financial and human resources. We anticipate spending approximately $5.5$4.0 million over the course of this project,in fiscal 2025, with a significant amount of time invested by our associates.
COVID-19 Cost Cutting and Cash Preservation MeasuresMaterial Capital Commitments
During the fiscal 2021 first quarter, we initiated certain measures to reduce operating expensesOur material capital commitments primarily consist of term loans and preserve cash which included temporary fee reductions for our Board of Directors, temporary salary reductions for officers and certain other managers, strategic staff reductions, the temporary closure of our domestic manufacturing plants and the furlough of manufacturing, warehouse and administrative associates. We also delayed all non-critical capital spending, rationalized our import purchase orders and accepted certain accommodations from our vendors to cut costs and extend payment terms where possible.lease payments.
While we continue to spend cautiously, business has improved steadily beginning in May 2020Contractual term-loan and we have seen greatly increased demand for our products. Consequently, duringinterest payments assuming identical effective interest rates as of the second quarterend of fiscal 2021, our domestic manufacturing plants reopened2024 are expected to be $2.8 million in fiscal 2025, $2.7 million in fiscal 2026, $2.6 million in fiscal 2027, and are currently operating at current capacity. During$19.3 million in fiscal 2028 including the fiscal 2021 third quarter, temporary salary and fee reductions were rescinded and aspayoff of early December 2020 furloughs of our associates have ended. We are in the process of re-building inventory to meet increased customer demand.$18 million Secured Term Loan.
CashWe lease office space, warehousing facilities, showroom space and cash equivalents stood at $65.8office equipment under leases expiring over the next five years. Future minimum annual commitments under leases and operating agreements are $9.5 million atin fiscal 2021 year-end, an increase of nearly $302025, $9.6 million compared to the balance of prior year end. We expect these cash balances to decrease as we build inventories to meet increased customer demand.in fiscal 2026, $9.4 million in fiscal 2027, $7.8 million in fiscal 2028 and $7.3 in fiscal 2029.
Dividends
We declared and paid dividends of $0.66$0.89 per share or approximately $7.8$9.7 million in fiscal 2021,2024, an increase of 8.2%8.5% or $0.05$0.07 per share compared to $0.61$0.82 per share in fiscal 2020.2023.
On March 1, 2021,4, 2024, our Board of Directors declared a quarterly cash dividend of $0.18$0.23 per share, payable on March 31, 202129, 2024 to shareholders of record at March 17, 2021.
18, 2024.
Our Board of Directors will continue to evaluate the appropriateness of the current dividend rate considering our performance and economic conditions in future quarters.
Commitments and Contractual Obligations
As of January 31, 2021, our commitments and contractual obligations were as follows:
Cash Payments Due by Period (In thousands) | ||||||||||||||||||||
Less than | More than | |||||||||||||||||||
1 Year | 1-3 Years | 3-5 Years | 5 years | Total | ||||||||||||||||
Deferred compensation payments (1) | $ | 1,033 | $ | 2,132 | $ | 2,192 | $ | 4,639 | $ | 9,996 | ||||||||||
Operating leases (2) | 7,394 | 11,254 | 10,615 | 9,809 | 39,072 | |||||||||||||||
Total contractual cash obligations | $ | 8,427 | $ | 13,386 | $ | 12,807 | $ | 14,448 | $ | 49,068 | ||||||||||
|
|
|
|
Off-Balance Sheet Arrangements
Standby letters of credit in the aggregate amount of $6.3 million, used to collateralize certain insurance arrangements and for imported product purchases, were outstanding under our revolving credit facility as of January 31, 2021. See the “Commitments and Contractual Obligations” table above and Note 18 to the consolidated financial statements included in this annual report on Form 10-K for additional information on our off-balance sheet arrangements.
Recently Issued Accounting Pronouncements
In August 2018,See the FASB issued ASU No. 2018-14, Compensation —Retirement Benefits —Defined Benefit Plans —General (Subtopic 715-20) —Disclosure Framework —ChangesAccounting Standards to the Disclosure Requirementsbe Adopted section of Note 1 to our Consolidated Financial Statements for Defined Benefit Plans (“ASU 2018-14”). The amendments in this update change the disclosure requirements for employers that sponsor defined benefit pension and/or other post-retirement benefit plans. It eliminates requirements for certain disclosures that are no longer considered cost beneficial and requires new disclosures that the FASB considers pertinent. The guidance is effective for fiscal years ending after December 15, 2020. Early adoption is permitted. We do not expect the adoptionfurther details of ASU 2018-14 will have a material impact on our consolidated financial statements or disclosures.recent accounting pronouncements.
In August 2018, the FASB issued ASU No. 2018-15, Intangibles – Goodwill and Other – Internal-Use Software (Subtopic 350-40). The amendments in this update align the accounting for implementation costs incurred in a hosting arrangement that does not include a license to internal-use software (i.e., a cloud computing arrangement) with one that does. It therefore requires companies to defer potentially significant implementation costs incurred in a cloud computing arrangement that were often expensed as incurred under legacy US GAAP and recognize them as expense over the term of the hosting arrangement. This guidance was effective for fiscal years and interim periods beginning after December 15, 2019. We plan to adopt this guidance in the fiscal 2022 first quarter. We do not expect the adoption of ASU 2018-15 will have a material impact on our consolidated financial statements and related disclosures.
COVID-19
As discussed under "Item 1A. Risk Factors," an outbreak of COVID-19 has been recognized as a global pandemic by the World Health Organization.
We monitor information on COVID-19 from the CDC and believe we are adhering to their recommendations regarding the health and safety of our personnel. To address the potential human impact of the virus, much of our administrative staff are telecommuting. For those administrative staff not telecommuting and our warehouse and domestic manufacturing employees, we have implemented appropriate social distancing policies and have stepped-up facility cleaning at each location. Non-essential domestic travel for our employees has ceased and international travel has been prohibited out-right. Testing, treatment and vaccinations for COVID-19 are covered 100% under our medical plan and counseling is available through our employee assistance plan to assist employees with financial, mental and emotional stress related to the virus and other issues. In addition, we are offering temporary paid leave to employees diagnosed with the virus (and those associates with another diagnosed person or persons in their household) and are working to accommodate associates with child-care issues related to school or day-care closures.
Outlook
We enter fiscal 2022 with confidenceHome furnishings industry demand is exceptionally soft and about two and a positive outlookhalf months into the new fiscal year, year-to-date consolidated orders are down in the mid-single digits as compared to the same prior-year period.
Economic indicators are mixed, but somewhat encouraging. Over the last six months, US Consumer confidence has shown no real trend to the upside or downside, despite encouraging signs including the easing of inflation from 2023 highs and likely interest rate cuts later in the year. We are also encouraged by recent strong existing home sales, growth in building permits and in single-family housing starts and completions, an encouraging jobs report, and the stock market’s strong performance. We are cautiously optimistic for our companylater this year and our industry. Demand is strong,beyond and are confident we’ve made the right strategic investments in sales channels, people, systems, and products and that we are experiencing significantly increased order rates so far in fiscal 2022 comparedpositioned to last year this time. Our operational priority is to maximize these high levels ofgrow when demand by servicing our backlogs, as we work to continue the momentum of the improved profitability achieved during the second half of fiscal 2021.returns.
We are currently experiencing two significant headwinds which we believelooking forward to be temporary. The first is the ongoing impact of COVID-19 on global manufacturing capacities, raw materials and the cost and availability of shipping containers. The second is a shortage of upholstery foam created by the recent power grid outage in Texas from severe weather. That power grid outage negatively impacted the oil industry, which produces the by-products used in the fabrication of foam. This has led to allocations of foam to our domestic upholstery segment. We expect the later issue to be a short to mid-term problem. The duration of the global logistics constraints is uncertain, but we believeSpring High Point Market that ports and freight lines are working to overcome these bottlenecksopens this week and expect to see improvements later this year.strong attendance as we offer an exciting assortment of new products across divisions.
Additionally, competition for consumers’ discretionary spending such as travel, dining outWe believe the investments and entertainmentimprovements we made in the past year will increase as COVID-19 vaccinations roll out; however,be a springboard to higher profitability, especially once demand improves. Going forward, we see sustainable positive market conditions for home furnishings, driven byintend to use the robust housing market, favorable demographicsstrength of our balance sheet and a brightvariable cost model to weather current economic outlook. We are confident in our team’s ability to execute our strategies to grow profitablyvolatility until consumer confidence improves and to adapt successfully to unexpected challenges.demand returns.
Critical Accounting Policies and Estimates
Our significant accounting policies are described in “Note 2 – Summary of Significant Accounting Policies” to the consolidated financial statements beginning at page F-11 in this report. The preparation of financial statements in conformity with U.S. generally accepted accounting principles requires us to make estimates and assumptions in certain circumstances that affect amounts reported in the accompanying financial statements and related notes. In preparing these financial statements, we have made our bestmethods, estimates and judgments we use in applying our most critical accounting policies have a significant impact on the results we report in our consolidated financial statements. Critical accounting estimates are those that involve a significant level of certain amounts included inestimation uncertainty and have had or are reasonably likely to have a material impact on our financial condition and results of operations. Specific areas requiring the application of management’s estimates and judgments include, among others, revenue recognition and inventory valuation. Accordingly, a different financial statements, giving due consideration to materiality. Wepresentation could result depending on the judgments, estimates or assumptions that are used. However, we do not believe that actual results will deviate materially from our estimates related to our accounting policies described below. However,below but because application of these accounting policies involves the exercise of judgment and the use of assumptions as to future uncertainties, actual results could differ materially from these estimates. Therefore, we consider an understanding of the variability and judgment required in making these estimates and assumptions to be critical in fully understanding and evaluating our reported financial results.
Revenue Recognition
Revenue Recognition. We recognize revenue pursuant to Accounting Standards Codification 606, which requires revenue to be recognized at an amount that reflects the consideration we expect to be entitled to receive in exchange for transferring goods or services to our customers. Our policy is to record revenue when control of the goods transfers to the customer. We have a present right to payment at the time of shipment as customers are invoiced at that time. We believe the customer obtains control of goods at the time of shipment, which is typically when title passes. While the customer may not enjoy immediate physical possession of the products, the customers’ right to re-direct shipment indicates control. In the very limited instances when products are sold under consignment arrangements, we do not recognize revenue until control over such products has transferred to the end consumer. Orders are generally non-cancellable once loaded into a shipping trailer or container.
The transaction price for each contract is the stated price of the product, reduced by any stated discounts or allowances at that point in time. We do not engage in sales of products that attach a future material right which could result in a separate performance obligation for the purchase of goods in the future at a material discount. The implicit contract with the customer, as reflected in the order acknowledgement and invoice, states the final terms of the sale, including the description, quantity, and price of each product purchased. The transaction price reflects the amount of estimated consideration to which we expect to be entitled. This amount of variable consideration included in the transaction price, and measurement of net sales, is included in net sales only to the extent that it is probable that there will be no significant reversal in a future period.
Net sales are comprised of gross revenues from sales of home furnishings and hospitality furniture products and are recorded net of allowances for trade promotions, estimated product returns, rebate advertising programs and other discounts. Physical product returns are very rare due to the high probability of damages to our products in return transit. Other revenues, primarily royalties, are immaterial to our overall results. Payment is typically due within 30-60 days of shipment for customers qualifying for payment terms. Collectability is reasonably assured since we extend credit to customers for whom we have performed credit evaluations and/or from whom we have received a down payment or deposit. Due to the highly-customized nature of our hospitality products, we typically require substantial prepayments on these orders, with the balance due within 30 days of delivery.
Leases. Our lease assets are composed of real estate and equipment. Real estate leases consist primarily of warehouses, showrooms and offices, while equipment leases consist of vehicles, office and warehouse equipment. At the inception of a contract, we assess whether the contract is, or contains, a lease. Our assessment is based on: (a) whether there is an identified asset in the contract that is land or a depreciable asset – i.e. property, plant or equipment; (b) whether we have the right to control the use of the identified asset throughout the period of use, which may be different from the overall contract term; and (c) whether we have the right to direct the use of an identified asset if it can direct (and change) how and for what purpose the asset will be used throughout the period of use.
Leases are classified as either finance leases or operating leases based on criteria in Topic 842. All of our leases are classified as operating leases. We do not currently have finance leases but could in the future.
Operating lease right-of-use ("ROU") assets and liabilities are recognized on the adoption date based on the present value of lease payments over the remaining lease term. As interest rates are not explicitly stated or implicit in any of our leases, we utilized our incremental borrowing rate at the adoption date of February 4, 2019, which was one-month LIBOR plus 1.5%. For leases without explicitly stated or implicit interest rates that commenced after the adoption date, we used our incremental borrowing rate which was one-month LIBOR at the lease commencement date plus 1.5%. ROU assets also include any lease payments made and exclude lease incentives. Lease terms may include options to extend or terminate the lease when it is reasonably certain that we will exercise that option.
At the inception of a lease, we allocate the consideration in the contract to each lease and non-lease component based on the component's relative stand-alone price to determine the lease payments. Lease and non-lease components are accounted for separately. Lease expense for operating leases is recognized on a straight-line basis over the lease term. Included in lease expense are any variable lease payments incurred in the period that were not included in the initial lease liability. Some of our real estate leases contain variable lease payments, including payments based on the percentage increase in the Consumer Price Index for Urban Consumers (“CPI-U”). We used February 2019 CPI-U issued by the US Department of Labor’s Bureau of Labor Statistics to measure lease payments and calculate lease liabilities upon adoption of this standard. Additional payments based on the change in an index or rate, or payments based on a change in our portion of the operating expenses, including real estate taxes and insurance, are recorded when incurred.
We have a sub-lease at one of our warehouses. In accordance with the provisions of Topic 842, since we have not been relieved as the primary obligor of the warehouse lease, we cannot net the sublease income against our lease payment to calculate the lease liability and ROU asset. Our practice has been, and we will continue to, straight-line the sub-lease income over the term of the sublease.
Our leases have remaining lease terms of less than one year to seven years, some of which include options to extend the leases for up to seven years. We have elected not to recognize ROU assets and lease liabilities that arise from short term leases for any class of underlying asset. Short term leases are leases with lease terms of 12 months or less with either (a) no renewal option or (b) a renewal option which we are not reasonably certain to exercise.
InventoriesInventory
Inventories, consisting of finished furniture for sale, raw materials, manufacturing supplies and furniture in process, are stated at the lower of cost, or market value, with cost determined using the last-in, first-out (LIFO) method. Under this method, inventory is valued at cost, which is determined by applying a cumulative index to current year inventory dollars.
We review inventories on hand and record an allowance for slow-moving and obsolete inventory based on historical experience, and expected sales.
Impairment of Long-Lived Assets
Tangible and Definite Lived Intangible Assets
We regularly review our property, plant and equipment and definite lived intangible assets for indicators of impairment, as specified in the Accounting Standards Codification. Although not exhaustive, this accounting guidance lists potential indicators of impairment, which we use to facilitate our review. These potential indicators of impairment include:
|
|
|
|
|
|
|
|
|
|
|
|
When an indicator of impairment is present, the impairment test for our property, plant and equipment requires us to assess the recoverability of the value of the assets by comparing their net carrying value to the sum of undiscounted estimated future cash flows directly associated with and arising from use and eventual disposition of the assets. We principally use our internal forecasts to estimate the undiscounted future cash flows used in our impairment analyses. These forecasts are subjective and are largely based on management’s judgment, primarily due to the changing industry in which we compete, changing consumer tastes,current sales trends and demographicsmarket conditions, expected sales and the current economic environment. We monitor changes in these factors as part of the quarter-end review of these assets. While our forecasts have been reasonably accurate in the past, during periods of economic instability, uncertainty, or rapid change within our industry, we may not be able to accurately forecast future cash flows from our long-lived assets and our future cash flows may be diminished. Therefore, our estimates and assumptions related to the viability of our long-lived assets may change and are reasonably likely to change in future periods. These changes could adversely affect our consolidated statements of operations and consolidated balance sheets.
other factors. When we concludeidentify inventory that anyis unlikely to be sold or that has a cost basis in excess of these assets are impaired,its net realizable value, we record a write-down to reduce the asset is written downcarrying amount of inventory to its fairestimated net realizable value. Any impaired assets that we expect to dispose of by sale are measured at the lower of their carrying amount or fair value, less estimated cost to sell; are no longer depreciated; and are reported separately as “assets held for sale” in the consolidated balance sheets, if we expect to dispose of the assets in one year or less.
Intangible Assets and Goodwill
We own both definite-lived (amortizable) assets and indefinite-lived intangible assets. Our amortizable intangible assets are related to the Home Meridian and Shenandoah acquisitions and include customer relationships, backlog and trademarks. Our indefinite lived assets include goodwill, trademarks and tradenames related to the Home Meridian and Shenandoah acquisitions, as well as the Bradington-Young and Sam Moore tradenames. We may acquire additional amortizable assets and/or indefinite lived intangible assets in the future. Our indefinite-lived intangible assets are not amortized but are tested for impairment annually or more frequently if events or circumstances indicate that the asset might be impaired.
The adverse economic effects brought on by the COVID-19 pandemic, including reductions in our sales, earnings and market value, as well as other changing market dynamics, required that we perform a valuation of our intangible assets during the interim period. The calculation methodology for the fair value of our Home Meridian segment and the Shenandoah division of our Domestic Upholstery segment included three approaches: the Discounted Cash Flow Method (DCF) which was given the largest weighting, the Guideline Public Company Method (GPCM) based on the consideration of the facts of the Company’s peer competitors and the Guideline Transaction Method (GTM) based on consideration of transactions with varying risk profiles, geographies and market conditions. The income approach, specifically the relief from royalty method, was used as the valuation methodology for our trade names and trademarks, based on cash flow projections and growth rates for each trade name for five years in the future, and a royalty rate benchmark for companies with similar activities. As a result of our intangible asset valuation analysis, in the first quarter of fiscal 2021, we recorded $44.3 million non-cash impairment charges including $23.2 million to Home Meridian goodwill, $16.4 million to Shenandoah goodwill and $4.8 million to certain of Home Meridian segment’s trade names.
Our goodwill, trademarks and trade namesother significant accounting policies are tested for impairment annually asdescribed in Note 1 – Summary of the first day ofSignificant Accounting Policies to our fourth quarter or more frequently if events or changesConsolidated Financial Statements beginning at page F-11 in circumstances indicate that the asset might be impaired. Circumstances that could indicate a potential impairment include, but are not limited to:
|
|
|
|
|
|
|
|
The fair value of our trademarks and tradenames is determined based on the estimated earnings and cash flow capacity of those assets. The impairment test consists of a comparison of the fair value of the indefinite-lived intangible assets with their carrying amount. If the carrying amount of the indefinite-lived intangible assets exceeds their fair value, an impairment loss is recognized in an amount equal to that excess. At January 31, 2021, based on our internal valuation, the fair values of our Bradington-Young, Home Meridian, Sam Moore and Shenandoah non-amortizable trademarks and trade names exceeded their carrying values.
Upon the adoption of ASU 2017-04, we perform our annual goodwill impairment test by comparing the fair value of a reporting unit with its carrying amount. Management judgment is a significant factor in the goodwill impairment evaluation process. The computations require management to make estimates and assumptions, the most critical of which are potential future cash flows and the appropriate discount rate. Based on our internal goodwill impairment analysis as described above, we have concluded that Shenandoah goodwill in the Domestic Upholstery segment is not impaired as of January 31, 2021.
The assumptions used to determine the fair value of our intangible assets are highly subjective and judgmental and include long-term growth rates, sales volumes, projected revenues, assumed royalty rates and factors used to develop an applied discount rate. If the assumptions that we use in these calculations differ from actual results, we may realize impairment on our intangible assets that may have a material-adverse effect on our results of operations and financial condition.
Income Taxes
At times, tax law and generally accepted accounting principles differ in the treatment of certain income and expense items. These items may be excluded or included in taxable income at different times than is required for GAAP or “book” reporting purposes. These differences may be permanent or temporary in nature.
We determine our annual effective income tax rate based on pre-tax book income and permanent book and tax differences.
To the extent any book and tax differences are temporary in nature, that is, the book realization will occur in a different period than the tax realization, a deferred tax asset or liability is established. To the extent a deferred tax asset is created, we evaluate our ability to realize this asset. If we determine that we will not be able to fully utilize deferred tax assets, we establish a valuation reserve. In assessing the realization of deferred tax assets, we consider whether it is more likely than not that some portion or all of the deferred tax assets will be realized. The ultimate realization of deferred tax assets is primarily dependent upon the generation of future taxable income during the periods in which those temporary differences reverse. Currently, we have $14.2 million deferred tax assets that can be used to offset taxable income and reduce our income tax liabilities in the future periods. All deferred tax assets and liabilities are classified as non-current on our consolidated balance sheets. See Note 16 Income Taxes for additional details.report.
Concentrations of Sourcing Risk
In fiscal 2021,2024, imported products sourced from Vietnam and China accounted for nearly all88% of our import purchases and our top five suppliers in Vietnam and China accountaccounted for approximately half60% of our fiscal 20212024 import purchases. A disruption in our supply chain, or from Vietnam or China in general, could significantly impact our ability to fill customer orders for products manufactured in those countries. If such a disruptionOur supply chain could be adversely impacted by the uncertainties of health concerns and governmental restrictions. In some cases, we were able to occur, we believe that we would have sufficientprovide substitutions using inventory on hand, in-transit and in transit to our U.S. warehouses in Virginia, North Carolina and California to adequately meet demand for several months or slightly longer with an additional month’s worth of demand available for immediate shipment from our domestic warehouses, in Asia. We believe that we could, most likely at higher cost, source most ofbut not enough to entirely mitigate the products currently sourced in Vietnam or China from factories in other countries and could produce certain upholstered products domestically at our own factories. However, supplylost sales. Supply disruptions and delays on selected items could occur for up to six months or longer before the impact of remedial measures would be reflected in our results. If we were to beare unsuccessful in obtaining those products from other sources or at comparable cost, a disruption in our supply chain from our largest import furniture suppliers, or from Vietnam or China in general, could adversely affect our sales, earnings, financial condition and liquidity.
ITEM 7A. QUANTITATIVE AND QUALITATIVE DISCLOSURES ABOUT MARKET RISK
We are exposed to various types of market risk in the normal course of our business, including the impact of interest rate changes, raw materials price risk and changes in foreign currency exchange rates, which could impact our results of operations or financial condition. We manage our exposure to this risk through our normal operating activities.
Interest Rate Risk
Borrowings under the revolving credit facility bearsExisting Revolver, the Secured Term Loan and the Unsecured Term loan bear interest based on LIBORBSBY plus 1.0%.1.00%, BSBY plus 0.90% and BSBY plus 1.40%, respectively. As such, thisthese debt instrument exposesinstruments expose us to market risk for changes in interest rates. There was no outstanding balance under our revolving credit facilitythe Existing Revolver as of January 31, 2021,28, 2024 other than amounts reserved for standby letters of credit in the amount of $6.3$6.7 million. As of January 28, 2024, $22.9 million was outstanding under our term loans. At current borrowing levels, a 1% increase in the BSBY rate would result in an annual increase in interest expenses on our terms loans of approximately $223,000.
Raw Materials Price Risk
We are exposed to market risk from changes in the cost of raw materials used in our domestic upholstery manufacturing processes; principally, wood, fabric and foam products. Increases in home construction activity could result in increases in wood and fabric costs. Additionally, the cost of petroleum-based foam products we utilize are sensitive to crude oil prices, which vary due to supply, demand and geo-political factors.
Currency Risk
For imported products, we generally negotiate firm pricing denominated in U.S. Dollars with our foreign suppliers, typically for periods of at least one year. We accept the exposure to exchange rate movements beyond these negotiated periods. We do not use derivative financial instruments to manage this risk but could choose to do so in the future. Most of our imports are purchased from suppliers located in Vietnam and China. The Chinese currency floats within a limited range in relation to the U.S. Dollar, resulting in exposure to foreign currency exchange rate fluctuations.Vietnam.
Since we transact our imported product purchases in U.S. Dollars, a relative decline in the value of the U.S. Dollar could increase the price we pay for imported products beyond the negotiated periods. We generally expect to reflect substantially all of the effect of any price increases from suppliers in the prices we charge for imported products. However, these changes could adversely impact sales volume or profit margins during affected periods.
ITEM 8.FINANCIAL STATEMENTS AND SUPPLEMENTARY DATA
Our consolidated financial statements listed in Item 15(a), and which begin on page F-6, of this report are incorporated herein by reference and are filed as a part of this report.
ITEM 9. CHANGES IN AND DISAGREEMENTS WITH ACCOUNTANTS ON ACCOUNTING AND FINANCIAL DISCLOSURE
None.
ITEM 9A. CONTROLS AND PROCEDURES
Evaluation of Disclosure Controls and Procedures
Our management, with the participation of our principal executive officer and principal financial officer, evaluated the effectiveness of our disclosure controls and procedures as of the end of the fiscal quarter ended January 31, 2021.28, 2024. Based on this evaluation, our principal executive officer and our principal financial officer concluded that our disclosure controls and procedures were effective as of January 31, 2021,28, 2024, the end of the period covered by this annual report, to provide reasonable assurance that information required to be disclosed in the reports that we file or submit under the Securities Exchange Act of 1934, as amended, is accumulated and communicated to the Company’s management, including our principal executive officer and principal financial officer, as appropriate to allow timely decisions regarding required disclosure and are effective to provide reasonable assurance that such information is recorded, processed, summarized and reported within the time periods specified in the Securities and Exchange Commission’s rules and forms.
Management’s Report on Internal Control over Financial Reporting
In accordance with Section 404 of the Sarbanes-Oxley Act and SEC rules thereunder, management has conducted an assessment of our internal control over financial reporting as of January 31, 2021,28, 2024, based on the framework in Internal Control-Integrated Framework (2013) issued by the Committee of Sponsoring Organizations of the Treadway Commission. Management’s report regarding that assessment is included on page F-2 of this report, with our consolidated financial statements, and is incorporated herein by reference.
Report of Registered Public Accounting Firm
Our independent registered public accounting firm, KPMG LLP, audited the consolidated financial statements included in this annual report on Form 10-K and has issued an audit report on the effectiveness of our internal control over financial reporting. KPMG’s report is included on page F-3 and F-4 of this report, with our consolidated financial statements, and is incorporated herein by reference.
Changes in Internal Control over Financial Reporting
We have integrated Sunset West into our overall internal control structure over financial reporting processes.
As previously disclosed, during the third quarter of fiscal 2024, we implemented a new Enterprise Resource Planning system at the legacy Hooker divisions and for consolidated reporting. This new system resulted in changes to certain of our processes and procedures for internal control over financial reporting. We assessed the control design during implementation and conducted post-implementation monitoring and testing to ensure the effectiveness of internal controls over financial reporting.
There have beenwere no other changes in ourthe Company’s internal control over financial reporting that occurred during the Company’s most recent fiscal quarter ended January 31, 2021, that havehas materially affected, or are reasonably likely to materially affect, ourthe Company’s internal control over financial reporting.
ITEM 9B. OTHER INFORMATION
None.During the fourth quarter of fiscal 2024, no director or officer of the Company adopted, terminated or modified a ‘Rule 10b5-1 trading arrangement’ or ‘non-Rule 10b5-1 trading arrangement,’ as each term is defined in Item 408(a) of Regulation S-K.
ITEM 9C. DISCLOSURE REGARDING FOREIGN JURISDICTIONS THAT PREVENT INSPECTIONS
Not Applicable.
Hooker FurnitureFurnishings Corporation
Part III
In accordance with General Instruction G (3) of Form 10-K, most of the information called for by Items 10, 11, 12, 13 and 14 of Part III will be incorporated by reference to the Company’s definitive Proxy Statement for its Annual Meeting of Shareholders scheduled to be held June 3, 20214, 2024 (the “2021“2024 Proxy Statement”), as set forth below.
ITEM 10. DIRECTORS, EXECUTIVE OFFICERS AND CORPORATE GOVERNANCE
Information relating to our directors will be set forth under the caption “Proposal One-Election of Directors” in the 20212024 Proxy Statement and is incorporated herein by reference.
Information relating to our executive officers is included in Part I of this report under the caption “Information about our Executive Officers” and is incorporated herein by reference.
Information relating to compliance with Section 16(a) of the Exchange Act will be set forth under the caption “Delinquent Section 16(a) Reports” in the 20212024 Proxy Statement and is incorporated herein by reference.
Information relating to the code of ethics that applies to our principal executive officer, principal financial officer, principal accounting officer or controller, or persons performing similar functions will be set forth under the caption “Code of Business Conduct and Ethics” in the 20212024 Proxy Statement and is incorporated herein by reference.
Information relating to material changes, if any, in the procedures by which shareholders may recommend nominees for our Board of Directors will be set forth under the caption “Procedures for Shareholder Recommendations of Director Nominees” in the 20212024 Proxy Statement and is incorporated herein by reference.
Information relating to the Audit Committee of our Board of Directors, including the composition of the Audit Committee and the Board’s determinations concerning whether certain members of the Audit Committee are “financial experts” as that term is defined under Item 407(d)(5) of Regulation S-K will be set forth under the captions “Corporate Governance” and “Audit Committee” in the 20212024 Proxy Statement and is incorporated herein by reference.
ITEM 11. EXECUTIVE COMPENSATION
Information relating to this item will be set forth under the captions “Report of the Compensation Committee,” “Executive Compensation” and “Director Compensation” in the 20212024 Proxy Statement and is incorporated herein by reference.
ITEM 12. SECURITY OWNERSHIP OF CERTAIN BENEFICIAL OWNERS AND MANAGEMENT AND RELATED SHAREHOLDER MATTERS
Information relating to this item will be set forth under the captions “Equity Compensation Plan Information” and “Security Ownership of Certain Beneficial Owners and Management” in the 20212024 Proxy Statement and is incorporated herein by reference.
ITEM 13. CERTAIN RELATIONSHIPS AND RELATED TRANSACTIONS, AND DIRECTOR INDEPENDENCE
Information relating to this item will be set forth in the last two paragraphs under the caption “Audit Committee” and the caption “Corporate Governance” in the 20212024 Proxy Statement and is incorporated herein by reference.
ITEM 14. PRINCIPAL ACCOUNTING FEES AND SERVICES
Information relating to this item will be set forth under the caption “Proposal Three-Three - Ratification of Selection of Independent Registered Public Accounting Firm” in the 20212024 Proxy Statement and is incorporated herein by reference.
Hooker FurnitureFurnishings Corporation
Part IV
ITEM 15. EXHIBITS AND FINANCIAL STATEMENT SCHEDULES
(a) Documents filed as part of this report on Form 10-K:
(1) The following reports and financial statements are included in this report on Form 10-K:
Management’s Report on Internal Control Over Financial Reporting
Reports of Independent Registered Public Accounting Firm
Consolidated Balance Sheets as of January 28, 2024 and January 29, 2023
Consolidated Statements of Operations for the fifty-two-week periods ended January 28, 2024, January 29, 2023, and January 30, 2022
Consolidated Statements of Comprehensive Income/(Loss) for the fifty-two-week periods ended January 28, 2024, January 29, 2023, and January 30, 2022
Consolidated Statements of Cash Flows for the fifty-two-week periods ended January 28, 2024, January 29, 2023, and January 30, 2022
Consolidated Statements of Shareholders’ Equity for the fifty-two-week periods ended January 28, 2024, January 29, 2023, and January 30, 2022
Notes to Consolidated Financial Statements
(2) Financial Statement Schedules:
Financial Statement Schedules have been omitted because the information required has been separately disclosed in the consolidated financial statements or related notes.
(b) Exhibits:
|
| |
|
| |
| ||
| ||
| ||
| ||
| ||
| ||
| ||
| ||
|
| |
| ||
|
| |
3.1 | ||
3.2 | ||
4.1 | Amended and Restated Articles of Incorporation of the Company (See Exhibit 3.1) | |
4.2 | Amended and Restated Bylaws of the Company (See Exhibit 3.2) | |
4.3 | ||
Pursuant to Regulation S-K, Item 601(b)(4)(iii), instruments, if any, evidencing long-term debt not exceeding 10% of the Company’s total assets have been omitted and will be furnished to the Securities and Exchange Commission upon request. | ||
10.1(a) |
10.1(b) | ||
10.1(c) | ||
10.1(d) | ||
10.1(e) | ||
10.1(f) | ||
10.1(i) | ||
| ||
| ||
| ||
| ||
10.1(k) | ||
10.1(l) | ||
10.1(m) | ||
10.1(n) | ||
10.2(a) | ||
10.2(b) | ||
10.2(c) | ||
10.2(d) |
10.2(e) | ||
10.2(f) | ||
10.3 | ||
21 | List of Subsidiaries: | |
Bradington-Young LLC, a North Carolina limited liability company | ||
Home Meridian Group, LLC, a Virginia limited liability company | ||
Sam Moore Furniture LLC, a Virginia limited liability company | ||
23 | Consent of Independent Registered Public Accounting Firm (filed herewith) | |
31.1 | Rule 13a-14(a) Certification of the Company’s principal executive officer (filed herewith) | |
31.2 | Rule 13a-14(a) Certification of the Company’s principal financial officer (filed herewith) | |
32.1 | ||
97 | ||
101 | The following financial statements from the Company's Annual Report on Form 10-K for the fiscal year ended January | |
104 | Cover page Interactive Data File (formatted in Inline XBRL and contained in Exhibit 101) |
*Management contract or compensatory plan
ITEM 16. FORM 10-K SUMMARY
None.
SIGNATURES
Pursuant to the requirements of Section 13 or 15(d) of the Securities Exchange Act of 1934, the registrant has duly caused this report to be signed on its behalf by the undersigned, thereunto duly authorized.
| HOOKER FURNISHINGS CORPORATION |
| |||
April | By: | /s/ Jeremy R. Hoff | ||
Jeremy R. Hoff | ||||
Chief Executive Officer and Director (Principal Executive Officer) | ||||
Pursuant to the requirements of the Securities Exchange Act of 1934, this report has been signed below by the following persons on behalf of the registrant and in the capacities and on the dates indicated.
Signature | Title | Date | ||
/s/ Jeremy R. Hoff | Chief Executive Officer and | April | ||
Jeremy R. Hoff | Director (Principal Executive Officer) | |||
/s/ Paul A. Huckfeldt | Senior Vice President - Finance and Accounting | April | ||
Paul A. Huckfeldt | and Chief Financial Officer (Principal | |||
Financial and Accounting Officer) | ||||
/s/ W. Christopher Beeler, | Director (Board Chair) | April | ||
W. Christopher Beeler, Jr. | ||||
/s/ Maria C. Duey | Director | April | ||
Maria C. Duey | ||||
/s/ Paulette Garafalo | Director | April | ||
Paulette Garafalo | ||||
| ||||
/s/ Christopher L. Henson | Director | April 12, 2024 | ||
Christopher L. Henson | ||||
/s/ Tonya H. Jackson | Director | April | ||
Tonya H. Jackson | ||||
|
|
| ||
| ||||
/s/ Ellen C. Taaffe | Director | April | ||
Ellen C. Taaffe | ||||
|
|
| ||
| ||||
|
|
|
| |
|
HOOKER FURNITUREFURNISHINGS CORPORATION AND SUBSIDIARIES
INDEX TO CONSOLIDATED FINANCIAL STATEMENTS
MANAGEMENT’S REPORT ON INTERNAL CONTROL OVER FINANCIAL REPORTING
To the Shareholders of
Hooker FurnitureFurnishings Corporation
Martinsville, Virginia
Management is responsible for establishing and maintaining adequate internal control over financial reporting, as defined in Securities Exchange Act Rule 13a-15(f). Under the supervision and with the participation of management, including the principal executive officer and principal financial officer, the Company conducted an evaluation of the effectiveness of its internal control over financial reporting based on the framework in Internal Control—Integrated Framework(2013) issued by the Committee of Sponsoring Organizations of the Treadway Commission (COSO). Based on the Company’s evaluation under that framework, management concluded that the Company’s internal control over financial reporting was effective as of January 31, 2021.
28, 2024.
The effectiveness of the Company’s internal control over financial reporting as of January 31, 202128, 2024 has been audited by KPMG LLP, the Company’s independent registered public accounting firm, as stated in their report which is included herein.


Jeremy R. Hoff
Chief Executive Officer and Director
(Principal Executive Officer)
April 16, 202112, 2024


Paul A. Huckfeldt
Senior Vice President – Finance and Accounting
and Chief Financial Officer
(Principal Financial and Accounting Officer)
April 16, 202112, 2024
Report of Independent Registered Public Accounting Firm
To the Shareholders and Board of Directors
Hooker FurnitureFurnishings Corporation:
Opinion on the ConsolidatedFinancial Statements
We have audited the accompanying consolidated balance sheets of Hooker FurnitureFurnishings Corporation and subsidiaries (the Company) as of January 31, 202128, 2024 and February 2, 2020,January 29, 2023, the related consolidated statements of operations, comprehensive income/(loss), cash flows, and shareholders’ equity and cash flows for each of the years in the three‑yearthree-year period ended January 31, 2021,28, 2024, and the related notes collectively,(collectively, the consolidated financial statements.statements). In our opinion, the consolidated financial statements present fairly, in all material respects, the financial position of the Company as of January 31, 202128, 2024 and February 2, 2020,January 29, 2023, and the results of its operations and its cash flows for each of the years in the three‑yearthree-year period ended January 31, 2021,28, 2024, in conformity with U.S. generally accepted accounting principles.
We also have audited, in accordance with the standards of the Public Company Accounting Oversight Board (United States) (PCAOB), the Company’s internal control over financial reporting as of January 31, 2021,28, 2024, based on criteria established in Internal Control – Integrated Framework (2013) issued by the Committee of Sponsoring Organizations of the Treadway Commission, and our report dated April 16, 202112, 2024 expressed an unqualified opinion on the effectiveness of the Company’s internal control over financial reporting.
Basis for Opinion
These consolidated financial statements are the responsibility of the Company’s management. Our responsibility is to express an opinion on these consolidated financial statements based on our audits. We are a public accounting firm registered with the PCAOB and are required to be independent with respect to the Company in accordance with the U.S. federal securities laws and the applicable rules and regulations of the Securities and Exchange Commission and the PCAOB.
We conducted our audits in accordance with the standards of the PCAOB. Those standards require that we plan and perform the audit to obtain reasonable assurance about whether the consolidated financial statements are free of material misstatement, whether due to error or fraud. Our audits included performing procedures to assess the risks of material misstatement of the consolidated financial statements, whether due to error or fraud, and performing procedures that respond to those risks. Such procedures included examining, on a test basis, evidence regarding the amounts and disclosures in the consolidated financial statements. Our audits also included evaluating the accounting principles used and significant estimates made by management, as well as evaluating the overall presentation of the consolidated financial statements. We believe that our audits provide a reasonable basis for our opinion.
Critical Audit MattersMatter
The critical audit mattersmatter communicated below are mattersis a matter arising from the current period audit of the consolidated financial statements that werewas communicated or required to be communicated to the audit committee and that: (1) relaterelates to accounts or disclosures that are material to the consolidated financial statements and (2) involved our especially challenging, subjective, or complex judgments. The communication of a critical audit mattersmatter does not alter in any way our opinion on the consolidated financial statements, taken as a whole, and we are not, by communicating the critical audit mattersmatter below, providing a separate opinionsopinion on the critical audit mattersmatter or on the accounts or disclosures to which they relate.it relates.
A. Goodwill Impairment AssessmentSufficiency of audit evidence over the implementation of a cloud-based enterprise resource planning system
As discussed in Note 9 to the consolidated financial statements, the goodwill balance asCompany completed the implementation of January 31, 2021 was $0.5 million related toa cloud-based Enterprise Resource Planning system for the Shenandoahlegacy Hooker divisions and consolidated reporting unit. During the first quarter ended May 3, 2020, the Company recorded(the ERP implementation) during 2023. The ERP implementation impacted a goodwill impairment chargehigh volume of $23.2 milliontransactions, all financial statement account balances, and $16.4 million related to the Home Meridian and Shenandoah reporting units, respectively. As discussed in Note 2, the Company performs goodwill impairment testing on an annual basis or more frequently if events or changes in circumstances indicate that the asset might be impaired. As of May 3, 2020, management determined it was likely that the carrying values of the Home Meridian and Shenandoah reporting units exceeded their respective fair values and performed a goodwill impairment test. To estimate the fair value of its reporting units, the Company used an income and market approach, specifically the discounted cash flow method, guideline public company method, and guideline transaction method.certain disclosures.
We identified the evaluation of goodwill for impairment for the Home Meridian and Shenandoah reporting unitssufficiency of audit evidence over the ERP implementation as a critical audit matter. Subjective and challengingA high degree of complex auditor judgment wasand the involvement of information technology (IT) professionals with specialized skills and knowledge were required to evaluate the selectionprogram development, configurations, interfaces and access rights of forecasted revenue growth rates and discount rates used to estimate the fair value of the reporting units as they represent subjective determinations of future market and economic conditions. Additionally, the audit effort associated with the evaluation of goodwill for impairment for the Home Meridian and Shenandoah reporting units required specialized skills and knowledge.certain IT applications.
The following are the primary procedures we performed to address this critical audit matter. We evaluatedapplied auditor judgment to determine the designnature and tested the operating effectivenessextent of certain internal controlsprocedures to be performed over the Company’s goodwill impairment evaluation process. This included controls related to the development of the forecasted revenue growth rates and discount rate assumptions.ERP implementation. We performed sensitivity analyses over the forecasted revenue growth rates and discount rate assumptions to assess their impact on the Company’s determination of fair value for the Home Meridian and Shenandoah reporting units. We evaluated the Company’s ability to forecast revenue growth rates for the reporting units by comparing the forecasted revenue growth assumptions to historical growth rates, considering future market and economic conditions. In addition, we involved valuationIT professionals with specialized skills and knowledge, who assisted in:
• evaluating the discount rates used in the determination of fair value, by comparing them against a discount rate range that was independently developed using publicly available market data for comparable entities
• testing the estimate of the reporting units’ fair value using the Company’s cash flow forecast for the reporting units, and discount rates, and comparing the results to the Company’s determination of fair value.
B. Impairment of non-amortizable intangible assets in the Home Meridian segment
As discussed in Note 9 to the consolidated financial statements, the non-amortizable intangible asset balance as of February 2, 2020 was $8.4 million, of which $6.7 million related to the Home Meridian reportable segment. During the first quarter ended May 3, 2020, the Company recorded an intangible asset impairment charge of $4.8 million related to the Home Meridian trade names. The Company performs impairment testing on an annual basis or more frequently if events or changes in circumstances indicate that the asset might be impaired. As of May 3, 2020, management determined it was likely that the carrying value of each trade name exceeded its fair value and performed a trade name impairment test. To value the non-amortizing intangible assets, the Company used the income approach, specifically the relief-from-royalty method.
| ● | obtaining an understanding of the relevant IT systems | |
| ● | evaluating the design and testing the operating effectiveness of general IT controls, including controls related to program development | |
| ● | evaluating the design and testing the operating effectiveness of certain IT application controls, including inspecting and evaluating configurations, interfaces, and access rights of certain IT applications. |
We identifiedevaluated the evaluationsufficiency of audit evidence obtained by assessing the results of procedures performed, including the appropriateness of the impairment of non-amortizable intangible assets in the Home Meridian segment as a critical audit matter. Subjectivenature and challenging auditor judgment was required to evaluate the selection of forecasted revenue growth rates, assumed royalty rates, and discount rates, used to estimate the fair valueextent of the non-amortizable intangible assets in the Home Meridian segment as they represent subjective determinations of future market and economic conditions. Additionally, the audit effort associated with the evaluation of the trade names for impairment required specialized skills and knowledge.
The following are the primary procedures we performed to address this critical audit matter. We evaluated the design and tested the operating effectiveness of certain internal controls over the Company’s non-amortizable intangible asset impairment assessment process. This included controls related to the development of the forecasted revenue growth rates, assumed royalty rate, and discount rate assumptions. We performed sensitivity analyses over the revenue growth rates and discount rate assumptions to assess their impact on the Company’s determination of fair value for the non-amortizable intangible assets in the Home Meridian segment. We evaluated the reasonableness of management’s forecasted revenue growth rates by comparing the forecasts to historical revenue growth rates, current industry conditions and growth plans. We compared the Company’s historical revenue forecasts to actual results to assess the Company’s ability to accurately forecast. In addition, we involved valuation professionals with specialized skills and knowledge, who assisted in:
• evaluating the Company’s assumed royalty rates by comparing the selected royalty rates to independently sourced royalty rates for trademarks within the furniture industry and performing a profit split analysis and assessing the resulting royalty rates
• evaluating the discount rates used in the valuation, by comparing them against a discount rate range that was independently developed using publicly available market data for comparable entities
• testing the estimate of the trade names’ fair values using the Company’s estimated cash flow forecast for the trade names, assumed royalty rates, and discount rates and comparing the results to the Company’s fair value estimates.
effort.
/s/ KPMG LLP
We have served as the Company’s auditor since 2003.
Raleigh, North Carolina
April 16, 202112, 2024
Report of Independent Registered Public Accounting Firm
To the Shareholders and Board of Directors
Hooker FurnitureFurnishings Corporation:
Opinion on Internal Control Over Financial Reporting
We have audited Hooker FurnitureFurnishings Corporation and subsidiaries’subsidiaries' (the Company) internal control over financial reporting as of January 31, 2021,28, 2024, based on criteria established inInternal Control – Integrated Framework (2013) issued by the Committee of Sponsoring Organizations of the Treadway Commission. In our opinion, the Company maintained, in all material respects, effective internal control over financial reporting as of January 31, 2021,28, 2024, based on criteria established in Internal Control – Integrated Framework (2013) issued by the Committee of Sponsoring Organizations of the Treadway Commission.
We also have audited, in accordance with the standards of the Public Company Accounting Oversight Board (United States) (PCAOB), the consolidated balance sheets of the Company as of January 31, 202128, 2024 and February 2, 2020,January 29, 2023, the related consolidated statements of operations, comprehensive income/(loss), cash flows, and shareholders’ equity and cash flows for each of the years in the three-year period ended January 31, 2021,28, 2024, and the related notes (collectively, the consolidated financial statements), and our report dated April 16, 202112, 2024 expressed an unqualified opinion on those consolidated financial statements.
Basis for Opinion
The Company’s management is responsible for maintaining effective internal control over financial reporting and for its assessment of the effectiveness of internal control over financial reporting, included in the accompanying Management’sManagement's Report on Internal Control Overover Financial Reporting. Our responsibility is to express an opinion on the Company’s internal control over financial reporting based on our audit. We are a public accounting firm registered with the PCAOB and are required to be independent with respect to the Company in accordance with the U.S. federal securities laws and the applicable rules and regulations of the Securities and Exchange Commission and the PCAOB.
We conducted our audit in accordance with the standards of the PCAOB. Those standards require that we plan and perform the audit to obtain reasonable assurance about whether effective internal control over financial reporting was maintained in all material respects. Our audit of internal control over financial reporting included obtaining an understanding of internal control over financial reporting, assessing the risk that a material weakness exists, and testing and evaluating the design and operating effectiveness of internal control based on the assessed risk. Our audit also included performing such other procedures as we considered necessary in the circumstances. We believe that our audit provides a reasonable basis for our opinion.
Definition and Limitations of Internal Control Over Financial Reporting
A company’s internal control over financial reporting is a process designed to provide reasonable assurance regarding the reliability of financial reporting and the preparation of financial statements for external purposes in accordance with generally accepted accounting principles. A company’s internal control over financial reporting includes those policies and procedures that (1) pertain to the maintenance of records that, in reasonable detail, accurately and fairly reflect the transactions and dispositions of the assets of the company; (2) provide reasonable assurance that transactions are recorded as necessary to permit preparation of financial statements in accordance with generally accepted accounting principles, and that receipts and expenditures of the company are being made only in accordance with authorizations of management and directors of the company; and (3) provide reasonable assurance regarding prevention or timely detection of unauthorized acquisition, use, or disposition of the company’s assets that could have a material effect on the financial statements.
Because of its inherent limitations, internal control over financial reporting may not prevent or detect misstatements. Also, projections of any evaluation of effectiveness to future periods are subject to the risk that controls may become inadequate because of changes in conditions, or that the degree of compliance with the policies or procedures may deteriorate.
/s/ KPMG LLP
Raleigh, North Carolina
April 16, 202112, 2024
HOOKER FURNITURE CORPORATION AND SUBSIDIARIES
CONSOLIDATED BALANCE SHEETS
HOOKER FURNISHINGS CORPORATION AND SUBSIDIARIES |
CONSOLIDATED BALANCE SHEETS |
(In thousands) |
As of | January 31, | February 2, | January 28, | January 29, | ||||||||||||
2021 | 2020 | 2024 | 2023 | |||||||||||||
Assets | ||||||||||||||||
Current assets | ||||||||||||||||
Cash and cash equivalents | $ | 65,841 | $ | 36,031 | $ | 43,159 | $ | 19,002 | ||||||||
Trade accounts receivable, net (See notes 5 and 6) | 83,290 | 87,653 | 51,280 | 62,129 | ||||||||||||
Inventories (see note 7) | 70,159 | 92,813 | 61,815 | 96,675 | ||||||||||||
Income tax recoverable | 0 | 751 | 3,014 | 3,079 | ||||||||||||
Prepaid expenses and other current assets | 4,432 | 4,719 | 5,530 | 6,418 | ||||||||||||
Total current assets | 223,722 | 221,967 | 164,798 | 187,303 | ||||||||||||
Property, plant and equipment, net (See note 8) | 26,780 | 29,907 | 29,142 | 27,010 | ||||||||||||
Cash surrender value of life insurance policies (See note 10) | 25,365 | 24,888 | ||||||||||||||
Deferred taxes (See note 16) | 14,173 | 2,880 | ||||||||||||||
Operating leases right-of-use assets (See note 11) | 34,613 | 39,512 | ||||||||||||||
Intangible assets, net (See note 9) | 26,237 | 33,371 | ||||||||||||||
Goodwill (See note 9) | 490 | 40,058 | ||||||||||||||
Cash surrender value of life insurance policies (See note 11) | 28,528 | 27,576 | ||||||||||||||
Deferred taxes (See note 17) | 12,005 | 14,484 | ||||||||||||||
Operating leases right-of-use assets (See note 12) | 50,801 | 68,949 | ||||||||||||||
Intangible assets, net (See note 10) | 28,622 | 31,779 | ||||||||||||||
Goodwill (See note 10) | 15,036 | 14,952 | ||||||||||||||
Other assets | 893 | 1,125 | 14,654 | 9,663 | ||||||||||||
Total non-current assets | 128,551 | 171,741 | 178,788 | 194,413 | ||||||||||||
Total assets | $ | 352,273 | $ | 393,708 | $ | 343,586 | $ | 381,716 | ||||||||
Liabilities and Shareholders’ Equity | ||||||||||||||||
Current liabilities | ||||||||||||||||
Current portion of long-term debt (See note 13) | $ | 1,393 | $ | 1,393 | ||||||||||||
Trade accounts payable | $ | 32,213 | $ | 25,493 | 16,470 | 16,090 | ||||||||||
Accrued salaries, wages and benefits | 7,136 | �� | 4,933 | 7,400 | 9,290 | |||||||||||
Income tax accrual (See note 16) | 501 | 0 | ||||||||||||||
Customer deposits | 4,256 | 3,351 | 5,920 | 8,511 | ||||||||||||
Current portion of lease liabilities (See note 11) | 6,650 | 6,307 | ||||||||||||||
Current portion of operating lease liabilities (See note 12) | 6,964 | 7,316 | ||||||||||||||
Other accrued expenses | 3,354 | 4,211 | 3,262 | 7,438 | ||||||||||||
Current portion of term loans | 0 | 5,834 | ||||||||||||||
Total current liabilities | 54,110 | 50,129 | 41,409 | 50,038 | ||||||||||||
Deferred compensation (See note 13) | 11,219 | 11,382 | ||||||||||||||
Lease liabilities (See note 11) | 29,441 | 33,794 | ||||||||||||||
Long term debt (See note 12) | 0 | 24,282 | ||||||||||||||
Long term debt (See note 13) | 21,481 | 22,874 | ||||||||||||||
Deferred compensation (See note 14) | 7,418 | 8,178 | ||||||||||||||
Operating lease liabilities (See note 12) | 46,414 | 63,762 | ||||||||||||||
Other long-term liabilities (See note 4) | 889 | 843 | ||||||||||||||
Total long-term liabilities | 40,660 | 69,458 | 76,202 | 95,657 | ||||||||||||
Total liabilities | 94,770 | 119,587 | 117,611 | 145,695 | ||||||||||||
Shareholders’ equity | ||||||||||||||||
Common stock, no par value, 20,000 shares authorized, 11,888 and 11,838 shares issued and outstanding on each date | 53,323 | 51,582 | ||||||||||||||
Common stock, no par value, 20,000 shares authorized, 10,672 and 11,197 shares issued and outstanding on each date | 49,524 | 50,770 | ||||||||||||||
Retained earnings | 204,988 | 223,252 | 175,717 | 184,386 | ||||||||||||
Accumulated other comprehensive loss | (808 | ) | (713 | ) | ||||||||||||
Accumulated other comprehensive income | 734 | 865 | ||||||||||||||
Total shareholders’ equity | 257,503 | 274,121 | 225,975 | 236,021 | ||||||||||||
Total liabilities and shareholders’ equity | $ | 352,273 | $ | 393,708 | $ | 343,586 | $ | 381,716 | ||||||||
See accompanying Notes to Consolidated Financial Statements.
HOOKER |
CONSOLIDATED STATEMENTS OF OPERATIONS |
(In thousands, except per share data) |
For the 52 Week Period Ended January 31, 2021, the 52 Week Period Ended February 2, 2020, and the 53 Week Period Ended February 3, 2019.
| ||||||||||||||||||||||||
For the 52 Week Periods Ended January 28, 2024, January 29, 2023, and January 30, 2022 | For the 52 Week Periods Ended January 28, 2024, January 29, 2023, and January 30, 2022 | |||||||||||||||||||||||
2021 | 2020 | 2019 | 2024 | 2023 | 2022 | |||||||||||||||||||
Net sales | $ | 540,081 | $ | 610,824 | $ | 683,501 | $ | 433,226 | $ | 583,102 | $ | 593,612 | ||||||||||||
Cost of sales | 427,333 | 496,866 | 536,014 | 322,705 | 461,056 | 488,508 | ||||||||||||||||||
Casualty loss | 0 | 0 | 500 | |||||||||||||||||||||
Inventory write downs | 1,829 | 28,752 | 3,402 | |||||||||||||||||||||
Gross profit | 112,748 | 113,958 | 146,987 | 108,692 | 93,294 | 101,702 | ||||||||||||||||||
Selling and administrative expenses | 80,410 | 88,867 | 91,928 | 92,678 | 95,815 | 84,475 | ||||||||||||||||||
Goodwill impairment charges | 39,568 | 0 | 0 | |||||||||||||||||||||
Trade name impairment charges | 4,750 | 0 | 0 | - | 13 | - | ||||||||||||||||||
Intangible asset amortization | 2,384 | 2,384 | 2,384 | 3,656 | 3,512 | 2,384 | ||||||||||||||||||
Operating (loss)/income | (14,364 | ) | 22,707 | 52,675 | ||||||||||||||||||||
Operating income / (loss) | 12,358 | (6,046 | ) | 14,843 | ||||||||||||||||||||
Other income, net | 336 | 458 | 369 | 1,653 | 416 | 373 | ||||||||||||||||||
Interest expense, net | 540 | 1,238 | 1,454 | 1,573 | 519 | 110 | ||||||||||||||||||
(Loss)/income before income taxes | (14,568 | ) | 21,927 | 51,590 | ||||||||||||||||||||
Income / (Loss) before income taxes | 12,438 | (6,149 | ) | 15,106 | ||||||||||||||||||||
Income tax (benefit)/expense | (4,142 | ) | 4,844 | 11,717 | ||||||||||||||||||||
Income tax expense / (benefit) | 2,573 | (1,837 | ) | 3,388 | ||||||||||||||||||||
Net (loss)/income | $ | (10,426 | ) | $ | 17,083 | $ | 39,873 | |||||||||||||||||
Net income / (loss) | $ | 9,865 | $ | (4,312 | ) | $ | 11,718 | |||||||||||||||||
(Loss)/Earnings per share: | ||||||||||||||||||||||||
Earnings / (Loss) per share: | ||||||||||||||||||||||||
Basic | $ | (0.88 | ) | $ | 1.44 | $ | 3.38 | $ | 0.91 | $ | (0.37 | ) | $ | 0.99 | ||||||||||
Diluted | $ | (0.88 | ) | $ | 1.44 | $ | 3.38 | $ | 0.91 | $ | (0.37 | ) | $ | 0.97 | ||||||||||
Weighted average shares outstanding: | ||||||||||||||||||||||||
Basic | 11,822 | 11,784 | 11,759 | 10,684 | 11,593 | 11,852 | ||||||||||||||||||
Diluted | 11,822 | 11,838 | 11,783 | 10,838 | 11,593 | 11,970 | ||||||||||||||||||
Cash dividends declared per share | $ | 0.66 | $ | 0.61 | $ | 0.57 | $ | 0.89 | $ | 0.82 | $ | 0.74 | ||||||||||||
See accompanying Notes to Consolidated Financial Statements.
HOOKER |
CONSOLIDATED STATEMENTS OF COMPREHENSIVE |
(In thousands) |
For the 52 Week Period Ended January 31, 2021, the 52 Week Period Ended February 2, 2020, and the 53 Week Period Ended February 3, 2019.
| ||||||||||||
2021 | 2020 | 2019 | ||||||||||
Net (Loss)/Income | $ | (10,426 | ) | $ | 17,083 | $ | 39,873 | |||||
Other comprehensive income (loss): | ||||||||||||
Amortization of actuarial (loss) | (125 | ) | (740 | ) | (305 | ) | ||||||
Income tax effect on amortization | 30 | 176 | 73 | |||||||||
Gain on pension plan settlement | 0 | (520 | ) | 0 | ||||||||
Income tax effect on settlement | 0 | 124 | 0 | |||||||||
Adjustments to net periodic benefit cost | (95 | ) | (960 | ) | (232 | ) | ||||||
Reclassification of tax effects due to the adoption of ASU 2018-02 | 0 | 0 | 111 | |||||||||
Total Comprehensive (Loss)/Income | $ | (10,521 | ) | $ | 16,123 | $ | 39,752 | |||||
For the 52 Week Periods Ended January 28, 2024, January 29, 2023, and January 30, 2022 | ||||||||||||
2024 | 2023 | 2022 | ||||||||||
Net Income/(Loss) | $ | 9,865 | $ | (4,312 | ) | $ | 11,718 | |||||
Other comprehensive income: | ||||||||||||
Actuarial adjustments | (172 | ) | 1,204 | 994 | ||||||||
Income tax effect on adjustments | 41 | (288 | ) | (237 | ) | |||||||
Adjustments to net periodic benefit cost | (131 | ) | 916 | 757 | ||||||||
Total Comprehensive Income/(Loss) | $ | 9,734 | $ | (3,396 | ) | $ | 12,475 | |||||
See accompanying Notes to Consolidated Financial Statements.
HOOKER | ||||||
CONSOLIDATED STATEMENTS OF CASH FLOWS | ||||||
(In thousands) |
For the 52 Week Period Ended January 31, 2021, the 52 Week Period Ended February 2, 2020, and the 53 Week Period Ended February 3, 2019.
| ||||||||||||||||||||||||
For the 52 Week Periods Ended January 28, 2024, January 29, 2023, and January 30, 2022 | For the 52 Week Periods Ended January 28, 2024, January 29, 2023, and January 30, 2022 | |||||||||||||||||||||||
2021 | 2020 | 2019 | 2024 | 2023 | 2022 | |||||||||||||||||||
Operating Activities: | ||||||||||||||||||||||||
Net (loss)/income | $ | (10,426 | ) | $ | 17,083 | $ | 39,873 | |||||||||||||||||
Net income/(loss) | $ | 9,865 | $ | (4,312 | ) | $ | 11,718 | |||||||||||||||||
Adjustments to reconcile net income to net cash provided by operating activities: | ||||||||||||||||||||||||
Goodwill and intangible asset impairment charges | 44,318 | 0 | 0 | |||||||||||||||||||||
Inventory valuation expense | 1,829 | 28,752 | 3,402 | |||||||||||||||||||||
Depreciation and amortization | 6,778 | 7,100 | 7,442 | 8,956 | 8,829 | 7,814 | ||||||||||||||||||
Gain on pension settlement | 0 | (520 | ) | 0 | ||||||||||||||||||||
(Gain)/Loss on disposal of assets | 0 | (271 | ) | (73 | ) | |||||||||||||||||||
Proceeds from casualty loss | 0 | 0 | 409 | |||||||||||||||||||||
Deferred income tax (benefit)/expense | (11,262 | ) | 1,940 | (1,221 | ) | |||||||||||||||||||
Loss/(Gain) on disposal of assets | 35 | 94 | (18 | ) | ||||||||||||||||||||
Deferred income tax expense/(benefit) | 2,523 | (3,160 | ) | 2,323 | ||||||||||||||||||||
Non-cash restricted stock and performance awards | 1,741 | 1,296 | 1,284 | 1,706 | 1,244 | (28 | ) | |||||||||||||||||
Provision for doubtful accounts and sales allowances | 4,686 | (435 | ) | (799 | ) | (727 | ) | (3,673 | ) | 45 | ||||||||||||||
Gain on life insurance policies | (1,207 | ) | (831 | ) | (748 | ) | (984 | ) | (1,179 | ) | (1,008 | ) | ||||||||||||
Changes in assets and liabilities: | ||||||||||||||||||||||||
Trade accounts receivable | (323 | ) | 25,339 | (17,982 | ) | 11,577 | 16,831 | 9,518 | ||||||||||||||||
Inventories | 22,654 | 12,391 | (21,323 | ) | 34,776 | (47,827 | ) | (8,265 | ) | |||||||||||||||
Income tax recoverable | 751 | (751 | ) | 0 | 65 | 1,283 | (4,361 | ) | ||||||||||||||||
Prepaid expenses and other current assets | 515 | (557 | ) | 267 | ||||||||||||||||||||
Prepaid expenses and other assets | (5,111 | ) | (5,711 | ) | (4,400 | ) | ||||||||||||||||||
Trade accounts payable | 6,686 | (15,349 | ) | 8,130 | 190 | (15,781 | ) | (1,312 | ) | |||||||||||||||
Accrued salaries, wages and benefits | 2,204 | (3,070 | ) | (1,643 | ) | (1,890 | ) | 2,148 | 76 | |||||||||||||||
Accrued income taxes | 501 | (3,159 | ) | (672 | ) | - | - | (501 | ) | |||||||||||||||
Customer deposits | 904 | 328 | (1,270 | ) | (2,590 | ) | (1,911 | ) | 2,890 | |||||||||||||||
Operating lease liabilities | 888 | 299 | 0 | 449 | (57 | ) | 708 | |||||||||||||||||
Other accrued expenses | (856 | ) | 645 | 604 | (4,261 | ) | 3,254 | 908 | ||||||||||||||||
Deferred compensation | (289 | ) | (49 | ) | (2,757 | ) | (937 | ) | (542 | ) | (300 | ) | ||||||||||||
Other long-term liabilities | 0 | 0 | 141 | |||||||||||||||||||||
Net cash provided by operating activities | 68,263 | 41,429 | 9,662 | |||||||||||||||||||||
Net cash provided by/(used in) operating activities | 55,471 | (21,718 | ) | 19,209 | ||||||||||||||||||||
Investing Activities: | ||||||||||||||||||||||||
Acquisition | (2,373 | ) | (25,274 | ) | - | |||||||||||||||||||
Purchases of property, plant and equipment | (1,210 | ) | (5,129 | ) | (5,214 | ) | (6,815 | ) | (4,199 | ) | (6,692 | ) | ||||||||||||
Proceeds received on notes receivable | 0 | 1,449 | 119 | |||||||||||||||||||||
Proceeds from sale of property and equipment | 0 | 16 | 11 | - | 18 | |||||||||||||||||||
Premiums paid on life insurance policies | (555 | ) | (590 | ) | (652 | ) | (406 | ) | (492 | ) | (560 | ) | ||||||||||||
Proceeds received on life insurance policies | 1,289 | 0 | 1,225 | 1,036 | - | 372 | ||||||||||||||||||
Net cash used in investing activities | (476 | ) | (4,254 | ) | (4,511 | ) | (8,558 | ) | (29,965 | ) | (6,862 | ) | ||||||||||||
Financing Activities: | ||||||||||||||||||||||||
Payments for long-term debt | (30,139 | ) | (5,368 | ) | (17,917 | ) | ||||||||||||||||||
Purchase and retirement of common stock | (11,674 | ) | (13,342 | ) | - | |||||||||||||||||||
Cash dividends paid | (7,838 | ) | (7,211 | ) | (6,714 | ) | (9,682 | ) | (9,602 | ) | (8,822 | ) | ||||||||||||
Net cash used in financing activities | (37,977 | ) | (12,579 | ) | (24,631 | ) | ||||||||||||||||||
Payments for long-term loans | (1,400 | ) | (700 | ) | - | |||||||||||||||||||
Proceeds from long-term loans | - | 25,000 | - | |||||||||||||||||||||
Proceeds from revolving credit facility | - | 36,190 | - | |||||||||||||||||||||
Payments for revolving credit facility | - | (36,190 | ) | - | ||||||||||||||||||||
Debt issuance cost | - | (37 | ) | - | ||||||||||||||||||||
Net cash (used in)/provided by financing activities | (22,756 | ) | 1,319 | (8,822 | ) | |||||||||||||||||||
Net increase (decrease) in cash and cash equivalents | 29,810 | 24,596 | (19,480 | ) | ||||||||||||||||||||
Net increase/(decrease) in cash and cash equivalents | 24,157 | (50,364 | ) | 3,525 | ||||||||||||||||||||
Cash and cash equivalents at the beginning of year | 36,031 | 11,435 | 30,915 | 19,002 | 69,366 | 65,841 | ||||||||||||||||||
Cash and cash equivalents at the end of year | $ | 65,841 | $ | 36,031 | $ | 11,435 | $ | 43,159 | $ | 19,002 | $ | 69,366 | ||||||||||||
Supplemental schedule of cash flow information: | ||||||||||||||||||||||||
Interest paid, net | $ | 444 | $ | 993 | $ | 1,338 | $ | 1,375 | $ | 642 | $ | - | ||||||||||||
Income taxes paid, net | 5,872 | 6,818 | 13,613 | 23 | 101 | 5,888 | ||||||||||||||||||
Supplemental schedule of noncash investing activities: | ||||||||||||||||||||||||
Increase in lease liabilities arising from obtaining right-of-use assets | 2,236 | 625 | 0 | |||||||||||||||||||||
(Decrease)/Increase in lease liabilities arising from obtaining right-of-use assets | (10,646 | ) | 25,241 | 24,513 | ||||||||||||||||||||
Increase in property and equipment through accrued purchases | 33 | 5 | 23 | 190 | 128 | 15 | ||||||||||||||||||
See accompanying Notes to Consolidated Financial Statements.
HOOKER | ||||||||
CONSOLIDATED STATEMENTS OF SHAREHOLDERS' EQUITY | ||||||||
(In thousands, except per share data) |
For the 52 Week Period Ended January 31, 2021, the 52 Week Period Ended February 2, 2020, and the 53 Week Period Ended February 3, 2019.
| ||||||||||||||||||||
Accumulated | ||||||||||||||||||||
Other | Total | |||||||||||||||||||
Common Stock | Retained | Comprehensive | Shareholders' | |||||||||||||||||
Shares | Amount | Earnings | Income / (Loss) | Equity | ||||||||||||||||
Balance at January 28, 2018 | 11,762 | $ | 48,970 | $ | 180,122 | $ | 368 | $ | 229,460 | |||||||||||
Net income | $ | 39,873 | $ | 39,873 | ||||||||||||||||
Prior year adjustment for ASU 2014-09 and 2018-02 | 99 | 111 | 210 | |||||||||||||||||
Unrealized loss on defined benefit plan, net of tax of $73 | (232 | ) | (232 | ) | ||||||||||||||||
Cash dividends paid and accrued ($0.57 per share) | (6,714 | ) | (6,714 | ) | ||||||||||||||||
Restricted stock grants, net of forfeitures | 23 | (30 | ) | (30 | ) | |||||||||||||||
Restricted stock compensation cost | 609 | 609 | ||||||||||||||||||
Balance at February 3, 2019 | 11,785 | $ | 49,549 | $ | 213,380 | $ | 247 | $ | 263,176 | |||||||||||
Net income | $ | 17,083 | $ | 17,083 | ||||||||||||||||
Gain on pension settlement, net of tax of $124 | (396 | ) | (396 | ) | ||||||||||||||||
Unrealized loss on defined benefit plan, net of tax of $176 | (564 | ) | (564 | ) | ||||||||||||||||
Cash dividends paid and accrued ($0.61 per share) | (7,211 | ) | (7,211 | ) | ||||||||||||||||
Restricted stock grants, net of forfeitures | 53 | 344 | 344 | |||||||||||||||||
Restricted stock compensation cost | 790 | 790 | ||||||||||||||||||
Recognition of PSUs as equity-based awards | 899 | 899 | ||||||||||||||||||
Balance at February 2, 2020 | 11,838 | $ | 51,582 | $ | 223,252 | $ | (713 | ) | $ | 274,121 | ||||||||||
Net loss | $ | (10,426 | ) | $ | (10,426 | ) | ||||||||||||||
Unrealized loss on defined benefit plan, net of tax of $30 | $ | (95 | ) | (95 | ) | |||||||||||||||
Cash dividends paid and accrued ($0.66 per share) | (7,838 | ) | (7,838 | ) | ||||||||||||||||
Restricted stock grants, net of forfeitures | 50 | $ | 169 | 169 | ||||||||||||||||
Restricted stock compensation cost | 809 | 809 | ||||||||||||||||||
Performance-based restricted stock units cost | 763 | 763 | ||||||||||||||||||
Balance at January 31, 2021 | 11,888 | $ | 53,323 | $ | 204,988 | $ | (808 | ) | $ | 257,503 | ||||||||||
For the 52 Week Periods Ended January 28, 2024, January 29, 2023, and January 30, 2022 | ||||||||||||||||||||
Accumulated | ||||||||||||||||||||
Other | Total | |||||||||||||||||||
Common Stock | Retained | Comprehensive | Shareholders' | |||||||||||||||||
Shares | Amount | Earnings | Income / (Loss) | Equity | ||||||||||||||||
Balance at January 31, 2021 | 11,888 | $ | 53,323 | $ | 204,988 | $ | (808 | ) | $ | 257,503 | ||||||||||
Net income | $ | 11,718 | $ | 11,718 | ||||||||||||||||
| Actuarial adjustments on defined benefit plan, net of tax of $237 | $ | 757 | 757 | |||||||||||||||||
Cash dividends paid and accrued ($0.74 per share) | (8,822 | ) | (8,822 | ) | ||||||||||||||||
Restricted stock grants, net of forfeitures | 34 | $ | (126 | ) | (126 | ) | ||||||||||||||
Restricted stock compensation cost | 1,074 | 1,074 | ||||||||||||||||||
Performance-based restricted stock units cost | 502 | 502 | ||||||||||||||||||
PSU awards | (1,478 | ) | (1,478 | ) | ||||||||||||||||
Balance at January 30, 2022 | 11,922 | $ | 53,295 | $ | 207,884 | $ | (51 | ) | $ | 261,128 | ||||||||||
Net loss | $ | (4,312 | ) | $ | (4,312 | ) | ||||||||||||||
| Actuarial adjustments on defined benefit plan, net of tax of $288 | $ | 916 | 916 | |||||||||||||||||
Cash dividends paid and accrued ($0.82 per share) | (9,602 | ) | (9,602 | ) | ||||||||||||||||
Purchase and retirement of common stock | (820 | ) | (3,770 | ) | (9,584 | ) | (13,354 | ) | ||||||||||||
Restricted stock grants, net of forfeitures | 95 | (101 | ) | (101 | ) | |||||||||||||||
Restricted stock compensation cost | 1,266 | 1,266 | ||||||||||||||||||
Performance-based restricted stock units cost | 606 | 606 | ||||||||||||||||||
PSU awards | (526 | ) | (526 | ) | ||||||||||||||||
Balance at January 29, 2023 | 11,197 | $ | 50,770 | $ | 184,386 | $ | 865 | $ | 236,021 | |||||||||||
Net income | $ | 9,865 | $ | 9,865 | ||||||||||||||||
| Actuarial adjustments on defined benefit plan, net of tax of $41 | $ | (131 | ) | (131 | ) | |||||||||||||||
Cash dividends paid and accrued ($0.89 per share) | (9,682 | ) | (9,682 | ) | ||||||||||||||||
Purchase and retirement of common stock | (620 | ) | $ | (2,952 | ) | (8,852 | ) | (11,804 | ) | |||||||||||
Restricted stock grants, net of forfeitures | 95 | (156 | ) | (156 | ) | |||||||||||||||
Restricted stock compensation cost | 1,702 | 1,702 | ||||||||||||||||||
Performance-based restricted stock units cost | 773 | 773 | ||||||||||||||||||
PSU awards | (613 | ) | (613 | ) | ||||||||||||||||
Balance at January 28, 2024 | 10,672 | $ | 49,524 | $ | 175,717 | $ | 734 | $ | 225,975 | |||||||||||
See accompanying Notes to Consolidated Financial Statements.
HOOKER FURNITUREFURNISHINGS CORPORATION AND SUBSIDIARIES
NOTES TO CONSOLIDATED FINANCIAL STATEMENTS
(Dollar and share amounts in tables, except per share amounts, in thousands unless otherwise indicated)
For the Fifty-Two Weeks Ended January 31, 202128, 2024
NOTE 1 – RECENTLY ADOPTED ACCOUNTING STANDARDS
In June 2016, the FASB issued ASU 2016-13, Financial Instruments—Credit Losses (Topic 326). This update seeks to provide financial statement users with more decision-useful information about the expected credit losses on financial instruments, including trade receivables, and other commitments to extend credit held by a reporting entity at each reporting date. The amendments require an entity to replace the incurred loss impairment methodology in current GAAP with a methodology that reflects current expected credit losses and requires consideration of a broader range of reasonable and supportable information to inform credit loss estimates. The amendments are effective for fiscal years, and interim periods within those fiscal years, beginning after December 15, 2019. We adopted the provisions of Topic 326 on February 3, 2020, the first day of our 2021 fiscal year using the modified retrospective transition approach. The adoption of this standard did not have a material effect on our consolidated financial statements or results of operations.
In December 2019, the FASB issued ASU 2019-12, Income Tax (Topic 740) – Simplifying the Accounting for Income Taxes. The amendments in this update simplify the accounting for income taxes by removing certain exceptions for intra-period tax allocation, the recognition of deferred tax liabilities after an investment in a foreign entity transitions to or from the equity method, and the general methodology for calculating income taxes in an interim period when a year-to-date loss exceeds the anticipated loss for the year. The amendments also introduce new guidance on determining how to apply the income tax guidance to franchise taxes that are partially based on income, clarifying the accounting for transactions that result in a step-up in the tax basis of goodwill, and the effect of an enacted change in tax laws or rates in the annual effective tax rate computation in the interim period. The amendments are effective for fiscal years, and interim periods within those fiscal years, beginning after December 15, 2020, with early adoption permitted. We elected to adopt ASU 2019-12 on February 3, 2020, the first day of our 2021 fiscal year. While the adoption of ASU 2019-12 impacted the tax benefit recognized in our interim financial statements, it had no material impact on our annual financial statements.
NOTE 21 – SUMMARY OF SIGNIFICANT ACCOUNTING POLICIES
Nature of Business
Hooker FurnitureFurnishings Corporation and subsidiaries (the “Company,” “we,” “us” and “our”) design, import, manufacture and market residential household furniture, hospitality and contract furniture, lighting, accessories, and home décor for sale to wholesale and retail merchandisers located principally in North America.
Consolidation
The consolidated financial statements include the accounts of Hooker FurnitureFurnishings Corporation and our wholly owned subsidiaries. All material intercompany accounts and transactions have been eliminated in consolidation. All references to the Company refer to the Company and our consolidated subsidiaries, unless specifically referring to segment information.
Operating Segments
As a public entity, we are required to present disaggregated information by segment using the management approach. The objective of this approach is to allow users of our financial statements to see our business through the eyes of management based upon the way management reviews performance and makes decisions. The management approach requires segment information to be reported based on how management internally evaluates the operating performance of the company’s business units or segments. The objective of this approach is to meet the basic principles of segment reporting as outlined in ASC 280 Segments (“ASC 280”), which are to allow the users of our financial statements to:
■ | better understand our performance; |
■ | better assess our prospects for future net cash flows; and |
■ | make more informed judgments about us as a whole. |
We define our segments as those operations our chief operating decision maker (“CODM”) regularly reviews to analyze performance and allocate resources. We measure the results of our segments using, among other measures, each segment’s net sales, gross profit and operating income, as determined by the information regularly reviewed by the CODM.
For financial reporting purposes, we are organized into 3three operating segments and “All Other”, which includes the remainder of our businesses:
■ | Hooker Branded, consisting of the operations of our imported Hooker Casegoods and Hooker Upholstery businesses; |
■ | Home Meridian, a stand-alone, mostly autonomous business that serves a different type or class of customer than do our other operating segments and at much lower margins; |
■ | Domestic Upholstery, which includes the domestic upholstery manufacturing operations of Bradington-Young, HF Custom (formerly Sam |
■ | All Other, consisting of H Contract, BOBO Intriguing Objects, and Lifestyle Brands. |
Cash and Cash Equivalents
We consider cash on hand, demand deposits in banks and all highly liquid investments with an original maturity of three months or less to be cash and cash equivalents.
Trade Accounts Receivable
Accounts receivable are reported net of the allowance for doubtful accounts and sales-related allowances. Substantially all of our trade accounts receivable are due from retailers and dealers that sell residential home furnishings or commercial purchasers of our hospitality and senior living products, and consist of a large number of entities with a broad geographic dispersion. We perform credit evaluations of our customers and generally do not require collateral.
These trade accounts receivable are reported net of customer allowances and an allowance for doubtful accounts.
Reserves for customer allowances comprise the majority of the reduction of our gross trade accounts receivable to the estimated fair value reported on the face of our financial statements. We regularly review and revise customer allowances based on unprocessed claims received and current and historical activity and any agreements made with specific customers. Historically, in the Home Meridian segment, Clubs channel customers drove most of the customer allowance activity due to their consumer-facing product return policies. We based anticipated future claims on historical experience with these customers.
We regularly review and revise accounts receivable for doubtful accounts and customer allowances based upon historical bad debts and customer allowances and any agreements with specific customers.debts. If the financial condition of a customer or customers were to deteriorate, resulting in an impairment of their ability to make payments, additional bad debt allowances may be required. In the event a receivable is determined to be potentially uncollectible, we engage collection agencies or law firms to attempt to collect amounts owed to us after all internal collection attempts have ended. Once we have determined the receivable is uncollectible, it is charged against the allowance for doubtful accounts.
Fair Value Measurements
We utilize valuation techniques that maximize the use of observable inputs and minimize the use of unobservable inputs to the extent possible. We determine fair value based on assumptions that we believe market participants would use in pricing an asset or liability in the principal or most advantageous market. When considering market participant assumptions in fair value measurements, the following fair value hierarchy distinguishes between observable and unobservable inputs, which are categorized in one of the following levels:
■ | Level 1 Inputs: Unadjusted quoted prices in active markets for identical assets or liabilities accessible to the reporting entity at the measurement date. |
■ | Level 2 Inputs: Observable inputs other than quoted prices included in Level 1 inputs that are observable for the asset or liability, either directly or indirectly, for substantially the full term of the asset or liability. |
■ | Level 3 Inputs: Unobservable inputs for the asset or liability used to measure fair value to the extent that observable inputs are not available, thereby allowing for situations in which there is little, if any, market activity for the asset or liability at measurement date. |
Fair Value of Financial Instruments
The carrying value of certain of our financial instruments (cash and cash equivalents, trade accounts receivable and payable, and accrued liabilities) approximates fair value because of the short-term nature of those instruments. The carrying value of Company-owned life insurance is marked to market each reporting period and any change in fair value is reflected in income for that period. See Note 1011 for details.
Inventories
Inventories, consisting of finished furniture for sale, raw materials, manufacturing supplies and furniture in process, are stated at the lower of cost, or market value, with cost determined using the last-in, first-out (LIFO) method. Under this method, inventory is valued at cost, which is determined by applying a cumulative index to current year inventory dollars. We believe the use of the LIFO method results in a better matching of costs and revenues. We review inventories on hand and record an allowance for slow-moving and obsolete inventory based on historical experience and expected sales.
Property, Plant and Equipment
Property, plant and equipment are stated at cost, less allowances for depreciation. Provision for depreciation has been computed at annual rates using straight-line or declining balance depreciation methods that will amortize the cost of the depreciable assets over their estimated useful lives.
Leases
Leases are classified as either finance leases or operating leases based on criteria in Topic 842. All of our current leases are classified as operating leases. We do not currently have finance leases but could in the future.
Operating lease right-of-use ("ROU"(“ROU”) assets and liabilities are recognized on the adoption date based on the present value of lease payments over the remaining lease term. As interest rates are not explicitly stated or implicit in any of our leases, we utilized our incremental borrowing rate at the adoption date of February 4, 2019. For leases without explicitly stated or implicit interest rates that commenced after the adoption date and before July 2022, we useused our incremental borrowing rate which was one-month LIBOR at the lease commencement date plus 1.5%. When we entered into the new loan agreement, our incremental borrowing rate for unsecured term loan became the current BSBY rate plus 1.40%. We use this rate as the discount rate for leases commenced in July 2022 and thereafter. ROU assets also include any lease payments made and exclude lease incentives. Lease terms may include options to extend or terminate the lease when it is reasonably certain that we will exercise that option.
At the inception of a lease, we allocate the consideration in the contract to each lease and non-lease component based on the component'scomponent’s relative stand-alone price to determine the lease payments. Lease and non-lease components are accounted for separately. Lease expense for operating leases is recognized on a straight-line basis over the lease term. Included in lease expense are any variable lease payments incurred in the period that were not included in the initial lease liability. Some of our real estate leases contain variable lease payments, including payments based on the percentage increase in the Consumer Price Index for Urban Consumers (“CPI-U”). We used February 2019 CPI-U issued by the US Department of Labor’s Bureau of Labor Statistics to measure lease payments and calculate lease liabilities upon adoption of this standard. Additional payments based on the change in an index or rate, or payments based on a change in our portion of the operating expenses, including real estate taxes and insurance, are recorded when incurred.
We have a sub-lease at one of our warehouses. In accordance with the provisions of Topic 842, since we have not been relieved as the primary obligor of the warehouse lease, we cannot net the sublease income against our lease payment to calculate the lease liability and ROU asset. Our practice is to straight-line the sub-lease income over the term of the sublease.
Our leases have remaining lease terms of less than one year to seventen years, some of which include options to extend the leases for up to seventen years. We have elected not to recognize ROU assets and lease liabilities that arise from short term leases for any class of underlying asset. Short term leases are leases with lease terms of 12 months or less with either (a) no renewal option or (b) a renewal option which we are not reasonably certain to exercise.
Impairment of Long-Lived Assets
Long-lived assets, such as property, plant and equipment and definite-lived assets, are evaluated for impairment annually or more frequently when events or changes in circumstances indicate that the carrying amount of the assets or asset groups may not be recoverable through the estimated undiscounted future cash flows from the use of those assets. When any such impairment exists, the related assets are written down to fair value. Long-lived assets subject to disposal by sale are measured at the lower of their carrying amount or fair value less estimated cost to sell, are no longer depreciated, and are reported separately as “assets held for sale” in the consolidated balance sheets.
Intangible Assets and Goodwill
We own both definite-lived (amortizable) assets and indefinite-lived intangible assets. Our amortizable intangible assets are related to the Shenandoah, Sunset West and Home Meridian acquisitions, as well as the rebranding of Sam Moore product line, and includes customer relationships and trademarks. Our indefinite lived assets include goodwill related to the Shenandoah, Sunset West and Home MeridianBOBO acquisitions, as well as the Bradington-Young, Home Meridian and Sam MooreBOBO tradenames. We may acquire additional amortizable assets and/or indefinite lived intangible assets in the future. Our indefinite-lived intangible assets are not amortized but are tested for impairment annually or more frequently if events or circumstances indicate that the asset might be impaired.
OurIn accordance with ASC 350, Intangibles—Goodwill and Other, our goodwill, trademarks and trade names are tested for impairment annually as of the first day of our fourth quarter or more frequently if events or changes in circumstances indicate that the asset might be impaired. Circumstances that could indicate a potential impairment include, but are not limited to:
■ | a significant adverse change in the economic or business climate either within the furniture industry or the national or global economy; |
■ | significant changes in demand for our products; |
■ | loss of key personnel; and |
■ | the likelihood that a reporting unit or significant portion of a reporting unit will be sold or otherwise subject to disposal. |
The assumptions used to determine the fair value of our intangible assets are highly subjective and judgmental and include long-term growth rates, sales volumes, projected revenues, assumed royalty rates and factors used to develop an applied discount rate. If the assumptions that we use in these calculations differ from actual results, we may realize additional impairment on our intangible assets that may have a material-adverse effect on our results of operations and financial condition.
Cash Surrender Value of Life Insurance Policies
We own NaNseventy-three life insurance policies on certain of our current and former executives and other key employees. These policies had a carrying value of $25.5$28.5 million at January 31, 202128, 2024 and have a face value of approximately $54$56 million as of that date. Proceeds from the policies are used to fund certain employee benefits and for other general corporate purposes. We account for life insurance as a component of employee benefits cost. Consequently, the cost of the coverage and any resulting gains or losses related to those insurance policies are recorded as a decrease or increase to operating income. Cash payments that increase the cash surrender value of these policies are classified as investing outflows on the Consolidated Statements of Cash Flows, with amounts paid in excess of the increase in cash surrender value included in operating activities. Gains on life insurance policies, which typically occur at the time a policy is redeemed, are included in the reconciliation of net income to net cash used in or provided by operating activities. Substantially all of the cash value of our company owned life insurance is pledged as collateral for our secured term loan.
Revenue Recognition
We recognize revenue pursuant to Accounting Standards Codification 606, which requires revenue to be recognized at an amount that reflects the consideration we expect to be entitled to receive in exchange for transferring goods or services to our customers. Our policy is to record revenue when control of the goods transfers to the customer. We have a present right to payment at the time of shipment as customers are invoiced at that time. We believe the customer obtains control of goods at the time of shipment, which is typically when title passes. While the customer may not enjoy immediate physical possession of the products, the customers’ right to re-direct shipment indicates control. In the very limited instances when products are sold under consignment arrangements, we do not recognize revenue until control over such products has transferred to the end consumer. Orders are generally non-cancellable once loaded into a shipping trailer or container.
The transaction price for each contract is the stated price of the product, reduced by any stated discounts or allowances at that point in time. We do not engage in sales of products that attach a future material right which could result in a separate performance obligation for the purchase of goods in the future at a material discount. The implicit contract with the customer, as reflected in the order acknowledgement and invoice, states the final terms of the sale, including the description, quantity, and price of each product purchased. The transaction price reflects the amount of estimated consideration to which we expect to be entitled. This amount of variable consideration included in the transaction price, and measurement of net sales, is included in net sales only to the extent that it is probable that there will be no significant reversal in a future period.
Net sales are comprised of gross revenues from sales of home furnishings and hospitality furniture products and are recorded net of allowances for trade promotions, estimated product returns, rebate advertising programs and other discounts. Physical product returns are very rare due to the high probability of damages to our products in return transit. Other revenues, primarily royalties, are immaterial to our overall results. Payment is typically due within 30-60 days of shipment for customers qualifying for payment terms. Collectability is reasonably assured since we extend credit to customers for whom we have performed credit evaluations and/or from whom we have received a down payment or deposit. Due to the highly-customized nature of our hospitality products, we typically require substantial prepayments on these orders, with the balance due within 30 days of delivery. For our outdoor furnishings, most orders require a 50% deposit upon order and the balance when production is started.
Cost of Sales
The major components of cost of sales are:
■ | the cost of imported products purchased for resale; |
■ | raw materials and supplies used in our domestically manufactured products; |
■ | labor and overhead costs associated with our domestically manufactured products; |
■ | the cost of our foreign import operations; |
■ | charges associated with our inventory reserves; |
■ | warehousing and certain shipping and handling costs; and |
■ | all other costs required to be classified as cost of sales. |
Selling and Administrative Expenses
The major components of our selling and administrative expenses are:
■ | the cost of our marketing and merchandising efforts, including showroom expenses; |
■ | sales and design commissions; |
■ | the costs of administrative support functions including, executive management, information technology, human resources and finance; and |
■ | all other costs required to be classified as selling and administrative expenses. |
Advertising
We offer advertising programs to qualified dealers under which we may provide signage, catalogs and other marketing support to our dealers and may reimburse some advertising and other costs incurred by our dealers in connection with promoting our products. The cost of these programs does not exceed the fair value of the benefit received. We charge the cost of point-of-purchase materials (including signage, catalogs, and fabric and leather swatches) to selling and administrative expense as incurred. Advertising costs charged to selling and administrative expense for fiscal years 2021, 20202024, 2023, and 20192022 were $2.1$2.6 million, $3.4$2.0 million, and $3.3$1.9 million, respectively. The costs for other advertising allowance programs are charged against net sales. We also have arrangements with some dealers to reimburse them for a portion of their advertising costs, which provides advertising benefits to us. Costs for these arrangements are expensed as incurred and are netted against net sales in our consolidated statements of operations and comprehensive income/(loss).income.
Income Taxes
At times, tax law and generally accepted accounting principles differ in the treatment of certain income and expense items. These items may be excluded or included in taxable income at different times than is required for GAAP or “book” reporting purposes. These differences may be permanent or temporary in nature.
We determine our annual effective income tax rate based on pre-tax book income and permanent book and tax differences.
To the extent any book and tax differences are temporary in nature, that is, the book realization will occur in a different period than the tax realization, a deferred tax asset or liability is established. To the extent a deferred tax asset is created, we evaluate our ability to realize this asset. If we determine that we will not be able to fully utilize deferred tax assets, we establish a valuation reserve. In assessing the realization of deferred tax assets, we consider whether it is more likely than not that some portion or all of the deferred tax assets will be realized. The ultimate realization of deferred tax assets is primarily dependent upon the generation of future taxable income during the periods in which those temporary differences reverse. Currently, we have $14.2 million deferred tax assets related to net operating loss carryforwards that can be used to offset taxable income and reduce our income tax liabilities in the future periods. All deferred tax assets and liabilities are classified as non-current on our consolidated balance sheets. See Note 16 Income Taxes for additional details.
Earnings Per Share
We use the two-class method to compute basic earnings per share. Under this method we allocate earnings to common shares and participating securities according to their participation rights in dividends declared and undistributed earnings and divide the income available to each class by the weighted average number of common shares for the period in each class. Unvested restricted stock grants made to our non-employee directors and certain employees are considered participating securities because the shares have the right to receive non-forfeitable dividends. Because the participating shares have no obligation to share in net losses, we do not allocate losses to our common shares in this calculation.
Diluted earnings per share reflect the potential dilutive effect of securities that could share in our earnings. Restricted stock awarded to non-employee directors and certain employees and restricted stock units granted to employees that have not yet vested are considered when computing diluted earnings per share. We use the treasury stock method to determine the dilutive effect of both unvested restricted stock and unvested restricted stock units. Shares of unvested restricted stock and unvested restricted stock units under a stock-based compensation arrangement are considered options for purposes of computing diluted earnings per share and are considered outstanding shares as of the grant date for purposes of computing diluted earnings per share even though their exercise may be contingent upon vesting. Those stock-based awards are included in the diluted earnings per share computation even if the non-employee director may be required to forfeit the stock at some future date, or no shares may ever be issued to the employees. Unvested restricted stock and unvested restricted stock units are not included in outstanding common shares in computing basic earnings per share.
Use of Estimates
The preparation of financial statements in conformity with U.S. generally accepted accounting principles requires us to make estimates and assumptions that affect the reported amounts of: (i) assets and liabilities, including disclosures regarding contingent assets and liabilities at the dates of the financial statements; and (ii) revenue and expenses during the reported periods. Significant items subject to such estimates and assumptions include inventory reserves, useful lives of fixed and intangible assets; allowance for doubtful accounts; deferred tax assets; the valuation of fixed assets and goodwill; our pension and supplemental retirement income plans; and stock-based compensation. These estimates and assumptions are based on our best judgments. We evaluate these estimates and assumptions on an ongoing basis using historical experience and other factors, including the current economic environment, which we believe to be reasonable under the circumstances. We adjust our estimates and assumptions as facts and circumstances dictate. Actual results could differ from our estimates.
Recently Issued Accounting Pronouncements
In November 2023, the FASB issued ASU 2023-07, “Segment Reporting (Topic 280): Improvements to Reportable Segment Disclosures”. The new guidance requires enhanced reportable segment disclosures to include significant segment expenses. ASU 2023-07 is effective for annual and interim periods beginning after December 15, 2023 (our fiscal 2025). We are currently evaluating the impact that the adoption of this new guidance will have on our Consolidated Financial Statements and will add necessary disclosures upon adoption.
In December 2023, the FASB issued ASU 2023-09, “Income Taxes (Topic 740): Improvements to Income Tax Disclosures”. The new guidance requires enhanced effective tax rate reconciliation and income taxes paid disclosures. ASU 2023-09 is effective for annual periods beginning after December 15, 2024 (our fiscal 2026). We are currently evaluating the impact that the adoption of this new guidance will have on our Consolidated Financial Statements and will add necessary disclosures upon adoption.
We reviewed all other newly issued accounting pronouncements and concluded that they are either not applicable to our business or are not expected to have a material effect on our Consolidated Financial Statements as a result of future adoption.
NOTE 3-2 - FISCAL YEAR
Our fiscal years end on the Sunday closest to January 31. In some years, generally once every six years, the fourth quarter will be fourteen weeks long and the fiscal year will consist of fifty-three weeks. The 2019 fiscal year that ended on February 3, 2019 was a 53-week fiscal year. Our quarterly periods are based on thirteen-week “reporting periods,” which end on Sundays. As a result, each quarterly period generally will be thirteen weeks, or 91 days long, except during a 53-week fiscal year which will have 14 weeks in the fourth quarter.
In the notes to the consolidated financial statements, references to the:
■ |
|
■ | 2023 fiscal year and comparable terminology mean the fiscal year that began January 31, 2022 and ended January 29, 2023; |
■ | 2022 fiscal year and comparable terminology mean the fiscal year that began February |
|
|
|
|
NOTE 43 – CASUALTY LOSSEXIT AND RESTRUCTURING CHARGES
On May 18, 2018, the Martinsville/Henry County, Va. area experienced torrential rains. NaNWe recorded inventory valuation charges of our Hooker Brands segment warehouse facilities were damaged as a result. No employees were injured$1.8 million, $28.8 million, and the casualty loss caused only a nominal disruption$3.4 million, respectively, in our ability to fulfilleach of fiscal 2024, fiscal 2023, and ship orders. The costs associated with the recovery efforts exceeded our insurance deductible of $500,000. Consequently, we recorded a $500,000 casualty loss during the fiscal 2019 second quarter. We incurred another $409,000 of repair2022 for slow-moving and remediation-related expenses during the third quarter, which was recovered from our casualty insurer duringobsolete inventory. During the fourth quarter of fiscal 2019.2023, we recorded net inventory valuation charges of approximately $24.4 million to write down the value of ACH and PRI inventories and other excess inventories to market, including excess Samuel Lawrence Furniture brand inventories. Management approved a plan to exit the Accentrics Home (ACH) e-commerce brand of the Home Meridian segment along with repositioning the Prime Resources International (PRI) at the end of fiscal 2023. Due to historically high freight costs on these inventories, high handling costs, current demand and industry discounting levels, as well as our current inventory levels, management determined that a viable and profitable market for these products didn’t exist and was unwilling to continue to incur additional lease, warehouse, labor and other costs to store and sell aging inventory below cost. These inventory valuation charges were included as a separate line item below cost of goods sold in the Consolidated Statement of Operations.
NOTE 4 – ACQUISITION
On January 31, 2022, the first day of our 2023 fiscal year, we entered into an Asset Purchase Agreement (the “Asset Purchase Agreement”) with Sunset HWM, LLC (“Sunset West”) and its three members to acquire substantially all the assets of Sunset West (the “Sunset Acquisition”). Simultaneously, we closed on the transaction by paying $23.9 million in cash and $2 million subject to an escrow arrangement and possible earn-out payments to the Sunset West Members up to an aggregate of $4 million with the closing cash consideration subject to adjustment for customary working capital estimates. In the fourth quarter of fiscal 2023, we received $639,000 from the seller for the final working capital adjustments. Under the Asset Purchase Agreement, the Company also assumed specified liabilities of Sunset West.
In accordance with FASB Accounting Standards Codification Topic 805, “Business Combinations” (“ASC 805”), the Sunset Acquisition has been accounted for using the acquisition method of accounting. We recorded assets acquired, including identifiable intangible assets, and liabilities assumed, from Sunset West at their respective fair values at the date of completion of the Sunset Acquisition. The excess of the purchase price over the net fair value of such assets and liabilities was recorded as goodwill.
The following table summarizes the fair values of the identifiable assets acquired and liabilities assumed in the Sunset Acquisition as of January 29, 2023.
Fair Value Estimates of Assets Acquired and Liabilities Assumed
The consideration and components of our initial fair value allocation of the purchase price paid at closing and in the subsequent net working capital adjustment consisted of the following:
Purchase price consideration
Fair value estimates of assets acquired and liabilities assumed | ||||
Purchase price consideration | ||||
Cash paid for assets acquired | $ | 23,909 | ||
Cash received from the seller for final working capital adjustment | (639 | ) | ||
Escrow | 2,003 | |||
Fair value of earnout | 766 | |||
Total purchase price | $ | 26,039 | ||
Accounts receivable | $ | 1,560 | ||
Inventory | 2,577 | |||
Prepaid expenses and other current assets | 90 | |||
Property | 7 | |||
Intangible assets | 11,451 | |||
Goodwill | 14,462 | |||
Customer deposits | (3,276 | ) | ||
Accounts payable | (816 | ) | ||
Accrued expenses | (16 | ) | ||
Total purchase price | $ | 26,039 |
Property was recorded at fair value and primarily consists of machinery and equipment. Property and equipment will be amortized over their estimated useful lives.
Goodwill is calculated as the excess of the purchase price over the net assets acquired. The goodwill recognized is attributable to growth opportunities and expected synergies. All goodwill is expected to be deductible for income tax purposes.
Intangible assets, consist of two separately identified assets:
■ | Sunset West customer relationships, which are definite-lived intangible assets with an aggregate fair value of $10.4 million. The customer relationships are amortizable and will be amortized over a period of 10 years; and |
■ | The Sunset West trade name, which is definite-lived intangible asset with fair value of $1.1 million. The trade name is amortizable and will be amortized over a period of 12 years. |
■ | The total weighted average amortization period for these assets is 10.2 years. |
We incurred Sunset Acquisition-related costs of $414,000 in fiscal 2022 and $69,000 in fiscal 2023. These expenses were recorded as a component of selling and administrative expenses in our fiscal 2022 and fiscal 2023 consolidated statements of operations. Sunset West’s results are included in the Domestic Upholstery segment’s results beginning with the fiscal 2023 first quarter, which include $27 million in net sales and $683,000 of operating income, including $1.1 million in intangible amortization expense for the fiscal 2023.
Results of operations starting from the date of acquisition of Sunset West have been included in our Consolidated Financial Statements for the year ended January 29, 2023. The Sunset West acquisition is not material to our Consolidated Financial Statements, and therefore, supplemental pro forma financial information for the year ended January 29, 2023 and the respective prior year periods related to the acquisition is not included herein.
NOTE 5 – DOUBTFUL ACCOUNTS AND OTHER ACCOUNTS RECEIVABLECUSTOMER ALLOWANCES
The activity in the allowance for doubtful accounts was:
Fifty-Two | Fifty-Two | Fifty-Three | ||||||||||||||||||||||
Weeks Ended | Weeks Ended | Weeks Ended | Fifty-Two Weeks Ended | |||||||||||||||||||||
January 31, | February 2, | February 3, | January 28, | January 29, | January 30, | |||||||||||||||||||
2021 | 2020 | 2019 | 2024 | 2023 | 2022 | |||||||||||||||||||
Balance at beginning of year | $ | 903 | $ | 908 | $ | 1,014 | $ | 1,769 | $ | 2,016 | $ | 2,338 | ||||||||||||
Non-cash charges to cost and expenses | 1,262 | 417 | 158 | (157 | ) | 109 | (76 | ) | ||||||||||||||||
Less uncollectible receivables written off, net of recoveries | 173 | (422 | ) | (264 | ) | |||||||||||||||||||
| Increase / (decrease) in allowance, net of recoveries | 205 | (356 | ) | (246 | ) | |||||||||||||||||||
Balance at end of year | $ | 2,338 | $ | 903 | $ | 908 | $ | 1,817 | $ | 1,769 | $ | 2,016 | ||||||||||||
The activity in other accounts receivablecustomer allowances was:
Fifty-Two | Fifty-Two | Fifty-Three | ||||||||||||||||||||||
Weeks Ended | Weeks Ended | Weeks Ended | Fifty-Two Weeks Ended | |||||||||||||||||||||
January 31, | February 2, | February 3, | January 28, | January 29, | January 30, | |||||||||||||||||||
2021 | 2020 | 2019 | 2024 | 2023 | 2022 | |||||||||||||||||||
Balance at beginning of year | $ | 3,493 | $ | 4,267 | $ | 5,117 | $ | 3,702 | $ | 7,284 | $ | 6,993 | ||||||||||||
Charges to cost and expenses | 29,243 | 31,815 | 41,606 | 8,376 | 11,983 | 23,766 | ||||||||||||||||||
Less allowances applied | (25,666 | ) | (32,511 | ) | (42,342 | ) | (10,541 | ) | (15,364 | ) | (23,305 | ) | ||||||||||||
Less uncollectible receivables written off, net of recoveries | (77 | ) | (78 | ) | (114 | ) | ||||||||||||||||||
| Increase / (decrease) in allowance, net of recoveries | 263 | (201 | ) | (170 | ) | |||||||||||||||||||
Balance at end of year | $ | 6,993 | $ | 3,493 | $ | 4,267 | $ | 1,800 | $ | 3,702 | $ | 7,284 | ||||||||||||
NOTE 6 – ACCOUNTS RECEIVABLE
January 28, | January 29, | |||||||
2024 | 2023 | |||||||
Gross accounts receivable | $ | 54,897 | $ | 67,600 | ||||
Customer allowances | (1,800 | ) | (3,702 | ) | ||||
Allowance for doubtful accounts | (1,817 | ) | (1,769 | ) | ||||
Trade accounts receivable | $ | 51,280 | $ | 62,129 | ||||
January 31, | February 2, | |||||||
2021 | 2020 | |||||||
Trade accounts receivable | $ | 92,621 | $ | 91,261 | ||||
Receivable from factor | 0 | 788 | ||||||
Other accounts receivable allowances | (6,993 | ) | (3,493 | ) | ||||
Allowance for doubtful accounts | (2,338 | ) | (903 | ) | ||||
Accounts receivable | $ | 83,290 | $ | 87,653 | ||||
“Receivable from factor” represented amounts due with respect to factored accounts receivable for a single customer. The agreement was discontinued in early fiscal 2021.
NOTE 7 – INVENTORIES
January 31, | February 2, | January 28, | January 29, | |||||||||||||
2021 | 2020 | 2024 | 2023 | |||||||||||||
Finished furniture | $ | 81,290 | $ | 106,495 | $ | 75,354 | $ | 115,015 | ||||||||
Furniture in process | 1,397 | 1,304 | 1,702 | 1,943 | ||||||||||||
Materials and supplies | 9,639 | 8,479 | 10,538 | 13,509 | ||||||||||||
Inventories at FIFO | 92,326 | 116,278 | 87,594 | 130,467 | ||||||||||||
Reduction to LIFO basis | (22,167 | ) | (23,465 | ) | (25,779 | ) | (33,792 | ) | ||||||||
Inventories | $ | 70,159 | $ | 92,813 | $ | 61,815 | $ | 96,675 | ||||||||
If the first-in, first-out (FIFO) method had been used in valuing all inventories, net loss would have been $11.1 million in fiscal 2021, net income would have been $19.5 million in fiscal 2020 and $41.5 million in fiscal 2019. We recorded LIFO income of $1.3 million in fiscal 2021, LIFO expense of $3.1 million in fiscal 2020 and $2.1 million in fiscal 2019.
At January 31, 202128, 2024 and February 2, 2020,January 29, 2023, we had $355,000$198,000 and $424,000,$2.4 million, respectively, in consigned inventories, which are included in the “Finished furniture” line in the table above.
At January 31, 2021,28, 2024, we held $8.4$4.1 million in inventory outside of the United States, in China and in Vietnam. At February 2, 2020,January 29, 2023, we held $9.6$12.3 million in inventory outside of the United States, in ChinaVietnam and in Vietnam.China.
NOTE 8 – PROPERTY, PLANT AND EQUIPMENT
Depreciable Lives | January 31, | February 2, | Depreciable Lives | January 28, | January 29, | |||||||||||||||||
(In years) | 2021 | 2020 | (In years) | 2024 | 2023 | |||||||||||||||||
Buildings and land improvements | 15 - 30 | $ | 31,316 | $ | 31,316 | 15 - 30 | $ | 33,785 | $ | 32,723 | ||||||||||||
Computer software and hardware | 3 - 10 | 15,012 | 19,166 | 3 - 10 | 8,994 | 15,887 | ||||||||||||||||
Machinery and equipment | 10 | 9,314 | 9,271 | 10 | 11,708 | 11,013 | ||||||||||||||||
Leasehold improvements | Term of lease | 10,005 | 9,737 | Term of lease | 12,436 | 11,894 | ||||||||||||||||
Furniture and fixtures | 3 - 8 | 2,614 | 2,597 | 3 - 8 | 7,256 | 5,991 | ||||||||||||||||
Other | 5 | 651 | 651 | 5 | 698 | 694 | ||||||||||||||||
Total depreciable property at cost | Total depreciable property at cost | 68,912 | 72,738 | 74,877 | 78,202 | |||||||||||||||||
Less accumulated depreciation | 44,098 | 44,089 | (47,700 | ) | (53,427 | ) | ||||||||||||||||
Total depreciable property, net | 24,814 | 28,649 | 27,177 | 24,775 | ||||||||||||||||||
Land | 1,077 | 1,077 | 1,077 | 1,077 | ||||||||||||||||||
Construction-in-progress | 889 | 181 | 888 | 1,158 | ||||||||||||||||||
Property, plant and equipment, net | Property, plant and equipment, net | $ | 26,780 | $ | 29,907 | Property, plant and equipment, net | $ | 29,142 | $ | 27,010 | ||||||||||||
Depreciation expenseexpenses for fiscal 2021, 20202024, 2023, and 2019 was $4.42022 were $4.9 million, $4.7$5.3 million, and $5.0$5.4 million, respectively.
Capitalized Software Costs
Certain costs incurred in connection with developing or obtaining computer software for internal use are capitalized. These costs are amortized over periods of ten years or less. Capitalized software is reported as a component of computer software and hardware above and on the property, plant, and equipment line of our consolidated balance sheets. The activity in capitalized software costs was:
Fifty-Two Weeks | Fifty-Two Weeks | Fifty-Three Weeks | ||||||||||||||||||||||
Ended | Ended | Ended | Fifty-Two Weeks Ended | |||||||||||||||||||||
January 31, | February 2, | February 3, | January 28, | January 29, | January 30, | |||||||||||||||||||
2021 | 2020 | 2019 | 2024 | 2023 | 2022 | |||||||||||||||||||
Balance beginning of year | $ | 4,277 | $ | 5,123 | $ | 5,982 | $ | 1,348 | $ | 2,223 | $ | 3,211 | ||||||||||||
Additions | 33 | 286 | 373 | 33 | - | 65 | ||||||||||||||||||
Amortization expense | (1,099 | ) | (1,132 | ) | (1,227 | ) | (400 | ) | (875 | ) | (1,053 | ) | ||||||||||||
Disposals | 0 | 0 | (5 | ) | (889 | ) | - | - | ||||||||||||||||
Balance end of year | $ | 3,211 | $ | 4,277 | $ | 5,123 | $ | 92 | $ | 1,348 | $ | 2,223 | ||||||||||||
NOTE 9 – CLOUD COMPUTING HOSTING ARRANGEMENT
We are in the process of implementing a common Enterprise Resource Planning (ERP) system across all divisions. The ERP system went live at Sunset West in December 2022 and in the legacy Hooker divisions and for consolidated reporting in early September 2023. We expect the new ERP system to go live in the Home Meridian segment during fiscal 2026. Based on the provisions of ASU 2018-15, Intangibles — Goodwill and Other — Internal-Use Software, we capitalize implementation costs associated with hosting arrangements that are service contracts. These costs are recorded in other noncurrent assets of our consolidated balance sheets. We amortize on a straight-line basis over 10-years term as the system went live at Sunset West and the legacy Hooker divisions. The amortization expenses are recorded as a component of selling and administrative expenses in our consolidated statements of operations. In addition, we recorded capitalized interest as we entered into new term loans in July 2022. Implementation costs of $5.1 million and interest expense of $273,000 were capitalized in fiscal 2024. Implementation costs of $5.4 million and interest expense of $84,000 were capitalized in fiscal 2023. Implementation costs of $3.2 million were capitalized in fiscal 2022. The capitalized implementation costs at January 28, 2024 and January 29, 2023 were as follows:
January 28, 2024 | January 29, 2023 | |||||||||||||||
Gross carrying amount | Accumulated amortization | Gross carrying amount | Accumulated amortization | |||||||||||||
Implementation Costs | 13,736 | (414 | ) | 8,610 | (12 | ) | ||||||||||
Interest Expenses | 357 | (8 | ) | 84 | (0 | ) | ||||||||||
NOTE 910 – INTANGIBLE ASSETS AND GOODWILL
Our goodwill, some trademarks and trade names have indefinite useful lives and, consequently, are not subject to amortization for financial reporting purposes but are tested for impairment annually or more frequently if events or circumstances indicate that the asset might be impaired.
Our non-amortizable intangible assets consist of:
■ | Goodwill |
■ | Trademarks and tradenames related to the acquisitions of Bradington-Young (acquired |
We review goodwill and other intangible assets annually for impairment or more frequently if events or circumstances indicate that it might be impaired.
In accordance with ASU 2017-04, Intangibles—Goodwill and Other (Topic 350): Simplifying the Test for Goodwill Impairment, we perform our annual goodwill impairment test by comparing the fair value of a reporting unit with its carrying amount. Management judgment is a significant factor in the goodwill impairment evaluation process. The computations require management to make estimates and assumptions, the most critical of which are potential future cash flows and the appropriate discount rate.
In conjunction with our evaluation of the cash flows generated by the Home Meridian, Bradington-Young and Sam Moore reporting units, we evaluated the carrying value of trademarks and trade names using the relief from royalty method, which values the trademark/trade name by estimating the savings achieved by ownership of the trademark/trade name when compared to licensing the mark/name from an independent owner. The inputs used in the trademark/trade name analyses are considered Level 3 fair value measurements.
The adverse economic effects brought on by the COVID-19 pandemic, including reductions in our sales, earnings and market value, as well as other changing market dynamics, required that we perform a valuation of our intangible assets in the 2021 first quarter. The calculation methodology for the fair value of our Home Meridian segment’s and the Shenandoah division of our Domestic Upholstery segment’s goodwill included three approaches: the Discounted Cash Flow Method (DCF) which was given the largest weighting, the Guideline Public Company Method (GPCM) based on the consideration of the facts of the Company’s peer competitors and the Guideline Transaction Method (GTM) based on consideration of transactions with varying risk profiles, geographies and market conditions. The income approach, specifically the relief from royalty method, was used as the valuation methodology for our trade names and trademarks, based on cash flow projections and growth rates for each trade name for five years in the future provided by management, and a royalty rate benchmark for companies with similar activities. As a result of our intangible asset valuation analysis, in the first quarter of fiscal 2021, we recorded $44.3 million non-cash impairment charges including $23.2 million to Home Meridian goodwill, $16.4 million to Shenandoah goodwill and $4.8 million to certain of Home Meridian segment’s trade names.
Based on our internal analyses, at January 31, 2021, the fair values of28, 2024, we concluded our non-amortizable trademarks and trade names exceeded their carrying valuesare not impaired and we concluded that Shenandoah, Sunset West and BOBO goodwill in the Domestic Upholstery segment is not impaired.
DetailsDuring fiscal 2024, we recorded $500,000 in trademarks with indefinite lives and $84,000 in goodwill as a result of our non-amortizable intangible assets are as follows:the BOBO acquisition.
January 31, 2021 | February 2, 2020 | ||||||||||||||||||||||||
Non-amortizable Intangible Assets | Segment | Beginning Balance | Impairment Charges | Net Book Value | Beginning Balance | Impairment Charges | Net Book Value | ||||||||||||||||||
Goodwill | Home Meridian | $ | 23,187 | $ | (23,187 | ) | $ | - | $ | 23,187 | $ | - | $ | 23,187 | |||||||||||
Goodwill | Domestic Upholstery | 16,871 | (16,381 | ) | 490 | 16,871 | - | 16,871 | |||||||||||||||||
Total Goodwill | 40,058 | (39,568 | ) | 490 | 40,058 | - | 40,058 | ||||||||||||||||||
Trademarks and trade names - Home Meridian | Home Meridian | 11,400 | (4,750 | ) | 6,650 | 11,400 | 0 | 11,400 | |||||||||||||||||
Trademarks and trade names - Bradington-Young | Domestic Upholstery | 861 | 0 | 861 | 861 | 0 | 861 | ||||||||||||||||||
Trademarks and trade names - Sam Moore | Domestic Upholstery | 396 | 0 | 396 | 396 | 0 | 396 | ||||||||||||||||||
Total Trademarks and trade names | $ | 12,657 | $ | (4,750 | ) | $ | 7,907 | $ | 12,657 | $ | 0 | $ | 12,657 | ||||||||||||
Total non-amortizable assets | $ | 52,715 | $ | (44,318 | ) | $ | 8,397 | $ | 52,715 | $ | 0 | $ | 52,715 | ||||||||||||
Our amortizable intangible assets are recorded in the Home Meridian and in Domestic Upholstery segments. The carrying amountsDuring the fiscal 2024 first quarter, we announced the rebranding of the Sam Moore product line to “HF Custom”. As a result, we reassessed the characteristics of the Sam Moore trade name and changes therein of those amortizable intangible assets were as follows:the roll-out process, and determined it qualified for amortization; consequently, we began amortizing the Sam Moore trade name over a 24-month period using the straight-line method beginning mid-April 2023.
Amortizable Intangible Assets | ||||||||||||
Customer | ||||||||||||
Relationships | Trademarks | Totals | ||||||||||
Balance at February 2, 2020 | $ | 19,996 | $ | 718 | $ | 20,714 | ||||||
Amortization | (2,324 | ) | (60 | ) | (2,384 | ) | ||||||
Balance at January 31, 2021 | $ | 17,672 | $ | 658 | $ | 18,330 | ||||||
Details of our intangible assets were as follows:
January 28, 2024 | January 29, 2023 | |||||||||||||||
Gross carrying amount | Accumulated Amortization | Gross carrying amount | Accumulated Amortization | |||||||||||||
Intangible assets with indefinite lives: | ||||||||||||||||
Goodwill | ||||||||||||||||
Domestic Upholstery - Shenandoah * | 490 | - | 490 | - | ||||||||||||
Domestic Upholstery - Sunset West | 14,462 | - | 14,462 | - | ||||||||||||
All Other - BOBO Intriguing Objects | 84 | - | - | - | ||||||||||||
Goodwill | 15,036 | - | 14,952 | - | ||||||||||||
Trademarks and Trade names * | 8,011 | - | 7,907 | - | ||||||||||||
Intangible assets with definite lives: | ||||||||||||||||
Customer Relations | 38,001 | (18,982 | ) | 38,001 | (15,618 | ) | ||||||||||
Trademarks and Trade names | 2,334 | (741 | ) | 1,938 | (449 | ) | ||||||||||
Intangible assets, net | 48,346 | (19,723 | ) | 47,846 | (16,067 | ) | ||||||||||
*: The amounts are net of impairment charges of $16.4 million related to Shenandoah goodwill and $4.8 million related to certain Home Meridian segment trade names, which were recorded in fiscal 2021.
The estimated amortization expense associated with our amortizable intangible assets is expected to be as follows:
Fiscal Year | Amount | |||
2022 | 2,384 | |||
2023 | 2,384 | |||
2024 | 2,384 | |||
2025 | 2,359 | |||
2026 | 2,359 | |||
2027 and thereafter | 6,460 | |||
| $ | 18,330 | |||
Fiscal Year | Amount | |||
2025 | 3,685 | |||
2026 | 3,528 | |||
2027 | 3,487 | |||
2028 | 2,178 | |||
2029 | 2,178 | |||
2030 and thereafter | 5,555 | |||
| $ | 20,611 | |||
NOTE 1011 – FAIR VALUE MEASUREMENTS
Fair value is the price that would be received upon the sale of an asset or paid upon the transfer of a liability (an exit price) in an orderly transaction between market participants on the applicable measurement date. We use a three-tier fair value hierarchy, which prioritizes the inputs used in measuring fair value. These tiers include:
Level 1, defined as observable inputs such as quoted prices in active markets for identical assets and liabilities;
Level 2, defined as inputs other than quoted prices in active markets that are either directly or indirectly observable; and
Level 3, defined as unobservable inputs for which little or no market data exists, therefore requiring an entity to develop its own assumptions.
As of January 31, 2021,28, 2024 and February 2, 2020,January 29, 2023, Company-owned life insurance was measured at fair value on a recurring basis based on Level 2 inputs. The fair value of the Company-owned life insurance is determined by inputs that are readily available in public markets or can be derived from information available in publicly quoted markets. Additionally, the fair value of the Company-owned life insurance is marked to market each reporting period and any change in fair value is reflected in income for that period.
Our assets measured at fair value on a recurring basis at January 31, 202128, 2024 and February 2, 2020,January 29, 2023 were as followsfollows:
Fair value at January 31, 2021 | Fair value at February 2, 2020 | Fair value at January 28, 2024 | Fair value at January 29, 2023 | |||||||||||||||||||||||||||||||||||||||||||||||||||||||||||||
Description | Level 1 | Level 2 | Level 3 | Total | Level 1 | Level 2 | Level 3 | Total | Level 1 | Level 2 | Level 3 | Total | Level 1 | Level 2 | Level 3 | Total | ||||||||||||||||||||||||||||||||||||||||||||||||
(In thousands) | (In thousands) | |||||||||||||||||||||||||||||||||||||||||||||||||||||||||||||||
Assets measured at fair value | ||||||||||||||||||||||||||||||||||||||||||||||||||||||||||||||||
Company-owned life insurance | $ | 0 | $ | 25,365 | $ | 0 | $ | 25,365 | $ | 0 | $ | 24,888 | $ | 0 | $ | 24,888 | $ | - | $ | 28,528 | $ | - | $ | 28,528 | $ | - | $ | 27,576 | $ | - | $ | 27,576 | ||||||||||||||||||||||||||||||||
NOTE 1112 – LEASES
In fiscal 2020, we adopted Accounting Standards Codification Topic 842 Leases. See “Leases” under Note 1 for a discussion of our accounting policies and elections under Topic 842. We have a sub-lease at one of our warehouses and we recognized $576,000 sub-lease income of $146,000, $445,000, and $890,000 in fiscal 2021.2024, fiscal 2023, and fiscal 2022, respectively.
The components of lease cost and supplemental cash flow information for leases in fiscal 20212024, 2023 and 2022 were:
Fifty-two Weeks Ended | Fifty-two Weeks Ended | |||||||||||||||||||
January 31, 2021 | February 2, 2020 | January 28, 2024 | January 29, 2023 | January 30, 2022 | ||||||||||||||||
Operating lease cost | $ | 8,367 | $ | 8,408 | $ | 10,912 | $ | 9,908 | $ | 8,144 | ||||||||||
Variable lease cost | 146 | 153 | 248 | 234 | 208 | |||||||||||||||
Short-term lease cost | 291 | 581 | 399 | 327 | 117 | |||||||||||||||
Total operating lease cost | $ | 8,804 | $ | 9,142 | $ | 11,559 | $ | 10,469 | $ | 8,469 | ||||||||||
Operating cash outflows | $ | 7,921 | $ | 8,725 | $ | 10,537 | $ | 10,527 | $ | 7,730 | ||||||||||
During the fiscal 2024 second quarter, we reduced our footprint by 200,000 square feet in the Georgia warehouse. During the third quarter, we entered into an agreement to further reduce our footprint by 200,000 square feet by early calendar 2024. These modifications resulted in an approximate $13 million decrease in the lease right-of-use assets and liabilities. The right-of-use assets and lease liabilities recorded on our Consolidated Balance Sheets as of January 31, 202128, 2024 and February 2, 2020January 29, 2023 were:
January 31, 2021 | February 2, 2020 | January 28, 2024 | January 29, 2023 | |||||||||||||
Real estate | $ | 33,651 | $ | 38,175 | $ | 49,968 | $ | 68,212 | ||||||||
Property and equipment | 962 | 1,337 | 833 | 737 | ||||||||||||
Total operating leases right-of-use assets | $ | 34,613 | $ | 39,512 | $ | 50,801 | $ | 68,949 | ||||||||
Current portion of operating lease liabilities | $ | 6,650 | $ | 6,307 | $ | 6,964 | $ | 7,316 | ||||||||
Long term operating lease liabilities | 29,441 | 33,794 | 46,414 | 63,762 | ||||||||||||
Total operating lease liabilities | $ | 36,091 | $ | 40,101 | $ | 53,378 | $ | 71,078 | ||||||||
Weighted-average remaining lease term is 6.7 years. We used our incremental borrowing rate which is LIBOR plus 1.5% at the adoption date. The weighted-average discount rate is 2.25%5.15%. Due to the COVID-19 pandemic, we received concessions on several of our leases, including changes in lease terms and deferred rent payments. We accounted for the concessions as lease modifications and used current LIBOR plus 1.5% for those leases. The weighted-average discount rate decreased due to a decrease in LIBOR.remaining lease term is 7.0 years.
The following table reconciles the undiscounted future lease payments for operating leases to the operating lease liabilities recorded in the consolidated balance sheet at January 31, 2021:28, 2024:
Undiscounted Future Operating Lease Payments | ||||
2022 | $ | 7,364 | ||
2023 | 5,591 | |||
2024 | 5,663 | |||
2025 | 5,280 | |||
2026 | 5,336 | |||
2027 and thereafter | 9,808 | |||
Total lease payments | $ | 39,042 | ||
Less: impact of discounting | (2,951 | ) | ||
Present value of lease payments | $ | 36,091 | ||
As of January 31, 2021, the Company had an additional lease for a warehouse in Georgia that had not yet commenced with estimated future minimum rental commitments of approximately $28 million. This lease is expected to commence in Fall of 2021 with a lease term of up to 10 years. Since the lease has not commenced, the undiscounted amounts are not included in the table above.
Fiscal Year | Undiscounted Future Operating Lease Payments | |||
2025 | $ | 9,530 | ||
2026 | 9,589 | |||
2027 | 9,428 | |||
2028 | 7,803 | |||
2029 | 7,275 | |||
2030 and thereafter | 20,982 | |||
Total lease payments | $ | 64,607 | ||
Less: impact of discounting | (11,229 | ) | ||
Present value of lease payments | $ | 53,378 | ||
NOTE 1213 – LONG-TERM DEBT
We paid off the term loans which were related to the Home Meridian acquisition in fiscal 2021 and currently have a $35 million revolving credit facility. The credit facility was provided for in the amended and restated loan agreement (the “Original Loan Agreement”), whichOn July 26, 2022, we entered into on February 1, 2016the Fourth Amendment to the Second Amended and Restated Loan Agreement (the “Amendment”) with Bank of America, N. A.N.A. (“BofA”) in connection withto replenish cash used to make the Home MeridianSunset Acquisition. We entered aThe Second Amended and Restated Loan Agreement dated as of September 29, 2017, (the “Second Amended and Restated Loan Agreement”),had previously been amended by a First Amendment to Second Amended and Restated Loan Agreement dated as of January 31, 2019, a Second Amendment to Second Amended and Restated Loan Agreement dated as of November 4, 2020, and a Third Amendment to the Second Amended and Restated Loan Agreement dated as of January 27, 2021.2021 (as so amended, the “Existing Loan Agreement”). Details of our revolvingthe individual credit facilityfacilities provided for in the Amendment are outlined below:as follows:
■ |
|
|
|
| then current Bloomberg Short-Term Bank Yield Index (“BSBY”) (adjusted periodically) plus 1.00%. The |
| interest rate will be adjusted on a monthly basis. The actual daily amount of undrawn letters of credit is subject to a quarterly fee equal to a per annum rate of 1% |
■ | 2022 Secured Term Loan. The Amendment provided us with a $18 million term loan (the “Secured Term Loan”), which was disbursed to us on July 26, 2022. We are required to pay monthly interest only payments at a rate per annum equal to the then current BSBY rate (adjusted periodically) plus 0.90% on the outstanding balance until the principal is paid in full. The interest rate will be adjusted on a monthly basis. On July 26, 2027, the entire outstanding indebtedness is due in full, including all principal and interest. The Secured Term Loan is secured by certain company-owned life insurance policies under a Security Agreement (Assignment of Life Insurance Policy as Collateral) dated July 26, 2022, by and between the Company and BofA; and |
■ | 2022 Unsecured Term Loan. The Amendment provided us with a $7 million unsecured term loan (the “Unsecured Term Loan”), which was disbursed to us on July 26, 2022. We are required to pay monthly principal payments of $116,667 and monthly interest payments at a rate per annum equal to the then current BSBY (adjusted periodically) plus 1.40% on the outstanding balance until paid in full. The interest rate will be adjusted monthly. On July 26, 2027, the entire outstanding indebtedness is due in full, including all principal and interest. |
We may prepay any outstanding principal amounts borrowed under either the Secured Term Loan or the Unsecured Term Loan at any time, without penalty provided that any payment is accompanied by all accrued interest owed. As of January 28, 2024, $4.9 million was outstanding under the Unsecured Term Loan, and $18 million was outstanding under the Secured Term Loan.
We incurred $37,500 in debt issuance costs in connection with our term loans. As of January 28, 2024, unamortized loan costs of $26,250 were netted against the carrying value of our term loans on our consolidated balance sheets.
Principal payments on the term loans are as follows. The carrying amount of the term loans approximated their fair value at January 28, 2024. |
|
|
|
Fiscal Year | Amount | |||
2025 | 1,400 | |||
2026 | 1,400 | |||
2027 | 1,400 | |||
2028 | 18,700 | |||
| $ | 22,900 | |||
The loan covenants agreed to under the Second Amended and Restated Loan Agreement continue to apply to us. They includeAmendment also included customary representations and warranties and requires us to comply with customary covenants, including, among other things, the following financial covenants:
● | Maintain a ratio of funded debt to EBITDA not |
o | 2.25:1.0 through July 30, 2024; and |
o | 2.00:1.00 thereafter. |
● | A basic fixed charge coverage ratio of at least 1.25:1.00; and |
● | Limit capital expenditures to no more than $15.0 million during any fiscal year. |
The Second Amended and RestatedExisting Loan Agreement also limits our right to incur other indebtedness, make certain investments and create liens upon our assets, subject to certain exceptions, among other restrictions. They doThe Existing Loan Agreement does not restrict our ability to pay cash dividends on, or repurchase, shares of our common stock, subject to our compliance with the financial covenants discussed above, if we are not otherwise in default under the agreements.Existing Loan Agreement.
We were in compliance with each of these financial covenants at January 31, 2021.28, 2024 and expect to remain in compliance with existing covenants for the foreseeable future.
As of January 31, 2021,28, 2024, we had an aggregate $28.7$28.3 million available under theour $35 million Existing Revolver to fund working capital needs. Standby letters of credit in the aggregate amount of $6.3$6.7 million, used to collateralize certain insurance arrangements and for imported product purchases, were outstanding under the revolving credit facilityExisting Revolver as of January 31, 2021.28, 2024 There were no additional borrowings outstanding under the Existing Revolver as of January 31, 2021.28, 2024.
NOTE 1314 – EMPLOYEE BENEFIT PLANS
Employee Savings Plans
We sponsor a tax-qualified 401(k) retirement plan covering substantially all employees. This plan assists employees in meeting their savings and retirement planning goals through employee salary deferrals and discretionary employer matching contributions. Our contributions to the plan amounted to $1.3$1.8 million in fiscal 2021,2024, $1.5 million in fiscal 2023, and $1.4 million in fiscal 2020, and $1.3 million in fiscal 2019.2022.
We adopted ASU 2017-07 as of the beginning of our 2019 fiscal year on January 29, 2018. Components of net periodic benefit cost other than the service cost for the SRIP, SERP and the Pension Plan are included in the line item “Other income, net” in our consolidated statements of operations. Service cost is included in our consolidated statements of operations under “Selling and administrative expenses.” The adoption resulted in the reclassification of a $30,000 gain from Selling and administrative expenses to Other income, net in fiscal 2018 consolidated statements of operations.
Executive Benefits
Pension, SRIP and SERP Overview
We maintain two “frozen” retirement plans, which are paying benefits and may include active employees among the participants but we do not expect to add participants to these plans in the future. The two plans include:
■ | a supplemental retirement income plan (“SRIP”) for certain former and current executives of Hooker |
■ | the Pulaski Furniture Corporation Supplemental Executive Retirement Plan (“SERP”) for certain former executives. |
In January 2019, we terminated the Pulaski Furniture Corporation Pension Plan (“Pension Plan”) settled all the obligations in fiscal 2020 which was also frozen and had been frozen since we acquired it in the Home Meridian acquisition.
SRIP and SERP
The SRIP provides monthly payments to participants or their designated beneficiaries based on a participant’s “final average monthly earnings” and “specified percentage” participation level as defined in the plan, subject to a vesting schedule that may vary for each participant. The benefit is payable for a 15-year period following the participant’s termination of employment due to retirement, disability or death. In addition, the monthly retirement benefit for each participant, regardless of age, becomes fully vested and the present value of that benefit is paid to each participant in a lump sum upon a change in control of the Company as defined in the plan. The SRIP is unfunded and all benefits are payable solely from our general assets. The plan liability is based on the aggregate actuarial present value of the vested benefits to which participating employees are currently entitled but based on the employees’ expected dates of separation or retirement. No employees have been added to the plan since 2008 and we do not expect to add additional employees in the future, due to changes in our compensation philosophy, which emphasizes more performance-based compensation measures in total management compensation.
The SERP provides monthly payments to 8eight retirees or their designated beneficiaries based on a defined benefit formula as defined in the plan. The benefit is payable for the life of the retiree with the following forms available as a reduced monthly benefit: Ten-year Certain and Life; 50% or 100% Joint and Survivor Annuity. The SERP is unfunded and all benefits are payable solely from our general assets. The plan liability is based on the aggregate actuarial present value of the benefits to which retired employees are currently entitled. No employees have been added to the plan since 2006 and we do not expect to add additional employees in the future.
Summarized SRIP and SERP information as of each fiscal year-end (the measurement date) is as follows:
SRIP (Supplemental Retirement Income Plan) | ||||||||||||||||||||
Fifty-Two | Fifty-Two | |||||||||||||||||||
Weeks Ended | Weeks Ended | SRIP (Supplemental Retirement Income Plan) | ||||||||||||||||||
January 31, | February 2, | January 28, | January 29, | |||||||||||||||||
2021 | 2020 | 2024 | 2023 | |||||||||||||||||
Change in benefit obligation: | ||||||||||||||||||||
Beginning projected benefit obligation | $ | 10,256 | $ | 9,622 | $ | 7,976 | $ | 9,426 | ||||||||||||
Service cost | 128 | 104 | 58 | 126 | ||||||||||||||||
Interest cost | 249 | 351 | 364 | 243 | ||||||||||||||||
Benefits paid | (591 | ) | (537 | ) | (877 | ) | (815 | ) | ||||||||||||
Actuarial loss | 530 | 716 | ||||||||||||||||||
Actuarial (gain)/ loss | (150 | ) | (1,004 | ) | ||||||||||||||||
Ending projected benefit obligation (funded status) | $ | 10,572 | $ | 10,256 | $ | 7,371 | $ | 7,976 | ||||||||||||
Accumulated benefit obligation | $ | 10,421 | $ | 10,131 | $ | 7,209 | $ | 7,783 | ||||||||||||
Discount rate used to value the ending benefit obligations: | 1.75 | % | 2.50 | % | 5.05 | % | 4.85 | % | ||||||||||||
Amount recognized in the consolidated balance sheets: | ||||||||||||||||||||
Current liabilities (Accrued salaries, wages and benefits line) | $ | 877 | $ | 557 | $ | 961 | $ | 877 | ||||||||||||
Non-current liabilities (Deferred compensation line) | 9,695 | 9,699 | 6,410 | 7,099 | ||||||||||||||||
Total | $ | 10,572 | $ | 10,256 | $ | 7,371 | $ | 7,976 | ||||||||||||
Fifty-Two | Fifty-Two | Fifty-Three | ||||||||||||||||||||||
Weeks Ended | Weeks Ended | Weeks Ended | Fifty-Two Weeks Ended | |||||||||||||||||||||
January 31, | February 2, | February 3, | January 28, | January 29, | January 30, | |||||||||||||||||||
2021 | 2020 | 2019 | 2024 | 2023 | 2022 | |||||||||||||||||||
Net periodic benefit cost | ||||||||||||||||||||||||
Service cost | $ | 128 | $ | 104 | $ | 326 | $ | 58 | $ | 126 | $ | 133 | ||||||||||||
Interest cost | 249 | 351 | 341 | 364 | 243 | 178 | ||||||||||||||||||
Net loss | 338 | 149 | 172 | |||||||||||||||||||||
Net (gain)/loss | (279 | ) | 83 | 402 | ||||||||||||||||||||
Net periodic benefit cost | $ | 715 | $ | 604 | $ | 839 | $ | 143 | $ | 452 | $ | 713 | ||||||||||||
Other changes recognized in accumulated other comprehensive income | Other changes recognized in accumulated other comprehensive income | Other changes recognized in accumulated other comprehensive income | ||||||||||||||||||||||
Net loss arising during period | 530 | 716 | 101 | |||||||||||||||||||||
Net (gain) / loss arising during period | (150 | ) | (1,004 | ) | (553 | ) | ||||||||||||||||||
Amortizations: | ||||||||||||||||||||||||
Loss | (338 | ) | (149 | ) | (172 | ) | ||||||||||||||||||
Total recognized in other comprehensive loss (income) | 192 | 567 | (71 | ) | ||||||||||||||||||||
Gain (loss) | 279 | (83 | ) | (402 | ) | |||||||||||||||||||
Total recognized in other comprehensive income | 129 | (1,087 | ) | (955 | ) | |||||||||||||||||||
Total recognized in net periodic benefit cost and accumulated other comprehensive income | $ | 907 | $ | 1,171 | $ | 768 | $ | 272 | $ | (635 | ) | $ | (242 | ) | ||||||||||
Assumptions used to determine net periodic benefit cost: | ||||||||||||||||||||||||
Discount rate | 2.50 | % | 3.75 | % | 3.75 | % | 4.85 | % | 2.70 | % | 1.75 | % | ||||||||||||
Increase in future compensation levels | 4.00 | % | 4.00 | % | 4.00 | % | 4.00 | % | 4.00 | % | 4.00 | % | ||||||||||||
Estimated Future Benefit Payments: | ||||||||||||
Fiscal 2022 | $ | 877 | ||||||||||
Fiscal 2023 | 877 | |||||||||||
Fiscal 2024 | 958 | |||||||||||
Fiscal 2025 | 958 | |||||||||||
Fiscal 2026 | 958 | |||||||||||
Fiscal 2027 through fiscal 2031 | 4,066 |
Estimated Future Benefit Payments: | ||||
Fiscal 2025 | $ | 961 | ||
Fiscal 2026 | 961 | |||
Fiscal 2027 | 788 | |||
Fiscal 2028 | 813 | |||
Fiscal 2029 | 830 | |||
Fiscal 2030 through fiscal 2034 | 3,668 |
For the SRIP, the discount rate used to determine the fiscal 20212024 net periodic cost was 2.5%4.85%, based on the Mercer yield curve and the plan’s expected benefit payments. At January 31, 2021,28, 2024, combining the Mercer yield curve and the plan's expected benefit payments resulted in a rate of 1.75%5.05%. This rate was used to value the ending benefit obligations.
At January 31, 2021,28, 2024, the actuarial lossesgain related to the SRIP amounted to $530,000,$150,000, net of tax of $338,000.$41,000. At February 2, 2020,January 29, 2023, the actuarial lossesgain related to the SRIP amounted to $716,000,$1 million, net of tax of $149,000.$288,000. The estimated actuarial lossgain that will be amortized from accumulated other comprehensive income into net periodic benefit cost over the 20222025 fiscal year is $401,622.$236,188. There is no expected prior service (cost) or credit amortization.
SERP (Supplemental Executive Retirement Plan) | ||||||||
January 28, | January 29, | |||||||
2024 | 2023 | |||||||
Change in benefit obligation: | ||||||||
Beginning projected benefit obligation | $ | 1,295 | $ | 1,531 | ||||
Service cost | - | - | ||||||
Interest cost | 57 | 41 | ||||||
Benefits paid | (157 | ) | (158 | ) | ||||
Actuarial (gain)/loss | 29 | (119 | ) | |||||
Ending projected benefit obligation (funded status) | $ | 1,224 | $ | 1,295 | ||||
Accumulated benefit obligation | $ | 1,224 | $ | 1,295 | ||||
Discount rate used to value the ending benefit obligations: | 4.90 | % | 4.70 | % | ||||
Amount recognized in the consolidated balance sheets: | ||||||||
Current liabilities (Accrued salaries, wages and benefits line) | $ | 155 | $ | 155 | ||||
Non-current liabilities (Deferred compensation line) | 1,069 | 1,140 | ||||||
Total | $ | 1,224 | $ | 1,295 | ||||
SERP (Supplemental Executive Retirement Plan) | ||||||||||||
Fifty-Two | Fifty-Two | |||||||||||
Weeks Ended | Weeks Ended | |||||||||||
January 31, | February 2, | |||||||||||
2021 | 2020 | |||||||||||
Change in benefit obligation: | ||||||||||||
Beginning projected benefit obligation | $ | 1,860 | $ | 1,805 | ||||||||
Service cost | 0 | 0 | ||||||||||
Interest cost | 46 | 67 | ||||||||||
Benefits paid | (158 | ) | (180 | ) | ||||||||
Actuarial (gain)/loss | (67 | ) | 168 | |||||||||
Ending projected benefit obligation (funded status) | $ | 1,681 | $ | 1,860 | ||||||||
Accumulated benefit obligation | $ | 1,681 | $ | 1,860 | ||||||||
Discount rate used to value the ending benefit obligations: | 2.10 | % | 2.60 | % | ||||||||
Amount recognized in the consolidated balance sheets: | ||||||||||||
Current liabilities (Accrued salaries, wages and benefits line) | $ | 156 | $ | 172 | ||||||||
Non-current liabilities (Deferred compensation line) | 1,525 | 1,688 | ||||||||||
Total | $ | 1,681 | $ | 1,860 | ||||||||
Fifty-Two Weeks Ended | ||||||||||||
January 28, | January 29, | January 30, | ||||||||||
2024 | 2023 | 2022 | ||||||||||
Net periodic benefit cost | ||||||||||||
Service cost | $ | - | $ | - | $ | - | ||||||
Interest cost | 57 | 41 | 34 | |||||||||
Net gain | (15 | ) | (2 | ) | ||||||||
Net periodic benefit cost | $ | 42 | $ | 39 | $ | 34 | ||||||
Other changes recognized in accumulated other comprehensive income | ||||||||||||
Net (gain)/loss arising during period | 29 | (119 | ) | (39 | ) | |||||||
Amortizations: | ||||||||||||
Gain (Loss) | 15 | 2 | - | |||||||||
Total recognized in other comprehensive income | 44 | (117 | ) | (39 | ) | |||||||
Total recognized in net periodic benefit cost and accumulated other comprehensive income | $ | 86 | $ | (78 | ) | $ | (5 | ) | ||||
Assumptions used to determine net periodic benefit cost: | ||||||||||||
Discount rate | 4.70 | % | 2.80 | % | 2.10 | % | ||||||
Increase in future compensation levels | N/A | N/A | N/A | |||||||||
Fifty-Two | Fifty-Two | Fifty-Three | ||||||||||
Weeks Ended | Weeks Ended | Weeks Ended | ||||||||||
January 31, | February 2, | February 3, | ||||||||||
2021 | 2020 | 2019 | ||||||||||
Net periodic benefit cost | ||||||||||||
Service cost | $ | 0 | $ | 0 | $ | 0 | ||||||
Interest cost | 46 | 67 | 70 | |||||||||
Net gain | 0 | (5 | ) | 0 | ||||||||
Net periodic benefit cost | $ | 46 | $ | 62 | $ | 70 | ||||||
Other changes recognized in accumulated other comprehensive income | ||||||||||||
Net (gain)/loss arising during period | (67 | ) | 168 | (88 | ) | |||||||
Amortizations: | ||||||||||||
Gain (Loss) | 0 | 5 | 0 | |||||||||
Total recognized in other comprehensive loss (income) | (67 | ) | 173 | (88 | ) | |||||||
Total recognized in net periodic benefit cost and | ||||||||||||
accumulated other comprehensive income | $ | (21 | ) | $ | 235 | $ | (18 | ) | ||||
Assumptions used to determine net periodic benefit cost: | ||||||||||||
Discount rate | 2.60 | % | 3.90 | % | 3.64 | % | ||||||
Increase in future compensation levels | N/A | N/A | N/A | |||||||||
Estimated Future Benefit Payments: | ||||||||||||
Fiscal 2022 | $ | 156 | ||||||||||
Fiscal 2023 | 151 | |||||||||||
Fiscal 2024 | 146 | |||||||||||
Fiscal 2025 | 141 | |||||||||||
Fiscal 2026 | 135 | |||||||||||
Fiscal 2027 through fiscal 2031 | 573 |
Estimated Future Benefit Payments: | ||||
Fiscal 2025 | $ | 155 | ||
Fiscal 2026 | 149 | |||
Fiscal 2027 | 142 | |||
Fiscal 2028 | 135 | |||
Fiscal 2029 | 127 | |||
Fiscal 2030 through fiscal 2034 | 504 |
For the SERP, the discount rate assumption used to measure the projected benefit obligations is set by reference to a certain hypothetical AA-rated corporate bond spot-rate yield curve constructed by our actuary, Aon (“Aon”). This yield curve was constructed from and the underlying bond price and yield data collected as of the Plan’s measurement date and is represented by a series of annualized, individual discount rates with durations ranging from six months to seventy-five years. Aon then applies the spot rates of the yield curveplan’s projected cash flows, rounded to the actuarially projected cash flow patterns to derive the appropriate single effective discount rate. At February 2, 2020, the plan used 2.60% based on rounding the Aon AA Above Median yield curve as of January 31, 2019. This rate was used to determine the fiscal 2021 net periodic cost.nearest 10 bps. At January 31, 2021,28, 2024, combining the Aon AA Above Median yield curve and the plan's expected benefit payments created a rate of 2.10%4.90%. This rate was used to value the ending benefit obligations. At January 29, 2023, combining the Aon AA Above Median yield curve and the plan's expected benefit payments created a rate of 4.70%. This rate was used to determine the fiscal 2024 net periodic cost. The change in the discount rate from 4.70% to 4.90% decreased liabilities.
At January 31, 2021,28, 2024, the actuarial loss related to the SERP was $29,000. At January 29, 2023, the actuarial gain related to the SERP was $67,000. At February 2, 2020, the actuarial loss related to the SERP was $168,000. The estimated net transition (asset)/obligation, prior service (cost) credit and actuarial loss that will be amortized from accumulated other comprehensive income into net periodic benefit cost over fiscal 2020 are immaterial.$119,000.
The Pension Plan
On January 30, 2019, our Board of Directors voted to terminate the Pension Plan. We settled all Pension Plan obligations during the third quarter of fiscal 2020 with the purchase of nonparticipating annuity contracts for plan participants.
Summarized Pension Plan information as of February 2, 2020 is as follows:
Pulaski Furniture Pension Plan | ||||||||
Fifty-Two | ||||||||
Weeks Ended | ||||||||
February 2, | ||||||||
2020 | ||||||||
Change in benefit obligation: | ||||||||
Beginning projected benefit obligation | $ | 10,906 | ||||||
Acquisition | ||||||||
Service cost | 0 | |||||||
Interest cost | 303 | |||||||
Benefits paid | (522 | ) | ||||||
Settlement | (12,557 | ) | ||||||
Actuarial loss | 1,870 | |||||||
Ending projected benefit obligation | $ | 0 | ||||||
Change in Plan Assets: | ||||||||
Beginning fair value of plan assets | $ | 10,992 | ||||||
Actual return on plan assets | 1,960 | |||||||
Employer contributions | 344 | |||||||
Actual expenses paid | (217 | ) | ||||||
Settlement | (12,557 | ) | ||||||
Actual benefits paid | (522 | ) | ||||||
Ending fair value of plan assets | $ | 0 | ||||||
Funded Status of the Plan | $ | 0 | ||||||
Discount rate used to value the ending benefit obligations: | N/A | |||||||
Amount recognized in the consolidated balance sheets: | ||||||||
Current liabilities (Accrued salaries, wages and benefits line) | $ | 0 | ||||||
Non-current liabilities (Deferred compensation line) | 0 | |||||||
Net Asset/(Liability) | $ | 0 | ||||||
Fifty-Two | Fifty-Three | |||||||
Weeks Ended | Weeks Ended | |||||||
February 2, | February 3, | |||||||
2020 | 2019 | |||||||
Net periodic benefit cost | ||||||||
Expected administrative expenses | $ | 105 | $ | 280 | ||||
Interest cost | 303 | 415 | ||||||
Net gain | (305 | ) | (575 | ) | ||||
Net periodic benefit cost | $ | 103 | $ | 120 | ||||
Settlement/Curtailment Income | (193 | ) | ||||||
Total net periodic benefit cost (Income) | $ | (90 | ) | $ | 120 | |||
Other changes recognized in other comprehensive income | ||||||||
Net (gain) loss arising during period | 327 | 464 | ||||||
Amortization: | ||||||||
Gain | 193 | 0 | ||||||
Total recognized in other comprehensive (income) loss | 520 | 464 | ||||||
Total recognized in net periodic benefit cost and accumulated other comprehensive income | $ | 430 | $ | 584 | ||||
Assumptions used to determine net periodic benefit cost: | ||||||||
Discount rate | 3.8 | % | 3.82 | % | ||||
Increase in future compensation levels | N/A | N/A | ||||||
NOTE 1415 – SHARE-BASED COMPENSATION
Our Stock Incentive Plan permits incentive awards of restricted stock, restricted stock units, stock appreciation rights and performance grants to key employees. A maximum of 750,000 shares of the Company’s common stock is authorized for issuance under the Stock Incentive Plan. The Stock Incentive Plan also provides for annual restricted stock awards to non-employee directors. We have issued restricted stock awards to our non-employee directors since January 2006 and certain other management employees since 2014.
We account for restricted stock awards as “non-vested equity shares” until the awards vest or are forfeited. Restricted stock awards to non-employee directors and certain other management employees vest if the director/employee remains on the board/employed through the specified vesting period for shares and may vest earlier upon certain events specified in the plan. For shares issued to non-employee directors during fiscal 2016 and after, there is a 12-month service period. The fair value of each share of restricted stock is the market price of our common shares on the grant date. The weighted average grant-date fair values of unvested restricted stock awards issued during fiscal 20212024 were $13.92, $19.20$18.73, $15.10, $17.65 and $29.34,$21.22, during fiscal 20202023 were $29.77, $29.21$22.19 and $19.87,$18.26, and during fiscal 2019 were $37.83 and $46.88, respectively.2022 was $37.20.
The restricted stock awards outstanding as of January 31, 202128, 2024 had an aggregate grant-date fair value of $1.3$3.6 million, after taking vested and forfeited restricted shares into account. As of January 31, 2021,28, 2024, we have recognized non-cash compensation expense of approximately $796,000$1.9 million related to these non-vested awards and $2.5 million for awards that have vested.awards. During fiscal 2024, 45,339 shares vested with an average grant date fair value of $714,000. The remaining $473,000$1.7 million of grant-date fair value for unvested restricted stock awards outstanding at January 31, 202128, 2024 will be recognized over the remaining vesting periods for these awards. The number of outstanding restricted shares increased due primarily to grants of restricted shares to a larger population of our non-executive employees as an incentive for retention and alignment of individual performance to our values.
For each restricted stock issuance, the following table summarizes restricted stock activity, including the weighted average issue price of those shares on the grant date, the fair value of each grant of restricted stock on the grant date, compensation expense recognized for the unvested shares of restricted stock for each grant and the remaining fair value of the unvested shares of restricted stock for each grant as of January 31, 2021:28, 2024:
Whole | Grant-Date | Aggregate | Compensation | Grant-Date Fair Value | ||||||||||||||||
Number of | Fair Value | Grant-Date | Expense | Unrecognized At | ||||||||||||||||
Shares | Per Share | Fair Value | Recognized | January 31, 2021 | ||||||||||||||||
Previous Awards (vested) | $ | 2,487 | ||||||||||||||||||
Restricted shares Issued on May 7, 2018 | 7,972 | $ | 37.83 | $ | 301 | $ | 245 | $ | 22 | |||||||||||
Forfeited | (886 | ) | (34 | ) | ||||||||||||||||
Restricted shares Issued on April 17, 2019 | 15,239 | 29.97 | 454 | 239 | 153 | |||||||||||||||
Forfeited | (2,058 | ) | (62 | ) | ||||||||||||||||
Restricted shares Issued on May 8, 2019 | 1,027 | 29.21 | 30 | 17 | 13 | |||||||||||||||
Restricted shares Issued on April 7, 2020 | 17,399 | 13.92 | 242 | 52 | 138 | |||||||||||||||
Forfeited | (3,718 | ) | (52 | ) | ||||||||||||||||
Restricted shares Issued on June 16, 2020 | 18,750 | 19.20 | 360 | 240 | 120 | |||||||||||||||
Restricted shares Issued on October 19, 2020 | 1,022 | 29.34 | 30 | 3 | 27 | |||||||||||||||
Awards outstanding at January 31, 2021: | 54,747 | $ | 1,269 | $ | 796 | $ | 473 | |||||||||||||
Whole | Grant-Date | Aggregate | Compensation | Grant-Date Fair Value | ||||||||||||||||
Number of | Fair Value | Grant-Date | Expense | Unrecognized At | ||||||||||||||||
Shares | Per Share | Fair Value | Recognized | January 28, 2024 | ||||||||||||||||
Restricted shares Issued on April 8, 2021 | 16,613 | $ | 37.20 | $ | 618 | $ | 317 | $ | 19 | |||||||||||
Forfeited | (7,576 | ) | (282 | ) | ||||||||||||||||
Restricted shares Issued on January 31, 2022 | 22,534 | 22.19 | 500 | 260 | 130 | |||||||||||||||
Forfeited | (4,958 | ) | (110 | ) | ||||||||||||||||
Restricted shares Issued on April 11, 2022 | 64,518 | 18.26 | 1,178 | 636 | 405 | |||||||||||||||
Forfeited | (7,524 | ) | (137 | ) | ||||||||||||||||
Restricted shares Issued on April 10, 2023 | 67,537 | 18.73 | 1,265 | 351 | 914 | |||||||||||||||
Restricted shares Issued on May 5, 2023 | 3,311 | 15.10 | 50 | 12 | 37 | |||||||||||||||
Restricted shares Issued on June 9, 2023 | 23,796 | 17.65 | 420 | 280 | 140 | |||||||||||||||
Restricted shares Issued on July 24, 2023 | 3,534 | 21.22 | 75 | 15 | 60 | |||||||||||||||
Awards outstanding at January 28, 2024: | 181,785 | $ | 3,577 | $ | 1,872 | $ | 1,705 | |||||||||||||
We have awarded time-based restricted stock units to certain senior executives since 2011. Each restricted stock unit, or “RSU”, entitles the executive to receive one share of the Company’s common stock if he remains continuously employed with the Company through the end of a three-year service period. The RSUs may be paid in shares of the Company’s common stock, cash or both, at the discretion of the Compensation Committee. The RSUs are accounted for as “non-vested stock grants.” Similar to the restricted stock grants issued to our non-employee directors, RSU compensation expense is recognized ratably over the applicable service period. However, unlike restricted stock grants, no shares are issued, or other payment made, until the end of the applicable service period (commonly referred to as “cliff vesting”) and grantees are not entitled to receive dividends on their RSUs during that time. The fair value of each RSU is the market price of a share of our common stock on the grant date, reduced by the present value of the dividends expected to be paid on a share of our common stock during the applicable service period, discounted at the appropriate risk-free rate.
The following table presents RSU activities for the year ended January 31, 2021:28, 2024:
Whole | Grant-Date | Aggregate | Compensation | Grant-Date Fair Value | ||||||||||||||||
Number of | Fair Value | Grant-Date | Expense | Unrecognized At | ||||||||||||||||
Units | Per Unit | Fair Value | Recognized | January 31, 2021 | ||||||||||||||||
Previous Awards (vested) | ||||||||||||||||||||
| �� | ||||||||||||||||||||
RSUs Awarded on June 4, 2018 | 6,032 | $ | 35.89 | 216 | 170 | 12 | ||||||||||||||
Forfeited | (968 | ) | (35 | ) | ||||||||||||||||
RSUs Awarded on April 17, 2019 | 10,196 | $ | 28.01 | 286 | 122 | 86 | ||||||||||||||
Forfeited | (2,771 | ) | (78 | ) | ||||||||||||||||
RSUs Awarded on April 7, 2020 | 17,672 | $ | 12.01 | 212 | 44 | 116 | ||||||||||||||
Forfeited | (4,310 | ) | (52 | ) | ||||||||||||||||
Awards outstanding at January 31, 2021: | 25,851 | $ | 550 | $ | 336 | $ | 214 | |||||||||||||
Whole | Grant-Date | Aggregate | Compensation | Grant-Date Fair Value | ||||||||||||||||
Number of | Fair Value | Grant-Date | Expense | Unrecognized At | ||||||||||||||||
Units | Per Unit | Fair Value | Recognized | January 28, 2024 | ||||||||||||||||
RSUs Awarded on April 8, 2021 | 8,186 | $ | 35.05 | $ | 287 | $ | 209 | $ | 12 | |||||||||||
Forfeited | (1,882 | ) | (66 | ) | ||||||||||||||||
RSUs for retention Awarded on April 8, 2021 | 4,865 | 35.05 | 171 | 108 | 6 | |||||||||||||||
Forfeited | (1,613 | ) | (57 | ) | ||||||||||||||||
RSUs Awarded on April 11, 2022 | 19,157 | 15.86 | 304 | 186 | 118 | |||||||||||||||
RSUs Awarded on April 10, 2023 | 18,676 | 16.19 | 302 | 84 | 218 | |||||||||||||||
Awards outstanding at January 28, 2024: | 47,389 | $ | 941 | $ | 586 | $ | 355 | |||||||||||||
We have issued Performance-based Restricted Stock Units (“PSUs”) to our named executive officers since fiscal 2019 under the Company’s Stock Incentive Plan. Each PSU entitles the executive officer to receive one share of our common stock based on the achievement of two specified performance conditions if the executive officer remains continuously employed through the end of the three-year performance period. One target is based on our annual average growth in our EPS over the performance period and the other target is based on EPS growth over the performance period compared to our peers. The payout or settlement of the PSUs will be made in shares of our common stock. PSUs awarded in fiscal 2022 were forfeited as the performance targets were not met. The following table presents PSU activities for the year ended January 28, 2024:
Whole | Grant-Date | Aggregate | Compensation | Grant-Date Fair Value | ||||||||||||||||
Number of | Fair Value | Grant-Date | Expense | Unrecognized At | ||||||||||||||||
Units | Per Unit | Fair Value | Recognized | January 31, 2021 | ||||||||||||||||
PSUs Awarded on June 4, 2018 | 21,606 | $ | 35.86 | 775 | 749 | - | ||||||||||||||
Forfeited | (711 | ) | (25 | ) | ||||||||||||||||
PSUs Awarded on April 17, 2019 | 36,412 | $ | 29.77 | 1,084 | 723 | 281 | ||||||||||||||
Forfeited | (2,701 | ) | (80 | ) | ||||||||||||||||
PSUs Awarded on April 7, 2020 | 69,075 | $ | 13.92 | 962 | 281 | 561 | ||||||||||||||
Forfeited | (8,621 | ) | (120 | ) | ||||||||||||||||
Awards outstanding at January 31, 2021: | 115,060 | $ | 2,594 | $ | 1,752 | $ | 842 | |||||||||||||
Whole | Grant-Date | Aggregate | Compensation | Grant-Date Fair Value | ||||||||||||||||
Number of | Fair Value | Grant-Date | Expense | Unrecognized At | ||||||||||||||||
Units | Per Unit | Fair Value | Recognized | January 28, 2024 | ||||||||||||||||
PSUs Awarded on April 11, 2022 | 46,725 | $ | 18.26 | $ | 853 | $ | 569 | $ | 284 | |||||||||||
PSUs Awarded on April 10, 2023 | 45,552 | 18.73 | 853 | 284 | 569 | |||||||||||||||
Awards outstanding at January 28, 2024: | 92,277 | $ | 1,706 | $ | 853 | $ | 853 | |||||||||||||
NOTE 1516 – EARNINGS PER SHARE
We refer you to the Earnings Per Share disclosure in Note 2-Summary of Significant Accounting Policies, above, for more detailed information concerning the calculation of earnings per share.
All stock awards are designed to encourage retention and to provide an incentive for increasing shareholder value. We have issued restricted stock awards to non-employee members of the board of directors since 2006 and to certain non-executive employees since 2014. We have issued restricted stock units (“RSUs”) to certain senior executives since fiscal 2012 under the Company’s Stock Incentive Plan. Each RSU entitles an executive to receive one share of the Company’s common stock if the executive remains continuously employed with the Company through the end of a three-year service period. The RSUs may be paid in shares of our common stock, cash or both at the discretion of the Compensation Committee of our board of directors. We have issued Performance-based Restricted Stock Units (“PSUs”) to certain senior executives since fiscal 2019 under the Company’s Stock Incentive Plan. Each PSU entitles the executive officer to receive one share of our common stock based on the achievement of two specified performance conditions if the executive officer remains continuously employed through the end of the three-year performance period. One target is based on our annual average growth in our EPS over the performance period and the other target is based on EPS growth over the performance period compared to our peers. The payout or settlement of the PSUs will be made in shares of our common stock.
We expect to continue to grant these types of awards annually in the future. The following table sets forth the number of outstanding restricted stock awards and RSUs and PSUs, net of forfeitures and vested shares, as of the fiscal period-end dates indicated:
January 31, | February 2, | February 3, | January 28, | January 29, | January 30, | |||||||||||||||||||
2021 | 2020 | 2019 | 2024 | 2023 | 2022 | |||||||||||||||||||
Restricted shares | 54,747 | 45,946 | 22,070 | 181,785 | 132,304 | 59,500 | ||||||||||||||||||
RSUs and PSUs | 140,911 | 73,060 | 14,189 | 139,666 | 100,969 | 77,841 | ||||||||||||||||||
| 195,658 | 119,006 | 36,259 | 321,451 | 233,273 | 137,341 | |||||||||||||||||||
All restricted shares, RSUs and PSUs awarded that have not yet vested are considered when computing diluted earnings per share.
During fiscal 2024, we purchased and retired 620,634 shares of our common stock (at an average price of $18.79 per share) under the $20 million share repurchase authorization approved by our board of directors in fiscal 2023 and the additional $5 million share repurchase authorization approved by our board of directors in the second quarter of this year. These repurchases reduced our total outstanding shares and, consequently, reduced the weighted outstanding shares used in our calculation of earnings per share for fiscal 2024 shown below. The share repurchase program was completed during the fiscal 2024 third quarter.
The following table sets forth the computation of basic and diluted earnings per share:
Fifty-Two | Fifty-Two | Fifty-Three | ||||||||||
Weeks Ended | Weeks Ended | Weeks Ended | ||||||||||
January 31, | February 2, | February 3, | ||||||||||
2021 | 2020 | 2019 | ||||||||||
Net (loss)/income | $ | (10,426 | ) | $ | 17,083 | $ | 39,873 | |||||
Less: Dividends on unvested restricted shares | 36 | 25 | 11 | |||||||||
Net earnings allocated to unvested restricted stock | 0 | 60 | 68 | |||||||||
Earnings available for common shareholders | $ | (10,462 | ) | $ | 16,998 | $ | 39,794 | |||||
Weighted average shares outstanding for basic earnings per share | 11,822 | 11,784 | 11,759 | |||||||||
Dilutive effect of unvested restricted stock awards | * | 54 | 24 | |||||||||
Weighted average shares outstanding for diluted earnings per share | 11,822 | 11,838 | 11,783 | |||||||||
Basic (loss)/earnings per share | $ | (0.88 | ) | $ | 1.44 | $ | 3.38 | |||||
Diluted (loss)/earnings per share | $ | (0.88 | ) | $ | 1.44 | $ | 3.38 | |||||
Fifty-Two Weeks Ended | ||||||||||||
January 28, | January 29, | January 30, | ||||||||||
2024 | 2023 | 2022 | ||||||||||
Net income/(loss) | $ | 9,865 | $ | (4,312 | ) | $ | 11,718 | |||||
Less: Dividends on unvested restricted shares | 153 | 103 | 46 | |||||||||
Net earnings allocated to unvested restricted stock | 156 | - | 61 | |||||||||
Earnings available for common shareholders | $ | 9,556 | $ | (4,415 | ) | $ | 11,611 | |||||
Weighted average shares outstanding for basic earnings per share | 10,684 | 11,593 | 11,852 | |||||||||
Dilutive effect of unvested restricted stock awards | 154 | * | 118 | |||||||||
Weighted average shares outstanding for diluted earnings per share | 10,838 | 11,593 | 11,970 | |||||||||
Basic earnings/(loss) per share | $ | 0.91 | $ | (0.37 | ) | $ | 0.99 | |||||
Diluted earnings/(loss) per share | $ | 0.91 | $ | (0.37 | ) | $ | 0.97 | |||||
*Due to the fiscal 2021 net loss in fiscal 2023, approximately 119,000117,000 shares would have been antidilutive and are therefore excluded from the calculation of earnings per share. share, respectively.
NOTE 1617 – INCOME TAXES
Our provision for income taxes was as follows for the periods indicated:
Fifty-Two | Fifty-Two | Fifty-Three | ||||||||||||||||||||||
Weeks Ended | Weeks Ended | Weeks Ended | Fifty-Two Weeks Ended | |||||||||||||||||||||
January 31, | February 2, | February 3, | January 28, | January 29, | January 30, | |||||||||||||||||||
2021 | 2020 | 2019 | 2024 | 2023 | 2022 | |||||||||||||||||||
Current expense | ||||||||||||||||||||||||
Federal | $ | 5,858 | $ | 2,312 | $ | 10,537 | $ | 6 | $ | 1,024 | $ | 650 | ||||||||||||
Foreign | 108 | 255 | 118 | 47 | 75 | 107 | ||||||||||||||||||
State | 1,154 | 334 | 2,247 | - | 223 | 307 | ||||||||||||||||||
Total current expense | 7,120 | 2,901 | 12,902 | 53 | 1,322 | 1,064 | ||||||||||||||||||
Deferred taxes | ||||||||||||||||||||||||
Federal | (9,554 | ) | 1,645 | (963 | ) | 2,227 | (2,617 | ) | 1,980 | |||||||||||||||
State | (1,708 | ) | 298 | (222 | ) | 293 | (542 | ) | 344 | |||||||||||||||
Total deferred taxes | (11,262 | ) | 1,943 | (1,185 | ) | 2,520 | (3,159 | ) | 2,324 | |||||||||||||||
Income tax (benefit)/expense | $ | (4,142 | ) | $ | 4,844 | $ | 11,717 | $ | 2,573 | $ | (1,837 | ) | $ | 3,388 | ||||||||||
Total tax expense for fiscal 2024 was $2.6 million, of which $2.6 million expense was allocated to continuing operations and $41,000 tax benefit was allocated to other comprehensive income. Total tax benefit for fiscal 20212023 was $4.2$1.5 million, of which $4.1$1.8 million benefit was allocated to continuing operations and $ 30,000$288,000 tax benefitexpense was allocated to other comprehensive income. Total tax expense for fiscal 20202022 was $4.5$3.6 million, of which $4.8$3.4 million expense was allocated to continuing operations and $ 300,000$237,000 tax benefit was allocated to other comprehensive income. Total tax expense for fiscal 2019 was $11.6 million, of which $11.7 million expense was allocated to continuing operations and $73,000 tax benefit was allocated to other comprehensive income.
The effective income tax rate differed from the federal statutory tax rate as follows for the periods indicated:
Fiftty-Two | Fiftty-Two | Fiftty-Three | ||||||||||||||||||||||
Weeks Ended | Weeks Ended | Weeks Ended | Fifty-Two Weeks Ended | |||||||||||||||||||||
January 31, | February 2, | February 3, | January 28, | January 29, | January 30, | |||||||||||||||||||
2021 | 2020 | 2019 | 2024 | 2023 | 2022 | |||||||||||||||||||
Income taxes at statutory rate | 21.0 | % | 21.0 | % | 21.0 | % | 21.0 | % | 21.0 | % | 21.0 | % | ||||||||||||
Increase (decrease) in tax rate resulting from: | ||||||||||||||||||||||||
State taxes, net of federal benefit | 3.0 | 2.4 | 3.2 | 1.9 | 4.1 | 3.4 | ||||||||||||||||||
Officer's life insurance | 1.7 | -1.1 | -0.7 | -1.7 | 4.0 | -1.3 | ||||||||||||||||||
Consolidated Appropriation Act provisions | 1.8 | 0.0 | 0.0 | |||||||||||||||||||||
Expiration of capital loss | 0.0 | 0.0 | 2.0 | |||||||||||||||||||||
Change in valuation allowance | 0.1 | -0.2 | -1.9 | |||||||||||||||||||||
Other | 0.9 | -0.2 | -0.8 | -0.6 | 1.0 | -0.8 | ||||||||||||||||||
Effective income tax rate | 28.4 | % | 22.1 | % | 22.7 | % | 20.7 | % | 29.9 | % | 22.4 | % | ||||||||||||
The tax effects of temporary differences that give rise to significant portions of the deferred tax assets and liabilities for the period indicated were:
January 31, | February 2, | January 28, | January 29, | |||||||||||||
2021 | 2020 | 2024 | 2023 | |||||||||||||
Assets | ||||||||||||||||
Intangible assets | $ | 8,057 | $ | 0 | $ | 5,590 | $ | 6,409 | ||||||||
Inventories | - | 3,618 | ||||||||||||||
Deferred compensation | 2,765 | 2,673 | 2,494 | 3,007 | ||||||||||||
Allowance for bad debts | 2,235 | 1,050 | 816 | 889 | ||||||||||||
Employee benefits | 848 | 607 | 1,008 | 746 | ||||||||||||
Inventories | 0 | 600 | ||||||||||||||
Capital loss carryover | 411 | 393 | ||||||||||||||
Loss and credit carryover | 6,655 | 418 | ||||||||||||||
Accrued liabilities | 511 | 338 | 238 | 79 | ||||||||||||
Deferred rent | 444 | 231 | 716 | 605 | ||||||||||||
Other | 369 | 431 | - | 215 | ||||||||||||
Total deferred tax assets | 15,640 | 6,323 | 17,517 | 15,986 | ||||||||||||
Valuation allowance | (411 | ) | (393 | ) | (107 | ) | (100 | ) | ||||||||
| 15,229 | 5,930 | 17,410 | 15,886 | |||||||||||||
Liabilities | ||||||||||||||||
Intangible assets | 0 | 1,737 | ||||||||||||||
Property, plant and equipment | 775 | 1,313 | 1,710 | 1,117 | ||||||||||||
Inventories | 281 | 0 | 3,319 | - | ||||||||||||
Other | 376 | 285 | ||||||||||||||
Total deferred tax liabilities | 1,056 | 3,050 | 5,405 | 1,402 | ||||||||||||
Net deferred tax assets | $ | 14,173 | $ | 2,880 | $ | 12,005 | $ | 14,484 | ||||||||
At January 31, 202128, 2024 and February 2, 2020January 29, 2023 our net deferred tax asset was $14.2$12.0 million and $2.9$14.5 million, respectively. The increase in the valuation allowance of $18,000$7,000 was due to additional foreign tax credit limitations.carry forward. We expect to fully realize the benefit of the deferred tax assets, with the exception of a portion of the capital loss carry forward and foreign tax credit carry forward, in future periods when the amounts become deductible. The capital
We have federal and state net operating loss carry forward is $1.4forwards of $22.7 million and expires$14.4 million, respectively, which have various expiration dates beginning in fiscal 2022. The2039 through fiscal 2044, with some having an indefinite carry forward period. We have foreign tax credit carry forward is $71,000 and expiresforwards of $147,000 which expire beginning in fiscal 2029 through fiscal 2034. We also have charitable contribution carry forwards of $3.2 million, which expire in fiscal 2028 and fiscal 2029.
Current accounting standards prescribe a recognition threshold and measurement attribute for the financial statement recognition and measurement of a tax position taken or expected to be taken in a tax return. The guidance also addresses de-recognition, classification, interest and penalties, accounting in interim periods and disclosures.
disclosure. We do not have unrecognized tax benefits as of January 31, 2021.28, 2024.
Tax years ending January 28, 201831, 2021 through January 31, 202128, 2024 remain subject to examination by federal and state taxing authorities.
NOTE 1718 – SEGMENT INFORMATION
As a public entity, we are required to present disaggregated information by segment using the management approach. The objective of this approach is to allow users of our financial statements to see our business through the eyes of management based upon the way management reviews performance and makes decisions. The management approach requires segment information to be reported based on how management internally evaluates the operating performance of the company’s business units or segments. The objective of this approach is to meet the basic principles of segment reporting as outlined in ASC 280 Segments (“ASC 280”), which are to allow the users of our financial statements to:
■ | better understand our performance; |
■ | better assess our prospects for future net cash flows; and |
■ | make more informed judgments about us as a whole. |
We define our segments as those operations our chief operating decision maker (“CODM”) regularly reviews to analyze performance and allocate resources. We measure the results of our segments using, among other measures, each segment’s net sales, gross profit and operating income, as determined by the information regularly reviewed by the CODM.
We continually monitor our reportable segments for changes in facts and circumstances to determine whether changes in the identification or aggregation of operating segments are necessary. In the fourth quarter of fiscal 2020, we updated our reportable segments as follows: Domestic upholstery producers Bradington-Young, Sam Moore and Shenandoah Furniture were moved from All other and aggregated into a new reportable segment called “Domestic Upholstery.” All Other now consists of H Contract and Lifestyle Brands. Lifestyle Brands is a business in its start-up phase targeted at the interior designer channel. The Hooker Branded and Home Meridian segments were unchanged. Therefore, forFor financial reporting purposes, we are organized into 3three reportable segments and “All Other”, which includes the remainder of our businesses:
■ | Hooker Branded, consisting of the operations of our imported Hooker Casegoods and Hooker Upholstery businesses; |
■ | Home Meridian, a business acquired at the beginning of fiscal 2017, is a stand-alone, mostly autonomous business that serves a different type or class of customer than do our other operating segments and at much lower margins; |
■ | Domestic Upholstery, which includes the domestic upholstery manufacturing operations of Bradington-Young, HF Custom (formerly Sam |
■ | All Other, consisting of H Contract, BOBO Intriguing Objects, and Lifestyle |
Changes to segment reporting for fiscal 2024
We regularly monitor our reportable segments for changes in facts and circumstances to determine whether changes in the identification or aggregation of operating segments are necessary. Before the fiscal 2024 third quarter, H Contract’s results included sales of products sourced from the Hooker Branded and Domestic Upholstery segments. Due to a change in the way management internally evaluates operating performance, beginning with fiscal 2024 third quarter, Hooker Branded and Domestic Upholstery segments’ results now include sales of products formerly included in H Contract’s results. Fiscal 2024 and fiscal 2023 results discussed below have been recast to reflect this change. The Home Meridian segment is unchanged.
During the second quarter of fiscal 2024, we acquired substantially all the assets of BOBO Intriguing Objects. Based on the requirements of ASC 280: Segment Reporting, BOBO’s results are included in All Other on a prospective basis.
The following table presents segment information for the periods, and as of the dates, indicated. Prior-year information has been recast to reflect the changes in segments discussed above.
Fifty-Two Weeks Ended | Fifty-Two Weeks Ended | Fifty-Three Weeks Ended | Fifty-Two Weeks Ended | |||||||||||||||||||||||||||||||||||||||||||||
January 31, 2021 | February 2, 2020 | February 3, 2019 | January 28, 2024 | January 29, 2023 | January 30, 2022 | |||||||||||||||||||||||||||||||||||||||||||
% Net | % Net | % Net | % Net | % Net | % Net | |||||||||||||||||||||||||||||||||||||||||||
Net Sales | Sales | Sales | Sales | Sales | Sales | Sales | ||||||||||||||||||||||||||||||||||||||||||
Hooker Branded | $ | 162,442 | 30.1 | % | $ | 161,990 | 26.4 | % | $ | 178,710 | 26.2 | % | $ | 156,590 | 36.2 | % | $ | 205,935 | 35.3 | % | $ | 200,945 | 33.8 | % | ||||||||||||||||||||||||
Home Meridian | 282,423 | 52.3 | % | 340,630 | 55.8 | % | 387,825 | 56.7 | % | 143,538 | 33.1 | % | 216,338 | 37.1 | % | 278,902 | 47.0 | % | ||||||||||||||||||||||||||||||
Domestic Upholstery | 83,678 | 15.5 | % | 95,670 | 15.7 | % | 106,580 | 15.6 | % | 126,827 | 29.3 | % | 156,717 | 26.9 | % | 106,827 | 18.0 | % | ||||||||||||||||||||||||||||||
All Other | 11,538 | 2.1 | % | 12,534 | 2.1 | % | 10,386 | 1.5 | % | 6,271 | 1.4 | % | 4,112 | 0.7 | % | 6,938 | 1.2 | % | ||||||||||||||||||||||||||||||
Consolidated | $ | 540,081 | 100 | % | $ | 610,824 | 100 | % | $ | 683,501 | 100 | % | $ | 433,226 | 100 | % | $ | 583,102 | 100 | % | $ | 593,612 | 100 | % | ||||||||||||||||||||||||
Gross Profit | ||||||||||||||||||||||||||||||||||||||||||||||||
Gross Profit/(Loss) | ||||||||||||||||||||||||||||||||||||||||||||||||
Hooker Branded | $ | 51,832 | 31.9 | % | $ | 51,462 | 31.8 | % | $ | 58,122 | 32.5 | % | $ | 57,671 | 36.8 | % | $ | 60,871 | 29.6 | % | $ | 63,333 | 31.5 | % | ||||||||||||||||||||||||
Home Meridian | 39,832 | 14.1 | % | 36,936 | 10.8 | % | 62,850 | 16.2 | % | 24,367 | 17.0 | % | (2,620 | ) | -1.2 | % | 15,213 | 5.5 | % | |||||||||||||||||||||||||||||
Domestic Upholstery | 17,121 | 20.5 | % | 21,120 | 22.1 | % | 22,503 | 21.1 | % | 24,048 | 19.0 | % | 32,633 | 20.8 | % | 20,860 | 19.5 | % | ||||||||||||||||||||||||||||||
All Other | 3,963 | 34.4 | % | 4,440 | 35.4 | % | 3,512 | 33.8 | % | 2,606 | 41.5 | % | 2,410 | 58.6 | % | 2,296 | 33.1 | % | ||||||||||||||||||||||||||||||
Consolidated | $ | 112,748 | 20.9 | % | $ | 113,958 | 18.7 | % | $ | 146,987 | 21.5 | % | $ | 108,692 | 25.1 | % | $ | 93,294 | 16.0 | % | $ | 101,702 | 17.1 | % | ||||||||||||||||||||||||
Operating (Loss)/Income | ||||||||||||||||||||||||||||||||||||||||||||||||
Operating Income/(Loss) | ||||||||||||||||||||||||||||||||||||||||||||||||
Hooker Branded | $ | 22,827 | 14.1 | % | $ | 21,512 | 13.3 | % | $ | 25,269 | 14.1 | % | $ | 16,844 | 10.8 | % | $ | 22,030 | 10.7 | % | $ | 30,705 | 15.3 | % | ||||||||||||||||||||||||
Home Meridian | (26,071 | ) | -9.2 | % | (7,169 | ) | -2.1 | % | 18,828 | 4.9 | % | (5,530 | ) | -3.9 | % | (37,181 | ) | -17.2 | % | (21,260 | ) | -7.6 | % | |||||||||||||||||||||||||
Domestic Upholstery | (12,418 | ) | -14.8 | % | 6,637 | 6.9 | % | 7,607 | 7.1 | % | 1,131 | 0.9 | % | 8,871 | 5.7 | % | 4,675 | 4.4 | % | |||||||||||||||||||||||||||||
All Other | 1,298 | 11.3 | % | 1,727 | 13.8 | % | 971 | 9.4 | % | (87 | ) | -1.4 | % | 234 | 5.7 | % | 723 | 10.4 | % | |||||||||||||||||||||||||||||
Consolidated | $ | (14,364 | ) | -2.7 | % | $ | 22,707 | 3.7 | % | $ | 52,675 | 7.7 | % | $ | 12,358 | 2.9 | % | $ | (6,046 | ) | -1.0 | % | $ | 14,843 | 2.5 | % | ||||||||||||||||||||||
Capital Expenditures | ||||||||||||||||||||||||||||||||||||||||||||||||
Hooker Branded | $ | 377 | $ | 690 | $ | 843 | $ | 4,185 | $ | 1,813 | $ | 558 | ||||||||||||||||||||||||||||||||||||
Home Meridian | 347 | 496 | 534 | 1,679 | 1,280 | 4,829 | ||||||||||||||||||||||||||||||||||||||||||
Domestic Upholstery | 475 | 3,914 | 3,807 | 860 | 1,106 | 1,295 | ||||||||||||||||||||||||||||||||||||||||||
All Other | 11 | 29 | 30 | 91 | - | 10 | ||||||||||||||||||||||||||||||||||||||||||
Consolidated | $ | 1,210 | $ | 5,129 | $ | 5,214 | $ | 6,815 | $ | 4,199 | $ | 6,692 | ||||||||||||||||||||||||||||||||||||
Depreciation & Amortization | ||||||||||||||||||||||||||||||||||||||||||||||||
Hooker Branded | $ | 1,809 | $ | 1,930 | $ | 1,979 | $ | 2,268 | $ | 2,092 | $ | 2,530 | ||||||||||||||||||||||||||||||||||||
Home Meridian | 2,160 | 2,218 | 2,407 | 2,689 | 2,899 | 2,594 | ||||||||||||||||||||||||||||||||||||||||||
Domestic Upholstery | 2,797 | 2,938 | 3,049 | 3,972 | 3,827 | 2,678 | ||||||||||||||||||||||||||||||||||||||||||
All Other | 12 | 14 | 7 | 27 | 11 | 12 | ||||||||||||||||||||||||||||||||||||||||||
Consolidated | $ | 6,778 | $ | 7,100 | $ | 7,442 | $ | 8,956 | $ | 8,829 | $ | 7,814 | ||||||||||||||||||||||||||||||||||||
As of January 31, | As of February 2, | As of January 28, | As of January 29, | |||||||||||||||||||||||||||||||||||||||||||||
2021 | %Total | 2020 | %Total | 2024 | %Total | 2023 | %Total | |||||||||||||||||||||||||||||||||||||||||
Assets | Assets | Assets | Assets | Assets | ||||||||||||||||||||||||||||||||||||||||||||
Hooker Branded | $ | 174,475 | 53.5 | % | $ | 144,112 | 45.0 | % | $ | 168,832 | 56.3 | % | $ | 174,523 | 52.1 | % | ||||||||||||||||||||||||||||||||
Home Meridian | 100,497 | 30.9 | % | 138,313 | 43.2 | % | 58,799 | 19.6 | % | 92,469 | 27.6 | % | ||||||||||||||||||||||||||||||||||||
Domestic Upholstery | 49,370 | 15.2 | % | 36,085 | 11.3 | % | 67,230 | 22.4 | % | 66,435 | 19.8 | % | ||||||||||||||||||||||||||||||||||||
All Other | 1,204 | 0.4 | % | 1,769 | 0.6 | % | 5,067 | 1.7 | % | 1,558 | 0.5 | % | ||||||||||||||||||||||||||||||||||||
Consolidated Assets | $ | 325,546 | 100 | % | $ | 320,279 | 100 | % | $ | 299,928 | 100 | % | $ | 334,985 | 100 | % | ||||||||||||||||||||||||||||||||
Consolidated Goodwill and Intangibles | 26,727 | 73,429 | 43,658 | 46,731 | ||||||||||||||||||||||||||||||||||||||||||||
Total Consolidated Assets | $ | 352,273 | $ | 393,708 | $ | 343,586 | $ | 381,716 | ||||||||||||||||||||||||||||||||||||||||
Sales by product type are as follows:
Net Sales (in thousands) | Net Sales (in thousands) | ||||||||||||||||||||||||||||||||||||||||||||
Fiscal | Fiscal | ||||||||||||||||||||||||||||||||||||||||||||
2021 | 2020 | 2019 | 2024 | 2023 | 2022 | ||||||||||||||||||||||||||||||||||||||||
Casegoods | $ | 329,906 | 61 | % | $ | 397,192 | 65 | % | $ | 417,677 | 61 | % | $ | 248,627 | 57 | % | $ | 328,849 | 56 | % | $ | 348,548 | 59 | % | |||||||||||||||||||||
Upholstery | 210,175 | 39 | % | 213,632 | 35 | % | 265,824 | 39 | % | 184,599 | 43 | % | 254,253 | 44 | % | 245,064 | 41 | % | |||||||||||||||||||||||||||
| $ | 540,081 | $ | 610,824 | $ | 683,501 | $ | 433,226 | 100 | % | $ | 583,102 | 100 | % | $ | 593,612 | 100 | % | ||||||||||||||||||||||||||||
No significant long-lived assets were held outside the United States at either January 31, 202128, 2024 or February 2, 2020.January 29, 2023. International customers accounted for 2.0%less than 2% of consolidated invoiced sales in fiscal 2021, 1.6% in fiscal 2020,2024, 2023 and 1.2% fiscal 2019.2022. We define international sales as sales outside of the United States and Canada.
NOTE 1819 – COMMITMENTS, CONTINGENCIES AND OFF BALANCEOFF-BALANCE SHEET ARRANGEMENTS
Commitments and Off-Balance Sheet Arrangements
We lease office space, warehousing facilities, showroom space and office equipment under leases expiring over the next five years. Rent expense was $10.7 million in fiscal 2021, $11.2 million in fiscal 2020, and $10.1 million in fiscal 2019. Future minimum annual commitments under leases and operating agreements are $7.4 million in fiscal 2022, $5.6 million in fiscal 2023, $5.7 million in fiscal 2024, $5.3 million in fiscal 2025 and $5.3 million in fiscal 2026.
We had letters of credit outstanding totaling $6.3$6.7 million on January 31, 2021.28, 2024. We utilize letters of credit to collateralize certain imported inventory purchases and certain insurance arrangements.
In the ordinary course of our business, we may become involved in legal proceedings involving contractual and employment relationships, product liability claims, intellectual property rights and a variety of other matters. We do not believe that any pending legal proceedings will have a material impact on our financial position or results of operations.
Our business is subject to a number of significant risks and uncertainties, including our reliance on offshore sourcing, any of which can adversely affect our business, results of operations, financial condition or future prospects.
NOTE 1920 – CONCENTRATIONS OF RISK
Imported Products Sourcing
We source imported products through multiple vendors, located in 9ten countries. Because of the large number and diverse nature of the foreign factories from which we can source our imported products, we have some flexibility in the placement of products in any particular factory or country.
Factories located in Vietnam and China are a critical resource for Hooker Furniture.Furnishings. In fiscal 2021,2024, imported products sourced from Vietnam and China accounted for 91%88% of our import purchases and our top 5five suppliers in those countries accounted for 45%60% of our fiscal 20212024 import purchases. A disruption in our supply chain from Vietnam or China could significantly impact our ability to fill customer orders for products manufactured at that factory or in that country.
Raw Materials Sourcing for Domestic Upholstery Manufacturing
Our five largest domestic upholstery suppliers accounted for 28%35% of our raw materials supply purchases for domestic upholstered furniture manufacturing operations in fiscal 2021.2024. One supplier accounted for 8.1%9% of our raw material purchases in fiscal 2021.2024. Should disruptions with these suppliers occur, we believe we could successfully source these products from other suppliers without significant disruption to our operations.
Concentration of Sales and Accounts Receivable
One customer accounted for nearly 12%approximately 6% of our consolidated sales in fiscal 2021.2024. Our top five customers accounted for approximately 30%22% of our fiscal 20212024 consolidated sales. The loss of any one or more of these customers could adversely affect our earnings, financial condition and liquidity. At January 31, 2021, half28, 2024, 16% of our consolidated accounts receivable is concentrated in our top five customers.
NOTE 20 – CONSOLIDATED QUARTERLY DATA (Unaudited- see accompanying accountant’s report.)
Fiscal Quarter | ||||||||||||||||
First | Second | Third | Fourth | |||||||||||||
2021 | ||||||||||||||||
Net sales | $ | 104,597 | $ | 130,537 | $ | 149,687 | $ | 155,259 | ||||||||
Cost of sales | 85,944 | 103,537 | 116,204 | 121,648 | ||||||||||||
Gross profit | 18,653 | 27,000 | 33,483 | 33,611 | ||||||||||||
Selling and administrative expenses | 19,177 | 18,892 | 19,850 | 22,490 | ||||||||||||
Goodwill impairment charges | 39,568 | 0 | 0 | 0 | ||||||||||||
Trade name impairment charges | 4,750 | 0 | 0 | 0 | ||||||||||||
Net income | (34,819 | ) | 5,774 | 10,093 | 8,526 | |||||||||||
Basic (loss)/earnings per share | $ | (2.95 | ) | $ | 0.49 | $ | 0.85 | $ | 0.72 | |||||||
Diluted (loss)/earnings per share | $ | (2.95 | ) | $ | 0.48 | $ | 0.84 | $ | 0.71 | |||||||
2020 | ||||||||||||||||
Net sales | $ | 135,518 | $ | 152,248 | $ | 158,176 | $ | 164,882 | ||||||||
Cost of sales | 110,001 | 123,422 | 129,777 | 133,665 | ||||||||||||
Gross profit | 25,517 | 28,826 | 28,399 | 31,217 | ||||||||||||
Selling and administrative expenses | 22,016 | 22,462 | 22,810 | 21,581 | ||||||||||||
Net income | 1,987 | 4,160 | 3,920 | 7,016 | ||||||||||||
Basic earnings per share | $ | 0.17 | $ | 0.35 | $ | 0.33 | $ | 0.59 | ||||||||
Diluted earnings per share | $ | 0.17 | $ | 0.35 | $ | 0.33 | $ | 0.59 |
Earnings per share for each fiscal quarter is derived using the weighted average number of shares outstanding during that quarter. Earnings per share for each fiscal year is derived using the weighted average number of shares outstanding on an annual basis. Consequently, the sum of earnings per share for the quarters of a fiscal year may not equal earnings per share for the full fiscal year.
NOTE 21-21 - RELATED PARTY TRANSACTIONS
We lease the 4four properties utilized in Shenandoah’s operations. One of our employees has an ownership interest in the entities that own these properties. The leases commenced on September 29, 2017 andwith an option to renew each for an additional seven years. All four leases include annual rent escalation clauses with respect to minimum lease payments after the initial 84-month term of the lease is completed. In addition to monthly lease payments, we also incur expenses for property taxes, routine repairs and maintenance and other operating expenses. We paid $668,000 inThe total amount of the lease payments to these entities during fiscal 2021.expenses and other expenses do not have a material effect on our consolidated financial statements.
NOTE 22-22 - SUBSEQUENT EVENTS
Cash Dividend
On March 1, 2021,4, 2024, our Board of Directors declared a quarterly cash dividend of $0.18$0.23 per share, payable on March 31, 202129, 2024 to shareholders of record at March 17, 2021.
18, 2024.