
☒ | ANNUAL REPORT PURSUANT TO SECTION 13 OR 15(d) OF THE SECURITIES EXCHANGE ACT OF 1934 |
☐ | TRANSITION REPORT PURSUANT TO SECTION 13 OR 15(d) OF THE SECURITIES EXCHANGE ACT OF 1934 |
| Delaware | 26-0151234 | |
(State or Other Jurisdiction of Incorporation or Organization) | (I.R.S. Employer Identification No.) |
c/o GreenHaven Commodity Services, LLC 3340 Peachtree Rd, Suite 1910 Atlanta, Georgia | 30326 | |
| (Address of Principal Executive Offices) | (Zip Code) |
| Title of Each Class | Name of Each Exchange on Which Registered | |
| Common Units of Beneficial Interest | –NYSE Arca |
| Large accelerated filer ☐ Accelerated Filer |
| 5 | |||
| 5 | |||
| Commodity Allowed | Contracts | Exchanges* | Index Weight | Sector Weight | ||||
| Crude Oil | ||||||||
| All 12 calendar months | CME | 5.88% | Energy 17.65% | |||||
| Heating Oil | All 12 calendar months | CME | 5.88% | |||||
| Natural Gas | All 12 calendar months | CME | 5.88% | |||||
| Corn | Mar, May, Jul, Sep, Dec | CME | 5.88% | Grains | ||||
| Wheat | Mar, May, Jul, Sep, Dec | CME | 5.88% | |||||
| Soybeans | Jan, Mar, May, Jul, Aug, Nov | CME | 5.88% | |||||
| Soybean Oil | Jan, Mar, May, Jul, Aug, Sep, | CME | 5.88% | |||||
| Oct Dec | ||||||||
| Live Cattle | Feb, Apr, Jun, Aug, Oct, Dec | CME | 5.88% | Livestock | ||||
| Lean Hogs | Feb, Apr, Jun, Jul, Aug, Oct, Dec | CME | 5.88% | |||||
| Sugar | March, May, July, October | ICE | 5.88% | Softs | ||||
| Cotton | March, May, July, December | ICE | 5.88% | |||||
| Coffee | Mar, May, Jul, Sep, Dec | ICE | 5.88% | |||||
| Cocoa | Mar, May, Jul, Sep, Dec | ICE | 5.88% | |||||
| Gold | Feb, Apr, Jun, Aug, Dec | CME | 5.88% | Metals | ||||
| Silver | Mar, May, Jul, Sep, Dec | CME | 5.88% | |||||
| Platinum | Jan, Apr, Jul, Oct | CME | 5.88% | |||||
| Copper | Mar, May, Jul, Sep, Dec | CME | 5.88% |
avgt | ||
| (i) | it determines that the purchase order is not in proper form; |
| (ii) | the Managing Owner believes that the purchase order would have adverse tax consequences to the Fund or its Shareholders; or |
| (iii) | circumstances outside the control of the Managing Owner or the Distributor make it, for all practical purposes, not feasible to process creations of Baskets. |
| (i) | selects the Trustee, administrator, distributor and auditor; |
| (ii) | negotiates various agreements and fees; and |
| (iii) | performs such other services as the Managing Owner believes that the Fund and the Master Fund may from time to time require. |
| (i) | selects the Commodity Broker; and |
| (ii) | monitors the performance results of the Master Fund’s portfolio and reallocates assets within the portfolio with a view to causing the performance of the Master Fund’s portfolio to track that of the Index over time. |
| (i) | up to approximately 10% of the |
| (ii) | approximately 90% of the |
| (i) | initial and ongoing registration fees, filing fees, escrow fees and taxes; |
| (ii) | costs of preparing, printing (including typesetting), amending, supplementing, mailing and distributing the Registration Statement, the exhibits thereto and the Prospectus of the Fund; |
| (iii) | the costs of qualifying, printing, (including typesetting), amending, supplementing, mailing and distributing sales materials used in connection with the offering and issuance of the Shares; |
| (iv) | travel, telephone and other expenses in connection with the offering and issuance of the Shares. |
| (i) | acts as the clearing broker; |
| (ii) | acts as custodian of all or a portion of the Master Fund’s assets; and |
| (iii) | performs such other services for the Master Fund as the Managing Owner may from time-to-time request. |
| (i) | all cash, securities, and open futures positions carried for the Master Fund by the Commodity Broker will be held by it as a security for the Master Fund’s obligations to the Commodity Broker; |
| (ii) | the margins required to initiate or maintain open positions will be as from time-to-time established by the Commodity Broker and may exceed exchange minimum levels; and |
| (iii) | the Commodity Broker may close out positions, purchase commodities or cancel orders at any time it deems necessary for its protection, without the consent of the Master Fund. |
| (i) | Either party terminates prior to the expiration of the initial term in the event the other party breaches any material provision of the Transfer Agency and Service Agreement, including, without limitation in the case of the Fund, its obligations to compensate the Transfer Agent, provided that the non-breaching party gives written notice of such breach to the breaching party and the breaching party does not cure such violation within ninety (90) days of receipt of such notice. |
| (ii) | The Fund may terminate the Transfer Agency and Service Agreement prior to the expiration of the initial term upon ninety (90) days’ prior written notice in the event that the Managing Owner determines to liquidate the Fund and terminate its registration with the Securities and Exchange Commission other than in connection with a merger or acquisition of the Fund. |
| (i) | All actions of the Transfer Agent or its agents or |
| (ii) | The Fund’s gross negligence or willful misconduct; |
| (iii) | The breach of any representation or warranty of the Fund thereunder; |
| (iv) | The conclusive reliance on or use by the Transfer Agent or its agents or subcontractors of information, records, documents or services which (i) are received by the Transfer Agent or its agents or subcontractors, and (ii) have been prepared, maintained or performed by the Fund or any other person or firm on behalf of the Fund including but not limited to any previous transfer agent or registrar; |
| (v) | The conclusive reliance on, or the carrying out by the Transfer Agent or its agents or subcontractors of any instructions or requests of the Fund on behalf of the Fund; |
| (vi) | The offer or sale of Shares in violation of any requirement under the federal securities laws or regulations or the securities laws; or |
(vii) | Regulations of any state that such Shares be registered in such state or in violation of any stop order or other determination or ruling by any federal agency or any state with respect to the offer or sale of such Shares in such state. |
ITEM 1A - RISK FACTORS |
• changing supply and demand relationships; |
• general economic activities and conditions; |
• weather and other environmental conditions; |
• acts of God; |
• agricultural, fiscal, monetary and exchange control programs and policies of governments; |
• national and international political and economic events and policies; |
• changes in rates of inflation; or |
• the general emotions and psychology of the marketplace, which at times can be volatile and unrelated to other more tangible factors. |
• A change in economic conditions, such as a recession, can adversely affect the price of both industrial and precious metals. An economic downturn may have a negative impact on the usage and demand of metals which may result in a loss for the Master Fund. |
• A sudden shift in political conditions of the world’s leading metal producers may have a negative effect on the global pricing of metals. |
• An increase in the hedging of precious metals may result in the price of precious metals to decline. |
• Changes in global supply and demand for industrial and precious metals. |
• The price and quantity of imports and exports of industrial and precious metals. |
• Technological advances in the processing and mining of industrial and precious metals. |
• Possible adverse effects on commodity markets from new regulations and required disclosures of public companies regarding “Conflict Minerals”. |
• Farmer planting decisions, general economic, market and regulatory factors all influence the price of agricultural commodities. |
• Weather conditions, including hurricanes, tornadoes, storms and droughts, may have a material adverse effect on crops, live cattle, live hogs and lumber, which may result in significant fluctuations in prices in such commodities. |
• Changes in global supply and demand for agriculture products. |
• The price and quantity of imports and exports of agricultural commodities. |
• Political conditions, including embargoes and war, in or affecting agricultural production, imports and exports. |
• Technological advances in agricultural production. |
• The price and availability of alternative agricultural commodities. |
• Changes in global supply and demand for oil and natural gas. |
• The price and quantity of imports and exports of oil and natural gas. |
• Political conditions, including embargoes and war, in or affecting other oil producing activities. |
• The level of global oil and natural gas exploration and production. |
• The level of global oil and natural gas inventories, production or pricing. |
• Weather conditions. |
• |
• The price and availability of alternative fuels. |
| MINING SAFETY DISCLOSURES |
| 2011 Monthly Stock Price Data for GCC | ||||||||||||||||||||||||||||||||
| 2014 Monthly Stock Price Data for GCC | 2014 Monthly Stock Price Data for GCC | |||||||||||||||||||||||||||||||
| Date | Open | High | Low | Close | Open | High | Low | Close | ||||||||||||||||||||||||
| December | 31.05 | 31.31 | 28.98 | 29.96 | 23.93 | 24.36 | 22.77 | 22.86 | ||||||||||||||||||||||||
| November | 31.39 | 32.69 | 30.42 | 31.18 | 24.68 | 24.74 | 23.93 | 23.96 | ||||||||||||||||||||||||
| October | 30.15 | 32.80 | 29.84 | 32.21 | 24.72 | 25.22 | 24.46 | 24.69 | ||||||||||||||||||||||||
| September | 35.19 | 35.22 | 30.28 | 30.34 | 26.24 | 26.24 | 24.68 | 24.75 | ||||||||||||||||||||||||
| August | 34.66 | 35.30 | 32.66 | 35.23 | 26.60 | 26.73 | 25.93 | 26.26 | ||||||||||||||||||||||||
| July | 33.50 | 35.13 | 33.20 | 34.47 | 27.89 | 27.94 | 26.60 | 26.61 | ||||||||||||||||||||||||
| June | 34.80 | 35.18 | 32.90 | 33.50 | 27.72 | 28.31 | 27.23 | 27.93 | ||||||||||||||||||||||||
| May | 36.45 | 36.46 | 33.10 | 34.90 | 28.65 | 28.76 | 27.74 | 27.77 | ||||||||||||||||||||||||
| April | 35.15 | 36.51 | 35.03 | 36.40 | 28.22 | 28.93 | 27.88 | 28.75 | ||||||||||||||||||||||||
| March | 35.57 | 36.19 | 32.82 | 35.23 | 28.09 | 30.14 | 27.85 | 28.18 | ||||||||||||||||||||||||
| February | 34.08 | 36.00 | 33.98 | 35.33 | 25.97 | 27.90 | 25.78 | 27.83 | ||||||||||||||||||||||||
| January | 33.49 | 34.25 | 32.08 | 34.03 | 25.72 | 25.93 | 25.32 | 25.83 | ||||||||||||||||||||||||
| 2010 Monthly Stock Price Data for GCC | ||||||||||||||||||||||||||||||||
| Date | Open | High | Low | Close | ||||||||||||||||||||||||||||
| December | 29.99 | 33.51 | 29.98 | 32.95 | ||||||||||||||||||||||||||||
| November | 30.04 | 33.53 | 29.02 | 29.69 | ||||||||||||||||||||||||||||
| October | 28.23 | 30.01 | 27.56 | 29.79 | ||||||||||||||||||||||||||||
| September | 26.45 | 28.55 | 26.40 | 28.16 | ||||||||||||||||||||||||||||
| August | 26.73 | 27.13 | 25.68 | 26.20 | ||||||||||||||||||||||||||||
| July | 24.81 | 26.43 | 24.56 | 26.41 | ||||||||||||||||||||||||||||
| June | 24.39 | 25.57 | 23.83 | 24.93 | ||||||||||||||||||||||||||||
| May | 25.83 | 25.86 | 23.88 | 24.54 | ||||||||||||||||||||||||||||
| April | 25.22 | 25.96 | 25.15 | 25.79 | ||||||||||||||||||||||||||||
| March | 25.79 | 25.94 | 24.68 | 25.08 | ||||||||||||||||||||||||||||
| February | 25.21 | 25.88 | 24.27 | 25.72 | ||||||||||||||||||||||||||||
| January | 26.93 | 27.30 | 25.05 | 25.06 | ||||||||||||||||||||||||||||
| 2013 Monthly Stock Price Data for GCC | ||||||||||||||||
| Date | Open | High | Low | Close | ||||||||||||
| December | 25.74 | 26.02 | 25.50 | 25.70 | ||||||||||||
| November | 26.02 | 26.10 | 25.09 | 25.80 | ||||||||||||
| October | 26.31 | 26.90 | 26.14 | 26.17 | ||||||||||||
| September | 27.06 | 27.14 | 26.35 | 26.39 | ||||||||||||
| August | 26.04 | 27.21 | 25.77 | 26.86 | ||||||||||||
| July | 25.88 | 26.66 | 25.72 | 26.02 | ||||||||||||
| June | 27.03 | 27.28 | 25.71 | 25.79 | ||||||||||||
| May | 27.39 | 27.75 | 26.80 | 26.80 | ||||||||||||
| April | 28.15 | 28.15 | 26.81 | 27.67 | ||||||||||||
| March | 28.05 | 28.58 | 27.98 | 28.22 | ||||||||||||
| February | 29.63 | 29.73 | 28.05 | 28.20 | ||||||||||||
| January | 29.17 | 29.59 | 28.53 | 29.55 | ||||||||||||
| 2012 Monthly Stock Price Data for GCC | ||||||||||||||||
| Date | Open | High | Low | Close | ||||||||||||
| December | 30.02 | 30.12 | 28.67 | 28.83 | ||||||||||||
| November | 29.60 | 30.12 | 29.09 | 29.85 | ||||||||||||
| October | 30.67 | 30.80 | 29.43 | 29.49 | ||||||||||||
| September | 30.78 | 31.61 | 29.97 | 30.50 | ||||||||||||
| August | 29.40 | 30.42 | 29.06 | 30.37 | ||||||||||||
| July | 29.29 | 29.99 | 28.32 | 29.61 | ||||||||||||
| June | 26.66 | 28.44 | 26.53 | 28.36 | ||||||||||||
| May | 29.48 | 29.61 | 26.88 | 26.93 | ||||||||||||
| April | 30.22 | 30.64 | 29.00 | 29.47 | ||||||||||||
| March | 31.75 | 32.36 | 29.90 | 30.28 | ||||||||||||
| February | 31.20 | 32.14 | 30.92 | 31.69 | ||||||||||||
| January | 30.37 | 31.90 | 30.09 | 31.29 | ||||||||||||
| Fiscal Year 2014 | High | Low | |||||
| 1st Quarter | 30.14 | 25.32 | |||||
| 2nd Quarter | 28.93 | 27.23 | |||||
| 3rd Quarter | 27.94 | 24.68 | |||||
| 4th Quarter | 25.22 | 22.77 | |||||
| 2009 Monthly Stock Price Data for GCC | ||||||||||||||||
| Date | Open | High | Low | Close | ||||||||||||
| December | 26.31 | 26.58 | 25.33 | 26.32 | ||||||||||||
| November | 25.05 | 26.20 | 24.89 | 26.11 | ||||||||||||
| October | 23.93 | 26.20 | 23.30 | 25.01 | ||||||||||||
| September | 23.10 | 24.28 | 22.73 | 23.97 | ||||||||||||
| August | 23.95 | 24.41 | 22.80 | 23.08 | ||||||||||||
| July | 23.00 | 23.55 | 21.31 | 23.52 | ||||||||||||
| June | 24.85 | 25.79 | 22.39 | 22.88 | ||||||||||||
| May | 21.99 | 24.50 | 21.92 | 24.34 | ||||||||||||
| April | 21.83 | 23.99 | 21.00 | 21.79 | ||||||||||||
| March | 20.43 | 23.60 | 19.01 | 21.95 | ||||||||||||
| February | 21.55 | 22.81 | 20.42 | 20.82 | ||||||||||||
| January | 22.12 | 22.99 | 20.79 | 21.80 | ||||||||||||
| Price Range of Units | |||||||||||||||
| Fiscal Year 2011 | High | Low | |||||||||||||
| Fiscal Year 2013 | High | Low | |||||||||||||
| 1st Quarter | 36.19 | 32.08 | 29.73 | 27.98 | |||||||||||
| 2nd Quarter | 36.51 | 32.90 | 28.15 | 25.71 | |||||||||||
| 3rd Quarter | 35.30 | 30.28 | 27.21 | 25.72 | |||||||||||
| 4th Quarter | 32.80 | 28.98 | 26.90 | 25.09 | |||||||||||
| Fiscal Year 2010 | High | Low | |||||||||||||
| 1st Quarter | 27.30 | 25.05 | |||||||||||||
| 2nd Quarter | 25.96 | 23.83 | |||||||||||||
| 3rd Quarter | 28.55 | 24.56 | |||||||||||||
| 4th Quarter | 33.53 | 27.56 | |||||||||||||
| Selected Quarterly Financial Data ( Unaudited) | ||||||||||||||||
For the Three Months Ended March 31, 2011 | For the Three Months Ended June 30, 2011 | For the Three Months Ended September 30, 2011 | For the Three Months Ended December 31, 2011 | |||||||||||||
| Interest Income | $ | 187,623 | $ | 119,476 | $ | 8,112 | $ | 20,465 | ||||||||
| Net Investment Income (Loss) | $ | (1,551,905 | ) | $ | (2,037,214 | ) | $ | (1,910,989 | ) | $ | (1,359,888 | ) | ||||
| Net Realized and Unrealized Gain (Loss) on Investments and Futures Contracts | $ | 44,819,207 | $ | (35,767,596 | ) | $ | (64,715,733 | ) | $ | (11,241,807 | ) | |||||
| Net Gain (Loss) | $ | 43,267,302 | $ | (37,804,810 | ) | $ | (66,626,722 | ) | $ | (12,601,695 | ) | |||||
| Increase (Decrease) in Net Asset Value | $ | 283,986,486 | $ | (84,481,829 | ) | $ | (115,475,657 | ) | $ | (37,234,039 | ) | |||||
| Net Gain (Loss) per Share | $ | 2.32 | $ | (1.61 | ) | $ | (3.13 | ) | $ | (0.50 | ) | |||||
For the Three Months Ended March 31, 2010 | For the Three Months Ended June 30, 2010 | For the Three Months Ended September 30, 2010 | For the Three Months Ended December 31, 2010 | |||||||||||||
| Interest Income | $ | 27,355 | $ | 69,812 | $ | 78,508 | $ | 126,133 | ||||||||
| Net Investment Income (Loss) | $ | (630,362 | ) | $ | (586,950 | ) | $ | (685,450 | ) | $ | (1,031,913 | ) | ||||
| Net Realized and Unrealized Gain (Loss) on Investments and Futures Contracts | $ | (11,376,937 | ) | $ | (1,174,964 | ) | $ | 34,210,557 | $ | 67,903,952 | ||||||
| Net Gain (Loss) | $ | (12,007,299 | ) | $ | (1,761,914 | ) | $ | 33,525,107 | $ | 66,872,039 | ||||||
| Increase (Decrease) in Net Asset Value | $ | 9,973,749 | $ | 3,581,072 | $ | 69,340,015 | $ | 222,033,881 | ||||||||
| Net Gain (Loss) per Share | $ | (1.15 | ) | $ | (0.15 | ) | $ | 3.22 | $ | 4.74 | ||||||
Year Ended December 31, 2014 | Year Ended December 31, 2013 | Year Ended December 31, 2012 | Year Ended December 31, 2011 | Year Ended December 31, 2010 | ||||||||||||||||
| Revenues (interest income) | $ | 44,304 | $ | 189,643 | $ | 331,044 | $ | 335,677 | $ | 301,808 | ||||||||||
| Total assets | $ | 267,179,248 | $ | 320,361,211 | $ | 479,691,588 | $ | 584,077,695 | $ | 535,067,061 | ||||||||||
| Net realized and unrealized gain (loss) on futures transactions and investments | $ | (35,320,782 | ) | $ | (45,104,484 | ) | $ | (22,718,144 | ) | $ | (66,905,929 | ) | $ | 89,562,608 | ||||||
| Net gain (loss) | $ | (38,779,345 | ) | $ | (49,238,972 | ) | $ | (27,402,292 | ) | $ | (73,765,925 | ) | $ | 86,627,933 | ||||||
| Year Ended | Year Ended | Year Ended | Period Ended | |||||||||||||
| December 31, | December 31, | December 31, | December 31, | |||||||||||||
| 2011 | 2010 | 2009 | 2008 (i) | |||||||||||||
| Total assets | $ | 584,077,695 | $ | 535,067,061 | $ | 229,623,343 | $ | 17,550,900 | ||||||||
| Net realized and unrealized gain (loss) on futures transactions and investments, inclusive of commissions | $ | (66,905,929 | ) | $ | 89,562,608 | $ | 27,112,878 | $ | (7,095,792 | ) | ||||||
| Net income (loss) | $ | (73,765,925 | ) | $ | 86,627,933 | $ | 25,933,097 | $ | (7,001,170 | ) | ||||||
| Cash held by broker | $ | 619,079,494 | $ | 6,487,519 | $ | 97,250,587 | $ | 13,331,630 | ||||||||
| Total assets per share | $ | 30.11 | $ | 32.93 | $ | 26.24 | $ | 21.94 | ||||||||
| Cash and cash equivalents per share at end of year/period | $ | 31.91 | $ | 0.40 | $ | 11.11 | $ | 16.66 | ||||||||
| Selected Quarterly Financial Data (Unaudited) | For the Three Months Ended March 31, 2014 | For the Three Months Ended June 30, 2014 | For the Three Months Ended September 30, 2014 | For the Three Months Ended December 31, 2014 | ||||||||||||
| Interest Income | $ | 10,011 | $ | 15,419 | $ | 8,256 | $ | 10,618 | ||||||||
| Net Investment Income (Loss) | $ | (842,440 | ) | $ | (917,973 | ) | $ | (904,843 | ) | $ | (793,307 | ) | ||||
| Net Realized and Unrealized Gain (Loss) on Investments and Futures Contracts | $ | 30,712,698 | $ | (2,892,040 | ) | $ | (39,995,805 | ) | $ | (23,145,635 | ) | |||||
| Net Gain (Loss) | $ | 29,870,258 | $ | (3,810,013 | ) | $ | (40,900,648 | ) | $ | (23,938,942 | ) | |||||
| Increase (Decrease) in Net Asset Value | $ | 28,190,820 | $ | 11,794,925 | $ | (38,960,923 | ) | $ | (54,119,272 | ) | ||||||
| Selected Quarterly Financial Data (Unaudited) | For the Three Months Ended March 31, 2013 | For the Three Months Ended June 30, 2013 | For the Three Months Ended September 30, 2013 | For the Three Months Ended December 31, 2013 | ||||||||||||
| Interest Income | $ | 84,009 | $ | 61,443 | $ | 30,080 | $ | 14,111 | ||||||||
| Net Investment Income (Loss) | $ | (1,149,951 | ) | $ | (1,110,863 | ) | $ | (977,194 | ) | $ | (896,480 | ) | ||||
| Net Realized and Unrealized Gain (Loss) on Investments and Futures Contracts | $ | (8,691,003 | ) | $ | (39,362,444 | ) | $ | 12,273,002 | $ | (9,324,039 | ) | |||||
| Net Gain (Loss) | $ | (9,840,954 | ) | $ | (40,473,307 | ) | $ | 11,295,808 | $ | (10,220,519 | ) | |||||
| Increase (Decrease) in Net Asset Value | $ | 5,758,576 | $ | (75,878,153 | ) | $ | (49,649,526 | ) | $ | (34,846,413 | ) | |||||
| Date | NAV | Total Shares | Extended Value | 1 Month | 3 Months | Year to Date | Since Inception | |||||||||||||||||||||
| 1/23/2008 | $ | 30.00 | 350,050 | $ | 10,501,500 | - | - | - | - | |||||||||||||||||||
| 1/31/2008 | $ | 31.65 | 350,050 | $ | 11,079,083 | 5.50 | % | - | 5.50 | % | 5.50 | % | ||||||||||||||||
| 2/29/2008 | $ | 35.41 | 900,050 | $ | 31,870,771 | 11.88 | % | - | 18.03 | % | 18.03 | % | ||||||||||||||||
| 3/31/2008 | $ | 32.46 | 900,050 | $ | 29,215,623 | -8.33 | % | - | 8.20 | % | 8.20 | % | ||||||||||||||||
| 4/30/2008 | $ | 33.49 | 900,050 | $ | 30,142,675 | 3.17 | % | 5.81 | % | 11.63 | % | 11.63 | % | |||||||||||||||
| 5/31/2008 | $ | 33.77 | 950,050 | $ | 32,083,189 | 0.84 | % | -4.63 | % | 12.57 | % | 12.57 | % | |||||||||||||||
| 6/30/2008 | $ | 36.83 | 800,050 | $ | 29,465,842 | 9.06 | % | 13.46 | % | 22.77 | % | 22.77 | % | |||||||||||||||
| 7/31/2008 | $ | 33.71 | 750,050 | $ | 25,284,186 | -8.47 | % | 0.66 | % | 12.37 | % | 12.37 | % | |||||||||||||||
| 8/31/2008 | $ | 31.65 | 800,050 | $ | 25,321,583 | -6.11 | % | -6.28 | % | 5.50 | % | 5.50 | % | |||||||||||||||
| 9/30/2008 | $ | 27.74 | 750,050 | $ | 20,806,387 | -12.35 | % | -24.68 | % | -7.53 | % | -7.53 | % | |||||||||||||||
| 10/31/2008 | $ | 22.68 | 700,050 | $ | 15,877,134 | -18.24 | % | -32.72 | % | -24.40 | % | -24.40 | % | |||||||||||||||
| 11/28/2008 | $ | 22.03 | 700,050 | $ | 15,422,102 | -2.87 | % | -30.39 | % | -26.57 | % | -26.57 | % | |||||||||||||||
| 12/31/2008 | $ | 21.92 | 800,050 | $ | 17,537,096 | -0.50 | % | -20.98 | % | -26.93 | % | -26.93 | % | |||||||||||||||
| 1/31/2009 | $ | 21.80 | 900,050 | $ | 19,621,090 | -0.55 | % | -3.88 | % | -0.55 | % | -27.33 | % | |||||||||||||||
| 2/28/2009 | $ | 20.87 | 950,050 | $ | 19,827,544 | -4.27 | % | -5.27 | % | -4.79 | % | -30.43 | % | |||||||||||||||
| 3/31/2009 | $ | 21.73 | 3,950,050 | $ | 85,834,587 | 4.12 | % | -0.87 | % | -0.87 | % | -27.57 | % | |||||||||||||||
| 4/30/2009 | $ | 21.69 | 3,950,050 | $ | 85,676,585 | -0.18 | % | -0.50 | % | -1.05 | % | -27.70 | % | |||||||||||||||
| 5/30/2009 | $ | 24.21 | 5,000,050 | $ | 121,051,211 | 11.62 | % | 16.00 | % | 10.45 | % | -19.30 | % | |||||||||||||||
| 6/30/2009 | $ | 22.73 | 6,300,050 | $ | 143,200,137 | -6.11 | % | 4.60 | % | 3.70 | % | -24.23 | % | |||||||||||||||
| 7/31/2009 | $ | 23.44 | 5,550,000 | $ | 130,092,000 | 3.12 | % | 8.07 | % | 6.93 | % | -21.87 | % | |||||||||||||||
| 8/31/2009 | $ | 23.19 | 6,100,050 | $ | 141,460,160 | -1.07 | % | -4.21 | % | 5.79 | % | -22.70 | % | |||||||||||||||
| 9/30/2009 | $ | 23.89 | 8,350,050 | $ | 199,482,695 | 3.02 | % | 5.10 | % | 8.99 | % | -20.37 | % | |||||||||||||||
| 10/31/2009 | $ | 24.94 | 8,850,050 | $ | 220,720,247 | 4.40 | % | 6.40 | % | 13.78 | % | -16.87 | % | |||||||||||||||
| 11/30/2009 | $ | 26.09 | 7,550,050 | $ | 196,980,805 | 4.61 | % | 12.51 | % | 19.02 | % | -13.03 | % | |||||||||||||||
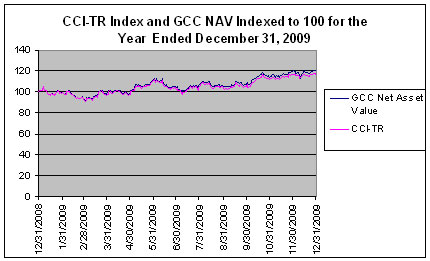
| 12/31/2009 | $ | 26.22 | 8,750,050 | $ | 229,426,311 | 0.50 | % | 9.75 | % | 19.62 | % | -12.60 | % | |||||||||||||||
| 1/31/2010 | $ | 25.09 | 9,850,050 | $ | 247,137,755 | -4.31 | % | 0.60 | % | -4.31 | % | -16.37 | % | |||||||||||||||
| 2/28/2010 | $ | 25.67 | 9,400,050 | $ | 241,299,284 | 2.31 | % | -1.61 | % | -2.10 | % | -14.43 | % | |||||||||||||||
| 3/31/2010 | $ | 25.07 | 9,550,050 | $ | 239,419,754 | -2.34 | % | -4.39 | % | -4.39 | % | -16.43 | % | |||||||||||||||
| 4/30/2010 | $ | 25.76 | 9,650,050 | $ | 248,585,288 | 2.75 | % | 2.67 | % | -1.75 | % | -14.13 | % | |||||||||||||||
| 5/31/2010 | $ | 24.50 | 9,650,050 | $ | 236,426,225 | -4.89 | % | -4.56 | % | -6.56 | % | -18.33 | % | |||||||||||||||
| 6/30/2010 | $ | 24.92 | 9,750,050 | $ | 242,971,246 | 1.71 | % | -0.60 | % | -4.96 | % | -16.93 | % | |||||||||||||||
| 7/31/2010 | $ | 26.42 | 10,200,050 | $ | 269,485,321 | 6.02 | % | 2.56 | % | 0.76 | % | -11.93 | % | |||||||||||||||
| 8/31/2010 | $ | 26.21 | 11,250,050 | $ | 294,863,811 | -0.79 | % | 6.98 | % | -0.04 | % | -12.63 | % | |||||||||||||||
| 9/30/2010 | $ | 28.14 | 11,100,050 | $ | 312,355,407 | 7.36 | % | 12.92 | % | 7.32 | % | -6.20 | % | |||||||||||||||
| 10/31/2010 | $ | 29.76 | 13,000,050 | $ | 386,881,488 | 5.76 | % | 12.64 | % | 13.50 | % | -0.80 | % | |||||||||||||||
| 11/30/2010 | $ | 29.67 | 14,900,050 | $ | 442,084,484 | -0.30 | % | 13.20 | % | 13.16 | % | -1.10 | % | |||||||||||||||
| 12/31/2010 | $ | 32.88 | 16,250,050 | $ | 534,301,644 | 10.82 | % | 16.84 | % | 25.40 | % | 9.60 | % | |||||||||||||||
| 1/31/2011 | $ | 34.01 | 17,650,050 | $ | 600,278,201 | 3.44 | % | 14.28 | % | 3.44 | % | 13.37 | % | |||||||||||||||
| 2/28/2011 | $ | 35.16 | 19,600,050 | $ | 689,137,758 | 3.38 | % | 18.50 | % | 6.93 | % | 17.20 | % | |||||||||||||||
| 3/31/2011 | $ | 35.20 | 23,250,050 | $ | 818,401,760 | 0.11 | % | 7.06 | % | 7.06 | % | 17.33 | % | |||||||||||||||
| 4/30/2011 | $ | 36.34 | 23,800,050 | $ | 864,893,817 | 3.24 | % | 6.85 | % | 10.52 | % | 21.13 | % | |||||||||||||||
| 5/31/2011 | $ | 34.87 | 22,000,050 | $ | 767,141,744 | -4.05 | % | -0.82 | % | 6.05 | % | 16.23 | % | |||||||||||||||
| 6/30/2011 | $ | 33.59 | 21,850,050 | $ | 733,943,180 | -3.67 | % | -4.57 | % | 2.16 | % | 11.97 | % | |||||||||||||||
| 7/31/2011 | $ | 34.48 | 21,000,050 | $ | 724,081,724 | 2.65 | % | -5.12 | % | 4.87 | % | 14.93 | % | |||||||||||||||
| 8/31/2011 | $ | 35.23 | 20,700,050 | $ | 729,262,762 | 2.18 | % | 1.03 | % | 7.15 | % | 17.43 | % | |||||||||||||||
| 9/30/2011 | $ | 30.46 | 20,600,050 | $ | 627,498,123 | -13.54 | % | -9.32 | % | -7.36 | % | 1.54 | % | |||||||||||||||
| 10/31/2011 | $ | 32.21 | 19,200,050 | $ | 618,433,611 | 5.74 | % | -6.58 | % | -2.04 | % | 7.37 | % | |||||||||||||||
| 11/30/2011 | $ | 31.12 | 20,300,050 | $ | 631,737,556 | -3.38 | % | -11.67 | % | -5.35 | % | 3.73 | % | |||||||||||||||
| 12/31/2011 | $ | 29.96 | 19,400,050 | $ | 581,225,498 | -3.73 | % | -1.64 | % | -8.88 | % | -0.13 | % | |||||||||||||||
| 5 Year Performance Summary | ||||||||||||||
| Date | NAV | Total Shares | Net Assets | 1 Month | 3 Months | Year to Date | Since Inception | |||||||
| 1/31/2010 | $25.09 | 9,850,050 | $247,137,755 | -4.31% | 0.60% | -4.31% | -16.37% | |||||||
| 2/28/2010 | $25.67 | 9,400,050 | $241,299,284 | 2.31% | -1.61% | -2.10% | -14.43% | |||||||
| 3/31/2010 | $25.07 | 9,550,050 | $239,419,754 | -2.34% | -4.39% | -4.39% | -16.43% | |||||||
| 4/30/2010 | $25.76 | 9,650,050 | $248,585,288 | 2.75% | 2.67% | -1.75% | -14.13% | |||||||
| 5/31/2010 | $24.50 | 9,650,050 | $236,426,225 | -4.89% | -4.56% | -6.56% | -18.33% | |||||||
| 6/30/2010 | $24.92 | 9,750,050 | $242,971,246 | 1.71% | -0.60% | -4.96% | -16.93% | |||||||
| 7/31/2010 | $26.42 | 10,200,050 | $269,485,321 | 6.02% | 2.56% | 0.76% | -11.93% | |||||||
| 8/31/2010 | $26.21 | 11,250,050 | $294,863,811 | -0.79% | 6.98% | -0.04% | -12.63% | |||||||
| 9/30/2010 | $28.14 | 11,100,050 | $312,355,407 | 7.36% | 12.92% | 7.32% | -6.20% | |||||||
| 10/31/2010 | $29.76 | 13,000,050 | $386,881,488 | 5.76% | 12.64% | 13.50% | -0.80% | |||||||
| 11/30/2010 | $29.67 | 14,900,050 | $442,084,484 | -0.30% | 13.20% | 13.16% | -1.10% | |||||||
| 12/31/2010 | $32.88 | 16,250,050 | $534,301,644 | 10.82% | 16.84% | 25.40% | 9.60% | |||||||
| 1/31/2011 | $34.01 | 17,650,050 | $600,278,201 | 3.44% | 14.28% | 3.44% | 13.37% | |||||||
| 2/28/2011 | $35.16 | 19,600,050 | $689,137,758 | 3.38% | 18.50% | 6.93% | 17.20% | |||||||
| 3/31/2011 | $35.20 | 23,250,050 | $818,401,760 | 0.11% | 7.06% | 7.06% | 17.33% | |||||||
| 4/30/2011 | $36.34 | 23,800,050 | $864,893,817 | 3.24% | 6.85% | 10.52% | 21.13% | |||||||
| 5/31/2011 | $34.87 | 22,000,050 | $767,141,744 | -4.05% | -0.82% | 6.05% | 16.23% | |||||||
| 6/30/2011 | $33.59 | 21,850,050 | $733,943,180 | -3.67% | -4.57% | 2.16% | 11.97% | |||||||
| 7/31/2011 | $34.48 | 21,000,050 | $724,081,724 | 2.65% | -5.12% | 4.87% | 14.93% | |||||||
| 8/31/2011 | $35.23 | 20,700,050 | $729,262,762 | 2.18% | 1.03% | 7.15% | 17.43% | |||||||
| 9/30/2011 | $30.46 | 20,600,050 | $627,498,123 | -13.54% | -9.32% | -7.36% | 1.54% | |||||||
| 10/31/2011 | $32.21 | 19,200,050 | $618,433,611 | 5.74% | -6.58% | -2.04% | 7.37% | |||||||
| 11/30/2011 | $31.12 | 20,300,050 | $631,737,556 | -3.38% | -11.67% | -5.35% | 3.73% | |||||||
| 12/31/2011 | $29.96 | 19,400,050 | $581,225,498 | -3.73% | -1.64% | -8.88% | -0.13% | |||||||
| 1/31/2012 | $31.29 | 19,550,050 | $611,721,065 | 4.44% | -2.86% | 4.44% | 4.30% | |||||||
| 2/29/2012 | $31.70 | 21,350,050 | $676,796,585 | 1.31% | 1.86% | 5.81% | 5.67% | |||||||
| 3/31/2012 | $30.35 | 21,250,050 | $644,939,018 | -4.26% | 1.30% | 1.30% | 1.17% | |||||||
| 4/30/2012 | $29.51 | 20,550,050 | $606,431,976 | -2.77% | -5.69% | -1.50% | -1.63% | |||||||
| 5/31/2012 | $26.95 | 18,300,050 | $493,186,348 | -8.68% | -14.98% | -10.05% | -10.17% | |||||||
| 6/30/2012 | $28.43 | 18,000,050 | $511,741,422 | 5.49% | -6.33% | -5.11% | -5.23% | |||||||
| 7/31/2012 | $29.65 | 17,100,050 | $507,016,483 | 4.29% | 0.47% | -1.03% | -1.17% | |||||||
| 8/31/2012 | $30.35 | 16,650,050 | $505,329,018 | 2.36% | 12.62% | 1.30% | 1.17% | |||||||
| 9/30/2012 | $30.57 | 16,900,050 | $516,634,529 | 0.72% | 7.53% | 2.04% | 1.90% | |||||||
| 10/31/2012 | $29.56 | 16,600,050 | $490,697,478 | -3.30% | -0.30% | -1.34% | -1.47% | |||||||
| 11/30/2012 | $29.83 | 16,750,050 | $499,653,992 | 0.91% | -1.71% | -0.43% | -0.57% | |||||||
| 12/31/2012 | $28.85 | 16,450,050 | $474,583,943 | -3.29% | -5.63% | -3.70% | -3.83% | |||||||
| 1/31/2013 | $29.50 | 16,450,050 | $485,276,475 | 2.25% | -0.20% | 2.25% | -1.67% | |||||||
| 2/28/2013 | $28.21 | 16,500,050 | $465,466,411 | -4.37% | -5.43% | -2.22% | -5.97% | |||||||
| 3/31/2013 | $28.26 | 17,000,050 | $480,421,413 | 0.18% | -2.05% | -2.05% | -5.80% | |||||||
| 4/30/2013 | $27.65 | 16,800,050 | $464,521,383 | -2.16% | -6.27% | -4.16% | -7.83% | |||||||
| 5/31/2013 | $26.89 | 16,200,050 | $435,619,345 | -2.75% | -4.68% | -6.79% | -10.37% | |||||||
| 6/30/2013 | $25.76 | 15,700,050 | $404,433,288 | -4.20% | -8.85% | -10.71% | -14.13% | |||||||
| 7/31/2013 | $26.01 | 14,900,050 | $387,550,301 | 0.97% | -5.93% | -9.84% | -13.30% | |||||||
| 8/31/2013 | $26.84 | 13,550,050 | $363,683,342 | 3.19% | -0.19% | -6.97% | -10.53% | |||||||
| 9/30/2013 | $26.48 | 13,400,050 | $354,833,324 | -1.34% | 2.80% | -8.21% | -11.73% | |||||||
| 10/31/2013 | $26.15 | 13,300,050 | $347,796,308 | -1.25% | 0.54% | -9.36% | -12.83% | |||||||
| 11/30/2013 | $25.84 | 13,300,050 | $343,673,292 | -1.19% | -3.73% | -10.43% | -13.87% | |||||||
| 12/31/2013 | $25.70 | 12,450,050 | $319,966,285 | -0.54% | -2.95% | -10.92% | -14.33% | |||||||
| 1/31/2014 | $25.87 | 11,900,050 | $307,854,294 | 0.66% | -1.07% | -10.33% | -13.77% | |||||||
| 2/28/2014 | $27.80 | 12,350,050 | $343,331,390 | 7.46% | 7.59% | -3.64% | -7.33% | |||||||
| 3/31/2014 | $28.19 | 12,350,050 | $348,147,910 | 1.40% | 9.69% | 9.69% | -6.03% | |||||||
| 4/30/2014 | $28.74 | 12,500,050 | $359,251,437 | 1.95% | 11.09% | 11.83% | -4.20% | |||||||
| 5/31/2014 | $27.78 | 12,800,050 | $355,585,389 | -3.34% | -0.07% | 8.09% | -7.40% | |||||||
| 6/30/2014 | $27.91 | 12,900,050 | $360,040,396 | 0.47% | -0.99% | 8.60% | -6.97% | |||||||
| 7/31/2014 | $26.62 | 13,150,050 | $350,054,331 | -4.62% | -7.38% | 3.58% | -11.27% | |||||||
| 8/31/2014 | $26.25 | 13,150,050 | $345,188,813 | -1.39% | -5.51% | 2.14% | -12.50% | |||||||
| 9/30/2014 | $24.79 | 12,950,050 | $321,031,740 | -5.56% | -11.18% | -3.54% | -17.37% | |||||||
| 10/31/2014 | $24.73 | 12,750,050 | $315,308,737 | -0.24% | -7.10% | -3.77% | -17.57% | |||||||
| 11/30/2014 | $23.97 | 12,250,050 | $293,633,699 | -3.07% | -8.69% | -6.73% | -20.10% | |||||||
| 12/31/2014 | $22.81 | 11,700,050 | $266,878,141 | -4.84% | -7.99% | -11.25% | -23.97% | |||||||
Board of Managers and Shareholders of
GreenHaven Continuous Commodity Index Fund:
We have audited the accompanying consolidated statements of financial condition, including the consolidated schedules of investments, of GreenHaven Continuous Commodity Index Fund (a Delaware Statutory Trust) and subsidiary as of December 31, 20112014 and 2010, the consolidated schedule of investments as of December 31, 2011 and 2010,2013, and the related consolidated statements of income and expenses, changes in shareholders’ equity, and cash flows for each of the three years in the three-year period ended December 31, 2011.2014. These financial statements are the responsibility of the GreenHaven Continuous Commodity Index Fund’s management. Our responsibility is to express an opinion on these financial statements based on our audits.
We conducted our audits in accordance with the standards of the Public Company Accounting Oversight Board (United States). Those standards require that we plan and perform the audit to obtain reasonable assurance about whether the financial statements are free of material misstatement. An audit includes examining, on a test basis, evidence supporting the amounts and disclosures in the financial statements. An audit also includes assessing the accounting principles used and significant estimates made by management, as well as evaluating the overall financial statement presentation. We believe that our audits provide a reasonable basis for our opinion.
In our opinion, the consolidated financial statements referred to above present fairly, in all material respects, the financial position of the GreenHaven Continuous Commodity Index Fund and subsidiary as of December 31, 20112014 and 2010,2013, and the results of itstheir operations and itstheir cash flows for each of the three years in the three-year period ended December 31, 2011,2014 in conformity with accounting principles generally accepted in the United States of America.
We also have audited, in accordance with the standards of the Public Company Accounting Oversight Board (United States), Greenhaventhe GreenHaven Continuous Commodity Index Fund’s internal control over financial reporting as of December 31, 2011,2014, based on criteria established in the 2013Internal Control-IntegratedControl—Integrated Frameworkissued by the Committee of Sponsoring Organizations of the Treadway Commission (COSO), and our report dated February 28, 2012March 6, 2015 expressed an unqualified opinion thereon.
/s/ GRANT THORNTON LLP
Atlanta, Georgia
March 6, 2015
Board of Managers and Shareholders of
GreenHaven Continuous Commodity Index Master Fund:
We have audited the accompanying statements of financial condition, including the schedules of investments, of GreenHaven Continuous Commodity Index Master Fund (a Delaware Statutory Trust) as of December 31, 20112014 and 2010, the schedule of investments as of December 31, 2011 and 2010,2013, and the related statements of income and expenses, changes in shareholders’ equity, and cash flows for each of the three years in the three-year period ended December 31, 2011.2014. These financial statements are the responsibility of the GreenHaven Continuous Commodity Index Master Fund’s management. Our responsibility is to express an opinion on these financial statements based on our audits.
We conducted our audits in accordance with the standards of the Public Company Accounting Oversight Board (United States). Those standards require that we plan and perform the audit to obtain reasonable assurance about whether the financial statements are free of material misstatement. An audit includes examining, on a test basis, evidence supporting the amounts and disclosures in the financial statements. An audit also includes assessing the accounting principles used and significant estimates made by management, as well as evaluating the overall financial statement presentation. We believe that our audits provide a reasonable basis for our opinion.
In our opinion, the financial statements referred to above present fairly, in all material respects, the financial position of the GreenHaven Continuous Commodity Index Master Fund as of December 31, 20112014 and 2010,2013, and the results of its operations and its cash flows for each of the three years in the three-year period ended December 31, 2011,2014 in conformity with accounting principles generally accepted in the United States of America.
We also have audited, in accordance with the standards of the Public Company Accounting Oversight Board (United States), the GreenHaven Continuous Commodity Index Master Fund’s internal control over financial reporting as of December 31, 2011,2014, based on criteria established in the 2013Internal Control-IntegratedControl—Integrated Frameworkissued by the Committee of Sponsoring Organizations of the Treadway Commission (COSO), and our report dated February 28, 2012March 6, 2015 expressed an unqualified opinion thereon.
/s/ GRANT THORNTON LLP
Atlanta, Georgia
March 6, 2015
| 2014 | 2013 | |||||||
| Assets | ||||||||
| Equity in broker trading accounts: | ||||||||
Short-term investments (cost $199,994,069 and $199,996,365 as of 2014 and 2013, respectively) | $ | 199,995,250 | $ | 199,998,800 | ||||
| Cash held by broker | 94,433,074 | 124,417,599 | ||||||
| Net unrealized depreciation on futures contracts | (27,249,076 | ) | (4,055,188 | ) | ||||
| Total assets | $ | 267,179,248 | $ | 320,361,211 | ||||
| Liabilities and shareholders’ equity | ||||||||
| Management fee payable to related party | 205,492 | 241,143 | ||||||
| Accrued brokerage fees and expenses payable | 75,622 | 127,484 | ||||||
| Total liabilities | 281,114 | 368,627 | ||||||
| Shareholders’ equity | ||||||||
| General Units: | ||||||||
| Paid in capital - 50 units issued | 1,500 | 1,500 | ||||||
| Accumulated deficit | (360 | ) | (215 | ) | ||||
| Total General Units | 1,140 | 1,285 | ||||||
| Limited Units: | ||||||||
Paid in capital - 11,700,000 and 12,450,000 redeemable shares issued and outstanding as of 2014 and 2013, respectively | 350,523,308 | 364,838,413 | ||||||
| Accumulated deficit | (83,626,314 | ) | (44,847,114 | ) | ||||
| Total Limited Units | 266,896,994 | 319,991,299 | ||||||
| Total shareholders’ equity | 266,898,134 | 319,992,584 | ||||||
| Total liabilities and shareholders’ equity | $ | 267,179,248 | $ | 320,361,211 | ||||
| Net asset value per share | ||||||||
| General Units | $ | 22.80 | $ | 25.70 | ||||
| Limited Units | $ | 22.81 | $ | 25.70 | ||||
| Percentage | Fair | Face | ||||||||||
| Description | of Net Assets | Value | Value | |||||||||
| U.S. Treasury Obligations | ||||||||||||
| U.S. Treasury Bills, 0.01% due January 22, 2015 | 37.47 | % | $ | 99,998,600 | $ | 100,000,000 | ||||||
| U.S. Treasury Bills, 0.03% due March 12, 2015 | 18.73 | 49,998,100 | 50,000,000 | |||||||||
| U.S. Treasury Bills, 0.06% due March 26, 2015 | 18.73 | 49,998,550 | 50,000,000 | |||||||||
| Total U.S. Treasury Obligations (cost $199,994,069) | 74.93 | % | $ | 199,995,250 | $ | 200,000,000 | ||||||
| Percentage | Fair | Notional | ||||||||||
| Description | of Net Assets | Value | Value | |||||||||
| Unrealized Appreciation/(Depreciation) on Futures Contracts | ||||||||||||
| Cocoa (181 contracts, settlement date July 16, 2015) | 0.03 | % | $ | 83,950 | $ | 5,229,090 | ||||||
| Cocoa (181 contracts, settlement date May 13, 2015) | (0.13 | ) | (334,480 | ) | 5,234,520 | |||||||
| Cocoa (181 contracts, settlement date March 16, 2015) | (0.12 | ) | (316,920 | ) | 5,267,100 | |||||||
| Coffee (82 contracts, settlement date July 21, 2015) | (0.25 | ) | (671,513 | ) | 5,285,925 | |||||||
| Coffee (82 contracts, settlement date May 18, 2015) | (0.27 | ) | (719,438 | ) | 5,205,975 | |||||||
| Coffee (83 contracts, settlement date March 19, 2015) | (0.28 | ) | (747,038 | ) | 5,185,425 | |||||||
| Copper (74 contracts, settlement date July 29, 2015) | (0.12 | ) | (320,262 | ) | 5,227,175 | |||||||
| Copper (74 contracts, settlement date May 27, 2015) | (0.22 | ) | (584,150 | ) | 5,223,475 | |||||||
| Copper (74 contracts, settlement date March 27, 2015) | (0.21 | ) | (559,600 | ) | 5,227,175 | |||||||
| Corn (258 contracts, settlement date July 14, 2015) | 0.04 | 101,863 | 5,321,250 | |||||||||
| Corn (258 contracts, settlement date May 14, 2015) | 0.09 | 250,975 | 5,234,175 | |||||||||
| Corn (259 contracts, settlement date March 13, 2015) | 0.09 | 242,600 | 5,141,150 | |||||||||
| Cotton (171 contracts, settlement date July 09, 2015) | 0.00 | * | 5,610 | 5,301,000 | ||||||||
| Cotton (171 contracts, settlement date May 06, 2015) | (0.12 | ) | (316,150 | ) | 5,221,485 | |||||||
| Cotton (171 contracts, settlement date March 09, 2015) | (0.27 | ) | (716,905 | ) | 5,153,085 | |||||||
| Gold (44 contracts, settlement date June 26, 2015) | 0.03 | 88,470 | 5,215,760 | |||||||||
| Gold (44 contracts, settlement date April 28, 2015) | (0.17 | ) | (446,860 | ) | 5,213,560 | |||||||
| Gold (44 contracts, settlement date February 25, 2015) | (0.13 | ) | (335,420 | ) | 5,210,040 | |||||||
| Lean Hogs (113 contracts, settlement date July 15, 2015) | (0.07 | ) | (176,480 | ) | 4,098,510 | |||||||
| Lean Hogs (113 contracts, settlement date June 12, 2015) | (0.07 | ) | (188,950 | ) | 4,138,060 | |||||||
| Lean Hogs (113 contracts, settlement date April 15, 2015) | (0.07 | ) | (197,270 | ) | 3,764,030 | |||||||
| Lean Hogs (113 contracts, settlement date February 13, 2015) | (0.12 | ) | (315,750 | ) | 3,670,240 | |||||||
| Light, Sweet Crude Oil (57 contracts, settlement date May 19, 2015) | (0.33 | ) | (893,390 | ) | 3,172,050 | |||||||
| Light, Sweet Crude Oil (58 contracts, settlement date April 21, 2015) | (0.38 | ) | (1,019,440 | ) | 3,187,680 | |||||||
| Light, Sweet Crude Oil (58 contracts, settlement date March 20, 2015) | (0.57 | ) | (1,532,690 | ) | 3,147,080 | |||||||
| Light, Sweet Crude Oil (58 contracts, settlement date February 20, 2015) | (0.58 | ) | (1,560,200 | ) | 3,114,600 | |||||||
| Light, Sweet Crude Oil (58 contracts, settlement date January 20, 2015) | (0.58 | ) | (1,550,530 | ) | 3,089,660 | |||||||
| Live Cattle (82 contracts, settlement date June 30, 2015) | (0.04 | ) | (114,190 | ) | 5,080,720 | |||||||
| Live Cattle (81 contracts, settlement date April 30, 2015) | 0.08 | 218,730 | 5,261,760 | |||||||||
| Live Cattle (81 contracts, settlement date February 27, 2015) | 0.09 | 242,130 | 5,299,020 | |||||||||
| Natural Gas (108 contracts, settlement date May 27, 2015) | (0.25 | ) | (668,300 | ) | 3,189,240 | |||||||
| Natural Gas (108 contracts, settlement date April 28, 2015) | (0.26 | ) | (694,840 | ) | 3,136,320 | |||||||
| Natural Gas (108 contracts, settlement date March 27, 2015) | (0.29 | ) | (786,680 | ) | 3,111,480 | |||||||
| Natural Gas (108 contracts, settlement date February 25, 2015) | (0.37 | ) | (1,000,490 | ) | 3,127,680 | |||||||
| Natural Gas (108 contracts, settlement date January 28, 2015) | (0.40 | ) | (1,071,100 | ) | 3,120,120 | |||||||
| NY Harbor ULSD (42 contracts, settlement date May 29, 2015) | (0.33 | ) | (873,041 | ) | 3,200,602 | |||||||
| NY Harbor ULSD (41 contracts, settlement date April 30, 2015) | (0.32 | ) | (861,353 | ) | 3,105,627 | |||||||
| NY Harbor ULSD (41 contracts, settlement date March 31, 2015) | (0.50 | ) | (1,337,461 | ) | 3,104,594 | |||||||
| NY Harbor ULSD (41 contracts, settlement date February 27, 2015) | (0.53 | ) | (1,409,974 | ) | 3,129,218 | |||||||
| NY Harbor ULSD (41 contracts, settlement date January 30, 2015) | (0.50 | ) | (1,333,559 | ) | 3,157,459 | |||||||
| Platinum (130 contracts, settlement date July 29, 2015) | 0.01 | 33,995 | 7,871,500 | |||||||||
| Platinum (129 contracts, settlement date April 28, 2015) | 0.01 | 20,485 | 7,801,275 | |||||||||
| Silver (66 contracts, settlement date July 29, 2015) | (0.02 | ) | (47,050 | ) | 5,168,460 | |||||||
| Silver (67 contracts, settlement date May 27, 2015) | (0.35 | ) | (940,295 | ) | 5,236,720 | |||||||
| Silver (67 contracts, settlement date March 27, 2015) | (0.34 | ) | (913,105 | ) | 5,225,665 | |||||||
| Soybean (101 contracts, settlement date July 14, 2015) | (0.03 | ) | (92,050 | ) | 5,236,850 | |||||||
| Soybean (101 contracts, settlement date May 14, 2015) | (0.07 | ) | (199,812 | ) | 5,204,025 | |||||||
| Soybean (102 contracts, settlement date March 13, 2015) | (0.06 | ) | (163,712 | ) | 5,219,850 | |||||||
| Soybean Oil (269 contracts, settlement date July 14, 2015) | (0.04 | ) | (102,582 | ) | 5,253,570 | |||||||
| Soybean Oil (269 contracts, settlement date May 14, 2015) | (0.13 | ) | (336,222 | ) | 5,221,290 | |||||||
| Soybean Oil (270 contracts, settlement date March 13, 2015) | (0.13 | ) | (337,578 | ) | 5,206,680 | |||||||
| Sugar (314 contracts, settlement date June 30, 2015) | (0.17 | ) | (441,795 | ) | 5,363,120 | |||||||
| Sugar (315 contracts, settlement date April 30, 2015) | (0.31 | ) | (834,389 | ) | 5,263,776 | |||||||
| Sugar (315 contracts, settlement date February 27, 2015) | (0.39 | ) | (1,039,808 | ) | 5,122,656 | |||||||
| Wheat (176 contracts, settlement date July 14, 2015) | 0.12 | 314,688 | 5,258,000 | |||||||||
| Wheat (176 contracts, settlement date May 14, 2015) | 0.04 | 106,325 | 5,231,600 | |||||||||
| Wheat (176 contracts, settlement date March 13, 2015) | 0.05 | 143,925 | 5,189,800 | |||||||||
| Net Unrealized Depreciation on Futures Contracts | (10.21 | )% | $ | (27,249,076 | ) | $ | 266,577,952 | |||||
| 2011 | 2010 | |||||||
| Assets | ||||||||
| Equity in broker trading accounts: | ||||||||
| Short-term investments (cost $9,999,989 and $469,919,567 as of 2011 and 2010, respectively) | $ | 9,999,990 | $ | 469,939,860 | ||||
| Cash held by broker | 619,079,494 | 6,487,519 | ||||||
| Net unrealized (depreciation) appreciation on futures contracts | (45,001,789 | ) | 58,639,682 | |||||
| Total assets | $ | 584,077,695 | $ | 535,067,061 | ||||
| Liabilities and shareholders’ equity | ||||||||
| Capital shares payable | $ | 1,497,826 | $ | - | ||||
| Management fee payable to related party | 438,205 | 352,427 | ||||||
| Broker fee payable | 983,648 | 351,579 | ||||||
| Total liabilities | 2,919,679 | 704,006 | ||||||
| Shareholders’ equity | ||||||||
| General Units: | ||||||||
| Paid in capital - 50 units issued | 1,500 | 1,500 | ||||||
| Retained (deficit) earnings | (2 | ) | 144 | |||||
| Total General Units | 1,498 | 1,644 | ||||||
| Limited Units: | ||||||||
| Paid in capital - 19,400,000 and 16,250,000 redeemable units issued and outstanding as of 2011 and 2010, respectively | 549,362,581 | 428,801,695 | ||||||
| Retained earnings | 31,793,937 | 105,559,716 | ||||||
| Total Limited Units | 581,156,518 | 534,361,411 | ||||||
| Total shareholders’ equity | 581,158,016 | 534,363,055 | ||||||
| Total liabilities and shareholders’ equity | $ | 584,077,695 | $ | 535,067,061 | ||||
| Net asset value per share | ||||||||
| General Units | $ | 29.96 | $ | 32.88 | ||||
| Limited Units | $ | 29.96 | $ | 32.88 | ||||
| Percentage of | Fair | Face | ||||||||||
| Description | Net Assets | Value | Value | |||||||||
| U.S. Treasury Obligations | ||||||||||||
| U.S. Treasury Bill, 0.00% due January 05, 2012 (cost $9,999,989) | 1.72 | % | $ | 9,999,990 | $ | 10,000,000 | ||||||
| Percentage of | Fair | Notional | ||||||||||
| Description | Net Assets | Value | Value | |||||||||
| Unrealized Appreciation/(Depreciation) on Futures Contracts | ||||||||||||
| Cocoa (535 contracts, settlement date March 15, 2012) | (0.55 | ) % | $ | (3,205,990 | ) | $ | 11,283,150 | |||||
| Cocoa (536 contracts, settlement date May 15, 2012) | (0.53 | ) | (3,093,380 | ) | 11,422,160 | |||||||
| Cocoa (536 contracts, settlement date July 16, 2012) | (0.33 | ) | (1,932,240 | ) | 11,513,280 | |||||||
| Coffee (133 contracts, settlement date March 20, 2012) | (0.15 | ) | (896,456 | ) | 11,314,144 | |||||||
| Coffee (132 contracts, settlement date May 18, 2012) | (0.16 | ) | (919,744 | ) | 11,367,675 | |||||||
| Coffee (132 contracts, settlement date July 19, 2012) | (0.06 | ) | (352,538 | ) | 11,493,900 | |||||||
| Copper (133 contracts, settlement date March 28, 2012) | (0.10 | ) | (592,150 | ) | 11,424,700 | |||||||
| Copper (132 contracts, settlement date May 29, 2012) | (0.11 | ) | (608,013 | ) | 11,376,750 | |||||||
| Copper (132 contracts, settlement date July 27, 2012) | 0.01 | 51,438 | 11,401,500 | |||||||||
| Corn (349 contracts, settlement date March 14, 2012) | (0.15 | ) | (862,200 | ) | 11,281,425 | |||||||
| Corn (349 contracts, settlement date May 14, 2012) | (0.15 | ) | (839,875 | ) | 11,425,387 | |||||||
| Corn (348 contracts, settlement date July 13, 2012) | 0.01 | 33,125 | 11,505,750 | |||||||||
| Cotton (249 contracts, settlement date March 08, 2012) | (0.13 | ) | (726,570 | ) | 11,429,100 | |||||||
| Cotton (248 contracts, settlement date May 08, 2012) | (0.15 | ) | (851,265 | ) | 11,368,320 | |||||||
| Cotton (248 contracts, settlement date July 09, 2012) | (0.12 | ) | (721,380 | ) | 11,322,440 | |||||||
| Florida Orange Juice (561 contracts, settlement date March 12, 2012) | 0.04 | 257,978 | 14,221,350 | |||||||||
| Florida Orange Juice (486 contracts, settlement date May 10, 2012) | 0.15 | 856,470 | 12,261,780 | |||||||||
| Florida Orange Juice (306 contracts, settlement date July 11, 2012) | (0.01 | ) | (32,880 | ) | 7,738,740 | |||||||
| Gold (72 contracts, settlement date February 27, 2012) | (0.09 | ) | (527,380 | ) | 11,280,960 | |||||||
| Gold (72 contracts, settlement date April 26, 2012) | (0.21 | ) | (1,233,460 | ) | 11,299,680 | |||||||
| Gold (73 contracts, settlement date June 27, 2012) | (0.25 | ) | (1,434,620 | ) | 11,472,680 | |||||||
| Heating Oil (57 contracts, settlement date January 31, 2012) | (0.02 | ) | (109,389 | ) | 6,976,595 | |||||||
| Heating Oil (56 contracts, settlement date February 29, 2012) | (0.02 | ) | (101,056 | ) | 6,834,677 | |||||||
| Heating Oil (56 contracts, settlement date March 30, 2012) | (0.02 | ) | (111,661 | ) | 6,789,283 | |||||||
| Heating Oil (56 contracts, settlement date April 30, 2012) | (0.09 | ) | (493,088 | ) | 6,734,482 | |||||||
| Heating Oil (56 contracts, settlement date May 31, 2012) | (0.08 | ) | (488,053 | ) | 6,693,557 | |||||||
| Lean Hogs (236 contracts, settlement date February 14, 2012) | (0.07 | ) | (384,030 | ) | 7,957,920 | |||||||
| Lean Hogs (236 contracts, settlement date April 16, 2012) | (0.06 | ) | (325,560 | ) | 8,278,880 | |||||||
| Lean Hogs (235 contracts, settlement date June 14, 2012) | (0.05 | ) | (275,680 | ) | 8,977,000 | |||||||
| Lean Hogs (236 contracts, settlement date July 16, 2012) | (0.04 | ) | (210,990 | ) | 8,951,480 | |||||||
| Light, Sweet Crude Oil (69 contracts, settlement date January 20, 2012) | 0.13 | 727,240 | 6,819,270 | |||||||||
| Light, Sweet Crude Oil (69 contracts, settlement date February 21, 2012) | 0.13 | 746,950 | 6,831,000 | |||||||||
| Light, Sweet Crude Oil (69 contracts, settlement date March 20, 2012) | 0.13 | 746,560 | 6,845,490 | |||||||||
| Light, Sweet Crude Oil (69 contracts, settlement date April 20, 2012) | 0.01 | 82,600 | 6,859,290 | |||||||||
| Light, Sweet Crude Oil (68 contracts, settlement date May 22, 2012) | 0.02 | 113,320 | 6,764,640 | |||||||||
| Live Cattle (229 contracts, settlement date February 29, 2012) | 0.00 | * | 2,380 | 11,124,820 | ||||||||
| Live Cattle (230 contracts, settlement date April 30, 2012) | (0.02 | ) | (131,730 | ) | 11,541,400 | |||||||
| Live Cattle (230 contracts, settlement date June 29, 2012) | (0.02 | ) | (122,410 | ) | 11,460,900 | |||||||
| Natural Gas (224 contracts, settlement date January 27, 2012) | (0.40 | ) | (2,315,920 | ) | 6,695,360 | |||||||
| Natural Gas (224 contracts, settlement date February 27, 2012) | (0.38 | ) | (2,204,450 | ) | 6,755,840 | |||||||
| Natural Gas (220 contracts, settlement date March 28, 2012) | (0.36 | ) | (2,067,940 | ) | 6,773,800 | |||||||
| Natural Gas (220 contracts, settlement date April 26, 2012) | (0.20 | ) | (1,188,850 | ) | 6,888,200 | |||||||
| Natural Gas (219 contracts, settlement date May 29, 2012) | (0.20 | ) | (1,169,040 | ) | 6,968,580 | |||||||
| Platinum (243 contracts, settlement date April 26, 2012) | (0.43 | ) | (2,468,450 | ) | 17,069,535 | |||||||
| Platinum (243 contracts, settlement date July 27, 2012) | (0.44 | ) | (2,566,290 | ) | 17,124,210 | |||||||
| Silver (82 contracts, settlement date March 28, 2012) | (0.35 | ) | (2,055,925 | ) | 11,445,150 | |||||||
| Silver (81 contracts, settlement date May 29, 2012) | (0.38 | ) | (2,222,650 | ) | 11,323,800 | |||||||
| Silver (81 contracts, settlement date July 27, 2012) | (0.33 | ) | (1,944,665 | ) | 11,338,785 | |||||||
| Soybean (186 contracts, settlement date March 14, 2012) | (0.17 | ) | (1,016,225 | ) | 11,232,075 | |||||||
| Soybean (187 contracts, settlement date May 14, 2012) | (0.16 | ) | (954,425 | ) | 11,383,625 | |||||||
| Soybean (187 contracts, settlement date July 13, 2012) | 0.05 | 264,900 | 11,472,450 | |||||||||
| Sugar (444 contracts, settlement date February 29, 2012) | (0.24 | ) | (1,406,339 | ) | 11,586,624 | |||||||
| Sugar (444 contracts, settlement date April 30, 2012) | (0.20 | ) | (1,152,122 | ) | 11,412,576 | |||||||
| Sugar (444 contracts, settlement date June 29, 2012) | (0.09 | ) | (545,496 | ) | 11,218,637 | |||||||
| Wheat (343 contracts, settlement date March 14, 2012) | (0.20 | ) | (1,133,987 | ) | 11,194,662 | |||||||
| Wheat (340 contracts, settlement date May 14, 2012) | (0.19 | ) | (1,118,513 | ) | 11,411,250 | |||||||
| Wheat (340 contracts, settlement date July 13, 2012) | 0.04 | 230,325 | 11,666,250 | |||||||||
| Net Unrealized Depreciation on Futures Contracts | (7.74 | ) % | $ | (45,001,789 | ) | $ | 580,606,964 | |||||
| * | Denotes greater than 0.000% yet less than 0.005% |
| Percentage | Fair | Face | ||||||||||
| Description | of Net Assets | Value | Value | |||||||||
| U.S. Treasury Obligations | ||||||||||||
| U.S. Treasury Bills, 0.01% due January 16, 2014 | 15.62 | % | $ | 49,999,850 | $ | 50,000,000 | ||||||
| U.S. Treasury Bills, 0.01% due January 23, 2014 | 46.88 | 149,998,950 | 150,000,000 | |||||||||
| Total U.S. Treasury Obligations (cost $199,996,365) | 62.50 | % | $ | 199,998,800 | $ | 200,000,000 | ||||||
| Percentage | Fair | Notional | ||||||||||
| Description | of Net Assets | Value | Value | |||||||||
| Unrealized Appreciation/(Depreciation) on Futures Contracts | �� | |||||||||||
| Cocoa (231 contracts, settlement date July 16, 2014) | 0.01 | % | $ | 35,760 | $ | 6,292,440 | ||||||
| Cocoa (231 contracts, settlement date May 14, 2014) | 0.13 | 411,440 | 6,273,960 | |||||||||
| Cocoa (231 contracts, settlement date March 14, 2014) | 0.12 | 381,180 | 6,257,790 | |||||||||
| Coffee (148 contracts, settlement date July 21, 2014) | 0.07 | 216,881 | 6,388,050 | |||||||||
| Coffee (148 contracts, settlement date May 19, 2014) | (0.17 | ) | (536,812 | ) | 6,268,725 | |||||||
| Coffee (148 contracts, settlement date March 19, 2014) | (0.17 | ) | (545,550 | ) | 6,143,850 | |||||||
| Copper (74 contracts, settlement date July 29, 2014) | 0.06 | 200,375 | 6,240,975 | |||||||||
| Copper (74 contracts, settlement date May 28, 2014) | 0.07 | 207,963 | 6,262,250 | |||||||||
| Copper (74 contracts, settlement date March 27, 2014) | 0.08 | 240,550 | 6,283,525 | |||||||||
| Corn (292 contracts, settlement date July 14, 2014) | (0.05 | ) | (170,225 | ) | 6,380,200 | |||||||
| Corn (292 contracts, settlement date May 14, 2014) | (0.19 | ) | (618,075 | ) | 6,281,650 | |||||||
| Corn (292 contracts, settlement date March 14, 2014) | (0.20 | ) | (625,900 | ) | 6,161,200 | |||||||
| Cotton (149 contracts, settlement date July 09, 2014) | 0.09 | 301,180 | 6,256,510 | |||||||||
| Cotton (149 contracts, settlement date May 07, 2014) | 0.00 | * | (10,605 | ) | 6,287,800 | |||||||
| Cotton (148 contracts, settlement date March 07, 2014) | (0.02 | ) | (59,930 | ) | 6,263,360 | |||||||
| Gold (52 contracts, settlement date June 26, 2014) | (0.15 | ) | (487,650 | ) | 6,258,720 | |||||||
| Gold (52 contracts, settlement date April 28, 2014) | (0.15 | ) | (482,440 | ) | 6,255,600 | |||||||
| Gold (52 contracts, settlement date February 26, 2014) | (0.17 | ) | (529,510 | ) | 6,251,960 | |||||||
| Lean Hogs (125 contracts, settlement date July 15, 2014) | 0.02 | 72,180 | 4,942,500 | |||||||||
| Lean Hogs (125 contracts, settlement date June 13, 2014) | 0.01 | 46,480 | 5,007,500 | |||||||||
| Lean Hogs (125 contracts, settlement date April 14, 2014) | 0.07 | 229,450 | 4,533,750 | |||||||||
| Lean Hogs (126 contracts, settlement date February 14, 2014) | 0.00 | ** | 9,330 | 4,305,420 | ||||||||
| Light, Sweet Crude Oil (39 contracts, settlement date May 20, 2014) | 0.04 | 136,060 | 3,793,920 | |||||||||
| Light, Sweet Crude Oil (38 contracts, settlement date April 22, 2014) | 0.05 | 144,650 | 3,723,620 | |||||||||
| Light, Sweet Crude Oil (38 contracts, settlement date March 20, 2014) | 0.02 | 55,240 | 3,740,720 | |||||||||
| Light, Sweet Crude Oil (38 contracts, settlement date February 20, 2014) | 0.01 | 31,670 | 3,744,900 | |||||||||
| Light, Sweet Crude Oil (38 contracts, settlement date January 21, 2014) | 0.00 | ** | 5,710 | 3,739,960 | ||||||||
| Live Cattle (118 contracts, settlement date June 30, 2014) | 0.01 | 44,040 | 6,108,860 | |||||||||
| Live Cattle (117 contracts, settlement date April 30, 2014) | 0.06 | 187,100 | 6,332,040 | |||||||||
| Live Cattle (118 contracts, settlement date February 28, 2014) | 0.10 | 335,300 | 6,354,300 | |||||||||
| Natural Gas (91 contracts, settlement date May 28, 2014) | 0.12 | 397,390 | 3,743,740 | |||||||||
| Natural Gas (91 contracts, settlement date April 28, 2014) | 0.13 | 412,180 | 3,726,450 | |||||||||
| Natural Gas (91 contracts, settlement date March 27, 2014) | 0.11 | 362,890 | 3,735,550 | |||||||||
| Natural Gas (90 contracts, settlement date February 26, 2014) | 0.12 | 383,380 | 3,773,700 | |||||||||
| Natural Gas (90 contracts, settlement date January 29, 2014) | 0.12 | 395,000 | 3,807,000 | |||||||||
| NY Harbor ULSD (30 contracts, settlement date May 30, 2014) *** | 0.06 | 205,317 | 3,810,996 | |||||||||
| NY Harbor ULSD (30 contracts, settlement date April 30, 2014) *** | 0.07 | 207,673 | 3,822,714 | |||||||||
| NY Harbor ULSD (29 contracts, settlement date March 31, 2014) *** | 0.04 | 116,840 | 3,706,983 | |||||||||
| NY Harbor ULSD (29 contracts, settlement date February 28, 2014) *** | 0.03 | 102,001 | 3,719,528 | |||||||||
| NY Harbor ULSD (29 contracts, settlement date January 31, 2014) *** | 0.04 | 113,904 | 3,733,414 | |||||||||
| Platinum (137 contracts, settlement date July 29, 2014) | (0.15 | ) | (490,930 | ) | 9,430,395 | |||||||
| Platinum (137 contracts, settlement date April 28, 2014) | (0.18 | ) | (574,305 | ) | 9,410,530 | |||||||
| Silver (64 contracts, settlement date July 29, 2014) | (0.18 | ) | (567,615 | ) | 6,220,160 | |||||||
| Silver (65 contracts, settlement date May 28, 2014) | (0.15 | ) | (490,235 | ) | 6,306,625 | |||||||
| Silver (65 contracts, settlement date March 27, 2014) | (0.15 | ) | (479,325 | ) | 6,295,250 | |||||||
| Soybean (98 contracts, settlement date July 14, 2014) | 0.06 | 182,763 | 6,196,050 | |||||||||
| Soybean (98 contracts, settlement date May 14, 2014) | 0.11 | 344,875 | 6,257,300 | |||||||||
| Soybean (98 contracts, settlement date March 14, 2014) | 0.13 | 401,825 | 6,333,250 | |||||||||
| Soybean Oil (266 contracts, settlement date July 14, 2014) | (0.12 | ) | (397,332 | ) | 6,361,656 | |||||||
| Soybean Oil (264 contracts, settlement date May 14, 2014) | (0.15 | ) | (466,266 | ) | 6,255,216 | |||||||
| Soybean Oil (264 contracts, settlement date March 14, 2014) | (0.14 | ) | (450,534 | ) | 6,198,192 | |||||||
| Sugar (338 contracts, settlement date June 30, 2014) | (0.12 | ) | (385,806 | ) | 6,333,309 | |||||||
| Sugar (338 contracts, settlement date April 30, 2014) | (0.11 | ) | (337,557 | ) | 6,268,954 | |||||||
| Sugar (339 contracts, settlement date February 28, 2014) | (0.14 | ) | (462,112 | ) | 6,230,549 | |||||||
| Wheat (205 contracts, settlement date July 14, 2014) | (0.17 | ) | (549,650 | ) | 6,321,687 | |||||||
| Wheat (205 contracts, settlement date May 14, 2014) | (0.20 | ) | (627,613 | ) | 6,273,000 | |||||||
| Wheat (205 contracts, settlement date March 14, 2014) | (0.20 | ) | (627,788 | ) | 6,203,812 | |||||||
| Net Unrealized Depreciation on Futures Contracts | (1.27 | )% | $ | (4,055,188 | ) | $ | 319,612,065 | |||||
| Percentage of | Fair | Face | ||||||||||
| Description | Net Assets | Value | Value | |||||||||
| U.S. Treasury Obligations | ||||||||||||
| U.S. Treasury Bills, 0.09% due January 13, 2011 | 33.68 | % | $ | 179,998,380 | $ | 180,000,000 | ||||||
| U.S. Treasury Bills, 0.12% due February 03, 2011 | 11.23 | 59,995,500 | 60,000,000 | |||||||||
| U.S. Treasury Bills, 0.13% due February 17, 2011 | 1.87 | 9,998,620 | 10,000,000 | |||||||||
| U.S. Treasury Bills, 0.12% due February 24, 2011 | 3.74 | 19,996,760 | 20,000,000 | |||||||||
| U.S. Treasury Bills, 0.15% due March 10, 2011 | 9.36 | 49,989,000 | 50,000,000 | |||||||||
| U.S. Treasury Bills, 0.13% due March 24, 2011 | 28.06 | 149,961,600 | 150,000,000 | |||||||||
| Total U.S. Treasury Obligations (cost $469,919,567) | 87.94 | % | $ | 469,939,860 | $ | 470,000,000 | ||||||
| Percentage of | Fair | Notional | ||||||||||
| Description | Net Assets | Value | Value | |||||||||
| Unrealized Appreciation on Futures Contracts | ||||||||||||
| Cocoa (344 contracts, settlement date March 16, 2011) | 0.12 | % | $ | 636,750 | $ | 10,440,400 | ||||||
| Cocoa (343 contracts, settlement date May 13, 2011) | 0.11 | 606,950 | 10,468,360 | |||||||||
| Cocoa (344 contracts, settlement date July 14, 2011) | 0.13 | 682,981 | 10,540,160 | |||||||||
| Coffee (116 contracts, settlement date March 21, 2011) | 0.40 | 2,127,581 | 10,461,750 | |||||||||
| Coffee (116 contracts, settlement date May 18, 2011) | 0.40 | 2,152,463 | 10,518,300 | |||||||||
| Coffee (116 contracts, settlement date July 19, 2011) | 0.27 | 1,460,111 | 10,468,275 | |||||||||
| Copper (94 contracts, settlement date March 29, 2011) | 0.36 | 1,927,650 | 10,450,450 | |||||||||
| Copper (94 contracts, settlement date May 26, 2011) | 0.39 | 2,061,488 | 10,432,825 | |||||||||
| Copper (95 contracts, settlement date July 27, 2011) | 0.20 | 1,078,225 | 10,504,625 | |||||||||
| Corn (330 contracts, settlement date March 14, 2011) | 0.36 | 1,945,850 | 10,378,500 | |||||||||
| Corn (330 contracts, settlement date May 13, 2011) | 0.36 | 1,927,875 | 10,502,250 | |||||||||
| Corn (330 contracts, settlement date July 14, 2011) | 0.20 | 1,068,200 | 10,560,000 | |||||||||
| Cotton (154 contracts, settlement date March 09, 2011) | 0.43 | 2,294,524 | 11,150,370 | |||||||||
| Cotton (151 contracts, settlement date May 06, 2011) | 0.34 | 1,802,070 | 10,389,555 | |||||||||
| Cotton (152 contracts, settlement date July 07, 2011) | 0.12 | 644,704 | 9,826,800 | |||||||||
| Florida Orange Juice (427 contracts, settlement date March 11, 2011) | 0.13 | 699,810 | 10,475,378 | |||||||||
| Florida Orange Juice (422 contracts, settlement date May 10, 2011) | 0.06 | 295,988 | 10,450,830 | |||||||||
| Florida Orange Juice (420 contracts, settlement date July 11, 2011) | 0.10 | 537,300 | 10,480,050 | |||||||||
| Gold (74 contracts, settlement date February 24, 2011) | 0.17 | 914,920 | 10,518,360 | |||||||||
| Gold (73 contracts, settlement date April 27, 2011) | 0.18 | 970,160 | 10,392,280 | |||||||||
| Gold (73 contracts, settlement date June 28, 2011) | 0.05 | 239,600 | 10,407,610 | |||||||||
| Heating Oil (58 contracts, settlement date January 31, 2011) | 0.13 | 684,037 | 6,193,286 | |||||||||
| Heating Oil (58 contracts, settlement date February 28, 2011) | 0.13 | 677,783 | 6,208,146 | |||||||||
| Heating Oil (59 contracts, settlement date March 31, 2011) | 0.14 | 730,666 | 6,305,023 | |||||||||
| Heating Oil (59 contracts, settlement date April 29, 2011) | 0.07 | 378,487 | 6,295,111 | |||||||||
| Heating Oil (59 contracts, settlement date May 31, 2011) | 0.07 | 378,420 | 6,302,793 | |||||||||
| Lean Hogs (225 contracts, settlement date February 14, 2011) | 0.08 | 405,900 | 7,177,500 | |||||||||
| Lean Hogs (225 contracts, settlement date April 14, 2011) | 0.09 | 486,320 | 7,548,750 | |||||||||
| Lean Hogs (225 contracts, settlement date June 14, 2011) | 0.09 | 457,720 | 8,374,500 | |||||||||
| Lean Hogs (226 contracts, settlement date July 15, 2011) | 0.08 | 444,060 | 8,357,480 | |||||||||
| Light, Sweet Crude Oil (67 contracts, settlement date January 20, 2011) | 0.11 | 605,960 | 6,122,460 | |||||||||
| Light, Sweet Crude Oil (68 contracts, settlement date February 22, 2011) | 0.12 | 655,440 | 6,270,960 | |||||||||
| Light, Sweet Crude Oil (68 contracts, settlement date March 22, 2011) | 0.13 | 710,820 | 6,317,880 | |||||||||
| Light, Sweet Crude Oil (68 contracts, settlement date April 19, 2011) | 0.07 | 378,669 | 6,351,880 | |||||||||
| Light, Sweet Crude Oil (67 contracts, settlement date May 20, 2011) | 0.07 | 387,900 | 6,283,260 | |||||||||
| Live Cattle (238 contracts, settlement date February 28, 2011) | 0.16 | 842,540 | 10,314,920 | |||||||||
| Live Cattle (237 contracts, settlement date April 29, 2011) | 0.16 | 840,320 | 10,636,560 | |||||||||
| Live Cattle (239 contracts, settlement date June 30, 2011) | 0.08 | 448,240 | 10,446,690 | |||||||||
| Natural Gas (142 contracts, settlement date January 27, 2011) | 0.02 | 125,030 | 6,255,100 | |||||||||
| Natural Gas (142 contracts, settlement date February 24, 2011) | 0.03 | 184,880 | 6,279,240 | |||||||||
| Natural Gas (142 contracts, settlement date March 29, 2011) | 0.03 | 185,310 | 6,249,420 | |||||||||
| Natural Gas (142 contracts, settlement date April 27, 2011) | 0.09 | 484,577 | 6,296,280 | |||||||||
| Natural Gas (142 contracts, settlement date May 26, 2011) | 0.09 | 463,960 | 6,354,500 | |||||||||
| Platinum (176 contracts, settlement date April 27, 2011) | 0.24 | 1,277,895 | 15,648,160 | |||||||||
| Platinum (177 contracts, settlement date July 27, 2011) | 0.12 | 628,240 | 15,779,550 | |||||||||
| Silver (68 contracts, settlement date March 29, 2011) | 0.52 | 2,776,085 | 10,518,580 | |||||||||
| Silver (67 contracts, settlement date May 26, 2011) | 0.59 | 3,152,680 | 10,381,985 | |||||||||
| Silver (67 contracts, settlement date July 27, 2011) | 0.23 | 1,242,865 | 10,398,400 | |||||||||
| Soybean (148 contracts, settlement date March 14, 2011) | 0.38 | 2,043,188 | 10,382,200 | |||||||||
| Soybean (149 contracts, settlement date May 13, 2011) | 0.40 | 2,149,688 | 10,497,050 | |||||||||
| Soybean (149 contracts, settlement date July 14, 2011) | 0.15 | 776,537 | 10,515,675 | |||||||||
| Sugar (320 contracts, settlement date February 28, 2011) | 0.38 | 2,021,544 | 11,511,808 | |||||||||
| Sugar (320 contracts, settlement date April 29, 2011) | 0.33 | 1,767,517 | 10,508,288 | |||||||||
| Sugar (321 contracts, settlement date June 30, 2011) | 0.26 | 1,368,442 | 9,419,424 | |||||||||
| Wheat (256 contracts, settlement date March 14, 2011) | 0.12 | 657,400 | 10,166,400 | |||||||||
| Wheat (258 contracts, settlement date May 13, 2011) | 0.17 | 891,337 | 10,587,675 | |||||||||
| Wheat (257 contracts, settlement date July 14, 2011) | 0.16 | 854,025 | 10,691,200 | |||||||||
| Net Unrealized Appreciation on Futures Contracts | 10.97 | % | $ | 58,639,682 | $ | 533,765,262 | ||||||
| * | Denotes less than 0.000% yet greater than (0.005)% |
| ** | Denotes greater than 0.000% yet less than 0.005% |
| *** | The CME Group changed specifications and the name of Heating Oil futures to ‘NY Harbor ULSD’ in May 2013 |
| 2014 | 2013 | 2012 | ||||||||||
| Income | ||||||||||||
| Interest Income | $ | 44,304 | $ | 189,643 | $ | 331,044 | ||||||
| Expenses | ||||||||||||
| Management fee to related party | 2,835,654 | 3,500,487 | 4,637,997 | |||||||||
| Brokerage fees and expenses | 667,213 | 823,644 | 377,195 | |||||||||
| Total expenses | 3,502,867 | 4,324,131 | 5,015,192 | |||||||||
| Net Investment Loss | (3,458,563 | ) | (4,134,488 | ) | (4,684,148 | ) | ||||||
Realized and Net Change in Unrealized Gain (Loss) on Investments and Futures Contracts | ||||||||||||
| Realized Gain (Loss) on | ||||||||||||
| Investments | - | (10,376 | ) | 1,429 | ||||||||
| Futures Contracts | (12,125,640 | ) | (53,539,832 | ) | (55,222,884 | ) | ||||||
| Net Realized Loss | (12,125,640 | ) | (53,550,208 | ) | (55,221,455 | ) | ||||||
| Net Change in Unrealized Gain (Loss) on | ||||||||||||
| Investments | (1,254 | ) | (13,546 | ) | 15,980 | |||||||
| Futures Contracts | (23,193,888 | ) | 8,459,270 | 32,487,331 | ||||||||
| Net Change in Unrealized Gain (Loss) | (23,195,142 | ) | 8,445,724 | 32,503,311 | ||||||||
Net Realized and Unrealized Loss on Investments and Futures Contracts | (35,320,782 | ) | (45,104,484 | ) | (22,718,144 | ) | ||||||
| Net Loss | $ | (38,779,345 | ) | $ | (49,238,972 | ) | $ | (27,402,292 | ) | |||
| 2011 | 2010 | 2009 | ||||||||||
| Income | ||||||||||||
| Interest Income | $ | 335,677 | $ | 301,808 | $ | 126,329 | ||||||
| Expenses | ||||||||||||
| Management fee to related party | 5,895,201 | 2,523,863 | 1,018,526 | |||||||||
| Brokerage commissions and fees | 1,300,472 | 712,620 | 287,584 | |||||||||
| Total expenses | 7,195,673 | 3,236,483 | 1,306,110 | |||||||||
| Net Investment Loss | (6,859,996 | ) | (2,934,675 | ) | (1,179,781 | ) | ||||||
Realized and Net Change in Unrealized Gain (Loss) on Investments and Futures Contracts | ||||||||||||
| Realized Gain (Loss) on | ||||||||||||
| Investments | 451 | (403 | ) | 397 | ||||||||
| Futures Contracts | 36,755,383 | 43,285,484 | 12,851,212 | |||||||||
| Net Realized Gain | 36,755,834 | 43,285,081 | 12,851,609 | |||||||||
| Net Change in Unrealized (Loss) Gain on | ||||||||||||
| Investments | (20,292 | ) | 18,076 | 748 | ||||||||
| Futures Contracts | (103,641,471 | ) | 46,259,451 | 14,260,521 | ||||||||
| Net Change in Unrealized (Loss) Gain | (103,661,763 | ) | 46,277,527 | 14,261,269 | ||||||||
Net Realized and Unrealized (Loss) Gain on Investments and Future Contracts | (66,905,929 | ) | 89,562,608 | 27,112,878 | ||||||||
| Net (Loss) Gain | $ | (73,765,925 | ) | $ | 86,627,933 | $ | 25,933,097 | |||||
| General Units | Limited Units | Total | ||||||||||||||||||||||||||||||||||
| Total | Total | |||||||||||||||||||||||||||||||||||
| General | Limited | Total | ||||||||||||||||||||||||||||||||||
| General Units | Accumulated | Shareholders’ | Limited Units | Accumulated | Shareholders’ | Shareholders’ | ||||||||||||||||||||||||||||||
| Units | Amount | Deficit | Equity | Units | Amount | Deficit | Equity | Equity | ||||||||||||||||||||||||||||
| Balance at January 1, 2014 | 50 | $ | 1,500 | $ | (215 | ) | $ | 1,285 | 12,450,000 | $ | 364,838,413 | $ | (44,847,114 | ) | $ | 319,991,299 | $ | 319,992,584 | ||||||||||||||||||
| Creation of Limited Units | - | - | - | - | 1,550,000 | 43,387,949 | - | 43,387,949 | 43,387,949 | |||||||||||||||||||||||||||
| Redemption of Limited Units | - | - | - | - | (2,300,000 | ) | (57,703,054 | ) | - | (57,703,054 | ) | (57,703,054 | ) | |||||||||||||||||||||||
| Net Loss: | ||||||||||||||||||||||||||||||||||||
| Net Investment Loss | - | - | (15 | ) | (15 | ) | - | - | (3,458,548 | ) | (3,458,548 | ) | (3,458,563 | ) | ||||||||||||||||||||||
Net Realized Loss on Investments and Futures Contracts | - | - | (45 | ) | (45 | ) | - | - | (12,125,595 | ) | (12,125,595 | ) | (12,125,640 | ) | ||||||||||||||||||||||
| Net Change in Unrealized Loss on | ||||||||||||||||||||||||||||||||||||
| Investments and Futures | ||||||||||||||||||||||||||||||||||||
| Contracts | - | - | (85 | ) | (85 | ) | - | - | (23,195,057 | ) | (23,195,057 | ) | (23,195,142 | ) | ||||||||||||||||||||||
| Net Loss | - | - | (145 | ) | (145 | ) | - | - | (38,779,200 | ) | (38,779,200 | ) | (38,779,345 | ) | ||||||||||||||||||||||
| Balance at December 31, 2014 | 50 | $ | 1,500 | $ | (360 | ) | $ | 1,140 | 11,700,000 | $ | 350,523,308 | $ | (83,626,314 | ) | $ | 266,896,994 | $ | 266,898,134 | ||||||||||||||||||
| 54 |
| General Units | Limited Units | Total | ||||||||||||||||||||||||||||||||||
| Total | Total | |||||||||||||||||||||||||||||||||||
| General | Limited | Total | ||||||||||||||||||||||||||||||||||
| General Units | Accumulated | Shareholders’ | Limited Units | Accumulated | Shareholders’ | Shareholders’ | ||||||||||||||||||||||||||||||
| Units | Amount | Deficit | Equity | Units | Amount | Deficit | Equity | Equity | ||||||||||||||||||||||||||||
| Balance at January 1, 2013 | 50 | $ | 1,500 | $ | (57 | ) | $ | 1,443 | 16,450,000 | $ | 470,214,957 | $ | 4,391,700 | $ | 474,606,657 | $ | 474,608,100 | |||||||||||||||||||
| Creation of Limited Units | - | - | - | - | 900,000 | 25,704,701 | - | 25,704,701 | 25,704,701 | |||||||||||||||||||||||||||
| Redemption of Limited Units | - | - | - | - | (4,900,000 | ) | (131,081,245 | ) | - | (131,081,245 | ) | (131,081,245 | ) | |||||||||||||||||||||||
| Net Loss: | ||||||||||||||||||||||||||||||||||||
| Net Investment Loss | - | - | (15 | ) | (15 | ) | - | - | (4,134,473 | ) | (4,134,473 | ) | (4,134,488 | ) | ||||||||||||||||||||||
Net Realized Loss on Investments and Futures Contracts | - | - | (171 | ) | (171 | ) | - | - | (53,550,037 | ) | (53,550,037 | ) | (53,550,208 | ) | ||||||||||||||||||||||
Net Change in Unrealized Gain on Investments and Futures Contracts | - | - | 28 | 28 | - | - | 8,445,696 | 8,445,696 | 8,445,724 | |||||||||||||||||||||||||||
| Net Loss | - | - | (158 | ) | (158 | ) | (49,238,814 | ) | (49,238,814 | ) | (49,238,972 | ) | ||||||||||||||||||||||||
| Balance at December 31, 2013 | 50 | $ | 1,500 | $ | (215 | ) | $ | 1,285 | 12,450,000 | $ | 364,838,413 | $ | (44,847,114 | ) | $ | 319,991,299 | $ | 319,992,584 | ||||||||||||||||||
| General Units | Limited Units | Total | ||||||||||||||||||||||||||||||||||
| Total | Total | |||||||||||||||||||||||||||||||||||
| General | Limited | Total | ||||||||||||||||||||||||||||||||||
| General Units | Accumulated | Shareholders’ | Limited Units | Accumulated | Shareholders’ | Shareholders’ | ||||||||||||||||||||||||||||||
| Units | Amount | Deficit | Equity | Units | Amount | Earnings | Equity | Equity | ||||||||||||||||||||||||||||
| Balance at January 1, 2012 | 50 | $ | 1,500 | $ | (2 | ) | $ | 1,498 | 19,400,000 | $ | 549,362,581 | $ | 31,793,937 | $ | 581,156,518 | $ | 581,158,016 | |||||||||||||||||||
| Creation of Limited Units | - | - | - | - | 3,250,000 | 101,149,075 | - | 101,149,075 | 101,149,075 | |||||||||||||||||||||||||||
| Redemption of Limited Units | - | - | - | - | (6,200,000 | ) | (180,296,699 | ) | - | (180,296,699 | ) | (180,296,699 | ) | |||||||||||||||||||||||
| Net loss: | ||||||||||||||||||||||||||||||||||||
| Net investment loss | - | - | (13 | ) | (13 | ) | - | - | (4,684,135 | ) | (4,684,135 | ) | (4,684,148 | ) | ||||||||||||||||||||||
Net realized loss on Investments and Futures Contracts | - | - | (135 | ) | (135 | ) | - | - | (55,221,320 | ) | (55,221,320 | ) | (55,221,455 | ) | ||||||||||||||||||||||
Net change in unrealized gain on Investments and Futures Contracts | - | - | 93 | 93 | - | - | 32,503,218 | 32,503,218 | 32,503,311 | |||||||||||||||||||||||||||
| Net loss | - | - | (55 | ) | (55 | ) | - | - | (27,402,237 | ) | (27,402,237 | ) | (27,402,292 | ) | ||||||||||||||||||||||
| Balance at December 31, 2012 | 50 | $ | 1,500 | $ | (57 | ) | $ | 1,443 | 16,450,000 | $ | 470,214,957 | $ | 4,391,700 | $ | 474,606,657 | $ | 474,608,100 | |||||||||||||||||||
| General Units | Limited Units | Total | ||||||||||||||||||||||||||||||||||
| Total | Total | |||||||||||||||||||||||||||||||||||
| General | Limited | Total | ||||||||||||||||||||||||||||||||||
| General Units | Accumulated | Shareholders’ | Limited Units | Accumulated | Shareholders’ | Shareholders’ | ||||||||||||||||||||||||||||||
| Units | Amount | Deficit | Equity | Units | Amount | Earnings | Equity | Equity | ||||||||||||||||||||||||||||
| Balance at January 1, 2011 | 50 | $ | 1,500 | $ | 144 | $ | 1,644 | 16,250,000 | $ | 428,801,695 | $ | 105,559,716 | $ | 534,361,411 | $ | 534,363,055 | ||||||||||||||||||||
| Creation of Limited Units | - | - | - | - | 11,200,000 | 383,075,174 | - | 383,075,174 | 383,075,174 | |||||||||||||||||||||||||||
| Redemption of Limited Units | - | - | - | - | (8,050,000 | ) | (262,514,288 | ) | - | (262,514,288 | ) | (262,514,288 | ) | |||||||||||||||||||||||
| Net loss: | ||||||||||||||||||||||||||||||||||||
| Net investment loss | - | - | (17 | ) | (17 | ) | - | - | (6,859,979 | ) | (6,859,979 | ) | (6,859,996 | ) | ||||||||||||||||||||||
| Net realized gain on Investments and Futures Contracts | - | - | 88 | 88 | - | - | 36,755,746 | 36,755,746 | 36,755,834 | |||||||||||||||||||||||||||
Net change in unrealized loss on Investments and Futures Contracts | - | - | (217 | ) | (217 | ) | - | - | (103,661,546 | ) | (103,661,546 | ) | (103,661,763 | ) | ||||||||||||||||||||||
| Net loss | - | - | (146 | ) | (146 | ) | - | - | (73,765,779 | ) | (73,765,779 | ) | (73,765,925 | ) | ||||||||||||||||||||||
| Balance at December 31, 2011 | 50 | $ | 1,500 | $ | (2 | ) | $ | 1,498 | 19,400,000 | $ | 549,362,581 | $ | 31,793,937 | $ | 581,156,518 | $ | 581,158,016 | |||||||||||||||||||
| 56 |
| 2014 | 2013 | 2012 | ||||||||||
| Cash flow from operating activities: | ||||||||||||
| Net Loss | $ | (38,779,345 | ) | $ | (49,238,972 | ) | $ | (27,402,292 | ) | |||
Adjustments to reconcile net loss to net cash provided by (used for) operating activities: | ||||||||||||
| Purchase of investment securities | (778,448,400 | ) | (1,484,819,380 | ) | (2,089,638,671 | ) | ||||||
| Proceeds from sales of investment securities | 778,495,000 | 1,754,981,721 | 1,629,991,694 | |||||||||
| Net accretion of discount | (44,304 | ) | (189,643 | ) | (331,044 | ) | ||||||
| Net realized (gain) loss on investment securities | - | 10,376 | (1,429 | ) | ||||||||
| Unrealized depreciation (appreciation) on investments | 23,195,142 | (8,445,724 | ) | (32,503,311 | ) | |||||||
| Decrease in accrued expenses | (87,513 | ) | (387,139 | ) | (666,087 | ) | ||||||
| Net cash provided by (used for) operating activities | (15,669,420 | ) | 211,911,239 | (520,551,140 | ) | |||||||
| Cash flows from financing activities: | ||||||||||||
| Proceeds from creation of Limited Units | 43,387,949 | 25,704,701 | 101,149,075 | |||||||||
| Redemption of Limited Units | (57,703,054 | ) | (131,081,245 | ) | (180,296,699 | ) | ||||||
| Increase (decrease) in capital shares payable | - | (4,327,722 | ) | 2,829,896 | ||||||||
| Net cash provided by (used for) financing activities | (14,315,105 | ) | (109,704,266 | ) | (76,317,728 | ) | ||||||
| Net change in cash | (29,984,525 | ) | 102,206,973 | (596,868,868 | ) | |||||||
| Cash held by broker at beginning of year | 124,417,599 | 22,210,626 | 619,079,494 | |||||||||
| Cash held by broker at end of year | $ | 94,433,074 | $ | 124,417,599 | $ | 22,210,626 | ||||||
| 2014 | 2013 | |||||||
| Assets | ||||||||
| Equity in broker trading accounts: | ||||||||
| Short-term investments (cost $199,994,069 and $199,996,365 as of 2014 and 2013, respectively) | $ | 199,995,250 | $ | 199,998,800 | ||||
| Cash held by broker | 94,433,074 | 124,417,599 | ||||||
| Net unrealized depreciation on futures contracts | (27,249,076 | ) | (4,055,188 | ) | ||||
| Total assets | $ | 267,179,248 | $ | 320,361,211 | ||||
| Liabilities and shareholders’ equity | ||||||||
| Management fee payable to related party | 205,492 | 241,143 | ||||||
| Accrued brokerage fees and expenses payable | 75,622 | 127,484 | ||||||
| Total liabilities | 281,114 | 368,627 | ||||||
| Shareholders’ equity | ||||||||
| General Units: | ||||||||
| Paid in capital - 50 units issued | 1,500 | 1,500 | ||||||
| Accumulated deficit | (360 | ) | (215 | ) | ||||
| Total General Units | 1,140 | 1,285 | ||||||
| Limited Units: | ||||||||
| Paid in capital - 11,700,000 and 12,450,000 redeemable shares issued and outstanding as of 2014 and 2013, respectively | 350,523,308 | 364,838,413 | ||||||
| Accumulated deficit | (83,626,314 | ) | (44,847,114 | ) | ||||
| Total Limited Units | 266,896,994 | 319,991,299 | ||||||
| Total shareholders’ equity | 266,898,134 | 319,992,584 | ||||||
| Total liabilities and shareholders’ equity | $ | 267,179,248 | $ | 320,361,211 | ||||
| Net asset value per share | ||||||||
| General Units | $ | 22.80 | $ | 25.70 | ||||
| Limited Units | $ | 22.81 | $ | 25.70 | ||||
| 58 |
| General Units | Limited Units | Total | ||||||||||||||||||||||||||||||||||
| Total | Total | |||||||||||||||||||||||||||||||||||
| General | Limited | Total | ||||||||||||||||||||||||||||||||||
| General Units | Accumulated | Shareholders’ | Limited Units | Accumulated | Shareholders’ | Shareholders’ | ||||||||||||||||||||||||||||||
| Units | Amount | Earnings | Equity | Units | Amount | Earnings | Equity | Equity | ||||||||||||||||||||||||||||
| Balance at January 1, 2010 | 50 | $ | 1,500 | $ | (189 | ) | $ | 1,311 | 8,750,000 | $ | 210,500,911 | $ | 18,932,116 | $ | 229,433,027 | $ | 229,434,338 | |||||||||||||||||||
| Creation of Limited Units | - | - | - | - | 9,200,000 | 262,051,675 | - | 262,051,675 | 262,051,675 | |||||||||||||||||||||||||||
| Redemption of Limited Units | - | - | - | - | (1,700,000 | ) | (43,750,891 | ) | - | (43,750,891 | ) | (43,750,891 | ) | |||||||||||||||||||||||
| Net gain: | ||||||||||||||||||||||||||||||||||||
| Net investment loss | - | - | (15 | ) | (15 | ) | - | - | (2,934,660 | ) | (2,934,660 | ) | (2,934,675 | ) | ||||||||||||||||||||||
| Net realized gain on Investments and Futures Contracts | - | - | 165 | 165 | - | - | 43,284,916 | 43,284,916 | 43,285,081 | |||||||||||||||||||||||||||
| Net change in unrealized gain on Investments and Futures Contracts | - | - | 183 | 183 | - | - | 46,277,344 | 46,277,344 | 46,277,527 | |||||||||||||||||||||||||||
| Net gain | - | - | 333 | 333 | - | - | 86,627,600 | 86,627,600 | 86,627,933 | |||||||||||||||||||||||||||
| Balance at December 31, 2010 | 50 | $ | 1,500 | $ | 144 | $ | 1,644 | 16,250,000 | $ | 428,801,695 | $ | 105,559,716 | $ | 534,361,411 | $ | 534,363,055 | ||||||||||||||||||||
| Percentage | Fair | Face | ||||||||||
| Description | of Net Assets | Value | Value | |||||||||
| U.S. Treasury Obligations | ||||||||||||
| U.S. Treasury Bills, 0.01% due January 22, 2015 | 37.47 | % | $ | 99,998,600 | $ | 100,000,000 | ||||||
| U.S. Treasury Bills, 0.03% due March 12, 2015 | 18.73 | 49,998,100 | 50,000,000 | |||||||||
| U.S. Treasury Bills, 0.06% due March 26, 2015 | 18.73 | 49,998,550 | 50,000,000 | |||||||||
| Total U.S. Treasury Obligations (cost $199,994,069) | 74.93 | % | $ | 199,995,250 | $ | 200,000,000 | ||||||
| Percentage | Fair | Notional | ||||||||||
| Description | of Net Assets | Value | Value | |||||||||
| Unrealized Appreciation/(Depreciation) on Futures Contracts | ||||||||||||
| Cocoa (181 contracts, settlement date July 16, 2015) | 0.03 | % | $ | 83,950 | $ | 5,229,090 | ||||||
| Cocoa (181 contracts, settlement date May 13, 2015) | (0.13 | ) | (334,480 | ) | 5,234,520 | |||||||
| Cocoa (181 contracts, settlement date March 16, 2015) | (0.12 | ) | (316,920 | ) | 5,267,100 | |||||||
| Coffee (82 contracts, settlement date July 21, 2015) | (0.25 | ) | (671,513 | ) | 5,285,925 | |||||||
| Coffee (82 contracts, settlement date May 18, 2015) | (0.27 | ) | (719,438 | ) | 5,205,975 | |||||||
| Coffee (83 contracts, settlement date March 19, 2015) | (0.28 | ) | (747,038 | ) | 5,185,425 | |||||||
| Copper (74 contracts, settlement date July 29, 2015) | (0.12 | ) | (320,262 | ) | 5,227,175 | |||||||
| Copper (74 contracts, settlement date May 27, 2015) | (0.22 | ) | (584,150 | ) | 5,223,475 | |||||||
| Copper (74 contracts, settlement date March 27, 2015) | (0.21 | ) | (559,600 | ) | 5,227,175 | |||||||
| Corn (258 contracts, settlement date July 14, 2015) | 0.04 | 101,863 | 5,321,250 | |||||||||
| Corn (258 contracts, settlement date May 14, 2015) | 0.09 | 250,975 | 5,234,175 | |||||||||
| Corn (259 contracts, settlement date March 13, 2015) | 0.09 | 242,600 | 5,141,150 | |||||||||
| Cotton (171 contracts, settlement date July 09, 2015) | 0.00 | * | 5,610 | 5,301,000 | ||||||||
| Cotton (171 contracts, settlement date May 06, 2015) | (0.12 | ) | (316,150 | ) | 5,221,485 | |||||||
| Cotton (171 contracts, settlement date March 09, 2015) | (0.27 | ) | (716,905 | ) | 5,153,085 | |||||||
| Gold (44 contracts, settlement date June 26, 2015) | 0.03 | 88,470 | 5,215,760 | |||||||||
| Gold (44 contracts, settlement date April 28, 2015) | (0.17 | ) | (446,860 | ) | 5,213,560 | |||||||
| Gold (44 contracts, settlement date February 25, 2015) | (0.13 | ) | (335,420 | ) | 5,210,040 | |||||||
| Lean Hogs (113 contracts, settlement date July 15, 2015) | (0.07 | ) | (176,480 | ) | 4,098,510 | |||||||
| Lean Hogs (113 contracts, settlement date June 12, 2015) | (0.07 | ) | (188,950 | ) | 4,138,060 | |||||||
| Lean Hogs (113 contracts, settlement date April 15, 2015) | (0.07 | ) | (197,270 | ) | 3,764,030 | |||||||
| Lean Hogs (113 contracts, settlement date February 13, 2015) | (0.12 | ) | (315,750 | ) | 3,670,240 | |||||||
| Light, Sweet Crude Oil (57 contracts, settlement date May 19, 2015) | (0.33 | ) | (893,390 | ) | 3,172,050 | |||||||
| Light, Sweet Crude Oil (58 contracts, settlement date April 21, 2015) | (0.38 | ) | (1,019,440 | ) | 3,187,680 | |||||||
| Light, Sweet Crude Oil (58 contracts, settlement date March 20, 2015) | (0.57 | ) | (1,532,690 | ) | 3,147,080 | |||||||
| Light, Sweet Crude Oil (58 contracts, settlement date February 20, 2015) | (0.58 | ) | (1,560,200 | ) | 3,114,600 | |||||||
| Light, Sweet Crude Oil (58 contracts, settlement date January 20, 2015) | (0.58 | ) | (1,550,530 | ) | 3,089,660 | |||||||
| Live Cattle (82 contracts, settlement date June 30, 2015) | (0.04 | ) | (114,190 | ) | 5,080,720 | |||||||
| Live Cattle (81 contracts, settlement date April 30, 2015) | 0.08 | 218,730 | 5,261,760 | |||||||||
| Live Cattle (81 contracts, settlement date February 27, 2015) | 0.09 | 242,130 | 5,299,020 | |||||||||
| Natural Gas (108 contracts, settlement date May 27, 2015) | (0.25 | ) | (668,300 | ) | 3,189,240 | |||||||
| Natural Gas (108 contracts, settlement date April 28, 2015) | (0.26 | ) | (694,840 | ) | 3,136,320 | |||||||
| Natural Gas (108 contracts, settlement date March 27, 2015) | (0.29 | ) | (786,680 | ) | 3,111,480 | |||||||
| Natural Gas (108 contracts, settlement date February 25, 2015) | (0.37 | ) | (1,000,490 | ) | 3,127,680 | |||||||
| Natural Gas (108 contracts, settlement date January 28, 2015) | (0.40 | ) | (1,071,100 | ) | 3,120,120 | |||||||
| NY Harbor ULSD (42 contracts, settlement date May 29, 2015) | (0.33 | ) | (873,041 | ) | 3,200,602 | |||||||
| NY Harbor ULSD (41 contracts, settlement date April 30, 2015) | (0.32 | ) | (861,353 | ) | 3,105,627 | |||||||
| NY Harbor ULSD (41 contracts, settlement date March 31, 2015) | (0.50 | ) | (1,337,461 | ) | 3,104,594 | |||||||
| NY Harbor ULSD (41 contracts, settlement date February 27, 2015) | (0.53 | ) | (1,409,974 | ) | 3,129,218 | |||||||
| NY Harbor ULSD (41 contracts, settlement date January 30, 2015) | (0.50 | ) | (1,333,559 | ) | 3,157,459 | |||||||
| Platinum (130 contracts, settlement date July 29, 2015) | 0.01 | 33,995 | 7,871,500 | |||||||||
| Platinum (129 contracts, settlement date April 28, 2015) | 0.01 | 20,485 | 7,801,275 | |||||||||
| Silver (66 contracts, settlement date July 29, 2015) | (0.02 | ) | (47,050 | ) | 5,168,460 | |||||||
| Silver (67 contracts, settlement date May 27, 2015) | (0.35 | ) | (940,295 | ) | 5,236,720 | |||||||
| Silver (67 contracts, settlement date March 27, 2015) | (0.34 | ) | (913,105 | ) | 5,225,665 | |||||||
| Soybean (101 contracts, settlement date July 14, 2015) | (0.03 | ) | (92,050 | ) | 5,236,850 | |||||||
| Soybean (101 contracts, settlement date May 14, 2015) | (0.07 | ) | (199,812 | ) | 5,204,025 | |||||||
| Soybean (102 contracts, settlement date March 13, 2015) | (0.06 | ) | (163,712 | ) | 5,219,850 | |||||||
| Soybean Oil (269 contracts, settlement date July 14, 2015) | (0.04 | ) | (102,582 | ) | 5,253,570 | |||||||
| Soybean Oil (269 contracts, settlement date May 14, 2015) | (0.13 | ) | (336,222 | ) | 5,221,290 | |||||||
| Soybean Oil (270 contracts, settlement date March 13, 2015) | (0.13 | ) | (337,578 | ) | 5,206,680 | |||||||
| Sugar (314 contracts, settlement date June 30, 2015) | (0.17 | ) | (441,795 | ) | 5,363,120 | |||||||
| Sugar (315 contracts, settlement date April 30, 2015) | (0.31 | ) | (834,389 | ) | 5,263,776 | |||||||
| Sugar (315 contracts, settlement date February 27, 2015) | (0.39 | ) | (1,039,808 | ) | 5,122,656 | |||||||
| Wheat (176 contracts, settlement date July 14, 2015) | 0.12 | 314,688 | 5,258,000 | |||||||||
| Wheat (176 contracts, settlement date May 14, 2015) | 0.04 | 106,325 | 5,231,600 | |||||||||
| Wheat (176 contracts, settlement date March 13, 2015) | 0.05 | 143,925 | 5,189,800 | |||||||||
| Net Unrealized Depreciation on Futures Contracts | (10.21 | )% | $ | (27,249,076 | ) | $ | 266,577,952 | |||||
| * | Denotes greater than 0.000% yet less than 0.005% |
| Percentage | Fair | Face | ||||||||||
| Description | of Net Assets | Value | Value | |||||||||
| U.S. Treasury Obligations | ||||||||||||
| U.S. Treasury Bills, 0.01% due January 16, 2014 | 15.62 | % | $ | 49,999,850 | $ | 50,000,000 | ||||||
| U.S. Treasury Bills, 0.01% due January 23, 2014 | 46.88 | 149,998,950 | 150,000,000 | |||||||||
| Total U.S. Treasury Obligations (cost $199,996,365) | 62.50 | % | $ | 199,998,800 | $ | 200,000,000 | ||||||
| Percentage | Fair | Notional | ||||||||||
| Description | of Net Assets | Value | Value | |||||||||
| Unrealized Appreciation/(Depreciation) on Futures Contracts | ||||||||||||
| Cocoa (231 contracts, settlement date July 16, 2014) | 0.01 | % | $ | 35,760 | $ | 6,292,440 | ||||||
| Cocoa (231 contracts, settlement date May 14, 2014) | 0.13 | 411,440 | 6,273,960 | |||||||||
| Cocoa (231 contracts, settlement date March 14, 2014) | 0.12 | 381,180 | 6,257,790 | |||||||||
| Coffee (148 contracts, settlement date July 21, 2014) | 0.07 | 216,881 | 6,388,050 | |||||||||
| Coffee (148 contracts, settlement date May 19, 2014) | (0.17 | ) | (536,812 | ) | 6,268,725 | |||||||
| Coffee (148 contracts, settlement date March 19, 2014) | (0.17 | ) | (545,550 | ) | 6,143,850 | |||||||
| Copper (74 contracts, settlement date July 29, 2014) | 0.06 | 200,375 | 6,240,975 | |||||||||
| Copper (74 contracts, settlement date May 28, 2014) | 0.07 | 207,963 | 6,262,250 | |||||||||
| Copper (74 contracts, settlement date March 27, 2014) | 0.08 | 240,550 | 6,283,525 | |||||||||
| Corn (292 contracts, settlement date July 14, 2014) | (0.05 | ) | (170,225 | ) | 6,380,200 | |||||||
| Corn (292 contracts, settlement date May 14, 2014) | (0.19 | ) | (618,075 | ) | 6,281,650 | |||||||
| Corn (292 contracts, settlement date March 14, 2014) | (0.20 | ) | (625,900 | ) | 6,161,200 | |||||||
| Cotton (149 contracts, settlement date July 09, 2014) | 0.09 | 301,180 | 6,256,510 | |||||||||
| Cotton (149 contracts, settlement date May 07, 2014) | 0.00 | * | (10,605 | ) | 6,287,800 | |||||||
| Cotton (148 contracts, settlement date March 07, 2014) | (0.02 | ) | (59,930 | ) | 6,263,360 | |||||||
| Gold (52 contracts, settlement date June 26, 2014) | (0.15 | ) | (487,650 | ) | 6,258,720 | |||||||
| Gold (52 contracts, settlement date April 28, 2014) | (0.15 | ) | (482,440 | ) | 6,255,600 | |||||||
| Gold (52 contracts, settlement date February 26, 2014) | (0.17 | ) | (529,510 | ) | 6,251,960 | |||||||
| Lean Hogs (125 contracts, settlement date July 15, 2014) | 0.02 | 72,180 | 4,942,500 | |||||||||
| Lean Hogs (125 contracts, settlement date June 13, 2014) | 0.01 | 46,480 | 5,007,500 | |||||||||
| Lean Hogs (125 contracts, settlement date April 14, 2014) | 0.07 | 229,450 | 4,533,750 | |||||||||
| Lean Hogs (126 contracts, settlement date February 14, 2014) | 0.00 | * * | 9,330 | 4,305,420 | ||||||||
| Light, Sweet Crude Oil (39 contracts, settlement date May 20, 2014) | 0.04 | 136,060 | 3,793,920 | |||||||||
| Light, Sweet Crude Oil (38 contracts, settlement date April 22, 2014) | 0.05 | 144,650 | 3,723,620 | |||||||||
| Light, Sweet Crude Oil (38 contracts, settlement date March 20, 2014) | 0.02 | 55,240 | 3,740,720 | |||||||||
| Light, Sweet Crude Oil (38 contracts, settlement date February 20, 2014) | 0.01 | 31,670 | 3,744,900 | |||||||||
| Light, Sweet Crude Oil (38 contracts, settlement date January 21, 2014) | 0.00 | * * | 5,710 | 3,739,960 | ||||||||
| Live Cattle (118 contracts, settlement date June 30, 2014) | 0.01 | 44,040 | 6,108,860 | |||||||||
| Live Cattle (117 contracts, settlement date April 30, 2014) | 0.06 | 187,100 | 6,332,040 | |||||||||
| Live Cattle (118 contracts, settlement date February 28, 2014) | 0.10 | 335,300 | 6,354,300 | |||||||||
| Natural Gas (91 contracts, settlement date May 28, 2014) | 0.12 | 397,390 | 3,743,740 | |||||||||
| Natural Gas (91 contracts, settlement date April 28, 2014) | 0.13 | 412,180 | 3,726,450 | |||||||||
| Natural Gas (91 contracts, settlement date March 27, 2014) | 0.11 | 362,890 | 3,735,550 | |||||||||
| Natural Gas (90 contracts, settlement date February 26, 2014) | 0.12 | 383,380 | 3,773,700 | |||||||||
| Natural Gas (90 contracts, settlement date January 29, 2014) | 0.12 | 395,000 | 3,807,000 | |||||||||
| NY Harbor ULSD (30 contracts, settlement date May 30, 2014) *** | 0.06 | 205,317 | 3,810,996 | |||||||||
| NY Harbor ULSD (30 contracts, settlement date April 30, 2014) *** | 0.07 | 207,673 | 3,822,714 | |||||||||
| NY Harbor ULSD (29 contracts, settlement date March 31, 2014) *** | 0.04 | 116,840 | 3,706,983 | |||||||||
| NY Harbor ULSD (29 contracts, settlement date February 28, 2014) *** | 0.03 | 102,001 | 3,719,528 | |||||||||
| NY Harbor ULSD (29 contracts, settlement date January 31, 2014) *** | 0.04 | 113,904 | 3,733,414 | |||||||||
| Platinum (137 contracts, settlement date July 29, 2014) | (0.15 | ) | (490,930 | ) | 9,430,395 | |||||||
| Platinum (137 contracts, settlement date April 28, 2014) | (0.18 | ) | (574,305 | ) | 9,410,530 | |||||||
| Silver (64 contracts, settlement date July 29, 2014) | (0.18 | ) | (567,615 | ) | 6,220,160 | |||||||
| Silver (65 contracts, settlement date May 28, 2014) | (0.15 | ) | (490,235 | ) | 6,306,625 | |||||||
| Silver (65 contracts, settlement date March 27, 2014) | (0.15 | ) | (479,325 | ) | 6,295,250 | |||||||
| Soybean (98 contracts, settlement date July 14, 2014) | 0.06 | 182,763 | 6,196,050 | |||||||||
| Soybean (98 contracts, settlement date May 14, 2014) | 0.11 | 344,875 | 6,257,300 | |||||||||
| Soybean (98 contracts, settlement date March 14, 2014) | 0.13 | 401,825 | 6,333,250 | |||||||||
| Soybean Oil (266 contracts, settlement date July 14, 2014) | (0.12 | ) | (397,332 | ) | 6,361,656 | |||||||
| Soybean Oil (264 contracts, settlement date May 14, 2014) | (0.15 | ) | (466,266 | ) | 6,255,216 | |||||||
| Soybean Oil (264 contracts, settlement date March 14, 2014) | (0.14 | ) | (450,534 | ) | 6,198,192 | |||||||
| Sugar (338 contracts, settlement date June 30, 2014) | (0.12 | ) | (385,806 | ) | 6,333,309 | |||||||
| Sugar (338 contracts, settlement date April 30, 2014) | (0.11 | ) | (337,557 | ) | 6,268,954 | |||||||
| Sugar (339 contracts, settlement date February 28, 2014) | (0.14 | ) | (462,112 | ) | 6,230,549 | |||||||
| Wheat (205 contracts, settlement date July 14, 2014) | (0.17 | ) | (549,650 | ) | 6,321,687 | |||||||
| Wheat (205 contracts, settlement date May 14, 2014) | (0.20 | ) | (627,613 | ) | 6,273,000 | |||||||
| Wheat (205 contracts, settlement date March 14, 2014) | (0.20 | ) | (627,788 | ) | 6,203,812 | |||||||
| Net Unrealized Depreciation on Futures Contracts | (1.27 | )% | $ | (4,055,188 | ) | $ | 319,612,065 | |||||
| * | Denotes less than 0.000% yet greater than (0.005)% |
| ** | Denotes greater than 0.000% yet less than 0.005% |
| *** | The CME Group changed specifications and the name of Heating Oil futures to ‘NY Harbor ULSD’ in May 2013 |
| General Units | Limited Units | Total | ||||||||||||||||||||||||||||||||||
| Total | Total | |||||||||||||||||||||||||||||||||||
| General | Limited | Total | ||||||||||||||||||||||||||||||||||
| General Units | Accumulated | Shareholders’ | Limited Units | Accumulated | Shareholders’ | Shareholders’ | ||||||||||||||||||||||||||||||
| Units | Amount | Deficit | Equity | Units | Amount | Earnings | Equity | Equity | ||||||||||||||||||||||||||||
| Balance at January 1, 2009 | 50 | $ | 1,500 | $ | (404 | ) | $ | 1,096 | 800,000 | $ | 24,539,494 | $ | (7,000,766 | ) | $ | 17,538,728 | $ | 17,539,824 | ||||||||||||||||||
| Creation of Limited Units | - | - | - | - | 11,000,000 | 260,518,098 | - | 260,518,098 | 260,518,098 | |||||||||||||||||||||||||||
| Redemption of Limited Units | - | - | - | - | (3,050,000 | ) | (74,556,681 | ) | - | (74,556,681 | ) | (74,556,681 | ) | |||||||||||||||||||||||
| Net gain: | ||||||||||||||||||||||||||||||||||||
| Net investment loss | - | - | (14 | ) | (14 | ) | - | - | (1,179,767 | ) | (1,179,767 | ) | (1,179,781 | ) | ||||||||||||||||||||||
| Net realized (loss) gain on Investments and Futures Contracts | - | - | (2 | ) | (2 | ) | - | - | 12,851,611 | 12,851,611 | 12,851,609 | |||||||||||||||||||||||||
| Net change in unrealized gain on Investments and Futures Contracts | - | - | 231 | 231 | - | - | 14,261,038 | 14,261,038 | 14,261,269 | |||||||||||||||||||||||||||
| Net gain | - | - | 215 | 215 | - | - | 25,932,882 | 25,932,882 | 25,933,097 | |||||||||||||||||||||||||||
| Balance at December 31, 2009 | 50 | $ | 1,500 | $ | (189 | ) | $ | 1,311 | 8,750,000 | $ | 210,500,911 | $ | 18,932,116 | $ | 229,433,027 | $ | 229,434,338 | |||||||||||||||||||
| 2014 | 2013 | 2012 | ||||||||||
| Income | ||||||||||||
| Interest Income | $ | 44,304 | $ | 189,643 | $ | 331,044 | ||||||
| Expenses | ||||||||||||
| Management fee to related party | 2,835,654 | 3,500,487 | 4,637,997 | |||||||||
| Brokerage fees and expenses | 667,213 | 823,644 | 377,195 | |||||||||
| Total expenses | 3,502,867 | 4,324,131 | 5,015,192 | |||||||||
| Net Investment Loss | (3,458,563 | ) | (4,134,488 | ) | (4,684,148 | ) | ||||||
Realized and Net Change in Unrealized Gain (Loss) on Investments and Futures Contracts | ||||||||||||
| Realized Gain (Loss) on | ||||||||||||
| Investments | - | (10,376 | ) | 1,429 | ||||||||
| Futures Contracts | (12,125,640 | ) | (53,539,832 | ) | (55,222,884 | ) | ||||||
| Net Realized Loss | (12,125,640 | ) | (53,550,208 | ) | (55,221,455 | ) | ||||||
| Net Change in Unrealized Gain (Loss) on | ||||||||||||
| Investments | (1,254 | ) | (13,546 | ) | 15,980 | |||||||
| Futures Contracts | (23,193,888 | ) | 8,459,270 | 32,487,331 | ||||||||
| Net Change in Unrealized Gain (Loss) | (23,195,142 | ) | 8,445,724 | 32,503,311 | ||||||||
Net Realized and Unrealized Loss on Investments and Futures Contracts | (35,320,782 | ) | (45,104,484 | ) | (22,718,144 | ) | ||||||
| Net Loss | $ | (38,779,345 | ) | $ | (49,238,972 | ) | $ | (27,402,292 | ) | |||
| 2011 | 2010 | 2009 | ||||||||||
| Cash flow from operating activities: | ||||||||||||
| Net (Loss) Gain | $ | (73,765,925 | ) | $ | 86,627,933 | $ | 25,933,097 | |||||
| Adjustments to reconcile net gain (loss) to net cash used for operating activities: | ||||||||||||
| Purchase of investment securities | (1,594,743,929 | ) | (1,159,625,357 | ) | (604,867,964 | ) | ||||||
| Proceeds from sales of investment securities | 2,054,999,635 | 809,997,503 | 489,996,097 | |||||||||
| Net accretion of discount | (335,677 | ) | (301,808 | ) | (119,648 | ) | ||||||
| Net realized (gain) loss on investment securities | (451 | ) | 403 | (397 | ) | |||||||
| Unrealized depreciation (appreciation) on investments | 103,661,763 | (46,277,527 | ) | (14,261,269 | ) | |||||||
| Increase in capital shares payable and other assets | 1,497,826 | - | 1,099,695 | |||||||||
| Increase in accrued expenses | 717,847 | 515,001 | 177,929 | |||||||||
| Net cash provided by (used for) operating activities | 492,031,089 | (309,063,852 | ) | (102,042,460 | ) | |||||||
| Cash flows from financing activities: | ||||||||||||
| Proceeds from creation of Limited Units | 383,075,174 | 262,051,675 | 260,518,098 | |||||||||
| Redemption of Limited Units | (262,514,288 | ) | (43,750,891 | ) | (74,556,681 | ) | ||||||
| Net cash provided by financing activities | 120,560,886 | 218,300,784 | 185,961,417 | |||||||||
| Net change in cash | 612,591,975 | (90,763,068 | ) | 83,918,957 | ||||||||
| Cash held by broker at beginning of period | 6,487,519 | 97,250,587 | 13,331,630 | |||||||||
| Cash held by broker at end of period | $ | 619,079,494 | $ | 6,487,519 | $ | 97,250,587 | ||||||
| General Units | Limited Units | Total | ||||||||||||||||||||||||||||||||||
| Total | Total | |||||||||||||||||||||||||||||||||||
| General | Limited | Total | ||||||||||||||||||||||||||||||||||
| General Units | Accumulated | Shareholders’ | Limited Units | Accumulated | Shareholders’ | Shareholders’ | ||||||||||||||||||||||||||||||
| Units | Amount | Deficit | Equity | Units | Amount | Deficit | Equity | Equity | ||||||||||||||||||||||||||||
| Balance at January 1, 2014 | 50 | $ | 1,500 | $ | (215 | ) | $ | 1,285 | 12,450,000 | $ | 364,838,413 | $ | (44,847,114 | ) | $ | 319,991,299 | $ | 319,992,584 | ||||||||||||||||||
| Creation of Limited Units | - | - | - | - | 1,550,000 | 43,387,949 | - | 43,387,949 | 43,387,949 | |||||||||||||||||||||||||||
| Redemption of Limited Units | - | - | - | - | (2,300,000 | ) | (57,703,054 | ) | - | (57,703,054 | ) | (57,703,054 | ) | |||||||||||||||||||||||
| Net Loss: | ||||||||||||||||||||||||||||||||||||
| Net Investment Loss | - | - | (15 | ) | (15 | ) | - | - | (3,458,548 | ) | (3,458,548 | ) | (3,458,563 | ) | ||||||||||||||||||||||
Net Realized Loss on Investments and Futures Contracts | - | - | (45 | ) | (45 | ) | - | - | (12,125,595 | ) | (12,125,595 | ) | (12,125,640 | ) | ||||||||||||||||||||||
Net Change in Unrealized Loss on Investments and Futures Contracts | - | - | (85 | ) | (85 | ) | - | - | (23,195,057 | ) | (23,195,057 | ) | (23,195,142 | ) | ||||||||||||||||||||||
| Net Loss | - | - | (145 | ) | (145 | ) | - | - | (38,779,200 | ) | (38,779,200 | ) | (38,779,345 | ) | ||||||||||||||||||||||
| Balance at December 31, 2014 | 50 | $ | 1,500 | $ | (360 | ) | $ | 1,140 | 11,700,000 | $ | 350,523,308 | $ | (83,626,314 | ) | $ | 266,896,994 | $ | 266,898,134 | ||||||||||||||||||
| 62 |
| 2011 | 2010 | |||||||
| Assets | ||||||||
| Equity in broker trading accounts: | ||||||||
| Short-term investments (cost $9,999,989 and $469,919,567 as of 2011 and 2010, | ||||||||
| respectively) | $ | 9,999,990 | $ | 469,939,860 | ||||
| Cash held by broker | 619,079,494 | 6,487,519 | ||||||
| Net unrealized (depreciation) appreciation on futures contracts | (45,001,789 | ) | 58,639,682 | |||||
| Total assets | $ | 584,077,695 | $ | 535,067,061 | ||||
| Liabilities and shareholders’ equity | ||||||||
| Capital shares payable | $ | 1,497,826 | $ | - | ||||
| Management fee payable to related party | 438,205 | 352,427 | ||||||
| Broker fee payable | 983,648 | 351,579 | ||||||
| Total liabilities | 2,919,679 | 704,006 | ||||||
| Shareholders’ equity | ||||||||
| General Units: | ||||||||
| Paid in capital - 50 units issued | 1,500 | 1,500 | ||||||
| Retained (deficit) earnings | (2 | ) | 144 | |||||
| Total General Units | 1,498 | 1,644 | ||||||
| Limited Units: | ||||||||
| Paid in capital - 19,400,000 and 16,250,000 redeemable units | ||||||||
| issued and outstanding as of 2011 and 2010, respectively | 549,362,581 | 428,801,695 | ||||||
| Retained earnings | 31,793,937 | 105,559,716 | ||||||
| Total Limited Units | 581,156,518 | 534,361,411 | ||||||
Total shareholders’ equity | 581,158,016 | 534,363,055 | ||||||
| Total liabilities and shareholders’ equity | $ | 584,077,695 | $ | 535,067,061 | ||||
| Net asset value per share | ||||||||
| General Units | $ | 29.96 | $ | 32.88 | ||||
| Limited Units | $ | 29.96 | $ | 32.88 | ||||
| General Units | Limited Units | Total | ||||||||||||||||||||||||||||||||||
| Total | Total | |||||||||||||||||||||||||||||||||||
| General | Limited | Total | ||||||||||||||||||||||||||||||||||
| General Units | Accumulated | Shareholders’ | Limited Units | Accumulated | Shareholders’ | Shareholders’ | ||||||||||||||||||||||||||||||
| Units | Amount | Deficit | Equity | Units | Amount | Deficit | Equity | Equity | ||||||||||||||||||||||||||||
| Balance at January 1, 2013 | 50 | $ | 1,500 | $ | (57 | ) | $ | 1,443 | 16,450,000 | $ | 470,214,957 | $ | 4,391,700 | $ | 474,606,657 | $ | 474,608,100 | |||||||||||||||||||
| Creation of Limited Units | - | - | - | - | 900,000 | 25,704,701 | - | 25,704,701 | 25,704,701 | |||||||||||||||||||||||||||
| Redemption of Limited Units | - | - | - | - | (4,900,000 | ) | (131,081,245 | ) | - | (131,081,245 | ) | (131,081,245 | ) | |||||||||||||||||||||||
| Net Loss: | ||||||||||||||||||||||||||||||||||||
| Net Investment Loss | - | - | (15 | ) | (15 | ) | - | - | (4,134,473 | ) | (4,134,473 | ) | (4,134,488 | ) | ||||||||||||||||||||||
Net Realized Loss on Investments and Futures Contracts | - | - | (171 | ) | (171 | ) | - | - | (53,550,037 | ) | (53,550,037 | ) | (53,550,208 | ) | ||||||||||||||||||||||
Net Change in Unrealized Gain on Investments and Futures Contracts | - | - | 28 | 28 | - | - | 8,445,696 | 8,445,696 | 8,445,724 | |||||||||||||||||||||||||||
| Net Loss | - | - | (158 | ) | (158 | ) | (49,238,814 | ) | (49,238,814 | ) | (49,238,972 | ) | ||||||||||||||||||||||||
| Balance at December 31, 2013 | 50 | $ | 1,500 | $ | (215 | ) | $ | 1,285 | 12,450,000 | $ | 364,838,413 | $ | (44,847,114 | ) | $ | 319,991,299 | $ | 319,992,584 | ||||||||||||||||||
| 63 |
| General Units | Limited Units | Total | ||||||||||||||||||||||||||||||||||
| Total | Total | |||||||||||||||||||||||||||||||||||
| General | Limited | Total | ||||||||||||||||||||||||||||||||||
| General Units | Accumulated | Shareholders’ | Limited Units | Accumulated | Shareholders’ | Shareholders’ | ||||||||||||||||||||||||||||||
| Units | Amount | Deficit | Equity | Units | Amount | Earnings | Equity | Equity | ||||||||||||||||||||||||||||
| Balance at January 1, 2012 | 50 | $ | 1,500 | $ | (2 | ) | $ | 1,498 | 19,400,000 | $ | 549,362,581 | $ | 31,793,937 | $ | 581,156,518 | $ | 581,158,016 | |||||||||||||||||||
| Creation of Limited Units | - | - | - | - | 3,250,000 | 101,149,075 | - | 101,149,075 | 101,149,075 | |||||||||||||||||||||||||||
| Redemption of Limited Units | - | - | - | - | (6,200,000 | ) | (180,296,699 | ) | - | (180,296,699 | ) | (180,296,699 | ) | |||||||||||||||||||||||
| Net loss: | ||||||||||||||||||||||||||||||||||||
| Net investment loss | - | - | (13 | ) | (13 | ) | - | - | (4,684,135 | ) | (4,684,135 | ) | (4,684,148 | ) | ||||||||||||||||||||||
Net realized loss on Investments and Futures Contracts | - | - | (135 | ) | (135 | ) | - | - | (55,221,320 | ) | (55,221,320 | ) | (55,221,455 | ) | ||||||||||||||||||||||
Net change in unrealized gain on Investments and Futures Contracts | - | - | 93 | 93 | - | - | 32,503,218 | 32,503,218 | 32,503,311 | |||||||||||||||||||||||||||
| Net loss | - | - | (55 | ) | (55 | ) | - | - | (27,402,237 | ) | (27,402,237 | ) | (27,402,292 | ) | ||||||||||||||||||||||
| Balance at December 31, 2012 | 50 | $ | 1,500 | $ | (57 | ) | $ | 1,443 | 16,450,000 | $ | 470,214,957 | $ | 4,391,700 | $ | 474,606,657 | $ | 474,608,100 | |||||||||||||||||||
| 2014 | 2013 | 2012 | ||||||||||
| Cash flow from operating activities: | ||||||||||||
| Net Loss | $ | (38,779,345 | ) | $ | (49,238,972 | ) | $ | (27,402,292 | ) | |||
Adjustments to reconcile net loss to net cash provided by (used for) operating activities: | ||||||||||||
| Purchase of investment securities | (778,448,400 | ) | (1,484,819,380 | ) | (2,089,638,671 | ) | ||||||
| Proceeds from sales of investment securities | 778,495,000 | 1,754,981,721 | 1,629,991,694 | |||||||||
| Net accretion of discount | (44,304 | ) | (189,643 | ) | (331,044 | ) | ||||||
| Net realized (gain) loss on investment securities | - | 10,376 | (1,429 | ) | ||||||||
| Unrealized depreciation (appreciation) on investments | 23,195,142 | (8,445,724 | ) | (32,503,311 | ) | |||||||
| Decrease in accrued expenses | (87,513 | ) | (387,139 | ) | (666,087 | ) | ||||||
| Net cash provided by (used for) operating activities | (15,669,420 | ) | 211,911,239 | (520,551,140 | ) | |||||||
| Cash flows from financing activities: | ||||||||||||
| Proceeds from creation of Limited Units | 43,387,949 | 25,704,701 | 101,149,075 | |||||||||
| Redemption of Limited Units | (57,703,054 | ) | (131,081,245 | ) | (180,296,699 | ) | ||||||
| Increase (decrease) in capital shares payable | - | (4,327,722 | ) | 2,829,896 | ||||||||
| Net cash provided by (used for) financing activities | (14,315,105 | ) | (109,704,266 | ) | (76,317,728 | ) | ||||||
| Net change in cash | (29,984,525 | ) | 102,206,973 | (596,868,868 | ) | |||||||
| Cash held by broker at beginning of year | 124,417,599 | 22,210,626 | 619,079,494 | |||||||||
| Cash held by broker at end of year | $ | 94,433,074 | $ | 124,417,599 | $ | 22,210,626 | ||||||
| Percentage of | Fair | Face | ||||||||||
| Description | Net Assets | Value | Value | |||||||||
| U.S. Treasury Obligations | ||||||||||||
| U.S. Treasury Bill, 0.00% due January 05, 2012 (cost $9,999,989) | 1.72 | % | $ | 9,999,990 | $ | 10,000,000 | ||||||
| Percentage of | Fair | Notional | ||||||||||
| Description | Net Assets | Value | Value | |||||||||
| Unrealized Appreciation/(Depreciation) on Futures Contracts | ||||||||||||
| Cocoa (535 contracts, settlement date March 15, 2012) | (0.55 | ) % | $ | (3,205,990 | ) | $ | 11,283,150 | |||||
| Cocoa (536 contracts, settlement date May 15, 2012) | (0.53 | ) | (3,093,380 | ) | 11,422,160 | |||||||
| Cocoa (536 contracts, settlement date July 16, 2012) | (0.33 | ) | (1,932,240 | ) | 11,513,280 | |||||||
| Coffee (133 contracts, settlement date March 20, 2012) | (0.15 | ) | (896,456 | ) | 11,314,144 | |||||||
| Coffee (132 contracts, settlement date May 18, 2012) | (0.16 | ) | (919,744 | ) | 11,367,675 | |||||||
| Coffee (132 contracts, settlement date July 19, 2012) | (0.06 | ) | (352,538 | ) | 11,493,900 | |||||||
| Copper (133 contracts, settlement date March 28, 2012) | (0.10 | ) | (592,150 | ) | 11,424,700 | |||||||
| Copper (132 contracts, settlement date May 29, 2012) | (0.11 | ) | (608,013 | ) | 11,376,750 | |||||||
| Copper (132 contracts, settlement date July 27, 2012) | 0.01 | 51,438 | 11,401,500 | |||||||||
| Corn (349 contracts, settlement date March 14, 2012) | (0.15 | ) | (862,200 | ) | 11,281,425 | |||||||
| Corn (349 contracts, settlement date May 14, 2012) | (0.15 | ) | (839,875 | ) | 11,425,387 | |||||||
| Corn (348 contracts, settlement date July 13, 2012) | 0.01 | 33,125 | 11,505,750 | |||||||||
| Cotton (249 contracts, settlement date March 08, 2012) | (0.13 | ) | (726,570 | ) | 11,429,100 | |||||||
| Cotton (248 contracts, settlement date May 08, 2012) | (0.15 | ) | (851,265 | ) | 11,368,320 | |||||||
| Cotton (248 contracts, settlement date July 09, 2012) | (0.12 | ) | (721,380 | ) | 11,322,440 | |||||||
| Florida Orange Juice (561 contracts, settlement date March 12, 2012) | 0.04 | 257,978 | 14,221,350 | |||||||||
| Florida Orange Juice (486 contracts, settlement date May 10, 2012) | 0.15 | 856,470 | 12,261,780 | |||||||||
| Florida Orange Juice (306 contracts, settlement date July 11, 2012) | (0.01 | ) | (32,880 | ) | 7,738,740 | |||||||
| Gold (72 contracts, settlement date February 27, 2012) | (0.09 | ) | (527,380 | ) | 11,280,960 | |||||||
| Gold (72 contracts, settlement date April 26, 2012) | (0.21 | ) | (1,233,460 | ) | 11,299,680 | |||||||
| Gold (73 contracts, settlement date June 27, 2012) | (0.25 | ) | (1,434,620 | ) | 11,472,680 | |||||||
| Heating Oil (57 contracts, settlement date January 31, 2012) | (0.02 | ) | (109,389 | ) | 6,976,595 | |||||||
| Heating Oil (56 contracts, settlement date February 29, 2012) | (0.02 | ) | (101,056 | ) | 6,834,677 | |||||||
| Heating Oil (56 contracts, settlement date March 30, 2012) | (0.02 | ) | (111,661 | ) | 6,789,283 | |||||||
| Heating Oil (56 contracts, settlement date April 30, 2012) | (0.09 | ) | (493,088 | ) | 6,734,482 | |||||||
| Heating Oil (56 contracts, settlement date May 31, 2012) | (0.08 | ) | (488,053 | ) | 6,693,557 | |||||||
| Lean Hogs (236 contracts, settlement date February 14, 2012) | (0.07 | ) | (384,030 | ) | 7,957,920 | |||||||
| Lean Hogs (236 contracts, settlement date April 16, 2012) | (0.06 | ) | (325,560 | ) | 8,278,880 | |||||||
| Lean Hogs (235 contracts, settlement date June 14, 2012) | (0.05 | ) | (275,680 | ) | 8,977,000 | |||||||
| Lean Hogs (236 contracts, settlement date July 16, 2012) | (0.04 | ) | (210,990 | ) | 8,951,480 | |||||||
| Light, Sweet Crude Oil (69 contracts, settlement date January 20, 2012) | 0.13 | 727,240 | 6,819,270 | |||||||||
| Light, Sweet Crude Oil (69 contracts, settlement date February 21, 2012) | 0.13 | 746,950 | 6,831,000 | |||||||||
| Light, Sweet Crude Oil (69 contracts, settlement date March 20, 2012) | 0.13 | 746,560 | 6,845,490 | |||||||||
| Light, Sweet Crude Oil (69 contracts, settlement date April 20, 2012) | 0.01 | 82,600 | 6,859,290 | |||||||||
| Light, Sweet Crude Oil (68 contracts, settlement date May 22, 2012) | 0.02 | 113,320 | 6,764,640 | |||||||||
| Live Cattle (229 contracts, settlement date February 29, 2012) | 0.00 | * | 2,380 | 11,124,820 | ||||||||
| Live Cattle (230 contracts, settlement date April 30, 2012) | (0.02 | ) | (131,730 | ) | 11,541,400 | |||||||
| Live Cattle (230 contracts, settlement date June 29, 2012) | (0.02 | ) | (122,410 | ) | 11,460,900 | |||||||
| Natural Gas (224 contracts, settlement date January 27, 2012) | (0.40 | ) | (2,315,920 | ) | 6,695,360 | |||||||
| Natural Gas (224 contracts, settlement date February 27, 2012) | (0.38 | ) | (2,204,450 | ) | 6,755,840 | |||||||
| Natural Gas (220 contracts, settlement date March 28, 2012) | (0.36 | ) | (2,067,940 | ) | 6,773,800 | |||||||
| Natural Gas (220 contracts, settlement date April 26, 2012) | (0.20 | ) | (1,188,850 | ) | 6,888,200 | |||||||
| Natural Gas (219 contracts, settlement date May 29, 2012) | (0.20 | ) | (1,169,040 | ) | 6,968,580 | |||||||
| Platinum (243 contracts, settlement date April 26, 2012) | (0.43 | ) | (2,468,450 | ) | 17,069,535 | |||||||
| Platinum (243 contracts, settlement date July 27, 2012) | (0.44 | ) | (2,566,290 | ) | 17,124,210 | |||||||
| Silver (82 contracts, settlement date March 28, 2012) | (0.35 | ) | (2,055,925 | ) | 11,445,150 | |||||||
| Silver (81 contracts, settlement date May 29, 2012) | (0.38 | ) | (2,222,650 | ) | 11,323,800 | |||||||
| Silver (81 contracts, settlement date July 27, 2012) | (0.33 | ) | (1,944,665 | ) | 11,338,785 | |||||||
| Soybean (186 contracts, settlement date March 14, 2012) | (0.17 | ) | (1,016,225 | ) | 11,232,075 | |||||||
| Soybean (187 contracts, settlement date May 14, 2012) | (0.16 | ) | (954,425 | ) | 11,383,625 | |||||||
| Soybean (187 contracts, settlement date July 13, 2012) | 0.05 | 264,900 | 11,472,450 | |||||||||
| Sugar (444 contracts, settlement date February 29, 2012) | (0.24 | ) | (1,406,339 | ) | 11,586,624 | |||||||
| Sugar (444 contracts, settlement date April 30, 2012) | (0.20 | ) | (1,152,122 | ) | 11,412,576 | |||||||
| Sugar (444 contracts, settlement date June 29, 2012) | (0.09 | ) | (545,496 | ) | 11,218,637 | |||||||
| Wheat (343 contracts, settlement date March 14, 2012) | (0.20 | ) | (1,133,987 | ) | 11,194,662 | |||||||
| Wheat (340 contracts, settlement date May 14, 2012) | (0.19 | ) | (1,118,513 | ) | 11,411,250 | |||||||
| Wheat (340 contracts, settlement date July 13, 2012) | 0.04 | 230,325 | 11,666,250 | |||||||||
| Net Unrealized Depreciation on Futures Contracts | (7.74 | ) % | $ | (45,001,789 | ) | $ | 580,606,964 | |||||
| * Denotes greater than 0.000% yet less than 0.005% | ||||||||||||
| 65 |
GreenHaven Continuous Commodity Index Master Fund Notes to Consolidated Financial Statements Years Ended December 31, 2014, 2013, and 2012 | |||||||||||||||||||||||||||||||||||||||||||||||||||||||||||||||||||||||||||||||||||||||||||||||||||||||||||||||||||||||||||||||||||||||||||||||||||||||||||||||||||||||||||||||||||||||||||||||||||||||||||||||||||||||||||||||||||||||||||||||||||||||||||||||||||||||||||||||||||||||||||||||||||||||||||||||||||||||||||||||||||||||||||||||||||||||||||||||||||||||||||||||||||||||||||||||||||||||||||||||||||||||||||||||||||||||||||||||||||||||||||||||||||||||||||||||||||||||||||||||||||||||||||||||||||||||||||||||||||||||||||||||||||||||||||||||||||||||||||||||||||||||||||||||||||||||||||||||||||||||||||||||||||||||||||||||||||||||||||||||||||||||||||||||||||||||||||||||||||||||||||||||||||||||||||||||||||||||||||||||||||||||||||||||||||||||||||||||||||||||||||||||||||||||||||||||||||||||||||||||||||||||||||||||||||||||||||||||||||||||||||||||||||||||||||||||||||||||||||||||||||||||||||||||||||||||||||||||||||||||||||||||||||||||||||||||||||||
| 2011 | 2010 | 2009 | ||||||||||
| Income | ||||||||||||
| Interest Income | $ | 335,677 | $ | 301,808 | $ | 126,329 | ||||||
| Expenses | ||||||||||||
| Management fee to related party | 5,895,201 | 2,523,863 | 1,018,526 | |||||||||
| Brokerage commissions and fees | 1,300,472 | 712,620 | 287,584 | |||||||||
| Total expenses | 7,195,673 | 3,236,483 | 1,306,110 | |||||||||
| Net Investment Loss | (6,859,996 | ) | (2,934,675 | ) | (1,179,781 | ) | ||||||
| Realized and Net Change in Unrealized Gain (Loss) on Investments and Futures Contracts | ||||||||||||
| Realized Gain (Loss) on | ||||||||||||
| Investments | 451 | (403 | ) | 397 | ||||||||
| Futures Contracts | 36,755,383 | 43,285,484 | 12,851,212 | |||||||||
| Net Realized Gain | 36,755,834 | 43,285,081 | 12,851,609 | |||||||||
| Net Change in Unrealized (Loss) Gain on | ||||||||||||
| Investments | (20,292 | ) | 18,076 | 748 | ||||||||
| Futures Contracts | (103,641,471 | ) | 46,259,451 | 14,260,521 | ||||||||
| Net Change in Unrealized (Loss) Gain | (103,661,763 | ) | 46,277,527 | 14,261,269 | ||||||||
| Net Realized and Unrealized (Loss) Gain on Investments and Future Contracts | (66,905,929 | ) | 89,562,608 | 27,112,878 | ||||||||
| Net (Loss) Gain | $ | (73,765,925 | ) | $ | 86,627,933 | $ | 25,933,097 | |||||
| General Units | Limited Units | Total | ||||||||||||||||||||||||||||||||||
| Total | Total | |||||||||||||||||||||||||||||||||||
| General | Limited | Total | ||||||||||||||||||||||||||||||||||
| General Units | Accumulated | Shareholders’ | Limited Units | Accumulated | Shareholders’ | Shareholders’ | ||||||||||||||||||||||||||||||
| Units | Amount | Deficit | Equity | Units | Amount | Earnings | Equity | Equity | ||||||||||||||||||||||||||||
| Balance at January 1, 2011 | 50 | $ | 1,500 | $ | 144 | $ | 1,644 | 16,250,000 | $ | 428,801,695 | $ | 105,559,716 | $ | 534,361,411 | $ | 534,363,055 | ||||||||||||||||||||
| Creation of Limited Units | - | - | - | - | 11,200,000 | 383,075,174 | - | 383,075,174 | 383,075,174 | |||||||||||||||||||||||||||
| Redemption of Limited Units | - | - | - | - | (8,050,000 | ) | (262,514,288 | ) | - | (262,514,288 | ) | (262,514,288 | ) | |||||||||||||||||||||||
| Net loss: | ||||||||||||||||||||||||||||||||||||
| Net investment loss | - | - | (17 | ) | (17 | ) | - | - | (6,859,979 | ) | (6,859,979 | ) | (6,859,996 | ) | ||||||||||||||||||||||
Net realized gain on Investments and Futures Contracts | - | - | 88 | 88 | - | - | 36,755,746 | 36,755,746 | 36,755,834 | |||||||||||||||||||||||||||
Net change in unrealized loss on Investments and Futures Contracts | - | - | (217 | ) | (217 | ) | - | - | (103,661,546 | ) | (103,661,546 | ) | (103,661,763 | ) | ||||||||||||||||||||||
| Net loss | - | - | (146 | ) | (146 | ) | - | - | (73,765,779 | ) | (73,765,779 | ) | (73,765,925 | ) | ||||||||||||||||||||||
Balance at December 31, 2011 | 50 | $ | 1,500 | $ | (2 | ) | $ | 1,498 | 19,400,000 | $ | 549,362,581 | $ | 31,793,937 | $ | 581,156,518 | $ | 581,158,016 | |||||||||||||||||||
| General Units | Limited Units | Total | ||||||||||||||||||||||||||||||||||
| Total | Total | |||||||||||||||||||||||||||||||||||
| General | Limited | Total | ||||||||||||||||||||||||||||||||||
| General Units | Accumulated | Shareholders’ | Limited Units | Accumulated | Shareholders’ | Shareholders’ | ||||||||||||||||||||||||||||||
| Units | Amount | Earnings | Equity | Units | Amount | Earnings | Equity | Equity | ||||||||||||||||||||||||||||
| Balance at January 1, 2010 | 50 | $ | 1,500 | $ | (189 | ) | $ | 1,311 | 8,750,000 | $ | 210,500,911 | $ | 18,932,116 | $ | 229,433,027 | $ | 229,434,338 | |||||||||||||||||||
| Creation of Limited Units | - | - | - | - | 9,200,000 | 262,051,675 | - | 262,051,675 | 262,051,675 | |||||||||||||||||||||||||||
| Redemption of Limited Units | - | - | - | - | (1,700,000 | ) | (43,750,891 | ) | - | (43,750,891 | ) | (43,750,891 | ) | |||||||||||||||||||||||
| Net gain: | ||||||||||||||||||||||||||||||||||||
| Net investment loss | - | - | (15 | ) | (15 | ) | - | - | (2,934,660 | ) | (2,934,660 | ) | (2,934,675 | ) | ||||||||||||||||||||||
Net realized gain on Investments and Futures Contracts | - | - | 165 | 165 | - | - | 43,284,916 | 43,284,916 | 43,285,081 | |||||||||||||||||||||||||||
Net change in unrealized gain on Investments and Futures Contracts | - | - | 183 | 183 | - | - | 46,277,344 | 46,277,344 | 46,277,527 | |||||||||||||||||||||||||||
| Net gain | - | - | 333 | 333 | - | - | 86,627,600 | 86,627,600 | 86,627,933 | |||||||||||||||||||||||||||
Balance at December 31, 2010 | 50 | $ | 1,500 | $ | 144 | $ | 1,644 | 16,250,000 | $ | 428,801,695 | $ | 105,559,716 | $ | 534,361,411 | $ | 534,363,055 | ||||||||||||||||||||
| General Units | Limited Units | Total | ||||||||||||||||||||||||||||||||||
| Total | Total | |||||||||||||||||||||||||||||||||||
| General | Limited | Total | ||||||||||||||||||||||||||||||||||
| General Units | Accumulated | Shareholders’ | Limited Units | Accumulated | Shareholders’ | Shareholders’ | ||||||||||||||||||||||||||||||
| Units | Amount | Defecit | Equity | Units | Amount | Earnings | Equity | Equity | ||||||||||||||||||||||||||||
| Balance at January 1, 2009 | 50 | $ | 1,500 | $ | (404 | ) | $ | 1,096 | 800,000 | $ | 24,539,494 | $ | (7,000,766 | ) | $ | 17,538,728 | $ | 17,539,824 | ||||||||||||||||||
| Creation of Limited Units | - | - | - | - | 11,000,000 | 260,518,098 | - | 260,518,098 | 260,518,098 | |||||||||||||||||||||||||||
Redemption of Limited Units | - | - | - | - | (3,050,000 | ) | (74,556,681 | ) | - | (74,556,681 | ) | (74,556,681 | ) | |||||||||||||||||||||||
| Net gain: | ||||||||||||||||||||||||||||||||||||
| Net investment loss | - | - | (14 | ) | (14 | ) | - | - | (1,179,767 | ) | (1,179,767 | ) | (1,179,781 | ) | ||||||||||||||||||||||
| Net realized (loss) gain on Investments and Futures Contracts | - | - | (2 | ) | (2 | ) | - | - | 12,851,611 | 12,851,611 | 12,851,609 | |||||||||||||||||||||||||
| Net change in unrealized gain on Investments and Futures Contracts | - | - | 231 | 231 | - | - | 14,261,038 | 14,261,038 | 14,261,269 | |||||||||||||||||||||||||||
| Net gain | - | - | 215 | 215 | - | - | 25,932,882 | 25,932,882 | 25,933,097 | |||||||||||||||||||||||||||
| Balance at December 31, 2009 | 50 | $ | 1,500 | $ | (189 | ) | $ | 1,311 | 8,750,000 | $ | 210,500,911 | $ | 18,932,116 | $ | 229,433,027 | $ | 229,434,338 | |||||||||||||||||||
| 2011 | 2010 | 2009 | ||||||||||
| Cash flow from operating activities: | ||||||||||||
| Net Gain (Loss) | $ | (73,765,925 | ) | $ | 86,627,933 | $ | 25,933,097 | |||||
| Adjustments to reconcile net (loss) gain to net cash used for operating activities: | ||||||||||||
| Purchase of investment securities | (1,594,743,929 | ) | (1,159,625,357 | ) | (604,867,964 | ) | ||||||
| Proceeds from sales of investment securities | 2,054,999,635 | 809,997,503 | 489,996,097 | |||||||||
| Net accretion of discount | (335,677 | ) | (301,808 | ) | (119,648 | ) | ||||||
| Net realized (gain) loss on investment securities | (451 | ) | 403 | (397 | ) | |||||||
| Unrealized depreciation (appreciation) on investments | 103,661,763 | (46,277,527 | ) | (14,261,269 | ) | |||||||
| Increase in capital shares payable and other assets | 1,497,826 | - | 1,099,695 | |||||||||
| Increase in accrued expenses | 717,847 | 515,001 | 177,929 | |||||||||
| Net cash provided by (used for) operating activities | 492,031,089 | (309,063,852 | ) | (102,042,460 | ) | |||||||
| Cash flows from financing activities: | ||||||||||||
| Proceeds from creation of Limited Units | 383,075,174 | 262,051,675 | 260,518,098 | |||||||||
| Redemption of Limited Units | (262,514,288 | ) | (43,750,891 | ) | (74,556,681 | ) | ||||||
| Net cash provided by financing activities | 120,560,886 | 218,300,784 | 185,961,417 | |||||||||
| Net change in cash | 612,591,975 | (90,763,068 | ) | 83,918,957 | ||||||||
| Cash held by broker at beginning of period | 6,487,519 | 97,250,587 | 13,331,630 | |||||||||
| Cash held by broker at end of period | $ | 619,079,494 | $ | 6,487,519 | $ | 97,250,587 | ||||||
| Other | ||||||||||||||||
| Quoted Prices in | Significant | Significant | ||||||||||||||
| Active Market | Observable | Unobservable | ||||||||||||||
| Assets | (Level 1) | Inputs (Level 2) | Inputs (Level 3) | Totals | ||||||||||||
| U.S. Treasuries | $ | - | $ | 199,995,250 | $ | - | $ | 199,995,250 | ||||||||
| Futures Contracts | (27,249,076 | ) | - | - | (27,249,076 | ) | ||||||||||
| Total | $ | (27,249,076 | ) | $ | 199,995,250 | $ | - | $ | 172,746,174 | |||||||
| Assets | Quoted Prices in Active Market (Level 1) | Other Significant Observable Inputs (Level 2) | Significant Unobservable Inputs (Level 3) | Totals | ||||||||||||
| U.S. Treasuries | $ | - | $ | 9,999,990 | $ | - | $ | 9,999,990 | ||||||||
| Futures Contracts | (45,001,789 | ) | - | - | (45,001,789 | ) | ||||||||||
| Total | $ | (45,001,789 | ) | $ | 9,999,990 | $ | - | $ | (35,001,799 | ) | ||||||
| Assets | Quoted Prices in Active Market (Level 1) | Other Significant Observable Inputs (Level 2) | Significant Unobservable Inputs (Level 3) | Totals | ||||||||||||
| U.S. Treasuries | $ | - | $ | 469,939,860 | $ | - | $ | 469,939,860 | ||||||||
| Futures Contracts | 58,639,682 | - | - | 58,639,682 | ||||||||||||
| Total | $ | 58,639,682 | $ | 469,939,860 | $ | - | $ | 528,579,542 | ||||||||
| Other | ||||||||||||||||
| Quoted Prices in | Significant | Significant | ||||||||||||||
| Active Market | Observable | Unobservable | ||||||||||||||
| Assets | (Level 1) | Inputs (Level 2) | Inputs (Level 3) | Totals | ||||||||||||
| U.S. Treasuries | $ | - | $ | 199,998,800 | $ | - | $ | 199,998,800 | ||||||||
| Futures Contracts | (4,055,188 | ) | - | - | (4,055,188 | ) | ||||||||||
| Total | $ | (4,055,188 | ) | $ | 199,998,800 | $ | - | $ | 195,943,612 | |||||||
| Derivative Instruments | Asset Derivatives* | Liability Derivatives | Net Derivatives* | Asset Derivatives | Liability Derivatives | Net Derivatives | ||||||||||||||||||
| Futures Contracts | $ | (45,001,789 | ) | $ | - | $ | (45,001,789 | ) | $ | (27,249,076 | ) | $ | - | $ | (27,249,076 | ) | ||||||||
| Realized Loss | ||||||||
| on Derivative | Net Change in Unrealized Loss | |||||||
| Derivative Instruments | Instruments | on Derivative Instruments | ||||||
| Futures Contracts | $ | (12,125,640 | ) | $ | (23,193,888 | ) | ||
| Derivative Instruments | Asset Derivatives | Liability Derivatives | Net Derivatives | |||||||||
| Futures Contracts | $ | (4,055,188 | ) | $ | - | $ | (4,055,188 | ) | ||||
| Derivative Instruments | Realized Gain on Derivative Instruments | Net Change in Unrealized Loss on Derivative Instruments | ||||||
| Futures Contracts | $ | 36,755,383 | $ | (103,641,471 | ) | |||
| Derivative Instruments | Asset Derivatives* | Liability Derivatives | Net Derivatives* | |||||||||
| Futures Contracts | $ | 58,639,682 | $ | - | $ | 58,639,682 | ||||||
| Realized Loss on | Net Change in Unrealized Gain | |||||||
| Derivative Instruments | Derivative Instruments | on Derivative Instruments | ||||||
| Futures Contracts | $ | (53,539,832 | ) | $ | 8,459,270 | |||
| Derivative Instruments | Realized Gain on Derivative Instruments | Net Change in Unrealized Gain on Derivative Instruments | ||||||
| Futures Contracts | $ | 43,285,484 | $ | 46,259,451 | ||||
| Realized Loss on | Net Change in Unrealized Gain | |||||||||||||||
| Derivative Instruments | Realized Gain on Derivative Instruments | Net Change in Unrealized Gain on Derivative Instruments | Derivative Instruments | on Derivative Instruments | ||||||||||||
| Futures Contracts | $ | 12,851,212 | $ | 14,260,521 | $ | (55,222,884 | ) | $ | 32,487,331 | |||||||
| (a) | Creation of shares |
| (i) | it determines that the creation order is not in proper form; |
| (ii) | the Managing Owner believes that the creation order would have adverse tax consequences to the Fund or its Shareholders; or |
| (iii) | circumstances outside the control of the Managing Owner or the Distributor make it, for all practical purposes, not feasible to process creations of Baskets. |
| (b) | Redemption of Shares |
| (b) | Organization and Offering Expenses |
| Year Ended | Year Ended | Year Ended | ||||||||||
| December 31, 2011 | December 31, 2010 | December 31, 2009 | ||||||||||
| Net Asset Value | ||||||||||||
| Net asset value per Limited Share, beginning of period | $ | 32.88 | $ | 26.22 | $ | 21.92 | ||||||
| Net realized and change in unrealized gain (loss) from investments | (2.59 | ) | 6.93 | 4.53 | ||||||||
| Net investment income (loss) | (0.33 | ) | (0.27 | ) | (0.23 | ) | ||||||
| Net increase (decrease) in net assets from operations | (2.92 | ) | 6.66 | 4.30 | ||||||||
| Net asset value per Limited Share, end of period | $ | 29.96 | $ | 32.88 | $ | 26.22 | ||||||
| Market value per Limited Share, beginning of period | $ | 32.95 | $ | 26.32 | $ | 21.92 | ||||||
| Market value per Limited Share, end of period | $ | 29.96 | $ | 32.95 | $ | 26.32 | ||||||
| Ratio to average net assets (i) | ||||||||||||
| Net investment income (loss) | (0.99 | ) % | (0.98 | ) % | (0.98 | ) % | ||||||
| Total expenses | 1.04 | % | 1.09 | % | 1.08 | % | ||||||
| Total Return, at net asset value (ii) | (8.88 | ) % | 25.40 | % | 19.62 | % | ||||||
| Total Return, at market value (ii) | (9.07 | ) % | 25.19 | % | 20.07 | % | ||||||
| (i) Percentages are annualized. | ||||||||||||
| (ii) Percentages are not annualized. | ||||||||||||
Year Ended | Year Ended | Year Ended | ||||||||||
December 31, 2014 | December 31, 2013 | December 31, 2012 | ||||||||||
| Net Asset Value | ||||||||||||
| Net asset value per Limited Share, beginning of year | $ | 25.70 | $ | 28.85 | $ | 29.96 | ||||||
| Net realized and change in unrealized loss from investments | (2.62 | ) | (2.88 | ) | (0.85 | ) | ||||||
| Net investment loss on U.S. Treasury Obligations | (0.27 | ) | (0.27 | ) | (0.26 | ) | ||||||
| Net decrease in net assets from operations | (2.89 | ) | (3.15 | ) | (1.11 | ) | ||||||
| Net asset value per Limited Share, end of year | $ | 22.81 | $ | 25.70 | $ | 28.85 | ||||||
| Market value per Limited Share, beginning of year | $ | 25.70 | $ | 28.83 | $ | 29.92 | ||||||
| Market value per Limited Share, end of year | $ | 22.86 | $ | 25.70 | $ | 28.83 | ||||||
| Ratio to average net assets | ||||||||||||
| Net investment loss* | (1.04) | % | (1.01 | )% | (0.86 | )% | ||||||
| Total expenses | 1.05 | % | 1.05 | % | 0.92 | % | ||||||
| Total Return, at net asset value | (11.25 | )% | (10.92 | )% | (3.70 | )% | ||||||
| Total Return, at market value | (11.05 | )% | (10.86 | )% | (3.64 | )% | ||||||
ITEM |
| 75 |
Board of Managers and Shareholders of
GreenHaven Continuous Commodity Index Fund:
We have audited GreenHaven Continuous Commodity Index Fund’sthe internal control over financial reporting of GreenHaven Continuous Commodity Index Fund (a Delaware Statutory Trust) and subsidiary as of December 31, 2011,2014, based on criteria established in the 2013Internal Control — Control—Integrated Framework issued by the Committee of Sponsoring Organizations of the Treadway Commission (COSO). GreenHaven Continuous Commodity Index Fund’s management is responsible for maintaining effective internal control over financial reporting and for its assessment of the effectiveness of internal control over financial reporting, included in the accompanying Management’s Report on Internal Control Over FinancialManagement’sFinancial Reporting. Our responsibility is to express an opinion on the GreenHaven Continuous Commodity Index Fund’s internal control over financial reporting based on our audit.
We conducted our audit in accordance with the standards of the Public Company Accounting Oversight Board (United States). Those standards require that we plan and perform the audit to obtain reasonable assurance about whether effective internal control over financial reporting was maintained in all material respects. Our audit included obtaining an understanding of internal control over financial reporting, assessing the risk that a material weakness exists, testing and evaluating the design and operating effectiveness of internal control based on the assessed risk, and performing such other procedures as we considered necessary in the circumstances. We believe that our audit provides a reasonable basis for our opinion.
A company’s internal control over financial reporting is a process designed to provide reasonable assurance regarding the reliability of financial reporting and the preparation of financial statements for external purposes in accordance with generally accepted accounting principles. A company’s internal control over financial reporting includes those policies and procedures that (1) pertain to the maintenance of records that, in reasonable detail, accurately and fairly reflect the transactions and dispositions of the assets of the company; (2) provide reasonable assurance that transactions are recorded as necessary to permit preparation of financial statements in accordance with generally accepted accounting principles, and that receipts and expenditures of the company are being made only in accordance with authorizations of management and directors of the company; and (3) provide reasonable assurance regarding prevention or timely detection of unauthorized acquisition, use, or disposition of the company’s assets that could have a material effect on the financial statements.
Because of its inherent limitations, internal control over financial reporting may not prevent or detect misstatements. Also, projections of any evaluation of effectiveness to future periods are subject to the risk that controls may become inadequate because of changes in conditions, or that the degree of compliance with the policies or procedures may deteriorate.
In our opinion, GreenHaven Continuous Commodity Index Fund maintained, in all material respects, effective internal control over financial reporting as of December 31, 2011,2014, based on criteria established in the 2013Internal Control — Control—Integrated Framework issued by COSO.
We also have audited, in accordance with the standards of the Public Company Accounting Oversight Board (United States), the consolidated financial statements of financial condition, including the consolidated schedule of investments, of GreenHaven Continuous Commodity Index Fund and subsidiary as of December 31, 2011 and 2010, andfor the related consolidated statements of income and expenses, changes in shareholders’ equity, and cash flows for each of the three-years in the periodyear ended December 31, 20112014, and our report dated February 28, 2012March 6, 2015 and expressed an unqualified opinion on those financial statements.
/s/ GRANT THORNTON LLP
Atlanta, Georgia
March 6, 2015
We have audited the internal control over financial reporting of GreenHaven Continuous Commodity Index Master Fund’s internal control over financial reportingFund (a Delaware Statutory Trust) as of December 31, 2011,2014, based on criteria established in the 2013Internal Control — Control—Integrated Framework issued by the Committee of Sponsoring Organizations of the Treadway Commission (COSO). GreenHaven Continuous Commodity Index Master Fund’s management is responsible for maintaining effective internal control over financial reporting and for its assessment of the effectiveness of internal control over financial reporting, included in the accompanying Management’s Report on Internal Control Over Financial Reporting. Our responsibility is to express an opinion on the GreenHaven Continuous Commodity Index Master Fund’s internal control over financial reporting based on our audit.
We conducted our audit in accordance with the standards of the Public Company Accounting Oversight Board (United States). Those standards require that we plan and perform the audit to obtain reasonable assurance about whether effective internal control over financial reporting was maintained in all material respects. Our audit included obtaining an understanding of internal control over financial reporting, assessing the risk that a material weakness exists, testing and evaluating the design and operating effectiveness of internal control based on the assessed risk, and performing such other procedures as we considered necessary in the circumstances. We believe that our audit provides a reasonable basis for our opinion.
A company’s internal control over financial reporting is a process designed to provide reasonable assurance regarding the reliability of financial reporting and the preparation of financial statements for external purposes in accordance with generally accepted accounting principles. A company’s internal control over financial reporting includes those policies and procedures that (1) pertain to the maintenance of records that, in reasonable detail, accurately and fairly reflect the transactions and dispositions of the assets of the company; (2) provide reasonable assurance that transactions are recorded as necessary to permit preparation of financial statements in accordance with generally accepted accounting principles, and that receipts and expenditures of the company are being made only in accordance with authorizations of management and directors of the company; and (3) provide reasonable assurance regarding prevention or timely detection of unauthorized acquisition, use, or disposition of the company’s assets that could have a material effect on the financial statements.
Because of its inherent limitations, internal control over financial reporting may not prevent or detect misstatements. Also, projections of any evaluation of effectiveness to future periods are subject to the risk that controls may become inadequate because of changes in conditions, or that the degree of compliance with the policies or procedures may deteriorate.
In our opinion, GreenHaven Continuous Commodity Index Master Fund maintained, in all material respects, effective internal control over financial reporting as of December 31, 2011,2014, based on criteria established in the 2013Internal Control — Control—Integrated Framework issued by COSO.
We also have audited, in accordance with the standards of the Public Company Accounting Oversight Board (United States), the consolidatedfinancial statements of financial condition, including the consolidated schedule of investments, of GreenHaven Continuous Commodity Index Master Fund as of December 31, 2011 and 2010, andfor the related consolidated statements of income and expenses, changes in shareholders’ equity, and cash flows for each of the three-years in the periodyear ended December 31, 20112014, and our report dated February 28, 2012March 6, 2015 and expressed an unqualified opinion on those financial statements.
/s/ GRANT THORNTON LLP
Atlanta, Georgia
March 6, 2015
| Name | Age | Position | ||||||
| Ashmead Pringle | 68 | Chief Executive Officer and Member of the Board of Directors | ||||||
| 35 | Chief Financial Officer and Member of the Board of Directors | |||||||
| 63 | Independent Director, Audit Committee Member | |||||||
| 67 | Independent Director, Audit Committee Member | |||||||
| 45 | Independent Director, Audit Committee Member | |||||||
| Title of Class | Name and Address of Beneficial Owner | Amount and Nature of Beneficial Ownership | Percent of Class | ||||||
| General Shares | 3340 Peachtree Rd, Suite 1910 Atlanta, GA 30326 | 50 shares | 100 | % | |||||
| Change in | |||||||||||||||||||||
| Pension | |||||||||||||||||||||
| Value and | |||||||||||||||||||||
| Fees | Nonqualified | ||||||||||||||||||||
| Earned or | Non-Equity | Deferred | |||||||||||||||||||
| Paid in | Stock | Option | Incentive Plan | Compensation | All Other | ||||||||||||||||
| Name | Cash | Awards | Awards | Compensation | Plan | Compensation(1) | Total | ||||||||||||||
| Independent Directors | |||||||||||||||||||||
| Michael Loungo | $ | 21,000 | NA | NA | NA | $ | NA | $ | NA | $ | 21,000 | ||||||||||
| Edward O’Neil | $ | 15,000 | NA | NA | NA | $ | NA | $ | NA | $ | 15,000 | ||||||||||
| Marcus Bensman | $ | 15,000 | NA | NA | NA | $ | NA | $ | NA | $ | 15,000 | ||||||||||
| Change in | |||||||||||||||||||||
| Pension | |||||||||||||||||||||
| Value and | |||||||||||||||||||||
| Fees | Nonqualified | ||||||||||||||||||||
| Earned or | Non-Equity | Deferred | |||||||||||||||||||
| Paid in | Stock | Option | Incentive Plan | Compensation | All Other | ||||||||||||||||
| Name | Cash | Awards | Awards | Compensation | Plan | Compensation | Total | ||||||||||||||
| Independent Directors | |||||||||||||||||||||
| Thomas Mangold | $ | 21,000 | NA | NA | NA | $ | NA | $ | NA | $ | 21,000 | ||||||||||
| Stephen O’Grady | $ | 15,000 | NA | NA | NA | $ | NA | $ | NA | $ | 15,000 | ||||||||||
| Cengiz Searfoss | $ | 15,000 | NA | NA | NA | $ | NA | $ | NA | $ | 15,000 | ||||||||||
| 80 |
ITEM 14. | PRINCIPAL ACCOUNTANT FEES AND SERVICES |
| Fiscal Year Ended | Fiscal Year Ended | Fiscal Year Ended | Fiscal Year Ended | |||||||||||||
| December 31, 2011 | December 31, 2010 | December 31, 2014 | December 31, 2013 | |||||||||||||
| Audit Fees | $ | 151,000 | $ | 157,850 | $ | 159,077 | $ | 155,000 | ||||||||
| Audit-Related Fees | ||||||||||||||||
| Tax Fes | ||||||||||||||||
| Tax Fees | ||||||||||||||||
| All Other Fees | ||||||||||||||||
| Total | $ | 151,000 | $ | 157,850 | $ | 159,077 | $ | 155,000 | ||||||||
| EXHIBIT NO. | DESCRIPTION | |
| 4.1 | Amended Declaration of Trust and Trust Agreement of the Registrant1 | |
| 4.2 | Amended Declaration of Trust and Trust Agreement of the Co-Registrant1 | |
| 4.3 | Form of Participant Agreement2 | |
| 10.1 | Form of Escrow Agreement3 | |
| 10.2 | Form of Global Custody Agreement3 | |
| 10.3 | ||
Form of | ||
| 10.4 | Form of Transfer Agency and Service Agreement3 | |
| 10.5 | Form of Distribution Services Agreement4 | |
10.6 10.7 10.9 10.10 10.11 10.12 10.13 10.14 10.15 10.16 10.17 10.18 10.19 | Marketing Agreement with ALPS Distributors, Inc4 License Agreement1 Addendum to License Agreement5 Addendum to License Agreement6 Addendum to License Agreement7 Addendum to License Agreement8 Amendment to Marketing Services Agreement9 Amendment to Marketing Services Agreement10 Amendment to Marketing Services Agreement11 Amendment to Marketing Services Agreement13 Amendment to Distribution Agreement9 Amendment to Distribution Agreement14 Addendum to License Agreement12 | |
| 23.1 | Consent of Independent Registered Public Accounting Firm | |
| 31.1 | Certificate Pursuant to Rule 13a-14(a) under the Securities Exchange Act of 1934 (filed herewith) | |
| 31.2 | Certificate Pursuant to Rule 13a-14(a) under the Securities | |
| 31.3 | Certificate Pursuant to Rule 13a-14(a) under the Securities Exchange Act of 1934 (filed herewith) | |
| 31.4 | Certificate Pursuant to Rule 13a-14(a) under the Securities Exchange Act of 1934 (filed herewith) | |
| 32.1 | Certificate Pursuant to 18 U.S.C. Section 1350, As Adopted Pursuant to Section 906 of the Sarbanes-Oxley Act of 2002 (furnished herewith) | |
| 32.2 | Certificate Pursuant to 18 U.S.C. Section 1350, As Adopted Pursuant to Section 906 of the Sarbanes-Oxley Act of 2002 (furnished herewith) | |
| 32.3 | Certificate Pursuant to 18 U.S.C. Section 1350, As Adopted Pursuant to Section 906 of the Sarbanes-Oxley Act of 2002 (furnished herewith) | |
| 32.4 | Certificate Pursuant to 18 U.S.C. Section 1350, As Adopted Pursuant to Section 906 of the Sarbanes-Oxley Act of 2002 (furnished herewith) | |
99.1 99.2 | Prospectus filed by the registrant on January 13, | |
Prospectus filed by the registrant on September 13, 2013 on Form S-3/A (File No. 333-170917) |
| GreenHaven Continuous Commodity Index Fund | |||||
| By: | GreenHaven Commodity Services LLC, | ||||
| its Managing Owner | |||||
| By: | /s/ Ashmead Pringle | ||||
| Name: | Ashmead Pringle | ||||
| Title: | Director and Chief Executive Officer | ||||
| Dated: | By: | /s/ | |||
| Name: | |||||
| Title: | Chief Operating Officer (principal financial officer) | ||||
| GreenHaven Continuous Commodity Index Master Fund | |||||
| By: | GreenHaven Commodity Services LLC, | ||||
| its Managing Owner | |||||
| By: | /s/ Ashmead Pringle | ||||
| Name: | Ashmead Pringle | ||||
| Title: | Director and Chief Executive Officer | ||||
Dated: | By: | /s/ | |||
| Name: | |||||
| Title: | Chief Operating Officer (principal financial officer) | ||||
| 83 |