When market closing prices are not available, the Managing Owner may value an asset of the Master Fund pursuant to policies the Managing Owner has adopted, which are consistent with normal industry standards.
Interest income on United States Treasury Obligations is recognized on an accrual basis when earned. PremiumsDiscounts and discountspremiums are amortized or accreted over the life of the United States Treasury Obligations.
Realized gains (losses) and changes in unrealized gain (loss) on open positions are determined on a specific identification basis and recognized in the consolidated statementstatements of income and expenses in the period in which the contract is closed or the changes occur, respectively.
The Fund records its futures contracts and United States Treasury Obligations on a trade date basis and at fair value in the consolidated financial statements, with changes in fair value reported in the consolidated statement of income and expenses.
In determining fair value of United States Treasury Obligations and commodity futures contracts, the Fund uses unadjusted quoted market prices in active markets and a fair value hierarchy that prioritizes the inputs to valuation techniques used to measure fair value. The hierarchy gives the highest priority to unadjusted quoted prices for identical assets or liabilities (Level 1 measurements) and the lowest priority to unobservable inputs (Level 3 measurements). Assets and liabilities are classified in their entirety based on the lowest level of input that is significant to the fair value measurement. See Note 4 withinto the financial statements in Item 8 for further information regarding this accounting policy.
See sectionSection 1A – Risk Factors and Section 7A – Quantitative and Qualitative Disclosures About Market Risk for a complete discussion of market risk
The Master Fund holds two types of investments. The first is long positions in futures contracts on the seventeen commodities in the Index. Since the Index allocates equally among the components and is rebalanced daily, performance risk of the futures contracts is divided equally among the components. Each of the component commodities is traded on the CME Group or ICE exchanges.
The CME Group and ICE exchanges guarantee the performance of its outstanding futures contracts. Each exchange is also publicly traded and, in management’s opinion, well-capitalized. Each uses a system of margining and daily cash settlement of unrealized gains and losses in open positions, which reduces counterparty risk for market participants. Hence, management believes that the Fund faces minimal credit or counterparty risk in its futures trading and contract positions.
The Master Fund will also hold significant cash balances representing the excess of invested funds above the margin requirements for its futures positions. To the extent practical, the Fund will hold this excess cash in short-term obligations of the United States Treasury. Hence, management assigns no counterparty risk to such holdings.
The Exchange May Halt TradingFunds do not anticipate making use of borrowings or other lines of credit to meet its obligations. The Master Fund meets liquidity needs in the normal course of business from cash, cash equivalents, and/or from the sale of United States Treasury Obligations it holds. The Funds’ liquidity needs include: redeeming Shares, Which Would Adversely Impact Your Ability to Sell Shares.
Tradingproviding margin deposits for existing futures contracts, the purchase of additional futures contracts and paying expenses.The Funds generate cash primarily from (i) the sale of creation Baskets, (ii) the sale of Futures Contracts, and (iii) interest earned on cash, cash equivalents and investments in Shares may be halted due to market conditions or, in light of NYSE rules and procedures, for reasons that, in the viewcollateralizing United States Treasury Obligations. Substantially all of the NYSE, make trading in Shares inadvisable. In addition, trading is subject to trading halts caused by extraordinary market volatility pursuant to “circuit breake” rules that require trading to be halted for a specified period based on a specified market decline in the equity markets. There can be no assurance that the requirements necessary to maintain the listingnet assets of the Shares will continue to be met or will remain unchanged. The Fund and the Master Fund are allocated to trading in futures contracts. Most of the assets of the Master Fund are held in United States Treasury Obligations, cash and/or cash equivalents that could or are used as margin or collateral for trading in futures contracts. The percentage that such assets bear to the total net assets will vary from period to period as the market values of the futures contracts change. Interest earned on interest-bearing assets of the Master Fund is paid to the Master Fund.
The investments of the Master Fund in futures contracts could be terminated ifsubject to periods of illiquidity because of market conditions, regulatory considerations and other reasons. Such conditions could prevent the Shares are de-listed.
Master Fund from promptly liquidating a position in futures contracts.The Lack Of An Active Trading Market for the Shares May Result in Losses on Your Investment at the Time of Disposition of Your Shares.
See Item 1A- Risk Factors
Possible Illiquid Markets May Exacerbate Losses.
See Item 1A – Risk Factors
The Fund and Master Fund’s contractual obligations are with the Managing Owner and the Commodity Broker. Management Fee payments made to the Managing Owner are calculated as a fixed percentage of the Master Fund’s Net Asset Value. CommissionCommissions paid by the Fund to the Commodity Broker are on a per contract half-turntrade basis. As such, the Managing Owner cannot anticipate the amount of payments and commissions related to half turns or round turns that will be required under these arrangements for future periods as net asset values are not known until a future date.
trades.Off-Balance Sheet Risk
In the normal course of its business, the Fund isFunds are party to financial instruments with off-balance sheet risk. The term “off-balance sheet risk”risk” refers to an unrecorded potential liability that, even though it does not appear on the balance sheet, may result in a future obligation or loss. The financial instruments used by the Fund are standardized commodity futures contracts traded on regulated exchanges and are recognized on the balance sheet at fair value pursuant to the accounting standards for derivatives and hedging activities, “Accounting for Derivative Instruments and Hedging Activities”.Activities.” As of the balance sheet date, therefore, the Fund hasFunds have no unrecorded liabilities relating to futures contracts. However, until these contracts are closed, they will fluctuate in value with changing commodity prices.
| QUANTITATIVE AND QUALITATIVE DISCLOSURES ABOUT MARKET RISK |
INTRODUCTION
Item 7A. Quantitative and Qualitative Disclosures about Market Risk.
Introduction
The Fund isFunds are designed to replicate a commodity index. The market-sensitive instruments held by itthe Master Fund are subject to the risk of trading loss. Unlike an operating company, the risk of market-sensitive instruments is integral, not incidental, to the Fund’sFunds’ main line of business.
Market movements can produce frequent changes in the fair market value of the Master Fund’s open positions and, consequently, in its earnings and cash flow.flows. The Fund’sFunds’ market risk is primarily influenced by changes in the price of commodities.
QUALITATIVE DISCLOSURES REGARDING NON-TRADING RISK EXPOSURE
General
Qualitative Disclosures Regarding Non-Trading Risk Exposure
The Fund isFunds are unaware of any (i) anticipated known demands, commitments or capital expenditures; (ii) material trends, favorable or unfavorable, in its capital resources; or (iii) trends or uncertainties that will have a material effect on operations.
QUALITATIVE DISCLOSURES REGARDING MEANS OF MANAGING RISK EXPOSURE
Qualitative Disclosures Regarding Means of Managing Risk Exposure
Under ordinary circumstances, the Managing Owner’sOwner’s discretionary power is limited to determining whether the Fund will make a distribution. Under emergency or extraordinary circumstances, the Managing Owner’s discretionary powers increase, but remain circumscribed. These special circumstances, for example, include the unavailability of the Index or certain natural or man-made disasters. The Managing Owner does not apply risk management techniques. The Master Fund initiates positions only on the “long” side of the market and does not employ “stop-loss” techniques.
Accordingly, tabular presentations of Market Risk or Sensitivity or Value-at-Risk analyses thereof are not applicable.
| FINANCIAL STATEMENTS AND SUPPLEMENTARY DATA | Financial Statements and Supplementary Data. |
See the Index to Financial Statements
GreenHaven Continuous Commodity Index Fund and GreenHaven Continuous Commodity Index Master Fund
|
| | 48 |
| | |
| | 49 |
| | |
| | 50 |
| | |
| | 50 |
| | |
| | 51 |
| | |
| | 52 |
| | |
| | 53 |
| | |
| | 54 |
| | |
| | 55 |
| | |
| | 56 |
| | |
| | 57 |
| | |
| | 58 |
| | |
| | 58 |
| | |
| | 59 |
| | |
| | 60 |
| | |
| | 61 |
| | |
| | 62 |
| | |
| | 63 |
| | |
| | 64 |
| | |
| | 65 |
| | |
| | 66 |
Board of Managers and Shareholders of
GreenHaven Continuous Commodity Index Fund:
We have audited the accompanying consolidated statements of financial condition of GreenHaven Continuous Commodity Index Fund and subsidiary as of December 31, 2012 and 2011, the consolidated schedules of investments as of December 31, 2012 and 2011, and the related consolidated statements of income and expenses, changes in shareholders’ equity, and cash flows for each of the three years in the period ended December 31, 2012. These financial statements are the responsibility of the GreenHaven Continuous Commodity Index Fund’s management. Our responsibility is to express an opinion on these financial statements based on our audits.
We conducted our audits in accordance with the standards of the Public Company Accounting Oversight Board (United States). Those standards require that we plan and perform the audit to obtain reasonable assurance about whether the financial statements are free of material misstatement. An audit includes examining, on a test basis, evidence supporting the amounts and disclosures in the financial statements. An audit also includes assessing the accounting principles used and significant estimates made by management, as well as evaluating the overall financial statement presentation. We believe that our audits provide a reasonable basis for our opinion.
In our opinion, the consolidated financial statements referred to above present fairly, in all material respects, the financial position of GreenHaven Continuous Commodity Index Fund and subsidiary as of December 31, 2012 and 2011, and the results of their operations and their cash flows for each of the three years in the period ended December 31, 2012 in conformity with accounting principles generally accepted in the United States of America.
We also have audited, in accordance with the standards of the Public Company Accounting Oversight Board (United States), the GreenHaven Continuous Commodity Index Fund’s internal control over financial reporting as of December 31, 2012, based on criteria established in Internal Control—Integrated Framework issued by the Committee of Sponsoring Organizations of the Treadway Commission (COSO), and our report dated February 26, 2013 expressed an unqualified opinion thereon.
/s/ Grant Thornton LLP
Atlanta, Georgia
February 26, 2013
REPORT OF INDEPENDENT REGISTERED PUBLIC ACCOUNTING FIRM
Board of Managers and Shareholders of
GreenHaven Continuous Commodity Index Master Fund:
We have audited the accompanying statements of financial condition of GreenHaven Continuous Commodity Index Master Fund as of December 31, 2012 and 2011, the schedules of investments as of December 31, 2012 and 2011, and the related statements of income and expenses, changes in shareholders’ equity, and cash flows for each of the three years in the period ended December 31, 2012. These financial statements are the responsibility of the GreenHaven Continuous Commodity Index Master Fund’s management. Our responsibility is to express an opinion on these financial statements based on our audits.
We conducted our audits in accordance with the standards of the Public Company Accounting Oversight Board (United States). Those standards require that we plan and perform the audit to obtain reasonable assurance about whether the financial statements are free of material misstatement. An audit includes examining, on a test basis, evidence supporting the amounts and disclosures in the financial statements. An audit also includes assessing the accounting principles used and significant estimates made by management, as well as evaluating the overall financial statement presentation. We believe that our audits provide a reasonable basis for our opinion.
In our opinion, the financial statements referred to above present fairly, in all material respects, the financial position of GreenHaven Continuous Commodity Index Master Fund as of December 31, 2012 and 2011, and the results of its operations and its cash flows for each of the three years in the period ended December 31, 2012 in conformity with accounting principles generally accepted in the United States of America.
We also have audited, in accordance with the standards of the Public Company Accounting Oversight Board (United States), the GreenHaven Continuous Commodity Index Master Fund’s internal control over financial reporting as of December 31, 2012, based on criteria established in Internal Control—Integrated Framework issued by the Committee of Sponsoring Organizations of the Treadway Commission (COSO), and our report dated February 26, 2013 expressed an unqualified opinion thereon.
/s/ Grant Thornton LLP
Atlanta, Georgia
February 26, 2013
| | | | | | | |
| | | 2012 | | | 2011 | |
| Assets | | | | | | |
| Equity in broker trading accounts: | | | | | | |
| U.S. Treasury Obligations (cost $469,979,439 and $9,999,989 as of 2012 and 2011, respectively) | | $ | 469,995,420 | | | $ | 9,999,990 | |
| Cash held by broker | | | 22,210,626 | | | | 619,079,494 | |
| Net unrealized depreciation on futures contracts | | | (12,514,458 | ) | | | (45,001,789 | ) |
| Total assets | | $ | 479,691,588 | | | $ | 584,077,695 | |
| | | | | | | | | |
| Liabilities and shareholders’ equity | | | | | | | | |
| Capital shares payable | | $ | 4,327,722 | | | $ | 1,497,826 | |
| Management fee payable to related party | | | 354,469 | | | | 438,205 | |
| Accrued brokerage fees and expenses payable | | | 401,297 | | | | 983,648 | |
| Total liabilities | | | 5,083,488 | | | | 2,919,679 | |
| | | | | | | | | |
| Shareholders’ equity | | | | | | | | |
| General Units: | | | | | | | | |
| Paid in capital - 50 units issued | | | 1,500 | | | | 1,500 | |
| Accumulated deficit | | | (57 | ) | | | (2 | ) |
| Total General Units | | | 1,443 | | | | 1,498 | |
| Limited Units: | | | | | | | | |
| | | | | | | | | |
Paid in capital - 16,450,000 and 19,400,000 redeemable units issued and outstanding as of 2012 and 2011, respectively | | | 470,214,957 | | | | 549,362,581 | |
| Retained earnings | | | 4,391,700 | | | | 31,793,937 | |
| | | | | | | | | |
| Total Limited Units | | | 474,606,657 | | | | 581,156,518 | |
| | | | | | | | | |
| Total shareholders’ equity | | | 474,608,100 | | | | 581,158,016 | |
| | | | | | | | | |
Total liabilities and shareholders’ equity | | $ | 479,691,588 | | | $ | 584,077,695 | |
| | | | | | | | | |
| Net asset value per share | | | | | | | | |
| | | | | | | | | |
| General Units | | $ | 28.86 | | | $ | 29.96 | |
| | | | | | | | | |
| Limited Units | | $ | 28.85 | | | $ | 29.96 | |
See accompanying notes to consolidated financial statements
| | | Percentage of | | | Fair | | | Face | |
| Description | | Net Assets | | | Value | | | Value | |
| U.S. Treasury Obligations | | | | | | | | | |
| U.S. Treasury Bills, 0.06% due January 03, 2013 | | | 37.93 | % | | $ | 180,000,000 | | | $ | 180,000,000 | |
| U.S. Treasury Bills, 0.05% due January 10, 2013 | | | 6.32 | | | | 29,999,820 | | | | 30,000,000 | |
| U.S. Treasury Bills, 0.05% due January 24, 2013 | | | 40.03 | | | | 189,997,910 | | | | 190,000,000 | |
| U.S. Treasury Bills, 0.11% due February 14, 2013 | | | 14.75 | | | | 69,997,690 | | | | 70,000,000 | |
| Total U.S. Treasury Obligations (cost $469,979,439) | | | 99.03 | % | | $ | 469,995,420 | | | $ | 470,000,000 | |
| | | | | | | | | | |
| | | Percentage of | | | Fair | | | Notional | |
| Description | | Net Assets | | | Value | | | Value | |
| Unrealized Appreciation/(Depreciation) on Futures Contracts | | | | | | | | | | | | |
| Cocoa (414 contracts, settlement date March 13, 2013) | | | (0.20 | )% | | $ | (948,620 | ) | | $ | 9,257,040 | |
| Cocoa (415 contracts, settlement date May 15, 2013) | | | (0.20 | ) | | | (932,590 | ) | | | 9,320,900 | |
| Cocoa (414 contracts, settlement date July 16, 2013) | | | (0.10 | ) | | | (485,050 | ) | | | 9,331,560 | |
| Coffee (168 contracts, settlement date March 18, 2013) | | | (0.28 | ) | | | (1,303,556 | ) | | | 9,059,400 | |
| Coffee (170 contracts, settlement date May 20, 2013) | | | (0.28 | ) | | | (1,324,350 | ) | | | 9,352,125 | |
| Coffee (169 contracts, settlement date July 19, 2013) | | | (0.14 | ) | | | (671,381 | ) | | | 9,477,731 | |
| Copper (102 contracts, settlement date March 26, 2013) | | | 0.12 | | | | 554,000 | | | | 9,313,875 | |
| Copper (102 contracts, settlement date May 29, 2013) | | | 0.11 | | | | 544,763 | | | | 9,338,100 | |
| Copper (101 contracts, settlement date July 29, 2013) | | | 0.11 | | | | 529,500 | | | | 9,271,800 | |
| Corn (267 contracts, settlement date March 14, 2013) | | | (0.25 | ) | | | (1,180,150 | ) | | | 9,321,637 | |
| Corn (266 contracts, settlement date May 14, 2013) | | | (0.23 | ) | | | (1,104,225 | ) | | | 9,313,325 | |
| Corn (266 contracts, settlement date July 12, 2013) | | | (0.08 | ) | | | (389,100 | ) | | | 9,273,425 | |
| Cotton (246 contracts, settlement date March 06, 2013) | | | 0.08 | | | | 361,630 | | | | 9,242,220 | |
| Cotton (244 contracts, settlement date May 08, 2013) | | | 0.02 | | | | 99,440 | | | | 9,254,920 | |
| Cotton (245 contracts, settlement date July 09, 2013) | | | 0.10 | | | | 489,040 | | | | 9,416,575 | |
| FCOJ-A (838 contracts, settlement date March 08, 2013) | | | (0.06 | ) | | | (301,343 | ) | | | 14,750,895 | |
| FCOJ-A (435 contracts, settlement date May 10, 2013) | | | 0.03 | | | | 133,620 | | | | 7,777,800 | |
| FCOJ-A (285 contracts, settlement date July 11, 2013) | | | (0.01 | ) | | | (61,987 | ) | | | 5,185,575 | |
| Gold (56 contracts, settlement date February 26, 2013) | | | 0.07 | | | | 312,270 | | | | 9,384,480 | |
| Gold (55 contracts, settlement date April 26, 2013) | | | 0.05 | | | | 236,130 | | | | 9,229,000 | |
| Gold (55 contracts, settlement date June 26, 2013) | | | (0.07 | ) | | | (317,080 | ) | | | 9,240,000 | |
| Heating Oil (44 contracts, settlement date January 31, 2013) | | | 0.00 | * | | | (14,960 | ) | | | 5,602,766 | |
| Heating Oil (44 contracts, settlement date February 28, 2013) | | | 0.00 | * | | | (10,185 | ) | | | 5,575,046 | |
| Heating Oil (44 contracts, settlement date March 28, 2013) | | | 0.00 | * | | | (1,571 | ) | | | 5,535,869 | |
| Heating Oil (44 contracts, settlement date April 30, 2013) | | | 0.02 | | | | 85,352 | | | | 5,587,982 | |
| Heating Oil (44 contracts, settlement date May 31, 2013) | | | 0.02 | | | | 90,959 | | | | 5,558,045 | |
| Lean Hogs (189 contracts, settlement date February 14, 2013) | | | 0.07 | | | | 323,420 | | | | 6,480,810 | |
| Lean Hogs (189 contracts, settlement date April 12, 2013) | | | 0.01 | | | | 24,060 | | | | 6,707,610 | |
| Lean Hogs (188 contracts, settlement date June 14, 2013) | | | (0.04 | ) | | | (163,170 | ) | | | 7,358,320 | |
| Lean Hogs (188 contracts, settlement date July 15, 2013) | | | (0.04 | ) | | | (193,660 | ) | | | 7,322,600 | |
| Light, Sweet Crude Oil (60 contracts, settlement date January 22, 2013) | | | (0.01 | ) | | | (45,010 | ) | | | 5,509,200 | |
| Light, Sweet Crude Oil (61 contracts, settlement date February 20, 2013) | | | (0.01 | ) | | | (57,300 | ) | | | 5,628,470 | |
| Light, Sweet Crude Oil (60 contracts, settlement date March 20, 2013) | | | (0.01 | ) | | | (38,330 | ) | | | 5,563,800 | |
| Light, Sweet Crude Oil (60 contracts, settlement date April 22, 2013) | | | 0.06 | | | | 279,100 | | | | 5,589,600 | |
| Light, Sweet Crude Oil (60 contracts, settlement date May 21, 2013) | | | 0.06 | | | | 274,100 | | | | 5,609,400 | |
| Live Cattle (175 contracts, settlement date February 28, 2013) | | | 0.03 | | | | 163,800 | | | | 9,261,000 | |
| Live Cattle (174 contracts, settlement date April 30, 2013) | | | 0.02 | | | | 106,530 | | | | 9,491,700 | |
| Live Cattle (175 contracts, settlement date June 28, 2013) | | | 0.02 | | | | 96,290 | | | | 9,152,500 | |
| Natural Gas (163 contracts, settlement date January 29, 2013) | | | (0.06 | ) | | | (298,990 | ) | | | 5,462,130 | |
| Natural Gas (163 contracts, settlement date Februay 26, 2013) | | | (0.05 | ) | | | (251,910 | ) | | | 5,484,950 | |
| Natural Gas (163 contracts, settlement date March 26, 2013) | | | (0.04 | ) | | | (189,680 | ) | | | 5,546,890 | |
| Natural Gas (163 contracts, settlement date April 26, 2013) | | | (0.07 | ) | | | (316,420 | ) | | | 5,628,390 | |
| Natural Gas (163 contracts, settlement date May 29, 2013) | | | (0.06 | ) | | | (298,280 | ) | | | 5,718,040 | |
| Platinum (181 contracts, settlement date April 26, 2013) | | | (0.06 | ) | | | (267,470 | ) | | | 13,958,720 | |
| Platinum (180 contracts, settlement date July 29, 2013) | | | (0.07 | ) | | | (329,455 | ) | | | 13,911,300 | |
| Silver (62 contracts, settlement date March 26, 2013) | | | 0.01 | | | | 58,585 | | | | 9,370,370 | |
| Silver (61 contracts, settlement date May 29, 2013) | | | 0.03 | | | | 143,405 | | | | 9,235,095 | |
| Silver (61 contracts, settlement date July 29, 2013) | | | (0.14 | ) | | | (680,860 | ) | | | 9,249,125 | |
| Soybean (133 contracts, settlement date March 14, 2013) | | | (0.16 | ) | | | (772,287 | ) | | | 9,373,175 | |
| Soybean (132 contracts, settlement date May 14, 2013) | | | (0.10 | ) | | | (461,563 | ) | | | 9,235,050 | |
| Soybean (133 contracts, settlement date July 12, 2013) | | | (0.01 | ) | | | (61,712 | ) | | | 9,278,413 | |
| Sugar (424 contracts, settlement date February 28, 2013) | | | (0.10 | ) | | | (456,109 | ) | | | 9,264,909 | |
| Sugar (424 contracts, settlement date April 30, 2013) | | | (0.07 | ) | | | (317,901 | ) | | | 9,307,648 | |
| Sugar (423 contracts, settlement date June 28, 2013) | | | 0.06 | | | | 278,678 | | | | 9,352,022 | |
| Wheat (237 contracts, settlement date March 14, 2013) | | | (0.28 | ) | | | (1,303,087 | ) | | | 9,219,300 | |
| Wheat (237 contracts, settlement date May 14, 2013) | | | (0.24 | ) | | | (1,134,200 | ) | | | 9,334,838 | |
| Wheat (235 contracts, settlement date July 12, 2013) | | | (0.22 | ) | | | (1,015,588 | ) | | | 9,326,563 | |
| Net Unrealized Depreciation on Futures Contracts | | | (2.64 | )% | | $ | (12,514,458 | ) | | $ | 473,904,029 | |
* | Denotes greater than 0.000% yet less than 0.005% |
See accompanying notes to consolidated financial statements
| | | Percentage of | | | Fair | | | Face | |
| Description | | Net Assets | | | Value | | | Value | |
| U.S. Treasury Obligations | | | | | | | | | |
| U.S. Treasury Bill, 0.00% due January 05, 2012 (cost $9,999,989) | | | 1.72 | % | | $ | 9,999,990 | | | $ | 10,000,000 | |
| | | | | | | | | | | | | |
| | | Percentage of | | | Fair | | | Notional | |
| Description | | Net Assets | | | Value | | | Value | |
| Unrealized Appreciation/(Depreciation) on Futures Contracts | | | | | | | | | | | | |
| Cocoa (535 contracts, settlement date March 15, 2012) | | | (0.55 | )% | | $ | (3,205,990 | ) | | $ | 11,283,150 | |
| Cocoa (536 contracts, settlement date May 15, 2012) | | | (0.53 | ) | | | (3,093,380 | ) | | | 11,422,160 | |
| Cocoa (536 contracts, settlement date July 16, 2012) | | | (0.33 | ) | | | (1,932,240 | ) | | | 11,513,280 | |
| Coffee (133 contracts, settlement date March 20, 2012) | | | (0.15 | ) | | | (896,456 | ) | | | 11,314,144 | |
| Coffee (132 contracts, settlement date May 18, 2012) | | | (0.16 | ) | | | (919,744 | ) | | | 11,367,675 | |
| Coffee (132 contracts, settlement date July 19, 2012) | | | (0.06 | ) | | | (352,538 | ) | | | 11,493,900 | |
| Copper (133 contracts, settlement date March 28, 2012) | | | (0.10 | ) | | | (592,150 | ) | | | 11,424,700 | |
| Copper (132 contracts, settlement date May 29, 2012) | | | (0.11 | ) | | | (608,013 | ) | | | 11,376,750 | |
| Copper (132 contracts, settlement date July 27, 2012) | | | 0.01 | | | | 51,438 | | | | 11,401,500 | |
| Corn (349 contracts, settlement date March 14, 2012) | | | (0.15 | ) | | | (862,200 | ) | | | 11,281,425 | |
| Corn (349 contracts, settlement date May 14, 2012) | | | (0.15 | ) | | | (839,875 | ) | | | 11,425,387 | |
| Corn (348 contracts, settlement date July 13, 2012) | | | 0.01 | | | | 33,125 | | | | 11,505,750 | |
| Cotton (249 contracts, settlement date March 08, 2012) | | | (0.13 | ) | | | (726,570 | ) | | | 11,429,100 | |
| Cotton (248 contracts, settlement date May 08, 2012) | | | (0.15 | ) | | | (851,265 | ) | | | 11,368,320 | |
| Cotton (248 contracts, settlement date July 09, 2012) | | | (0.12 | ) | | | (721,380 | ) | | | 11,322,440 | |
| FCOJ-A (561 contracts, settlement date March 12, 2012) | | | 0.04 | | | | 257,978 | | | | 14,221,350 | |
| FCOJ-A (486 contracts, settlement date May 10, 2012) | | | 0.15 | | | | 856,470 | | | | 12,261,780 | |
| FCOJ-A (306 contracts, settlement date July 11, 2012) | | | (0.01 | ) | | | (32,880 | ) | | | 7,738,740 | |
| Gold (72 contracts, settlement date February 27, 2012) | | | (0.09 | ) | | | (527,380 | ) | | | 11,280,960 | |
| Gold (72 contracts, settlement date April 26, 2012) | | | (0.21 | ) | | | (1,233,460 | ) | | | 11,299,680 | |
| Gold (73 contracts, settlement date June 27, 2012) | | | (0.25 | ) | | | (1,434,620 | ) | | | 11,472,680 | |
| Heating Oil (57 contracts, settlement date January 31, 2012) | | | (0.02 | ) | | | (109,389 | ) | | | 6,976,595 | |
| Heating Oil (56 contracts, settlement date February 29, 2012) | | | (0.02 | ) | | | (101,056 | ) | | | 6,834,677 | |
| Heating Oil (56 contracts, settlement date March 30, 2012) | | | (0.02 | ) | | | (111,661 | ) | | | 6,789,283 | |
| Heating Oil (56 contracts, settlement date April 30, 2012) | | | (0.09 | ) | | | (493,088 | ) | | | 6,734,482 | |
| Heating Oil (56 contracts, settlement date May 31, 2012) | | | (0.08 | ) | | | (488,053 | ) | | | 6,693,557 | |
| Lean Hogs (236 contracts, settlement date February 14, 2012) | | | (0.07 | ) | | | (384,030 | ) | | | 7,957,920 | |
| Lean Hogs (236 contracts, settlement date April 16, 2012) | | | (0.06 | ) | | | (325,560 | ) | | | 8,278,880 | |
| Lean Hogs (235 contracts, settlement date June 14, 2012) | | | (0.05 | ) | | | (275,680 | ) | | | 8,977,000 | |
| Lean Hogs (236 contracts, settlement date July 16, 2012) | | | (0.04 | ) | | | (210,990 | ) | | | 8,951,480 | |
| Light, Sweet Crude Oil (69 contracts, settlement date January 20, 2012) | | | 0.13 | | | | 727,240 | | | | 6,819,270 | |
| Light, Sweet Crude Oil (69 contracts, settlement date February 21, 2012) | | | 0.13 | | | | 746,950 | | | | 6,831,000 | |
| Light, Sweet Crude Oil (69 contracts, settlement date March 20, 2012) | | | 0.13 | | | | 746,560 | | | | 6,845,490 | |
| Light, Sweet Crude Oil (69 contracts, settlement date April 20, 2012) | | | 0.01 | | | | 82,600 | | | | 6,859,290 | |
| Light, Sweet Crude Oil (68 contracts, settlement date May 22, 2012) | | | 0.02 | | | | 113,320 | | | | 6,764,640 | |
| Live Cattle (229 contracts, settlement date February 29, 2012) | | | 0.00 | * | | | 2,380 | | | | 11,124,820 | |
| Live Cattle (230 contracts, settlement date April 30, 2012) | | | (0.02 | ) | | | (131,730 | ) | | | 11,541,400 | |
| Live Cattle (230 contracts, settlement date June 29, 2012) | | | (0.02 | ) | | | (122,410 | ) | | | 11,460,900 | |
| Natural Gas (224 contracts, settlement date January 27, 2012) | | | (0.40 | ) | | | (2,315,920 | ) | | | 6,695,360 | |
| Natural Gas (224 contracts, settlement date February 27, 2012) | | | (0.38 | ) | | | (2,204,450 | ) | | | 6,755,840 | |
| Natural Gas (220 contracts, settlement date March 28, 2012) | | | (0.36 | ) | | | (2,067,940 | ) | | | 6,773,800 | |
| Natural Gas (220 contracts, settlement date April 26, 2012) | | | (0.20 | ) | | | (1,188,850 | ) | | | 6,888,200 | |
| Natural Gas (219 contracts, settlement date May 29, 2012) | | | (0.20 | ) | | | (1,169,040 | ) | | | 6,968,580 | |
| Platinum (243 contracts, settlement date April 26, 2012) | | | (0.43 | ) | | | (2,468,450 | ) | | | 17,069,535 | |
| Platinum (243 contracts, settlement date July 27, 2012) | | | (0.44 | ) | | | (2,566,290 | ) | | | 17,124,210 | |
| Silver (82 contracts, settlement date March 28, 2012) | | | (0.35 | ) | | | (2,055,925 | ) | | | 11,445,150 | |
| Silver (81 contracts, settlement date May 29, 2012) | | | (0.38 | ) | | | (2,222,650 | ) | | | 11,323,800 | |
| Silver (81 contracts, settlement date July 27, 2012) | | | (0.33 | ) | | | (1,944,665 | ) | | | 11,338,785 | |
| Soybean (186 contracts, settlement date March 14, 2012) | | | (0.17 | ) | | | (1,016,225 | ) | | | 11,232,075 | |
| Soybean (187 contracts, settlement date May 14, 2012) | | | (0.16 | ) | | | (954,425 | ) | | | 11,383,625 | |
| Soybean (187 contracts, settlement date July 13, 2012) | | | 0.05 | | | | 264,900 | | | | 11,472,450 | |
| Sugar (444 contracts, settlement date February 29, 2012) | | | (0.24 | ) | | | (1,406,339 | ) | | | 11,586,624 | |
| Sugar (444 contracts, settlement date April 30, 2012) | | | (0.20 | ) | | | (1,152,122 | ) | | | 11,412,576 | |
| Sugar (444 contracts, settlement date June 29, 2012) | | | (0.09 | ) | | | (545,496 | ) | | | 11,218,637 | |
| Wheat (343 contracts, settlement date March 14, 2012) | | | (0.20 | ) | | | (1,133,987 | ) | | | 11,194,662 | |
| Wheat (340 contracts, settlement date May 14, 2012) | | | (0.19 | ) | | | (1,118,513 | ) | | | 11,411,250 | |
| Wheat (340 contracts, settlement date July 13, 2012) | | | 0.04 | | | | 230,325 | | | | 11,666,250 | |
| Net Unrealized Depreciation on Futures Contracts | | | (7.74 | )% | | $ | (45,001,789 | ) | | $ | 580,606,964 | |
* | Denotes greater than 0.000% yet less than 0.005% |
See accompanying notes to consolidated financial statements
| | | 2012 | | | 2011 | | | 2010 | |
| Income | | | | | | | | | |
| Interest Income | | $ | 331,044 | | | $ | 335,677 | | | $ | 301,808 | |
| | | | | | | | | | | | | |
| Expenses | | | | | | | | | | | | |
| Management fee to related party | | | 4,637,997 | | | | 5,895,201 | | | | 2,523,863 | |
| Brokerage fees and expenses | | | 377,195 | | | | 1,300,472 | | | | 712,620 | |
| Total expenses | | | 5,015,192 | | | | 7,195,673 | | | | 3,236,483 | |
| Net Investment Loss | | | (4,684,148 | ) | | | (6,859,996 | ) | | | (2,934,675 | ) |
Realized and Net Change in Unrealized Gain (Loss) on Investments and Futures Contracts | | | | | | | | | | | | |
| Realized Gain (Loss) on | | | | | | | | | | | | |
| Investments | | | 1,429 | | | | 451 | | | | (403 | ) |
| Futures Contracts | | | (55,222,884 | ) | | | 36,755,383 | | | | 43,285,484 | |
| Net Realized Gain (Loss) | | | (55,221,455 | ) | | | 36,755,834 | | | | 43,285,081 | |
| Net Change in Unrealized Gain (Loss) on | | | | | | | | | | | | |
| Investments | | | 15,980 | | | | (20,292 | ) | | | 18,076 | |
| Futures Contracts | | | 32,487,331 | | | | (103,641,471 | ) | | | 46,259,451 | |
| Net Change in Unrealized Gain (Loss) | | | 32,503,311 | | | | (103,661,763 | ) | | | 46,277,527 | |
Net Realized and Unrealized Gain (Loss) on Investments and Future Contracts | | | (22,718,144 | ) | | | (66,905,929 | ) | | | 89,562,608 | |
| | | | | | | | | | | | | |
| Net Gain (Loss) | | $ | (27,402,292 | ) | | $ | (73,765,925 | ) | | $ | 86,627,933 | |
See accompanying notes to consolidated financial statements
| | | | | | | | | | | | | | | | | | | | | | | | | | | | | | | | | | | | | |
| | | General Units | | | Limited Units | | | Total | |
| | | | | | | | | | | | | | | | | | | | | | |
| | | | | | | | | Total | | | | | | | | | Total | | | | |
| | | | | | | | | General | | | | | | | | | Limited | | | Total | |
| | | General Units | | | Accumulated | | | Shareholders’ | | | Limited Units | | | Accumulated | | | Shareholders’ | | | Shareholders’ | |
| | | Units | | | Amount | | | Deficit | | | Equity | | | Units | | | Amount | | | Earnings | | | Equity | | | Equity | |
| Balance at January 1, 2012 | | | 50 | | | $ | 1,500 | | | $ | (2 | ) | | $ | 1,498 | | | | 19,400,000 | | | $ | 549,362,581 | | | $ | 31,793,937 | | | $ | 581,156,518 | | | $ | 581,158,016 | |
| Creation of Limited Units | | | - | | | | - | | | | - | | | | - | | | | 3,250,000 | | | | 101,149,075 | | | | - | | | | 101,149,075 | | | | 101,149,075 | |
| Redemption of Limited Units | | | - | | | | - | | | | - | | | | - | | | | (6,200,000 | ) | | | (180,296,699 | ) | | | - | | | | (180,296,699 | ) | | | (180,296,699 | ) |
| Net loss: | | | | | | | | | | | | | | | | | | | | | | | | | | | | | | | | | | | | |
| Net investment loss | | | - | | | | - | | | | (13 | ) | | | (13 | ) | | | - | | | | - | | | | (4,684,135 | ) | | | (4,684,135 | ) | | | (4,684,148 | ) |
Net realized loss on Investments and Futures Contracts | | | - | | | | - | | | | (135 | ) | | | (135 | ) | | | - | | | | - | | | | (55,221,320 | ) | | | (55,221,320 | ) | | | (55,221,455 | ) |
Net change in unrealized gain on Investments and Futures Contracts | | | - | | | | - | | | | 93 | | | | 93 | | | | - | | | | - | | | | 32,503,218 | | | | 32,503,218 | | | | 32,503,311 | |
| Net loss | | | - | | | | - | | | | (55 | ) | | | (55 | ) | | | - | | | | - | | | | (27,402,237 | ) | | | (27,402,237 | ) | | | (27,402,292 | ) |
| | | | | | | | | | | | | | | | | | | | | | | | | | | | | | | | | | | | | |
| Balance at December 31, 2012 | | | 50 | | | $ | 1,500 | | | $ | (57 | ) | | $ | 1,443 | | | | 16,450,000 | | | $ | 470,214,957 | | | $ | 4,391,700 | | | $ | 474,606,657 | | | $ | 474,608,100 | |
See accompanying notes to consolidated financial statements
| | | | | | | | | | | | | | | | | | | | | | | | | | | | | | | | | | | | | |
| | | General Units | | | Limited Units | | | Total | |
| | | | | | | | | | | | | | | | | | | | | | | | | |
| | | | | | | | | Total | | | | | | | | | | | | Total | | | | |
| | | | | | | | | General | | | | | | | | | | | | Limited | | | Total | |
| | | General Units | | | Accumulated | | | Shareholders’ | | | Limited Units | | | Accumulated | | | Shareholders’ | | | Shareholders’ | |
| | | Units | | | Amount | | | Deficit | | | Equity | | | Units | | | Amount | | | Earnings | | | Equity | | | Equity | |
| Balance at January 1, 2011 | | | 50 | | | $ | 1,500 | | | $ | 144 | | | $ | 1,644 | | | | 16,250,000 | | | $ | 428,801,695 | | | $ | 105,559,716 | | | $ | 534,361,411 | | | $ | 534,363,055 | |
| Creation of Limited Units | | | - | | | | - | | | | - | | | | - | | | | 11,200,000 | | | | 383,075,174 | | | | - | | | | 383,075,174 | | | | 383,075,174 | |
| Redemption of Limited Units | | | - | | | | - | | | | - | | | | - | | | | (8,050,000 | ) | | | (262,514,288 | ) | | | - | | | | (262,514,288 | ) | | | (262,514,288 | ) |
| Net loss: | | | | | | | | | | | | | | | | | | | | | | | | | | | | | | | | | | | | |
| Net investment loss | | | - | | | | - | | | | (17 | ) | | | (17 | ) | | | - | | | | - | | | | (6,859,979 | ) | | | (6,859,979 | ) | | | (6,859,996 | ) |
Net realized gain on Investments and Futures Contracts | | | - | | | | - | | | | 88 | | | | 88 | | | | - | | | | - | | | | 36,755,746 | | | | 36,755,746 | | | | 36,755,834 | |
Net change in unrealized loss on Investments and Futures Contracts | | | - | | | | - | | | | (217 | ) | | | (217 | ) | | | - | | | | - | | | | (103,661,546 | ) | | | (103,661,546 | ) | | | (103,661,763 | ) |
| Net loss | | | - | | | | - | | | | (146 | ) | | | (146 | ) | | | - | | | | - | | | | (73,765,779 | ) | | | (73,765,779 | ) | | | (73,765,925 | ) |
| | | | | | | | | | | | | | | | | | | | | | | | | | | | | | | | | | | | | |
| Balance at December 31, 2011 | | | 50 | | | $ | 1,500 | | | $ | (2 | ) | | $ | 1,498 | | | | 19,400,000 | | | $ | 549,362,581 | | | $ | 31,793,937 | | | $ | 581,156,518 | | | $ | 581,158,016 | |
See accompanying notes to consolidated financial statements
GreenHaven Continous Commodity Index Fund
For the Year Ended December 31, 2010
| | | | | | | | | | | | | | | | | | | | | | | | | | | | |
| | | General Units | | | Limited Units | | | Total | |
| | | | | | | | | | | | | | | | | | | | | | | | | | | | |
| | | | | | | | | | | | Total | | | | | | | | | | | | Total | | | | |
| | | | | | | | | | | | General | | | | | | | | | | | | Limited | | | Total | |
| | | General Units | | | Accumulated | | | Shareholders’ | | | Limited Units | | | Accumulated | | | Shareholders’ | | | Shareholders’ | |
| | | Units | | | Amount | | | Earnings | | | Equity | | | Units | | | Amount | | | Earnings | | | Equity | | | Equity | |
| Balance at January 1, 2010 | | | 50 | | | $ | 1,500 | | | $ | (189 | ) | | $ | 1,311 | | | | 8,750,000 | | | $ | 210,500,911 | | | $ | 18,932,116 | | | $ | 229,433,027 | | | $ | 229,434,338 | |
| Creation of Limited Units | | | - | | | | - | | | | - | | | | - | | | | 9,200,000 | | | | 262,051,675 | | | | - | | | | 262,051,675 | | | | 262,051,675 | |
| Redemption of Limited Units | | | - | | | | - | | | | - | | | | - | | | | (1,700,000 | ) | | | (43,750,891 | ) | | | - | | | | (43,750,891 | ) | | | (43,750,891 | ) |
| Net gain: | | | | | | | | | | | | | | | | | | | | | | | | | | | | | | | | | | | | |
| Net investment loss | | | - | | | | - | | | | (15 | ) | | | (15 | ) | | | - | | | | - | | | | (2,934,660 | ) | | | (2,934,660 | ) | | | (2,934,675 | ) |
Net realized gain on Investments
and Futures Contracts | | | - | | | | - | | | | 165 | | | | 165 | | | | - | | | | - | | | | 43,284,916 | | | | 43,284,916 | | | | 43,285,081 | |
Net change in unrealized gain on Investments and Futures Contracts | | | - | | | | - | | | | 183 | | | | 183 | | | | - | | | | - | | | | 46,277,344 | | | | 46,277,344 | | | | 46,277,527 | |
| Net gain | | | - | | | | - | | | | 333 | | | | 333 | | | | - | | | | - | | | | 86,627,600 | | | | 86,627,600 | | | | 86,627,933 | |
| | | | | | | | | | | | | | | | | | | | | | | | | | | | | | | | | | | | | |
| Balance at December 31, 2010 | | | 50 | | | $ | 1,500 | | | $ | 144 | | | $ | 1,644 | | | | 16,250,000 | | | $ | 428,801,695 | | | $ | 105,559,716 | | | $ | 534,361,411 | | | $ | 534,363,055 | |
See accompanying notes to consolidated financial statements | |
GreenHaven Continuous Commodity Index Fund
For the Years Ended December 31, 2012, 2011, and 2010
| | | | | | | | | | |
| | | 2012 | | | 2011 | | | 2010 | |
| Cash flow from operating activities: | | | | | | | | | |
| Net gain (loss) | | $ | (27,402,292 | ) | | $ | (73,765,925 | ) | | $ | 86,627,933 | |
| Adjustments to reconcile net gain (loss) to net cash used for operating activities: | | | | | | | | | | | | |
| Purchase of investment securities | | | (2,089,638,671 | ) | | | (1,594,743,929 | ) | | | (1,159,625,357 | ) |
| Proceeds from sales of investment securities | | | 1,629,991,694 | | | | 2,054,999,635 | | | | 809,997,503 | |
| Net accretion of discount | | | (331,044 | ) | | | (335,677 | ) | | | (301,808 | ) |
| Net realized loss (gain) on investment securities | | | (1,429 | ) | | | (451 | ) | | | 403 | |
| Unrealized depreciation (appreciation) on investments | | | (32,503,311 | ) | | | 103,661,763 | | | | (46,277,527 | ) |
| Increase in payable - capital shares | | | 2,829,896 | | | | 1,497,826 | | | | - | |
| Increase (decrease) in accrued expenses | | | (666,087 | ) | | | 717,847 | | | | 515,001 | |
| Net cash provided by (used for) operating activities | | | (517,721,244 | ) | | | 492,031,089 | | | | (309,063,852 | ) |
| | | | | | | | | | | | | |
| Cash flows from financing activities: | | | | | | | | | | | | |
| Proceeds from creation of Limited Units | | | 101,149,075 | | | | 383,075,174 | | | | 262,051,675 | |
| Redemption of Limited Units | | | (180,296,699 | ) | | | (262,514,288 | ) | | | (43,750,891 | ) |
| Net cash provided by (used for) financing activities | | | (79,147,624 | ) | | | 120,560,886 | | | | 218,300,784 | |
| | | | | | | | | | | | | |
| Net change in cash | | | (596,868,868 | ) | | | 612,591,975 | | | | (90,763,068 | ) |
| Cash held by broker at beginning of year | | | 619,079,494 | | | | 6,487,519 | | | | 97,250,587 | |
| Cash held by broker at end of year | | $ | 22,210,626 | | | $ | 619,079,494 | | | $ | 6,487,519 | |
See accompanying notes to consolidated financial statements | |
December 31, 2012 and 2011
| | | | | | | |
| | | 2012 | | | 2011 | |
| Assets | | | | | | |
| Equity in broker trading accounts: | | | | | | |
| U.S. Treasury Obligations (cost $469,979,439 and $9,999,989 as of 2012 and 2011, respectively) | | $ | 469,995,420 | | | $ | 9,999,990 | |
| Cash held by broker | | | 22,210,626 | | | | 619,079,494 | |
| Net unrealized depreciation on futures contracts | | | (12,514,458 | ) | | | (45,001,789 | ) |
| Total assets | | $ | 479,691,588 | | | $ | 584,077,695 | |
| | | | | | | | | |
| Liabilities and shareholders’ equity | | | | | | | | |
| Capital shares payable | | $ | 4,327,722 | | | $ | 1,497,826 | |
| Management fee payable to related party | | | 354,469 | | | | 438,205 | |
| Accrued brokerage fees and expenses payable | | | 401,297 | | | | 983,648 | |
| Total liabilities | | | 5,083,488 | | | | 2,919,679 | |
| | | | | | | | | |
| Shareholders’ equity | | | | | | | | |
| General Units: | | | | | | | | |
| Paid in capital - 50 units issued | | | 1,500 | | | | 1,500 | |
| Accumulated deficit | | | (57 | ) | | | (2 | ) |
| Total General Units | | | 1,443 | | | | 1,498 | |
| Limited Units: | | | | | | | | |
| Paid in capital - 16,450,000 and 19,400,000 redeemable units | | | | | | | | |
issued and outstanding as of 2012 and 2011, respectively | | | 470,214,957 | | | | 549,362,581 | |
| Retained earnings | | | 4,391,700 | | | | 31,793,937 | |
| | | | | | | | | |
| Total Limited Units | | | 474,606,657 | | | | 581,156,518 | |
| | | | | | | | | |
| Total shareholders’ equity | | | 474,608,100 | | | | 581,158,016 | |
| | | | | | | | | |
| Total liabilities and shareholders’ equity | | $ | 479,691,588 | | | $ | 584,077,695 | |
| | | | | | | | | |
| Net asset value per share | | | | | | | | |
| | | | | | | | | |
| General Units | | $ | 28.86 | | | $ | 29.96 | |
| | | | | | | | | |
| Limited Units | | $ | 28.85 | | | $ | 29.96 | |
See accompanying notes to consolidated financial statements | |
| | | | | | | | | | |
| | | Percentage of | | | Fair | | | Face | |
| Description | | Net Assets | | | Value | | | Value | |
| U.S. Treasury Obligations | | | | | | | | | |
| U.S. Treasury Bills, 0.06% due January 03, 2013 | | | 37.93 | % | | $ | 180,000,000 | | | $ | 180,000,000 | |
| U.S. Treasury Bills, 0.05% due January 10, 2013 | | | 6.32 | | | | 29,999,820 | | | | 30,000,000 | |
| U.S. Treasury Bills, 0.05% due January 24, 2013 | | | 40.03 | | | | 189,997,910 | | | | 190,000,000 | |
| U.S. Treasury Bills, 0.11% due February 14, 2013 | | | 14.75 | | | | 69,997,690 | | | | 70,000,000 | |
| Total U.S. Treasury Obligations (cost $469,979,439) | | | 99.03 | % | | $ | 469,995,420 | | | $ | 470,000,000 | |
| | | | | | | | | | | | | |
| | | Percentage of | | | Fair | | | Notional | |
| Description | | Net Assets | | | Value | | | Value | |
| Unrealized Appreciation/(Depreciation) on Futures Contracts | | | | | | | | | | | | |
| Cocoa (414 contracts, settlement date March 13, 2013) | | | (0.20 | )% | | $ | (948,620 | ) | | $ | 9,257,040 | |
| Cocoa (415 contracts, settlement date May 15, 2013) | | | (0.20 | ) | | | (932,590 | ) | | | 9,320,900 | |
| Cocoa (414 contracts, settlement date July 16, 2013) | | | (0.10 | ) | | | (485,050 | ) | | | 9,331,560 | |
| Coffee (168 contracts, settlement date March 18, 2013) | | | (0.28 | ) | | | (1,303,556 | ) | | | 9,059,400 | |
| Coffee (170 contracts, settlement date May 20, 2013) | | | (0.28 | ) | | | (1,324,350 | ) | | | 9,352,125 | |
| Coffee (169 contracts, settlement date July 19, 2013) | | | (0.14 | ) | | | (671,381 | ) | | | 9,477,731 | |
| Copper (102 contracts, settlement date March 26, 2013) | | | 0.12 | | | | 554,000 | | | | 9,313,875 | |
| Copper (102 contracts, settlement date May 29, 2013) | | | 0.11 | | | | 544,763 | | | | 9,338,100 | |
| Copper (101 contracts, settlement date July 29, 2013) | | | 0.11 | | | | 529,500 | | | | 9,271,800 | |
| Corn (267 contracts, settlement date March 14, 2013) | | | (0.25 | ) | | | (1,180,150 | ) | | | 9,321,637 | |
| Corn (266 contracts, settlement date May 14, 2013) | | | (0.23 | ) | | | (1,104,225 | ) | | | 9,313,325 | |
| Corn (266 contracts, settlement date July 12, 2013) | | | (0.08 | ) | | | (389,100 | ) | | | 9,273,425 | |
| Cotton (246 contracts, settlement date March 06, 2013) | | | 0.08 | | | | 361,630 | | | | 9,242,220 | |
| Cotton (244 contracts, settlement date May 08, 2013) | | | 0.02 | | | | 99,440 | | | | 9,254,920 | |
| Cotton (245 contracts, settlement date July 09, 2013) | | | 0.10 | | | | 489,040 | | | | 9,416,575 | |
| FCOJ-A (838 contracts, settlement date March 08, 2013) | | | (0.06 | ) | | | (301,343 | ) | | | 14,750,895 | |
| FCOJ-A (435 contracts, settlement date May 10, 2013) | | | 0.03 | | | | 133,620 | | | | 7,777,800 | |
| FCOJ-A (285 contracts, settlement date July 11, 2013) | | | (0.01 | ) | | | (61,987 | ) | | | 5,185,575 | |
| Gold (56 contracts, settlement date February 26, 2013) | | | 0.07 | | | | 312,270 | | | | 9,384,480 | |
| Gold (55 contracts, settlement date April 26, 2013) | | | 0.05 | | | | 236,130 | | | | 9,229,000 | |
| Gold (55 contracts, settlement date June 26, 2013) | | | (0.07 | ) | | | (317,080 | ) | | | 9,240,000 | |
| Heating Oil (44 contracts, settlement date January 31, 2013) | | | 0.00 | * | | | (14,960 | ) | | | 5,602,766 | |
| Heating Oil (44 contracts, settlement date February 28, 2013) | | | 0.00 | * | | | (10,185 | ) | | | 5,575,046 | |
| Heating Oil (44 contracts, settlement date March 28, 2013) | | | 0.00 | * | | | (1,571 | ) | | | 5,535,869 | |
| Heating Oil (44 contracts, settlement date April 30, 2013) | | | 0.02 | | | | 85,352 | | | | 5,587,982 | |
| Heating Oil (44 contracts, settlement date May 31, 2013) | | | 0.02 | | | | 90,959 | | | | 5,558,045 | |
| Lean Hogs (189 contracts, settlement date February 14, 2013) | | | 0.07 | | | | 323,420 | | | | 6,480,810 | |
| Lean Hogs (189 contracts, settlement date April 12, 2013) | | | 0.01 | | | | 24,060 | | | | 6,707,610 | |
| Lean Hogs (188 contracts, settlement date June 14, 2013) | | | (0.04 | ) | | | (163,170 | ) | | | 7,358,320 | |
| Lean Hogs (188 contracts, settlement date July 15, 2013) | | | (0.04 | ) | | | (193,660 | ) | | | 7,322,600 | |
| Light, Sweet Crude Oil (60 contracts, settlement date January 22, 2013) | | | (0.01 | ) | | | (45,010 | ) | | | 5,509,200 | |
| Light, Sweet Crude Oil (61 contracts, settlement date February 20, 2013) | | | (0.01 | ) | | | (57,300 | ) | | | 5,628,470 | |
| Light, Sweet Crude Oil (60 contracts, settlement date March 20, 2013) | | | (0.01 | ) | | | (38,330 | ) | | | 5,563,800 | |
| Light, Sweet Crude Oil (60 contracts, settlement date April 22, 2013) | | | 0.06 | | | | 279,100 | | | | 5,589,600 | |
| Light, Sweet Crude Oil (60 contracts, settlement date May 21, 2013) | | | 0.06 | | | | 274,100 | | | | 5,609,400 | |
| Live Cattle (175 contracts, settlement date February 28, 2013) | | | 0.03 | | | | 163,800 | | | | 9,261,000 | |
| Live Cattle (174 contracts, settlement date April 30, 2013) | | | 0.02 | | | | 106,530 | | | | 9,491,700 | |
| Live Cattle (175 contracts, settlement date June 28, 2013) | | | 0.02 | | | | 96,290 | | | | 9,152,500 | |
| Natural Gas (163 contracts, settlement date January 29, 2013) | | | (0.06 | ) | | | (298,990 | ) | | | 5,462,130 | |
| Natural Gas (163 contracts, settlement date Februay 26, 2013) | | | (0.05 | ) | | | (251,910 | ) | | | 5,484,950 | |
| Natural Gas (163 contracts, settlement date March 26, 2013) | | | (0.04 | ) | | | (189,680 | ) | | | 5,546,890 | |
| Natural Gas (163 contracts, settlement date April 26, 2013) | | | (0.07 | ) | | | (316,420 | ) | | | 5,628,390 | |
| Natural Gas (163 contracts, settlement date May 29, 2013) | | | (0.06 | ) | | | (298,280 | ) | | | 5,718,040 | |
| Platinum (181 contracts, settlement date April 26, 2013) | | | (0.06 | ) | | | (267,470 | ) | | | 13,958,720 | |
| Platinum (180 contracts, settlement date July 29, 2013) | | | (0.07 | ) | | | (329,455 | ) | | | 13,911,300 | |
| Silver (62 contracts, settlement date March 26, 2013) | | | 0.01 | | | | 58,585 | | | | 9,370,370 | |
| Silver (61 contracts, settlement date May 29, 2013) | | | 0.03 | | | | 143,405 | | | | 9,235,095 | |
| Silver (61 contracts, settlement date July 29, 2013) | | | (0.14 | ) | | | (680,860 | ) | | | 9,249,125 | |
| Soybean (133 contracts, settlement date March 14, 2013) | | | (0.16 | ) | | | (772,287 | ) | | | 9,373,175 | |
| Soybean (132 contracts, settlement date May 14, 2013) | | | (0.10 | ) | | | (461,563 | ) | | | 9,235,050 | |
| Soybean (133 contracts, settlement date July 12, 2013) | | | (0.01 | ) | | | (61,712 | ) | | | 9,278,413 | |
| Sugar (424 contracts, settlement date February 28, 2013) | | | (0.10 | ) | | | (456,109 | ) | | | 9,264,909 | |
| Sugar (424 contracts, settlement date April 30, 2013) | | | (0.07 | ) | | | (317,901 | ) | | | 9,307,648 | |
| Sugar (423 contracts, settlement date June 28, 2013) | | | 0.06 | | | | 278,678 | | | | 9,352,022 | |
| Wheat (237 contracts, settlement date March 14, 2013) | | | (0.28 | ) | | | (1,303,087 | ) | | | 9,219,300 | |
| Wheat (237 contracts, settlement date May 14, 2013) | | | (0.24 | ) | | | (1,134,200 | ) | | | 9,334,838 | |
| Wheat (235 contracts, settlement date July 12, 2013) | | | (0.22 | ) | | | (1,015,588 | ) | | | 9,326,563 | |
| Net Unrealized Depreciation on Futures Contracts | | | (2.64 | )% | | $ | (12,514,458 | ) | | $ | 473,904,029 | |
* Denotes greater than 0.000% yet less than 0.005% | | | | | | | | | | | |
See accompanying notes to consolidated financial statements
| | | | | | | | | | |
| | | Percentage of | | | Fair | | | Face | |
| Description | | Net Assets | | | Value | | | Value | |
| U.S. Treasury Obligations | | | | | | | | | |
| U.S. Treasury Bill, 0.00% due January 05, 2012 (cost $9,999,989) | | | 1.72 | % | | $ | 9,999,990 | | | $ | 10,000,000 | |
| | | | | | | | | | | | | |
| | | Percentage of | | | Fair | | | Notional | |
| Description | | Net Assets | | | Value | | | Value | |
| Unrealized Appreciation/(Depreciation) on Futures Contracts | | | | | | | | | | | | |
| Cocoa (535 contracts, settlement date March 15, 2012) | | | (0.55 | ) % | | $ | (3,205,990 | ) | | $ | 11,283,150 | |
| Cocoa (536 contracts, settlement date May 15, 2012) | | | (0.53 | ) | | | (3,093,380 | ) | | | 11,422,160 | |
| Cocoa (536 contracts, settlement date July 16, 2012) | | | (0.33 | ) | | | (1,932,240 | ) | | | 11,513,280 | |
| Coffee (133 contracts, settlement date March 20, 2012) | | | (0.15 | ) | | | (896,456 | ) | | | 11,314,144 | |
| Coffee (132 contracts, settlement date May 18, 2012) | | | (0.16 | ) | | | (919,744 | ) | | | 11,367,675 | |
| Coffee (132 contracts, settlement date July 19, 2012) | | | (0.06 | ) | | | (352,538 | ) | | | 11,493,900 | |
| Copper (133 contracts, settlement date March 28, 2012) | | | (0.10 | ) | | | (592,150 | ) | | | 11,424,700 | |
| Copper (132 contracts, settlement date May 29, 2012) | | | (0.11 | ) | | | (608,013 | ) | | | 11,376,750 | |
| Copper (132 contracts, settlement date July 27, 2012) | | | 0.01 | | | | 51,438 | | | | 11,401,500 | |
| Corn (349 contracts, settlement date March 14, 2012) | | | (0.15 | ) | | | (862,200 | ) | | | 11,281,425 | |
| Corn (349 contracts, settlement date May 14, 2012) | | | (0.15 | ) | | | (839,875 | ) | | | 11,425,387 | |
| Corn (348 contracts, settlement date July 13, 2012) | | | 0.01 | | | | 33,125 | | | | 11,505,750 | |
| Cotton (249 contracts, settlement date March 08, 2012) | | | (0.13 | ) | | | (726,570 | ) | | | 11,429,100 | |
| Cotton (248 contracts, settlement date May 08, 2012) | | | (0.15 | ) | | | (851,265 | ) | | | 11,368,320 | |
| Cotton (248 contracts, settlement date July 09, 2012) | | | (0.12 | ) | | | (721,380 | ) | | | 11,322,440 | |
| FCOJ-A (561 contracts, settlement date March 12, 2012) | | | 0.04 | | | | 257,978 | | | | 14,221,350 | |
| FCOJ-A (486 contracts, settlement date May 10, 2012) | | | 0.15 | | | | 856,470 | | | | 12,261,780 | |
| FCOJ-A (306 contracts, settlement date July 11, 2012) | | | (0.01 | ) | | | (32,880 | ) | | | 7,738,740 | |
| Gold (72 contracts, settlement date February 27, 2012) | | | (0.09 | ) | | | (527,380 | ) | | | 11,280,960 | |
| Gold (72 contracts, settlement date April 26, 2012) | | | (0.21 | ) | | | (1,233,460 | ) | | | 11,299,680 | |
| Gold (73 contracts, settlement date June 27, 2012) | | | (0.25 | ) | | | (1,434,620 | ) | | | 11,472,680 | |
| Heating Oil (57 contracts, settlement date January 31, 2012) | | | (0.02 | ) | | | (109,389 | ) | | | 6,976,595 | |
| Heating Oil (56 contracts, settlement date February 29, 2012) | | | (0.02 | ) | | | (101,056 | ) | | | 6,834,677 | |
| Heating Oil (56 contracts, settlement date March 30, 2012) | | | (0.02 | ) | | | (111,661 | ) | | | 6,789,283 | |
| Heating Oil (56 contracts, settlement date April 30, 2012) | | | (0.09 | ) | | | (493,088 | ) | | | 6,734,482 | |
| Heating Oil (56 contracts, settlement date May 31, 2012) | | | (0.08 | ) | | | (488,053 | ) | | | 6,693,557 | |
| Lean Hogs (236 contracts, settlement date February 14, 2012) | | | (0.07 | ) | | | (384,030 | ) | | | 7,957,920 | |
| Lean Hogs (236 contracts, settlement date April 16, 2012) | | | (0.06 | ) | | | (325,560 | ) | | | 8,278,880 | |
| Lean Hogs (235 contracts, settlement date June 14, 2012) | �� | | (0.05 | ) | | | (275,680 | ) | | | 8,977,000 | |
| Lean Hogs (236 contracts, settlement date July 16, 2012) | | | (0.04 | ) | | | (210,990 | ) | | | 8,951,480 | |
| Light, Sweet Crude Oil (69 contracts, settlement date January 20, 2012) | | | 0.13 | | | | 727,240 | | | | 6,819,270 | |
| Light, Sweet Crude Oil (69 contracts, settlement date February 21, 2012) | | | 0.13 | | | | 746,950 | | | | 6,831,000 | |
| Light, Sweet Crude Oil (69 contracts, settlement date March 20, 2012) | | | 0.13 | | | | 746,560 | | | | 6,845,490 | |
| Light, Sweet Crude Oil (69 contracts, settlement date April 20, 2012) | | | 0.01 | | | | 82,600 | | | | 6,859,290 | |
| Light, Sweet Crude Oil (68 contracts, settlement date May 22, 2012) | | | 0.02 | | | | 113,320 | | | | 6,764,640 | |
| Live Cattle (229 contracts, settlement date February 29, 2012) | | | 0.00 | * | | | 2,380 | | | | 11,124,820 | |
| Live Cattle (230 contracts, settlement date April 30, 2012) | | | (0.02 | ) | | | (131,730 | ) | | | 11,541,400 | |
| Live Cattle (230 contracts, settlement date June 29, 2012) | | | (0.02 | ) | | | (122,410 | ) | | | 11,460,900 | |
| Natural Gas (224 contracts, settlement date January 27, 2012) | | | (0.40 | ) | | | (2,315,920 | ) | | | 6,695,360 | |
| Natural Gas (224 contracts, settlement date February 27, 2012) | | | (0.38 | ) | | | (2,204,450 | ) | | | 6,755,840 | |
| Natural Gas (220 contracts, settlement date March 28, 2012) | | | (0.36 | ) | | | (2,067,940 | ) | | | 6,773,800 | |
| Natural Gas (220 contracts, settlement date April 26, 2012) | | | (0.20 | ) | | | (1,188,850 | ) | | | 6,888,200 | |
| Natural Gas (219 contracts, settlement date May 29, 2012) | | | (0.20 | ) | | | (1,169,040 | ) | | | 6,968,580 | |
| Platinum (243 contracts, settlement date April 26, 2012) | | | (0.43 | ) | | | (2,468,450 | ) | | | 17,069,535 | |
| Platinum (243 contracts, settlement date July 27, 2012) | | | (0.44 | ) | | | (2,566,290 | ) | | | 17,124,210 | |
| Silver (82 contracts, settlement date March 28, 2012) | | | (0.35 | ) | | | (2,055,925 | ) | | | 11,445,150 | |
| Silver (81 contracts, settlement date May 29, 2012) | | | (0.38 | ) | | | (2,222,650 | ) | | | 11,323,800 | |
| Silver (81 contracts, settlement date July 27, 2012) | | | (0.33 | ) | | | (1,944,665 | ) | | | 11,338,785 | |
| Soybean (186 contracts, settlement date March 14, 2012) | | | (0.17 | ) | | | (1,016,225 | ) | | | 11,232,075 | |
| Soybean (187 contracts, settlement date May 14, 2012) | | | (0.16 | ) | | | (954,425 | ) | | | 11,383,625 | |
| Soybean (187 contracts, settlement date July 13, 2012) | | | 0.05 | | | | 264,900 | | | | 11,472,450 | |
| Sugar (444 contracts, settlement date February 29, 2012) | | | (0.24 | ) | | | (1,406,339 | ) | | | 11,586,624 | |
| Sugar (444 contracts, settlement date April 30, 2012) | | | (0.20 | ) | | | (1,152,122 | ) | | | 11,412,576 | |
| Sugar (444 contracts, settlement date June 29, 2012) | | | (0.09 | ) | | | (545,496 | ) | | | 11,218,637 | |
| Wheat (343 contracts, settlement date March 14, 2012) | | | (0.20 | ) | | | (1,133,987 | ) | | | 11,194,662 | |
| Wheat (340 contracts, settlement date May 14, 2012) | | | (0.19 | ) | | | (1,118,513 | ) | | | 11,411,250 | |
| Wheat (340 contracts, settlement date July 13, 2012) | | | 0.04 | | | | 230,325 | | | | 11,666,250 | |
| Net Unrealized Depreciation on Futures Contracts | | | (7.74 | )% | | $ | (45,001,789 | ) | | $ | 580,606,964 | |
* Denotes greater than 0.000% yet less than 0.005% | | | | | | | | | | | | |
See accompanying notes to consolidated financial statements
GreenHaven Continuous Commodity Index Master Fund
| | | 2012 | | | 2011 | | | 2010 | |
| Income | | | | | | | | | |
| Interest Income | | $ | 331,044 | | | $ | 335,677 | | | $ | 301,808 | |
| | | | | | | | | | | | | |
| Expenses | | | | | | | | | | | | |
| Management fee to related party | | | 4,637,997 | | | | 5,895,201 | | | | 2,523,863 | |
| Brokerage fees and expenses | | | 377,195 | | | | 1,300,472 | | | | 712,620 | |
| Total expenses | | | 5,015,192 | | | | 7,195,673 | | | | 3,236,483 | |
| Net Investment Loss | | | (4,684,148 | ) | | | (6,859,996 | ) | | | (2,934,675 | ) |
| | | | | | | | | | | | | |
Realized and Net Change in Unrealized Gain (Loss) on Investments and Futures Contracts | | | | | | | | | | | | |
| Realized Gain (Loss) on | | | | | | | | | | | | |
| Investments | | | 1,429 | | | | 451 | | | | (403 | ) |
| Futures Contracts | | | (55,222,884 | ) | | | 36,755,383 | | | | 43,285,484 | |
| Net Realized Gain (Loss) | | | (55,221,455 | ) | | | 36,755,834 | | | | 43,285,081 | |
| Net Change in Unrealized Gain (Loss) on | | | | |
| Investments | | | 15,980 | | | | (20,292 | ) | | | 18,076 | |
| Futures Contracts | | | 32,487,331 | | | | (103,641,471 | ) | | | 46,259,451 | |
| Net Change in Unrealized Gain (Loss) | | | 32,503,311 | | | | (103,661,763 | ) | | | 46,277,527 | |
Net Realized and Unrealized Gain (Loss) on Investments and Future Contracts | | | (22,718,144 | ) | | | (66,905,929 | ) | | | 89,562,608 | |
| | | | | | | | | | | | | |
| Net Gain (Loss) | | $ | (27,402,292 | ) | | $ | (73,765,925 | ) | | $ | 86,627,933 | |
See accompanying notes to consolidated financial statements
GreenHaven Continuous Commodity Index Master Fund
For the Year Ended December 31, 2012
| | | General Units | | Limited Units | | Total | |
| | | | | | | | | | | | | | | | | | | | | | | | | | | | |
| | | | | | | | | | | | Total | | | | | | | | | | | | Total | | | | |
| | | | | | | | | | | | General | | | | | | | | | | | | Limited | | | Total | |
| | | General Units | | | Accumulated | | | Shareholders’ | | | Limited Units | | | Accumulated | | | Shareholders’ | | | Shareholders’ | |
| | | Units | | | Amount | | | Deficit | | | Equity | | | Units | | | Amount | | | Earnings | | | Equity | | | Equity | |
| Balance at January 1, 2012 | | | 50 | | | $ | 1,500 | | | $ | (2 | ) | | $ | 1,498 | | | | 19,400,000 | | | $ | 549,362,581 | | | $ | 31,793,937 | | | $ | 581,156,518 | | | $ | 581,158,016 | |
| Creation of Limited Units | | | - | | | | - | | | | - | | | | - | | | | 3,250,000 | | | | 101,149,075 | | | | - | | | | 101,149,075 | | | | 101,149,075 | |
| Redemption of Limited Units | | | - | | | | - | | | | - | | | | - | | | | (6,200,000 | ) | | | (180,296,699 | ) | | | - | | | | (180,296,699 | ) | | | (180,296,699 | ) |
| Net loss: | | | | | | | | | | | | | | | | | | | | | | | | | | | | | | | | | | | | |
| Net investment loss | | | - | | | | - | | | | (13 | ) | | | (13 | ) | | | - | | | | - | | | | (4,684,135 | ) | | | (4,684,135 | ) | | | (4,684,148 | ) |
| Net realized loss on Investments | | | | | | | | | | | | | | | | | | | | | | | | | | | | | | | | | | | |
| and Futures Contracts | | | - | | | | - | | | | (135 | ) | | | (135 | ) | | | - | | | | - | | | | (55,221,320 | ) | | | (55,221,320 | ) | | | (55,221,455 | ) |
| Net change in unrealized gain on | | | | | | | | | | | | | | | | | | | | | | | | | | | | | | | | | | | |
| Investments and | | | | | | | | | | | | | | | | | | | | | | | | | | | | | | | | | | | | |
| Futures Contracts | | | - | | | | - | | | | 93 | | | | 93 | | | | - | | | | - | | | | 32,503,218 | | | | 32,503,218 | | | | 32,503,311 | |
| Net loss | | | - | | | | - | | | | (55 | ) | | | (55 | ) | | | - | | | | - | | | | (27,402,237 | ) | | | (27,402,237 | ) | | | (27,402,292 | ) |
| | | | | | | | | | | | | | | | | | | | | | | | | | | | | | | | | | | | | |
| Balance at December 31, 2012 | | | 50 | | | $ | 1,500 | | | $ | (57 | ) | | $ | 1,443 | | | | 16,450,000 | | | $ | 470,214,957 | | | $ | 4,391,700 | | | $ | 474,606,657 | | | $ | 474,608,100 | |
See accompanying notes to consolidated financial statements
| | | | | | | | | | | | | | | | | | | | | | | | | | | | |
| | | General Units | | Limited Units | | Total | |
| | | | | | | | | | | | | | | | | | | | | | | | | | | | |
| | | | | | | | | | | | Total | | | | | | | | | | | | Total | | | | |
| | | | | | | | | | | | General | | | | | | | | | | | | Limited | | | Total | |
| | | General Units | | | Accumulated | | | Shareholders’ | | | Limited Units | | | Accumulated | | | Shareholders’ | | | Shareholders’ | |
| | | Units | | | Amount | | | Deficit | | | Equity | | | Units | | | Amount | | | Earnings | | | Equity | | | Equity | |
| Balance at January 1, 2011 | | | 50 | | | $ | 1,500 | | | $ | 144 | | | $ | 1,644 | | | | 16,250,000 | | | $ | 428,801,695 | | | $ | 105,559,716 | | | $ | 534,361,411 | | | $ | 534,363,055 | |
| Creation of Limited Units | | | - | | | | - | | | | - | | | | - | | | | 11,200,000 | | | | 383,075,174 | | | | - | | | | 383,075,174 | | | | 383,075,174 | |
| Redemption of Limited Units | | | - | | | | - | | | | - | | | | - | | | | (8,050,000 | ) | | | (262,514,288 | ) | | | - | | | | (262,514,288 | ) | | | (262,514,288 | ) |
| Net loss: | | | | | | | | | | | | | | | | | | | | | | | | | | | | | | | | | | | | |
| Net investment loss | | | - | | | | - | | | | (17 | ) | | | (17 | ) | | | - | | | | - | | | | (6,859,979 | ) | | | (6,859,979 | ) | | | (6,859,996 | ) |
| Net realized gain on Investments | | | | | | | | | | | | | | | | | | | | | | | | | | | | | | | | | |
| and Futures Contracts | | | - | | | | - | | | | 88 | | | | 88 | | | | - | | | | - | | | | 36,755,746 | | | | 36,755,746 | | | | 36,755,834 | |
| Net change in unrealized loss on | | | | | | | | | | | | | | | | | | | | | | | | | | | | | | | | | | | | |
| Investments and | | | | | | | | | | | | | | | | | | | | | | | | | | | | | | | | | | | | |
| Futures Contracts | | | - | | | | - | | | | (217 | ) | | | (217 | ) | | | - | | | | - | | | | (103,661,546 | ) | | | (103,661,546 | ) | | | (103,661,763 | ) |
| Net loss | | | - | | | | - | | | | (146 | ) | | | (146 | ) | | | - | | | | - | | | | (73,765,779 | ) | | | (73,765,779 | ) | | | (73,765,925 | ) |
| | | | | | | | | | | | | | | | | | | | | | | | | | | | | | | | | | | | | |
| Balance at December 31, 2011 | | | 50 | | | $ | 1,500 | | | $ | (2 | ) | | $ | 1,498 | | | | 19,400,000 | | | $ | 549,362,581 | | | $ | 31,793,937 | | | $ | 581,156,518 | | | $ | 581,158,016 | |
See accompanying notes to consolidated financial statements
| | | | | | | | | | | | | | | | | | | | | | | | | | | | |
| | | General Units | | Limited Units | | Total | |
| | | | | | | | | | | | | | | | | | | | | | | | | | | | |
| | | | | | | | | | | | Total | | | | | | | | | | | | Total | | | | |
| | | | | | | | | | | | General | | | | | | | | | | | | Limited | | | Total | |
| | | General Units | | | Accumulated | | | Shareholders’ | | | Limited Units | | | Accumulated | | | Shareholders’ | | | Shareholders’ | |
| | | Units | | | Amount | | | Earnings | | | Equity | | | Units | | | Amount | | | Earnings | | | Equity | | | Equity | |
| Balance at January 1, 2010 | | | 50 | | | $ | 1,500 | | | $ | (189 | ) | | $ | 1,311 | | | | 8,750,000 | | | $ | 210,500,911 | | | $ | 18,932,116 | | | $ | 229,433,027 | | | $ | 229,434,338 | |
| Creation of Limited Units | | | - | | | | - | | | | - | | | | - | | | | 9,200,000 | | | | 262,051,675 | | | | - | | | | 262,051,675 | | | | 262,051,675 | |
| Redemption of Limited Units | | | - | | | | - | | | | - | | | | - | | | | (1,700,000 | ) | | | (43,750,891 | ) | | | - | | | | (43,750,891 | ) | | | (43,750,891 | ) |
| Net gain: | | | | | | | | | | | | | | | | | | | | | | | | | | | | | | | | | | | | |
| Net investment loss | | | - | | | | - | | | | (15 | ) | | | (15 | ) | | | - | | | | - | | | | (2,934,660 | ) | | | (2,934,660 | ) | | | (2,934,675 | ) |
| Net realized gain on Investments | | | | | | | | | | | | | | | | | | | | | | | | | | | | | | | | | |
| and Futures Contracts | | | - | | | | - | | | | 165 | | | | 165 | | | | - | | | | - | | | | 43,284,916 | | | | 43,284,916 | | | | 43,285,081 | |
| Net change in unrealized gain on | | | | | | | | | | | | | | | | | | | | | | | | | | | | | | | | | | | |
| Investments and | | | | | | | | | | | | | | | | | | | | | | | | | | | | | | | | | | | | |
| Futures Contracts | | | - | | | | - | | | | 183 | | | | 183 | | | | - | | | | - | | | | 46,277,344 | | | | 46,277,344 | | | | 46,277,527 | |
| Net gain | | | - | | | | - | | | | 333 | | | | 333 | | | | - | | | | - | | | | 86,627,600 | | | | 86,627,600 | | | | 86,627,933 | |
| | | | | | | | | | | | | | | | | | | | | | | | | | | | | | | | | | | | | |
| Balance at December 31, 2010 | | | 50 | | | $ | 1,500 | | | $ | 144 | | | $ | 1,644 | | | | 16,250,000 | | | $ | 428,801,695 | | | $ | 105,559,716 | | | $ | 534,361,411 | | | $ | 534,363,055 | |
See accompanying notes to consolidated financial statements
GreenHaven Continuous Commodity Index Master Fund
Statements of Cash Flows
For the Years Ended December 31, 2012, 2011, and 2010| | | | | | | | | | |
| | | 2012 | | | 2011 | | | 2010 | |
| Cash flow from operating activities: | | | | | | | | | |
| Net gain (loss) | | $ | (27,402,292 | ) | | $ | (73,765,925 | ) | | $ | 86,627,933 | |
| Adjustments to reconcile net gain (loss) to net cash used for operating activities: | | | | | | | | | | | | |
| Purchase of investment securities | | | (2,089,638,671 | ) | | | (1,594,743,929 | ) | | | (1,159,625,357 | ) |
| Proceeds from sales of investment securities | | | 1,629,991,694 | | | | 2,054,999,635 | | | | 809,997,503 | |
| Net accretion of discount | | | (331,044 | ) | | | (335,677 | ) | | | (301,808 | ) |
| Net realized loss (gain) on investment securities | | | (1,429 | ) | | | (451 | ) | | | 403 | |
| Unrealized depreciation (appreciation) on investments | | | (32,503,311 | ) | | | 103,661,763 | | | | (46,277,527 | ) |
| Increase in payable - capital shares | | | 2,829,896 | | | | 1,497,826 | | | | - | |
| Increase (decrease) in accrued expenses | | | (666,087 | ) | | | 717,847 | | | | 515,001 | |
| Net cash provided by (used for) operating activities | | | (517,721,244 | ) | | | 492,031,089 | | | | (309,063,852 | ) |
| | | | | | | | | | | | | |
| Cash flows from financing activities: | | | | | | | | | | | | |
| Proceeds from creation of Limited Units | | | 101,149,075 | | | | 383,075,174 | | | | 262,051,675 | |
| Redemption of Limited Units | | | (180,296,699 | ) | | | (262,514,288 | ) | | | (43,750,891 | ) |
| Net cash provided by (used for) financing activities | | | (79,147,624 | ) | | | 120,560,886 | | | | 218,300,784 | |
| | | | | | | | | | | | | |
| Net change in cash | | | (596,868,868 | ) | | | 612,591,975 | | | | (90,763,068 | ) |
| Cash held by broker at beginning of year | | | 619,079,494 | | | | 6,487,519 | | | | 97,250,587 | |
| Cash held by broker at end of year | | $ | 22,210,626 | | | $ | 619,079,494 | | | $ | 6,487,519 | |
See accompanying notes to consolidated financial statements
GreenHaven Continuous Commodity Index Fund
GreenHaven Continuous Commodity Index Master Fund
Years Ended December 31, 2012, 2011, and 2010
(1) Organization
The GreenHaven Continuous Commodity Index Fund (the “Fund”) was formed as a Delaware statutory trust on October 27, 2006, and GreenHaven Continuous Commodity Master Index Fund (the “Master Fund”, and together with the Fund, the “Funds”), was formed as a Delaware statutory trust on October 27, 2006. The Fund offers common units of beneficial interest (the “Shares”). Upon inception of the Fund, 50 General Units of the Fund were issued to GreenHaven Commodity Services, LLC (the “Managing Owner”) in exchangepage F-1 for a capital contribution of $1,500. The Managing Owner serves the Fund as commodity pool operator, commodity trading advisor, and managing owner.
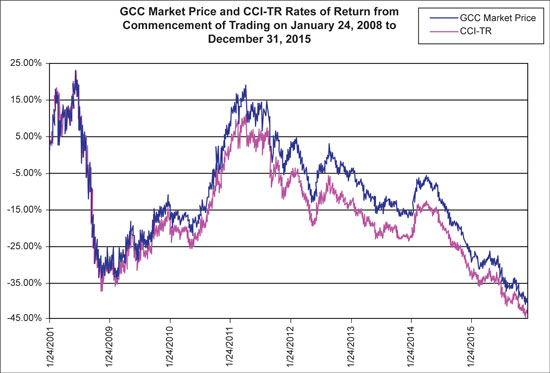
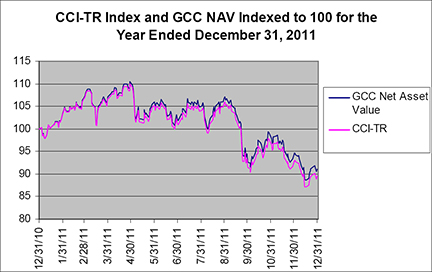
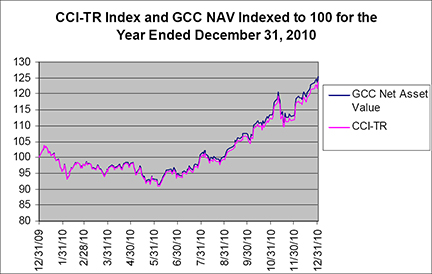
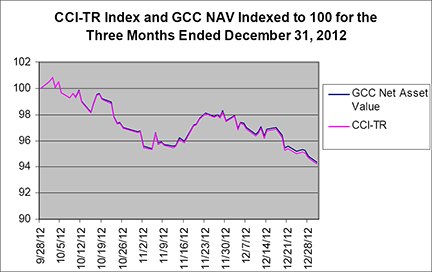
Shares are purchased from the Fund only by Authorized Participants in one or more blocks of 50,000 Shares, called a Basket. The proceeds from the offering of Shares are invested in the Master Fund. The Master Fund actively trades exchange traded futures in the commodities comprising the Reuters Continuous Commodity Index (“the Index”), with a view to tracking the performance of the Index over time. The Master Fund’s portfolio also includes United States Treasury securities and other high credit quality short term fixed income securities for deposit with the Master Fund’s commodities brokers as margin. The Fund wholly owns the Master Fund.
The Fund commenced trading on the American Stock Exchange (the AMEX) on January 24, 2008. On November 24, 2008 the Fund de-listed from the AMEX and on November 25, 2008 the Fund listed on NYSE Arca. Prior to January 23, 2008, the only activity in the Fund was the subscription in 2006 by the Managing Owner for the General Units and the related payment for them in January 2008.
The Index is intended to reflect the performance of certain commodities. Through January 6, 2013 the commodities comprising the Index (the “Index Commodities”) were: corn, soybeans, wheat, live cattle, lean hogs, gold, silver, copper, cocoa, coffee, sugar, cotton, orange juice, platinum, crude oil, heating oil, and natural gas. The Index was revised on January 7, 2013 to include soybean oil and remove orange juice.
The Managing Owner and the Shareholders share in any profits and losses of the Fund attributable to the Fund in proportion to the percentage interest owned by each.
The Managing Owner, the Fund, and the Master Fund retain the services of third party service providers to operate the ongoing operations of the Fund and the Master Fund (See Note (2)).
(2) Service Providers and Related Party Agreements
(a) “The Trustee” – CSC Trust is the trustee for the Fund and Master Fund. CSC Trust is headquartered in Wilmington, DE.
(b) “The Managing Owner” – GreenHaven Commodity Services, LLC is the managing owner of the Fund and Master Fund and is responsible for the day to day operations of both entities. The Managing Owner charges the Fund a management fee for its services. GreenHaven Commodity Services, LLC is a Delaware limited liability company with operations in Atlanta, GA.
(c) “The Administrator” – The Bank of New York Mellon Corporation has been appointed by the Managing Owner as the administrator, custodian and transfer agent of the Fund and the Master Fund, and has entered into separate administrative, custodian, transfer agency and service agreements (collectively referred to as the “Administration Agreement”). Pursuant to the Administration Agreement, the Administrator performs or supervises the services necessary for the operation and administration of the Fund and the Master Fund (other than making investment decisions), including receiving net asset value calculations, accounting and other fund administrative services. As the Fund’s transfer agent, the Administrator will process creations and redemptions of Shares. These transactions will be processed on Depository Trust Company’s (“DTC’s”) book entry system. The Administrator retains certain financial books and records, including: Basket creation and redemption books and records, fund accounting records, ledgers with respect to assets, liabilities, capital, income and expenses, the registrar, transfer journals and related details and trading and related documents received from futures commission merchants. The Bank of New York Mellon Corporation is based in New York, New York.
(d) “The Commodity Broker” – Morgan Stanley & Co. Incorporated (“MS&Co.”) is the Master Fund’s Commodity Broker. In its capacity as the Commodity Broker, it executes and clears each of the Master Fund’s futures transactions and performs certain administrative services for the Master Fund. MS&Co. is based in New York, New York.
(e) “The Distributor” – The Managing Owner, on behalf of the Fund and the Master Fund, has appointed ALPS Distributors, Inc., or the Distributor, to assist the Managing Owner and the Administrator with certain functions and duties relating to the creation and redemption of Baskets, including receiving and processing orders from Authorized Participants to create and redeem Baskets, coordinating the processing of such orders and related functions and duties. The Distributor retains all marketing materials and Basket creation and redemption books and records at c/o ALPS Distributors, Inc., 1290 Broadway, Suite 1100, Denver, CO 80203; Telephone number (303) 623-2577. Investors may contact the Distributor toll-free in the U.S. at (800) 320-2577. The Fund has entered into a Distribution Services Agreement with the Distributor.
The Distributor is affiliated with ALPS Mutual Fund Services, Inc., a Denver-based service provider of administration, fund accounting, transfer agency and shareholder services for mutual funds, closed-end funds and exchange-traded funds.
(f) “The Authorized Participant” — Authorized Participants may create or redeem shares of the Master Fund. Each Authorized Participant must (1) be a registered broker-dealer or other securities market participant such as a bank or other financial institution which is not required to register as a broker-dealer to engage in securities transactions, (2) be a participant in the Depository Trust Company, or DTC, and (3) have entered into a participant agreement with the Fund and the Managing Owner, or a Participant Agreement. The Participant Agreement sets forth the procedures for the creation and redemption of Baskets of Shares and for the delivery of cash required for such creations or redemptions. A list of the current Authorized Participants can be obtained from the Administrator. A similar agreement between the Fund and the Master Fund sets forth the procedures for the creation and redemption of Master Unit Baskets by the Fund.
(3) Summary of Significant Accounting Policies
(a) Use of Estimates
The preparation of the financial statements in conformity with accounting principles generally accepted in the United States of America requires management to make estimates and assumptions that affect the reported amounts of assets and liabilities and disclosure of contingent assets and liabilities at the date of the financial statements and the reported amounts of revenue and expenses during the period. Actual results could differ from those estimates.
(b) Cash Held by Broker
The Fund defines cash held by broker to be cash and highly liquid investments with remaining maturities of three months or less when acquired. MS&Co. allows the Fund to apply its Treasury Bill portfolio towards its initial margin requirement for the Fund’s futures positions, hence all cash held by broker is unrestricted cash. The cash and Treasury bill positions are held in segregated accounts at MS&Co and are not insured by the Federal Deposit Insurance Corporation.
(c) United States Treasury Obligations
The Master Fund records purchases and sales of United States Treasury Obligations on a trade date basis. These holdings are marked to market based on quoted market closing prices. The Master Fund holds United States Treasury Obligations for deposit with the Master Fund’s commodity broker as margin and for trading and holding against initial margin of the open futures contracts. Interest income is recognized on an accrual basis when earned. Premiums and discounts are amortized or accreted over the life of the United States Treasury Obligations.
(d) Income Taxes
The Fund and Master Fund are classified as a grantor trust and a partnership respectively, for U.S. federal income tax purposes. Accordingly, neither the Fund nor the Master Fund is subject to U.S. federal, state, or local income taxes. Accordingly, no provision for federal, state, and local income taxes has been made in the accompanying consolidated financial statements, as investors are individually liable for income taxes, if any, on their allocable share of the Fund’s share of the Master Fund’s income, gain, loss, deductions and other items.
The Fund accounts for uncertainty in income taxes pursuant to the applicable accounting standard, which provides measurement, presentation and disclosure guidance related to uncertain tax positions. The guidance addresses how tax benefits claimed or expected to be claimed on a tax return should be recorded in the financial statements. Under this topic, the Fund must recognize the tax benefit from an uncertain tax position only if it is more likely than not that the tax position will be sustained on examination by the taxing authorities based on the technical merits of the position. The tax benefits recognized in the financial statements from such a position are measured based on the largest benefit that has a greater than fifty percent likelihood of being realized upon ultimate resolution. The Fund’s reassessment of its tax positions did not have a material impact on the Fund’s financial condition, results of operations or liquidity.
(e) Futures Contracts
The Master Fund purchases and holds commodity futures contracts for investment purposes. These contracts are recorded on a trade date basis and open contracts are valued daily at settlement prices provided by the relevant exchanges. In the consolidated statement of financial condition, futures contracts are presented at their published settlement prices on the last business day of the period, in accord with the fair value accounting standard. Since these contracts are actively traded in markets that are directly observable and which provide readily available price quotes, their market value is deemed to be their fair value under the fair value accounting standard. (See Note 4 – Fair Value Measurements)
However, when market closing prices are not available, the Managing Owner may value an asset of the Master Fund pursuant to such other principles as the Managing Owner deems fair and equitable provided such principles are consistent with the fair value accounting standard. Realized gains (losses) and changes in unrealized appreciation (depreciation) on open positions are determined on a specific identification basis and recognized in the consolidated statement of income and expenses in the period in which the contract is closed or the changes occur, respectively.
(f) Basis of Presentation and Consolidation
Upon the initial offering of the limited shares of the Fund, 100% of the capital raised by the Fund was used to purchase common units of beneficial interest of the Master Fund. The financial statement balances of the Master Fund were consolidated with the Fund’s financial statement balances beginning with the first reporting period subsequent to the initial offering, and all significant inter-company balances and transactions were eliminated. Separate financial statements of the Master Fund are presented to comply with SEC reporting requirements as the Master Fund is a separate SEC registrant.
(g) Recently Issued Accounting Pronouncements
The Fund is required to follow recent disclosure guidance which includes common requirements for measurement of and disclosure about fair value. The new guidance requires reporting entities to disclose the following information for fair value measurements categorized within Level 3 of the fair value hierarchy: Quantitative information about the unobservable inputs used in the fair value measurement, the valuation processes used by the reporting entity and a narrative description of the sensitivity of the fair value measurement to changes in unobservable inputs and the interrelationships between those unobservable inputs. It also requires reporting entities to make disclosures about amounts and reasons for all transfers in and out of Level 1 and Level 2 fair value measurements. Previously issued guidance continues to require the same information regarding transfers in and out of Level 3. The disclosures required by this guidance are reflected in Note (4).
In December 2011, additional disclosure guidance was issued requiring financial statements prepared under principles generally accepted in the United States of America to be more comparable to those prepared under International Financial Reporting Standards. The new disclosure requirements mandate that entities disclose both gross and net information about instruments and transactions eligible for offset in the statement of assets and liabilities as well as instruments and transactions subject to an agreement similar to a master netting arrangement. In addition, disclosure of collateral received and posted in connection with master netting agreements or similar arrangements is required. New disclosures are required for annual reporting periods beginning on or after January 1, 2013,and interim periods within those annual periods. Management is evaluating the impact of this additional disclosure guidance on the financial statements and disclosures.
(h) Subsequent Events
For purposes of disclosure in the financial statements, the Fund has evaluated events occurring between the year ending December 31, 2012 and when the financial statements were issued.
400,000 Limited Shares created and 350,000 Limited Shares redeemed resulting in 16,500,000 Limited Shares outstanding.
In accordance with the terms of the Distribution Services Agreement which would have renewed on January 7, 2013, the Managing Owner has informed the Distributor that instead of automatically renewing it intends to meet with the Distributor to review the terms of the agreement. The terms of the present agreement remains in effect until amended.
Other than these events, the evaluation did not result in any subsequent events that necessitated disclosures and/or adjustments.
(4) Fair Value Measurements
The guidance for fair value measurements establishes the authoritative definition for fair value, sets out a framework for measuring fair value and outlines the required disclosures regarding fair value measurements. Fair value is the price that would be received to sell an asset or paid to transfer a liability (an exit price) in the principal or most advantageous market for the asset or liability in an orderly transaction between market participants at the measurement date. The Company uses a three-tier fair value hierarchy based upon observable and non-observable inputs as follows:
Level 1 — Quoted prices (unadjusted) in active markets for identical assets or liabilities that the reporting entity can access at the measurement date.
Level 2 — Inputs other than quoted prices included within Level 1 that are observable for the asset or liability, either directly or indirectly.
Level 3 — Unobservable inputs for the asset or liability.
The inputs or methodology used for valuing securities are not necessarily an indication of the risk associated with investing in those securities. The assets of the Fund are either exchange-traded securities or government securities that are valued using dealer and broker quotations or other inputs that are observable or can be corroborated by observable market data. A summary of the Fund’s assets and liabilities at fair value as of December 31, 2012, classified according to the levels used to value them, are as follows:
| | | | | | | | | | | | | | |
| Assets | | Quoted Prices in Active Market (Level 1) | | Other Significant Observable Inputs (Level 2) | | Significant Unobservable Inputs (Level 3) | | Totals | |
| U.S. Treasuries | | $ | - | | $ | 469,995,420 | | $ | - | | $ | 469,995,420 | |
| Futures Contracts | | | (12,514,458 | ) | | - | | | - | | | (12,514,458 | ) |
| Total | | $ | (12,514,458 | ) | $ | 469,995,420 | | $ | - | | $ | 457,480,962 | |
There were no transfers between Level 1 and Level 2 for the Fund during the year ended December 31, 2012. The Fund did not hold any Level 3 securities during the year ended December 31, 2012.
A summary of the Fund’s assets and liabilities at fair value as of December 31, 2011, classified according to the levels used to value them, are as follows:
| | | | | | | | | | | | | | |
| Assets | | Quoted Prices in Active Market (Level 1) | | Other Significant Observable Inputs (Level 2) | | Significant Unobservable Inputs (Level 3) | | Totals | |
| U.S. Treasuries | | $ | - | | $ | 9,999,990 | | $ | - | | $ | 9,999,990 | |
| Futures Contracts | | | (45,001,789 | ) | | - | | | - | | | (45,001,789 | ) |
| Total | | $ | (45,001,789 | ) | $ | 9,999,990 | | $ | - | | $ | (35,001,799 | ) |
There were no transfers between Level 1 and Level 2 for the Fund during the year ended December 31, 2011. The Fund did not hold any Level 3 securities during the year ended December 31, 2011.
(5) Derivative Instruments and Hedging Activities
The Fund uses derivative instrumentsfiled as part of its principal investment strategy to achieve its investment objective. As of December 31, 2012, the Funds were invested in futures contracts.
At December 31, 2012, the fair value of derivative instruments were as follows:
| Derivative Instruments | | Asset Derivatives | | | | | | Net Derivatives | |
| Futures Contracts | | $ | (12,514,458 | ) | | $ | - | | | $ | (12,514,458 | ) |
The following is a summary of the realized and unrealized gains and losses of the derivative instruments utilized by the Fund, categorized by risk exposure, for the year ended December 31, 2012:
| Derivative Instruments | | Net Realized Loss on Derivative Instruments | | | Net Change in Unrealized Gain on Derivative Instruments | |
| Futures Contracts | | $ | (55,222,884 | ) | | $ | 32,487,331 | |
At December 31, 2011, the fair value of derivative instruments were as follows:
| Derivative Instruments | | Asset Derivatives | | | Liability Derivatives | | | Net Derivatives | |
| Futures Contracts | | $ | (45,001,789 | ) | | $ | - | | | $ | (45,001,789 | ) |
The following is a summary of the realized and unrealized gains and losses of the derivative instruments utilized by the Fund, categorized by risk exposure, for the year ended December 31, 2011:
Derivative Instruments | | Net Realized Gain on Derivative Instruments | | | Net Change in Unrealized Loss on Derivative Instruments | |
| Futures Contracts | | $ | 36,755,383 | | | $ | (103,641,471 | ) |
The following is a summary of the realized and unrealized gains and losses of the derivative instruments utilized by the Fund, categorized by risk exposure, for the year ended December 31, 2010:
| Derivative Instruments | | Net Realized Gain on Derivative Instruments | | | Net Change in Unrealized Gain on Derivative Instruments | |
| Futures Contracts | | $ | 43,285,484 | | | $ | 46,259,451 | |
(6)this Annual Report. Those Financial Instrument Risk
In the normal course of its business, the Fund is party to financial instruments with off-balance sheet risk. The term “off-balance sheet risk” refers to an unrecorded potential liability that, even though it does not appear on the balance sheet, may result in a future obligation or loss. The financial instruments used by the Fund are commodity futures, whose values are based upon an underlying asset and generally represent future commitments that have a reasonable possibility to be settled in cash or through physical delivery. These instruments are traded on an exchange and are standardized contracts.
Market risk is the potential for changes in the value of the financial instruments traded by the Fund due to market changes, including fluctuations in commodity prices. In entering into these contracts, there exists a market risk that such contracts may be significantly influenced by conditions, resulting in such contracts being less valuable. If the markets should move against all of the futures interest positions at the same time,Statements, and the Managing Owner was unable to offset such positions, the Fund could experience substantial losses.
Credit risk is the possibility that a loss may occur due to the failure of an exchange clearinghouse to perform according to the terms of a contract. Credit risk with respect to exchange-traded instruments is reduced to the extent that an exchange or clearing organization acts as counterparty to the transactions. The Fund’s risk of loss in the event of counterparty default is typically limited to the amounts recognized in the statement of assetsnotes and liabilities and not representedschedules related thereto, are incorporated by the contract or notional amounts of the instruments.
The Fund and the Master Fund have not utilized, nor do they expect to utilize in the future, special purpose entities to facilitate off-balance sheet financing arrangements and have no loan guarantee arrangements or off-balance sheet arrangements of any kind other than agreements enteredreference into in the normal course of business.
(7) Share Creations and Redemptions
(a) Creation of shares
The Fund will issue Shares in baskets of 50,000 Shares (“Baskets”) only to Authorized Participants continuously as of noon, New York time, on the business day immediately following the date on which a valid order to create a Basket is accepted by the Fund. The Baskets will be valued as of the closing time of the NYSE Arca or the last to close of the exchanges on which the Index Commodities are traded, whichever is later, on the date that a valid order to create a Basket is accepted by the Fund.
The total payment required to create each Basket is the value of the Fund’s Net Asset Value per Share for 50,000 Shares as of the closing time of NYSE Arca or the last to close of the exchanges on which the Index Commodities are traded, whichever is later, on the purchase order date. Baskets will be issued as of 12:00 p.m., New York time, on the Business Day immediately following the creation order date at Net Asset Value per Share as of the closing time of NYSE Arca or the last to close of the exchanges on which the Index Commodities are traded, whichever is later, on the purchase order date during the continuous offering period, but only if the required payment has been timely received.
Because orders to create Baskets must be placed by 10:00 a.m., New York time, but the total payment required to create a Basket during the continuous offering period will not be determined until 4:00 p.m., New York time, on the date the creation order is received, Authorized Participants will not know the total amount of the payment required to create a Basket at the time they submit an irrevocable purchase order for the Basket. The Fund’s Net Asset Value and the total amount of the payment required to create a Basket could rise or fall substantially between the time an irrevocable creation order is submitted and the time the amount of the creation price in respect thereof is determined.
On any business day, an Authorized Participant may place an order with the Distributor to create one or more Baskets. Creation orders must be placed by 10:00 a.m., New York time. The day on which the Distributor receives a valid creation order is the creation order date.
The Administrator may reject a creation order if:
this Item 8. | Item 9. | Changes in and Disagreements with Accountants on Accounting and Financial Disclosure. |
None.
| | (i) | it determines that the creation order is not in proper form; |
| 37 | |
| (ii)Item 9A. | the Managing Owner believes that the creation order would have adverse tax consequences to the Fund or its Shareholders; or |
| | |
| (iii) | circumstances outside the control of the Managing Owner or the Distributor make it, for all practical purposes, not feasible to process creations of Baskets.Controls and Procedures. |
The DistributorDisclosure Controls and the Managing Owner will not be liable for the rejection of any creation order.
(b) Redemption of Shares
The procedures by which an Authorized Participant can redeem one or more Baskets mirror the procedures for the creation of Baskets. On any business day, an Authorized Participant may place an order with the Distributor to redeem one or more Baskets. Redemption orders must be placed by 10:00 a.m., New York time. The day on which the Distributor receives a valid redemption order is the redemption order date.
By placing a redemption order, an Authorized Participant agrees to deliver the Baskets to be redeemed through DTC’s book-entry system to the Fund not later than noon, New York time, on the business day immediately following the redemption order date. By placing a redemption order, and prior to receipt of the redemption distribution, an Authorized Participant’s DTC account will be charged the non-refundable transaction fee due for the redemption order.
The redemption distribution from the Fund consists of the cash redemption amount. The cash redemption amount is equal to the Net Asset Value of the number of Basket(s) requested in the Authorized Participant’s redemption order as of the closing time of the NYSE Arca or the last to close of the exchanges on which the Index Commodities are traded, whichever is later, on the redemption order date. The Fund will distribute the cash redemption amount at noon, New York time, on the business day immediately following the redemption order date through DTC to the account of the Authorized Participant as recorded on DTC’s book entry system.
The redemption distribution due from the Fund is delivered to the Authorized Participant at noon, New York time, on the business day immediately following the redemption order date if, by such time on such business day immediately following the redemption order date, the Fund’s DTC account has been credited with the Baskets to be redeemed. If the Fund’s DTC account has not been credited with all of the Baskets to be redeemed by such time, the redemption distribution is delivered to the extent of whole Baskets received. Any remainder of the redemption distribution is delivered on the next business day to the extent of remaining whole Baskets received if the Administrator receives the fee applicable to the extension of the redemption distribution date which the Managing Owner may, from time to time, determine and the remaining Baskets to be redeemed are credited to the Fund’s DTC account by noon, New York time, on such next business day. Any further outstanding amount of the redemption order shall be canceled. The Administrator is also authorized to deliver the redemption distribution notwithstanding that the Baskets to be redeemed are not credited to the Fund’s DTC account by noon, New York time, on the business day immediately following the redemption order date if the Authorized Participant has collateralized its obligation to deliver the Baskets through DTC’s book entry system on such terms as the Administrator and the Managing Owner may from time to time agree upon.
The Distributor may, in its discretion, and will when directed by the Managing Owner, suspend the right of redemption or postpone the redemption settlement date, (1) for any period during which an emergency exists as a result of which the redemption distribution is not reasonably practicable, or (2) for such other period as the Managing Owner determines to be necessary for the protection of the Shareholders. In addition, the Distributor will reject a redemption order if the order is not in proper form as described in the Participant Agreement or if the fulfillment of the order, in the opinion of its counsel, might be unlawful. Any such postponement, suspension or rejection could adversely affect a redeeming Authorized Participant. For example, the resulting delay may adversely affect the value of the Authorized Participant’s redemption proceeds if the net asset value of the Fund declines during the period of the delay. Under the Distribution Services Agreement, the Managing Owner and the Distributor may disclaim any liability for any loss or damage that may result from any such suspension or postponement.
(8) Operating Expenses
(a) Management Fee
The Master Fund pays the Managing Owner a management fee (the “Management Fee”) monthly in arrears, in an amount equal to 0.85% per annum of the net asset value of the Master Fund. No separate management fee will be paid by the Master Fund. The Management Fee will be paid in consideration of the use of the license for the Thomson Reuters Continuous Commodity Index held by GreenHaven, LLC, a Georgia limited liability company formed in August 2005, and its subsidiary GreenHaven Commodity Services, LLC, as well as for commodity futures trading advisory services. The management fees incurred for the years ended December 31, 2012, 2011 and 2010 were $4,637,997, $5,895,201 and $2,523,863, respectively. The Management Fees were charged to the Master Fund and paid to the Managing Owner.
(b) | Organization and Offering Expenses |
Expenses incurred in connection with organizing the Fund and the Master Fund and the offering of the Shares were paid by GreenHaven, LLC. GreenHaven, LLC is the sole member of the Managing Owner. The Fund and the Master Fund do not have an obligation to reimburse GreenHaven, LLC or its affiliates for organization and offering expenses paid on their behalf.
(c) Brokerage Commissions and Fees
The Managing Owner currently does not expect brokerage commissions and fees as well as routine operational, administrative and other ordinary expenses for which the Funds are responsible, including, but not limited to, the fees and expenses of the Trustee, legal and accounting fees and expenses, tax preparation expenses, filing fees, and printing, mailing and duplication costs, to exceed 0.20% of the net asset value of the Master Fund in any year, although the actual amount of such fees and expenses in any year may be greater. The Fund’s brokerage commissions and fees and routine operational, administrative and other ordinary expenses are accrued at a rate of 0.20% per annum in the aggregate. Of the amounts so accrued, the Master Fund first pays brokerage fees, and secondly from the remainder of the amounts so accrued, reimburses the Managing Owner for the Fund’s and Master Fund’s routine operational, administrative, and other ordinary expenses paid by the Managing Owner.
Brokerage commissions and fees are charged against the Master Fund’s Assets on a per transaction basis on the date of the transaction. The brokerage commissions and trading fees incurred for the years ended December 31, 2012, 2011 and 2010 were $377,195, $1,300,472 and $712,620, respectively. These fees were charged to the Fund and paid to the Commodity Broker. Brokerage commissions and trading fees are typically charged by the Commodity Broker to the Fund on a half-turn basis, i.e. half is charged when a contract is opened and half is charged when a position is closed.
(d) Unusual Fees and Expenses
The Master Fund will pay all the unusual fees and expenses, if any, of the Fund and the Master Fund. Such unusual fees and expenses, by their nature, are unpredictable in terms of timing and amount. There have been no unusual fees and expenses since the Fund commenced investment operations on January 23, 2008.
(e) Routine Operational, Administrative and Other Ordinary Expenses
During the continuous offering period the Managing Owner paid all of the routine operational, administrative and other ordinary expenses of the Index Fund and the Master Fund, including, but not limited to, accounting and computer services, the fees and expenses of the Trustee, legal fees and expenses, tax preparation expenses, filing fees, fees in connection with fund administration, and printing, mailing and duplication costs. The Managing Owner may be reimbursed for routine operational, administrative and other ordinary expenses. See Note 8 (c) for details of the Fund’s brokerage commissions and fees and routine operational, administrative and other ordinary expenses accrual policy.
(9) Termination
The term of the Fund is perpetual, unless terminated in certain circumstances as set forth below.
The Fund will dissolve at any time upon the happening of any of the following events:
| (i) | The filing of a certificate of dissolution or revocation of the Managing Owner’s charter (and the expiration of ninety (90) days after the date of notice to the Managing Owner of revocation without a reinstatement of its charter) or upon the withdrawal, removal, adjudication or admission of bankruptcy or insolvency of the Managing Owner, or an event of withdrawal unless (i) at the time there is at least one remaining Managing Owner and that remaining Managing Owner carries on the business of the Fund or (ii) within ninety (90) days of such event of withdrawal all the remaining Shareholders agree in writing to continue the business of the Fund and to select, effective as of the date of such event, one or more successor Managing Owners. If the Fund is terminated as the result of an event of withdrawal and a failure of all remaining Shareholders to continue the business of the Fund and to appoint a successor Managing Owner as provided above within one hundred and twenty (120) days of such event of withdrawal, Shareholders holding Shares representing at least seventy-five percent (75%) of the net asset value (not including Shares held by the Managing Owner and its affiliates) may elect to continue the business of the Fund by forming a new statutory trust, or reconstituted trust, on the same terms and provisions as set forth in the Trust Declaration. Any such election must also provide for the election of a Managing Owner to the reconstituted trust. If such an election is made, all Shareholders of the Fund shall be bound thereby and continue as Shareholders of the reconstituted trust. |
| (ii) | The occurrence of any event which would make unlawful the continued existence of the Fund. |
| (iii) | In the event of the suspension, revocation or termination of the Managing Owner’s registration as a commodity pool operator, or membership as a commodity pool operator with the NFA (if, in either case, such registration is required at such time unless at the time there is at least one remaining Managing Owner whose registration or membership has not been suspended, revoked or terminated). |
| (iv) | The Fund becomes insolvent or bankrupt. |
| (v) | The Shareholders holding Shares representing at least seventy-five percent (75%) of the Net Asset Value (which excludes the Shares of the Managing Owner) vote to dissolve the Fund, notice of which is sent to the Managing Owner not less than ninety (90) Business Days prior to the effective date of termination.
|
| (vi) | The determination of the Managing Owner that the aggregate net assets of the Fund in relation to the operating expenses of the Fund make it unreasonable or imprudent to continue the business of the Fund. |
| (vii) | The Fund becoming required to be registered as an investment company under the Investment Company Act of 1940. |
| (viii) | DTC is unable or unwilling to continue to perform its functions, and a comparable replacement is unavailable. |
(10) Profit and Loss Allocations and Distributions
The Managing Owner and the Shareholders share in any profits and losses of the Fund attributable to the Fund in proportion to the percentage interest owned by each. Distributions may be made at the sole discretion of the Managing Owner on a pro rata basis in accordance with the respective capital balances of the shareholders.
(11) Net Asset Value and Financial Highlights
The Fund is presenting the following net asset value and financial highlights related to investment performance and operations for a Share outstanding for the years ended December 31, 2012, 2011 and 2010. The net investment loss and total expense ratios have been annualized. The total return is based on the change in net asset value of the Shares during the period. An individual investor’s return and ratios may vary based on the timing of capital transactions.
| | | Year | | | Year | | | Year | |
| | | Ended | | | Ended | | | Ended | |
| | | December 31, 2012 | | | December 31, 2011 | | | December 31, 2010 | |
| | | | | | | | | | |
| Net Asset Value | | | | | | | | | |
| Net asset value per Limited Share, beginning of year | | $ | 29.96 | | | $ | 32.88 | | | $ | 26.22 | |
| | | | | | | | | | | | | |
| Net realized and change in unrealized gain (loss) from investments | | | (0.85 | ) | | | (2.59 | ) | | | 6.93 | |
| Net investment loss | | | (0.26 | ) | | | (0.33 | ) | | | (0.27 | ) |
| Net increase (decrease) in net assets from operations | | | (1.11 | ) | | | (2.92 | ) | | | 6.66 | |
| Net asset value per Limited Share, end of year | | $ | 28.85 | | | $ | 29.96 | | | $ | 32.88 | |
| | | | | | | | | | | | | |
| Market value per Limited Share, beginning of year | | $ | 29.96 | | | $ | 32.95 | | | $ | 26.32 | |
| Market value per Limited Share, end of year | | $ | 28.85 | | | $ | 29.96 | | | $ | 32.95 | |
| | | | | | | | | | | | | |
| Ratio to average net assets (i) | | | | | | | | | | | | |
| Net investment loss | | | (0.86 | )% | | | (0.99 | )% | | | (0.98 | )% |
| Total expenses | | | 0.92 | % | | | 1.04 | % | | | 1.09 | % |
| | | | | | | | | | | | | |
| Total Return, at net asset value (ii) | | | (3.70 | )% | | | (8.88 | )% | | | 25.40 | % |
| Total Return, at market value (ii) | | | (3.77 | )% | | | (9.07 | )% | | | 25.19 | % |
| | | | | | | | | | | | | |
| (i) Percentages are annualized. | | | | | | | | | | | | |
(ii) Percentages are not annualized. | | | | | | | | | | | | |
None.
Disclosure controls and procedures
ProceduresFor purposes of this Item 9A, references to the “Fund” and “our” include both the Fund and the Master Fund. Under the supervision and with the participation of the management of the Managing Owner, including its chief executive officer and principal financial officer, the Fund carried out an evaluation of the effectiveness of the design and operation of its disclosure controls and procedures (as defined in Rule 13a-15(f)) of the Securities Exchange Act of 1934). Based upon that evaluation, the chief executive officer and principal financial officer concluded that the Fund’s disclosure controls and procedures with respect to the Fund were effective as of the end of the period covered by this annual report.
Internal controlControl over financial reporting
Management’s Financial ReportingThe Managing Owner is responsible for establishing and maintaining adequate internal control over financial reporting. The Managing Owner’s internal control system is designed to provide reasonable assurance to the Fund’s management and its board of directors regarding the preparation and fair presentation of published financial statements. All internal control systems, no matter how well designed, have inherent limitations. Therefore, even those systems determined to be effective can provide only reasonable assurance with respect to financial statement preparation and presentation.
The Managing Owner assessed the effectiveness of the Fund’s internal control over financial reporting as of December 31, 2012.2015. In making this assessment, the Managing Owner used the criteria set forth in the 2013 Internal Controls – Integrated Framework by the Committee of Sponsoring Organizations of the Treadway Commission on Internal Control Integrated Framework.Commission. Based on ourtheir assessment, Management believes that, as of December 31, 2012,2015, its internal control over financial reporting is effective.
Grant Thornton LLP, the independent registered public accounting firm that audited the Fund’s consolidated financial statements included in this Annual Report, on Form 10-K, has issued an attestation reportreports on the Fund’s internal control over financial reporting, which appears on pages 76 and 77 ofaccompany this Annual Report on Form 10-K.
Report.Management evaluated whether there was a change in the Fund’s internal control over financial reporting during the three months ended December 31, 20122015 that has materially affected, or is reasonably likely to materially affect, the Fund’s internal control over financial reporting. Based on this evaluation, Management believes that there was no such change during the three months ended December 31, 2012.2015.
| Item 9B. | Other Information. |
Not applicable.
PART III
| Item 10. | Managers and Executive Officers of the Registrant. |
The Managing Owner and the Sub-Advisor; Management
WisdomTree Commodity Services, LLC is the Managing Owner of the Funds and as of January 1, 2016, GreenHaven Advisors LLC is the Sub-Advisor of the Funds. For the year ended December 31, 2015, the Managing Owner served as the commodity pool operator of, and commodity trading advisor to, the Funds. Effective January 1, 2016, the Managing Owner serves as the commodity pool operator of the Funds, and the Sub-Advisor serves as the commodity trading advisor to the Funds. The Funds have no officers or directors. Set forth below is a description of the officers and key decision-makers of the Managing Owner and the Sub-Advisor as of the date of this Annual Report. The Fund does not directly compensate any of the executive officers noted below.
Executive Officers of the Managing Owner
| Name | | Position |
| Gregory Barton | | President and Chief Executive Officer |
| Amit Muni | | Executive Vice President |
| David Castano | | Chief Financial Officer and Treasurer |
| Peter Ziemba | | Executive Vice President, Chief Legal Officer and Secretary |
The following is a biographical summary of the business experience of the executive officers of the Managing Owner as of the date of this Annual Report.
Gregory Barton - President and Chief Executive Officer. Mr. Barton has served as the Executive Vice President-Operations and Chief Operating Officer of WisdomTree Investments Inc. (“WTI”) since October 2012. From June 2009 to July 2012, Mr. Barton served as Executive Vice President Business and Legal Affairs, General Counsel and Secretary of TheStreet, Inc., a financial media company. Mr. Barton served as an Independent Trustee and Chairman of the Audit Committee of WisdomTree Trust from August 2008 to June 2009 and July 2012 to October 2012. From October 2007 to August 2008, Mr. Barton served as General Counsel and Secretary of Martha Stewart Living Omnimedia, Inc., a media and merchandising company. From October 2004 to October 2007, Mr. Barton served as Executive Vice President, Licensing and Legal Affairs, General Counsel and Secretary, and from November 2002 to October 2004, as Executive Vice President, General Counsel and Secretary, of Ziff Davis Media Inc., a technology media company. Preceding Ziff Davis, Mr. Barton served in a variety of positions at WTI (then known as Individual Investor Group, Inc.) from August 1998 to November 2002, including President, Chief Financial Officer and General Counsel. From September 1996 to August 1998, Mr. Barton served as Vice President, Corporate and Legal Affairs, and General Counsel, and from May 1995 to September 1996 as General Counsel, of Alliance Semiconductor Corporation, an integrated circuit company. Mr. Barton received a B.A. degree, summa cum laude, from Claremont McKenna College and a J.D. degree, magna cum laude, from Harvard Law School. Mr. Barton became a registered Associated Person and Principal of the Managing Owner on January 4, 2016. Mr. Barton is also a registered Associated Person and Principal of WisdomTree Coal Services, LLC, effective as of January 4, 2016, and a registered Associated Person and Principal of WisdomTree Asset Management, Inc., effective as of February 15, 2013 and December 13, 2012, respectively. Mr. Barton is 54 years old.
Amit Muni - Executive Vice President. Mr. Muni has served as WTI’s Executive Vice President-Finance and Chief Financial Officer since March 2008. From July 2003 to March 2008, Mr. Muni served as Controller and Chief Accounting Officer of International Securities Exchange Holdings, Inc., an electronic options exchange. From July 2000 to June 2003, Mr. Muni served as Vice President, Finance, of Instinet Group Incorporated, an electronic agency broker-dealer. From September 1996 to June 2000, Mr. Muni served as a Manager of the Financial Services Industry Practice of PricewaterhouseCoopers LLP, an accounting firm. From August 1991 to August 1996, Mr. Muni served as an accountant and senior auditor for National Securities Clearing Corporation, a firm that provides centralized clearing, information and settlement services to the financial industry. Mr. Muni received a B.B.A. in Accounting from Pace University and is a Certified Public Accountant. Mr. Muni is a Principal of WisdomTree Asset Management, Inc. effective as of December 28, 2012 and was registered as a Principal for both the Managing Owner and WisdomTree Coal Services, LLC as of January 2016. Mr. Muni is 46 years old.
David Castano – Chief Financial Officer and Treasurer. Mr. Castano has served as Director of Fund Accounting & Administration of WisdomTree Asset Management, Inc. since June 2011 and Treasurer/Principal Financial Officer of the WisdomTree Trust since January 2013. From December 2006 to June 2011, Mr. Castano served as an Assistant Vice President and Vice President of Legg Mason & Co., a global investment management firm. From May 2004 to December 2006, Mr. Castano served as an Assistant Treasurer at Lord Abbett mutual funds. From March 2003 to May 2004, Mr. Castano served as a Supervisor at UBS Global Asset Management, a privately owned investment manager. Mr. Castano received a BBA in Public Accounting from Pace University. Mr. Castano became a registered Principal of the Sponsor on March 8, 2016. Mr. Castano is also a registered Principal of WisdomTree Commodity Services, LLC, effective as of March 8, 2016. Mr. Castano is 44 years old.
Peter Ziemba – Executive Vice President, Chief Legal Officer and Secretary.Mr. Ziemba has served as WTI’s Executive Vice President—Business and Legal Affairs since January 2008 and Chief Legal Officer since March 2011. From April 2007 to March 2011, Mr. Ziemba served as WTI’s General Counsel. From September 1982 to April 2007, Mr. Ziemba was an attorney in the Corporate and Securities department of Graubard Miller. Mr. Ziemba received his B.A. in History with university honors from Binghamton University and his J.D., cum laude, from Benjamin N. Cardozo School of Law. Mr. Ziemba served as a director of WTI from 1996 to 2003. Mr. Ziemba is 58 years old.
Executive Officers and Significant Employees of the Sub-Advisor
| Name | | Position |
| Ashmead Pringle | | Chief Executive Officer |
| Cooper Anderson | | Chief Financial Officer |
| Scott Glasing | | Trader |
| Tom Fernandes | | Partner |
The following is a biographical summary of the business experience of the executive officers and significant employees of the Sub-Advisor as of the date of this Annual Report.
Ashmead Pringle – Chief Executive Officer. Mr. Pringle founded the Sub-Adviser and has served as its Chief Executive Officer in charge of managing its business since November 2015. He became a registered Associated Person and listed Principal of the Sub-Adviser in November 2015. Mr. Pringle also founded Grain Service Corporation (“GSC”), a commodity research and trading company, and has served as its President since October 1984. He became a registered Associated Person and listed Principal of GSC in June 1985. Mr. Pringle also founded the Managing Owner and served as its Chief Executive Officer in charge of managing its business from October 2006 to January 2016. He was a registered Associated Person and listed Principal of the Managing Owner from October 2006 to January 2016. Mr. Pringle also founded GreenHaven LLC, the former holding company of the Managing Owner, and managed its business operations from September 2006 to February 2011. Mr. Pringle was a registered Associated Person and listed Principal of GreenHaven LLC from September 2006 to February 2011. Mr. Pringle also founded the GreenHaven Coal Services, LLC (“GreenHaven Coal”), the Sponsor of the GreenHaven Coal Fund, and served as its President in charge of managing its business from August 2012 to January 2016. He was a registered Associated Person and listed Principal of GreenHaven Coal from August 2012 to January 2016. Mr. Pringle is 69 years old.
Cooper Anderson – Chief Financial Officer. Mr. Anderson is a trader for the Sub-Adviser and is responsible for daily futures trading, cash flow management, treasury portfolio management, and quantitative analysis for the Fund and the WisdomTree Coal Fund. He became a registered Associated Person and listed Principal of the Sub-Adviser in November 2015. From December of 2002 to March of 2006, Mr. Anderson worked as an analyst in Institutional Equity Sales and Trading for Credit Suisse Securities USA LLC, a securities broker dealer and investment bank based in Zurich, Switzerland. At Credit Suisse Securities USA LLC, Mr. Anderson served as a brokerage sales person covering the major financial institutions in the Southeastern United States and the Caribbean. Between March of 2006 and April of 2007, Mr. Anderson took time off from work. From May 2007 to February 2011, Mr. Anderson was a managing partner and registered Associated Person and listed Principal of GreenHaven LLC, the former holding company of the Managing Owner. From November 2009 to January 2016, Mr. Anderson was a trader and Chief Financial Officer, and registered Associated Person and listed Principal of the Managing Owner. From May 2012 to January 2016, Mr. Anderson was the Chief Financial Officer of GreenHaven Coal, the Sponsor of the GreenHaven Coal Fund, responsible for managing GreenHaven Coal and the GreenHaven Coal Fund’s finances and trading, and a registered Associated Person and listed Principal of the GreenHaven Coal. Mr. Anderson is 36 years old.
Scott Glasing – Trader. Mr. Glasing is a trader for the Sub-Adviser and is responsible for daily futures trading. He became a registered Associated Person and listed Principal of the Sub-Adviser in November 2015. Since February 1998, Mr. Glasing has worked for GSC as a trader. He became a registered Associated Person of GSC in April 1998 and a listed Principal of GSC in March 1998. From September 2006 to February 2011, Mr. Glasing was a trader and a registered Associated Person of GreenHaven LLC, the former holding company of the Managing Owner. From November 2006 to January 2016, Mr. Glasing was a trader and a registered Associated Person and listed Principal of the Managing Owner. From August 2012 to January 2016, Mr. Glasing was a trader and a registered Associated Person and listed Principal of GreenHaven Coal, the Sponsor of the GreenHaven Coal Fund. Mr. Glasing is 53 years old.
Tom Fernandes – Partner. Mr. Fernandes is a managing partner of the Sub-Advisor. He became a registered Associated Person and listed Principal of the Sub-Adviser in November 2015. From March 2000 to March 2002, Mr. Fernandes was employed as a trader at Fleet Bank of Boston. From March 2002 to April 2005, Mr. Fernandes worked as an analyst at West Broadway Partners, an investment partnership. From May 2005 to October 2006, Mr. Fernandes served as a commodity expert for GSC. He was registered as an Associated Person of GSC starting in August 2005. From October 2006 to August 2012, Mr. Fernandes served as Chief Financial Officer and a registered Associated Person of the Managing Owner, he was a registered Principal of the Managing Owner from October 2006 until August 2012. From August 2006 to February 2011, Mr. Fernandes was a managing partner and a registered Associated Person and listed Principal of GreenHaven LLC, the former holding company of the Managing Owner. From August 2012 to October 2014, Mr. Fernandes was Chief Operating Officer and a registered Associated Person and listed Principal of GreenHaven Coal, the Sponsor of the GreenHaven Coal Fund. Since August 2012, Mr. Fernandes has served as Chief Executive Officer of GSC Agribusiness, a livestock producer. Mr. Fernandes is 42 years old.
| Item 11. | Executive Compensation. |
The Fund has no employees, officers or directors and is managed by the Managing Owner. None of the directors or officers of the Managing Owner receive compensation from the Fund. The Managing Owner receives a monthly management fee of 1/12 of 0.85% (0.85% annually) of the average daily net assets of the Fund during the preceding month. During 2015, 2014 and 2013, the Fund incurred management fees of $2,121,828, $2,835,654 and $3,500,487, respectively.
| Item 12. | Security Ownership of Certain Beneficial Owners and Management and Related Stockholder Matters. |
The Fund has no officers or directors. The following table sets forth certain information regarding beneficial ownership of the Fund’s General Shares and Limited Shares as of December 31, 2015, by the Managing Owner. No person is known by us to own beneficially more than 5% of the outstanding shares of such class.
| Title of Class | | Name/Address of Beneficial Owner | | Amount/Nature of Beneficial Ownership |
| General Shares | | WisdomTree Commodity Services, LLC 245 Park Avenue, 35th Floor New York, New York 10167 | | 50 Shares |
| Item 13. | Certain Relationships and Related Transactions and Director Independence. |
The following table sets forth compensation earned from the Managing Owner during the year ended December 31, 2015, by the Directors of the Managing Owner.
| Name | | Fees
Earned
or
Paid in
Cash | | | Stock
Awards | | | Option
Awards | | | Non-Equity
Incentive Plan
Compensation | | | Change in
Pension
Value and
Nonqualified
Deferred
Compensation
Plan | | | All Other
Compensation | | | Total | |
| Independent Directors | | | | | | | | | | | | | | | | | | | | | | | | | | | | |
| Thomas Mangold | | $ | 21,000 | | | | NA | | | | NA | | | | NA | | | $ | 0 | | | $ | 0 | | | $ | 21,000 | |
| Stephen O’Grady | | $ | 15,000 | | | | NA | | | | NA | | | | NA | | | $ | 0 | | | $ | 0 | | | $ | 15,000 | |
| Cengiz Searfoss | | $ | 15,000 | | | | NA | | | | NA | | | | NA | | | $ | 0 | | | $ | 0 | | | $ | 15,000 | |
As of January 1, 2016, the Funds have no independent directors.
| Item 14. | Principal Accountant Fees and Services. |
Audit and Non-Audit Fees
The following table presents fees for professional audit services rendered by Grant Thornton LLP for the audit of the Fund’s annual financial statements for the years ended December 31, 2015 and December 31, 2014.
| | | 2015 | | | 2014 | |
| Audit fees | | $ | 199,066 | | | $ | 159,077 | |
| Audit-related fees | | | 0 | | | | 0 | |
| Tax fees | | | 0 | | | | 0 | |
| All other fees | | | 0 | | | | 0 | |
| Total | | $ | 199,066 | | | $ | 159,077 | |
Approval of Independent Registered Public Accounting Firm Services and Fees
The Audit Committee of the Managing Owner approved 100% of the services provided to the Fund described above. For the year ended December 31, 2015, the Audit Committee of the Managing Owner pre-approved all audit and allowed non-audit services of the Fund’s independent registered public accounting firms, including all engagement fees and terms.
PART IV
| Item 15. | Exhibits, Financial Statement Schedules. |
See Index to Financial Statements on Page F-1 for a list of the financial statements being filed as part of this Annual report. Schedules may have been omitted since they are either not required, not applicable, or the information has otherwise been included.
| Exhibit | | Description of Document |
| 3.1 | | Certificate of Amendment to Certificate of Trust of GreenHaven Continuous Commodity Index Fund(1) |
| 3.2 | | Certificate of Amendment to Certificate of Trust of GreenHaven Continuous Commodity Index Master Fund(2) |
| 3.3 | | Amended Declaration of Trust and Trust Agreement of GreenHaven Continuous Commodity Index Fund(3) |
| 3.4 | | Amendment to the Declaration of Trust and Trust Agreement of Greenhaven Continuous Commodity Index Fund (4) |
| 3.5 | | Amended Declaration of Trust and Trust Agreement of GreenHaven Continuous Commodity Index Master Fund(5) |
| 3.6 | | Amendment to the Declaration of Trust and Trust Agreement of Greenhaven Continuous Commodity Index Master Fund (6) |
| 10.1 | | Commodity Subadvisory Agreement(7) |
| 10.2 | | Master Custodian Agreement(8) |
| 10.3 | | Administration Agreement(9) |
| 10.4 | | Distribution Services Agreement(10) |
| 10.5 | | Transfer Agency and Services Agreement(11) |
| 10.6 | | Form of Participant Agreement(12) |
| 10.7 | | Amended and Restated License Agreement(13) |
| 23.1 | | Consent of Grant Thornton LLP(14) |
| 31.1 | | Certification by Principal Executive Officer Pursuant to Rule 13a-14(a) under the Securities Exchange Act of 1934, as amended(14) |
| 31.2 | | Certification by Principal Financial Officer Pursuant to Rule 13a-14(a) under the Securities Exchange Act of 1934, as amended(14) |
| 31.3 | | Certification by Principal Executive Officer Pursuant to Rule 13a-14(a) under the Securities Exchange Act of 1934, as amended(14) |
| 31.4 | | Certification by Principal Financial Officer Pursuant to Rule 13a-14(a) under the Securities Exchange Act of 1934, as amended(14) |
| 32.1 | | Certification by Principal Executive Officer Pursuant to 18 U.S.C. Section 1350, as Adopted Pursuant to Section 906 of the Sarbanes-Oxley Act of 2002(14) |
| 32.2 | | Certification by Principal Financial Officer Pursuant to 18 U.S.C. Section 1350, as Adopted Pursuant to Section 906 of the Sarbanes-Oxley Act of 2002(14) |
| 32.3 | | Certification by Principal Executive Officer Pursuant to 18 U.S.C. Section 1350, as Adopted Pursuant to Section 906 of the Sarbanes-Oxley Act of 2002(14) |
| 32.4 | | Certification by Principal Financial Officer Pursuant to 18 U.S.C. Section 1350, as Adopted Pursuant to Section 906 of the Sarbanes-Oxley Act of 2002(14) |
| (1) | Incorporated by reference to Exhibit 3.1 of the Fund’s Current Report on Form 8-K filed January 4, 2016. |
| (2) | Incorporated by reference to Exhibit 3.3 of the Fund’s Current Report on Form 8-K filed January 4, 2016. |
| (3) | Incorporated by reference to Exhibit A-2 of the Fund’s pre-effective Registration Statement on Form S-1 filed November 3, 2006. |
| (4) | Incorporated by reference to Exhibit 3.2 of the Fund’s Current Report on Form 8-K filed January 4, 2016. |
| (5) | Incorporated by reference to Exhibit A-1 of the Fund’s pre-effective Registration Statement on Form S-1 filed November 3, 2006. |
| (6) | Incorporated by reference to Exhibit 3.4 of the Fund’s Current Report on Form 8-K filed January 4, 2016. |
| (7) | Incorporated by reference to Exhibit 10.1 of the Fund’s Current Report on Form 8-K filed January 4, 2016. |
| (8) | Incorporated by reference to Exhibit 10.2 of the Fund’s Current Report on Form 8-K filed January 4, 2016. |
| (9) | Incorporated by reference to Exhibit 10.3 of the Fund’s Current Report on Form 8-K filed January 4, 2016. |
| (10) | Incorporated by reference to Exhibit 10.4 of the Fund’s Current Report on Form 8-K filed January 4, 2016. |
| (11) | Incorporated by reference to Exhibit 10.5 of the Fund’s Current Report on Form 8-K filed January 4, 2016. |
| (12) | Incorporated by reference to Exhibit 10.6 of the Fund’s Current Report on Form 8-K filed January 4, 2016. |
| (13) | Incorporated by reference to Exhibit 10.7 of the Fund’s Current Report on Form 8-K filed January 4, 2016. |
WisdomTree Continuous Commodity Index Fund
(f/k/a GreenHaven Continuous Commodity Index Fund)
WisdomTree Continuous Commodity Index Master Fund
(f/k/a GreenHaven Continuous Commodity Index Master Fund)
Index to Financial Statements
| | Page |
| | |
Report of Independent Registered Public Accounting Firm | | |
| (WisdomTree Continuous Commodity Index Fund) | | F-2 |
| | |
Report of Independent Registered Public Accounting Firm | | |
| (WisdomTree Continuous Commodity Index Master Fund) | | F-3 |
| | |
Report of Independent Registered Public Accounting Firm | | |
| (WisdomTree Continuous Commodity Index Fund) | | F-4 |
| | |
Report of Independent Registered Public Accounting Firm | | |
| (WisdomTree Continuous Commodity Index Master Fund) | | F-5 |
| | |
| WisdomTree Continuous Commodity Index Fund Financial Statements | | |
| | |
| Consolidated Statements of Financial Condition as of December 31, 2015 and 2014 | | F-6 |
| | |
| Consolidated Schedule of Investments as of December 31, 2015 | | F-7 |
| | |
| Consolidated Schedule of Investments as of December 31, 2014 | | F-8 |
| | |
| Consolidated Statements of Income and Expenses for the years ended December 31, 2015, 2014 and 2013 | | F-9 |
| | |
| Consolidated Statement of Changes in Shareholder’s Equity for the year ended December 31, 2015 | | F-10 |
| | |
| Consolidated Statement of Changes in Shareholder’s Equity for the year ended December 31, 2014 | | F-11 |
| | |
| Consolidated Statement of Changes in Shareholder’s Equity for the year ended December 31, 2013 | | F-12 |
| | |
| Consolidated Statements of Cash Flows for the years ended December 31, 2015, 2014 and 2013 | | F-13 |
| | |
| WisdomTree Continuous Commodity Index Master Fund Financial Statements | | |
| | |
| Statements of Financial Condition as of December 31, 2015 and 2014 | | F-14 |
| | |
| Schedule of Investments as of December 31, 2015 | | F-15 |
| | |
| Schedule of Investments as of December 31, 2014 | | F-16 |
| | |
| Statements of Income and Expenses for the years ended December 31, 2015, 2014, and 2013 | | F-17 |
| | |
| Statement of Changes in Shareholder’s Equity for the year ended December 31, 2015 | | F-18 |
| | |
| Statement of Changes in Shareholder’s Equity for the year ended December 31, 2014 | | F-19 |
| | |
| Statement of Changes in Shareholder’s Equity for the year ended December 31, 2013 | | F-20 |
| | |
| Statements of Cash Flows for the years ended December 31, 2015, 2014, and 2013 | | F-21 |
| | |
| Notes to the Consolidated Financial Statements | | F-22 |
On January 4, 2016, the name of the Fund was changed to WisdomTree Continuous Commodity Index Fund and the name of the Master Fund was changed to WisdomTree Continuous Commodity Index Master Fund
REPORT OF INDEPENDENT REGISTERED PUBLIC ACCOUNTING FIRM
Board of ManagersTo the Managing Owner and Shareholders of
WisdomTree Continuous Commodity Index Fund(f/k/a GreenHaven Continuous Commodity Index Fund:
Fund):We have audited the accompanying consolidated statements of financial condition, including the consolidated schedules of investments, of WisdomTree Continuous Commodity Index Fund (a Delaware Statutory Trust) and subsidiary as of December 31, 2015 and 2014, and the related consolidated statements of income and expenses, changes in shareholders’ equity, and cash flows for each of the three years in the period ended December 31, 2015. These financial statements are the responsibility of the WisdomTree Continuous Commodity Index Fund’s management. Our responsibility is to express an opinion on these financial statements based on our audits.
We conducted our audits in accordance with the standards of the Public Company Accounting Oversight Board (United States). Those standards require that we plan and perform the audit to obtain reasonable assurance about whether the financial statements are free of material misstatement. An audit includes examining, on a test basis, evidence supporting the amounts and disclosures in the financial statements. An audit also includes assessing the accounting principles used and significant estimates made by management, as well as evaluating the overall financial statement presentation. We believe that our audits provide a reasonable basis for our opinion.
In our opinion, the consolidated financial statements referred to above present fairly, in all material respects, the financial position of WisdomTree Continuous Commodity Index Fund and subsidiary as of December 31, 2015 and 2014, and the results of their operations and their cash flows for each of the three years in the period ended December 31, 2015 in conformity with accounting principles generally accepted in the United States of America.
We also have audited, in accordance with the standards of the Public Company Accounting Oversight Board (United States), the WisdomTree Continuous Commodity Index Fund’s internal control over financial reporting as of December 31, 2015, based on criteria established in the 2013Internal Control—Integrated Framework issued by the Committee of Sponsoring Organizations of the Treadway Commission (COSO), and our report dated March 15, 2016 expressed an unqualified opinion thereon.
/s/ GRANT THORNTON LLP
Atlanta, Georgia
March 15, 2016
REPORT OF INDEPENDENT REGISTERED PUBLIC ACCOUNTING FIRM
To the Managing Owner and Shareholders of
WisdomTree Continuous Commodity Index Master Fund
(f/k/a GreenHaven Continuous Commodity Index Master Fund):
We have audited the accompanying statements of financial condition, including the schedules of investments, of WisdomTree Continuous Commodity Index Master Fund (a Delaware Statutory Trust) as of December 31, 2015 and 2014, and the related statements of income and expenses, changes in shareholders’ equity, and cash flows for each of the three years in the period ended December 31, 2015. These financial statements are the responsibility of the WisdomTree Continuous Commodity Index Master Fund’s management. Our responsibility is to express an opinion on these financial statements based on our audits.
We conducted our audits in accordance with the standards of the Public Company Accounting Oversight Board (United States). Those standards require that we plan and perform the audit to obtain reasonable assurance about whether the financial statements are free of material misstatement. An audit includes examining, on a test basis, evidence supporting the amounts and disclosures in the financial statements. An audit also includes assessing the accounting principles used and significant estimates made by management, as well as evaluating the overall financial statement presentation. We believe that our audits provide a reasonable basis for our opinion.
In our opinion, the financial statements referred to above present fairly, in all material respects, the financial position of WisdomTree Continuous Commodity Index Master Fund as of December 31, 2015 and 2014, and the results of its operations and its cash flows for each of the three years in the period ended December 31, 2015 in conformity with accounting principles generally accepted in the United States of America.
We also have audited, in accordance with the standards of the Public Company Accounting Oversight Board (United States), the WisdomTree Continuous Commodity Index Master Fund’s internal control over financial reporting as of December 31, 2015, based on criteria established in the 2013Internal Control—Integrated Framework issued by the Committee of Sponsoring Organizations of the Treadway Commission (COSO), and our report dated March 15, 2016 expressed an unqualified opinion thereon.
/s/ GRANT THORNTON LLP
Atlanta, Georgia
March 15, 2016
REPORT OF INDEPENDENT REGISTERED PUBLIC ACCOUNTING FIRM
To the Managing Owner and Shareholders of
WisdomTree Continuous Commodity Index Fund
(f/k/a GreenHaven Continuous Commodity Index Fund):
We have audited the internal control over financial reporting of GreenHavenWisdomTree Continuous Commodity Index Fund (a Delaware Statutory Trust) and subsidiary as of December 31, 2012,2015, based on criteria established in the 2013Internal Control—Integrated Framework issued by the Committee of Sponsoring Organizations of the Treadway Commission (COSO). GreenHavenWisdomTree Continuous Commodity Index Fund’s management is responsible for maintaining effective internal control over financial reporting and for its assessment of the effectiveness of internal control over financial reporting, included in the accompanying Management’s Report on Internal Control Over Management’s Financial Reporting. Our responsibility is to express an opinion on the GreenHavenWisdomTree Continuous Commodity Index Fund’s internal control over financial reporting based on our audit.
We conducted our audit in accordance with the standards of the Public Company Accounting Oversight Board (United States). Those standards require that we plan and perform the audit to obtain reasonable assurance about whether effective internal control over financial reporting was maintained in all material respects. Our audit included obtaining an understanding of internal control over financial reporting, assessing the risk that a material weakness exists, testing and evaluating the design and operating effectiveness of internal control based on the assessed risk, and performing such other procedures as we considered necessary in the circumstances. We believe that our audit provides a reasonable basis for our opinion.
A company’s internal control over financial reporting is a process designed to provide reasonable assurance regarding the reliability of financial reporting and the preparation of financial statements for external purposes in accordance with generally accepted accounting principles. A company’s internal control over financial reporting includes those policies and procedures that (1) pertain to the maintenance of records that, in reasonable detail, accurately and fairly reflect the transactions and dispositions of the assets of the company; (2) provide reasonable assurance that transactions are recorded as necessary to permit preparation of financial statements in accordance with generally accepted accounting principles, and that receipts and expenditures of the company are being made only in accordance with authorizations of management and directors of the company; and (3) provide reasonable assurance regarding prevention or timely detection of unauthorized acquisition, use, or disposition of the company’s assets that could have a material effect on the financial statements.
Because of its inherent limitations, internal control over financial reporting may not prevent or detect misstatements. Also, projections of any evaluation of effectiveness to future periods are subject to the risk that controls may become inadequate because of changes in conditions, or that the degree of compliance with the policies or procedures may deteriorate.
In our opinion, GreenHavenWisdomTree Continuous Commodity Index Fund maintained, in all material respects, effective internal control over financial reporting as of December 31, 2012,2015, based on criteria established in the 2013Internal Control—Integrated Framework issued by COSO.
We also have audited, in accordance with the standards of the Public Company Accounting Oversight Board (United States), the consolidated financial statements of the GreenHavenWisdomTree Continuous Commodity Index Fund as of and for the year ended December 31, 2012,2015, and our report dated February 26, 2013March 15, 2016 expressed an unqualified opinion on those financial statements.
/s/ Grant ThorntonGRANT THORNTON LLP
February 26, 2013
GAMarch 15, 2016
REPORT OF INDEPENDENT REGISTERED PUBLIC ACCOUNTING FIRM
Board of ManagersTo the Managing Owner and Shareholders of
WisdomTree Continuous Commodity Index Master Fund(f/k/a GreenHaven Continuous Commodity Index Master Fund:
Fund):We have audited the internal control over financial reporting of GreenHavenWisdomTree Continuous Commodity Index Master Fund (a Delaware Statutory Trust) as of December 31, 2012,2015, based on criteria established in the 2013Internal Control—Integrated Framework issued by the Committee of Sponsoring Organizations of the Treadway Commission (COSO). GreenHavenWisdomTree Continuous Commodity Index Master Fund’s management is responsible for maintaining effective internal control over financial reporting and for its assessment of the effectiveness of internal control over financial reporting, included in the accompanying Management’s Report on Internal Control Over Management’s Financial Reporting. Our responsibility is to express an opinion on the GreenHavenWisdomTree Continuous Commodity Index Master Fund’s internal control over financial reporting based on our audit.
We conducted our audit in accordance with the standards of the Public Company Accounting Oversight Board (United States). Those standards require that we plan and perform the audit to obtain reasonable assurance about whether effective internal control over financial reporting was maintained in all material respects. Our audit included obtaining an understanding of internal control over financial reporting, assessing the risk that a material weakness exists, testing and evaluating the design and operating effectiveness of internal control based on the assessed risk, and performing such other procedures as we considered necessary in the circumstances. We believe that our audit provides a reasonable basis for our opinion.
A company’s internal control over financial reporting is a process designed to provide reasonable assurance regarding the reliability of financial reporting and the preparation of financial statements for external purposes in accordance with generally accepted accounting principles. A company’s internal control over financial reporting includes those policies and procedures that (1) pertain to the maintenance of records that, in reasonable detail, accurately and fairly reflect the transactions and dispositions of the assets of the company; (2) provide reasonable assurance that transactions are recorded as necessary to permit preparation of financial statements in accordance with generally accepted accounting principles, and that receipts and expenditures of the company are being made only in accordance with authorizations of management and directors of the company; and (3) provide reasonable assurance regarding prevention or timely detection of unauthorized acquisition, use, or disposition of the company’s assets that could have a material effect on the financial statements.
Because of its inherent limitations, internal control over financial reporting may not prevent or detect misstatements. Also, projections of any evaluation of effectiveness to future periods are subject to the risk that controls may become inadequate because of changes in conditions, or that the degree of compliance with the policies or procedures may deteriorate.
In our opinion, GreenHavenWisdomTree Continuous Commodity Index Master Fund maintained, in all material respects, effective internal control over financial reporting as of December 31, 2012,2015, based on criteria established in the 2013Internal Control—Integrated Framework issued by COSO.
We also have audited, in accordance with the standards of the Public Company Accounting Oversight Board (United States), the financial statements of the GreenHavenWisdomTree Continuous Commodity Index Master Fund as of and for the year ended December 31, 2012,2015, and our report dated February 26, 2013March 15, 2016 expressed an unqualified opinion on those financial statements.
/s/ Grant ThorntonGRANT THORNTON LLP
February 26, 2013
None.
The Fund has no directors or executive officers and also does not have any employees. It is managed by the Managing Owner.
The current board of directors and executive officers of the Managing Owner are as follows:
Name | | | Age | | Position | |
Ashmead Pringle | | 66 | | Chief Executive Officer and Member of the Board of Directors |
Cooper Anderson | | 33 | | Chief Financial Officer and Member of the Board of Directors |
TJ Mangold | | 61 | | Independent Director, Audit Committee Member |
Steve O'Grady | | 65 | | Independent Director, Audit Committee Member |
Cengiz Searfoss | | 43 | | Independent Director, Audit Committee Member |
Mr. Ashmead Pringle and Mr. Cooper Anderson serve as executive officers of the Managing Owner. Mr. TJ Mangold is the Audit Committee Chair. The Fund has no executive officers. Its affairs are managed by the Managing Owner. The following individuals serve as Management & Directors of the Managing Owner.
Principals and Key Employees. Ashmead Pringle and Cooper Anderson serve as the chief decision makers of the Managing Owner.
Ashmead Pringle, 66, Chief Executive Officer
Mr. Pringle founded the Managing Owner and has served as the President since October of 2006. Since 1984, Mr. Pringle founded and has acted as the President of Grain Service Corporation (GSC), a commodity research and trading company. Mr. Pringle has conducted hundreds of seminars on hedging, risk management, and basis trading in energy and agriculture, and is a recognized expert in commodity risk management. Mr. Pringle became a registered Associated Person and listed Principal of the Managing Owner on NovemberGAMarch 15, 2006. He became 2016
WisdomTree Continuous Commodity Index Fund
(f/k/a listed Principal of GreenHaven, LLC on November 15, 2006 and a registered Associated Person of GreenHaven, LLC on September 18, 2006. GreenHaven LLC is a Georgia LLC, which focuses on the development of private and public commodity investments. He became a listed Principal of Grain Service Corporation, Inc. on June 12, 1985 and a registered Associated Person of Grain Service Corporation, Inc. on October 31, 1985.
Cooper Anderson, 33, Chief Financial Officer and Manager of Operations
Mr. Anderson is the Manager of Operations for the Managing Owner and is responsible for daily futures trading, cash flow management, treasury portfolio management, and quantitative analysis for the GreenHaven Continuous Commodity Index
Fund. PriorFund)Consolidated Statements of Financial Condition
December 31, 2015 and 2014
| | | December 31,
2015 | | | December 31, 2014 | |
| Assets | | | | | | | | |
| Equity in broker trading accounts: | | | | | | | | |
| Short-term investments (cost $149,963,671 and $199,994,069 as of 2015 and 2014, respectively) | | $ | 149,980,000 | | | $ | 199,995,250 | |
| Cash held by broker | | | 83,440,007 | | | | 94,433,074 | |
| Net unrealized depreciation on futures contracts | | | (8,705,967 | ) | | | (27,249,076 | ) |
| Total assets | | $ | 224,714,040 | | | $ | 267,179,248 | |
| | | | | | | | | |
| Liabilities and shareholders’ equity | | | | | | | | |
| Management fee payable to related party | | | 166,759 | | | | 205,492 | |
| Accrued brokerage fees and expenses payable | | | 28,756 | | | | 75,622 | |
| Total liabilities | | | 195,515 | | | | 281,114 | |
| | | | | | | | | |
| Shareholders’ equity | | | | | | | | |
| General Units: | | | | | | | | |
| Paid in capital - 50 units issued | | | 1,500 | | | | 1,500 | |
| Accumulated deficit | | | (572 | ) | | | (360 | ) |
| Total General Units | | | 928 | | | | 1,140 | |
| Limited Units: | | | | | | | | |
| Paid in capital - 12,100,000 and 11,700,000 redeemable shares issued and outstanding as of 2015 and 2014, respectively | | | 360,079,849 | | | | 350,523,308 | |
| Accumulated deficit | | | (135,562,252 | ) | | | (83,626,314 | ) |
| | | | | | | | | |
| Total Limited Units | | | 224,517,597 | | | | 266,896,994 | |
| | | | | | | | | |
| Total shareholders’ equity | | | 224,518,525 | | | | 266,898,134 | |
| Total liabilities and shareholders’ equity | | $ | 224,714,040 | | | $ | 267,179,248 | |
| | | | | | | | | |
| Net asset value per share | | | | | | | | |
| | | | | | | | | |
| General Units | | $ | 18.56 | | | $ | 22.80 | |
| | | | | | | | | |
| Limited Units | | $ | 18.56 | | | $ | 22.81 | |
See accompanying notes to joiningconsolidated financial statements
WisdomTree Continuous Commodity Index Fund
(f/k/a GreenHaven LLC,Continuous Commodity Index Fund)
Consolidated Schedule of Investments
December 31, 2015
| Description | | Percentage
of Net Assets | | | Fair
Value | | | Face
Value | |
| U.S. Treasury Obligations | | | | | | | | | | | | |
| U.S. Treasury Bills, 0.17% due January 28, 2016 | | | 22.27 | % | | $ | 49,995,900 | | | $ | 50,000,000 | |
| U.S. Treasury Bills, 0.14% due February 11, 2016 | | | 22.27 | | | | 49,993,400 | | | | 50,000,000 | |
| U.S. Treasury Bills, 0.28% due March 17, 2016 | | | 22.26 | | | | 49,990,700 | | | | 50,000,000 | |
| Total U.S. Treasury Obligations (cost $149,963,671) | | | 66.80 | % | | $ | 149,980,000 | | | $ | 150,000,000 | |
| Description | | Percentage
of Net Assets | | | Fair
Value | | | Notional
Value | |
| Unrealized Appreciation/(Depreciation) on Futures Contracts | | | | | | | | | | | | |
| Cocoa (138 contracts, settlement date July 14, 2016) | | | (0.05 | )% | | $ | (119,940 | ) | | $ | 4,420,140 | |
| Cocoa (137 contracts, settlement date May 13, 2016) | | | 0.05 | | | | 113,380 | | | | 4,393,590 | |
| Cocoa (137 contracts, settlement date March 15, 2016) | | | 0.05 | | | | 119,700 | | | | 4,399,070 | |
| Coffee (91 contracts, settlement date July 19, 2016) | | | 0.12 | | | | 267,150 | | | | 4,461,844 | |
| Coffee (91 contracts, settlement date May 18, 2016) | | | (0.04 | ) | | | (96,862 | ) | | | 4,395,300 | |
| Coffee (91 contracts, settlement date March 18, 2016) | | | (0.05 | ) | | | (118,144 | ) | | | 4,323,638 | |
| Copper (82 contracts, settlement date July 27, 2016) | | | (0.04 | ) | | | (81,925 | ) | | | 4,400,325 | |
| Copper (82 contracts, settlement date May 26, 2016) | | | (0.15 | ) | | | (338,513 | ) | | | 4,390,075 | |
| Copper (82 contracts, settlement date March 29, 2016) | | | (0.14 | ) | | | (309,850 | ) | | | 4,376,750 | |
| Corn (241 contracts, settlement date July 14, 2016) | | | (0.05 | ) | | | (114,900 | ) | | | 4,464,525 | |
| Corn (242 contracts, settlement date May 13, 2016) | | | (0.14 | ) | | | (315,375 | ) | | | 4,410,450 | |
| Corn (242 contracts, settlement date March 14, 2016) | | | (0.13 | ) | | | (301,212 | ) | | | 4,340,875 | |
| Cotton (137 contracts, settlement date July 07, 2016) | | | 0.04 | | | | 97,490 | | | | 4,438,115 | |
| Cotton (137 contracts, settlement date May 06, 2016) | | | (0.01 | ) | | | (12,455 | ) | | | 4,391,535 | |
| Cotton (138 contracts, settlement date March 08, 2016) | | | (0.02 | ) | | | (35,815 | ) | | | 4,366,320 | |
| Gold (41 contracts, settlement date June 28, 2016) | | | (0.05 | ) | | | (104,370 | ) | | | 4,352,150 | |
| Gold (41 contracts, settlement date April 27, 2016) | | | (0.09 | ) | | | (211,170 | ) | | | 4,349,280 | |
| Gold (42 contracts, settlement date February 25, 2016) | | | (0.18 | ) | | | (401,480 | ) | | | 4,452,840 | |
| Lean Hogs (117 contracts, settlement date July 15, 2016) | | | 0.08 | | | | 185,740 | | | | 3,643,380 | |
| Lean Hogs (117 contracts, settlement date June 14, 2016) | | | 0.10 | | | | 220,880 | | | | 3,650,400 | |
| Lean Hogs (117 contracts, settlement date April 14, 2016) | | | (0.07 | ) | | | (148,820 | ) | | | 3,086,460 | |
| Lean Hogs (117 contracts, settlement date February 12, 2016) | | | (0.11 | ) | | | (239,750 | ) | | | 2,798,640 | |
| Live Cattle (82 contracts, settlement date June 30, 2016) | | | 0.06 | | | | 132,670 | | | | 4,191,840 | |
| Live Cattle (82 contracts, settlement date April 29, 2016) | | | (0.04 | ) | | | (86,140 | ) | | | 4,525,580 | |
| Live Cattle (82 contracts, settlement date February 29, 2016) | | | (0.09 | ) | | | (204,150 | ) | | | 4,487,040 | |
| Natural Gas (110 contracts, settlement date May 26, 2016) | | | (0.02 | ) | | | (46,190 | ) | | | 2,714,800 | |
| Natural Gas (110 contracts, settlement date April 27, 2016) | | | (0.02 | ) | | | (39,980 | ) | | | 2,666,400 | |
| Natural Gas (110 contracts, settlement date March 29, 2016) | | | (0.11 | ) | | | (238,510 | ) | | | 2,625,700 | |
| Natural Gas (110 contracts, settlement date February 25, 2016) | | | (0.14 | ) | | | (318,070 | ) | | | 2,599,300 | |
| Natural Gas (111 contracts, settlement date January 27, 2016) | | | (0.18 | ) | | | (395,510 | ) | | | 2,594,070 | |
| NY Harbor ULSD (53 contracts, settlement date May 31, 2016) | | | (0.24 | ) | | | (551,179 | ) | | | 2,705,480 | |
| NY Harbor ULSD (53 contracts, settlement date April 29, 2016) | | | (0.25 | ) | | | (556,471 | ) | | | 2,649,163 | |
| NY Harbor ULSD (54 contracts, settlement date March 31, 2016) | | | (0.32 | ) | | | (719,783 | ) | | | 2,647,436 | |
| NY Harbor ULSD (54 contracts, settlement date February 29, 2016) | | | (0.35 | ) | | | (789,184 | ) | | | 2,605,705 | |
| NY Harbor ULSD (54 contracts, settlement date January 29, 2016) | | | (0.38 | ) | | | (848,266 | ) | | | 2,549,005 | |
| Platinum (148 contracts, settlement date July 27, 2016) | | | 0.06 | | | | 126,785 | | | | 6,615,600 | |
| Platinum (147 contracts, settlement date April 27, 2016) | | | (0.11 | ) | | | (254,960 | ) | | | 6,565,020 | |
| Silver (63 contracts, settlement date July 27, 2016) | | | (0.07 | ) | | | (151,495 | ) | | | 4,368,105 | |
| Silver (64 contracts, settlement date May 26, 2016) | | | (0.17 | ) | | | (374,635 | ) | | | 4,426,880 | |
| Silver (64 contracts, settlement date March 29, 2016) | | | (0.18 | ) | | | (414,395 | ) | | | 4,416,960 | |
| Soybean (101 contracts, settlement date July 14, 2016) | | | 0.01 | | | | 24,500 | | | | 4,427,587 | |
| Soybean (101 contracts, settlement date May 13, 2016) | | | (0.10 | ) | | | (221,537 | ) | | | 4,390,975 | |
| Soybean (101 contracts, settlement date March 14, 2016) | | | (0.10 | ) | | | (231,875 | ) | | | 4,364,463 | |
| Soybean Oil (237 contracts, settlement date July 14, 2016) | | | 0.18 | | | | 391,830 | | | | 4,433,796 | |
| Soybean Oil (237 contracts, settlement date May 13, 2016) | | | 0.13 | | | | 288,294 | | | | 4,402,512 | |
| Soybean Oil (237 contracts, settlement date March 14, 2016) | | | 0.12 | | | | 277,464 | | | | 4,372,650 | |
| Sugar (264 contracts, settlement date June 30, 2016) | | | 0.06 | | | | 126,717 | | | | 4,328,755 | |
| Sugar (264 contracts, settlement date April 29, 2016) | | | 0.26 | | | | 591,270 | | | | 4,411,546 | |
| Sugar (263 contracts, settlement date February 29, 2016) | | | 0.27 | | | | 600,074 | | | | 4,489,094 | |
| Wheat (184 contracts, settlement date July 14, 2016) | | | (0.07 | ) | | | (160,687 | ) | | | 4,445,900 | |
| Wheat (185 contracts, settlement date May 13, 2016) | | | (0.13 | ) | | | (298,525 | ) | | | 4,407,625 | |
| Wheat (185 contracts, settlement date March 14, 2016) | | | (0.14 | ) | | | (314,138 | ) | | | 4,347,500 | |
| WTI Crude (67 contracts, settlement date May 20, 2016) | | | (0.15 | ) | | | (329,010 | ) | | | 2,727,570 | |
| WTI Crude (67 contracts, settlement date April 20, 2016) | | | (0.15 | ) | | | (334,250 | ) | | | 2,678,660 | |
| WTI Crude (68 contracts, settlement date March 21, 2016) | | | (0.20 | ) | | | (445,480 | ) | | | 2,660,840 | |
| WTI Crude (68 contracts, settlement date February 22, 2016) | | | (0.22 | ) | | | (492,250 | ) | | | 2,595,560 | |
| WTI Crude (68 contracts, settlement date January 20, 2016) | | | (0.22 | ) | | | (502,660 | ) | | | 2,518,720 | |
| Net Unrealized Depreciation on Futures Contracts | | | (3.88 | )% | | $ | (8,705,967 | ) | | $ | 224,263,539 | |
See accompanying notes to consolidated financial statements
WisdomTree Continuous Commodity Index Fund
(f/k/a GreenHaven Continuous Commodity Index Fund)
Consolidated Schedule of Investments
December 31, 2014
| | | Percentage | | | Fair | | | Face | |
| Description | | of Net Assets | | | Value | | | Value | |
| U.S. Treasury Obligations | | | | | | | | | | | | |
| U.S. Treasury Bills, 0.01% due January 22, 2015 | | | 37.47 | % | | $ | 99,998,600 | | | $ | 100,000,000 | |
| U.S. Treasury Bills, 0.03% due March 12, 2015 | | | 18.73 | | | | 49,998,100 | | | | 50,000,000 | |
| U.S. Treasury Bills, 0.06% due March 26, 2015 | | | 18.73 | | | | 49,998,550 | | | | 50,000,000 | |
| Total U.S. Treasury Obligations (cost $199,994,069) | | | 74.93 | % | | $ | 199,995,250 | | | $ | 200,000,000 | |
| | | Percentage | | | Fair | | | Notional | |
| Description | | of Net Assets | | | Value | | | Value | |
| Unrealized Appreciation/(Depreciation) on Futures Contracts | | | | | | | | | | | | |
| Cocoa (181 contracts, settlement date July 16, 2015) | | | 0.03 | % | | $ | 83,950 | | | $ | 5,229,090 | |
| Cocoa (181 contracts, settlement date May 13, 2015) | | | (0.13 | ) | | | (334,480 | ) | | | 5,234,520 | |
| Cocoa (181 contracts, settlement date March 16, 2015) | | | (0.12 | ) | | | (316,920 | ) | | | 5,267,100 | |
| Coffee (82 contracts, settlement date July 21, 2015) | | | (0.25 | ) | | | (671,513 | ) | | | 5,285,925 | |
| Coffee (82 contracts, settlement date May 18, 2015) | | | (0.27 | ) | | | (719,438 | ) | | | 5,205,975 | |
| Coffee (83 contracts, settlement date March 19, 2015) | | | (0.28 | ) | | | (747,038 | ) | | | 5,185,425 | |
| Copper (74 contracts, settlement date July 29, 2015) | | | (0.12 | ) | | | (320,262 | ) | | | 5,227,175 | |
| Copper (74 contracts, settlement date May 27, 2015) | | | (0.22 | ) | | | (584,150 | ) | | | 5,223,475 | |
| Copper (74 contracts, settlement date March 27, 2015) | | | (0.21 | ) | | | (559,600 | ) | | | 5,227,175 | |
| Corn (258 contracts, settlement date July 14, 2015) | | | 0.04 | | | | 101,863 | | | | 5,321,250 | |
| Corn (258 contracts, settlement date May 14, 2015) | | | 0.09 | | | | 250,975 | | | | 5,234,175 | |
| Corn (259 contracts, settlement date March 13, 2015) | | | 0.09 | | | | 242,600 | | | | 5,141,150 | |
| Cotton (171 contracts, settlement date July 09, 2015) | | | 0.00 | * | | | 5,610 | | | | 5,301,000 | |
| Cotton (171 contracts, settlement date May 06, 2015) | | | (0.12 | ) | | | (316,150 | ) | | | 5,221,485 | |
| Cotton (171 contracts, settlement date March 09, 2015) | | | (0.27 | ) | | | (716,905 | ) | | | 5,153,085 | |
| Gold (44 contracts, settlement date June 26, 2015) | | | 0.03 | | | | 88,470 | | | | 5,215,760 | |
| Gold (44 contracts, settlement date April 28, 2015) | | | (0.17 | ) | | | (446,860 | ) | | | 5,213,560 | |
| Gold (44 contracts, settlement date February 25, 2015) | | | (0.13 | ) | | | (335,420 | ) | | | 5,210,040 | |
| Lean Hogs (113 contracts, settlement date July 15, 2015) | | | (0.07 | ) | | | (176,480 | ) | | | 4,098,510 | |
| Lean Hogs (113 contracts, settlement date June 12, 2015) | | | (0.07 | ) | | | (188,950 | ) | | | 4,138,060 | |
| Lean Hogs (113 contracts, settlement date April 15, 2015) | | | (0.07 | ) | | | (197,270 | ) | | | 3,764,030 | |
| Lean Hogs (113 contracts, settlement date February 13, 2015) | | | (0.12 | ) | | | (315,750 | ) | | | 3,670,240 | |
| Light, Sweet Crude Oil (57 contracts, settlement date May 19, 2015) | | | (0.33 | ) | | | (893,390 | ) | | | 3,172,050 | |
| Light, Sweet Crude Oil (58 contracts, settlement date April 21, 2015) | | | (0.38 | ) | | | (1,019,440 | ) | | | 3,187,680 | |
| Light, Sweet Crude Oil (58 contracts, settlement date March 20, 2015) | | | (0.57 | ) | | | (1,532,690 | ) | | | 3,147,080 | |
| Light, Sweet Crude Oil (58 contracts, settlement date February 20, 2015) | | | (0.58 | ) | | | (1,560,200 | ) | | | 3,114,600 | |
| Light, Sweet Crude Oil (58 contracts, settlement date January 20, 2015) | | | (0.58 | ) | | | (1,550,530 | ) | | | 3,089,660 | |
| Live Cattle (82 contracts, settlement date June 30, 2015) | | | (0.04 | ) | | | (114,190 | ) | | | 5,080,720 | |
| Live Cattle (81 contracts, settlement date April 30, 2015) | | | 0.08 | | | | 218,730 | | | | 5,261,760 | |
| Live Cattle (81 contracts, settlement date February 27, 2015) | | | 0.09 | | | | 242,130 | | | | 5,299,020 | |
| Natural Gas (108 contracts, settlement date May 27, 2015) | | | (0.25 | ) | | | (668,300 | ) | | | 3,189,240 | |
| Natural Gas (108 contracts, settlement date April 28, 2015) | | | (0.26 | ) | | | (694,840 | ) | | | 3,136,320 | |
| Natural Gas (108 contracts, settlement date March 27, 2015) | | | (0.29 | ) | | | (786,680 | ) | | | 3,111,480 | |
| Natural Gas (108 contracts, settlement date February 25, 2015) | | | (0.37 | ) | | | (1,000,490 | ) | | | 3,127,680 | |
| Natural Gas (108 contracts, settlement date January 28, 2015) | | | (0.40 | ) | | | (1,071,100 | ) | | | 3,120,120 | |
| NY Harbor ULSD (42 contracts, settlement date May 29, 2015) | | | (0.33 | ) | | | (873,041 | ) | | | 3,200,602 | |
| NY Harbor ULSD (41 contracts, settlement date April 30, 2015) | | | (0.32 | ) | | | (861,353 | ) | | | 3,105,627 | |
| NY Harbor ULSD (41 contracts, settlement date March 31, 2015) | | | (0.50 | ) | | | (1,337,461 | ) | | | 3,104,594 | |
| NY Harbor ULSD (41 contracts, settlement date February 27, 2015) | | | (0.53 | ) | | | (1,409,974 | ) | | | 3,129,218 | |
| NY Harbor ULSD (41 contracts, settlement date January 30, 2015) | | | (0.50 | ) | | | (1,333,559 | ) | | | 3,157,459 | |
| Platinum (130 contracts, settlement date July 29, 2015) | | | 0.01 | | | | 33,995 | | | | 7,871,500 | |
| Platinum (129 contracts, settlement date April 28, 2015) | | | 0.01 | | | | 20,485 | | | | 7,801,275 | |
| Silver (66 contracts, settlement date July 29, 2015) | | | (0.02 | ) | | | (47,050 | ) | | | 5,168,460 | |
| Silver (67 contracts, settlement date May 27, 2015) | | | (0.35 | ) | | | (940,295 | ) | | | 5,236,720 | |
| Silver (67 contracts, settlement date March 27, 2015) | | | (0.34 | ) | | | (913,105 | ) | | | 5,225,665 | |
| Soybean (101 contracts, settlement date July 14, 2015) | | | (0.03 | ) | | | (92,050 | ) | | | 5,236,850 | |
| Soybean (101 contracts, settlement date May 14, 2015) | | | (0.07 | ) | | | (199,812 | ) | | | 5,204,025 | |
| Soybean (102 contracts, settlement date March 13, 2015) | | | (0.06 | ) | | | (163,712 | ) | | | 5,219,850 | |
| Soybean Oil (269 contracts, settlement date July 14, 2015) | | | (0.04 | ) | | | (102,582 | ) | | | 5,253,570 | |
| Soybean Oil (269 contracts, settlement date May 14, 2015) | | | (0.13 | ) | | | (336,222 | ) | | | 5,221,290 | |
| Soybean Oil (270 contracts, settlement date March 13, 2015) | | | (0.13 | ) | | | (337,578 | ) | | | 5,206,680 | |
| Sugar (314 contracts, settlement date June 30, 2015) | | | (0.17 | ) | | | (441,795 | ) | | | 5,363,120 | |
| Sugar (315 contracts, settlement date April 30, 2015) | | | (0.31 | ) | | | (834,389 | ) | | | 5,263,776 | |
| Sugar (315 contracts, settlement date February 27, 2015) | | | (0.39 | ) | | | (1,039,808 | ) | | | 5,122,656 | |
| Wheat (176 contracts, settlement date July 14, 2015) | | | 0.12 | | | | 314,688 | | | | 5,258,000 | |
| Wheat (176 contracts, settlement date May 14, 2015) | | | 0.04 | | | | 106,325 | | | | 5,231,600 | |
| Wheat (176 contracts, settlement date March 13, 2015) | | | 0.05 | | | | 143,925 | | | | 5,189,800 | |
| Net Unrealized Depreciation on Futures Contracts | | | (10.21 | )% | | $ | (27,249,076 | ) | | $ | 266,577,952 | |
| * | Denotes greater than 0.000% yet less than 0.005% |
See accompanying notes to consolidated financial statements
WisdomTree Continuous Commodity Index Fund
(f/k/a GreenHaven Continuous Commodity Index Fund)
Consolidated Statements of Income and Expenses
For the Years Ended December 31, 2015, 2014 and 2013
| | | 2015 | | | 2014 | | | 2013 | |
| Income | | | | | | | | | | | | |
| Interest Income | | $ | 45,979 | | | $ | 44,304 | | | $ | 189,643 | |
| | | | | | | | | | | | | |
| Expenses | | | | | | | | | | | | |
| Management fee to related party | | | 2,121,828 | | | | 2,835,654 | | | | 3,500,487 | |
| Brokerage fees and expenses | | | 499,254 | | | | 667,213 | | | | 823,644 | |
| Total expenses | | | 2,621,082 | | | | 3,502,867 | | | | 4,324,131 | |
| Net Investment Loss | | | (2,575,103 | ) | | | (3,458,563 | ) | | | (4,134,488 | ) |
| | | | | | | | | | | | | |
| Realized and Net Change in Unrealized Gain (Loss) on Investments and Futures Contracts | | | | | | | | | | | | |
| Realized Gain (Loss) on | | | | | | | | | | | | |
| Investments | | | 3,500 | | | | — | | | | (10,376 | ) |
| Futures Contracts | | | (67,922,804 | ) | | | (12,125,640 | ) | | | (53,539,832 | ) |
| Net Realized Loss | | | (67,919,304 | ) | | | (12,125,640 | ) | | | (53,550,208 | ) |
| Net Change in Unrealized Gain (Loss) on | | | | | | | | | | | | |
| Investments | | | 15,148 | | | | (1,254 | ) | | | (13,546 | ) |
| Futures Contracts | | | 18,543,109 | | | | (23,193,888 | ) | | | 8,459,270 | |
| Net Change in Unrealized Gain (Loss) | | | 18,558,257 | | | | (23,195,142 | ) | | | 8,445,724 | |
| Net Realized and Unrealized Loss on Investments and Futures Contracts | | | (49,361,047 | ) | | | (35,320,782 | ) | | | (45,104,484 | ) |
| | | | | | | | | | | | | |
| Net Loss | | $ | (51,936,150 | ) | | $ | (38,779,345 | ) | | $ | (49,238,972 | ) |
See accompanying notes to consolidated financial statements
WisdomTree Continuous Commodity Index Fund
(f/k/a GreenHaven Continuous Commodity Index Fund)
Consolidated Statement of Changes in AprilShareholders’ Equity
For the Year Ended December 31, 2015
| | | General Units | | | Limited Units | | | Total | |
| | | | | | | | | | | | Total | | | | | | | | | | | | Total | | | | |
| | | | | | | | | | | | General | | | | | | | | | | | | Limited | | | Total | |
| | | General Units | | | Accumulated | | | Shareholders’ | | | Limited Units | | | Accumulated | | | Shareholders’ | | | Shareholders’ | |
| | | Units | | | Amount | | | Deficit | | | Equity | | | Units | | | Amount | | | Deficit | | | Equity | | | Equity | |
| | | | | | | | | | | | | | | | | | | | | | | | | | | | |
| Balance at January 01, 2015 | | | 50 | | | $ | 1,500 | | | $ | (360 | ) | | $ | 1,140 | | | | 11,700,000 | | | $ | 350,523,308 | | | $ | (83,626,314 | ) | | $ | 266,896,994 | | | $ | 266,898,134 | |
| Creation of Limited Units | | | — | | | | — | | | | — | | | | — | | | | 2,150,000 | | | | 45,167,597 | | | | — | | | | 45,167,597 | | | | 45,167,597 | |
| Redemption of Limited Units | | | — | | | | — | | | | — | | | | — | | | | (1,750,000 | ) | | | (35,611,056 | ) | | | — | | | | (35,611,056 | ) | | | (35,611,056 | ) |
| Net Loss: | | | | | | | | | | | | | | | | | | | | | | | | | | | | | | | | | | | | |
| Net Investment Loss | | | — | | | | — | | | | (12 | ) | | | (12 | ) | | | — | | | | — | | | | (2,575,091 | ) | | | (2,575,091 | ) | | | (2,575,103 | ) |
| Net realized loss on Investments and Futures Contracts | | | — | | | | — | | | | (284 | ) | | | (284 | ) | | | — | | | | — | | | | (67,919,020 | ) | | | (67,919,020 | ) | | | (67,919,304 | ) |
| Net change in unrealized gain on Investments and Futures Contracts | | | — | | | | — | | | | 84 | | | | 84 | | | | — | | | | — | | | | 18,558,173 | | | | 18,558,173 | | | | 18,558,257 | |
| Net Loss | | | — | | | | — | | | | (212 | ) | | | (212 | ) | | | — | | | | — | | | | (51,935,938 | ) | | | (51,935,938 | ) | | | (51,936,150 | ) |
| Balance at December 31, 2015 | | | 50 | | | $ | 1,500 | | | $ | (572 | ) | | $ | 928 | | | | 12,100,000 | | | $ | 360,079,849 | | | $ | (135,562,252 | ) | | $ | 224,517,597 | | | $ | 224,518,525 | |
See accompanying notes to consolidated financial statements
WisdomTree Continuous Commodity Index Fund
(f/k/a GreenHaven Continuous Commodity Index Fund)
Consolidated Statement of 2007, Mr. Anderson worked fromChanges in Shareholders’ Equity
For the Year Ended December 31, 2014
| | | General Units | | | Limited Units | | | Total | |
| | | Total
General | | | | | | Total
Limited | | | Total | |
| | | General Units | | | Accumulated | | | Shareholders’ | | | Limited Units | | | Accumulated | | | Shareholders’ | | | Shareholders’ | |
| | | Units | | | Amount | | | Deficit | | | Equity | | | Units | | | Amount | | | Deficit | | | Equity | | | Equity | |
| | | | |
| Balance at January 01, 2014 | | | 50 | | | $ | 1,500 | | | $ | (215 | ) | | $ | 1,285 | | | | 12,450,000 | | | $ | 364,838,413 | | | $ | (44,847,114 | ) | | $ | 319,991,299 | | | $ | 319,992,584 | |
| Creation of Limited Units | | | — | | | | — | | | | — | | | | — | | | | 1,550,000 | | | | 43,387,949 | | | | — | | | | 43,387,949 | | | | 43,387,949 | |
| Redemption of Limited Units | | | — | | | | — | | | | — | | | | — | | | | (2,300,000 | ) | | | (57,703,054 | ) | | | — | | | | (57,703,054 | ) | | | (57,703,054 | ) |
| Net Loss: | | | | | | | | | | | | | | | | | | | | | | | | | | | | | | | | | | | | |
| Net Investment Loss | | | — | | | | — | | | | (15 | ) | | | (15 | ) | | | — | | | | — | | | | (3,458,548 | ) | | | (3,458,548 | ) | | | (3,458,563 | ) |
| Net realized loss on Investments and Futures Contracts | | | — | | | | — | | | | (45 | ) | | | (45 | ) | | | — | | | | — | | | | (12,125,595 | ) | | | (12,125,595 | ) | | | (12,125,640 | ) |
| Net change in unrealized on Investments and Futures Contracts | | | — | | | | — | | | | (85 | ) | | | (85 | ) | | | — | | | | — | | | | (23,195,057 | ) | | | (23,195,057 | ) | | | (23,195,142 | ) |
| Net Loss | | | — | | | | — | | | | (145 | ) | | | (145 | ) | | | — | | | | — | | | | (38,779,200 | ) | | | (38,779,200 | ) | | | (38,779,345 | ) |
| Balance at December 31, 2014 | | | 50 | | | $ | 1,500 | | | $ | (360 | ) | | $ | 1,140 | | | | 11,700,000 | | | $ | 350,523,308 | | | $ | (83,626,314 | ) | | $ | 266,896,994 | | | $ | 266,898,134 | |
See accompanying notes to consolidated financial statements
WisdomTree Continuous Commodity Index Fund
(f/k/a GreenHaven Continuous Commodity Index Fund)
Consolidated Statement of 2002 until MarchChanges in Shareholders’ Equity
For the Year Ended December 31, 2013
| | | General Units | | | Limited Units | | | Total | |
| | | Total
General | | | | | | Total
Limited | | | Total | |
| | | General Units | | | Accumulated | | | Shareholders’ | | | Limited Units | | | Accumulated | | | Shareholders’ | | | Shareholders’ | |
| | | Units | | | Amount | | | Deficit | | | Equity | | | Units | | | Amount | | | Deficit | | | Equity | | | Equity | |
| | | | | | | | | | | | | | | | | | | | | | | | | | | | |
| Balance at January 01, 2013 | | | 50 | | | $ | 1,500 | | | $ | (57 | ) | | $ | 1,443 | | | | 16,450,000 | | | $ | 470,214,957 | | | $ | 4,391,700 | | | $ | 474,606,657 | | | $ | 474,608,100 | |
| Creation of Limited Units | | | — | | | | — | | | | — | | | | — | | | | 900,000 | | | | 25,704,701 | | | | — | | | | 25,704,701 | | | | 25,704,701 | |
| Redemption of Limited Units | | | — | | | | — | | | | — | | | | — | | | | (4,900,000 | ) | | | (131,081,245 | ) | | | — | | | | (131,081,245 | ) | | | (131,081,245 | ) |
| Net Loss: | | | | | | | | | | | | | | | | | | | | | | | | | | | | | | | | | | | | |
| Net Investment Loss | | | — | | | | — | | | | (15 | ) | | | (15 | ) | | | — | | | | — | | | | (4,134,473 | ) | | | (4,134,473 | ) | | | (4,134,488 | ) |
| Net realized loss on Investments and Futures Contracts | | | — | | | | — | | | | (171 | ) | | | (171 | ) | | | — | | | | — | | | | (53,550,037 | ) | | | (53,550,037 | ) | | | (53,550,208 | ) |
| Net change in unrealized on Investments and Futures Contracts | | | — | | | | — | | | | 28 | | | | 28 | | | | — | | | | — | | | | 8,445,696 | | | | 8,445,696 | | | | 8,445,724 | |
| Net Loss | | | — | | | | — | | | | (158 | ) | | | (158 | ) | | | — | | | | — | | | | (49,238,814 | ) | | | (154,615,358 | ) | | | () | |
| Balance at December 31, 2013 | | | 50 | | | $ | 1,500 | | | $ | (215 | ) | | $ | 1,285 | | | | 12,450,000 | | | $ | 364,838,413 | | | $ | (44,847,114 | ) | | $ | 319,991,299 | | | $ | 319,992,584 | |
See accompanying notes to consolidated financial statements
WisdomTree Continuous Commodity Index Fund
(f/k/a GreenHaven Continuous Commodity Index Fund)
Consolidated Statements of 2006 as an analyst in Institutional Equity SalesCash Flows
For the Years Ended December 31, 2015, 2014 and Trading for Credit Suisse Securities USA LLC, 2013
| | | 2015 | | | 2014 | | | 2013 | |
| | | | | | | | | | |
| Cash flow from operating activities: | | | | | | | | | | | | |
| Net Loss | | $ | (51,936,150 | ) | | $ | (38,779,345 | ) | | $ | (49,238,972 | ) |
Adjustments to reconcile net loss to net cash provided by (used for) operating activities: | | | | | | | | | | | | |
| Purchase of investment securities | | | (649,921,623 | ) | | | (778,448,400 | ) | | | (1,484,819,380 | ) |
| Proceeds from sales of investment securities | | | 700,001,500 | | | | 778,495,000 | | | | 1,754,981,721 | |
| Net accretion of discount | | | (45,979 | ) | | | (44,304 | ) | | | (189,643 | ) |
| Net realized gain (loss) on investment securities | | | (3,500 | ) | | | — | | | | 10,376 | |
| Unrealized depreciation (appreciation) on investments | | | (18,558,257 | ) | | | 23,195,142 | | | | (8,445,724 | ) |
| Decrease in accrued expenses | | | (85,599 | ) | | | (87,513 | ) | | | (387,139 | ) |
| Net cash provided by (used for) operating activities | | | (20,549,608 | ) | | | (15,669,420 | ) | | | 211,911,239 | |
| | | | | | | | | | | | | |
| Cash flows from financing activities: | | | | | | | | | | | | |
| Proceeds from creation of Limited Units | | | 45,167,597 | | | | 43,387,949 | | | | 25,704,701 | |
| Redemption of Limited Units | | | (35,611,056 | ) | | | (57,703,054 | ) | | | (131,081,245 | ) |
| Increase (decrease) in capital shares payable | | | — | | | | — | | | | (4,327,722 | ) |
| Net cash provided by (used for) financing activities | | | 9,556,541 | | | | (14,315,105 | ) | | | (109,704,266 | ) |
| | | | | | | | | | | | | |
| Net change in cash | | | (10,993,067 | ) | | | (29,984,525 | ) | | | 102,206,973 | |
| Cash held by broker at beginning of year | | | 94,433,074 | | | | 124,417,599 | | | | 22,210,626 | |
| Cash held by broker at end of year | | $ | 83,440,007 | | | $ | 94,433,074 | | | $ | 124,417,599 | |
See accompanying notes to consolidated financial statements
WisdomTree Continuous Commodity Index Master Fund
(f/k/a securities broker dealer and investment bank based in Zurich, Switzerland. At Credit Suisse Securities USA LLC, Mr. Anderson served as a brokerage sales person covering the major financial institutions in the Southeastern United States and the Caribbean. Between the MarchGreenHaven Continuous Commodity Index Master Fund)
Statements of 2006 and April of 2007, Mr. Anderson took time off from work. He has passed the Level 3 CFA® exam and has a B.B.A. in Finance from the University of Georgia. Mr. Anderson became a registered Associated Person on May 29, 2007 with GreenHaven LLC and registered Associated Person and as listed Principal of the Managing Owner on November 30, 2009. The registration associated with GreenHaven, LLC became inactive Financial Condition
as of February 2, 2011.December 31, 2015 and 2014
| | | December 31,
2015 | | | December 31, 2014 | |
| Assets | | | | | | | | |
| Equity in broker trading accounts: | | | | | | | | |
| Short-term investments (cost $149,963,671 and $199,994,069 as of 2015 and 2014, respectively) | | $ | 149,980,000 | | | $ | 199,995,250 | |
| Cash held by broker | | | 83,440,007 | | | | 94,433,074 | |
| Net unrealized depreciation on futures contracts | | | (8,705,967 | ) | | | (27,249,076 | ) |
| Total assets | | $ | 224,714,040 | | | $ | 267,179,248 | |
| | | | | | | | | |
| Liabilities and shareholders’ equity | | | | | | | | |
| Management fee payable to related party | | | 166,759 | | | | 205,492 | |
| Accrued brokerage fees and expenses payable | | | 28,756 | | | | 75,622 | |
| Total liabilities | | | 195,515 | | | | 281,114 | |
| | | | | | | | | |
| Shareholders’ equity | | | | | | | | |
| General Units: | | | | | | | | |
| Paid in capital - 50 units issued | | | 1,500 | | | | 1,500 | |
| Accumulated deficit | | | (572 | ) | | | (360 | ) |
| Total General Units | | | 928 | | | | 1,140 | |
| Limited Units: | | | | | | | | |
| Paid in capital - 12,100,000 and 11,700,000 redeemable shares issued and outstanding as of 2015 and 2014, respectively | | | 360,079,849 | | | | 350,523,308 | |
| Accumulated deficit | | | (135,562,252 | ) | | | (83,626,314 | ) |
| | | | | | | | | |
| Total Limited Units | | | 224,517,597 | | | | 266,896,994 | |
| | | | | | | | | |
| Total shareholders’ equity | | | 224,518,525 | | | | 266,898,134 | |
| Total liabilities and shareholders’ equity | | $ | 224,714,040 | | | $ | 267,179,248 | |
| | | | | | | | | |
| Net asset value per share | | | | | | | | |
| | | | | | | | | |
| General Units | | $ | 18.56 | | | $ | 22.80 | |
| | | | | | | | | |
| Limited Units | | $ | 18.56 | | | $ | 22.81 | |
See accompanying notes to financial statements
WisdomTree Continuous Commodity Index Master Fund
(f/k/a GreenHaven Continuous Commodity Index Master Fund)
Schedule of Investments
as of December 31, 2015
| Description | | Percentage
of Net Assets | | | Fair
Value | | | Face
Value | |
| U.S. Treasury Obligations | | | | | | | | | | | | |
| U.S. Treasury Bills, 0.17% due January 28, 2016 | | | 22.27 | % | | $ | 49,995,900 | | | $ | 50,000,000 | |
| U.S. Treasury Bills, 0.14% due February 11, 2016 | | | 22.27 | | | | 49,993,400 | | | | 50,000,000 | |
| U.S. Treasury Bills, 0.28% due March 17, 2016 | | | 22.26 | | | | 49,990,700 | | | | 50,000,000 | |
| Total U.S. Treasury Obligations (cost $149,963,671) | | | 66.80 | % | | $ | 149,980,000 | | | $ | 150,000,000 | |
| Description | | Percentage
of Net Assets | | | Fair
Value | | | Notional
Value | |
| Unrealized Appreciation/(Depreciation) on Futures Contracts | | | | | | | | | | | | |
| Cocoa (138 contracts, settlement date July 14, 2016) | | | (0.05 | )% | | $ | (119,940 | ) | | $ | 4,420,140 | |
| Cocoa (137 contracts, settlement date May 13, 2016) | | | 0.05 | | | | 113,380 | | | | 4,393,590 | |
| Cocoa (137 contracts, settlement date March 15, 2016) | | | 0.05 | | | | 119,700 | | | | 4,399,070 | |
| Coffee (91 contracts, settlement date July 19, 2016) | | | 0.12 | | | | 267,150 | | | | 4,461,844 | |
| Coffee (91 contracts, settlement date May 18, 2016) | | | (0.04 | ) | | | (96,862 | ) | | | 4,395,300 | |
| Coffee (91 contracts, settlement date March 18, 2016) | | | (0.05 | ) | | | (118,144 | ) | | | 4,323,638 | |
| Copper (82 contracts, settlement date July 27, 2016) | | | (0.04 | ) | | | (81,925 | ) | | | 4,400,325 | |
| Copper (82 contracts, settlement date May 26, 2016) | | | (0.15 | ) | | | (338,513 | ) | | | 4,390,075 | |
| Copper (82 contracts, settlement date March 29, 2016) | | | (0.14 | ) | | | (309,850 | ) | | | 4,376,750 | |
| Corn (241 contracts, settlement date July 14, 2016) | | | (0.05 | ) | | | (114,900 | ) | | | 4,464,525 | |
| Corn (242 contracts, settlement date May 13, 2016) | | | (0.14 | ) | | | (315,375 | ) | | | 4,410,450 | |
| Corn (242 contracts, settlement date March 14, 2016) | | | (0.13 | ) | | | (301,212 | ) | | | 4,340,875 | |
| Cotton (137 contracts, settlement date July 07, 2016) | | | 0.04 | | | | 97,490 | | | | 4,438,115 | |
| Cotton (137 contracts, settlement date May 06, 2016) | | | (0.01 | ) | | | (12,455 | ) | | | 4,391,535 | |
| Cotton (138 contracts, settlement date March 08, 2016) | | | (0.02 | ) | | | (35,815 | ) | | | 4,366,320 | |
| Gold (41 contracts, settlement date June 28, 2016) | | | (0.05 | ) | | | (104,370 | ) | | | 4,352,150 | |
| Gold (41 contracts, settlement date April 27, 2016) | | | (0.09 | ) | | | (211,170 | ) | | | 4,349,280 | |
| Gold (42 contracts, settlement date February 25, 2016) | | | (0.18 | ) | | | (401,480 | ) | | | 4,452,840 | |
| Lean Hogs (117 contracts, settlement date July 15, 2016) | | | 0.08 | | | | 185,740 | | | | 3,643,380 | |
| Lean Hogs (117 contracts, settlement date June 14, 2016) | | | 0.10 | | | | 220,880 | | | | 3,650,400 | |
| Lean Hogs (117 contracts, settlement date April 14, 2016) | | | (0.07 | ) | | | (148,820 | ) | | | 3,086,460 | |
| Lean Hogs (117 contracts, settlement date February 12, 2016) | | | (0.11 | ) | | | (239,750 | ) | | | 2,798,640 | |
| Live Cattle (82 contracts, settlement date June 30, 2016) | | | 0.06 | | | | 132,670 | | | | 4,191,840 | |
| Live Cattle (82 contracts, settlement date April 29, 2016) | | | (0.04 | ) | | | (86,140 | ) | | | 4,525,580 | |
| Live Cattle (82 contracts, settlement date February 29, 2016) | | | (0.09 | ) | | | (204,150 | ) | | | 4,487,040 | |
| Natural Gas (110 contracts, settlement date May 26, 2016) | | | (0.02 | ) | | | (46,190 | ) | | | 2,714,800 | |
| Natural Gas (110 contracts, settlement date April 27, 2016) | | | (0.02 | ) | | | (39,980 | ) | | | 2,666,400 | |
| Natural Gas (110 contracts, settlement date March 29, 2016) | | | (0.11 | ) | | | (238,510 | ) | | | 2,625,700 | |
| Natural Gas (110 contracts, settlement date February 25, 2016) | | | (0.14 | ) | | | (318,070 | ) | | | 2,599,300 | |
| Natural Gas (111 contracts, settlement date January 27, 2016) | | | (0.18 | ) | | | (395,510 | ) | | | 2,594,070 | |
| NY Harbor ULSD (53 contracts, settlement date May 31, 2016) | | | (0.24 | ) | | | (551,179 | ) | | | 2,705,480 | |
| NY Harbor ULSD (53 contracts, settlement date April 29, 2016) | | | (0.25 | ) | | | (556,471 | ) | | | 2,649,163 | |
| NY Harbor ULSD (54 contracts, settlement date March 31, 2016) | | | (0.32 | ) | | | (719,783 | ) | | | 2,647,436 | |
| NY Harbor ULSD (54 contracts, settlement date February 29, 2016) | | | (0.35 | ) | | | (789,184 | ) | | | 2,605,705 | |
| NY Harbor ULSD (54 contracts, settlement date January 29, 2016) | | | (0.38 | ) | | | (848,266 | ) | | | 2,549,005 | |
| Platinum (148 contracts, settlement date July 27, 2016) | | | 0.06 | | | | 126,785 | | | | 6,615,600 | |
| Platinum (147 contracts, settlement date April 27, 2016) | | | (0.11 | ) | | | (254,960 | ) | | | 6,565,020 | |
| Silver (63 contracts, settlement date July 27, 2016) | | | (0.07 | ) | | | (151,495 | ) | | | 4,368,105 | |
| Silver (64 contracts, settlement date May 26, 2016) | | | (0.17 | ) | | | (374,635 | ) | | | 4,426,880 | |
| Silver (64 contracts, settlement date March 29, 2016) | | | (0.18 | ) | | | (414,395 | ) | | | 4,416,960 | |
| Soybean (101 contracts, settlement date July 14, 2016) | | | 0.01 | | | | 24,500 | | | | 4,427,587 | |
| Soybean (101 contracts, settlement date May 13, 2016) | | | (0.10 | ) | | | (221,537 | ) | | | 4,390,975 | |
| Soybean (101 contracts, settlement date March 14, 2016) | | | (0.10 | ) | | | (231,875 | ) | | | 4,364,463 | |
| Soybean Oil (237 contracts, settlement date July 14, 2016) | | | 0.18 | | | | 391,830 | | | | 4,433,796 | |
| Soybean Oil (237 contracts, settlement date May 13, 2016) | | | 0.13 | | | | 288,294 | | | | 4,402,512 | |
| Soybean Oil (237 contracts, settlement date March 14, 2016) | | | 0.12 | | | | 277,464 | | | | 4,372,650 | |
| Sugar (264 contracts, settlement date June 30, 2016) | | | 0.06 | | | | 126,717 | | | | 4,328,755 | |
| Sugar (264 contracts, settlement date April 29, 2016) | | | 0.26 | | | | 591,270 | | | | 4,411,546 | |
| Sugar (263 contracts, settlement date February 29, 2016) | | | 0.27 | | | | 600,074 | | | | 4,489,094 | |
| Wheat (184 contracts, settlement date July 14, 2016) | | | (0.07 | ) | | | (160,687 | ) | | | 4,445,900 | |
| Wheat (185 contracts, settlement date May 13, 2016) | | | (0.13 | ) | | | (298,525 | ) | | | 4,407,625 | |
| Wheat (185 contracts, settlement date March 14, 2016) | | | (0.14 | ) | | | (314,138 | ) | | | 4,347,500 | |
| WTI Crude (67 contracts, settlement date May 20, 2016) | | | (0.15 | ) | | | (329,010 | ) | | | 2,727,570 | |
| WTI Crude (67 contracts, settlement date April 20, 2016) | | | (0.15 | ) | | | (334,250 | ) | | | 2,678,660 | |
| WTI Crude (68 contracts, settlement date March 21, 2016) | | | (0.20 | ) | | | (445,480 | ) | | | 2,660,840 | |
| WTI Crude (68 contracts, settlement date February 22, 2016) | | | (0.22 | ) | | | (492,250 | ) | | | 2,595,560 | |
| WTI Crude (68 contracts, settlement date January 20, 2016) | | | (0.22 | ) | | | (502,660 | ) | | | 2,518,720 | |
| Net Unrealized Depreciation on Futures Contracts | | | (3.88 | )% | | $ | (8,705,967 | ) | | $ | 224,263,539 | |
See accompanying notes to financial statements
WisdomTree Continuous Commodity Index Master Fund
(f/k/a GreenHaven Continuous Commodity Index Master Fund)
Schedule of Investments
as of December 31, 2014
| | | Percentage | | | Fair | | | Face | |
| Description | | of Net Assets | | | Value | | | Value | |
| U.S. Treasury Obligations | | | | | | | | | | | | |
| U.S. Treasury Bills, 0.01% due January 22, 2015 | | | 37.47 | % | | $ | 99,998,600 | | | $ | 100,000,000 | |
| U.S. Treasury Bills, 0.03% due March 12, 2015 | | | 18.73 | | | | 49,998,100 | | | | 50,000,000 | |
| U.S. Treasury Bills, 0.06% due March 26, 2015 | | | 18.73 | | | | 49,998,550 | | | | 50,000,000 | |
| Total U.S. Treasury Obligations (cost $199,994,069) | | | 74.93 | % | | $ | 199,995,250 | | | $ | 200,000,000 | |
| | | Percentage | | | Fair | | | Notional | |
| Description | | of Net Assets | | | Value | | | Value | |
| Unrealized Appreciation/(Depreciation) on Futures Contracts | | | | | | | | | | | | |
| Cocoa (181 contracts, settlement date July 16, 2015) | | | 0.03 | % | | $ | 83,950 | | | $ | 5,229,090 | |
| Cocoa (181 contracts, settlement date May 13, 2015) | | | (0.13 | ) | | | (334,480 | ) | | | 5,234,520 | |
| Cocoa (181 contracts, settlement date March 16, 2015) | | | (0.12 | ) | | | (316,920 | ) | | | 5,267,100 | |
| Coffee (82 contracts, settlement date July 21, 2015) | | | (0.25 | ) | | | (671,513 | ) | | | 5,285,925 | |
| Coffee (82 contracts, settlement date May 18, 2015) | | | (0.27 | ) | | | (719,438 | ) | | | 5,205,975 | |
| Coffee (83 contracts, settlement date March 19, 2015) | | | (0.28 | ) | | | (747,038 | ) | | | 5,185,425 | |
| Copper (74 contracts, settlement date July 29, 2015) | | | (0.12 | ) | | | (320,262 | ) | | | 5,227,175 | |
| Copper (74 contracts, settlement date May 27, 2015) | | | (0.22 | ) | | | (584,150 | ) | | | 5,223,475 | |
| Copper (74 contracts, settlement date March 27, 2015) | | | (0.21 | ) | | | (559,600 | ) | | | 5,227,175 | |
| Corn (258 contracts, settlement date July 14, 2015) | | | 0.04 | | | | 101,863 | | | | 5,321,250 | |
| Corn (258 contracts, settlement date May 14, 2015) | | | 0.09 | | | | 250,975 | | | | 5,234,175 | |
| Corn (259 contracts, settlement date March 13, 2015) | | | 0.09 | | | | 242,600 | | | | 5,141,150 | |
| Cotton (171 contracts, settlement date July 09, 2015) | | | 0.00 | * | | | 5,610 | | | | 5,301,000 | |
| Cotton (171 contracts, settlement date May 06, 2015) | | | (0.12 | ) | | | (316,150 | ) | | | 5,221,485 | |
| Cotton (171 contracts, settlement date March 09, 2015) | | | (0.27 | ) | | | (716,905 | ) | | | 5,153,085 | |
| Gold (44 contracts, settlement date June 26, 2015) | | | 0.03 | | | | 88,470 | | | | 5,215,760 | |
| Gold (44 contracts, settlement date April 28, 2015) | | | (0.17 | ) | | | (446,860 | ) | | | 5,213,560 | |
| Gold (44 contracts, settlement date February 25, 2015) | | | (0.13 | ) | | | (335,420 | ) | | | 5,210,040 | |
| Lean Hogs (113 contracts, settlement date July 15, 2015) | | | (0.07 | ) | | | (176,480 | ) | | | 4,098,510 | |
| Lean Hogs (113 contracts, settlement date June 12, 2015) | | | (0.07 | ) | | | (188,950 | ) | | | 4,138,060 | |
| Lean Hogs (113 contracts, settlement date April 15, 2015) | | | (0.07 | ) | | | (197,270 | ) | | | 3,764,030 | |
| Lean Hogs (113 contracts, settlement date February 13, 2015) | | | (0.12 | ) | | | (315,750 | ) | | | 3,670,240 | |
| Light, Sweet Crude Oil (57 contracts, settlement date May 19, 2015) | | | (0.33 | ) | | | (893,390 | ) | | | 3,172,050 | |
| Light, Sweet Crude Oil (58 contracts, settlement date April 21, 2015) | | | (0.38 | ) | | | (1,019,440 | ) | | | 3,187,680 | |
| Light, Sweet Crude Oil (58 contracts, settlement date March 20, 2015) | | | (0.57 | ) | | | (1,532,690 | ) | | | 3,147,080 | |
| Light, Sweet Crude Oil (58 contracts, settlement date February 20, 2015) | | | (0.58 | ) | | | (1,560,200 | ) | | | 3,114,600 | |
| Light, Sweet Crude Oil (58 contracts, settlement date January 20, 2015) | | | (0.58 | ) | | | (1,550,530 | ) | | | 3,089,660 | |
| Live Cattle (82 contracts, settlement date June 30, 2015) | | | (0.04 | ) | | | (114,190 | ) | | | 5,080,720 | |
| Live Cattle (81 contracts, settlement date April 30, 2015) | | | 0.08 | | | | 218,730 | | | | 5,261,760 | |
| Live Cattle (81 contracts, settlement date February 27, 2015) | | | 0.09 | | | | 242,130 | | | | 5,299,020 | |
| Natural Gas (108 contracts, settlement date May 27, 2015) | | | (0.25 | ) | | | (668,300 | ) | | | 3,189,240 | |
| Natural Gas (108 contracts, settlement date April 28, 2015) | | | (0.26 | ) | | | (694,840 | ) | | | 3,136,320 | |
| Natural Gas (108 contracts, settlement date March 27, 2015) | | | (0.29 | ) | | | (786,680 | ) | | | 3,111,480 | |
| Natural Gas (108 contracts, settlement date February 25, 2015) | | | (0.37 | ) | | | (1,000,490 | ) | | | 3,127,680 | |
| Natural Gas (108 contracts, settlement date January 28, 2015) | | | (0.40 | ) | | | (1,071,100 | ) | | | 3,120,120 | |
| NY Harbor ULSD (42 contracts, settlement date May 29, 2015) | | | (0.33 | ) | | | (873,041 | ) | | | 3,200,602 | |
| NY Harbor ULSD (41 contracts, settlement date April 30, 2015) | | | (0.32 | ) | | | (861,353 | ) | | | 3,105,627 | |
| NY Harbor ULSD (41 contracts, settlement date March 31, 2015) | | | (0.50 | ) | | | (1,337,461 | ) | | | 3,104,594 | |
| NY Harbor ULSD (41 contracts, settlement date February 27, 2015) | | | (0.53 | ) | | | (1,409,974 | ) | | | 3,129,218 | |
| NY Harbor ULSD (41 contracts, settlement date January 30, 2015) | | | (0.50 | ) | | | (1,333,559 | ) | | | 3,157,459 | |
| Platinum (130 contracts, settlement date July 29, 2015) | | | 0.01 | | | | 33,995 | | | | 7,871,500 | |
| Platinum (129 contracts, settlement date April 28, 2015) | | | 0.01 | | | | 20,485 | | | | 7,801,275 | |
| Silver (66 contracts, settlement date July 29, 2015) | | | (0.02 | ) | | | (47,050 | ) | | | 5,168,460 | |
| Silver (67 contracts, settlement date May 27, 2015) | | | (0.35 | ) | | | (940,295 | ) | | | 5,236,720 | |
| Silver (67 contracts, settlement date March 27, 2015) | | | (0.34 | ) | | | (913,105 | ) | | | 5,225,665 | |
| Soybean (101 contracts, settlement date July 14, 2015) | | | (0.03 | ) | | | (92,050 | ) | | | 5,236,850 | |
| Soybean (101 contracts, settlement date May 14, 2015) | | | (0.07 | ) | | | (199,812 | ) | | | 5,204,025 | |
| Soybean (102 contracts, settlement date March 13, 2015) | | | (0.06 | ) | | | (163,712 | ) | | | 5,219,850 | |
| Soybean Oil (269 contracts, settlement date July 14, 2015) | | | (0.04 | ) | | | (102,582 | ) | | | 5,253,570 | |
| Soybean Oil (269 contracts, settlement date May 14, 2015) | | | (0.13 | ) | | | (336,222 | ) | | | 5,221,290 | |
| Soybean Oil (270 contracts, settlement date March 13, 2015) | | | (0.13 | ) | | | (337,578 | ) | | | 5,206,680 | |
| Sugar (314 contracts, settlement date June 30, 2015) | | | (0.17 | ) | | | (441,795 | ) | | | 5,363,120 | |
| Sugar (315 contracts, settlement date April 30, 2015) | | | (0.31 | ) | | | (834,389 | ) | | | 5,263,776 | |
| Sugar (315 contracts, settlement date February 27, 2015) | | | (0.39 | ) | | | (1,039,808 | ) | | | 5,122,656 | |
| Wheat (176 contracts, settlement date July 14, 2015) | | | 0.12 | | | | 314,688 | | | | 5,258,000 | |
| Wheat (176 contracts, settlement date May 14, 2015) | | | 0.04 | | | | 106,325 | | | | 5,231,600 | |
| Wheat (176 contracts, settlement date March 13, 2015) | | | 0.05 | | | | 143,925 | | | | 5,189,800 | |
| Net Unrealized Depreciation on Futures Contracts | | | (10.21 | )% | | $ | (27,249,076 | ) | | $ | 266,577,952 | |
| * | Denotes greater than 0.000% yet less than 0.005% |
See accompanying notes to financial statements
Scott Glasing, 50, TraderWisdomTree Continuous Commodity Index Master Fund
(f/k/a GreenHaven Continuous Commodity Index Master Fund)
Statements of Income and Expenses
For the Years Ended December 31, 2015, 2014, and 2013
| | | 2015 | | | 2014 | | | 2013 | |
| Income | | | | | | | | | | | | |
| Interest Income | | $ | 45,979 | | | $ | 44,304 | | | $ | 189,643 | |
| | | | | | | | | | | | | |
| Expenses | | | | | | | | | | | | |
| Management fee to related party | | | 2,121,828 | | | | 2,835,654 | | | | 3,500,487 | |
| Brokerage fees and expenses | | | 499,254 | | | | 667,213 | | | | 823,644 | |
| Total expenses | | | 2,621,082 | | | | 3,502,867 | | | | 4,324,131 | |
| Net Investment Loss | | | (2,575,103 | ) | | | (3,458,563 | ) | | | (4,134,488 | ) |
| | | | | | | | | | | | | |
| Realized and Net Change in Unrealized Gain (Loss) on Investments and Futures Contracts | | | | | | | | | | | | |
| Realized Gain (Loss) on | | | | | | | | | | | | |
| Investments | | | 3,500 | | | | — | | | | (10,376 | ) |
| Futures Contracts | | | (67,922,804 | ) | | | (12,125,640 | ) | | | (53,539,832 | ) |
| Net Realized Loss | | | (67,919,304 | ) | | | (12,125,640 | ) | | | (53,550,208 | ) |
| Net Change in Unrealized Gain (Loss) on | | | | | | | | | | | | |
| Investments | | | 15,148 | | | | (1,254 | ) | | | (13,546 | ) |
| Futures Contracts | | | 18,543,109 | | | | (23,193,888 | ) | | | 8,459,270 | |
| Net Change in Unrealized Gain (Loss) | | | 18,558,257 | | | | (23,195,142 | ) | | | 8,445,724 | |
| Net Realized and Unrealized Loss on Investments and Futures Contracts | | | (49,361,047 | ) | | | (35,320,782 | ) | | | (45,104,484 | ) |
| | | | | | | | | | | | | |
| Net Loss | | $ | (51,936,150 | ) | | $ | (38,779,345 | ) | | $ | (49,238,972 | ) |
See accompanying notes to financial statements
WisdomTree Continuous Commodity Index Master Fund
(f/k/a GreenHaven Continuous Commodity Index Master Fund)
Statement of Changes in Shareholders’ Equity
For the Year Ended December 31, 2015
| | | General Units | | | Limited Units | | | Total | |
| | | | | | | | | | | | Total | | | | | | | | | | | | Total | | | | |
| | | | | | | | | | | | General | | | | | | | | | | | | Limited | | | Total | |
| | | General Units | | | Accumulated | | | Shareholders’ | | | Limited Units | | | Accumulated | | | Shareholders’ | | | Shareholders’ | |
| | | Units | | | Amount | | | Deficit | | | Equity | | | Units | | | Amount | | | Deficit | | | Equity | | | Equity | |
| | | | | | | | | | | | | | | | | | | | | | | | | | | | |
| Balance at January 01, 2015 | | | 50 | | | $ | 1,500 | | | $ | (360 | ) | | $ | 1,140 | | | | 11,700,000 | | | $ | 350,523,308 | | | $ | (83,626,314 | ) | | $ | 266,896,994 | | | $ | 266,898,134 | |
| Creation of Limited Units | | | — | | | | — | | | | — | | | | — | | | | 2,150,000 | | | | 45,167,597 | | | | — | | | | 45,167,597 | | | | 45,167,597 | |
| Redemption of Limited Units | | | — | | | | — | | | | — | | | | — | | | | (1,750,000 | ) | | | (35,611,056 | ) | | | — | | | | (35,611,056 | ) | | | (35,611,056 | ) |
| Net Loss: | | | | | | | | | | | | | | | | | | | | | | | | | | | | | | | | | | | | |
| Net Investment Loss | | | — | | | | — | | | | (12 | ) | | | (12 | ) | | | — | | | | — | | | | (2,575,091 | ) | | | (2,575,091 | ) | | | (2,575,103 | ) |
| Net realized loss on Investments and Futures Contracts | | | — | | | | — | | | | (284 | ) | | | (284 | ) | | | — | | | | — | | | | (67,919,020 | ) | | | (67,919,020 | ) | | | (67,919,304 | ) |
| Net change in unrealized gain on Investments and Futures Contracts | | | — | | | | — | | | | 84 | | | | 84 | | | | — | | | | — | | | | 18,558,173 | | | | 18,558,173 | | | | 18,558,257 | |
| Net Loss | | | — | | | | — | | | | (212 | ) | | | (212 | ) | | | — | | | | — | | | | (51,935,938 | ) | | | (51,935,938 | ) | | | (51,936,150 | ) |
| Balance at December 31, 2015 | | | 50 | | | $ | 1,500 | | | $ | (572 | ) | | $ | 928 | | | | 12,100,000 | | | $ | 360,079,849 | | | $ | (135,562,252 | ) | | $ | 224,517,597 | | | $ | 224,518,525 | |
See accompanying notes to financial statements
WisdomTree Continuous Commodity Index Master Fund
(f/k/a trader forGreenHaven Continuous Commodity Index Master Fund)
Statement of Changes in Shareholders’ Equity
For the Managing OwnerYear Ended December 31, 2014
| | | General Units | | | Limited Units | | | Total | |
| | | Total
General | | | | | | Total
Limited | | | Total | |
| | | General Units | | | Accumulated | | | Shareholders’ | | | Limited Units | | | Accumulated | | | Shareholders’ | | | Shareholders’ | |
| | | Units | | | Amount | | | Deficit | | | Equity | | | Units | | | Amount | | | Deficit | | | Equity | | | Equity | |
| | | | |
| Balance at January 01, 2014 | | | 50 | | | $ | 1,500 | | | $ | (215 | ) | | $ | 1,285 | | | | 12,450,000 | | | $ | 364,838,413 | | | $ | (44,847,114 | ) | | $ | 319,991,299 | | | $ | 319,992,584 | |
| Creation of Limited Units | | | — | | | | — | | | | — | | | | — | | | | 1,550,000 | | | | 43,387,949 | | | | — | | | | 43,387,949 | | | | 43,387,949 | |
| Redemption of Limited Units | | | — | | | | — | | | | — | | | | — | | | | (2,300,000 | ) | | | (57,703,054 | ) | | | — | | | | (57,703,054 | ) | | | (57,703,054 | ) |
| Net Loss: | | | | | | | | | | | | | | | | | | | | | | | | | | | | | | | | | | | | |
| Net Investment Loss | | | — | | | | — | | | | (15 | ) | | | (15 | ) | | | — | | | | — | | | | (3,458,548 | ) | | | (3,458,548 | ) | | | (3,458,563 | ) |
| Net realized loss on Investments and Futures Contracts | | | — | | | | — | | | | (45 | ) | | | (45 | ) | | | — | | | | — | | | | (12,125,595 | ) | | | (12,125,595 | ) | | | (12,125,640 | ) |
| Net change in unrealized on Investments and Futures Contracts | | | — | | | | — | | | | (85 | ) | | | (85 | ) | | | — | | | | — | | | | (23,195,057 | ) | | | (23,195,057 | ) | | | (23,195,142 | ) |
| Net Loss | | | — | | | | — | | | | (145 | ) | | | (145 | ) | | | — | | | | — | | | | (38,779,200 | ) | | | (38,779,200 | ) | | | (38,779,345 | ) |
| Balance at December 31, 2014 | | | 50 | | | $ | 1,500 | | | $ | (360 | ) | | $ | 1,140 | | | | 11,700,000 | | | $ | 350,523,308 | | | $ | (83,626,314 | ) | | $ | 266,896,994 | | | $ | 266,898,134 | |
See accompanying notes to financial statements
WisdomTree Continuous Commodity Index Master Fund
(f/k/a GreenHaven Continuous Commodity Index Master Fund)
Statement of Changes in Shareholders’ Equity
For the Year Ended December 31, 2013
| | | General Units | | | Limited Units | | | Total | |
| | | Total
General | | | | | | Total
Limited | | | Total | |
| | | General Units | | | Accumulated | | | Shareholders’ | | | Limited Units | | | Accumulated | | | Shareholders’ | | | Shareholders’ | |
| | | Units | | | Amount | | | Deficit | | | Equity | | | Units | | | Amount | | | Deficit | | | Equity | | | Equity | |
| | | | | | | | | | | | | | | | | | | | | | | | | | | | |
| Balance at January 01, 2013 | | | 50 | | | $ | 1,500 | | | $ | (57 | ) | | $ | 1,443 | | | | 16,450,000 | | | $ | 470,214,957 | | | $ | 4,391,700 | | | $ | 474,606,657 | | | $ | 474,608,100 | |
| Creation of Limited Units | | | — | | | | — | | | | — | | | | — | | | | 900,000 | | | | 25,704,701 | | | | — | | | | 25,704,701 | | | | 25,704,701 | |
| Redemption of Limited Units | | | — | | | | — | | | | — | | | | — | | | | (4,900,000 | ) | | | (131,081,245 | ) | | | — | | | | (131,081,245 | ) | | | (131,081,245 | ) |
| Net Loss: | | | | | | | | | | | | | | | | | | | | | | | | | | | | | | | | | | | | |
| Net Investment Loss | | | — | | | | — | | | | (15 | ) | | | (15 | ) | | | — | | | | — | | | | (4,134,473 | ) | | | (4,134,473 | ) | | | (4,134,488 | ) |
| Net realized loss on Investments and Futures Contracts | | | — | | | | — | | | | (171 | ) | | | (171 | ) | | | — | | | | — | | | | (53,550,037 | ) | | | (53,550,037 | ) | | | (53,550,208 | ) |
| Net change in unrealized on Investments and Futures Contracts | | | — | | | | — | | | | 28 | | | | 28 | | | | — | | | | — | | | | 8,445,696 | | | | 8,445,696 | | | | 8,445,724 | |
| Net Loss | | | — | | | | — | | | | (158 | ) | | | (158 | ) | | | — | | | | — | | | | (49,238,814 | ) | | | (154,615,358 | ) | | | () | |
| Balance at December 31, 2013 | | | 50 | | | $ | 1,500 | | | $ | (215 | ) | | $ | 1,285 | | | | 12,450,000 | | | $ | 364,838,413 | | | $ | (44,847,114 | ) | | $ | 319,991,299 | | | $ | 319,992,584 | |
See accompanying notes to financial statements
WisdomTree Continuous Commodity Index Master Fund
(f/k/a GreenHaven Continuous Commodity Index Master Fund)
Statements of Cash Flows
For the Years Ended December 31, 2015, 2014 and is responsible for daily futures trading. Mr. Glasing has held this position since November of 2006. Mr. Glasing has an expertise, concentrated in trading, back office operations2013
| | | 2015 | | | 2014 | | | 2013 | |
| | �� | | | | | | | | |
| Cash flow from operating activities: | | | | | | | | | | | | |
| Net Loss | | $ | (51,936,150 | ) | | $ | (38,779,345 | ) | | $ | (49,238,972 | ) |
Adjustments to reconcile net loss to net cash provided by (used for) operating activities: | | | | | | | | | | | | |
| Purchase of investment securities | | | (649,921,623 | ) | | | (778,448,400 | ) | | | (1,484,819,380 | ) |
| Proceeds from sales of investment securities | | | 700,001,500 | | | | 778,495,000 | | | | 1,754,981,721 | |
| Net accretion of discount | | | (45,979 | ) | | | (44,304 | ) | | | (189,643 | ) |
| Net realized gain (loss) on investment securities | | | (3,500 | ) | | | — | | | | 10,376 | |
| Unrealized depreciation (appreciation) on investments | | | (18,558,257 | ) | | | 23,195,142 | | | | (8,445,724 | ) |
| Decrease in accrued expenses | | | (85,599 | ) | | | (87,513 | ) | | | (387,139 | ) |
| Net cash provided by (used for) operating activities | | | (20,549,608 | ) | | | (15,669,420 | ) | | | 211,911,239 | |
| | | | | | | | | | | | | |
| Cash flows from financing activities: | | | | | | | | | | | | |
| Proceeds from creation of Limited Units | | | 45,167,597 | | | | 43,387,949 | | | | 25,704,701 | |
| Redemption of Limited Units | | | (35,611,056 | ) | | | (57,703,054 | ) | | | (131,081,245 | ) |
| Increase (decrease) in capital shares payable | | | — | | | | — | | | | (4,327,722 | ) |
| Net cash provided by (used for) financing activities | | | 9,556,541 | | | | (14,315,105 | ) | | | (109,704,266 | ) |
| | | | | | | | | | | | | |
| Net change in cash | | | (10,993,067 | ) | | | (29,984,525 | ) | | | 102,206,973 | |
| Cash held by broker at beginning of year | | | 94,433,074 | | | | 124,417,599 | | | | 22,210,626 | |
| Cash held by broker at end of year | | $ | 83,440,007 | | | $ | 94,433,074 | | | $ | 124,417,599 | |
See accompanying notes to financial statements
| WisdomTree Continuous Commodity Index Fund |
| (f/k/a GreenHaven Continuous Commodity Index Fund) |
| WisdomTree Continuous Commodity Index Master Fund |
| (f/k/a GreenHaven Continuous Commodity Index Master Fund) |
|
| Notes to Consolidated Financial Statements |
| Years Ended December 31, 2015, 2014 and 2013 |
(1) Organization
The WisdomTree Continuous Commodity Index Fund (the “Fund”; “Fund” may also refer to the Fund and compliance. A native of Chicago, he has interest in finance, economics, and hedging. Mr. Glasing has worked for Grain Service Corporation, Inc. since 1998. Mr. Glasing became a registered Associated Person on November 15, 2006 and listed Principal of the Managing Owner on November 30, 2009. He became a registered Associated Person of GreenHaven, LLC on September 14, 2006. He became an Associated Person of Grain Service Corporation, Inc. on February 9, 1998 and was listed as a principal of Grain Service Corporation, Inc. on March 26, 1998.
None of Mr. Pringle, Mr. Anderson, or Mr. Glasing receives a salary directly from the Master Fund, orcollectively as the Fundcontext requires) was formed as a result of serving in any capacity. However, a portion the Management Fee that is received for the services provided by the Managing Owner may be used for payment of compensation to such individuals.
The following individuals serve as Independent Directors of the Managing Owner.
Thomas J Mangold spent thirty seven years in public accounting with PricewaterhouseCoopers LLP (PwC)Delaware statutory trust on October 27, 2006, and WisdomTree Continuous Commodity Index Master Fund (the “Master Fund”), serving national and international public and private clients. He has extensive experience in providing financial reporting, accounting, internal control and mergers and acquisitions expertise. He also served in various leadership roles for PwC including leading its Information and Communication practice andwas formed as a member of the firm’s U.S. Extended Leadership Team. Mr. Mangold is a certified public accountant and holds a bachelor’s degree in accounting from the University of Cincinnati.
Stephen O’Grady has more than thirty nine years experience in the financial services sector, most recently as part of GFI Group where he helped start the company’s ETF division. Prior to GFI, Mr. O’Grady spent 7 years as a partner at Kellogg Capital Group, and for six years served as a Senior Vice President and Floor Manager for ABN-AMRODelaware statutory trust on the American Stock Exchange. Mr. O’Grady was also President for SOG, Inc, a New York Stock Exchange options brokerage firm. He was co-founder and President of Labranche Futures, and a partner at the New York Futures Exchange. Mr. O’Grady started his career in the municipal bond markets, serving as Vice President and Head of Municipal Bond Trading and Underwriting at Chemical Bank, and as an employee in the Municipal Bond Department of Bankers Trust Company. Mr. O'Grady holds a Masters of Business Administration from Harvard Business School and a Bachelors of Arts Degree in Economics from Williams College.
Cengiz Searfoss is a Senior Director of Corporate Finance at Aetna Inc. He serves as Managing Director of DCS Capital, a US hedge fund, and previously was a Partner at West Broadway Partners, a multi-strategy hedge fund. Prior to his position at West Broadway Partners, he was a Financial Analyst at Goldman, Sachs and Company, and began his career as an Auditor at KPMG Peat Marwick, where he qualified as a Certified Public Accountant. He received his BBA in Accountancy from the University of Notre Dame.
The Managing Owner has an audit committee which is made up of the three independent directors, TJ Mangold, Stephen O’Grady, and Cengiz Searfoss. Mr. Mangold is the Chair of the Audit Committee. The audit committee is governed by an audit committee charter that is posted on the Fund’s website. The Board considers TJ Mangold to be an “Audit Committee Financial Expert” as such term is referenced in Item 407(d)(5) of Regulation S-K. The Board also believes that Messrs, O’Grady and Searfoss are able to read and understand financial statements and meet the financial sophistication requirements of the NYSE Arca and applicable FINRA rules as they relate to audit committees.
As of December 31, 2012, none of either Mr. Pringle, Mr. Anderson, Mr. Glasing or any Director owned any Shares, and the Managing Owner owned fifty (50) Shares.
Other Committees
Since the individuals who perform work on behalf of the Managing Owner are not compensated by the Fund, but instead by the Managing Owner, the Fund does not have a compensation committee. Similarly, since the Directors noted above serve on the board of directors of the Managing Owner, there is no nominating committee of the board of directors that acts on behalf of the Fund.
Code of Ethics
The Fund has no officers or employees and is managed by GreenHavenOctober 27, 2006. WisdomTree Commodity Services, LLC (the “Managing Owner”)
. The serves the Fund as commodity pool operator and managing owner.Effective January 1, 2016, in accordance with the terms of a Unit Purchase Agreement dated October 29, 2015, GreenHaven LLC sold 100% of the issued and outstanding membership interest in the Managing Owner has adoptedto WisdomTree Investments Inc. Following the code of ethics of ALPS, Inc (the “Distributor”), which applies to all of its directors. Ethics training and annual review applies to all officerssale, the name of the Managing Owner. A copyFund was changed from “GreenHaven Continuous Commodity Index Fund” to “WisdomTree Continuous Commodity Index Fund,” the name of the PolicyMaster Fund was changed from “GreenHaven Continuous Commodity Index Master Fund” to “WisdomTree Continuous Commodity Index Master Fund,” and Procedure Manualthe name of the Managing Owner which includes ethics trainingwas changed from “GreenHaven Commodity Services, LLC” to “WisdomTree Commodity Services, LLC.” As of January 1, 2016, the Fund’s Sub-Advisor and review, can be obtainedcommodity trading advisor is GreenHaven Advisors LLC.
The Fund offers common units of beneficial interest (the “Shares”). Upon inception, 50 General Units of the Fund were issued to the Managing Owner in exchange for a capital contribution of $1,500.
The proceeds from the offering of Shares are invested in the Master Fund (See Note 7 for details of the procedures for creation and redemption of Shares in the Fund). The Master Fund actively trades exchange traded futures on the Managing Owner’s website: www.greenhavenfunds.com.
Executive Compensation
commodities comprising the Thomson Reuters Continuous Commodity Index (the “Index”), with a view to tracking the performance of the Index over time. The Master Fund’s Portfolio also includes United States Treasury securities and other high credit-quality short-term fixed income securities for deposit with the Master Fund’s commodity broker as margin. The Fund has no employees, officers or directorswholly owns the Master Fund. The Fund and Master Fund commenced investment operations on January 23, 2008 with the offering of 350,000 Shares in exchange for $10,500,000. The Fund commenced trading on the American Stock Exchange (now known as the NYSE Arca) on January 24, 2008 and, as of November 25, 2008, was listed on the NYSE Arca. For a description of the Fund’s offerings following the commencement of trading see Part II, Item 5.The Index is managedintended to reflect the performance of certain commodities. Through January 6, 2013, the commodities comprising the Index (the “Index Commodities”) were: corn, soybeans, wheat, live cattle, lean hogs, gold, silver, copper, cocoa, coffee, sugar, cotton, orange juice, platinum, crude oil, NY Harbor ULSD (formerly known as heating oil), and natural gas. The Index was revised on January 7, 2013 to include soybean oil and remove orange juice.
The Managing Owner and the Shareholders share in any profits and losses attributable to the Fund in proportion to the percentage interest owned by each.
The Managing Owner, the Funds, and the Master Fund retain the services of third party service providers for the ongoing operations of the Fund and the Master Fund (See Note (2)).
(2) Service Providers and Related Party Agreements
(a) “The Trustee” – CSC Trust is the trustee for the Fund and Master Fund. CSC Trust is headquartered in Wilmington, Delaware.
(b) “The Managing Owner” – WisdomTree Commodity Services, LLC (f/k/a GreenHaven Commodity Services, LLC. NoneLLC) is the managing owner of the directorsFund and Master Fund and is responsible for the day to day operations of both entities. The Managing Owner charges the Fund a management fee for its services. The Managing Owner is a Delaware limited liability company with operations in New York, New York.
(c) “The Administrator” – The Bank of New York Mellon Corporation served as the administrator, custodian and transfer agent of the Fund for the fiscal year ended December 31, 2015. As of January 1, 2016, the Managing Owner, on behalf of the Fund, appointed State Street Bank and Trust Company as the Fund’s Administrator. The Administrator performs or officerssupervises the services necessary for the operation and administration of the Fund (other than making investment decisions) in accordance with various services agreements entered into with the Fund. These services include calculating the daily net asset value of the Fund (the “Net Asset Value”), accounting and other Fund administrative services. As the Fund’s transfer agent, the Administrator processes additions and redemptions of Shares. These transactions are processed on Depository Trust Company’s (“DTC”) book entry system. The Administrator retains certain financial books and records, including: Basket creation and redemption books and records, fund accounting records, ledgers with respect to assets, liabilities, capital, income and expenses, the registrar, transfer journals and related details and trading and related documents received from futures commission merchants. The Bank of New York Mellon Corporation is based in New York, New York and State Street Bank and Trust Company has an office in Boston, Massachusetts.
(d) “The Commodity Broker” –Morgan Stanley & Co. Incorporated (“MS&Co.”)is the Master Fund’s Commodity Broker. In its capacity as the Commodity Broker, it executes and clears each of the Master Fund’s futures transactions and performs certain administrative services for the Master Fund. MS&Co. is based in New York, New York.
(e) “The Distributor” – ALPS Distributors, Inc. served as the Fund’s Distributor for the fiscal year ended December 31, 2015. As of January 1, 2016, the Managing Owner, on behalf of the Fund, appointed Foreside Fund Services LLC (“FFS”) as the Fund’s Distributor. The Fund’s Distributor assists the Managing Owner and the Administrator with certain functions and duties relating to the creation and redemption of Baskets, including receiving and processing orders from the Fund’s Authorized Participants to create and redeem Baskets, coordinating the processing of such orders and related functions and duties. ALPS Distributors, Inc. is based out of Denver, Colorado and FFS has an office in Portland, Maine.
(f) “The Authorized Participant” — Authorized Participants may create or redeem shares of the Fund. Each Authorized Participant must (1) be a registered broker-dealer or other securities market participant such as a bank or other financial institution which is not required to register as a broker-dealer to engage in securities transactions, (2) be a participant in the Depository Trust Company, or DTC, and (3) have entered into a Participant Agreement with the Fund and the Managing Owner. The Participant Agreement sets forth the procedures for the creation and redemption of Baskets of Shares and for the delivery of cash required for such creations or redemptions. The current Authorized Participants are J.P. Morgan Securities LLC, Merrill Lynch Professional Clearing Corporation, Morgan Stanley & Co. Incorporated, and RBC Capital Markets, LLC. A similar agreement between the Fund and the Master Fund sets forth the procedures for the creation and redemption of baskets of Master Units.
(3) Summary of Significant Accounting Policies
(a) Use of Estimates
The preparation of the financial statements in conformity with accounting principles generally accepted in the United States of America requires management to make estimates and assumptions that affect the reported amounts of assets and liabilities and disclosure of contingent assets and liabilities at the date of the financial statements and the reported amounts of revenue and expenses during the period. Actual results could differ from those estimates.
(b) Cash Held by Broker
The Fund defines cash held by broker to be cash and highly liquid investments with remaining maturities of three months or less when acquired. MS&Co. allows the Master Fund to apply its Treasury Bill portfolio towards its initial margin requirement for the Master Fund’s futures positions, hence all cash held by broker is unrestricted cash. The cash and Treasury bill positions are held in segregated accounts at MS&Co. and are not insured by the Federal Deposit Insurance Corporation.
(c) United States Treasury Obligations
The Master Fund records purchases and sales of United States Treasury Obligations on a trade date basis. These holdings are marked to market based on market quotations from broker-dealers or independent service providers. The Master Fund holds United States Treasury Obligations for deposit with the Master Fund’s commodity broker as margin and for trading and holding against initial margin of the open futures contracts. Interest income is recognized on an accrual basis when earned. Premiums and discounts are amortized or accreted over the life of the United States Treasury Obligations.
(d) Income Taxes
The Fund and Master Fund are classified as a grantor trust and a partnership respectively, for U.S. federal income tax purposes. Accordingly, neither the Fund nor the Master Fund is subject to U.S. federal, state, or local income taxes. No provision for federal, state, or local income taxes has been made in the accompanying consolidated financial statements, as investors are individually liable for income taxes, if any, on their allocable share of the Fund’s share of the Master Fund’s income, gain, loss, deductions and other items.
The Fund accounts for uncertainty in income taxes pursuant to the applicable accounting standard, which provides measurement, presentation and disclosure guidance related to uncertain tax positions. The guidance addresses how tax benefits claimed or expected to be claimed on a tax return should be recorded in the financial statements. Under this topic, the Fund recognizes the tax benefit from an uncertain tax position only if it is more likely than not that the tax position will be sustained on examination by the taxing authorities based on the technical merits of the position. The tax benefits recognized in the financial statements from such a position are measured based on the largest benefit that has a greater than fifty percent likelihood of being realized upon ultimate resolution. Management’s reassessment of the Fund’s tax positions has not had a material impact on the Fund’s financial condition, results of operations or liquidity in any year presented.
(e) Futures Contracts
The Master Fund purchases and holds commodity futures contracts for investment purposes. These contracts are recorded on a trade date basis and open contracts are valued daily at settlement prices provided by the relevant exchanges. In the consolidated statements of financial condition, futures contracts are presented at their published settlement prices on the last business day of the period, in accordance with the fair value accounting standard. Since these contracts are actively traded in markets that are directly observable and which provide readily available price quotes, their market value is deemed to be their fair value under the fair value accounting standard. (See Note 4 – Fair Value Measurements)
However, when market closing prices are not available, the Managing Owner may value an asset of the Master Fund pursuant to such other principles as the Managing Owner deems fair and equitable provided such principles are consistent with the fair value accounting standard. Realized gains (losses) and changes in unrealized appreciation (depreciation) on open positions are determined on a specific identification basis and recognized in the consolidated statements of income and expenses in the period in which the contract is closed or the changes occur, respectively.
(f) Basis of Presentation and Consolidation
All of the capital raised by the Fund is used to purchase common units of beneficial interest in the Master Fund. The financial statement balances of the Master Fund are consolidated with the Fund’s financial statement balances and all significant inter-company balances and transactions are eliminated. Separate financial statements of the Master Fund are presented to comply with SEC reporting requirements as the Master Fund is a separate SEC registrant.
(g) Subsequent Events
For purposes of disclosure in the consolidated financial statements, the Fund has evaluated events occurring between the year ended December 31, 2015 and when the financial statements were issued.
Subsequent to December 31, 2015, 0 Limited Shares were created and 750,000 Limited Shares were redeemed resulting in 11,350,000 Limited Shares outstanding.
Effective January 1, 2016, in accordance with the terms of a Unit Purchase Agreement dated October 29, 2015, GreenHaven LLC sold 100% of the issued and outstanding membership interest in the Managing Owner to WisdomTree Investments Inc. Following the sale, the name of the Fund was changed from “GreenHaven Continuous Commodity Index Fund” to “WisdomTree Continuous Commodity Index Fund,” the name of the Master Fund was changed from “GreenHaven Continuous Commodity Index Master Fund” to “WisdomTree Continuous Commodity Index Master Fund,” and the name of the Managing Owner was changed from “GreenHaven Commodity Services, LLC receive compensation from the Fund. GreenHavenLLC” to “WisdomTree Commodity Services, LLC receives a monthly management fee of 1/12 of 0.85% (0.85% annually)LLC.” The foregoing sale resulted in no accounting impact for the financial reporting period for the year ended December 31, 2015. Concurrent with the effectiveness of the average daily netsale, the audit committee of the Managing Owner resigned.
Other than these events, the evaluation did not result in any subsequent events that necessitated disclosures and/or adjustments.
(4) Fair Value Measurements
The guidance for fair value measurements establishes the authoritative definition for fair value, sets out a framework for measuring fair value and outlines the required disclosures regarding fair value measurements. Fair value is the price that would be received to sell an asset or paid to transfer a liability (an exit price) in the principal or most advantageous market for the asset or liability in an orderly transaction between market participants at the measurement date. The Fund uses a three-tier fair value hierarchy based upon observable and non-observable inputs as follows:
Level 1 — Quoted prices (unadjusted) in active markets for identical assets or liabilities that the reporting entity can access at the measurement date.
Level 2 — Inputs other than quoted prices included within Level 1 that are observable for the asset or liability, either directly or indirectly.
Level 3 — Unobservable inputs for the asset or liability.
The inputs or methodology used for valuing securities are not necessarily an indication of the risk associated with investing in those securities. The assets of the Fund duringare either exchange-traded securities or government securities that are valued using dealer and broker quotations or other inputs that are observable or can be corroborated by observable market data. A summary of the preceding month. During 2012, 2011,Fund’s assets and 2010 the Fund incurred management fees of $4,637,997, $5,895,201, and $2,523,863, respectively.
The Fund has no officers or directors. The following table sets forth certain information regarding beneficial ownership of our General Shares and Limited Sharesliabilities at fair value as of December 31,
2010, by management. No person2015, classified according to the levels used to value them, is
known by us to own beneficially more than 5% ofas follows:| Assets | | Quoted
Prices in
Active
Market
(Level 1) | | | Other
Significant
Observable
Inputs
(Level 2) | | | Significant
Unobservable
Inputs
(Level 3) | | | Totals | |
| U.S. Treasuries | | $ | - | | | $ | 149,980,000 | | | $ | - | | | $ | 149,980,000 | |
| Commodity Futures Contracts | | | (8,705,967 | ) | | | - | | | | - | | | | (8,705,967 | ) |
| Total | | $ | (8,705,967 | ) | | $ | 149,980,000 | | | $ | - | | | $ | 141,274,033 | |
There were no transfers between Level 1 and Level 2 for the outstanding shares of such class.
| | | | | | |
| | Name and Address of Beneficial Owner | | Amount and Nature of
Beneficial Ownership
| | Percent of Class |
General Shares | | GreenHaven Commodity Services LLC
c/o GreenHaven Commodity Services LLC
3340 Peachtree Rd, Suite 1910
Atlanta, GA 30326
| | 50 shares | | 100%
|
The Fund has no securities authorized for issuance under equity compensation plans.
The following table sets forth compensation earned from the Managing Owner during the year ended December 31, 2012,2015. The Fund did not hold any Level 3 securities during the year ended December 31, 2015.A summary of the Fund’s assets and liabilities at fair value as of December 31, 2014, classified according to the levels used to value them, are as follows:
| Assets | | Quoted
Prices in
Active
Market
(Level 1) | | | Other
Significant
Observable
Inputs
(Level 2) | | | Significant
Unobservable
Inputs
(Level 3) | | | Totals | |
| U.S. Treasuries | | $ | - | | | $ | 199,995,250 | | | $ | - | | | $ | 199,995,250 | |
| Commodity Futures Contracts | | | (27,249,076 | ) | | | - | | | | - | | | | (27,249,076 | ) |
| Total | | $ | (27,249,076 | ) | | $ | 199,995,250 | | | $ | - | | | $ | 172,746,174 | |
There were no transfers between Level 1 and Level 2 for the Fund during the year ended December 31, 2014. The Fund did not hold any Level 3 securities during the year ended December 31, 2014.
(5) Derivative Instruments and Hedging Activities
The Fund uses derivative instruments as part of its principal investment strategy to achieve its investment objective. For the year ended December 31, 2015 and 2014, the average month-end national amounts at open Coal Futures contracts were $247,056,205 and $330,146,759, respectively.
At December 31, 2015, the fair value of derivative instruments was as follows:
Derivative
Instruments | | Asset
Derivatives (i) | | | Liability
Derivatives | | | Net
Derivatives | |
| Commodity Futures Contracts | | $ | (8,705,967 | ) | | $ | - | | | $ | (8,705,967 | ) |
(i) Values are disclosed on the December 31, 2015 Statements of Financial Condition underNet unrealized depreciationon futures contracts.
The following is a summary of the realized and unrealized gains and losses of the derivative instruments utilized by the DirectorsFund for the year ended December 31, 2015:
Derivative
Instruments | | Statements of Income and Expenses Location | | Realized
Loss on
Derivative
Instruments | | | Net Change in
Unrealized Loss
on Derivative
Instruments | |
| Commodity Futures Contracts | | Net realized loss
Net change in unrealized gain (loss) | | | (67,922,804 | ) | | | (18,543,109 | ) |
At December 31, 2014, the fair value of derivative instruments was as follows:
Derivative
Instruments | | Asset
Derivatives (ii) | | | Liability Derivatives | | | Net
Derivatives | |
| Commodity Futures Contracts | | $ | (27,249,076 | ) | | $ | - | | | $ | (27,249,076 | ) |
(ii) Values are disclosed on the December 31, 2014 Statements of Financial Condition underNet unrealized depreciationon futures contracts.
The following is a summary of the realized and unrealized gains and losses of the derivative instruments utilized by the Fund for the year ended December 31, 2014 and 2013:
Derivative
Instruments | | Statements of Income and Expenses Location | | Realized
Loss on
Derivative
Instruments | | | Net Change in
Unrealized Loss
on Derivative
Instruments | |
| Commodity Futures Contracts (2014) | | Net realized loss
Net change in unrealized gain (loss) | | | (12,125,640 | ) | | | (23,193,888 | ) |
| Commodity Futures Contracts (2013) | | Net realized loss
Net change in unrealized gain (loss) | | | (53,539,832 | ) | | | 8,459,270 | |
(6) Financial Instrument Risk
In the normal course of its business, the Fund is party to financial instruments with off-balance sheet risk. The term “off-balance sheet risk” refers to an unrecorded potential liability that, even though it does not appear on the balance sheet, may result in a future obligation or loss. The financial instruments used by the Fund are commodity futures, whose values are based upon an underlying asset and generally represent future commitments that have a reasonable possibility to be settled in cash or through physical delivery. These instruments are traded on an exchange and are standardized contracts.
Market risk is the potential for changes in the value of the financial instruments traded by the Fund due to market changes, including fluctuations in commodity prices. In entering into these contracts, there exists a market risk that such contracts may be significantly influenced by conditions, resulting in such contracts being less valuable. If the markets should move against all of the futures interest positions at the same time, and the Managing Owner was unable to offset such positions, the Fund could experience substantial losses.
Credit risk is the possibility that a loss may occur due to the failure of an exchange clearinghouse to perform according to the terms of a contract. Credit risk with respect to exchange-traded instruments is reduced to the extent that an exchange or clearing organization acts as counterparty to the transactions. The Fund’s risk of loss in the event of counterparty default is typically limited to the amounts recognized in the statement of financial condition and not represented by the contract or notional amounts of the instruments.
The Fund and the Master Fund have not utilized, nor do they expect to utilize in the future, special purpose entities to facilitate off-balance sheet financing arrangements and have no loan guarantee arrangements or off-balance sheet arrangements of any kind other than agreements entered into in the normal course of business.
(7) Share Creations and Redemptions
General. On any business day, an Authorized Participant may place an order with the Fund’s Distributor (as facilitated by the Fund’s Administrator) to create one or more Baskets. For purposes of processing both purchase and redemption orders, a “business day” means any day other than a day when banks in New York City are required or permitted to be closed. Purchase orders must be placed by 10:00 a.m., New York time. The day on which a valid purchase order is received is the purchase order date. Purchase orders are irrevocable. By placing a purchase order, and prior to delivery of such Baskets, an Authorized Participant’s DTC account will be charged the non-refundable transaction fee due for the purchase order.
Determination of Required Payment. The total payment required to create each Basket is the Net Asset Value of 50,000 Shares as of the closing time of NYSE Arca or the last to close of the exchanges on which the Index Commodities are traded, whichever is later, on the purchase order date. Baskets will be issued as of 12:00 p.m., New York time, on the business day immediately following the purchase order date at Net Asset Value per Share as of the closing time of NYSE Arca or the last to close of the exchanges on which the Index Commodities are traded, whichever is later, on the purchase order date during the continuous offering period, but only if the required payment has been timely received.
Because orders to purchase Baskets must be placed by 10:00 a.m., New York time, but the total payment required to create a Basket during the continuous offering period will not be determined until 4:00 p.m., New York time, on the date the purchase order is received, Authorized Participants will not know the total amount of the payment required to create a Basket at the time they submit an irrevocable purchase order for the Basket. The Fund’s Net Asset Value and the total amount of the payment required to create a Basket could rise or fall substantially between the time an irrevocable purchase order is submitted and the time the amount of the purchase price in respect thereof is determined.
Rejection of Purchase Orders. The Administrator may reject a purchase order if:
| (i) | it determines that the purchase order is not in proper form; |
| (ii) | the Managing Owner believes that the purchase order would have adverse tax consequences to the Fund or its Shareholders; or |
| (iii) | circumstances outside the control of the Managing Owner or the Distributor make it, for all practical purposes, not feasible to process creations of Baskets. |
The Distributor and the Managing Owner will not be liable for the rejection of any purchase order.
Redemption Procedures
General. The procedures by which an Authorized Participant can redeem one or more Baskets mirror the procedures for the creation of Baskets. On any business day, an Authorized Participant may place an order with the Distributor (as facilitated by the Administrator) to redeem one or more Baskets. Redemption orders must be placed by 10:00 a.m., New York time. The day on which a valid redemption order is received in proper form is the redemption order date. Redemption orders are irrevocable. Individual Shareholders may not redeem directly from the Fund.
By placing a redemption order, an Authorized Participant agrees to deliver the Baskets to be redeemed through DTC’s book-entry system to the Fund not later than 12:00pm, New York time, on the business day immediately following the redemption order date. By placing a redemption order, and prior to receipt of the redemption proceeds, an Authorized Participant’s DTC account will be charged the non-refundable transaction fee due for the redemption order.
Determination of Required Payment. The redemption proceeds from the Fund consist of the cash redemption amount equal to the Net Asset Value of the number of Basket(s) requested in the Authorized Participant’s redemption order as of the closing time of the NYSE Arca or the last to close of the exchanges on which the Index Commodities are traded, whichever is later, on the redemption order date. The Managing Owner will distribute the cash redemption amount at 12:00 p.m., New York time, on the business day immediately following the redemption order date through DTC to the account of the Authorized Participant as recorded on DTC’s book entry system.
Delivery of Redemption Proceeds. The redemption proceeds due from the Fund are delivered to the Authorized Participant at 12:00pm, New York time, on the business day immediately following the redemption order date if, by such time, the Fund’s DTC account has been credited with the Baskets to be redeemed. If the Fund’s DTC account has not been credited with all of the Baskets to be redeemed by such time, the redemption distribution is delivered to the extent of whole Baskets received. Any remainder of the redemption distribution is delivered on the next business day to the extent of remaining whole Baskets received if the Distributor receives the fee applicable to the extension of the redemption distribution date which the Distributor may, from time-to-time, determine and the remaining Baskets to be redeemed are credited to the Fund’s DTC account by 12:00pm, New York time, on such next business day. Any further outstanding amount of the redemption order shall be cancelled. The Distributor is also authorized to deliver the redemption distribution notwithstanding that the Baskets to be redeemed are not credited to the Fund’s DTC account by 12:00pm, New York time, on the business day immediately following the redemption order date if the Authorized Participant has collateralized its obligation to deliver the Baskets through DTC’s book entry system on such terms as the Distributor and the Managing Owner may from time-to-time agree upon.
Suspension or Rejection of Redemption Orders. The Managing Owner may suspend the right of redemption, or postpone the redemption settlement date, (1) for any period during which an emergency exists as a result of which the redemption distribution is not reasonably practicable, or (2) for such other period as the Managing Owner determines to be necessary for the protection of the Shareholders. The Managing Owner will not be liable to any person or in any way for any loss or damages that may result from any such suspension or postponement.
A redemption order may be rejected if the order is not in proper form as described in the order form and/or Participant Agreement or if the fulfillment of the order, in the opinion of its counsel, might be unlawful.
(8) Operating Expenses
(a) Management Fee
The Fund pays the Managing Owner a management fee (the “Management Fee”) monthly in arrears, in an amount equal to 0.85% per annum of the net asset value of the Master Fund. The management fees incurred for the years ended December 31, 2015, 2014 and 2013 were $2,121,828, $2,835,654 and $3,500,487, respectively. The Management Fees were charged to the Fund and paid to the Managing Owner.
(b) Organization and Offering Expenses
Expenses incurred in connection with organizing the Fund and the offering of the Shares were paid by GreenHaven, LLC. GreenHaven, LLC is the former sole member of the Managing Owner.
| | | | | | | | | | | Change in | | | | | | | |
| | | | | | | | | | | Pension | | | | | | | |
| | | | | | | | | | | Value and | | | | | | | |
| | | Fees | | | | | | | | Nonqualified | | | | | | | |
| | | Earned or | | | | | | Non-Equity | | Deferred | | | | | | | |
| | | Paid in | | Stock | | Option | | Incentive Plan | | Compensation | | | All Other | | | | |
| Name | | Cash | | Awards | | Awards | | Compensation | | Plan | | | Compensation(1) | | | Total | |
| Independent Directors | | | | | | | | | | | | | | | | | | | | | |
| Michael Loungo | | $ | 21,000 | | NA | | NA | | NA | | $ | NA | | | $ | NA | | | $ | 21,000 | |
| Edward O’Neil | | $ | 15,000 | | NA | | NA | | NA | | $ | NA | | | $ | NA | | | $ | 15,000 | |
| Marcus Bensman | | $ | 15,000 | | NA | | NA | | NA | | $ | NA | | | $ | NA | | | $ | 15,000 | |
| Cengiz Searfoss | | $ | 10,000 | | NA | | NA | | NA | | $ | NA | | | $ | NA | | | $ | 10,000 | |
| Thomas Mangold | | $ | 0 | | NA | | NA | | NA | | | NA | | | $ | NA | | | $ | 0 | |
| Stephen O’Grady | | $ | 0 | | NA | | NA | | NA | | | NA | | | $ | NA | | | $ | 0 | |
AuditThe Fund does not have an obligation to reimburse GreenHaven, LLC or its affiliates for organization and
Non-Auditoffering expenses paid on their behalf.(c) Brokerage Commissions, Fees,
and Routine Operational, Administrative, and Other Ordinary ExpensesThe following table sets forthManaging Owner does not expect brokerage commissions and fees as well as routine operational, administrative and other ordinary expenses for which the Funds are responsible, including, but not limited to, the fees and expenses of the Trustee, legal and accounting fees and expenses, tax preparation expenses, filing fees, and printing, mailing and duplication costs, to exceed 0.20% of the Net Asset Value of the Master Fund in any year, although the actual amount of such fees and expenses in any year may be greater. The Fund’s brokerage commissions and fees and routine operational, administrative and other ordinary expenses are accrued at a rate of 0.20% per annum in the aggregate. Of the amounts so accrued, the Fund first pays brokerage fees, and secondly, from the remainder of the amounts so accrued, reimburses the Managing Owner for professional services rendered by Grant Thornton, the Fund’s independent registered public accounting firm.
| | | Fiscal Year Ended December 31, 2012 | | | Fiscal Year Ended December 31, 2011 | |
| Audit Fees | | $ | 151,000 | | | $ | 151,000 | |
| Audit-Related Fees | | | | | | | | |
| Tax Fees | | | | | | | | |
| All Other Fees | | | | | | | | |
| Total | | $ | 151,000 | | | $ | 151,000 | |
Approvalroutine operational, administrative and other ordinary expenses paid by the Managing Owner.Brokerage commissions and fees are charged against the Fund’s assets on a per transaction basis. The brokerage commissions, trading fees and routine operational, administrative, and other ordinary expenses incurred for the years ended December 31, 2015, 2014 and 2013 were $499,254, $667,213 and $823,644, respectively.
(d) Unusual Fees and Expenses
The Fund will pay all the unusual fees and expenses, if any, of Independent Registered Public Accounting Firm Servicesthe Fund. Such unusual fees and Fees
expenses, by their nature, are unpredictable in terms of timing and amount. There have been no unusual fees or expenses since the Fund commenced investment operations on January 23, 2008.(9) Termination
The Audit Committeeterm of the Fund is perpetual, unless terminated in certain circumstances as defined in the Trust Agreement.
(10) Profit and Loss Allocations and Distributions
The Managing Owner and the Shareholders share in any profits and losses of the Fund in proportion to the percentage interest owned by each. Distributions may be made at the sole discretion of the Managing Owner approved 100%on a pro rata basis in accordance with the respective capital balances of the services provided by Grant Thornton to the Fund described above. shareholders.
(11) Commitments and Contingencies
The Audit Committee ofManaging Owner, either in its own capacity or in its capacity as the Managing Owner pre-approves all audit and allowed non-audit serviceson behalf of the Fund, has entered into various service agreements that contain a variety of representations, or provide indemnification provisions related to certain risks service providers undertake in performing services which are in the best interest of the Fund. As of December 31, 2015, no claims had been received by the Fund and it was therefore not possible to estimate the Fund’s independent registered public accounting firm, including all engagement fees and terms.
potential future exposure under such indemnification provisions.(a)(1) Financial Statements
See financial statements commencing on page 50 hereof.
(a)(2) Financial Statement Schedules
No financial statement schedules are filed herewith because (i) such schedules are not required or (ii) the information required has been presented in the aforementioned financial statements.
(a)(3) Exhibits
(12) Net Asset Value and Financial Highlights
The Fund is presenting the following Net Asset Value and financial highlights related to investment performance and operations for a Share outstanding for the years ended December 31, 2015, 2014 and 2013. The total return at net asset value is based on the change in net asset value of the Shares during the period and the total return at market value is based on the change in market value of the Shares on the NYSE Arca during the period. An individual investor’s return and ratios may vary based on the timing of capital transactions.
| | | Year Ended
December 31,
2015 | | | Year Ended
December 31,
2014 | | | Year Ended
December 31,
2013 | |
| Net Asset Value | | | | | | | | | | | | |
| Net asset value per Limited Share, beginning of year | | $ | 22.81 | | | $ | 25.70 | | | $ | 28.85 | |
| | | | | | | | | | | | | |
| Net realized and change in unrealized loss | | | (4.04 | ) | | | (2.62 | ) | | | (2.88 | ) |
| Net investment loss | | | (0.21 | ) | | | (0.27 | ) | | | (0.27 | ) |
| Net decrease in net assets from operations | | | (4.25 | ) | | | (2.89 | ) | | | (3.15 | ) |
| Net asset value per Limited Share, end of year | | $ | 18.56 | | | $ | 22.81 | | | $ | 25.70 | |
| | | | | | | | | | | | | |
| Market value per Limited Share, beginning of year | | $ | 22.86 | | | $ | 25.70 | | | $ | 28.83 | |
| Market value per Limited Share, end of year | | $ | 18.52 | | | $ | 22.86 | | | $ | 25.70 | |
| Ratio to average Net Assets | | | | | | | | | | | | |
| Net investment loss * | | | (1.03 | )% | | | (1.04 | )% | | | (1.01 | )% |
| Total expenses | | | 1.05 | % | | | 1.05 | % | | | 1.05 | % |
| | | | | | | | | | | | | |
| Total Return, at net asset value | | | (18.63 | )% | | | (11.25 | )% | | | (10.92 | )% |
| Total Return, at market value | | | (18.99 | )% | | | (11.05 | )% | | | (10.86 | )% |
* Net investment loss is calculated by subtracting the Fund expenses from U.S Treasury Obligations income.
EXHIBIT NO. | DESCRIPTION |
4.1 | Amended Declaration of Trust and Trust Agreement of the Registrant1
|
| |
4.2 | Amended Declaration of Trust and Trust Agreement of the Co-Registrant1
|
| |
4.3 | Form of Participant Agreement2
|
| |
10.1 | Form of Escrow Agreement3
|
| |
| |
10.2 | Form of Global Custody Agreement3
|
| |
10.3 | Form of Administration Agreement4
|
| |
10.4 | Form of Transfer Agency and Service Agreement3
|
| |
10.5 | Form of Distribution Services Agreement4
|
| |
10.6
10.7
10.9
10.10
10.11
10.12
10.13
10.14
10.15
| Marketing Agreement with ALPS Distributors, Inc4
License Agreement1
Addendum to License Agreement5
Addendum to License Agreement6
Addendum to License Agreement7
Addendum to License Agreement8
Amendment to Marketing Services Agreement9
Amendment to Marketing Services Agreement10
Amendment to Marketing Services Agreement11
F-30 |
1 Previously filed as an exhibit to Form S-1 on November 3, 2006 and incorporated herein by reference.
2 Previously filed as an exhibit to Pre-Effective Amendment No. 3 to Form S-1 on October 2, 2007 and incorporated herein by reference.
3 Previously filed as an exhibit to Pre-Effective Amendment No. 2 to Form S-1 on August 1, 2007 and incorporated herein by reference.
4 Previously filed as an exhibit to Form 8-K on January 14, 2008 and incorporated herein by reference.
5 Previously filed as an exhibit to Form 8-K on March 6, 2009 and incorporated herein by reference.
6 Previously filed as an exhibit to Form 8-K on October 1, 2009 and incorporated herein by reference.
7 Previously filed as an exhibit to Form 8-K on October 14, 2010 and incorporated herein by reference.
8 Previously filed as an exhibit to Form 8-K on October 6, 2011 and incorporated herein by reference.
9 Previously filed as an exhibit to Form 8-K on May 1, 2009 and incorporated herein by reference.
10 Previously filed as an exhibit to Form 8-K on May 19, 2009 and incorporated herein by reference.
10.16 | Amendment to Distribution Agreement9
|
10.17 | Addendum to License Agreement12 |
23.1 | Consent of Independent Registered Public Accounting Firm |
31.1 | Certificate Pursuant to Rule 13a-14(a) under the Securities Exchange Act of 1934 (filed herewith) |
31.2 | Certificate Pursuant to Rule 13a-14(a) under the Securities Exhange Act of 1934 (filed herewith) |
31.3 | Certificate Pursuant to Rule 13a-14(a) under the Securities Exchange Act of 1934 (filed herewith) |
31.4 | Certificate Pursuant to Rule 13a-14(a) under the Securities Exchange Act of 1934 (filed herewith) |
32.1 | Certificate Pursuant to 18 U.S.C. Section 1350, As Adopted Pursuant to Section 906 of the Sarbanes-Oxley Act of 2002 (furnished herewith) |
32.2 | Certificate Pursuant to 18 U.S.C. Section 1350, As Adopted Pursuant to Section 906 of the Sarbanes-Oxley Act of 2002 (furnished herewith) |
32.3 | Certificate Pursuant to 18 U.S.C. Section 1350, As Adopted Pursuant to Section 906 of the Sarbanes-Oxley Act of 2002 (furnished herewith) |
32.4 | Certificate Pursuant to 18 U.S.C. Section 1350, As Adopted Pursuant to Section 906 of the Sarbanes-Oxley Act of 2002 (furnished herewith) |
99.1 | | Prospectus filed by the registrant on January 13, 2011 pursuant to Rule 424(b)(3) of the Securities Act (File No.333-170917) |
11 Previously filed as an exhibit to Form 8-K on August 16, 2010 and incorporated herein by reference.
12 Previously filed as an exhibit to Form 8-K on March 3, 2012, and incorporated herein by reference.
Pursuant to the requirements of the Securities Exchange Act of 1934, the Registrant hasregistrant and co-registrant have duly caused this Annual report to be signed on its behalf by the undersigned, thereunto duly authorized.
| | GreenHaven Continuous Commodity Index Fund |
| | |
| By: | GreenHavenWisdomTree Commodity Services, LLC, |
| | | its Managing OwnerSponsor of the WisdomTree Continuous Commodity Index Fund (registrant) |
| | | |
| | By: | /s/ Ashmead PringleGregory Barton |
| | Name: | Ashmead PringleGregory Barton |
| | Title: | Director and Chief Executive Officer |
| | | |
Dated: February 26, 2013
| By: | /s/ Cooper Anderson |
| Name: | Cooper Anderson |
| Title: | Chief Operating Officer (principal financial officer) |
| GreenHaven Continuous Commodity Index Master Fund(Principal Executive Officer) |
| | | |
| | By:Date: | GreenHaven Commodity Services LLC, |
| | its Managing OwnerMarch 15, 2016 |
| | | |
| | By: | /s/ Ashmead PringleDavid Castano |
| | Name: | Ashmead PringleDavid Castano |
| | Title:Chief Financial Officer |
| Director and Chief Executive Officer(Principal Financial Officer) |
| | | |
Dated: February 26, 2013
| Date: | March 15, 2016 |
| | |
| WisdomTree Commodity Services, LLC, |
| Sponsor of the WisdomTree Continuous Commodity Index Master Fund (co-registrant) |
| | |
| By: | /s/ Cooper AndersonGregory Barton |
| | Name: | Cooper AndersonGregory Barton |
| | Title:Chief Executive Officer |
| (Principal Executive Officer) |
| | |
| Date: | March 15, 2016 |
| | |
| By: | /s/ David Castano |
| David Castano |
| Chief OperatingFinancial Officer (principal financial officer) |
| (Principal Financial Officer) |
| | |
| Date: | March 15, 2016 |
84