UNITED STATES
SECURITIES AND EXCHANGE COMMISSION
Washington, D.C. 20549
FORM 10-K
| x | Annual Report pursuant to Section 13 or 15(d) of the Securities Exchange Act of 1934 For the fiscal year ended December 31, 20122013 |
| |
| o | Transition Report pursuant to Section 13 or 15(d) of the Securities Exchange Act of 1934 For the transition period from _______to_______ |
Commission File Number 0-53713
OTTER TAIL CORPORATION
(Exact name of registrant as specified in its charter)
| | |
| MINNESOTA | | 27-0383995 |
| (State or other jurisdiction of incorporation or organization) | | (I.R.S. Employer Identification No.) |
| | | |
| 215 SOUTH CASCADE STREET, BOX 496, FERGUS FALLS,MINNESOTA | | 56538-0496 |
(Address (Address of principal executive offices) | (Zip | (Zip Code) |
Registrant’s telephone number, including area code: 866-410-8780
Securities registered pursuant to Section 12(b) of the Act:
| | | | |
| Title of each class | | Name of each exchange on which registered |
| | COMMON SHARES, par value $5.00 per share | | The NASDAQ Stock Market LLC |
Securities registered pursuant to Section 12(g) of the Act:
CUMULATIVE PREFERRED SHARES, without par valueNone
Indicate by check mark if the registrant is a well-known seasoned issuer, as defined in Rule 405 of the Securities Act. (Yes x No o)
Indicate by check mark if the registrant is not required to file reports pursuant to Section 13 or
Section 15(d) of the Act. (Yes oNo x))
Indicate by check mark whether the registrant (1) has filed all reports required to be filed by Section 13 or 15(d) of the Securities Exchange Act of 1934 during the preceding 12 months (or for such shorter period that the registrant was required to file such reports), and (2) has been subject to such filing requirements for the past 90 days. (Yes x No o)
Indicate by check mark whether the registrant has submitted electronically and posted on its corporate Web site, if any, every Interactive Data File required to be submitted and posted pursuant to Rule 405 of Regulation S-T during the preceding 12 months (or for such shorter period that the registrant was required to submit and post such files). (Yes xNo o)
Indicate by check mark if disclosure of delinquent filers pursuant to Item 405 of Regulation S-K is not contained herein and will not be contained, to the best of the registrant’s knowledge, in definitive proxy or information statements incorporated by reference in Part III of this Form 10-K or any amendment to this Form 10-K. x
Indicate by check mark whether the registrant is a large accelerated filer, an accelerated filer, a non-accelerated filer or a smaller reporting company. See the definitions of “large accelerated filer,” “accelerated filer” and “smaller reporting company” in Rule 12b-2 of the Exchange Act. (Check one):
| | | |
| Indicate by check mark whether the registrant is a large accelerated filer, an accelerated filer, a non-accelerated filer or a smaller reporting company. See the definitions of “large accelerated filer,” “accelerated filer” and “smaller reporting company” in Rule 12b-2 of the Exchange Act. (Check one): |
| | Large Accelerated Filer x | | Accelerated Filer o |
| | Non-Accelerated Filer o | | Smaller Reporting Company o |
| | (Do not check if a smaller reporting company) | | |
Indicate by check mark whether the registrant is a shell company (as defined in Rule 12b-2 of the Exchange Act). (Yeso No x)
The aggregate market value of common stock held by non-affiliates, computed by reference to the last sales price on June 29, 201228, 2013 was $777,976,655.972,636,461.
Indicate the number of shares outstanding of each of the registrant’s classes of common stock, as of the latest practicable date: 36,169,48836,340,637 Common Shares ($5 par value) as of February 15, 2013.14, 2014.
Documents Incorporated by Reference:
Proxy Statement for the 20132014 Annual Meeting-Portions incorporated by reference into Part III
OTTER TAIL CORPORATION
FORM 10-K TABLE OF CONTENTS
| | | Description | Page Numbers |
| | Description | Page |
| | | 2 | |
| | | | |
| | | 4 | |
| | | 2928 | |
| | | 35 | |
| | | 35 | |
| | | 36 | |
| | | 36 | |
| | | 36 | |
| | | | | |
| | | | |
| | | 37 | |
| | | 38 | |
| | | 38 | |
| | | 6165 | |
| | | | |
| | | | 6367 | |
| | | 6468 | |
| | | 6670 | |
| | | 6771 | |
| | | 6872 | |
| | | 6973 | |
| | | 7074 | |
| | | 7175 | |
| | | 120125 | |
| | | 121126 | |
| | | 121126 | |
| | | 121126 | |
| | | | |
| | | | |
| | | 122127 | |
| | | 122127 | |
| | | 123127 | |
| | | 123127 | |
| | | 123127 | |
| | | | |
| | | | |
| | | 124128 | |
| | | | |
| | | 132137 | |
The following abbreviations or acronyms are used in the text. References in this report to “the Company”, “we”, “us” and “our” are to Otter Tail Corporation, collectively.Corporation.
| | |
| ADP | | Advance Determination of Prudence |
| Aevenia | | Aevenia, Inc. |
| AFUDC | | Allowance for Funds Used During Construction |
| AQCS | | Air Quality Control System |
| ARO | | Accumulated Asset Retirement Obligation |
| ASC | | Accounting Standards Codification |
| ASC 980 | | ASC Topic 980 - Regulated Operations |
| ASM | | Ancillary Services Market |
| Aviva | | Aviva Sports, Inc. |
| BACT | | Best-Available Control Technology |
| BART | | Best-Available Retrofit Technology |
| Bemidji Project | | Bemidji-Grand Rapids 230 kV Project |
| Brookings Project | | Brookings-Southeast Twin Cities 345 kV Project |
| BTD | | BTD Manufacturing, Inc. |
| CAA | | Clean Air Act |
| CAIR | | Clean Air Interstate Rule |
| CapX2020 | | Capacity Expansion 2020 |
| Cascade | | Cascade Investment LLC |
| Cascade Note | | $50 million 8.89% Senior Unsecured Note due November 30, 2017 |
| CCMC | | Coyote Creek Mining Company, L.L.C. |
CCRA | Conservation Cost Recovery Adjustment |
CO2 | | Carbon Dioxide |
| CON | | Certificate of Need |
| CSAPR | | Cross-State Air Pollution Rule |
| CWIP | | Construction Work in Progress |
| DENR | | Department of Environment and Natural Resources |
DMIDMS | DMI Industries, Inc. |
DMS | DMS Health Technologies, Inc. |
ECRRECR | | Environmental Cost Recovery Rider |
| EEI | | Edison Electric Institute Index |
| EEP | | Energy Efficiency Plan |
| EPA | | Environmental Protection Agency |
| ERCOT | | Electric Reliability Council of Texas |
| ESSRP | | Executive Survivor and Supplemental Retirement Plan |
| Fargo Project | | Fargo-Monticello 345 kV Project |
| FASB | | Financial Accounting Standards Board |
| FERC | | Federal Energy Regulatory Commission |
| Foley | | Foley Company |
| GAAP | | Generally Accepted Accounting Principles |
| GHG | | Greenhouse Gas |
| IMD | | IMD, Inc. |
| IPH | | Idaho Pacific Holdings, Inc. |
| IRP | | Integrated Resource Plan |
| JPMS | | J.P. Morgan Securities |
| kV | | kiloVolt |
| kW | | kiloWatt |
| kwh | | kilowatt-hour |
| LSA | | Lignite Sales Agreement |
| MAPP | | Mid-Continent Area Power Pool |
| MATS | | Mercury and Air Toxics Standards |
| MDU | | MDU Resources Group, Inc. |
| MEI | | Moorhead Electric, Inc. |
| MISO | Midwest | Midcontinent Independent Transmission System Operator, Inc. |
| MISO Tariff | | MISO Open Access Transmission, Energy and Operating Reserve Markets Tariff |
| MNCIP | | Minnesota Conservation Improvement Program |
| MNDOC | | Minnesota Department of Commerce |
| Minnesota Office of Attorney General | |
| MNRRA | | Minnesota Renewable Resource Adjustment |
| MPCA | | Minnesota Pollution Control Agency |
| MPUC | | Minnesota Public Utilities Commission |
| MRO | | Midwest Reliability Organization |
| MVP | | Multi-Value Project |
| MW | | Megawatt |
| mwh | | Megawatt-hour |
| NAEMA | | North American Energy Marketers Association |
| NDDOH | | North Dakota Department of Health |
| NDPSC | | North Dakota Public Service Commission |
| NDRRA | | North Dakota Renewable Resource Cost Recovery Rider Adjustment |
| NICF | | Notice of InterestIntent to Construct Facilities |
| NPCA | | National Parks Conservation Association |
| NPDES | | National Pollutant Discharge Elimination System |
| Northern Pipe | | Northern Pipe Products, Inc. |
NOx | | Nitrogen Oxide |
| NSPS | | New Source Performance Standards |
| NYMEX | | New York Mercantile Exchange |
| OTESCO | | Otter Tail Energy Services Company |
| OTP | | Otter Tail Power Company |
PACEPCOR | Partnership in Assisting Community Expansion |
PCOR | Plains CO2Reduction Partnership |
PEM | | Power and Energy Market |
| PM2.5 | | Particulate Matter Less Than 2.5 Microns |
PSPSD | Polystyrene |
PSD | Prevention of Significant Deterioration |
| PTC | | Production Tax Credit |
| PVC | | Polyvinyl Chloride |
| RCRA | | Resource Conservation and Recovery Act |
| SCR | | Selective Catalytic Reduction |
| SDPUC | | South Dakota Public Utilities Commission |
| SEC | | Securities and Exchange Commission |
| SF6 | | Sulfur Hexaflouride |
ShoreMasterShrco | ShoreMaster, | Shrco, Inc. |
| SIP | | State Implementation Plan |
SO2 | | Sulfur Dioxide |
| T.O. Plastics | | T.O. Plastics, Inc. |
| Tariff | | Energy and Operating Reserve Markets Tariff |
| TCR | | Transmission Cost Recovery |
| Trinity | | Trinity Industries, Inc. |
VaRVaristar | Value at Risk |
Varistar | Varistar Corporation |
| VIC | | Voluntary Investigation and Cleanup |
| VIE | | Variable Interest Entity |
| Vinyltech | | Vinyltech Corporation |
| Wylie | | E.W. Wylie Corporation |
(a) General Development of Business
Otter Tail Power Company was incorporated in 1907 under the laws of the State of Minnesota. In 2001, the name was changed to “Otter Tail Corporation” to more accurately represent the broader scope of electric and nonelectric operations and the name Otter Tail Power Company (OTP) was retained for use by the electric utility. On July 1, 2009, Otter Tail Corporation completed a holding company reorganization whereby OTP, which had previously been operated as a division of Otter Tail Corporation, became a wholly owned subsidiary of the new parent holding company named Otter Tail Corporation (the Company). The new parent holding company was incorporated in June 2009 under the laws of the State of Minnesota in connection with the holding company reorganization. The Company’s executive offices are located at 215 South Cascade Street, P.O. Box 496, Fergus Falls, Minnesota 56538-0496 and 4334 18th Avenue SW, Suite 200, P.O. Box 9156, Fargo, North Dakota 58106-9156. The Company’s telephone number is (866) 410-8780.
The Company makes available free of charge at its internet website (www.ottertail.com) its annual reports on Form 10-K, quarterly reports on Form 10-Q, current reports on Form 8-K, Forms 3, 4 and 5 filed on behalf of directors and executive officers and any amendments to these reports filed or furnished pursuant to Section 13(a) or 15(d) of the Securities Exchange Act of 1934, as soon as reasonably practicable after such material is electronically filed with or furnished to the Securities and Exchange Commission (SEC). Information on the Company’s website is not deemed to be incorporated by reference into this Annual Report on Form 10-K.
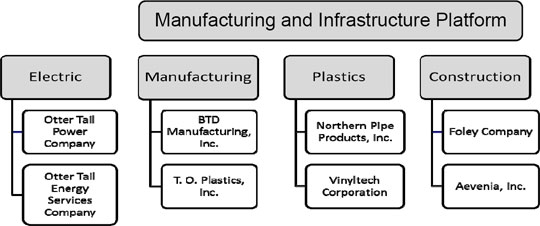
Otter Tail Corporation and its subsidiaries conduct business primarily in the United States. The Company had approximately 2,2862,336 full-time employees in its continuing operations at December 31, 2012.2013. The Company’s businesses have been classified in four segments to be consistent with its business strategy and the reporting and review process used by the Company’s chief operating decision maker. The four segments are Electric, Manufacturing, Plastics and Construction. We may refer to our Manufacturing, Plastics and Construction segments collectively as our manufacturing and infrastructure businesses.
In 2011 and 2012,Over the last three years, the Company sold several businesses in execution of itsan announced strategy of realigningto realign its business portfolio to reduce its risk profile and dedicate a greater portion of its resources toward electric utility operations. In 2011, the Company sold Idaho Pacific Holdings, Inc. (IPH), its Food Ingredient Processing business, and E.W. Wylie Corporation (Wylie), its trucking company, which was included in its former Wind Energy segment. In January 2012, the Company sold the assets of Aviva Sports, Inc. (Aviva), a recreational equipment manufacturer and a wholly owned subsidiary of ShoreMaster,Shrco, Inc. (ShoreMaster)(Shrco), the Company’s former waterfront equipment manufacturer. In February 2012, the Company sold DMS Health Technologies, Inc. (DMS), its former Health Services segment business. In November 2012, the Company completed the sale of the assets of DMI Industries,IMD, Inc. (DMI)(IMD), itsthe Company’s former wind tower manufacturer, of towers for wind turbines, and exited the wind tower manufacturing business. In December 2012,On February 8, 2013 the Company entered into negotiations to sellsold substantially all the assets of ShoreMaster and completed the sale on February 8, 2013. The Company’s business structure now consists of the following segments: Electric, Manufacturing, Construction and Plastics.Shrco.

All informationThe chart below indicates the companies included in this report, including comparative financial information, has been revised to reflect the continuing operationseach of the Company’s businessreporting segments.

| | ● | Electric includes the production, transmission, distribution and sale of electric energy in Minnesota, North Dakota and South Dakota by OTP. In addition, OTP is an active wholesale participant in the MidwestMidcontinent Independent Transmission System Operator, Inc. (MISO) markets. OTP’s operations have been the Company’s primary business since 1907. Additionally, Electric alsothe electric segment includes Otter Tail Energy Services Company (OTESCO), which providesprovided technical and engineering services.services through December 31, 2012. OTESCO ceased operations and did not record any operating revenues, expenses or net income in 2013. |
| | ● | Manufacturing consists of businesses in the following manufacturing activities: contract machining, metal parts stamping and fabrication, and production of material and handling trays and horticultural containers. These businesses have manufacturing facilities in Illinois and Minnesota, and sell products primarily in the United States. |
| | ● | Plastics consists of businesses producing polyvinyl chloride (PVC) pipe at plants in North Dakota and Arizona. The PVC pipe is sold primarily in the upper Midwest and Southwest regions of the United States. |
| ● | Construction consists of businesses involved in commercial and industrial electric contracting and construction of fiber optic, and electric distribution, systems, water, wastewater and HVAC systems primarily in the central United States. |
| ● | Plastics consists of businesses producing polyvinyl chloride (PVC) pipe in the upper Midwest and Southwest regions of the United States.
|
OTP is a wholly owned subsidiary of the Company. All of the Company’s manufacturing and infrastructure businesses are owned by its wholly owned subsidiary, Varistar Corporation (Varistar). The Company’s corporate operating costs include items such as corporate staff and overhead costs, the results of the Company’s captive insurance company and other items excluded from the measurement of operating segment performance. Corporate assets consist primarily of cash, prepaid expenses, investments and fixed assets. Corporate is not an operating segment. Rather, it is added to operating segment totals to reconcile to totals on the Company’s consolidated financial statements.
OTPThe Company has lowered its overall risk by investing in rate base growth opportunities in its Electric segment and OTESCO are wholly owned subsidiaries of the Company. All ofdivesting certain nonelectric operating companies that no longer fit the Company’s other businesses are owned byportfolio criteria. This strategy has provided a more predictable earnings stream, improved the Company’s credit quality and preserved its wholly owned subsidiary, Varistar Corporation (Varistar).
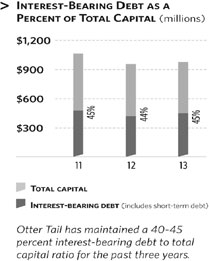
ability to fund the dividend. The Company’s current strategygoal is to deliver annual growth in earnings per share between four to seven percent over the next several years, using 2012 as the measurement year. The growth is expected to come from the substantial increase in the Company’s regulated utility rate base and from planned increased earnings from existing capacity already in place at the Company’s manufacturing and infrastructure businesses. The Company will continue to review its business portfolio to see where additional opportunities exist to improve its risk profile, improve credit metrics and generate additional sources of cash to support the growth opportunities in its electric utility. The Company has lowered its overall risk by investing in rate base growth opportunities in its Electric segment and divesting certain non-electric operating companies that no longer fit the Company’s portfolio criteria. This strategy is intended to create a more predictable earnings stream, improve the Company’s credit quality and preserve its ability to fund the dividend. The Company’s goal is to deliver annual growth in earnings per share between four to seven percent over the next several years. The growth is expected to come from the substantial increase in the Company’s regulated utility rate base and from planned increased earnings from existing capacity already in place at the Company’s manufacturing and infrastructure businesses. The Company will also evaluate opportunities to allocate capital to potential acquisitions in its Manufacturing segment. Over time, the Company expects the electric utility business will provide approximately 75% to 85% of its overall earnings. The Company expects its Manufacturingmanufacturing and Infrastructureinfrastructure businesses will provide 15% to 25% of its earnings, and will continue to be a fundamental part of its strategy. The actual mix of earnings from continuing operations in 2013 was 77% from the electric utility and 23% from the manufacturing and infrastructure businesses.
In evaluating its portfolio of operating companies, the Company looks for the following characteristics:
| | ● | a threshold level of net earnings and a return on invested capital in excess of the Company’s weighted average cost of capital, |
| | ● | a strategic differentiation from competitors and a sustainable cost advantage, |
| | ● | a stable or growing industry, |
| | ● | an ability to quickly adapt to changing economic cycles, and |
| | ● | a strong management team committed to operational excellence. |
For a discussion of the Company’s results of operations, see “Management’s“Management’s Discussion and Analysis of Financial Condition and Results of Operations,” on pages 38 through 6065 of this Annual Report on Form 10-K.
(b) Financial Information about Industry Segments
The Company is engaged in businesses classified into four segments: Electric, Manufacturing, ConstructionPlastics and Plastics.Construction. Financial information about the Company’s segments and geographic areas is included in note 2 of “Notes to Consolidated Financial Statements” on pages 8085 through 8387 of this Annual Report on Form 10-K.
(c) Narrative Description of Business
ELECTRIC
General
Electric consists of two businesses:includes OTP and, OTESCO.through December 31, 2012, the operations of OTESCO, which were not materially significant in 2012 and 2011. OTP, headquartered in Fergus Falls, Minnesota, provides electricity to more than 129,000130,000 customers in a service area with outer boundaries that encompass a total expanse of 70,000 square miles of western Minnesota, eastern North Dakota, and northeastern South Dakota. OTESCO, headquartered in Fergus Falls, Minnesota, providesprovided technical and engineering services primarily in North Dakota and Minnesota. The Company derived 41%42%, 41% and 48%41% of its consolidated operating revenues and 64%, 74% and 88% of its consolidated operating income from the Electric segment for each of the three years ended December 31, 2013, 2012 2011 and 2010,2011, respectively.
The breakdown of retail electric revenues by state is as follows:
| State | | 2012 | | | 2011 | | | 2013 | | | 2012 | |
| Minnesota | | | 48.9 | % | | | 48.8 | % | | | 48.2 | % | | | 48.9 | % |
| North Dakota | | | 42.0 | | | | 42.2 | | | | 42.8 | | | | 42.0 | |
| South Dakota | | | 9.1 | | | | 9.0 | | | | 9.0 | | | | 9.1 | |
| Total | | | 100.0 | % | | | 100.0 | % | | | 100.0 | % | | | 100.0 | % |
The territory served by OTP is predominantly agricultural. The aggregate population of OTP’s retail electric service area is approximately 230,000. In this service area of 422 communities and adjacent rural areas and farms, approximately 125,646 people live in communities having a population of more than 1,000, according to the 2010 census. The only communities served which have a population in excess of 10,000 are Jamestown, North Dakota (15,427); Bemidji, Minnesota (13,431); and Fergus Falls, Minnesota (13,138). As of December 31, 2012,2013, OTP served 129,786130,188 customers. Although there are relatively few large customers, sales to commercial and industrial customers are significant.
The following table provides a breakdown of electric revenues by customer category. All other sources include gross wholesale sales from utility generation, net revenue from energy trading activity and sales to municipalities.
| Customer Category | | 2012 | | | 2011 | | | 2013 | | | 2012 | |
| Commercial | | | 36.0 | % | | | 36.2 | % | | | 36.9 | % | | | 36.0 | % |
| Residential | | | 32.6 | | | | 32.9 | | | | 33.3 | | | | 32.6 | |
| Industrial | | | 25.0 | | | | 23.8 | | | | 23.2 | | | | 25.0 | |
| All Other Sources | | | 6.4 | | | | 7.1 | | | | 6.6 | | | | 6.4 | |
| Total | | | 100.0 | % | | | 100.0 | % | | | 100.0 | % | | | 100.0 | % |
Wholesale electric energy kilowatt-hour (kwh) sales were 11.8%12.5% of total kwh sales for 20122013 and 12.9%11.8% for 2011.2012. Wholesale electric energy kwh sales decreasedincreased by 10.8%13.9% between the years while revenue per kwh sold decreasedincreased by 14.5%18.8%. Activity in the short-term energy market is subject to change based on a number of factors and it is difficult to predict the quantity of wholesale power sales or prices for wholesale power in the future.
Capacity and Demand
As of December 31, 20122013 OTP’s owned net-plant dependable kilowatt (kW) capacity was:
| | | |
| Baseload Plants | | | |
| Big Stone Plant | | 256,600256,700 | kW |
| Coyote Station | | | 149,100149,000 | |
| Hoot Lake Plant | | | 141,600148,900 | |
| Total Baseload Net Plant | | 547,300554,600 | kW |
| Combustion Turbine and Small Diesel Units | | 108,000104,900 | kW |
| Hydroelectric Facilities | | 2,8002,600 | kW |
| Owned Wind Facilities (rated at nameplate) | | | | |
| Luverne Wind Farm (33 turbines) | | 49,500 | kW |
| Ashtabula Wind Center (32 turbines) | | | 48,000 | |
| Langdon Wind Center (27 turbines) | | | 40,500 | |
| Total Owned Wind Facilities | | 138,000 | kW |
The baseload net plant capacity for Big Stone Plant and Coyote Station constitutes OTP’s ownership percentages of 53.9% and 35%, respectively. OTP owns 100% of the Hoot Lake Plant. During 2012,2013, OTP generated about 68.3%70.8% of its retail kwh sales and purchased the balance.
In addition to the owned facilities described above OTP had the following purchased power agreements in place on December 31, 2012:
2013:
| |
| Purchased Wind Power Agreements (rated at nameplate and greater than 2,000 kW) | |
| Ashtabula Wind III | | 62,400 | kW |
| Edgeley | | | 21,000 | kW |
| Langdon | | | 19,500 | |
| Total Purchased Wind | | 40,500102,900 | kW |
| | | | |
| Other Purchased Power Agreements (in excess of 1 year and 500 kW) | | | | |
Wisconsin Electric Power CompanyGreat River Energy1
| | 50,000100,000 | kW |
Great River Energy2
| | | 50,000 | |
Total Purchased Power | | 100,000 | kW |
1Expires Through May 2013. 2Increases to 100,000 kW from June 2013 through May 2017.2021.
| | | |
OTP has a direct control load management system which provides some flexibility to OTP to effect reductions of peak load. OTP also offers rates to customers which encourage off-peak usage.
OTP’s capacity requirement is based on MISO Module E requirements. OTP is required to have sufficient PlanningZonal Resource Credits to meet its monthly weather normalized forecast demand, plus a reserve obligation. The MISO Resource Adequacy Construct changed significantly for the 2013/2014 MISO Planning Year effective June 1, 2013. OTP met its MISO obligation for all months in 2012. The MISO Resource Adequacy Construct is significantly changed for the 2013/2014 MISO Planning Year. These changes will be effective beginning June 1, 2013. OTP generating capacity combined with additional capacity under purchased power agreements (as described above) and load management control capabilities is expected to meet 20132014 system demand and MISO reserve requirements.
Fuel Supply
Coal is the principal fuel burned at the Big Stone, Coyote and Hoot Lake generating plants. Coyote Station, a mine-mouth facility, burns North Dakota lignite coal. Hoot Lake Plant and Big Stone plantsPlant burn western subbituminous coal.
The following table shows the sources of energy used to generate OTP’s net output of electricity for 20122013 and 2011:
2012:
| | |
| | | 2012 | | | 2011 | | | 2013 | | | 2012 | |
| Sources | | Net Kilowatt
Hours
Generated
(Thousands) | | | % of Total
Kilowatt
Hours
Generated | | | Net Kilowatt
Hours
Generated
(Thousands) | | | % of Total
Kilowatt
Hours
Generated | | | Net Kilowatt
Hours
Generated
(Thousands) | | | % of Total
Kilowatt
Hours
Generated | | | Net Kilowatt
Hours
Generated
(Thousands) | | | | % of Total
Kilowatt
Hours
Generated | |
| Subbituminous Coal | | | 2,094,293 | | | | 61.2 | % | | | 2,125,170 | | | | 56.7 | % | | | 2,322,608 | | | | 62.4 | % | | | 2,094,293 | | | | 61.2 | % |
| Lignite Coal | | | 782,358 | | | | 22.9 | | | | 1,062,153 | | | | 28.3 | | | | 881,973 | | | | 23.7 | | | | 782,358 | | | | 22.9 | |
| Wind and Hydro | | | 490,387 | | | | 14.3 | | | | 527,913 | | | | 14.1 | | | | 471,176 | | | | 12.7 | | | | 490,387 | | | | 14.3 | |
| Natural Gas and Oil | | | 55,637 | | | | 1.6 | | | | 33,367 | | | | 0.9 | | | | 43,165 | | | | 1.2 | | | | 55,637 | | | | 1.6 | |
| Total | | | 3,422,675 | | | | 100.0 | % | | | 3,748,603 | | | | 100.0 | % | | | 3,718,922 | | | | 100.0 | % | | | 3,422,675 | | | | 100.0 | % |
OTP has the following primary coal supply agreements:
| | | |
| Plant | Coal Supplier | Type of Coal | Expiration Date |
| Big Stone Plant | Peabody COALSALES, LLC | Wyoming subbituminous | December 31, 2016 |
| Big Stone Plant | Westmoreland Resources, Inc. | Montana subbituminous | December 31, 2014 |
| Coyote Station | Dakota Westmoreland Corporation | North Dakota lignite | May 4, 2016 |
| Coyote Station | Coyote Creek Mining Company, L.L.C. | North Dakota lignite | December 31, 2040 |
| Hoot Lake Plant | Cloud Peak Energy Resources LLC | Montana subbituminous | December 31, 20142015 |
OTP has about 42%58% of its coal needs for Big Stone under contract through December 2016.
The contract with Dakota Westmoreland Corporation expires on May 4, 2016. In October 2012, the Coyote Station owners, including OTP, entered into a lignite sales agreement (LSA) with Coyote Creek Mining Company, L.L.C. (CCMC), a subsidiary of The North American Coal Corporation, for the purchase of coal to meet the coal supply requirements of Coyote Station for the period beginning in May 2016 and ending in December 2040. The price per ton to be paid by the Coyote Station owners under the LSA will reflect the cost of production, along with an agreed profit and capital charge. The LSA provides for the Coyote Station owners to purchase the membership interests in CCMC in the event of certain early termination events and also at the end of the term of the LSA.
OTP has about 78%84% of its anticipated coal needs for Hoot Lake Plant secured under contract through December 2014.2015.
It is OTP’s practice to maintain a minimum 30-day inventory (at full output) of coal at the Big Stone Plant and a 20-day inventory at the Coyote Station and Hoot Lake Plant.
Railroad transportation services to the Big Stone Plant and Hoot Lake Plant are provided under a common carrier rate by the BNSF Railway. The common carrier rate is subject to a mileage-based methodology to assess a fuel surcharge. The basis for the fuel surcharge is the U.S. average price of retail on-highway diesel fuel. No coal transportation agreement is needed for the Coyote Station due to its location next to a coal mine.
The average cost of fuel consumed (including handling charges to the plant sites) per million British Thermal Units for each of the three years 2013, 2012, and 2011 was $2.055, $2.108, and 2010 was $2.108, $1.922, and $1.813, respectively.
General Regulation
OTP is subject to regulation of rates and other matters in each of the three states in which it operates and by the federal government for certain interstate operations.
A breakdown of electric rate regulation by each jurisdiction is as follows:
| | | 2012 | | | 2011 | | | 2013 | | | 2012 | |
| Rates | Regulation | | % of
Electric
Revenues | | | % of kwh
Sales | | | % of
Electric
Revenues | | | % of kwh
Sales | | Regulation | | % of
Electric
Revenues | | | % of kwh
Sales | | | % of
Electric
Revenues | | | % of kwh
Sales | |
| MN Retail Sales | MN Public Utilities Commission | | | 45.2 | % | | | 43.4 | % | | | 45.1 | % | | | 42.2 | % | MN Public Utilities Commission | | | 43.8 | % | | | 42.5 | % | | | 45.2 | % | | | 43.4 | % |
| ND Retail Sales | ND Public Service Commission | | | 38.8 | | | | 36.4 | | | | 39.1 | | | | 36.5 | | ND Public Service Commission | | | 39.0 | | | | 36.8 | | | | 38.8 | | | | 36.4 | |
| SD Retail Sales | SD Public Utilities Commission | | | 8.4 | | | | 8.5 | | | | 8.3 | | | | 8.4 | | SD Public Utilities Commission | | | 8.2 | | | | 8.2 | | | | 8.4 | | | | 8.5 | |
| Transmission & Wholesale | Federal Energy Regulatory Commission | | | 7.6 | | | | 11.7 | | | | 7.5 | | | | 12.9 | | Federal Energy Regulatory Commission | | | 9.0 | | | | 12.5 | | | | 7.6 | | | | 11.7 | |
| Total | | | | 100.0 | % | | | 100.0 | % | | | 100.0 | % | | | 100.0 | % | | | | 100.0 | % | | | 100.0 | % | | | 100.0 | % | | | 100.0 | % |
OTP operates under approved retail electric tariffs in all three states it serves. OTP has an obligation to serve any customer requesting service within its assigned service territory. The pattern of electric usage can vary dramatically during a 24-hour period and from season to season. OTP’s tariffs are designed to coverrecover the costs of providing electric service. To the extent that peak usage can be reduced or shifted to periods of lower usage, the cost to serve all customers is reduced. In order to shift usage from peak times, OTP has approved tariffs in all three states for residential demand control, general service time of use and time of day, real-time pricing, and controlled and interruptible service. Each of these specialized rates is designed to improve efficient use of OTP resources, while giving customers more control over their electric bill. OTP also has approved tariffs in its three service territories which allow qualifying customers to release and sell energy back to OTP when wholesale energy prices make such transactions desirable.
With a few minor exceptions, OTP’s electric retail rate schedules provide for adjustments in rates based on the cost of fuel delivered to OTP���sOTP’s generating plants, as well as for adjustments based on the cost of electric energy purchased by OTP. OTP also credits certain margins from wholesale sales to the fuel and purchased power adjustment. The adjustments for fuel and purchased power costs are presently based on a two month moving average in Minnesota and by the Federal Energy Regulatory Commission (FERC), a three month moving average in South Dakota and a four month moving average in North Dakota. These adjustments are applied to the next billing period after becoming applicable. These adjustments also include an over or under recovery mechanism, which is calculated on an annual basis in Minnesota and on a monthly basis in North Dakota and South Dakota.
The following summarizes the material regulations of each jurisdiction applicable to OTP’s electric operations, as well as any specific electric rate proceedings during the last three years with the Minnesota Public Utilities Commission (MPUC), the North Dakota Public Service Commission (NDPSC), the South Dakota Public Utilities Commission (SDPUC) and the FERC. The Company’s manufacturing and infrastructure businesses are not subject to direct regulation by any of these agencies.
Minnesota
Under the Minnesota Public Utilities Act, OTP is subject to the jurisdiction of the MPUC with respect to rates, issuance of securities, depreciation rates, public utility services, construction of major utility facilities, establishment of exclusive assigned service areas, contracts and arrangements with subsidiaries and other affiliated interests, and other matters. The MPUC has the authority to assess the need for large energy facilities and to issue or deny certificates of need, after public hearings, within one year of an application to construct such a facility.
Pursuant to the Minnesota Power Plant Siting Act, the MPUC has authority to select or designate sites in Minnesota for new electric power generating plants (50,000 kW or more) and routes for transmission lines (100 kilovolt (kV) or more) in an orderly manner compatible with environmental preservation and the efficient use of resources, and to certify such sites and routes as to environmental compatibility after an environmental impact study has been conducted by the Minnesota Department of Commerce (MNDOC) and the Office of Administrative Hearings has conducted contested case hearings.
The Minnesota Division of Energy Resources, part of the MNDOC, is responsible for investigating all matters subject to the jurisdiction of the MNDOC or the MPUC, and for the enforcement of MPUC orders. Among other things, the MNDOC is authorized to collect and analyze data on energy including the consumption of energy, develop recommendations as to energy policies for the governor and the legislature of Minnesota and evaluate policies governing the establishment of rates and prices for energy as related to energy conservation. The MNDOC also has the power, in the event of energy shortage or for a long-term basis, to prepare and adopt regulations to conserve and allocate energy.
2010 General Rate Case Filing—OTP filed a general rate case on April 2, 2010 requesting an 8.01% base rate increase as well as a 3.8% interim rate increase. On May 27, 2010, the MPUC issued an order accepting the filing, suspending rates, and approving the interim rate increase, as requested, to be effective with customer usage on and after June 1, 2010. The MPUC held a hearing to decide on the issues in the rate case on March 25, 2011 and issued a written order on April 25, 2011. The MPUC authorized a revenue increase of approximately $5.0 million, or 3.76% in base rate revenues, excluding the effect of moving recovery of wind investments to base rates. The MPUC’s written order included: (1) recovery of Big Stone II costs over five years, (2) moving recovery of wind farm assets from rider recovery to base rate recovery, (3) transfer of a portion of Minnesota Conservation Improvement Program (MNCIP) costs from rider recovery to base rate recovery, (4) transfer of the investment in two transmission lines from rider recovery to base rate recovery, and (5) changing the mechanism for providing customers with a credit for margins earned on asset-based wholesale sales of electricity from a credit to base rates to a credit to the Minnesota Fuel Clause Adjustment. Final rates went into effect October 1, 2011. The overall increase to customers was approximately 1.6% compared to the authorized interim rate increase of 3.8%, which resulted in an interim rate refund to Minnesota retail electric customers of approximately $3.9 million in the fourth quarter of 2011. Pursuant to the order, OTP’s allowed rate of return on rate base increased from 8.33% to 8.61% and its allowed rate of return on equity increased from 10.43% to 10.74%. OTP’s authorized rates of return are based on a capital structure of 48.28% long term debt and 51.72% common equity.
Conservation Improvement Programs—Under Minnesota law, every regulated public utility that furnishes electric service must make annual investments and expenditures in energy conservation improvements, or make a contribution to the state’s energy and conservation account, in an amount equal to at least 1.5% of its gross operating revenues from service provided in Minnesota. The Next Generation Energy Act of 2007, passed by the Minnesota legislature in May 2007, transitions from a conservation spending goal to a conservation energy savings goal.
The MNDOC may require a utility to make investments and expenditures in energy conservation improvements whenever it finds that the improvement will result in energy savings at a total cost to the utility less than the cost to the utility to produce or purchase an equivalent amount of a new supply of energy. Such MNDOC orders can be appealed to the MPUC. Investments made pursuant to such orders generally are recoverable costs in rate cases, even though ownership of the improvement may belong to the property owner rather than the utility. OTP recovers conservation related costs not included in base rates under the MNCIP through the use of an annual recovery mechanism approved by the MPUC.
A written order was issued by the MPUC onOn January 11, 2012 approvingthe MPUC approved the recovery of $3.5 million infor 2010 MNCIP financial incentives. Beginning in January 2012, OTP’s MNCIP Conservation Cost Recovery Adjustment (CCRA) increased from 3.0% to 3.8% for all Minnesota retail electric customers.
OTP recognized $2.2 million in MNCIP financial incentives in 2011 relating to 2011 program results. On March 30, 2012 OTP recognized an additional $0.4 million of incentive related to 2011 and submitted its annual 2011 financial incentive filing request for $2.6 million and recognized an additional $0.4 million of incentive related to 2011 in 2012.million. In December 2012, the MPUC approved the recovery of $2.6 million in financial incentives for 2011 and also ordered a change in the MNCIP cost recovery methodology used by OTP from a percentage of a customer’s bill to an amount per kwh consumed. The written order was issued on December 10, 2012. On January 1, 2013 OTP’s MNCIP surcharge decreased from 3.8% of athe customer’s bill to $0.00142 per kwh, which equates to approximately 1.9% of a customer’s bill. The per-kwh cost allocation method is the principle method approved by the MPUC for other electric utilities in Minnesota. OTP recognized $2.6 million of MNCIP financial incentives in 2012 and an additional $0.1 million in 2013 relating to 2012 program results.
OTP had a regulatory asset of $6.1 On October 10, 2013 the MPUC approved OTP’s 2012 financial incentive request for $2.7 million as well as its request for allowable costs and financial incentives eligible for recovery through the MNCIP rider that had not been billedan updated surcharge rate to Minnesota customers as of December 31, 2012.be implemented on November 1, 2013.
Integrated Resource Plan (IRP)—Minnesota law requires utilities to submit to the MPUC for approval a 15-year advance IRP. A resource plan is a set of resource options a utility could use to meet the service needs of its customers over a forecast period, including an explanation of the utility’s supply and demand circumstances, and the extent to which each resource option would be used to meet those service needs. The MPUC’s findings of fact and conclusions regarding resource plans shall be considered prima facie evidence, subject to rebuttal, in Certificate of Need (CON) hearings, rate reviews and other proceedings. Typically, the filings are submitted every two years.
On June 25, 2010 OTP filed its 2011-2025 IRP withIn the MPUC. The MNDOC requested and was granted an extension of the initial comment period to March 1, 2011. Presentations ofMPUC order approving the 2011-2025 IRP were madein February 2012, OTP was required to bothsubmit a base-load diversification study specifically focused on evaluating retirement and repower options for the NDPSC and SDPUC. Approximately 60% of the 2011-2025 IRP is comprised of improvements at existing resources and wholesale energy purchases similar to existing levels. The remaining 40% of the plan is comprised of the following components: 64% natural gas simple cycle combustion turbines, 21% conservation and demand response, and 15% wind generation. Capacity additions proposed in the 2011-2025 IRP are as follows:
Resource | Proposed |
Natural gas | 213 MW |
Demand Response/Conservation | 70 MW |
Wind | 50 MW |
On December 20, 2011 and February 9, 2012, respectively, the MPUC approved and issued a writtenHoot Lake Plant. In an order approving OTP’s 2011-2025 IRP, subject to the following conditions, among others:
| ● | Preparation and submission of a base-load diversification study specifically focused on evaluating retirement and repower options for Hoot Lake Plant to be filed no later than November 8, 2012. This study should evaluate the costs and OTP’s plans related to the Environmental Protection Agency’s (EPA) rules and how they might impact OTP operations. It also should include implications to transmission system reliability of any changes to Hoot Lake Plant. |
| ● | Future OTP IRPs should include carbon dioxide (CO2) costs at the mid-point of the commission-approved range in the base case and also should include market costs for sulfur dioxide (SO2) allowances. Future OTP IRPs should use the most current MISO long-term wind capacity credit or an average of its historical wind capacity credits.
|
| ● | OTP should increase its wind additions to 100 megawatts (MW) from the 50 MW of additional wind included in its five-year preferred plan, assuming the prices are reasonable. |
For resource planning purposes,dated March 25, 2013 the MPUC approved OTP’s 1.2% energy savings target and encouraged OTP to expand its demand-response and energy-efficiency portfolio. OTP’s next IRP filing is due no later than December 1, 2013.
In a January 31, 2013 hearing, the MPUC approved OTP’s recommendationrecommendations that Hoot Lake Plant add pollution-control equipment at a cost of approximately $10.0 million to comply with EPAU.S. Environmental Protection Agency’s (EPA) mercury and air toxics standards by 2015 and discontinue burning coal in 2020.
On December 2, 2013 OTP filed its 2014-2028 IRP with the MPUC. Copies of the 2014-2028 IRP were provided to both the NDPSC and SDPUC. Approximately 65% of the resource options called for by the 2014-2028 IRP are comprised of existing resources and wholesale energy purchases similar to existing levels. The remaining 35% is comprised of the following components: 65% natural gas simple cycle combustion turbines and 35% conservation and demand response. Capacity additions proposed in the 2014-2028 IRP are as follows:
| |
| Resource | Proposed Megawatts |
| Natural gas | 194 |
| Demand Response/Conservation | 106 |
OTP expects a MPUC order on its 2014-2028 IRP filing during the second quarter of 2014.
Renewable Energy Standards, Conservation, Renewable Resource Riders—The Minnesota legislature has enacted a statute thatlaw favors conservation over the addition of new resources. In addition, itMinnesota law requires the use of renewable resources where new supplies are needed, unless the utility proves that a renewable energy facility is not in the public interest. An existing environmental externality law requires the MPUC, to the extent practicable, to quantify the environmental costs associated with each method of electricity generation, and to use such monetized values in evaluating generation resources. The MPUC must disallow any nonrenewable rate base additions (whether within or outside of the state) or any related rate recovery, and may not approve any nonrenewable energy facility in an integrated resource plan, unless the utility proves that a renewable energy facility is not in the public interest. The state has prioritized the acceptability of new generation with wind and solar ranked first and coal and nuclear ranked fifth, the lowest ranking. The MPUC’s current estimate of the range of costs of future CO2 regulation to be used in modeling analyses for resource plans is $9 to $34/ton of CO2 commencing in 2012.2017. The MPUC is required to annually update these estimates.
Minnesota has a renewable energy standard which requires OTP to generate or procure sufficient renewable generation such that the following percentages of total retail electric sales to Minnesota customers come from qualifying renewable sources: 12% by 2012; 17% by 2016; 20% by 2020 and 25% by 2025. In addition, a new standard established by the 2013 legislature requires 1.5% of total electric sales to be supplied by solar energy by the year 2020. OTP is currently evaluating the new legislation and potential options for meeting that standard. Under certain circumstances and after consideration of costs and reliability issues, the MPUC may modify or delay implementation of the standards. OTP has acquired renewable resources and expects to acquire additional renewable resources in order to maintain compliance with the Minnesota renewable energy standard. OTP’s compliance with the Minnesota renewable energy standard will be measured through the Midwest Renewable Energy Tracking System.
Under the Next Generation Energy Act of 2007, an automatic adjustment mechanism was established to allow Minnesota electric utilities to recover investments and costs incurred to satisfy the requirements of the renewable energy standard. The MPUC is authorized to approve a rate schedule rider to enable utilities to recover the costs of qualifying renewable energy projects that supply renewable energy to Minnesota customers. Cost recovery for qualifying renewable energy projects can be authorized outside of a rate case proceeding, provided that such renewable projects have received previous MPUC approval. Renewable resource costs eligible for recovery may include return on investment, depreciation, operation and maintenance costs, taxes, renewable energy delivery costs and other related expenses.
The costs for three major wind farms previously approved by the MPUC issued an order on January 12, 2010 finding OTP’s Luverne Wind Farm project eligible for cost recovery through theOTP’s Minnesota Renewable Resource Adjustment (MNRRA). The 2010 annual MNRRA cost recovery filing was made on December 31, 2009 with a requested effective date of April 1, 2010. The MPUC approved OTP’s petition for a 2010 MNRRA in the third quarter of 2010 with implementation effective September 1, 2010. The 2010 MNRRA was in place from September 1, 2010 through September 30, 2011 with a recovery of $17.0 million.
The recovery of MNRRA costs was were moved to base rates as of October 1, 2011 under the MPUC’s April 25, 2011 general rate case order with the exception of the remaining balance of the MNRRA regulatory asset. OTP had a regulatory asset of $0.9 million for amounts eligible for recovery through the MNRRA rider that had not been billed to Minnesota customers as of December 31, 2012. A request for an updated rate to be effective October 1, 2012 was initially filed on June 28, 2012, followed by a revised filing on July 25, 2012. The filing, which is still under review included aBecause the request to extend the period of the new rate for 18 months which would reduce the current balance of unrecovered costs to zero. However, it is now estimated the remaining unrecovered costs will be collected by the end of May 2013, so OTP is planning to makewas still under review, a supplemental filing to requestwas submitted on February 15, 2013, requesting that the current rate be retained until a majority of the remaining balance iscosts were recovered and that the MNRRA thenrate be suspended.set to zero effective May 1, 2013. The MPUC approved the February 15, 2013 request on April 4, 2013 and authorized that any unrecovered balance be retained as a regulatory asset to be recovered in OTP’s next general rate case. Effective May 1, 2013 the resource adjustment on OTP’s Minnesota customers’ bills no longer includes MNRRA costs.
Transmission Cost Recovery (TCR) Rider—In addition to the MNRRA rider, the Minnesota Public Utilities Act provides a similar mechanism for automatic adjustment outside of a general rate proceeding to recover the costs of new transmission facilities that have been previously approved by the MPUC in a CON proceeding, certified by the MPUC as a Minnesota priority transmission project, made to transmit the electricity generated from renewable generation sources ultimately used to provide service to the utility’s retail customers, or exempt from the requirement to obtain a Minnesota CON. The MPUC may also authorize cost recovery via such TCR riders for charges incurred by a utility under a federally approved tariff that accrue from other transmission owners’ regionally planned transmission projects that have been determined by the MISO to benefit the utility or integrated transmission system. The 2013 legislature passed legislation that also authorizes TCR riders to recover the costs of new transmission facilities approved by the regulatory commission of the state in which the new transmission facilities are to be constructed to the extent approval is required by the laws of that state and determined by the MISO to benefit the utility or integrated transmission system. Such TCR riders allow a return on investment at the level approved in a utility’s last general rate case. Additionally, following approval of the rate schedule, the MPUC may approve annual rate adjustments filed pursuant to the rate schedule. OTP’s initial request for approval of a TCR rider was granted by the MPUC on January 7, 2010, and became effective February 1, 2010.
OTP requested recovery of its transmission investments being recovered through its Minnesota TCR rider rate as part of its general rate case filed on April 2, 2010. In its April 25, 2011 general rate case order, the MPUC approved the transfer of transmission costs currentlythen being recovered through OTP’s Minnesota TCR rider to recovery in base rates. Final rates went into effect on October 1, 2011. OTP will continuecontinues to utilize the TCR rider cost recovery mechanism untilto recover the remaining balance of the current transmission projects has been collected as well asand to recover costs associated with approved regional projects. new transmission projects determined eligible for TCR rider recovery by the MPUC.
OTP filed a request for an update to its Minnesota TCR rider on October 5, 2010. The update to OTP’s Minnesota TCR rider, approved by the MPUC on March 26, 2012, went into effect April 1, 2012.
In this TCR rider update, the MNPUCMPUC addressed how to handle utility investments in transmission facilities that qualify for regional cost allocation under the MISO tariff.Open Access Transmission, Energy and Operating Reserve Markets Tariff (MISO Tariff). MISO regional cost allocation allows OTP to recover some of the costs of its transmission investment from the other MISO utilities. On March 26, 2012 the MPUC approved the update to OTP’s Minnesota TCR rider along with an all-in method for MISO regional cost allocations in which OTP’s retail customers would be responsible for the entire investment OTP made with an offsetting credit for revenues received from other MISO utilities under the MISO tariff.Tariff for projects included in the TCR. OTP’s updated Minnesota TCR rider went into effect April 1, 2012.
On May 24, 2012 OTP filed a petition with the MPUC to seek a determination of eligibility for the inclusion of 12twelve additional transmission related projects in subsequent Minnesota TCR rider filings. On August 22, 2012February 20, 2013 the MNDOC filed comments and on August 24, 2012 the Minnesota OfficeMPUC approved three of the Attorney General (MNOAG) filed comments. OTP filed reply comments on September 25, 2012 and supplemental comments on January 8, 2013 describing an agreement reached between OTP, the MNDOC and the MNOAG, to find eligible 3 of the 12 projects. MPUC approval of that agreement is pending. If approval is obtained to include additional projects in the rider, investment in the approved projects will be included in the next annual Minnesota TCR rider rate update filings, andas eligible for recovery of the investment will begin through the TCR rider. OTP filed its annual update to the TCR rider rates if subsequently approved byon February 7, 2013 to include the MPUC. Updatedthree new projects as well as updated costs associated with existing projects withinprojects. On January 30, 2014 the MPUC approved OTP’s 2013 TCR rider update but disallowed TCR rider recovery of capitalized internal labor costs and costs in excess of CON estimates. These costs will be removed from OTP’s Minnesota TCR rider effective as of the date of the MPUC’s order. OTP will also be includedallowed to seek recovery of these costs in a future rate case.
Big Stone Air Quality Control System (AQCS)—Minnesota law authorizes a public utility to petition the MPUC for an Advance Determination of Prudence (ADP) for a project undertaken to comply with federal or state air quality standards of states in which the utility’s electric generation facilities are located if the project has an expected jurisdictional cost to Minnesota ratepayers of at least $10 million. On January 14, 2011 OTP filed a petition asking the MPUC for ADP for costs associated with the design, construction and operation of the Best-Available Retrofit Technology (BART) compliant air quality control system at Big Stone Plant attributable to serving OTP’s Minnesota customers. The MPUC granted OTP’s petition for ADP for the AQCS in a written order issued on January 23, 2012. OTP’s share of the costs for the Big Stone Plant AQCS is expected to be $218 million.
On May 24, 2013 legislation was enacted in Minnesota which allowed OTP to file for an emission-reduction rider for recovery of the revenue requirements of the AQCS. The legislation authorizes the rider to allow a current return on investment (including Construction Work in Progress (CWIP)) at the level approved in OTP’s most recent general rate case, unless a different return is determined by the MPUC to be in the nextpublic interest. On July 31, 2013 OTP filed for a Minnesota Environmental Cost Recovery (ECR) rider with the MPUC for recovery of its Minnesota jurisdictional share of the revenue requirements of its investment in the AQCS under construction at Big Stone Plant. The ECR rider recoverable revenue requirements include a current return on the project’s CWIP balance. The MPUC granted approval of OTP’s Minnesota ECR rider on December 18, 2013 with an effective date of January 1, 2014. The rate will be updated in an annual rider rate update filing. OTP had a regulatory liability of $0.5 million as of December 31, 2012 for amounts billed to Minnesota customers thatfiling with the MPUC until the costs are subject to refund through the Minnesota TCR rider.rolled into base rates at an undetermined future date.
Big Stone II Project—OTP and a coalition of six other electric providers filed an application for a CON for the Minnesota portion of the Big Stone II transmission line project on October 3, 2005 and filed an application for a Route Permit for the Minnesota portion of the Big Stone II transmission line project with the MPUC on December 9, 2005. On January 15, 2009 the MPUC approved a motion to grant the CON and Route Permit for the Minnesota portion of the Big Stone II transmission line.line project.
The MPUC granted the CON subject to a number of additional conditions, including but not limited to: (1) fulfilling various requirements relating to renewable energy goals, energy efficiency, community-based energy development projects and emissions reduction; (2) that the generation plant be built as a “carbon capture retrofit ready” facility; (3) that the applicants report to the MPUC on the feasibility of building the plant using ultra-supercritical technology; and (4) that the applicants achieve specific limits on construction costs at $3,000/kW and CO2 costs at $26/ton.
The CON and Route Permit, required by state law, would have allowed the Big Stone II utilities to construct and upgrade 112 miles of electric transmission lines in western Minnesota for delivery of power from the Big Stone site and from numerous other planned generation projects, most of which are wind energy.
Following OTP’s September 11, 2009 withdrawal from the Big Stone II project and the remaining Big Stone II participants’ November 2, 2009 cancellation of the project, the suitability of the route permits and easements obtained by OTP as a MISO transmission owner for other interconnection customers backfilling through the MISO interconnection process into the Big Stone area continuescontinued to be evaluated.
On December 14, 2009 OTP filed a request with the MPUC for deferred regulatory accounting treatment for the costs incurred related to the cancelled Big Stone II plant. OTP requested recovery of the Minnesota portion of its Big Stone II development costs over a five-year period as part of its general rate case filed in Minnesota on April 2, 2010. In a written order issued on April 25, 2011, the MPUC authorized recovery of the Minnesota portion of Big Stone II generation development costs from Minnesota ratepayers over a 60-month recovery period which began on October 1, 2011. The amount of Big Stone II generation costs incurred by OTP that were deemed recoverable from Minnesota ratepayers as part of rates established in that proceeding was $3.2 million (which excludesexcluded $3.2 million of transmission-related project transmission-related costs). As of December 31, 2012, OTP had a regulatory asset of $2.1
Approximately $0.4 million of Big Stone II generation costs to be recovered.
On December 30, 2010 OTP filed a request for an extension of the total Minnesota Route Permit for the Big Stone transmission facilities. The request asked to extend the deadline for filing a CON for these transmission facilities until March 17, 2013. The April 25, 2011 MPUC order instructed OTP to transfer the $3.2 million Minnesotajurisdictional share of Big Stone II transmission costs were transferred to Construction Workthe Big Stone South - Brookings Multi-Value Project (MVP) in Progress (CWIP) andthe first quarter of 2013. The remaining costs, along with accumulated AFUDC, were transferred from CWIP to create a tracker account through which any over or under recoveries could be accumulated for refund or recovery determination in future rate cases as a regulatory liability or asset. If determined eligible for recovery under the FERC-approved MISO regional transmission tariff, the Minnesota portion of Big Stone II transmission costs and accumulated Allowance for Funds Used During Construction (AFUDC) will receive rate base treatment andUnrecovered Project Costs – Minnesota regulatory asset account in May 2013, based on recovery through the FERC-approved MISO regional transmission rates. Any amounts over or under collected through MISO rates will be reflectedgranted in the tracker account.
Big Stone Air Quality Control System (AQCS) Request for Advance DeterminationApril 25, 2011 order. The recoverable amount of Prudence (ADP)—Minnesota law authorizes a public utilityapproximately $3.5 million is expected to petition the MPUC forbe recovered over an ADP for a project undertaken to comply with federal or state air quality standards of statesanticipated 89-month recovery period which began in which the utility’s electric generation facilities are located, if the project has an expected jurisdictional cost to Minnesota ratepayers of at least $10 million. ADPs can help lower the cost of financing by providing additional regulatory certainty, which ultimately reduces customer costs. On January 14, 2011 OTP filed a petition asking the MPUC for an ADP for the design, construction and operation of the Best-Available Retrofit Technology (BART) compliant air quality control system at Big Stone Plant attributable to serving OTP’s Minnesota customers, and on December 20, 2011 the MPUC granted OTP’s petition. The MPUC’s written order was issued on January 23, 2012.May 2013.
Capacity Expansion 2020 (CapX2020)—CapX2020 is a joint initiative of eleven investor-owned, cooperative, and municipal utilities in Minnesota and the surrounding region to upgrade and expand the electric transmission grid to ensure continued reliable and affordable service. The CapX2020 companies identified four major transmission projects for the region: (1) the Fargo–Monticello 345 kV Project (the Fargo Project), (2) the Brookings–Southeast Twin Cities 345 kV Project (the Brookings Project), (3) the Bemidji – Grand Rapids 230 kV Project (the Bemidji Project), and (4) the Twin Cities–LaCrosse 345 kV Project. OTP is an investor in the Fargo Project, the Brookings Project and the Bemidji Project. Recovery of OTP’s CapX2020 transmission investments will be through the MISO Tariff (the Brookings Project as an MVP) and Minnesota, North Dakota and South Dakota TCR Riders.
The Fargo Project—All major permits have been received from state regulatory bodies and project agreements have been signed for the construction of the Fargo Project. The Monticello to St. Cloud portion of the Fargo Project was placed into service on December 21, 2011. Construction is underway for the remaining portions of the project with completion scheduled for the firstsecond quarter of 2015. OTP’s share of the costs for the St. Cloud to Fargo portion of the Fargo Project is expected to be $84.2$84.4 million.
The Brookings Project—All major permits have been received from state regulatory bodies and project agreements have been signed for the construction of the Brookings Project. The MISO granted unconditional approval of the Brookings Project as a Multi-Value Project (MVP)an MVP under the MISO Open Access Transmission, Energy and Operating Reserves Market Tariff (Tariff) in December 2011. This project willis anticipated to be placedcompleted in service in segments with the earliest segment being placed in service in the summer of 2013 and the last segment placed in service during the first quarter of 2015. OTP’s share of the costs for the Brookings Project is expected to be $26.0$26.5 million.
The Bemidji Project—The Bemidji-Grand Rapids transmission line was fully energized and put in service on September 17, 2012.
Recovery of OTP’s CapX2020 transmission investments will be through the MISO Tariff and the Minnesota, North Dakota and South Dakota TCR riders.
Capital Structure Petition—Minnesota law requires an annual filing of a capital structure petition with the MPUC. In this filing the MPUC reviews and approves the capital structure for OTP. Once the petition is approved, OTP may issue securities without further petition or approval, provided the issuance is consistent with the purposes and amounts set forth in the approved capital structure petition. The MPUC approved OTP’s current capital structure petition on June 20, 2013, which is in effect until the MPUC issues a new capital structure order for 2013.2014. OTP is required to file its 20132014 capital structure petition by May 14, 2013.2014.
North Dakota
OTP is subject to the jurisdiction of the NDPSC with respect to rates, services, certain issuances of securities, construction of major utility facilities and other matters. The NDPSC periodically performs audits of gas and electric utilities over which it has rate setting jurisdiction to determine the reasonableness of overall rate levels. In the past, these audits have occasionally resulted in settlement agreements adjusting rate levels for OTP.
The North Dakota Energy Conversion and Transmission Facility Siting Act grants the NDPSC the authority to approve sites in North Dakota for large electric generating facilities and high voltage transmission lines. This Act is similar to the Minnesota Power Plant Siting Act described above and applies to proposed newwind energy electric power generating plants exceeding 60,000500 kW of electricity, non-wind energy electric power generating plants exceeding 50,000 kW and proposed new transmission lines with a design in excess of 115 kV. OTP is required to submit a ten-year plan to the NDPSC annually.
The NDPSC reserves the right to review the issuance of stocks, bonds, notes and other evidence of indebtedness of a public utility. However, the issuance by a public utility of securities registered with the SEC is expressly exempted from review by the NDPSC under North Dakota state law.
General Rate CaseRates—On November 3, 2008 OTP filed aOTP’s most recent general rate case in North Dakota requesting an overall revenue increase of approximately $6.1 million, or 5.1%, and an interim rate increase of approximately 4.1%, or $4.8 million annualized, that went into effect on January 2, 2009. In an order issued by the NDPSC on November 25, 2009, OTP was granted an increase in North Dakota retail electric rates of $3.6 million, or approximately 3.0%, which went into effect in December 2009. The NDPSC order authorizing an interim rate increase required OTP to refund North Dakota customers the difference between final and interim rates, with interest. OTP established a refund reserve for revenues collected under interim rates that exceeded the final rate increase. The refund reserve balance of $0.9 million as of December 31, 2009 was refunded to North Dakota customers in January 2010. OTP deferred recognition of $0.5 million in rate case-related filing and administrative costs that are subject to amortization and recovery over a three year period beginning in January 2010. As requiredgranted by the NDPSC in an order in the OTP 2008 rate case, OTP submitted a filing for a request to remove the recovery of the costs associated with economic development in base rates in North Dakota. OTP proposedissued on November 25, 2009 and the NDPSC approved an Economic Development Cost Removal Rider, under which all North Dakota customers will receive a credit of $0.00025 per kwh. The monthly credit was effective with bills rendered on and after January 1, 2011.December 2009.
Renewable Resource Cost Recovery RiderAdjustment— On May 21, 2008 the NDPSC approved OTP’s request forOTP has a North Dakota Renewable Resource Cost Recovery Rider Adjustment (NDRRA) to enablewhich enables OTP to recover the North Dakota share of its investments in renewable energy facilities it owns in North Dakota. This rider allows OTP to recover costs associated with new renewable energy projects as they are completed. OTP included investment costs and expenses related to its 32 wind turbines at the Ashtabula Wind Energy Center that became commercially operational in November 2008 in its 2009 annual request to the NDPSC to increase the amount of the NDRRA. An NDRRA of $0.0051 per kwh was approved by the NDPSC on January 14, 2009 and went into effect beginning with billing statements sent on February 1, 2009. Terms of the approved settlement provide for the recovery of accrued costs and returns on investments in renewable energy facilities under the NDRRA over a period of 48 months beginning in January 2010.
In a proceeding that was combined with OTP’s general rate case, the NDPSC reviewed whether to move the costs of the projects being recovered through the NDRRA into base rate cost recovery and whether to make changes to the rider. A settlement of the general rate case and the NDRRA reduced the NDRRA to $0.00369 for the period from December 1, 2009 until the effective date for the next annual NDRRA filing, requested to be April 1, 2010. Because the 2008 annual NDRRA filing was combined with the general rate case proceedings (concluded in November 2009), the 2009 annual filing to establish the 2010 NDRRA (which includes cost recovery for OTP’s investment in its Luverne Wind Farm project) was delayed until December 31, 2009, with a requested effective date of April 1, 2010. Approval for implementation of an updated NDRRA was received in the third quarter of 2010 with implementation effective September 1, 2010.
The 2010 NDRRA was in place for the period offrom September 1, 2010 through March 31, 2012 with a recovery of $15.6 million. On December 29, 2011 OTP submitted its annualMarch 21, 2012 the NDPSC approved an update to the renewable rider with anOTP’s NDRRA effective April 1, 2012 effective date, which was approved by the NDPSC on March 21, 2012. The 2011updated NDRRA has an expected recovery of $10.1recovered $9.9 million over the period April 1, 2012 through March 31, 2013. On December 28, 2012 OTP has a regulatory asset of $1.6 million for amounts eligible for recovery throughsubmitted its annual update to the NDRRA rider that havewith a proposed effective date of April 1, 2013. The update resulted in a rate reduction, so the NDPSC did not been billedissue an order suspending the rate change. Consequently, pursuant to North Dakota customers as ofstatute, OTP was allowed to implement updated rates effective April 1, 2013 and, on July 10, 2013, the NDPSC approved the rate implemented on April 1, 2013. OTP submitted its annual update to the NDRRA on December 31, 2012.2013 with a proposed April 1, 2014 effective date.
Transmission Cost Recovery Rider— North Dakota law provides a mechanism for automatic adjustment outside of a general rate proceeding to recover jurisdictional capital and operating costs incurred by a public utility for new or modified electric transmission facilities. On April 29, 2011 OTP filed a request for an initial North Dakota TCR rider with the NDPSC, on April 29, 2011, which was approved by the NDPSC on April 25, 2012 to go into effectand effective May 1, 2012. On August 31, 2012 OTP filed its annual update to the North Dakota TCR rider rate to reflect updated cost information associated with projects currently in the rider, as well as proposing to include costs associated with ten additional projects for recovery within the rider, whichrider. The NDPSC approved the NDPSC approvedannual update on December 12, 2012 to go into effectwith an effective date of January 1, 2013. On August 30, 2013 OTP hasfiled its annual update to its North Dakota TCR rider rate, which was approved on December 30, 2013 and became effective January 1, 2014.
Environmental Cost Recovery Rider—On May 9, 2012 the NDPSC approved OTP’s application for an ADP related to the Big Stone Plant AQCS. On February 8, 2013, OTP filed a request with the NDPSC for an ECR rider to recover OTP’s North Dakota jurisdictional share of carrying costs associated with its investment in the Big Stone Plant AQCS. On December 18, 2013 the NDPSC approved OTP’s North Dakota ECR rider based on revenue requirements through the 2013 calendar year and thereafter, with rates effective for bills rendered on and after January 1, 2014. OTP recorded a regulatory asset of $0.1$2.3 million for amounts eligible for recovery through the North Dakota TCRECR rider that havehad not been billed to North Dakota customers as of December 31, 2012.2013. The rate will be updated at least annually in a filing with the NDPSC until the project costs are rolled into base rates at an undetermined future date.
Big Stone II Project—A filing in North Dakota for an ADP of Big Stone II was made by OTP in November 2006. On August 27, 2008, the NDPSC determined that OTP’s participation in Big Stone II was prudent in a range of 121.8 to 130 MW. On January 20, 2010, OTP filed a request with the NDPSC for a determination that continuing with the Big Stone II project would not have been prudent. North Dakota’s ADP statute allows a utility to recover costs, and a reasonable return on the costs pending recovery, for a project previously deemed prudent and for which the NDPSC later makes a determination that continuing with the project was no longer prudent.
On December 14, 2009 OTP filed a request with the NDPSC for deferred regulatory accounting treatment for its costs incurred related to the cancelled Big Stone II project. In an order issued June 25, 2010, the NDPSC authorized recovery of Big Stone II development costs from North Dakota ratepayers, pursuant to a final settlement agreement filed June 23, 2010, between the NDPSC advocacy staff, OTP and the North Dakota Large Industrial Energy Group, which had intervened.as interveners. The terms of the settlement agreement indicate that OTP’s discontinuation of participation in the project was prudent and OTP should be authorized to recover the portion of costs it incurred related to the Big Stone II generation project. The total amount of Big Stone II generation costs incurred by OTP (which excludesexcluded $2.6 million of project transmission-related costs) was determined to be $10.1 million, of which $4.1 million represents North Dakota’s jurisdictional share. The North Dakota portion of Big Stone II generation costs is being recovered over a 36 month36-month period which began on August 1, 2010. As of December 31, 2012, OTP had a regulatory asset of $0.9 million of Big Stone II generation costs to be recovered.
The North Dakota’sDakota jurisdictional share of Big Stone II costs incurred by OTP related to transmission iswas $1.1 million. OTPApproximately $0.3 million of the total North Dakota jurisdictional share of Big Stone II transmission costs were transferred to the Big Stone South - Brookings MVP during the first quarter of 2013. On July 30, 2013 the NDPSC approved OTP’s request to continue the Big Stone II cost recovery rates for an additional eight months through March 31, 2014 to recover the remaining North Dakota share of Big Stone II transmissiontransmission-related costs to CWIP, with such costs subject toplus accrued AFUDC continuing from September 2009. If construction of all or a portion of the transmission facilities commences within three years of the NDPSC order approving the settlement agreement, the North Dakota portion of Big Stone II transmission costs and accumulated AFUDC shall be included in the rate base investment for these future transmission facilities. If construction is not commenced on any of the transmission facilities within three years of the NDPSC order approving the settlement agreement, OTP may petition the NDPSC to either continue accounting for these costs as CWIP or to commence recovery of such costs.
Big Stone Plant AQCS Request for ADP—An application for an ADP filed by OTP with the NDPSC on May 20, 2011 was approved on May 9, 2012.totaling $1.0 million.
CapX2020 Request for Advance Determination of Prudence—On October 5, 2009 OTP filed an application for an ADP with the NDPSC for its proposed participation in three of the four Group 1 projects: the Fargo Project, the Brookings Project and the Bemidji Project. An administrative law judge conducted an evidentiary hearing on the application in May 2010. On October 6, 2010 the NDPSC adopted an order approving a settlement between OTP and intervener NDPSC advocacy staff, and issued an ADP to OTP for participation in the three Group 1 projects. The order is subject to a number of terms and conditions in addition to the settlement agreement, including the provision of additional information on the eventual resolution of cost allocation issues relevant to the Brookings Project and its associated impact on North Dakota. On April 29, 2011, OTP filed its compliance filing with the NDPSC, seeking a determination of continued prudence for OTP’s investment in the Brookings Project. The NDPSC approved the request for an ADP for the Brookings Project on November 10, 2011 conditioned on the MISO MVP cost allocation remaining materially unchanged. The MISO granted unconditional approval of the Brookings Project as an MVP under the MISO Tariff in December 2011.
CapX2020 - Fargo Project—All major permits have been received from state regulatory bodies and project agreements have been signed for the construction of the Fargo Project. Completion of all phases of the Fargo Project is scheduled for the first quarter of 2015. OTP’s share of the costs of the Fargo Project is expected to be $84.2 million.
South Dakota
Under the South Dakota Public Utilities Act, OTP is subject to the jurisdiction of the SDPUC with respect to rates, public utility services, construction of major utility facilities, establishment of assigned service areas and other matters. Under the South Dakota Energy Facility Permit Act, the SDPUC has the authority to approve sites in South Dakota for large energy conversion facilities (100,000 kW or more) and transmission lines with a design of 115 kV or more.
2010 General Rate Case Filing—On August 20, 2010 OTP filed a general rate case with the SDPUC requesting an overall revenue increase of approximately $2.8 million, or just under 10.0%, which includes, among other things, recovery of investments and expenses related to renewable resources. On September 28, 2010 the SDPUC suspended OTP’s proposed rates for a period of 180 days to allow time to review OTP’s proposal. On January 19, 2011 OTP submitted a proposal to use current rate design to implement an interim rate in South Dakota to be effective on and after February 17, 2011. On January 26, 2011 OTP submitted an amended proposal to use a lower interim rate increase than originally proposed. At its February 1, 2011 meeting, the SDPUC approved OTP’s request to implement interim rates using current rate design and the lower interim increase to be effective on and after February 17, 2011. On April 21, 2011, the SDPUC issued itsa written order approving an overall final revenue increase for OTP of approximately $643,000 (2.32%) and an overall rate of return on rate base of 8.50% for the interim rates and final rates.. Final rates were effective with bills rendered on and after June 1, 2011.
Transmission Cost Recovery Rider—South Dakota law provides a mechanism for automatic adjustment outside of a general rate proceeding to recover jurisdictional capital and operating costs incurred by a public utility for new or modified electric transmission facilities. OTP submitted a request for an initial South Dakota TCR rider to the SDPUC on November 5, 2010. The South Dakota TCR was approved by the SDPUC and implemented on December 1, 2011. OTP billed $570,000 to South Dakota customers under the TCR rider from December 1, 2011 through December 31, 2012 and had a regulatory asset of $2,000 for amounts eligible for recovery through the South Dakota TCR rider that had not been billed to South Dakota customers as of December 31, 2012. On September 4, 2012 OTP filed its annual update to the South Dakota TCR rider. Updated rates, approved on April 23, 2013, went into effect on May 1, 2013. OTP filed its annual update to the South Dakota TCR rider rate. The request is currently under review by the SDPUC.on August 30, 2013 with a supplemental filing in February 2014 with a proposed implementation date of March 1, 2014.
Big Stone II Project—On December 14, 2009 OTP filed a request with the SDPUC for deferred regulatory accounting treatment for its costs incurred related to the cancelled Big Stone II plant. The SDPUC approved OTP’s request for deferred accounting treatment on February 11, 2010. OTP requested recovery of the South Dakota portion of its Big Stone II development costs over a five-year period as part of its general rate case filed in South Dakota on August 20, 2010. In the first quarter of 2011, the SDPUC approved recovery of the South Dakota portion of Big Stone II generation development costs totaling approximately $1.0 million from South Dakota ratepayers over a ten-year period beginning in February 2011 with the implementation of interim rates. OTP will beis allowed to earn a return on the amount subject to recovery over the ten-year recovery period. OTP transferred the South Dakota portion of the remaining Big Stone II transmission costs to CWIP, with such costs subject to AFUDC and recovery in future FERC-approved MISO rates or retail rates. On July 31, 2012 the SDPUC approved the transfer of the Big Stone II transmission route permits fromto OTP.
A portion of the original Big Stone II transmission ownerscosts were transferred out of CWIP in February 2013 to OTP.be included within the Big Stone South - Brookings MVP. On March 28, 2013, OTP filed a petition with the SDPUC requesting deferred accounting for the remaining unrecovered Big Stone II Transmission costs until OTP’s next South Dakota general rate case. The petition was approved by the SDPUC on April 23, 2013 and in May 2013 OTP transferred the remaining South Dakota jurisdictional portion of unrecovered Big Stone II transmission costs plus accumulated AFUDC totaling $0.2 million from CWIP to the Big Stone II Unrecovered Project Costs – South Dakota long-term regulatory asset account.
Big Stone Plant AQCS—On March 30, 2012 OTP requested approval from the SDPUC for an Environmental Cost RecoveryECR Rider (ECRR) to recover costs associated with the Big Stone Plant AQCS. On April 17, 2013 OTP filed a request to either suspend or withdraw this filing. The SDPUC approved withdrawing this filing on April 23, 2013. Instead of receiving rider recovery on the portion of AQCS with a proposed effective date of October 1, 2012. This riderconstruction costs assignable to OTP’s South Dakota customers while the project is designed to recover the revenue requirements plus carrying charges of the Big Stone AQCS project while under construction, as well as after completionOTP will accrue an AFUDC on these costs and request recovery of, and a return on, the project until placed into base rates through theaccumulated costs, including AFUDC, in a future rate filing of a rate case. For the initial period of October 1, 2012 through September 30, 2013, OTP is requesting revenue requirement recovery on expenditures incurred for the Big Stone Plant AQCS. The request is currently under review by the SDPUC.in South Dakota.
CapX2020 Brookings–Southeast Twin Cities 345 kV Project—All major permits have been received from state regulatory bodies and project agreements have been signed for the construction of this project. The MISO granted unconditional approval of the Brookings Project as an MVP under the MISO Tariff in December 2011. This project willis anticipated to be placedcompleted in service in segments with the earliest segment being placed in service in the summer of 2013 and the last segment placed in service during the first quarter of 2015. OTP’s share of the costs of the Brookings Project is expected to be $26.0 million.
Energy Efficiency Plan (EEP)—The SDPUC has encouraged all investor-owned utilities in South Dakota to be part of an Energy Efficiency Partnership to significantly reduce energy useuse. The plan is being implemented with program costs, carrying costs and a financial incentive being recovered through an approved rider.
On June 16, 2010 OTP filed a request with the SDPUC for approval of updates to itsOTP’s 2010 South Dakota Energy Efficiency PlanEEP and approval for the continuation of the program in 2011. OTP requested increases in energy and demand savings goals and increases in related financial incentives for both 2010 and the requested 2011 program. In an order issued on July 27, 2010 the SDPUC approved OTP’s request for updated energy, demand and participation goals for continuation of the programEEP into 2011. OTP is operating under its 2010 South Dakota EEP, as updated.
On April 29, 2011 OTP filed a request with the SDPUC for approval of a 2010 financial incentive of $73,415 and a surcharge adjustment of $0.00063 on South Dakota customers’ bills. On May 25, 2011 OTP filed a request with the SDPUC for approval of updates to its 2012-2013 South Dakota Energy Efficiency Plan.EEP. The SDPUC approved the 2012-2013 planupdated EEP with a maximum available incentive payment limited to 30% of the budget amount provided in the plan,EEP, or $84,000. On June 19, 2012, the SDPUC approved OTP’s request for a 2011 financial incentive of $78,900 along with an increased surcharge adjustment that became effective on July 1, 2012. On June 18, 2013 the SDPUC approved OTP’s request for a 2012 financial incentive of $84,000 along with an increased surcharge adjustment that became effective July 1, 2013. On November 5, 2013, the SDPUC approved OTP’s EEP updates for 2014-2015. On December 3, 2013, the SDPUC voted to amend the approval previously given and require OTP to come before the Commission if the overall plan budget would exceed 10%, rather than the previously approved 30%.
FERC
Wholesale power sales and transmission rates are subject to the jurisdiction of the FERC under the Federal Power Act of 1935, as amended. The FERC is an independent agency which haswith jurisdiction over rates for wholesale electricity sales, transmission and sale of electric energy in interstate commerce, interconnection of facilities, and accounting policies and practices. Filed rates are effective after a one day suspension period, subject to ultimate approval by the FERC.
Effective January 1, 2010 the FERC authorized OTP’s implementation of a forward looking formula transmission rate under the MISO Tariff. OTP was also authorized by the FERC to recover in its formula rate (1) 100% of prudently incurred CWIP in rate base and (2) 100% of prudently incurred costs of transmission facilities that are cancelled or abandoned for reasons beyond OTP’s control (Abandoned Plant Recovery), as determined by the FERC subsequent to abandonment, specifically for three regional transmission CapX2020 projects thatin which OTP is investing in:investing: the Fargo Project, the Bemidji Project and the Brookings Project.
On December 16, 2010 the FERC approved the cost allocation for a new classification of projects in MISO called MVPs. MVPs are designed to enable the region to comply with energy policy mandates and to address reliability and economic issues affecting multiple transmission zones within the MISO region. The cost allocation is designed to ensure that the costs of transmission projects with regional benefits are properly assigned to those who benefit. On October 20, 2011 the FERC reaffirmed the MVP cost allocation on rehearing. TheOn June 7, 2013, in response to a challenge to the MVP cost allocation is currently being challenged in the Seventh Circuit ofheard before the United States Court of Appeals.Appeals, Seventh Circuit, the Court ruled in favor of MISO and MISO transmission owners, issuing an order affirming the FERC’s approval of the MVP cost allocation. On October 7, 2013 certain parties submitted a petition for writ of certiorari to the U.S. Supreme Court seeking review of the Seventh Circuit decision. As of February 14, 2014 the U.S. Supreme Court had not acted on the petition.
On November 3, 2011 OTP12, 2013, a group of industrial customers and other stakeholders filed witha complaint at the FERC seeking to request transmission incentive rate treatment for two MVPs. The two MVPs, which were granted approval by MISOreduce the return on December 8, 2011, are the Big Stone South–Brookings Project and the Ellendale–Big Stone South Project. On December 30, 2011, the FERC approved OTP’s request. The approved incentive rate treatment provides for the inclusion in rate base of in-process construction costs during development and constructionequity component of the projectstransmission rates that MISO transmission owners, including OTP, may collect under the MISO Tariff. The complainants are seeking to reduce the current 12.38% return on equity used in MISO’s transmission rates to a proposed 9.15%. MISO and ina group of MISO transmission owners have filed responses to the event that either ofcomplaint seeking its dismissal and defending the projectscurrent return on equity. The complaint is abandoned for reasons outside of OTP’s control, will allow OTP to petitionpending at the FERC for recovery of any abandonment plant costs on the basis that the costs were prudently incurred. FERC.
Effective on January 1, 2012 the FERC authorized OTP to recover 100% CWIP and Abandoned Plant Recovery on two projects approved by MISO as MVPs in MISO’s 2011 Transmission Expansion Plan: the Big Stone South–Brookings ProjectMVP and the Ellendale–Big Stone South Project. OTP’s total expected capital investment in these two projects in the years 2012 through 2016 is approximately $117.7 million.South-Ellendale MVP.
The Big Stone South – Brookings Project—This planned 345 kV transmission line will extend 70 miles between a proposed substation near Big Stone City, South Dakota and the new Brookings County Substation near Brookings, South Dakota. OTP is jointly developing this project with Xcel Energy. MISO approved this project as an MVP under the MISO Tariff in December 2011. A Notice of Intent to Construct Facilities (NICF) was filed with the SDPUC on February 29, 2012. A portion of this line is anticipated to use previously obtained Big Stone II transmission route permits and easements and is expected to be in service in 2017. On July 31, 2012 the SDPUC approved the transfer of the Big Stone II transmission route permits to OTP. In December 2012, a request was filed with the SDPUC for recertification of a portion of the line route that was approved as part of the Big Stone II transmission development. The SDPUC approved the certification for the northern portion of the route on April 9, 2013. OTP and Xcel Energy expectjointly submitted an application to makethe SDPUC for a joint route permit filing in the second quarter of 2013 for the remainingsouthern portion of the project.Big Stone South to Brookings line on June 3, 2013. A decision on the permit application for the southern half of this route is expected in the first quarter of 2014. If the proposed project receives all the necessary approvals, OTP anticipates the line will be completed in 2017. OTP’s total capital investment in this project is expected to be approximately $109 million.
The Ellendale – Big Stone South – Ellendale Project—This transmission line is a proposed 345 kV line that will extend 160 to 170 miles between a proposed substation near Big Stone City, South Dakota and a proposed substation near Ellendale, North Dakota. OTP is jointly developing this project with Montana-Dakota Utilities Co., a Division of MDU Resources Group, Inc. (MDU). MISO approved this project as an MVP under the MISO Tariff in December 2011. OTP and MDU jointly filed an NICF with the SDPUC in March of 2012. ThisOn August 25, 2013 the NDPSC granted Certificates of Public Convenience and Necessity to OTP and MDU for the ten miles of the proposed line to be built in North Dakota. A joint route permit application was filed by OTP and MDU on August 23, 2013 with the SDPUC. OTP and MDU jointly filed an Application for a Certificate of Corridor Compatibility along with an application for a route permit with the NDPSC on October 18, 2013. If the proposed project receives all the necessary approvals, OTP anticipates the line will require regulatory approval from both the SDPUC and the NDPSC. Route permits arebe completed in 2019. OTP’s total capital investment in this project is expected to be filed with the respective commissions in the third quarter of 2013.approximately $184 million.
CapX2020 Brookings Project—In June 2011 the MISO board of directors granted conditional approval of the MVP cost allocation designation under the MISO Tariff for the Brookings Project, and the project was granted unconditional approval in December 2011 as an MVP. This project is anticipated to be completed in the first quarter of 2015.
NAEMA
OTP is a member of the North American Energy Marketers Association (NAEMA) which is an independent, non-profit trade association representing entities involved in the marketing of energy or in providing services to the energy industry. NAEMA has over 130 members with operations in 48 states and Canada. NAEMA was formed as a successor organization of the Power and Energy Market (PEM) of the Mid-Continent Area Power Pool (MAPP) in recognition that PEM had outgrown the MAPP region. Power pool sales are conducted continuously through NAEMA in accordance with schedules filed by NAEMA with the FERC.
MRO
OTP is a member of the Midwest Reliability Organization (MRO). The MRO is a non-profit organization dedicated to ensuring the reliability and security of the bulk power system in the north central region of North America, including parts of both the United States and Canada. MRO began operations in 2005 and is one of eight regional entities in North America operating under authority from regulators in the United States and Canada through a delegation agreement with the North American Electric Reliability Corporation. The MRO is responsible for: (1) developing and implementing reliability standards, (2) enforcing compliance with those standards, (3) providing seasonal and long-term assessments of the bulk power system’s ability to meet demand for electricity, and (4) providing an appeals and dispute resolution process.
The MRO region covers roughly one million square miles spanning the provinces of Saskatchewan and Manitoba, the states of North Dakota, Minnesota, Nebraska and the majority of the territory in the states of South Dakota, Iowa and Wisconsin. The region includes more than 100 organizations that are involved in the production and delivery of power to more than 20 million people. These organizations include municipal utilities, cooperatives, investor-owned utilities, a federal power marketing agency, Canadian Crown Corporations, independent power producers and others who have interests in the reliability of the bulk power system. MRO assumed the reliability functions of the MAPP and Mid-America Interconnected Network, both former voluntary regional reliability councils.
MISO
OTP is a member of the MISO. As the transmission provider and security coordinator for the region, the MISO seeks to optimize the efficiency of the interconnected system, provide regional solutions to regional planning needs and minimize risk to reliability through its security coordination, long-term regional planning, market monitoring, scheduling and tariff administration functions. The MISO covers a broad region containing all or parts of 1215 states and the Canadian province of Manitoba. The MISO has operational control of OTP’s transmission facilities above 100 kV, but OTP continues to own and maintain its transmission assets.
The MISO Energy Markets commenced operation on April 1, 2005. Through its Energy Markets, MISO seeks to develop options for energy supply, increase utilization of transmission assets, optimize the use of energy resources across a wider region and provide greater visibility of data. MISO aims to facilitate a more cost-effective and efficient use of the wholesale bulk electric system.
The MISO Ancillary Services Market (ASM) commenced on January 6, 2009. The marketASM facilitates the provision of Regulation, Spinning Reserve and Supplemental Reserves. The ASM integrates the procurement and use of regulation and contingency reserves with the existing Energy Market. OTP has actively participated in the market since its commencement.
In December 2008 pursuant to the provisions of the MISO Transmission Owners Agreement, OTP sent MISO a letter of intent to withdraw from MISO on or after December 31, 2009. This procedural step was taken to allow OTP the earliest available opportunity to withdraw from MISO if its concerns about the unintended consequences produced by the MISO Tariff, which imposed a disproportionate allocation of charges to its customers, attributable to the allocation of costs for transmission network upgrades, cannot be equitably resolved. Withdrawal from MISO would require OTP to either secure replacement of and/or self-provide the services currently provided by MISO. OTP’s notice remains in effect.
Other
OTP is subject to various federal and state laws, including the Federal Public Utility Regulatory Policies Act and the Energy Policy Act of 1992 which(which are intended to promote the conservation of energy and the development and use of alternative energy sources,sources) and the Comprehensive Energy Policy Act of 2005.
Competition, Deregulation and Legislation
Electric sales are subject to competition in some areas from municipally owned systems, rural electric cooperatives and, in certain respects, from on-site generators and cogenerators. Electricity also competes with other forms of energy. The degree of competition may vary from time to time depending on relative costs and supplies of other forms of energy.
The Company believes OTP is well positioned to be successful in a competitive environment. A comparison of OTP’s electric retail rates to the rates of other investor-owned utilities, cooperatives and municipals in the states OTP serves indicates OTP’s rates are competitive.
Legislative and regulatory activity could affect operations in the future. OTP cannot predict the timing or substance of any future legislation or regulation. The Company does not expect retail competition to come to the states of Minnesota, North Dakota or South Dakota in the foreseeable future. There has been no legislative action regarding electric retail choice in any of the states where OTP operates. The Minnesota legislature has in the past considered legislation that, if passed, would have limited the Company’s ability to maintain and grow its nonelectric businesses.
OTP is unable to predict the impact on its operations resulting from future regulatory activities, from future legislation or from future taxes that may be imposed on the source or use of energy.
Environmental Regulation
Impact of Environmental Laws —OTP’s existing generating plants are subject to stringent federal and state standards and regulations regarding, among other things, air, water and solid waste pollution. In the five years ended December 31, 20122013 OTP invested approximately $23.5$103.2 million in environmental control facilities. The 20132014 and 20142015 construction budgets include approximately $89.5$82 million and $99.5$61 million, respectively, for environmental equipment for existing facilities.
Air Quality - Criteria Pollutants —Pursuant to the Federalfederal Clean Air Act (the CAA), the EPA has promulgated national primary and secondary standards for certain air pollutants.
The primary fuels burned by OTP’s steam generating plants are North Dakota lignite coal and western subbituminous coal. Electrostatic precipitators have been installed at the principal units at the Hoot Lake Plant. Hoot Lake Plant Unit 1, which is the smallest of the three coal-fired units at Hoot Lake Plant, was retired as of December 31, 2005. As a result, OTP believes the units at the Hoot Lake Plant currently meet all presently applicable federal and state air quality and emission standards.
The South Dakota Department of Environment and Natural Resources (DENR) issued a Title V Operating Permit to the Big Stone site on June 9, 2009 allowing for operation of Big Stone Plant. The Big Stone Plant continues to operate under Title V permit provisions. The Big Stone Plant is currently operating within all presently applicable federal and state air quality and emission standards.
The Coyote Station is equipped with SOsulfur dioxide (SO2) removal equipment. The removal equipment—referred to as a dry scrubber—consists of a spray dryer, followed by a fabric filter, and is designed to desulfurize hot gases from the stack. The fabric filter collects spray dryer residue along with the fly ash. The Coyote Station is currently operating within all presently applicable federal and state air quality and emission standards.
The CAA, in addressing acid deposition, imposed requirements on power plants in an effort to reduce national emissions of SO2 and nitrogen oxides (NOx).
The national SO2 emission reduction goals are achieved through a market based system under which power plants are allocated “emissions allowances” that require plants to either reduce their SO2 emissions or acquire allowances from others to achieve compliance. Each allowance is an authorization to emit one ton of SO2. SO2 emission requirements are currently being met by all of OTP’s generating facilities without the need to acquire other allowances for compliance with the acid deposition provisions of the CAA.
The national NOx emission reduction goals are achieved by imposing mandatory emissions standards on individual sources. All of OTP’s generating facilities met the NOx standards during 2012.2013.
The EPA Administrator signed the Clean Air Interstate Rule (CAIR) on March 10, 2005. The EPA has concluded that SO2 and NOx are the chief emissions contributing to interstate transport of particulate matter less than 2.5 microns (PM2.5). The EPA also concluded that NOx emissions are the chief emissions contributing to ozone nonattainment.
Twenty-three states and the District of Columbia were found to contribute to ambient air quality PM2.5 nonattainment in downwind states. On that basis, the EPA proposed to cap SO2 and NOx emissions in the designated states. Minnesota was included among the twenty-three states subject to emissions caps; North Dakota and South Dakota were not included. Twenty-five states were found to contribute to downwind 8-hour ozone nonattainment. None of the states in OTP’s service territory were slated for NOx reduction for 8-hour ozone nonattainment purposes. On July 11, 2008, the U.S. Court of Appeals for the D.C. Circuit vacated CAIR and the CAIR federal implementation plan in its entirety.
On December 23, 2008, the court reconsidered and remandedits order vacating CAIR, instead remanding the case forrule to the EPA to conduct further proceedings consistent with the court’s prior opinion.opinion invalidating CAIR. On January 16, 2009, the EPA proposed a rule that would stay the effectiveness of CAIR and the CAIR federal implementation plan for sources in Minnesota while the EPA conductsconducted notice-and-comment rulemaking on remand from the D.C. Circuit’s decisions in the litigation on CAIR. Remanding the issue to the EPA for further consideration, the court held that the EPA had not adequately addressed errors alleged by Minnesota Power in the EPA’s analysis supporting inclusion of Minnesota. Neither the EPA nor any other party sought rehearing of this part of the court’s CAIR decision. Public Notice of the final rule staying the implementation of CAIR in Minnesota appeared in the November 3, 2009 Federal Register.
On July 6, 2010, the EPA proposed the Transport Rule that essentially would replace the CAIR, but which was(unlike CAIR) proposed to include Minnesota sources due to a finding that Minnesota’s emissions contribute to PM2.5 nonattainment in downwind states. However, its impact on Hoot Lake Plant and OTP’s Solway combustion turbine under the initial proposal would have been less than what had been contemplated under CAIR. The EPA released the final Transport Rule, renamed as the Cross-State Air Pollution Rule (CSAPR), on July 8, 2011. The final rule made several changes as compared to the proposed rule, including a substantial change in the allowance allocation methodology. A number of states and industry representatives challenged the rule, and onrule. On December 30, 2011, the U.S. Court of Appeals for the D.C. Circuit granted motions to stay CSAPR pending the court’s resolution of the petitions for review. The Court issued an order on August 21, 2012 to vacatevacating CSAPR. The order requiresrequired the EPA to continue administering CAIR pending the promulgation of a valid replacement rule. The United States sought Supreme Court review of the D.C. Circuit’s decision vacating CSAPR, and the Supreme Court granted review. Briefing and oral argument took place in late 2013, and a decision on whether CSAPR will be reinstated is expected before July 2014. In the meantime, because no party sought a stay of the issuance of the mandate in the D.C. Circuit pending Supreme Court review, CSAPR remains invalidated, and regulated parties must continue to abide by CAIR pending a Supreme Court decision. Since CAIR is currently stayed for Minnesota, and does not apply to North or South Dakota, there is no impact to OTP at this time.
Air Quality – Hazardous Air Pollutants —On—On December 16, 2011 the EPA signed a final rule to reduce mercury and other air toxics emissions from power plants known as the Mercury and Air Toxics Standards (MATS) rule. The final rule became effective on April 16, 2012, and plants will have until April 16, 2015 to comply. However, the EPA is encouraging state permitting authorities to broadly grant a one-year compliance extension to plants that need additional time to install controls. The DENR granted Big Stone Plant a one-year compliance extension in August 2013. The EPA is also providing a pathway for reliability criticalreliability-critical units to obtain an additional year to achieve compliance; however, the EPA has indicated that it believes there will be few, if any situations, in which this pathway is needed. Based on OTP’s review of the final rule, it appears that OTP’s affected units wouldwill meet the requirements by installing the AQCS system at Big Stone, by adding fabric filters or upgrading the electrostatic precipitators on Hoot Lake Units 2 and 3, by installing mercury control technology such as activated carbon injection on all units, and by possibly installing dry sorbent injection at Hoot Lake Plant. Emissions monitoring equipment and/or stack testing will also be needed to verify compliance with the standards. Mercury emissions monitoring equipmentNumerous petitions were filed in the United States Court of Appeals for the D.C. Circuit challenging the MATS rule. The matter has been fully briefed and argued, and a decision is expected in the spring of 2014. Because no stay of the rule was previously installed at Big Stone Plant and Coyote Station, butobtained, MATS continues to govern pending resolution of the equipment will needjudicial challenges to be re-evaluated for operability under the final rule.
Air Quality – EPA New Source Review Enforcement Initiative —In—In 1998 the EPA announced its New Source Review Enforcement Initiative targeting coal-fired utilities, petroleum refineries, pulp and paper mills and other industries for alleged violations of the EPA’s New Source Review rules. These rules require owners or operators that construct new major sources or make major modifications to existing sources to obtain permits and install air pollution control equipment at affected facilities. The EPA is attempting to determine if emission sources violated certain provisions of the CAA by making major modifications to their facilities without installing state-of-the-art pollution controls. On January 2, 2001 OTP received a request from the EPA, pursuant to Section 114(a) of the CAA, to provide certain information relative to past operation and capital construction projects at the Big Stone Plant. OTP responded to that request. In March 2003 the EPA conducted a review of the plant’s outage records as a follow-up to theirits January 2001 data request. A copy of the designated documents was provided to the EPA on March 21, 2003.
On January 8, 2009, OTP received another request from EPA Regions 5 and 8, pursuant to Section 114(a) of the CAA, to provide certain information relative to past operation and capital construction projects at the Big Stone Plant, Coyote Station and Hoot Lake Plant. OTP filed timely responses to the EPA’s requests on February 23, 2009 and March 31, 2009. In July 2009, EPA Region 5 issued a follow-up information request with respect to certain maintenance and repair work at the Hoot Lake Plant. OTP responded to the request. The EPA has not set forth any additional follow-up requests at this time. OTP cannot determine what, if any, actions will be taken by the EPA.
On September 22, 2008, the Sierra Club notified OTP and the two other Big Stone Plant co-owners of its intent to sue alleging violations of the Prevention of Significant Deterioration (PSD) and New Source Performance Standards (NSPS) requirements of the CAA with respect to two past plant activities. The Sierra Club stated that unless the matter was otherwise fully resolved, it intended to file suit in the applicable district courts any time 60 days after the September 22, 2008 letter. As of the date of this report the Sierra Club has not filed suit in the applicable district courts as contemplated in the September 22, 2008 notification. OTP believes that the Big Stone Plant is in material compliance with all applicable requirements of the CAA.
Air Quality – Regional Haze Program —The—The EPA promulgated the Regional Haze Rule in 1999, and on June 15, 2005 the EPA provided final guidelines for conducting BART determinations under the rule. The Regional Haze Rule requires emissions reductions from BART-eligible sources that are deemed to contribute to visibility impairment in Class I air quality areas. Big Stone Plant is BART eligible, and the South Dakota Department of Environment and Natural Resources (DENR)DENR determined that the plant is subject to emission reduction requirements based on the modeled contribution of the plant emissions to visibility impairment in downwind Class I air quality areas. On November 2, 2009 OTP submitted to DENR its analysis of what control technology should be consideredBased on the South Dakota DENR’s BART for NOX, SO2,determination and particulate matter for the Big Stone Plant.
On January 15, 2010 the DENR provided OTP with a copy offinal South Dakota’s draft proposedDakota Regional Haze State Implementation Plan (SIP). South Dakota’s draft proposed Regional Haze SIP recommended approved by the SO2 and particulate matter emission control technology and emission rates that generally followed OTP’s BART analysis. The DENR recommendedEPA on March 29, 2012, Big Stone must install Selective Catalytic Reduction (SCR) technology for NOx emission reduction in addition to the OTP-recommendedand separated over-fire air.air to reduce NOx emissions, dry flue gas desulfurization to reduce SO2
South Dakota developed emissions, and submitted its implementation plan and associated implementation rules to the EPA on January 21, 2011. The DENR and the EPA agreed on non-substantive rule revisions, which were adopted by the Board of Minerals and Environment and became effective on September 19, 2011. South Dakota submitted a revised implementation plan and associated implementation rules to the EPA on September 19, 2011. EPA signed the final rule approving the South Dakota Regional Haze SIP and the Big Stone BART determination on March 29, 2012, and the final approval became effective on May 29, 2012. Under the South Dakota implementation plan, and its implementing rules, thenew baghouse for particulate matter control. Big Stone Plant must install and operate a newthe BART compliant air quality control system to reduce emissions as expeditiously as practicable, but nonot later than five years after the EPA’s approval. Although studies and evaluations are continuing, thefinal approval of May 29, 2012. The current project cost is estimated to be approximately $490$405 million (OTP’s share would be $265$218 million).
On January 14, 2011 OTP filed a petition asking the MPUC for an ADP for the design, construction and operation of the BART compliant air quality control system at Big Stone Plant attributable to serving OTP’s Minnesota customers and on December 20, 2011 the MPUC granted the petition. The MPUC issued its written order granting the ADP on January 23, 2012.
OTP filed an application for an ADP with the NDPSC on May 20, 2011. The NDPSC hired a consulting firm to evaluate the ADP request. Evidentiary hearings were held on November 29, 2011. There was no opposition in this proceeding. OTP and NDPSC advocacy staff entered into a settlement agreement that was filed with the NDPSC on January 9, 2012. The NDPSC held a special meeting on May 9, 2012 at which time the order was approved by all Commissioners. The order contains conditions for reporting and made no determination of the prudence of the technology for NOx control.
On March 30, 2012 OTP requested approval from the SDPUC for an ECRR to recover costs associated with the Big Stone Plant air quality control system. OTP is currently awaiting SDPUC action. This rider is designed to recover the revenue requirements plus carrying charges of the project while under construction as well as after completion of the project until placed into base rates through the filing of a rate case.
Big Stone Plant is currently operating within all presently applicable federal and state air quality and emission standards.
The North Dakota Regional Haze SIP requires that Coyote Station reduce its NOx emissions. On March 14, 2011 the North Dakota Department of Health (NDDOH) issued a construction permit to Coyote Station requiring installation of control equipment to limit its NOx emissions to 0.5 pounds per million Btu as calculated on a 30-day rolling average basis beginning on July 1, 2018. The current estimate of the total cost of the project is $6$9 million ($2.13.2 million for OTP’s share). On March 1, 2012 the EPA signed a final rule for partial approval of the North Dakota SIP that included the NOx emission rate permit conditions for Coyote Station as proposed by the NDDOH. The rule became effective on May 7, 2012.
In June 2012 the Sierra Club and National Parks Conservation Association (NPCA) filed an appeal of the EPA’s approval of the North Dakota Regional Haze SIP to the U.S. Eighth Circuit Court of Appeals. The petitionAppeals for review was silent on the specific issues that the groups intended to challenge.Eight Circuit. On the same day Sierra Club/NPCA also separately filed a petition for reconsideration with the EPA. In the petition for reconsideration filed with the EPA, Sierra Club/NPCA did not take issue with the Coyote Station NOx emission limit. However, in the Eighth Circuit appeal, Sierra Club/NPCA filed a brief on October 5, 2012 that included a challenge to the EPA’s determinations relative to Coyote Station. The groups are requestingrequested the Eighth Circuit to reverse and remand the EPA’s SIP approval. An amicus brief was submitted to the Eighth Circuit on behalf of the Coyote Station on December 18, 2012. Oral arguments were held before the Eighth Circuit on May 14, 2013, and on September 23, 2013 the Eighth Circuit denied the Sierra Club/NPCA appeal with respect to Coyote Station.
Air Quality – Greenhouse Gas (GHG) Regulation —Combustion—Combustion of fossil fuels for the generation of electricity is a major stationary source of CO2 emissions in the United States and globally. OTP is an owner or part-owner of three baseload, coal-fired electricity generating plants and three fuel-oil or natural gas-fired combustion turbine peaking plants with a combined net dependable capacity of 652656 MW. In 20122013 these plants emitted approximately 3.54.0 million tons of CO2.
OTP monitors and evaluates the possible adoption of national, regional, or state climate change and GHG legislation or regulations that would affect electric utilities. Congress previously considered but has not adopted GHG legislation which would require a reduction in GHG emissions, and there is no legislation under active consideration at this time. The likelihood of any federal mandatory CO2 emissions reduction program being adopted by Congress in the near future, and the specific requirements of any such program, is uncertain.
In April 2007, however, the U.S. Supreme Court issued a decision that determined that the EPA has authority to regulate CO2 and other GHGs from automobiles as “air pollutants” under the CAA. The Supreme Court sent the case back todirected the EPA to conduct a rulemaking to determine whether GHG emissions contribute to climate change “which may reasonably be anticipated to endanger public health or welfare.” While this case addressed a provision of the CAA related to emissions from motor vehicles, a parallel provision of the CAA applies to stationary sources such as electric generators.generators; according to the EPA, that parallel provision would be automatically triggered once the EPA began regulating motor vehicle GHG emissions. The first step in the EPA rulemaking process was the publication of an endangerment finding in the December 15, 2009 Federal Register where the EPA found that CO2 and five other GHGs – methane, NOx,nitrous oxide, hydrofluorocarbons, perfluorocarbons and sulfur hexafluoride – threaten public health and the environment.
The EPA’s final findings respond to the 2007 U.S. Supreme Court decision that GHGs fit within the CAA’s definition of air pollutants. The findings do not in and of themselves impose any emission reduction requirements but rather allowed the EPA to finalize the GHG standards for new light-duty vehicles as part of the joint rulemaking with the Department of Transportation. These standards apply to motor vehicles as of January 2011, which makes GHGs “subject to regulation” under the CAA. This, then, triggered the Prevention of Significant Deterioration (PSD) and Title V operating permits programs for stationary sources of GHGs. The question of whether the regulation of motor vehicle emissions does in fact automatically trigger regulation of stationary sources of the same pollutant is presently under review by the Supreme Court. The case is fully briefed, and oral argument will be held on February 24, 2014. A decision is not expected until June or July 2014.
On June 6, 2010 the EPA published a final “tailoring rule” that phases in application of its PSD programand Title V programs to GHG emission sources, including power plants. ThisThe PSD program applies to existing sources if there is a physical change or change in the method of operation of the facility that results in a significant net emissions increase.increase of any pollutant. As a result, PSD does not apply on a set timeline as is the case with other regulatory programs, but is triggered depending on what activities take place at a major source. If triggered, the owner or operator of an affected facility must undergo a review which requires the identification and implementation of best-available control technology (BACT) for the regulated air pollutants for which there is a significant net emissions increase, and an analysis of the ambient air quality impacts of the facility.
As of July 2011, sources emitting more than 100,000 tons per year of “CO2e”, a measure that converts emissions of each GHG into its carbon dioxide equivalent, are considered “major sources” subject to PSD requirements if they propose to make modifications resulting in a net GHG emissions increase of 75,000 tons per year or more of CO2e. OTP does not anticipate making modifications at any of its facilities that would trigger PSD requirements. The South Dakota DENR reviewed OTP’s projected emissions, including GHG emissions, as a result of the Big Stone Plant AQCS Project and the DENR agreed that the emissions did not trigger the need for a PSD permit. Consequently, the DENR issued an Air Quality Construction Permit for the Big Stone Plant AQCS Project on January 6, 2012.
TheConcurrently, the EPA is developing NSPSNew Source Performance Standards (NSPS) for GHGs from fossil fuel-fired electric generating units. The EPA proposed a rule on April 13, 2012January 8, 2014 that would require certainsubject large new fossil fuel generating plantscoal-fired units to meet a GHG emission limit of 1,100 lbs. of CO2output per megawatt-hour (mwh) averaged over a 12-month period, or possibly a limit of 1,000-1,050 pounds of CO2 averaged over a period of seven years. This limit is based standard.on emission reductions the EPA believes could be achieved through the installation and operation of partial carbon capture and sequestration technology. Certain new natural gas-fired units would be subject to a limit of 1,000 or 1,100 pounds of CO2 per mwh, dependent on unit size, which is the emissions level the EPA believes natural gas combined cycle units can currently achieve with no additional add-ons. Unlike traditional NSPS rules, the proposed GHG NSPS would not apply to modifications at existing units. ItUnder Section 111(b) of the CAA, the EPA must finalize the standard within a year of its proposal, or by January 8, 2015. However, it is expected thatthe EPA will issue a final rule in the firstsecond half of 2013.2014. If finalized, the NSPS would apply to any unit the construction of which commences after the date of the proposal, or January 8, 2014.
AfterThe EPA develops the NSPS, it is anticipated that the EPA will work towards issuing emission guidelinesalso intends to develop GHG performance standards for existing sources under CAA Section 111(d) (111(d) Standard). A 111(d) Standard, unlike thea NSPS, applies to an existing source. Statessources of a pollutant. Under Section 111(d), the EPA does not itself issue the standards. Rather, the EPA promulgates emission guidelines, and the states are then given a period of time to develop plans to implement a 111(d) Standard,the standard. The EPA reviews each state-developed standard and then approves it if athe state’s plan comports with the federal emission guidelines; if the state does not develop suchsubmit a plan, or if the EPA finds that the plan is inadequate, the EPA will prescribe a plan for that state. AThe EPA has indicated that it intends to sign proposed emission guidelines by June 1, 2014, to finalize those guidelines by June 1, 2015 and to require state submissions by June 30, 2016.
For both new and existing sources, the EPA must develop a “standard of performance”performance,” which is defined as:
…a standard for emissions of air pollutants which reflects the degree of emission limitation achievable through the application of the best system of emission reduction which (taking into account the cost of achieving such reduction and any non airnon-air quality health and environmental impact and energy requirements) the [EPA] Administrator determines has been adequately demonstrated.
Both NSPS andFor existing sources, Section 111(d) Standards involve development of “standards of performance,” but the 111(d) Standard also requires the EPA to consider, “among other factors, remaining useful lives of the sources in the category of sources to which such standard applies.” In general, the standards ultimately developed are more stringent for new sources than for existing sources, because existing source standards need to consider the issues involved in retrofitting plants considering what can be achieved under their existing design.design, as well as the cost of implementing the standard relative to the remaining useful life of the facility. The standards also need to be capable of attainment across the category of sources regulated by the standard.
While the potential impact of a 111(d) Standard on OTP’s facilities is not yet known, standards of performance for GHGs, especially for existing sources of GHGs are anticipated to focus on efficiency improvements rather than add-on controls. The cost of efficiency improvements that achieve generation of the same amount of power with less fuel used could be offset in whole or in part by reduced fuel costs. It is also possible that the EPA will allow the states to claim credit for reductions in GHG emissions that are achieved through programs designed to reduce end-user demand and that it will allow the states, either separately or together, to establish emission averaging and emission credit banking and trading systems (i.e., a cap-and-trade program).
Litigation over both the NSPS and the emission guidelines for existing sources is expected. Thus, uncertainty over whether the standards will be enforced or, if so, what will be permitted, may continue for a number of years.
Several states and regional organizations are also developing, or already have developed, state-specific or regional legislative initiatives to reduce GHG emissions through mandatory programs. In 2007, the state of Minnesota passed legislation regarding renewable energy portfolio standards that will requirerequires retail electricity providers to obtain 25% of the electricity sold to Minnesota customers from renewable sources by the year 2025. TheAdditionally, in 2013 the state of Minnesota passed a provision that requires public utilities to generate or procure sufficient electricity generated by solar energy to serve its retail electricity customers in Minnesota so that by the end of 2020, at least 1.5% of the utility’s total retail electric sales to retail customers in Minnesota is generated by solar energy. Regarding CO2, the Minnesota legislature set a January 1, 2008 deadline for the MPUC to establish an estimate of the likely range of costs of future CO2 regulation on electricity generation. The legislation also set state targets for reducing fossil fuel use, included goals for reducing the state’s output of GHGs, and restricted importing electricity that would contribute to statewide power sector CO2 emission. The MPUC, in its order dated December 21, 2007, established an estimate of future CO2 regulation costs at between $4/ton and $30/ton emitted in 2012 and after. However, annual updates of the range are required, and for 2012 and 2013 the range was revised to $9-$34/ton, and the start date to begin using CO2 costs in resource planning decisions was moved from 2012 to 2017.
The states of North Dakota and South Dakota currently have no proposed or pending legislation related to the regulation of GHG emissions, but North Dakota and South Dakota have 10% renewable energy objectives.
While the eventual outcome of proposed and pending climate change legislation and GHG regulation is unknown, OTP is taking steps to reduce its carbon footprint and mitigate levels of CO2 emitted in the process of generating electricity for its customers through the following initiatives:
| | ● | Supply efficiency and reliability: OTP’s efforts to increase plant efficiency and add renewable energy to its resource mix have reduced its CO2 intensity. Between 19901985 and 2012,2013 OTP decreased its overall system average CO2 emissions intensity (lbs.by approximately 23%. Further reductions are expected with the additional purchase of CO2/megawatt-hour generated) by nearly 25%.62.4 MW of wind-powered generation under the Ashtabula Wind III wind power purchase agreement, under which energy delivery commenced in October 2013, and with the anticipated replacement of Hoot Lake Plant generation likely with natural gas in the 2020 timeframe. |
| | | Conservation: Since 1992 OTP has helped ourits customers conserve over 500nearly 600 MW of demand and nearly 2.52.8 million cumulative megawatt-hoursmwhs of electricity. Thatelectricity, which is roughly equivalent to the amount of electricity that 189,000232,000 average homes would have useduse in a year. OTP continues to educate customers about energy efficiency and demand-side management and to work with regulators to develop new programs. OTP’s 2011-20252014-2028 IRP calls for an additional 70106 MW of conservation and demand side management impacts by 2025.2028. |
| | | Renewable energy: Since 2002, OTP’s customers have been able to purchase 100% of their electricity from wind generation through OTP’s TailWinds program. 40.5OTP has access to 102.9 MW of purchasedwind powered generation under power agreement wind projectspurchase agreements and owns 138 MW of owned wind resources have been on line since December 2009 for serving OTP’s customers.powered generation. |
| | | Other: OTP will continue to participate asis a participating member of the EPA’s SF6 (sulfur hexafluoride) Emission Reduction Partnership for Electric Power Systems program. The partnershipprogram, which proactively is targeting a reduction in emissions of SF6, a potent GHG. SF6 has a global-warming potential 23,900 times that of CO2. Methane has a global-warming potential over 20 times that of CO2. OTP participates in carbon sequestration research through the Plains CO2 Reduction Partnership (PCOR) through the University of North Dakota’s Energy and Environmental Research Center. The PCOR Partnership is a collaborative effort of approximately 100 public and private sector stakeholders working toward a better understanding of the technical and economic feasibility of capturing and storing anthropogenic CO2 emissions from stationary sources in the central interior of North America. |
In late 2009, two federal circuit courts of appeal reversed dismissals of GHG suits and remanded them to district court for trial. OTP iswas not a party to any of these suits, and does not have an indication that it will be the subject of such a lawsuit. The circuit court opinions, however, openopened utility companies and other GHG emitters to these actions, which had previously been dismissed by the district courts as nonjustifiable based on the political question doctrine. In 2010, the U.S. Supreme Court took review of one of these cases, while declining review of another. On June 20, 2011, the Supreme Court ruled unanimously that states cannot invoke federal law to force utilities to cut GHG emissions, which was in agreement with the position of utilities and the EPA.
While the future financial impact of any proposed or pending climate change legislation, litigation, or regulation of GHG emissions is unknown at this time, any capital and operating costs incurred for additional pollution control equipment or CO2 emission reduction measures, such as the cost of sequestration or purchasing allowances, or offset credits, or the imposition of a carbon tax or cap and trade program at the state or federal level could materially adversely affect the Company’s future results of operations, cash flows, and possibly financial condition, unless such costs could be recovered through regulated rates and/or future market prices for energy.
Water Quality —The Federal Water Pollution Control Act Amendments of 1972, and amendments thereto, provide for, among other things, the imposition of effluent limitations to regulate discharges of pollutants, including thermal discharges, into the waters of the United States, and the EPA has established effluent guidelines for the steam electric power generating industry. Discharges must also comply with state water quality standards.
Effluent limits specific to Hoot Lake Plant and Coyote Station are incorporated into their National Pollutant Discharge Elimination System (NPDES) permits. Big Stone Plant is a zero discharge facility and therefore does not have a NPDES permit. The EPA announced its decision to proceed with further possible revisions to steam effluent guidelines on September 15, 2009, and published a proposed rulemaking on June 7, 2013. The proposed rulemaking primarily focuses on discharge restrictions applicable to fly ash transport water, bottom ash transport water, and flue gas desulfurization wastewater. Since the steam effluent guidelines rule is not final, at this time OTP is unable to determine how it will affect our facilities, but it appears that the rule could have minimal effect since the facilities do not discharge fly ash transport water, bottom ash transport water, or flue gas desulfurization wastewater into waters of the United States.
On February 16, 2004 the EPA Administrator signed the final Phase II rule implementing Section 316(b) of the Clean Water Act establishing standards for cooling water intake structures for certain existing facilities. A proposed 316(b) rule was issued on April 20, 2011 to replace the 2004 Phase II rule for existing facilities following its remand by the U.S. Court of Appeals in 2007. Unlike the 2004 Phase II rule, the proposed rule has the potential to affect both Hoot Lake Plant and Coyote Station with the greatest potential effect on Hoot Lake Plant. The final rule is dueexpected to be issuedsigned in June 2013.early 2014, though the EPA has repeatedly missed self-imposed deadlines for finalizing the rule. OTP is uncertain of the impact on the potentially affected facilities until the EPA releases the final rule.rule, and likely until after discussions with state regulatory agencies.
OTP has all federal and state water permits presently necessary for the operation of the Coyote Station, the Big Stone Plant and the Hoot Lake Plant. OTP owns five small dams on the Otter Tail River, which are subject to FERC licensing requirements. A license for all five dams was issued on December 5, 1991. Total nameplate rating (manufacturer’s expected output) of the five dams is 3,450 kW.
Solid Waste —Permits—Permits for disposal of ash and other solid wastes have been issued for the Coyote Station, the Big Stone Plant and the Hoot Lake Plant.
On June 21, 2010 the EPA published a proposed rule that outlines two possible options to regulate disposal of coal ash generated from the combustion of coal by electric utilities under the Resource Conservation and Recovery Act (RCRA). In one option, the EPA would propose to list coal ash destined for disposal in landfills or surface impoundments as “special wastes” subject to regulation under Subtitle C of RCRA. Subtitle C regulations set forth the EPA’s hazardous waste regulatory program, which regulates the generation, handling, transport and disposal of wastes.
The proposal would create a new category of special waste under Subtitle C, so that coal ash would not be classified as hazardous waste, but would be subject to many of the regulatory requirements applicable to hazardous waste. This option would subject coal ash to technical and permitting requirements from the point of generation to final disposal. The EPA is considering whether to impose disposal facility requirements such as liners, groundwater monitoring, fugitive dust controls, financial assurance, corrective action, closure of units, and post-closure care. This option also includes potential requirements for dam safety and stability for surface impoundments, land disposal restrictions, treatment standards for coal ash, and a prohibition on the disposal of treated coal ash below the natural water table. Beneficial re-uses of coal ash would not be subject to these requirements.
Under the second proposed regulatory option, the EPA would regulate the disposal of coal ash under Subtitle D of RCRA, the regulatory program for non-hazardous solid wastes. In this option, the EPA is considering issuing national minimum criteria to ensure the safe disposal of coal ash, which would subject disposal units to location standards, composite liner requirements, groundwater monitoring and corrective action standards for releases, closure and post-closure care requirements, and requirements to address the stability of surface impoundments. Within this option, the EPA is also considering not requiring existing surface impoundments to close or install composite liners and allowing them to continue to operate for their useful life.
This option would not regulate the generation, storage, or treatment of coal ash prior to disposal, and no federal permits would be required. The EPA’s proposal also states that the EPA is considering whether to list coal ash as a hazardous substance under the Comprehensive Environmental Response, Compensation, and Liability Act, and includes proposals for alternative methods to adjust the statutory reportable quantity for coal ash. The EPA has not decided which regulatory approach it will take with respect to the management and disposal of coal ash. It has suggested, however, that if it finalizes a related Clean Water Act rule regarding effluent limitation guidelines for the steam electric power generating category that are expected to drive utilities to dry-handle their coal combustion residues, then an RCRA rule allowing coal ash to be treated as non-hazardous solid waste may be adequate.
While additionalAdditional requirements may be imposed as part of the EPA’s pending rule, thatwhich could increase the capital and operating costs of OTP’s facilities, identificationfacilities. Identification of specific costs would beis contingent on the requirements of the final rule. The most costly option in the EPA proposal is the option that would regulate all coal ash destined for disposal as special waste. For example, under this option, OTP estimates an annual cost of approximately $5.75 million at its Big Stone Plant. If the EPA chooses the other option, it would impose less cost than this estimate. It is also possible that the new regulations would not require change in the current operation and cost of OTP’s coal ash disposal sites.
At the request of the Minnesota Pollution Control Agency (MPCA), OTP has an ongoing investigation at its former, closed Hoot Lake Plant ash disposal sites. The MPCA continues to monitor site activities under theirits Voluntary Investigation and Cleanup (VIC) Program. OTP provided a revised focus feasibility study for remediation alternatives to the MPCA in October 2004. OTP and the MPCA have reached an agreement identifying the remediation technology and OTP completed the projects in 2006. The effectiveness of the remediation is under ongoing evaluation.evaluation and OTP has notified the MPCA of an additional project in 2014 with plans to remove the ash from one VIC area and place it in OTP’s permitted disposal area.
The EPA has promulgated various solid and hazardous waste regulations and guidelines pursuant to, among other laws, the Resource Conservation and Recovery Act of 1976, the Solid Waste Disposal Act Amendments of 1980 and the Hazardous and Solid Waste Amendments of 1984, which provide for, among other things, the comprehensive control of various solid and hazardous wastes from generation to final disposal. The states of Minnesota, North Dakota and South Dakota have also adopted rules and regulations pertaining to solid and hazardous waste. To date, OTP has incurred no significant costs as a result of these laws. The future total impact on OTP of the various solid and hazardous waste statutes and regulations enacted by the federal government or the states of Minnesota, North Dakota and South Dakota is not certain at this time.
In 1980, the United States enacted the Comprehensive Environmental Response, Compensation and Liability Act, commonly known as the Federal Superfund law, which was reauthorized and amended in 1986. In 1983, Minnesota adopted the Minnesota Environmental Response and Liability Act, commonly known as the Minnesota Superfund law. In 1988, South Dakota enacted the Regulated Substance Discharges Act, commonly known as the South Dakota Superfund law. In 1989, North Dakota enacted the Environmental Emergency Cost Recovery Act. Among other requirements, the federal and state acts establish environmental response funds to pay for remedial actions associated with the release or threatened release of certain regulated substances into the environment. These federal and state Superfund laws also establish liability for cleanup costs and damage to the environment resulting from such release or threatened release of regulated substances. The Minnesota Superfund law also creates liability for personal injury and economic loss under certain circumstances. OTP has not incurred any significant costs to date related to these laws. OTP is not presently named as a potentially responsible party under the federal or state Superfund laws.
Capital Expenditures
OTP is continually expanding, replacing and improving its electric facilities. During 2012,2013, approximately $102$149 million in cash was invested for additions and replacements to its electric utility properties. During the five years ended December 31, 20122013 gross electric property additions, including construction work in progress, were approximately $495$474 million and gross retirements were approximately $58$60 million. OTP estimates that during the five-year period 2013-20172014-2018 it will invest approximately $811$657 million for electric construction, which includes $247$131 million for OTP’s share of a newthe Big Stone Plant AQCS and $348$304 million for transmission projects including $253$243 million for MVPs and $45$26 million for CapX2020 transmission projects excluding $20($7 million for the Brookings to Southeast Twin Cities CapX2020 MVP project is included inwith the $253$243 million above.for MVP projects). The remainder of the 2013-20172014-2018 anticipated capital expenditures is for asset replacements, additions and improvements across OTP’s generation, transmission, distribution and general plant. See “Management’s Discussion and Analysis of Financial Condition and Results of Operations - Capital Requirements” section for further discussion.
Franchises
At December 31, 20122013 OTP had franchises to operate as an electric utility in substantially all but oneof the incorporated municipality thatmunicipalities it serves. All franchises are nonexclusive and generally were obtained for 20-year terms, with varying expiration dates. No franchises are required to serve unincorporated communities in any of the three states that OTP serves. OTP believes that its franchises will be renewed prior to expiration.
Employees
At December 31, 20122013 OTP had 663668 equivalent full-time employees. A total of 393397 OTP employees are represented by local unions of the International Brotherhood of Electrical Workers under two separate contracts expiring in the fall of 20132014 and 2014.2016. OTP has not experienced any strike, work stoppage or strike vote, and considers its present relations with employees to be good.
MANUFACTURING
General
Manufacturing consists of businesses engaged in the following activities: contract machining, metal parts stamping and fabrication, and production of material handling trays and horticultural containers.
The Company derived 24%23%, 23%24% and 20%23% of its consolidated operating revenues and 21%, 26% and 22% of its consolidated operating income from the Manufacturing segment for each of the three years ended December 31, 2013, 2012 2011 and 2010,2011, respectively. Following is a brief description of each of these businesses:
BTD Manufacturing, Inc. (BTD), with headquarters located in Detroit Lakes, Minnesota, is a metal stamping and tool and die manufacturer that provides its services mainly to customers in the Midwest. BTD stamps, fabricates, welds and laser cuts metal components according to manufacturers’ specifications primarily for the recreational vehicle, agricultural, lawn and garden, industrial equipment, health and fitness and enclosure industries in its facilities in Detroit Lakes, Otsego and Lakeville, Minnesota.Minnesota, and Washington, Illinois. BTD’s location in Washington, Illinois facility also manufactures and fabricates parts for off-road equipment, mining machinery, oil fields and offshore oil rigs, wind industry components, broadcast antennae and farm equipment, and serves several major equipment manufacturers in the Peoria, Illinois area and nationwide, including Caterpillar, Komatsu and Gardner Denver.
T. O. Plastics, Inc. (T.O. Plastics), located in Otsego and Clearwater, Minnesota, manufactures and sells thermoformed products for the horticulture industry throughout the United States. In addition, T.O. Plastics produces products such as clamshell packing, blister packs, returnable pallets and handling trays for shipping and storing odd-shaped or difficult-to-handle parts for other industries.customers in the consumer products, food packaging, electronics, industrial and medical industries, among others. T.O. Plastics’ Otsego thermoforming facility achieved an AIB International (formerly American Institute of Baking) compliance rating for producing food-contact packaging materials in its operations.
Competition
The various markets in which the Manufacturing segment entities compete are characterized by intense competition from both foreign and domestic manufacturers. These markets have many established manufacturers with broader product lines, greater distribution capabilities, greater capital resources, excess capacity, labor advantages and larger marketing, research and development staffs and facilities than the Company’s manufacturing entities.
The Company believes the principal competitive factors in its Manufacturing segment are product performance, quality, price, technical innovation, cost effectiveness, customer service and breadth of product line. The Company’s manufacturing entities intend to continue to compete on the basis of high-performance products, innovative production technologies, cost-effective manufacturing techniques, close customer relations and support, and increasing product offerings.
Raw Materials Supply
The companies in the Manufacturing segment use raw materials in the products they manufacture, including steel, aluminum and Polystyrene (PS)polystyrene and other plastics resins. Both pricing increases and availability of these raw materials are concerns of companies in the Manufacturing segment. The companies in the Manufacturing segment attempt to pass increases in the costs of these raw materials on to their customers. Increases in the costs of raw materials that cannot be passed on to customers could have a negative effect on profit margins in the Manufacturing segment.
Backlog
The Manufacturing segment has backlog in place to support 20132014 revenues of approximately $124$136 million compared with $115$124 million one year ago.
Capital Expenditures
Capital expenditures in the Manufacturing segment typically include additional investments in new manufacturing equipment or expenditures to replace worn-out manufacturing equipment. Capital expenditures may also be made for the purchase of land and buildings for plant expansion and for investments in management information systems. During 2012,2013, cash expenditures for capital additions in the Manufacturing segment were approximately $9$7 million. Total capital expenditures for the Manufacturing segment during the five-year period 2013-20172014-2018 are estimated to be approximately $73$81 million.
Employees
At December 31, 20122013 the Manufacturing segment had 9801,059 full-time employees. There are 829932 full-time employees at BTD and 151127 full-time employees at T.O. Plastics.
CONSTRUCTION
General
Construction consists of businesses involved in commercial and industrial electric contracting and construction of fiber optic and electric distribution systems, water, wastewater and HVAC systems primarily in the central United States.
The Company derived 17%, 22% and 19% of its consolidated operating revenues from the Construction segment for each of the years ended December 31, 2012, 2011 and 2010, respectively. Following is a brief description of the businesses included in this segment:
Foley Company (Foley), headquartered in Kansas City, Missouri, provides mechanical and prime contracting services for water and wastewater treatment plants, power generation plants, hospital and pharmaceutical facilities, and other industrial and manufacturing projects across a multi-state service area in the United States.
Aevenia, Inc. (Aevenia), located in Moorhead, Minnesota, has divisions that provide a full spectrum of electrical design and construction services for the industrial, commercial and municipal business markets, including government, institutional, utility communications and electric distribution.
Competition
Each of the construction companies is subject to competition, as well as the effects of general economic conditions in their respective disciplines and geographic locations. The construction companies must compete with other construction companies primarily in the Upper Midwest and the Central regions of the United States, including companies with greater financial resources, when bidding on new projects. The Company believes the principal competitive factors in the Construction segment are price, quality of work and customer service.
Backlog
The construction companies have backlog in place of $151 million for 2013 compared with $106 million one year ago.
Capital Expenditures
Capital expenditures in this segment typically include investments in additional construction equipment. During 2012, cash expenditures for capital additions in the Construction segment were approximately $2 million. Capital expenditures during the five-year period 2013-2017 are estimated to be approximately $12 million for the Construction segment.
Employees
At December 31, 2012 there were 446 full-time employees in the Construction segment. Foley has 203 employees represented by various unions, including Carpenters and Millwrights, Sheet Metal Workers, Laborers, Operators, Operating Engineers, Pipe Fitters, Steamfitters, Plumbers and Teamsters. Foley has several labor contracts with various expiration dates in 2013 – 111 employees, and 2014 – 90 employees, and one contract covering two employees that expires on May 31, 2017. Foley has not experienced any strike, work stoppage or strike vote, and considers its present relations with employees to be good.
PLASTICS
General
Plastics consists of businesses producing PVC pipe at plants in the Upper MidwestNorth Dakota and Southwest regions of the United States.Arizona. The Company derived 18%, 15%18% and 14%15% of its consolidated operating revenues and 25%, 32% and 15% of its consolidated operating income from the Plastics segment for each of the three years ended December 31, 2013, 2012 2011 and 2010,2011, respectively. Following is a brief description of these businesses:
Northern Pipe Products, Inc. (Northern Pipe), located in Fargo, North Dakota, manufactures and sells PVC pipe for municipal water, rural water, wastewater, storm drainage systems and other uses in the northern, midwestern, south-central and western regions of the United States as well as central and western Canada. Production facilities are located in Fargo, North Dakota.
Vinyltech Corporation (Vinyltech), located in Phoenix, Arizona, manufactures and sells PVC pipe for municipal water, wastewater, water reclamation systems and other uses in the western southwestern and south-central regions of the United States.
Together these companies have the current capacity to produce approximately 300 million pounds of PVC pipe annually.
Customers
PVC pipe products are marketed through a combination of independent sales representatives, company salespersons and customer service representatives. Customers for the PVC pipe products consist primarily of wholesalers and distributors throughout the upper midwest, southwestnorthern, midwestern, south-central and western United States.
Competition
The plastic pipe industry is fragmented and competitive, due to the number of producers, the small number of raw material suppliers and the fungible nature of the product. Due to shipping costs, competition is usually regional, instead of national, in scope. The principal areas of competition are a combination of price, service, warranty, and product performance. Northern Pipe and Vinyltech compete not only against other plastic pipe manufacturers, but also ductile iron, steel, concrete and clay pipe producers. Pricing pressure will continue to affect operating margins in the future.
Northern Pipe and Vinyltech intend to continue to compete on the basis of their high quality products, cost-effective production techniques and close customer relations and support.
ManufacturingELECTRIC
General
Electric includes OTP and, Resinthrough December 31, 2012, the operations of OTESCO, which were not materially significant in 2012 and 2011. OTP, headquartered in Fergus Falls, Minnesota, provides electricity to more than 130,000 customers in a service area with outer boundaries that encompass a total expanse of 70,000 square miles of western Minnesota, eastern North Dakota, and northeastern South Dakota. OTESCO, headquartered in Fergus Falls, Minnesota, provided technical and engineering services primarily in North Dakota and Minnesota. The Company derived 42%, 41% and 41% of its consolidated operating revenues and 64%, 74% and 88% of its consolidated operating income from the Electric segment for the years ended December 31, 2013, 2012 and 2011, respectively.
The breakdown of retail electric revenues by state is as follows:
| State | | 2013 | | | 2012 | |
| Minnesota | | | 48.2 | % | | | 48.9 | % |
| North Dakota | | | 42.8 | | | | 42.0 | |
| South Dakota | | | 9.0 | | | | 9.1 | |
| Total | | | 100.0 | % | | | 100.0 | % |
The territory served by OTP is predominantly agricultural. The aggregate population of OTP’s retail electric service area is approximately 230,000. In this service area of 422 communities and adjacent rural areas and farms, approximately 125,646 people live in communities having a population of more than 1,000, according to the 2010 census. The only communities served which have a population in excess of 10,000 are Jamestown, North Dakota (15,427); Bemidji, Minnesota (13,431); and Fergus Falls, Minnesota (13,138). As of December 31, 2013, OTP served 130,188 customers. Although there are relatively few large customers, sales to commercial and industrial customers are significant.
The following table provides a breakdown of electric revenues by customer category. All other sources include gross wholesale sales from utility generation, net revenue from energy trading activity and sales to municipalities.
| Customer Category | | 2013 | | | 2012 | |
| Commercial | | | 36.9 | % | | | 36.0 | % |
| Residential | | | 33.3 | | | | 32.6 | |
| Industrial | | | 23.2 | | | | 25.0 | |
| All Other Sources | | | 6.6 | | | | 6.4 | |
| Total | | | 100.0 | % | | | 100.0 | % |
Wholesale electric energy kilowatt-hour (kwh) sales were 12.5% of total kwh sales for 2013 and 11.8% for 2012. Wholesale electric energy kwh sales increased by 13.9% between the years while revenue per kwh sold increased by 18.8%. Activity in the short-term energy market is subject to change based on a number of factors and it is difficult to predict the quantity of wholesale power sales or prices for wholesale power in the future.
Capacity and Demand
As of December 31, 2013 OTP’s owned net-plant dependable kilowatt (kW) capacity was:
| | | |
| Baseload Plants | | | |
| Big Stone Plant | | 256,700 | kW |
| Coyote Station | | | 149,000 | |
| Hoot Lake Plant | | | 148,900 | |
| Total Baseload Net Plant | | 554,600 | kW |
| Combustion Turbine and Small Diesel Units | | 104,900 | kW |
| Hydroelectric Facilities | | 2,600 | kW |
| Owned Wind Facilities (rated at nameplate) | | | | |
| Luverne Wind Farm (33 turbines) | | 49,500 | kW |
| Ashtabula Wind Center (32 turbines) | | | 48,000 | |
| Langdon Wind Center (27 turbines) | | | 40,500 | |
| Total Owned Wind Facilities | | 138,000 | kW |
The baseload net plant capacity for Big Stone Plant and Coyote Station constitutes OTP’s ownership percentages of 53.9% and 35%, respectively. OTP owns 100% of the Hoot Lake Plant. During 2013, OTP generated about 70.8% of its retail kwh sales and purchased the balance.
In addition to the owned facilities described above OTP had the following purchased power agreements in place on December 31, 2013:
| |
| Purchased Wind Power Agreements (rated at nameplate and greater than 2,000 kW) | |
| Ashtabula Wind III | | 62,400 | kW |
| Edgeley | | | 21,000 | |
| Langdon | | | 19,500 | |
| Total Purchased Wind | | 102,900 | kW |
| | | | |
| Other Purchased Power Agreements (in excess of 1 year and 500 kW) | | | | |
Great River Energy1 | | 100,000 | kW |
1 Through May 2021. | | | |
OTP has a direct control load management system which provides some flexibility to OTP to effect reductions of peak load. OTP also offers rates to customers which encourage off-peak usage.
OTP’s capacity requirement is based on MISO Module E requirements. OTP is required to have sufficient Zonal Resource Credits to meet its monthly weather normalized forecast demand, plus a reserve obligation. The MISO Resource Adequacy Construct changed significantly for the 2013/2014 MISO Planning Year effective June 1, 2013. OTP met its MISO obligation for 2013. OTP generating capacity combined with additional capacity under purchased power agreements (as described above) and load management control capabilities is expected to meet 2014 system demand and MISO reserve requirements.
Fuel Supply
PVC pipeCoal is manufactured throughthe principal fuel burned at the Big Stone, Coyote and Hoot Lake generating plants. Coyote Station, a process known as extrusion. During the production process, PVC compound (a dry powder-like substance) is introduced into an extrusion machine, where it is heated to a molten statemine-mouth facility, burns North Dakota lignite coal. Hoot Lake Plant and then forced through a sizing apparatus to produce the pipe. The newly extruded pipe is then pulled through a series of water cooling tanks, marked to identify the type of pipe and cut to finished lengths. Warehouse and outdoor storage facilities are used to store the finished product. Inventory is shipped from storage to distributors and customers mainly by common carrier.Big Stone Plant burn western subbituminous coal.
The PVC resinsfollowing table shows the sources of energy used to generate OTP’s net output of electricity for 2013 and 2012:
| |
| | | 2013 | | | 2012 | |
| Sources | | Net Kilowatt
Hours
Generated
(Thousands) | | | % of Total
Kilowatt
Hours
Generated | | | Net Kilowatt
Hours
Generated
(Thousands) | | | | % of Total
Kilowatt
Hours
Generated | |
| Subbituminous Coal | | | 2,322,608 | | | | 62.4 | % | | | 2,094,293 | | | | 61.2 | % |
| Lignite Coal | | | 881,973 | | | | 23.7 | | | | 782,358 | | | | 22.9 | |
| Wind and Hydro | | | 471,176 | | | | 12.7 | | | | 490,387 | | | | 14.3 | |
| Natural Gas and Oil | | | 43,165 | | | | 1.2 | | | | 55,637 | | | | 1.6 | |
| Total | | | 3,718,922 | | | | 100.0 | % | | | 3,422,675 | | | | 100.0 | % |
OTP has the following primary coal supply agreements:
| | | |
| Plant | Coal Supplier | Type of Coal | Expiration Date |
| Big Stone Plant | Peabody COALSALES, LLC | Wyoming subbituminous | December 31, 2016 |
| Big Stone Plant | Westmoreland Resources, Inc. | Montana subbituminous | December 31, 2014 |
| Coyote Station | Dakota Westmoreland Corporation | North Dakota lignite | May 4, 2016 |
| Coyote Station | Coyote Creek Mining Company, L.L.C. | North Dakota lignite | December 31, 2040 |
| Hoot Lake Plant | Cloud Peak Energy Resources LLC | Montana subbituminous | December 31, 2015 |
OTP has about 58% of its coal needs for Big Stone under contract through December 2016.
The contract with Dakota Westmoreland Corporation expires on May 4, 2016. In October 2012, the Coyote Station owners, including OTP, entered into a lignite sales agreement (LSA) with Coyote Creek Mining Company, L.L.C. (CCMC), a subsidiary of The North American Coal Corporation, for the purchase of coal to meet the coal supply requirements of Coyote Station for the period beginning in May 2016 and ending in December 2040. The price per ton to be paid by the Coyote Station owners under the LSA will reflect the cost of production, along with an agreed profit and capital charge. The LSA provides for the Coyote Station owners to purchase the membership interests in CCMC in the event of certain early termination events and also at the end of the term of the LSA.
OTP has about 84% of its anticipated coal needs for Hoot Lake Plant secured under contract through December 2015.
It is OTP’s practice to maintain a minimum 30-day inventory (at full output) of coal at the Big Stone Plant and a 20-day inventory at Coyote Station and Hoot Lake Plant.
Railroad transportation services to the Big Stone Plant and Hoot Lake Plant are provided under a common carrier rate by the BNSF Railway. The common carrier rate is subject to a mileage-based methodology to assess a fuel surcharge. The basis for the fuel surcharge is the U.S. average price of retail on-highway diesel fuel. No coal transportation agreement is needed for Coyote Station due to its location next to a coal mine.
The average cost of fuel consumed (including handling charges to the plant sites) per million British Thermal Units for the years 2013, 2012, and 2011 was $2.055, $2.108, and $1.922, respectively.
General Regulation
OTP is subject to regulation of rates and other matters in each of the three states in which it operates and by the federal government for certain interstate operations.
A breakdown of electric rate regulation by each jurisdiction is as follows:
| | | | 2013 | | | 2012 | |
| Rates | Regulation | | % of
Electric
Revenues | | | % of kwh
Sales | | | % of
Electric
Revenues | | | % of kwh
Sales | |
| MN Retail Sales | MN Public Utilities Commission | | | 43.8 | % | | | 42.5 | % | | | 45.2 | % | | | 43.4 | % |
| ND Retail Sales | ND Public Service Commission | | | 39.0 | | | | 36.8 | | | | 38.8 | | | | 36.4 | |
| SD Retail Sales | SD Public Utilities Commission | | | 8.2 | | | | 8.2 | | | | 8.4 | | | | 8.5 | |
| Transmission & Wholesale | Federal Energy Regulatory Commission | | | 9.0 | | | | 12.5 | | | | 7.6 | | | | 11.7 | |
| Total | | | | 100.0 | % | | | 100.0 | % | | | 100.0 | % | | | 100.0 | % |
OTP operates under approved retail electric tariffs in all three states it serves. OTP has an obligation to serve any customer requesting service within its assigned service territory. The pattern of electric usage can vary dramatically during a 24-hour period and from season to season. OTP’s tariffs are designed to recover the costs of providing electric service. To the extent that peak usage can be reduced or shifted to periods of lower usage, the cost to serve all customers is reduced. In order to shift usage from peak times, OTP has approved tariffs in all three states for residential demand control, general service time of use and time of day, real-time pricing, and controlled and interruptible service. Each of these specialized rates is designed to improve efficient use of OTP resources, while giving customers more control over their electric bill. OTP also has approved tariffs in its three service territories which allow qualifying customers to release and sell energy back to OTP when wholesale energy prices make such transactions desirable.
With a few minor exceptions, OTP’s electric retail rate schedules provide for adjustments in rates based on the cost of fuel delivered to OTP’s generating plants, as well as for adjustments based on the cost of electric energy purchased by OTP. OTP also credits certain margins from wholesale sales to the fuel and purchased power adjustment. The adjustments for fuel and purchased power costs are presently based on a two month moving average in Minnesota and by the Federal Energy Regulatory Commission (FERC), a three month moving average in South Dakota and a four month moving average in North Dakota. These adjustments are applied to the next billing period after becoming applicable. These adjustments also include an over or under recovery mechanism, which is calculated on an annual basis in Minnesota and on a monthly basis in North Dakota and South Dakota.
The following summarizes the material regulations of each jurisdiction applicable to OTP’s electric operations, as well as any specific electric rate proceedings during the last three years with the Minnesota Public Utilities Commission (MPUC), the North Dakota Public Service Commission (NDPSC), the South Dakota Public Utilities Commission (SDPUC) and the FERC. The Company’s manufacturing and infrastructure businesses are not subject to direct regulation by any of these agencies.
Minnesota
Under the Minnesota Public Utilities Act, OTP is subject to the jurisdiction of the MPUC with respect to rates, issuance of securities, depreciation rates, public utility services, construction of major utility facilities, establishment of exclusive assigned service areas, contracts and arrangements with subsidiaries and other affiliated interests, and other matters. The MPUC has the authority to assess the need for large energy facilities and to issue or deny certificates of need, after public hearings, within one year of an application to construct such a facility.
Pursuant to the Minnesota Power Plant Siting Act, the MPUC has authority to select or designate sites in Minnesota for new electric power generating plants (50,000 kW or more) and routes for transmission lines (100 kilovolt (kV) or more) in an orderly manner compatible with environmental preservation and the efficient use of resources, and to certify such sites and routes as to environmental compatibility after an environmental impact study has been conducted by the Minnesota Department of Commerce (MNDOC) and the Office of Administrative Hearings has conducted contested case hearings.
The Minnesota Division of Energy Resources, part of the MNDOC, is responsible for investigating all matters subject to the jurisdiction of the MNDOC or the MPUC, and for the enforcement of MPUC orders. Among other things, the MNDOC is authorized to collect and analyze data on energy including the consumption of energy, develop recommendations as to energy policies for the governor and the legislature of Minnesota and evaluate policies governing the establishment of rates and prices for energy as related to energy conservation. The MNDOC also has the power, in the event of energy shortage or for a long-term basis, to prepare and adopt regulations to conserve and allocate energy.
2010 General Rate Case—OTP filed a general rate case on April 2, 2010 requesting an 8.01% base rate increase as well as a 3.8% interim rate increase. On May 27, 2010, the MPUC issued an order accepting the filing, suspending rates, and approving the interim rate increase, as requested, to be effective with customer usage on and after June 1, 2010. The MPUC held a hearing to decide on the issues in the rate case on March 25, 2011 and issued a written order on April 25, 2011. The MPUC authorized a revenue increase of approximately $5.0 million, or 3.76% in base rate revenues, excluding the effect of moving recovery of wind investments to base rates. The MPUC’s written order included: (1) recovery of Big Stone II costs over five years, (2) moving recovery of wind farm assets from rider recovery to base rate recovery, (3) transfer of a portion of Minnesota Conservation Improvement Program (MNCIP) costs from rider recovery to base rate recovery, (4) transfer of the investment in two transmission lines from rider recovery to base rate recovery, and (5) changing the mechanism for providing customers with a credit for margins earned on asset-based wholesale sales of electricity from a credit to base rates to a credit to the Minnesota Fuel Clause Adjustment. Final rates went into effect October 1, 2011. The overall increase to customers was approximately 1.6% compared to the authorized interim rate increase of 3.8%, which resulted in an interim rate refund to Minnesota retail electric customers of approximately $3.9 million in the fourth quarter of 2011. Pursuant to the order, OTP’s allowed rate of return on rate base increased from 8.33% to 8.61% and its allowed rate of return on equity increased from 10.43% to 10.74%. OTP’s authorized rates of return are based on a capital structure of 48.28% long term debt and 51.72% common equity.
Conservation Improvement Programs—Under Minnesota law, every regulated public utility that furnishes electric service must make annual investments and expenditures in energy conservation improvements, or make a contribution to the state’s energy and conservation account, in an amount equal to at least 1.5% of its gross operating revenues from service provided in Minnesota. The Next Generation Energy Act of 2007, passed by the Minnesota legislature in May 2007, transitions from a conservation spending goal to a conservation energy savings goal.
The MNDOC may require a utility to make investments and expenditures in energy conservation improvements whenever it finds that the improvement will result in energy savings at a total cost to the utility less than the cost to the utility to produce or purchase an equivalent amount of a new supply of energy. Such MNDOC orders can be appealed to the MPUC. Investments made pursuant to such orders generally are recoverable costs in rate cases, even though ownership of the improvement may belong to the property owner rather than the utility. OTP recovers conservation related costs not included in base rates under the MNCIP through the use of an annual recovery mechanism approved by the MPUC.
On January 11, 2012 the MPUC approved the recovery of $3.5 million for 2010 MNCIP financial incentives. Beginning in January 2012, OTP’s MNCIP Conservation Cost Recovery Adjustment increased from 3.0% to 3.8% for all Minnesota retail electric customers. On March 30, 2012 OTP recognized an additional $0.4 million of incentive related to 2011 and submitted its annual 2011 financial incentive filing request for $2.6 million. In December 2012, the MPUC approved the recovery of $2.6 million in financial incentives for 2011 and also ordered a change in the MNCIP cost recovery methodology used by OTP from a percentage of a customer’s bill to an amount per kwh consumed. On January 1, 2013 OTP’s MNCIP surcharge decreased from 3.8% of the customer’s bill to $0.00142 per kwh, which equates to approximately 1.9% of a customer’s bill. OTP recognized $2.6 million of MNCIP financial incentives in 2012 and an additional $0.1 million in 2013 relating to 2012 program results. On October 10, 2013 the MPUC approved OTP’s 2012 financial incentive request for $2.7 million as well as its request for an updated surcharge rate to be implemented on November 1, 2013.
Integrated Resource Plan (IRP)—Minnesota law requires utilities to submit to the MPUC for approval a 15-year advance IRP. A resource plan is a set of resource options a utility could use to meet the service needs of its customers over a forecast period, including an explanation of the utility’s supply and demand circumstances, and the extent to which each resource option would be used to meet those service needs. The MPUC’s findings of fact and conclusions regarding resource plans shall be considered prima facie evidence, subject to rebuttal, in Certificate of Need (CON) hearings, rate reviews and other proceedings. Typically, the filings are submitted every two years.
In the MPUC order approving the 2011-2025 IRP in February 2012, OTP was required to submit a base-load diversification study specifically focused on evaluating retirement and repower options for the Hoot Lake Plant. In an order dated March 25, 2013 the MPUC approved OTP’s recommendations that Hoot Lake Plant add pollution-control equipment at a cost of approximately $10.0 million to comply with U.S. Environmental Protection Agency’s (EPA) mercury and air toxics standards by 2015 and discontinue burning coal in 2020.
On December 2, 2013 OTP filed its 2014-2028 IRP with the MPUC. Copies of the 2014-2028 IRP were provided to both the NDPSC and SDPUC. Approximately 65% of the resource options called for by the 2014-2028 IRP are comprised of existing resources and wholesale energy purchases similar to existing levels. The remaining 35% is comprised of the following components: 65% natural gas simple cycle combustion turbines and 35% conservation and demand response. Capacity additions proposed in the 2014-2028 IRP are as follows:
| |
| Resource | Proposed Megawatts |
| Natural gas | 194 |
| Demand Response/Conservation | 106 |
OTP expects a MPUC order on its 2014-2028 IRP filing during the second quarter of 2014.
Renewable Energy Standards, Conservation, Renewable Resource Riders—Minnesota law favors conservation over the addition of new resources. In addition, Minnesota law requires the use of renewable resources where new supplies are needed, unless the utility proves that a renewable energy facility is not in the public interest. An existing environmental externality law requires the MPUC, to the extent practicable, to quantify the environmental costs associated with each method of electricity generation, and to use such monetized values in evaluating generation resources. The MPUC must disallow any nonrenewable rate base additions (whether within or outside of the state) or any related rate recovery, and may not approve any nonrenewable energy facility in an integrated resource plan, unless the utility proves that a renewable energy facility is not in the public interest. The state has prioritized the acceptability of new generation with wind and solar ranked first and coal and nuclear ranked fifth, the lowest ranking. The MPUC’s current estimate of the range of costs of future CO2 regulation to be used in modeling analyses for resource plans is $9 to $34/ton of CO2 commencing in 2017. The MPUC is required to annually update these estimates.
Minnesota has a renewable energy standard which requires OTP to generate or procure sufficient renewable generation such that the following percentages of total retail electric sales to Minnesota customers come from qualifying renewable sources: 17% by 2016; 20% by 2020 and 25% by 2025. In addition, a new standard established by the 2013 legislature requires 1.5% of total electric sales to be supplied by solar energy by the year 2020. OTP is currently evaluating the new legislation and potential options for meeting that standard. Under certain circumstances and after consideration of costs and reliability issues, the MPUC may modify or delay implementation of the standards. OTP has acquired renewable resources and expects to acquire additional renewable resources in order to maintain compliance with the Minnesota renewable energy standard. OTP’s compliance with the Minnesota renewable energy standard will be measured through the Midwest Renewable Energy Tracking System.
Under the Next Generation Energy Act of 2007, an automatic adjustment mechanism was established to allow Minnesota electric utilities to recover investments and costs incurred to satisfy the requirements of the renewable energy standard. The MPUC is authorized to approve a rate schedule rider to enable utilities to recover the costs of qualifying renewable energy projects that supply renewable energy to Minnesota customers. Cost recovery for qualifying renewable energy projects can be authorized outside of a rate case proceeding, provided that such renewable projects have received previous MPUC approval. Renewable resource costs eligible for recovery may include return on investment, depreciation, operation and maintenance costs, taxes, renewable energy delivery costs and other related expenses.
The costs for three major wind farms previously approved by the MPUC for recovery through OTP’s Minnesota Renewable Resource Adjustment (MNRRA) were moved to base rates as of October 1, 2011 under the MPUC’s April 25, 2011 general rate case order with the exception of the remaining balance of the MNRRA regulatory asset. A request for an updated rate to be effective October 1, 2012 was initially filed on June 28, 2012, followed by a revised filing on July 25, 2012. Because the request to extend the period of the new rate for 18 months was still under review, a supplemental filing was submitted on February 15, 2013, requesting that the current rate be retained until a majority of the remaining costs were recovered and that the MNRRA rate be set to zero effective May 1, 2013. The MPUC approved the February 15, 2013 request on April 4, 2013 and authorized that any unrecovered balance be retained as a regulatory asset to be recovered in OTP’s next general rate case. Effective May 1, 2013 the resource adjustment on OTP’s Minnesota customers’ bills no longer includes MNRRA costs.
Transmission Cost Recovery (TCR) Rider—In addition to the MNRRA rider, the Minnesota Public Utilities Act provides a similar mechanism for automatic adjustment outside of a general rate proceeding to recover the costs of new transmission facilities that have been previously approved by the MPUC in a CON proceeding, certified by the MPUC as a Minnesota priority transmission project, made to transmit the electricity generated from renewable generation sources ultimately used to provide service to the utility’s retail customers, or exempt from the requirement to obtain a Minnesota CON. The MPUC may also authorize cost recovery via such TCR riders for charges incurred by a utility under a federally approved tariff that accrue from other transmission owners’ regionally planned transmission projects that have been determined by the MISO to benefit the utility or integrated transmission system. The 2013 legislature passed legislation that also authorizes TCR riders to recover the costs of new transmission facilities approved by the regulatory commission of the state in which the new transmission facilities are to be constructed to the extent approval is required by the laws of that state and determined by the MISO to benefit the utility or integrated transmission system. Such TCR riders allow a return on investment at the level approved in a utility’s last general rate case. Additionally, following approval of the rate schedule, the MPUC may approve annual rate adjustments filed pursuant to the rate schedule. OTP’s initial request for approval of a TCR rider was granted by the MPUC on January 7, 2010, and became effective February 1, 2010.
OTP requested recovery of its transmission investments being recovered through its Minnesota TCR rider rate as part of its general rate case filed on April 2, 2010. In its April 25, 2011 general rate case order, the MPUC approved the transfer of transmission costs then being recovered through OTP’s Minnesota TCR rider to recovery in base rates. Final rates went into effect on October 1, 2011. OTP continues to utilize the TCR rider cost recovery mechanism to recover the remaining balance of current transmission projects and to recover costs associated with new transmission projects determined eligible for TCR rider recovery by the MPUC.
OTP filed a request for an update to its Minnesota TCR rider on October 5, 2010. In this TCR rider update, the MPUC addressed how to handle utility investments in transmission facilities that qualify for regional cost allocation under the MISO Open Access Transmission, Energy and Operating Reserve Markets Tariff (MISO Tariff). MISO regional cost allocation allows OTP to recover some of the costs of its transmission investment from the other MISO utilities. On March 26, 2012 the MPUC approved the update to OTP’s Minnesota TCR rider along with an all-in method for MISO regional cost allocations in which OTP’s retail customers would be responsible for the entire investment OTP made with an offsetting credit for revenues received from other MISO utilities under the MISO Tariff for projects included in the TCR. OTP’s updated Minnesota TCR rider went into effect April 1, 2012.
On May 24, 2012 OTP filed a petition with the MPUC to seek a determination of eligibility for the inclusion of twelve additional transmission related projects in subsequent Minnesota TCR rider filings. On February 20, 2013 the MPUC approved three of the additional projects as eligible for recovery through the TCR rider. OTP filed its annual update to the TCR rider on February 7, 2013 to include the three new projects as well as updated costs associated with existing projects. On January 30, 2014 the MPUC approved OTP’s 2013 TCR rider update but disallowed TCR rider recovery of capitalized internal labor costs and costs in excess of CON estimates. These costs will be removed from OTP’s Minnesota TCR rider effective as of the date of the MPUC’s order. OTP will be allowed to seek recovery of these costs in a future rate case.
Big Stone Air Quality Control System (AQCS)—Minnesota law authorizes a public utility to petition the MPUC for an Advance Determination of Prudence (ADP) for a project undertaken to comply with federal or state air quality standards of states in which the utility’s electric generation facilities are located if the project has an expected jurisdictional cost to Minnesota ratepayers of at least $10 million. On January 14, 2011 OTP filed a petition asking the MPUC for ADP for costs associated with the design, construction and operation of the Best-Available Retrofit Technology (BART) compliant air quality control system at Big Stone Plant attributable to serving OTP’s Minnesota customers. The MPUC granted OTP’s petition for ADP for the AQCS in a written order issued on January 23, 2012. OTP’s share of the costs for the Big Stone Plant AQCS is expected to be $218 million.
On May 24, 2013 legislation was enacted in Minnesota which allowed OTP to file for an emission-reduction rider for recovery of the revenue requirements of the AQCS. The legislation authorizes the rider to allow a current return on investment (including Construction Work in Progress (CWIP)) at the level approved in OTP’s most recent general rate case, unless a different return is determined by the MPUC to be in the public interest. On July 31, 2013 OTP filed for a Minnesota Environmental Cost Recovery (ECR) rider with the MPUC for recovery of its Minnesota jurisdictional share of the revenue requirements of its investment in the AQCS under construction at Big Stone Plant. The ECR rider recoverable revenue requirements include a current return on the project’s CWIP balance. The MPUC granted approval of OTP’s Minnesota ECR rider on December 18, 2013 with an effective date of January 1, 2014. The rate will be updated in an annual filing with the MPUC until the costs are rolled into base rates at an undetermined future date.
Big Stone II Project—OTP and a coalition of six other electric providers filed an application for a CON for the Minnesota portion of the Big Stone II transmission line project on October 3, 2005 and filed an application for a Route Permit for the Minnesota portion of the Big Stone II transmission line project with the MPUC on December 9, 2005. On January 15, 2009 the MPUC approved a motion to grant the CON and Route Permit for the Minnesota portion of the Big Stone II transmission line project.
The MPUC granted the CON subject to a number of additional conditions, including but not limited to: (1) fulfilling various requirements relating to renewable energy goals, energy efficiency, community-based energy development projects and emissions reduction; (2) that the generation plant be built as a “carbon capture retrofit ready” facility; (3) that the applicants report to the MPUC on the feasibility of building the plant using ultra-supercritical technology; and (4) that the applicants achieve specific limits on construction costs at $3,000/kW and CO2 costs at $26/ton.
The CON and Route Permit, required by state law, would have allowed the Big Stone II utilities to construct and upgrade 112 miles of electric transmission lines in western Minnesota for delivery of power from the Big Stone site and from numerous other planned generation projects, most of which are wind energy.
Following OTP’s September 11, 2009 withdrawal from the Big Stone II project and the remaining Big Stone II participants’ November 2, 2009 cancellation of the project, the suitability of the route permits and easements obtained by OTP as a MISO transmission owner for other interconnection customers backfilling through the MISO interconnection process into the Big Stone area continued to be evaluated. OTP requested recovery of the Minnesota portion of its Big Stone II development costs over a five-year period as part of its general rate case filed in Minnesota on April 2, 2010. In a written order issued on April 25, 2011, the MPUC authorized recovery of the Minnesota portion of Big Stone II generation development costs from Minnesota ratepayers over a 60-month recovery period which began on October 1, 2011. The amount of Big Stone II generation costs incurred by OTP that were deemed recoverable from Minnesota ratepayers as part of rates established in that proceeding was $3.2 million (which excluded $3.2 million of transmission-related project costs).
Approximately $0.4 million of the total Minnesota jurisdictional share of Big Stone II transmission costs were transferred to the Big Stone South - Brookings Multi-Value Project (MVP) in the first quarter of 2013. The remaining costs, along with accumulated AFUDC, were transferred from CWIP to the Big Stone II Unrecovered Project Costs – Minnesota regulatory asset account in May 2013, based on recovery granted in the April 25, 2011 order. The recoverable amount of approximately $3.5 million is expected to be recovered over an anticipated 89-month recovery period which began in May 2013.
Capacity Expansion 2020 (CapX2020)—CapX2020 is a joint initiative of eleven investor-owned, cooperative, and municipal utilities in Minnesota and the surrounding region to upgrade and expand the electric transmission grid to ensure continued reliable and affordable service. The CapX2020 companies identified four major transmission projects for the region: (1) the Fargo–Monticello 345 kV Project (the Fargo Project), (2) the Brookings–Southeast Twin Cities 345 kV Project (the Brookings Project), (3) the Bemidji – Grand Rapids 230 kV Project (the Bemidji Project), and (4) the Twin Cities–LaCrosse 345 kV Project. OTP is an investor in the Fargo Project, the Brookings Project and the Bemidji Project. Recovery of OTP’s CapX2020 transmission investments will be through the MISO Tariff (the Brookings Project as an MVP) and Minnesota, North Dakota and South Dakota TCR Riders.
The Fargo Project—All major permits have been received from state regulatory bodies and project agreements have been signed for the construction of the Fargo Project. The Monticello to St. Cloud portion of the Fargo Project was placed into service on December 21, 2011. Construction is underway for the remaining portions of the project with completion scheduled for second quarter 2015. OTP’s share of the costs for the St. Cloud to Fargo portion of the Fargo Project is expected to be $84.4 million.
The Brookings Project—All major permits have been received from state regulatory bodies and project agreements have been signed for the construction of the Brookings Project. The MISO granted unconditional approval of the Brookings Project as an MVP under the MISO Tariff in December 2011. This project is anticipated to be completed in the first quarter of 2015. OTP’s share of the costs for the Brookings Project is expected to be $26.5 million.
The Bemidji Project—The Bemidji-Grand Rapids transmission line was fully energized and put in service on September 17, 2012.
Capital Structure Petition—Minnesota law requires an annual filing of a capital structure petition with the MPUC. In this filing the MPUC reviews and approves the capital structure for OTP. Once the petition is approved, OTP may issue securities without further petition or approval, provided the issuance is consistent with the purposes and amounts set forth in the approved capital structure petition. The MPUC approved OTP’s capital structure petition on June 20, 2013, which is in effect until the MPUC issues a new capital structure order for 2014. OTP is required to file its 2014 capital structure petition by May 2014.
North Dakota
OTP is subject to the jurisdiction of the NDPSC with respect to rates, services, certain issuances of securities, construction of major utility facilities and other matters. The NDPSC periodically performs audits of gas and electric utilities over which it has rate setting jurisdiction to determine the reasonableness of overall rate levels. In the past, these audits have occasionally resulted in settlement agreements adjusting rate levels for OTP.
The North Dakota Energy Conversion and Transmission Facility Siting Act grants the NDPSC the authority to approve sites in North Dakota for large electric generating facilities and high voltage transmission lines. This Act is similar to the Minnesota Power Plant Siting Act described above and applies to proposed wind energy electric power generating plants exceeding 500 kW of electricity, non-wind energy electric power generating plants exceeding 50,000 kW and transmission lines with a design in excess of 115 kV. OTP is required to submit a ten-year plan to the NDPSC annually.
The NDPSC reserves the right to review the issuance of stocks, bonds, notes and other evidence of indebtedness of a public utility. However, the issuance by a public utility of securities registered with the SEC is expressly exempted from review by the NDPSC under North Dakota state law.
General Rates—OTP’s most recent general rate increase in North Dakota of $3.6 million, or approximately 3.0%, was granted by the NDPSC in an order issued on November 25, 2009 and effective December 2009.
Renewable Resource Adjustment—OTP has a North Dakota Renewable Resource Adjustment (NDRRA) which enables OTP to recover the North Dakota share of its investments in renewable energy facilities it owns in North Dakota. This rider allows OTP to recover costs associated with new renewable energy projects as they are completed. OTP’s 2010 NDRRA was in place from September 1, 2010 through March 31, 2012 with a recovery of $15.6 million. On March 21, 2012 the NDPSC approved an update to OTP’s NDRRA effective April 1, 2012. The updated NDRRA recovered $9.9 million over the period April 1, 2012 through March 31, 2013. On December 28, 2012 OTP submitted its annual update to the NDRRA with a proposed effective date of April 1, 2013. The update resulted in a rate reduction, so the NDPSC did not issue an order suspending the rate change. Consequently, pursuant to statute, OTP was allowed to implement updated rates effective April 1, 2013 and, on July 10, 2013, the NDPSC approved the rate implemented on April 1, 2013. OTP submitted its annual update to the NDRRA on December 31, 2013 with a proposed April 1, 2014 effective date.
Transmission Cost Recovery Rider— North Dakota law provides a mechanism for automatic adjustment outside of a general rate proceeding to recover jurisdictional capital and operating costs incurred by a public utility for new or modified electric transmission facilities. On April 29, 2011 OTP filed a request for an initial North Dakota TCR rider with the NDPSC, which was approved on April 25, 2012 and effective May 1, 2012. On August 31, 2012 OTP filed its annual update to the North Dakota TCR rider rate to reflect updated cost information associated with projects currently in the rider, as well as proposing to include costs associated with ten additional projects for recovery within the rider. The NDPSC approved the annual update on December 12, 2012 with an effective date of January 1, 2013. On August 30, 2013 OTP filed its annual update to its North Dakota TCR rider rate, which was approved on December 30, 2013 and became effective January 1, 2014.
Environmental Cost Recovery Rider—On May 9, 2012 the NDPSC approved OTP’s application for an ADP related to the Big Stone Plant AQCS. On February 8, 2013, OTP filed a request with the NDPSC for an ECR rider to recover OTP’s North Dakota jurisdictional share of carrying costs associated with its investment in the Big Stone Plant AQCS. On December 18, 2013 the NDPSC approved OTP’s North Dakota ECR rider based on revenue requirements through the 2013 calendar year and thereafter, with rates effective for bills rendered on and after January 1, 2014. OTP recorded a regulatory asset of $2.3 million for amounts eligible for recovery through the North Dakota ECR rider that had not been billed to North Dakota customers as of December 31, 2013. The rate will be updated at least annually in a filing with the NDPSC until the project costs are rolled into base rates at an undetermined future date.
Big Stone II Project—On August 27, 2008, the NDPSC determined that OTP’s participation in Big Stone II was prudent in a range of 121.8 to 130 MW. On January 20, 2010, OTP filed a request with the NDPSC for a determination that continuing with the Big Stone II project would not have been prudent.
In an order issued June 25, 2010, the NDPSC authorized recovery of Big Stone II development costs from North Dakota ratepayers, pursuant to a final settlement agreement filed June 23, 2010, between the NDPSC advocacy staff, OTP and the North Dakota Large Industrial Energy Group, as interveners. The terms of the settlement agreement indicate that OTP’s discontinuation of participation in the project was prudent and OTP should be authorized to recover the portion of costs it incurred related to the Big Stone II generation project. The total amount of Big Stone II generation costs incurred by OTP (which excluded $2.6 million of project transmission-related costs) was determined to be $10.1 million, of which $4.1 million represents North Dakota’s jurisdictional share. The North Dakota portion of Big Stone II generation costs is being recovered over a 36-month period which began on August 1, 2010.
The North Dakota jurisdictional share of Big Stone II costs incurred by OTP related to transmission was $1.1 million. Approximately $0.3 million of the total North Dakota jurisdictional share of Big Stone II transmission costs were transferred to the Big Stone South - Brookings MVP during the first quarter of 2013. On July 30, 2013 the NDPSC approved OTP’s request to continue the Big Stone II cost recovery rates for an additional eight months through March 31, 2014 to recover the remaining North Dakota share of Big Stone II transmission-related costs plus accrued AFUDC totaling $1.0 million.
CapX2020 Request for Advance Determination of Prudence—On October 5, 2009 OTP filed an application for an ADP with the NDPSC for its proposed participation in three of the four Group 1 projects: the Fargo Project, the Brookings Project and the Bemidji Project. An administrative law judge conducted an evidentiary hearing on the application in May 2010. On October 6, 2010 the NDPSC adopted an order approving a settlement between OTP and intervener NDPSC advocacy staff, and issued an ADP to OTP for participation in the three Group 1 projects. The order is subject to a number of terms and conditions in addition to the settlement agreement, including the provision of additional information on the eventual resolution of cost allocation issues relevant to the Brookings Project and its associated impact on North Dakota. On April 29, 2011, OTP filed its compliance filing with the NDPSC, seeking a determination of continued prudence for OTP’s investment in the Brookings Project. The NDPSC approved the request for an ADP for the Brookings Project on November 10, 2011 conditioned on the MISO MVP cost allocation remaining materially unchanged. The MISO granted unconditional approval of the Brookings Project as an MVP under the MISO Tariff in December 2011.
CapX2020 - Fargo Project—All major permits have been received from state regulatory bodies and project agreements have been signed for the construction of the Fargo Project.
South Dakota
Under the South Dakota Public Utilities Act, OTP is subject to the jurisdiction of the SDPUC with respect to rates, public utility services, construction of major utility facilities, establishment of assigned service areas and other matters. Under the South Dakota Energy Facility Permit Act, the SDPUC has the authority to approve sites in South Dakota for large energy conversion facilities (100,000 kW or more) and transmission lines with a design of 115 kV or more.
2010 General Rate Case—On April 21, 2011, the SDPUC issued a written order approving an overall revenue increase for OTP of approximately $643,000 (2.32%) and an overall rate of return on rate base of 8.50%. Final rates were effective with bills rendered on and after June 1, 2011.
Transmission Cost Recovery Rider— South Dakota law provides a mechanism for automatic adjustment outside of a general rate proceeding to recover jurisdictional capital and operating costs incurred by a public utility for new or modified electric transmission facilities. OTP submitted a request for an initial South Dakota TCR rider to the SDPUC on November 5, 2010. The South Dakota TCR was approved by the SDPUC and implemented on December 1, 2011. On September 4, 2012 OTP filed its annual update to the South Dakota TCR rider. Updated rates, approved on April 23, 2013, went into effect on May 1, 2013. OTP filed its annual update to the South Dakota TCR rider on August 30, 2013 with a supplemental filing in February 2014 with a proposed implementation date of March 1, 2014.
Big Stone II Project— OTP requested recovery of the South Dakota portion of its Big Stone II development costs over a five-year period as part of its general rate case filed in South Dakota on August 20, 2010. In the first quarter of 2011, the SDPUC approved recovery of the South Dakota portion of Big Stone II generation development costs totaling approximately $1.0 million from South Dakota ratepayers over a ten-year period beginning in February 2011 with the implementation of interim rates. OTP is allowed to earn a return on the amount subject to recovery over the ten-year recovery period. OTP transferred the South Dakota portion of the remaining Big Stone II transmission costs to CWIP, with such costs subject to AFUDC and recovery in future FERC-approved MISO rates or retail rates. On July 31, 2012 the SDPUC approved the transfer of the Big Stone II transmission route permits to OTP.
A portion of the Big Stone II transmission costs were transferred out of CWIP in February 2013 to be included within the Big Stone South - Brookings MVP. On March 28, 2013, OTP filed a petition with the SDPUC requesting deferred accounting for the remaining unrecovered Big Stone II Transmission costs until OTP’s next South Dakota general rate case. The petition was approved by the SDPUC on April 23, 2013 and in May 2013 OTP transferred the remaining South Dakota jurisdictional portion of unrecovered Big Stone II transmission costs plus accumulated AFUDC totaling $0.2 million from CWIP to the Big Stone II Unrecovered Project Costs – South Dakota long-term regulatory asset account.
Big Stone Plant AQCS—On March 30, 2012 OTP requested approval from the SDPUC for an ECR Rider to recover costs associated with the Big Stone Plant AQCS. On April 17, 2013 OTP filed a request to either suspend or withdraw this filing. The SDPUC approved withdrawing this filing on April 23, 2013. Instead of receiving rider recovery on the portion of AQCS construction costs assignable to OTP’s South Dakota customers while the project is under construction, OTP will accrue an AFUDC on these costs and request recovery of, and a return on, the accumulated costs, including AFUDC, in a future rate filing in South Dakota.
CapX2020 Brookings–Southeast Twin Cities 345 kV Project—All major permits have been received from state regulatory bodies and project agreements have been signed for the construction of this project. The MISO granted unconditional approval of the Brookings Project as an MVP under the MISO Tariff in December 2011. This project is anticipated to be completed in the first quarter of 2015.
Energy Efficiency Plan (EEP)—The SDPUC has encouraged all investor-owned utilities in South Dakota to be part of an Energy Efficiency Partnership to significantly reduce energy use. The plan is being implemented with program costs, carrying costs and a financial incentive being recovered through an approved rider.
On June 16, 2010 OTP filed a request with the SDPUC for approval of updates to OTP’s 2010 South Dakota EEP and approval for the continuation of the program in 2011. OTP requested increases in energy and demand savings goals and increases in related financial incentives for both 2010 and the requested 2011 program. In an order issued on July 27, 2010 the SDPUC approved OTP’s request for updated energy, demand and participation goals for continuation of the EEP into 2011. OTP is operating under its 2010 South Dakota EEP, as updated.
On May 25, 2011 OTP filed a request with the SDPUC for approval of updates to its EEP. The SDPUC approved the 2012-2013 updated EEP with a maximum available incentive payment limited to 30% of the budget amount provided in the EEP, or $84,000. On June 19, 2012, the SDPUC approved OTP’s request for a 2011 financial incentive of $78,900 along with an increased surcharge adjustment that became effective on July 1, 2012. On June 18, 2013 the SDPUC approved OTP’s request for a 2012 financial incentive of $84,000 along with an increased surcharge adjustment that became effective July 1, 2013. On November 5, 2013, the SDPUC approved OTP’s EEP updates for 2014-2015. On December 3, 2013, the SDPUC voted to amend the approval previously given and require OTP to come before the Commission if the overall plan budget would exceed 10%, rather than the previously approved 30%.
FERC
Wholesale power sales and transmission rates are subject to the jurisdiction of the FERC under the Federal Power Act of 1935, as amended. The FERC is an independent agency with jurisdiction over rates for wholesale electricity sales, transmission and sale of electric energy in interstate commerce, interconnection of facilities, and accounting policies and practices. Filed rates are effective after a one day suspension period, subject to ultimate approval by the FERC.
Effective January 1, 2010 the FERC authorized OTP’s implementation of a forward looking formula transmission rate under the MISO Tariff. OTP was also authorized by the FERC to recover in its formula rate (1) 100% of prudently incurred CWIP in rate base and (2) 100% of prudently incurred costs of transmission facilities that are cancelled or abandoned for reasons beyond OTP’s control (Abandoned Plant Recovery), as determined by the FERC subsequent to abandonment, specifically for three regional transmission CapX2020 projects in which OTP is investing: the Fargo Project, the Bemidji Project and the Brookings Project.
On December 16, 2010 the FERC approved the cost allocation for a new classification of projects in MISO called MVPs. MVPs are designed to enable the region to comply with energy policy mandates and to address reliability and economic issues affecting multiple transmission zones within the MISO region. The cost allocation is designed to ensure that the costs of transmission projects with regional benefits are properly assigned to those who benefit. On October 20, 2011 the FERC reaffirmed the MVP cost allocation on rehearing. On June 7, 2013, in response to a challenge to the MVP cost allocation heard before the United States Court of Appeals, Seventh Circuit, the Court ruled in favor of MISO and MISO transmission owners, issuing an order affirming the FERC’s approval of the MVP cost allocation. On October 7, 2013 certain parties submitted a petition for writ of certiorari to the U.S. Supreme Court seeking review of the Seventh Circuit decision. As of February 14, 2014 the U.S. Supreme Court had not acted on the petition.
On November 12, 2013, a group of industrial customers and other stakeholders filed a complaint at the FERC seeking to reduce the return on equity component of the transmission rates that MISO transmission owners, including OTP, may collect under the MISO Tariff. The complainants are seeking to reduce the current 12.38% return on equity used in MISO’s transmission rates to a proposed 9.15%. MISO and a group of MISO transmission owners have filed responses to the complaint seeking its dismissal and defending the current return on equity. The complaint is pending at the FERC.
Effective on January 1, 2012 the FERC authorized OTP to recover 100% CWIP and Abandoned Plant Recovery on two projects approved by MISO as MVPs in MISO’s 2011 Transmission Expansion Plan: the Big Stone South–Brookings MVP and the Big Stone South-Ellendale MVP.
The Big Stone South – Brookings Project—This planned 345 kV transmission line will extend 70 miles between a proposed substation near Big Stone City, South Dakota and the new Brookings County Substation near Brookings, South Dakota. OTP is jointly developing this project with Xcel Energy. MISO approved this project as an MVP under the MISO Tariff in December 2011. A Notice of Intent to Construct Facilities (NICF) was filed with the SDPUC on February 29, 2012. A portion of this line is anticipated to use previously obtained Big Stone II transmission route permits and easements and is expected to be in service in 2017. On July 31, 2012 the SDPUC approved the transfer of the Big Stone II transmission route permits to OTP. In December 2012, a request was filed with the SDPUC for recertification of a portion of the line route that was approved as part of the Big Stone II transmission development. The SDPUC approved the certification for the northern portion of the route on April 9, 2013. OTP and Xcel Energy jointly submitted an application to the SDPUC for a route permit for the southern portion of the Big Stone South to Brookings line on June 3, 2013. A decision on the permit application for the southern half of this route is expected in the first quarter of 2014. If the proposed project receives all the necessary approvals, OTP anticipates the line will be completed in 2017. OTP’s total capital investment in this project is expected to be approximately $109 million.
The Big Stone South – Ellendale Project—This transmission line is a proposed 345 kV line that will extend 160 to 170 miles between a proposed substation near Big Stone City, South Dakota and a proposed substation near Ellendale, North Dakota. OTP is jointly developing this project with Montana-Dakota Utilities Co., a Division of MDU Resources Group, Inc. (MDU). MISO approved this project as an MVP under the MISO Tariff in December 2011. OTP and MDU jointly filed an NICF with the SDPUC in March of 2012. On August 25, 2013 the NDPSC granted Certificates of Public Convenience and Necessity to OTP and MDU for the ten miles of the proposed line to be built in North Dakota. A joint route permit application was filed by OTP and MDU on August 23, 2013 with the SDPUC. OTP and MDU jointly filed an Application for a Certificate of Corridor Compatibility along with an application for a route permit with the NDPSC on October 18, 2013. If the proposed project receives all the necessary approvals, OTP anticipates the line will be completed in 2019. OTP’s total capital investment in this project is expected to be approximately $184 million.
CapX2020 Brookings Project—In June 2011 the MISO board of directors granted conditional approval of the MVP cost allocation designation under the MISO Tariff for the Brookings Project, and the project was granted unconditional approval in December 2011 as an MVP. This project is anticipated to be completed in the first quarter of 2015.
NAEMA
OTP is a member of the North American Energy Marketers Association (NAEMA) which is an independent, non-profit trade association representing entities involved in the marketing of energy or in providing services to the energy industry. NAEMA has over 130 members with operations in 48 states and Canada. NAEMA was formed as a successor organization of the Power and Energy Market (PEM) of the Mid-Continent Area Power Pool (MAPP) in recognition that PEM had outgrown the MAPP region. Power pool sales are conducted continuously through NAEMA in accordance with schedules filed by NAEMA with the FERC.
MRO
OTP is a member of the Midwest Reliability Organization (MRO). The MRO is a non-profit organization dedicated to ensuring the reliability and security of the bulk power system in the north central region of North America, including parts of both the United States and shippedCanada. MRO began operations in 2005 and is one of eight regional entities in North America operating under authority from regulators in the United States and Canada through a delegation agreement with the North American Electric Reliability Corporation. The MRO is responsible for: (1) developing and implementing reliability standards, (2) enforcing compliance with those standards, (3) providing seasonal and long-term assessments of the bulk power system’s ability to meet demand for electricity, and (4) providing an appeals and dispute resolution process.
The MRO region covers roughly one million square miles spanning the provinces of Saskatchewan and Manitoba, the states of North Dakota, Minnesota, Nebraska and the majority of the territory in the states of South Dakota, Iowa and Wisconsin. The region includes more than 100 organizations that are involved in the production and delivery of power to more than 20 million people. These organizations include municipal utilities, cooperatives, investor-owned utilities, a federal power marketing agency, Canadian Crown Corporations, independent power producers and others who have interests in the reliability of the bulk power system. MRO assumed the reliability functions of the MAPP and Mid-America Interconnected Network, both former voluntary regional reliability councils.
MISO
OTP is a member of the MISO. As the transmission provider and security coordinator for the region, the MISO seeks to optimize the efficiency of the interconnected system, provide regional solutions to regional planning needs and minimize risk to reliability through its security coordination, long-term regional planning, market monitoring, scheduling and tariff administration functions. The MISO covers a broad region containing all or parts of 15 states and the Canadian province of Manitoba. The MISO has operational control of OTP’s transmission facilities above 100 kV, but OTP continues to own and maintain its transmission assets.
The MISO Energy Markets commenced operation on April 1, 2005. Through its Energy Markets, MISO seeks to develop options for energy supply, increase utilization of transmission assets, optimize the use of energy resources across a wider region and provide greater visibility of data. MISO aims to facilitate a more cost-effective and efficient use of the wholesale bulk electric system.
The MISO Ancillary Services Market (ASM) commenced on January 6, 2009. The ASM facilitates the provision of Regulation, Spinning Reserve and Supplemental Reserves. The ASM integrates the procurement and use of regulation and contingency reserves with the existing Energy Market. OTP has actively participated in the market since its commencement.
Other
OTP is subject to various federal laws, including the Public Utility Regulatory Policies Act and the Energy Policy Act of 1992 (which are intended to promote the conservation of energy and the development and use of alternative energy sources) and the Energy Policy Act of 2005.
Competition, Deregulation and Legislation
Electric sales are subject to competition in some areas from municipally owned systems, rural electric cooperatives and, in certain respects, from on-site generators and cogenerators. Electricity also competes with other forms of energy. The degree of competition may vary from time to time depending on relative costs and supplies of other forms of energy.
The Company believes OTP is well positioned to be successful in a competitive environment. A comparison of OTP’s electric retail rates to the rates of other investor-owned utilities, cooperatives and municipals in the states OTP serves indicates OTP’s rates are competitive.
Legislative and regulatory activity could affect operations in the future. OTP cannot predict the timing or substance of any future legislation or regulation. The Company does not expect retail competition to come to the states of Minnesota, North Dakota or South Dakota in the foreseeable future. There has been no legislative action regarding electric retail choice in any of the states where OTP operates. The Minnesota legislature has in the past considered legislation that, if passed, would have limited the Company’s ability to maintain and grow its nonelectric businesses.
OTP is unable to predict the impact on its operations resulting from future regulatory activities, from future legislation or from future taxes that may be imposed on the source or use of energy.
Environmental Regulation
Impact of Environmental Laws —OTP’s existing generating plants are subject to stringent federal and state standards and regulations regarding, among other things, air, water and solid waste pollution. In the five years ended December 31, 2013 OTP invested approximately $103.2 million in environmental control facilities. The 2014 and 2015 construction budgets include approximately $82 million and $61 million, respectively, for environmental equipment for existing facilities.
Air Quality - Criteria Pollutants —Pursuant to the federal Clean Air Act (the CAA), the EPA has promulgated national primary and secondary standards for certain air pollutants.
The primary fuels burned by OTP’s steam generating plants are North Dakota lignite coal and western subbituminous coal. Electrostatic precipitators have been installed at the principal units at the Hoot Lake Plant. Hoot Lake Plant Unit 1, which is the smallest of the three coal-fired units at Hoot Lake Plant, was retired as of December 31, 2005. As a result, OTP believes the units at the Hoot Lake Plant currently meet all presently applicable federal and state air quality and emission standards.
The South Dakota Department of Environment and Natural Resources (DENR) issued a Title V Operating Permit to the Big Stone site on June 9, 2009 allowing for operation of Big Stone Plant. The Big Stone Plant continues to operate under Title V permit provisions. The Big Stone Plant is currently operating within all presently applicable federal and state air quality and emission standards.
The Coyote Station is equipped with sulfur dioxide (SO2) removal equipment. The removal equipment—referred to as a dry scrubber—consists of a spray dryer, followed by a fabric filter, and is designed to desulfurize hot gases from the stack. The fabric filter collects spray dryer residue along with the fly ash. The Coyote Station is currently operating within all presently applicable federal and state air quality and emission standards.
The CAA, in addressing acid deposition, imposed requirements on power plants in an effort to reduce national emissions of SO2 and nitrogen oxides (NOx).
The national SO2 emission reduction goals are achieved through a market based system under which power plants are allocated “emissions allowances” that require plants to either reduce their SO2 emissions or acquire allowances from others to achieve compliance. Each allowance is an authorization to emit one ton of SO2. SO2 emission requirements are currently being met by all of OTP’s generating facilities without the need to acquire other allowances for compliance with the acid deposition provisions of the CAA.
The national NOx emission reduction goals are achieved by imposing mandatory emissions standards on individual sources. All of OTP’s generating facilities met the NOx standards during 2013.
The EPA Administrator signed the Clean Air Interstate Rule (CAIR) on March 10, 2005. The EPA has concluded that SO2 and NOx are the chief emissions contributing to interstate transport of particulate matter less than 2.5 microns (PM2.5). The EPA also concluded that NOx emissions are the chief emissions contributing to ozone nonattainment. Twenty-three states and the District of Columbia were found to contribute to ambient air quality PM2.5 nonattainment in downwind states. On that basis, the EPA proposed to cap SO2 and NOx emissions in the designated states. Minnesota was included among the twenty-three states subject to emissions caps; North Dakota and South Dakota were not included. Twenty-five states were found to contribute to downwind 8-hour ozone nonattainment. None of the states in OTP’s service territory were slated for NOx reduction for 8-hour ozone nonattainment purposes. On July 11, 2008, the U.S. Court of Appeals for the D.C. Circuit vacated CAIR and the CAIR federal implementation plan in its entirety.
On December 23, 2008, the court reconsidered its order vacating CAIR, instead remanding the rule to the EPA to conduct further proceedings consistent with the court’s prior opinion invalidating CAIR. On January 16, 2009, the EPA proposed a rule that would stay the effectiveness of CAIR and the CAIR federal implementation plan for sources in Minnesota while the EPA conducted notice-and-comment rulemaking on remand from the D.C. Circuit’s decisions in the litigation on CAIR. Remanding the issue to the EPA for further consideration, the court held that the EPA had not adequately addressed errors alleged by Minnesota Power in the EPA’s analysis supporting inclusion of Minnesota. Neither the EPA nor any other party sought rehearing of this part of the court’s CAIR decision. Public Notice of the final rule staying the implementation of CAIR in Minnesota appeared in the November 3, 2009 Federal Register.
On July 6, 2010, the EPA proposed the Transport Rule that essentially would replace the CAIR, but which (unlike CAIR) proposed to include Minnesota sources due to a finding that Minnesota’s emissions contribute to PM2.5 nonattainment in downwind states. However, its impact on Hoot Lake Plant and OTP’s Solway combustion turbine under the initial proposal would have been less than what had been contemplated under CAIR. The EPA released the final Transport Rule, renamed as the Cross-State Air Pollution Rule (CSAPR), on July 8, 2011. The final rule made several changes as compared to the proposed rule, including a substantial change in the allowance allocation methodology. A number of states and industry representatives challenged the rule. On December 30, 2011, the U.S. Court of Appeals for the D.C. Circuit granted motions to stay CSAPR pending the court’s resolution of the petitions for review. The Court issued an order on August 21, 2012 vacating CSAPR. The order required the EPA to continue administering CAIR pending the promulgation of a valid replacement rule. The United States sought Supreme Court review of the D.C. Circuit’s decision vacating CSAPR, and the Supreme Court granted review. Briefing and oral argument took place in late 2013, and a decision on whether CSAPR will be reinstated is expected before July 2014. In the meantime, because no party sought a stay of the issuance of the mandate in the D.C. Circuit pending Supreme Court review, CSAPR remains invalidated, and regulated parties must continue to abide by CAIR pending a Supreme Court decision. Since CAIR is currently stayed for Minnesota, and does not apply to North or South Dakota, there is no impact to OTP at this time.
Air Quality – Hazardous Air Pollutants—On December 16, 2011 the EPA signed a final rule to reduce mercury and other air toxics emissions from power plants known as the Mercury and Air Toxics Standards (MATS) rule. The final rule became effective on April 16, 2012, and plants will have until April 16, 2015 to comply. However, the EPA is encouraging state permitting authorities to broadly grant a one-year compliance extension to plants that need additional time to install controls. The DENR granted Big Stone Plant a one-year compliance extension in August 2013. The EPA is also providing a pathway for reliability-critical units to obtain an additional year to achieve compliance; however, the EPA has indicated that it believes there will be few, if any situations, in which this pathway is needed. Based on OTP’s review of the final rule, it appears that OTP’s affected units will meet the requirements by installing the AQCS system at Big Stone, by upgrading the electrostatic precipitators on Hoot Lake Units 2 and 3, by installing activated carbon injection on all units, and by possibly installing dry sorbent injection at Hoot Lake Plant. Emissions monitoring equipment and/or stack testing will also be needed to verify compliance with the standards. Numerous petitions were filed in the United States Court of Appeals for the D.C. Circuit challenging the MATS rule. The matter has been fully briefed and argued, and a decision is expected in the spring of 2014. Because no stay of the rule was obtained, MATS continues to govern pending resolution of the judicial challenges to the rule.
Air Quality – EPA New Source Review Enforcement Initiative—In 1998 the EPA announced its New Source Review Enforcement Initiative targeting coal-fired utilities, petroleum refineries, pulp and paper mills and other industries for alleged violations of the EPA’s New Source Review rules. These rules require owners or operators that construct new major sources or make major modifications to existing sources to obtain permits and install air pollution control equipment at affected facilities. The EPA is attempting to determine if emission sources violated certain provisions of the CAA by making major modifications to their facilities without installing state-of-the-art pollution controls. On January 2, 2001 OTP received a request from the EPA, pursuant to Section 114(a) of the CAA, to provide certain information relative to past operation and capital construction projects at the Big Stone Plant. OTP responded to that request. In March 2003 the EPA conducted a review of the plant’s outage records as a follow-up to its January 2001 data request. A copy of the designated documents was provided to the EPA on March 21, 2003.
On January 8, 2009, OTP received another request from EPA Regions 5 and 8, pursuant to Section 114(a) of the CAA, to provide certain information relative to past operation and capital construction projects at the Big Stone Plant, Coyote Station and Hoot Lake Plant. OTP filed timely responses to the EPA’s requests on February 23, 2009 and March 31, 2009. In July 2009, EPA Region 5 issued a follow-up information request with respect to certain maintenance and repair work at the Hoot Lake Plant. OTP responded to the request. The EPA has not set forth any additional follow-up requests at this time. OTP cannot determine what, if any, actions will be taken by the EPA.
Air Quality – Regional Haze Program—The EPA promulgated the Regional Haze Rule in 1999, and on June 15, 2005 the EPA provided final guidelines for conducting BART determinations under the rule. The Regional Haze Rule requires emissions reductions from BART-eligible sources that are deemed to contribute to visibility impairment in Class I air quality areas. Big Stone Plant is BART eligible, and the South Dakota DENR determined that the plant is subject to emission reduction requirements based on the modeled contribution of the plant emissions to visibility impairment in downwind Class I air quality areas. Based on the South Dakota DENR’s BART determination and the final South Dakota Regional Haze State Implementation Plan (SIP) approved by the EPA on March 29, 2012, Big Stone must install Selective Catalytic Reduction (SCR) and separated over-fire air to reduce NOx emissions, dry flue gas desulfurization to reduce SO2 emissions, and a new baghouse for particulate matter control. Big Stone Plant must install and operate the BART compliant air quality control system as expeditiously as practicable, but not later than five years after the EPA’s final approval of May 29, 2012. The current project cost is estimated to be approximately $405 million (OTP’s share would be $218 million).
The North Dakota Regional Haze SIP requires that Coyote Station reduce its NOx emissions. On March 14, 2011 the North Dakota Department of Health (NDDOH) issued a construction permit to Coyote Station requiring installation of control equipment to limit its NOx emissions to 0.5 pounds per million Btu as calculated on a 30-day rolling average basis beginning on July 1, 2018. The current estimate of the total cost of the project is $9 million ($3.2 million for OTP’s share). On March 1, 2012 the EPA signed a final rule for partial approval of the North Dakota SIP that included the NOx emission rate permit conditions for Coyote Station as proposed by the NDDOH. The rule became effective on May 7, 2012.
In June 2012 the Sierra Club and National Parks Conservation Association (NPCA) filed an appeal of the EPA’s approval of the North Dakota Regional Haze SIP to the U.S. Court of Appeals for the Eight Circuit. On the same day Sierra Club/NPCA also separately filed a petition for reconsideration with the EPA. In the petition for reconsideration filed with the EPA, Sierra Club/NPCA did not take issue with the Coyote Station NOx emission limit. However, in the Eighth Circuit appeal, Sierra Club/NPCA filed a brief on October 5, 2012 that included a challenge to the EPA’s determinations relative to Coyote Station. The groups requested the Eighth Circuit reverse and remand the EPA’s SIP approval. An amicus brief was submitted to the Eighth Circuit on behalf of the Coyote Station on December 18, 2012. Oral arguments were held before the Eighth Circuit on May 14, 2013, and on September 23, 2013 the Eighth Circuit denied the Sierra Club/NPCA appeal with respect to Coyote Station.
Air Quality – Greenhouse Gas (GHG) Regulation—Combustion of fossil fuels for the generation of electricity is a major stationary source of CO2 emissions in the United States and globally. OTP is an owner or part-owner of three baseload, coal-fired electricity generating plants and three fuel-oil or natural gas-fired combustion turbine peaking plants with a combined net dependable capacity of 656 MW. In 2013 these plants emitted approximately 4.0 million tons of CO2.
OTP monitors and evaluates the possible adoption of national, regional, or state climate change and GHG legislation or regulations that would affect electric utilities. Congress previously considered but has not adopted GHG legislation which would require a reduction in GHG emissions, and there is no legislation under active consideration at this time. The likelihood of any federal mandatory CO2 emissions reduction program being adopted by Congress in the near future, and the specific requirements of any such program, is uncertain.
In April 2007, however, the U.S. Supreme Court issued a decision that determined that the EPA has authority to regulate CO2 and other GHGs from automobiles as “air pollutants” under the CAA. The Supreme Court directed the EPA to conduct a rulemaking to determine whether GHG emissions contribute to climate change “which may reasonably be anticipated to endanger public health or welfare.” While this case addressed a provision of the CAA related to emissions from motor vehicles, a parallel provision of the CAA applies to stationary sources such as electric generators; according to the EPA, that parallel provision would be automatically triggered once the EPA began regulating motor vehicle GHG emissions. The first step in the EPA rulemaking process was the publication of an endangerment finding in the December 15, 2009 Federal Register where the EPA found that CO2 and five other GHGs – methane, nitrous oxide, hydrofluorocarbons, perfluorocarbons and sulfur hexafluoride – threaten public health and the environment.
The EPA’s final findings respond to the 2007 U.S. Supreme Court decision that GHGs fit within the CAA’s definition of air pollutants. The findings do not in and of themselves impose any emission reduction requirements but rather allowed the EPA to finalize the GHG standards for new light-duty vehicles as part of the joint rulemaking with the Department of Transportation. These standards apply to motor vehicles as of January 2011, which makes GHGs “subject to regulation” under the CAA. This, then, triggered the Prevention of Significant Deterioration (PSD) and Title V operating permits programs for stationary sources of GHGs. The question of whether the regulation of motor vehicle emissions does in fact automatically trigger regulation of stationary sources of the same pollutant is presently under review by the Supreme Court. The case is fully briefed, and oral argument will be held on February 24, 2014. A decision is not expected until June or July 2014.
On June 6, 2010 the EPA published a final “tailoring rule” that phases in application of its PSD and Title V programs to GHG emission sources, including power plants. The PSD program applies to existing sources if there is a physical change or change in the method of operation of the facility that results in a significant net emissions increase of any pollutant. As a result, PSD does not apply on a set timeline as is the case with other regulatory programs, but is triggered depending on what activities take place at a major source. If triggered, the owner or operator of an affected facility must undergo a review which requires the identification and implementation of best-available control technology (BACT) for the regulated air pollutants for which there is a significant net emissions increase, and an analysis of the ambient air quality impacts of the facility.
As of July 2011, sources emitting more than 100,000 tons per year of “CO2e”, a measure that converts emissions of each GHG into its carbon dioxide equivalent, are considered “major sources” subject to PSD requirements if they propose to make modifications resulting in a net GHG emissions increase of 75,000 tons per year or more of CO2e. OTP does not anticipate making modifications at any of its facilities that would trigger PSD requirements. The South Dakota DENR reviewed OTP’s projected emissions, including GHG emissions, as a result of the Big Stone Plant AQCS Project and the DENR agreed that the emissions did not trigger the need for a PSD permit. Consequently, the DENR issued an Air Quality Construction Permit for the Big Stone Plant AQCS Project on January 6, 2012.
Concurrently, the EPA is developing New Source Performance Standards (NSPS) for GHGs from fossil fuel-fired electric generating units. The EPA proposed a rule on January 8, 2014 that would subject large new coal-fired units to a GHG emission limit of 1,100 lbs. of CO2 per megawatt-hour (mwh) averaged over a 12-month period, or possibly a limit of 1,000-1,050 pounds of CO2 averaged over a period of seven years. This limit is based on emission reductions the EPA believes could be achieved through the installation and operation of partial carbon capture and sequestration technology. Certain new natural gas-fired units would be subject to a limit of 1,000 or 1,100 pounds of CO2 per mwh, dependent on unit size, which is the emissions level the EPA believes natural gas combined cycle units can currently achieve with no additional add-ons. Unlike traditional NSPS rules, the proposed GHG NSPS would not apply to modifications at existing units. Under Section 111(b) of the CAA, the EPA must finalize the standard within a year of its proposal, or by January 8, 2015. However, it is expected the EPA will issue a final rule in the second half of 2014. If finalized, the NSPS would apply to any unit the construction of which commences after the date of the proposal, or January 8, 2014.
The EPA also intends to develop GHG performance standards for existing sources under CAA Section 111(d) (111(d) Standard). A 111(d) Standard, unlike a NSPS, applies to existing sources of a pollutant. Under Section 111(d), the EPA does not itself issue the standards. Rather, the EPA promulgates emission guidelines, and the states are then given a period of time to develop plans to implement the standard. The EPA reviews each state-developed standard and then approves it if the state’s plan comports with the federal emission guidelines; if the state does not submit a plan, or if the EPA finds that the plan is inadequate, the EPA will prescribe a plan for that state. The EPA has indicated that it intends to sign proposed emission guidelines by June 1, 2014, to finalize those guidelines by June 1, 2015 and to require state submissions by June 30, 2016.
For both new and existing sources, the EPA must develop a “standard of performance,” which is defined as:
…a standard for emissions of air pollutants which reflects the degree of emission limitation achievable through the application of the best system of emission reduction which (taking into account the cost of achieving such reduction and any non-air quality health and environmental impact and energy requirements) the [EPA] Administrator determines has been adequately demonstrated.
For existing sources, Section 111(d) also requires the EPA to consider, “among other factors, remaining useful lives of the sources in the category of sources to which such standard applies.” In general, the standards ultimately developed are more stringent for new sources than for existing sources, because existing source standards need to consider the issues involved in retrofitting plants considering what can be achieved under their existing design, as well as the cost of implementing the standard relative to the remaining useful life of the facility. The standards also need to be capable of attainment across the category of sources regulated by the standard.
While the potential impact of a 111(d) Standard on OTP’s facilities is not yet known, standards of performance for existing sources of GHGs are anticipated to focus on efficiency improvements rather than add-on controls. The cost of efficiency improvements that achieve generation of the same amount of power with less fuel used could be offset in whole or in part by reduced fuel costs. It is also possible that the EPA will allow the states to claim credit for reductions in GHG emissions that are achieved through programs designed to reduce end-user demand and that it will allow the states, either separately or together, to establish emission averaging and emission credit banking and trading systems (i.e., a cap-and-trade program).
Litigation over both the NSPS and the emission guidelines for existing sources is expected. Thus, uncertainty over whether the standards will be enforced or, if so, what will be permitted, may continue for a number of years.
Several states and regional organizations are also developing, or already have developed, state-specific or regional legislative initiatives to reduce GHG emissions through mandatory programs. In 2007, the state of Minnesota passed legislation regarding renewable energy portfolio standards that requires retail electricity providers to obtain 25% of the electricity sold to Minnesota customers from renewable sources by the year 2025. Additionally, in 2013 the state of Minnesota passed a provision that requires public utilities to generate or procure sufficient electricity generated by solar energy to serve its retail electricity customers in Minnesota so that by the end of 2020, at least 1.5% of the utility’s total retail electric sales to retail customers in Minnesota is generated by solar energy. Regarding CO2, the Minnesota legislature set a January 1, 2008 deadline for the MPUC to establish an estimate of the likely range of costs of future CO2 regulation on electricity generation. The legislation also set state targets for reducing fossil fuel use, included goals for reducing the state’s output of GHGs, and restricted importing electricity that would contribute to statewide power sector CO2 emission. The MPUC, in its order dated December 21, 2007, established an estimate of future CO2 regulation costs at between $4/ton and $30/ton emitted in 2012 and after. However, annual updates of the range are required, and for 2012 and 2013 the range was revised to $9-$34/ton, and the start date to begin using CO2 costs in resource planning decisions was moved from 2012 to 2017.
The states of North Dakota and South Dakota currently have no proposed or pending legislation related to the regulation of GHG emissions, but North Dakota and South Dakota have 10% renewable energy objectives.
While the eventual outcome of proposed and pending climate change legislation and GHG regulation is unknown, OTP is taking steps to reduce its carbon footprint and mitigate levels of CO2 emitted in the process of generating electricity for its customers through the following initiatives:
| ● | Supply efficiency and reliability: OTP’s efforts to increase plant efficiency and add renewable energy to its resource mix have reduced its CO2 intensity. Between 1985 and 2013 OTP decreased its overall system average CO2 emissions intensity by approximately 23%. Further reductions are expected with the additional purchase of 62.4 MW of wind-powered generation under the Ashtabula Wind III wind power purchase agreement, under which energy delivery commenced in October 2013, and with the anticipated replacement of Hoot Lake Plant generation likely with natural gas in the 2020 timeframe. |
| | Conservation: Since 1992 OTP has helped its customers conserve nearly 600 MW of demand and nearly 2.8 million cumulative mwhs of electricity, which is roughly equivalent to the amount of electricity that 232,000 average homes would use in a year. OTP continues to educate customers about energy efficiency and demand-side management and to work with regulators to develop new programs. OTP’s 2014-2028 IRP calls for an additional 106 MW of conservation and demand side management impacts by 2028. |
| | Renewable energy: Since 2002, OTP’s customers have been able to purchase 100% of their electricity from wind generation through OTP’s TailWinds program. OTP has access to 102.9 MW of wind powered generation under power purchase agreements and owns 138 MW of wind powered generation. |
| | Other: OTP is a participating member of the EPA’s SF6 (sulfur hexafluoride) Emission Reduction Partnership for Electric Power Systems program, which proactively is targeting a reduction in emissions of SF6, a potent GHG. SF6 has a global-warming potential 23,900 times that of CO2. Methane has a global-warming potential over 20 times that of CO2. OTP participates in carbon sequestration research through the Plains CO2 Reduction Partnership (PCOR) through the University of North Dakota’s Energy and Environmental Research Center. The PCOR Partnership is a collaborative effort of approximately 100 public and private sector stakeholders working toward a better understanding of the technical and economic feasibility of capturing and storing anthropogenic CO2 emissions from stationary sources in central North America. |
In late 2009, two federal circuit courts of appeal reversed dismissals of GHG suits and remanded them to district court for trial. OTP was not a party to any of these suits, and does not have an indication that it will be the subject of such a lawsuit. The circuit court opinions, however, opened utility companies and other GHG emitters to these actions, which had previously been dismissed by the district courts as nonjustifiable based on the political question doctrine. In 2010, the U.S. Supreme Court took review of one of these cases, while declining review of another. On June 20, 2011, the Supreme Court ruled unanimously that states cannot invoke federal law to force utilities to cut GHG emissions, which was in agreement with the position of utilities and the EPA.
While the future financial impact of any proposed or pending climate change legislation, litigation, or regulation of GHG emissions is unknown at this time, any capital and operating costs incurred for additional pollution control equipment or CO2 emission reduction measures, such as the cost of sequestration or purchasing allowances, or offset credits, or the imposition of a carbon tax or cap and trade program at the state or federal level could materially adversely affect the Company’s future results of operations, cash flows, and possibly financial condition, unless such costs could be recovered through regulated rates and/or future market prices for energy.
Water Quality —The Federal Water Pollution Control Act Amendments of 1972, and amendments thereto, provide for, among other things, the imposition of effluent limitations to regulate discharges of pollutants, including thermal discharges, into the waters of the United States, and the EPA has established effluent guidelines for the steam electric power generating industry. Discharges must also comply with state water quality standards.
Effluent limits specific to Hoot Lake Plant and Coyote Station are incorporated into their National Pollutant Discharge Elimination System (NPDES) permits. Big Stone Plant is a zero discharge facility and therefore does not have a NPDES permit. The EPA announced its decision to proceed with further possible revisions to steam effluent guidelines on September 15, 2009, and published a proposed rulemaking on June 7, 2013. The proposed rulemaking primarily focuses on discharge restrictions applicable to fly ash transport water, bottom ash transport water, and flue gas desulfurization wastewater. Since the steam effluent guidelines rule is not final, at this time OTP is unable to determine how it will affect our facilities, but it appears that the rule could have minimal effect since the facilities do not discharge fly ash transport water, bottom ash transport water, or flue gas desulfurization wastewater into waters of the United States.
On February 16, 2004 the EPA Administrator signed the final Phase II rule implementing Section 316(b) of the Clean Water Act establishing standards for cooling water intake structures for certain existing facilities. A proposed 316(b) rule was issued on April 20, 2011 to replace the 2004 Phase II rule for existing facilities following its remand by the U.S. Court of Appeals in 2007. Unlike the 2004 Phase II rule, the proposed rule has the potential to affect both Hoot Lake Plant and Coyote Station with the greatest potential effect on Hoot Lake Plant. The final rule is expected to be signed in early 2014, though the EPA has repeatedly missed self-imposed deadlines for finalizing the rule. OTP is uncertain of the impact on the potentially affected facilities until the EPA releases the final rule, and likely until after discussions with state regulatory agencies.
OTP has all federal and state water permits presently necessary for the operation of the Coyote Station, the Big Stone Plant and the Hoot Lake Plant. OTP owns five small dams on the Otter Tail River, which are subject to FERC licensing requirements. A license for all five dams was issued on December 5, 1991. Total nameplate rating (manufacturer’s expected output) of the five dams is 3,450 kW.
Solid Waste—Permits for disposal of ash and other solid wastes have been issued for the Coyote Station, the Big Stone Plant and the Hoot Lake Plant.
On June 21, 2010 the EPA published a proposed rule that outlines two possible options to regulate disposal of coal ash generated from the combustion of coal by electric utilities under the Resource Conservation and Recovery Act (RCRA). In one option, the EPA would propose to list coal ash destined for disposal in landfills or surface impoundments as “special wastes” subject to regulation under Subtitle C of RCRA. Subtitle C regulations set forth the EPA’s hazardous waste regulatory program, which regulates the generation, handling, transport and disposal of wastes.
The proposal would create a new category of special waste under Subtitle C, so that coal ash would not be classified as hazardous waste, but would be subject to many of the regulatory requirements applicable to hazardous waste. This option would subject coal ash to technical and permitting requirements from the point of usegeneration to final disposal. The EPA is considering whether to impose disposal facility requirements such as liners, groundwater monitoring, fugitive dust controls, financial assurance, corrective action, closure of units, and post-closure care. This option also includes potential requirements for dam safety and stability for surface impoundments, land disposal restrictions, treatment standards for coal ash, and a prohibition on the disposal of treated coal ash below the natural water table. Beneficial re-uses of coal ash would not be subject to these requirements.
Under the second proposed regulatory option, the EPA would regulate the disposal of coal ash under Subtitle D of RCRA, the regulatory program for non-hazardous solid wastes. In this option, the EPA is considering issuing national minimum criteria to ensure the safe disposal of coal ash, which would subject disposal units to location standards, composite liner requirements, groundwater monitoring and corrective action standards for releases, closure and post-closure care requirements, and requirements to address the stability of surface impoundments. Within this option, the EPA is also considering not requiring existing surface impoundments to close or install composite liners and allowing them to continue to operate for their useful life.
This option would not regulate the generation, storage, or treatment of coal ash prior to disposal, and no federal permits would be required. The EPA’s proposal also states that the EPA is considering whether to list coal ash as a hazardous substance under the Comprehensive Environmental Response, Compensation, and Liability Act, and includes proposals for alternative methods to adjust the statutory reportable quantity for coal ash. The EPA has not decided which regulatory approach it will take with respect to the management and disposal of coal ash. It has suggested, however, that if it finalizes a related Clean Water Act rule regarding effluent limitation guidelines for the steam electric power generating category that are expected to drive utilities to dry-handle their coal combustion residues, then an RCRA rule allowing coal ash to be treated as non-hazardous solid waste may be adequate.
Additional requirements may be imposed as part of the EPA’s pending rule, which could increase the capital and operating costs of OTP’s facilities. Identification of specific costs is contingent on the requirements of the final rule. The most costly option in the EPA proposal is the option that would regulate all coal ash destined for disposal as special waste. For example, under this option, OTP estimates an annual cost of approximately $5.75 million at its Big Stone Plant. If the EPA chooses the other option, it would impose less cost than this estimate. It is also possible the new regulations would not require change in the current operation and cost of OTP’s coal ash disposal sites.
At the request of the Minnesota Pollution Control Agency (MPCA), OTP has an ongoing investigation at its former, closed Hoot Lake Plant ash disposal sites. The MPCA continues to monitor site activities under its Voluntary Investigation and Cleanup (VIC) Program. OTP provided a revised focus feasibility study for remediation alternatives to the MPCA in October 2004. OTP and the MPCA have reached an agreement identifying the remediation technology and OTP completed the projects in 2006. The effectiveness of the remediation is under ongoing evaluation and OTP has notified the MPCA of an additional project in 2014 with plans to remove the ash from one VIC area and place it in OTP’s permitted disposal area.
The EPA has promulgated various solid and hazardous waste regulations and guidelines pursuant to, among other laws, the Resource Conservation and Recovery Act of 1976, the Solid Waste Disposal Act Amendments of 1980 and the Hazardous and Solid Waste Amendments of 1984, which provide for, among other things, the comprehensive control of various solid and hazardous wastes from generation to final disposal. The states of Minnesota, North Dakota and South Dakota have also adopted rules and regulations pertaining to solid and hazardous waste. To date, OTP has incurred no significant costs as a result of these laws. The future total impact on OTP of the various solid and hazardous waste statutes and regulations enacted by rail car. Therethe federal government or the states of Minnesota, North Dakota and South Dakota is not certain at this time.
In 1980, the United States enacted the Comprehensive Environmental Response, Compensation and Liability Act, commonly known as the Federal Superfund law, which was reauthorized and amended in 1986. In 1983, Minnesota adopted the Minnesota Environmental Response and Liability Act, commonly known as the Minnesota Superfund law. In 1988, South Dakota enacted the Regulated Substance Discharges Act, commonly known as the South Dakota Superfund law. In 1989, North Dakota enacted the Environmental Emergency Cost Recovery Act. Among other requirements, the federal and state acts establish environmental response funds to pay for remedial actions associated with the release or threatened release of certain regulated substances into the environment. These federal and state Superfund laws also establish liability for cleanup costs and damage to the environment resulting from such release or threatened release of regulated substances. The Minnesota Superfund law also creates liability for personal injury and economic loss under certain circumstances. OTP has not incurred any significant costs to date related to these laws. OTP is not presently named as a potentially responsible party under the federal or state Superfund laws.
Capital Expenditures
OTP is continually expanding, replacing and improving its electric facilities. During 2013, approximately $149 million in cash was invested for additions and replacements to its electric utility properties. During the five years ended December 31, 2013 gross electric property additions, including construction work in progress, were approximately $474 million and gross retirements were approximately $60 million. OTP estimates that during the five-year period 2014-2018 it will invest approximately $657 million for electric construction, which includes $131 million for OTP’s share of the Big Stone Plant AQCS and $304 million for transmission projects including $243 million for MVPs and $26 million for CapX2020 transmission projects ($7 million for the Brookings to Southeast Twin Cities CapX2020 MVP project is included with the $243 million for MVP projects). The remainder of the 2014-2018 anticipated capital expenditures is for asset replacements, additions and improvements across OTP’s generation, transmission, distribution and general plant. See “Management’s Discussion and Analysis of Financial Condition and Results of Operations - Capital Requirements” section for further discussion.
Franchises
At December 31, 2013 OTP had franchises to operate as an electric utility in substantially all of the incorporated municipalities it serves. All franchises are a limited numbernonexclusive and generally were obtained for 20-year terms, with varying expiration dates. No franchises are required to serve unincorporated communities in any of third party vendorsthe three states that supplyOTP serves. OTP believes that its franchises will be renewed prior to expiration.
Employees
At December 31, 2013 OTP had 668 equivalent full-time employees. A total of 397 OTP employees are represented by local unions of the PVC resin used by Northern PipeInternational Brotherhood of Electrical Workers under two separate contracts expiring in the fall of 2014 and Vinyltech. Two vendors provided approximately 90%2016. OTP has not experienced any strike, work stoppage or strike vote, and 97%considers its present relations with employees to be good.
MANUFACTURING
General
Manufacturing consists of total resin purchasesbusinesses engaged in the following activities: contract machining, metal parts stamping and fabrication, and production of material handling trays and horticultural containers.
The Company derived 23%, 24% and 23% of its consolidated operating revenues and 21%, 26% and 22% of its consolidated operating income from the Manufacturing segment for the years ended December 31, 2013, 2012 and 2011, respectively. The supplyFollowing is a brief description of PVC resin may also be limited primarily due to manufacturing capacity and the limited availabilityeach of raw material components. A majority of U.S. resin production plants arethese businesses:
BTD Manufacturing, Inc. (BTD), with headquarters located in Detroit Lakes, Minnesota, is a metal stamping and tool and die manufacturer that provides its services mainly to customers in the Gulf Coast region, which is subjectMidwest. BTD stamps, fabricates, welds and laser cuts metal components according to risk of damage tomanufacturers’ specifications primarily for the plantsrecreational vehicle, agricultural, lawn and potential shutdown of resin production because of exposure to hurricanes that occurgarden, industrial equipment, health and fitness and enclosure industries in that part ofits facilities in Detroit Lakes, Otsego and Lakeville, Minnesota, and Washington, Illinois. BTD’s Illinois facility also manufactures and fabricates parts for off-road equipment, mining machinery, oil fields and offshore oil rigs, wind industry components, broadcast antennae and farm equipment, and serves several major equipment manufacturers in the Peoria, Illinois area and nationwide, including Caterpillar, Komatsu and Gardner Denver.
T. O. Plastics, Inc. (T.O. Plastics), located in Otsego and Clearwater, Minnesota, manufactures and sells thermoformed products for the horticulture industry throughout the United States. The loss of a key vendor,In addition, T.O. Plastics produces products such as clamshell packing, blister packs, returnable pallets and handling trays for shipping and storing odd-shaped or any interruption or delaydifficult-to-handle parts for customers in the supplyconsumer products, food packaging, electronics, industrial and medical industries, among others. T.O. Plastics’ Otsego thermoforming facility achieved an AIB International (formerly American Institute of PVC resin, could disrupt the ability of the Plastics segment to manufacture products, cause customers to cancel orders or require incurrence of additional expenses to obtain PVC resin from alternative sources, if such sources were available. Both Northern Pipe and Vinyltech believe they have good relationships with their key raw material vendors.Baking) compliance rating for producing food-contact packaging materials in its operations.
DueCompetition
The various markets in which the Manufacturing segment entities compete are characterized by intense competition from both foreign and domestic manufacturers. These markets have many established manufacturers with broader product lines, greater distribution capabilities, greater capital resources, excess capacity, labor advantages and larger marketing, research and development staffs and facilities than the Company’s manufacturing entities.
The Company believes the principal competitive factors in its Manufacturing segment are product performance, quality, price, technical innovation, cost effectiveness, customer service and breadth of product line. The Company’s manufacturing entities intend to continue to compete on the commodity naturebasis of PVC resinhigh-performance products, innovative production technologies, cost-effective manufacturing techniques, close customer relations and PVC pipesupport, and increasing product offerings.
Raw Materials Supply
The companies in the dynamic supplyManufacturing segment use raw materials in the products they manufacture, including steel, aluminum and demand factors worldwide, historicallypolystyrene and other plastics resins. Both pricing increases and availability of these raw materials are concerns of companies in the markets for both PVC resin and PVC pipeManufacturing segment. The companies in the Manufacturing segment attempt to pass increases in the costs of these raw materials on to their customers. Increases in the costs of raw materials that cannot be passed on to customers could have been very cyclicala negative effect on profit margins in the Manufacturing segment.
Backlog
The Manufacturing segment has backlog in place to support 2014 revenues of approximately $136 million compared with significant fluctuations in prices and gross margins.$124 million one year ago.
Capital Expenditures
Capital expenditures in the PlasticsManufacturing segment typically include additional investments in extrusion machines,new manufacturing equipment or expenditures to replace worn-out manufacturing equipment. Capital expenditures may also be made for the purchase of land and buildings for plant expansion and for investments in management information systems. During 2012,2013, cash expenditures for capital additions in the PlasticsManufacturing segment were approximately $3$7 million. Total capital expenditures for the Manufacturing segment during the five-year period 2013-20172014-2018 are estimated to be approximately $10 million to replace existing equipment.$81 million.
Employees
At December 31, 20122013 the Manufacturing segment had 1,059 full-time employees. There are 932 full-time employees at BTD and 127 full-time employees at T.O. Plastics.
PLASTICS
General
Plastics consists of businesses producing PVC pipe at plants in North Dakota and Arizona. The Company derived 18%, 18% and 15% of its consolidated operating revenues and 25%, 32% and 15% of its consolidated operating income from the Plastics segment had 142 full-time employees. Northern Pipe had 91 full-time employees and Vinyltech had 51 full-time employees as offor the years ended December 31, 2012.2013, 2012 and 2011, respectively. Following is a brief description of these businesses:
Item 1A.RISK FACTORSNorthern Pipe Products, Inc. (Northern Pipe), located in Fargo, North Dakota, manufactures and sells PVC pipe for municipal water, rural water, wastewater, storm drainage systems and other uses in the northern, midwestern, south-central and western regions of the United States as well as central and western Canada. Production facilities are located in Fargo, North Dakota.
RISK FACTORS AND CAUTIONARY STATEMENTSVinyltech Corporation (Vinyltech), located in Phoenix, Arizona, manufactures and sells PVC pipe for municipal water, wastewater, water reclamation systems and other uses in the western and south-central regions of the United States.
Our businesses are subjectTogether these companies have the current capacity to various risks and uncertainties. Anyproduce approximately 300 million pounds of the risks described below or elsewhere in this Annual Report on Form 10-K or in our other SEC filings could materially adversely affect our business, financial condition and results of operations.PVC pipe annually.
Federal and state environmental regulation could require us to incur substantial capital expenditures and increased operating costs.
We are subject to federal, state and local environmental laws and regulations relating to air quality, water quality, waste management, natural resources and health safety. These laws and regulations regulate the modification and operation of existing facilities, the construction and operation of new facilities and the proper storage, handling, cleanup and disposal of hazardous waste and toxic substances. Compliance with these legal requirements requires us to commit significant resources and funds toward environmental monitoring, installation and operation of pollution control equipment, payment of emission fees and securing environmental permits. Obtaining environmental permits can entail significant expense and cause substantial construction delays. Failure to comply with environmental laws and regulations, even if caused by factors beyond our control, may result in civil or criminal liabilities, penalties and fines.Customers
Existing environmental laws or regulations may be revisedPVC pipe products are marketed through a combination of independent sales representatives, company salespersons and new laws or regulations may be adopted or become applicable to us. Revised or additional regulations, which result in increased compliance costs or additional operating restrictions, particularly if those costs are not fully recoverable from customers, could have a material effect on our resultscustomer service representatives. Customers for the PVC pipe products consist primarily of operations.wholesalers and distributors throughout the northern, midwestern, south-central and western United States.
Volatile financial markets and changes in our debt ratings could restrict our ability to access capital and increase borrowing costs and pension plan and postretirement health care expenses.
We rely on access to both short- and long-term capital markets as a source of liquidity for capital requirements not satisfied by cash flows from operations. If we are unable to access capital at competitive rates, our ability to implement our business plans may be adversely affected. Market disruptions or a downgrade of our credit ratings may increase the cost of borrowing or adversely affect our ability to access one or more financial markets.
Disruptions, uncertainty or volatility in the financial markets can also adversely impact our results of operations, the ability of customers to finance purchases of goods and services, and our financial condition, as well as exert downward pressure on stock prices and/or limit our ability to sustain our current common stock dividend level.
Changes in the U.S. capital markets could also have significant effects on our pension plan. Our pension income or expense is affected by factors including the market performance of the assets in the master pension trust maintained for the pension plan for some of our employees, the weighted average asset allocation and long-term rate of return of our pension plan assets, the discount rate used to determine the service and interest cost components of our net periodic pension cost and assumed rates of increase in our employees’ future compensation. If our pension plan assets do not achieve positive rates of return, or if our estimates and assumed rates are not accurate, our earnings may decrease because net periodic pension costs would rise and we could be required to provide additional funds to cover our obligations to employees under the pension plan.
We made a $10.0 million discretionary contribution to our defined benefit pension plan in January 2013. We could be required to contribute additional capital to the pension plan in the future if the market value of pension plan assets significantly declines, plan assets do not earn in line with our long-term rate of return assumptions or relief under the Pension Protection Act is no longer granted.
Any significant impairment of our goodwill would cause a decrease in our asset values and a reduction in our net operating income.
We had approximately $39.0 million of goodwill recorded on our consolidated balance sheet as of December 31, 2012. We have recorded goodwill for businesses in each of our business segments except Electric. If we make changes in our business strategy or if market or other conditions adversely affect operations in any of these businesses, we may be forced to record an impairment charge, which would lead to decreased assets and a reduction in net operating performance. Goodwill is tested for impairment annually or whenever events or changes in circumstances indicate impairment may have occurred. If the testing performed indicates that impairment has occurred, we are required to record an impairment charge for the difference between the carrying amount of the goodwill and the implied fair value of the goodwill in the period the determination is made. The testing of goodwill for impairment requires us to make significant estimates about our future performance and cash flows, as well as other assumptions. These estimates can be affected by numerous factors, including changes in economic, industry or market conditions, changes in business operations, future business operating performance, changes in competition or changes in technologies. Any changes in key assumptions, or actual performance compared with key assumptions, about our business and its future prospects or other assumptions could affect the fair value of one or more business segments, which may result in an impairment charge.
A sustained decline in our common stock price below book value or declines in projected operating cash flows at any of our operating companies may result in goodwill impairments that could adversely affect our results of operations and financial position, as well as financing agreement covenants.
We currently have $7.3 million of goodwill and a $1.1 million indefinite-lived trade name recorded on our consolidated balance sheet related to the acquisition of Foley in 2003. Foley generated a large operating loss in 2012 due to significant cost overruns on certain construction projects. If operating margins do not meet our projections, the reductions in anticipated cash flows from Foley may indicate that its fair value is less than its book value, resulting in an impairment of some or all of the goodwill and indefinite-lived trade name associated with Foley along with a corresponding charge against earnings.Competition
The inabilityplastic pipe industry is fragmented and competitive, due to the number of our subsidiariesproducers, the small number of raw material suppliers and the fungible nature of the product. Due to provide sufficient earningsshipping costs, competition is usually regional, instead of national, in scope. The principal areas of competition are a combination of price, service, warranty, and cash flowsproduct performance. Northern Pipe and Vinyltech compete not only against other plastic pipe manufacturers, but also ductile iron, steel, concrete and clay pipe producers. Pricing pressure will continue to allow usaffect operating margins in the future.
Northern Pipe and Vinyltech intend to meet our financial obligations and debt covenants and pay dividendscontinue to our shareholders could have an adverse effectcompete on the Company.basis of their high quality products, cost-effective production techniques and close customer relations and support.
Otter Tail Corporation is a holding company with no significant operations of its own. The primary source of funds for payment of our financial obligations and dividends to our shareholders is from cash provided by our subsidiary companies. Our ability to meet our financial obligations and pay dividends on our common stock principally depends on the actual and projected earnings, cash flows, capital requirements and general financial position of our subsidiary companies, as well as regulatory factors, financial covenants, general business conditions and other matters.
Under our $150 million revolving credit agreement we may not permit the ratio of our Interest-bearing Debt to Total Capitalization to be greater than 0.60 to 1.00. OTP may not permit the ratio of its Interest-bearing Debt to Total Capitalization to be greater than 0.60 to 1.00 under its $170 million revolving credit agreement. Both credit agreements contain restrictions on the payment of cash dividends upon a default or event of default. As of December 31, 2012 we were in compliance with the debt covenants.
Under the Federal Power Act, a public utility may not pay dividends from any funds properly included in a capital account. What constitutes “funds properly included in a capital account” is undefined in the Federal Power Act or the related regulations; however, FERC has consistently interpreted the provision to allow dividends to be paid as long as (1) the source of the dividends is clearly disclosed, (2) the dividend is not excessive and (3) there is no self-dealing on the part of corporate officials. The MPUC indirectly limits the amount of dividends OTP can pay to us by requiring an equity-to-total-capitalization ratio between 46.3% and 56.7%. OTP’s equity-to-total-capitalization ratio was 52.0% as of December 31, 2012.
While these restrictions are not expected to affect our ability to pay dividends at the current level in the foreseeable future, there is no assurance that adverse financial results would not reduce or eliminate our ability to pay dividends. Our dividend payout ratio has exceeded our (losses) earnings in each of the last five years.
Economic conditions could negatively impact our businesses.
Our businesses are affected by local, national and worldwide economic conditions. Tightening of credit in financial markets could adversely affect the ability of customers to finance purchases of our goods and services, resulting in decreased orders, cancelled or deferred orders, slower payment cycles, and increased bad debt and customer bankruptcies. Our businesses may also be adversely affected by decreases in the general level of economic activity, such as decreases in business and consumer spending. A decline in the level of economic activity and uncertainty regarding energy and commodity prices could adversely affect our results of operations and our future growth.
If we are unable to achieve the organic growth we expect, our financial performance may be adversely affected.
We expect much of our growth in the next few years will come from major capital investment at existing companies. To achieve the organic growth we expect, we will have to have access to the capital markets, be successful with capital expansion programs related to organic growth, develop new products and services, expand our markets and increase efficiencies in our businesses. Competitive and economic factors could adversely affect our ability to do this. If we are unable to achieve and sustain consistent organic growth, we will be less likely to meet our revenue growth targets, which, together with any resulting impact on our net income growth, may adversely affect the market price of our common shares.
Our plans to grow and realign our business mix through capital projects, acquisitions and dispositions may not be successful, which could result in poor financial performance.
As part of our business strategy, we intend to increase capital expenditures in our existing businesses and to continually assess our mix of businesses and potential strategic acquisitions or dispositions. There are risks associated with capital expenditures including not being granted timely or full recovery of rate base additions in our regulated utility business and the inability to recover the cost of capital additions due to an economic downturn, lack of markets for new products, competition from producers of lower cost or alternative products, product defects or loss of customers. We may not be able to identify appropriate acquisition candidates or successfully negotiate, finance or integrate acquisitions. Future acquisitions could involve numerous risks including: difficulties in integrating the operations, services, products and personnel of the acquired business; and the potential loss of key employees, customers and suppliers of the acquired business. If we are unable to successfully manage these risks, we could face reductions in net income in future periods.
We may, from time to time, sell assets to provide capital to fund investments in our electric utility business or for other corporate purposes, which could result in the recognition of a loss on the sale of any assets sold and other potential liabilities. The sale of any of our businesses also exposes us to additional risks associated with indemnification obligations under the applicable sales agreements and any related disputes.
As part of our business strategy, we continually assess our business portfolio to determine if our operating companies continue to meet our portfolio criteria. A loss on the sale of a business would be recognized if a company is sold for less than its book value.
In certain transactions we retain obligations that have arisen, or subsequently arise, out of our conduct of the business prior to the sale. These obligations are sometimes direct or, in other cases, take the form of an indemnification obligation to the buyer. These obligations include such things as warranty, environmental, and in the case of ShoreMaster, the collection of certain receivables. Unforeseen costs related to these obligations could result in future losses related to the business sold.
Our plans to grow and operate our manufacturing and infrastructure businesses could be limited by state law.
Our plans to grow and operate our manufacturing and infrastructure businesses could be adversely affected by legislation in one or more states that may attempt to limit the amount or level of diversification permitted in a holding company structure that includes a regulated utility company or affiliated nonelectric companies.
Significant warranty claims and remediation costs in excess of amounts normally reserved for such items could adversely affect our results of operations and financial condition.
Depending on the specific product or service, we provide certain warranty terms against manufacturing defects and certain materials. We reserve for warranty claims based on industry experience and estimates made by management. For some of our products we have limited history on which to base our warranty estimate. Our assumptions could be materially different from any actual claim and could exceed reserve balances.
Expenses associated with remediation activities of DMI, our former wind tower manufacturer, could be substantial. The potential exists for multiple claims based on one defect repeated throughout the production process or for claims where the cost to repair or replace the defective part is highly disproportionate to the original cost of the part. If we are required to cover remediation expenses in addition to our regular warranty coverage, we could be required to accrue additional expenses and experience additional unplanned cash expenditures which could adversely affect our consolidated results of operations and financial condition.
We are subject to risks associated with energy markets.
Our businesses are subject to the risks associated with energy markets, including market supply and increasing energy prices. If we are faced with shortages in market supply, we may be unable to fulfill our contractual obligations to our retail, wholesale and other customers at previously anticipated costs. This could force us to obtain alternative energy or fuel supplies at higher costs or suffer increased liability for unfulfilled contractual obligations. Any significantly higher than expected energy or fuel costs would negatively affect our financial performance.
We are subject to risks and uncertainties related to the timing of recovery of deferred tax assets which could have a negative impact on our net income in future periods.
If taxable income is not generated in future periods in certain tax jurisdictions the recovery of deferred taxes related to accumulated tax benefits may be delayed and we may be required to record a reserve related to the uncertainty of the timing of recovery of deferred tax assets related to accumulated taxable losses in those tax jurisdictions. This would have a negative impact on the Company’s net income in the period the reserve is recorded.
We rely on our information systems to conduct our business, and failure to protect these systems against security breaches could adversely affect our business and results of operations. Additionally, if these systems fail or become unavailable for any significant period of time, our business could be harmed.
The efficient operation of our business is dependent on computer hardware and software systems. Information systems are vulnerable to security breach by computer hackers and cyber terrorists. We rely on industry accepted security measures and technology to securely maintain confidential and proprietary information maintained on our information systems. However, these measures and technology may not adequately prevent security breaches. In addition, the unavailability of the information systems or failure of these systems to perform as anticipated for any reason could disrupt our business and could result in decreased performance and increased overhead costs, causing our business and results of operations to suffer. Any significant interruption or failure of our information systems or any significant breach of security could adversely affect our business and results of operations.
ELECTRIC
We may experience fluctuationsGeneral
Electric includes OTP and, through December 31, 2012, the operations of OTESCO, which were not materially significant in 2012 and 2011. OTP, headquartered in Fergus Falls, Minnesota, provides electricity to more than 130,000 customers in a service area with outer boundaries that encompass a total expanse of 70,000 square miles of western Minnesota, eastern North Dakota, and northeastern South Dakota. OTESCO, headquartered in Fergus Falls, Minnesota, provided technical and engineering services primarily in North Dakota and Minnesota. The Company derived 42%, 41% and 41% of its consolidated operating revenues and expenses related64%, 74% and 88% of its consolidated operating income from the Electric segment for the years ended December 31, 2013, 2012 and 2011, respectively.
The breakdown of retail electric revenues by state is as follows:
| State | | 2013 | | | 2012 | |
| Minnesota | | | 48.2 | % | | | 48.9 | % |
| North Dakota | | | 42.8 | | | | 42.0 | |
| South Dakota | | | 9.0 | | | | 9.1 | |
| Total | | | 100.0 | % | | | 100.0 | % |
The territory served by OTP is predominantly agricultural. The aggregate population of OTP’s retail electric service area is approximately 230,000. In this service area of 422 communities and adjacent rural areas and farms, approximately 125,646 people live in communities having a population of more than 1,000, according to ourthe 2010 census. The only communities served which have a population in excess of 10,000 are Jamestown, North Dakota (15,427); Bemidji, Minnesota (13,431); and Fergus Falls, Minnesota (13,138). As of December 31, 2013, OTP served 130,188 customers. Although there are relatively few large customers, sales to commercial and industrial customers are significant.
The following table provides a breakdown of electric operations,revenues by customer category. All other sources include gross wholesale sales from utility generation, net revenue from energy trading activity and sales to municipalities.
| Customer Category | | 2013 | | | 2012 | |
| Commercial | | | 36.9 | % | | | 36.0 | % |
| Residential | | | 33.3 | | | | 32.6 | |
| Industrial | | | 23.2 | | | | 25.0 | |
| All Other Sources | | | 6.6 | | | | 6.4 | |
| Total | | | 100.0 | % | | | 100.0 | % |
Wholesale electric energy kilowatt-hour (kwh) sales were 12.5% of total kwh sales for 2013 and 11.8% for 2012. Wholesale electric energy kwh sales increased by 13.9% between the years while revenue per kwh sold increased by 18.8%. Activity in the short-term energy market is subject to change based on a number of factors and it is difficult to predict the quantity of wholesale power sales or prices for wholesale power in the future.
Capacity and Demand
As of December 31, 2013 OTP’s owned net-plant dependable kilowatt (kW) capacity was:
| | | |
| Baseload Plants | | | |
| Big Stone Plant | | 256,700 | kW |
| Coyote Station | | | 149,000 | |
| Hoot Lake Plant | | | 148,900 | |
| Total Baseload Net Plant | | 554,600 | kW |
| Combustion Turbine and Small Diesel Units | | 104,900 | kW |
| Hydroelectric Facilities | | 2,600 | kW |
| Owned Wind Facilities (rated at nameplate) | | | | |
| Luverne Wind Farm (33 turbines) | | 49,500 | kW |
| Ashtabula Wind Center (32 turbines) | | | 48,000 | |
| Langdon Wind Center (27 turbines) | | | 40,500 | |
| Total Owned Wind Facilities | | 138,000 | kW |
The baseload net plant capacity for Big Stone Plant and Coyote Station constitutes OTP’s ownership percentages of 53.9% and 35%, respectively. OTP owns 100% of the Hoot Lake Plant. During 2013, OTP generated about 70.8% of its retail kwh sales and purchased the balance.
In addition to the owned facilities described above OTP had the following purchased power agreements in place on December 31, 2013:
| |
| Purchased Wind Power Agreements (rated at nameplate and greater than 2,000 kW) | |
| Ashtabula Wind III | | 62,400 | kW |
| Edgeley | | | 21,000 | |
| Langdon | | | 19,500 | |
| Total Purchased Wind | | 102,900 | kW |
| | | | |
| Other Purchased Power Agreements (in excess of 1 year and 500 kW) | | | | |
Great River Energy1 | | 100,000 | kW |
1 Through May 2021. | | | |
OTP has a direct control load management system which may cause our financial resultsprovides some flexibility to fluctuate and could impair our abilityOTP to make distributionseffect reductions of peak load. OTP also offers rates to shareholders or scheduled paymentscustomers which encourage off-peak usage.
OTP’s capacity requirement is based on our debt obligations, orMISO Module E requirements. OTP is required to have sufficient Zonal Resource Credits to meet covenantsits monthly weather normalized forecast demand, plus a reserve obligation. The MISO Resource Adequacy Construct changed significantly for the 2013/2014 MISO Planning Year effective June 1, 2013. OTP met its MISO obligation for 2013. OTP generating capacity combined with additional capacity under our borrowing agreements.purchased power agreements (as described above) and load management control capabilities is expected to meet 2014 system demand and MISO reserve requirements.
Fuel Supply
Coal is the principal fuel burned at the Big Stone, Coyote and Hoot Lake generating plants. Coyote Station, a mine-mouth facility, burns North Dakota lignite coal. Hoot Lake Plant and Big Stone Plant burn western subbituminous coal.
The following table shows the sources of energy used to generate OTP’s net output of electricity for 2013 and 2012:
| |
| | | 2013 | | | 2012 | |
| Sources | | Net Kilowatt
Hours
Generated
(Thousands) | | | % of Total
Kilowatt
Hours
Generated | | | Net Kilowatt
Hours
Generated
(Thousands) | | | | % of Total
Kilowatt
Hours
Generated | |
| Subbituminous Coal | | | 2,322,608 | | | | 62.4 | % | | | 2,094,293 | | | | 61.2 | % |
| Lignite Coal | | | 881,973 | | | | 23.7 | | | | 782,358 | | | | 22.9 | |
| Wind and Hydro | | | 471,176 | | | | 12.7 | | | | 490,387 | | | | 14.3 | |
| Natural Gas and Oil | | | 43,165 | | | | 1.2 | | | | 55,637 | | | | 1.6 | |
| Total | | | 3,718,922 | | | | 100.0 | % | | | 3,422,675 | | | | 100.0 | % |
OTP has the following primary coal supply agreements:
| | | |
| Plant | Coal Supplier | Type of Coal | Expiration Date |
| Big Stone Plant | Peabody COALSALES, LLC | Wyoming subbituminous | December 31, 2016 |
| Big Stone Plant | Westmoreland Resources, Inc. | Montana subbituminous | December 31, 2014 |
| Coyote Station | Dakota Westmoreland Corporation | North Dakota lignite | May 4, 2016 |
| Coyote Station | Coyote Creek Mining Company, L.L.C. | North Dakota lignite | December 31, 2040 |
| Hoot Lake Plant | Cloud Peak Energy Resources LLC | Montana subbituminous | December 31, 2015 |
OTP has about 58% of its coal needs for Big Stone under contract through December 2016.
The contract with Dakota Westmoreland Corporation expires on May 4, 2016. In October 2012, the Coyote Station owners, including OTP, entered into a lignite sales agreement (LSA) with Coyote Creek Mining Company, L.L.C. (CCMC), a subsidiary of The North American Coal Corporation, for the purchase of coal to meet the coal supply requirements of Coyote Station for the period beginning in May 2016 and ending in December 2040. The price per ton to be paid by the Coyote Station owners under the LSA will reflect the cost of production, along with an agreed profit and capital charge. The LSA provides for the Coyote Station owners to purchase the membership interests in CCMC in the event of certain early termination events and also at the end of the term of the LSA.
OTP has about 84% of its anticipated coal needs for Hoot Lake Plant secured under contract through December 2015.
It is OTP’s practice to maintain a minimum 30-day inventory (at full output) of coal at the Big Stone Plant and a 20-day inventory at Coyote Station and Hoot Lake Plant.
Railroad transportation services to the Big Stone Plant and Hoot Lake Plant are provided under a common carrier rate by the BNSF Railway. The common carrier rate is subject to a mileage-based methodology to assess a fuel surcharge. The basis for the fuel surcharge is the U.S. average price of retail on-highway diesel fuel. No coal transportation agreement is needed for Coyote Station due to its location next to a coal mine.
The average cost of fuel consumed (including handling charges to the plant sites) per million British Thermal Units for the years 2013, 2012, and 2011 was $2.055, $2.108, and $1.922, respectively.
General Regulation
OTP is subject to regulation of rates and other matters in each of the three states in which it operates and by the federal government for certain interstate operations.
A numberbreakdown of factors, manyelectric rate regulation by each jurisdiction is as follows:
| | | | 2013 | | | 2012 | |
| Rates | Regulation | | % of
Electric
Revenues | | | % of kwh
Sales | | | % of
Electric
Revenues | | | % of kwh
Sales | |
| MN Retail Sales | MN Public Utilities Commission | | | 43.8 | % | | | 42.5 | % | | | 45.2 | % | | | 43.4 | % |
| ND Retail Sales | ND Public Service Commission | | | 39.0 | | | | 36.8 | | | | 38.8 | | | | 36.4 | |
| SD Retail Sales | SD Public Utilities Commission | | | 8.2 | | | | 8.2 | | | | 8.4 | | | | 8.5 | |
| Transmission & Wholesale | Federal Energy Regulatory Commission | | | 9.0 | | | | 12.5 | | | | 7.6 | | | | 11.7 | |
| Total | | | | 100.0 | % | | | 100.0 | % | | | 100.0 | % | | | 100.0 | % |
OTP operates under approved retail electric tariffs in all three states it serves. OTP has an obligation to serve any customer requesting service within its assigned service territory. The pattern of electric usage can vary dramatically during a 24-hour period and from season to season. OTP’s tariffs are designed to recover the costs of providing electric service. To the extent that peak usage can be reduced or shifted to periods of lower usage, the cost to serve all customers is reduced. In order to shift usage from peak times, OTP has approved tariffs in all three states for residential demand control, general service time of use and time of day, real-time pricing, and controlled and interruptible service. Each of these specialized rates is designed to improve efficient use of OTP resources, while giving customers more control over their electric bill. OTP also has approved tariffs in its three service territories which are beyond our control, may contributeallow qualifying customers to fluctuationsrelease and sell energy back to OTP when wholesale energy prices make such transactions desirable.
With a few minor exceptions, OTP’s electric retail rate schedules provide for adjustments in our revenues and expenses from electric operations, causing our net incomerates based on the cost of fuel delivered to fluctuate from period to period. These risks include fluctuations in the volume and price of sales of electricity to customers or other utilities, which may be affected by factors such as mergers and acquisitions of other utilities, geographic location of other utilities, transmission costs (including increased costs related to operations of regional transmission organizations), changes in the manner in which wholesale power is sold and purchased, unplanned interruptions at OTP’s generating plants, as well as for adjustments based on the effectscost of regulationelectric energy purchased by OTP. OTP also credits certain margins from wholesale sales to the fuel and legislation, demographic changes in OTP’s customer base and changes in OTP’s customer demand or load growth. Electric wholesale margins have been significantly and adversely affected by increased efficiencies in the MISO market. Electric wholesale trading margins could also be adversely affected by losses due to trading activities. Other risks include weather conditions or changes in weather patterns (including severe weather that could result in damage to OTP’s assets),purchased power adjustment. The adjustments for fuel and purchased power costs are presently based on a two month moving average in Minnesota and by the Federal Energy Regulatory Commission (FERC), a three month moving average in South Dakota and a four month moving average in North Dakota. These adjustments are applied to the next billing period after becoming applicable. These adjustments also include an over or under recovery mechanism, which is calculated on an annual basis in Minnesota and on a monthly basis in North Dakota and South Dakota.
The following summarizes the material regulations of each jurisdiction applicable to OTP’s electric operations, as well as any specific electric rate proceedings during the last three years with the Minnesota Public Utilities Commission (MPUC), the North Dakota Public Service Commission (NDPSC), the South Dakota Public Utilities Commission (SDPUC) and the FERC. The Company’s manufacturing and infrastructure businesses are not subject to direct regulation by any of these agencies.
Minnesota
Under the Minnesota Public Utilities Act, OTP is subject to the jurisdiction of the MPUC with respect to rates, issuance of securities, depreciation rates, public utility services, construction of major utility facilities, establishment of exclusive assigned service areas, contracts and arrangements with subsidiaries and other affiliated interests, and other matters. The MPUC has the authority to assess the need for large energy facilities and to issue or deny certificates of need, after public hearings, within one year of an application to construct such a facility.
Pursuant to the Minnesota Power Plant Siting Act, the MPUC has authority to select or designate sites in Minnesota for new electric power generating plants (50,000 kW or more) and routes for transmission lines (100 kilovolt (kV) or more) in an orderly manner compatible with environmental preservation and the efficient use of resources, and to certify such sites and routes as to environmental compatibility after an environmental impact study has been conducted by the Minnesota Department of Commerce (MNDOC) and the Office of Administrative Hearings has conducted contested case hearings.
The Minnesota Division of Energy Resources, part of the MNDOC, is responsible for investigating all matters subject to the jurisdiction of the MNDOC or the MPUC, and for the enforcement of MPUC orders. Among other things, the MNDOC is authorized to collect and analyze data on energy including the consumption of energy, develop recommendations as to energy policies for the governor and the legislature of Minnesota and evaluate policies governing the establishment of rates and prices for energy as related to energy conservation. The MNDOC also has the power, in the event of energy shortage or for a long-term basis, to prepare and adopt regulations to conserve and allocate energy.
2010 General Rate Case—OTP filed a general rate case on April 2, 2010 requesting an 8.01% base rate increase as well as a 3.8% interim rate increase. On May 27, 2010, the MPUC issued an order accepting the filing, suspending rates, and approving the interim rate increase, as requested, to be effective with customer usage on and after June 1, 2010. The MPUC held a hearing to decide on the issues in the rate case on March 25, 2011 and issued a written order on April 25, 2011. The MPUC authorized a revenue increase of approximately $5.0 million, or 3.76% in base rate revenues, excluding the effect of moving recovery of wind investments to base rates. The MPUC’s written order included: (1) recovery of Big Stone II costs over five years, (2) moving recovery of wind farm assets from rider recovery to base rate recovery, (3) transfer of a portion of Minnesota Conservation Improvement Program (MNCIP) costs from rider recovery to base rate recovery, (4) transfer of the investment in two transmission lines from rider recovery to base rate recovery, and (5) changing the mechanism for providing customers with a credit for margins earned on asset-based wholesale sales of electricity from a credit to base rates to a credit to the Minnesota Fuel Clause Adjustment. Final rates went into effect October 1, 2011. The overall increase to customers was approximately 1.6% compared to the authorized interim rate increase of 3.8%, which resulted in an interim rate refund to Minnesota retail electric customers of approximately $3.9 million in the fourth quarter of 2011. Pursuant to the order, OTP’s allowed rate of economic growthreturn on rate base increased from 8.33% to 8.61% and its allowed rate of return on equity increased from 10.43% to 10.74%. OTP’s authorized rates of return are based on a capital structure of 48.28% long term debt and 51.72% common equity.
Conservation Improvement Programs—Under Minnesota law, every regulated public utility that furnishes electric service must make annual investments and expenditures in energy conservation improvements, or declinemake a contribution to the state’s energy and conservation account, in an amount equal to at least 1.5% of its gross operating revenues from service provided in Minnesota. The Next Generation Energy Act of 2007, passed by the Minnesota legislature in May 2007, transitions from a conservation spending goal to a conservation energy savings goal.
The MNDOC may require a utility to make investments and expenditures in energy conservation improvements whenever it finds that the improvement will result in energy savings at a total cost to the utility less than the cost to the utility to produce or purchase an equivalent amount of a new supply of energy. Such MNDOC orders can be appealed to the MPUC. Investments made pursuant to such orders generally are recoverable costs in rate cases, even though ownership of the improvement may belong to the property owner rather than the utility. OTP recovers conservation related costs not included in base rates under the MNCIP through the use of an annual recovery mechanism approved by the MPUC.
On January 11, 2012 the MPUC approved the recovery of $3.5 million for 2010 MNCIP financial incentives. Beginning in January 2012, OTP’s MNCIP Conservation Cost Recovery Adjustment increased from 3.0% to 3.8% for all Minnesota retail electric customers. On March 30, 2012 OTP recognized an additional $0.4 million of incentive related to 2011 and submitted its annual 2011 financial incentive filing request for $2.6 million. In December 2012, the MPUC approved the recovery of $2.6 million in financial incentives for 2011 and also ordered a change in the MNCIP cost recovery methodology used by OTP from a percentage of a customer’s bill to an amount per kwh consumed. On January 1, 2013 OTP’s MNCIP surcharge decreased from 3.8% of the customer’s bill to $0.00142 per kwh, which equates to approximately 1.9% of a customer’s bill. OTP recognized $2.6 million of MNCIP financial incentives in 2012 and an additional $0.1 million in 2013 relating to 2012 program results. On October 10, 2013 the MPUC approved OTP’s 2012 financial incentive request for $2.7 million as well as its request for an updated surcharge rate to be implemented on November 1, 2013.
Integrated Resource Plan (IRP)—Minnesota law requires utilities to submit to the MPUC for approval a 15-year advance IRP. A resource plan is a set of resource options a utility could use to meet the service needs of its customers over a forecast period, including an explanation of the utility’s supply and demand circumstances, and the extent to which each resource option would be used to meet those service needs. The MPUC’s findings of fact and conclusions regarding resource plans shall be considered prima facie evidence, subject to rebuttal, in Certificate of Need (CON) hearings, rate reviews and other proceedings. Typically, the filings are submitted every two years.
In the MPUC order approving the 2011-2025 IRP in February 2012, OTP was required to submit a base-load diversification study specifically focused on evaluating retirement and repower options for the Hoot Lake Plant. In an order dated March 25, 2013 the MPUC approved OTP’s recommendations that Hoot Lake Plant add pollution-control equipment at a cost of approximately $10.0 million to comply with U.S. Environmental Protection Agency’s (EPA) mercury and air toxics standards by 2015 and discontinue burning coal in 2020.
On December 2, 2013 OTP filed its 2014-2028 IRP with the MPUC. Copies of the 2014-2028 IRP were provided to both the NDPSC and SDPUC. Approximately 65% of the resource options called for by the 2014-2028 IRP are comprised of existing resources and wholesale energy purchases similar to existing levels. The remaining 35% is comprised of the following components: 65% natural gas simple cycle combustion turbines and 35% conservation and demand response. Capacity additions proposed in the 2014-2028 IRP are as follows:
| |
| Resource | Proposed Megawatts |
| Natural gas | 194 |
| Demand Response/Conservation | 106 |
OTP expects a MPUC order on its 2014-2028 IRP filing during the second quarter of 2014.
Renewable Energy Standards, Conservation, Renewable Resource Riders—Minnesota law favors conservation over the addition of new resources. In addition, Minnesota law requires the use of renewable resources where new supplies are needed, unless the utility proves that a renewable energy facility is not in the public interest. An existing environmental externality law requires the MPUC, to the extent practicable, to quantify the environmental costs associated with each method of electricity generation, and to use such monetized values in evaluating generation resources. The MPUC must disallow any nonrenewable rate base additions (whether within or outside of the state) or any related rate recovery, and may not approve any nonrenewable energy facility in an integrated resource plan, unless the utility proves that a renewable energy facility is not in the public interest. The state has prioritized the acceptability of new generation with wind and solar ranked first and coal and nuclear ranked fifth, the lowest ranking. The MPUC’s current estimate of the range of costs of future CO2 regulation to be used in modeling analyses for resource plans is $9 to $34/ton of CO2 commencing in 2017. The MPUC is required to annually update these estimates.
Minnesota has a renewable energy standard which requires OTP to generate or procure sufficient renewable generation such that the following percentages of total retail electric sales to Minnesota customers come from qualifying renewable sources: 17% by 2016; 20% by 2020 and 25% by 2025. In addition, a new standard established by the 2013 legislature requires 1.5% of total electric sales to be supplied by solar energy by the year 2020. OTP is currently evaluating the new legislation and potential options for meeting that standard. Under certain circumstances and after consideration of costs and reliability issues, the MPUC may modify or delay implementation of the standards. OTP has acquired renewable resources and expects to acquire additional renewable resources in order to maintain compliance with the Minnesota renewable energy standard. OTP’s compliance with the Minnesota renewable energy standard will be measured through the Midwest Renewable Energy Tracking System.
Under the Next Generation Energy Act of 2007, an automatic adjustment mechanism was established to allow Minnesota electric utilities to recover investments and costs incurred to satisfy the requirements of the renewable energy standard. The MPUC is authorized to approve a rate schedule rider to enable utilities to recover the costs of qualifying renewable energy projects that supply renewable energy to Minnesota customers. Cost recovery for qualifying renewable energy projects can be authorized outside of a rate case proceeding, provided that such renewable projects have received previous MPUC approval. Renewable resource costs eligible for recovery may include return on investment, depreciation, operation and maintenance costs, taxes, renewable energy delivery costs and other related expenses.
The costs for three major wind farms previously approved by the MPUC for recovery through OTP’s Minnesota Renewable Resource Adjustment (MNRRA) were moved to base rates as of October 1, 2011 under the MPUC’s April 25, 2011 general rate case order with the exception of the remaining balance of the MNRRA regulatory asset. A request for an updated rate to be effective October 1, 2012 was initially filed on June 28, 2012, followed by a revised filing on July 25, 2012. Because the request to extend the period of the new rate for 18 months was still under review, a supplemental filing was submitted on February 15, 2013, requesting that the current rate be retained until a majority of the remaining costs were recovered and that the MNRRA rate be set to zero effective May 1, 2013. The MPUC approved the February 15, 2013 request on April 4, 2013 and authorized that any unrecovered balance be retained as a regulatory asset to be recovered in OTP’s next general rate case. Effective May 1, 2013 the resource adjustment on OTP’s Minnesota customers’ bills no longer includes MNRRA costs.
Transmission Cost Recovery (TCR) Rider—In addition to the MNRRA rider, the Minnesota Public Utilities Act provides a similar mechanism for automatic adjustment outside of a general rate proceeding to recover the costs of new transmission facilities that have been previously approved by the MPUC in a CON proceeding, certified by the MPUC as a Minnesota priority transmission project, made to transmit the electricity generated from renewable generation sources ultimately used to provide service areas. A decreaseto the utility’s retail customers, or exempt from the requirement to obtain a Minnesota CON. The MPUC may also authorize cost recovery via such TCR riders for charges incurred by a utility under a federally approved tariff that accrue from other transmission owners’ regionally planned transmission projects that have been determined by the MISO to benefit the utility or integrated transmission system. The 2013 legislature passed legislation that also authorizes TCR riders to recover the costs of new transmission facilities approved by the regulatory commission of the state in which the new transmission facilities are to be constructed to the extent approval is required by the laws of that state and determined by the MISO to benefit the utility or integrated transmission system. Such TCR riders allow a return on investment at the level approved in a utility’s last general rate case. Additionally, following approval of the rate schedule, the MPUC may approve annual rate adjustments filed pursuant to the rate schedule. OTP’s initial request for approval of a TCR rider was granted by the MPUC on January 7, 2010, and became effective February 1, 2010.
OTP requested recovery of its transmission investments being recovered through its Minnesota TCR rider rate as part of its general rate case filed on April 2, 2010. In its April 25, 2011 general rate case order, the MPUC approved the transfer of transmission costs then being recovered through OTP’s Minnesota TCR rider to recovery in base rates. Final rates went into effect on October 1, 2011. OTP continues to utilize the TCR rider cost recovery mechanism to recover the remaining balance of current transmission projects and to recover costs associated with new transmission projects determined eligible for TCR rider recovery by the MPUC.
OTP filed a request for an update to its Minnesota TCR rider on October 5, 2010. In this TCR rider update, the MPUC addressed how to handle utility investments in transmission facilities that qualify for regional cost allocation under the MISO Open Access Transmission, Energy and Operating Reserve Markets Tariff (MISO Tariff). MISO regional cost allocation allows OTP to recover some of the costs of its transmission investment from the other MISO utilities. On March 26, 2012 the MPUC approved the update to OTP’s Minnesota TCR rider along with an all-in method for MISO regional cost allocations in which OTP’s retail customers would be responsible for the entire investment OTP made with an offsetting credit for revenues received from other MISO utilities under the MISO Tariff for projects included in the TCR. OTP’s updated Minnesota TCR rider went into effect April 1, 2012.
On May 24, 2012 OTP filed a petition with the MPUC to seek a determination of eligibility for the inclusion of twelve additional transmission related projects in subsequent Minnesota TCR rider filings. On February 20, 2013 the MPUC approved three of the additional projects as eligible for recovery through the TCR rider. OTP filed its annual update to the TCR rider on February 7, 2013 to include the three new projects as well as updated costs associated with existing projects. On January 30, 2014 the MPUC approved OTP’s 2013 TCR rider update but disallowed TCR rider recovery of capitalized internal labor costs and costs in excess of CON estimates. These costs will be removed from OTP’s Minnesota TCR rider effective as of the date of the MPUC’s order. OTP will be allowed to seek recovery of these costs in a future rate case.
Big Stone Air Quality Control System (AQCS)—Minnesota law authorizes a public utility to petition the MPUC for an Advance Determination of Prudence (ADP) for a project undertaken to comply with federal or state air quality standards of states in which the utility’s electric generation facilities are located if the project has an increaseexpected jurisdictional cost to Minnesota ratepayers of at least $10 million. On January 14, 2011 OTP filed a petition asking the MPUC for ADP for costs associated with the design, construction and operation of the Best-Available Retrofit Technology (BART) compliant air quality control system at Big Stone Plant attributable to serving OTP’s Minnesota customers. The MPUC granted OTP’s petition for ADP for the AQCS in expenses relateda written order issued on January 23, 2012. OTP’s share of the costs for the Big Stone Plant AQCS is expected to ourbe $218 million.
On May 24, 2013 legislation was enacted in Minnesota which allowed OTP to file for an emission-reduction rider for recovery of the revenue requirements of the AQCS. The legislation authorizes the rider to allow a current return on investment (including Construction Work in Progress (CWIP)) at the level approved in OTP’s most recent general rate case, unless a different return is determined by the MPUC to be in the public interest. On July 31, 2013 OTP filed for a Minnesota Environmental Cost Recovery (ECR) rider with the MPUC for recovery of its Minnesota jurisdictional share of the revenue requirements of its investment in the AQCS under construction at Big Stone Plant. The ECR rider recoverable revenue requirements include a current return on the project’s CWIP balance. The MPUC granted approval of OTP’s Minnesota ECR rider on December 18, 2013 with an effective date of January 1, 2014. The rate will be updated in an annual filing with the MPUC until the costs are rolled into base rates at an undetermined future date.
Big Stone II Project—OTP and a coalition of six other electric operations may reduceproviders filed an application for a CON for the Minnesota portion of the Big Stone II transmission line project on October 3, 2005 and filed an application for a Route Permit for the Minnesota portion of the Big Stone II transmission line project with the MPUC on December 9, 2005. On January 15, 2009 the MPUC approved a motion to grant the CON and Route Permit for the Minnesota portion of the Big Stone II transmission line project.
The MPUC granted the CON subject to a number of additional conditions, including but not limited to: (1) fulfilling various requirements relating to renewable energy goals, energy efficiency, community-based energy development projects and emissions reduction; (2) that the generation plant be built as a “carbon capture retrofit ready” facility; (3) that the applicants report to the MPUC on the feasibility of building the plant using ultra-supercritical technology; and (4) that the applicants achieve specific limits on construction costs at $3,000/kW and CO2 costs at $26/ton.
The CON and Route Permit, required by state law, would have allowed the Big Stone II utilities to construct and upgrade 112 miles of electric transmission lines in western Minnesota for delivery of power from the Big Stone site and from numerous other planned generation projects, most of which are wind energy.
Following OTP’s September 11, 2009 withdrawal from the Big Stone II project and the remaining Big Stone II participants’ November 2, 2009 cancellation of the project, the suitability of the route permits and easements obtained by OTP as a MISO transmission owner for other interconnection customers backfilling through the MISO interconnection process into the Big Stone area continued to be evaluated. OTP requested recovery of the Minnesota portion of its Big Stone II development costs over a five-year period as part of its general rate case filed in Minnesota on April 2, 2010. In a written order issued on April 25, 2011, the MPUC authorized recovery of the Minnesota portion of Big Stone II generation development costs from Minnesota ratepayers over a 60-month recovery period which began on October 1, 2011. The amount of funds available for our existing and future businesses, which could resultBig Stone II generation costs incurred by OTP that were deemed recoverable from Minnesota ratepayers as part of rates established in increased financing requirements, impair our ability to make expected distributions to shareholders or impair our ability to make scheduled payments on our debt obligations, or to meet covenants under our borrowing agreements.that proceeding was $3.2 million (which excluded $3.2 million of transmission-related project costs).
Actions byApproximately $0.4 million of the regulatorstotal Minnesota jurisdictional share of ourBig Stone II transmission costs were transferred to the Big Stone South - Brookings Multi-Value Project (MVP) in the first quarter of 2013. The remaining costs, along with accumulated AFUDC, were transferred from CWIP to the Big Stone II Unrecovered Project Costs – Minnesota regulatory asset account in May 2013, based on recovery granted in the April 25, 2011 order. The recoverable amount of approximately $3.5 million is expected to be recovered over an anticipated 89-month recovery period which began in May 2013.
Capacity Expansion 2020 (CapX2020)—CapX2020 is a joint initiative of eleven investor-owned, cooperative, and municipal utilities in Minnesota and the surrounding region to upgrade and expand the electric operations could result in rate reductions, lower revenuestransmission grid to ensure continued reliable and earnings or delays in recovering capital expenditures.
We are subject to federalaffordable service. The CapX2020 companies identified four major transmission projects for the region: (1) the Fargo–Monticello 345 kV Project (the Fargo Project), (2) the Brookings–Southeast Twin Cities 345 kV Project (the Brookings Project), (3) the Bemidji – Grand Rapids 230 kV Project (the Bemidji Project), and state legislation, government regulations and regulatory actions that may have a negative impact on our business and results of operations. The electric rates that(4) the Twin Cities–LaCrosse 345 kV Project. OTP is allowed to charge for its electric services are onean investor in the Fargo Project, the Brookings Project and the Bemidji Project. Recovery of OTP’s CapX2020 transmission investments will be through the most important items influencing our financial position, results of operationsMISO Tariff (the Brookings Project as an MVP) and liquidity. The rates that OTP charges its electric customers are subject to review and determination by state public utility commissions in Minnesota, North Dakota and South Dakota.Dakota TCR Riders.
The Fargo Project—All major permits have been received from state regulatory bodies and project agreements have been signed for the construction of the Fargo Project. The Monticello to St. Cloud portion of the Fargo Project was placed into service on December 21, 2011. Construction is underway for the remaining portions of the project with completion scheduled for second quarter 2015. OTP’s share of the costs for the St. Cloud to Fargo portion of the Fargo Project is expected to be $84.4 million.
The Brookings Project—All major permits have been received from state regulatory bodies and project agreements have been signed for the construction of the Brookings Project. The MISO granted unconditional approval of the Brookings Project as an MVP under the MISO Tariff in December 2011. This project is anticipated to be completed in the first quarter of 2015. OTP’s share of the costs for the Brookings Project is expected to be $26.5 million.
The Bemidji Project—The Bemidji-Grand Rapids transmission line was fully energized and put in service on September 17, 2012.
Capital Structure Petition—Minnesota law requires an annual filing of a capital structure petition with the MPUC. In this filing the MPUC reviews and approves the capital structure for OTP. Once the petition is approved, OTP may issue securities without further petition or approval, provided the issuance is consistent with the purposes and amounts set forth in the approved capital structure petition. The MPUC approved OTP’s capital structure petition on June 20, 2013, which is in effect until the MPUC issues a new capital structure order for 2014. OTP is also regulatedrequired to file its 2014 capital structure petition by May 2014.
North Dakota
OTP is subject to the jurisdiction of the NDPSC with respect to rates, services, certain issuances of securities, construction of major utility facilities and other matters. The NDPSC periodically performs audits of gas and electric utilities over which it has rate setting jurisdiction to determine the reasonableness of overall rate levels. In the past, these audits have occasionally resulted in settlement agreements adjusting rate levels for OTP.
The North Dakota Energy Conversion and Transmission Facility Siting Act grants the NDPSC the authority to approve sites in North Dakota for large electric generating facilities and high voltage transmission lines. This Act is similar to the Minnesota Power Plant Siting Act described above and applies to proposed wind energy electric power generating plants exceeding 500 kW of electricity, non-wind energy electric power generating plants exceeding 50,000 kW and transmission lines with a design in excess of 115 kV. OTP is required to submit a ten-year plan to the NDPSC annually.
The NDPSC reserves the right to review the issuance of stocks, bonds, notes and other evidence of indebtedness of a public utility. However, the issuance by a public utility of securities registered with the SEC is expressly exempted from review by the FERC. An adverse decisionNDPSC under North Dakota state law.
General Rates—OTP’s most recent general rate increase in North Dakota of $3.6 million, or approximately 3.0%, was granted by one or more regulatory commissions concerning the level or methodNDPSC in an order issued on November 25, 2009 and effective December 2009.
Renewable Resource Adjustment—OTP has a North Dakota Renewable Resource Adjustment (NDRRA) which enables OTP to recover the North Dakota share of determining electric utility rates,its investments in renewable energy facilities it owns in North Dakota. This rider allows OTP to recover costs associated with new renewable energy projects as they are completed. OTP’s 2010 NDRRA was in place from September 1, 2010 through March 31, 2012 with a recovery of $15.6 million. On March 21, 2012 the authorized returns on equity, implementationNDPSC approved an update to OTP’s NDRRA effective April 1, 2012. The updated NDRRA recovered $9.9 million over the period April 1, 2012 through March 31, 2013. On December 28, 2012 OTP submitted its annual update to the NDRRA with a proposed effective date of enforceable federal reliability standards or other regulatory matters, permitted business activities (such as ownership or operation of nonelectric businesses) or any prolonged delay in rendering a decisionApril 1, 2013. The update resulted in a rate or other proceeding (including with respectreduction, so the NDPSC did not issue an order suspending the rate change. Consequently, pursuant to statute, OTP was allowed to implement updated rates effective April 1, 2013 and, on July 10, 2013, the NDPSC approved the rate implemented on April 1, 2013. OTP submitted its annual update to the NDRRA on December 31, 2013 with a proposed April 1, 2014 effective date.
Transmission Cost Recovery Rider— North Dakota law provides a mechanism for automatic adjustment outside of a general rate proceeding to recover jurisdictional capital and operating costs incurred by a public utility for new or modified electric transmission facilities. On April 29, 2011 OTP filed a request for an initial North Dakota TCR rider with the NDPSC, which was approved on April 25, 2012 and effective May 1, 2012. On August 31, 2012 OTP filed its annual update to the North Dakota TCR rider rate to reflect updated cost information associated with projects currently in the rider, as well as proposing to include costs associated with ten additional projects for recovery within the rider. The NDPSC approved the annual update on December 12, 2012 with an effective date of January 1, 2013. On August 30, 2013 OTP filed its annual update to its North Dakota TCR rider rate, which was approved on December 30, 2013 and became effective January 1, 2014.
Environmental Cost Recovery Rider—On May 9, 2012 the NDPSC approved OTP’s application for an ADP related to the Big Stone Plant AQCS. On February 8, 2013, OTP filed a request with the NDPSC for an ECR rider to recover OTP’s North Dakota jurisdictional share of carrying costs associated with its investment in the Big Stone Plant AQCS. On December 18, 2013 the NDPSC approved OTP’s North Dakota ECR rider based on revenue requirements through the 2013 calendar year and thereafter, with rates effective for bills rendered on and after January 1, 2014. OTP recorded a regulatory asset of $2.3 million for amounts eligible for recovery through the North Dakota ECR rider that had not been billed to North Dakota customers as of December 31, 2013. The rate will be updated at least annually in a filing with the NDPSC until the project costs are rolled into base rates at an undetermined future date.
Big Stone II Project—On August 27, 2008, the NDPSC determined that OTP’s participation in Big Stone II was prudent in a range of 121.8 to 130 MW. On January 20, 2010, OTP filed a request with the NDPSC for a determination that continuing with the Big Stone II project would not have been prudent.
In an order issued June 25, 2010, the NDPSC authorized recovery of capital expendituresBig Stone II development costs from North Dakota ratepayers, pursuant to a final settlement agreement filed June 23, 2010, between the NDPSC advocacy staff, OTP and the North Dakota Large Industrial Energy Group, as interveners. The terms of the settlement agreement indicate that OTP’s discontinuation of participation in rates) could resultthe project was prudent and OTP should be authorized to recover the portion of costs it incurred related to the Big Stone II generation project. The total amount of Big Stone II generation costs incurred by OTP (which excluded $2.6 million of project transmission-related costs) was determined to be $10.1 million, of which $4.1 million represents North Dakota’s jurisdictional share. The North Dakota portion of Big Stone II generation costs is being recovered over a 36-month period which began on August 1, 2010.
The North Dakota jurisdictional share of Big Stone II costs incurred by OTP related to transmission was $1.1 million. Approximately $0.3 million of the total North Dakota jurisdictional share of Big Stone II transmission costs were transferred to the Big Stone South - Brookings MVP during the first quarter of 2013. On July 30, 2013 the NDPSC approved OTP’s request to continue the Big Stone II cost recovery rates for an additional eight months through March 31, 2014 to recover the remaining North Dakota share of Big Stone II transmission-related costs plus accrued AFUDC totaling $1.0 million.
CapX2020 Request for Advance Determination of Prudence—On October 5, 2009 OTP filed an application for an ADP with the NDPSC for its proposed participation in lower revenuesthree of the four Group 1 projects: the Fargo Project, the Brookings Project and net income.
Dependingthe Bemidji Project. An administrative law judge conducted an evidentiary hearing on the outcomeapplication in May 2010. On October 6, 2010 the NDPSC adopted an order approving a settlement between OTP and intervener NDPSC advocacy staff, and issued an ADP to OTP for participation in the three Group 1 projects. The order is subject to a number of terms and conditions in addition to the challenges atsettlement agreement, including the 7th Circuit U.S. Courtprovision of Appeals,additional information on the eventual resolution of cost allocation issues relevant to the Brookings Project and its associated impact on North Dakota. On April 29, 2011, OTP could be required to absorbfiled its compliance filing with the NDPSC, seeking a disproportionate sharedetermination of costscontinued prudence for transmission investments ifOTP’s investment in the Brookings Project. The NDPSC approved the request for an ADP for the Brookings Project on November 10, 2011 conditioned on the MISO MVP cost allocation changes. These costs may not be recoverable through a transmission tariff and could resultremaining materially unchanged. The MISO granted unconditional approval of the Brookings Project as an MVP under the MISO Tariff in reduced returns on invested capital and/or increased rates to OTP’s retail electric customers.December 2011.
CapX2020 - Fargo Project—All major permits have been received from state regulatory bodies and project agreements have been signed for the construction of the Fargo Project.
South Dakota
Under the South Dakota Public Utilities Act, OTP is subject to the jurisdiction of the SDPUC with respect to rates, public utility services, construction of major utility facilities, establishment of assigned service areas and other matters. Under the South Dakota Energy Facility Permit Act, the SDPUC has the authority to approve sites in South Dakota for large energy conversion facilities (100,000 kW or more) and transmission lines with a design of 115 kV or more.
2010 General Rate Case—On April 21, 2011, the SDPUC issued a written order approving an overall revenue increase for OTP of approximately $643,000 (2.32%) and an overall rate of return on rate base of 8.50%. Final rates were effective with bills rendered on and after June 1, 2011.
Transmission Cost Recovery Rider— South Dakota law provides a mechanism for automatic adjustment outside of a general rate proceeding to recover jurisdictional capital and operating costs incurred by a public utility for new or modified electric transmission facilities. OTP submitted a request for an initial South Dakota TCR rider to the SDPUC on November 5, 2010. The South Dakota TCR was approved by the SDPUC and implemented on December 1, 2011. On September 4, 2012 OTP filed its annual update to the South Dakota TCR rider. Updated rates, approved on April 23, 2013, went into effect on May 1, 2013. OTP filed its annual update to the South Dakota TCR rider on August 30, 2013 with a supplemental filing in February 2014 with a proposed implementation date of March 1, 2014.
Big Stone II Project— OTP requested recovery of the South Dakota portion of its Big Stone II development costs over a five-year period as part of its general rate case filed in South Dakota on August 20, 2010. In the first quarter of 2011, the SDPUC approved recovery of the South Dakota portion of Big Stone II generation development costs totaling approximately $1.0 million from South Dakota ratepayers over a ten-year period beginning in February 2011 with the implementation of interim rates. OTP is allowed to earn a return on the amount subject to recovery over the ten-year recovery period. OTP transferred the South Dakota portion of the remaining Big Stone II transmission costs to CWIP, with such costs subject to AFUDC and recovery in future FERC-approved MISO rates or retail rates. On July 31, 2012 the SDPUC approved the transfer of the Big Stone II transmission route permits to OTP.
A portion of the Big Stone II transmission costs were transferred out of CWIP in February 2013 to be included within the Big Stone South - Brookings MVP. On March 28, 2013, OTP filed a petition with the SDPUC requesting deferred accounting for the remaining unrecovered Big Stone II Transmission costs until OTP’s electric generating facilitiesnext South Dakota general rate case. The petition was approved by the SDPUC on April 23, 2013 and in May 2013 OTP transferred the remaining South Dakota jurisdictional portion of unrecovered Big Stone II transmission costs plus accumulated AFUDC totaling $0.2 million from CWIP to the Big Stone II Unrecovered Project Costs – South Dakota long-term regulatory asset account.
Big Stone Plant AQCS—On March 30, 2012 OTP requested approval from the SDPUC for an ECR Rider to recover costs associated with the Big Stone Plant AQCS. On April 17, 2013 OTP filed a request to either suspend or withdraw this filing. The SDPUC approved withdrawing this filing on April 23, 2013. Instead of receiving rider recovery on the portion of AQCS construction costs assignable to OTP’s South Dakota customers while the project is under construction, OTP will accrue an AFUDC on these costs and request recovery of, and a return on, the accumulated costs, including AFUDC, in a future rate filing in South Dakota.
CapX2020 Brookings–Southeast Twin Cities 345 kV Project—All major permits have been received from state regulatory bodies and project agreements have been signed for the construction of this project. The MISO granted unconditional approval of the Brookings Project as an MVP under the MISO Tariff in December 2011. This project is anticipated to be completed in the first quarter of 2015.
Energy Efficiency Plan (EEP)—The SDPUC has encouraged all investor-owned utilities in South Dakota to be part of an Energy Efficiency Partnership to significantly reduce energy use. The plan is being implemented with program costs, carrying costs and a financial incentive being recovered through an approved rider.
On June 16, 2010 OTP filed a request with the SDPUC for approval of updates to OTP’s 2010 South Dakota EEP and approval for the continuation of the program in 2011. OTP requested increases in energy and demand savings goals and increases in related financial incentives for both 2010 and the requested 2011 program. In an order issued on July 27, 2010 the SDPUC approved OTP’s request for updated energy, demand and participation goals for continuation of the EEP into 2011. OTP is operating under its 2010 South Dakota EEP, as updated.
On May 25, 2011 OTP filed a request with the SDPUC for approval of updates to its EEP. The SDPUC approved the 2012-2013 updated EEP with a maximum available incentive payment limited to 30% of the budget amount provided in the EEP, or $84,000. On June 19, 2012, the SDPUC approved OTP’s request for a 2011 financial incentive of $78,900 along with an increased surcharge adjustment that became effective on July 1, 2012. On June 18, 2013 the SDPUC approved OTP’s request for a 2012 financial incentive of $84,000 along with an increased surcharge adjustment that became effective July 1, 2013. On November 5, 2013, the SDPUC approved OTP’s EEP updates for 2014-2015. On December 3, 2013, the SDPUC voted to amend the approval previously given and require OTP to come before the Commission if the overall plan budget would exceed 10%, rather than the previously approved 30%.
FERC
Wholesale power sales and transmission rates are subject to operational risks that could result in unscheduled plant outages, unanticipated operationthe jurisdiction of the FERC under the Federal Power Act of 1935, as amended. The FERC is an independent agency with jurisdiction over rates for wholesale electricity sales, transmission and maintenance expenses and increased power purchase costs.
Operationsale of electric energy in interstate commerce, interconnection of facilities, and accounting policies and practices. Filed rates are effective after a one day suspension period, subject to ultimate approval by the FERC.
Effective January 1, 2010 the FERC authorized OTP’s implementation of a forward looking formula transmission rate under the MISO Tariff. OTP was also authorized by the FERC to recover in its formula rate (1) 100% of prudently incurred CWIP in rate base and (2) 100% of prudently incurred costs of transmission facilities that are cancelled or abandoned for reasons beyond OTP’s control (Abandoned Plant Recovery), as determined by the FERC subsequent to abandonment, specifically for three regional transmission CapX2020 projects in which OTP is investing: the Fargo Project, the Bemidji Project and the Brookings Project.
On December 16, 2010 the FERC approved the cost allocation for a new classification of projects in MISO called MVPs. MVPs are designed to enable the region to comply with energy policy mandates and to address reliability and economic issues affecting multiple transmission zones within the MISO region. The cost allocation is designed to ensure that the costs of transmission projects with regional benefits are properly assigned to those who benefit. On October 20, 2011 the FERC reaffirmed the MVP cost allocation on rehearing. On June 7, 2013, in response to a challenge to the MVP cost allocation heard before the United States Court of Appeals, Seventh Circuit, the Court ruled in favor of MISO and MISO transmission owners, issuing an order affirming the FERC’s approval of the MVP cost allocation. On October 7, 2013 certain parties submitted a petition for writ of certiorari to the U.S. Supreme Court seeking review of the Seventh Circuit decision. As of February 14, 2014 the U.S. Supreme Court had not acted on the petition.
On November 12, 2013, a group of industrial customers and other stakeholders filed a complaint at the FERC seeking to reduce the return on equity component of the transmission rates that MISO transmission owners, including OTP, may collect under the MISO Tariff. The complainants are seeking to reduce the current 12.38% return on equity used in MISO’s transmission rates to a proposed 9.15%. MISO and a group of MISO transmission owners have filed responses to the complaint seeking its dismissal and defending the current return on equity. The complaint is pending at the FERC.
Effective on January 1, 2012 the FERC authorized OTP to recover 100% CWIP and Abandoned Plant Recovery on two projects approved by MISO as MVPs in MISO’s 2011 Transmission Expansion Plan: the Big Stone South–Brookings MVP and the Big Stone South-Ellendale MVP.
The Big Stone South – Brookings Project—This planned 345 kV transmission line will extend 70 miles between a proposed substation near Big Stone City, South Dakota and the new Brookings County Substation near Brookings, South Dakota. OTP is jointly developing this project with Xcel Energy. MISO approved this project as an MVP under the MISO Tariff in December 2011. A Notice of Intent to Construct Facilities (NICF) was filed with the SDPUC on February 29, 2012. A portion of this line is anticipated to use previously obtained Big Stone II transmission route permits and easements and is expected to be in service in 2017. On July 31, 2012 the SDPUC approved the transfer of the Big Stone II transmission route permits to OTP. In December 2012, a request was filed with the SDPUC for recertification of a portion of the line route that was approved as part of the Big Stone II transmission development. The SDPUC approved the certification for the northern portion of the route on April 9, 2013. OTP and Xcel Energy jointly submitted an application to the SDPUC for a route permit for the southern portion of the Big Stone South to Brookings line on June 3, 2013. A decision on the permit application for the southern half of this route is expected in the first quarter of 2014. If the proposed project receives all the necessary approvals, OTP anticipates the line will be completed in 2017. OTP’s total capital investment in this project is expected to be approximately $109 million.
The Big Stone South – Ellendale Project—This transmission line is a proposed 345 kV line that will extend 160 to 170 miles between a proposed substation near Big Stone City, South Dakota and a proposed substation near Ellendale, North Dakota. OTP is jointly developing this project with Montana-Dakota Utilities Co., a Division of MDU Resources Group, Inc. (MDU). MISO approved this project as an MVP under the MISO Tariff in December 2011. OTP and MDU jointly filed an NICF with the SDPUC in March of 2012. On August 25, 2013 the NDPSC granted Certificates of Public Convenience and Necessity to OTP and MDU for the ten miles of the proposed line to be built in North Dakota. A joint route permit application was filed by OTP and MDU on August 23, 2013 with the SDPUC. OTP and MDU jointly filed an Application for a Certificate of Corridor Compatibility along with an application for a route permit with the NDPSC on October 18, 2013. If the proposed project receives all the necessary approvals, OTP anticipates the line will be completed in 2019. OTP’s total capital investment in this project is expected to be approximately $184 million.
CapX2020 Brookings Project—In June 2011 the MISO board of directors granted conditional approval of the MVP cost allocation designation under the MISO Tariff for the Brookings Project, and the project was granted unconditional approval in December 2011 as an MVP. This project is anticipated to be completed in the first quarter of 2015.
NAEMA
OTP is a member of the North American Energy Marketers Association (NAEMA) which is an independent, non-profit trade association representing entities involved in the marketing of energy or in providing services to the energy industry. NAEMA has over 130 members with operations in 48 states and Canada. NAEMA was formed as a successor organization of the Power and Energy Market (PEM) of the Mid-Continent Area Power Pool (MAPP) in recognition that PEM had outgrown the MAPP region. Power pool sales are conducted continuously through NAEMA in accordance with schedules filed by NAEMA with the FERC.
MRO
OTP is a member of the Midwest Reliability Organization (MRO). The MRO is a non-profit organization dedicated to ensuring the reliability and security of the bulk power system in the north central region of North America, including parts of both the United States and Canada. MRO began operations in 2005 and is one of eight regional entities in North America operating under authority from regulators in the United States and Canada through a delegation agreement with the North American Electric Reliability Corporation. The MRO is responsible for: (1) developing and implementing reliability standards, (2) enforcing compliance with those standards, (3) providing seasonal and long-term assessments of the bulk power system’s ability to meet demand for electricity, and (4) providing an appeals and dispute resolution process.
The MRO region covers roughly one million square miles spanning the provinces of Saskatchewan and Manitoba, the states of North Dakota, Minnesota, Nebraska and the majority of the territory in the states of South Dakota, Iowa and Wisconsin. The region includes more than 100 organizations that are involved in the production and delivery of power to more than 20 million people. These organizations include municipal utilities, cooperatives, investor-owned utilities, a federal power marketing agency, Canadian Crown Corporations, independent power producers and others who have interests in the reliability of the bulk power system. MRO assumed the reliability functions of the MAPP and Mid-America Interconnected Network, both former voluntary regional reliability councils.
MISO
OTP is a member of the MISO. As the transmission provider and security coordinator for the region, the MISO seeks to optimize the efficiency of the interconnected system, provide regional solutions to regional planning needs and minimize risk to reliability through its security coordination, long-term regional planning, market monitoring, scheduling and tariff administration functions. The MISO covers a broad region containing all or parts of 15 states and the Canadian province of Manitoba. The MISO has operational control of OTP’s transmission facilities above 100 kV, but OTP continues to own and maintain its transmission assets.
The MISO Energy Markets commenced operation on April 1, 2005. Through its Energy Markets, MISO seeks to develop options for energy supply, increase utilization of transmission assets, optimize the use of energy resources across a wider region and provide greater visibility of data. MISO aims to facilitate a more cost-effective and efficient use of the wholesale bulk electric system.
The MISO Ancillary Services Market (ASM) commenced on January 6, 2009. The ASM facilitates the provision of Regulation, Spinning Reserve and Supplemental Reserves. The ASM integrates the procurement and use of regulation and contingency reserves with the existing Energy Market. OTP has actively participated in the market since its commencement.
Other
OTP is subject to various federal laws, including the Public Utility Regulatory Policies Act and the Energy Policy Act of 1992 (which are intended to promote the conservation of energy and the development and use of alternative energy sources) and the Energy Policy Act of 2005.
Competition, Deregulation and Legislation
Electric sales are subject to competition in some areas from municipally owned systems, rural electric cooperatives and, in certain respects, from on-site generators and cogenerators. Electricity also competes with other forms of energy. The degree of competition may vary from time to time depending on relative costs and supplies of other forms of energy.
The Company believes OTP is well positioned to be successful in a competitive environment. A comparison of OTP’s electric retail rates to the rates of other investor-owned utilities, cooperatives and municipals in the states OTP serves indicates OTP’s rates are competitive.
Legislative and regulatory activity could affect operations in the future. OTP cannot predict the timing or substance of any future legislation or regulation. The Company does not expect retail competition to come to the states of Minnesota, North Dakota or South Dakota in the foreseeable future. There has been no legislative action regarding electric retail choice in any of the states where OTP operates. The Minnesota legislature has in the past considered legislation that, if passed, would have limited the Company’s ability to maintain and grow its nonelectric businesses.
OTP is unable to predict the impact on its operations resulting from future regulatory activities, from future legislation or from future taxes that may be imposed on the source or use of energy.
Environmental Regulation
Impact of Environmental Laws —OTP’s existing generating facilities involves risksplants are subject to stringent federal and state standards and regulations regarding, among other things, air, water and solid waste pollution. In the five years ended December 31, 2013 OTP invested approximately $103.2 million in environmental control facilities. The 2014 and 2015 construction budgets include approximately $82 million and $61 million, respectively, for environmental equipment for existing facilities.
Air Quality - Criteria Pollutants —Pursuant to the federal Clean Air Act (the CAA), the EPA has promulgated national primary and secondary standards for certain air pollutants.
The primary fuels burned by OTP’s steam generating plants are North Dakota lignite coal and western subbituminous coal. Electrostatic precipitators have been installed at the principal units at the Hoot Lake Plant. Hoot Lake Plant Unit 1, which can adversely affect energy outputis the smallest of the three coal-fired units at Hoot Lake Plant, was retired as of December 31, 2005. As a result, OTP believes the units at the Hoot Lake Plant currently meet all presently applicable federal and efficiency levels. Moststate air quality and emission standards.
The South Dakota Department of Environment and Natural Resources (DENR) issued a Title V Operating Permit to the Big Stone site on June 9, 2009 allowing for operation of Big Stone Plant. The Big Stone Plant continues to operate under Title V permit provisions. The Big Stone Plant is currently operating within all presently applicable federal and state air quality and emission standards.
The Coyote Station is equipped with sulfur dioxide (SO2) removal equipment. The removal equipment—referred to as a dry scrubber—consists of a spray dryer, followed by a fabric filter, and is designed to desulfurize hot gases from the stack. The fabric filter collects spray dryer residue along with the fly ash. The Coyote Station is currently operating within all presently applicable federal and state air quality and emission standards.
The CAA, in addressing acid deposition, imposed requirements on power plants in an effort to reduce national emissions of SO2 and nitrogen oxides (NOx).
The national SO2 emission reduction goals are achieved through a market based system under which power plants are allocated “emissions allowances” that require plants to either reduce their SO2 emissions or acquire allowances from others to achieve compliance. Each allowance is an authorization to emit one ton of SO2. SO2 emission requirements are currently being met by all of OTP’s generating capacity is coal-fired. OTP reliesfacilities without the need to acquire other allowances for compliance with the acid deposition provisions of the CAA.
The national NOx emission reduction goals are achieved by imposing mandatory emissions standards on individual sources. All of OTP’s generating facilities met the NOx standards during 2013.
The EPA Administrator signed the Clean Air Interstate Rule (CAIR) on March 10, 2005. The EPA has concluded that SO2 and NOx are the chief emissions contributing to interstate transport of particulate matter less than 2.5 microns (PM2.5). The EPA also concluded that NOx emissions are the chief emissions contributing to ozone nonattainment. Twenty-three states and the District of Columbia were found to contribute to ambient air quality PM2.5 nonattainment in downwind states. On that basis, the EPA proposed to cap SO2 and NOx emissions in the designated states. Minnesota was included among the twenty-three states subject to emissions caps; North Dakota and South Dakota were not included. Twenty-five states were found to contribute to downwind 8-hour ozone nonattainment. None of the states in OTP’s service territory were slated for NOx reduction for 8-hour ozone nonattainment purposes. On July 11, 2008, the U.S. Court of Appeals for the D.C. Circuit vacated CAIR and the CAIR federal implementation plan in its entirety.
On December 23, 2008, the court reconsidered its order vacating CAIR, instead remanding the rule to the EPA to conduct further proceedings consistent with the court’s prior opinion invalidating CAIR. On January 16, 2009, the EPA proposed a limitedrule that would stay the effectiveness of CAIR and the CAIR federal implementation plan for sources in Minnesota while the EPA conducted notice-and-comment rulemaking on remand from the D.C. Circuit’s decisions in the litigation on CAIR. Remanding the issue to the EPA for further consideration, the court held that the EPA had not adequately addressed errors alleged by Minnesota Power in the EPA’s analysis supporting inclusion of Minnesota. Neither the EPA nor any other party sought rehearing of this part of the court’s CAIR decision. Public Notice of the final rule staying the implementation of CAIR in Minnesota appeared in the November 3, 2009 Federal Register.
On July 6, 2010, the EPA proposed the Transport Rule that essentially would replace the CAIR, but which (unlike CAIR) proposed to include Minnesota sources due to a finding that Minnesota’s emissions contribute to PM2.5 nonattainment in downwind states. However, its impact on Hoot Lake Plant and OTP’s Solway combustion turbine under the initial proposal would have been less than what had been contemplated under CAIR. The EPA released the final Transport Rule, renamed as the Cross-State Air Pollution Rule (CSAPR), on July 8, 2011. The final rule made several changes as compared to the proposed rule, including a substantial change in the allowance allocation methodology. A number of suppliersstates and industry representatives challenged the rule. On December 30, 2011, the U.S. Court of coal, making it vulnerableAppeals for the D.C. Circuit granted motions to increased pricesstay CSAPR pending the court’s resolution of the petitions for fuel as existing contracts expire orreview. The Court issued an order on August 21, 2012 vacating CSAPR. The order required the EPA to continue administering CAIR pending the promulgation of a valid replacement rule. The United States sought Supreme Court review of the D.C. Circuit’s decision vacating CSAPR, and the Supreme Court granted review. Briefing and oral argument took place in late 2013, and a decision on whether CSAPR will be reinstated is expected before July 2014. In the meantime, because no party sought a stay of the issuance of the mandate in the event of unanticipated interruptionsD.C. Circuit pending Supreme Court review, CSAPR remains invalidated, and regulated parties must continue to abide by CAIR pending a Supreme Court decision. Since CAIR is currently stayed for Minnesota, and does not apply to North or South Dakota, there is no impact to OTP at this time.
Air Quality – Hazardous Air Pollutants—On December 16, 2011 the EPA signed a final rule to reduce mercury and other air toxics emissions from power plants known as the Mercury and Air Toxics Standards (MATS) rule. The final rule became effective on April 16, 2012, and plants will have until April 16, 2015 to comply. However, the EPA is encouraging state permitting authorities to broadly grant a one-year compliance extension to plants that need additional time to install controls. The DENR granted Big Stone Plant a one-year compliance extension in fuel supply. OTPAugust 2013. The EPA is also providing a captive rail shipperpathway for reliability-critical units to obtain an additional year to achieve compliance; however, the EPA has indicated that it believes there will be few, if any situations, in which this pathway is needed. Based on OTP’s review of the BNSF Railwayfinal rule, it appears that OTP’s affected units will meet the requirements by installing the AQCS system at Big Stone, by upgrading the electrostatic precipitators on Hoot Lake Units 2 and 3, by installing activated carbon injection on all units, and by possibly installing dry sorbent injection at Hoot Lake Plant. Emissions monitoring equipment and/or stack testing will also be needed to verify compliance with the standards. Numerous petitions were filed in the United States Court of Appeals for shipmentsthe D.C. Circuit challenging the MATS rule. The matter has been fully briefed and argued, and a decision is expected in the spring of coal2014. Because no stay of the rule was obtained, MATS continues to govern pending resolution of the judicial challenges to the rule.
Air Quality – EPA New Source Review Enforcement Initiative—In 1998 the EPA announced its New Source Review Enforcement Initiative targeting coal-fired utilities, petroleum refineries, pulp and paper mills and other industries for alleged violations of the EPA’s New Source Review rules. These rules require owners or operators that construct new major sources or make major modifications to existing sources to obtain permits and install air pollution control equipment at affected facilities. The EPA is attempting to determine if emission sources violated certain provisions of the CAA by making major modifications to their facilities without installing state-of-the-art pollution controls. On January 2, 2001 OTP received a request from the EPA, pursuant to Section 114(a) of the CAA, to provide certain information relative to past operation and capital construction projects at the Big Stone Plant. OTP responded to that request. In March 2003 the EPA conducted a review of the plant’s outage records as a follow-up to its January 2001 data request. A copy of the designated documents was provided to the EPA on March 21, 2003.
On January 8, 2009, OTP received another request from EPA Regions 5 and 8, pursuant to Section 114(a) of the CAA, to provide certain information relative to past operation and capital construction projects at the Big Stone Plant, Coyote Station and Hoot Lake plants, making it vulnerablePlant. OTP filed timely responses to increased pricesthe EPA’s requests on February 23, 2009 and March 31, 2009. In July 2009, EPA Region 5 issued a follow-up information request with respect to certain maintenance and repair work at the Hoot Lake Plant. OTP responded to the request. The EPA has not set forth any additional follow-up requests at this time. OTP cannot determine what, if any, actions will be taken by the EPA.
Air Quality – Regional Haze Program—The EPA promulgated the Regional Haze Rule in 1999, and on June 15, 2005 the EPA provided final guidelines for coal transportationconducting BART determinations under the rule. The Regional Haze Rule requires emissions reductions from BART-eligible sources that are deemed to contribute to visibility impairment in Class I air quality areas. Big Stone Plant is BART eligible, and the South Dakota DENR determined that the plant is subject to emission reduction requirements based on the modeled contribution of the plant emissions to visibility impairment in downwind Class I air quality areas. Based on the South Dakota DENR’s BART determination and the final South Dakota Regional Haze State Implementation Plan (SIP) approved by the EPA on March 29, 2012, Big Stone must install Selective Catalytic Reduction (SCR) and separated over-fire air to reduce NOx emissions, dry flue gas desulfurization to reduce SO2 emissions, and a sole supplier. Higher fuel prices result in higher electric ratesnew baghouse for particulate matter control. Big Stone Plant must install and operate the BART compliant air quality control system as expeditiously as practicable, but not later than five years after the EPA’s final approval of May 29, 2012. The current project cost is estimated to be approximately $405 million (OTP’s share would be $218 million).
The North Dakota Regional Haze SIP requires that Coyote Station reduce its NOx emissions. On March 14, 2011 the North Dakota Department of Health (NDDOH) issued a construction permit to Coyote Station requiring installation of control equipment to limit its NOx emissions to 0.5 pounds per million Btu as calculated on a 30-day rolling average basis beginning on July 1, 2018. The current estimate of the total cost of the project is $9 million ($3.2 million for OTP’s retail customers through fuel clause adjustmentsshare). On March 1, 2012 the EPA signed a final rule for partial approval of the North Dakota SIP that included the NOx emission rate permit conditions for Coyote Station as proposed by the NDDOH. The rule became effective on May 7, 2012.
In June 2012 the Sierra Club and could make it less competitiveNational Parks Conservation Association (NPCA) filed an appeal of the EPA’s approval of the North Dakota Regional Haze SIP to the U.S. Court of Appeals for the Eight Circuit. On the same day Sierra Club/NPCA also separately filed a petition for reconsideration with the EPA. In the petition for reconsideration filed with the EPA, Sierra Club/NPCA did not take issue with the Coyote Station NOx emission limit. However, in wholesale electric markets. Operational risks also include facility shutdowns duethe Eighth Circuit appeal, Sierra Club/NPCA filed a brief on October 5, 2012 that included a challenge to breakdown or failurethe EPA’s determinations relative to Coyote Station. The groups requested the Eighth Circuit reverse and remand the EPA’s SIP approval. An amicus brief was submitted to the Eighth Circuit on behalf of equipment or processes, labor disputes, operator errorthe Coyote Station on December 18, 2012. Oral arguments were held before the Eighth Circuit on May 14, 2013, and catastrophic events such as fires, explosions, floods, intentional actson September 23, 2013 the Eighth Circuit denied the Sierra Club/NPCA appeal with respect to Coyote Station.
Air Quality – Greenhouse Gas (GHG) Regulation—Combustion of destruction or other similar occurrences affecting OTP’s electric generating facilities. The lossfossil fuels for the generation of electricity is a major generating facility would require OTP to find other sourcesstationary source of supply, if available, and expose it to higher purchased power costs.
Changes to regulation of generating plant emissions, including but not limited to CO2 emissions could affect our operating costs and the costs of supplying electricity to our customers.
Existing or new laws or regulations passed or issued by federal or state authorities addressing climate change or reductions of greenhouse gas emissions, such as mandated levels of renewable generation, mandatory reductions in CO2 emission levels, taxes on CO2 emissions or cap and trade regimes, could require us to incur significant new costs, which could negatively impact our net income, financial position and operating cash flows if such costs cannot be recovered through rates granted by ratemaking authorities in the states whereUnited States and globally. OTP provides serviceis an owner or through increased market prices for electricity. Debate continues in Congress onpart-owner of three baseload, coal-fired electricity generating plants and three fuel-oil or natural gas-fired combustion turbine peaking plants with a combined net dependable capacity of 656 MW. In 2013 these plants emitted approximately 4.0 million tons of CO2.
OTP monitors and evaluates the direction and scopepossible adoption of U.S. policy onnational, regional, or state climate change and regulation of GHGs.GHG legislation or regulations that would affect electric utilities. Congress haspreviously considered but has not adopted GHG legislation which would require a reduction in GHG emissions, and there is no legislation under active consideration at this time. The likelihood of any federal mandatory CO2 emissions reduction program being adopted by Congress in the near future, and the specific requirements of any such program, areis uncertain. The
In April 2007, however, the U.S. Supreme Court issued a decision that determined that the EPA has begunauthority to regulate CO2 and other GHGs from automobiles as “air pollutants” under the CAA. The Supreme Court directed the EPA to conduct a rulemaking to determine whether GHG emissions under its “endangerment” finding. The EPA has adopted its first GHG emission control rules forcontribute to climate change “which may reasonably be anticipated to endanger public health or welfare.” While this case addressed a provision of the CAA related to emissions from motor vehicles, a parallel provision of the CAA applies to stationary sources such as electric generators; according to the EPA, that parallel provision would be automatically triggered once the EPA began regulating motor vehicle GHG emissions. The first step in the EPA rulemaking process was the publication of an endangerment finding in the December 15, 2009 Federal Register where the EPA found that CO2and five other GHGs – methane, nitrous oxide, hydrofluorocarbons, perfluorocarbons and sulfur hexafluoride – threaten public health and the environment.
The EPA’s final findings respond to the 2007 U.S. Supreme Court decision that GHGs fit within the CAA’s definition of air pollutants. The findings do not in and of themselves impose any emission reduction requirements but rather allowed the EPA to finalize the GHG standards for new source reviewlight-duty vehicles as part of the joint rulemaking with the Department of Transportation. These standards apply to motor vehicles as of January 2011, which makes GHGs “subject to regulation” under the CAA. This, then, triggered the Prevention of Significant Deterioration (PSD) and Title V operating permits programs for stationary sources of GHGs. The question of whether the regulation of motor vehicle emissions does in fact automatically trigger regulation of stationary sources of GHGs,the same pollutant is presently under review by the Supreme Court. The case is fully briefed, and oral argument will be held on February 24, 2014. A decision is not expected until June or July 2014.
On June 6, 2010 the EPA published a final “tailoring rule” that phases in application of its PSD and Title V programs to GHG emission sources, including power plants. The PSD program applies to existing sources if there is a physical change or change in the method of operation of the facility that results in a significant net emissions increase of any pollutant. As a result, PSD does not apply on a set timeline as is the case with other regulatory programs, but is triggered depending on what activities take place at a major source. If triggered, the owner or operator of an affected facility must undergo a review which became applicablerequires the identification and implementation of best-available control technology (BACT) for the regulated air pollutants for which there is a significant net emissions increase, and an analysis of the ambient air quality impacts of the facility.
As of July 2011, sources emitting more than 100,000 tons per year of “CO2e”, a measure that converts emissions of each GHG into its carbon dioxide equivalent, are considered “major sources” subject to motor vehiclesPSD requirements if they propose to make modifications resulting in a net GHG emissions increase of 75,000 tons per year or more of CO2e. OTP does not anticipate making modifications at any of its facilities that would trigger PSD requirements. The South Dakota DENR reviewed OTP’s projected emissions, including GHG emissions, as a result of the Big Stone Plant AQCS Project and stationary sources, respectively,the DENR agreed that the emissions did not trigger the need for a PSD permit. Consequently, the DENR issued an Air Quality Construction Permit for the Big Stone Plant AQCS Project on January 2, 2011. The6, 2012.
Concurrently, the EPA is developing standardsNew Source Performance Standards (NSPS) for GHGs from fossil fuel-fired electric generating units andunits. The EPA proposed a rule on April 13, 2012January 8, 2014 that would require certainsubject large new fossil fuel generating plantscoal-fired units to meet a GHG emission limit of 1,100 lbs. of CO2output per megawatt-hour (mwh) averaged over a 12-month period, or possibly a limit of 1,000-1,050 pounds of CO2 averaged over a period of seven years. This limit is based standard.on emission reductions the EPA believes could be achieved through the installation and operation of partial carbon capture and sequestration technology. Certain new natural gas-fired units would be subject to a limit of 1,000 or 1,100 pounds of CO2 per mwh, dependent on unit size, which is the emissions level the EPA believes natural gas combined cycle units can currently achieve with no additional add-ons. Unlike traditional NSPS rules, the proposed GHG NSPS would not apply to modifications at existing units. ItUnder Section 111(b) of the CAA, the EPA must finalize the standard within a year of its proposal, or by January 8, 2015. However, it is expected thatthe EPA will issue a final rule in the firstsecond half of 2014. If finalized, the NSPS would apply to any unit the construction of which commences after the date of the proposal, or January 8, 2014.
The EPA also intends to develop GHG performance standards for existing sources under CAA Section 111(d) (111(d) Standard). A 111(d) Standard, unlike a NSPS, applies to existing sources of a pollutant. Under Section 111(d), the EPA does not itself issue the standards. Rather, the EPA promulgates emission guidelines, and the states are then given a period of time to develop plans to implement the standard. The EPA reviews each state-developed standard and then approves it if the state’s plan comports with the federal emission guidelines; if the state does not submit a plan, or if the EPA finds that the plan is inadequate, the EPA will prescribe a plan for that state. The EPA has indicated that it intends to sign proposed emission guidelines by June 1, 2014, to finalize those guidelines by June 1, 2015 and to require state submissions by June 30, 2016.
For both new and existing sources, the EPA must develop a “standard of performance,” which is defined as:
…a standard for emissions of air pollutants which reflects the degree of emission limitation achievable through the application of the best system of emission reduction which (taking into account the cost of achieving such reduction and any non-air quality health and environmental impact and energy requirements) the [EPA] Administrator determines has been adequately demonstrated.
For existing sources, Section 111(d) also requires the EPA to consider, “among other factors, remaining useful lives of the sources in the category of sources to which such standard applies.” In general, the standards ultimately developed are more stringent for new sources than for existing sources, because existing source standards need to consider the issues involved in retrofitting plants considering what can be achieved under their existing design, as well as the cost of implementing the standard relative to the remaining useful life of the facility. The standards also need to be capable of attainment across the category of sources regulated by the standard.
While the potential impact of a 111(d) Standard on OTP’s facilities is not yet known, standards of performance for existing sources of GHGs are anticipated to focus on efficiency improvements rather than add-on controls. The cost of efficiency improvements that achieve generation of the same amount of power with less fuel used could be offset in whole or in part by reduced fuel costs. It is also possible that the EPA will allow the states to claim credit for reductions in GHG emissions that are achieved through programs designed to reduce end-user demand and that it will allow the states, either separately or together, to establish emission averaging and emission credit banking and trading systems (i.e., a cap-and-trade program).
Litigation over both the NSPS and the emission guidelines for existing sources is expected. Thus, uncertainty over whether the standards will be enforced or, if so, what will be permitted, may continue for a number of years.
Several states and regional organizations are also developing, or already have developed, state-specific or regional legislative initiatives to reduce GHG emissions through mandatory programs. In 2007, the state of Minnesota passed legislation regarding renewable energy portfolio standards that requires retail electricity providers to obtain 25% of the electricity sold to Minnesota customers from renewable sources by the year 2025. Additionally, in 2013 the state of Minnesota passed a provision that requires public utilities to generate or procure sufficient electricity generated by solar energy to serve its retail electricity customers in Minnesota so that by the end of 2020, at least 1.5% of the utility’s total retail electric sales to retail customers in Minnesota is generated by solar energy. Regarding CO2, the Minnesota legislature set a January 1, 2008 deadline for the MPUC to establish an estimate of the likely range of costs of future CO2 regulation on electricity generation. The legislation also set state targets for reducing fossil fuel use, included goals for reducing the state’s output of GHGs, and restricted importing electricity that would contribute to statewide power sector CO2 emission. The MPUC, in its order dated December 21, 2007, established an estimate of future CO2 regulation costs at between $4/ton and $30/ton emitted in 2012 and after. However, annual updates of the range are required, and for 2012 and 2013 the range was revised to $9-$34/ton, and the start date to begin using CO2 costs in resource planning decisions was moved from 2012 to 2017.
The states of North Dakota and South Dakota currently have no proposed or pending legislation related to the regulation of GHG emissions, but North Dakota and South Dakota have 10% renewable energy objectives.
While the eventual outcome of proposed and pending climate change legislation and GHG regulation is unknown, OTP is taking steps to reduce its carbon footprint and mitigate levels of CO2 emitted in the process of generating electricity for its customers through the following initiatives:
| ● | Supply efficiency and reliability: OTP’s efforts to increase plant efficiency and add renewable energy to its resource mix have reduced its CO2 intensity. Between 1985 and 2013 OTP decreased its overall system average CO2 emissions intensity by approximately 23%. Further reductions are expected with the additional purchase of 62.4 MW of wind-powered generation under the Ashtabula Wind III wind power purchase agreement, under which energy delivery commenced in October 2013, and with the anticipated replacement of Hoot Lake Plant generation likely with natural gas in the 2020 timeframe. |
| | Conservation: Since 1992 OTP has helped its customers conserve nearly 600 MW of demand and nearly 2.8 million cumulative mwhs of electricity, which is roughly equivalent to the amount of electricity that 232,000 average homes would use in a year. OTP continues to educate customers about energy efficiency and demand-side management and to work with regulators to develop new programs. OTP’s 2014-2028 IRP calls for an additional 106 MW of conservation and demand side management impacts by 2028. |
| | Renewable energy: Since 2002, OTP’s customers have been able to purchase 100% of their electricity from wind generation through OTP’s TailWinds program. OTP has access to 102.9 MW of wind powered generation under power purchase agreements and owns 138 MW of wind powered generation. |
| | Other: OTP is a participating member of the EPA’s SF6 (sulfur hexafluoride) Emission Reduction Partnership for Electric Power Systems program, which proactively is targeting a reduction in emissions of SF6, a potent GHG. SF6 has a global-warming potential 23,900 times that of CO2. Methane has a global-warming potential over 20 times that of CO2. OTP participates in carbon sequestration research through the Plains CO2 Reduction Partnership (PCOR) through the University of North Dakota’s Energy and Environmental Research Center. The PCOR Partnership is a collaborative effort of approximately 100 public and private sector stakeholders working toward a better understanding of the technical and economic feasibility of capturing and storing anthropogenic CO2 emissions from stationary sources in central North America. |
In late 2009, two federal circuit courts of appeal reversed dismissals of GHG suits and remanded them to district court for trial. OTP was not a party to any of these suits, and does not have an indication that it will be the subject of such a lawsuit. The circuit court opinions, however, opened utility companies and other GHG emitters to these actions, which had previously been dismissed by the district courts as nonjustifiable based on the political question doctrine. In 2010, the U.S. Supreme Court took review of one of these cases, while declining review of another. On June 20, 2011, the Supreme Court ruled unanimously that states cannot invoke federal law to force utilities to cut GHG emissions, which was in agreement with the position of utilities and the EPA.
While the future financial impact of any proposed or pending climate change legislation, litigation, or regulation of GHG emissions is unknown at this time, any capital and operating costs incurred for additional pollution control equipment or CO2 emission reduction measures, such as the cost of sequestration or purchasing allowances, or offset credits, or the imposition of a carbon tax or cap and trade program at the state or federal level could materially adversely affect the Company’s future results of operations, cash flows, and possibly financial condition, unless such costs could be recovered through regulated rates and/or future market prices for energy.
Water Quality —The Federal Water Pollution Control Act Amendments of 1972, and amendments thereto, provide for, among other things, the imposition of effluent limitations to regulate discharges of pollutants, including thermal discharges, into the waters of the United States, and the EPA has established effluent guidelines for the steam electric power generating industry. Discharges must also comply with state water quality standards.
Effluent limits specific to Hoot Lake Plant and Coyote Station are incorporated into their National Pollutant Discharge Elimination System (NPDES) permits. Big Stone Plant is a zero discharge facility and therefore does not have a NPDES permit. The EPA announced its decision to proceed with further possible revisions to steam effluent guidelines on September 15, 2009, and published a proposed rulemaking on June 7, 2013. SpecificThe proposed rulemaking primarily focuses on discharge restrictions applicable to fly ash transport water, bottom ash transport water, and flue gas desulfurization wastewater. Since the steam effluent guidelines rule is not final, at this time OTP is unable to determine how it will affect our facilities, but it appears that the rule could have minimal effect since the facilities do not discharge fly ash transport water, bottom ash transport water, or flue gas desulfurization wastewater into waters of the United States.
On February 16, 2004 the EPA Administrator signed the final Phase II rule implementing Section 316(b) of the Clean Water Act establishing standards for cooling water intake structures for certain existing facilities. A proposed 316(b) rule was issued on April 20, 2011 to replace the 2004 Phase II rule for existing facilities following its remand by the U.S. Court of Appeals in 2007. Unlike the 2004 Phase II rule, the proposed rule has the potential to affect both Hoot Lake Plant and Coyote Station with the greatest potential effect on Hoot Lake Plant. The final rule is expected to be signed in early 2014, though the EPA has repeatedly missed self-imposed deadlines for finalizing the rule. OTP is uncertain of the impact on the potentially affected facilities until the EPA releases the final rule, and likely until after discussions with state regulatory agencies.
OTP has all federal and state water permits presently necessary for the operation of the Coyote Station, the Big Stone Plant and the Hoot Lake Plant. OTP owns five small dams on the Otter Tail River, which are subject to FERC licensing requirements. A license for all five dams was issued on December 5, 1991. Total nameplate rating (manufacturer’s expected output) of the five dams is 3,450 kW.
Solid Waste—Permits for disposal of ash and other solid wastes have been issued for the Coyote Station, the Big Stone Plant and the Hoot Lake Plant.
On June 21, 2010 the EPA published a proposed rule that outlines two possible options to regulate disposal of coal ash generated from the combustion of coal by electric utilities under the Resource Conservation and Recovery Act (RCRA). In one option, the EPA would propose to list coal ash destined for disposal in landfills or surface impoundments as “special wastes” subject to regulation under Subtitle C of RCRA. Subtitle C regulations set forth the EPA’s hazardous waste regulatory program, which regulates the generation, handling, transport and disposal of wastes.
The proposal would create a new category of special waste under Subtitle C, so that coal ash would not be classified as hazardous waste, but would be subject to many of the regulatory requirements applicable to hazardous waste. This option would subject coal ash to technical and permitting requirements from the point of generation to final disposal. The EPA is considering whether to impose disposal facility requirements such as liners, groundwater monitoring, fugitive dust controls, financial assurance, corrective action, closure of units, and post-closure care. This option also includes potential requirements for dam safety and stability for surface impoundments, land disposal restrictions, treatment standards for coal ash, and a prohibition on the disposal of treated coal ash below the natural water table. Beneficial re-uses of coal ash would not be subject to these requirements.
Under the second proposed regulatory option, the EPA would regulate the disposal of coal ash under Subtitle D of RCRA, the regulatory program for non-hazardous solid wastes. In this option, the EPA is considering issuing national minimum criteria to ensure the safe disposal of coal ash, which would subject disposal units to location standards, composite liner requirements, groundwater monitoring and corrective action standards for releases, closure and post-closure care requirements, and requirements to address the stability of surface impoundments. Within this option, the EPA is also considering not requiring existing surface impoundments to close or install composite liners and allowing them to continue to operate for their useful life.
This option would not regulate the generation, storage, or treatment of coal ash prior to disposal, and no federal permits would be required. The EPA’s proposal also states that the EPA is considering whether to list coal ash as a hazardous substance under the Comprehensive Environmental Response, Compensation, and Liability Act, and includes proposals for alternative methods to adjust the statutory reportable quantity for coal ash. The EPA has not decided which regulatory approach it will take with respect to the management and disposal of coal ash. It has suggested, however, that if it finalizes a related Clean Water Act rule regarding effluent limitation guidelines for the steam electric power generating category that are expected to drive utilities to dry-handle their coal combustion residues, then an RCRA rule allowing coal ash to be treated as non-hazardous solid waste may be adequate.
Additional requirements may be imposed as part of the EPA’s pending rule, which could increase the capital and operating costs of OTP’s facilities. Identification of specific costs is contingent on the requirements of regulationthe final rule. The most costly option in the EPA proposal is the option that would regulate all coal ash destined for disposal as special waste. For example, under this option, OTP estimates an annual cost of approximately $5.75 million at its Big Stone Plant. If the CAA’sEPA chooses the other option, it would impose less cost than this estimate. It is also possible the new regulations would not require change in the current operation and cost of OTP’s coal ash disposal sites.
At the request of the Minnesota Pollution Control Agency (MPCA), OTP has an ongoing investigation at its former, closed Hoot Lake Plant ash disposal sites. The MPCA continues to monitor site activities under its Voluntary Investigation and Cleanup (VIC) Program. OTP provided a revised focus feasibility study for remediation alternatives to the MPCA in October 2004. OTP and the MPCA have reached an agreement identifying the remediation technology and OTP completed the projects in 2006. The effectiveness of the remediation is under ongoing evaluation and OTP has notified the MPCA of an additional project in 2014 with plans to remove the ash from one VIC area and place it in OTP’s permitted disposal area.
The EPA has promulgated various programs,solid and thus theirhazardous waste regulations and guidelines pursuant to, among other laws, the Resource Conservation and Recovery Act of 1976, the Solid Waste Disposal Act Amendments of 1980 and the Hazardous and Solid Waste Amendments of 1984, which provide for, among other things, the comprehensive control of various solid and hazardous wastes from generation to final disposal. The states of Minnesota, North Dakota and South Dakota have also adopted rules and regulations pertaining to solid and hazardous waste. To date, OTP has incurred no significant costs as a result of these laws. The future total impact on OTP are uncertainof the various solid and hazardous waste statutes and regulations enacted by the federal government or the states of Minnesota, North Dakota and South Dakota is not certain at this time.
In 1980, the United States enacted the Comprehensive Environmental Response, Compensation and Liability Act, commonly known as the Federal Superfund law, which was reauthorized and amended in 1986. In 1983, Minnesota adopted the Minnesota Environmental Response and Liability Act, commonly known as the Minnesota Superfund law. In 1988, South Dakota enacted the Regulated Substance Discharges Act, commonly known as the South Dakota Superfund law. In 1989, North Dakota enacted the Environmental Emergency Cost Recovery Act. Among other requirements, the federal and state acts establish environmental response funds to pay for remedial actions associated with the release or threatened release of certain regulated substances into the environment. These federal and state Superfund laws also establish liability for cleanup costs and damage to the environment resulting from such release or threatened release of regulated substances. The Minnesota Superfund law also creates liability for personal injury and economic loss under certain circumstances. OTP has not incurred any significant costs to date related to these laws. OTP is not presently named as a potentially responsible party under the federal or state Superfund laws.
Capital Expenditures
OTP is continually expanding, replacing and improving its electric facilities. During 2013, approximately $149 million in cash was invested for additions and replacements to its electric utility properties. During the five years ended December 31, 2013 gross electric property additions, including construction work in progress, were approximately $474 million and gross retirements were approximately $60 million. OTP estimates that during the five-year period 2014-2018 it will invest approximately $657 million for electric construction, which includes $131 million for OTP’s share of the Big Stone Plant AQCS and $304 million for transmission projects including $243 million for MVPs and $26 million for CapX2020 transmission projects ($7 million for the Brookings to Southeast Twin Cities CapX2020 MVP project is included with the $243 million for MVP projects). The remainder of the 2014-2018 anticipated capital expenditures is for asset replacements, additions and improvements across OTP’s generation, transmission, distribution and general plant. See “Management’s Discussion and Analysis of Financial Condition and Results of Operations - Capital Requirements” section for further discussion.
Franchises
At December 31, 2013 OTP had franchises to operate as an electric utility in substantially all of the incorporated municipalities it serves. All franchises are nonexclusive and generally were obtained for 20-year terms, with varying expiration dates. No franchises are required to serve unincorporated communities in any of the three states that OTP serves. OTP believes that its franchises will be renewed prior to expiration.
Employees
At December 31, 2013 OTP had 668 equivalent full-time employees. A total of 397 OTP employees are represented by local unions of the International Brotherhood of Electrical Workers under two separate contracts expiring in the fall of 2014 and 2016. OTP has not experienced any strike, work stoppage or strike vote, and considers its present relations with employees to be good.
MANUFACTURING
General
Manufacturing consists of businesses engaged in the following activities: contract machining, metal parts stamping and fabrication, and production of material handling trays and horticultural containers.
The Company derived 23%, 24% and 23% of its consolidated operating revenues and 21%, 26% and 22% of its consolidated operating income from the Manufacturing segment for the years ended December 31, 2013, 2012 and 2011, respectively. Following is a brief description of each of these businesses:
BTD Manufacturing, Inc. (BTD), with headquarters located in Detroit Lakes, Minnesota, is a metal stamping and tool and die manufacturer that provides its services mainly to customers in the Midwest. BTD stamps, fabricates, welds and laser cuts metal components according to manufacturers’ specifications primarily for the recreational vehicle, agricultural, lawn and garden, industrial equipment, health and fitness and enclosure industries in its facilities in Detroit Lakes, Otsego and Lakeville, Minnesota, and Washington, Illinois. BTD’s Illinois facility also manufactures and fabricates parts for off-road equipment, mining machinery, oil fields and offshore oil rigs, wind industry components, broadcast antennae and farm equipment, and serves several major equipment manufacturers in the Peoria, Illinois area and nationwide, including Caterpillar, Komatsu and Gardner Denver.
T. O. Plastics, Inc. (T.O. Plastics), located in Otsego and Clearwater, Minnesota, manufactures and sells thermoformed products for the horticulture industry throughout the United States. In addition, T.O. Plastics produces products such as clamshell packing, blister packs, returnable pallets and handling trays for shipping and storing odd-shaped or difficult-to-handle parts for customers in the consumer products, food packaging, electronics, industrial and medical industries, among others. T.O. Plastics’ Otsego thermoforming facility achieved an AIB International (formerly American Institute of Baking) compliance rating for producing food-contact packaging materials in its operations.
Competition
The various markets in which the Manufacturing segment entities compete are characterized by intense competition from both foreign and domestic manufacturers. These markets have many established manufacturers the price and availability of raw materials and general economic conditions could affect the revenues and earnings of our manufacturing businesses.
Our manufacturing businesses are subject to intense risks associated with competition from foreign and domestic manufacturers, many of whom have broader product lines, greater distribution capabilities, greater capital resources, excess capacity, labor advantages and larger marketing, research and development staffs and facilities than the Company’s manufacturing entities.
The Company believes the principal competitive factors in its Manufacturing segment are product performance, quality, price, technical innovation, cost effectiveness, customer service and other capabilities that may place downward pressurebreadth of product line. The Company’s manufacturing entities intend to continue to compete on marginsthe basis of high-performance products, innovative production technologies, cost-effective manufacturing techniques, close customer relations and profitability. support, and increasing product offerings.
Raw Materials Supply
The companies in ourthe Manufacturing segment use a variety of raw materials in the products they manufacture, including steel, aluminum and Polystyrene (PS)polystyrene and other plastics resins. Costs forBoth pricing increases and availability of these items have increased significantly and may continue to increase. If our manufacturing businessesraw materials are not ableconcerns of companies in the Manufacturing segment. The companies in the Manufacturing segment attempt to pass increases in the costs of these raw materials on cost increases to their customers. Increases in the costs of raw materials that cannot be passed on to customers it could have a negative effect on profit margins in ourthe Manufacturing segment.
EachBacklog
The Manufacturing segment has backlog in place to support 2014 revenues of ourapproximately $136 million compared with $124 million one year ago.
Capital Expenditures
Capital expenditures in the Manufacturing segment typically include additional investments in new manufacturing equipment or expenditures to replace worn-out manufacturing equipment. Capital expenditures may also be made for the purchase of land and buildings for plant expansion and for investments in management information systems. During 2013, cash expenditures for capital additions in the Manufacturing segment were approximately $7 million. Total capital expenditures for the Manufacturing segment during the five-year period 2014-2018 are estimated to be approximately $81 million.
Employees
At December 31, 2013 the Manufacturing segment had 1,059 full-time employees. There are 932 full-time employees at BTD and 127 full-time employees at T.O. Plastics.
PLASTICS
General
Plastics consists of businesses producing PVC pipe at plants in North Dakota and Arizona. The Company derived 18%, 18% and 15% of its consolidated operating revenues and 25%, 32% and 15% of its consolidated operating income from the Plastics segment for the years ended December 31, 2013, 2012 and 2011, respectively. Following is a brief description of these businesses:
Northern Pipe Products, Inc. (Northern Pipe), located in Fargo, North Dakota, manufactures and sells PVC pipe for municipal water, rural water, wastewater, storm drainage systems and other uses in the northern, midwestern, south-central and western regions of the United States as well as central and western Canada. Production facilities are located in Fargo, North Dakota.
Vinyltech Corporation (Vinyltech), located in Phoenix, Arizona, manufactures and sells PVC pipe for municipal water, wastewater, water reclamation systems and other uses in the western and south-central regions of the United States.
Together these companies has significanthave the current capacity to produce approximately 300 million pounds of PVC pipe annually.
Customers
PVC pipe products are marketed through a combination of independent sales representatives, company salespersons and customer service representatives. Customers for the PVC pipe products consist primarily of wholesalers and distributors throughout the northern, midwestern, south-central and western United States.
Competition
The plastic pipe industry is fragmented and competitive, due to the number of producers, the small number of raw material suppliers and the fungible nature of the product. Due to shipping costs, competition is usually regional, instead of national, in scope. The principal areas of competition are a combination of price, service, warranty, and product performance. Northern Pipe and Vinyltech compete not only against other plastic pipe manufacturers, but also ductile iron, steel, concrete and clay pipe producers. Pricing pressure will continue to affect operating margins in the future.
Northern Pipe and Vinyltech intend to continue to compete on the basis of their high quality products, cost-effective production techniques and close customer relations and support.
Manufacturing and Resin Supply
PVC pipe is manufactured through a process known as extrusion. During the production process, PVC compound (a dry powder-like substance) is introduced into an extrusion machine, where it is heated to a molten state and then forced through a sizing apparatus to produce the pipe. The newly extruded pipe is then pulled through a series of water cooling tanks, marked to identify the type of pipe and cut to finished lengths. Warehouse and outdoor storage facilities are used to store the finished product. Inventory is shipped from storage to distributors and customers mainly by common carrier.
The PVC resins are acquired in bulk and concentrated salesshipped to point of use by rail car. There are a limited number of third party vendors that supply the PVC resin used by Northern Pipe and Vinyltech. Two vendors provided approximately 93% and 90% of total resin purchases in 2013 and 2012, respectively. The supply of PVC resin may also be limited primarily due to manufacturing capacity and the limited availability of raw material components. A majority of U.S. resin production plants are located in the Gulf Coast region, which is subject to risk of damage to the plants and potential shutdown of resin production because of exposure to hurricanes that occur in that part of the United States. The loss of a key vendor, or any interruption or delay in the supply of PVC resin, could disrupt the ability of the Plastics segment to manufacture products, cause customers to cancel orders or require incurrence of additional expenses to obtain PVC resin from alternative sources, if such customers. If oursources were available. Both Northern Pipe and Vinyltech believe they have good relationships with significant customers should change materially, it would be difficult to immediately and profitably replace lost sales.their key raw material vendors.
Due to the commodity nature of PVC resin and PVC pipe and the dynamic supply and demand factors worldwide, historically the markets for both PVC resin and PVC pipe have been very cyclical with significant fluctuations in prices and gross margins.
Capital Expenditures
Capital expenditures in the Plastics segment typically include investments in extrusion machines, land and buildings and management information systems. During 2013, cash expenditures for capital additions in the Plastics segment were approximately $3 million. Total capital expenditures for the five-year period 2014-2018 are estimated to be approximately $14 million to replace existing equipment.
Employees
At December 31, 2013 the Plastics segment had 136 full-time employees. Northern Pipe had 89 full-time employees and Vinyltech had 47 full-time employees as of December 31, 2013.
CONSTRUCTION
General
A significant failure
Construction consists of businesses involved in commercial and industrial electric contracting and construction of fiber optic and electric distribution systems, water, wastewater and HVAC systems primarily in the central United States.
The Company derived 17%, 17% and 22% of its consolidated operating revenues and 3%, (15)% and (4)% of its consolidated operating income from the Construction segment for each of the years ended December 31, 2013, 2012 and 2011, respectively. Following is a brief description of the businesses included in this segment:
Foley Company (Foley), headquartered in Kansas City, Missouri, provides mechanical and prime contracting services for water and wastewater treatment plants, power generation plants, hospital and pharmaceutical facilities, and other industrial and manufacturing projects across a multi-state service area in the United States.
Aevenia, Inc. (Aevenia), located in Moorhead, Minnesota, has divisions that provide a full spectrum of electrical design and construction services for the industrial, commercial and municipal business markets, including government, institutional, utility communications and electric distribution.
Competition
Each of the construction companies is subject to competition, as well as the effects of general economic conditions in their respective disciplines and geographic locations. The construction companies must compete with other construction companies primarily in the Upper Midwest and the Central regions of the United States, including companies with greater financial resources, when bidding on new projects. The Company believes the principal competitive factors in the Construction segment are price, quality of work and customer service.
Backlog
The construction companies have backlog in place of $77 million for 2014 compared with $151 million one year ago.
Capital Expenditures
Capital expenditures in this segment typically include investments in additional construction equipment. During 2013, cash expenditures for capital additions in the Construction segment were approximately $5 million. Capital expenditures during the five-year period 2014-2018 are estimated to be approximately $17 million for the Construction segment.
Employees
At December 31, 2013 there were 426 full-time employees in the Construction segment. There are 232 full-time employees at Foley and 194 full-time employees at Aevenia. Foley has 178 employees represented by various unions, including Carpenters and Millwrights, Laborers, Operating Engineers, Pipe Fitters, Plumbers, Teamsters and Cement Masons. Foley has several labor contracts with various expiration dates in 2014 (124 employees), one contract that expires in March 2015 (14 employees), one contract that expires in April 2017 (8 employees) and one contract that expires in May 2018 (11 employees). Foley also employs 21 people under contracts held by the Tennessee Valley Authority. Foley has not experienced any strike, work stoppage or an inabilitystrike vote, and considers its present relations with employees to properly bidbe good.
RISK FACTORS AND CAUTIONARY STATEMENTS
Our businesses are subject to various risks and uncertainties. Any of the risks described below or performelsewhere in this Annual Report on projectsForm 10-K or contracts byin our construction businessesother SEC filings could lead to adversematerially adversely affect our business, financial condition and results and could lead to the possibility of delay or liquidated damages.operations.
The profitabilityGENERAL
Federal and success of our construction companiesstate environmental regulation could require us to identify, estimateincur substantial capital expenditures and timely bid on profitable projects or contracts. The quantity and quality of projects up for bid at any time is uncertain. Additionally, once a project or contract is awarded, we must be able to perform within cost estimates that were set when the bid was submitted and accepted. A significant failure or an inability to properly bid or perform on projects or contracts could lead to adverse financial results and could lead to the possibility of delay or liquidated damages.increased operating costs.
We enter intoare subject to federal, state and local environmental laws and regulations relating to air quality, water quality, waste management, natural resources and health safety. These laws and regulations regulate the modification and operation of existing facilities, the construction contracts which could exposeand operation of new facilities and the proper storage, handling, cleanup and disposal of hazardous waste and toxic substances. Compliance with these legal requirements requires us to unforeseencommit significant resources and funds toward environmental monitoring, installation and operation of pollution control equipment, payment of emission fees and securing environmental permits. Obtaining environmental permits can entail significant expense and cause substantial construction delays. Failure to comply with environmental laws and regulations, even if caused by factors beyond our control, may result in civil or criminal liabilities, penalties and fines.
Existing environmental laws or regulations may be revised and new laws or regulations may be adopted or become applicable to us. Revised or additional regulations, which result in increased compliance costs or additional operating restrictions, particularly if those costs are not fully recoverable from customers, could have a material effect on our results of operations.
Volatile financial markets and changes in our debt ratings could restrict our ability to access capital and increase borrowing costs and pension plan and postretirement health care expenses.
We rely on access to both short- and long-term capital markets as a source of liquidity for capital requirements not satisfied by cash flows from operations. If we are unable to access capital at competitive rates, our ability to implement our business plans may be adversely affected. Market disruptions or a downgrade of our credit ratings may increase the cost of borrowing or adversely affect our ability to access one or more financial markets.
Disruptions, uncertainty or volatility in the financial markets can also adversely impact our results of operations, the ability of customers to finance purchases of goods and services, and our financial condition, as well as exert downward pressure on stock prices and/or limit our ability to sustain our current common stock dividend level.
Changes in the U.S. capital markets could also have significant effects on our pension plan. Our pension income or expense is affected by factors including the market performance of the assets in the master pension trust maintained for the pension plan for some of our employees, the weighted average asset allocation and long-term rate of return of our pension plan assets, the discount rate used to determine the service and interest cost components of our net periodic pension cost and assumed rates of increase in our employees’ future compensation. If our pension plan assets do not achieve positive rates of return, or if our estimates and assumed rates are not accurate, our earnings may decrease because net periodic pension costs would rise and we could be required to provide additional funds to cover our obligations to employees under the pension plan.
Discretionary contributions totaling $20.0 million were made to our defined benefit pension plan in January 2014. We could be required to contribute additional capital to the pension plan in the future if the market value of pension plan assets significantly declines, plan assets do not withinearn in line with our control,long-term rate of return assumptions or relief under the Pension Protection Act is no longer granted.
Any significant impairment of our goodwill would cause a decrease in our asset values and a reduction in our net operating income.
We had approximately $39.0 million of goodwill recorded on our consolidated balance sheet as of December 31, 2013. We have recorded goodwill for businesses in each of our business segments except Electric. If we make changes in our business strategy or if market or other conditions adversely affect operations in any of these businesses, we may be forced to record an impairment charge, which would lead to decreased assets and a reduction in net operating performance. Goodwill is tested for impairment annually or whenever events or changes in circumstances indicate impairment may have occurred. If the testing performed indicates that impairment has occurred, we are required to record an impairment charge for the difference between the carrying amount of the goodwill and the implied fair value of the goodwill in the period the determination is made. The testing of goodwill for impairment requires us to make significant estimates about our future performance and cash flows, as well as other assumptions. These estimates can be affected by numerous factors, including changes in economic, industry or market conditions, changes in business operations, future business operating performance, changes in competition or changes in technologies. Any changes in key assumptions, or actual performance compared with key assumptions, about our business and its future prospects or other assumptions could affect the fair value of one or more business segments, which may result in an impairment charge.
Declines in projected operating cash flows at any of our reporting units may result in goodwill impairments that could adversely affect our results of operations and financial position, as well as financing agreement covenants.
We currently have $7.3 million of goodwill and a $1.1 million indefinite-lived trade name recorded on our consolidated balance sheet related to the acquisition of Foley in 2003. Foley net earnings improved $10.4 million between 2012 and 2013. If future expected operating profits do not meet our projections, reductions in anticipated cash flows from Foley may indicate its fair value is less than its book value, resulting in an impairment of some or all of the goodwill and indefinite-lived intangible assets associated with Foley along with a corresponding charge against earnings.
The inability of our subsidiaries to provide sufficient earnings and cash flows to allow us to meet our financial obligations and debt covenants and pay dividends to our shareholders could have an adverse effect on the Company.
Otter Tail Corporation is a holding company with no significant operations of its own. The primary source of funds for payment of our financial obligations and dividends to our shareholders is from cash provided by our subsidiary companies. Our ability to meet our financial obligations and pay dividends on our common stock principally depends on the actual and projected earnings, cash flows, capital requirements and general financial position of our subsidiary companies, as well as regulatory factors, financial covenants, general business conditions and other matters.
Under our $150 million revolving credit agreement we may not permit the ratio of our Interest-bearing Debt to Total Capitalization to be greater than 0.60 to 1.00. OTP may not permit the ratio of its Interest-bearing Debt to Total Capitalization to be greater than 0.60 to 1.00 under its $170 million revolving credit agreement. Both credit agreements contain restrictions on the payment of cash dividends on a default or event of default. As of December 31, 2013 we were in compliance with the debt covenants.
Under the Federal Power Act, a public utility may not pay dividends from any funds properly included in a capital account. What constitutes “funds properly included in a capital account” is undefined in the Federal Power Act or the related regulations; however, FERC has consistently interpreted the provision to allow dividends to be paid as long as (1) the source of the dividends is clearly disclosed, (2) the dividend is not excessive and (3) there is no self-dealing on the part of corporate officials. The MPUC indirectly limits the amount of dividends OTP can pay to us by requiring an equity-to-total-capitalization ratio between 44.8% and 54.8%. OTP’s equity-to-total-capitalization ratio was 50.2% as of December 31, 2013.
While these restrictions are not expected to affect our ability to pay dividends at the current level in the foreseeable future, there is no assurance that adverse financial results would not reduce or eliminate our ability to pay dividends. Our dividend payout ratio has exceeded our earnings (losses) in four of the last five years.
Economic conditions could negatively impact our businesses.
Our businesses are affected by local, national and worldwide economic conditions. Tightening of credit in financial markets could adversely affect the ability of customers to finance purchases of our goods and services, resulting in decreased orders, cancelled or deferred orders, slower payment cycles, and increased bad debt and customer bankruptcies. Our businesses may also be adversely affected by decreases in the general level of economic activity, such as decreases in business and consumer spending. A decline in the level of economic activity and uncertainty regarding energy and commodity prices could adversely affect our results of operations and our future growth.
If we are unable to achieve the organic growth we expect, our financial performance may be adversely affected.
We expect much of our growth in the next few years will come from major capital investment at existing companies. To achieve the organic growth we expect, we will have to have access to the capital markets, be successful with capital expansion programs related to organic growth, develop new products and services, expand our markets and increase efficiencies in our businesses. Competitive and economic factors could adversely affect our ability to do this. If we are unable to achieve and sustain consistent organic growth, we will be less likely to meet our revenue growth targets, which, together with any resulting impact on our net income growth, may adversely affect the market price of our common shares.
Our plans to grow and realign our business mix through capital projects, acquisitions and dispositions may not be recoverablesuccessful, which could result in poor financial performance.
As part of our business strategy, we intend to increase capital expenditures in our existing businesses and to continually assess our mix of businesses and potential strategic acquisitions or dispositions. There are risks associated with capital expenditures including not being granted timely or full recovery of rate base additions in our regulated utility business and the inability to recover the cost of capital additions due to an economic downturn, lack of markets for new products, competition from producers of lower cost or alternative products, product defects or loss of customers. We may not be able to identify appropriate acquisition candidates or successfully negotiate, finance or integrate acquisitions. Future acquisitions could involve numerous risks including: difficulties in integrating the operations, services, products and personnel of the acquired business; and the potential loss of key employees, customers and suppliers of the acquired business. If we are unable to successfully manage these risks, we could face reductions in net income in future periods.
We may, from time to time, sell assets to provide capital to fund investments in our electric utility business or for other corporate purposes, which could result in the recognition of a loss on the sale of any assets sold and other potential liabilities. The sale of any of our businesses also exposes us to additional risks associated with indemnification obligations under the applicable sales agreements and any related disputes.
As part of our business strategy, we continually assess our business portfolio to determine if our operating companies continue to meet our portfolio criteria. A loss on the sale of a business would be recognized if a company is sold for less than its book value.
In certain transactions we retain obligations that have arisen, or subsequently arise, out of our conduct of the business prior to the sale. These obligations are sometimes direct or, in other cases, take the form of an indemnification obligation to the buyer. These obligations include such things as warranty, environmental, and the collection of certain receivables. Unforeseen costs related to these obligations could result in future losses related to the business sold.
Our plans to grow and operate our manufacturing and infrastructure businesses could be limited by state law.
Our plans to grow and operate our manufacturing and infrastructure businesses could be adversely affected by legislation in one or more states that may attempt to limit the amount or level of diversification permitted in a holding company structure that includes a regulated utility company or affiliated nonelectric companies.
Significant warranty claims and remediation costs in excess of amounts normally reserved for such items could adversely affect our results of operations and financial condition.
Depending on the specific product or service, we may provide certain warranty terms against manufacturing defects and certain materials. We reserve for warranty claims based on industry experience and estimates made by management. For some of our products we have limited history on which to base our warranty estimate. Our construction companies frequently provide services pursuantassumptions could be materially different from any actual claim and could exceed reserve balances.
Expenses associated with remediation activities of our former wind tower manufacturer, could be substantial. The potential exists for multiple claims based on one defect repeated throughout the production process or for claims where the cost to fixed-price contracts. Revenues recognized on jobsrepair or replace the defective part is highly disproportionate to the original cost of the part. If we are required to cover remediation expenses in progress under fixed-price contracts were $309 million at December 31, 2012addition to our regular warranty coverage, we could be required to accrue additional expenses and $343 million at December 31, 2011. Under those contracts,experience additional unplanned cash expenditures which could adversely affect our consolidated results of operations and financial condition.
We are subject to risks associated with energy markets.
Our businesses are subject to the risks associated with energy markets, including market supply and increasing energy prices. If we agreeare faced with shortages in market supply, we may be unable to perform the contract for a fixed price and, as a result, can improvefulfill our expected profit by superior contract performance, productivity, worker safetycontractual obligations to our retail, wholesale and other factors resultingcustomers at previously anticipated costs. This could force us to obtain alternative energy or fuel supplies at higher costs or suffer increased liability for unfulfilled contractual obligations. Any significantly higher than expected energy or fuel costs would negatively affect our financial performance.
We are subject to risks and uncertainties related to the timing of recovery of deferred tax assets which could have a negative impact on our net income in cost savings. However, we could incur cost overruns above the approved contract price, which may not be recoverable.future periods.
Fixed-price contract prices are established based largely on estimatesIf taxable income is not generated in future periods in certain tax jurisdictions the recovery of deferred taxes related to accumulated tax benefits may be delayed and assumptions relating to project scope and specifications, personnel and material needs. These estimates and assumptions may prove inaccurate or conditions may change due to factors out of our control, resulting in cost overruns, which we may be required to record a reserve related to the uncertainty of the timing of recovery of deferred tax assets related to accumulated taxable losses in those tax jurisdictions. This would have a negative impact on the Company’s net income in the period the reserve is recorded.
We rely on our information systems to conduct our business, and failure to protect these systems against security breaches or cyber-attacks could adversely affect our business and results of operations. Additionally, if these systems fail or become unavailable for any significant period of time, our business could be harmed.
Our electric utility company, OTP, owns electric transmission and generation facilities subject to mandatory and enforceable standards advanced by the North American Electric Reliability Corporation (NERC). These bulk electric system facilities provide the framework for the electrical infrastructure of OTP’s service territory and interconnected systems, the operation of which is dependent on information technology systems. Further, the information systems that operate OTP’s electric system are interconnected to external networks. Parties that wish to disrupt the U.S. bulk power system or OTP’s operations could view OTP’s computer systems, software or networks as attractive targets for cyber-attack. Also, our businesses require us to collect and maintain sensitive customer data, as well as confidential employee and shareholder information, which is subject to electronic theft or loss. We also use third-party vendors to electronically process certain of our business transactions. The efficient operation of our business is dependent on computer hardware and software systems. Information systems, both ours and those of third-party information processors, are vulnerable to security breach by computer hackers and cyber terrorists.
A successful cyber-attack on the systems that control our generation, transmission, distribution or other assets could severely disrupt business operations, preventing us from serving customers or collecting revenues. The breach of certain business systems could affect our ability to correctly record, process and report financial information and transactions. A major cyber incident could result in significant expenses to investigate and repair security breaches or system damage and could lead to litigation, fines, other remedial action, heightened regulatory scrutiny and damage to our reputation. In addition, the misappropriation, corruption or loss of personally identifiable information and other confidential data could lead to significant breach notification expenses and mitigation expenses such as credit monitoring. We maintain property and casualty insurance that may cover certain physical damage or third party injuries caused by potential cybersecurity incidents. However, other damage and claims arising from such incidents may not be covered or may exceed the amount of any insurance available.
OTP is subject to mandatory cybersecurity regulatory requirements. OTP implements the NERC standards for operating its transmission and generation assets and stays abreast of best practices within business and the utility industry to protect its computers and computer controlled systems from outside attack. We rely on industry accepted security measures and technology to securely maintain confidential and proprietary information maintained on our information systems. In an effort to reduce the likelihood and severity of cyber intrusions, we have cybersecurity processes and controls designed to protect and preserve the confidentiality, integrity and availability of data and systems. However, all these measures and technology may not adequately prevent security breaches or cyber-attacks. In addition, the unavailability of the information systems or failure of these systems to perform as anticipated for any reason could disrupt our business and could result in decreased performance and increased overhead costs, causing our business and results of operations to suffer. Any significant interruption or failure of our information systems or any significant breach of security due to cyber-attacks, hacking or internal security breaches could adversely affect our business and results of operations.
ELECTRIC
We may experience fluctuations in revenues and expenses related to our electric operations, which may cause our financial results to fluctuate and could impair our ability to make distributions to shareholders or scheduled payments on our debt obligations, or to meet covenants under our borrowing agreements.
A number of factors, many of which are beyond our control, may contribute to fluctuations in our revenues and expenses from electric operations, causing our net income to fluctuate from period to period. These risks include fluctuations in the volume and price of sales of electricity to customers or other utilities, which may be affected by factors such as mergers and acquisitions of other utilities, geographic location of other utilities, transmission costs (including increased costs related to operations of regional transmission organizations), changes in the manner in which wholesale power is sold and purchased, unplanned interruptions at OTP’s generating plants, the effects of regulation and legislation, demographic changes in OTP’s customer base and changes in OTP’s customer demand or load growth. Electric wholesale margins have been significantly and adversely affected by increased efficiencies in the MISO market. Electric wholesale trading margins could also be adversely affected by losses due to trading activities. Other risks include weather conditions or changes in weather patterns (including severe weather that could result in damage to OTP’s assets), fuel and purchased power costs and the rate of economic growth or decline in OTP’s service areas. A decrease in revenues or an increase in expenses related to our electric operations may reduce the amount of funds available for our existing and future businesses, which could result in increased financing requirements, impair our ability to make expected distributions to shareholders or impair our ability to make scheduled payments on our debt obligations, or to meet covenants under our borrowing agreements.
Actions by the regulators of our electric operations could result in rate reductions, lower revenues and earnings or delays in recovering capital expenditures.
We are subject to federal and state legislation, government regulations and regulatory actions that may have a negative impact on our business and results of operations. The electric rates that OTP is allowed to charge for its electric services are one of the most important items influencing our financial position, results of operations and liquidity. The rates that OTP charges its electric customers are subject to review and determination by state public utility commissions in Minnesota, North Dakota and South Dakota. OTP is also regulated by the FERC. An adverse decision by one or more regulatory commissions concerning the level or method of determining electric utility rates, the authorized returns on equity, implementation of enforceable federal reliability standards or other regulatory matters, permitted business activities (such as ownership or operation of nonelectric businesses) or any prolonged delay in rendering a decision in a rate or other proceeding (including with respect to the recovery of capital expenditures in rates) could result in lower revenues and net income.
Depending on the outcome of the U.S. Supreme Court review of the 7th Circuit U.S. Court of Appeals decision relating to MVPs, OTP could be required to absorb a disproportionate share of costs for transmission investments if the MISO MVP cost allocation changes. These costs may not be recoverable through a transmission tariff and could result in reduced returns on invested capital and/or increased rates to OTP’s retail electric customers. Depending on the outcome of a November 12, 2013 FERC complaint filed by a group of industrial customers and other stakeholders seeking to reduce the return on equity component of the transmission rates that MISO transmission owners, including OTP, may collect under the relevant MISO tariff, OTP may receive a lower return on equity on its MISO transmission rates and this may impact future revenues for transmission services provided in MISO.
OTP’s electric generating facilities are subject to operational risks that could result in unscheduled plant outages, unanticipated operation and maintenance expenses and increased power purchase costs.
Operation of electric generating facilities involves risks which can adversely affect energy output and efficiency levels. Most of OTP’s generating capacity is coal-fired. OTP relies on a limited number of suppliers of coal, making it vulnerable to increased prices for fuel as existing contracts expire or in the event of unanticipated interruptions in fuel supply. OTP is a captive rail shipper of the BNSF Railway for shipments of coal to its Big Stone and Hoot Lake plants, making it vulnerable to increased prices for coal transportation from a sole supplier. Higher fuel prices result in higher electric rates for OTP’s retail customers through fuel clause adjustments and could make it less competitive in wholesale electric markets. Operational risks also include facility shutdowns due to breakdown or failure of equipment or processes, labor disputes, operator error and catastrophic events such as fires, explosions, floods, intentional acts of destruction or other similar occurrences affecting OTP’s electric generating facilities. The loss of a major generating facility would require OTP to find other sources of supply, if available, and expose it to higher purchased power costs.
Changes to regulation of generating plant emissions, including but not limited to CO2 emissions, could affect our operating costs and the costs of supplying electricity to our customers.
Existing or new laws or regulations passed or issued by federal or state authorities addressing climate change or reductions of greenhouse gas emissions, such as mandated levels of renewable generation, mandatory reductions in CO2 emission levels, taxes on CO2 emissions or cap and trade regimes, could require us to incur significant new costs, which could negatively impact our net income, financial position and operating cash flows if such costs cannot be recovered through rates granted by ratemaking authorities in the states where OTP provides service or through increased market prices for electricity. Debate continues in Congress on the direction and scope of U.S. policy on climate change and regulation of GHGs. Congress has considered but has not adopted GHG legislation which would require a reduction in GHG emissions and there is no legislation under active consideration at this time. The likelihood of any federal mandatory CO2 emissions reduction program being adopted by Congress in the near future, and the specific requirements of any such program, are uncertain. The EPA has begun to regulate GHG emissions under its “endangerment” finding. The EPA has adopted its first GHG emission control rules for motor vehicles and new source review of stationary sources of GHGs, which became applicable to motor vehicles and stationary sources, respectively, on January 2, 2011. The EPA is developing CAA Section 111 standards for GHGs from electric generating units and proposed a rule on September 20, 2013 that would require certain new fossil fuel generating plants to meet a CO2 output based standard. Unlike traditional NSPS rules, the proposed GHG NSPS would not apply to modifications at existing units. It is expected the EPA will issue a final new source rule in 2014. For existing units, the EPA is slated to propose Section 111(d) emission guidelines by June 1, 2014, finalize the guidelines by June 1, 2015, and require states to develop 111(d) plans by June 30, 2016. Specific requirements of the CAA Section 111(d) regulation, and thus their impact on OTP, are uncertain at this time.
MANUFACTURING
Competition from foreign and domestic manufacturers, the price and availability of raw materials and general economic conditions could affect the revenues and earnings of our manufacturing businesses.
Our manufacturing businesses are subject to intense risks associated with competition from foreign and domestic manufacturers, many of whom have broader product lines, greater distribution capabilities, greater capital resources, larger marketing, research and development staffs and facilities and other capabilities that may place downward pressure on margins and profitability. The companies in our Manufacturing segment use a variety of raw materials in the products they manufacture, including steel, aluminum and polystyrene and other plastics resins. Costs for these items have increased significantly and may continue to increase. If our manufacturing businesses are not able to pass on cost increases to their customers, it could have a material adversenegative effect on profit margins in our business, financial condition and resultsManufacturing segment.
Each of our operations. In addition,manufacturing companies has significant customers and concentrated sales to such customers. If our profits from these contracts could decreaserelationships with significant customers should change materially, it would be difficult to immediately and we could experience losses if we incur difficulties in performing the contracts or are unable to secure fixed-pricing commitments from our suppliers and subcontractors at the time we enter into fixed-price contracts with our customers.profitably replace lost sales.
PLASTICS
Our plastics operations are highly dependent on a limited number of vendors for PVC resin and a limited supply of PVC resin. The loss of a key vendor, or any interruption or delay in the supply of PVC resin, could result in reduced sales or increased costs for our plastics business.
We rely on a limited number of vendors to supply the PVC resin used in our plastics business. Two vendors accounted for approximately 93% of our total purchases of PVC resin in 2013 and approximately 90% of our total purchases of PVC resin in 2012 and approximately 97% of our total purchases of PVC resin in 2011.2012. In addition, the supply of PVC resin may be limited primarily due to manufacturing capacity and the limited availability of raw material components. A majority of U.S. resin production plants are located in the Gulf Coast region, which may increase the risk of a shortage of resin in the event of a hurricane or other natural disaster in that region. The loss of a key vendor or any interruption or delay in the availability or supply of PVC resin could disrupt our ability to deliver our plastic products, cause customers to cancel orders or require us to incur additional expenses to obtain PVC resin from alternative sources, if such sources are available.
We compete against a large number of other manufacturers of PVC pipe and manufacturers of alternative products. Customers may not distinguish our products from those of our competitors.
The plastic pipe industry is fragmented and competitive due to the number of producers and the fungible nature of the product. We compete not only against other PVC pipe manufacturers, but also against ductile iron, steel, concrete and clay pipe manufacturers. Due to shipping costs, competition is usually regional instead of national in scope, and the principal areas of competition are a combination of price, service, warranty, and product performance. Our inability to compete effectively in each of these areas and to distinguish our plastic pipe products from competing products may adversely affect the financial performance of our plastics business.
Reductions in PVC resin prices can negatively affect our plastics business.
The PVC pipe industry is highly sensitive to commodity raw material pricing volatility. Historically, when resin prices are rising or stable, margins and sales volume have been higher and when resin prices are falling, sales volumes and margins have been lower. Reductions in PVC resin prices could negatively affect PVC pipe prices, profit margins on PVC pipe sales and the value of our finished goods inventory.
CONSTRUCTION
A significant failure or an inability to properly bid or perform on projects or contracts by our construction businesses could lead to adverse financial results and could lead to the possibility of delay or liquidated damages.
The profitability and success of our construction companies require us to identify, estimate and timely bid on profitable projects or contracts. The quantity and quality of projects up for bid at any time is uncertain. Additionally, once a project or contract is awarded, we must be able to perform within cost estimates that were set when the bid was submitted and accepted. A significant failure or an inability to properly bid or perform on projects or contracts could lead to adverse financial results and could lead to the possibility of delay or liquidated damages.
We enter into construction contracts which could expose us to unforeseen costs and costs not within our control, which may not be recoverable and could adversely affect our results of operations and financial condition.
Our construction companies frequently provide services pursuant to fixed-price contracts. Revenues recognized on jobs in progress under fixed-price contracts were $368 million at December 31, 2013 and $309 million at December 31, 2012. Under those contracts, we agree to perform the contract for a fixed price and, as a result, can improve our expected profit by superior contract performance, productivity, worker safety and other factors resulting in cost savings. However, we could incur cost overruns above the approved contract price, which may not be recoverable.
Fixed-price contract prices are established based largely on estimates and assumptions relating to project scope and specifications, personnel and material needs. These estimates and assumptions may prove inaccurate or conditions may change due to factors out of our control, resulting in cost overruns, which we may be required to absorb and that could have a material adverse effect on our business, financial condition and results of our operations. In addition, our profits from these contracts could decrease and we could experience losses if we incur difficulties in performing the contracts or are unable to secure fixed-pricing commitments from our suppliers and subcontractors at the time we enter into fixed-price contracts with our customers.
None.
The Coyote Station, which commenced operation in 1981, is a 414,000 kW (nameplate rating) mine-mouth plant located in the lignite coal fields near Beulah, North Dakota and is jointly owned by OTP, Northern Municipal Power Agency, Montana-Dakota Utilities Co. and Northwestern Public Service Company. OTP is the operating agent of the Coyote Station and owns 35% of the plant.
OTP, jointly with Northwestern Public Service Company and Montana-Dakota Utilities Co., owns the 414,000 kW (nameplate rating) Big Stone Plant in northeastern South Dakota which commenced operation in 1975. OTP is the operating agent of Big Stone Plant and owns 53.9% of the plant.
Located near Fergus Falls, Minnesota, the Hoot Lake Plant is comprised of three separate generating units. The oldest Hoot Lake Plant generating unit, constructed in 1948 (7,500 kW nameplate rating), was retired on December 31, 2005. A second unit was added in 1959 (53,500 kW nameplate rating) and a third unit was added in 1964 (75,000 kW nameplate rating) and modified in 1988 to provide cycling capability, allowing this unit to be more efficiently brought online from a standby mode. The two generating units in operation have a combined nameplate rating of 128,500 kW.
OTP owns 27 wind turbines at the Langdon, North Dakota Wind Energy Center with a nameplate rating of 40,500 kW, 32 wind turbines at the Ashtabula Wind Energy Center located in Barnes County, North Dakota with a nameplate rating of 48,000 kW and 33 wind turbines at the Luverne Wind Farm located in Steele County, North Dakota with a nameplate rating of 49,500 kW.
As of December 31, 20122013 OTP’s transmission facilities, which are interconnected with lines of other public utilities, consisted of 76 miles of 345 kV lines; 487 miles of 230 kV lines; 862878 miles of 115 kV lines; and 3,9773,965 miles of lower voltage lines, principally 41.6 kV. OTP owns the uprated portion of 48 miles of the 345 kV lines, with Minnkota Power Cooperative retaining title to the original 230 kV construction. OTP owns an undivided interest in the remaining 345 kV line miles. OTP is a joint owner, with other regional utilities, in CapX2020 transmission lines with the following ownership interests: 14.8% in the 70 mile Bemidji-Grand Rapids 230 kV line and 13.3% of 29 miles of energized line of the Fargo-Monticello 345 kV Project.
In addition to the properties mentioned above, all of which are utilized by the Electric segment, the Company owns and has investments in offices and service buildings utilized by each of its manufacturing and infrastructure business segments. The Company’s subsidiaries own construction equipment, tools and facilities and equipment used in: the manufacture of PVC pipe, thermoformed products, heavy metal fabricated products, metal parts stamping, fabricating and contract machining.
Management of the Company believes the facilities and equipment described above are adequate for the Company’s present businesses.
The Company is the subject of various pending or threatened legal actions and proceedings in the ordinary course of its business. Such matters are subject to many uncertainties and to outcomes that are not predictable with assurance. The Company records a liability in its consolidated financial statements for costs related to claims, including future legal costs, settlements and judgments, where it has assessed that a loss is probable and an amount can be reasonably estimated. The Company believes the final resolution of currently pending or threatened legal actions and proceedings, either individually or in the aggregate, will not have a material adverse effect on the Company’s consolidated financial position, results of operations or cash flows.
Item 3A. EXECUTIVE OFFICERS OF THE REGISTRANT (AS OF FEBRUARY 27, 2013)MARCH 3, 2014)
Set forth below is a summary of the principal occupations and business experience during the past five years of the executive officers as defined by rules of the SEC. Each of the executive officers has been employed by the Company for more than five years in an executive or management position either with the Company or its wholly owned subsidiary, Otter Tail Power Company, or has served as a director on the Company’s Board of Directors.
| | | |
| NAME AND AGE | DATES ELECTED
TO OFFICE | PRESENT POSITION AND BUSINESS EXPERIENCE |
Edward J. McIntyre (62)(63) | 9/8/11 | Present: | President and Chief Executive Officer |
George A. Koeck (60)(61) | 4/10/00 | Present: | Senior Vice President, General Counsel and Corporate Secretary |
Kevin G. Moug (53)(54) | 4/9/01 | Present: | Chief Financial Officer and Senior Vice President |
Charles S. MacFarlane (48)(49) | 5/1/03 | Present: | Senior Vice President, Electric Platform |
Shane N. Waslaski (37)(38) | 4/11/11 | Present: | Senior Vice President, Manufacturing and Infrastructure Platform |
Mr. MacFarlane was appointed President and Chief Operating Officer of the Company effective April 14, 2014.
On September 8, 2011 on the resignation of John Erickson as President and Chief Executive Officer, the Company’s Board of Directors appointed current director Edward J. (Jim) McIntyre to serve as interim President and Chief Executive Officer. On January 3, 2012, the Company’s Board of Directors appointed Mr. McIntyre to serve as permanent President and Chief Executive Officer of the Company. Mr. McIntyre, 62,63, is retired Vice President and former Chief Financial Officer of Xcel Energy, Inc. He has been a member of the Board of Directors since 2006.
Mr. Waslaski has worked as a Vice President within the Company’s Manufacturing and Infrastructure platform since 2007 and became an executive officer of the Company on April 11, 2011.
The term of office for each of the executive officers is one year and any executive officer elected may be removed by the vote of the Board of Directors at any time during the term. There are no family relationships between any of the executive officers or directors.
| Item 4. | | MINE SAFETY DISCLOSURES |
The Company’s common stock is traded on the NASDAQ Global Select Market under the NASDAQ symbol “OTTR”. The information required by this Item can be found on Page 38 of this Annual Report on Form 10-K under the heading “Selected Financial Data,” on Page 100103 under the heading “Retained Earnings and Dividend Restriction” and on Page 120125 under the heading “Supplementary Financial Information.” The Company does not have a publicly announced stock repurchase program. In addition, the Company did not repurchase any equity securities during the three months ended December 31, 2012.2013.
PERFORMANCE GRAPH
COMPARISON OF FIVE-YEAR CUMULATIVE TOTAL RETURN
This graph compares the cumulative total shareholder return on the Company’s common shares for the last five fiscal years with the cumulative return of The NASDAQ Stock Market Index and the Edison Electric Institute Index (EEI) over the same period (assuming the investment of $100 in each vehicle on December 31, 2007,2008, and reinvestment of all dividends).
| | | 2007 | | 2008 | | 2009 | | 2010 | | 2011 | | 2012 |
| OTC | | $100.00 | | $ 70.07 | | $ 78.76 | | $ 75.73 | | $ 78.26 | | $ 93.54 |
| EEI | | $100.00 | | $ 74.10 | | $ 82.03 | | $ 87.80 | | $105.35 | | $107.55 |
| NASDAQ | | $100.00 | | $ 61.67 | | $ 87.93 | | $104.13 | | $104.69 | | $123.85 |
| | | 2008 | | | 2009 | | | 2010 | | | 2011 | | | 2012 | | | 2013 | |
| OTC | | $ | 100.00 | | | $ | 112.40 | | | $ | 108.08 | | | $ | 111.68 | | | $ | 133.49 | | | $ | 162.95 | |
| EEI | | $ | 100.00 | | | $ | 110.71 | | | $ | 118.50 | | | $ | 142.18 | | | $ | 145.15 | | | $ | 164.03 | |
| NASDAQ | | $ | 100.00 | | | $ | 143.74 | | | $ | 170.23 | | | $ | 171.23 | | | $ | 202.46 | | | $ | 281.91 | |
| (thousands, except number of shareholders and per-share data) | | 2012 | | | 2011 | | | 2010 | | | 2009 | | | 2008 | | | 2013 | | | 2012 | | | 2011 | | | 2010 | | | 2009 | |
| Revenues | | | | | | | | | | | | | | | | | | | | | | | | | | | | | | |
| Electric | | $ | 350,765 | | | $ | 342,727 | | | $ | 344,379 | | | $ | 314,666 | | | $ | 340,075 | | | $ | 373,540 | | | $ | 350,765 | | | $ | 342,727 | | | $ | 344,379 | | | $ | 314,666 | |
| Manufacturing | | | 208,965 | | | | 189,459 | | | | 143,072 | | | | 119,255 | | | | 156,699 | | | | 204,997 | | | | 208,965 | | | | 189,459 | | | | 143,072 | | | | 119,255 | |
| Plastics | | | | 164,957 | | | | 150,517 | | | | 123,669 | | | | 96,945 | | | | 80,208 | |
| Construction | | | 149,092 | | | | 184,657 | | | | 134,222 | | | | 103,831 | | | | 157,053 | | | | 149,910 | | | | 149,092 | | | | 184,657 | | | | 134,222 | | | | 103,831 | |
| Plastics | | | 150,517 | | | | 123,669 | | | | 96,945 | | | | 80,208 | | | | 116,452 | | |
| Corporate Revenues and Intersegment Eliminations | | | (100 | ) | | | (343 | ) | | | (721 | ) | | | (275 | ) | | | (440 | ) | |
| Intersegment Eliminations | | | | (91 | ) | | | (100 | ) | | | (343 | ) | | | (721 | ) | | | (275 | ) |
| Total Operating Revenues | | $ | 859,239 | | | $ | 840,169 | | | $ | 717,897 | | | $ | 617,685 | | | $ | 769,839 | | | $ | 893,313 | | | $ | 859,239 | | | $ | 840,169 | | | $ | 717,897 | | | $ | 617,685 | |
| | | | | | | | | | | | | | | | | | | | | | |
Net Income from Continuing Operations | | $ | 38,968 | | | $ | 34,910 | | | $ | 26,280 | | | $ | 22,131 | | | $ | 30,700 | | | $ | 50,174 | | | $ | 38,968 | | | $ | 34,910 | | | $ | 26,280 | | | $ | 22,131 | |
| Net (Loss) Income from Discontinued Operations | | | (44,241 | ) | | | (48,153 | ) | | | (27,624 | ) | | | 3,900 | | | | 4,425 | | |
| Net (Loss) Income | | $ | (5,273 | ) | | $ | (13,243 | ) | | $ | (1,344 | ) | | $ | 26,031 | | | $ | 35,125 | | |
| Net Income (Loss) from Discontinued Operations | | | | 691 | | | | (44,241 | ) | | | (48,153 | ) | | | (27,624 | ) | | | 3,900 | |
| Net Income (Loss) | | | $ | 50,865 | | | $ | (5,273 | ) | | $ | (13,243 | ) | | $ | (1,344 | ) | | $ | 26,031 | |
| | | | | | | | | | | | | | | | | | | | | | |
Operating Cash Flow from Continuing Operations | | $ | 168,986 | | | $ | 93,678 | | | $ | 105,934 | | | $ | 125,646 | | | $ | 92,767 | | | $ | 150,283 | | | $ | 168,986 | | | $ | 93,678 | | | $ | 105,934 | | | $ | 125,646 | |
| Operating Cash Flow - Continuing and Discontinued Operations | | | 233,547 | | | | 104,383 | | | | 105,017 | | | | 162,750 | | | | 111,321 | | | | 147,781 | | | | 233,547 | | | | 104,383 | | | | 105,017 | | | | 162,750 | |
| Capital Expenditures - Continuing Operations | | | 115,762 | | | | 67,360 | | | | 58,264 | | | | 160,501 | | | | 217,604 | | | | 164,463 | | | | 115,762 | | | | 67,360 | | | | 58,264 | | | | 160,501 | |
| Total Assets | | | 1,602,337 | | | | 1,700,522 | | | | 1,770,555 | | | | 1,754,678 | | | | 1,692,587 | | | | 1,596,019 | | | | 1,602,337 | | | | 1,700,522 | | | | 1,770,555 | | | | 1,754,678 | |
| Long-Term Debt | | | 421,680 | | | | 471,915 | | | | 430,807 | | | | 431,083 | | | | 333,940 | | | | 389,589 | | | | 421,680 | | | | 471,915 | | | | 430,807 | | | | 431,083 | |
Basic Earnings Per Share - Continuing Operations (1) | | | 1.06 | | | | 0.95 | | | | 0.71 | | | | 0.60 | | | | 0.95 | | | | 1.37 | | | | 1.06 | | | | 0.95 | | | | 0.71 | | | | 0.60 | |
Basic (Loss) Earnings Per Share - Total (1) | | | (0.17 | ) | | | (0.40 | ) | | | (0.06 | ) | | | 0.71 | | | | 1.09 | | |
Basic Earnings (Loss) Per Share - Total (1) | | | | 1.39 | | | | (0.17 | ) | | | (0.40 | ) | | | (0.06 | ) | | | 0.71 | |
Diluted Earnings Per Share - Continuing Operations (1) | | | 1.05 | | | | 0.95 | | | | 0.71 | | | | 0.60 | | | | 0.95 | | | | 1.37 | | | | 1.05 | | | | 0.95 | | | | 0.71 | | | | 0.60 | |
Diluted (Loss) Earnings Per Share - Total (1) | | | (0.17 | ) | | | (0.40 | ) | | | (0.06 | ) | | | 0.71 | | | | 1.09 | | |
| Return on Average Common Equity | | | (1.1 | )% | | | (2.3 | )% | | | (0.3 | )% | | | 3.8 | % | | | 6.0 | % | |
Diluted Earnings (Loss) Per Share - Total (1) | | | | 1.39 | | | | (0.17 | ) | | | (0.40 | ) | | | (0.06 | ) | | | 0.71 | |
Return on Average Common Equity (2) | | | | 9.5 | % | | | (1.1 | )% | | | (2.3 | )% | | | (0.3 | )% | | | 3.8 | % |
| Dividends Declared Per Common Share | | | 1.19 | | | | 1.19 | | | | 1.19 | | | | 1.19 | | | | 1.19 | | | | 1.19 | | | | 1.19 | | | | 1.19 | | | | 1.19 | | | | 1.19 | |
| Dividend Payout Ratio | | | — | | | | — | | | | — | | | | 168 | % | | | 109 | % | | | 86 | % | | | — | | | | — | | | | — | | | | 168 | % |
| Common Shares Outstanding - Year End | | | 36,168 | | | | 36,102 | | | | 36,003 | | | | 35,812 | | | | 35,385 | | | | 36,272 | | | | 36,168 | | | | 36,102 | | | | 36,003 | | | | 35,812 | |
Number of Common Shareholders (2) | | | 14,584 | | | | 14,687 | | | | 14,848 | | | | 14,923 | | | | 14,627 | | |
Number of Common Shareholders (3) | | | | 14,252 | | | | 14,584 | | | | 14,687 | | | | 14,848 | | | | 14,923 | |
(1) Based on average number of shares outstanding.
(2) Earnings available for common shares divided by the 13-month average of month-end common equity balances.
(3) Holders of record at year end.
OVERVIEW
Otter Tail Corporation and its subsidiaries form a diverse group of businesses with operations classified into four segments: Electric, Manufacturing, ConstructionPlastics and Plastics.Construction. Our primary financial goals are to maximize earnings and cash flows and to allocate capital profitably toward growth opportunities that will increase shareholder value. Meeting these objectives enables us to preserve and enhance our financial capability by maintaining desired capitalization ratios and a strong interest coverage position and preserving investment grade credit ratings on outstanding securities, which, in the form of lower interest rates, benefits both our customers and shareholders.
Our strategy is to continue to grow our largest business, the regulated electric utility, which will lower our overall risk, create a more predictable earnings stream, improve our credit quality and preserve our ability to fund the dividend. Over time, we expect the electric utility business will provide approximately 75% to 85% of our overall earnings. We expect our manufacturing and infrastructure businesses will provide 15% to 25% of our earnings, and will continue to be a fundamental part of our strategy.
Reliable utility performance along with rate base investment opportunities over the next five years will provide us with a strong base of revenues, earnings and cash flows. We also look to our manufacturing and infrastructure companies to provide organic growth as well. Organic, internal growth comes from new products and services, market expansion and increased efficiencies. We expect much of our growth in these businesses in the next few years will come from utilizing expanded plant capacity from capital investments made in previous years. We will also evaluate opportunities to allocate capital to potential acquisitions in our Manufacturing segment. We are a committed long-term owner and therefore we do not acquire companies in pursuit of short-term gains. However, we will divest operating companies that no longer fit into our strategy and risk profile over the long term.
We have worked to realign our portfolio of businesses and refocus our capital investment in the electric utility. In 2011 and 2012Over the last three years we sold several businesses in execution of our announced strategy. In 2011 we sold Idaho Pacific Holdings, Inc. (IPH), our Food Ingredient Processing segment business, and E.W. Wylie Corporation (Wylie), our trucking company which was included in our Wind Energy segment. In January 2012 we sold the assets of Aviva Sports, Inc. (Aviva), a recreational equipment manufacturer and wholly owned subsidiary of ShoreMaster,Shrco, Inc. (ShoreMaster)(Shrco), our former waterfront equipment manufacturer. In February 2012 we sold DMS Health Technologies, Inc. (DMS), our Health Services segment business. In November 2012 we completed the sale of the assets of DMI Industries,IMD, Inc. (DMI)(IMD), our former wind tower manufacturer, of towers for wind turbines and we exited the wind tower manufacturing business. In December 2012On February 8, 2013 we entered into negotiations to sellsold substantially all of the assets of ShoreMaster and completed the sale on February 8, 2013. As a result of these 2011, 2012 and 2013 transactions, our business structure no longer includes Wind Energy, Health Services or Food Ingredient Processing segments, and now includes the remaining four segments listed above.Shrco.
In evaluating our portfolio of operating companies, we look for the following characteristics:
| | ● | a threshold level of net earnings and a return on invested capital in excess of our weighted average cost of capital, |
| | | a strategic differentiation from competitors and a sustainable cost advantage, |
| | | a stable or growing industry, |
| | | an ability to quickly adapt to changing economic cycles, and |
| | | a strong management team committed to operational excellence. |
Major growth strategies and initiatives in our future include:
| | | Planned capital budget expenditures of up to $906$769 million for the years 20132014 through 2017,2018, of which $811$657 million are for capital projects at Otter Tail Power Company (OTP), including $247$131 million for OTP’s share of a new air quality control system at Big Stone Plant and $348$304 million for anticipated expansion of transmission capacity including $253$243 million for MVPsMidcontinent Independent System Operator, Inc. (MISO) designated Multi-Value Projects (MVPs) and $45$26 million for CapX2020Capacity Expansion 2020 (CapX2020) transmission projects excluding $20($7 million for the Brookings to Southeast Twin Cities CapX2020 MVP project is included inwith the $253$243 million above.for MVP projects). The remainder of the 2013-2017OTP 2014-2018 anticipated capital expenditures is for asset replacements, additions and improvements across OTP’s generation, transmission, distribution and general plant. See “Capital Requirements” section for further discussion. |
| | | Utilization of existing and potentially expanded plant capacity from capital investments made in our manufacturing and infrastructure businesses. |
| | | Continued investigation and evaluation of organic growth opportunities and evaluation of opportunities to allocate capital to potential acquisitions in our Manufacturing segment. |
In 2012:2013:
| | | Our net cash from continuing and discontinued operations was $233.5$147.8 million. |
| | | Our Plastics segment net income increased 142.9% to $14.1 million. |
| ● | Our Manufacturing segment net income increased 29.7% to $10.7 million. |
| ● | Our Electric segment net income of $38.3 million decreased slightly from $38.9 million in 2011. |
| ● | Our Construction segment recorded a net lossincome of $7.7$1.3 million compared with a net loss of $2.2$7.7 million in 2011.2012. Net income from Aevenia, Inc. (Aevenia), our electrical design and construction services company, increased $2.2 million while Foley Company (Foley), our mechanical and prime contractor on industrial projects recordedwas $0.5 million compared to a net loss increasein 2012 of $7.7$10.0 million as a result of cost overruns on several large jobs.jobs which were substantially complete by the end of 2012. |
| | Our Manufacturing segment net income increased 7.3% to $11.5 million from $10.7 million in 2012. |
| | Our Electric segment net income of $38.2 million decreased slightly from $38.3 million in 2012. |
| | Our Plastics segment net income decreased 2.2% to $13.8 million from $14.1 million in 2012. |
The following table summarizes our consolidated results of operations for the years ended December 31:
| (in thousands) | | 2012 | | | 2011 | | | 2013 | | | 2012 | |
| Operating Revenues: | | | | | | | | | | | | |
| Electric | | $ | 350,679 | | | $ | 342,633 | | | $ | 373,459 | | | $ | 350,679 | |
| Manufacturing and Infrastructure | | | 508,560 | | | | 497,536 | | | | 519,854 | | | | 508,560 | |
| Total Operating Revenues | | $ | 859,239 | | | $ | 840,169 | | | $ | 893,313 | | | $ | 859,239 | |
| Net Income (Loss) From Continuing Operations: | | | | | | | | | | | | | | | | |
| Electric | | $ | 38,341 | | | $ | 38,886 | | | $ | 38,236 | | | $ | 38,341 | |
| Manufacturing and Infrastructure | | | 17,100 | | | | 11,836 | | | | 26,576 | | | | 17,100 | |
| Corporate | | | (16,473 | ) | | | (15,812 | ) | | | (14,638 | ) | | | (16,473 | ) |
| Total Net Income From Continuing Operations: | | $ | 38,968 | | | $ | 34,910 | | | $ | 50,174 | | | $ | 38,968 | |
Revenue increases in our Electric, Plastics Manufacturing and ElectricConstruction segments were partially offset by a decrease in revenues from our ConstructionManufacturing segment, resulting in a 2.3%4.0% increase in consolidated revenues in 20122013 compared with 2011.2012. Revenues from our Electric segment increased $22.8 million reflecting: (1) a $20.2 million increase in retail revenue as a result of a 5.8% increase in retail kilowatt-hour (kwh) sales due mainly to colder weather in 2013 evidenced by a 37% increase in heating degree days between the years, and (2) a $1.9 million increase in wholesale revenues from excess generation as a result of a 15.9% increase in prices received on wholesale energy sales. Revenues from our Plastics segment increased $26.8$14.4 million as a result of a combination of increased sales volume and higher prices per pound12.0% increase in pounds of polyvinyl chloride (PVC) pipe sold.sold partially offset by lower PVC pipe prices. Revenues from our Construction segment increased $0.8 million as a $16.5 million increase in revenue at Foley was mostly offset by a $15.7 million decrease in revenues at Aevenia, Inc. (Aevenia) our electrical design and construction services company, $5.4 million of which relates to Aevenia’s sale of Moorhead Electric in October of 2012. Revenues from our Manufacturing segment increased $19.5decreased $4.0 million as a result of higherthe discontinued production of a major packaging product for a customer who took production in-house and lower sales volume due to improved customerreduced demand forfrom customers in end markets serving the productsconstruction and services provided by our manufacturing companies. Revenues from our Electric segment increased $8.0 million as a result of: (1) a $4.3 million increase in retail revenue, reflecting increases in transmission cost recovery revenues and revenues from Minnesota customers following implementation of new rates in October 2011, and (2) a $3.6 million increase in Midwest Independent Transmission System Operator (MISO) Schedule 26 transmission tariff revenues, driven in part by returns on, and recovery of, CapX2020 investment costs and operating expenses. Revenues from our Construction segment decreased $35.6 million as Foley’s job volume and revenues recognized on a percentage-of-completion basis declined.energy industries.
The following table sets forth actual 20122013 consolidated diluted earnings per share results from continuing operations against the last forecast we provided for 20122013 on a GAAP basis, and also shows the effect on a non-GAAP basis of the November 2013 early retirement of $47.7 million of our $50previously outstanding $100 million 8.89% Senior Unsecured Note9.000% Notes due 2017 (the Cascade Note).December 15, 2016.
| | | | | |
2013 Earnings Per Share Guidance Range December 2, 2013 | 2013
Earnings
Per Share | 2012
Earnings
Per Share |
| | Low | High |
| Electric | $1.02 | $1.04 | $1.05 | $1.06 |
| Manufacturing | $0.30 | $0.33 | $0.32 | $0.29 |
| Plastics | $0.35 | $0.37 | $0.38 | $0.39 |
| Construction | $0.03 | $0.05 | $0.04 | ($0.21) |
| Corporate – Recurring Costs | ($0.32) | ($0.29) | ($0.25) | ($0.22) |
Subtotal – Non-GAAP Basis1 | $1.38 | $1.50 | $1.54 | $1.31 |
| Corporate – Loss on Debt Extinguishment | ($0.17) | ($0.17) | ($0.17) | ($0.22) |
| Corporate – Interest on Debt Related to Discontinued Operations | | | | ($0.04) |
| Total – Continuing Operations - GAAP Basis | $1.21 | $1.33 | $1.37 | $1.05 |
| 1In November 2013 we retired early $47.7 million of our previously outstanding $100 million 9.000% Notes due December 15, 2016 from available cash. In July 2012 we retired early our $50 million, 8.89% Senior Unsecured Note due November 30, 2017 from proceeds generated in connection with the divestiture of IMD. Generally Accepted Accounting Principles require that in order for debt retirement premiums and related interest expense to be reported as discontinued operations, a company must be required by the lender to repay the related debt as a result of the disposition. Although we were not legally obligated to repay the aforementioned $50 million note, management believes it is appropriate to associate the 2012 debt prepayment premium and interest expense with its discontinued operations to provide a better indication of future earnings. Management understands that there are material limitations on the use of Non-GAAP measures. Non-GAAP measures are not substitutes for GAAP measures for the purpose of analyzing financial performance. Non-GAAP measures are not in accordance with, or an alternative for, measures prepared in accordance with, generally accepted accounting principles and may be different from Non-GAAP measures used by other companies. In addition, Non-GAAP measures are not based on any comprehensive set of accounting rules or principles. This information should not be construed as an alternative to the reported results, which have been determined in accordance with GAAP. |
2012 Earnings Per Share Guidance Range November 5, 2012 | 2012 GAAP
Earnings Per
Share | 2012 Non-
GAAP Items | 2012 Non-GAAP
Earnings Per
Share |
| | Low | High |
| Electric | $1.01 | $1.06 | $1.06 | -- | $1.06 |
| Manufacturing (without ShoreMaster) | $0.26 | $0.30 | $0.29 | -- | $0.29 |
| Net Loss from ShoreMaster | ($0.08) | ($0.07) | -- | -- | -- |
| Construction | ($0.23) | ($0.18) | ($0.21) | -- | ($0.21) |
| Plastics | $0.32 | $0.37 | $0.39 | -- | $0.39 |
| Corporate – Recurring Costs | ($0.22) | ($0.17) | ($0.26) | $0.04 | ($0.22) |
Subtotal | $1.06 | $1.31 | $1.27 | $0.04 | $1.31 |
| Corporate – Premium Paid on Debt Extinguishment | ($0.22) | ($0.22) | ($0.22) | $0.22 | -- |
| Total – Continuing Operations | $0.84 | $1.09 | $1.05 | $0.26 | $1.31 |
| Discontinued Operations: | | | | | |
| Net Losses from Discontinued Operations | ($1.00) | ($0.95) | ($1.22) | -- | ($1.22) |
Premium Paid on Debt Extinguishment in Connection with DMI Disposition1 | -- | -- | -- | ($0.22) | ($0.22) |
2012 Interest Expense on Debt Extinguished in Connection with DMI Disposition1 | -- | -- | -- | ($0.04) | ($0.04) |
| Total – Discontinued Operations | ($1.00) | ($0.95) | ($1.22) | ($0.26) | ($1.48) |
| Total | ($0.16) | $0.14 | ($0.17) | -- | ($0.17) |
1We retired early the Cascade Note from proceeds generated in connection with the divestiture of DMI. Generally Accepted Accounting Principles require that in order for debt retirement premiums and related interest expense to be reported as discontinued operations, a company must be required by the lender to repay the related debt as a result of the disposition. Although we were not legally obligated to repay the aforementioned note, we believe it is appropriate to associate the 2012 debt prepayment premium and interest expense with our discontinued operations to provide a better indication of future earnings. |
Following is a more detailed analysis of our operating results by business segment for the three years ended December 31, 2013, 2012 2011 and 2010,2011, followed by a discussion of our financial position at the end of 20122013 and our outlook for 2013.2014.
RESULTS OF OPERATIONSMANUFACTURING
This discussion and analysis should be read in conjunction with our consolidated financial statements and related notes. See note 2 to our consolidated financial statements for a complete description of our lines of business, locations of operations and principal products and services.General
Intersegment Eliminations—Amounts presentedManufacturing consists of businesses engaged in the following segment tables for 2012, 2011activities: contract machining, metal parts stamping and 2010 operating revenues, costfabrication, and production of goods soldmaterial handling trays and other nonelectric operating expenses will not agree with amounts presented in the consolidated statements of income due to the elimination of intersegment transactions. The amounts of intersegment eliminations by income statement line item are listed below:
Intersegment Eliminations (in thousands) | | 2012 | | | 2011 | | | 2010 | |
| Operating Revenues: | | | | | | | | | |
| Electric | | $ | 86 | | | $ | 94 | | | $ | 115 | |
| Nonelectric | | | 14 | | | | 249 | | | | 606 | |
| Cost of Goods Sold | | | 68 | | | | 122 | | | | (57 | ) |
| Other Nonelectric Expenses | | | 32 | | | | 221 | | | | 778 | |
ELECTRIChorticultural containers.
The following table summarizesCompany derived 23%, 24% and 23% of its consolidated operating revenues and 21%, 26% and 22% of its consolidated operating income from the results of operations for our ElectricManufacturing segment for the years ended December 31:31, 2013, 2012 and 2011, respectively. Following is a brief description of each of these businesses:
(in thousands) | | 2012 | | | %
change | | | 2011 | | | %
change | | | 2010 | |
| Retail Sales Revenues | | $ | 308,530 | | | | 1 | | | $ | 304,181 | | | | -- | | | $ | 305,146 | |
| Wholesale Revenues – Company Generation | | | 12,951 | | | | (11 | ) | | | 14,518 | | | | (28 | ) | | | 20,053 | |
| Net Revenue – Energy Trading Activity | | | 1,426 | | | | (39 | ) | | | 2,319 | | | | (26 | ) | | | 3,144 | |
| Other Revenues | | | 27,858 | | | | 28 | | | | 21,709 | | | | 35 | | | | 16,036 | |
| Total Operating Revenues | | $ | 350,765 | | | | 2 | | | $ | 342,727 | | | | -- | | | $ | 344,379 | |
| Production Fuel | | | 66,284 | | | | (4 | ) | | | 69,017 | | | | (6 | ) | | | 73,102 | |
| Purchased Power – System Use | | | 49,184 | | | | 13 | | | | 43,451 | | | | (3 | ) | | | 44,788 | |
| Other Operation and Maintenance Expenses | | | 121,069 | | | | 4 | | | | 115,863 | | | | 3 | | | | 112,174 | |
| Asset Impairment | | | 432 | | | | (8 | ) | | | 470 | | | | -- | | | | -- | |
| Depreciation and Amortization | | | 42,051 | | | | 4 | | | | 40,283 | | | | -- | | | | 40,241 | |
| Property Taxes | | | 10,720 | | | | 5 | | | | 10,190 | | | | 9 | | | | 9,364 | |
| Operating Income | | $ | 61,025 | | | | (4 | ) | | $ | 63,453 | | | | (2 | ) | | $ | 64,710 | |
Electric kilowatt-hours (kwh) Sales (in thousands) | | 2012 | | | %
change | | | 2011 | | | %
change | | | 2010 | |
| Retail kwh Sales | | | 4,240,789 | | | | (1 | ) | | | 4,291,637 | | | | 1 | | | | 4,262,748 | |
| Wholesale kwh Sales – Company Generation | | | 476,637 | | | | (7 | ) | | | 510,978 | | | | (18 | ) | | | 624,153 | |
| Wholesale kwh Sales – Purchased Power Resold | | | 88,637 | | | | (28 | ) | | | 122,430 | | | | (64 | ) | | | 336,875 | |
2012Competition
The various markets in which the Manufacturing segment entities compete are characterized by intense competition from both foreign and domestic manufacturers. These markets have many established manufacturers with broader product lines, greater distribution capabilities, greater capital resources, excess capacity, labor advantages and larger marketing, research and development staffs and facilities than the Company’s manufacturing entities.
The Company believes the principal competitive factors in its Manufacturing segment are product performance, quality, price, technical innovation, cost effectiveness, customer service and breadth of product line. The Company’s manufacturing entities intend to continue to compete on the basis of high-performance products, innovative production technologies, cost-effective manufacturing techniques, close customer relations and support, and increasing product offerings.
Raw Materials Supply
The companies in the Manufacturing segment use raw materials in the products they manufacture, including steel, aluminum and polystyrene and other plastics resins. Both pricing increases and availability of these raw materials are concerns of companies in the Manufacturing segment. The companies in the Manufacturing segment attempt to pass increases in the costs of these raw materials on to their customers. Increases in the costs of raw materials that cannot be passed on to customers could have a negative effect on profit margins in the Manufacturing segment.
Backlog
The Manufacturing segment has backlog in place to support 2014 revenues of approximately $136 million compared with 2011$124 million one year ago.
Retail
Capital Expenditures
Capital expenditures in the Manufacturing segment typically include additional investments in new manufacturing equipment or expenditures to replace worn-out manufacturing equipment. Capital expenditures may also be made for the purchase of land and buildings for plant expansion and for investments in management information systems. During 2013, cash expenditures for capital additions in the Manufacturing segment were approximately $7 million. Total capital expenditures for the Manufacturing segment during the five-year period 2014-2018 are estimated to be approximately $81 million.
Employees
At December 31, 2013 the Manufacturing segment had 1,059 full-time employees. There are 932 full-time employees at BTD and 127 full-time employees at T.O. Plastics.
PLASTICS
General
Plastics consists of businesses producing PVC pipe at plants in North Dakota and Arizona. The Company derived 18%, 18% and 15% of its consolidated operating revenues and 25%, 32% and 15% of its consolidated operating income from the Plastics segment for the years ended December 31, 2013, 2012 and 2011, respectively. Following is a brief description of these businesses:
Northern Pipe Products, Inc. (Northern Pipe), located in Fargo, North Dakota, manufactures and sells PVC pipe for municipal water, rural water, wastewater, storm drainage systems and other uses in the northern, midwestern, south-central and western regions of the United States as well as central and western Canada. Production facilities are located in Fargo, North Dakota.
Vinyltech Corporation (Vinyltech), located in Phoenix, Arizona, manufactures and sells PVC pipe for municipal water, wastewater, water reclamation systems and other uses in the western and south-central regions of the United States.
Together these companies have the current capacity to produce approximately 300 million pounds of PVC pipe annually.
Customers
PVC pipe products are marketed through a combination of independent sales representatives, company salespersons and customer service representatives. Customers for the PVC pipe products consist primarily of wholesalers and distributors throughout the northern, midwestern, south-central and western United States.
Competition
The plastic pipe industry is fragmented and competitive, due to the number of producers, the small number of raw material suppliers and the fungible nature of the product. Due to shipping costs, competition is usually regional, instead of national, in scope. The principal areas of competition are a combination of price, service, warranty, and product performance. Northern Pipe and Vinyltech compete not only against other plastic pipe manufacturers, but also ductile iron, steel, concrete and clay pipe producers. Pricing pressure will continue to affect operating margins in the future.
Northern Pipe and Vinyltech intend to continue to compete on the basis of their high quality products, cost-effective production techniques and close customer relations and support.
Manufacturing and Resin Supply
PVC pipe is manufactured through a process known as extrusion. During the production process, PVC compound (a dry powder-like substance) is introduced into an extrusion machine, where it is heated to a molten state and then forced through a sizing apparatus to produce the pipe. The newly extruded pipe is then pulled through a series of water cooling tanks, marked to identify the type of pipe and cut to finished lengths. Warehouse and outdoor storage facilities are used to store the finished product. Inventory is shipped from storage to distributors and customers mainly by common carrier.
The PVC resins are acquired in bulk and shipped to point of use by rail car. There are a limited number of third party vendors that supply the PVC resin used by Northern Pipe and Vinyltech. Two vendors provided approximately 93% and 90% of total resin purchases in 2013 and 2012, respectively. The supply of PVC resin may also be limited primarily due to manufacturing capacity and the limited availability of raw material components. A majority of U.S. resin production plants are located in the Gulf Coast region, which is subject to risk of damage to the plants and potential shutdown of resin production because of exposure to hurricanes that occur in that part of the United States. The loss of a key vendor, or any interruption or delay in the supply of PVC resin, could disrupt the ability of the Plastics segment to manufacture products, cause customers to cancel orders or require incurrence of additional expenses to obtain PVC resin from alternative sources, if such sources were available. Both Northern Pipe and Vinyltech believe they have good relationships with their key raw material vendors.
Due to the commodity nature of PVC resin and PVC pipe and the dynamic supply and demand factors worldwide, historically the markets for both PVC resin and PVC pipe have been very cyclical with significant fluctuations in prices and gross margins.
Capital Expenditures
Capital expenditures in the Plastics segment typically include investments in extrusion machines, land and buildings and management information systems. During 2013, cash expenditures for capital additions in the Plastics segment were approximately $3 million. Total capital expenditures for the five-year period 2014-2018 are estimated to be approximately $14 million to replace existing equipment.
Employees
At December 31, 2013 the Plastics segment had 136 full-time employees. Northern Pipe had 89 full-time employees and Vinyltech had 47 full-time employees as of December 31, 2013.
CONSTRUCTION
General
Construction consists of businesses involved in commercial and industrial electric contracting and construction of fiber optic and electric distribution systems, water, wastewater and HVAC systems primarily in the central United States.
The Company derived 17%, 17% and 22% of its consolidated operating revenues and 3%, (15)% and (4)% of its consolidated operating income from the Construction segment for each of the years ended December 31, 2013, 2012 and 2011, respectively. Following is a brief description of the businesses included in this segment:
Foley Company (Foley), headquartered in Kansas City, Missouri, provides mechanical and prime contracting services for water and wastewater treatment plants, power generation plants, hospital and pharmaceutical facilities, and other industrial and manufacturing projects across a multi-state service area in the United States.
Aevenia, Inc. (Aevenia), located in Moorhead, Minnesota, has divisions that provide a full spectrum of electrical design and construction services for the industrial, commercial and municipal business markets, including government, institutional, utility communications and electric distribution.
Competition
Each of the construction companies is subject to competition, as well as the effects of general economic conditions in their respective disciplines and geographic locations. The construction companies must compete with other construction companies primarily in the Upper Midwest and the Central regions of the United States, including companies with greater financial resources, when bidding on new projects. The Company believes the principal competitive factors in the Construction segment are price, quality of work and customer service.
Backlog
The construction companies have backlog in place of $77 million for 2014 compared with $151 million one year ago.
Capital Expenditures
Capital expenditures in this segment typically include investments in additional construction equipment. During 2013, cash expenditures for capital additions in the Construction segment were approximately $5 million. Capital expenditures during the five-year period 2014-2018 are estimated to be approximately $17 million for the Construction segment.
Employees
At December 31, 2013 there were 426 full-time employees in the Construction segment. There are 232 full-time employees at Foley and 194 full-time employees at Aevenia. Foley has 178 employees represented by various unions, including Carpenters and Millwrights, Laborers, Operating Engineers, Pipe Fitters, Plumbers, Teamsters and Cement Masons. Foley has several labor contracts with various expiration dates in 2014 (124 employees), one contract that expires in March 2015 (14 employees), one contract that expires in April 2017 (8 employees) and one contract that expires in May 2018 (11 employees). Foley also employs 21 people under contracts held by the Tennessee Valley Authority. Foley has not experienced any strike, work stoppage or strike vote, and considers its present relations with employees to be good.
RISK FACTORS AND CAUTIONARY STATEMENTS
Our businesses are subject to various risks and uncertainties. Any of the risks described below or elsewhere in this Annual Report on Form 10-K or in our other SEC filings could materially adversely affect our business, financial condition and results of operations.
GENERAL
Federal and state environmental regulation could require us to incur substantial capital expenditures and increased operating costs.
We are subject to federal, state and local environmental laws and regulations relating to air quality, water quality, waste management, natural resources and health safety. These laws and regulations regulate the modification and operation of existing facilities, the construction and operation of new facilities and the proper storage, handling, cleanup and disposal of hazardous waste and toxic substances. Compliance with these legal requirements requires us to commit significant resources and funds toward environmental monitoring, installation and operation of pollution control equipment, payment of emission fees and securing environmental permits. Obtaining environmental permits can entail significant expense and cause substantial construction delays. Failure to comply with environmental laws and regulations, even if caused by $4.3factors beyond our control, may result in civil or criminal liabilities, penalties and fines.
Existing environmental laws or regulations may be revised and new laws or regulations may be adopted or become applicable to us. Revised or additional regulations, which result in increased compliance costs or additional operating restrictions, particularly if those costs are not fully recoverable from customers, could have a material effect on our results of operations.
Volatile financial markets and changes in our debt ratings could restrict our ability to access capital and increase borrowing costs and pension plan and postretirement health care expenses.
We rely on access to both short- and long-term capital markets as a source of liquidity for capital requirements not satisfied by cash flows from operations. If we are unable to access capital at competitive rates, our ability to implement our business plans may be adversely affected. Market disruptions or a downgrade of our credit ratings may increase the cost of borrowing or adversely affect our ability to access one or more financial markets.
Disruptions, uncertainty or volatility in the financial markets can also adversely impact our results of operations, the ability of customers to finance purchases of goods and services, and our financial condition, as well as exert downward pressure on stock prices and/or limit our ability to sustain our current common stock dividend level.
Changes in the U.S. capital markets could also have significant effects on our pension plan. Our pension income or expense is affected by factors including the market performance of the assets in the master pension trust maintained for the pension plan for some of our employees, the weighted average asset allocation and long-term rate of return of our pension plan assets, the discount rate used to determine the service and interest cost components of our net periodic pension cost and assumed rates of increase in our employees’ future compensation. If our pension plan assets do not achieve positive rates of return, or if our estimates and assumed rates are not accurate, our earnings may decrease because net periodic pension costs would rise and we could be required to provide additional funds to cover our obligations to employees under the pension plan.
Discretionary contributions totaling $20.0 million were made to our defined benefit pension plan in January 2014. We could be required to contribute additional capital to the pension plan in the future if the market value of pension plan assets significantly declines, plan assets do not earn in line with our long-term rate of return assumptions or relief under the Pension Protection Act is no longer granted.
Any significant impairment of our goodwill would cause a decrease in our asset values and a reduction in our net operating income.
We had approximately $39.0 million of goodwill recorded on our consolidated balance sheet as of December 31, 2013. We have recorded goodwill for businesses in each of our business segments except Electric. If we make changes in our business strategy or if market or other conditions adversely affect operations in any of these businesses, we may be forced to record an impairment charge, which would lead to decreased assets and a reduction in net operating performance. Goodwill is tested for impairment annually or whenever events or changes in circumstances indicate impairment may have occurred. If the testing performed indicates that impairment has occurred, we are required to record an impairment charge for the difference between the carrying amount of the goodwill and the implied fair value of the goodwill in the period the determination is made. The testing of goodwill for impairment requires us to make significant estimates about our future performance and cash flows, as well as other assumptions. These estimates can be affected by numerous factors, including changes in economic, industry or market conditions, changes in business operations, future business operating performance, changes in competition or changes in technologies. Any changes in key assumptions, or actual performance compared with key assumptions, about our business and its future prospects or other assumptions could affect the fair value of one or more business segments, which may result in an impairment charge.
Declines in projected operating cash flows at any of our reporting units may result in goodwill impairments that could adversely affect our results of operations and financial position, as well as financing agreement covenants.
We currently have $7.3 million of goodwill and a $1.1 million indefinite-lived trade name recorded on our consolidated balance sheet related to the acquisition of Foley in 2003. Foley net earnings improved $10.4 million between 2012 and 2013. If future expected operating profits do not meet our projections, reductions in anticipated cash flows from Foley may indicate its fair value is less than its book value, resulting in an impairment of some or all of the goodwill and indefinite-lived intangible assets associated with Foley along with a corresponding charge against earnings.
The inability of our subsidiaries to provide sufficient earnings and cash flows to allow us to meet our financial obligations and debt covenants and pay dividends to our shareholders could have an adverse effect on the Company.
Otter Tail Corporation is a holding company with no significant operations of its own. The primary source of funds for payment of our financial obligations and dividends to our shareholders is from cash provided by our subsidiary companies. Our ability to meet our financial obligations and pay dividends on our common stock principally depends on the actual and projected earnings, cash flows, capital requirements and general financial position of our subsidiary companies, as well as regulatory factors, financial covenants, general business conditions and other matters.
Under our $150 million revolving credit agreement we may not permit the ratio of our Interest-bearing Debt to Total Capitalization to be greater than 0.60 to 1.00. OTP may not permit the ratio of its Interest-bearing Debt to Total Capitalization to be greater than 0.60 to 1.00 under its $170 million revolving credit agreement. Both credit agreements contain restrictions on the payment of cash dividends on a default or event of default. As of December 31, 2013 we were in compliance with the debt covenants.
Under the Federal Power Act, a public utility may not pay dividends from any funds properly included in a capital account. What constitutes “funds properly included in a capital account” is undefined in the Federal Power Act or the related regulations; however, FERC has consistently interpreted the provision to allow dividends to be paid as long as (1) the source of the dividends is clearly disclosed, (2) the dividend is not excessive and (3) there is no self-dealing on the part of corporate officials. The MPUC indirectly limits the amount of dividends OTP can pay to us by requiring an equity-to-total-capitalization ratio between 44.8% and 54.8%. OTP’s equity-to-total-capitalization ratio was 50.2% as of December 31, 2013.
While these restrictions are not expected to affect our ability to pay dividends at the current level in the foreseeable future, there is no assurance that adverse financial results would not reduce or eliminate our ability to pay dividends. Our dividend payout ratio has exceeded our earnings (losses) in four of the last five years.
Economic conditions could negatively impact our businesses.
Our businesses are affected by local, national and worldwide economic conditions. Tightening of credit in financial markets could adversely affect the ability of customers to finance purchases of our goods and services, resulting in decreased orders, cancelled or deferred orders, slower payment cycles, and increased bad debt and customer bankruptcies. Our businesses may also be adversely affected by decreases in the general level of economic activity, such as decreases in business and consumer spending. A decline in the level of economic activity and uncertainty regarding energy and commodity prices could adversely affect our results of operations and our future growth.
If we are unable to achieve the organic growth we expect, our financial performance may be adversely affected.
We expect much of our growth in the next few years will come from major capital investment at existing companies. To achieve the organic growth we expect, we will have to have access to the capital markets, be successful with capital expansion programs related to organic growth, develop new products and services, expand our markets and increase efficiencies in our businesses. Competitive and economic factors could adversely affect our ability to do this. If we are unable to achieve and sustain consistent organic growth, we will be less likely to meet our revenue growth targets, which, together with any resulting impact on our net income growth, may adversely affect the market price of our common shares.
Our plans to grow and realign our business mix through capital projects, acquisitions and dispositions may not be successful, which could result in poor financial performance.
As part of our business strategy, we intend to increase capital expenditures in our existing businesses and to continually assess our mix of businesses and potential strategic acquisitions or dispositions. There are risks associated with capital expenditures including not being granted timely or full recovery of rate base additions in our regulated utility business and the inability to recover the cost of capital additions due to an economic downturn, lack of markets for new products, competition from producers of lower cost or alternative products, product defects or loss of customers. We may not be able to identify appropriate acquisition candidates or successfully negotiate, finance or integrate acquisitions. Future acquisitions could involve numerous risks including: difficulties in integrating the operations, services, products and personnel of the acquired business; and the potential loss of key employees, customers and suppliers of the acquired business. If we are unable to successfully manage these risks, we could face reductions in net income in future periods.
We may, from time to time, sell assets to provide capital to fund investments in our electric utility business or for other corporate purposes, which could result in the recognition of a loss on the sale of any assets sold and other potential liabilities. The sale of any of our businesses also exposes us to additional risks associated with indemnification obligations under the applicable sales agreements and any related disputes.
As part of our business strategy, we continually assess our business portfolio to determine if our operating companies continue to meet our portfolio criteria. A loss on the sale of a business would be recognized if a company is sold for less than its book value.
In certain transactions we retain obligations that have arisen, or subsequently arise, out of our conduct of the business prior to the sale. These obligations are sometimes direct or, in other cases, take the form of an indemnification obligation to the buyer. These obligations include such things as warranty, environmental, and the collection of certain receivables. Unforeseen costs related to these obligations could result in future losses related to the business sold.
Our plans to grow and operate our manufacturing and infrastructure businesses could be limited by state law.
Our plans to grow and operate our manufacturing and infrastructure businesses could be adversely affected by legislation in one or more states that may attempt to limit the amount or level of diversification permitted in a holding company structure that includes a regulated utility company or affiliated nonelectric companies.
Significant warranty claims and remediation costs in excess of amounts normally reserved for such items could adversely affect our results of operations and financial condition.
Depending on the specific product or service, we may provide certain warranty terms against manufacturing defects and certain materials. We reserve for warranty claims based on industry experience and estimates made by management. For some of our products we have limited history on which to base our warranty estimate. Our assumptions could be materially different from any actual claim and could exceed reserve balances.
Expenses associated with remediation activities of our former wind tower manufacturer, could be substantial. The potential exists for multiple claims based on one defect repeated throughout the production process or for claims where the cost to repair or replace the defective part is highly disproportionate to the original cost of the part. If we are required to cover remediation expenses in addition to our regular warranty coverage, we could be required to accrue additional expenses and experience additional unplanned cash expenditures which could adversely affect our consolidated results of operations and financial condition.
We are subject to risks associated with energy markets.
Our businesses are subject to the risks associated with energy markets, including market supply and increasing energy prices. If we are faced with shortages in market supply, we may be unable to fulfill our contractual obligations to our retail, wholesale and other customers at previously anticipated costs. This could force us to obtain alternative energy or fuel supplies at higher costs or suffer increased liability for unfulfilled contractual obligations. Any significantly higher than expected energy or fuel costs would negatively affect our financial performance.
We are subject to risks and uncertainties related to the timing of recovery of deferred tax assets which could have a negative impact on our net income in future periods.
If taxable income is not generated in future periods in certain tax jurisdictions the recovery of deferred taxes related to accumulated tax benefits may be delayed and we may be required to record a reserve related to the uncertainty of the timing of recovery of deferred tax assets related to accumulated taxable losses in those tax jurisdictions. This would have a negative impact on the Company’s net income in the period the reserve is recorded.
We rely on our information systems to conduct our business, and failure to protect these systems against security breaches or cyber-attacks could adversely affect our business and results of operations. Additionally, if these systems fail or become unavailable for any significant period of time, our business could be harmed.
Our electric utility company, OTP, owns electric transmission and generation facilities subject to mandatory and enforceable standards advanced by the North American Electric Reliability Corporation (NERC). These bulk electric system facilities provide the framework for the electrical infrastructure of OTP’s service territory and interconnected systems, the operation of which is dependent on information technology systems. Further, the information systems that operate OTP’s electric system are interconnected to external networks. Parties that wish to disrupt the U.S. bulk power system or OTP’s operations could view OTP’s computer systems, software or networks as attractive targets for cyber-attack. Also, our businesses require us to collect and maintain sensitive customer data, as well as confidential employee and shareholder information, which is subject to electronic theft or loss. We also use third-party vendors to electronically process certain of our business transactions. The efficient operation of our business is dependent on computer hardware and software systems. Information systems, both ours and those of third-party information processors, are vulnerable to security breach by computer hackers and cyber terrorists.
A successful cyber-attack on the systems that control our generation, transmission, distribution or other assets could severely disrupt business operations, preventing us from serving customers or collecting revenues. The breach of certain business systems could affect our ability to correctly record, process and report financial information and transactions. A major cyber incident could result in significant expenses to investigate and repair security breaches or system damage and could lead to litigation, fines, other remedial action, heightened regulatory scrutiny and damage to our reputation. In addition, the misappropriation, corruption or loss of personally identifiable information and other confidential data could lead to significant breach notification expenses and mitigation expenses such as credit monitoring. We maintain property and casualty insurance that may cover certain physical damage or third party injuries caused by potential cybersecurity incidents. However, other damage and claims arising from such incidents may not be covered or may exceed the amount of any insurance available.
OTP is subject to mandatory cybersecurity regulatory requirements. OTP implements the NERC standards for operating its transmission and generation assets and stays abreast of best practices within business and the utility industry to protect its computers and computer controlled systems from outside attack. We rely on industry accepted security measures and technology to securely maintain confidential and proprietary information maintained on our information systems. In an effort to reduce the likelihood and severity of cyber intrusions, we have cybersecurity processes and controls designed to protect and preserve the confidentiality, integrity and availability of data and systems. However, all these measures and technology may not adequately prevent security breaches or cyber-attacks. In addition, the unavailability of the information systems or failure of these systems to perform as anticipated for any reason could disrupt our business and could result in decreased performance and increased overhead costs, causing our business and results of operations to suffer. Any significant interruption or failure of our information systems or any significant breach of security due to cyber-attacks, hacking or internal security breaches could adversely affect our business and results of operations.
ELECTRIC
We may experience fluctuations in revenues and expenses related to our electric operations, which may cause our financial results to fluctuate and could impair our ability to make distributions to shareholders or scheduled payments on our debt obligations, or to meet covenants under our borrowing agreements.
A number of factors, many of which are beyond our control, may contribute to fluctuations in our revenues and expenses from electric operations, causing our net income to fluctuate from period to period. These risks include fluctuations in the volume and price of sales of electricity to customers or other utilities, which may be affected by factors such as mergers and acquisitions of other utilities, geographic location of other utilities, transmission costs (including increased costs related to operations of regional transmission organizations), changes in the manner in which wholesale power is sold and purchased, unplanned interruptions at OTP’s generating plants, the effects of regulation and legislation, demographic changes in OTP’s customer base and changes in OTP’s customer demand or load growth. Electric wholesale margins have been significantly and adversely affected by increased efficiencies in the MISO market. Electric wholesale trading margins could also be adversely affected by losses due to trading activities. Other risks include weather conditions or changes in weather patterns (including severe weather that could result in damage to OTP’s assets), fuel and purchased power costs and the rate of economic growth or decline in OTP’s service areas. A decrease in revenues or an increase in expenses related to our electric operations may reduce the amount of funds available for our existing and future businesses, which could result in increased financing requirements, impair our ability to make expected distributions to shareholders or impair our ability to make scheduled payments on our debt obligations, or to meet covenants under our borrowing agreements.
Actions by the regulators of our electric operations could result in rate reductions, lower revenues and earnings or delays in recovering capital expenditures.
We are subject to federal and state legislation, government regulations and regulatory actions that may have a negative impact on our business and results of operations. The electric rates that OTP is allowed to charge for its electric services are one of the most important items influencing our financial position, results of operations and liquidity. The rates that OTP charges its electric customers are subject to review and determination by state public utility commissions in Minnesota, North Dakota and South Dakota. OTP is also regulated by the FERC. An adverse decision by one or more regulatory commissions concerning the level or method of determining electric utility rates, the authorized returns on equity, implementation of enforceable federal reliability standards or other regulatory matters, permitted business activities (such as ownership or operation of nonelectric businesses) or any prolonged delay in rendering a decision in a rate or other proceeding (including with respect to the recovery of capital expenditures in rates) could result in lower revenues and net income.
Depending on the outcome of the U.S. Supreme Court review of the 7th Circuit U.S. Court of Appeals decision relating to MVPs, OTP could be required to absorb a disproportionate share of costs for transmission investments if the MISO MVP cost allocation changes. These costs may not be recoverable through a transmission tariff and could result in reduced returns on invested capital and/or increased rates to OTP’s retail electric customers. Depending on the outcome of a November 12, 2013 FERC complaint filed by a group of industrial customers and other stakeholders seeking to reduce the return on equity component of the transmission rates that MISO transmission owners, including OTP, may collect under the relevant MISO tariff, OTP may receive a lower return on equity on its MISO transmission rates and this may impact future revenues for transmission services provided in MISO.
OTP’s electric generating facilities are subject to operational risks that could result in unscheduled plant outages, unanticipated operation and maintenance expenses and increased power purchase costs.
Operation of electric generating facilities involves risks which can adversely affect energy output and efficiency levels. Most of OTP’s generating capacity is coal-fired. OTP relies on a limited number of suppliers of coal, making it vulnerable to increased prices for fuel as existing contracts expire or in the event of unanticipated interruptions in fuel supply. OTP is a captive rail shipper of the BNSF Railway for shipments of coal to its Big Stone and Hoot Lake plants, making it vulnerable to increased prices for coal transportation from a sole supplier. Higher fuel prices result in higher electric rates for OTP’s retail customers through fuel clause adjustments and could make it less competitive in wholesale electric markets. Operational risks also include facility shutdowns due to breakdown or failure of equipment or processes, labor disputes, operator error and catastrophic events such as fires, explosions, floods, intentional acts of destruction or other similar occurrences affecting OTP’s electric generating facilities. The loss of a major generating facility would require OTP to find other sources of supply, if available, and expose it to higher purchased power costs.
Changes to regulation of generating plant emissions, including but not limited to CO2 emissions, could affect our operating costs and the costs of supplying electricity to our customers.
Existing or new laws or regulations passed or issued by federal or state authorities addressing climate change or reductions of greenhouse gas emissions, such as mandated levels of renewable generation, mandatory reductions in CO2 emission levels, taxes on CO2 emissions or cap and trade regimes, could require us to incur significant new costs, which could negatively impact our net income, financial position and operating cash flows if such costs cannot be recovered through rates granted by ratemaking authorities in the states where OTP provides service or through increased market prices for electricity. Debate continues in Congress on the direction and scope of U.S. policy on climate change and regulation of GHGs. Congress has considered but has not adopted GHG legislation which would require a reduction in GHG emissions and there is no legislation under active consideration at this time. The likelihood of any federal mandatory CO2 emissions reduction program being adopted by Congress in the near future, and the specific requirements of any such program, are uncertain. The EPA has begun to regulate GHG emissions under its “endangerment” finding. The EPA has adopted its first GHG emission control rules for motor vehicles and new source review of stationary sources of GHGs, which became applicable to motor vehicles and stationary sources, respectively, on January 2, 2011. The EPA is developing CAA Section 111 standards for GHGs from electric generating units and proposed a rule on September 20, 2013 that would require certain new fossil fuel generating plants to meet a CO2 output based standard. Unlike traditional NSPS rules, the proposed GHG NSPS would not apply to modifications at existing units. It is expected the EPA will issue a final new source rule in 2014. For existing units, the EPA is slated to propose Section 111(d) emission guidelines by June 1, 2014, finalize the guidelines by June 1, 2015, and require states to develop 111(d) plans by June 30, 2016. Specific requirements of the CAA Section 111(d) regulation, and thus their impact on OTP, are uncertain at this time.
MANUFACTURING
Competition from foreign and domestic manufacturers, the price and availability of raw materials and general economic conditions could affect the revenues and earnings of our manufacturing businesses.
Our manufacturing businesses are subject to intense risks associated with competition from foreign and domestic manufacturers, many of whom have broader product lines, greater distribution capabilities, greater capital resources, larger marketing, research and development staffs and facilities and other capabilities that may place downward pressure on margins and profitability. The companies in our Manufacturing segment use a variety of raw materials in the products they manufacture, including steel, aluminum and polystyrene and other plastics resins. Costs for these items have increased significantly and may continue to increase. If our manufacturing businesses are not able to pass on cost increases to their customers, it could have a negative effect on profit margins in our Manufacturing segment.
Each of our manufacturing companies has significant customers and concentrated sales to such customers. If our relationships with significant customers should change materially, it would be difficult to immediately and profitably replace lost sales.
PLASTICS
Our plastics operations are highly dependent on a limited number of vendors for PVC resin and a limited supply of PVC resin. The loss of a key vendor, or any interruption or delay in the supply of PVC resin, could result in reduced sales or increased costs for our plastics business.
We rely on a limited number of vendors to supply the PVC resin used in our plastics business. Two vendors accounted for approximately 93% of our total purchases of PVC resin in 2013 and approximately 90% of our total purchases of PVC resin in 2012. In addition, the supply of PVC resin may be limited primarily due to manufacturing capacity and the limited availability of raw material components. A majority of U.S. resin production plants are located in the Gulf Coast region, which may increase the risk of a shortage of resin in the event of a hurricane or other natural disaster in that region. The loss of a key vendor or any interruption or delay in the availability or supply of PVC resin could disrupt our ability to deliver our plastic products, cause customers to cancel orders or require us to incur additional expenses to obtain PVC resin from alternative sources, if such sources are available.
We compete against a large number of other manufacturers of PVC pipe and manufacturers of alternative products. Customers may not distinguish our products from those of our competitors.
The plastic pipe industry is fragmented and competitive due to the number of producers and the fungible nature of the product. We compete not only against other PVC pipe manufacturers, but also against ductile iron, steel, concrete and clay pipe manufacturers. Due to shipping costs, competition is usually regional instead of national in scope, and the principal areas of competition are a combination of price, service, warranty, and product performance. Our inability to compete effectively in each of these areas and to distinguish our plastic pipe products from competing products may adversely affect the financial performance of our plastics business.
Reductions in PVC resin prices can negatively affect our plastics business.
The PVC pipe industry is highly sensitive to commodity raw material pricing volatility. Historically, when resin prices are rising or stable, margins and sales volume have been higher and when resin prices are falling, sales volumes and margins have been lower. Reductions in PVC resin prices could negatively affect PVC pipe prices, profit margins on PVC pipe sales and the value of our finished goods inventory.
CONSTRUCTION
A significant failure or an inability to properly bid or perform on projects or contracts by our construction businesses could lead to adverse financial results and could lead to the possibility of delay or liquidated damages.
The profitability and success of our construction companies require us to identify, estimate and timely bid on profitable projects or contracts. The quantity and quality of projects up for bid at any time is uncertain. Additionally, once a project or contract is awarded, we must be able to perform within cost estimates that were set when the bid was submitted and accepted. A significant failure or an inability to properly bid or perform on projects or contracts could lead to adverse financial results and could lead to the possibility of delay or liquidated damages.
We enter into construction contracts which could expose us to unforeseen costs and costs not within our control, which may not be recoverable and could adversely affect our results of operations and financial condition.
Our construction companies frequently provide services pursuant to fixed-price contracts. Revenues recognized on jobs in progress under fixed-price contracts were $368 million at December 31, 2013 and $309 million at December 31, 2012. Under those contracts, we agree to perform the contract for a fixed price and, as a result, of:can improve our expected profit by superior contract performance, productivity, worker safety and other factors resulting in cost savings. However, we could incur cost overruns above the approved contract price, which may not be recoverable.
Fixed-price contract prices are established based largely on estimates and assumptions relating to project scope and specifications, personnel and material needs. These estimates and assumptions may prove inaccurate or conditions may change due to factors out of our control, resulting in cost overruns, which we may be required to absorb and that could have a material adverse effect on our business, financial condition and results of our operations. In addition, our profits from these contracts could decrease and we could experience losses if we incur difficulties in performing the contracts or are unable to secure fixed-pricing commitments from our suppliers and subcontractors at the time we enter into fixed-price contracts with our customers.
None.
The Coyote Station, which commenced operation in 1981, is a 414,000 kW (nameplate rating) mine-mouth plant located in the lignite coal fields near Beulah, North Dakota and is jointly owned by OTP, Northern Municipal Power Agency, Montana-Dakota Utilities Co. and Northwestern Public Service Company. OTP is the operating agent of the Coyote Station and owns 35% of the plant.
OTP, jointly with Northwestern Public Service Company and Montana-Dakota Utilities Co., owns the 414,000 kW (nameplate rating) Big Stone Plant in northeastern South Dakota which commenced operation in 1975. OTP is the operating agent of Big Stone Plant and owns 53.9% of the plant.
Located near Fergus Falls, Minnesota, the Hoot Lake Plant is comprised of three separate generating units. The oldest Hoot Lake Plant generating unit, constructed in 1948 (7,500 kW nameplate rating), was retired on December 31, 2005. A second unit was added in 1959 (53,500 kW nameplate rating) and a third unit was added in 1964 (75,000 kW nameplate rating) and modified in 1988 to provide cycling capability, allowing this unit to be more efficiently brought online from a standby mode. The two generating units in operation have a combined nameplate rating of 128,500 kW.
OTP owns 27 wind turbines at the Langdon, North Dakota Wind Energy Center with a nameplate rating of 40,500 kW, 32 wind turbines at the Ashtabula Wind Energy Center located in Barnes County, North Dakota with a nameplate rating of 48,000 kW and 33 wind turbines at the Luverne Wind Farm located in Steele County, North Dakota with a nameplate rating of 49,500 kW.
As of December 31, 2013 OTP’s transmission facilities, which are interconnected with lines of other public utilities, consisted of 76 miles of 345 kV lines; 487 miles of 230 kV lines; 878 miles of 115 kV lines; and 3,965 miles of lower voltage lines, principally 41.6 kV. OTP owns the uprated portion of 48 miles of the 345 kV lines, with Minnkota Power Cooperative retaining title to the original 230 kV construction. OTP owns an undivided interest in the remaining 345 kV line miles. OTP is a joint owner, with other regional utilities, in CapX2020 transmission lines with the following ownership interests: 14.8% in the 70 mile Bemidji-Grand Rapids 230 kV line and 13.3% of 29 miles of energized line of the Fargo-Monticello 345 kV Project.
In addition to the properties mentioned above, all of which are utilized by the Electric segment, the Company owns and has investments in offices and service buildings utilized by each of its manufacturing and infrastructure business segments. The Company’s subsidiaries own construction equipment, tools and facilities and equipment used in: the manufacture of PVC pipe, thermoformed products, heavy metal fabricated products, metal parts stamping, fabricating and contract machining.
Management of the Company believes the facilities and equipment described above are adequate for the Company’s present businesses.
The Company is the subject of various pending or threatened legal actions and proceedings in the ordinary course of its business. Such matters are subject to many uncertainties and to outcomes that are not predictable with assurance. The Company records a liability in its consolidated financial statements for costs related to claims, including future legal costs, settlements and judgments, where it has assessed that a loss is probable and an amount can be reasonably estimated. The Company believes the final resolution of currently pending or threatened legal actions and proceedings, either individually or in the aggregate, will not have a material adverse effect on the Company’s consolidated financial position, results of operations or cash flows.
Set forth below is a summary of the principal occupations and business experience during the past five years of the executive officers as defined by rules of the SEC. Each of the executive officers has been employed by the Company for more than five years in an executive or management position either with the Company or its wholly owned subsidiary, Otter Tail Power Company, or has served as a director on the Company’s Board of Directors.
| | | |
| NAME AND AGE | DATES ELECTED
TO OFFICE | PRESENT POSITION AND BUSINESS EXPERIENCE |
| Edward J. McIntyre (63) | 9/8/11 | Present: | President and Chief Executive Officer |
| George A. Koeck (61) | 4/10/00 | Present: | Senior Vice President, General Counsel and Corporate Secretary |
| Kevin G. Moug (54) | 4/9/01 | Present: | Chief Financial Officer and Senior Vice President |
| Charles S. MacFarlane (49) | 5/1/03 | Present: | Senior Vice President, Electric Platform |
| Shane N. Waslaski (38) | 4/11/11 | Present: | Senior Vice President, Manufacturing and Infrastructure Platform |
Mr. MacFarlane was appointed President and Chief Operating Officer of the Company effective April 14, 2014.
On September 8, 2011 the Company’s Board of Directors appointed current director Edward J. (Jim) McIntyre to serve as interim President and Chief Executive Officer. On January 3, 2012, the Company’s Board of Directors appointed Mr. McIntyre to serve as permanent President and Chief Executive Officer of the Company. Mr. McIntyre, 63, is retired Vice President and former Chief Financial Officer of Xcel Energy, Inc. He has been a member of the Board of Directors since 2006.
Mr. Waslaski has worked as a Vice President within the Company’s Manufacturing and Infrastructure platform since 2007 and became an executive officer of the Company on April 11, 2011.
The term of office for each of the executive officers is one year and any executive officer elected may be removed by the vote of the Board of Directors at any time during the term. There are no family relationships between any of the executive officers or directors.
The Company’s common stock is traded on the NASDAQ Global Select Market under the NASDAQ symbol “OTTR”. The information required by this Item can be found on Page 38 of this Annual Report on Form 10-K under the heading “Selected Financial Data,” on Page 103 under the heading “Retained Earnings and Dividend Restriction” and on Page 125 under the heading “Supplementary Financial Information.” The Company does not have a publicly announced stock repurchase program. In addition, the Company did not repurchase any equity securities during the three months ended December 31, 2013.
PERFORMANCE GRAPH
COMPARISON OF FIVE-YEAR CUMULATIVE TOTAL RETURN
This graph compares the cumulative total shareholder return on the Company’s common shares for the last five fiscal years with the cumulative return of The NASDAQ Stock Market Index and the Edison Electric Institute Index (EEI) over the same period (assuming the investment of $100 in each vehicle on December 31, 2008, and reinvestment of all dividends).
| | | 2008 | | | 2009 | | | 2010 | | | 2011 | | | 2012 | | | 2013 | |
| OTC | | $ | 100.00 | | | $ | 112.40 | | | $ | 108.08 | | | $ | 111.68 | | | $ | 133.49 | | | $ | 162.95 | |
| EEI | | $ | 100.00 | | | $ | 110.71 | | | $ | 118.50 | | | $ | 142.18 | | | $ | 145.15 | | | $ | 164.03 | |
| NASDAQ | | $ | 100.00 | | | $ | 143.74 | | | $ | 170.23 | | | $ | 171.23 | | | $ | 202.46 | | | $ | 281.91 | |
| (thousands, except number of shareholders and per-share data) | | 2013 | | | 2012 | | | 2011 | | | 2010 | | | 2009 | |
| Revenues | | | | | | | | | | | | | | | |
| Electric | | $ | 373,540 | | | $ | 350,765 | | | $ | 342,727 | | | $ | 344,379 | | | $ | 314,666 | |
| Manufacturing | | | 204,997 | | | | 208,965 | | | | 189,459 | | | | 143,072 | | | | 119,255 | |
| Plastics | | | 164,957 | | | | 150,517 | | | | 123,669 | | | | 96,945 | | | | 80,208 | |
| Construction | | | 149,910 | | | | 149,092 | | | | 184,657 | | | | 134,222 | | | | 103,831 | |
| Intersegment Eliminations | | | (91 | ) | | | (100 | ) | | | (343 | ) | | | (721 | ) | | | (275 | ) |
| Total Operating Revenues | | $ | 893,313 | | | $ | 859,239 | | | $ | 840,169 | | | $ | 717,897 | | | $ | 617,685 | |
| | | | | | | | | | | | | | | | | | | | | |
| Net Income from Continuing Operations | | $ | 50,174 | | | $ | 38,968 | | | $ | 34,910 | | | $ | 26,280 | | | $ | 22,131 | |
| Net Income (Loss) from Discontinued Operations | | | 691 | | | | (44,241 | ) | | | (48,153 | ) | | | (27,624 | ) | | | 3,900 | |
| Net Income (Loss) | | $ | 50,865 | | | $ | (5,273 | ) | | $ | (13,243 | ) | | $ | (1,344 | ) | | $ | 26,031 | |
| | | | | | | | | | | | | | | | | | | | | |
| Operating Cash Flow from Continuing Operations | | $ | 150,283 | | | $ | 168,986 | | | $ | 93,678 | | | $ | 105,934 | | | $ | 125,646 | |
| Operating Cash Flow - Continuing and Discontinued Operations | | | 147,781 | | | | 233,547 | | | | 104,383 | | | | 105,017 | | | | 162,750 | |
| Capital Expenditures - Continuing Operations | | | 164,463 | | | | 115,762 | | | | 67,360 | | | | 58,264 | | | | 160,501 | |
| Total Assets | | | 1,596,019 | | | | 1,602,337 | | | | 1,700,522 | | | | 1,770,555 | | | | 1,754,678 | |
| Long-Term Debt | | | 389,589 | | | | 421,680 | | | | 471,915 | | | | 430,807 | | | | 431,083 | |
Basic Earnings Per Share - Continuing Operations (1) | | | 1.37 | | | | 1.06 | | | | 0.95 | | | | 0.71 | | | | 0.60 | |
Basic Earnings (Loss) Per Share - Total (1) | | | 1.39 | | | | (0.17 | ) | | | (0.40 | ) | | | (0.06 | ) | | | 0.71 | |
Diluted Earnings Per Share - Continuing Operations (1) | | | 1.37 | | | | 1.05 | | | | 0.95 | | | | 0.71 | | | | 0.60 | |
Diluted Earnings (Loss) Per Share - Total (1) | | | 1.39 | | | | (0.17 | ) | | | (0.40 | ) | | | (0.06 | ) | | | 0.71 | |
Return on Average Common Equity (2) | | | 9.5 | % | | | (1.1 | )% | | | (2.3 | )% | | | (0.3 | )% | | | 3.8 | % |
| Dividends Declared Per Common Share | | | 1.19 | | | | 1.19 | | | | 1.19 | | | | 1.19 | | | | 1.19 | |
| Dividend Payout Ratio | | | 86 | % | | | — | | | | — | | | | — | | | | 168 | % |
| Common Shares Outstanding - Year End | | | 36,272 | | | | 36,168 | | | | 36,102 | | | | 36,003 | | | | 35,812 | |
Number of Common Shareholders (3) | | | 14,252 | | | | 14,584 | | | | 14,687 | | | | 14,848 | | | | 14,923 | |
(1) Based on average number of shares outstanding.
(2) Earnings available for common shares divided by the 13-month average of month-end common equity balances.
(3) Holders of record at year end.
OVERVIEW
Otter Tail Corporation and its subsidiaries form a diverse group of businesses with operations classified into four segments: Electric, Manufacturing, Plastics and Construction. Our primary financial goals are to maximize earnings and cash flows and to allocate capital profitably toward growth opportunities that will increase shareholder value. Meeting these objectives enables us to preserve and enhance our financial capability by maintaining desired capitalization ratios and a strong interest coverage position and preserving investment grade credit ratings on outstanding securities, which, in the form of lower interest rates, benefits both our customers and shareholders.
Our strategy is to continue to grow our largest business, the regulated electric utility, which will lower our overall risk, create a more predictable earnings stream, improve our credit quality and preserve our ability to fund the dividend. Over time, we expect the electric utility business will provide approximately 75% to 85% of our overall earnings. We expect our manufacturing and infrastructure businesses will provide 15% to 25% of our earnings, and will continue to be a fundamental part of our strategy.
Reliable utility performance along with rate base investment opportunities over the next five years will provide us with a strong base of revenues, earnings and cash flows. We also look to our manufacturing and infrastructure companies to provide organic growth as well. Organic, internal growth comes from new products and services, market expansion and increased efficiencies. We expect much of our growth in these businesses in the next few years will come from utilizing expanded plant capacity from capital investments made in previous years. We will also evaluate opportunities to allocate capital to potential acquisitions in our Manufacturing segment. We are a committed long-term owner and therefore we do not acquire companies in pursuit of short-term gains. However, we will divest operating companies that no longer fit into our strategy and risk profile over the long term.
We have worked to realign our portfolio of businesses and refocus our capital investment in the electric utility. Over the last three years we sold several businesses in execution of our announced strategy. In 2011 we sold Idaho Pacific Holdings, Inc. (IPH), our Food Ingredient Processing segment business, and E.W. Wylie Corporation (Wylie), our trucking company which was included in our Wind Energy segment. In January 2012 we sold the assets of Aviva Sports, Inc. (Aviva), a recreational equipment manufacturer and wholly owned subsidiary of Shrco, Inc. (Shrco), our former waterfront equipment manufacturer. In February 2012 we sold DMS Health Technologies, Inc. (DMS), our Health Services segment business. In November 2012 we completed the sale of the assets of IMD, Inc. (IMD), our former wind tower manufacturer, and we exited the wind tower manufacturing business. On February 8, 2013 we sold substantially all of the assets of Shrco.
In evaluating our portfolio of operating companies, we look for the following characteristics:
| ● | a $2.6 million increasethreshold level of net earnings and a return on invested capital in transmissionexcess of our weighted average cost recovery revenues as a result of increased investment in transmission assets,capital, |
| | | a $1.8 million interim rate refund recorded in 2011 related to amounts collected under interim rates in Minnesota in 2010,strategic differentiation from competitors and a sustainable cost advantage, |
| | | a $1.5 million increase in revenue mainly relatedstable or growing industry, |
| | an ability to rate design changes implemented in Minnesota in October 2011 on finalization of OTP’s 2010 general rate case,quickly adapt to changing economic cycles, and |
| | | a $0.9 million increase in retail revenue relatedstrong management team committed to the recovery of increased fuel and purchased power costs,operational excellence. |
offset by:Major growth strategies and initiatives in our future include:
| | | Planned capital budget expenditures of up to $769 million for the years 2014 through 2018, of which $657 million are for capital projects at Otter Tail Power Company (OTP), including $131 million for OTP’s share of a $2.3new air quality control system at Big Stone Plant and $304 million decrease in revenues relatedfor anticipated expansion of transmission capacity including $243 million for Midcontinent Independent System Operator, Inc. (MISO) designated Multi-Value Projects (MVPs) and $26 million for Capacity Expansion 2020 (CapX2020) transmission projects ($7 million for the Brookings to a 1.2% reduction in retail kwh sales between the periods due to an 11% reduction in heating-degree days resulting from significantly milder weather in the first half of 2012 compared to the first half of 2011, partially offset by a 19.6% increase in cooling-degree days in the summer of 2012 comparedSoutheast Twin Cities CapX2020 MVP project is included with the same period$243 million for MVP projects). The remainder of the OTP 2014-2018 anticipated capital expenditures is for asset replacements, additions and improvements across OTP’s generation, transmission, distribution and general plant. See “Capital Requirements” section for further discussion. |
| | Utilization of existing and potentially expanded plant capacity from capital investments made in 2011,our manufacturing and infrastructure businesses. |
| | Continued investigation and evaluation of organic growth opportunities and evaluation of opportunities to allocate capital to potential acquisitions in our Manufacturing segment. |
In 2013:
| | Our net cash from continuing and discontinued operations was $147.8 million. |
| | | Our Construction segment recorded net income of $1.3 million compared with a $0.2net loss of $7.7 million reduction in accrued conservation program2012. Net income from Foley Company (Foley), our mechanical and prime contractor on industrial projects was $0.5 million compared to a net loss in 2012 of $10.0 million as a result of cost recovery revenues and incentives. |
Wholesale electric revenues from company-owned generation decreased $1.6 million due to a 6.7% decline in wholesale kwh sales in combination with a 4.4% decrease in the average price per wholesale kwh sold. This was related to an 8.7% reduction in kwh generation mainly as a resultoverruns on several large jobs which were substantially complete by the end of two major shutdowns of OTP’s lowest-cost baseload resource, Coyote Station, in 2012. The first occurred in the second quarter of 2012 for seven weeks of scheduled maintenance, and the second occurred on November 27, 2012, when an electrical fault caused major damage to the station’s generator, which needed to be moved offsite for repairs estimated to take 10 to 12 weeks. Lower demand in wholesale markets and low natural gas prices for alternative generation also contributed to the reduction in wholesale electric sales.
Net revenue from energy trading activities, including net mark-to-market gains on forward energy contracts, decreased $0.9 million mainly as a result of a decrease in mark-to-market gains on open energy contracts, along with a reduction in trading activity.
Other electric operating revenues increased $6.1 million as a result of:
| ● | a $3.6 million increase in MISO Schedule 26 transmission tariff revenues, driven in part by returns on, and recovery of, CapX2020 investment costs and operating expenses, |
| | | a $1.5Our Manufacturing segment net income increased 7.3% to $11.5 million increasefrom $10.7 million in revenues earned under agreements for shared use of transmission facilities with other regional transmission providers,2012. |
| | | $0.9Our Electric segment net income of $38.2 million decreased slightly from $38.3 million in MISO Schedule 26A revenue, new in 2012, mainly related to investments in MISO designated MVPs,2012. |
| | | $0.8Our Plastics segment net income decreased 2.2% to $13.8 million from $14.1 million in revenue earned under a contract to upgrade a distribution system for another regional electric service provider, and |
| ● | a $0.7 million increase in MISO Schedule 1 transmission tariff revenues due to 2011 and 2012 changes in the calculation methodology used to determine Schedule 1 revenues, |
offset by:
| ● | a $1.3 million reduction in revenue related to payments received in 2011 from a transmission cooperative to Otter Tail Energy Services Company (OTESCO) for access rights to construct a high voltage transmission line through a wind farm site where OTESCO owned development rights, and for assistance in obtaining easements from landowners.2012. |
The $2.7 million decreasefollowing table summarizes our consolidated results of operations for the years ended December 31:
| (in thousands) | | 2013 | | | 2012 | |
| Operating Revenues: | | | | | | |
| Electric | | $ | 373,459 | | | $ | 350,679 | |
| Manufacturing and Infrastructure | | | 519,854 | | | | 508,560 | |
| Total Operating Revenues | | $ | 893,313 | | | $ | 859,239 | |
| Net Income (Loss) From Continuing Operations: | | | | | | | | |
| Electric | | $ | 38,236 | | | $ | 38,341 | |
| Manufacturing and Infrastructure | | | 26,576 | | | | 17,100 | |
| Corporate | | | (14,638 | ) | | | (16,473 | ) |
| Total Net Income From Continuing Operations: | | $ | 50,174 | | | $ | 38,968 | |
Revenue increases in production fuel costs resulted from a 9.0% decrease in kwhs generated from OTP’s steam-poweredour Electric, Plastics and combustion turbine generators,Construction segments were partially offset by a 5.5%decrease in revenues from our Manufacturing segment, resulting in a 4.0% increase in consolidated revenues in 2013 compared with 2012. Revenues from our Electric segment increased $22.8 million reflecting: (1) a $20.2 million increase in retail revenue as a result of a 5.8% increase in retail kilowatt-hour (kwh) sales due mainly to colder weather in 2013 evidenced by a 37% increase in heating degree days between the costyears, and (2) a $1.9 million increase in wholesale revenues from excess generation as a result of fuel per kwh generated. The decreasea 15.9% increase in kwh generation was due to the two major maintenance shutdowns of Coyote Station in 2012. The cost of purchased power for retail salesprices received on wholesale energy sales. Revenues from our Plastics segment increased $5.7$14.4 million as a result of a 28.2%12.0% increase in kwhs purchased for system use,pounds of polyvinyl chloride (PVC) pipe sold partially offset by an 11.7% decrease in the cost per kwh purchased. The increase in kwh purchases was driven by the need to buy replacement power after Coyote Station went off-line in November 2012.
Electric operating and maintenance expenseslower PVC pipe prices. Revenues from our Construction segment increased $5.2$0.8 million due to the following:
| ● | a $3.4 million increase in MISO transmission service charges, mainly MISO Schedule 26 charges related to increased investment in transmission facilities by MISO member companies, |
| ● | a $2.2 million increase in labor and benefit expenses mainly due to increases in pension and retiree health benefit costs resulting from a reduction in the discount rate applied to projected benefit obligations, |
| ● | a $1.1 million increase in maintenance expenses at Coyote Station related to its second quarter 2012 seven-week scheduled major maintenance shutdown, |
| ● | a $0.4 million increase in wind farm maintenance service costs, and |
| ● | a $0.3 million increase in maintenance costs at Big Stone Plant, |
offset by:
| ● | a $1.7 million reduction in material and supply costs related to costs incurred in conjunction with a major overhaul of Big Stone Plant in the fourth quarter of 2011, and |
| ● | a $0.4 million reduction in incurred conservation program costs, commensurate with a reduction in accrued revenues related to the future recovery of those costs. |
OTESCO recorded asset impairment charges of $0.4 million in the first quarter of 2012 and $0.5 million in the fourth quarter of 2011 related to its wind farm development rights at its Sheridan Ridge and Stutsman County sites in North Dakota, based on market indicators of the value of those assets.
The $1.8as a $16.5 million increase in depreciation expense is related to 2011 property additions, mainly transmission assets.
Property taxes increased $0.5 million due to higher taxes on electric distribution property and increased investments in transmission property.
2011 compared with 2010
Retail sales revenues decreased by $1.0 million as a result of:
| ● | a $3.1 million reduction in fuel cost recovery revenues related to lower fuel and purchased power costs, |
| ● | a $0.8 million decrease in accrued and recovered conservation improvement program revenues and incentives, and |
| ● | a $0.6 million reduction in Minnesota retail revenues related to an increase in rates thatrevenue at Foley was more than offset by a refund of excess amounts collected under interim rates in effect from June 2010 through September 2011. |
These decreases in retail revenue were mostly offset by:
| ● | a $2.0 million increase in revenue related to a 0.7% increase in kwh sales, |
| ● | a $0.8 million increase in revenues related to the recovery of the North Dakota portion of Big Stone II plant abandonment costs, and |
| ● | a $0.7 million increase in renewable resource and transmission cost recovery revenues related to an increase in transmission costs eligible for recovery under Minnesota and North Dakota transmission cost recovery riders. |
Wholesale electric revenues from company-owned generation decreased $5.5 million due to an 18.1% decline in wholesale kwh sales combined with an 11.6% decrease in the average price per wholesale kwh sold. This was the result of an 8.2% reduction in kwh generation at OTP’s generating units related toby a scheduled major maintenance shutdown at Big Stone Plant, lower demand in wholesale markets and low natural gas prices. Net gains from energy trading activities, including net mark-to-market gains on forward energy contracts, decreased $0.8 million mainly as a result of a decrease in mark-to-market gains on open energy contracts, in part due to a reduction in trading activity.
Other electric operating revenues increased $5.7 million as a result of: (1) a $3.5 million increase in transmission tariff revenues as a result of increased use of company-owned transmission assets by others, (2) $1.1 million payment received by OTESCO in the first quarter of 2011 for the sale of access rights through an OTESCO wind farm development site, and (3) a $1.1 million refund in 2010 of revenues collected from OTP’s Big Stone II project partners in years prior to 2010.
The $4.1$15.7 million decrease in fuel costs reflects a 10.7% decreaserevenues at Aevenia, Inc. (Aevenia) our electrical design and construction services company, $5.4 million of which relates to Aevenia’s sale of Moorhead Electric in kwhs generatedOctober of 2012. Revenues from OTP’s steam-powered and combustion turbine generators, partially offset by a 5.7% increase in the cost of fuel per kwh generated. The decrease in kwh generation was due to a scheduled major maintenance shutdown of Big Stone Plant in fall 2011. The cost of purchased power for retail salesour Manufacturing segment decreased $1.3$4.0 million as a result of the discontinued production of a 13.7% decreasemajor packaging product for a customer who took production in-house and lower sales volume due to reduced demand from customers in end markets serving the costconstruction and energy industries.
The following table sets forth actual 2013 consolidated diluted earnings per kwh purchased, despiteshare results from continuing operations against the last forecast we provided for 2013 on a 12.4% increase in kwhs purchased for system use.GAAP basis, and also shows the effect on a non-GAAP basis of the November 2013 early retirement of $47.7 million of our previously outstanding $100 million 9.000% Notes due December 15, 2016.
| | | | | |
2013 Earnings Per Share Guidance Range December 2, 2013 | 2013
Earnings
Per Share | 2012
Earnings
Per Share |
| | Low | High |
| Electric | $1.02 | $1.04 | $1.05 | $1.06 |
| Manufacturing | $0.30 | $0.33 | $0.32 | $0.29 |
| Plastics | $0.35 | $0.37 | $0.38 | $0.39 |
| Construction | $0.03 | $0.05 | $0.04 | ($0.21) |
| Corporate – Recurring Costs | ($0.32) | ($0.29) | ($0.25) | ($0.22) |
Subtotal – Non-GAAP Basis1 | $1.38 | $1.50 | $1.54 | $1.31 |
| Corporate – Loss on Debt Extinguishment | ($0.17) | ($0.17) | ($0.17) | ($0.22) |
| Corporate – Interest on Debt Related to Discontinued Operations | | | | ($0.04) |
| Total – Continuing Operations - GAAP Basis | $1.21 | $1.33 | $1.37 | $1.05 |
| 1In November 2013 we retired early $47.7 million of our previously outstanding $100 million 9.000% Notes due December 15, 2016 from available cash. In July 2012 we retired early our $50 million, 8.89% Senior Unsecured Note due November 30, 2017 from proceeds generated in connection with the divestiture of IMD. Generally Accepted Accounting Principles require that in order for debt retirement premiums and related interest expense to be reported as discontinued operations, a company must be required by the lender to repay the related debt as a result of the disposition. Although we were not legally obligated to repay the aforementioned $50 million note, management believes it is appropriate to associate the 2012 debt prepayment premium and interest expense with its discontinued operations to provide a better indication of future earnings. Management understands that there are material limitations on the use of Non-GAAP measures. Non-GAAP measures are not substitutes for GAAP measures for the purpose of analyzing financial performance. Non-GAAP measures are not in accordance with, or an alternative for, measures prepared in accordance with, generally accepted accounting principles and may be different from Non-GAAP measures used by other companies. In addition, Non-GAAP measures are not based on any comprehensive set of accounting rules or principles. This information should not be construed as an alternative to the reported results, which have been determined in accordance with GAAP. |
Electric
Following is a more detailed analysis of our operating results by business segment for the years ended December 31, 2013, 2012 and maintenance expenses increased $3.7 million due to2011, followed by a discussion of our financial position at the following:end of 2013 and our outlook for 2014.
| ● | a $1.7 million increase in transmission tariff charges related to the increase in kwhs purchased from other generators to serve retail customers, |
| ● | a $1.0 million increase in labor costs related to increased health benefit costs, |
| ● | a $1.0 million increase in generation plant maintenance costs related to the Big Stone Plant overhaul in fall 2011 and increased maintenance costs at the Langdon wind farm and Coyote Station, |
| ● | a $0.9 million increase in expense related to the amortization of the North Dakota portion of Big Stone II plant abandonment costs, which OTP began recovering in August 2010, |
| ● | a $0.8 million increase in Minnesota Conservation Improvement Program (MNCIP) costs related to mandated increases in conservation expenditures in Minnesota, and |
| ● | a $0.7 million increase in transportation costs related to increases in gasoline and diesel fuel prices. |
These increases in expenses were partially offset by an increase of $2.4 million in administrative and general expenses charged to capital projects in 2011, which decreases expenses charged to operations.
OTESCO recorded a $0.5 million asset impairment charge in the fourth quarter of 2011 related to its wind farm development rights at its Sheridan Ridge and Stutsman County sites in North Dakota, based on market indicators of the value of those assets.
Property taxes increased $0.8 million due to valuation increases and increases in local property tax rates on Minnesota property.
MANUFACTURING
General
Manufacturing consists of businesses engaged in the following activities: contract machining, metal parts stamping and fabrication, and production of material handling trays and horticultural containers.
The Company derived 23%, 24% and 23% of its consolidated operating revenues and 21%, 26% and 22% of its consolidated operating income from the Manufacturing segment for the years ended December 31, 2013, 2012 and 2011, respectively. Following is a brief description of each of these businesses:
BTD Manufacturing, Inc. (BTD), with headquarters located in Detroit Lakes, Minnesota, is a metal stamping and tool and die manufacturer that provides its services mainly to customers in the Midwest. BTD stamps, fabricates, welds and laser cuts metal components according to manufacturers’ specifications primarily for the recreational vehicle, agricultural, lawn and garden, industrial equipment, health and fitness and enclosure industries in its facilities in Detroit Lakes, Otsego and Lakeville, Minnesota, and Washington, Illinois. BTD’s Illinois facility also manufactures and fabricates parts for off-road equipment, mining machinery, oil fields and offshore oil rigs, wind industry components, broadcast antennae and farm equipment, and serves several major equipment manufacturers in the Peoria, Illinois area and nationwide, including Caterpillar, Komatsu and Gardner Denver.
T. O. Plastics, Inc. (T.O. Plastics), located in Otsego and Clearwater, Minnesota, manufactures and sells thermoformed products for the horticulture industry throughout the United States. In addition, T.O. Plastics produces products such as clamshell packing, blister packs, returnable pallets and handling trays for shipping and storing odd-shaped or difficult-to-handle parts for customers in the consumer products, food packaging, electronics, industrial and medical industries, among others. T.O. Plastics’ Otsego thermoforming facility achieved an AIB International (formerly American Institute of Baking) compliance rating for producing food-contact packaging materials in its operations.
Competition
The various markets in which the Manufacturing segment entities compete are characterized by intense competition from both foreign and domestic manufacturers. These markets have many established manufacturers with broader product lines, greater distribution capabilities, greater capital resources, excess capacity, labor advantages and larger marketing, research and development staffs and facilities than the Company’s manufacturing entities.
The Company believes the principal competitive factors in its Manufacturing segment are product performance, quality, price, technical innovation, cost effectiveness, customer service and breadth of product line. The Company’s manufacturing entities intend to continue to compete on the basis of high-performance products, innovative production technologies, cost-effective manufacturing techniques, close customer relations and support, and increasing product offerings.
Raw Materials Supply
The companies in the Manufacturing segment use raw materials in the products they manufacture, including steel, aluminum and polystyrene and other plastics resins. Both pricing increases and availability of these raw materials are concerns of companies in the Manufacturing segment. The companies in the Manufacturing segment attempt to pass increases in the costs of these raw materials on to their customers. Increases in the costs of raw materials that cannot be passed on to customers could have a negative effect on profit margins in the Manufacturing segment.
Backlog
The Manufacturing segment has backlog in place to support 2014 revenues of approximately $136 million compared with $124 million one year ago.
Capital Expenditures
Capital expenditures in the Manufacturing segment typically include additional investments in new manufacturing equipment or expenditures to replace worn-out manufacturing equipment. Capital expenditures may also be made for the purchase of land and buildings for plant expansion and for investments in management information systems. During 2013, cash expenditures for capital additions in the Manufacturing segment were approximately $7 million. Total capital expenditures for the Manufacturing segment during the five-year period 2014-2018 are estimated to be approximately $81 million.
Employees
At December 31, 2013 the Manufacturing segment had 1,059 full-time employees. There are 932 full-time employees at BTD and 127 full-time employees at T.O. Plastics.
PLASTICS
General
Plastics consists of businesses producing PVC pipe at plants in North Dakota and Arizona. The Company derived 18%, 18% and 15% of its consolidated operating revenues and 25%, 32% and 15% of its consolidated operating income from the Plastics segment for the years ended December 31, 2013, 2012 and 2011, respectively. Following is a brief description of these businesses:
Northern Pipe Products, Inc. (Northern Pipe), located in Fargo, North Dakota, manufactures and sells PVC pipe for municipal water, rural water, wastewater, storm drainage systems and other uses in the northern, midwestern, south-central and western regions of the United States as well as central and western Canada. Production facilities are located in Fargo, North Dakota.
Vinyltech Corporation (Vinyltech), located in Phoenix, Arizona, manufactures and sells PVC pipe for municipal water, wastewater, water reclamation systems and other uses in the western and south-central regions of the United States.
Together these companies have the current capacity to produce approximately 300 million pounds of PVC pipe annually.
Customers
PVC pipe products are marketed through a combination of independent sales representatives, company salespersons and customer service representatives. Customers for the PVC pipe products consist primarily of wholesalers and distributors throughout the northern, midwestern, south-central and western United States.
Competition
The plastic pipe industry is fragmented and competitive, due to the number of producers, the small number of raw material suppliers and the fungible nature of the product. Due to shipping costs, competition is usually regional, instead of national, in scope. The principal areas of competition are a combination of price, service, warranty, and product performance. Northern Pipe and Vinyltech compete not only against other plastic pipe manufacturers, but also ductile iron, steel, concrete and clay pipe producers. Pricing pressure will continue to affect operating margins in the future.
Northern Pipe and Vinyltech intend to continue to compete on the basis of their high quality products, cost-effective production techniques and close customer relations and support.
Manufacturing and Resin Supply
PVC pipe is manufactured through a process known as extrusion. During the production process, PVC compound (a dry powder-like substance) is introduced into an extrusion machine, where it is heated to a molten state and then forced through a sizing apparatus to produce the pipe. The newly extruded pipe is then pulled through a series of water cooling tanks, marked to identify the type of pipe and cut to finished lengths. Warehouse and outdoor storage facilities are used to store the finished product. Inventory is shipped from storage to distributors and customers mainly by common carrier.
The PVC resins are acquired in bulk and shipped to point of use by rail car. There are a limited number of third party vendors that supply the PVC resin used by Northern Pipe and Vinyltech. Two vendors provided approximately 93% and 90% of total resin purchases in 2013 and 2012, respectively. The supply of PVC resin may also be limited primarily due to manufacturing capacity and the limited availability of raw material components. A majority of U.S. resin production plants are located in the Gulf Coast region, which is subject to risk of damage to the plants and potential shutdown of resin production because of exposure to hurricanes that occur in that part of the United States. The loss of a key vendor, or any interruption or delay in the supply of PVC resin, could disrupt the ability of the Plastics segment to manufacture products, cause customers to cancel orders or require incurrence of additional expenses to obtain PVC resin from alternative sources, if such sources were available. Both Northern Pipe and Vinyltech believe they have good relationships with their key raw material vendors.
Due to the commodity nature of PVC resin and PVC pipe and the dynamic supply and demand factors worldwide, historically the markets for both PVC resin and PVC pipe have been very cyclical with significant fluctuations in prices and gross margins.
Capital Expenditures
Capital expenditures in the Plastics segment typically include investments in extrusion machines, land and buildings and management information systems. During 2013, cash expenditures for capital additions in the Plastics segment were approximately $3 million. Total capital expenditures for the five-year period 2014-2018 are estimated to be approximately $14 million to replace existing equipment.
Employees
At December 31, 2013 the Plastics segment had 136 full-time employees. Northern Pipe had 89 full-time employees and Vinyltech had 47 full-time employees as of December 31, 2013.
CONSTRUCTION
General
Construction consists of businesses involved in commercial and industrial electric contracting and construction of fiber optic and electric distribution systems, water, wastewater and HVAC systems primarily in the central United States.
The Company derived 17%, 17% and 22% of its consolidated operating revenues and 3%, (15)% and (4)% of its consolidated operating income from the Construction segment for each of the years ended December 31, 2013, 2012 and 2011, respectively. Following is a brief description of the businesses included in this segment:
Foley Company (Foley), headquartered in Kansas City, Missouri, provides mechanical and prime contracting services for water and wastewater treatment plants, power generation plants, hospital and pharmaceutical facilities, and other industrial and manufacturing projects across a multi-state service area in the United States.
Aevenia, Inc. (Aevenia), located in Moorhead, Minnesota, has divisions that provide a full spectrum of electrical design and construction services for the industrial, commercial and municipal business markets, including government, institutional, utility communications and electric distribution.
Competition
Each of the construction companies is subject to competition, as well as the effects of general economic conditions in their respective disciplines and geographic locations. The construction companies must compete with other construction companies primarily in the Upper Midwest and the Central regions of the United States, including companies with greater financial resources, when bidding on new projects. The Company believes the principal competitive factors in the Construction segment are price, quality of work and customer service.
Backlog
The construction companies have backlog in place of $77 million for 2014 compared with $151 million one year ago.
Capital Expenditures
Capital expenditures in this segment typically include investments in additional construction equipment. During 2013, cash expenditures for capital additions in the Construction segment were approximately $5 million. Capital expenditures during the five-year period 2014-2018 are estimated to be approximately $17 million for the Construction segment.
Employees
At December 31, 2013 there were 426 full-time employees in the Construction segment. There are 232 full-time employees at Foley and 194 full-time employees at Aevenia. Foley has 178 employees represented by various unions, including Carpenters and Millwrights, Laborers, Operating Engineers, Pipe Fitters, Plumbers, Teamsters and Cement Masons. Foley has several labor contracts with various expiration dates in 2014 (124 employees), one contract that expires in March 2015 (14 employees), one contract that expires in April 2017 (8 employees) and one contract that expires in May 2018 (11 employees). Foley also employs 21 people under contracts held by the Tennessee Valley Authority. Foley has not experienced any strike, work stoppage or strike vote, and considers its present relations with employees to be good.
RISK FACTORS AND CAUTIONARY STATEMENTS
Our businesses are subject to various risks and uncertainties. Any of the risks described below or elsewhere in this Annual Report on Form 10-K or in our other SEC filings could materially adversely affect our business, financial condition and results of operations.
GENERAL
Federal and state environmental regulation could require us to incur substantial capital expenditures and increased operating costs.
We are subject to federal, state and local environmental laws and regulations relating to air quality, water quality, waste management, natural resources and health safety. These laws and regulations regulate the modification and operation of existing facilities, the construction and operation of new facilities and the proper storage, handling, cleanup and disposal of hazardous waste and toxic substances. Compliance with these legal requirements requires us to commit significant resources and funds toward environmental monitoring, installation and operation of pollution control equipment, payment of emission fees and securing environmental permits. Obtaining environmental permits can entail significant expense and cause substantial construction delays. Failure to comply with environmental laws and regulations, even if caused by factors beyond our control, may result in civil or criminal liabilities, penalties and fines.
Existing environmental laws or regulations may be revised and new laws or regulations may be adopted or become applicable to us. Revised or additional regulations, which result in increased compliance costs or additional operating restrictions, particularly if those costs are not fully recoverable from customers, could have a material effect on our results of operations.
Volatile financial markets and changes in our debt ratings could restrict our ability to access capital and increase borrowing costs and pension plan and postretirement health care expenses.
We rely on access to both short- and long-term capital markets as a source of liquidity for capital requirements not satisfied by cash flows from operations. If we are unable to access capital at competitive rates, our ability to implement our business plans may be adversely affected. Market disruptions or a downgrade of our credit ratings may increase the cost of borrowing or adversely affect our ability to access one or more financial markets.
Disruptions, uncertainty or volatility in the financial markets can also adversely impact our results of operations, the ability of customers to finance purchases of goods and services, and our financial condition, as well as exert downward pressure on stock prices and/or limit our ability to sustain our current common stock dividend level.
Changes in the U.S. capital markets could also have significant effects on our pension plan. Our pension income or expense is affected by factors including the market performance of the assets in the master pension trust maintained for the pension plan for some of our employees, the weighted average asset allocation and long-term rate of return of our pension plan assets, the discount rate used to determine the service and interest cost components of our net periodic pension cost and assumed rates of increase in our employees’ future compensation. If our pension plan assets do not achieve positive rates of return, or if our estimates and assumed rates are not accurate, our earnings may decrease because net periodic pension costs would rise and we could be required to provide additional funds to cover our obligations to employees under the pension plan.
Discretionary contributions totaling $20.0 million were made to our defined benefit pension plan in January 2014. We could be required to contribute additional capital to the pension plan in the future if the market value of pension plan assets significantly declines, plan assets do not earn in line with our long-term rate of return assumptions or relief under the Pension Protection Act is no longer granted.
Any significant impairment of our goodwill would cause a decrease in our asset values and a reduction in our net operating income.
We had approximately $39.0 million of goodwill recorded on our consolidated balance sheet as of December 31, 2013. We have recorded goodwill for businesses in each of our business segments except Electric. If we make changes in our business strategy or if market or other conditions adversely affect operations in any of these businesses, we may be forced to record an impairment charge, which would lead to decreased assets and a reduction in net operating performance. Goodwill is tested for impairment annually or whenever events or changes in circumstances indicate impairment may have occurred. If the testing performed indicates that impairment has occurred, we are required to record an impairment charge for the difference between the carrying amount of the goodwill and the implied fair value of the goodwill in the period the determination is made. The testing of goodwill for impairment requires us to make significant estimates about our future performance and cash flows, as well as other assumptions. These estimates can be affected by numerous factors, including changes in economic, industry or market conditions, changes in business operations, future business operating performance, changes in competition or changes in technologies. Any changes in key assumptions, or actual performance compared with key assumptions, about our business and its future prospects or other assumptions could affect the fair value of one or more business segments, which may result in an impairment charge.
Declines in projected operating cash flows at any of our reporting units may result in goodwill impairments that could adversely affect our results of operations and financial position, as well as financing agreement covenants.
We currently have $7.3 million of goodwill and a $1.1 million indefinite-lived trade name recorded on our consolidated balance sheet related to the acquisition of Foley in 2003. Foley net earnings improved $10.4 million between 2012 and 2013. If future expected operating profits do not meet our projections, reductions in anticipated cash flows from Foley may indicate its fair value is less than its book value, resulting in an impairment of some or all of the goodwill and indefinite-lived intangible assets associated with Foley along with a corresponding charge against earnings.
The inability of our subsidiaries to provide sufficient earnings and cash flows to allow us to meet our financial obligations and debt covenants and pay dividends to our shareholders could have an adverse effect on the Company.
Otter Tail Corporation is a holding company with no significant operations of its own. The primary source of funds for payment of our financial obligations and dividends to our shareholders is from cash provided by our subsidiary companies. Our ability to meet our financial obligations and pay dividends on our common stock principally depends on the actual and projected earnings, cash flows, capital requirements and general financial position of our subsidiary companies, as well as regulatory factors, financial covenants, general business conditions and other matters.
Under our $150 million revolving credit agreement we may not permit the ratio of our Interest-bearing Debt to Total Capitalization to be greater than 0.60 to 1.00. OTP may not permit the ratio of its Interest-bearing Debt to Total Capitalization to be greater than 0.60 to 1.00 under its $170 million revolving credit agreement. Both credit agreements contain restrictions on the payment of cash dividends on a default or event of default. As of December 31, 2013 we were in compliance with the debt covenants.
Under the Federal Power Act, a public utility may not pay dividends from any funds properly included in a capital account. What constitutes “funds properly included in a capital account” is undefined in the Federal Power Act or the related regulations; however, FERC has consistently interpreted the provision to allow dividends to be paid as long as (1) the source of the dividends is clearly disclosed, (2) the dividend is not excessive and (3) there is no self-dealing on the part of corporate officials. The MPUC indirectly limits the amount of dividends OTP can pay to us by requiring an equity-to-total-capitalization ratio between 44.8% and 54.8%. OTP’s equity-to-total-capitalization ratio was 50.2% as of December 31, 2013.
While these restrictions are not expected to affect our ability to pay dividends at the current level in the foreseeable future, there is no assurance that adverse financial results would not reduce or eliminate our ability to pay dividends. Our dividend payout ratio has exceeded our earnings (losses) in four of the last five years.
Economic conditions could negatively impact our businesses.
Our businesses are affected by local, national and worldwide economic conditions. Tightening of credit in financial markets could adversely affect the ability of customers to finance purchases of our goods and services, resulting in decreased orders, cancelled or deferred orders, slower payment cycles, and increased bad debt and customer bankruptcies. Our businesses may also be adversely affected by decreases in the general level of economic activity, such as decreases in business and consumer spending. A decline in the level of economic activity and uncertainty regarding energy and commodity prices could adversely affect our results of operations and our future growth.
If we are unable to achieve the organic growth we expect, our financial performance may be adversely affected.
We expect much of our growth in the next few years will come from major capital investment at existing companies. To achieve the organic growth we expect, we will have to have access to the capital markets, be successful with capital expansion programs related to organic growth, develop new products and services, expand our markets and increase efficiencies in our businesses. Competitive and economic factors could adversely affect our ability to do this. If we are unable to achieve and sustain consistent organic growth, we will be less likely to meet our revenue growth targets, which, together with any resulting impact on our net income growth, may adversely affect the market price of our common shares.
Our plans to grow and realign our business mix through capital projects, acquisitions and dispositions may not be successful, which could result in poor financial performance.
As part of our business strategy, we intend to increase capital expenditures in our existing businesses and to continually assess our mix of businesses and potential strategic acquisitions or dispositions. There are risks associated with capital expenditures including not being granted timely or full recovery of rate base additions in our regulated utility business and the inability to recover the cost of capital additions due to an economic downturn, lack of markets for new products, competition from producers of lower cost or alternative products, product defects or loss of customers. We may not be able to identify appropriate acquisition candidates or successfully negotiate, finance or integrate acquisitions. Future acquisitions could involve numerous risks including: difficulties in integrating the operations, services, products and personnel of the acquired business; and the potential loss of key employees, customers and suppliers of the acquired business. If we are unable to successfully manage these risks, we could face reductions in net income in future periods.
We may, from time to time, sell assets to provide capital to fund investments in our electric utility business or for other corporate purposes, which could result in the recognition of a loss on the sale of any assets sold and other potential liabilities. The sale of any of our businesses also exposes us to additional risks associated with indemnification obligations under the applicable sales agreements and any related disputes.
As part of our business strategy, we continually assess our business portfolio to determine if our operating companies continue to meet our portfolio criteria. A loss on the sale of a business would be recognized if a company is sold for less than its book value.
In certain transactions we retain obligations that have arisen, or subsequently arise, out of our conduct of the business prior to the sale. These obligations are sometimes direct or, in other cases, take the form of an indemnification obligation to the buyer. These obligations include such things as warranty, environmental, and the collection of certain receivables. Unforeseen costs related to these obligations could result in future losses related to the business sold.
Our plans to grow and operate our manufacturing and infrastructure businesses could be limited by state law.
Our plans to grow and operate our manufacturing and infrastructure businesses could be adversely affected by legislation in one or more states that may attempt to limit the amount or level of diversification permitted in a holding company structure that includes a regulated utility company or affiliated nonelectric companies.
Significant warranty claims and remediation costs in excess of amounts normally reserved for such items could adversely affect our results of operations and financial condition.
Depending on the specific product or service, we may provide certain warranty terms against manufacturing defects and certain materials. We reserve for warranty claims based on industry experience and estimates made by management. For some of our products we have limited history on which to base our warranty estimate. Our assumptions could be materially different from any actual claim and could exceed reserve balances.
Expenses associated with remediation activities of our former wind tower manufacturer, could be substantial. The potential exists for multiple claims based on one defect repeated throughout the production process or for claims where the cost to repair or replace the defective part is highly disproportionate to the original cost of the part. If we are required to cover remediation expenses in addition to our regular warranty coverage, we could be required to accrue additional expenses and experience additional unplanned cash expenditures which could adversely affect our consolidated results of operations and financial condition.
We are subject to risks associated with energy markets.
Our businesses are subject to the risks associated with energy markets, including market supply and increasing energy prices. If we are faced with shortages in market supply, we may be unable to fulfill our contractual obligations to our retail, wholesale and other customers at previously anticipated costs. This could force us to obtain alternative energy or fuel supplies at higher costs or suffer increased liability for unfulfilled contractual obligations. Any significantly higher than expected energy or fuel costs would negatively affect our financial performance.
We are subject to risks and uncertainties related to the timing of recovery of deferred tax assets which could have a negative impact on our net income in future periods.
If taxable income is not generated in future periods in certain tax jurisdictions the recovery of deferred taxes related to accumulated tax benefits may be delayed and we may be required to record a reserve related to the uncertainty of the timing of recovery of deferred tax assets related to accumulated taxable losses in those tax jurisdictions. This would have a negative impact on the Company’s net income in the period the reserve is recorded.
We rely on our information systems to conduct our business, and failure to protect these systems against security breaches or cyber-attacks could adversely affect our business and results of operations. Additionally, if these systems fail or become unavailable for any significant period of time, our business could be harmed.
Our electric utility company, OTP, owns electric transmission and generation facilities subject to mandatory and enforceable standards advanced by the North American Electric Reliability Corporation (NERC). These bulk electric system facilities provide the framework for the electrical infrastructure of OTP’s service territory and interconnected systems, the operation of which is dependent on information technology systems. Further, the information systems that operate OTP’s electric system are interconnected to external networks. Parties that wish to disrupt the U.S. bulk power system or OTP’s operations could view OTP’s computer systems, software or networks as attractive targets for cyber-attack. Also, our businesses require us to collect and maintain sensitive customer data, as well as confidential employee and shareholder information, which is subject to electronic theft or loss. We also use third-party vendors to electronically process certain of our business transactions. The efficient operation of our business is dependent on computer hardware and software systems. Information systems, both ours and those of third-party information processors, are vulnerable to security breach by computer hackers and cyber terrorists.
A successful cyber-attack on the systems that control our generation, transmission, distribution or other assets could severely disrupt business operations, preventing us from serving customers or collecting revenues. The breach of certain business systems could affect our ability to correctly record, process and report financial information and transactions. A major cyber incident could result in significant expenses to investigate and repair security breaches or system damage and could lead to litigation, fines, other remedial action, heightened regulatory scrutiny and damage to our reputation. In addition, the misappropriation, corruption or loss of personally identifiable information and other confidential data could lead to significant breach notification expenses and mitigation expenses such as credit monitoring. We maintain property and casualty insurance that may cover certain physical damage or third party injuries caused by potential cybersecurity incidents. However, other damage and claims arising from such incidents may not be covered or may exceed the amount of any insurance available.
OTP is subject to mandatory cybersecurity regulatory requirements. OTP implements the NERC standards for operating its transmission and generation assets and stays abreast of best practices within business and the utility industry to protect its computers and computer controlled systems from outside attack. We rely on industry accepted security measures and technology to securely maintain confidential and proprietary information maintained on our information systems. In an effort to reduce the likelihood and severity of cyber intrusions, we have cybersecurity processes and controls designed to protect and preserve the confidentiality, integrity and availability of data and systems. However, all these measures and technology may not adequately prevent security breaches or cyber-attacks. In addition, the unavailability of the information systems or failure of these systems to perform as anticipated for any reason could disrupt our business and could result in decreased performance and increased overhead costs, causing our business and results of operations to suffer. Any significant interruption or failure of our information systems or any significant breach of security due to cyber-attacks, hacking or internal security breaches could adversely affect our business and results of operations.
ELECTRIC
We may experience fluctuations in revenues and expenses related to our electric operations, which may cause our financial results to fluctuate and could impair our ability to make distributions to shareholders or scheduled payments on our debt obligations, or to meet covenants under our borrowing agreements.
A number of factors, many of which are beyond our control, may contribute to fluctuations in our revenues and expenses from electric operations, causing our net income to fluctuate from period to period. These risks include fluctuations in the volume and price of sales of electricity to customers or other utilities, which may be affected by factors such as mergers and acquisitions of other utilities, geographic location of other utilities, transmission costs (including increased costs related to operations of regional transmission organizations), changes in the manner in which wholesale power is sold and purchased, unplanned interruptions at OTP’s generating plants, the effects of regulation and legislation, demographic changes in OTP’s customer base and changes in OTP’s customer demand or load growth. Electric wholesale margins have been significantly and adversely affected by increased efficiencies in the MISO market. Electric wholesale trading margins could also be adversely affected by losses due to trading activities. Other risks include weather conditions or changes in weather patterns (including severe weather that could result in damage to OTP’s assets), fuel and purchased power costs and the rate of economic growth or decline in OTP’s service areas. A decrease in revenues or an increase in expenses related to our electric operations may reduce the amount of funds available for our existing and future businesses, which could result in increased financing requirements, impair our ability to make expected distributions to shareholders or impair our ability to make scheduled payments on our debt obligations, or to meet covenants under our borrowing agreements.
Actions by the regulators of our electric operations could result in rate reductions, lower revenues and earnings or delays in recovering capital expenditures.
We are subject to federal and state legislation, government regulations and regulatory actions that may have a negative impact on our business and results of operations. The electric rates that OTP is allowed to charge for its electric services are one of the most important items influencing our financial position, results of operations and liquidity. The rates that OTP charges its electric customers are subject to review and determination by state public utility commissions in Minnesota, North Dakota and South Dakota. OTP is also regulated by the FERC. An adverse decision by one or more regulatory commissions concerning the level or method of determining electric utility rates, the authorized returns on equity, implementation of enforceable federal reliability standards or other regulatory matters, permitted business activities (such as ownership or operation of nonelectric businesses) or any prolonged delay in rendering a decision in a rate or other proceeding (including with respect to the recovery of capital expenditures in rates) could result in lower revenues and net income.
Depending on the outcome of the U.S. Supreme Court review of the 7th Circuit U.S. Court of Appeals decision relating to MVPs, OTP could be required to absorb a disproportionate share of costs for transmission investments if the MISO MVP cost allocation changes. These costs may not be recoverable through a transmission tariff and could result in reduced returns on invested capital and/or increased rates to OTP’s retail electric customers. Depending on the outcome of a November 12, 2013 FERC complaint filed by a group of industrial customers and other stakeholders seeking to reduce the return on equity component of the transmission rates that MISO transmission owners, including OTP, may collect under the relevant MISO tariff, OTP may receive a lower return on equity on its MISO transmission rates and this may impact future revenues for transmission services provided in MISO.
OTP’s electric generating facilities are subject to operational risks that could result in unscheduled plant outages, unanticipated operation and maintenance expenses and increased power purchase costs.
Operation of electric generating facilities involves risks which can adversely affect energy output and efficiency levels. Most of OTP’s generating capacity is coal-fired. OTP relies on a limited number of suppliers of coal, making it vulnerable to increased prices for fuel as existing contracts expire or in the event of unanticipated interruptions in fuel supply. OTP is a captive rail shipper of the BNSF Railway for shipments of coal to its Big Stone and Hoot Lake plants, making it vulnerable to increased prices for coal transportation from a sole supplier. Higher fuel prices result in higher electric rates for OTP’s retail customers through fuel clause adjustments and could make it less competitive in wholesale electric markets. Operational risks also include facility shutdowns due to breakdown or failure of equipment or processes, labor disputes, operator error and catastrophic events such as fires, explosions, floods, intentional acts of destruction or other similar occurrences affecting OTP’s electric generating facilities. The loss of a major generating facility would require OTP to find other sources of supply, if available, and expose it to higher purchased power costs.
Changes to regulation of generating plant emissions, including but not limited to CO2 emissions, could affect our operating costs and the costs of supplying electricity to our customers.
Existing or new laws or regulations passed or issued by federal or state authorities addressing climate change or reductions of greenhouse gas emissions, such as mandated levels of renewable generation, mandatory reductions in CO2 emission levels, taxes on CO2 emissions or cap and trade regimes, could require us to incur significant new costs, which could negatively impact our net income, financial position and operating cash flows if such costs cannot be recovered through rates granted by ratemaking authorities in the states where OTP provides service or through increased market prices for electricity. Debate continues in Congress on the direction and scope of U.S. policy on climate change and regulation of GHGs. Congress has considered but has not adopted GHG legislation which would require a reduction in GHG emissions and there is no legislation under active consideration at this time. The likelihood of any federal mandatory CO2 emissions reduction program being adopted by Congress in the near future, and the specific requirements of any such program, are uncertain. The EPA has begun to regulate GHG emissions under its “endangerment” finding. The EPA has adopted its first GHG emission control rules for motor vehicles and new source review of stationary sources of GHGs, which became applicable to motor vehicles and stationary sources, respectively, on January 2, 2011. The EPA is developing CAA Section 111 standards for GHGs from electric generating units and proposed a rule on September 20, 2013 that would require certain new fossil fuel generating plants to meet a CO2 output based standard. Unlike traditional NSPS rules, the proposed GHG NSPS would not apply to modifications at existing units. It is expected the EPA will issue a final new source rule in 2014. For existing units, the EPA is slated to propose Section 111(d) emission guidelines by June 1, 2014, finalize the guidelines by June 1, 2015, and require states to develop 111(d) plans by June 30, 2016. Specific requirements of the CAA Section 111(d) regulation, and thus their impact on OTP, are uncertain at this time.
MANUFACTURING
Competition from foreign and domestic manufacturers, the price and availability of raw materials and general economic conditions could affect the revenues and earnings of our manufacturing businesses.
Our manufacturing businesses are subject to intense risks associated with competition from foreign and domestic manufacturers, many of whom have broader product lines, greater distribution capabilities, greater capital resources, larger marketing, research and development staffs and facilities and other capabilities that may place downward pressure on margins and profitability. The companies in our Manufacturing segment use a variety of raw materials in the products they manufacture, including steel, aluminum and polystyrene and other plastics resins. Costs for these items have increased significantly and may continue to increase. If our manufacturing businesses are not able to pass on cost increases to their customers, it could have a negative effect on profit margins in our Manufacturing segment.
Each of our manufacturing companies has significant customers and concentrated sales to such customers. If our relationships with significant customers should change materially, it would be difficult to immediately and profitably replace lost sales.
PLASTICS
Our plastics operations are highly dependent on a limited number of vendors for PVC resin and a limited supply of PVC resin. The loss of a key vendor, or any interruption or delay in the supply of PVC resin, could result in reduced sales or increased costs for our plastics business.
We rely on a limited number of vendors to supply the PVC resin used in our plastics business. Two vendors accounted for approximately 93% of our total purchases of PVC resin in 2013 and approximately 90% of our total purchases of PVC resin in 2012. In addition, the supply of PVC resin may be limited primarily due to manufacturing capacity and the limited availability of raw material components. A majority of U.S. resin production plants are located in the Gulf Coast region, which may increase the risk of a shortage of resin in the event of a hurricane or other natural disaster in that region. The loss of a key vendor or any interruption or delay in the availability or supply of PVC resin could disrupt our ability to deliver our plastic products, cause customers to cancel orders or require us to incur additional expenses to obtain PVC resin from alternative sources, if such sources are available.
We compete against a large number of other manufacturers of PVC pipe and manufacturers of alternative products. Customers may not distinguish our products from those of our competitors.
The plastic pipe industry is fragmented and competitive due to the number of producers and the fungible nature of the product. We compete not only against other PVC pipe manufacturers, but also against ductile iron, steel, concrete and clay pipe manufacturers. Due to shipping costs, competition is usually regional instead of national in scope, and the principal areas of competition are a combination of price, service, warranty, and product performance. Our inability to compete effectively in each of these areas and to distinguish our plastic pipe products from competing products may adversely affect the financial performance of our plastics business.
Reductions in PVC resin prices can negatively affect our plastics business.
The PVC pipe industry is highly sensitive to commodity raw material pricing volatility. Historically, when resin prices are rising or stable, margins and sales volume have been higher and when resin prices are falling, sales volumes and margins have been lower. Reductions in PVC resin prices could negatively affect PVC pipe prices, profit margins on PVC pipe sales and the value of our finished goods inventory.
CONSTRUCTION
A significant failure or an inability to properly bid or perform on projects or contracts by our construction businesses could lead to adverse financial results and could lead to the possibility of delay or liquidated damages.
The profitability and success of our construction companies require us to identify, estimate and timely bid on profitable projects or contracts. The quantity and quality of projects up for bid at any time is uncertain. Additionally, once a project or contract is awarded, we must be able to perform within cost estimates that were set when the bid was submitted and accepted. A significant failure or an inability to properly bid or perform on projects or contracts could lead to adverse financial results and could lead to the possibility of delay or liquidated damages.
We enter into construction contracts which could expose us to unforeseen costs and costs not within our control, which may not be recoverable and could adversely affect our results of operations and financial condition.
Our construction companies frequently provide services pursuant to fixed-price contracts. Revenues recognized on jobs in progress under fixed-price contracts were $368 million at December 31, 2013 and $309 million at December 31, 2012. Under those contracts, we agree to perform the contract for a fixed price and, as a result, can improve our expected profit by superior contract performance, productivity, worker safety and other factors resulting in cost savings. However, we could incur cost overruns above the approved contract price, which may not be recoverable.
Fixed-price contract prices are established based largely on estimates and assumptions relating to project scope and specifications, personnel and material needs. These estimates and assumptions may prove inaccurate or conditions may change due to factors out of our control, resulting in cost overruns, which we may be required to absorb and that could have a material adverse effect on our business, financial condition and results of our operations. In addition, our profits from these contracts could decrease and we could experience losses if we incur difficulties in performing the contracts or are unable to secure fixed-pricing commitments from our suppliers and subcontractors at the time we enter into fixed-price contracts with our customers.
None.
The Coyote Station, which commenced operation in 1981, is a 414,000 kW (nameplate rating) mine-mouth plant located in the lignite coal fields near Beulah, North Dakota and is jointly owned by OTP, Northern Municipal Power Agency, Montana-Dakota Utilities Co. and Northwestern Public Service Company. OTP is the operating agent of the Coyote Station and owns 35% of the plant.
OTP, jointly with Northwestern Public Service Company and Montana-Dakota Utilities Co., owns the 414,000 kW (nameplate rating) Big Stone Plant in northeastern South Dakota which commenced operation in 1975. OTP is the operating agent of Big Stone Plant and owns 53.9% of the plant.
Located near Fergus Falls, Minnesota, the Hoot Lake Plant is comprised of three separate generating units. The oldest Hoot Lake Plant generating unit, constructed in 1948 (7,500 kW nameplate rating), was retired on December 31, 2005. A second unit was added in 1959 (53,500 kW nameplate rating) and a third unit was added in 1964 (75,000 kW nameplate rating) and modified in 1988 to provide cycling capability, allowing this unit to be more efficiently brought online from a standby mode. The two generating units in operation have a combined nameplate rating of 128,500 kW.
OTP owns 27 wind turbines at the Langdon, North Dakota Wind Energy Center with a nameplate rating of 40,500 kW, 32 wind turbines at the Ashtabula Wind Energy Center located in Barnes County, North Dakota with a nameplate rating of 48,000 kW and 33 wind turbines at the Luverne Wind Farm located in Steele County, North Dakota with a nameplate rating of 49,500 kW.
As of December 31, 2013 OTP’s transmission facilities, which are interconnected with lines of other public utilities, consisted of 76 miles of 345 kV lines; 487 miles of 230 kV lines; 878 miles of 115 kV lines; and 3,965 miles of lower voltage lines, principally 41.6 kV. OTP owns the uprated portion of 48 miles of the 345 kV lines, with Minnkota Power Cooperative retaining title to the original 230 kV construction. OTP owns an undivided interest in the remaining 345 kV line miles. OTP is a joint owner, with other regional utilities, in CapX2020 transmission lines with the following ownership interests: 14.8% in the 70 mile Bemidji-Grand Rapids 230 kV line and 13.3% of 29 miles of energized line of the Fargo-Monticello 345 kV Project.
In addition to the properties mentioned above, all of which are utilized by the Electric segment, the Company owns and has investments in offices and service buildings utilized by each of its manufacturing and infrastructure business segments. The Company’s subsidiaries own construction equipment, tools and facilities and equipment used in: the manufacture of PVC pipe, thermoformed products, heavy metal fabricated products, metal parts stamping, fabricating and contract machining.
Management of the Company believes the facilities and equipment described above are adequate for the Company’s present businesses.
The Company is the subject of various pending or threatened legal actions and proceedings in the ordinary course of its business. Such matters are subject to many uncertainties and to outcomes that are not predictable with assurance. The Company records a liability in its consolidated financial statements for costs related to claims, including future legal costs, settlements and judgments, where it has assessed that a loss is probable and an amount can be reasonably estimated. The Company believes the final resolution of currently pending or threatened legal actions and proceedings, either individually or in the aggregate, will not have a material adverse effect on the Company’s consolidated financial position, results of operations or cash flows.
Set forth below is a summary of the principal occupations and business experience during the past five years of the executive officers as defined by rules of the SEC. Each of the executive officers has been employed by the Company for more than five years in an executive or management position either with the Company or its wholly owned subsidiary, Otter Tail Power Company, or has served as a director on the Company’s Board of Directors.
| | | |
| NAME AND AGE | DATES ELECTED
TO OFFICE | PRESENT POSITION AND BUSINESS EXPERIENCE |
| Edward J. McIntyre (63) | 9/8/11 | Present: | President and Chief Executive Officer |
| George A. Koeck (61) | 4/10/00 | Present: | Senior Vice President, General Counsel and Corporate Secretary |
| Kevin G. Moug (54) | 4/9/01 | Present: | Chief Financial Officer and Senior Vice President |
| Charles S. MacFarlane (49) | 5/1/03 | Present: | Senior Vice President, Electric Platform |
| Shane N. Waslaski (38) | 4/11/11 | Present: | Senior Vice President, Manufacturing and Infrastructure Platform |
Mr. MacFarlane was appointed President and Chief Operating Officer of the Company effective April 14, 2014.
On September 8, 2011 the Company’s Board of Directors appointed current director Edward J. (Jim) McIntyre to serve as interim President and Chief Executive Officer. On January 3, 2012, the Company’s Board of Directors appointed Mr. McIntyre to serve as permanent President and Chief Executive Officer of the Company. Mr. McIntyre, 63, is retired Vice President and former Chief Financial Officer of Xcel Energy, Inc. He has been a member of the Board of Directors since 2006.
Mr. Waslaski has worked as a Vice President within the Company’s Manufacturing and Infrastructure platform since 2007 and became an executive officer of the Company on April 11, 2011.
The term of office for each of the executive officers is one year and any executive officer elected may be removed by the vote of the Board of Directors at any time during the term. There are no family relationships between any of the executive officers or directors.
The Company’s common stock is traded on the NASDAQ Global Select Market under the NASDAQ symbol “OTTR”. The information required by this Item can be found on Page 38 of this Annual Report on Form 10-K under the heading “Selected Financial Data,” on Page 103 under the heading “Retained Earnings and Dividend Restriction” and on Page 125 under the heading “Supplementary Financial Information.” The Company does not have a publicly announced stock repurchase program. In addition, the Company did not repurchase any equity securities during the three months ended December 31, 2013.
PERFORMANCE GRAPH
COMPARISON OF FIVE-YEAR CUMULATIVE TOTAL RETURN
This graph compares the cumulative total shareholder return on the Company’s common shares for the last five fiscal years with the cumulative return of The NASDAQ Stock Market Index and the Edison Electric Institute Index (EEI) over the same period (assuming the investment of $100 in each vehicle on December 31, 2008, and reinvestment of all dividends).
| | | 2008 | | | 2009 | | | 2010 | | | 2011 | | | 2012 | | | 2013 | |
| OTC | | $ | 100.00 | | | $ | 112.40 | | | $ | 108.08 | | | $ | 111.68 | | | $ | 133.49 | | | $ | 162.95 | |
| EEI | | $ | 100.00 | | | $ | 110.71 | | | $ | 118.50 | | | $ | 142.18 | | | $ | 145.15 | | | $ | 164.03 | |
| NASDAQ | | $ | 100.00 | | | $ | 143.74 | | | $ | 170.23 | | | $ | 171.23 | | | $ | 202.46 | | | $ | 281.91 | |
| (thousands, except number of shareholders and per-share data) | | 2013 | | | 2012 | | | 2011 | | | 2010 | | | 2009 | |
| Revenues | | | | | | | | | | | | | | | |
| Electric | | $ | 373,540 | | | $ | 350,765 | | | $ | 342,727 | | | $ | 344,379 | | | $ | 314,666 | |
| Manufacturing | | | 204,997 | | | | 208,965 | | | | 189,459 | | | | 143,072 | | | | 119,255 | |
| Plastics | | | 164,957 | | | | 150,517 | | | | 123,669 | | | | 96,945 | | | | 80,208 | |
| Construction | | | 149,910 | | | | 149,092 | | | | 184,657 | | | | 134,222 | | | | 103,831 | |
| Intersegment Eliminations | | | (91 | ) | | | (100 | ) | | | (343 | ) | | | (721 | ) | | | (275 | ) |
| Total Operating Revenues | | $ | 893,313 | | | $ | 859,239 | | | $ | 840,169 | | | $ | 717,897 | | | $ | 617,685 | |
| | | | | | | | | | | | | | | | | | | | | |
| Net Income from Continuing Operations | | $ | 50,174 | | | $ | 38,968 | | | $ | 34,910 | | | $ | 26,280 | | | $ | 22,131 | |
| Net Income (Loss) from Discontinued Operations | | | 691 | | | | (44,241 | ) | | | (48,153 | ) | | | (27,624 | ) | | | 3,900 | |
| Net Income (Loss) | | $ | 50,865 | | | $ | (5,273 | ) | | $ | (13,243 | ) | | $ | (1,344 | ) | | $ | 26,031 | |
| | | | | | | | | | | | | | | | | | | | | |
| Operating Cash Flow from Continuing Operations | | $ | 150,283 | | | $ | 168,986 | | | $ | 93,678 | | | $ | 105,934 | | | $ | 125,646 | |
| Operating Cash Flow - Continuing and Discontinued Operations | | | 147,781 | | | | 233,547 | | | | 104,383 | | | | 105,017 | | | | 162,750 | |
| Capital Expenditures - Continuing Operations | | | 164,463 | | | | 115,762 | | | | 67,360 | | | | 58,264 | | | | 160,501 | |
| Total Assets | | | 1,596,019 | | | | 1,602,337 | | | | 1,700,522 | | | | 1,770,555 | | | | 1,754,678 | |
| Long-Term Debt | | | 389,589 | | | | 421,680 | | | | 471,915 | | | | 430,807 | | | | 431,083 | |
Basic Earnings Per Share - Continuing Operations (1) | | | 1.37 | | | | 1.06 | | | | 0.95 | | | | 0.71 | | | | 0.60 | |
Basic Earnings (Loss) Per Share - Total (1) | | | 1.39 | | | | (0.17 | ) | | | (0.40 | ) | | | (0.06 | ) | | | 0.71 | |
Diluted Earnings Per Share - Continuing Operations (1) | | | 1.37 | | | | 1.05 | | | | 0.95 | | | | 0.71 | | | | 0.60 | |
Diluted Earnings (Loss) Per Share - Total (1) | | | 1.39 | | | | (0.17 | ) | | | (0.40 | ) | | | (0.06 | ) | | | 0.71 | |
Return on Average Common Equity (2) | | | 9.5 | % | | | (1.1 | )% | | | (2.3 | )% | | | (0.3 | )% | | | 3.8 | % |
| Dividends Declared Per Common Share | | | 1.19 | | | | 1.19 | | | | 1.19 | | | | 1.19 | | | | 1.19 | |
| Dividend Payout Ratio | | | 86 | % | | | — | | | | — | | | | — | | | | 168 | % |
| Common Shares Outstanding - Year End | | | 36,272 | | | | 36,168 | | | | 36,102 | | | | 36,003 | | | | 35,812 | |
Number of Common Shareholders (3) | | | 14,252 | | | | 14,584 | | | | 14,687 | | | | 14,848 | | | | 14,923 | |
(1) Based on average number of shares outstanding.
(2) Earnings available for common shares divided by the 13-month average of month-end common equity balances.
(3) Holders of record at year end.
OVERVIEW
Otter Tail Corporation and its subsidiaries form a diverse group of businesses with operations classified into four segments: Electric, Manufacturing, Plastics and Construction. Our primary financial goals are to maximize earnings and cash flows and to allocate capital profitably toward growth opportunities that will increase shareholder value. Meeting these objectives enables us to preserve and enhance our financial capability by maintaining desired capitalization ratios and a strong interest coverage position and preserving investment grade credit ratings on outstanding securities, which, in the form of lower interest rates, benefits both our customers and shareholders.
Our strategy is to continue to grow our largest business, the regulated electric utility, which will lower our overall risk, create a more predictable earnings stream, improve our credit quality and preserve our ability to fund the dividend. Over time, we expect the electric utility business will provide approximately 75% to 85% of our overall earnings. We expect our manufacturing and infrastructure businesses will provide 15% to 25% of our earnings, and will continue to be a fundamental part of our strategy.
Reliable utility performance along with rate base investment opportunities over the next five years will provide us with a strong base of revenues, earnings and cash flows. We also look to our manufacturing and infrastructure companies to provide organic growth as well. Organic, internal growth comes from new products and services, market expansion and increased efficiencies. We expect much of our growth in these businesses in the next few years will come from utilizing expanded plant capacity from capital investments made in previous years. We will also evaluate opportunities to allocate capital to potential acquisitions in our Manufacturing segment. We are a committed long-term owner and therefore we do not acquire companies in pursuit of short-term gains. However, we will divest operating companies that no longer fit into our strategy and risk profile over the long term.
We have worked to realign our portfolio of businesses and refocus our capital investment in the electric utility. Over the last three years we sold several businesses in execution of our announced strategy. In 2011 we sold Idaho Pacific Holdings, Inc. (IPH), our Food Ingredient Processing segment business, and E.W. Wylie Corporation (Wylie), our trucking company which was included in our Wind Energy segment. In January 2012 we sold the assets of Aviva Sports, Inc. (Aviva), a recreational equipment manufacturer and wholly owned subsidiary of Shrco, Inc. (Shrco), our former waterfront equipment manufacturer. In February 2012 we sold DMS Health Technologies, Inc. (DMS), our Health Services segment business. In November 2012 we completed the sale of the assets of IMD, Inc. (IMD), our former wind tower manufacturer, and we exited the wind tower manufacturing business. On February 8, 2013 we sold substantially all of the assets of Shrco.
In evaluating our portfolio of operating companies, we look for the following characteristics:
| ● | a threshold level of net earnings and a return on invested capital in excess of our weighted average cost of capital, |
| | a strategic differentiation from competitors and a sustainable cost advantage, |
| | a stable or growing industry, |
| | an ability to quickly adapt to changing economic cycles, and |
| | a strong management team committed to operational excellence. |
Major growth strategies and initiatives in our future include:
| | Planned capital budget expenditures of up to $769 million for the years 2014 through 2018, of which $657 million are for capital projects at Otter Tail Power Company (OTP), including $131 million for OTP’s share of a new air quality control system at Big Stone Plant and $304 million for anticipated expansion of transmission capacity including $243 million for Midcontinent Independent System Operator, Inc. (MISO) designated Multi-Value Projects (MVPs) and $26 million for Capacity Expansion 2020 (CapX2020) transmission projects ($7 million for the Brookings to Southeast Twin Cities CapX2020 MVP project is included with the $243 million for MVP projects). The remainder of the OTP 2014-2018 anticipated capital expenditures is for asset replacements, additions and improvements across OTP’s generation, transmission, distribution and general plant. See “Capital Requirements” section for further discussion. |
| | Utilization of existing and potentially expanded plant capacity from capital investments made in our manufacturing and infrastructure businesses. |
| | Continued investigation and evaluation of organic growth opportunities and evaluation of opportunities to allocate capital to potential acquisitions in our Manufacturing segment. |
In 2013:
| | Our net cash from continuing and discontinued operations was $147.8 million. |
| | Our Construction segment recorded net income of $1.3 million compared with a net loss of $7.7 million in 2012. Net income from Foley Company (Foley), our mechanical and prime contractor on industrial projects was $0.5 million compared to a net loss in 2012 of $10.0 million as a result of cost overruns on several large jobs which were substantially complete by the end of 2012. |
| | Our Manufacturing segment net income increased 7.3% to $11.5 million from $10.7 million in 2012. |
| | Our Electric segment net income of $38.2 million decreased slightly from $38.3 million in 2012. |
| | Our Plastics segment net income decreased 2.2% to $13.8 million from $14.1 million in 2012. |
The following table summarizes our consolidated results of operations for the years ended December 31:
| (in thousands) | | 2013 | | | 2012 | |
| Operating Revenues: | | | | | | |
| Electric | | $ | 373,459 | | | $ | 350,679 | |
| Manufacturing and Infrastructure | | | 519,854 | | | | 508,560 | |
| Total Operating Revenues | | $ | 893,313 | | | $ | 859,239 | |
| Net Income (Loss) From Continuing Operations: | | | | | | | | |
| Electric | | $ | 38,236 | | | $ | 38,341 | |
| Manufacturing and Infrastructure | | | 26,576 | | | | 17,100 | |
| Corporate | | | (14,638 | ) | | | (16,473 | ) |
| Total Net Income From Continuing Operations: | | $ | 50,174 | | | $ | 38,968 | |
Revenue increases in our Electric, Plastics and Construction segments were partially offset by a decrease in revenues from our Manufacturing segment, resulting in a 4.0% increase in consolidated revenues in 2013 compared with 2012. Revenues from our Electric segment increased $22.8 million reflecting: (1) a $20.2 million increase in retail revenue as a result of a 5.8% increase in retail kilowatt-hour (kwh) sales due mainly to colder weather in 2013 evidenced by a 37% increase in heating degree days between the years, and (2) a $1.9 million increase in wholesale revenues from excess generation as a result of a 15.9% increase in prices received on wholesale energy sales. Revenues from our Plastics segment increased $14.4 million as a result of a 12.0% increase in pounds of polyvinyl chloride (PVC) pipe sold partially offset by lower PVC pipe prices. Revenues from our Construction segment increased $0.8 million as a $16.5 million increase in revenue at Foley was mostly offset by a $15.7 million decrease in revenues at Aevenia, Inc. (Aevenia) our electrical design and construction services company, $5.4 million of which relates to Aevenia’s sale of Moorhead Electric in October of 2012. Revenues from our Manufacturing segment decreased $4.0 million as a result of the discontinued production of a major packaging product for a customer who took production in-house and lower sales volume due to reduced demand from customers in end markets serving the construction and energy industries.
The following table sets forth actual 2013 consolidated diluted earnings per share results from continuing operations against the last forecast we provided for 2013 on a GAAP basis, and also shows the effect on a non-GAAP basis of the November 2013 early retirement of $47.7 million of our previously outstanding $100 million 9.000% Notes due December 15, 2016.
| | | | | |
2013 Earnings Per Share Guidance Range December 2, 2013 | 2013
Earnings
Per Share | 2012
Earnings
Per Share |
| | Low | High |
| Electric | $1.02 | $1.04 | $1.05 | $1.06 |
| Manufacturing | $0.30 | $0.33 | $0.32 | $0.29 |
| Plastics | $0.35 | $0.37 | $0.38 | $0.39 |
| Construction | $0.03 | $0.05 | $0.04 | ($0.21) |
| Corporate – Recurring Costs | ($0.32) | ($0.29) | ($0.25) | ($0.22) |
Subtotal – Non-GAAP Basis1 | $1.38 | $1.50 | $1.54 | $1.31 |
| Corporate – Loss on Debt Extinguishment | ($0.17) | ($0.17) | ($0.17) | ($0.22) |
| Corporate – Interest on Debt Related to Discontinued Operations | | | | ($0.04) |
| Total – Continuing Operations - GAAP Basis | $1.21 | $1.33 | $1.37 | $1.05 |
| 1In November 2013 we retired early $47.7 million of our previously outstanding $100 million 9.000% Notes due December 15, 2016 from available cash. In July 2012 we retired early our $50 million, 8.89% Senior Unsecured Note due November 30, 2017 from proceeds generated in connection with the divestiture of IMD. Generally Accepted Accounting Principles require that in order for debt retirement premiums and related interest expense to be reported as discontinued operations, a company must be required by the lender to repay the related debt as a result of the disposition. Although we were not legally obligated to repay the aforementioned $50 million note, management believes it is appropriate to associate the 2012 debt prepayment premium and interest expense with its discontinued operations to provide a better indication of future earnings. Management understands that there are material limitations on the use of Non-GAAP measures. Non-GAAP measures are not substitutes for GAAP measures for the purpose of analyzing financial performance. Non-GAAP measures are not in accordance with, or an alternative for, measures prepared in accordance with, generally accepted accounting principles and may be different from Non-GAAP measures used by other companies. In addition, Non-GAAP measures are not based on any comprehensive set of accounting rules or principles. This information should not be construed as an alternative to the reported results, which have been determined in accordance with GAAP. |
Following is a more detailed analysis of our operating results by business segment for the years ended December 31, 2013, 2012 and 2011, followed by a discussion of our financial position at the end of 2013 and our outlook for 2014.
RESULTS OF OPERATIONS
This discussion and analysis should be read in conjunction with our consolidated financial statements and related notes. See note 2 to our consolidated financial statements for a complete description of our lines of business, locations of operations and principal products and services.
Intersegment Eliminations—Amounts presented in the following segment tables for 2013, 2012 and 2011 operating revenues, cost of goods sold and other nonelectric operating expenses will not agree with amounts presented in the consolidated statements of income due to the elimination of intersegment transactions. The amounts of intersegment eliminations by income statement line item are listed below:
Intersegment Eliminations (in thousands) | | 2013 | | | 2012 | | | 2011 | |
| Operating Revenues: | | | | | | | | | |
| Electric | | $ | 81 | | | $ | 86 | | | $ | 94 | |
| Nonelectric | | | 10 | | | | 14 | | | | 249 | |
| Cost of Goods Sold | | | 20 | | | | 68 | | | | 122 | |
| Other Nonelectric Expenses | | | 71 | | | | 32 | | | | 221 | |
ELECTRIC
The following table summarizes the results of operations for our Electric segment for the years ended December 31:
(in thousands) | | 2013 | | | % change | | | 2012 | | | % change | | | 2011 | |
| Retail Sales Revenues | | $ | 328,758 | | | | 7 | | | $ | 308,530 | | | | 1 | | | $ | 304,181 | |
| Wholesale Revenues – Company Generation | | | 14,846 | | | | 15 | | | | 12,951 | | | | (11 | ) | | | 14,518 | |
| Net Revenue – Energy Trading Activity | | | 1,615 | | | | 13 | | | | 1,426 | | | | (39 | ) | | | 2,319 | |
| Other Revenues | | | 28,321 | | | | 2 | | | | 27,858 | | | | 28 | | | | 21,709 | |
| Total Operating Revenues | | $ | 373,540 | | | | 6 | | | $ | 350,765 | | | | 2 | | | $ | 342,727 | |
| Production Fuel | | | 71,248 | | | | 7 | | | | 66,284 | | | | (4 | ) | | | 69,017 | |
| Purchased Power – System Use | | | 52,006 | | | | 6 | | | | 49,184 | | | | 13 | | | | 43,451 | |
| Other Operation and Maintenance Expenses | | | 133,395 | | | | 10 | | | | 121,069 | | | | 4 | | | | 115,863 | |
| Asset Impairment | | | -- | | | | -- | | | | 432 | | | | (8 | ) | | | 470 | |
| Depreciation and Amortization | | | 43,125 | | | | 3 | | | | 42,051 | | | | 4 | | | | 40,283 | |
| Property Taxes | | | 11,311 | | | | 6 | | | | 10,720 | | | | 5 | | | | 10,190 | |
| Operating Income | | $ | 62,455 | | | | 2 | | | $ | 61,025 | | | | (4 | ) | | $ | 63,453 | |
| | | | | | | | | | | | | | | | | | | | | |
Electric kwh Sales (in thousands) | | | | | | | | | | | | | | | | | | | | |
| Retail kwh Sales | | | 4,487,541 | | | | 6 | | | | 4,240,789 | | | | (1 | ) | | | 4,291,637 | |
| Wholesale kwh Sales – Company Generation | | | 471,474 | | | | (1 | ) | | | 476,637 | | | | (7 | ) | | | 510,978 | |
| Wholesale kwh Sales – Purchased Power Resold | | | 172,404 | | | | 95 | | | | 88,637 | | | | (28 | ) | | | 122,430 | |
| Heating Degree Days | | | 7,366 | | | | 37 | | | | 5,377 | | | | (15 | ) | | | 6,318 | |
| Cooling Degree Days | | | 516 | | | | (20 | ) | | | 641 | | | | 20 | | | | 534 | |
2013 compared with 2012
Retail sales revenues increased by $20.2 million as a result of:
| ● | a $6.6 million increase in revenues due to significantly colder weather in 2013 compared to 2012, which drove a 5.8% increase in retail kwh sales, |
| | a $7.0 million increase in retail revenue related to increases in fuel clause adjustment revenues and fuel and purchased power costs recovered in base rates, which was driven by increased kwh generation to meet higher retail demand and higher prices for purchased power, |
| | a $2.8 million increase in transmission cost recovery rider revenues resulting from increased investment in transmission lines, |
| | a $2.3 million increase in environmental cost recovery revenues related to earning a return in North Dakota on funds invested in the construction of a new air quality control system at Big Stone Plant, and |
| | a $1.5 million increase in conservation improvement program recovered costs and incentives earned as a result of the effectiveness of OTP’s programs. |
Wholesale electric revenues from company-owned generation increased $1.9 million, despite a 1.1% decline in wholesale kwh sales, due to a 15.9% increase in the average price per wholesale kwh sold, which was driven by higher natural gas prices and increased demand resulting from colder weather in 2013.
Net revenue from energy trading activities, including net mark-to-market gains on forward energy contracts, increased $0.2 million mainly as a result of an increase in unrealized mark-to-market gains on open energy contracts scheduled to settle in January and February of 2014.
Other electric operating revenues increased $0.5 million reflecting a $2.6 million increase in MISO tariff revenues related to increasing investments in regional transmission projects, mainly CapX2020 projects, offset by a $2.2 million reduction in revenue from shared use of transmission facilities with other regional transmission providers. For shared use of transmission facilities with certain regional transmission cooperatives, revenues are estimated. Bills are rendered based on anticipated usage and settlements are made later based on actual usage. Estimated revenues may be adjusted prior to settlement, or at the time of settlement, to reflect actual usage.
The $5.0 million increase in production fuel costs resulted from a 10.8% increase in kwhs generated from OTP’s steam-powered and combustion turbine generators, partially offset by a 3.0% reduction in the cost of fuel per kwh generated. The increase in kwh generation was facilitated by improved availability of all of OTP’s steam-powered generation units in 2013. The increase in generation was dedicated entirely to serving increased demand from OTP’s retail customers driven by colder weather in 2013. The cost of purchased power to serve retail customers increased $2.8 million, despite a 2.1% decrease in kwhs purchased, due to an 8.0% increase in costs per kwh purchased driven by increased demand and higher fuel prices for natural-gas fired generation.
Electric operating and maintenance expenses increased $12.3 million as a result of the following:
| | a $4.0 million increase in MISO transmission tariff charges related to increasing investments in regional CapX2020 and MISO-designated MVP transmission projects, |
| | a $2.9 million increase in corporate costs allocated to OTP due, in part, to changes in allocation factors resulting from the corporation’s recent divestitures, |
| | a $2.5 million increase in labor and benefit expenses due to increases in salaries and wages, a reduction in capitalized labor in 2013 compared with 2012 and an increase in pension benefit costs resulting from a reduction in the discount rate related to projected benefit obligations, |
| | a $0.8 million increase in transportation costs related to higher gasoline prices and a reduction in capitalized transportation expenses in 2013, |
| | a $0.7 million discount on OTP’s investment in abandoned transmission plant that was transferred in 2013 from construction work in progress to a regulatory asset account for future recovery, |
| | a $0.4 million increase in conservation improvement program costs, and |
| | $1.0 million total increased expenditures for insurance, outside services, vegetative maintenance, power plant water supply and bad debt expense in 2013. |
Otter Tail Energy Services Company (OTESCO) recorded a $0.4 million asset impairment charge related to wind farm development rights at its Sheridan Ridge and Stutsman County sites in North Dakota in the first quarter of 2012 as a potential sale of the rights did not occur as expected. OTESCO ceased operations and did not record any operating revenues, expenses or net income in 2013.
The $1.1 million increase in depreciation expense is mainly related to CapX2020 transmission lines being placed in service in 2013.
Property taxes increased $0.6 million due to higher property value assessments in Minnesota and South Dakota.
2012 compared with 2011
Retail sales revenues increased by $4.3 million as a result of:
| | a $2.6 million increase in transmission cost recovery revenues as a result of increased investment in transmission assets, |
| | a $1.8 million interim rate refund recorded in 2011 related to amounts collected under interim rates in Minnesota in 2010, |
| | a $1.5 million increase in revenue mainly related to rate design changes implemented in Minnesota in October 2011 on finalization of OTP’s 2010 general rate case, and |
| | a $0.9 million increase in retail revenue related to the recovery of increased fuel and purchased power costs, |
offset by:
| | a $2.3 million decrease in revenues related to a 1.2% reduction in retail kwh sales between the periods due to a reduction in heating-degree days resulting from significantly milder weather in the first half of 2012 compared to the first half of 2011, partially offset by an increase in cooling-degree days in the summer of 2012 compared with the same period in 2011, and |
| | a $0.2 million reduction in accrued conservation program cost recovery revenues and incentives. |
Wholesale electric revenues from company-owned generation decreased $1.6 million due to a 6.7% decline in wholesale kwh sales in combination with a 4.4% decrease in the average price per wholesale kwh sold. This was related to an 8.7% reduction in kwh generation mainly as a result of two major shutdowns of OTP’s lowest-cost baseload resource, Coyote Station, in 2012. The first occurred in the second quarter of 2012 for seven weeks of scheduled maintenance, and the second occurred on November 27, 2012, when an electrical fault caused major damage to the station’s generator, which needed to be moved offsite for repairs that took 11 weeks. Lower demand in wholesale markets and low natural gas prices for alternative generation also contributed to the reduction in wholesale electric sales.
Net revenue from energy trading activities, including net mark-to-market gains on forward energy contracts, decreased $0.9 million mainly as a result of a decrease in mark-to-market gains on open energy contracts, along with a reduction in trading activity.
Other electric operating revenues increased $6.1 million as a result of:
| | a $3.6 million increase in MISO Schedule 26 transmission tariff revenues, driven in part by returns on, and recovery of, CapX2020 investment costs and operating expenses, |
| | a $1.5 million increase in revenues earned under agreements for shared use of transmission facilities with other regional transmission providers, |
| | $0.9 million in MISO Schedule 26A revenue, new in 2012, mainly related to investments in MISO designated MVPs, |
| | $0.8 million in revenue earned under a contract to upgrade a distribution system for another regional electric service provider, and |
| | a $0.7 million increase in MISO Schedule 1 transmission tariff revenues due to 2011 and 2012 changes in the calculation methodology used to determine Schedule 1 revenues, |
offset by:
| | a $1.3 million reduction in revenue related to payments received in 2011 from a transmission cooperative to OTESCO for access rights to construct a high voltage transmission line through a wind farm site where OTESCO owned development rights, and for assistance in obtaining easements from landowners. |
The $2.7 million decrease in production fuel costs resulted from a 9.0% decrease in kwhs generated from OTP’s steam-powered and combustion turbine generators, partially offset by a 5.5% increase in the cost of fuel per kwh generated. The decrease in kwh generation was due to the two major maintenance shutdowns of Coyote Station in 2012. The cost of purchased power for retail sales increased $5.7 million as a result of a 28.2% increase in kwhs purchased for system use, partially offset by an 11.7% decrease in the cost per kwh purchased. The increase in kwh purchases was driven by the need to buy replacement power after Coyote Station went off-line in November 2012.
Electric operating and maintenance expenses increased $5.2 million due to the following:
| | a $3.4 million increase in MISO transmission service charges, mainly MISO Schedule 26 charges related to increased investment in transmission facilities by MISO member companies, |
| | a $2.2 million increase in labor and benefit expenses mainly due to increases in pension and retiree health benefit costs resulting from a reduction in the discount rate applied to projected benefit obligations, |
| | a $1.1 million increase in maintenance expenses at Coyote Station related to its second quarter 2012 seven-week scheduled major maintenance shutdown, |
| | a $0.4 million increase in wind farm maintenance service costs, and |
| | a $0.3 million increase in maintenance costs at Big Stone Plant, |
offset by:
| | a $1.7 million reduction in material and supply costs related to costs incurred in conjunction with a major overhaul of Big Stone Plant in the fourth quarter of 2011, and |
| | a $0.4 million reduction in incurred conservation program costs, commensurate with a reduction in accrued revenues related to the future recovery of those costs. |
OTESCO recorded asset impairment charges of $0.4 million in the first quarter of 2012 and $0.5 million in the fourth quarter of 2011 related to its wind farm development rights at its Sheridan Ridge and Stutsman County sites in North Dakota, based on market indicators of the value of those assets.
The $1.8 million increase in depreciation expense is related to 2011 property additions, mainly transmission assets.
Property taxes increased $0.5 million due to higher taxes on electric distribution property and increased investments in transmission property.
MANUFACTURING
The following table summarizes the results of operations for our Manufacturing segment for the years ended December 31:
| (in thousands) | | 2012 | | | %
change | | | 2011 | | | %
change | | | 2010 | | | 2013 | | | % change | | | 2012 | | | % change | | | 2011 | |
| Operating Revenues | | $ | 208,965 | | | | 10 | | | $ | 189,459 | | | | 32 | | | $ | 143,072 | | | $ | 204,997 | | | | (2 | ) | | $ | 208,965 | | | | 10 | | | $ | 189,459 | |
| Cost of Goods Sold | | | 157,437 | | | | 9 | | | | 144,987 | | | | 37 | | | | 106,114 | | |
| Cost of Products Sold | | | | 154,235 | | | | (2 | ) | | | 157,437 | | | | 9 | | | | 144,987 | |
| Other Operating Expenses | | | 18,233 | | | | 10 | | | | 16,524 | | | | 15 | | | | 14,343 | | | | 18,820 | | | | 3 | | | | 18,233 | | | | 10 | | | | 16,524 | |
| Depreciation and Amortization | | | 12,208 | | | | 1 | | | | 12,116 | | | | 6 | | | | 11,430 | | | | 11,194 | | | | (8 | ) | | | 12,208 | | | | 1 | | | | 12,116 | |
| Operating Income | | $ | 21,087 | | | | 33 | | | $ | 15,832 | | | | 42 | | | $ | 11,185 | | | $ | 20,748 | | | | (2 | ) | | $ | 21,087 | | | | 33 | | | $ | 15,832 | |
2013 compared with 2012
The decrease in revenues in our Manufacturing segment in 2013 compared with 2012 relates to the following:
| | Revenues at BTD Manufacturing, Inc. (BTD), our metal parts stamping and fabrication company, decreased $1.7 million (1.0%) as a result of lower sales volume due to reduced demand from customers in end markets serving the construction and energy industries, partially offset by increased sales to customers in end markets serving the recreational equipment and agricultural industries. |
| | Revenues at T.O. Plastics, Inc. (T.O. Plastics) our manufacturer of thermoformed plastic and horticultural products, decreased $2.3 million (5.7%) due to the discontinuance of a packaging product for a major customer who took production of the product in-house, partially offset by increased sales volumes in certain horticultural and industrial product lines. |
The decrease in cost of products sold in our Manufacturing segment in 2013 compared with 2012 consists of the following:
| | Cost of products sold at BTD decreased by $0.1 million as a reduction in costs related to lower sales volumes was mostly offset by increases in labor costs due to a ramp up in hiring personnel in anticipation of larger sales volumes in 2014. |
| | Cost of products sold at T.O. Plastics decreased $3.1 million as a result of reductions in raw material costs and reduced conversion costs related to productivity improvements. |
The increase in other operating expenses in our Manufacturing segment in 2013 compared with 2012 relates to the following:
| | Operating expenses at BTD increased $0.2 million mainly as a result of upgrades and enhancements made to BTD’s communications systems. |
| | Operating expenses at T.O. Plastics increased $0.4 million as a result of increased hiring costs associated with new management team members and increased sales incentives and commissions. |
Depreciation expense decreased mainly as a result of certain assets at BTD’s Illinois plant being fully depreciated early in 2013.
2012 compared with 2011
The increase in revenues in our Manufacturing segment in 2012 compared with 2011 relates to the following:
| | | Revenues at BTD Manufacturing, Inc. (BTD), our metal parts stamping and fabrication company, increased $17.7 million (11.8%) as a result of higher sales volume due to improved customer demand for products and services. |
| | | Revenues at T.O. Plastics Inc. (T.O. Plastics) our manufacturer of thermoformed plastic and horticultural products, increased by $1.8 million (4.6%) mainly as a result of increased sales of industrial and medical products. |
The increase in cost of goodsproducts sold in our Manufacturing segment in 2012 compared with 2011 consists of the following:
| | | Cost of goodsproducts sold at BTD increased $12.4 million mainly as a result of increased sales volume. |
| | | Cost of goodsproducts sold at T.O. Plastics increased $0.1 million. An increase in costs related to the increase in sales of industrial and medical products was mostly offset by productivity improvements from the use of different blends of plastics and improved operating efficiencies along with more selective bidding practices. |
The increase in other operating expenses in our Manufacturing segment in 2012 compared with 2011 relates to the following:
| | | Operating expenses at BTD increased $1.7 million mainly due to increased benefit expenses related to employee incentives, but also due to increased salary and benefit expenses related to workforce expansion and increases in expenditures for contracted services. |
| | | Operating expenses at T.O. Plastics were unchanged between the years. |
2011 compared with 2010
The increase in revenues in our Manufacturing segment in 2011 compared with 2010 relates to the following:
| ● | Revenues at BTD increased $44.7 million (42.1%) as a result of higher sales volume due to improved customer demand for products and services. |
| ● | Revenues at T.O. Plastics increased by $1.7 million (4.6%) mainly as a result of increased sales of horticultural products. |
The increase in cost of goods sold in our Manufacturing segment in 2011 compared with 2010 consists of the following:
| ● | Cost of goods sold at BTD increased $37.3 million mainly as a result of increased sales volume. |
| ● | Cost of goods sold at T.O. Plastics increased $1.6 million as a result of the increase in sales of horticultural products combined with higher material costs related to price increase for resin. |
The increase in other operating expenses in our Manufacturing segment in 2011 compared with 2010 relates to the following:
| ● | Operating expenses at BTD increased $2.0 million mainly due to increased salary and benefit costs related to workforce expansion to support the increase in revenues between the years. |
| ● | Operating expenses at T.O. Plastics increased $0.2 million due to increased salary and benefit costs and insurance costs offset by a reduction in advertising expenses. |
CONSTRUCTION
The following table summarizes the results of operations for our Construction segment for the years ended December 31:
| (in thousands) | | 2012 | | | % change | | | 2011 | | | % change | | | 2010 | |
| Operating Revenues | | $ | 149,092 | | | | (19 | ) | | $ | 184,657 | | | | 38 | | | $ | 134,222 | |
| Cost of Goods Sold | | | 147,107 | | | | (15 | ) | | | 173,654 | | | | 44 | | | | 120,470 | |
| Operating Expenses | | | 12,353 | | | | 4 | | | | 11,886 | | | | (3 | ) | | | 12,235 | |
| Depreciation and Amortization | | | 1,906 | | | | (5 | ) | | | 2,009 | | | | (1 | ) | | | 2,023 | |
| Operating Loss | | $ | (12,274 | ) | | | (324 | ) | | $ | (2,892 | ) | | | (472 | ) | | $ | (506 | ) |
2012 compared with 2011
The decrease in revenues in our Construction segment in 2012 compared with 2011 relates to the following:
| ● | Revenues at Foley decreased $48.3 million (34.0%) due to a decrease in work volume and the effect of cost overruns on estimated revenues recognized under percentage-of-completion accounting, where revenues are recognized during the project based on the ratio of actual costs incurred to total estimated costs to complete the job. Under percentage-of-completion accounting, increases in costs on certain projects of $14.9 million in 2012 and $7.0 million in 2011 in excess of initial estimates resulted in declining levels of revenue recognized relative to costs incurred and an erosion of margins on those projects. |
| ● | Revenues at Aevenia increased $12.7 million (29.6%) mainly due to an increase in electrical transmission, distribution and substation work in the oil patch region of western North Dakota. |
The decrease in cost of goods sold in our Construction segment in 2012 compared with 2011 relates to the following:
| ● | Cost of goods sold at Foley decreased $35.8 million. The decrease reflects reductions in material and subcontractor costs due to a decrease in work volume between periods. |
| ● | Cost of goods sold at Aevenia increased $9.2 million as a result of the increase in electrical transmission, distribution and substation work, which drove increases in labor, material, subcontractors and rent costs. |
The increase in other operating expenses in our Construction segment in 2012 compared with 2011 relates to the following:
| ● | Operating expenses at Foley increased $0.3 million as a result of increased expenditures for outside services. |
| ● | Operating expenses at Aevenia increased $0.1 million as a result of increased expenditures for outside services. |
2011 compared with 2010
The increase in revenues in our Construction segment in 2011 compared with 2010 relates to the following:
| ● | Revenues at Foley increased $48.7 million (52.3%) due to an increase in construction activity. |
| ● | Revenues at Aevenia increased $1.7 million (4.1%) mainly due to increased revenue from electrical and data wiring work. |
The increase in cost of goods sold in our Construction segment in 2011 compared with 2010 relates to the following:
| ● | Cost of goods sold at Foley increased $51.9 million, mainly in the areas of material and subcontractor costs related to the increase in Foley’s work volume between the periods. |
| ● | Cost of goods sold at Aevenia increased $1.3 million between the periods, primarily in labor costs, as a result of increased electrical and data wiring work and the reporting of indirect labor costs in cost of goods sold in 2011 as compared to other operating expenses in 2010. |
The decrease in other operating expenses in our Construction segment in 2011 compared with 2010 relates to the following:
| ● | Operating expenses at Foley increased $1.0 million between the periods mainly for salaries and benefits in order to support the increase in project growth. |
| ● | Operating expenses at Aevenia decreased $1.4 million as a result of indirect labor costs being recorded in costs of goods sold in 2011 instead of operating expense, an increase in gains on sales of assets and a decrease in outside legal services. |
PLASTICS
The following table summarizes the results of operations for our Plastics segment for the years ended December 31:
| (in thousands) | | 2012 | | | % change | | | 2011 | | | % change | | | 2010 | | | 2013 | | | % change | | | 2012 | | | % change | | | 2011 | |
| Operating Revenues | | $ | 150,517 | | | | 22 | | | $ | 123,669 | | | | 28 | | | $ | 96,945 | | | $ | 164,957 | | | | 10 | | | $ | 150,517 | | | | 22 | | | $ | 123,669 | |
| Cost of Goods Sold | | | 112,662 | | | | 9 | | | | 103,131 | | | | 24 | | | | 82,866 | | |
| Cost of Products Sold | | | | 129,042 | | | | 15 | | | | 112,662 | | | | 9 | | | | 103,131 | |
| Operating Expenses | | | 8,784 | | | | 41 | | | | 6,210 | | | | 20 | | | | 5,174 | | | | 8,571 | | | | (2 | ) | | | 8,784 | | | | 41 | | | | 6,210 | |
| Depreciation and Amortization | | | 3,118 | | | | (8 | ) | | | 3,377 | | | | (2 | ) | | | 3,430 | | | | 3,350 | | | | 7 | | | | 3,118 | | | | (8 | ) | | | 3,377 | |
| Operating Income | | $ | 25,953 | | | | 137 | | | $ | 10,951 | | | | 100 | | | $ | 5,475 | | | $ | 23,994 | | | | (8 | ) | | $ | 25,953 | | | | 137 | | | $ | 10,951 | |
2013 compared with 2012
The increase in Plastics segment revenue is the result of a 12.0% increase in pounds of PVC pipe sold, partially offset by a 2.2% decrease in the price per pound of pipe sold. Sales volume increased as construction and housing markets continued to improve in the South Central and Southwest regions of the United States and construction activity increased in the North Central United States in the second half of 2013. The increase in costs of products sold was mostly due to the increase in pounds of pipe sold, but also reflects a 2.2% increase in the cost per pound of pipe sold related to higher PVC resin costs driven by high global demand and an increase in the cost of ethylene, a key ingredient in the production of PVC resin. The reduction in operating expenses reflects a reduction in incentive compensation related to the decrease in operating income between the years. The increase in depreciation and amortization expense is related to equipment replacement costs incurred in 2013 at our Arizona plant associated with increased production levels and machine usage.
2012 compared with 2011
The $26.8 million increase in Plastics operating revenues in 2012 compared with 2011 was due to a 17.0% increase in pounds of PVC pipe sold combined with a 4.1% increase in the price per pound of PVC pipe sold. The $9.5 million increase in cost of goodsproducts sold was related to the increase in pounds of PVC pipe sold offset by a 6.6% reduction in the cost per pound of pipe sold. The decrease in the cost per pound of pipe sold was due to lower prices of resin between the years and increased productivity as fixed production costs were spread over a larger volume of pipe produced over longer production runs with less downtime. The $2.6 million increase in operating expenses is mainly due to increased employee incentives related to improved operating results, but also reflects increases in commissions related to the increase in sales volume.
2011CONSTRUCTION
The following table summarizes the results of operations for our Construction segment for the years ended December 31:
| (in thousands) | | 2013 | | | % change | | | 2012 | | | % change | | | 2011 | |
| Operating Revenues | | $ | 149,910 | | | | 1 | | | $ | 149,092 | | | | (19 | ) | | $ | 184,657 | |
| Cost of Construction Revenues Earned | | | 133,430 | | | | (9 | ) | | | 147,107 | | | | (15 | ) | | | 173,654 | |
| Operating Expenses | | | 11,855 | | | | (4 | ) | | | 12,353 | | | | 4 | | | | 11,886 | |
| Depreciation and Amortization | | | 2,009 | | | | 5 | | | | 1,906 | | | | (5 | ) | | | 2,009 | |
| Operating Income (Loss) | | $ | 2,616 | | | | -- | | | $ | (12,274 | ) | | | (324 | ) | | $ | (2,892 | ) |
2013 compared with 20102012
Revenues in our Construction segment were relatively flat in 2013 compared with 2012, but our individual operating companies experienced significant changes in revenue due to the following:
| ● | Revenues at Foley increased $16.5 million (17.6%) mainly as a result of recognizing revenue in 2013 on several large projects initiated in 2012. Also, in 2012, increases in costs on certain projects in excess of initial estimates resulted in declining levels of revenue recognized relative to costs incurred and an erosion of margins on those projects under percentage–of–completion accounting. |
| | Revenues at Aevenia decreased $15.7 million (28.3%) as a result of a decrease in construction activity due to a strategic reduction in the volume of telecommunications jobs pursued in 2013 and a harsher winter and colder and wetter spring in 2013 that delayed the start of many construction projects relative to the early start to construction that was facilitated by extremely mild weather in the first six months of 2012. Aevenia’s 2012 revenues also included $5.4 million from Moorhead Electric, Inc. (MEI), an Aevenia subsidiary that was sold in October 2012. |
The $26.7 million increase in Plastics operating revenues in 2011 compared with 2010 was due to a 10.7% increase in pounds of PVC pipe sold combined with a 15.2% increase in the price per pound of PVC pipe sold driven by an increase in resin prices. The $20.3 million increasedecrease in cost of goods sold was relatedconstruction revenues earned in our Construction segment in 2013 compared with 2012 relates to the following:
| | Cost of construction revenues earned at Foley decreased $0.6 million despite the large increase in Foley’s revenues as a result of a reduction in cost overruns on major projects nearing completion during the periods, mostly offset by an increase in costs related to the increased volume of work completed in 2013 on several large projects that were initiated in 2012. As a result of these revenue and cost changes, Foley went from recording a $15.9 million operating loss in 2012 to recording $1.1 million in operating income in 2013. |
| | Cost of construction revenues earned at Aevenia decreased $13.1 million as a result of a decrease in construction activity due to the strategic reduction in telecommunications jobs pursued in 2013 and the harsher winter and colder and wetter spring in 2013 delaying the start of many construction projects, and due to the sale of MEI in October 2012. MEI’s cost of goods sold totaled $4.5 million in 2012. |
The decrease in poundsother operating expenses in our Construction segment in 2013 compared with 2012 relates to the following:
| | Operating expenses at Foley increased $0.2 million as a result of minor increases in several categories of expense in 2013, which can be attributed to an increase in the level of Foley’s business activity in 2013. |
| | Operating expenses at Aevenia decreased $0.7 million between the years: $0.5 million as a result of the sale of MEI in October 2012, and $0.2 million related to a reduction in gains from sales of assets. |
2012 compared with 2011
The decrease in revenues in our Construction segment in 2012 compared with 2011 relates to the following:
| | Revenues at Foley decreased $48.3 million (34.0%) due to a decrease in work volume and the effect of cost overruns on estimated revenues recognized under percentage-of-completion accounting, where revenues are recognized during the project based on the ratio of actual costs incurred to total estimated costs to complete the job. Under percentage-of-completion accounting, increases in costs on certain projects of $14.9 million in 2012 and $7.0 million in 2011 in excess of initial estimates resulted in declining levels of revenue recognized relative to costs incurred and an erosion of margins on those projects. |
| | Revenues at Aevenia increased $12.7 million (29.6%) mainly due to an increase in electrical transmission, distribution and substation work in the oil patch region of western North Dakota. |
The decrease in cost of PVC pipe sold combinedconstruction revenues earned in our Construction segment in 2012 compared with a 12.4% increase in2011 relates to the cost per pound of pipe sold, which was also driven by the increase in PVC resin prices. following:
| | Cost of construction revenues earned at Foley decreased $35.8 million. The decrease reflects reductions in material and subcontractor costs due to a decrease in work volume between periods. |
| | Cost of construction revenues earned at Aevenia increased $9.2 million as a result of the increase in electrical transmission, distribution and substation work, which drove increases in labor, material, subcontractors and rent costs. |
The increase in other operating expenses is duein our Construction segment in 2012 compared with 2011 relates to increased labor costs and in commissions paid to independent sales representatives.the following:
| | Operating expenses at Foley increased $0.3 million as a result of increased expenditures for outside services. |
| | Operating expenses at Aevenia increased $0.1 million as a result of increased expenditures for outside services. |
CORPORATE
Corporate includes items such as corporate staff and overhead costs, the results of our captive insurance company and other items excluded from the measurement of operating segment performance. Corporate is not an operating segment. Rather it is added to operating segment totals to reconcile to totals on our consolidated statements of income.
| (in thousands) | | 2012 | | | %
change | | | 2011 | | | %
change | | | 2010 | | | 2013 | | | % change | | | 2012 | | | % change | | | 2011 | |
| Operating Expenses | | $ | 13,283 | | | | (11 | ) | | $ | 14,897 | | | | (5 | ) | | $ | 15,741 | | | $ | 12,755 | | | | (4 | ) | | $ | 13,283 | | | | (11 | ) | | $ | 14,897 | |
| Depreciation and Amortization | | | 481 | | | | (13 | ) | | | 550 | | | | 5 | | | | 523 | | | | 207 | | | | (57 | ) | | | 481 | | | | (13 | ) | | | 550 | |
The $0.5 million decrease in Corporate operating expenses in 2013 compared with 2012 reflects:
| | a $2.9 million increase in various corporate expenses allocated or directly charged to our Electric segment due, in part, to changes in allocation factors resulting from the corporation’s recent divestitures, and |
| | a $0.5 million reduction in insurance costs and contracted services, |
offset by:
| | a $2.4 million increase in incentive and performance award accruals related to our improved operating results and the strong performance of our common stock price as measured against the stock performances of our peer group of companies in the Edison Electric Institute Index, and |
| | a $0.5 million increase in labor costs mainly related to staffing additions at Varistar Corporation (Varistar). |
Corporate operating expenses were lower in 2012 than in 2011 as a result of termination benefits incurred in the third quarter of 2011 associated with the resignation of the corporation’sCompany’s former chief executive officer and reductions in health benefit costs. Corporate operating expenses were lower in 2011 than in 2010 as a result of severance costs related to personnel changes incurred in 2010.
CONSOLIDATED OTHER INCOME
Other income increased $1.3 million in 2012 compared with 2011 due to an increase in investment income and gains on investments of $1.0 million, and a $0.3 million increase in Allowance for Funds Used during Construction (AFUDC).
Other income increased $1.0 million in 2011 compared with 2010, mainly due to a $0.9 million increase in AFUDC.
LOSS ON EARLY RETIREMENT OF DEBT
On November 6 and 25, 2013 we purchased, in two separate transactions, approximately $47.7 million of our outstanding $100 million 9.000% Notes due December 15, 2016 (the 2016 Notes). The purchased Notes (Purchased 2016 Notes) were subsequently retired and are no longer outstanding. The price we paid for the Purchased 2016 Notes was approximately $59.4 million, which includes the principal amount of the Purchased 2016 Notes, plus accrued interest of approximately $1.8 million through the respective purchase dates and a negotiated premium of approximately $9.9 million (which was less than the redemption premium we would have been required to pay under the terms of the 2016 Notes). On repayment, $0.4 million in unamortized debt expense related to the 2016 Notes was immediately recognized as expense along with the $9.9 million negotiated premium. We used cash on hand to fund the purchase of the Purchased 2016 Notes. The amount of the debt retired as a result of these transactions is approximately equivalent to the remaining amount of debt that was associated with the operating companies we divested over the last two years. The retirement of the Purchased 2016 Notes reduces pre-tax interest expense by approximately $4.3 million per year for the remaining three-year life of the Purchased 2016 Notes. The $10.3 million ($6.2 million net-of-tax) loss on early retirement of debt had a negative impact on 2013 diluted earnings per share of $0.17.
On July 13, 2012 we prepaid in full theour $50 million 8.89% Senior Unsecured Note due November 30, 2017 (the Cascade Note.Note). The price to prepay the Cascade Note was $63,031,000,$63.0 million which included the principal amount of the Cascade Note plus accrued interest of $531,000$0.5 million and a negotiated prepayment premium of $12,500,000.$12.5 million. On repayment, $606,000$0.6 million in unamortized debt expense related to this note was immediately recognized as expense along with the $12,500,000$12.5 million negotiated prepayment premium. The $13,106,000$13.1 million ($7,864,0007.9 million net-of-tax) loss on early retirement of debt had a negative impact on 2012 diluted earnings per share of $0.22.
CONSOLIDATED INTEREST CHARGES
The $4.9 million decrease in interest charges in 2013 compared with 2012 reflects the following:
| ● | a $2.7 million decrease in interest and debt amortization charges related to the retirement of the Cascade Note on July 13, 2012, |
| ● | a $0.6 million net decrease in interest charges as a result of OTP’s debt refinancing on March 1, 2013, when it borrowed $40.9 million under an unsecured term loan due January 15, 2015, bearing interest at LIBOR plus 0.875% and used a portion of the proceeds to redeem its $20.1 million in outstanding 4.85% Mercer County, North Dakota Pollution Control Refunding Revenue Bonds and $5.1 million in outstanding 4.65% Grant County, South Dakota Pollution Control Refunding Revenue Bonds, |
| ● | a $0.5 million reduction in interest charges as a result of the early retirement in November 2013 of $47.7 million of our outstanding 9.000% Notes, |
| ● | a $0.4 million reduction in line of credit non-use fees as a result of reducing the Otter Tail Corporation line limit by $50 million in October 2012, |
| ● | a $0.3 million increase in capitalized interest expense at OTP related to OTP’s increasing investment in the Big Stone Plant air quality control system (AQCS), and |
| ● | a $0.3 million decrease in interest on the Company’s and OTP’s line of credit borrowings. |
Interest charges decreased $3.7 million in 2012 compared with 2011 due to a $2.0 million reduction in interest expense related to the retirement of the Cascade Note on July 13, 2012, a $1.2 million reduction in short-term debt interest related to a $38.8 million reduction in the daily average balance of short-term debt outstanding between the years, and a $0.6 reduction in the amortization of debt issuance expense and reacquisition losses on OTP debt.
CONSOLIDATED OTHER INCOME
Interest charges decreased $1.2
Other income was $4.1 million for both 2013 and 2012. Other income increased $1.3 million in 20112012 compared with 20102011 due to a $0.6 reductionan increase of $1.0 million in the amortization of debt issuance expenseinvestment income and reacquisition lossesgains on investments, and a $0.6$0.3 million increase in capitalized interest charges related to an increase in construction work in progress between the years.Allowance for Funds Used during Construction.
CONSOLIDATED INCOME TAXES
Income tax expense - continuing operations was $13.5 million in 2013 compared with $2.1 million in 2012 compared withand $4.1 million in 2011 and $3.2 million in 2010.2011. The following table provides a reconciliation of income tax expense – continuing operations calculated at the federal statutory rate on income from continuing operations before income taxes reported on our consolidated statements of income for the years ended December 31, 2013, 2012 2011 and 2010:2011:
| | | For the Year Ended December 31, | | | For the Year Ended December 31, | |
| (in thousands) | | 2012 | | | 2011 | | | 2010 | | | 2013 | | | 2012 | | | 2011 | |
| Tax Computed at Federal Statutory Rate | | $ | 14,385 | | | $ | 13,661 | | | $ | 10,329 | | | $ | 22,301 | | | $ | 14,385 | | | $ | 13,661 | |
| Increases (Decreases) in Tax from: | | | | | | | | | | | | | | | | | | | | | | | | |
| Federal Production Tax Credit | | | (6,695 | ) | | | (7,281 | ) | | | (6,441 | ) | |
| Federal Production Tax Credit (PTC) | | | | (6,612 | ) | | | (6,695 | ) | | | (7,281 | ) |
| State Income Taxes Net of Federal Income Tax Benefit | | | | 1,667 | | | | (849 | ) | | | 798 | |
| North Dakota Wind Tax Credit Amortization – Net of Federal Taxes | | | (891 | ) | | | (996 | ) | | | (1,163 | ) | | | (863 | ) | | | (891 | ) | | | (996 | ) |
| State Income Taxes Net of Federal Income Tax Benefit | | | (849 | ) | | | 798 | | | | (1,186 | ) | |
| Corporate Owned Life Insurance | | | | (856 | ) | | | (585 | ) | | | (388 | ) |
| Allowance for Funds Used During Construction - Equity | | | | (638 | ) | | | (409 | ) | | | (301 | ) |
| Dividend Received/Paid Deduction | | | | (632 | ) | | | (656 | ) | | | (677 | ) |
| Investment Tax Credit Amortization | | | (720 | ) | | | (855 | ) | | | (926 | ) | | | (597 | ) | | | (720 | ) | | | (855 | ) |
| Dividend Received/Paid Deduction | | | (656 | ) | | | (677 | ) | | | (692 | ) | |
| Corporate Owned Life Insurance | | | (585 | ) | | | (388 | ) | | | (556 | ) | |
| Impact of Medicare Part D Change | | | (584 | ) | | | (599 | ) | | | 1,692 | | |
| Allowance for Funds Used During Construction - Equity | | | (409 | ) | | | (301 | ) | | | (1 | ) | |
| Tax Depreciation - Treasury Grant for Wind Farms | | | (304 | ) | | | (507 | ) | | | (845 | ) | | | (304 | ) | | | (304 | ) | | | (507 | ) |
| Differences Reversing in Excess of Federal Rates | | | (143 | ) | | | 680 | | | | 989 | | | | (100 | ) | | | (143 | ) | | | 680 | |
| Impact of Medicare Part D Change | | | | -- | | | | (584 | ) | | | (599 | ) |
| Permanent and Other Differences | | | (416 | ) | | | 586 | | | | 2,031 | | | | 177 | | | | (416 | ) | | | 586 | |
| Total Income Tax Expense – Continuing Operations | | $ | 2,133 | | | $ | 4,121 | | | $ | 3,231 | | | $ | 13,543 | | | $ | 2,133 | | | $ | 4,121 | |
| Effective Income Tax Rate – Continuing Operations | | | 5.2 | % | | | 10.6 | % | | | 10.9 | % | | | 21.3 | % | | | 5.2 | % | | | 10.6 | % |
Federal PTCs are recognized as wind energy is generated based on a per kwh rate prescribed in applicable federal statutes. North Dakota wind energy credits are based on dollars invested in qualifying facilities and are being recognized on a straight-line basis over 25 years.
DISCONTINUED OPERATIONS
On February 8, 2013 we closed oncompleted the sale of substantially all of the assets of ShoreMasterShrco, formerly included in our Manufacturing segment, for approximately $13.0 million in cash plusand received a future working capital true up to be finalized and paid no later than 180 days after closing. We recorded a $4.6of approximately $2.4 million net-of-tax impairment of ShoreMaster’s assets in December 2012 based on the market value of ShoreMaster’s assets. On November 30, 2012 we completed the sale of the fixed assets of DMI for total proceeds, net of commissions and selling costs, of $18.1 million. On February 29, 2012 we completed the sale of DMS, for $24.0 million net of commissions and selling cost. June 2013.
On January 18, 2012, we sold the assets of Aviva, a subsidiary of Shrco, for $0.3 million in cash. For discontinued operations reporting, Aviva’s results are included in ShoreMaster’sShrco’s consolidated results. On November 30, 2012 we completed the sale of the assets of IMD for total proceeds, net of commissions and selling costs, of $18.1 million. Prior to the sale, IMD was the only remaining entity in our former Wind Energy segment. On February 29, 2012 we completed the sale of DMS, our health services company, for $24.0 million in cash net of commissions and selling costs, which was reduced by a $1.7 million working capital settlement paid to the buyer in February 2013. The DMS working capital settlement was estimated to be $1.9 million at the time of the sale. The final settlement resulted in recording a $0.2 million gain on the sale of DMS in the first quarter of 2013. DMS was the only business in our former Health Services segment.
On December 29, 2011 we completed the sale of Wylie for approximately $25.0 million in cash. Wylie was included in our former Wind Energy segment. On May 6, 2011 we completed the sale of IPH for approximately $86.0 million in cash. IPH was the only business in our former Food Ingredient Processing segment.
Our Wind Energy, Health Services and Food Ingredient Processing segments were eliminated as a result of the sales of IMD, DMS and IPH. The financial position, results of operations, and cash flows of DMI,IMD, Wylie, ShoreMaster,Shrco, DMS and IPH are reported as discontinued operations in our consolidated financial statements. Following are summary presentations of the results of discontinued operations for the years ended December 31, 2013, 2012 2011 and 2010:
| | | For the Year Ended December 31, 2012 | |
| (in thousands) | | DMI | | | Wylie | | | ShoreMaster | | | DMS | | | IPH | | | Intercompany transactions adjustment | | | Total | |
| Operating Revenues | | $ | 186,151 | | | $ | -- | | | $ | 32,563 | | | $ | 16,362 | | | $ | -- | | | $ | (2,017 | ) | | $ | 233,059 | |
| Operating Expenses | | | 184,462 | | | | 179 | | | | 36,163 | | | | 14,741 | | | | -- | | | | (2,017 | ) | | | 233,528 | |
| Asset Impairment Charge | | | 45,573 | | | | -- | | | | 7,747 | | | | -- | | | | -- | | | | -- | | | | 53,320 | |
| Other Income | | | 135 | | | | -- | | | | 15 | | | | 122 | | | | -- | | | | -- | | | | 272 | |
| Interest Expense | | | 5,787 | | | | -- | | | | 1,553 | | | | 279 | | | | -- | | | | (7,444 | ) | | | 175 | |
| Income Tax (Benefit) Expense | | | (15,792 | ) | | | 13 | | | | (4,021 | ) | | | 1,734 | | | | 106 | | | | 2,978 | | | | (14,982 | ) |
| Net Loss from Operations | | | (33,744 | ) | | | (192 | ) | | | (8,864 | ) | | | (270 | ) | | | (106 | ) | | | 4,466 | | | | (38,710 | ) |
| Loss on Disposition Before Taxes | | | -- | | | | (62 | ) | | | -- | | | | (5,154 | ) | | | -- | | | | -- | | | | (5,216 | ) |
| Income Tax Expense (Benefit) on Disposition | | | -- | | | | 460 | | | | -- | | | | (145 | ) | | | -- | | | | -- | | | | 315 | |
| Net Loss on Disposition | | | -- | | | | (522 | ) | | | -- | | | | (5,009 | ) | | | -- | | | | -- | | | | (5,531 | ) |
| Net Loss | | $ | (33,744 | ) | | $ | (714 | ) | | $ | (8,864 | ) | | $ | (5,279 | ) | | $ | (106 | ) | | $ | 4,466 | | | $ | (44,241 | ) |
| | | For the Year Ended December 31, 2011 | |
| (in thousands) | | DMI | | | Wylie | | | ShoreMaster | | | DMS | | | IPH | | | Intercompany transactions adjustment | | | Total | |
| Operating Revenues | | $ | 201,921 | | | $ | 49,884 | | | $ | 39,863 | | | $ | 89,558 | | | $ | 28,125 | | | $ | (6,016 | ) | | $ | 403,335 | |
| Operating Expenses | | | 218,542 | | | | 55,927 | | | | 41,478 | | | | 85,244 | | | | 24,046 | | | | (6,016 | ) | | | 419,221 | |
| Asset Impairment Charge | | | 3,142 | | | | -- | | | | 456 | | | | 56,379 | | | | -- | | | | -- | | | | 59,977 | |
| Other (Deductions) Income | | | (46 | ) | | | 18 | | | | 1 | | | | 281 | | | | (228 | ) | | | (3 | ) | | | 23 | |
| Interest Expense | | | 6,852 | | | | 709 | | | | 1,580 | | | | 1,726 | | | | 11 | | | | (10,636 | ) | | | 242 | |
| Income Tax (Benefit) Expense | | | (4,768 | ) | | | (2,683 | ) | | | (1,462 | ) | | | (16,058 | ) | | | 1,462 | | | | 4,254 | | | | (19,255 | ) |
| Net (Loss) Income from Operations | | | (21,893 | ) | | | (4,051 | ) | | | (2,188 | ) | | | (37,452 | ) | | | 2,378 | | | | 6,379 | | | | (56,827 | ) |
| (Loss) Gain on Disposition Before Taxes | | | -- | | | | (946 | ) | | | -- | | | | -- | | | | 15,471 | | | | -- | | | | 14,525 | |
| Income Tax Expense on Disposition | | | -- | | | | 2,854 | | | | -- | | | | -- | | | | 2,997 | | | | -- | | | | 5,851 | |
| Net (Loss) Gain on Disposition | | | -- | | | | (3,800 | ) | | | -- | | | | -- | | | | 12,474 | | | | -- | | | | 8,674 | |
| Net (Loss) Income | | $ | (21,893 | ) | | $ | (7,851 | ) | | $ | (2,188 | ) | | $ | (37,452 | ) | | $ | 14,852 | | | $ | 6,379 | | | $ | (48,153 | ) |
48| | | For the Year Ended December 31, 2013 | |
| (in thousands) | | IMD | | | Wylie | | | Shrco | | | DMS | | | IPH | | | Intercompany
Transactions
Adjustment | | | Total | |
| Operating Revenues | | $ | -- | | | $ | -- | | | $ | 2,016 | | | $ | -- | | | $ | -- | | | $ | -- | | | $ | 2,016 | |
| Operating Expenses | | | (988 | ) | | | 640 | | | | 2,622 | | | | (269 | ) | | | -- | | | | -- | | | | 2,005 | |
| Other Income | | | 412 | | | | -- | | | | 67 | | | | -- | | | | -- | | | | -- | | | | 479 | |
| Income Tax Expense (Benefit) | | | 370 | | | | (256 | ) | | | (213 | ) | | | 108 | | | | -- | | | | -- | | | | 9 | |
| Net Income (Loss) from Operations | | | 1,030 | | | | (384 | ) | | | (326 | ) | | | 161 | | | | -- | | | | -- | | | | 481 | |
| Gain on Disposition Before Taxes | | | -- | | | | -- | | | | 16 | | | | 200 | | | | -- | | | | -- | | | | 216 | |
| Income Tax Expense on Disposition | | | -- | | | | -- | | | | 6 | | | | -- | | | | -- | | | | -- | | | | 6 | |
| Net Gain on Disposition | | | -- | | | | -- | | | | 10 | | | | 200 | | | | -- | | | | -- | | | | 210 | |
| Net Income (Loss) | | $ | 1,030 | | | $ | (384 | ) | | $ | (316 | ) | | $ | 361 | | | $ | -- | | | $ | -- | | | $ | 691 | |
| | | For the Year Ended December 31, 2012 | |
| (in thousands) | | IMD | | | Wylie | | | Shrco | | | DMS | | | IPH | | | Intercompany
Transactions
Adjustment | | | Total | |
| Operating Revenues | | $ | 186,151 | | | $ | -- | | | $ | 32,563 | | | $ | 16,362 | | | $ | -- | | | $ | (2,017 | ) | | $ | 233,059 | |
| Operating Expenses | | | 184,462 | | | | 179 | | | | 36,163 | | | | 14,741 | | | | -- | | | | (2,017 | ) | | | 233,528 | |
| Asset Impairment Charge | | | 45,573 | | | | -- | | | | 7,747 | | | | -- | | | | -- | | | | -- | | | | 53,320 | |
| Other Income | | | 135 | | | | -- | | | | 15 | | | | 122 | | | | -- | | | | -- | | | | 272 | |
| Interest Expense | | | 5,787 | | | | -- | | | | 1,553 | | | | 279 | | | | -- | | | | (7,444 | ) | | | 175 | |
| Income Tax (Benefit) Expense | | | (15,792 | ) | | | 13 | | | | (4,021 | ) | | | 1,734 | | | | 106 | | | | 2,978 | | | | (14,982 | ) |
| Net Loss from Operations | | | (33,744 | ) | | | (192 | ) | | | (8,864 | ) | | | (270 | ) | | | (106 | ) | | | 4,466 | | | | (38,710 | ) |
| Loss on Disposition Before Taxes | | | -- | | | | (62 | ) | | | -- | | | | (5,154 | ) | | | -- | | | | -- | | | | (5,216 | ) |
| Income Tax Expense (Benefit) on Disposition | | | -- | | | | 460 | | | | -- | | | | (145 | ) | | | -- | | | | -- | | | | 315 | |
| Net Loss on Disposition | | | -- | | | | (522 | ) | | | -- | | | | (5,009 | ) | | | -- | | | | -- | | | | (5,531 | ) |
| Net Loss | | $ | (33,744 | ) | | $ | (714 | ) | | $ | (8,864 | ) | | $ | (5,279 | ) | | $ | (106 | ) | | $ | 4,466 | | | $ | (44,241 | ) |
| | | For the Year Ended December 31, 2010 | | | For the Year Ended December 31, 2011 | |
| (in thousands) | | DMI | | | Wylie | | | ShoreMaster | | | DMS | | | IPH | | | Intercompany transactions adjustment | | | Total | | | IMD | | | Wylie | | | Shrco | | | DMS | | | IPH | | | Intercompany
Transactions
Adjustment | | | Total | |
| Operating Revenues | | $ | 143,603 | | | $ | 54,143 | | | $ | 35,624 | | | $ | 100,301 | | | $ | 77,412 | | | $ | (5,830 | ) | | $ | 405,253 | | | $ | 201,921 | | | $ | 49,884 | | | $ | 39,863 | | | $ | 89,558 | | | $ | 28,125 | | | $ | (6,016 | ) | | $ | 403,335 | |
| Operating Expenses | | | 159,646 | | | | 52,311 | | | | 41,351 | | | | 98,794 | | | | 65,261 | | | | (5,830 | ) | | | 411,533 | | | | 218,542 | | | | 55,927 | | | | 41,478 | | | | 85,244 | | | | 24,046 | | | | (6,016 | ) | | | 419,221 | |
| Asset Impairment Charge | | | -- | | | | -- | | | | 19,740 | | | | -- | | | | -- | | | | -- | | | | 19,740 | | | | 3,142 | | | | -- | | | | 456 | | | | 56,379 | | | | -- | | | | -- | | | | 59,977 | |
| Other (Deductions) Income | | | (734 | ) | | | 8 | | | | 21 | | | | 331 | | | | (326 | ) | | | -- | | | | (700 | ) | | | (46 | ) | | | 18 | | | | 1 | | | | 281 | | | | (228 | ) | | | (3 | ) | | | 23 | |
| Interest Expense | | | 5,614 | | | | 522 | | | | 1,492 | | | | 1,289 | | | | 111 | | | | (8,844 | ) | | | 184 | | | | 6,852 | | | | 709 | | | | 1,580 | | | | 1,726 | | | | 11 | | | | (10,636 | ) | | | 242 | |
| Income Tax (Benefit) Expense | | | (356 | ) | | | 511 | | | | (7,058 | ) | | | 369 | | | | 3,716 | | | | 3,538 | | | | 720 | | | | (4,768 | ) | | | (2,683 | ) | | | (1,462 | ) | | | (16,058 | ) | | | 1,462 | | | | 4,254 | | | | (19,255 | ) |
| Net (Loss) Income from Operations | | | | (21,893 | ) | | | (4,051 | ) | | | (2,188 | ) | | | (37,452 | ) | | | 2,378 | | | | 6,379 | | | | (56,827 | ) |
| (Loss) Gain on Disposition Before Taxes | | | | -- | | | | (946 | ) | | | -- | | | | -- | | | | 15,471 | | | | -- | | | | 14,525 | |
| Income Tax Expense on Disposition | | | | -- | | | | 2,854 | | | | -- | | | | -- | | | | 2,997 | | | | -- | | | | 5,851 | |
| Net (Loss) Gain on Disposition | | | | -- | | | | (3,800 | ) | | | -- | | | | -- | | | | 12,474 | | | | -- | | | | 8,674 | |
| Net (Loss) Income | | $ | (22,035 | ) | | $ | 807 | | | $ | (19,880 | ) | | $ | 180 | | | $ | 7,998 | | | $ | 5,306 | | | $ | (27,624 | ) | | $ | (21,893 | ) | | $ | (7,851 | ) | | $ | (2,188 | ) | | $ | (37,452 | ) | | $ | 14,852 | | | $ | 6,379 | | | $ | (48,153 | ) |
IMPACT OF INFLATION
OTP operates under regulatory provisions that allow price changes in fuel and certain purchased power costs to be passed to most retail customers through automatic adjustments to its rate schedules under fuel clause adjustments. Other increases in the cost of electric service must be recovered through timely filings for electric rate increases with the appropriate regulatory agency.
Our Manufacturing, ConstructionPlastics and PlasticsConstruction segments consist entirely of businesses whose revenues are not subject to regulation by ratemaking authorities. Increased operating costs are reflected in product or services pricing with any limitations on price increases determined by the marketplace. Raw material costs, labor costs, fuel and energy costs and interest rates are important components of costs for companies in these segments. Any or all of these components could be impacted by inflation or other pricing pressures, with a possible adverse effect on our profitability, especially where increases in these costs exceed price increases on finished products. In recent years, our operating companies have faced strong inflationary and other pricing pressures with respect to steel, fuel, resin, aluminum and health care costs, which have been partially mitigated by pricing adjustments.
LIQUIDITY
The following table presents the status of our lines of credit as of December 31, 20122013 and December 31, 2011:2012:
| (in thousands) | | Line Limit | | | In Use on December 31, 2012 | | | Restricted due to
Outstanding
Letters of Credit | | | Available on December 31,
2012 | | | Available on December 31,
2011 | | | Line Limit | | | In Use on
December 31,
2013 | | | Restricted due to
Outstanding
Letters of Credit | | | Available on December 31,
2013 | | | Available on
December 31,
2012 | |
| Otter Tail Corporation Credit Agreement | | $ | 150,000 | | | $ | -- | | | $ | 733 | | | $ | 149,267 | | | $ | 198,776 | | | $ | 150,000 | | | $ | -- | | | $ | 659 | | | $ | 149,341 | | | $ | 149,267 | |
| OTP Credit Agreement | | | 170,000 | | | | -- | | | | 3,189 | | | | 166,811 | | | | 165,950 | | | | 170,000 | | | | 51,195 | | | | 1,830 | | | | 116,975 | | | | 166,811 | |
| Total | | $ | 320,000 | | | $ | -- | | | $ | 3,922 | | | $ | 316,078 | | | $ | 364,726 | | | $ | 320,000 | | | $ | 51,195 | | | $ | 2,489 | | | $ | 266,316 | | | $ | 316,078 | |
We believe we have the necessary liquidity to effectively conduct business operations for an extended period if needed. Our balance sheet is strong and we are in compliance with our debt covenants. Financial flexibility is provided by operating cash flows, unused lines of credit, strong financial coverages, investment grade credit ratings and alternative financing arrangements such as leasing.
We believe our financial condition is strong and our cash, other liquid assets, operating cash flows, existing lines of credit, access to capital markets and borrowing ability because of investment-grade credit ratings, when taken together, provide adequate resources to fund ongoing operating requirements and future capital expenditures related to expansion of existing businesses and development of new projects. On May 11, 2012 we filed a shelf registration statement with the Securities and Exchange Commission (SEC) under which we may offer for sale, from time to time, either separately or together in any combination, equity, debt or other securities described in the shelf registration statement.statement, which expires on May 10, 2015. On May 14, 2012, we entered into a Distribution Agreement (the Agreement) with J.P. Morgan Securities (JPMS) under which we may offer and sell our common shares from time to time through JPMS, as our distribution agent, up to an aggregate sales price of $75 million.
Equity or debt financing will be required in the period 20132014 through 20172018 given the expansion plans related to our Electric segment to fund construction of new rate base investments, in the event we decide to reduce borrowings under our lines of credit or refund or retire early any of our presently outstanding debt, to complete acquisitions or for other corporate purposes. Also, our operating cash flow and access to capital markets can be impacted by macroeconomic factors outside our control. In addition, our borrowing costs can be impacted by changing interest rates on short-term and long-term debt and ratings assigned to us by independent rating agencies, which in part are based on certain credit measures such as interest coverage and leverage ratios.
Our common stock dividend payments have exceeded our net income (losses) income in eachfour of the last five years. The determination of the amount of future cash dividends to be declared and paid will depend on, among other things, our financial condition, improvement in earnings per share, to levels in excess of the indicated annual dividend per share of $1.19, cash flows from operations, the level of our capital expenditures and our future business prospects. As a result of certain statutory limitations or regulatory or financing agreements, restrictions could occur on the amount of distributions allowed to be made by the Company’sour subsidiaries. See note 8 to consolidated financial statementstatements for more information. The decision to declare a quarterly dividend is reviewed quarterly by the Board of Directors. On February 3, 2014 our Board of Directors increased the quarterly dividend from $0.2975 to $0.3025 per common share.
Cash provided by operating activities from continuing operations was $150.3 million in 2013 compared with $169.0 million in 2012. The $18.7 million decrease in cash provided by operating activities from continuing operations reflects an $18.7 million decrease in cash provided by changes in accounts payables and other current liabilities between the years.
Cash provided by operating activities from continuing operations was $169.0 million in 2012 compared with $93.7 million in 2011. A major contributor to the $75.3 million increase in cash from operations was a change from cash used for working capital of $26.3 million in 2011 to $24.7 million in cash provided from a reduction in working capital in continuing operations. Deferred debits and other assets increased $25.1 million in 2011 compared to an increase of $4.8 million in 2012, mainly due to a smaller increase in regulatory assets in 2012 compared with 2011. Net cash provided by discontinued operations of $64.6 million in 2012 is mainly from the monetization of DMI’sIMD’s working capital in 2012 after DMI’sIMD’s operations were discontinued. The proceeds generated by the monetization of DMI’sIMD’s working capital were used to pay down our line of credit after the line was used to repurchase the Cascade Note and to pay a $12.5 million repurchase premium to retire the Cascade Note prior to its maturity date.
Net cash used in investing activities of continuing operations was $162.5 million in 2013 compared to $111.9 million in 2012. The $50.6 million increase is mainly due to increases in cash used for capital expenditures of $47.9 million at OTP and $2.3 million at Aevenia between the periods. OTP’s $149.5 million in capital expenditures in 2013 includes a significant level of expenditures for the construction of Big Stone Plant’s new AQCS and expenditures for the construction of two major CapX2020 transmission line projects, the Fargo–Monticello 345 kiloVolt (kV) Project and the Brookings–Southeast Twin Cities 345 kV Project. Net proceeds from the sale of discontinued operations of $12.8 million in 2013 reflect $14.5 million in net proceeds from the sale of the assets of our waterfront equipment manufacturing business less a $1.7 million working capital settlement paid to the buyer of DMS, which we sold in the first quarter of 2012.
Net cash used in investing activities of continuing operations was $111.9 million in 2012 compared to $65.5 million in 2011. The $46.4 million increase in cash used for investing activities reflects a $48.4 million increase in cash used for capital expenditures, mainly due to a $51.8 million increase in capital expenditures at OTP. The increase in cash used for capital expenditures at OTP is mainly related to expenditures for CapX2020 transmission line projects and initial expenditures for Big Stone Plant’s new air quality control systemAQCS scheduled for completion in 2015. Net investing cash flows from discontinued operations were $28.3 million in 2012 compared with $70.9 million in 2011. Net proceeds from the sales of DMS, DMIIMD and Aviva were $42.2 million in 2012, compared to net proceeds of $107.3 million from the sales of IPH and Wylie in 2011. Net cash used in investing activities of discontinued operations of $13.9 million in 2012 mainly reflects cash used by DMS to purchase assets held under operating leases. Net cash used in investing activities of discontinued operations of $36.4 million in 2011 mainly reflects 2011 capital expenditures at DMS, Wylie and IMD.
Net cash used in financing activities of continuing operations of $49.0 million in 2013 includes $57.6 million used for the November 2013 early retirement of $47.7 million of our 9.000% Notes due December 15, 2016 and $43.8 million in common and preferred stock dividend payments, offset by $51.2 million in proceeds from short term borrowings at OTP to fund its significant level of capital expenditures. On March 1, 2013 OTP used proceeds from a $40.9 million unsecured term loan to fund the redemption of all $25.1 million of the then outstanding 4.65% Grant County, South Dakota Pollution Control Refunding Revenue Bonds and 4.85% Mercer County, North Dakota Pollution Control Refunding Revenue Bonds, and to pay off an intercompany note to us that mirrored our $15.5 million in outstanding cumulative preferred shares, which were also redeemed on March 1, 2013.
Net cash used in financing activities of continuing operations of $108.1 million in 2012 includedincludes $62.5 million used for the early retirement of the Cascade Note and $44.0 million for the payment of dividends on our outstanding common and preferred shares. This compares to $92.3 million in cash used in the financing activities of our continuing operations in 2011, when we paid out $43.9 million in dividends. Also in 2011, OTP issued $140 million in long-term debt and used a portion of the proceeds to retire its $90 million Senior Notes due December 1, 2011, and to retire early its $10.4 million in pollution control refunding revenue bonds due December 1, 2012. A portion of the proceeds were also used to pay down OTP’s line of credit borrowings which were at $10.0 million when the debt was issued. We repaid $86.8 million in short-term borrowings and checks issued in excess of cash in 2011. In 2011, net proceeds of $84.3 million from the sale of IPH were used to pay down short-term debt.
CAPITAL REQUIREMENTS
We have a capital expenditure program for expanding, upgrading and improving our plants and operating equipment. Typical uses of cash for capital expenditures are investments in electric generation facilities and environmental upgrades, transmission and distribution lines, manufacturing facilities and upgrades, equipment used in the manufacturing process, and computer hardware and information systems. The capital expenditure program is subject to review and is revised in light of changes in demands for energy, technology, environmental laws, regulatory changes, business expansion opportunities, the costs of labor, materials and equipment and our consolidated financial condition.
Cash used for consolidated capital expenditures was $164 million in 2013, $116 million in 2012 and $67 million in 2011 and $58 million in 2010.2011. Estimated capital expenditures for 20132014 are $204$195 million. Total capital expenditures for the five-year period 20132014 through 20172018 are estimated to be approximately $906$769 million, which includes $247$131 million for OTP’s share of athe new air quality control systemAQCS at Big Stone Plant and $347$304 million for transmission projects including $253$243 million for MVPs and $45$26 million for CapX2020 transmission projects excluding $20($7 million for the Brookings to Southeast Twin Cities CapX2020 MVP project is included inwith the $253$243 million above.for MVP projects).
The breakdown of 2010, 2011, 2012 and 20122013 actual cash used for capital expenditures and 20132014 through 20172018 estimated capital expenditures by segment is as follows:
| | | | | | | | | | | | | | | | | | | | | | | | | | | | |
| (in millions) | | 2011 | | | 2012 | | | 2013 | | | 2014 | | | 2015 | | | 2016 | | | 2017 | | | 2018 | | | Total for
2014-2018 | |
| Electric | | $ | 50 | | | $ | 102 | | | $ | 149 | | | $ | 172 | | | $ | 145 | | | $ | 141 | | | $ | 97 | | | $ | 102 | | | $ | 657 | |
| Manufacturing | | | 10 | | | | 9 | | | | 7 | | | | 17 | | | | 12 | | | | 20 | | | | 15 | | | | 17 | | | | 81 | |
| Plastics | | | 2 | | | | 3 | | | | 3 | | | | 4 | | | | 3 | | | | 3 | | | | 2 | | | | 2 | | | | 14 | |
| Construction | | | 3 | | | | 2 | | | | 5 | | | | 2 | | | | 4 | | | | 3 | | | | 3 | | | | 5 | | | | 17 | |
| Corporate | | | 2 | | | | -- | | | | -- | | | | -- | | | | -- | | | | -- | | | | -- | | | | -- | | | | -- | |
| Total | | $ | 67 | | | $ | 116 | | | $ | 164 | | | $ | 195 | | | $ | 164 | | | $ | 167 | | | $ | 117 | | | $ | 126 | | | $ | 769 | |
| (in millions) | | 2010 | | | 2011 | | | 2012 | | | 2013 | | | 2014 | | | 2015 | | | 2016 | | | 2017 | | | Total for
2013-2017 | |
| Electric | | $ | 43 | | | $ | 50 | | | $ | 102 | | | $ | 182 | | | $ | 185 | | | $ | 170 | | | $ | 113 | | | $ | 161 | | | $ | 811 | |
| Manufacturing | | | 6 | | | | 10 | | | | 9 | | | | 17 | | | | 14 | | | | 15 | | | | 12 | | | | 16 | | | | 74 | |
| Construction | | | 5 | | | | 3 | | | | 2 | | | | 3 | | | | 3 | | | | 2 | | | | 1 | | | | 2 | | | | 11 | |
| Plastics | | | 3 | | | | 2 | | | | 3 | | | | 2 | | | | 2 | | | | 2 | | | | 2 | | | | 2 | | | | 10 | |
| Corporate | | | 1 | | | | 2 | | | | -- | | | | -- | | | | -- | | | | -- | | | | -- | | | | -- | | | | -- | |
| Total | | $ | 58 | | | $ | 67 | | | $ | 116 | | | $ | 204 | | | $ | 204 | | | $ | 189 | | | $ | 128 | | | $ | 181 | | | $ | 906 | |
The following table summarizes our contractual obligations at December 31, 20122013 and the effect these obligations are expected to have on our liquidity and cash flow in future periods.
| (in millions) | | Total | | | Less than 1 Year | | | 1-3 Years | | | 3-5 Years | | | More than 5 Years | | | Total | | | Less than
1 Year | | | 1-3 Years | | | 3-5 Years | | | More than
5 Years | |
| Coal Contracts (required minimums) | | $ | 797 | | | $ | 43 | | | $ | 37 | | | $ | 43 | | | $ | 674 | | | $ | 761 | | | $ | 50 | | | $ | 42 | | | $ | 47 | | | $ | 622 | |
| Long-Term Debt Obligations | | | 422 | | | | -- | | | | 1 | | | | 138 | | | | 283 | | |
| Interest on Long-Term Debt Obligations | | | 250 | | | | 26 | | | | 53 | | | | 43 | | | | 128 | | |
| Debt Obligations | | | | 441 | | | | 92 | | | | 53 | | | | 33 | | | | 263 | |
| Capacity and Energy Requirements | | | 170 | | | | 31 | | | | 30 | | | | 32 | | | | 77 | | | | 347 | | | | 23 | | | | 53 | | | | 48 | | | | 223 | |
| Interest on Debt Obligations | | | | 202 | | | | 21 | | | | 42 | | | | 30 | | | | 109 | |
| Other Purchase Obligations | | | | 108 | | | | 85 | | | | 23 | | | | -- | | | | -- | |
| Postretirement Benefit Obligations | | | 91 | | | | 4 | | | | 9 | | | | 10 | | | | 68 | | | | 74 | | | | 4 | | | | 8 | | | | 9 | | | | 53 | |
| Other Purchase Obligations | | | 79 | | | | 45 | | | | 12 | | | | 22 | | | | -- | | |
| Operating Lease Obligations | | | 42 | | | | 8 | | | | 13 | | | | 8 | | | | 13 | | | | 37 | | | | 8 | | | | 11 | | | | 6 | | | | 12 | |
| Total Contractual Cash Obligations | | $ | 1,851 | | | $ | 157 | | | $ | 155 | | | $ | 296 | | | $ | 1,243 | | | $ | 1,970 | | | $ | 283 | | | $ | 232 | | | $ | 173 | | | $ | 1,282 | |
Postretirement Benefit Obligations include estimated cash expenditures for the payment of retiree medical and life insurance benefits and supplemental pension benefits under our unfunded Executive Survivor and Supplemental Retirement Plan, but do not include amounts to fund our noncontributory funded pension plan, as we are not currently required to make a contribution to that plan.
In January 2013 our BoardOn February 27, 2014 OTP issued, in a private placement transaction, $60 million aggregate principal amount of Directors authorizedOTP’s 4.68% Series A Senior Unsecured Notes due February 27, 2029 (the 2029 Notes) and $90 million aggregate principal amount of OTP’s 5.47% Series B Senior Unsecured Notes due February 27, 2044 (the 2044 Notes and, together with the redemption in full of all four series of our cumulative preferred shares, which were called on January 24, 2013 for redemption on March 1, 2013. Also, on January 24, 2013,2029 Notes, the New OTP caused call notices to be issued for the optional redemption in full on March 1, 2013, allNotes). OTP used a portion of the outstanding 4.65% Grant County, South Dakota Pollution Control Refunding Revenue Bonds (of which an aggregate of $5.1 million was outstanding on such date) and allproceeds of the outstanding 4.85% Mercer County, North Dakota Pollution Control Refunding Revenue Bonds (of which an aggregate of $20.1 million was outstanding on such date), in each case for which OTP pays debt service. Additionally, on March 1, 2013 OTP will pay off $15.5 million in intercompany debt owedNotes to us that represents our $15.5 million in cumulative preferred shares outstanding. All of the foregoing redemptions will be funded from aretire early its $40.9 million term loan, due January 15, 2015 and to repay outstanding short-term debt. The remaining proceeds of the New OTP Notes will be entering into. The lower, LIBOR based, floating rate interest underused to repay additional short-term debt of OTP, to pay fees and expenses related to the term loan is expected to contribute to a reduction in pre-tax interest expense in 2013 compared with 2012.issuance of the New OTP Notes and for other general corporate purposes, including planned construction program expenditures.
CAPITAL RESOURCES
Financial flexibility is provided by operating cash flows, unused lines of credit, strong financial coverages, investment grade credit ratings, and alternative financing arrangements such as leasing. Equity or debt financing will be required in the period 2014 through 2018 given the expansion plans related to our Electric segment to fund construction of new rate base investments, in the event we decide to reduce borrowings under our lines of credit, to refund or retire early any of our presently outstanding debt, to complete acquisitions or for other corporate purposes. There can be no assurance that any additional required financing will be available through bank borrowings, debt or equity financing or otherwise, or that if such financing is available, it will be available on terms acceptable to us. If adequate funds are not available on acceptable terms, our businesses, results of operations and financial condition could be adversely affected.
On May 11, 2012 we filed a shelf registration statement with the SEC under which we may offer for sale, from time to time, either separately or together in any combination, equity, debt or other securities described in the shelf registration statement.
On May 14, 2012, we entered into the Agreement with JPMS. Pursuant to the terms of the Agreement, we may offer and sell our common shares from time to time through JPMS, as our distribution agent for the offer and sale of the shares, up to an aggregate sales price of $75 million. Under the Agreement, we will designate the minimum price and maximum number of shares to be sold through JPMS on any given trading day or over a specified period of trading days, and JPMS will use commercially reasonable efforts to sell such shares on such days, subject to certain conditions. We are not obligated to sell and JPMS is not obligated to buy or sell any of the shares under the Agreement. The shares, if issued, will be issued pursuant to our shelf registration statement, as amended. No shares have been sold pursuant to the Agreement.
Short-Term Debt
The following table presents the status of our lines of credit as of December 31, 20122013 and December 31, 2011:2012:
| (in thousands) | | Line Limit | | | In Use on
December 31,
2012 | | | Restricted due to
Outstanding
Letters of Credit | | | Available on
December 31,
2012 | | | Available on
December 31,
2011 | | | Line Limit | | | In Use on
December 31,
2013 | | | Restricted due to
Outstanding
Letters of Credit | | | Available on
December 31,
2013 | | | Available on December 31,
2012 | |
| Otter Tail Corporation Credit Agreement | | $ | 150,000 | | | $ | -- | | | $ | 733 | | | $ | 149,267 | | | $ | 198,776 | | | $ | 150,000 | | | $ | -- | | | $ | 659 | | | $ | 149,341 | | | $ | 149,267 | |
| OTP Credit Agreement | | | 170,000 | | | | -- | | | | 3,189 | | | | 166,811 | | | | 165,950 | | | | 170,000 | | | | 51,195 | | | | 1,830 | | | | 116,975 | | | | 166,811 | |
| Total | | $ | 320,000 | | | $ | -- | | | $ | 3,922 | | | $ | 316,078 | | | $ | 364,726 | | | $ | 320,000 | | | $ | 51,195 | | | $ | 2,489 | | | $ | 266,316 | | | $ | 316,078 | |
Under the Otter Tail Corporation Credit Agreement (as defined below), the maximum amount of debt outstanding in 20122013 was $66,236,000$4,754,000 on July 13, 2012December 2, 2013 and the average daily balance of debt outstanding during 20122013 was $12,078,000.$49,000. The weighted average interest rate paid on debt outstanding under the Otter Tail Corporation Credit Agreement during 20122013 was 3.8%1.9% compared with 3.7%3.8% in 2011.2012. Under the OTP Credit Agreement (as defined below), the maximum amount of debt outstanding in 20122013 was $16,582,000$53,003,000 on August 15, 2012December 13, 2013 and the average daily balance of debt outstanding during 20122013 was $5,867,000.$17,446,000. The weighted average interest rate paid on debt outstanding under the OTP Credit Agreement during 20122013 was 1.7%1.4% compared with 1.5%1.7% in 2011.2012. The weighted average interest rate on consolidated short-term debt outstanding on December 31, 2013 was 1.4%.
On October 29, 2012 we entered into a Third Amended and Restated Credit Agreement (the Otter Tail Corporation Credit Agreement), which is an unsecured $150 million revolving credit facility that wemay be increased to $250 million on the terms and subject to the conditions described in the Otter Tail Corporation Credit Agreement. On October 29, 2013 the Otter Tail Corporation Credit Agreement was amended to extend its expiration date by one year from October 29, 2017 to October 29, 2018. We can draw on this credit facility to refinance certain indebtedness and support our operations and the operations of our subsidiaries. The Credit Agreement amends and restates our Second Amended and Restated Credit Agreement dated as of May 4, 2010, which was set to expire on May 4, 2013, and provided for a $200 million line of credit. Borrowings under the Otter Tail Corporation Credit Agreement bear interest at LIBOR plus 1.75%, subject to adjustment based on our senior unsecured credit ratings. The interest rate being charged under the Second Amended and Restated Credit Agreement expires on October 29, 2017. Underprior to the Credit Agreement, werenewal was LIBOR plus 3.25%. We are required to pay commitment fees based on the average daily unused amount available to be drawn under the revolving credit facility. The Otter Tail Corporation Credit Agreement contains a number of restrictions on us and the businesses of Varistar and its material subsidiaries, including restrictions on our and their ability to merge, sell assets, make investments, create or incur liens on assets, guarantee the obligations of certain other parties and engage in transactions with related parties. The Otter Tail Corporation Credit Agreement also contains affirmative covenants and events of default.default, and financial covenants as described below under the heading “Financial Covenants.” The Otter Tail Corporation Credit Agreement does not include provisions for the termination of the agreement or the acceleration of repayment of amounts outstanding due to changes in our credit ratings. Our obligations under the Otter Tail Corporation Credit Agreement are guaranteed by certain of our material subsidiaries. Outstanding letters of credit issued by us under the Otter Tail Corporation Credit Agreement can reduce the amount available for borrowing under the line by up to $40 million. The Credit Agreement has an accordion feature whereby the line can be increased to $250 million on the terms and subject to the conditions described in the Credit Agreement.
On October 29, 2012 OTP entered into a Second Amended and Restated Credit Agreement (the OTP Credit Agreement) that provides, providing for aan unsecured $170 million line ofrevolving credit with an accordion feature whereby the line canfacility that may be increased to $250 million on the terms and subject to the conditions described in the OTP Credit Agreement. TheOn October 29, 2013 the OTP Credit Agreement amends and restates the $170 million OTP Credit Agreement dated as of March 3, 2011, which was setamended to expire on March 3, 2016. The OTP Credit Agreement is an unsecured revolving credit facility thatextend its expiration date by one year from October 29, 2017 to October 29, 2018. OTP can draw on this credit facility to support the working capital needs and other capital requirements of its operations, including letters of credit in an aggregate amount not to exceed $50 million outstanding at any time. Borrowings under this line of credit bear interest at LIBOR plus 1.25%, subject to adjustment based on the ratings of OTP’s senior unsecured debt. The OTP Credit Agreement is set to expire on October 29, 2017. OTP is required to pay the Banks’ commitment fees based on the average daily unused amount available to be drawn under the revolving credit facility. The OTP Credit Agreement contains a number of restrictions on the business of OTP, including restrictions on its ability to merge, sell assets, make investments, create or incur liens on assets, guarantee the obligations of any other party, and engage in transactions with related parties. The OTP Credit Agreement also contains affirmative covenants and events of default.default, and financial covenants as described below under the heading “Financial Covenants.” The OTP Credit Agreement does not include provisions for the termination of the agreement or the acceleration of repayment of amounts outstanding due to changes in OTP’s credit ratings. OTP’s obligations under the OTP Credit Agreement are not guaranteed by any other party.
Long-Term Debt
Debt Retirements
On December 4, 2009November 6 and 25, 2013 we issued $100 millionpurchased, in two separate transactions, $12,933,000 and $34,737,000, respectively, of our outstanding 9.000% notes due 2016 under(the 2016 Notes), originally issued in the indenture (for unsecured debt securities) dated as of November 1, 1997, as amended by the First Supplemental Indenture dated as of July 1, 2009, between us and U.S. Bank National Association (formerly First Trust National Association), as trustee. The notes are senior unsecured indebtedness and bear interest at 9.000% per year, payable semi-annually in arrears on June 15 and December 15 of each year. The entireaggregate principal amount of the notes,$100 million. The purchased 2016 Notes (the Purchased 2016 Notes) were subsequently retired and are no longer outstanding. The remaining $52,330,000 principal amount of 2016 Notes outstanding, unless previously redeemed early or otherwise repaid, will mature and become due and payable on December 15, 2016.
On March 18, 2011 we borrowed $1.5 million under a Partnership in Assisting Community Expansion loan to finance capital investments at Northern Pipe Products, Inc. (Northern Pipe), The price paid for the Company’s PVC pipe manufacturing subsidiary located in Fargo, North Dakota. The ten-year unsecured note bears interest at 2.54% with monthly principal and interest payments through March 2021. On April 6, 2011 we borrowed $0.5 million under a North Dakota Development Fund loan to finance additional capital investments at Northern Pipe. The seven-year unsecured note bears interest at 3.95% with monthly principal and interest payments through April 1, 2018.
On December 1, 2011 OTP issued $140 million aggregatePurchased 2016 Notes was $59,404,000, which includes the principal amount of its 4.63% Senior Unsecuredthe Purchased 2016 Notes, due December 1, 2021 (the 2021 Notes) pursuantplus accrued interest of $1,845,000 through the respective purchase dates and a negotiated premium of $9,889,000 (which is less than the premium we would have been required to a Note Purchase Agreement dated July 29, 2011 (2011 Note Purchase Agreement) between OTP andpay to redeem them under the purchasers named therein. OTP used a portionterms of the proceeds2016 Notes). We used cash on hand to fund the purchase of the 2021 Notes to retire $90 million aggregate principalPurchased 2016 Notes. The amount of OTP’s 6.63% Senior Notes due December 1, 2011 and $10.4 million aggregate principalthe debt retired as a result of these transactions is approximately equivalent to the remaining amount of its pollution control refunding revenue bonds due December 1, 2012.debt that was associated with the operating companies that we have divested over the last two years. The remaining proceedsretirement of the 2021Purchased Notes were used to repay short-termfurther strengthens our capital structure and reduces our pre-tax interest expense by approximately $4.3 million in both 2014 and 2015 and $4.1 million in 2016. On repayment, $363,000 in unamortized debt of OTP which was issued to fund capital expenditures, to pay fees and expensesexpense related to the debt issuance and to fund a $10 million contribution to2016 Notes was immediately recognized as expense along with the Company’s pension plan$9,889,000 negotiated premium which, in January 2012.total, reduced diluted earnings per share by $0.17 in 2013.
On July 13, 2012 we prepaid in full the Cascade Note issued pursuant to the Note Purchase Agreement dated as of February 23, 2007, as amended, between us and Cascade Investment L.L.C. (Cascade). Immediately before the prepayment, the Cascade Note bore interest at 8.89% annually. The price paid by us to prepay the Cascade Note was $63,031,000, which included the principal amount of the Cascade Note plus accrued interest of $531,000 and a negotiated prepayment premium of $12,500,000. We used the funds available under the Otter Tail Corporation Credit Agreement for the prepayment. This early retirement reflectsreflected our desire to lower our long-term debt outstanding given our recent divestitures. This retirement of debt strengthens our consolidated capital structure and will positively affect future years’ earnings by lowering interest costs. On repayment, $606,000 in unamortized debt expense related to this note was immediately recognized as expense along with the $12,500,000 negotiated prepayment premium, which, in total, reduced diluted earnings per share by $0.22 in 2012. Cascade owned approximately 9.6%9.5% of our outstanding common stock as of December 31, 2013.
In addition, on February 27, 2014 the Company repaid in full its Term Loan as described below.
Unsecured Term Loan due January 15, 2015
On March 1, 2013 OTP entered into a Credit Agreement (the Loan Agreement) with JPMorgan Chase Bank, N.A. (JPMorgan) providing for a $40.9 million unsecured term loan (the Term Loan) to OTP originally due on June 1, 2014, which was fully drawn on March 1, 2013. The Loan Agreement was amended on October 29, 2013 to extend the due date on the Term Loan to January 15, 2015. On February 27, 2014 OTP used a portion of the proceeds of the New OTP Notes described below to retire early the Term Loan.
Borrowings under the Loan Agreement bore interest at LIBOR plus 0.875%. On March 1, 2013 OTP utilized approximately $25.1 million of Term Loan proceeds to fund the redemption price for all of the 4.65% Grant County, South Dakota Pollution Control Refunding Revenue Bonds and 4.85% Mercer County, North Dakota Pollution Control Refunding Revenue Bonds outstanding on that date, in each case for which OTP paid debt service. All such bonds had been called for redemption in full on March 1, 2013. Also on March 1, 2013, OTP utilized approximately $15.7 million of Term Loan proceeds to satisfy an intercompany note to us that had a balance and interest rate designed to equate to the balances and dividend rates of our cumulative preferred shares. Those cumulative preferred shares were redeemed on March 1, 2013 for $15.7 million, including $0.2 million in call premiums charged to equity and included with preferred dividends paid and as part of our preferred dividend requirement for the year ended December 31, 2013.
2016 Notes
On December 4, 2009 we issued $100 million of our 9.000% notes due 2016 (the 2016 Notes) under the indenture (for unsecured debt securities) dated as of November 1, 1997, as amended by the First Supplemental Indenture dated as of July 1, 2009, between us and U.S. Bank National Association (formerly First Trust National Association), as trustee. The 2016 Notes are senior unsecured indebtedness and bear interest at 9.000% per year, payable semi-annually in arrears on June 15 and December 15 of each year. In November 2013 we purchased and retired, in two separate transactions, $12,933,000 and $34,737,000, respectively, of our outstanding 2016 Notes. The remaining $52,330,000 principal amount of the 2016 Notes outstanding, unless previously redeemed or otherwise repaid, will mature and become due and payable on December 15, 2016.
2013 Note Purchase Agreement
On August 14, 2013 OTP entered into a Note Purchase Agreement (the 2013 Note Purchase Agreement) pursuant to which OTP agreed to issue the New OTP Notes to the purchasers named therein, in a private placement transaction. On February 27, 2014 OTP issued the New OTP Notes. OTP used a portion of the proceeds of the New OTP Notes to retire early the Term Loan as discussed above and to repay OTP’s short-term debt outstanding on February 27, 2014. The remaining proceeds of the New OTP Notes will be used to pay fees and expenses related to the issuance of the New OTP Notes and for other general purposes, including planned construction program expenditures.
The 2013 Note Purchase Agreement states that OTP may prepay all or any part of the New OTP Notes (in an amount not less than 10% of the aggregate principal amount of the New OTP Notes then outstanding in the case of a partial prepayment) at 100% of the principal amount prepaid, together with accrued interest and a make-whole amount, provided that if no default or event of default under the 2013 Note Purchase Agreement exists, any optional prepayment made by OTP of (i) all of the 2029 Notes then outstanding on or after November 27, 2028 or (ii) all of the 2044 Notes then outstanding on or after November 27, 2043, will be made at 100% of the principal prepaid but without any make-whole amount. In addition, the 2013 Note Purchase Agreement states OTP must offer to prepay all of the outstanding New OTP Notes at 100% of the principal amount together with unpaid accrued interest in the event of a change of control of OTP.
The 2013 Note Purchase Agreement contains a number of restrictions on the business of OTP, including restrictions on OTP’s ability to merge, sell assets, create or incur liens on assets, guarantee the obligations of any other party, and engage in transactions with related parties. The 2013 Note Purchase Agreement also contains affirmative covenants and events of default, as well as certain financial covenants as described below under the heading “Financial Covenants.” The 2013 Note Purchase Agreement does not include provisions for the termination of the agreement or the acceleration of repayment of amounts outstanding due to changes in OTP’s credit ratings. The 2013 Note Purchase Agreement includes a “most favored lender” provision generally requiring that in the event OTP’s existing credit agreement or any renewal, extension or replacement thereof, at any time contains any financial covenant or other provision providing for limitations on interest expense and such a covenant is not contained in the 2013 Note Purchase Agreement under substantially similar terms or would be more beneficial to the holders of the New OTP Notes than any analogous provision contained in the 2013 Note Purchase Agreement (an “Additional Covenant”), then unless waived by the Required Holders (as defined in the 2013 Note Purchase Agreement), the Additional Covenant will be deemed to be incorporated into the 2013 Note Purchase Agreement. The 2013 Note Purchase Agreement also provides for the amendment, modification or deletion of an Additional Covenant if such Additional Covenant is amended or modified under or deleted from the OTP credit agreement, provided that no default or event of default has occurred and is continuing.
2007 and 2011 Note Purchase Agreements
On December 1, 2011, OTP issued $140 million aggregate principal amount of its 4.63% Senior Unsecured Notes due December 1, 2021 (the 2021 Notes) pursuant to a Note Purchase Agreement dated as of July 29, 2011 (2011 Note Purchase Agreement). OTP used a portion of the proceeds of the 2021 Notes to retire $90 million aggregate principal amount of OTP’s 6.63% Senior Notes due December 1, 2011 at maturity and to retire early $10.4 million aggregate principal amount of outstanding pollution control refunding revenue bonds due December 1, 2012. No penalty was paid for the early retirement. The remaining proceeds of the 2021 Notes were used to repay short-term debt of OTP which was issued to fund capital expenditures, to pay fees and expenses related to the debt issuance and to fund a $10 million contribution to the Company’s pension plan in January 2012.
The note purchase agreement relating to OTP’sOTP also has outstanding its $155 million senior unsecured notes issued in four series consisting of $33 million aggregate principal amount of 5.95% Senior Unsecured Notes, Series A, due 2017; $30 million aggregate principal amount of 6.15% Senior Unsecured Notes, Series B, due 2022; $42 million aggregate principal amount of 6.37% Senior Unsecured Notes, Series C, due 2027; and $50 million aggregate principal amount of 6.47% Senior Unsecured Notes, Series D, due 2037 (collectively, the 2007 Notes). The 2007 Notes were issued pursuant to a Note Purchase Agreement dated as amendedof August 20, 2007 (the 2007 Note Purchase Agreement).
The 2011 Note Purchase Agreement and the 20112007 Note Purchase Agreement each states that OTP may prepay all or any part of the notes issued thereunder (in an amount not less than 10% of the aggregate principal amount of the notes then outstanding in the case of a partial prepayment) at 100% of the principal amount prepaid, together with accrued interest and a make-whole amount. The 2011 Note Purchase Agreement states in the event of a transfer of utility assets put event, the noteholders thereunder have the right to require OTP to repurchase the notes held by them in full, together with accrued interest and a make-whole amount, on the terms and conditions specified in the 2011 Note Purchase Agreement.
The 20072011 Note Purchase Agreement and the 20112007 Note Purchase Agreement each also states that OTP must offer to prepay all of the outstanding notes issued thereunder at 100% of the principal amount together with unpaid accrued interest in the event of a change of control of OTP, and each containsOTP. The note purchase agreements contain a number of restrictions on OTP. These includeOTP, including restrictions on OTP’s ability to merge, sell assets, create or incur liens on assets, guarantee the obligations of any other party, and engage in transactions with related parties. The note purchase agreements also include affirmative covenants and events of default, and certain financial covenants as described below under the heading “Financial Covenants.”
PACE Loan
On March 18, 2011 we borrowed $1.5 million under a Partnership in Assisting Community Expansion loan to finance capital investments at Northern Pipe Products, Inc. (Northern Pipe), the Company’s PVC pipe manufacturing subsidiary located in Fargo, North Dakota. The ten-year unsecured note bears interest at 2.54% with monthly principal and interest payments through March 2021. On April 6, 2011 we borrowed $0.5 million under a North Dakota Development Fund loan to finance additional capital investments at Northern Pipe. The seven-year unsecured note bears interest at 3.95% with monthly principal and interest payments through April 1, 2018.
Financial Covenants
As of December 31, 2012 the Company wasWe were in compliance with the financial statement covenants that existed in itsour debt agreements.agreements as of December 31, 2013.
No Credit or Note Purchase Agreement contains any provisions that would trigger an acceleration of the related debt as a result of changes in the credit rating levels assigned to the related obligor by rating agencies.
Our borrowing agreements are subject to certain financial covenants. Specifically:
| | ● | Under the Otter Tail Corporation Credit Agreement, we may not permit the ratio of our Interest-bearing Debt to Total Capitalization to be greater than 0.60 to 1.00 or permit our Interest and Dividend Coverage Ratio to be less than 1.50 to 1.00 (each measured on a consolidated basis), as provided in the Otter Tail Corporation Credit Agreement. As of December 31, 20122013 our Interest and Dividend Coverage Ratio calculated under the requirements of the Otter Tail Corporation Credit Agreement was 2.813.85 to 1.00. |
| | ● | Under the OTP Credit Agreement and the Loan Agreement (when in effect), OTP may not permit the ratio of its Interest-bearing Debt to Total Capitalization to be greater than 0.60 to 1.00. |
| | ● | Under the 2007 Note Purchase Agreement and 2011 Note Purchase Agreement, and the financial guaranty insurance policy with Ambac Assurance Corporation relating to certain pollution control refunding bonds, OTP may not permit the ratio of its Consolidated Debt to Total Capitalization to be greater than 0.60 to 1.00 or permit its Interest and Dividend Coverage Ratio to be less than 1.50 to 1.00, in each case as provided in the related borrowing or insurance agreement. In addition, under the 2007 Note Purchase Agreementagreement, and 2011 Note Purchase Agreement, OTP may not permit its Priority Debt to exceed 20% of its Total Capitalization, as provided in the related agreement. As of December 31, 20122013 OTP’s Interest and Dividend Coverage Ratio and Interest Charges Coverage Ratio, calculated under the requirements of the 2007 Note Purchase Agreement and 2011 Note Purchase Agreement, was 3.353.72 to 1.00. |
| ● | Under the 2013 Note Purchase Agreement, OTP may not permit its Interest-bearing Debt to exceed 60% of Total Capitalization and may not permit its Priority Indebtedness to exceed 20% of its Total Capitalization, each as provided in the 2013 Note Purchase Agreement. |
As of December 31, 20122013 our interest-bearing debt to total capitalization was 0.440.45 to 1.00 on a fully consolidated basis and 0.480.50 to 1.00 for OTP.
Our ratio of earnings to fixed charges from continuing operations reported in Exhibit 12.1 to this Annual Report on Form 10-K, which includes imputed finance costs on operating leases, was 3.4x for 2013 compared to 2.6x for 2012 compared to 2.0x for 2011, and our2012. Our debt interest coverage ratio before taxes, calculated by dividing income before income taxes from continuing operation plus interest charges by interest charges plus capitalized interest, was 3.2x for 2013 compared to 2.2x for 2012 compared to 2.1x for 2011.2012. During 2013,2014, we expect these coverage ratios to increase, assuming 20132014 net income meets our expectations.
OFF-BALANCE-SHEET ARRANGEMENTS
We and our subsidiary companies have outstanding letters of credit totaling $10.6$9.0 million, but our line of credit borrowing limits are only restricted by $3.9$2.5 million of the outstanding letters of credit. We do not have any other off-balance-sheet arrangements or any relationships with unconsolidated entities or financial partnerships. These entities are often referred to as structured finance special purpose entities or variable interest entities, which are established for the purpose of facilitating off-balance-sheet arrangements or for other contractually narrow or limited purposes. We are not exposed to any financing, liquidity, market or credit risk that could arise if we had such relationships.
20132014 BUSINESS OUTLOOK
We anticipate 20132014 diluted earnings per share to be in the range of $1.30$1.55 to $1.55.$1.75. This guidance reflects the current mix of businesses owned by us as we start out 2013.us. It considers the cyclical nature of some of our businesses and reflects challenges, presented by current economic conditions, as well as our plans and strategies for improving future operating results. Our current consolidatedWe expect capital expenditures expectation for 2013 is2014 to be $195 million compared with $164 million in the range of $200 million to $210 million. This compares with $116 million of capital expenditures in 2012. The major project2013. Major projects contributing to the increase in planned expenditures isare the new air quality control system (AQCS) forAQCS under construction at Big Stone Plant to meet requirements of the federal Clean Air Act and regional haze regulations. We plan to investinvestments in generation andseveral transmission projects for the Electric segment, including CapX2020 and MISO-designated Multi-Value projects that are expected to positively impact our earnings and returnsprovide an immediate return on capital. In addition to the AQCS project, current Electric segment projects include investment in three MISO-determined MVP transmission projects that will serve the nine-state MISO region, of which one is a CapX2020 project already underway, and investment with other utilities in one other remaining CapX2020 transmission project also under way.
Segment components of our 20132014 earnings per share guidance range are as follows:
| | | | | | | | | | | | |
| | 2012 EPS by Segment | 2013 EPS Guidance | | 2013 EPS
by Segment | | 2014 EPS Guidance | |
| | Low | High | | | | Low | | | High | |
| Electric | $1.06 | $1.06 | $1.11 | | | $1.05 | | | $1.19 | | | $1.23 | |
| Manufacturing | $0.29 | $0.31 | $0.36 | | | $0.32 | | | $0.29 | | | $0.33 | |
| Plastics | | | | $0.38 | | | $0.25 | | | $0.29 | |
| Construction | ($0.21) | $0.06 | $0.11 | | | $0.04 | | | $0.07 | | | $0.11 | |
| Plastics | $0.39 | $0.16 | $0.21 | |
| Corporate | ($0.26) | ($0.29) | ($0.24) | | | ($0.25) | | | ($0.25) | | | ($0.21) | |
| Subtotal – Continuing Operations | $1.27 | $1.30 | $1.55 | | | $1.54 | | | $1.55 | | | $1.75 | |
| Corporate – Premium Paid on Debt Extinguishment | ($0.22) | | | |
| Corporate – Loss on Debt Extinguishment | | | | ($0.17) | | | | | | | |
| Total – Continuing Operations | $1.05 | $1.30 | $1.55 | | | $1.37 | | | $1.55 | | | $1.75 | |
Contributing to our earnings guidance for 20132014 are the following items:
| | ● | We expect net income to increase slightlysignificantly in our Electric segment in 20132014 compared with 2012. This is2013 based on rider recovery increases and an increase in AFUDC related to larger construction expenditures, offset by lower conservation improvement program incentives and increases in operating and maintenance expenses due to higher benefit costs. OTP’s pension benefit costs for 2013 for our noncontributory funded pension plan are expected to increase by $2.7 million in 2013, reflecting a change in the assumed rate of return on pension plan assets from 8.0% in 2012 to 7.75% in 2013 and a decrease in the estimated discount rate used to determine annual benefit costs accruals from 5.15% in 2012 to 4.50% in 2013.following items: |
| | o | Rider recovery increases, including environmental riders in Minnesota and North Dakota related to the Big Stone AQCS environmental upgrades while under construction, and |
| o | A decrease in pension costs of approximately $2.0 million as a result of an increase in the discount rate from 4.5% to 5.3%, offset by |
| o | An increase in interest costs as a result of $150 million of fixed rate long term debt being put in place in the first quarter of 2014 to finance the Big Stone Plant AQCS and transmission projects, and |
| o | An increase in operating and maintenance costs primarily for increased labor and a planned outage for maintenance at Hoot Lake Plant. |
| ● | We expect earningsnet income from our Manufacturing segment to improve in 2013be flat between the years due to the following factors: |
| | o | IncreasedAn increase at BTD due to increased order volume as a result of expanded relationships with customers in recreational vehicle, lawn and continuing improvement in economic conditions in the industriesgarden, industrial and commercial end markets BTD serves, offset by |
| | o | A slight increasedecrease in earnings from T.O. Plastics anddue to a reduction in sales of a product the customer will be producing on its own in 2014. |
| | o | Backlog for the manufacturing companies of approximately $124$136 million for 20132014 compared with $115$124 million one year ago. |
| | ● | We expect net income in our Plastics segment to return to more normal levels in 2014 compared with 2013. The Plastics segment experienced its fourth best earnings year in its history in 2013 due to increased sales volumes in construction and housing markets in the South Central and Southwest regions of the United States and high levels of construction activity in the North Central United States. Gross margins are expected to return to more normal levels in 2014 compared with 2013. Secondarily, sales volumes and sales prices are currently expected to be slightly lower in 2014 compared to 2013. |
| ● | We expect higher net income from our Construction segment in 20132014 as it has implementeda result of improved cost control processes in construction management and selectively bidmore selective bidding on projects with the potential for higher margins. 2012 was negatively impacted by the results on certain large projects at Foley. These projects are now substantially completed and Foley’s internal bidding and estimating project review procedures have been improved such that we do not expect to see similar losses in 2013. Backlog in place for the construction businesses is $151$77 million for 20132014 compared with $106$151 million one year ago. |
| | ● | The Plastics segment experienced its second best earnings year in its history in 2012 due in part to certain market and weather related events thatCorporate costs are not expected to recurbe down in 2013. Accordingly, we expect2014 due to lower interest costs as a result of retiring $47.7 million of 9% long term debt in the fourth quarter of 2013, net earnings for Plastics to be lower based on the marketoffset by general inflation increases in labor, benefits and weather conditions currently being experienced.other general and administrative costs. |
| ● | Corporate general and administrative costs are expected to remain relatively flat between the years. |
The sales of DMI and ShoreMaster were strategic decisions by management to monetize assets and divestWe review our portfolio of companies that do not fit with our current operating plans. The divestitures free up liquidity going forward for upcoming Electric segment capital investments. We will continue to review our portfolioannually to see where additional opportunities exist to improve our risk profile, improve credit metrics and generate additional sources of cash to support the future capital expenditure plans of our Electric segment. This will result in a larger percentage of our earnings coming from OTP, our most stable and relatively predictable business, and is consistent with the strategy to grow this business given its current investment opportunities.
The following table shows our 20122013 capital expenditures and 20132014 through 20172018 anticipated capital expenditures and electric utility average rate base:
| (in millions) | | 2012 | | | 2013 | | | 2014 | | | 2015 | | | 2016 | | | 2017 | | | 2013 | | | 2014 | | | 2015 | | | 2016 | | | 2017 | | | 2018 | |
| Capital Expenditures: | | | | | | | | | | | | | | | | | | | | | | | | | | | | | | | | | | | | |
Electric Segment: | | | | | | | | | | | | | | | | | | | | | | | | | | | | | | | | | | | | |
| Transmission | | | | | $ | 60 | | | $ | 45 | | | $ | 56 | | | $ | 69 | | | $ | 118 | | | | | | $ | 53 | | | $ | 46 | | | $ | 97 | | | $ | 52 | | | $ | 56 | |
| Environmental | | | | | | 89 | | | | 99 | | | | 72 | | | | 1 | | | | -- | | | | | | | 82 | | | | 61 | | | | -- | | | | -- | | | | -- | |
| Other | | | | | | 33 | | | | 41 | | | | 42 | | | | 43 | | | | 43 | | | | | | | 37 | | | | 38 | | | | 44 | | | | 45 | | | | 46 | |
| Total Electric Segment | | $ | 102 | | | $ | 182 | | | $ | 185 | | | $ | 170 | | | $ | 113 | | | $ | 161 | | | $ | 149 | | | $ | 172 | | | $ | 145 | | | $ | 141 | | | $ | 97 | | | $ | 102 | |
| Manufacturing and Infrastructure Segments | | | 14 | | | | 22 | | | | 19 | | | | 19 | | | | 15 | | | | 20 | | | | 15 | | | | 23 | | | | 19 | | | | 26 | | | | 20 | | | | 24 | |
| Total Capital Expenditures | | $ | 116 | | | $ | 204 | | | $ | 204 | | | $ | 189 | | | $ | 128 | | | $ | 181 | | | $ | 164 | | | $ | 195 | | | $ | 164 | | | $ | 167 | | | $ | 117 | | | $ | 126 | |
| Total Electric Utility Average Rate Base | | $ | 694 | | | $ | 789 | | | $ | 919 | | | $ | 1,061 | | | $ | 1,134 | | | $ | 1,197 | | | | | | | $ | 885 | | | $ | 991 | | | $ | 1,062 | | | $ | 1,120 | | | $ | 1,152 | |
Execution on the currently anticipated electric utility capital expenditure plan is expected to grow rate base and be a key driver in increasing utility earnings over the 20132014 through 20172018 timeframe. We intend to maintain our equity to total capitalization ratio near its present level of 52% in the Electric segment and will seek to earn our authorized overall return on equity of approximately 10.5% in the utility’s regulatory jurisdictions.
Our outlook for 20132014 is dependent on a variety of factors and is subject to the risks and uncertainties discussed in Item 1A. Risk Factors, and elsewhere in this Annual Report on Form 10-K.
CRITICAL ACCOUNTING POLICIES INVOLVING SIGNIFICANT ESTIMATES
Our significant accounting policies are described in note 1 to our consolidated financial statements. The discussion and analysis of the financial statements and results of operations are based on our consolidated financial statements, which have been prepared in accordance with accounting principles generally accepted in the United States of America. The preparation of these consolidated financial statements requires management to make estimates and judgments that affect the reported amounts of assets, liabilities, revenues and expenses, and related disclosure of contingent assets and liabilities.
We use estimates based on the best information available in recording transactions and balances resulting from business operations. Estimates are used for such items as depreciable lives, asset impairment evaluations, tax provisions, collectability of trade accounts receivable, self-insurance programs, unbilled electric revenues, accrued renewable resource, transmission, and transmissionenvironmental cost recovery rider revenues, valuations of forward energy contracts, percentage-of-completion, warranty and actuarially determined benefits costs and liabilities. As better information becomes available or actual amounts are known, estimates are revised. Operating results can be affected by revised estimates. Actual results may differ from these estimates under different assumptions or conditions. Management has discussed the application of these critical accounting policies and the development of these estimates with the Audit Committee of the Board of Directors. The following critical accounting policies affect the more significant judgments and estimates used in the preparation of our consolidated financial statements.
PENSION AND OTHER POSTRETIREMENT BENEFITS OBLIGATIONS AND COSTS
Pension and postretirement benefit liabilities and expenses for our electric utility and corporate employees are determined by actuaries using assumptions about the discount rate, expected return on plan assets, rate of compensation increase and healthcare cost-trend rates. Further discussion of our pension and postretirement benefit plans and related assumptions is included in note 12 to our consolidated financial statements.
These benefits, for any individual employee, can be earned and related expenses can be recognized and a liability accrued over periods of up to 40 or more years. These benefits can be paid out for up to 40 or more years after an employee retires. Estimates of liabilities and expenses related to these benefits are among our most critical accounting estimates. Although deferral and amortization of fluctuations in actuarially determined benefit obligations and expenses are provided for when actual results on a year-to-year basis deviate from long-range assumptions, compensation increases and healthcare cost increases or a reduction in the discount rate applied from one year to the next can significantly increase our benefit expenses in the year of the change. Also, a reduction in the expected rate of return on pension plan assets in our funded pension plan or realized rates of return on plan assets that are well below assumed rates of return could result in significant increases in recognized pension benefit expenses in the year of the change or for many years thereafter because actuarial losses can be amortized over the average remaining service lives of active employees.
The pension benefit cost for 20132014 for our noncontributory funded pension plan is expected to be $10.5$4.9 million compared to $8.6$10.3 million in 2012,2013, reflecting ano change in the assumed rate of return on pension plan assets from 8.0% in 2012 to 7.75% in 2013, and a decreasean increase in the estimated discount rate used to determine annual benefit cost accruals from 5.15% in 2012 to 4.50% in 2013.2013 to 5.30% in 2014. In selecting the discount rate, we consider the yields of fixed income debt securities, which have ratings of “Aa” published by recognized rating agencies, along with bond matching models specific to our plans as a basis to determine the rate.
Subsequent increases or decreases in actual rates of return on plan assets over assumed rates or increases or decreases in the discount rate or rate of increase in future compensation levels could significantly change projected costs. For 2012,2013, all other factors being held constant: a 0.25 increase in the discount rate would have decreased our 20122013 pension benefit cost by $736,000;$806,000; a 0.25 decrease in the discount rate would have increased our 20122013 pension benefit cost by $772,000;$846,000; a 0.25 increase in the assumed rate of increase in future compensation levels would have increased our 20122013 pension benefit cost by $706,000;$515,000; a 0.25 decrease in the assumed rate of increase in future compensation levels would have decreased our 20122013 pension benefit cost by $501,000;$503,000; and a 0.25 increase (or decrease) in the expected long-term rate of return on plan assets would have decreased (or increased) our 20122013 pension benefit cost by $451,000.$468,000.
Increases or decreases in the discount rate or in retiree healthcare cost inflation rates could significantly change our projected postretirement healthcare benefit costs. A 0.25 increase in the discount rate would have decreased our 20122013 postretirement medical benefit costs by $269,000.$270,000. A 0.25 decrease in the discount rate would have increased our 20122013 postretirement medical benefit costs by $285,000.$284,000. See note 12 to our consolidated financial statements for the cost impact of a change in medical cost inflation rates.
We believe the estimates made for our pension and other postretirement benefits are reasonable based on the information that is known at the point in time the estimates are made. These estimates and assumptions are subject to a number of variables and are subject to change.
REVENUE RECOGNITION
Our construction companies record operating revenues on a percentage-of-completion basis for fixed-price construction contracts. The method used to determine the progress of completion is based on the ratio of costs incurred to total estimated costs. The duration of the majority of these contracts ranges from less than a year up to three years. Revenues recognized on jobs in progress as of December 31, 20122013 were $309$368 million. Any expected losses on jobs in progress at year-end 20122013 have been recognized. We believe the accounting estimate related to the percentage-of-completion accounting on uncompleted contracts is critical to the extent that any underestimate of total expected costs on fixed-price construction contracts could result in reduced profit margins being recognized on these contracts at the time of completion.
We have a standard quarterly Estimateestimate at Completioncompletion process in which we review the progress and performance of our contracts accounted for under percentage-of-completion accounting. As part of this process, our reviews include, but are not limited to, any outstanding key contract matters, progress towards completion and the related program schedule, identified risks and opportunities, and the related changes in estimates of revenues and costs. The risks and opportunities include our judgment about the ability and cost to achieve the schedule, technical requirements and other contract requirements. We must make assumptions regarding labor productivity and availability, the complexity of the work to be performed, the availability of materials, the length of time to complete the contract, and performance by subcontractors, among other variables. Based on this analysis, any adjustments to net sales, costs of sales, and the related impact to operating income are recorded as necessary in the period they become known. These adjustments may result from positive program performance and an increase in operating profit during the performance of individual contracts if management determines itwe determine we will be successful in mitigating risks surrounding the technical, schedule, and cost aspects of those contracts or realizing related opportunities. Likewise, these adjustments may result in a decrease in operating profit if we determine we will not be successful in mitigating these risks or realizing related opportunities. Changes in estimates of net sales, costs of sales, and the related impact to operating income are recognized using a cumulative catch-up, which recognizes, in the current period, the cumulative effect of the changes on current and prior periods based on a contract’scontract’s percent complete. A significant change in one or more of these estimates could affect the profitability of one or more of our contracts. If a loss is indicated at a point in time during a contract, a projected loss for the entire contract is estimated and recognized.
FORWARD ENERGY CONTRACTS CLASSIFIED AS DERIVATIVES
OTP’s forward contracts for the purchase and sale of electricity are derivatives subject to mark-to-market accounting under generally accepted accounting principles. The marketMarket prices used to value OTP’s forward contracts for the purchases and sales of electricity and electricity generating capacity are determined by survey of counterparties or brokers used by OTP’s power services’ personnel responsible for contract pricing, as well as prices gathered from daily settlement prices published by the Intercontinental Exchange and the CME Globex. For certain contracts, prices at illiquid trading points are based on a basis spread between that trading point and more liquid trading hub prices. These basis spreads are determined based on available market price information and the use of forward price curve models, and as such, are estimates. The forward energy salespurchase contracts that are marked to market as of December 31, 2012,2013 are 100% offset by forward energy purchasesales contracts in terms of volumes and delivery periods and pointsbut not in terms of delivery.delivery points. The differential in forward prices at theentered into with different delivery locations currently results in a net mark-to-market unrealized gain on OTP’s open forward contracts.energy contracts of $115,000.
OTP’s recognized but unrealized net gains of $49,000$115,000 on forward purchases and sales of electricity marked to market on December 31, 20122013 are expected to be realized on settlement as scheduled over the following periods in the amounts listed:
| (in thousands) | | 1st Quarter
2013 | | | 1st Quarter
2014 | |
| Net Gain | | $ | 49 | | | $ | 115 | |
ALLOWANCE FOR DOUBTFUL ACCOUNTS
Our operating companies encounter risks associated with sales and the collection of the associated accounts receivable. As such, they record provisions for accounts receivable that are considered to be uncollectible. In order to calculate the appropriate monthly provision, the operating companies primarily utilize historical rates of accounts receivables written off as a percentage of total revenue. This historical rate is applied to the current revenues on a monthly basis. The historical rate is updated periodically based on events that may change the rate, such as a significant increase or decrease in collection performance and timing of payments as well as the calculated total exposure in relation to the allowance. Periodically, operating companies compare identified credit risks with allowances that have been established using historical experience and adjust allowances accordingly. In circumstances where an operating company is aware of a specific customer’s inability to meet financial obligations, the operating company records a specific allowance for bad debts to reduce the account receivable to the amount it reasonably believes will be collected.
We believe the accounting estimates related to the allowance for doubtful accounts is critical because the underlying assumptions used for the allowance can change from period to period and could potentially cause a material impact to the income statement and working capital.
During 2012,2013, for continuing operations, $845,000$1,017,000 of bad debt expense (0.1% of total 20122013 revenue of $859.2$893.3 million) was recorded and the allowance for doubtful accounts was $1.3$1.2 million (1.4% of gross trade accounts receivable) as of December 31, 2012.2013. General economic conditions and specific geographic concerns are major factors that may affect the adequacy of the allowance and may result in a change in the annual bad debt expense. An increase or decrease in our consolidated allowance for doubtful accounts based on one percentage point of outstanding trade receivables at December 31, 20122013 would result in a $0.9$0.8 million increase or decrease in bad debt expense.
Although an estimated allowance for doubtful accounts on our operating companies’ accounts receivable is provided for, the allowance for doubtful accounts on the Electric segment’s wholesale electric sales is insignificant in proportion to annual revenues from these sales. The Electric segment has not experienced a bad debt related to wholesale electric sales largely due to stringent risk management criteria related to these sales. Nonpayment on a single wholesale electric sale could result in a significant bad debt expense.
DEPRECIATION EXPENSE AND DEPRECIABLE LIVES
The provisions for depreciation of electric utility property for financial reporting purposes are made on the straight-line method based on the estimated service lives (5 to 70 years) of the properties. Such provisions as a percent of the average balance of depreciable electric utility property were 2.96% in 2013, 2.98% in 2012 and 2.94% in 2011 and 3.01% in 2010.2011. Depreciation rates on electric utility property are subject to annual regulatory review and approval, and depreciation expense is recovered through rates set by ratemaking authorities. Although the useful lives of electric utility properties are estimated, the recovery of their cost is dependent on the ratemaking process. Deregulation of the electric industry could result in changes to the estimated useful lives of electric utility property that could impact depreciation expense.
Property and equipment of our nonelectric operations are carried at historical cost or at the then-current replacement cost if acquired in a business combination accounted for under the purchase method of accounting and are depreciated on a straight-line basis over useful lives (3 to 40 years) of the related assets. We believe the lives and methods of determining depreciation are reasonable, however, changes in economic conditions affecting the industries in which our manufacturing and infrastructure companies operate or innovations in technology could result in a reduction of the estimated useful lives of our manufacturing and infrastructure operating companies’ property, plant and equipment or in an impairment write-down of the carrying value of these properties.
TAXATION
We are required to make judgments regarding the potential tax effects of various financial transactions and our ongoing operations to estimate our obligations to taxing authorities. These tax obligations include income, real estate and use taxes. These judgments could result in the recognition of a liability for potential adverse outcomes regarding uncertain tax positions that we have taken. While we believe our liability for uncertain tax positions as of December 31, 20122013 reflects the most likely probable expected outcome of these tax matters in accordance with the requirements of Accounting Standards Codification (ASC) 740, Income Taxes, the ultimate outcome of such matters could result in additional adjustments to our consolidated financial statements. However, we do not believe such adjustments would be material.
Deferred income taxes are provided for revenue and expenses which are recognized in different periods for income tax and financial reporting purposes. We assess our deferred tax assets for recoverability taking into consideration both our historical and anticipated earnings levels, the reversal of other existing temporary differences, available net operating loss carryforwards and available tax planning strategies that could be implemented to realize the deferred tax assets. Based on this assessment, management must evaluate the need for, and amount of, a valuation allowance against our deferred tax assets. As facts and circumstances change, adjustments to the valuation allowance may be required.
ASSET IMPAIRMENT
We are required to test for asset impairment relating to property and equipment whenever events or changes in circumstances indicate that the carrying amount of a long-lived asset may exceed its fair value and not be recoverable. We apply the accounting guidance under ASC 360-10-35, Property, Plant, and Equipment - Subsequent Measurement, in order to determine whether or not an asset is impaired. This standard requires an impairment analysis when indicators of impairment are present. If such indicators are present, the standard requires that if the sum of the future expected cash flows from a company’s asset, undiscounted and without interest charges, is less than the carrying amount, an asset impairment must be recognized in the financial statements. The amount of the impairment is the difference between the fair value of the asset and the carrying amount of the asset.
We believe the accounting estimates related to an asset impairment are critical because they are highly susceptible to change from period to period reflecting changing business cycles and require management to make assumptions about future cash flows over future years and the impact of recognizing an impairment could have a significant effect on operations. Management’s assumptions about future cash flows require significant judgment because actual operating levels have fluctuated in the past and are expected to continue to do so in the future.
In 2012, asset impairments were recorded at DMI, ShoreMasterIMD, Shrco and OTESCO. The DMIIMD and ShoreMasterShrco impairments were recorded in connection with their sales value and are reflected in the results of discontinued operations. As of December 31, 20122013 an assessment of the carrying amounts of our remaining long-lived assets and other intangibles indicated these assets were not impaired.
GOODWILL IMPAIRMENT
Goodwill is required to be evaluated annually for impairment, according to ASC 350-20-35, Goodwill - Subsequent Measurement. We perform quantitative goodwill impairment testing annually in the fourth quarter. In addition, the test is performed on an interim basis whenever events or circumstances indicate that the carrying amount of goodwill may not be recoverable. Examples of such events or circumstances may include a significant adverse change in business climate, weakness in an industry in which our reporting units operate or recent significant cash or operating losses with expectations that those losses will continue.
The standard requiresquantitative goodwill impairment test is a two-step process be performed to analyze whetherat the reporting unit level. We have determined the reporting units for our goodwill impairment test are our operating segments, or not goodwill has been impaired. Step onecomponents of an operating segment, that constitute a business for which discrete financial information is toavailable and for which our chief operating decision makers regularly review the operating results. For more information on our operating segments, see note 2 of our consolidated financial statements. The first step of the quantitative impairment test for potential impairment and requires thatinvolves comparing the fair value of theeach reporting unit be compared to its book value including goodwill.carrying value. If the fair value of a reporting unit exceeds its carrying value, the test is higher than the book value,complete and no impairment is recognized.recorded. If the fair value of a reporting unit is lowerless than its carrying value, step two of the book value, a second step must be performed. The second steptest is performed to measuredetermine the amount of impairment loss, if any, and requires that a hypothetical purchase price allocation be done to determineany. The impairment is computed by comparing the implied fair value of goodwill. This fair value is then comparedthe reporting unit’s goodwill to the carrying amountvalue of that goodwill. If the carrying value is greater than the implied fair value, is lower thanan impairment loss must be recorded. At December 31, 2013, the fair value substantially exceeded the carrying amount, an impairment adjustment must be recorded.value at all our reporting units.
Determining the fair value of a reporting unit requires judgment and the use of significant estimates which include assumptions about the reporting unit’s future revenue, profitability and cash flows, amount and timing of estimated capital expenditures, inflation rates, weighted average cost of capital, operational plans, and current and future economic conditions, among others. The fair value of each reporting unit is determined using a weighted combination of income and market approaches. We believe accounting estimates related to goodwill impairment are critical because the underlying assumptions useduse a discounted cash flow methodology for our income approach. Under this approach, the discounted cash flow can change from period tomodel determines fair value based on the present value of projected cash flows over a specified period and could potentially cause a material impactresidual value related to future cash flows beyond the income statement. Management’sprojection period. Both values are discounted using a rate which reflects the best estimate of the weighted average cost of capital at each reporting unit. Under the market approach, we estimate fair value using multiples derived from comparable enterprise value to EBITDA multiples, comparable price earnings ratios, comparable enterprise value to sales multiples and if available, comparable sales transactions for comparative peer companies for each respective reporting unit. These multiples are applied to operating data for each reporting unit to arrive at an indication of fair value. We believe the estimates and assumptions about inflation ratesused in our impairment assessments are reasonable and other internal and external economic conditions, such as earnings growth rate, require significant judgment based on fluctuating rates and expected revenues. Additionally, ASC 350-20-35 requires goodwill be analyzed for impairment on an annual basis usingavailable market information, but variations in any of the assumptions that apply at the time the analysiscould result in materially different calculations of fair value and determinations of whether or not an impairment is updated.indicated.
We currently have $7.3 million of goodwill and a $1.1 million indefinite-lived trade name recorded on our balance sheet related to the acquisition of Foley in 2003. Foley generated a large operating loss inFoley’s net earnings improved $10.4 million between 2012 due to significant cost overruns on certain construction projects.and 2013. If operating marginsprofits do not meet our projections, the reductions in anticipated cash flows from Foley may indicate that its fair value is less than its book value, resulting in an impairment of some or all of the goodwill and indefinite-lived intangible assets associated with Foley along with a corresponding charge against earnings.
We evaluate goodwill for impairment on an annual basis and as conditions warrant. An assessment of the carrying amounts of our goodwill as of December 31, 20122013 indicated the fair values of our reporting units are substantially in excess of their respective book values and not impaired.
ACQUISITION METHOD OF ACCOUNTING
We account for acquisitions under the requirements of ASC Topic 805, Business Combinations. Under ASC 805 the term “purchase method of accounting” is replaced with “acquisition method of accounting” and requires an acquirer to recognize the assets acquired, the liabilities assumed and any noncontrolling interest in the acquiree at the acquisition date, measured at their fair values as of that date, with limited exceptions.
Acquired assets and liabilities assumed that are subject to critical estimates include property, plant and equipment and intangible assets. The fair value of property, plant and equipment is based on valuations performed by qualified internal personnel and/or with the assistance of outside appraisers. Fair values assigned to plant and equipment are based on several factors including the age and condition of the equipment, maintenance records of the equipment and auction values for equipment with similar characteristics at the time of purchase. Intangible assets are identified and valued using the guidelines of ASC 805. The fair value of intangible assets is based on estimates including royalty rates, customer attrition rates and estimated cash flows.
While the allocation of purchase price is subject to a high degree of judgment and uncertainty, we do not expect the estimates to vary significantly once an acquisition is complete. We believe our estimates have been reasonable in the past as there have been no significant valuation adjustments to the allocation of purchase price.
FORWARD-LOOKING INFORMATION - SAFE HARBOR STATEMENT UNDER THE PRIVATE SECURITIES LITIGATION REFORM ACT OF 1995
This Annual Report on Form 10-K contains forward-looking statements within the meaning of the Private Securities Litigation Reform Act of 1995 (the Act). When used in this Form 10-K and in future filings by the Company with the SEC, in the Company’s press releases and in oral statements, words such as “may,” “will,” “expect,” “anticipate,” “continue,” “estimate,” “project,” “believes” or similar expressions are intended to identify forward-looking statements within the meaning of the Act. Such statements are based on current expectations and assumptions, and entail various risks and uncertainties that could cause actual results to differ materially from those expressed in such forward-looking statements. Such risks and uncertainties include the various factors set forth in Item 1A. Risk Factors of this Annual Report on Form 10-K and in our other SEC filings.
| |
| Item 7A. | QUANTITATIVE AND QUALITATIVE DISCLOSURES ABOUT MARKET RISK |
At December 31, 20122013 we had no exposure to market risk associated with interest rates because we had no$51.2 million in short-term debt outstanding subject to variable interest rates.rates that are indexed to LIBOR plus 1.25% under OTP’s $170 million revolving credit facility.
AllThe majority of our consolidated long-term debt has fixed interest rates. We manage our interest rate risk through the issuance of fixed-rate debt with varying maturities, through economic refunding of debt through optional refundings, limiting the amount of variable interest rate debt, and the utilization of short-term borrowings to allow flexibility in the timing and placement of long-term debt. As of December 31, 2013 we had $40.9 million of long-term debt outstanding under an unsecured term loan subject to a variable interest rate of LIBOR plus 0.875%. This debt was early retired on February 27, 2014 with proceeds from the issuance of fixed-rate debt (see discussion under “Management’s Discussion and Analysis of Financial Conditions and Results of Operations – Capital Resources” on page 54 of this Annual Report on Form 10-K).
We have not used interest rate swaps to manage net exposure to interest rate changes related to our portfolio of borrowings. We maintain a ratio of fixed-rate debt to total debt within a certain range. It is our policy to enter into interest rate transactions and other financial instruments only to the extent considered necessary to meet our stated objectives. We do not enter into interest rate transactions for speculative or trading purposes.
The companies in our Manufacturing segment are exposed to market risk related to changes in commodity prices for steel, aluminum and Polystyrene (PS) and other plastics resins. The price and availability of these raw materials could affect the revenues and earnings of our Manufacturing segment.
The plastics companies are exposed to market risk related to changes in commodity prices for PVC resins, the raw material used to manufacture PVC pipe. The PVC pipe industry is highly sensitive to commodity raw material pricing volatility. Historically, when resin prices are rising or stable, sales volume has been higher and when resin prices are falling, sales volume has been lower. Operating income may decline when the supply of PVC pipe increases faster than demand. Due to the commodity nature of PVC resin and the dynamic supply and demand factors worldwide, it is very difficult to predict gross margin percentages or to assume that historical trends will continue.
OTP has market, price and credit risk associated with forward contracts for the purchase and sale of electricity. As of December 31, 20122013 OTP had recognized, on a pretax basis, $49,000$115,000 in net unrealized gains on open forward contracts for the purchase and sale of electricity and electricity generating capacity. Due to the nature of electricity and the physical aspects of the electricity transmission system, unanticipated events affecting the transmission grid can cause transmission constraints that result in unanticipated gains or losses in the process of settling transactions.
The market prices used to value OTP’s forward contracts for the purchases and sales of electricity and electricity generating capacity are determined by survey of counterparties or brokers used by OTP’s power services’ personnel responsible for contract pricing, as well as prices gathered from daily settlement prices published by the Intercontinental Exchange and the CME Globex. For certain contracts, prices at illiquid trading points are based on a basis spread between that trading point and more liquid trading hub prices. These basis spreads are determined based on available market price information and the use of forward price curve models. The forward energy purchase contracts that are marked to market as of December 31, 2012,2013, are 100% offset by forward energy sales contracts in terms of volumes and delivery periods and pointsbut not in terms of delivery.delivery points. The differential in forward prices at theentered into with different delivery locations currently results in a net mark-to-market unrealized gain on OTP’s forward energy contracts of $49,000.$115,000.
We have in place an energy risk management policy with a goal to manage, through the use of defined risk management practices, price risk and credit risk associated with wholesale power purchases and sales. Volumetric limits and loss limits are used to adequately manage the risks associated with our energy trading activities. Additionally, we have a Value at Risk (VaR) limit to further manage market price risk. There was no price risk on open positions as of December 31, 2012 because the open2013 where purchases were offset by open salesnot at the same point of delivery.delivery points as the offsetting sales.
The following tables show the effect of marking to market forward contracts for the purchase and sale of electricity and the location and fair value amounts of the related derivatives reported on the Company’s consolidated balance sheets as of December 31, 20122013 and December 31, 2011,2012, and the change in the Company’s consolidated balance sheet position from December 31, 2012 to December 31, 2013 and December 31, 2011 to December 31, 2012 and December 31, 2010 to December 31, 2011:2012:
| (in thousands) | | December 31, 2012 | | | December 31, 2011 | | | December 31, 2013 | | | December 31, 2012 | |
| | | | | | | | | | |
| Current Asset – Marked-to-Market Gain | | $ | 502 | | | $ | 3,803 | | | $ | 338 | | | $ | 502 | |
| Regulatory Asset – Current Deferred Marked-to-Market Loss | | | 7,949 | | | | 5,208 | | | | 3,008 | | | | 7,949 | |
| Regulatory Asset – Long-Term Deferred Marked-to-Market Loss | | | 10,050 | | | | 10,749 | | | | 8,674 | | | | 10,050 | |
| Total Assets | | | 18,501 | | | | 19,760 | | | | 12,020 | | | | 18,501 | |
| | | | | | | | | | |
| Current Liability – Marked-to-Market Loss | | | (18,234 | ) | | | (18,770 | ) | | | (11,782 | ) | | | (18,234 | ) |
| Regulatory Liability – Current Deferred Marked-to-Market Gain | | | (8 | ) | | | (96 | ) | | | (6 | ) | | | (8 | ) |
| Regulatory Liability – Long-Term Deferred Marked-to-Market Gain | | | (210 | ) | | | -- | | | | (117 | ) | | | (210 | ) |
| Total Liabilities | | | (18,452 | ) | | | (18,866 | ) | | | (11,905 | ) | | | (18,452 | ) |
| | | | | | | | | | |
| Net Fair Value of Marked-to-Market Energy Contracts | | $ | 49 | | | $ | 894 | | | $ | 115 | | | $ | 49 | |
| (in thousands) | | Year ended December 31, 2012 | | | Year ended December 31, 2011 | | | Year ended December 31, 2013 | | | Year ended December 31, 2012 | |
| Cumulative Fair Value Adjustments Included in Earnings - Beginning of Period | | $ | 894 | | | $ | 763 | | | $ | 49 | | | $ | 894 | |
| Less: Amounts Realized on Settlement of Contracts Entered into in Prior Periods | | | (861 | ) | | | (356 | ) | | | (49 | ) | | | (861 | ) |
| Changes in Fair Value of Contracts Entered into in Prior Periods | | | (33 | ) | | | (86 | ) | | | -- | | | | (33 | ) |
| Cumulative Fair Value Adjustments in Earnings of Contracts Entered into in Prior Years at End of Period | | | -- | | | | 321 | | | | -- | | | | -- | |
| Changes in Fair Value of Contracts Entered into in Current Period | | | 49 | | | | 573 | | | | 115 | | | | 49 | |
| Cumulative Fair Value Adjustments Included in Earnings - End of Period | | $ | 49 | | | $ | 894 | | | $ | 115 | | | $ | 49 | |
The $49,000$115,000 in recognized but unrealized net gains on the forward energy and capacity purchases and sales marked to market on December 31, 20122013 is expected to be realized on settlement in the first quarter of 2013.2014.
The following realized and unrealized net gains (losses) and gains on forward energy contracts are included in electric operating revenues on our consolidated statements of income:
| | | Year Ended December 31, | | | Year Ended December 31, |
| (in thousands) | | 2012 | | | 2011 | | | 2010 | | | 2013 | | | 2012 | | | 2011 |
| Net (Losses) Gains on Forward Electric Energy Contracts | | $ | (61 | ) | | $ | 926 | | | $ | 2,135 | | |
| Net Gains (Losses) on Forward Electric Energy Contracts | | | $ | 432 | | | $ | (61 | ) | | $ | 926 | |
OTP has credit risk associated with the nonperformance or nonpayment by counterparties to its forward energy and capacity purchases and sales agreements. We have established guidelines and limits to manage credit risk associated with wholesale power and capacity purchases and sales. Specific limits are determined by a counterparty’s financial strength. OTP’s credit risk with its largest counterparty on delivered and marked-to-market forward contracts as of December 31, 20122013 was $285,000.$530,000. As of December 31, 20122013 OTP had a net credit risk exposure of $580,000$856,000 from fivethree counterparties with investment grade credit ratings and one counterparty that has not been rated by an external credit rating agency but has been evaluated internally and assigned an internal credit rating equivalent to investment grade.ratings. OTP had no exposure at December 31, 20122013 to counterparties with credit ratings below investment grade. Counterparties with investment grade credit ratings have minimum credit ratings of BBB- (Standard & Poor’s), Baa3 (Moody’s) or BBB- (Fitch).
The $580,000$856,000 credit risk exposure included net amounts due to OTP on receivables/payables from completed transactions billed and unbilled plus marked-to-market gains/lossesgains on forward contracts for the purchase and sale of electricitygasoline scheduled for delivery aftersettlement subsequent December 31, 2012.2013. Individual counterparty exposures are offset according to legally enforceable netting arrangements.
REPORT OF INDEPENDENT REGISTERED PUBLIC PUBLICACCOUNTING FIRM
To the shareholders of
Otter Tail Corporation
We have audited the accompanying consolidated balance sheets and statements of capitalization of Otter Tail Corporation and its subsidiaries (the “Company”) as of December 31, 20122013 and 2011,2012, and the related consolidated statements of income, comprehensive income, common shareholders’ equity, and cash flows for each of the three years in the period ended December 31, 2012.2013. Our audits also included the financial statement schedule listed in the Index at Item 15. We also have audited the Company’sCompany’s internal control over financial reporting as of December 31, 20122013, based on the criteria established in Internal Control — Integrated Framework (1992) issued by the Committee of Sponsoring Organizations of the Treadway Commission. The Company’s management is responsible for these financial statements and financial statement schedule, for maintaining effective internal control over financial reporting, and for its assessment of the effectiveness of internal control over financial reporting, included in the accompanying Management’s Report Regarding Internal ControlControls Over Financial Reporting. Our responsibility is to express an opinion on these financial statements and financial statement schedule and an opinion on the Company’s internal control over financial reporting based on our audits.
We conducted our audits in accordance with the standards of the Public Company Accounting Oversight Board (United States). Those standards require that we plan and perform the audit to obtain reasonable assurance about whether the financial statements are free of material misstatement and whether effective internal control over financial reporting was maintained in all material respects. Our audits of the financial statements and financial statement schedule included examining, on a test basis, evidence supporting the amounts and disclosures in the financial statements, assessing the accounting principles used and significant estimates made by management, and evaluating the overall financial statement presentation. Our audit of internal control over financial reporting included obtaining an understanding of internal control over financial reporting, assessing the risk that a material weakness exists, and testing and evaluating the design and operating effectiveness of internal control based on the assessed risk. Our audits also included performing such other procedures as we considered necessary in the circumstances. We believe that our audits provide a reasonable basis for our opinions.
A company’s internal control over financial reporting is a process designed by, or under the supervision of, the company’s principal executive and principal financial officers, or persons performing similar functions, and effected by the company’s board of directors, management, and other personnel to provide reasonable assurance regarding the reliability of financial reporting and the preparation of financial statements for external purposes in accordance with generally accepted accounting principles. A company’s internal control over financial reporting includes those policies and procedures that (1) pertain to the maintenance of records that, in reasonable detail, accurately and fairly reflect the transactions and dispositions of the assets of the company; (2) provide reasonable assurance that transactions are recorded as necessary to permit preparation of financial statements in accordance with generally accepted accounting principles, and that receipts and expenditures of the company are being made only in accordance with authorizations of management and directors of the company; and (3) provide reasonable assurance regarding prevention or timely detection of unauthorized acquisition, use, or disposition of the company’s assets that could have a material effect on the financial statements.
Because of the inherent limitations of internal control over financial reporting, including the possibility of collusion or improper management override of controls, material misstatements due to error or fraud may not be prevented or detected on a timely basis. Also, projections of any evaluation of the effectiveness of the internal control over financial reporting to future periods are subject to the risk that the controls may become inadequate because of changes in conditions, or that the degree of compliance with the policies or procedures may deteriorate.
In our opinion, the consolidated financial statements and financial statement schedule referred to above present fairly, in all material respects, the financial position of Otter Tail Corporation and its subsidiaries as of December 31, 20122013 and 2011,2012, and the results of their operations and their cash flows for each of the three years in the period ended December 31, 2012,2013, in conformity with accounting principles generally accepted in the United States of America. Also, in our opinion, such financial statement schedule, when considered in relation to the basic consolidated financial statements taken as a whole, presents fairly, in all material respects, the information set forth therein. Also, in our opinion, the Company maintained, in all material respects, effective internal control over financial reporting as of December 31, 2012,2013, based on the criteria established in Internal Control — Integrated Framework (1992) issued by the Committee of Sponsoring Organizations of the Treadway Commission.
/s/ Deloitte & Touche LLP
Minneapolis, Minnesota
February 27, 2013March 3, 2014
| OTTER TAIL CORPORATION | |
| |
| (in thousands) | | 2013 | | | 2012 | |
| | | | | | | |
| ASSETS | | | | | | |
| | | | | | | |
| Current Assets | | | | | | |
| Cash and Cash Equivalents | | $ | 1,150 | | | $ | 52,362 | |
| Accounts Receivable: | | | | | | | | |
| Trade (less allowance for doubtful accounts of $1,177 for 2013 and $1,279 for 2012) | | | 83,572 | | | | 91,170 | |
| Other | | | 9,790 | | | | 7,684 | |
| Inventories | | | 72,681 | | | | 69,336 | |
| Deferred Income Taxes | | | 35,452 | | | | 30,964 | |
| Unbilled Revenues | | | 18,157 | | | | 15,701 | |
| Costs and Estimated Earnings in Excess of Billings | | | 4,063 | | | | 3,663 | |
| Regulatory Assets | | | 17,940 | | | | 25,499 | |
| Other | | | 7,747 | | | | 8,161 | |
| Assets of Discontinued Operations | | | 38 | | | | 19,092 | |
| Total Current Assets | | | 250,590 | | | | 323,632 | |
| | | | | | | | | |
| Investments | | | 9,362 | | | | 9,471 | |
| Other Assets | | | 28,834 | | | | 26,222 | |
| Goodwill | | | 38,971 | | | | 38,971 | |
| Other Intangibles--Net | | | 13,328 | | | | 14,305 | |
| | | | | | | | | |
| Deferred Debits | | | | | | | | |
| Unamortized Debt Expense | | | 4,188 | | | | 5,529 | |
| Regulatory Assets | | | 83,730 | | | | 134,755 | |
| Total Deferred Debits | | | 87,918 | | | | 140,284 | |
| | | | | | | | | |
| Plant | | | | | | | | |
| Electric Plant in Service | | | 1,460,884 | | | | 1,423,303 | |
| Nonelectric Operations | | | 194,872 | | | | 186,094 | |
| Construction Work in Progress | | | 187,461 | | | | 77,890 | |
| Total Gross Plant | | | 1,843,217 | | | | 1,687,287 | |
| Less Accumulated Depreciation and Amortization | | | 676,201 | | | | 637,835 | |
| Net Plant | | | 1,167,016 | | | | 1,049,452 | |
| | | | | | | | | |
| Total Assets | | $ | 1,596,019 | | | $ | 1,602,337 | |
| | | | | | | | | |
| See accompanying notes to consolidated financial statements. | | | | | | | | |
| OTTER TAIL CORPORATION | |
| Consolidated Balance Sheets, December 31 | |
| (in thousands, except share data) | | 2013 | | | 2012 | |
| | | | | | | |
| LIABILITIES AND EQUITY | | | | | | |
| | | | | | | |
| Current Liabilities | | | | | | |
| Short-Term Debt | | $ | 51,195 | | | $ | -- | |
| Current Maturities of Long-Term Debt | | | 188 | | | | 176 | |
| Accounts Payable | | | 113,457 | | | | 88,406 | |
| Accrued Salaries and Wages | | | 19,903 | | | | 20,571 | |
| Billings In Excess Of Costs and Estimated Earnings | | | 13,707 | | | | 16,204 | |
| Accrued Taxes | | | 12,491 | | | | 12,047 | |
| Derivative Liabilities | | | 11,782 | | | | 18,234 | |
| Other Accrued Liabilities | | | 6,532 | | | | 6,334 | |
| Liabilities of Discontinued Operations | | | 3,637 | | | | 11,156 | |
| Total Current Liabilities | | | 232,892 | | | | 173,128 | |
| | | | | | | | | |
| Pensions Benefit Liability | | | 69,743 | | | | 116,541 | |
| Other Postretirement Benefits Liability | | | 45,221 | | | | 58,883 | |
| Other Noncurrent Liabilities | | | 25,209 | | | | 22,244 | |
| | | | | | | | | |
| Commitments and Contingencies (note 9) | | | | | | | | |
| | | | | | | | | |
| Deferred Credits | | | | | | | | |
| Deferred Income Taxes | | | 195,603 | | | | 171,787 | |
| Deferred Tax Credits | | | 28,288 | | | | 31,299 | |
| Regulatory Liabilities | | | 73,926 | | | | 68,835 | |
| Other | | | 718 | | | | 466 | |
| Total Deferred Credits | | | 298,535 | | | | 272,387 | |
| | | | | | | | | |
| Capitalization (page 74) | | | | | | | | |
| Long-Term Debt, Net of Current Maturities | | | 389,589 | | | | 421,680 | |
| | | | | | | | | |
Cumulative Preferred Shares Authorized 1,500,000 Shares Without Par Value; Outstanding 2013—None; 2012—155,000 Shares | | | -- | | | | 15,500 | |
| | | | | | | | | |
Cumulative Preference Shares – Authorized 1,000,000 Shares Without Par Value; Outstanding - None | | | -- | | | | -- | |
| | | | | | | | | |
| Common Shares, Par Value $5 Per Share--Authorized, 50,000,000 Shares; | | | | | | | | |
| Outstanding, 2013—36,271,696 Shares; 2012—36,168,368 Shares | | | 181,358 | | | | 180,842 | |
| Premium on Common Shares | | | 255,759 | | | | 253,296 | |
| Retained Earnings | | | 99,441 | | | | 92,221 | |
| Accumulated Other Comprehensive Loss | | | (1,728 | ) | | | (4,385 | ) |
| Total Common Equity | | | 534,830 | | | | 521,974 | |
| | | | | | | | | |
| Total Capitalization | | | 924,419 | | | | 959,154 | |
| | | | | | | | | |
| Total Liabilities and Equity | | $ | 1,596,019 | | | $ | 1,602,337 | |
| | | | | | | | | |
| See accompanying notes to consolidated financial statements. | | | | | | | | |
| |
| |
| (in thousands, except per-share amounts) | | 2013 | | | 2012 | | | 2011 | |
| | | | | | | | | | |
| Operating Revenues | | | | | | | | | |
| Electric | | $ | 373,459 | | | $ | 350,679 | | | $ | 342,633 | |
| Product Sales | | | 369,952 | | | | 359,474 | | | | 313,020 | |
| Construction Services | | | 149,902 | | | | 149,086 | | | | 184,516 | |
| Total Operating Revenues | | | 893,313 | | | | 859,239 | | | | 840,169 | |
| | | | | | | | | | | | | |
| Operating Expenses | | | | | | | | | | | | |
| Production Fuel - Electric | | | 71,248 | | | | 66,284 | | | | 69,017 | |
| Purchased Power - Electric System Use | | | 52,006 | | | | 49,184 | | | | 43,451 | |
| Electric Operation and Maintenance Expenses | | | 133,395 | | | | 121,069 | | | | 115,863 | |
| Cost of Products Sold (depreciation included below) | | | 283,260 | | | | 270,041 | | | | 248,021 | |
| Cost of Construction Revenues Earned (depreciation included below) | | | 133,427 | | | | 147,097 | | | | 173,629 | |
| Other Nonelectric Expenses | | | 51,930 | | | | 52,621 | | | | 49,296 | |
| Asset Impairment Charge | | | -- | | | | 432 | | | | 470 | |
| Depreciation and Amortization | | | 59,885 | | | | 59,764 | | | | 58,335 | |
| Property Taxes - Electric | | | 11,311 | | | | 10,720 | | | | 10,190 | |
| Total Operating Expenses | | | 796,462 | | | | 777,212 | | | | 768,272 | |
| | | | | | | | | | | | | |
| Operating Income | | | 96,851 | | | | 82,027 | | | | 71,897 | |
| | | | | | | | | | | | | |
| Interest Charges | | | 26,978 | | | | 31,905 | | | | 35,629 | |
| Loss on Early Retirement of Debt | | | 10,252 | | | | 13,106 | | | | -- | |
| Other Income | | | 4,096 | | | | 4,085 | | | | 2,763 | |
| Income Before Income Taxes – Continuing Operations | | | 63,717 | | | | 41,101 | | | | 39,031 | |
| Income Tax Expense – Continuing Operations | | | 13,543 | | | | 2,133 | | | | 4,121 | |
| Net Income from Continuing Operations | | | 50,174 | | | | 38,968 | | | | 34,910 | |
| Discontinued Operations | | | | | | | | | | | | |
| Income (Loss) - net of Income Tax Expense (Benefit) of $9 in 2013, $6,231 in 2012 and ($1,811) in 2011 | | | 481 | | | | (6,603 | ) | | | (14,294 | ) |
| Impairment Loss - net of Income Tax (Benefit) of ($21,213) in 2012 and ($17,444) in 2011 | | | -- | | | | (32,107 | ) | | | (42,533 | ) |
| Gain (Loss) on Disposition - net of Income Tax Expense of $6 in 2013, $315 in 2012 and $5,851 in 2011 | | | 210 | | | | (5,531 | ) | | | 8,674 | |
| Net Gain (Loss) from Discontinued Operations | | | 691 | | | | (44,241 | ) | | | (48,153 | ) |
| Total Net Income (Loss) | | | 50,865 | | | | (5,273 | ) | | | (13,243 | ) |
| Preferred Dividend Requirement and Other Adjustments | | | 513 | | | | 736 | | | | 1,058 | |
| Earnings (Loss) Available for Common Shares | | $ | 50,352 | | | $ | (6,009 | ) | | $ | (14,301 | ) |
| | | | | | | | | | | | | |
| Average Number of Common Shares Outstanding--Basic | | | 36,151 | | | | 36,048 | | | | 35,922 | |
| Average Number of Common Shares Outstanding--Diluted | | | 36,355 | | | | 36,242 | | | | 36,082 | |
| | | | | | | | | | | | | |
| Basic Earnings (Loss) Per Common Share: | | | | | | | | | | | | |
| Continuing Operations (net of preferred dividend requirement) | | $ | 1.37 | | | $ | 1.06 | | | $ | 0.95 | |
| Discontinued Operations | | $ | 0.02 | | | $ | (1.23 | ) | | $ | (1.35 | ) |
| | | $ | 1.39 | | | $ | (0.17 | ) | | $ | (0.40 | ) |
| Diluted Earnings (Loss) Per Common Share: | | | | | | | | | | | | |
| Continuing Operations (net of preferred dividend requirement) | | $ | 1.37 | | | $ | 1.05 | | | $ | 0.95 | |
| Discontinued Operations | | $ | 0.02 | | | $ | (1.22 | ) | | $ | (1.35 | ) |
| | | $ | 1.39 | | | $ | (0.17 | ) | | $ | (0.40 | ) |
| | | | | | | | | | | | | |
| Dividends Declared Per Common Share | | $ | 1.19 | | | $ | 1.19 | | | $ | 1.19 | |
| | | | | | | | | | | | | |
| See accompanying notes to consolidated financial statements. | | | | | | | | | | | | |
| OTTER TAIL CORPORATION | |
| |
| (in thousands) | | 2013 | | | 2012 | | | 2011 | |
| Net Income (Loss) | | $ | 50,865 | | | $ | (5,273 | ) | | $ | (13,243 | ) |
| Other Comprehensive Income (Loss): | | | | | | | | | | | | |
| Unrealized (Loss) Gain on Available-for-Sale Securities: | | | | | | | | | | | | |
| Reversal of Previously Recognized Gains Realized on Sale of Investments and Included in Other Income During Period | | | (27 | ) | | | -- | | | | -- | |
| (Losses) Gains Arising During Period | | | (77 | ) | | | 154 | | | | (121 | ) |
| Income Tax Benefit (Expense) | | | 36 | | | | (53 | ) | | | 48 | |
| Change in Unrealized Gains on Available-for-Sale Securities – net-of-tax | | | (68 | ) | | | 101 | | | | (73 | ) |
| Reversal of Foreign Currency Translation Adjustment Unrealized Gain: | | | | | | | | | | | | |
| Unrealized Net Change During Period | | | -- | | | | -- | | | | 303 | |
| Reversal of Previously Recognized Gains Realized on Sale of IPH in 2011 | | | -- | | | | -- | | | | (6,068 | ) |
| Income Tax Benefit | | | -- | | | | -- | | | | 1,787 | |
Reversal of Foreign Currency Translation Adjustment Unrealized Gain – net-of-tax | | | -- | | | | -- | | | | (3,978 | ) |
| Pension and Postretirement Benefit Plans: | | | | | | | | | | | | |
| Actuarial Gains (Losses) Net of Regulatory Allocation Adjustment | | | 3,986 | | | | (2,133 | ) | | | (1,686 | ) |
| Amortization of Unrecognized Postretirement Benefit Costs (note 12) | | | 555 | | | | 376 | | | | 239 | |
| Income Tax (Expense) Benefit | | | (1,816 | ) | | | 703 | | | | 579 | |
| Pension and Postretirement Benefit Plans – net-of-tax | | | 2,725 | | | | (1,054 | ) | | | (868 | ) |
| | | | | | | | | | | | | |
| Total Other Comprehensive Income (Loss) | | | 2,657 | | | | (953 | ) | | | (4,919 | ) |
| | | | | | | | | | | | | |
| Total Comprehensive Income (Loss) | | $ | 53,522 | | | $ | (6,226 | ) | | $ | (18,162 | ) |
| | | | | | | | | | | | | |
| See accompanying notes to consolidated financial statements. | | | | | | | | | | | | |
| |
| | |
| |
| (in thousands, except common shares outstanding) | | Common
Shares Outstanding | | | Par Value,
Common
Shares | | | Premium
on
Common
Shares | | | Retained
Earnings | | | Accumulated
Other
Comprehensive
Income/(Loss) | | Total
Common
Equity | |
| Balance, December 31, 2010 | | | 36,002,739 | | | $ | 180,014 | | | $ | 251,919 | | | $ | 198,443 | | | $ | 1,487 | | | | $ | 631,863 | |
| Common Stock Issuances, Net of Expenses | | | 154,225 | | | | 771 | | | | 2,671 | | | | | | | | | | | | | 3,442 | |
| Common Stock Retirements | | | (55,269 | ) | | | (276 | ) | | | (906 | ) | | | | | | | | | | | | (1,182 | ) |
| Net Loss | | | | | | | | | | | | | | | (13,243 | ) | | | | | | | | (13,243 | ) |
| Other Comprehensive Loss | | | | | | | | | | | | | | | | | | | (4,919 | ) | | | | (4,919 | ) |
| Tax Benefit – Stock Compensation | | | | | | | | | | | (875 | ) | | | | | | | | | | | | (875 | ) |
| Employee Stock Incentive Plan Expense | | | | | | | | | | | 606 | | | | | | | | | | | | | 606 | |
| Premium on Purchase of Stock for Employee Purchase Plan | | | | | | | | | | | (292 | ) | | | | | | | | | | | | (292 | ) |
| Premium on Purchase of Subsidiary Class B Stock and Options | | | | | | | | | | | | | | | (322 | ) | | | | | | | | (322 | ) |
| Cumulative Preferred Dividends | | | | | | | | | | | | | | | (735 | ) | | | | | | | | (735 | ) |
| Common Dividends ($1.19 per share) | | | | | | | | | | | | | | | (42,895 | ) | | | | | | | | (42,895 | ) |
| Balance, December 31, 2011 | | | 36,101,695 | | | $ | 180,509 | | | $ | 253,123 | | | $ | 141,248 | | | $ | (3,432 | ) | (a) | | $ | 571,448 | |
| Common Stock Issuances, Net of Expenses | | | 71,745 | | | | 359 | | | | 148 | | | | | | | | | | | | | 507 | |
| Common Stock Retirements | | | (5,072 | ) | | | (26 | ) | | | (85 | ) | | | | | | | | | | | | (111 | ) |
| Net Loss | | | | | | | | | | | | | | | (5,273 | ) | | | | | | | | (5,273 | ) |
| Other Comprehensive Loss | | | | | | | | | | | | | | | | | | | (953 | ) | | | | (953 | ) |
| Tax Benefit – Stock Compensation | | | | | | | | | | | (103 | ) | | | | | | | | | | | | (103 | ) |
| Employee Stock Incentive Plan Expense | | | | | | | | | | | 435 | | | | | | | | | | | | | 435 | |
| Premium on Purchase of Stock for Employee Purchase Plan | | | | | | | | | | | (222 | ) | | | | | | | | | | | | (222 | ) |
| Cumulative Preferred Dividends | | | | | | | | | | | | | | | (736 | ) | | | | | | | | (736 | ) |
| Common Dividends ($1.19 per share) | | | | | | | | | | | | | | | (43,018 | ) | | | | | | | | (43,018 | ) |
| Balance, December 31, 2012 | | | 36,168,368 | | | $ | 180,842 | | | $ | 253,296 | | | $ | 92,221 | | | $ | (4,385 | ) | (a) | | $ | 521,974 | |
| Common Stock Issuances, Net of Expenses | | | 112,512 | | | | 562 | | | | 2,095 | | | | | | | | | | | | | 2,657 | |
| Common Stock Retirements | | | (9,184 | ) | | | (46 | ) | | | (177 | ) | | | | | | | | | | | | (223 | ) |
| Net Income | | | | | | | | | | | | | | | 50,865 | | | | | | | | | 50,865 | |
| Other Comprehensive Income | | | | | | | | | | | | | | | | | | | 2,657 | | | | | 2,657 | |
| Tax Benefit – Stock Compensation | | | | | | | | | | | 299 | | | | | | | | | | | | | 299 | |
| Employee Stock Incentive Plan Expense | | | | | | | | | | | 418 | | | | | | | | | | | | | 418 | |
| Premium on Purchase of Stock for Employee Purchase Plan | | | | | | | | | | | (258 | ) | | | | | | | | | | | | (258 | ) |
| Cumulative Preferred Dividends | | | | | | | | | | | | | | | (427 | ) | | | | | | | | (427 | ) |
| Preferred Stock Issuance Expenses Transferred to Retained Earnings on Redemption of Preferred Shares | | | | | | | | | | | 86 | | | | (86 | ) | | | | | | | | -- | |
| Common Dividends ($1.19 per share) | | | | | | | | | | | | | | | (43,132 | ) | | | | | | | | (43,132 | ) |
| Balance, December 31, 2013 | | | 36,271,696 | | | $ | 181,358 | | | $ | 255,759 | | | $ | 99,441 | | | $ | (1,728 | ) | (a) | | $ | 534,830 | |
| (a) Accumulated Other Comprehensive Loss on December 31 is comprised of the following: | |
| (in thousands) | | 2013 | | | 2012 | | | 2011 | |
| Unrealized Gain on Marketable Equity Securities: | | | | | | | | | |
| Before Tax | | $ | 73 | | | $ | 177 | | | $ | 23 | |
| Tax Effect | | | (26 | ) | | | (62 | ) | | | (9 | ) |
| Unrealized Gain on Marketable Equity Securities – Net-of-Tax | | | 47 | | | | 115 | | | | 14 | |
| Unamortized Actuarial Losses, Prior Service Costs and Transition Obligation Related to Pension and Postretirement Benefits: | | | | | | | | | | | | |
| Before Tax | | | (2,959 | ) | | | (7,500 | ) | | | (5,743 | ) |
| Tax Effect | | | 1,184 | | | | 3,000 | | | | 2,297 | |
| Unamortized Actuarial Losses and Transition Obligation Related to Pension and Postretirement Benefits – Net-of-Tax | | | (1,775 | ) | | | (4,500 | ) | | | (3,446 | ) |
| Accumulated Other Comprehensive Loss: | | | | | | | | | | | | |
| Before Tax | | | (2,886 | ) | | | (7,323 | ) | | | (5,720 | ) |
| Tax Effect | | | 1,158 | | | | 2,938 | | | | 2,288 | |
| Net Accumulated Other Comprehensive Loss | | $ | (1,728 | ) | | $ | (4,385 | ) | | $ | (3,432 | ) |
See accompanying notes to consolidated financial statements.
| OTTER TAIL CORPORATION | |
| | |
| |
| (in thousands) | | 2012 | | | 2011 | |
| | | | | | | |
| ASSETS | | | | | | |
| | | | | | | |
| Current Assets | | | | | | |
| Cash and Cash Equivalents | | $ | 52,362 | | | $ | 15,994 | |
| Accounts Receivable: | | | | | | | | |
| Trade (less allowance for doubtful accounts of $1,279 for 2012 and $1,114 for 2011) | | | 91,170 | | | | 93,392 | |
| Other | | | 7,684 | | | | 8,660 | |
| Inventories | | | 69,336 | | | | 68,743 | �� |
| Deferred Income Taxes | | | 30,964 | | | | 9,523 | |
| Unbilled Revenue | | | 15,701 | | | | 13,719 | |
| Costs and Estimated Earnings in Excess of Billings | | | 3,663 | | | | 12,211 | |
| Regulatory Assets | | | 25,499 | | | | 27,391 | |
| Other | | | 8,161 | | | | 15,009 | |
| Assets of Discontinued Operations | | | 19,092 | | | | 209,929 | |
| Total Current Assets | | | 323,632 | | | | 474,571 | |
| | | | | | | | | |
| Investments | | | 9,471 | | | | 11,093 | |
| Other Assets | | | 26,222 | | | | 26,997 | |
| Goodwill | | | 38,971 | | | | 39,118 | |
| Other Intangibles--Net | | | 14,305 | | | | 15,286 | |
| | | | | | | | | |
| Deferred Debits | | | | | | | | |
| Unamortized Debt Expense | | | 5,529 | | | | 6,458 | |
| Regulatory Assets | | | 134,755 | | | | 124,137 | |
| Total Deferred Debits | | | 140,284 | | | | 130,595 | |
| | | | | | | | | |
| Plant | | | | | | | | |
| Electric Plant in Service | | | 1,423,303 | | | | 1,372,534 | |
| Nonelectric Operations | | | 186,094 | | | | 177,328 | |
| Construction Work in Progress | | | 77,890 | | | | 52,751 | |
| Total Gross Plant | | | 1,687,287 | | | | 1,602,613 | |
| Less Accumulated Depreciation and Amortization | | | 637,835 | | | | 599,751 | |
| Net Plant | | | 1,049,452 | | | | 1,002,862 | |
| | | | | | | | | |
| Total Assets | | $ | 1,602,337 | | | $ | 1,700,522 | |
| | | | | | | | | |
| See accompanying notes to consolidated financial statements. | | | | | | | | |
| |
| |
| (in thousands) | | 2013 | | | 2012 | | | 2011 | |
| Cash Flows from Operating Activities | | | | | | | | | |
| Net Income (Loss) | | $ | 50,865 | | | $ | (5,273 | ) | | $ | (13,243 | ) |
| Adjustments to Reconcile Net Income (Loss) to Net Cash Provided by Operating Activities: | | | | | | | | | | | | |
| Net (Gain) Loss from Sale of Discontinued Operations | | | (210 | ) | | | 5,531 | | | | (8,674 | ) |
| Net (Income) Loss from Discontinued Operations | | | (481 | ) | | | 38,710 | | | | 56,827 | |
| Depreciation and Amortization | | | 59,885 | | | | 59,764 | | | | 58,335 | |
| Asset Impairment Charge | | | -- | | | | 432 | | | | 470 | |
| Premium Paid for Early Retirement of Long-Term Debt | | | 9,889 | | | | 12,500 | | | | -- | |
| Deferred Tax Credits | | | (1,925 | ) | | | (2,091 | ) | | | (2,386 | ) |
| Deferred Income Taxes | | | 15,902 | | | | 11,459 | | | | 10,661 | |
| Change in Deferred Debits and Other Assets | | | 56,720 | | | | (4,802 | ) | | | (25,053 | ) |
| Discretionary Contribution to Pension Fund | | | (10,000 | ) | | | (10,000 | ) | | | -- | |
| Change in Noncurrent Liabilities and Deferred Credits | | | (42,226 | ) | | | 32,718 | | | | 35,178 | |
| Allowance for Equity/Other Funds Used During Construction | | | (1,823 | ) | | | (1,168 | ) | | | (861 | ) |
| Change in Derivatives Net of Regulatory Deferral | | | 8 | | | | 718 | | | | 72 | |
| Stock Compensation Expense – Equity Awards | | | 1,456 | | | | 1,311 | | | | 2,177 | |
| Other—Net | | | 641 | | | | 4,500 | | | | 6,496 | |
| Cash Provided by (Used for) Current Assets and Current Liabilities: | | | | | | | | | | | | |
| Change in Receivables | | | 8,335 | | | | 2,430 | | | | (7,952 | ) |
| Change in Inventories | | | (3,345 | ) | | | (687 | ) | | | (5,286 | ) |
| Change in Other Current Assets | | | (4,216 | ) | | | 7,019 | | | | (1,072 | ) |
| Change in Payables and Other Current Liabilities | | | 11,321 | | | | 30,056 | | | | (4,775 | ) |
| Change in Interest Payable and Income Taxes Receivable/Payable | | | (513 | ) | | | (14,141 | ) | | | (7,236 | ) |
| Net Cash Provided by Continuing Operations | | | 150,283 | | | | 168,986 | | | | 93,678 | |
| Net Cash (Used in) Provided by Discontinued Operations | | | (2,502 | ) | | | 64,561 | | | | 10,705 | |
| Net Cash Provided by Operating Activities | | | 147,781 | | | | 233,547 | | | | 104,383 | |
| Cash Flows from Investing Activities | | | | | | | | | | | | |
| Capital Expenditures | | | (164,463 | ) | | | (115,762 | ) | | | (67,360 | ) |
| Proceeds from Disposal of Noncurrent Assets | | | 3,764 | | | | 4,889 | | | | 1,923 | |
| Net Increase in Other Investments | | | (1,845 | ) | | | (1,037 | ) | | | (40 | ) |
| Net Cash Used in Investing Activities - Continuing Operations | | | (162,544 | ) | | | (111,910 | ) | | | (65,477 | ) |
| Net Proceeds from Sale of Discontinued Operations | | | 12,842 | | | | 42,229 | | | | 107,310 | |
| Net Cash Provided by (Used in) Investing Activities - Discontinued Operations | | | 505 | | | | (13,896 | ) | | | (36,410 | ) |
| Net Cash (Used in) Provided by Investing Activities | | | (149,197 | ) | | | (83,577 | ) | | | 5,423 | |
| Cash Flows from Financing Activities | | | | | | | | | | | | |
| Change in Checks Written in Excess of Cash | | | -- | | | | -- | | | | (7,268 | ) |
| Net Short-Term Borrowings (Repayments) | | | 51,195 | | | | -- | | | | (79,490 | ) |
| Proceeds from Issuance of Common Stock | | | 1,821 | | | | -- | | | | -- | |
| Common Stock Issuance Expenses | | | (3 | ) | | | (370 | ) | | | -- | |
| Payments for Retirement of Capital Stock | | | (15,723 | ) | | | (111 | ) | | | (1,182 | ) |
| Proceeds from Issuance of Long-Term Debt | | | 40,900 | | | | -- | | | | 142,006 | |
| Short-Term and Long-Term Debt Issuance Expenses | | | (522 | ) | | | (897 | ) | | | (1,666 | ) |
| Payments for Retirement of Long-Term Debt | | | (72,981 | ) | | | (50,224 | ) | | | (100,796 | ) |
| Premium Paid for Early Retirement of Long-Term Debt | | | (9,889 | ) | | | (12,500 | ) | | | -- | |
| Dividends Paid and Other Distributions | | | (43,818 | ) | | | (43,976 | ) | | | (43,923 | ) |
| Net Cash Used in Financing Activities - Continuing Operations | | | (49,020 | ) | | | (108,078 | ) | | | (92,319 | ) |
| Net Cash Used in Financing Activities - Discontinued Operations | | | -- | | | | (4,278 | ) | | | (3,184 | ) |
| Net Cash Used in Financing Activities | | | (49,020 | ) | | | (112,356 | ) | | | (95,503 | ) |
| Net Change in Cash and Cash Equivalents - Discontinued Operations | | | (776 | ) | | | (1,246 | ) | | | 2,015 | |
| Effect of Foreign Exchange Rate Fluctuations on Cash – Discontinued Operations | | | -- | | | | -- | | | | (324 | ) |
| Net Change in Cash and Cash Equivalents | | | (51,212 | ) | | | 36,368 | | | | 15,994 | |
| Cash and Cash Equivalents at Beginning of Period | | | 52,362 | | | | 15,994 | | | | -- | |
| Cash and Cash Equivalents at End of Period | | $ | 1,150 | | | $ | 52,362 | | | $ | 15,994 | |
See accompanying notes to consolidated financial statements.
| OTTER TAIL CORPORATION | |
| | |
| Consolidated Balance Sheets, December 31 | |
| (in thousands, except share data) | | 2012 | | | 2011 | |
| | | | | | | |
| LIABILITIES AND EQUITY | | | | | | |
| | | | | | | |
| Current Liabilities | | | | | | |
| Current Maturities of Long-Term Debt | | $ | 176 | | | $ | 165 | |
| Accounts Payable | | | 88,406 | | | | 80,457 | |
| Accrued Salaries and Wages | | | 20,571 | | | | 15,862 | |
| Billings In Excess Of Costs and Estimated Earnings | | | 16,204 | | | | 9,175 | |
| Accrued Taxes | | | 12,047 | | | | 11,696 | |
| Derivative Liabilities | | | 18,234 | | | | 18,770 | |
| Other Accrued Liabilities | | | 6,334 | | | | 5,540 | |
| Liabilities of Discontinued Operations | | | 11,156 | | | | 50,691 | |
| Total Current Liabilities | | | 173,128 | | | | 192,356 | |
| | | | | | | | | |
| Pensions Benefit Liability | | | 116,541 | | | | 106,818 | |
| Other Postretirement Benefits Liability | | | 58,883 | | | | 48,263 | |
| Other Noncurrent Liabilities | | | 22,244 | | | | 18,102 | |
| | | | | | | | | |
| Commitments and Contingencies (note 9) | | | | | | | | |
| | | | | | | | | |
| Deferred Credits | | | | | | | | |
| Deferred Income Taxes | | | 171,787 | | | | 173,312 | |
| Deferred Tax Credits | | | 31,299 | | | | 33,182 | |
| Regulatory Liabilities | | | 68,835 | | | | 69,106 | |
| Other | | | 466 | | | | 520 | |
| Total Deferred Credits | | | 272,387 | | | | 276,120 | |
| | | | | | | | | |
| Capitalization (page 70) | | | | | | | | |
| Long-Term Debt, Net of Current Maturities | | | 421,680 | | | | 471,915 | |
| | | | | | | | | |
Cumulative Preferred Shares Authorized 1,500,000 Shares Without Par Value; Outstanding 2012 and 2011 – 155,000 Shares | | | 15,500 | | | | 15,500 | |
| | | | | | | | | |
Cumulative Preference Shares – Authorized 1,000,000 Shares Without Par Value; Outstanding - None | | | -- | | | | -- | |
| | | | | | | | | |
| Common Shares, Par Value $5 Per Share--Authorized, 50,000,000 Shares; | | | | | | | | |
| Outstanding, 2012—36,168,368 Shares; 2011—36,101,695 Shares | | | 180,842 | | | | 180,509 | |
| Premium on Common Shares | | | 253,296 | | | | 253,123 | |
| Retained Earnings | | | 92,221 | | | | 141,248 | |
| Accumulated Other Comprehensive Loss | | | (4,385 | ) | | | (3,432 | ) |
| Total Common Equity | | | 521,974 | | | | 571,448 | |
| | | | | | | | | |
| Total Capitalization | | | 959,154 | | | | 1,058,863 | |
| | | | | | | | | |
| Total Liabilities and Equity | | $ | 1,602,337 | | | $ | 1,700,522 | |
See accompanying notes to consolidated financial statements. | | | | | | | | |
| |
| | |
| |
| (in thousands, except per-share amounts) | | 2012 | | | 2011 | | | 2010 | |
| | | | | | | | | | |
| Operating Revenues | | | | | | | | | |
| Electric | | $ | 350,679 | | | $ | 342,633 | | | $ | 344,264 | |
| Nonelectric | | | 508,560 | | | | 497,536 | | | | 373,633 | |
| Total Operating Revenues | | | 859,239 | | | | 840,169 | | | | 717,897 | |
| | | | | | | | | | | | | |
| Operating Expenses | | | | | | | | | | | | |
| Production Fuel - Electric | | | 66,284 | | | | 69,017 | | | | 73,102 | |
| Purchased Power - Electric System Use | | | 49,184 | | | | 43,451 | | | | 44,788 | |
| Electric Operation and Maintenance Expenses | | | 121,069 | | | | 115,863 | | | | 112,174 | |
| Cost of Goods Sold - Nonelectric (excludes depreciation; included below) | | | 417,138 | | | | 421,650 | | | | 309,507 | |
| Other Nonelectric Expenses | | | 52,621 | | | | 49,296 | | | | 46,715 | |
| Asset Impairment Charge | | | 432 | | | | 470 | | | | -- | |
| Depreciation and Amortization | | | 59,764 | | | | 58,335 | | | | 57,647 | |
| Property Taxes - Electric | | | 10,720 | | | | 10,190 | | | | 9,364 | |
| Total Operating Expenses | | | 777,212 | | | | 768,272 | | | | 653,297 | |
| | | | | | | | | | | | | |
| Operating Income | | | 82,027 | | | | 71,897 | | | | 64,600 | |
| | | | | | | | | | | | | |
| Loss on Early Retirement of Debt | | | 13,106 | | | | -- | | | | -- | |
| Interest Charges | | | 31,905 | | | | 35,629 | | | | 36,848 | |
| Other Income | | | 4,085 | | | | 2,763 | | | | 1,759 | |
| Income Before Income Taxes – Continuing Operations | | | 41,101 | | | | 39,031 | | | | 29,511 | |
| Income Tax Expense – Continuing Operations | | | 2,133 | | | | 4,121 | | | | 3,231 | |
| Net Income from Continuing Operations | | | 38,968 | | | | 34,910 | | | | 26,280 | |
| Discontinued Operations | | | | | | | | | | | | |
Loss - net of Income Tax Expense (Benefit) of $6,231, ($1,811) and $4,834 for the respective periods | | | (6,603 | ) | | | (14,294 | ) | | | (11,998 | ) |
Impairment Loss - net of Income Tax (Benefit) of ($21,213), ($17,444) and ($4,114) for the respective periods | | | (32,107 | ) | | | (42,533 | ) | | | (15,626 | ) |
(Loss) Gain on Disposition - net of Income Tax Expense of $315 in 2012 and $5,851 in 2011 | | | (5,531 | ) | | | 8,674 | | | | -- | |
| Net Loss from Discontinued Operations | | | (44,241 | ) | | | (48,153 | ) | | | (27,624 | ) |
| Total Net Loss | | | (5,273 | ) | | | (13,243 | ) | | | (1,344 | ) |
| Preferred Dividend Requirement and Other Adjustments | | | 736 | | | | 1,058 | | | | 833 | |
| Loss Available for Common Shares | | $ | (6,009 | ) | | $ | (14,301 | ) | | $ | (2,177 | ) |
| | | | | | | | | | | | | |
| Average Number of Common Shares Outstanding--Basic | | | 36,048 | | | | 35,922 | | | | 35,784 | |
| Average Number of Common Shares Outstanding--Diluted | | | 36,242 | | | | 36,082 | | | | 36,012 | |
| | | | | | | | | | | | | |
| Basic Earnings (Loss) Per Common Share: | | | | | | | | | | | | |
| Continuing Operations (net of preferred dividend requirement) | | $ | 1.06 | | | $ | 0.95 | | | $ | 0.71 | |
| Discontinued Operations (net of other adjustments) | | $ | (1.23 | ) | | $ | (1.35 | ) | | $ | (0.77 | ) |
| | | $ | (0.17 | ) | | $ | (0.40 | ) | | $ | (0.06 | ) |
| Diluted Earnings (Loss) Per Common Share: | | | | | | | | | | | | |
| Continuing Operations (net of preferred dividend requirement) | | $ | 1.05 | | | $ | 0.95 | | | $ | 0.71 | |
| Discontinued Operations (net of other adjustments) | | $ | (1.22 | ) | | $ | (1.35 | ) | | $ | (0.77 | ) |
| | | $ | (0.17 | ) | | $ | (0.40 | ) | | $ | (0.06 | ) |
| Dividends Declared Per Common Share | | $ | 1.19 | | | $ | 1.19 | | | $ | 1.19 | |
See accompanying notes to consolidated financial statements. | | | | | | | | | | | | |
| OTTER TAIL CORPORATION | |
| | |
| |
| (in thousands) | | 2012 | | | 2011 | | | 2010 | |
| Net Loss | | $ | (5,273 | ) | | $ | (13,243 | ) | | $ | (1,344 | ) |
| Other Comprehensive Income (Loss): | | | | | | | | | | | | |
| Unrealized Gain (Loss) on Available-for-Sale Securities: | | | | | | | | | | | | |
| Net Gain (Loss) Arising During Period | | | 154 | | | | (121 | ) | | | 50 | |
| Income Tax (Expense) Benefit | | | (53 | ) | | | 48 | | | | (20 | ) |
| Net Gain (Loss) on Available-for-Sale Securities – net-of-tax | | | 101 | | | | (73 | ) | | | 30 | |
| Foreign Currency Translation Adjustment Gain (Loss): | | | | | | | | | | | | |
| Unrealized Net Change During Period | | | -- | | | | 303 | | | | 1,335 | |
| Reversal of Previously Recognized Gains Realized on Sale of IPH in 2011 | | | -- | | | | (6,068 | ) | | | -- | |
| Income Tax Benefit (Expense) | | | -- | | | | 1,787 | | | | (15 | ) |
| Foreign Currency Translation Adjustment (Loss) Gain – net-of-tax | | | -- | | | | (3,978 | ) | | | 1,320 | |
| Pension and Postretirement Benefit Plans: | | | | | | | | | | | | |
| Actuarial (Losses) Gains Net of Regulatory Allocation Adjustment | | | (2,133 | ) | | | (1,686 | ) | | | 1,738 | |
| Amortization of Unrecognized Postretirement Benefit Costs | | | 376 | | | | 239 | | | | 682 | |
| Income Tax Benefit (Expense) | | | 703 | | | | 579 | | | | (968 | ) |
| Pension and Postretirement Benefit Plans – net-of-tax | | | (1,054 | ) | | | (868 | ) | | | 1,452 | |
| Total Other Comprehensive (Loss) Income | | | (953 | ) | | | (4,919 | ) | | | 2,802 | |
| Total Comprehensive (Loss) Income | | $ | (6,226 | ) | | $ | (18,162 | ) | | $ | 1,458 | |
See accompanying notes to consolidated financial statements. | | | | | | | | | | | | |
| (in thousands, except common shares outstanding) | | Common
Shares
Outstanding | | | Par Value,
Common
Shares | | | Premium
on
Common
Shares | | | Retained
Earnings | | | Accumulated
Other
Comprehensive
Income/(Loss) | | | Total
Common
Equity | |
| Balance, December 31, 2009 | | | 35,812,280 | | | $ | 179,061 | | | $ | 250,398 | | | $ | 243,352 | | | $ | (1,315 | ) (a) | | $ | 671,496 | |
| Common Stock Issuances, Net of Expenses | | | 208,333 | | | | 1,042 | | | | 2,054 | | | | | | | | | | | | 3,096 | |
| Common Stock Retirements | | | (17,874 | ) | | | (89 | ) | | | (312 | ) | | | | | | | | | | | (401 | ) |
| Net Loss | | | | | | | | | | | | | | | (1,344 | ) | | | | | | | (1,344 | ) |
| Other Comprehensive Income | | | | | | | | | | | | | | | | | | | 2,802 | | | | 2,802 | |
| Tax Benefit – Stock Compensation | | | | | | | | | | | (1,404 | ) | | | | | | | | | | | (1,404 | ) |
| Stock Incentive Plan Performance Award Accrual | | | | | | | | | | | 1,415 | | | | | | | | | | | | 1,415 | |
| Premium on Purchase of Stock for Employee Purchase Plan | | | | | | | | | | | (232 | ) | | | | | | | | | | | (232 | ) |
| Premium on Purchase of Subsidiary Class B Stock and Options | | | | | | | | | | | | | | | (98 | ) | | | | | | | (98 | ) |
| Cumulative Preferred Dividends | | | | | | | | | | | | | | | (736 | ) | | | | | | | (736 | ) |
| Common Dividends | | | | | | | | | | | | | | | (42,731 | ) | | | | | | | (42,731 | ) |
| Balance, December 31, 2010 | | | 36,002,739 | | | $ | 180,014 | | | $ | 251,919 | | | $ | 198,443 | | | $ | 1,487 | (a) | | $ | 631,863 | |
| Common Stock Issuances, Net of Expenses | | | 154,225 | | | | 771 | | | | 2,671 | | | | | | | | | | | | 3,442 | |
| Common Stock Retirements | | | (55,269 | ) | | | (276 | ) | | | (906 | ) | | | | | | | | | | | (1,182 | ) |
| Net Loss | | | | | | | | | | | | | | | (13,243 | ) | | | | | | | (13,243 | ) |
| Other Comprehensive Loss | | | | | | | | | | | | | | | | | | | (4,919 | ) | | | (4,919 | ) |
| Tax Benefit – Stock Compensation | | | | | | | | | | | (875 | ) | | | | | | | | | | | (875 | ) |
| Employee Stock Incentive Plan Expense | | | | | | | | | | | 606 | | | | | | | | | | | | 606 | |
| Premium on Purchase of Stock for Employee Purchase Plan | | | | | | | | | | | (292 | ) | | | | | | | | | | | (292 | ) |
| Premium on Purchase of Subsidiary Class B Stock and Options | | | | | | | | | | | | | | | (322 | ) | | | | | | | (322 | ) |
| Cumulative Preferred Dividends | | | | | | | | | | | | | | | (735 | ) | | | | | | | (735 | ) |
| Common Dividends | | | | | | | | | | | | | | | (42,895 | ) | | | | | | | (42,895 | ) |
| Balance, December 31, 2011 | | | 36,101,695 | | | $ | 180,509 | | | $ | 253,123 | | | $ | 141,248 | | | $ | (3,432 | )(a) | | $ | 571,448 | |
| Common Stock Issuances, Net of Expenses | | | 71,745 | | | | 359 | | | | 148 | | | | | | | | | | | | 507 | |
| Common Stock Retirements | | | (5,072 | ) | | | (26 | ) | | | (85 | ) | | | | | | | | | | | (111 | ) |
| Net Loss | | | | | | | | | | | | | | | (5,273 | ) | | | | | | | (5,273 | ) |
| Other Comprehensive Loss | | | | | | | | | | | | | | | | | | | (953 | ) | | | (953 | ) |
| Tax Benefit – Stock Compensation | | | | | | | | | | | (103 | ) | | | | | | | | | | | (103 | ) |
| Employee Stock Incentive Plan Expense | | | | | | | | | | | 435 | | | | | | | | | | | | 435 | |
| Premium on Purchase of Stock for Employee Purchase Plan | | | | | | | | | | | (222 | ) | | | | | | | | | | | (222 | ) |
| Cumulative Preferred Dividends | | | | | | | | | | | | | | | (736 | ) | | | | | | | (736 | ) |
| Common Dividends | | | | | | | | | | | | | | | (43,018 | ) | | | | | | | (43,018 | ) |
| Balance, December 31, 2012 | | | 36,168,368 | | | $ | 180,842 | | | $ | 253,296 | | | $ | 92,221 | | | $ | (4,385 | )(a) | | $ | 521,974 | |
| (a) Accumulated Other Comprehensive Income (Loss) on December 31 is comprised of the following: | |
| (in thousands) | | 2012 | | | 2011 | | | 2010 | |
| Unrealized Gain on Marketable Equity Securities: | | | | | | | | | |
| Before Tax | | $ | 177 | | | $ | 23 | | | $ | 145 | |
| Tax Effect | | | (62 | ) | | | (9 | ) | | | (58 | ) |
| Unrealized Gain on Marketable Equity Securities – Net-of-Tax | | | 115 | | | | 14 | | | | 87 | |
| Foreign Currency Exchange Translation – Net-of-Tax: | | | | | | | | | | | | |
| Before Tax | | | -- | | | | -- | | | | 5,765 | |
| Tax Effect | | | -- | | | | -- | | | | (1,787 | ) |
| Foreign Currency Exchange Translation – Net-of-Tax | | | -- | | | | -- | | | | 3,978 | |
| Unamortized Actuarial Losses and Transition Obligation Related to Pension and Postretirement Benefits: | | | | | | | | | | | | |
| Before Tax | | | (7,500 | ) | | | (5,743 | ) | | | (4,296 | ) |
| Tax Effect | | | 3,000 | | | | 2,297 | | | | 1,718 | |
| Unamortized Actuarial Losses and Transition Obligation Related to Pension and Postretirement Benefits – Net-of-Tax | | | (4,500 | ) | | | (3,446 | ) | | | (2,578 | ) |
| Accumulated Other Comprehensive (Loss) Income: | | | | | | | | | | | | |
| Before Tax | | | (7,323 | ) | | | (5,720 | ) | | | 1,614 | |
| Tax Effect | | | 2,938 | | | | 2,288 | | | | (127 | ) |
| Net Accumulated Other Comprehensive (Loss) Income | | $ | (4,385 | ) | | $ | (3,432 | ) | | $ | 1,487 | |
See accompanying notes to consolidated financial statements. | | | | | | | | | | | | |
| OTTER TAIL CORPORATION | |
| |
| (in thousands) | | 2012 | | | 2011 | | | 2010 | |
| Cash Flows from Operating Activities | | | | | | | | | |
| Net Loss | | $ | (5,273 | ) | | $ | (13,243 | ) | | $ | (1,344 | ) |
| Adjustments to Reconcile Net Loss to Net Cash Provided by Operating Activities: | | | | | | | | | | | | |
| Net Loss (Gain) from Sale of Discontinued Operations | | | 5,531 | | | | (8,674 | ) | | | -- | |
| Net Loss from Discontinued Operations | | | 38,710 | | | | 56,827 | | | | 27,624 | |
| Depreciation and Amortization | | | 59,764 | | | | 58,335 | | | | 57,647 | |
| Asset Impairment Charge | | | 432 | | | | 470 | | | | -- | |
| Deferred Tax Valuation Adjustments and Tax Rate Reduction | | | -- | | | | -- | | | | 8,300 | |
| Premium Paid for Early Retirement of Long-Term Debt | | | 12,500 | | | | -- | | | | -- | |
| Deferred Tax Credits | | | (2,091 | ) | | | (2,386 | ) | | | (2,715 | ) |
| Deferred Income Taxes | | | 11,459 | | | | 10,661 | | | | 10,990 | |
| Change in Deferred Debits and Other Assets | | | (4,802 | ) | | | (25,053 | ) | | | 30 | |
| Discretionary Contribution to Pension Fund | | | (10,000 | ) | | | -- | | | | (20,000 | ) |
| Change in Noncurrent Liabilities and Deferred Credits | | | 32,718 | | | | 35,178 | | | | 2,786 | |
| Allowance for Equity (Other) Funds Used During Construction | | | (1,168 | ) | | | (861 | ) | | | (4 | ) |
| Change in Derivatives Net of Regulatory Deferral | | | 718 | | | | 72 | | | | 208 | |
| Stock Compensation Expense – Equity Awards | | | 1,311 | | | | 2,177 | | | | 2,923 | |
| Other—Net | | | 4,500 | | | | 6,496 | | | | 5,847 | |
| Cash Provided by (Used for) Current Assets and Current Liabilities: | | | | | | | | | | | | |
| Change in Receivables | | | 2,430 | | | | (7,952 | ) | | | (31,094 | ) |
| Change in Inventories | | | (687 | ) | | | (5,286 | ) | | | (8,167 | ) |
| Change in Other Current Assets | | | 7,019 | | | | (1,072 | ) | | | (6,559 | ) |
| Change in Payables and Other Current Liabilities | | | 30,056 | | | | (4,775 | ) | | | 16,256 | |
| Change in Interest Payable and Income Taxes Receivable/Payable | | | (14,141 | ) | | | (7,236 | ) | | | 43,206 | |
| Net Cash Provided by Continuing Operations | | | 168,986 | | | | 93,678 | | | | 105,934 | |
| Net Cash Provided by (Used in) Discontinued Operations | | | 64,561 | | | | 10,705 | | | | (917 | ) |
| Net Cash Provided by Operating Activities | | | 233,547 | | | | 104,383 | | | | 105,017 | |
| Cash Flows from Investing Activities | | | | | | | | | | | | |
| Capital Expenditures | | | (115,762 | ) | | | (67,360 | ) | | | (58,264 | ) |
| Proceeds from Disposal of Noncurrent Assets | | | 4,889 | | | | 1,923 | | | | 827 | |
| Net Increase in Other Investments | | | (1,037 | ) | | | (40 | ) | | | (2,855 | ) |
| Net Cash Used in Investing Activities - Continuing Operations | | | (111,910 | ) | | | (65,477 | ) | | | (60,292 | ) |
| Net Proceeds from Sale of Discontinued Operations | | | 42,229 | | | | 107,310 | | | | -- | |
| Net Cash Used in Investing Activities - Discontinued Operations | | | (13,896 | ) | | | (36,410 | ) | | | (24,875 | ) |
| Net Cash (Used in) Provided by Investing Activities | | | (83,577 | ) | | | 5,423 | | | | (85,167 | ) |
| Cash Flows from Financing Activities | | | | | | | | | | | | |
| Change in Checks Written in Excess of Cash | | | -- | | | | (7,268 | ) | | | 7,268 | |
| Net Short-Term (Repayments) Borrowings | | | -- | | | | (79,490 | ) | | | 71,905 | |
| Proceeds from Issuance of Common Stock | | | -- | | | | -- | | | | 549 | |
| Proceeds from Issuance of Class B Stock of Subsidiary | | | -- | | | | -- | | | | 153 | |
| Common Stock Issuance Expenses | | | (370 | ) | | | -- | | | | (142 | ) |
| Payments for Retirement of Common Stock | | | (111 | ) | | | (1,182 | ) | | | (401 | ) |
| Payments for Retirement of Class B Stock and Options of Subsidiary | | | -- | | | | -- | | | | (1,012 | ) |
| Proceeds from Issuance of Long-Term Debt | | | -- | | | | 142,006 | | | | -- | |
| Short-Term and Long-Term Debt Issuance Expenses | | | (897 | ) | | | (1,666 | ) | | | (1,699 | ) |
| Payments for Retirement of Long-Term Debt | | | (50,224 | ) | | | (100,796 | ) | | | (58,451 | ) |
| Premium Paid for Early Retirement of Long-Term Debt | | | (12,500 | ) | | | -- | | | | -- | |
| Dividends Paid and Other Distributions | | | (43,976 | ) | | | (43,923 | ) | | | (43,698 | ) |
| Net Cash Used in Financing Activities - Continuing Operations | | | (108,078 | ) | | | (92,319 | ) | | | (25,528 | ) |
| Net Cash (Used in) Provided by Financing Activities - Discontinued Operations | | | (4,278 | ) | | | (3,184 | ) | | | 1,812 | |
| Net Cash Used in Financing Activities | | | (112,356 | ) | | | (95,503 | ) | | | (23,716 | ) |
| Net Change in Cash and Cash Equivalents - Discontinued Operations | | | (1,246 | ) | | | 2,015 | | | | (2,495 | ) |
| Effect of Foreign Exchange Rate Fluctuations on Cash – Discontinued Operations | | | -- | | | | (324 | ) | | | (566 | ) |
| Net Change in Cash and Cash Equivalents | | | 36,368 | | | | 15,994 | | | | (6,927 | ) |
| Cash and Cash Equivalents at Beginning of Period | | | 15,994 | | | | -- | | | | 6,927 | |
| Cash and Cash Equivalents at End of Period | | $ | 52,362 | | | $ | 15,994 | | | $ | -- | |
| See accompanying notes to consolidated financial statements. | | | | | | | | | | | | |
| |
| | |
| |
| (in thousands, except share data) | | 2012 | | | 2011 | |
| | | | | | | |
| Long-Term Debt | | | | | | |
| Obligations of Otter Tail Corporation | | | | | | |
| 9.000% Notes, due December 15, 2016 | | $ | 100,000 | | | $ | 100,000 | |
| Senior Unsecured Note 8.89%, due November 30, 2017, retired early on July 13, 2012 | | | -- | | | | 50,000 | |
| North Dakota Development Note, 3.95%, due April 1, 2018 | | | 393 | | | | 458 | |
| Partnership in Assisting Community Expansion (PACE) Note, 2.54%, due March 18, 2021 | | | 1,332 | | | | 1,431 | |
| Total – Otter Tail Corporation | | | 101,725 | | | | 151,889 | |
| | | | | | | | | |
| Obligations of Otter Tail Power Company | | | | | | | | |
| Senior Unsecured Notes 5.95%, Series A, due August 20, 2017 | | | 33,000 | | | | 33,000 | |
| Grant County, South Dakota Pollution Control Refunding Revenue Bonds 4.65%, due September 1, 2017 | | | 5,065 | | | | 5,090 | |
| Senior Unsecured Notes 4.63%, due December 1, 2021 | | | 140,000 | | | | 140,000 | |
| Senior Unsecured Notes 6.15%, Series B, due August 20, 2022 | | | 30,000 | | | | 30,000 | |
| Mercer County, North Dakota Pollution Control Refunding Revenue Bonds 4.85%, due September 1, 2022 | | | 20,070 | | | | 20,105 | |
| Senior Unsecured Notes 6.37%, Series C, due August 20, 2027 | | | 42,000 | | | | 42,000 | |
| Senior Unsecured Notes 6.47%, Series D, due August 20, 2037 | | | 50,000 | | | | 50,000 | |
| Total – Otter Tail Power Company | | | 320,135 | | | | 320,195 | |
| | | | | | | | | |
| Total | | | 421,860 | | | | 472,084 | |
| Less: | | | | | | | | |
| Current Maturities – Otter Tail Corporation | | | 176 | | | | 165 | |
| Unamortized Debt Discount – Otter Tail Corporation | | | 4 | | | | 4 | |
| Total Long-Term Debt | | | 421,680 | | | | 471,915 | |
Cumulative Preferred Shares—Without Par Value (Stated and Liquidating Value $100 a Share)— Authorized 1,500,000 Shares; nonvoting and redeemable at the option of the Company: | | | | | | | | |
| Series Outstanding: | | Call Price December 31, 2012 | | | | | | | | | |
| $3.60, 60,000 Shares | | $ | 102.2500 | | | | 6,000 | | | | 6,000 | |
| $4.40, 25,000 Shares | | $ | 102.0000 | | | | 2,500 | | | | 2,500 | |
| $4.65, 30,000 Shares | | $ | 101.5000 | | | | 3,000 | | | | 3,000 | |
| $6.75, 40,000 Shares | | $ | 100.3375 | | | | 4,000 | | | | 4,000 | |
| Total Preferred | | | | | | | 15,500 | | | | 15,500 | |
Cumulative Preference Shares--Without Par Value, Authorized 1,000,000 Shares; Outstanding: None | | | | | | | | |
| Total Common Shareholders’ Equity | | | 521,974 | | | | 571,448 | |
| Total Capitalization | | $ | 959,154 | | | $ | 1,058,863 | |
See accompanying notes to consolidated financial statements. | | | | | | | | |
| |
| | |
| |
| (in thousands, except share data) | | 2013 | | | 2012 | |
| Short-Term Debt | | | | | | |
| Otter Tail Power Company Credit Agreement | | $ | 51,195 | | | $ | -- | |
| Total Short-Term Debt | | $ | 51,195 | | | $ | -- | |
| | | | | | | | | |
| Long-Term Debt | | | | | | | | |
| Obligations of Otter Tail Corporation | | | | | | | | |
| 9.000% Notes, due December 15, 2016 | | $ | 52,330 | | | $ | 100,000 | |
| North Dakota Development Note, 3.95%, due April 1, 2018 | | | 325 | | | | 393 | |
| Partnership in Assisting Community Expansion (PACE) Note, 2.54%, due March 18, 2021 | | | 1,223 | | | | 1,332 | |
| Total – Otter Tail Corporation | | | 53,878 | | | | 101,725 | |
| | | | | | | | | |
| Obligations of Otter Tail Power Company | | | | | | | | |
| Unsecured Term Loan - LIBOR plus 0.875%, due January 15, 2015 | | | 40,900 | | | | -- | |
| Senior Unsecured Notes 5.95%, Series A, due August 20, 2017 | | | 33,000 | | | | 33,000 | |
Grant County, South Dakota Pollution Control Refunding Revenue Bonds 4.65%, due September 1, 2017, retired early on March 1, 2013 | | | -- | | | | 5,065 | |
| Senior Unsecured Notes 4.63%, due December 1, 2021 | | | 140,000 | | | | 140,000 | |
| Senior Unsecured Notes 6.15%, Series B, due August 20, 2022 | | | 30,000 | | | | 30,000 | |
Mercer County, North Dakota Pollution Control Refunding Revenue Bonds 4.85%, due September 1, 2022, retired early on March 1, 2013 | | | -- | | | | 20,070 | |
| Senior Unsecured Notes 6.37%, Series C, due August 20, 2027 | | | 42,000 | | | | 42,000 | |
| Senior Unsecured Notes 6.47%, Series D, due August 20, 2037 | | | 50,000 | | | | 50,000 | |
| Total – Otter Tail Power Company | | | 335,900 | | | | 320,135 | |
| | | | | | | | | |
| Total | | | 389,778 | | | | 421,860 | |
| Less: | | | | | | | | |
| Current Maturities – Otter Tail Corporation | | | 188 | | | | 176 | |
| Unamortized Debt Discount – Otter Tail Corporation | | | 1 | | | | 4 | |
| Total Long-Term Debt | | | 389,589 | | | | 421,680 | |
Cumulative Preferred Shares—Without Par Value (Stated and Liquidating Value $100 a Share)— Authorized 1,500,000 Shares; nonvoting and redeemable at the option of the Company: | | | | | | | | |
| | Series Outstanding December 31, 2012: | | | | | | | | | |
| $3.60, 60,000 Shares; redeemed on March 1, 2013 | | | -- | | | | 6,000 | |
| $4.40, 25,000 Shares; redeemed on March 1, 2013 | | | -- | | | | 2,500 | |
| $4.65, 30,000 Shares; redeemed on March 1, 2013 | | | -- | | | | 3,000 | |
| $6.75, 40,000 Shares; redeemed on March 1, 2013 | | | -- | | | | 4,000 | |
| Total Preferred | | | -- | | | | 15,500 | |
Cumulative Preference Shares--Without Par Value, Authorized 1,000,000 Shares; Outstanding: None | | | | | | | | |
| Total Common Shareholders’ Equity | | | 534,830 | | | | 521,974 | |
| Total Capitalization | | $ | 924,419 | | | $ | 959,154 | |
See accompanying notes to consolidated financial statements. | | | | | | | | |
For the years ended December 31, 2013, 2012 2011 and 20102011
1. Summary of Significant Accounting Policies
Principles of Consolidation
The consolidated financial statements of Otter Tail Corporation and its wholly owned subsidiaries (the Company) include the accounts of the following segments: Electric, Manufacturing, ConstructionPlastics and Plastics.Construction. See note 2 to the consolidated financial statements for further descriptions of the Company’s business segments. All significant intercompany balances and transactions have been eliminated in consolidation except profits on sales to the regulated electric utility company from nonregulated affiliates, which is in accordance with the requirements of Financial Accounting Standards Board (FASB) Accounting Standards Codification (ASC) Topic 980, Regulated Operations, (ASC 980).
Regulation and ASC 980
The Company’s regulated electric utility company, Otter Tail Power Company (OTP), accounts for the financial effects of regulation in accordance with ASC 980. This standard allows for the recording of a regulatory asset or liability for costs and revenues that will be collected or refunded through the ratemaking process in the future. In accordance with regulatory treatment, OTP defers utility debt redemption premiums and amortizes such costs over the original life of the reacquired bonds. See note 4 for further discussion.
OTP is subject to various state and federal agency regulations. The accounting policies followed by this business are subject to the Uniform System of Accounts of the Federal Energy Regulatory Commission (FERC). These accounting policies differ in some respects from those used by the Company’s nonelectric businesses.
Plant, Retirements and Depreciation
Utility plant is stated at original cost. The cost of additions includes contracted work, direct labor and materials, allocable overheads and allowance for funds used during construction. The amount of interest capitalized on electric utility plant was $1,002,000 in 2013, $656,000 in 2012 and $628,000 in 2011 and $76,000 in 2010.2011. The cost of depreciable units of property retired less salvage is charged to accumulated depreciation. Removal costs, when incurred, are charged against the accumulated reserve for estimated removal costs, a regulatory liability. Maintenance, repairs and replacement of minor items of property are charged to operating expenses. The provisions for utility depreciation for financial reporting purposes are made on the straight-line method based on the estimated service lives of the properties.properties (5 to 70 years). Such provisions as a percent of the average balance of depreciable electric utility property were 2.96% in 2013, 2.98% in 2012 and 2.94% in 2011 and 3.01% in 2010.2011. Gains or losses on group asset dispositions are taken to the accumulated provision for depreciation reserve and impact current and future depreciation rates.
Property and equipment of nonelectric operations are carried at historical cost or at the then-current replacement cost if acquired in a business combination accounted for under the purchase method of accounting, and are depreciated on a straight-line basis over the assets’ estimated useful lives (3 to 40 years). The cost of additions includes contracted work, direct labor and materials, allocable overheads and capitalized interest. No interest was capitalized on nonelectric plant in 2013, 2012 2011 or 2010.2011. Maintenance and repairs are expensed as incurred. Gains or losses on asset dispositions are included in the determination of operating income.
Jointly Owned PlantsFacilities
The consolidated balance sheets include OTP’s ownership interests in the assets and liabilities of Big Stone Plant (53.9%) and Coyote Station (35.0%). The following amounts are included in the Company’s December 31, 20122013 and 20112012 consolidated balance sheets:
| (in thousands) | | 2012 | | | 2011 | | | 2013 | | | 2012 | |
| Big Stone Plant: | | | | | | | | | | | | |
| Electric Plant in Service | | $ | 141,221 | | | $ | 143,993 | | | $ | 142,780 | | | $ | 141,221 | |
| Construction Work in Progress | | | 22,335 | | | | 2,674 | | | | 94,913 | | | | 22,335 | |
| Accumulated Depreciation | | | (80,588 | ) | | | (87,669 | ) | | | (83,005 | ) | | | (80,588 | ) |
| Net Plant | | $ | 82,968 | | | $ | 58,998 | | | $ | 154,688 | | | $ | 82,968 | |
| Coyote Station: | | | | | | | | | | | | | | | | |
| Electric Plant in Service | | $ | 160,617 | | | $ | 156,213 | | | $ | 162,095 | | | $ | 160,617 | |
| Construction Work in Progress | | | 578 | | | | 1,533 | | | | 303 | | | | 578 | |
| Accumulated Depreciation | | | (93,564 | ) | | | (97,090 | ) | | | (96,907 | ) | | | (93,564 | ) |
| Net Plant | | $ | 67,631 | | | $ | 60,656 | | | $ | 65,491 | | | $ | 67,631 | |
OTP is a joint owner, with other regional utilities, in three Capacity Expansion 2020 (CapX2020) transmission lines with the following ownership interests: 14.8% in the Bemidji-Grand Rapids 230 kV line, 13.3% in the Fargo-Monticello 345 kV line, 4.9% in the Brookings-Southeast Twin Cities Multi-Value Project (MVP) 345 kV line, 50.0% in the Big Stone South to Brookings MVP 345 kV line and 49.2% in the Big Stone South to Ellendale MVP 345 kV line. The following amounts for the jointly-owned transmission facilities are included in the Company’s December 31, 2013 and 2012 consolidated balance sheets: 71
| (in thousands) | | 2013 | | | 2012 | |
| Electric Plant in Service | | $ | 26,337 | | | $ | 25,852 | |
| Construction Work in Progress | | | 71,205 | | | | 30,171 | |
| Accumulated Depreciation | | | (837 | ) | | | (483 | ) |
| Net Plant | | $ | 96,705 | | | $ | 55,540 | |
The Company’s share of direct revenue and expenses of the jointly owned plantsfacilities is included in operating revenue and expenses in the consolidated statements of income.
Coyote Station Lignite Supply Agreement – Variable Interest Entity
In October 2012, the Coyote Station owners, including OTP, entered into a lignite sales agreement (LSA) with Coyote Creek Mining Company, L.L.C. (CCMC), a subsidiary of The North American Coal Corporation, for the purchase of coal to meet the coal supply requirements of Coyote Station for the period beginning in May 2016 and ending in December 2040. The price per ton to be paid by the Coyote Station owners under the LSA will reflect the cost of production, along with an agreed profit and capital charge. CCMC was formed for the purpose of mining lignite coal to meet the coal fuel supply requirements of Coyote Station from May 2016 through December 2040 and, based on the terms of the LSA, is considered a variable interest entity (VIE). due to the transfer of all operating and economic risk to the Coyote Station owners, as the agreement is structured so that the price of the coal would cover all costs of operations as well as future reclamation costs. The Coyote Station owners are also providing a guarantee of the value of the assets of CCMC as they would be required to buy the assets at book value should they terminate the contract prior to the end of the contract term and are providing a guarantee of the value of the equity of CCMC in that they are required to buy the entity at the end of the contract term at equity value. Under current accounting standards, the primary beneficiary of a VIE is required to include the assets, liabilities, results of operations and cash flows of the VIE in its consolidated financial statements. Although Coyote Station is the primary beneficiary of the VIE, noNo single owner of Coyote Station owns a majority interest in Coyote Station and none, individually, havehas the power to direct the activities that most significantly impact CCMC. Therefore, none of the owners individually, including OTP, is considered a primary beneficiary of the VIE. Therefore, CCMC is not required to be consolidated in the Company’s consolidated financial statements.
Under the LSA, all development period costs of the Coyote Creek coal mine incurred during the development period will be recovered from the Coyote Station owners over the full term of the production period, which commences with the first delivery of coal to Coyote Station, scheduled for May 2016, by being included in the cost of production. The development fee and the capital charge incurred during the development period will be recovered from the Coyote Station owners over the first 52 months of the production period by being included in the cost of production during those months. OTP’s 35% share of development period costs, development fees and capital charges incurred by CCMC through December 31, 2012 totaled $8.32013 is $10.2 million. In the event the contract is terminated because regulations or legislation render the burning of coal cost prohibitive and the assets worthless, OTP’s maximum exposure to loss as a result of its involvement with CCMC as of December 31, 2013 could be as high as $10.2 million.
Recoverability of Long-Lived Assets
The Company reviews its long-lived assets whenever events or changes in circumstances indicate the carrying amount of the assets may not be recoverable. The Company determines potential impairment by comparing the carrying amount of the assets with net cash flows expected to be provided by operating activities of the business or related assets. If the sum of the expected future net cash flows is less than the carrying amount of the assets, the Company would recognize an impairment loss. Such an impairment loss would be measured as the amount by which the carrying amount exceeds the fair value of the asset, where fair value is based on the discounted cash flows expected to be generated by the asset.
In the fourth quarter of 2011, DMI Industries,IMD, Inc. (DMI)(IMD), the Company’s former wind tower manufacturer, recorded a $3.1 million asset impairment charge on its plant in Fort Erie, Ontario. DMIIMD idled this plant in the fourth quarter of 2011, as the plant had completed all of its then current tower orders.
In June 2012, the Company entered into a nonbinding letter of interest with Trinity Industries, Inc. (Trinity) to sell the fixed assets of DMIIMD for $20 million, with the Company retaining DMI’sIMD’s net working capital—approximately $66 million on June 30, 2012. On September 6, 2012 the Company entered into definitive agreements with Trinity to sell the fixed assets of DMIIMD for $20 million. The agreed on price for the fixed assets was an indicator of the fair value of the assets under level 2 of the ASC fair value hierarchy and an indication of a decrease in the market value of the assets being sold, which were significantly impacted by a decline in market conditions in the wind energy industry. DMIIMD had no tower orders for 2013 due to the expected expiration, at the end of 2012, of the Federal Production Tax Credit (PTC) for investments in renewable energy resources. These factors resulted in DMIIMD recording a fair value adjustment of its long-lived assets to the indicated market price of $20 million and an asset impairment charge of $45.6 million ($27.5 million net-of-tax benefits), or $0.76 per share, in June 2012 broken down as follows:
| (in thousands) | | | |
| Long-Lived Assets (net of accumulated depreciation) | | $ | 45,285 | |
| Goodwill | | | 288 | |
| Total Asset Impairment Charges | | $ | 45,573 | |
| (in thousands) | | | |
| Long-Lived Assets (net of accumulated depreciation) | | $ | 45,285 | |
| Goodwill | | | 288 | |
| Total Asset Impairment Charges | | $ | 45,573 | |
The sale of the Fort Erie fixed assets closed on September 6, 2012, the West Fargo transaction closed on October 31, 2012 and the Tulsa transaction closed on November 30, 2012. With the sale of DMI’s Tulsa assets DMI’s operations under the Company ended and, accordingly, DMI’s cash flows, results of operations, and any remaining assets and liabilities are reported under discontinued operations as of, and for all periods ending prior to, December 31, 2012.
Otter Tail Energy Services Company (OTESCO) recorded asset impairment charges of $0.4 million in 2012 and $0.5 million in 2011 related to wind farm development rights at its Sheridan Ridge and Stutsman County sites in North Dakota based on the fair value of these assets declining to $0 as of March 31, 2012.
On February 8, 2013 the Company closed on the sale ofsold substantially all of the assets of ShoreMasterShrco, Inc. (ShoreMaster)(Shrco), the Company’s former waterfront equipment manufacturer, subject to certain closing conditions. The Company recorded a $7.7 million ($4.6 million net-of-tax benefits), or $0.13 per share, asset impairment charge in December 2012 based on the indicated market value of ShoreMaster’sShrco’s assets broken down as follows:
| (in thousands) | | | |
| Long-Lived Assets (net of accumulated depreciation) | | $ | 5,859 | |
| Inventory | | | 782 | |
| Accrued Selling Costs | | | 1,106 | |
| Total Impairment Charges | | $ | 7,747 | |
As a result of the pending sale, ShoreMaster’s assets are considered held for sale as of December 31, 2012 and, along with its liabilities, cash flows, and results of operations, are reported under discontinued operations as of, and for all periods ending prior to, December 31, 2012.| (in thousands) | | | |
| Long-Lived Assets (net of accumulated depreciation) | | $ | 5,859 | |
| Inventory | | | 782 | |
| Accrued Selling Costs | | | 1,106 | |
| Total Impairment Charges | | $ | 7,747 | |
Income Taxes
Comprehensive interperiod income tax allocation is used for substantially all book and tax temporary differences. Deferred income taxes arise for all temporary differences between the book and tax basis of assets and liabilities. Deferred taxes are recorded using the tax rates scheduled by tax law to be in effect in the periods when the temporary differences reverse. The Company amortizes investment tax credits over the estimated lives of related property. The Company records income taxes in accordance with ASC Topic 740, Income Taxes, and has recognized in its consolidated financial statements the tax effects of all tax positions that are “more-likely-than-not”“more-likely-than-not” to be sustained on audit based solely on the technical merits of those positions as of the balance sheet date. The term “more-likely-than-not” means a likelihood of more than 50%. The Company classifies interest and penalties on tax uncertainties as components of the provision for income taxes. See note 15 to the consolidated financial statements regarding the Company’s accounting for uncertain tax positions.
The Company also is required to assess the realizability of its deferred tax assets, taking into consideration the Company’s forecast of future taxable income, the reversal of other existing temporary differences, available net operating loss carryforwards and available tax planning strategies that could be implemented to realize the deferred tax assets. Based on this assessment, management must evaluate the need for, and amount of, valuation allowances against the Company’s deferred tax assets. If we determine we would be able to realize our deferred income tax assets in the future in excess of their net recorded amount, we would make an adjustment to the deferred tax asset valuation allowance, which would reduce the provision for income taxes. To the extent facts and circumstances change in the future, adjustments to the valuation allowance may be required.
Revisions to Presentation
Beginning with the Company’s 2013 Annual Report on Form 10-K, the Company is reporting revenues and costs related to the sale of products by its manufacturing and plastic pipe companies separately from the revenues and costs of its construction companies on the face of its consolidated statements of income. Its nonelectric revenues and cost of goods sold for the years 2012 and 2011 were revised in a similar manner to be consistent with, and comparable to, the presentation of revenues and costs for 2013. The change in presentation of 2012 and 2011 nonelectric revenues and cost of goods sold had no effect on the Company’s reported consolidated revenues, costs, operating income or net income for 2012 or 2011.
Revenue Recognition
Due to the diverse business operations of the Company, revenue recognition depends on the product produced and sold or service performed. The Company recognizes revenue when the earnings process is complete, evidenced by an agreement with the customer, there has been delivery and acceptance, and the price is fixed or determinable. In cases where significant obligations remain after delivery, revenue recognition is deferred until such obligations are fulfilled. Provisions for sales returns and warranty costs are recorded at the time of the sale based on historical information and current trends. In the case of derivative instruments, such as OTP’s forward energy contracts, marked-to-market and realized gains and losses are recognized on a net basis in revenue in accordance with ASC Topic 815, Derivatives and Hedging (ASC 815). Gains and losses on forward energy contracts subject to regulatory treatment, if any, are deferred and recognized on a net basis in revenue in the period realized.
For the Company’s operating companies recognizing revenue on certain products when shipped, those operating companies have no further obligation to provide services related to such product. The shipping terms used in these instances are FOB shipping point.
Customer electricity use is metered and bills are rendered monthly. Revenue is accrued for electricity consumed but not yet billed. Rate schedules applicable to substantially all customers include a fuel clause adjustment, under which the rates are adjusted to reflect changes in average cost of fuels and purchased power, and a surcharge for recovery of conservation-related expenses. Revenue is recognized for fuel and purchased power costs incurred in excess of amounts recovered in base rates but not yet billed through the fuel clause adjustment, for conservation program incentives and bonuses earned but not yet billed and for renewable resource, transmission-related and transmission-relatedenvironmental incurred costs and investment returns approved for recovery through riders.
Revenues on wholesale electricity sales from Company-owned generating units are recognized when energy is delivered.
OTP’s unrealized gains and losses on forward energy contracts that do not meet the definition of capacity contracts are marked to market and reflected on a net basis in electric revenue on the Company’s consolidated statement of income. Under ASC 815, OTP’s forward energy contracts that do not meet the definition of a capacity contract and are subject to unplanned netting do not qualify for the normal purchase and sales exception from mark-to-market accounting. See note 5 for further discussion.
Manufacturing operating revenues are recorded when products are shipped.
The companies in the Construction segment enter into fixed-price construction contracts. Revenues under these contracts are recognized on a percentage-of-completion basis. The method used to determine the progress of completion is based on the ratio of costs incurred to total estimated costs on construction projects. Following are the percentages of the Company’s consolidated revenues recorded under the percentage-of-completion method:
| | | 2012 | | | 2011 | | | 2010 | |
| Percentage-of-Completion Revenues | | | 17.3 | % | | | 22.0 | % | | | 18.6 | % |
| | | 2013 | | | 2012 | | | 2011 | |
| Percentage-of-Completion Revenues | | | 16.7% | | | | 17.0% | | | | 21.4% | |
The following table summarizes costs incurred and billings and estimated earnings recognized on uncompleted contracts:
| | | December 31, | | | December 31, | | | December 31, | | | December 31, | |
| (in thousands) | | 2012 | | | 2011 | | | 2013 | | | 2012 | |
| Costs Incurred on Uncompleted Contracts | | $ | 307,085 | | | $ | 321,346 | | | $ | 361,487 | | | $ | 307,085 | |
| Less Billings to Date | | | (321,388 | ) | | | (340,418 | ) | | | (377,608 | ) | | | (321,388 | ) |
| Plus Estimated Earnings Recognized | | | 1,762 | | | | 22,108 | | | | 6,477 | | | | 1,762 | |
| | | $ | (12,541 | ) | | $ | 3,036 | | |
| Net Billings in Excess of Costs and Estimated Earnings on Uncompleted Contracts | | | $ | (9,644 | ) | | $ | (12,541 | ) |
The following costs and estimated earnings in excess of billings and billings in excess of costs and estimated earnings are included in the Company’s consolidated balance sheets.sheets:
| | | December 31, | | | December 31, | | | December 31, | | | December 31, | |
| (in thousands) | | 2012 | | | 2011 | | | 2013 | | | 2012 | |
| Costs and Estimated Earnings in Excess of Billings on Uncompleted Contracts | | $ | 3,663 | | | $ | 12,211 | | | $ | 4,063 | | | $ | 3,663 | |
| Billings in Excess of Costs and Estimated Earnings on Uncompleted Contracts | | | (16,204 | ) | | | (9,175 | ) | | | (13,707 | ) | | | (16,204 | ) |
| | | $ | (12,541 | ) | | $ | 3,036 | | |
| Net Billings in Excess of Costs and Estimated Earnings on Uncompleted Contracts | | | $ | (9,644 | ) | | $ | (12,541 | ) |
The Company has a standard quarterly Estimateestimate at Completioncompletion process in which management reviews the progress and performance of the Company’s contracts accounted for under percentage-of-completion accounting. As part of this process, management reviews include, but are not limited to, any outstanding key contract matters, progress towards completion and the related program schedule, identified risks and opportunities, and the related changes in estimates of revenues and costs. The risks and opportunities include management’s judgment about the ability and cost to achieve the schedule, technical requirements and other contract requirements. Management must make assumptions regarding labor productivity and availability, the complexity of the work to be performed, the availability of materials, the length of time to complete the contract, and performance by subcontractors, among other variables. Based on this analysis, any adjustments to net sales, costs of sales, and the related impact to operating income are recorded as necessary in the period they become known. These adjustments may result from positive program performance and an increase in operating profit during the performance of individual contracts if management determines it will be successful in mitigating risks surrounding the technical, schedule, and cost aspects of those contracts or realizing related opportunities. Likewise, these adjustments may result in a decrease in operating profit if management determines it will not be successful in mitigating these risks or realizing related opportunities. Changes in estimates of net sales, costs of sales, and the related impact to operating income are recognized using a cumulative catch-up, which recognizes, in the current period, the cumulative effect of the changes on current and prior periods based on a contract’s percent complete. A significant change in one or more of these estimates could affect the profitability of one or more of the Company’s contracts. If a loss is indicated at a point in time during a contract, a projected loss for the entire contract is estimated and recognized.
In 2012, Foley Company (Foley) experienced cost overruns in excess of estimated costs on several large projects. All of these projects were substantially completed as of December 31, 2012. Estimated costs on certain projects in excess of previous period estimates resulted in pretax charges of $0.6 million in 2013 compared with $14.9 million in 2012 compared withand $7.0 million in 2011. All of these projects were substantially completed as of December 31, 2012.
Plastics operating revenues are recorded when the product is shipped.
Warranty Reserves
The Company establishes reserves for estimated product warranty costs at the time revenue is recognized based on historical warranty experience and additionally for any known product warranty issues. Certain products previously sold by the Company products carrycarried one to fifteen year warranties. Although the Company engagesengaged in extensive product quality programs and processes, the Company’s warranty obligations have been and may in the future be affected by product failure rates, repair or field replacement costs and additional development costs incurred in correcting product failures.
| (in thousands) | | | |
| Warranty Reserve Balance, December 31, 2011 | | $ | 3,170 | |
| Provision for Warranties Used During the Year | | | 3,240 | |
| Less Settlements Made During the Year | | | (1,342 | ) |
| Decrease in Warranty Estimates for Prior Years | | | (41 | ) |
| Warranty Reserve Balance, December 31, 2012 | | $ | 5,027 | |
The warranty reserve balancebalances as of December 31, 2013 and December 31, 2012 relatesrelate entirely to products that were produced by DMIIMD and ShoreMasterShrco prior to the Company selling the assets of these companies and isare included in liabilities of discontinued operations. Expenses associated with remediation activities of DMI could be substantial. Although the assets of DMI and ShoreMaster have been sold and DMI’s and ShoreMaster’s operating results are reported under discontinued operations in the Company’sSee note 17 to consolidated statements of income, the Company retains responsibility for warranty claims related to the products produced by DMI and ShoreMaster prior to the sales of these entities. For DMI’s wind towers, the potential exists for multiple claims based on one defect repeated throughout the production process or for claims where the cost to repair or replace the defective part is highly disproportionate to the original cost of the part. If the Company is required to cover remediation expenses in addition to regular warranty coverage, the Company could be required to accrue additional expenses and experience additional unplanned cash expenditures which could adversely affect the Company’s consolidated results of operations and financial condition.statements.
Retainage
Accounts Receivable include the following amounts, billed under contracts by the Company’s construction subsidiaries, that have been retained by customers pending project completion:
| | | December 31, | | | December 31, | | | December 31, | | | December 31, | |
| (in thousands) | | 2012 | | | 2011 | | | 2013 | | | 2012 | |
| Accounts Receivable Retained by Customers | | $ | 12,227 | | | $ | 13,075 | | | $ | 7,125 | 1 | | $ | 12,227 | |
1 Includes $89,000 related to one project with an expected completion date beyond December 31, 2014. | | 1 Includes $89,000 related to one project with an expected completion date beyond December 31, 2014. | |
Shipping and Handling Costs
The Company includes revenues received for shipping and handling in operating revenues. Expenses paid for shipping and handling are recorded as part of cost of goods sold.
Use of Estimates
The Company uses estimates based on the best information available in recording transactions and balances resulting from business operations. Estimates are used for such items as depreciable lives, asset impairment evaluations, tax provisions, collectability of trade accounts receivable, self-insurance programs, unbilled electric revenues, accrued renewable resource, transmission and environmental cost recovery rider revenues, valuations of forward energy contracts, percentage-of-completion, warranty reserves and actuarially determined benefits costs and liabilities. As better information becomes available (or actual amounts are known), the recorded estimates are revised. Consequently, operating results can be affected by revisions to prior accounting estimates.
Cash Equivalents
The Company considers all highly liquid debt instruments purchased with maturity of 90 days or less to be cash equivalents.
Investments
The following table provides a breakdown of the Company’s investments at December 31, 20122013 and 2011:2012:
| | | December 31, | | | December 31, | | | December 31, | | | December 31, | |
| (in thousands) | | 2012 | | | 2011 | | | 2013 | | | 2012 | |
| Cost Method: | | | | | | | | | | | | |
Portion of IPH Sales Proceeds Held in Escrow Account1 | | $ | 1,500 | | | $ | 3,001 | | | $ | -- | | | $ | 1,500 | |
| Economic Development Loan Pools | | | 255 | | | | 320 | | | | 219 | | | | 255 | |
| Other | | | 174 | | | | 206 | | | | 158 | | | | 174 | |
| Equity Method: | | | | | | | | | | | | | | | | |
| Affordable Housing and Other Partnerships | | | 117 | | | | 276 | | | | 43 | | | | 117 | |
| Marketable Securities Classified as Available-for-Sale | | | 8,925 | | | | 8,790 | | | | 8,942 | | | | 8,925 | |
| Total Investments | | $ | 10,971 | | | $ | 12,593 | | | $ | 9,362 | | | $ | 10,971 | |
Less: IPH Escrow Funds Reported under Other Current Assets1 | | | (1,500 | ) | | | (1,500 | ) | | | -- | | | | (1,500 | ) |
| Investments | | $ | 9,471 | | | $ | 11,093 | | | $ | 9,362 | | | $ | 9,471 | |
1$I.5 million accessible within one year is classified and reported under other current assets. | | |
1$1.5 million accessible within one year is classified and reported under other current assets. | | 1$1.5 million accessible within one year is classified and reported under other current assets. | |
The Company’s marketable securities classified as available-for-sale are held for insurance purposes and are reflected at their fair values on December 31, 2012.2013. See further discussion below and under note 13.
Fair Value Measurements
The Company follows ASC Topic 820, Fair Value Measurements and Disclosures(ASC 820), for recurring fair value measurements. ASC 820 provides a single definition of fair value, requires enhanced disclosures about assets and liabilities measured at fair value and establishes a hierarchal framework for disclosing the observability of the inputs utilized in measuring assets and liabilities at fair value. The three levels defined by the hierarchy and examples of each level are as follows:
Level 1 – Quoted prices are available in active markets for identical assets or liabilities as of the reported date. The types of assets and liabilities included in Level 1 are highly liquid and actively traded instruments with quoted prices, such as equities listed by the New York Stock Exchange and commodity derivative contracts listed on the New York Mercantile Exchange.Exchange (NYMEX).
Level 2 – Pricing inputs are other than quoted prices in active markets, but are either directly or indirectly observable as of the reported date. The types of assets and liabilities included in Level 2 are typically either comparable to actively traded securities or contracts, such as treasury securities with pricing interpolated from recent trades of similar securities, or priced with models using highly observable inputs, such as commodity options priced using observable forward prices and volatilities.
Level 3 – Significant inputs to pricing have little or no observability as of the reporting date. The types of assets and liabilities included in Level 3 are those with inputs requiring significant management judgment or estimation and may include complex and subjective models and forecasts.
The following tables present, for each of the hierarchy levels, the Company’s assets and liabilities that are measured at fair value on a recurring basis as of December 31, 2013 and December 31, 2012:
December 31, 2013 (in thousands) | | Level 1 | | | Level 2 | | | Level 3 | |
| Assets: | | | | | | | | | |
| Current Assets – Other: | | | | | | | | | |
| Forward Energy Contracts | | $ | -- | | | $ | -- | | | $ | 338 | |
| Forward Gasoline Purchase Contracts | | | | | | | 62 | | | | | |
| Money Market and Mutual Funds - Nonqualified Retirement Savings Plan | | | 110 | | | | | | | | | |
| Investments: | | | | | | | | | | | | |
| Corporate Debt Securities – Held by Captive Insurance Company | | | | | | | 7,671 | | | | | |
| U.S. Government Debt Securities – Held by Captive Insurance Company | | | | | | | 1,271 | | | | | |
| Other Assets: | | | | | | | | | | | | |
| Money Market and Mutual Funds - Nonqualified Retirement Savings Plan | | | 866 | | | | | | | | | |
| Total Assets | | $ | 976 | | | $ | 9,004 | | | $ | 338 | |
| Liabilities: | | | | | | | | | | | | |
| Derivative Liabilities - Forward Energy Contracts | | $ | -- | | | $ | 103 | | | $ | 11,679 | |
| Total Liabilities | | $ | -- | | | $ | 103 | | | $ | 11,679 | |
December 31, 2012 (in thousands) | | Level 1 | | | Level 2 | | | Level 3 | |
| Assets: | | | | | | | | | |
| Current Assets – Other: | | | | | | | | | |
| Forward Energy Contracts | | $ | -- | | | $ | 292 | | | $ | 210 | |
| Forward Gasoline Purchase Contracts | | | | | | | 136 | | | | | |
| Money Market Fund - Escrow Account IPH Sale | | | 1,500 | | | | | | | | | |
| Money Market and Mutual Funds - Nonqualified Retirement Savings Plan | | | 110 | | | | | | | | | |
| Investments: | | | | | | | | | | | | |
| Corporate Debt Securities – Held by Captive Insurance Company | | | | | | | 7,620 | | | | | |
| U.S. Government Debt Securities – Held by Captive Insurance Company | | | | | | | 1,305 | | | | | |
| Other Assets: | | | | | | | | | | | | |
| Money Market and Mutual Funds - Nonqualified Retirement Savings Plan | | | 357 | | | | | | | | | |
| Equity Securities - Nonqualified Retirement Savings Plan | | | 125 | | | | | | | | | |
| Total Assets | | $ | 2,092 | | | $ | 9,353 | | | $ | 210 | |
| Liabilities: | | | | | | | | | | | | |
| Derivative Liabilities - Forward Energy Contracts | | $ | -- | | | $ | 242 | | | $ | 17,992 | |
| Total Liabilities | | $ | -- | | | $ | 242 | | | $ | 17,992 | |
The valuation techniques and inputs used for the Level 2 fair value measurements in the table above are as follows:
Forward Energy Contracts – Prices used for the fair valuation of these forward purchases and sales of electricity, which have illiquid trading points, are indexed to a price at an active market.
Forward Gasoline Purchase Contracts – These contracts are priced based on NYMEX quoted prices for Reformulated Blendstock for Oxygenate Blending (RBOB) Gasoline contracts. Prices used for the fair valuation of these contracts are based on NYMEX daily reporting date quoted prices for RBOB contracts with the same settlement periods.
Corporate and U.S. Government Debt Securities Held by the Company’s Captive Insurance Company – Fair values are determined on the basis of valuations provided by a third-party pricing service which utilizes industry accepted valuation models and observable market inputs to determine valuation. Some valuations or model inputs used by the pricing service may be based on broker quotes.
Fair values for OTP’s forward energy contracts with delivery points that are not at an active trading hub included in Level 3 of the fair value hierarchy in the table belowabove as of December 31, 2013 and December 31, 2012, are based on prices indexed to observable prices at an active trading hub. The range for Level 3 forward electric price inputs was $16ranged from $6.95 per megawatt-hour under the active trading hub price to $48$3.11 per megawatt-hour.megawatt-hour over the active trading hub price. The weighted average price was $35$34.00 per megawatt-hour. The level of deviation in
In the indexed prices of these contracts at their point of physical delivery from the observable prices for similar contracts at an active trading hub resulted in the contracts that were outstanding at both December 31, 2011 and December 31, 2012 being moved from Level 2 to Level 3table above, $117,000 of the fair value hierarchy in 2012.
The following table presents changes in Level 3 forward energy contract derivative asset and liability fair valuations forof the year ended December 31, 2012, the first year the Company’s forward energy contracts were classified as Level 3 in the fair value hierarchy:
| (in thousands) | | Year ended December 31, 2012 | |
| Forward Energy Contracts - Fair Values Beginning of Year | | $ | -- | |
| Transfers into Level 3 from Level 2 | | | (15,884 | ) |
| Less: Amounts Reversed on Settlement of Contracts Entered into in Prior Periods | | | 5,135 | |
| Changes in Fair Value of Contracts Entered into in Prior Periods | | | (4,001 | ) |
| Cumulative Fair Value Adjustments of Contracts Entered into in Prior Years at End of Period | | | (14,750 | ) |
| Net Losses Recognized as Regulatory Assets on contract entered into in 2012 | | | (3,032 | ) |
| Forward Energy Contracts - Net Derivative Liability Fair Values End of Year | | $ | (17,782 | ) |
All Level 3 forward energy contracts in a derivative asset position and $11,679,000 of the table belowfair value of the Level 3 forward energy contracts in a derivative liability position as of December 31, 2013 are related to power purchase contracts where OTP intends to take or has taken physical delivery of the energy under the contract. When OTP takes physical delivery of the energy purchased under these contracts the costs incurred will be recoveredare subject to recovery in base rates and through fuel clause adjustments. Any derivative assets or liabilities and related gains or losses recorded as a result of the fair valuation of these power purchase contracts will not be realized and are 100% offset by regulatory liabilities and assets related to fuel clause adjustment treatment of fuelpurchased power costs. Therefore, the net impact of any recorded fair valuation gains or losses related to these contracts on the Company’s consolidated net income is $0 and the net income impact of any future fair valuation adjustments of these contracts will be $0. When energy is delivered under these contracts, they will be settled at the original contract price and any fair valuation gains or losses and related derivative assets or liabilities recorded over the life of the contracts will be reversed along with any offsetting regulatory liabilities or assets. Because of regulatory accounting treatment, any price volatility related to the fair valuation of these contracts had no impact on the Company’s reported consolidated net income for 2012, 2011the years ended December 31, 2013 and 2012.
The remaining $221,000 of the fair value of the Level 3 forward energy contracts in a derivative asset position and $103,000 of the fair value of the Level 2 forward energy contracts in a derivative liability position as of December 31, 2013 are related to financial contracts that will not be settled by physical delivery of electricity but will be settled financially by the counterparty to the contract paying or 2010.receiving the difference between the contract price and the market price at the hour of scheduled delivery. Although the related forward energy purchase and sales contracts are 100% offsetting in terms of volumes and delivery periods, the purchase contracts and offsetting sales contracts do not have the same delivery points. Therefore, the net derivative gain related to these contracts of $118,000 as of December 31, 2013 is subject to change in subsequent reporting periods or on settlement. These contracts are scheduled for settlement in January and February of 2014. Any fluctuation in the factors used in the fair valuation of these contracts would not result in a significant change to the net fair value of the contracts.
The following table presents changes in Level 3 forward energy contract derivative asset and liability fair valuations for each of these hierarchy levels, the Company’s assetstwelve-month periods ended December 31, 2013 and liabilities that are measured at fair value on a recurring basis as of December 31:2012:
2012 (in thousands) | | Level 1 | | | Level 2 | | | Level 3 | |
| Assets: | | | | | | | | | |
| Current Assets – Other: | | | | | | | | | |
| Forward Energy Contracts | | $ | -- | | | $ | 292 | | | $ | 210 | |
| Forward Gasoline Purchase Contracts | | | | | | | 136 | | | | | |
| Money Market Fund - Escrow Account IPH Sale | | | 1,500 | | | | | | | | | |
| Money Market and Mutual Funds - Nonqualified Retirement Savings Plan | | | 110 | | | | | | | | | |
| Investments: | | | | | | | | | | | | |
| Corporate Debt Securities – Held by Captive Insurance Company | | | | | | | 7,620 | | | | | |
| U.S. Government Debt Securities – Held by Captive Insurance Company | | | | | | | 1,305 | | | | | |
| Other Assets: | | | | | | | | | | | | |
| Money Market and Mutual Funds - Nonqualified Retirement Savings Plan | | | 357 | | | | | | | | | |
| Equity Securities - Nonqualified Retirement Savings Plan | | | 125 | | | | | | | | | |
| Total Assets | | $ | 2,092 | | | $ | 9,353 | | | $ | 210 | |
| Liabilities: | | | | | | | | | | | | |
| Derivative Liabilities - Forward Energy Contracts | | $ | -- | | | $ | 242 | | | $ | 17,992 | |
| Total Liabilities | | $ | -- | | | $ | 242 | | | $ | 17,992 | |
| In 2012, the Company’s investments in forward gasoline contracts and U.S. government debt securities were moved to level 2 of the fair value hierarchy. | |
2011 (in thousands) | | Level 1 | | | Level 2 | | Level 3 |
| Assets: | | | | | | | |
| Current Assets – Other: | | | | | | | |
| Forward Energy Contracts | | $ | -- | | | $ | 3,803 | | |
| Forward Gasoline Purchase Contracts | | | 9 | | | | | | |
| Money Market Fund - Escrow Account IPH Sale | | | 1,500 | | | | | | |
| Money Market and Mutual Funds - Nonqualified Retirement Savings Plan | | | 110 | | | | | | |
| Investments: | | | | | | | | | |
| Corporate Debt Securities – Held by Captive Insurance Company | | | | | | | 8,083 | | |
| U.S. Government Debt Securities – Held by Captive Insurance Company | | | 707 | | | | | | |
| Money Market Fund - Escrow Account IPH Sale | | | 1,501 | | | | | | |
| Other Assets: | | | | | | | | | |
| Money Market and Mutual Funds - Nonqualified Retirement Savings Plan | | | 254 | | | | | | |
| Total Assets | | $ | 4,081 | | | $ | 11,886 | | |
| Liabilities: | | | | | | | | | |
| Derivative Liabilities - Forward Energy Contracts | | $ | -- | | | $ | 18,770 | | |
| Total Liabilities | | $ | -- | | | $ | 18,770 | | |
| (in thousands) | | 2013 | | | 2012 | |
| Forward Energy Contracts - Fair Values Beginning of Period | | $ | (17,782 | ) | | $ | -- | |
| Transfers into Level 3 from Level 2 | | | -- | | | | (15,884 | ) |
| Less: Amounts Reversed on Settlement of Contracts Entered into in Prior Periods | | | 7,943 | | | | 5,135 | |
| Changes in Fair Value of Contracts Entered into in Prior Periods | | | (640 | ) | | | (4,001 | ) |
| Cumulative Fair Value Adjustments of Contracts Entered into in Prior Years at End of Period | | | (10,479 | ) | | | (14,750 | ) |
| Net Decrease in Value of Open Contracts Entered into in Current Period | | | (862 | ) | | | (3,032 | ) |
| Forward Energy Contracts - Net Derivative Liability Fair Values End of Period | | $ | (11,341 | ) | | $ | (17,782 | ) |
Inventories
The Electric segment inventories are reported at average cost. All other segments’ inventories are stated at the lower of cost (first-in, first-out) or market. Inventories consist of the following:
| | | December 31, | | | December 31, | | | December 31, | | | December 31, | |
| (in thousands) | | 2012 | | | 2011 | | | 2013 | | | 2012 | |
| Finished Goods | | $ | 21,893 | | | $ | 18,478 | | | $ | 20,649 | | | $ | 21,893 | |
| Work in Process | | | 8,800 | | | | 10,470 | | | | 9,942 | | | | 8,800 | |
| Raw Material, Fuel and Supplies | | | 38,643 | | | | 39,795 | | | | 42,090 | | | | 38,643 | |
| Total Inventories | | $ | 69,336 | | | $ | 68,743 | | | $ | 72,681 | | | $ | 69,336 | |
Goodwill and Other Intangible Assets
The Company accounts for goodwill and other intangible assets in accordance with the requirements of ASC Topic 350, Intangibles—Goodwill and Other, measuring its goodwill and indefinite-lived intangible assets for impairment annually in the fourth quarter, and more often when events indicate the assets may be impaired. Intangible assetsThe Company does qualitative assessments of its reporting units with finite lives are amortized over their estimated useful lives and reviewed for impairment in accordancerecorded goodwill to determine if it is more likely than not that the fair value of the reporting unit exceeds its book value. The Company also does quantitative assessments of its reporting units with requirements under ASC 360-10-35, Property, Plant, and Equipment—Overall—Subsequent Measurement.recorded goodwill to determine the fair value of the reporting unit.
In the fourth quarter of 2012 the Company sold Moorhead Electric, Inc. (MEI), a subsidiary company that provided electrical contracting services. In connection with this sale, the Company disposed of $147,000 in goodwill associated with the purchase of MEI in 1992.
The following tables summarize changes to goodwill by business segment during 20122013 and 2011:2012:
(in thousands) | | Gross Balance December 31, 2011 | | | Accumulated Impairments | | | Balance (net of impairments) December 31, 2011 | | | Adjustments to Goodwill in 2012 | | | Balance (net of impairments) December 31, 2012 | | | Gross Balance
December 31,
2012 | | | Accumulated
Impairments | | | Balance (net of
impairments) December 31, 2012 | | | Adjustments
to Goodwill
in 2013 | | | Balance (net of
impairments) December 31, 2013 | |
| Electric | | $ | 240 | | | $ | (240 | ) | | $ | -- | | | $ | -- | | | $ | -- | | |
| Manufacturing | | | 24,445 | | | | (12,259 | ) | | | 12,186 | | | | -- | | | | 12,186 | | | $ | 12,186 | | | $ | -- | | | $ | 12,186 | | | $ | -- | | | $ | 12,186 | |
| Construction | | | 7,630 | | | | -- | | | | 7,630 | | | | (147 | ) | | | 7,483 | | | | 7,483 | | | | -- | | | | 7,483 | | | | -- | | | | 7,483 | |
| Plastics | | | 19,302 | | | | -- | | | | 19,302 | | | | -- | | | | 19,302 | | | | 19,302 | | | | -- | | | | 19,302 | | | | -- | | | | 19,302 | |
| Total | | $ | 51,617 | | | $ | (12,499 | ) | | $ | 39,118 | | | $ | (147 | ) | | $ | 38,971 | | | $ | 38,971 | | | $ | -- | | | $ | 38,971 | | | $ | -- | | | $ | 38,971 | |
(in thousands) | | Gross Balance December 31,
2011 | | | Accumulated
Impairments | | | Balance (net of
impairments)
December 31,
2011 | | | Adjustments
to Goodwill
in 2012 | | | Balance (net of
impairments)
December 31, 2012 | |
| Electric | | $ | 240 | | | $ | (240 | ) | | $ | -- | | | $ | -- | | | $ | -- | |
| Manufacturing | | | 24,445 | | | | (12,259 | ) | | | 12,186 | | | | -- | | | | 12,186 | |
| Construction | | | 7,630 | | | | -- | | | | 7,630 | | | | (147 | ) | | | 7,483 | |
| Plastics | | | 19,302 | | | | -- | | | | 19,302 | | | | -- | | | | 19,302 | |
| Total | | $ | 51,617 | | | $ | (12,499 | ) | | $ | 39,118 | | | $ | (147 | ) | | $ | 38,971 | |
(in thousands) | | Gross Balance December 31, 2010 | | | Accumulated Impairments | | | Balance (net of impairments) December 31, 2010 | | | Adjustments to Goodwill in 2011 | | | Balance (net of impairments) December 31, 2011 | |
| Electric | | $ | 240 | | | $ | (240 | ) | | $ | -- | | | $ | -- | | | $ | -- | |
| Manufacturing | | | 24,445 | | | | (12,259 | ) | | | 12,186 | | | | -- | | | | 12,186 | |
| Construction | | | 7,630 | | | | -- | | | | 7,630 | | | | -- | | | | 7,630 | |
| Plastics | | | 19,302 | | | | -- | | | | 19,302 | | | | -- | | | | 19,302 | |
| Total | | $ | 51,617 | | | $ | (12,499 | ) | | $ | 39,118 | | | $ | -- | | | $ | 39,118 | |
Other Intangible Assets
assets with finite lives are amortized over their estimated useful lives and reviewed for impairment in accordance with requirements under ASC 360-10-35, Property, Plant, and Equipment—Overall—Subsequent Measurement. The following table summarizes the components of the Company’s intangible assets at December 31:
2013 (in thousands) | | | Gross Carrying Amount | | | Accumulated Amortization | | | Net Carrying Amount | | Amortization Periods |
| Amortizable Intangible Assets: | | | | | | | | | | | |
| Customer Relationships | | | $ | 16,811 | | | $ | 4,935 | | | $ | 11,876 | | 15 – 25 years |
| Other Intangible Assets Including Contracts | | | | 825 | | | | 473 | | | | 352 | | 5 – 30 years |
| Total | | | $ | 17,636 | | | $ | 5,408 | | | $ | 12,228 | | |
| Indefinite-Lived Intangible Assets: | | | | | | | | | | | | | | |
| Trade Name | | | $ | 1,100 | | | | -- | | | $ | 1,100 | | |
| | | | | | | | | | | | | | | |
2012 (in thousands) | | Gross Carrying Amount | | | Accumulated Amortization | | | Net Carrying Amount | | Amortization Periods | | | | | | | | | | | | | |
| Amortizable Intangible Assets: | | | | | | | | | | | | | | | | | | | | | | | |
| Customer Relationships | | $ | 16,811 | | | $ | 4,085 | | | $ | 12,726 | | 15 – 25 years | | $ | 16,811 | | | $ | 4,085 | | | $ | 12,726 | | 15 – 25 years |
| Other Intangible Assets Including Contracts | | | 1,092 | | | | 613 | | | | 479 | | 5 – 30 years | | | 1,092 | | | | 613 | | | | 479 | | 5 – 30 years |
| Total | | $ | 17,903 | | | $ | 4,698 | | | $ | 13,205 | | | | $ | 17,903 | | | $ | 4,698 | | | $ | 13,205 | | |
| Indefinite-Lived Intangible Assets: | | | | | | | | | | | | | | | | | | | | | | | | | | |
| Trade Name | | $ | 1,100 | | | | -- | | | $ | 1,100 | | | | $ | 1,100 | | | | -- | | | $ | 1,100 | | |
| | | | | | | | | | | | | | | |
2011 (in thousands) | | | | | | | | | | | | | | |
| Amortizable Intangible Assets: | | | | | | | | | | | | | | |
| Customer Relationships | | $ | 16,811 | | | $ | 3,236 | | | $ | 13,575 | | 15 – 25 years | |
| Covenants Not to Compete | | | 713 | | | | 709 | | | | 4 | | 3 – 5 years | |
| Other Intangible Assets Including Contracts | | | 1,092 | | | | 485 | | | | 607 | | 5 – 30 years | |
| Total | | $ | 18,616 | | | $ | 4,430 | | | $ | 14,186 | | | |
| Indefinite-Lived Intangible Assets: | | | | | | | | | | | | | | |
| Trade Name | | $ | 1,100 | | | | -- | | | $ | 1,100 | | | |
The amortization expense for these intangible assets was:
| (in thousands) | | 2012 | | | 2011 | | | 2010 | | | 2013 | | | 2012 | | | 2011 | |
| Amortization Expense – Intangible Assets | | $ | 981 | | | $ | 956 | | | $ | 895 | | | $ | 977 | | | $ | 981 | | | $ | 956 | |
The estimated annual amortization expense for these intangible assets for the next five years is:
| (in thousands) | | 2013 | | | 2014 | | | 2015 | | | 2016 | | | 2017 | | | 2014 | | | 2015 | | | 2016 | | | 2017 | | | 2018 | |
| Estimated Amortization Expense – Intangible Assets | | $ | 977 | | | $ | 977 | | | $ | 977 | | | $ | 945 | | | $ | 849 | | | $ | 977 | | | $ | 977 | | | $ | 945 | | | $ | 849 | | | $ | 849 | |
Supplemental Disclosures of Cash Flow Information
| | | | |
| | | As of December 31, | |
| (in thousands) | | 2013 | | | 2012 | |
| Noncash Investing Activities: | | | | | | |
Accounts Payable Outstanding Related to Capital Additions1 | | $ | 22,951 | | | $ | 9,967 | |
Accounts Receivable Outstanding Related to Joint Plant Owner’s Share of Capital Additions2 | | $ | 3,264 | | | $ | -- | |
1Amounts are included in cash used for capital expenditures in subsequent periods when payables are settled. 2Amounts are deducted from cash used for capital expenditures in subsequent periods when cash is received. | |
| | | As of December, 31 | |
| (in thousands) | | 2012 | | | 2011 | |
| Noncash Investing Activities: | | | | | | |
Accounts Payable Outstanding Related to Capital Additions1 | | $ | 9,967 | | | $ | 20,521 | |
1Amounts are included in cash used for capital expenditures in subsequent periods when payables are settled. | |
| | | | | | | | | | |
| (in thousands) | | 2013 | | | 2012 | | | 2011 | |
| Cash Paid (Received) During the Year for: | | | | | | | | | |
| Interest (net of amount capitalized) | | $ | 26,789 | | | $ | 30,741 | | | $ | 34,434 | |
| Income Tax Refunds | | $ | (453 | ) | | $ | (353 | ) | | $ | (257 | ) |
| (in thousands) | | 2012 | | | 2011 | | | 2010 | |
| Cash Paid During the Year for: | | | | | | | | | |
| Interest (net of amount capitalized) | | $ | 30,741 | | | $ | 34,434 | | | $ | 33,094 | |
| Income Tax Refunds | | $ | (353 | ) | | $ | (257 | ) | | $ | (54,346 | ) |
Reclassifications and Changes to Presentation
The Company’s consolidated balance sheet as of December 31, 2011 and consolidated income statement and consolidated statement of cash flows for the years ended December 31, 2011 and 2010 reflect the reclassifications of the assets and liabilities, operating results and cash flows of DMI and ShoreMaster to discontinued operations as a result of the sale of DMI’s fixed assets in 2012 and the sale of ShoreMaster on February 8, 2013. As of December 31, 2012 the Company met the criteria of assets held for sale under ASC 360-10-45 for the ShoreMaster transaction and appropriately classified the assets as held for sale on December 31, 2012. Accordingly, ShoreMaster’s activities were required to be reported in discontinued operations as required under ASC 205-20-45. The reclassifications had no impact on the Company’s total consolidated assets, consolidated net income or cash flows as of and for the years ended December 31, 2011 and 2010.
In 2011 management reported Minnesota Conservation Improvement Program (MNCIP) incentives in Operating Revenues – Electric rather than Other Income as they had been classified in 2010. The Company has corrected this classification resulting in the following increase in Operating Revenues and Operating Income and decrease in Other Income:
| (in thousands) | | 2010 | |
| MNCIP Incentives reclassified from Other Income to Operating Revenue | | $ | 4,066 | |
The correction had no impact on the Company’s net income, total assets, or operating cash flows for the year ended December 31, 2010.
New Accounting Standards
Accounting Standards Update (ASU) 2011-11 and 2013-01
In December 2011, the FASB issued ASU 2011-11, Balance Sheet (Topic 210): Disclosures about Offsetting Assets and Liabilities (ASU 2011-11), which requires disclosures regarding netting arrangements in agreements underlying derivatives, certain financial instruments and related collateral amounts, and the extent to which an entity’s financial statement presentation policies related to netting arrangements impact amounts recorded to the financial statements. In January 2013, the FASB issued ASU 2013-01, Balance Sheet (Topic 210): Clarifying the Scope of Disclosures about Offsetting Assets and Liabilities (ASU 2013-01), to clarify which instruments and transactions are subject to the offsetting disclosure requirements established by ASU 2011-11. The amendments in ASU 2013-01 apply to derivatives accounted for in accordance with ASC 815 and clarify that only derivatives accounted for in accordance with ASC 815 are within the scope of the disclosure requirements. These disclosure requirements do not affect the presentation of amounts in the consolidated balance sheets. ASU 2013-01 is effective for fiscal years beginning on or after January 1, 2013, and interim periods within those annual periods.
The Company implemented the disclosure guidance January 1, 2013. While certain of the Company’s offsetting derivative asset and liability positions related to forward energy contracts with the same counterparty are subject to legally enforceable netting arrangements, the Company does not present its derivative assets and liabilities subject to legally enforceable netting arrangements, or any related payables or receivables, on a net basis on the face of its consolidated balance sheet. The Company has added disclosures and a table in note 5 to the consolidated financial statements indicating the amounts of its derivative forward energy contracts presented at fair value in accordance with ASC 815 that are subject to legally enforceable netting arrangements.
ASU 2013-02
In February 2013, the FASB issued ASU 2013-02, “ComprehensiveComprehensive Income (Topic 220): Reporting of Amounts Reclassified out of Accumulated Other Comprehensive Income”, which requires entities to provide information about the amounts reclassified out of accumulated other comprehensive income by component. In addition, entities are required to present, either on the face of the statement where net income is presented or in the notes, significant amounts reclassified out of accumulated other comprehensive income by the respective line items of net income but only if the amount reclassified is required under U.S. GAAPaccounting principles generally accepted in the United States of America (U.S. GAAP) to be reclassified to net income in its entirety in the same reporting period. For other amounts that are not required under U.S. GAAP to be reclassified in their entirety to net income, entities are required to cross-reference to other disclosures required under U.S. GAAP that provide additional detail on these amounts. This ASU is effective prospectively for reporting periods beginning after December 15, 2012. Additional information required by this update is included on the face of the Company’s consolidated statement of comprehensive income for the period ending December 31, 2013. The Company is currently evaluatingamounts of accumulated other comprehensive losses associated with the impact of adopting this guidance.Company’s pension and other post-retirement benefit programs that are being amortized and recognized as operating expenses and the income statement line item affected by the expense are disclosed in note 12 to the consolidated financial statements.
2. Business Combinations, Dispositions and Segment Information
The Company acquired no new businesses in 2013, 2012 2011 or 2010 and disposed of no businesses in 2010.2011.
In 2012 and 2011, in execution of the Company’s announced strategy of realigning its business portfolio to reduce its risk profile and dedicate a greater portion of its resources toward electric utility operations, the Company sold or was in the process of selling several of its holdings. On December 31,holdings in 2013, 2012 the Company was in negotiations to sell the assets of ShoreMaster, its waterfront equipment manufacturer, which was included in its Manufacturing segment. ShoreMaster’s assets met the criteria to be classified as held for sale and reported in discontinued operations on December 31, 2012.2011. The sale of substantially all of ShoreMaster’sShrco’s assets closed on February 8, 2013. On November 30, 2012 the Company completed the sale of the fixed assets of DMI, its wind tower manufacturing company,IMD, eliminating its Wind Energy segment. On February 29, 2012 the Company completed the sale of DMS Health Technologies, Inc. (DMS), its health services company, eliminating its Health Services segment. On January 18, 2012 the Company sold the assets of Aviva Sports, Inc. (Aviva), a wholly owned subsidiary of ShoreMasterShrco that sold various recreational products. In 2011, the Company sold IPH,Idaho Pacific Holdings, Inc. (IPH), its food ingredient processing business, eliminating its Food Ingredient Processing segment, and E.W. Wylie (Wylie), its trucking company, which was included in its Wind Energy segment.
The results of operations of ShoreMasterShrco including Aviva, DMI,IMD, DMS, Wylie and IPH are reported as discontinued operations in the Company’s consolidated financial statements as of and for the years ended December 31, 2013, 2012 2011 and 2010,2011, and are summarized in note 17 to consolidated financial statements.
Segment Information
The accounting policies of the segments are described under note 1 – Summary of Significant Accounting Policies. As a result of the 2011, 2012 and 2013 dispositions, theThe Company’s business structure nowcurrently includes the following four segments: Electric, Manufacturing, ConstructionPlastics and Plastics.Construction. The chart below indicates the companies included in each segment.
Electric includes the production, transmission, distribution and sale of electric energy in Minnesota, North Dakota and South Dakota by OTP. In addition, OTP is an active wholesale participant in the MidwestMidcontinent Independent Transmission System Operator, Inc. (MISO) markets. OTP’s operations have been the Company’s primary business since 1907. Additionally, the electric segment includes OTESCO, which providesprovided technical and engineering services.services through December 31, 2012. OTESCO ceased operations and did not record any operating revenues, expenses or net income in 2013.
Manufacturing consists of businesses in the following manufacturing activities: contract machining, metal parts stamping and fabrication, and production of material and handling trays and horticultural containers. These businesses have manufacturing facilities in Illinois and Minnesota and sell products primarily in the United States.
Plastics consists of businesses producing polyvinyl chloride (PVC) pipe at plants in North Dakota and Arizona. The PVC pipe is sold primarily in the upper Midwest and Southwest regions of the United States.
Construction consists of businesses involved in commercial and industrial electric contracting and construction of fiber optic, and electric distribution, systems, water, wastewater and HVAC systems primarily in the central United States.
Plastics consists of businesses producing polyvinyl chloride (PVC) pipe in the upper Midwest and Southwest regions of the United States.
OTP and OTESCO areis a wholly owned subsidiariessubsidiary of the Company. All of the Company’s other businesses are owned by its wholly owned subsidiary, Varistar Corporation (Varistar).
The Company’s corporate operating costs include items such as corporate staff and overhead costs, the results of the Company’s captive insurance company and other items excluded from the measurement of operating segment performance. Corporate assets consist primarily of cash, prepaid expenses, investments and fixed assets. Corporate is not an operating segment. Rather, it is added to operating segment totals to reconcile to totals on the Company’s consolidated financial statements.
No single customer accounted for over 10% of the Company’s consolidated revenues in 2013, 2012 2011 or 2010.2011. All of the Company’s long-lived assets are within the United States.
| | Percent of Sales Revenue by Country for the Year Ended December 31: | | 2012 | | 2011 | | 2010 | |
| | United States of America | | 97.7% | | 98.1% | | 99.0% | |
| | Canada | | 1.1% | | 1.4% | | 0.8% | |
| | All Other Countries | | 1.2% | | 0.5% | | 0.2% | |
| | | | | | | | | | | |
| Percent of Sales Revenue by Country for the Year Ended December 31: | | 2013 | | 2012 | | 2011 | |
| United States of America | | | 97.6 | % | | | 97.7 | % | | | 98.1 | % | |
| Mexico | | | 1.4 | % | | | 1.0 | % | | | 0.4 | % | |
| Canada | | | 0.9 | % | | | 1.1 | % | | | 1.4 | % | |
| All Other Countries (none greater than 0.04%) | | | 0.1 | % | | | 0.2 | % | | | 0.1 | % | |
The Company evaluates the performance of its business segments and allocates resources to them based on earnings contribution and return on total invested capital. Substantially all the revenues reported below by segment are from sales to external customers, except for immaterial amounts reported in intersegment eliminations, which are insignificant in total and by segment. Information on continuing operations for the business segments for 2013, 2012 2011 and 2010, which now excludes Wind Energy due to the sale of DMI and its inclusion in discontinued operations, and includes restated amounts for the Manufacturing segment due to the sale of ShoreMaster and its inclusion in discontinued operations,2011 is presented in the following table:
| | | | | | | | | | |
| (in thousands) | | 2013 | | | 2012 | | | 2011 | |
| Operating Revenue | | | | | | | | | |
| Electric | | $ | 373,540 | | | $ | 350,765 | | | $ | 342,727 | |
| Manufacturing | | | 204,997 | | | | 208,965 | | | | 189,459 | |
| Plastics | | | 164,957 | | | | 150,517 | | | | 123,669 | |
| Construction | | | 149,910 | | | | 149,092 | | | | 184,657 | |
| Intersegment Eliminations | | | (91 | ) | | | (100 | ) | | | (343 | ) |
| Total | | $ | 893,313 | | | $ | 859,239 | | | $ | 840,169 | |
| Cost of Products Sold and Cost of Construction Revenues Earned | | | | | | | | | | | | |
| Manufacturing | | $ | 154,235 | | | $ | 157,437 | | | $ | 144,987 | |
| Plastics | | | 129,042 | | | | 112,662 | | | | 103,131 | |
| Construction | | | 133,430 | | | | 147,107 | | | | 173,654 | |
| Intersegment Eliminations | | | (20 | ) | | | (68 | ) | | | (122 | ) |
| Total | | $ | 416,687 | | | $ | 417,138 | | | $ | 421,650 | |
| Other Nonelectric Expenses | | | | | | | | | | | | |
| Manufacturing | | $ | 18,820 | | | $ | 18,233 | | | $ | 16,524 | |
| Plastics | | | 8,571 | | | | 8,784 | | | | 6,210 | |
| Construction | | | 11,855 | | | | 12,353 | | | | 11,886 | |
| Corporate | | | 12,755 | | | | 13,283 | | | | 14,897 | |
| Intersegment Eliminations | | | (71 | ) | | | (32 | ) | | | (221 | ) |
| Total | | $ | 51,930 | | | $ | 52,621 | | | $ | 49,296 | |
| Depreciation and Amortization | | | | | | | | | | | | |
| Electric | | $ | 43,125 | | | $ | 42,051 | | | $ | 40,283 | |
| Manufacturing | | | 11,194 | | | | 12,208 | | | | 12,116 | |
| Plastics | | | 3,350 | | | | 3,118 | | | | 3,377 | |
| Construction | | | 2,009 | | | | 1,906 | | | | 2,009 | |
| Corporate | | | 207 | | | | 481 | | | | 550 | |
| Total | | $ | 59,885 | | | $ | 59,764 | | | $ | 58,335 | |
| Operating Income (Loss) | | | | | | | | | | | | |
| Electric | | $ | 62,455 | | | $ | 61,025 | | | $ | 63,453 | |
| Manufacturing | | | 20,748 | | | | 21,087 | | | | 15,832 | |
| Plastics | | | 23,994 | | | | 25,953 | | | | 10,951 | |
| Construction | | | 2,616 | | | | (12,274 | ) | | | (2,892 | ) |
| Corporate | | | (12,962 | ) | | | (13,764 | ) | | | (15,447 | ) |
| Total | | $ | 96,851 | | | $ | 82,027 | | | $ | 71,897 | |
| Interest Charges | | | | | | | | | | | | |
| Electric | | $ | 17,461 | | | $ | 19,049 | | | $ | 19,643 | |
| Manufacturing | | | 3,255 | | | | 3,557 | | | | 3,727 | |
| Plastics | | | 1,001 | | | | 2,519 | | | | 1,525 | |
| Construction | | | 456 | | | | 1,039 | | | | 947 | |
| Corporate and Intersegment Eliminations | | | 4,805 | | | | 5,741 | | | | 9,787 | |
| Total | | $ | 26,978 | | | $ | 31,905 | | | $ | 35,629 | |
| (in thousands) | | 2012 | | | 2011 | | | 2010 | |
| Operating Revenue | | | | | | | | | |
| Electric | | $ | 350,765 | | | $ | 342,727 | | | $ | 344,379 | |
| Manufacturing | | | 208,965 | | | | 189,459 | | | | 143,072 | |
| Construction | | | 149,092 | | | | 184,657 | | | | 134,222 | |
| Plastics | | | 150,517 | | | | 123,669 | | | | 96,945 | |
| Intersegment Eliminations | | | (100 | ) | | | (343 | ) | | | (721 | ) |
| Total | | $ | 859,239 | | | $ | 840,169 | | | $ | 717,897 | |
| Depreciation and Amortization | | | | | | | | | | | | |
| Electric | | $ | 42,051 | | | $ | 40,283 | | | $ | 40,241 | |
| Manufacturing | | | 12,208 | | | | 12,116 | | | | 11,430 | |
| Construction | | | 1,906 | | | | 2,009 | | | | 2,023 | |
| Plastics | | | 3,118 | | | | 3,377 | | | | 3,430 | |
| Corporate | | | 481 | | | | 550 | | | | 523 | |
| Total | | $ | 59,764 | | | $ | 58,335 | | | $ | 57,647 | |
| Interest Charges | | | | | | | | | | | | |
| Electric | | $ | 19,049 | | | $ | 19,643 | | | $ | 20,949 | |
| Manufacturing | | | 3,557 | | | | 3,727 | | | | 3,625 | |
| Construction | | | 1,039 | | | | 947 | | | | 671 | |
| Plastics | | | 2,519 | | | | 1,525 | | | | 1,560 | |
| Corporate and Intersegment Eliminations | | | 5,741 | | | | 9,787 | | | | 10,043 | |
| Total | | $ | 31,905 | | | $ | 35,629 | | | $ | 36,848 | |
| Income (Loss) Before Income Taxes | | | | | | | | | | | | |
| Electric | | $ | 44,203 | | | $ | 45,569 | | | $ | 44,505 | |
| Manufacturing | | | 17,630 | | | | 12,191 | | | | 7,548 | |
| Construction | | | (13,145 | ) | | | (3,688 | ) | | | (1,115 | ) |
| Plastics | | | 23,506 | | | | 9,464 | | | | 4,007 | |
| Corporate | | | (31,093 | ) | | | (24,505 | ) | | | (25,434 | ) |
| Total | | $ | 41,101 | | | $ | 39,031 | | | $ | 29,511 | |
| Earnings (Loss) Available for Common Shares | | | | | | | | | | | | |
| Electric | | $ | 38,341 | | | $ | 38,886 | | | $ | 34,557 | |
| Manufacturing | | | 10,676 | | | | 8,229 | | | | 5,115 | |
| Construction | | | (7,689 | ) | | | (2,204 | ) | | | (646 | ) |
| Plastics | | | 14,113 | | | | 5,811 | | | | 2,515 | |
| Corporate | | | (17,209 | ) | | | (16,548 | ) | | | (15,996 | ) |
| Discontinued Operations | | | (44,241 | ) | | | (48,475 | ) | | | (27,722 | ) |
| Total | | $ | (6,009 | ) | | $ | (14,301 | ) | | $ | (2,177 | ) |
| Capital Expenditures | | | | | | | | | | | | |
| Electric | | $ | 101,919 | | | $ | 49,707 | | | $ | 43,121 | |
| Manufacturing | | | 9,311 | | | | 10,546 | | | | 6,159 | |
| Construction | | | 1,576 | | | | 2,645 | | | | 5,490 | |
| Plastics | | | 2,819 | | | | 2,414 | | | | 2,671 | |
| Corporate | | | 137 | | | | 2,048 | | | | 823 | |
| Total | | $ | 115,762 | | | $ | 67,360 | | | $ | 58,264 | |
| Identifiable Assets | | | | | | | | | | | | |
| Electric | | $ | 1,226,145 | | | $ | 1,170,449 | | | $ | 1,106,261 | |
| Manufacturing | | | 114,933 | | | | 124,872 | | | | 112,295 | |
| Construction | | | 50,696 | | | | 69,453 | | | | 60,978 | |
| Plastics | | | 78,855 | | | | 72,200 | | | | 73,508 | |
| Corporate | | | 112,616 | | | | 53,619 | | | | 43,102 | |
| Assets of Discontinued Operations | | | 19,092 | | | | 209,929 | | | | 374,411 | |
| Total | | $ | 1,602,337 | | | $ | 1,700,522 | | | $ | 1,770,555 | |
| | |
Revised Segments Information by Quarter (not audited)
The following table provides revised segment information based on the Company’s continuing operations as of December 31, 2012, similar to the tabular information provided in note 2 to financial statements in the Company’s quarterly reports on Form 10-Q.
| Three Months Ended | | March 31 | | | June 30 | | | September 30 | | | December 31 | |
| (in thousands) | | 2012 | | | 2011 | | | 2012 | | | 2011 | | | 2012 | | | 2011 | | | 2012 | | | 2011 | |
| Operating Revenue | | | | | | | | | | | | | | | | | | | | | | | | |
| Electric | | $ | 90,003 | | | $ | 91,596 | | | $ | 78,963 | | | $ | 78,031 | | | $ | 88,564 | | | $ | 85,172 | | | $ | 93,235 | | | $ | 87,928 | |
| Manufacturing | | | 59,434 | | | | 46,953 | | | | 53,039 | | | | 45,178 | | | | 46,618 | | | | 47,323 | | | | 49,874 | | | | 50,005 | |
| Construction | | | 35,617 | | | | 37,515 | | | | 37,934 | | | | 49,133 | | | | 37,931 | | | | 53,247 | | | | 37,610 | | | | 44,762 | |
| Plastics | | | 34,875 | | | | 18,478 | | | | 41,490 | | | | 44,373 | | | | 42,217 | | | | 36,231 | | | | 31,935 | | | | 24,587 | |
| Corporate and Intersegment Eliminations | | | (39 | ) | | | (261 | ) | | | (25 | ) | | | (38 | ) | | | (14 | ) | | | (27 | ) | | | (22 | ) | | | (17 | ) |
| Total | | $ | 219,890 | | | $ | 194,281 | | | $ | 211,401 | | | $ | 216,677 | | | $ | 215,316 | | | $ | 221,946 | | | $ | 212,632 | | | $ | 207,265 | |
| | | | | | | | | | | | | | | | | | | | | | | | | | | | | | | | | |
| Interest Charges | | | | | | | | | | | | | | | | | | | | | | | | | | | | | | | | |
| Electric | | $ | 4,851 | | | $ | 5,088 | | | $ | 4,762 | | | $ | 4,990 | | | $ | 4,880 | | | $ | 4,796 | | | $ | 4,556 | | | $ | 4,769 | |
| Manufacturing | | | 915 | | | | 903 | | | | 917 | | | | 941 | | | | 891 | | | | 952 | | | | 834 | | | | 931 | |
| Construction | | | 253 | | | | 220 | | | | 310 | | | | 227 | | | | 305 | | | | 251 | | | | 171 | | | | 249 | |
| Plastics | | | 346 | | | | 363 | | | | 346 | | | | 402 | | | | 342 | | | | 411 | | | | 1,485 | | | | 349 | |
| Corporate and Intersegment Eliminations | | | 2,229 | | | | 2,769 | | | | 2,137 | | | | 2,558 | | | | 1,486 | | | | 2,268 | | | | (111 | ) | | | 2,192 | |
| Total | | $ | 8,594 | | | $ | 9,343 | | | $ | 8,472 | | | $ | 9,118 | | | $ | 7,904 | | | $ | 8,678 | | | $ | 6,935 | | | $ | 8,490 | |
| | | | | | | | | | | | | | | | | | | | | | | | | | | | | | | | | |
| Income Tax Expense (Benefit) | | | | | | | | | | | | | | | | | | | | | | | | | | | | | | | | |
| Electric | | $ | 1,622 | | | $ | 2,600 | | | $ | (800 | ) | | $ | 8 | | | $ | 2,995 | | | $ | 3,364 | | | $ | 2,045 | | | $ | 711 | |
| Manufacturing | | | 2,324 | | | | 1,579 | | | | 1,674 | | | | 1,215 | | | | 1,288 | | | | 938 | | | | 1,668 | | | | 230 | |
| Construction | | | (2,776 | ) | | | (210 | ) | | | (1,164 | ) | | | 130 | | | | (879 | ) | | | (115 | ) | | | (637 | ) | | | (1,289 | ) |
| Plastics | | | 2,175 | | | | (241 | ) | | | 2,722 | | | | 2,144 | | | | 2,216 | | | | 1,295 | | | | 2,280 | | | | 455 | |
| Corporate | | | (2,877 | ) | | | (1,902 | ) | | | (1,915 | ) | | | (2,617 | ) | | | (6,405 | ) | | | (3,373 | ) | | | (3,423 | ) | | | (801 | ) |
| Total | | $ | 468 | | | $ | 1,826 | | | $ | 517 | | | $ | 880 | | | $ | (785 | ) | | $ | 2,109 | | | $ | 1,933 | | | $ | (694 | ) |
| | | | | | | | | | | | | | | | | | | | | | | | | | | | | | | | | |
| Earnings (Loss) Available for Common Shares | | | | | | | | | | | | | | | | | | | | | | | | | | | | | |
| Electric | | $ | 11,016 | | | $ | 11,142 | | | $ | 5,191 | | | $ | 7,386 | | | $ | 10,206 | | | $ | 10,900 | | | $ | 11,928 | | | $ | 9,458 | |
| Manufacturing | | | 3,465 | | | | 2,356 | | | | 2,501 | | | | 2,179 | | | | 1,914 | | | | 1,571 | | | | 2,796 | | | | 2,123 | |
| Construction | | | (4,171 | ) | | | (325 | ) | | | (1,756 | ) | | | 184 | | | | (1,325 | ) | | | (179 | ) | | | (437 | ) | | | (1,884 | ) |
| Plastics | | | 3,253 | | | | (374 | ) | | | 4,067 | | | | 3,312 | | | | 3,309 | | | | 1,970 | | | | 3,484 | | | | 903 | |
| Corporate | | | (3,572 | ) | | | (2,964 | ) | | | (3,286 | ) | | | (3,437 | ) | | | (9,486 | ) | | | (5,355 | ) | | | (865 | ) | | | (4,792 | ) |
| Discontinued Operations | | | (2,932 | ) | | | (4,323 | ) | | | (24,257 | ) | | | 8,698 | | | | (2,928 | ) | | | (2,723 | ) | | | (14,124 | ) | | | (50,127 | ) |
| Total | | $ | 7,059 | | | $ | 5,512 | | | $ | (17,540 | ) | | $ | 18,322 | | | $ | 1,690 | | | $ | 6,184 | | | $ | 2,782 | | | $ | (44,319 | ) |
| | | | | | | | | | | | | | | | | | | | | | | | | | | | | | | | | |
| Identifiable Assets | | | | | | | | | | | | | | | | | | | | | | | | | | | | | | | | |
| Electric | | $ | 1,167,688 | | | $ | 1,094,549 | | | $ | 1,168,902 | | | $ | 1,092,111 | | | $ | 1,179,472 | | | $ | 1,101,146 | | | $ | 1,226,145 | | | $ | 1,170,449 | |
| Manufacturing | | | 133,988 | | | | 120,161 | | | | 127,055 | | | | 125,967 | | | | 125,747 | | | | 124,414 | | | | 114,933 | | | | 124,872 | |
| Construction | | | 67,288 | | | | 64,500 | | | | 68,407 | | | | 65,351 | | | | 67,342 | | | | 74,639 | | | | 50,696 | | | | 69,453 | |
| Plastics | | | 87,066 | | | | 76,993 | | | | 87,747 | | | | 94,035 | | | | 86,445 | | | | 84,463 | | | | 78,855 | | | | 72,200 | |
| Corporate | | | 42,292 | | | | 46,947 | | | | 39,222 | | | | 41,380 | | | | 38,612 | | | | 57,262 | | | | 112,616 | | | | 53,619 | |
| Discontinued Operations | | | 180,796 | | | | 393,831 | | | | 143,067 | | | | 289,303 | | | | 72,308 | | | | 270,060 | | | | 19,092 | | | | 209,929 | |
| Total | | $ | 1,679,118 | | | $ | 1,796,981 | | | $ | 1,634,400 | | | $ | 1,708,147 | | | $ | 1,569,926 | | | $ | 1,711,984 | | | $ | 1,602,337 | | | $ | 1,700,522 | |
| | | | | | | | | | |
| (in thousands) | | 2013 | | | 2012 | | | 2011 | |
| Income Tax Expense (Benefit) – Continuing Operations | | | | | | | | | |
| Electric | | $ | 9,278 | | | $ | 5,862 | | | $ | 6,683 | |
| Manufacturing | | | 6,047 | | | | 6,954 | | | | 3,962 | |
| Plastics | | | 9,249 | | | | 9,393 | | | | 3,653 | |
| Construction | | | 850 | | | | (5,456 | ) | | | (1,484 | ) |
| Corporate | | | (11,881 | ) | | | (14,620 | ) | | | (8,693 | ) |
| Total | | $ | 13,543 | | | $ | 2,133 | | | $ | 4,121 | |
| Earnings (Loss) Available for Common Shares | | | | | | | | | | | | |
| Electric | | $ | 38,236 | | | $ | 38,341 | | | $ | 38,886 | |
| Manufacturing | | | 11,457 | | | | 10,676 | | | | 8,229 | |
| Plastics | | | 13,809 | | | | 14,113 | | | | 5,811 | |
| Construction | | | 1,310 | | | | (7,689 | ) | | | (2,204 | ) |
| Corporate | | | (15,151 | ) | | | (17,209 | ) | | | (16,548 | ) |
| Discontinued Operations | | | 691 | | | | (44,241 | ) | | | (48,475 | ) |
| Total | | $ | 50,352 | | | $ | (6,009 | ) | | $ | (14,301 | ) |
| Capital Expenditures | | | | | | | | | | | | |
| Electric | | $ | 149,467 | | | $ | 101,919 | | | $ | 49,707 | |
| Manufacturing | | | 7,046 | | | | 9,311 | | | | 10,546 | |
| Plastics | | | 3,273 | | | | 2,819 | | | | 2,414 | |
| Construction | | | 4,630 | | | | 1,576 | | | | 2,645 | |
| Corporate | | | 47 | | | | 137 | | | | 2,048 | |
| Total | | $ | 164,463 | | | $ | 115,762 | | | $ | 67,360 | |
| Identifiable Assets | | | | | | | | | | | | |
| Electric | | $ | 1,290,416 | | | $ | 1,226,145 | | | $ | 1,170,449 | |
| Manufacturing | | | 119,302 | | | | 114,933 | | | | 124,872 | |
| Plastics | | | 76,853 | | | | 78,855 | | | | 72,200 | |
| Construction | | | 49,440 | | | | 50,696 | | | | 69,453 | |
| Corporate | | | 59,970 | | | | 112,616 | | | | 53,619 | |
| Assets of Discontinued Operations | | | 38 | | | | 19,092 | | | | 209,929 | |
| Total | | $ | 1,596,019 | | | $ | 1,602,337 | | | $ | 1,700,522 | |
3. Rate and Regulatory Matters
Minnesota
2010 General Rate Case Filing—OTP filed a general rate case on April 2, 2010 requesting an 8.01% base rate increase as well as a 3.8% interim rate increase. On May 27, 2010, the Minnesota Public Utilities Commission (MPUC) issued an order accepting the filing, suspending rates, and approving the interim rate increase, as requested, to be effective with customer usage on and after June 1, 2010. The MPUC held a hearing to decide on the issues in the rate case on March 25, 2011 and issued a written order on April 25, 2011. The MPUC authorized a revenue increase of approximately $5.0 million, or 3.76% in base rate revenues, excluding the effect of moving recovery of wind investments to base rates. The MPUC’s written order included: (1) recovery of Big Stone II costs over five years, (2) moving recovery of wind farm assets from rider recovery to base rate recovery, (3) transfer of a portion of MNCIPMinnesota Conservation Improvement Program (MNCIP) costs from rider recovery to base rate recovery, (4) transfer of the investment in two transmission lines from rider recovery to base rate recovery, and (5) changing the mechanism for providing customers with a credit for margins earned on asset-based wholesale sales of electricity from a credit to base rates to a credit to the Minnesota Fuel Clause Adjustment. Final rates went into effect October 1, 2011. The overall increase to customers was approximately 1.6% compared to the authorized interim rate increase of 3.8%, which resulted in an interim rate refund to Minnesota retail electric customers of approximately $3.9 million in the fourth quarter of 2011. Pursuant to the order, OTP’s allowed rate of return on rate base increased from 8.33% to 8.61% and its allowed rate of return on equity increased from 10.43% to 10.74%. OTP’s authorized rates of return are based on a capital structure of 48.28% long term debt and 51.72% common equity.
Renewable Energy Standards, Conservation, Renewable Resource Riders—Minnesota has a renewable energy standard which requires OTP to generate or procure sufficient renewable generation such that the following percentages of total retail electric sales to Minnesota customers come from qualifying renewable sources: 12% by 2012; 17% by 2016; 20% by 2020 and 25% by 2025. In addition, a new standard established by the 2013 legislature requires 1.5% of total electric sales to be supplied by solar energy by the year 2020. OTP is currently evaluating the new legislation and potential options for meeting that standard. Under certain circumstances and after consideration of costs and reliability issues, the MPUC may modify or delay implementation of the standards. OTP has acquired renewable resources and expects to acquire additional renewable resources in order to maintain compliance with the Minnesota renewable energy standard. OTP’s compliance with the Minnesota renewable energy standard will be measured through the Midwest Renewable Energy Tracking System.
Under the Next Generation Energy Act of 2007, an automatic adjustment mechanism was established to allow Minnesota electric utilities to recover investments and costs incurred to satisfy the requirements of the renewable energy standard. The MPUC is authorized to approve a rate schedule rider to enable utilities to recover the costs of qualifying renewable energy projects that supply renewable energy to Minnesota customers. Cost recovery for qualifying renewable energy projects can be authorized outside of a rate case proceeding, provided that such renewable projects have received previous MPUC approval. Renewable resource costs eligible for recovery may include return on investment, depreciation, operation and maintenance costs, taxes, renewable energy delivery costs and other related expenses.
The costs for three major wind farms previously approved by the MPUC issued an order on January 12, 2010 finding OTP’s Luverne Wind Farm project eligible for cost recovery through theOTP’s Minnesota Renewable Resource Adjustment (MNRRA). The 2010 annual MNRRA cost recovery filing was made on December 31, 2009. The MPUC approved OTP’s petition for a 2010 MNRRA in the third quarter of 2010 with implementation effective September 1, 2010. The 2010 MNRRA was in place from September 1, 2010 through September 30, 2011 with a recovery of $17.0 million.
The recovery of MNRRA costs was were moved to base rates as of October 1, 2011 under the MPUC’s April 25, 2011 general rate case order with the exception of the remaining balance of the MNRRA regulatory asset. OTP has a regulatory asset of $0.9 million for amounts eligible for recovery through the MNRRA rider that have not been billed to Minnesota customers as of December 31, 2012. A request for an updated rate to be effective October 1, 2012 was initially filed on June 28, 2012, followed by a revised filing on July 25, 2012. The filing, which is still under review, included aBecause the request to extend the period of the new rate for 18 months which would reduce the current balance of unrecovered costs to zero. However, OTP now estimates the remaining unrecovered costs will collected by the end of May 2013, so OTP is planning to makewas still under review, a supplemental filing to requestwas submitted on February 15, 2013, requesting that the current rate be retained until a majority of the remaining balance iscosts were recovered and that the MNRRA thenrate be suspended.set to zero effective May 1, 2013. The MPUC approved the February 15, 2013 request on April 4, 2013 and authorized that any unrecovered balance be retained as a regulatory asset to be recovered in OTP’s next general rate case. Effective May 1, 2013 the resource adjustment on OTP’s Minnesota customers’ bills no longer includes MNRRA costs.
Transmission Cost Recovery (TCR) Rider—In addition to the MNRRA rider, the Minnesota Public Utilities Act provides a similar mechanism for automatic adjustment outside of a general rate proceeding to recover the costs of new transmission facilities that have been previously approved by the MPUC in a Certificate of Need (CON) proceeding, certified by the MPUC as a Minnesota priority transmission project, made to transmit the electricity generated from renewable generation sources ultimately used to provide service to the utility’s retail customers, or exempt from the requirement to obtain a Minnesota CON. The MPUC may also authorize cost recovery via such TCR riders for charges incurred by a utility under a federally approved tariff that accrue from other transmission owners’ regionally planned transmission projects that have been determined by the MISO to benefit the utility or integrated transmission system. The 2013 legislature passed legislation that also authorizes TCR riders to recover the costs of new transmission facilities approved by the regulatory commission of the state in which the new transmission facilities are to be constructed, to the extent approval is required by the laws of that state, and determined by the MISO to benefit the utility or integrated transmission system. Such TCR riders allow a return on investment at the level approved in a utility’s last general rate case. Additionally, following approval of the rate schedule, the MPUC may approve annual rate adjustments filed pursuant to the rate schedule. OTP’s initial request for approval of a TCR rider was granted by the MPUC on January 7, 2010, and became effective February 1, 2010.
OTP requested recovery of its transmission investments being recovered through its Minnesota TCR rider rate as part of its general rate case filed on April 2, 2010. In its April 25, 2011 general rate case order, the MPUC approved the transfer of transmission costs currentlythen being recovered through OTP’s Minnesota TCR rider to recovery in base rates. Final rates went into effect on October 1, 2011. The Company will continueOTP continues to utilize the TCR rider cost recovery mechanism untilto recover the remaining balance of the current transmission projects has been collected as well asand to recover costs associated with approved regional projects. new transmission projects determined eligible for TCR rider recovery by the MPUC.
OTP filed a request for an update to its Minnesota TCR rider on October 5, 2010. The update to OTP’s Minnesota TCR rider, approved by the MPUC on March 26, 2012, went into effect April 1, 2012.
In this TCR rider update, the MPUC addressed how to handle utility investments in transmission facilities that qualify for regional cost allocation under the MISO tariff.Open Access Transmission, Energy and Operating Reserve Markets Tariff (MISO Tariff). MISO regional cost allocation allows OTP to recover some of the costs of its transmission investment from the other MISO utilities. On March 26, 2012 the MPUC approved the update to OTP’s Minnesota TCR rider along with an all-in method for MISO regional cost allocations in which OTP’s retail customers would be responsible for the entire investment OTP made with an offsetting credit for revenues received from other MISO utilities under the MISO tariff.Tariff for projects included in the TCR. OTP’s updated Minnesota TCR rider went into effect April 1, 2012.
On May 24, 2012 OTP filed a petition with the MPUC to seek a determination of eligibility for the inclusion of twelve additional transmission related projects in subsequent Minnesota TCR rider filings. On August 22, 2012February 20, 2013 the Minnesota Department of Commerce (MNDOC) filed comments and on August 24, 2012 the Minnesota OfficeMPUC approved three of the Attorney General (MNOAG) filed comments. OTP filed reply comments on September 25, 2012 and supplemental comments on January 8, 2013 describing an agreement reached between OTP, the MNDOC and the MNOAG, to find eligible 3 of the 12 projects. MPUC approval of that agreement is pending. If approval is obtained to include additional projects in the rider, investment in the approved projects will be included in the next annual Minnesota TCR rider rate update filings andas eligible for recovery of the investment will begin through the TCR rider. OTP filed its annual update to the TCR rider rates if subsequently approved byon February 7, 2013 to include the MPUC. Updatedthree new projects as well as updated costs associated with existing projects withinprojects. On January 30, 2014 the MPUC approved OTP’s 2013 TCR rider update but disallowed recovery of capitalized internal labor costs and costs in excess of CON estimates in the TCR rider. These costs will be removed from OTP’s Minnesota TCR rider effective as of the date of the MPUC order. OTP will also be includedallowed to seek recovery of these costs in the next annual ridera future rate update filing.case. OTP hashad a regulatory liability of $0.5$0.7 million as of December 31, 20122013 for amounts billed to Minnesota customers that are subject to refund through the Minnesota TCR rider.
Environmental Cost Recovery (ECR) Rider—On January 14, 2011 OTP filed a petition asking the MPUC for Advance Determination of Prudence (ADP) for costs associated with the design, construction and operation of the Best-Available Retrofit Technology (BART) compliant air quality control system at Big Stone Plant attributable to serving OTP’s Minnesota customers, and on December 20, 2011 the MPUC granted OTP’s petition for ADP for the Big Stone Plant air quality control system (AQCS). The MPUC written order was issued on January 23, 2012. On May 24, 2013 legislation was enacted in Minnesota which allowed OTP to file an emission-reduction rider for recovery of the revenue requirements of the AQCS. The legislation authorizes the rider to allow a current return on investment (including Construction Work in Progress (CWIP)) at the level approved in OTP’s most recent general rate case, unless a different return is determined by the MPUC to be in the public interest. On July 31, 2013 OTP filed for a Minnesota ECR rider with the MPUC for recovery of its Minnesota jurisdictional share of the revenue requirements of its investment in the AQCS under construction at Big Stone Plant. The ECR rider recoverable revenue requirements include a current return on the project’s CWIP balance. The MPUC granted approval of OTP’s Minnesota ECR rider on December 18, 2013 with an effective date of January 1, 2014. The rate will be updated in an annual filing with the MPUC until the costs are rolled into base rates at an undetermined future date.
Conservation Improvement Programs—Under Minnesota law, every regulated public utility that furnishes electric service must make annual investments and expenditures in energy conservation improvements, or make a contribution to the state’s energy and conservation account, in an amount equal to at least 1.5% of its gross operating revenues from service provided in Minnesota. The Next Generation Energy Act of 2007, passed by the Minnesota legislature in May 2007, transitions from a conservation spending goal to a conservation energy savings goal.
The MNDOC may require a utility to make investments and expenditures in energy conservation improvements whenever it finds that the improvement will result in energy savings at a total cost to the utility less than the cost to the utility to produce or purchase an equivalent amount of a new supply of energy. Such MNDOC orders can be appealed to the MPUC. Investments made pursuant to such orders generally are recoverable costs in rate cases, even though ownership of the improvement may belong to the property owner rather than the utility. OTP recovers conservation related costs not included in base rates under the MNCIP through the use of an annual recovery mechanism approved by the MPUC.
In 2010, OTP recognized $3.7 million in financial incentives relating to 2010, but reduced that amount by $0.2 million in the fourth quarter of 2011. A written order was issued by the MPUC onOn January 11, 2012 approving the MPUC approved recovery of $3.5 million for the 2010 MNCIP financial incentives. Beginning in January 2012, OTP’s MNCIP Conservation Cost Recovery Adjustment (CCRA) increased from 3.0% to 3.8% for all Minnesota retail electric customers.
OTP recognized $2.2 million in MNCIP financial incentives in 2011 relating to 2011 program results. On March 30, 2012 OTP recognized an additional $0.4 million of incentive related to 2011 and submitted its annual 2011 financial incentive filing request for $2.6 million and recognized an additional $0.4 million of incentive related to 2011 in 2012.million. In December 2012, the MPUC approved the recovery of $2.6 million in financial incentives for 2011 and also ordered a change in the MNCIP cost recovery methodology used by OTP from a percentage of a customer’s bill to an amount per kwhkilowatt-hour (kwh) consumed. The written order was issued on December 10, 2012. On January 1, 2013 OTP’s MNCIP surcharge decreased from 3.8% of the customer’s bill to $0.00142 per kwh, , which equates to approximately 1.9% of a customer’s bill . The per-kwh cost allocation method is the principle method approved by the MPUC for other electric utilities in Minnesota.bill. OTP recognized $2.6 million of MNCIP financial incentives in 2012 and an additional $0.1 million in 2013 relating to 2012 program results. On October 10, 2013 the MPUC approved OTP’s 2012 financial incentive request for $2.7 million as well as its request for an updated surcharge rate to be implemented on November 1, 2013. OTP recognized $3.9 million in MNCIP financial incentives in 2013 related to the results of its conservation improvement programs in Minnesota in 2013.
OTP hashad a regulatory asset of $6.1$8.9 million for allowable costs and financial incentives that are eligible for recovery through the MNCIP rider that havehad not been billed to Minnesota customers as of December 31, 2012.2013. OTP’s Minnesota conservation recoverable costs and incentives totaled $9.3 million in 2013, $7.8 million in 2012 and $8.0 million in 2011 and $8.6 million in 2010.
North Dakota
General Rate CaseRates—On November 3, 2008 OTP filed aOTP’s most recent general rate case in North Dakota requesting an overall revenue increase of approximately $6.1 million, or 5.1%, and an interim rate increase of approximately 4.1%, or $4.8 million annualized, that went into effect on January 2, 2009. In an order issued by the North Dakota Public Service Commission (NDPSC) on November 25, 2009, OTP was granted an increase in North Dakota retail electric rates of $3.6 million, or approximately 3.0%, which went into effect in December 2009. The NDPSC order authorizing an interim rate increase required OTP to refund North Dakota customers the difference between final and interim rates, with interest. OTP established a refund reserve for revenues collected under interim rates that exceeded the final rate increase. The refund reserve balance of $0.9 million as of December 31, 2009 was refunded to North Dakota customers in January 2010. OTP deferred recognition of $0.5 million in rate case-related filing and administrative costs that are subject to amortization and recovery over a three year period beginning in January 2010. As requiredgranted by the NDPSC in an order in the OTP 2008 rate case, OTP submitted a filing for a request to remove the recovery of the costs associated with economic development in base rates in North Dakota. OTP proposedissued on November 25, 2009 and the NDPSC approved an Economic Development Cost Removal Rider, under which all North Dakota customers will receive a credit of $0.00025 per kwh. The monthly credit was effective with bills rendered on and after January 1, 2011.December 2009.
Renewable Resource Cost Recovery RiderAdjustment— On May 21, 2008 the NDPSC approved OTP’s request forOTP has a North Dakota Renewable Resource Cost Recovery Rider Adjustment (NDRRA) to enablewhich enables OTP to recover the North Dakota share of its investments in renewable energy facilities it owns in North Dakota. This rider allows OTP to recover costs associated with new renewable energy projects as they are completed. OTP included investment costs and expenses related to its 32 wind turbines at the Ashtabula Wind Energy Center that became commercially operational in November 2008 in its 2009 annual request to the NDPSC to increase the amount of the NDRRA. An NDRRA of $0.0051 per kwh was approved by the NDPSC on January 14, 2009 and went into effect beginning with billing statements sent on February 1, 2009. Terms of the approved settlement provide for the recovery of accrued costs and returns on investments in renewable energy facilities under the NDRRA over a period of 48 months beginning in January 2010.
In a proceeding that was combined with OTP’s general rate case, the NDPSC reviewed whether to move the costs of the projects being recovered through the NDRRA into base rate cost recovery and whether to make changes to the rider. A settlement of the general rate case and the NDRRA reduced the NDRRA to $0.00369 for the period from December 1, 2009 until the effective date for the next annual NDRRA filing, requested to be April 1, 2010. Because the 2008 annual NDRRA filing was combined with the general rate case proceedings (concluded in November 2009), the 2009 annual filing to establish the 2010 NDRRA (which includes cost recovery for OTP’s investment in its Luverne Wind Farm project) was delayed until December 31, 2009, with a requested effective date of April 1, 2010. Approval for implementation of an updated NDRRA was received in the third quarter of 2010 with implementation effective September 1, 2010.
The 2010 NDRRA was in place for the period offrom September 1, 2010 through March 31, 2012 with a recovery of $15.6 million. On December 29, 2011 OTP submitted its annualMarch 21, 2012 the NDPSC approved an update to the renewable rider with anOTP’s NDRRA effective April 1, 2012 effective date, which was approved by the NDPSC on March 21, 2012. The 2011updated NDRRA has an expected recovery of $10.1recovered $9.9 million over the period April 1, 2012 through March 31, 2013. On December 28, 2012 OTP submitted its annual update to the NDRRA with a proposed effective date of April 1, 2013. The update resulted in a rate reduction, so the NDPSC did not issue an order suspending the rate change. Consequently, pursuant to statute, OTP was allowed to implement updated rates effective April 1, 2013 and, on July 10, 2013, the NDPSC approved the rate implemented on April 1, 2013. OTP submitted its annual update to the NDRRA on December 31, 2013 with a proposed April 1, 2014 effective date. OTP has a regulatory asset of $1.6$0.5 million for amounts eligible for recovery through the NDRRA rider that havehad not been billed to North Dakota customers as of December 31, 2012.2013.
Transmission Cost Recovery Rider—North Dakota law provides a mechanism for automatic adjustment outside of a general rate proceeding to recover jurisdictional capital and operating costs incurred by a public utility for new or modified electric transmission facilities. On April 29, 2011 OTP filed a request for an initial North Dakota TCR rider with the NDPSC, on April 29, 2011, which was approved by the NDPSC on April 25, 2012 to go into effectand effective May 1, 2012. On August 31, 2012 OTP filed its annual update to the North Dakota TCR rider rate to reflect updated cost information associated with projects currently in the rider, as well as proposing to include costs associated with ten additional projects for recovery within the rider, whichrider. The NDPSC approved the NDPSC approvedannual update on December 12, 2012 to go into effectwith an effective date of January 1, 2013. On August 30, 2013 OTP filed its annual update to its North Dakota TCR rider rate, which was approved on December 30, 2013 and became effective January 1, 2014. OTP has a regulatory liability of $0.2 million as of December 31, 2013 for amounts billed to North Dakota customers that are subject to refund through the North Dakota TCR rider.
Environmental Cost Recovery Rider—On May 9, 2012 the NDPSC approved OTP’s application for an ADP related to the Big Stone Plant AQCS. On February 8, 2013 OTP filed a request with the NDPSC for an ECR rider to recover OTP’s North Dakota jurisdictional share of carrying costs associated with its investment in the Big Stone Plant AQCS. On December 18, 2013 the NDPSC approved OTP’s North Dakota ECR rider based on revenue requirements through the 2013 calendar year and thereafter, with rates effective for bills rendered on or after January 1, 2014. OTP had a regulatory asset of $0.1$2.3 million for amounts eligible for recovery through the North Dakota TCRECR rider that havehad not been billed to North Dakota customers as of December 31, 2012.2013. The ECR rider rate will be updated at least annually in a filing with the NDPSC until the project costs are rolled into base rates at an undetermined future date.
South Dakota
2010 General Rate Case Filing—On August 20, 2010 OTP filed a general rate case with the South Dakota Public Utilities Commission (SDPUC) requesting an overall revenue increase of approximately $2.8 million, or just under 10.0%, which includes, among other things, recovery of investments and expenses related to renewable resources. On September 28, 2010 the SDPUC suspended OTP’s proposed rates for a period of 180 days to allow time to review OTP’s proposal. On January 19, 2011 OTP submitted a proposal to use current rate design to implement an interim rate in South Dakota to be effective on and after February 17, 2011. On January 26, 2011 OTP submitted an amended proposal to use a lower interim rate increase than originally proposed. At its February 1, 2011 meeting, the SDPUC approved OTP’s request to implement interim rates using current rate design and the lower interim increase to be effective on and after February 17, 2011. On April 21, 2011 the SDPUC issued itsa written order approving an overall final revenue increase of approximately $643,000 (2.32%) and an overall rate of return on rate base of 8.50% for the interim rates and final rates.rates for OTP in South Dakota. Final rates were effective with bills rendered on and after June 1, 2011.
Transmission Cost Recovery Rider—South Dakota law provides a mechanism for automatic adjustment outside of a general rate proceeding to recover jurisdictional capital and operating costs incurred by a public utility for new or modified electric transmission facilities. OTP submitted a request for an initial South Dakota TCR rider to the SDPUC on November 5, 2010. The South Dakota TCR was approved by the SDPUC and implemented on December 1, 2011. OTP billed $570,000 to South Dakota customers under the TCR rider from December 1, 2011 through December 31, 2012 and had a regulatory asset of $2,000 for amounts eligible for recovery through the South Dakota TCR rider that had not been billed to South Dakota customers as of December 31, 2012. On September 4, 2012 OTP filed its annual update to the South Dakota TCR rider. Updated rates, approved on April 23, 2013, went into effect on May 1, 2013. OTP filed its annual update to the South Dakota TCR rider rate. The request is currently under review by the SDPUC.on August 30, 2013 with a supplemental filing made in February 2014 with a proposed implementation date of March 1, 2014.
Energy Efficiency PlanEnvironmental Cost Recovery Rider—TheOn March 30, 2012 OTP requested approval from the SDPUC has encouraged all investor-owned utilities in South Dakotafor an ECR rider to be part of an Energy Efficiency Partnership to significantly reduce energy use. The plan is being implementedrecover costs associated with program costs, carrying costs and a financial incentive being recovered through an approved rider.
the Big Stone Plant AQCS. On June 16, 2010April 17, 2013 OTP filed a request with the SDPUC for approval of updates to its 2010 South Dakota Energy Efficiency Plan and approval for the continuation of the program in 2011. OTP requested increases in energy and demand savings goals and increases in related financial incentives for both 2010 and the requested 2011 program. In an order issued on July 27, 2010 the SDPUC approved OTP’s request for updated energy, demand and participation goals for continuation of the program into 2011.
On April 29, 2011 OTP filed a request with the SDPUC for approval of a 2010 financial incentive of $73,415 and a surcharge adjustment of $0.00063 on South Dakota customers’ bills. On May 25, 2011 OTP filed a request with the SDPUC for approval of updates to its 2012–2013 South Dakota Energy Efficiency Plan.either suspend or withdraw this filing. The SDPUC approved withdrawing this filing on April 23, 2013. Instead of receiving rider recovery on the 2012–2013 plan withportion of AQCS construction costs assignable to OTP’s South Dakota customers while the project is under construction, OTP will accrue an Allowance for Funds Used During Construction (AFUDC) on these costs and request recovery of, and a maximum available incentive payment limited to 30% ofreturn on, the budget amount providedaccumulated costs, including AFUDC, in the plan, or $84,000.a future rate filing in South Dakota.
Federal
Wholesale power sales and transmission rates are subject to the jurisdiction of the FERC under the Federal Power Act of 1935, as amended. The FERC is an independent agency which haswith jurisdiction over rates for wholesale electricity sales, transmission and sale of electric energy in interstate commerce, interconnection of facilities, and accounting policies and practices. Filed rates are effective after a one day suspension period, subject to ultimate approval by the FERC.
Effective January 1, 2010 the FERC authorized OTP’s implementation of a forward looking formula transmission rate under the MISO Open Access Transmission, Energy and Operating Reserve Markets Tariff (MISO Tariff).Tariff. OTP was also authorized by the FERC to recover in its formula rate: (1) 100% of prudently incurred Construction Work in Progress (CWIP)CWIP in rate base and (2) 100% of prudently incurred costs of transmission facilities that are cancelled or abandoned for reasons beyond OTP’s control (Abandoned Plant Recovery), as determined by the FERC subsequent to abandonment, specifically for three regional transmission CapX2020 projects thatin which OTP is investing in, including the Fargo Project, Bemidji Project and Brookings Project.invested.
On December 16, 2010 the FERC approved the cost allocation for a new classification of projects in MISO called Multi-Value Projects (MVP). MVPs are designed to enable the region to comply with energy policy mandates and to address reliability and economic issues affecting multiple transmission zones within the MISO region. The cost allocation is designed to ensure that the costs of transmission projects with regional benefits are properly assigned to those who benefit. On October 20, 2011 the FERC reaffirmed the MVP cost allocation on rehearing. TheOn June 7, 2013, in response to a challenge to the MVP cost allocation is currently being challenged atheard before the United States Court of Appeals, Seventh Circuit.Circuit, the Court ruled in favor of MISO and MISO transmission owners, issuing an order affirming the FERC’s approval of the MVP cost allocation. On October 7, 2013 certain parties submitted a petition for writ of certiorari to the U.S. Supreme Court seeking review of the Seventh Circuit decision. The U.S. Supreme Court had not acted on the request as of February 14, 2014.
On November 12, 2013 a group of industrial customers and other stakeholders filed a complaint at the FERC seeking to reduce the return on equity component of the transmission rates that MISO transmission owners, including OTP, may collect under the MISO Tariff. The complainants are seeking to reduce the current 12.38% return on equity used in MISO’s transmission rates to a proposed 9.15%. MISO and a group of MISO transmission owners have filed responses to the complaint seeking its dismissal and defending the current return on equity. The complaint is pending at the FERC.
Effective January 1, 2012 the FERC authorized OTP to recover 100% CWIP and Abandoned Plant Recovery on two projects approved by MISO as MVPs in MISO’s 2011 Transmission Expansion Plan: the Big Stone South – Brookings MVP and the Ellendale – Big Stone South – Ellendale MVP.
The Big Stone South – Brookings Project—This planned 345 kiloVolt (kV) transmission line will extend 70 miles between a proposed substation near Big Stone City, South Dakota and the new Brookings County Substation near Brookings, South Dakota. OTP is jointly developing this project with Xcel Energy. MISO approved this project as an MVP under the MISO Tariff in December 2011. A Notice of Intent to Construct Facilities (NICF) was filed with the SDPUC on February 29, 2012. A portion of this line is anticipated to use previously obtained Big Stone II transmission route permits and easements and is expected to be in service in the fourth quarter of 2017. On July 31, 2012 the SDPUC approved the transfer of the Big Stone II transmission route permits to OTP. In December 2012, a request was filed with the SDPUC for recertification of a portion of the line route that was approved as part of the Big Stone II transmission development. The SDPUC approved the certification for the northern portion of the route on April 9, 2013. OTP and Xcel Energy expectjointly submitted an application to makethe SDPUC for a joint route permit filing in the second quarter of 2013 for the remainingsouthern portion of the project.
The Ellendale – Big Stone South to Brookings line on June 3, 2013. A decision on the permit application for the southern half of this route is expected in the first quarter of 2014.
The Big Stone South – Ellendale Project—This transmission line is a proposed 345 kV line that will extend 160 to 170 miles between a proposed substation near Big Stone City, South Dakota and a proposed substation near Ellendale, North Dakota. OTP is jointly developing this project with Montana-Dakota Utilities Co., a Division of MDU Resources Group, Inc. (MDU). MISO approved this project as an MVP under the MISO Tariff in December 2011. OTP and MDU jointly filed an NICF with the SDPUC in March of 2012. This project will require regulatory approval from bothOn August 25, 2013 the SDPUCNDPSC granted Certificates of Public Convenience and Necessity to OTP and MDU for the NDPSC. Route permits are expectedten miles of the proposed line to be built in North Dakota. A joint route permit application was filed by OTP and MDU on August 23, 2013 with the respective commissionsSDPUC. OTP and MDU jointly filed an Application for a Certificate of Corridor Compatibility along with an application for a route permit with the NDPSC on October 18, 2013. If the proposed project receives all the necessary approvals, OTP anticipates the line will be placed in service in the thirdfourth quarter of 2013.2019.
Capacity Expansion 2020 (CapX2020)CapX2020
CapX2020 is a joint initiative of eleven investor-owned, cooperative, and municipal utilities in Minnesota and the surrounding region to upgrade and expand the electric transmission grid to ensure continued reliable and affordable service. The CapX2020 companies identified four major transmission projects for the region: (1) the Fargo–Monticello 345 kiloVolt (kV)kV Project (the Fargo Project), (2) the Brookings–Southeast Twin Cities 345 kV Project (the Brookings Project), (3) the Bemidji–Grand Rapids 230 kV Project (the Bemidji Project), and (4) the Twin Cities–LaCrosse 345 kV Project. OTP is an investor in the Fargo Project, the Brookings Project and the Bemidji Project. Recovery of OTP’s CapX2020 transmission investments will be through the MISO Tariff (the Brookings Project as an MVP) and Minnesota, North Dakota and South Dakota TCR Riders.
The Fargo Project—All major permits have been received from state regulatory bodies and project agreements have been signed for the construction of the Fargo Project. The Monticello to St. Cloud portion of the Fargo Project was placed into service on December 21, 2011. Completion of all phasesConstruction is underway for the remaining portions of the Fargo Project isproject, with completion scheduled for the firstsecond quarter of 2015.
The Brookings Project—All major permits have been received from state regulatory bodies and project agreements have been signed for the construction of the Brookings Project. The MISO granted unconditional approval of the Brookings Project as an MVP under the MISO Tariff in December 2011. This project willis anticipated to be placedcompleted in service in segments with the earliest segment being placed in service in the summer of 2013 and the last segment placed in service during the first quarter of 2015.
The Bemidji Project—The Bemidji-Grand Rapids transmission line was fully energized and put into service on September 17, 2012.
Big Stone Air Quality Control SystemPlant AQCS
The South Dakota Department of Environment and Natural Resources (DENR) determined that the Big Stone Plant is subject to Best Available Retrofit Technology (BART)BART requirements of the Clean Air Act (CAA), based on air dispersion modeling indicating that Big Stone’s emissions reasonably contribute to visibility impairment in national parks and wilderness areas in Minnesota, North Dakota, South Dakota and Michigan. Under the U.S. Environmental Protection Agency’s (EPA) regional haze regulations, South Dakota developed and submitted its implementation plan and associated implementation rules to the EPA on January 21, 2011. The DENR and the EPA have agreed on non-substantive rule revisions, which were adopted by the Board of Minerals and Environment and became effective on September 19, 2011.
South Dakota developed and submitted its revised implementation plan and associated implementation rules to the EPA on September 19, 2011. Under the South Dakota implementation plan, and its implementing rules, the Big Stone Plant must install and operate a new BART compliant air quality control systemAQCS to reduce emissions as expeditiously as practicable, but no later than five years after the EPA’s approval of South Dakota’s implementation plan. On March 29, 2012 the EPA took final action to approve South Dakota’s Regional Haze State Implementation Plan (SIP), finding that South Dakota’s SIP submittal met all applicable regional haze regulations. The EPA’s final approval of the SIP was effective on May 29, 2012.
On January 14, 2011 OTP filed a petition asking the MPUC for ADP for the design, construction and operation of the BART compliant air quality control system at Big Stone Plant attributable to serving OTP’s Minnesota customers. On December 20, 2011 the MPUC granted OTP’s petition for ADP for the Big Stone Plant Air Quality Control System (AQCS). The MPUC written order was issued on January 23, 2012.
An application for an ADP filed by OTP with the NDPSC on May 20, 2011 was approved on May 9, 2012.
On March 30, 2012 OTP requested approval from the SDPUC for an ECRR to recover costs associated with the Big Stone Plant AQCS, with a proposed effective date of October 1, 2012. Information requests for this filing continue and OTP is currently awaiting SDPUC action. This rider is designed to recover the revenue requirements plus carrying charges of the Big Stone AQCS project while under construction as well as after completion of the project until placed into base rates through the filing of a rate case. For the initial period of October 1, 2012 through September 30, 2013, OTP is requesting revenue requirement recovery on expenditures incurred for the Big Stone Plant AQCS. The request is currently under review by the SDPUC.
Big Stone II Project
On June 30, 2005 OTP and a coalition of six other electric providers entered into several agreements for the development of a second electric generating unit, named Big Stone II, at the site of the existing Big Stone Plant near Milbank, South Dakota. On September 11, 2009 OTP announced its withdrawal—both as a participating utility and as the project’s lead developer—from Big Stone II. On November 2, 2009, the remaining Big Stone II participants announced the cancellation of the Big Stone II project.
Minnesota—OTP requested recovery of the Minnesota portion of its Big Stone II development costs over a five-year period as part of its general rate case filed in Minnesota on April 2, 2010. In a written order issued on April 25, 2011, the MPUC authorized recovery of the Minnesota portion of Big Stone II generation development costs from Minnesota ratepayers over a 60-month recovery period which began on October 1, 2011. The amount of Big Stone II generation costs incurred by OTP that were deemed recoverable from Minnesota ratepayers as part of the rates established in that proceeding was $3,199,000$3.2 million (which excluded $3,246,000$3.2 million of transmission-related project transmission-related costs). Because OTP will not earn a return on these deferred costs over the 60-month recovery period, the recoverable amount of $3,199,000$3.2 million was discounted to its present value of $2,758,000$2.8 million using OTP’s incremental borrowing rate, in accordance with ASC 980 Regulated Operations, accounting requirements.
On December 30, 2010 OTP filed a request for an extensionApproximately $0.4 million of the total Minnesota Route Permit for the Big Stone II transmission facilities. The request asks to extend the deadline for filing a CON for these transmission facilities until March 17, 2013. The April 25, 2011 MPUC order instructed OTP to transfer the $3,246,000 Minnesotajurisdictional share of Big Stone II transmission costs were transferred to the Big Stone South - Brookings MVP in the first quarter of 2013. The remaining costs, along with accumulated AFUDC, were transferred from CWIP and to create a tracker account through which any over or under recoveries could be accumulated for refund or recovery determination in future rate cases as a regulatory liability or asset. If determined eligible for recovery under the FERC-approved MISO regional transmission tariff, the Minnesota portion of Big Stone II transmission costs and accumulated Allowance for Funds Used During Construction (AFUDC) will receive rate base treatment andUnrecovered Project Costs – Minnesota regulatory asset account in May 2013, based on recovery through the FERC-approved MISO regional transmission rates. Any amounts over or under collected through MISO rates will be reflectedgranted in the tracker account.April 25, 2011 order. Because OTP will not earn a return on these deferred costs over their anticipated recovery period, the recoverable amount of approximately $3.5 million was discounted to its present value of $2.8 million using OTP’s incremental borrowing rate. In May 2013, OTP recorded a charge of $0.7 million related to the discount in accordance with ASC 980 accounting requirements. The amount of the discount is expected to be recovered, along with the remaining balance of the Big Stone II Unrecovered Project Costs – Minnesota regulatory asset, over an anticipated 89-month recovery period which began in May 2013.
North Dakota—In an order issued June 25, 2010, the NDPSC authorized recovery of Big Stone II development costs from North Dakota ratepayers, pursuant to a final settlement agreement filed June 23, 2010, between the NDPSC advocacy staff, OTP and the North Dakota Large Industrial Energy Group, Interveners. The terms of the settlement agreement indicate that OTP’s discontinuation of participation in the project was prudent and OTP should be authorized to recover the portion of costs it incurred related to the Big Stone II generation project. The total amount of Big Stone II generation costs incurred by OTP (which excluded $2,612,000$2.6 million of project transmission-related costs) was determined to be $10,080,000,$10.1 million, of which $4,064,000$4.1 million represents North Dakota’s jurisdictional share.
OTP is including in its total recovery amount a carrying charge of approximately $285,000$0.3 million on the North Dakota share of Big Stone II generation costs for the period from September 1, 2009 through the date the recovery of costs begins based on OTP’s average 2009 AFUDC rate of 7.65%. Because OTP will not earn a return on these deferred costs over the 36-month recovery period, the recoverable amount of $4,349,000$4.3 million was discounted to its then present value of $3,913,000$3.9 million using OTP’s incremental borrowing rate, in accordance with ASC 980 accounting requirements. The North Dakota portion of Big Stone II generation costs is being recovered over a 36-month period which began on August 1, 2010.
The North Dakota jurisdictional share of Big Stone II costs incurred by OTP related to transmission is $1,053,000. OTPwas $1.1 million. Approximately $0.3 million of the total North Dakota jurisdictional share of Big Stone II transmission costs were transferred to the Big Stone South - Brookings MVP during the first quarter of 2013. On July 30, 2013 the NDPSC approved OTP’s request to continue the Big Stone II cost recovery rates for an additional eight months through March 31, 2014 to recover the remaining North Dakota share of Big Stone II transmissiontransmission-related costs to CWIP, with such costs subject toplus accrued AFUDC continuing from September 2009. If construction of all or a portion of the transmission facilities commences within three years of the NDPSC order approving the settlement agreement, the North Dakota portion of Big Stone II transmission costs and accumulated AFUDC shall be included in the rate base investment for these future transmission facilities. If construction is not commenced on any of the transmission facilities within three years of the NDPSC order approving the settlement agreement, OTP may petition the NDPSC to either continue accounting for these costs as CWIP or to commence recovery of such costs.totaling $1.0 million.
South Dakota—OTP requested recovery of the South Dakota portion of its Big Stone II development costs over a five-year period as part of its general rate case filed in South Dakota on August 20, 2010. In the first quarter of 2011, the SDPUC approved recovery of the South Dakota portion of Big Stone II generation development costs totaling approximately $1.0 million from South Dakota ratepayers over a ten-year period beginning in February 2011 with the implementation of interim rates. OTP will beis allowed to earn a return on the amount subject to recovery over the ten-year recovery period. Therefore, the South Dakota settlement amount is not discounted. OTP transferred the South Dakota portion of the remaining Big Stone II transmission costs to CWIP, with such costs subject to AFUDC and recovery in future FERC-approved MISO rates or retail rates. On July 31, 2012 the SDPUC approved the transfer of the Big Stone II transmission route permits to OTP.
A portion of the Big Stone II transmission costs were transferred out of CWIP in February 2013 to be included within the Big Stone South - Brookings MVP. On March 28, 2013, OTP filed a petition with the SDPUC requesting deferred accounting for the remaining unrecovered Big Stone II Transmission costs until OTP’s next South Dakota general rate case. The petition was approved by the SDPUC on April 23, 2013 and in May 2013 OTP transferred the remaining South Dakota jurisdictional portion of unrecovered Big Stone II transmission costs plus accumulated AFUDC totaling $0.2 million from CWIP to the Big Stone II Unrecovered Project Costs – South Dakota long-term regulatory asset account.
4. Regulatory Assets and Liabilities
As a regulated entity, OTP accounts for the financial effects of regulation in accordance with ASC 980, Regulated Operations.980. This accounting standard allows for the recording of a regulatory asset or liability for costs that will be collected or refunded in the future as required under regulation. The following regulatory assets reflect incurred costs eligible for recovery in future periods on which the Company will not earn a rate of return: Prior Service Costs and Actuarial Losses on Pensions and Other Postretirement Benefits, the Accumulated ARO Accretion/Depreciation Adjustment, Debt Reacquisition Premiums, Big Stone II Unrecovered Project Costs – Minnesota, Deferred Income Taxes, the MISO Schedule 26 Transmission Cost Recovery Rider True-up, Big Stone II Unrecovered Project Costs – North Dakota, General Rate Case Recoverable Expenses and Deferred Holding Company Formation Costs. Additionally, ASC 980-605-25 provides for the recognition of revenues authorized for recovery outside of a general rate case under alternative revenue programs which provide for recovery of costs and incentives or returns on investment in such items as transmission infrastructure, renewable energy resources or conservation initiatives. The following regulatory assets represent amounts eligible for recovery under alternative revenue programs or on which the Company earns an incentive or rate of return: Conservation Improvement Program Costs and Incentives, North Dakota Renewable Resource Rider Accrued Revenues, Minnesota Renewable Resource Rider Accrued Revenues, Big Stone II Unrecovered Project Costs – South Dakota, North Dakota Transmission Rider Accrued Revenues and South Dakota Transmission Rider Accrued Revenue The following table indicatestables indicate the amount of regulatory assets and liabilities recorded on the Company’s consolidated balance sheet:sheets:
| | | December 31, 2012 | | Remaining
Recovery/
Refund Period |
| (in thousands) | | Current | | | Long-Term | | | Total | |
| Regulatory Assets: | | | | | | | | | | |
| Prior Service Costs and Actuarial Losses on Pensions and Other Postretirement Benefits | | $ | 8,411 | | | $ | 109,538 | | | $ | 117,949 | | see note |
| Deferred Marked-to-Market Losses | | | 7,949 | | | | 10,050 | | | | 17,999 | | 72 months |
| Conservation Improvement Program Costs and Incentives | | | 3,707 | | | | 2,560 | | | | 6,267 | | 18 months |
| Accumulated ARO Accretion/Depreciation Adjustment | | | -- | | | | 4,137 | | | | 4,137 | | asset lives |
| Debt Reacquisition Premiums | | | 268 | | | | 1,978 | | | | 2,246 | | 237 months |
| Big Stone II Unrecovered Project Costs – Minnesota | | | 526 | | | | 1,618 | | | | 2,144 | | 45 months |
| Recoverable Fuel and Purchased Power Costs | | | 1,737 | | | | -- | | | | 1,737 | | 12 months |
| Deferred Income Taxes | | | -- | | | | 1,691 | | | | 1,691 | | asset lives |
| North Dakota Renewable Resource Rider Accrued Revenues | | | 532 | | | | 1,087 | | | | 1,619 | | 15 months |
| MISO Schedule 26 Transmission Cost Recovery Rider True-up | | | -- | | | | 1,352 | | | | 1,352 | | see note |
| Minnesota Renewable Resource Rider Accrued Revenues | | | 915 | | | | -- | | | | 915 | | 5 months |
| Big Stone II Unrecovered Project Costs – North Dakota | | | 908 | | | | -- | | | | 908 | | 7 months |
| Big Stone II Unrecovered Project Costs – South Dakota | | | 100 | | | | 711 | | | | 811 | | 97 months |
| General Rate Case Recoverable Expenses | | | 279 | | | | 6 | | | | 285 | | 13 months |
| North Dakota Transmission Rider Accrued Revenues | | | 110 | | | | -- | | | | 110 | | 12 months |
| Deferred Holding Company Formation Costs | | | 55 | | | | 27 | | | | 82 | | 18 months |
| South Dakota Transmission Rider Accrued Revenue | | | 2 | | | | -- | | | | 2 | | 12 months |
| Total Regulatory Assets | | $ | 25,499 | | | $ | 134,755 | | | $ | 160,254 | | |
| Regulatory Liabilities: | | | | | | | | | | | | | |
| Accumulated Reserve for Estimated Removal Costs – Net of Salvage | | $ | -- | | | $ | 65,960 | | | $ | 65,960 | | asset lives |
| Deferred Income Taxes | | | -- | | | | 2,553 | | | | 2,553 | | asset lives |
| Minnesota Transmission Rider Accrued Refund | | | 489 | | | | -- | | | | 489 | | 12 months |
| Deferred Marked-to-Market Gains | | | 8 | | | | 210 | | | | 218 | | 68 months |
| Deferred Gain on Sale of Utility Property – Minnesota Portion | | | 6 | | | | 112 | | | | 118 | | 252 months |
| South Dakota – Nonasset-Based Margin Sharing Excess | | | 56 | | | | -- | | | | 56 | | 12 months |
| Total Regulatory Liabilities | | $ | 559 | | | $ | 68,835 | | | $ | 69,394 | | |
| Net Regulatory Asset Position | | $ | 24,940 | | | $ | 65,920 | | | $ | 90,860 | | |
| | | | | Remaining |
| | | December 31, 2013 | | Recovery/
Refund Period |
| (in thousands) | | Current | | | Long-Term | | | Total | |
| Regulatory Assets: | | | | | | | | | | |
Prior Service Costs and Actuarial Losses on Pensions and Other Postretirement Benefits1 | | $ | 4,095 | | | $ | 55,012 | | | $ | 59,107 | | see note |
Deferred Marked-to-Market Losses1 | | | 3,008 | | | | 8,674 | | | | 11,682 | | 60 months |
Conservation Improvement Program Costs and Incentives2 | | | 4,945 | | | | 3,959 | | | | 8,904 | | 18 months |
Accumulated ARO Accretion/Depreciation Adjustment1 | | | -- | | | | 4,646 | | | | 4,646 | | asset lives |
Big Stone II Unrecovered Project Costs – Minnesota1 | | | 558 | | | | 3,967 | | | | 4,525 | | 81 months |
MISO Schedule 26/26A Transmission Cost Recovery Rider True-up1 | | | 1,351 | | | | 1,753 | | | | 3,104 | | 24 months |
Debt Reacquisition Premiums1 | | | 351 | | | | 2,241 | | | | 2,592 | | 225 months |
North Dakota Environmental Cost Recovery Rider Accrued Revenues2 | | | 2,331 | | | | -- | | | | 2,331 | | 12 months |
Deferred Income Taxes1 | | | -- | | | | 1,805 | | | | 1,805 | | asset lives |
Big Stone II Unrecovered Project Costs – South Dakota2 | | | 101 | | | | 843 | | | | 944 | | 113 months |
North Dakota Renewable Resource Rider Accrued Revenues2 | | | -- | | | | 762 | | | | 762 | | 15 months |
Recoverable Fuel and Purchased Power Costs1 | | | 760 | | | | -- | | | | 760 | | 12 months |
Big Stone II Unrecovered Project Costs – North Dakota1 | | | 375 | | | | -- | | | | 375 | | 3 months |
Minnesota Renewable Resource Rider Accrued Revenues2 | | | -- | | | | 68 | | | | 68 | | see note |
South Dakota Transmission Rider Accrued Revenues2 | | | 32 | | | | -- | | | | 32 | | 12 months |
Deferred Holding Company Formation Costs1 | | | 27 | | | | -- | | | | 27 | | 6 months |
General Rate Case Recoverable Expenses – South Dakota1 | | | 6 | | | | -- | | | | 6 | | 1 month |
| Total Regulatory Assets | | $ | 17,940 | | | $ | 83,730 | | | $ | 101,670 | | |
| Regulatory Liabilities: | | | | | | | | | | | | | |
| Accumulated Reserve for Estimated Removal Costs – Net of Salvage | | $ | -- | | | $ | 71,454 | | | $ | 71,454 | | asset lives |
| Deferred Income Taxes | | | -- | | | | 1,960 | | | | 1,960 | | asset lives |
| Minnesota Transmission Rider Accrued Refund | | | 670 | | | | -- | | | | 670 | | 12 months |
| Revenue for Rate Case Expenses Subject to Refund – Minnesota | | | -- | | | | 289 | | | | 289 | | see note |
| North Dakota Renewable Resource Rider Accrued Refund | | | 261 | | | | -- | | | | 261 | | 12 months |
| North Dakota Transmission Rider Accrued Refund | | | 215 | | | | -- | | | | 215 | | 12 months |
| Deferred Marked-to-Market Gains | | | 6 | | | | 117 | | | | 123 | | 56 months |
| Deferred Gain on Sale of Utility Property – Minnesota Portion | | | 5 | | | | 106 | | | | 111 | | 240 months |
| South Dakota – Nonasset-Based Margin Sharing Excess | | | 38 | | | | -- | | | | 38 | | 12 months |
| Total Regulatory Liabilities | | $ | 1,195 | | | $ | 73,926 | | | $ | 75,121 | | |
| Net Regulatory Asset Position | | $ | 16,745 | | | $ | 9,804 | | | $ | 26,549 | | |
1Costs subject to recovery without a rate of return. 2Amount eligible for recovery under an alternative revenue program which includes an incentive or rate of return. |
| | | December 31, 2011 | | Remaining
Recovery/
Refund Period |
| (in thousands) | | Current | | | Long-Term | | | Total | |
| Regulatory Assets: | | | | | | | | | | |
| Unrecognized Transition Obligation, Prior Service Costs and Actuarial Losses on Pensions and Other Postretirement Benefits | | $ | 6,304 | | | $ | 96,074 | | | $ | 102,378 | | see notes |
| Deferred Marked-to-Market Losses | | | 5,208 | | | | 10,749 | | | | 15,957 | | 44 months |
| Conservation Improvement Program Costs and Incentives | | | 5,234 | | | | 2,208 | | | | 7,442 | | 18 months |
| Recoverable Fuel and Purchased Power Costs | | | 4,043 | | | | -- | | | | 4,043 | | 12 months |
| Accumulated ARO Accretion/Depreciation Adjustment | | | -- | | | | 3,662 | | | | 3,662 | | asset lives |
| Minnesota Renewable Resource Rider Accrued Revenues | | | 1,461 | | | | 1,306 | | | | 2,767 | | 33 months |
| Big Stone II Unrecovered Project Costs – Minnesota | | | 495 | | | | 2,144 | | | | 2,639 | | 57 months |
| Debt Reacquisition Premiums | | | 280 | | | | 2,246 | | | | 2,526 | | 249 months |
| Deferred Income Taxes | | | -- | | | | 2,382 | | | | 2,382 | | asset lives |
| Big Stone II Unrecovered Project Costs – North Dakota | | | 1,340 | | | | 862 | | | | 2,202 | | 19 months |
| North Dakota Renewable Resource Rider Accrued Revenues | | | 785 | | | | 1,325 | | | | 2,110 | | 24 months |
| General Rate Case Recoverable Expenses | | | 721 | | | | 285 | | | | 1,006 | | 25 months |
| Big Stone II Unrecovered Project Costs – South Dakota | | | 100 | | | | 811 | | | | 911 | | 109 months |
| North Dakota Transmission Rider Accrued Revenues | | | 518 | | | | -- | | | | 518 | | 12 months |
| MISO Schedule 16 and 17 Deferred Administrative Costs - ND | | | 343 | | | | -- | | | | 343 | | 11 months |
| MISO Schedule 26 Transmission Cost Recovery Rider True-up | | | 252 | | | | -- | | | | 252 | | 12 months |
| Deferred Holding Company Formation Costs | | | 55 | | | | 83 | | | | 138 | | 30 months |
| South Dakota – Asset-Based Margin Sharing Shortfall | | | 138 | | | | -- | | | | 138 | | 2 months |
| South Dakota Transmission Rider Accrued Revenues | | | 114 | | | | -- | | | | 114 | | 12 months |
| Total Regulatory Assets | | $ | 27,391 | | | $ | 124,137 | | | $ | 151,528 | | |
| Regulatory Liabilities: | | | | | | | | | | | | | |
| Accumulated Reserve for Estimated Removal Costs – Net of Salvage | | $ | -- | | | $ | 65,610 | | | $ | 65,610 | | asset lives |
| Deferred Income Taxes | | | -- | | | | 3,379 | | | | 3,379 | | asset lives |
| Deferred Gain on Sale of Utility Property – Minnesota Portion | | | 6 | | | | 117 | | | | 123 | | 264 months |
| Deferred Marked-to-Market Gains | | | 96 | | | | -- | | | | 96 | | 12 months |
| South Dakota – Nonasset-Based Margin Sharing Excess | | | 54 | | | | -- | | | | 54 | | 12 months |
| Minnesota Transmission Rider Accrued Refund | | | 28 | | | | -- | | | | 28 | | see notes |
| Total Regulatory Liabilities | | $ | 184 | | | $ | 69,106 | | | $ | 69,290 | | |
| Net Regulatory Asset Position | | $ | 27,207 | | | $ | 55,031 | | | $ | 82,238 | | |
| | | | | Remaining
Recovery/
Refund Period |
| | | December 31, 2012 | |
| (in thousands) | | Current | | | Long-Term | | | Total | |
| Regulatory Assets: | | | | | | | | | |
Prior Service Costs and Actuarial Losses on Pensions and Other Postretirement Benefits1 | | $ | 8,411 | | | $ | 109,538 | | | $ | 117,949 | | see note |
Deferred Marked-to-Market Losses1 | | | 7,949 | | | | 10,050 | | | | 17,999 | | 72 months |
Conservation Improvement Program Costs and Incentives2 | | | 3,707 | | | | 2,560 | | | | 6,267 | | 18 months |
Accumulated ARO Accretion/Depreciation Adjustment1 | | | -- | | | | 4,137 | | | | 4,137 | | asset lives |
Debt Reacquisition Premiums1 | | | 268 | | | | 1,978 | | | | 2,246 | | 237 months |
Big Stone II Unrecovered Project Costs – Minnesota1 | | | 526 | | | | 1,618 | | | | 2,144 | | 45 months |
Recoverable Fuel and Purchased Power Costs1 | | | 1,737 | | | | -- | | | | 1,737 | | 12 months |
Deferred Income Taxes1 | | | -- | | | | 1,691 | | | | 1,691 | | asset lives |
North Dakota Renewable Resource Rider Accrued Revenues2 | | | 532 | | | | 1,087 | | | | 1,619 | | 15 months |
MISO Schedule 26/26A Transmission Cost Recovery Rider True-up1 | | | -- | | | | 1,352 | | | | 1,352 | | see note |
Minnesota Renewable Resource Rider Accrued Revenues2 | | | 915 | | | | -- | | | | 915 | | 5 months |
Big Stone II Unrecovered Project Costs – North Dakota1 | | | 908 | | | | -- | | | | 908 | | 7 months |
Big Stone II Unrecovered Project Costs – South Dakota2 | | | 100 | | | | 711 | | | | 811 | | 97 months |
General Rate Case Recoverable Expenses1 | | | 279 | | | | 6 | | | | 285 | | 13 months |
North Dakota Transmission Rider Accrued Revenues2 | | | 110 | | | | -- | | | | 110 | | 12 months |
Deferred Holding Company Formation Costs1 | | | 55 | | | | 27 | | | | 82 | | 18 months |
South Dakota Transmission Rider Accrued Revenue2 | | | 2 | | | | -- | | | | 2 | | 12 months |
| Total Regulatory Assets | | $ | 25,499 | | | $ | 134,755 | | | $ | 160,254 | | |
| Regulatory Liabilities: | | | | | | | | | | | | | |
| Accumulated Reserve for Estimated Removal Costs – Net of Salvage | | $ | -- | | | $ | 65,960 | | | $ | 65,960 | | asset lives |
| Deferred Income Taxes | | | -- | | | | 2,553 | | | | 2,553 | | asset lives |
| Minnesota Transmission Rider Accrued Refund | | | 489 | | | | -- | | | | 489 | | 12 months |
| Deferred Marked-to-Market Gains | | | 8 | | | | 210 | | | | 218 | | 68 months |
| Deferred Gain on Sale of Utility Property – Minnesota Portion | | | 6 | | | | 112 | | | | 118 | | 252 months |
| South Dakota – Nonasset-Based Margin Sharing Excess | | | 56 | | | | -- | | | | 56 | | 12 months |
| Total Regulatory Liabilities | | $ | 559 | | | $ | 68,835 | | | $ | 69,394 | | |
| Net Regulatory Asset Position | | $ | 24,940 | | | $ | 65,920 | | | $ | 90,860 | | |
1Costs subject to recovery without a rate of return. 2Amount eligible for recovery under an alternative revenue program which includes an incentive or rate of return. |
The regulatory asset related to the unrecognized transition obligation, prior service costs and actuarial losses on pensions and other postretirement benefits represents benefit costs and actuarial losses subject to recovery through rates as they are expensed over the remaining service lives of active employees included in the plans. These unrecognized benefit costs and actuarial losses are required to be recognized as components of Accumulated Other Comprehensive Income in equity under ASC Topic 715, Compensation—Retirement Benefits, but are eligible for treatment as regulatory assets based on their probable recovery in future retail electric rates.
All Deferred Marked-to-Market Gains and Losses recorded as of December 31, 20122013 are related to forward purchases of energy scheduled for delivery through December 2018.
Conservation Improvement Program Costs and Incentives represent mandated conservation expenditures and incentives recoverable through retail electric rates.
The Accumulated Asset Retirement Obligation (ARO) Accretion/Depreciation Adjustment will accrete and be amortized over the lives of property with asset retirement obligations.
Big Stone II Unrecovered Project Costs – Minnesota are the Minnesota share of generation and transmission plant-related costs incurred by OTP related to its participation in the abandoned Big Stone II generation project.
MISO Schedule 26/26A Transmission Cost Recovery Rider True-up relates to the over/under collection of revenue based on comparison of the expected versus actual construction on eligible projects in the period. The true-up also includes the state jurisdictional portion of MISO Schedule 26/26A for regional transmission cost recovery that was included in the calculation of the state transmission riders and subsequently adjusted to reflect actual billing amounts in the schedule. The December 31, 2013 balance will be amortized on a straight-line basis over two consecutive 12-month periods beginning in January 2014.
Debt Reacquisition Premiums are being recovered from OTP customers over the remaining original lives of the reacquired debt issues, the longest of which is 237225 months.
North Dakota Environmental Cost Recovery Rider Accrued Revenues relate to a return granted on the North Dakota share of amounts invested in the construction of the Big Stone II Unrecovered Project Costs – Minnesota are the Minnesota share of costs incurred by OTP relatedPlant AQCS project. The rider, approved in December 2013, is retroactive to its participationJanuary 2013. The balance in the abandoned Big Stone II generation project.regulatory asset account is subject to recovery over a twelve month period ending on December 31, 2014.
The regulatory assets and liabilities related to Deferred Income Taxes result from changes in statutory tax rates accounted for in accordance with ASC 740, Income Taxes.
Big Stone II Unrecovered Project Costs – South Dakota are the South Dakota share of generation and transmission plant-related costs incurred by OTP related to its participation in the abandoned Big Stone II generation project.
North Dakota Renewable Resource Rider Accrued Revenues relate to revenues earned on qualifying renewable resource costs incurred to serve North Dakota customers that have not been billed to North Dakota customers as of December 31, 2012.2013.
MISO Schedule 26 Transmission Cost Recovery Rider True-up relatesBig Stone II Unrecovered Project Costs – North Dakota are the North Dakota share of generation and transmission plant-related costs incurred by OTP related to the Minnesota jurisdictional portion of MISO Schedule 26 for regional transmission cost recovery that was includedits participation in the calculation of the Minnesota Transmission Rider and subsequently adjusted to reflect actual billing amounts in the schedule. The December 31, 2012 balance will be amortized on a straight-line basis over a period of 12 months beginning in January 2014.abandoned Big Stone II generation project.
Minnesota Renewable Resource Rider Accrued Revenues relate to revenues earned on qualifying 2008 through December 31, 2012 renewable resource costs incurred to serve Minnesota customers that have not been billed to Minnesota customers as of December 31, 2012.2013. A supplemental filing was submitted to the MPUC on February 15, 2013, requesting that the then current MNRRA rate be retained until a majority of the remaining costs were recovered and that the MNRRA rate be set to zero effective May 1, 2013. The MPUC approved the request on April 4, 2013 and authorized that any unrecovered balance be retained as a regulatory asset to be recovered in OTP’s next general rate case.
Big Stone II Unrecovered Project Costs – North Dakota are the North Dakota share of costs incurred by OTP related to its participation in the abandoned Big Stone II generation project.
Big Stone II Unrecovered Project Costs – South Dakota are the South Dakota share of costs incurred by OTP related to its participation in the abandoned Big Stone II generation project. OTP will be allowed to earn a return on the amount subject to recovery over a ten-year recovery period. Therefore, the South Dakota settlement amount is not discounted.
General Rate Case Recoverable Expenses relate to expenses incurred during rate case proceedings that are eligible for recovery.
North Dakota Transmission Rider Accrued Revenues relate to revenues earned on qualifying transmission system facilities and net operating costs incurred to serve North Dakota customers that have not been billed to North Dakota customers as of December 31, 2012.
The South Dakota Transmission Rider Accrued Revenues relate to revenues billed for qualifying transmission system facilities and operating costs incurred to serve South Dakota customers net of transmission revenues that are refundablehave not been billed to South Dakota customers as of December 31, 2012.2013.
General Rate Case Recoverable Expenses – South Dakota relate to expenses incurred during rate case proceedings that are eligible for recovery.
The Accumulated Reserve for Estimated Removal Costs – Net of Salvage is reduced as actual removal costs, net of salvage revenues, are incurred.
The Minnesota Transmission Rider Accrued Refund relates to revenues billed forearned on qualifying transmission system facilities and operating costs incurred to serve Minnesota customers net of transmission revenues that are refundable to Minnesota customers as of December 31, 2012.2013.
Revenue for Rate Case Expenses Subject to Refund - Minnesota relate to revenues collected under general rates to recover costs related to prior rate case proceedings in excess of the actual costs incurred, which are subject to refund.
The North Dakota Renewable Resource Rider Accrued Refund relates to amounts collected for qualifying renewable resource costs incurred to serve North Dakota customers that are refundable to North Dakota customers as of December 31, 2013.
The North Dakota Transmission Rider Accrued Refund relates to amounts collected for qualifying transmission system facilities and operating costs incurred to serve North Dakota customers net of transmission revenues that are refundable to North Dakota customers as of December 31, 2013.
South Dakota – Nonasset-Based Margin Sharing Excess represents 25% of OTP’s South Dakota share of actual profit margins on nonasset-based wholesale sales of electricity. The excess margins accumulated annually will be subject to refund through future retail rate adjustments in South Dakota in the following year.
If for any reason, OTP ceases to meet the criteria for application of guidance under ASC 980 for all or part of its operations, the regulatory assets and liabilities that no longer meet such criteria would be removed from the consolidated balance sheet and included in the consolidated statement of income as an extraordinary expense or income item in the period in which the application of guidance under ASC 980 ceases.
5. Forward Contracts Classified as Derivatives
Electricity Contracts
All of OTP’s wholesale purchases and sales of energy under forward contracts that do not meet the definition of capacity contracts are considered derivatives subject to mark-to-market accounting. OTP’s objective in entering into forward contracts for the purchase and sale of energy is to optimize the use of its generating and transmission facilities and leverage its knowledge of wholesale energy markets in the region to maximize financial returns for the benefit of both its customers and shareholders. OTP’s intent in entering into certain of these contracts is to settle them through the physical delivery of energy when physically possible and economically feasible. OTP also enters into certain contracts for trading purposes with the intent to profit from fluctuations in market prices through the timing of purchases and sales.
As of December 31, 20122013 OTP had recognized, on a pretax basis, $49,000$115,000 in net unrealized gains on open forward contracts for the purchase and sale of electricity. The marketMarket prices used to value OTP’s forward contracts for the purchases and sales of electricity and electricity generating capacity are determined by survey of counterparties or brokers used by OTP’s power services’ personnel responsible for contract pricing, as well as prices gathered from daily settlement prices published by the Intercontinental Exchange and CME Globex. For certain contracts, prices at illiquid trading points are based on a basis spread between that trading point and more liquid trading hub prices. These basis spreads are determined based on available market price information and the use of forward price curve models. The fair value measurements of these forward energy contracts fall into level 2 and levelLevel 3 of the fair value hierarchy set forth in ASC 820, Fair Value Measurement.820.
Electric operating revenues include wholesale electric sales and net unrealized derivative gains on forward energy contracts, the acquisition and settlement of financial transmission rights and congestion revenue rights options in the MISO and Electric Reliability Council of Texas (ERCOT) markets, and daily settlements of virtual transactions in the MISO, ERCOT and California Independent Transmission System Operator markets, broken down as follows for the years ended December 31:
| | | | | | | | | | |
| (in thousands) | | 2013 | | | 2012 | | | 2011 | |
| Wholesale Sales - Company-Owned Generation | | $ | 14,846 | | | $ | 12,951 | | | $ | 14,518 | |
| Revenue from Settled Contracts at Market Prices | | | 133,238 | | | | 160,987 | | | | 168,313 | |
| Market Cost of Settled Contracts | | | (132,055 | ) | | | (159,500 | ) | | | (166,920 | ) |
| Net Margins on Settled Contracts at Market | | | 1,183 | | | | 1,487 | | | | 1,393 | |
| Marked-to-Market Gains on Settled Contracts | | | 3,039 | | | | 7,864 | | | | 10,208 | |
| Marked-to-Market Losses on Settled Contracts | | | (2,722 | ) | | | (7,974 | ) | | | (10,176 | ) |
| Net Marked-to-Market Gains (Losses) on Settled Contracts | | | 317 | | | | (110 | ) | | | 32 | |
| Unrealized Marked-to-Market Gains on Open Contracts | | | 215 | | | | 284 | | | | 3,707 | |
| Unrealized Marked-to-Market Losses on Open Contracts | | | (100 | ) | | | (235 | ) | | | (2,813 | ) |
| Net Unrealized Marked-to-Market Gains on Open Contracts | | | 115 | | | | 49 | | | | 894 | |
| Wholesale Electric Revenue | | $ | 16,461 | | | $ | 14,377 | | | $ | 16,837 | |
| (in thousands) | | 2012 | | | 2011 | | | 2010 | |
| Wholesale Sales - Company-Owned Generation | | $ | 12,951 | | | $ | 14,518 | | | $ | 20,053 | |
Revenue from Settled Contracts at Market Prices | | | 160,987 | | | | 168,313 | | | | 147,003 | |
| Market Cost of Settled Contracts | | | (159,500 | ) | | | (166,920 | ) | | | (145,994 | ) |
| Net Margins on Settled Contracts at Market | | | 1,487 | | | | 1,393 | | | | 1,009 | |
Marked-to-Market Gains on Settled Contracts | | | 7,864 | | | | 10,208 | | | | 18,901 | |
| Marked-to-Market Losses on Settled Contracts | | | (7,974 | ) | | | (10,176 | ) | | | (17,529 | ) |
| Net Marked-to-Market (Losses) Gains on Settled Contracts | | | (110 | ) | | | 32 | | | | 1,372 | |
Unrealized Marked-to-Market Gains on Open Contracts | | | 284 | | | | 3,707 | | | | 6,700 | |
| Unrealized Marked-to-Market Losses on Open Contracts | | | (235 | ) | | | (2,813 | ) | | | (5,937 | ) |
| Net Unrealized Marked-to-Market Gains on Open Contracts | | | 49 | | | | 894 | | | | 763 | |
Wholesale Electric Revenue | | $ | 14,377 | | | $ | 16,837 | | | $ | 23,197 | |
The following tables show the effect of marking to market forward contracts for the purchase and sale of electricity and the location and fair value amounts of the related derivatives reported on the Company’s consolidated balance sheets as of December 31, 20122013 and December 31, 2011,2012, and the change in the Company’s consolidated balance sheet position from December 31, 2012 to December 31, 2013 and December 31, 2011 to December 31, 2012 and December 31, 2010 to December 31, 2011:2012:
| | | | | | | |
| (in thousands) | | December 31, 2013 | | | December 31, 2012 | |
| Other Current Asset – Marked-to-Market Gain | | $ | 338 | | | $ | 502 | |
| Regulatory Asset – Current Deferred Marked-to-Market Loss | | | 3,008 | | | | 7,949 | |
| Regulatory Asset – Long-Term Deferred Marked-to-Market Loss | | | 8,674 | | | | 10,050 | |
| Total Assets | | | 12,020 | | | | 18,501 | |
| Current Liability – Marked-to-Market Loss | | | (11,782 | ) | | | (18,234 | ) |
| Regulatory Liability – Current Deferred Marked-to-Market Gain | | | (6 | ) | | | (8 | ) |
| Regulatory Liability – Long-Term Deferred Marked-to-Market Gain | | | (117 | ) | | | (210 | ) |
| Total Liabilities | | | (11,905 | ) | | | (18,452 | ) |
| Net Fair Value of Marked-to-Market Energy Contracts | | $ | 115 | | | $ | 49 | |
| (in thousands) | | December 31, 2012 | | | December 31, 2011 | |
| | | | | | | | | |
| Other Current Asset – Marked-to-Market Gain | | $ | 502 | | | $ | 3,803 | |
| Regulatory Asset – Current Deferred Marked-to-Market Loss | | | 7,949 | | | | 5,208 | |
| Regulatory Asset – Long-Term Deferred Marked-to-Market Loss | | | 10,050 | | | | 10,749 | |
| Total Assets | | | 18,501 | | | | 19,760 | |
| | | | | | | | | |
| Current Liability – Marked-to-Market Loss | | | (18,234 | ) | | | (18,770 | ) |
| Regulatory Liability – Current Deferred Marked-to-Market Gain | | | (8 | ) | | | (96 | ) |
| Regulatory Liability – Long-Term Deferred Marked-to-Market Gain | | | (210 | ) | | | -- | |
| Total Liabilities | | | (18,452 | ) | | | (18,866 | ) |
| | | | | | | | | |
| Net Fair Value of Marked-to-Market Energy Contracts | | $ | 49 | | | $ | 894 | |
| | | | | | | |
| (in thousands) | | Year ended December 31, 2013 | | | Year ended December 31, 2012 | |
| Cumulative Fair Value Adjustments Included in Earnings - Beginning of Period | | $ | 49 | | | $ | 894 | |
| Less: Amounts Realized on Settlement of Contracts Entered into in Prior Periods | | | (49 | ) | | | (861 | ) |
| Changes in Fair Value of Contracts Entered into in Prior Periods | | | -- | | | | (33 | ) |
| Cumulative Fair Value Adjustments in Earnings of Contracts Entered into in Prior Years at End of Period | | | -- | | | | -- | |
| Changes in Fair Value of Contracts Entered into in Current Period | | | 115 | | | | 49 | |
| Cumulative Fair Value Adjustments Included in Earnings - End of Period | | $ | 115 | | | $ | 49 | |
| (in thousands) | | Year ended December 31, 2012 | | | Year ended December 31, 2011 | |
| Cumulative Fair Value Adjustments Included in Earnings - Beginning of Period | | $ | 894 | | | $ | 763 | |
| Less: Amounts Realized on Settlement of Contracts Entered into in Prior Periods | | | (861 | ) | | | (356 | ) |
| Changes in Fair Value of Contracts Entered into in Prior Periods | | | (33 | ) | | | (86 | ) |
| Cumulative Fair Value Adjustments in Earnings of Contracts Entered into in Prior Years at End of Period | | | -- | | | | 321 | |
| Changes in Fair Value of Contracts Entered into in Current Period | | | 49 | | | | 573 | |
| Cumulative Fair Value Adjustments Included in Earnings - End of Period | | $ | 49 | | | $ | 894 | |
The $49,000$115,000 in recognized but unrealized net gains on the forward energy and capacity purchases and sales marked to market on December 31, 20122013 is expected to be realized on settlement in the first quarter of 2013.2014.
OTP has credit risk associated with the nonperformance or nonpayment by counterparties to its forward energy and capacity purchases and sales agreements. We haveThe Company has established guidelines and limits to manage credit risk associated with wholesale power and capacity purchases and sales. Specific limits are determined by a counterparty’s financial strength.
The following table provides information on OTP’s credit risk exposure on delivered and marked-to-market forward contracts as of December 31, 20122013 and December 31, 2011:2012:
| | | | | | | |
| | | December 31, 2013 | | | December 31, 2012 | |
| (in thousands) | | Exposure | | | Counterparties | | | Exposure | | | Counterparties | |
| Net Credit Risk on Forward Energy Contracts | | $ | 856 | | | | 3 | | | $ | 580 | | | | 6 | |
| Net Credit Risk to Single Largest Counterparty | | $ | 530 | | | | | | | $ | 285 | | | | | |
| | | December 31, 2012 | | | December 31, 2011 | |
| (in thousands) | | Exposure | | | Counterparties | | | Exposure | | | Counterparties | |
| Net Credit Risk on Forward Energy Contracts | | $ | 580 | | | | 6 | | | $ | 1,677 | | | | 10 | |
| Net Credit Risk to Single Largest Counterparty | | $ | 285 | | | | | | | $ | 737 | | | | | |
OTP had a net credit risk exposure to fivethree counterparties with investment grade credit ratings and one counterparty that has not been rated by an external credit rating agency but has been evaluated internally and assigned an internal credit rating equivalent to investment grade.ratings. OTP had no exposure at December 31, 20122013 or December 31, 20112012 to counterparties with credit ratings below investment grade. Counterparties with investment grade credit ratings have minimum credit ratings of BBB- (Standard & Poor’s), Baa3 (Moody’s) or BBB- (Fitch). The credit risk exposures include net amounts due to OTP on receivables/payables from completed transactions billed and unbilled plus marked-to-market gains/lossesgains on forward contracts for the purchase and sale of electricitygasoline scheduled for deliverysettlement subsequent to the reporting date.December 31, 2013. Individual counterparty exposures are offset according to legally enforceable netting arrangements. However, the Company does not net offsetting payables and receivables or derivative assets and liabilities under legally enforceable netting arrangements on the face of its consolidated balance sheet. The amounts of derivative asset and derivative liability balances that were subject to legally enforceable netting arrangements as of December 31, 2013 and December 31, 2012 are indicated in the following table:
| | | | | | | |
| (in thousands) | | December 31, 2013 | | | December 31, 2012 | |
| Derivative Assets Subject to Legally Enforceable Netting Arrangements | | $ | 400 | | | $ | 638 | |
| Derivative Liabilities Subject to Legally Enforceable Netting Arrangements | | | (11,782 | ) | | | (18,234 | ) |
| Net Balance Subject to Legally Enforceable Netting Arrangements | | $ | (11,382 | ) | | $ | (17,596 | ) |
The following table provides a breakdown of OTP’s credit risk standing on forward energy contracts in marked-to-market loss positions as of December 31, 20122013 and December 31, 2011:2012:
| | | | | | |
Current Liability – Marked-to-Market Loss (in thousands) | December 31,
2013 | | | December 31,
2012 | |
| Loss Contracts Covered by Deposited Funds or Letters of Credit | $ | -- | | | $ | 2,176 | |
Contracts Requiring Cash Deposits if OTP’s Credit Falls Below Investment Grade1 | | 11,679 | | | | 16,058 | |
| Loss Contracts with No Ratings Triggers or Deposit Requirements | | 103 | | | | -- | |
| Total Current Liability – Marked-to-Market Loss | $ | 11,782 | | | $ | 18,234 | |
1Certain OTP derivative energy contracts contain provisions that require an investment grade credit rating from each of the major credit rating agencies on OTP’s debt. If OTP’s debt ratings were to fall below investment grade, the counterparties to these forward energy contracts could request the immediate deposit of cash to cover contracts in net liability positions. | | | | | | | |
| Contracts Requiring Cash Deposits if OTP’s Credit Falls Below Investment Grade | $ | 11,679 | | | $ | 16,058 | |
| Offsetting Gains with Counterparties under Master Netting Agreements | | (117 | ) | | | (416 | ) |
| Reporting Date Deposit Requirement if Credit Risk Feature Triggered | $ | 11,562 | | | $ | 15,642 | |
Current Liability – Marked-to-Market Loss (in thousands) | | December 31, 2012 | | | December 31, 2011 | |
| Loss Contracts Covered by Deposited Funds or Letters of Credit | | $ | 2,176 | | | $ | 3,423 | |
Contracts Requiring Cash Deposits if OTP’s Credit Falls Below Investment Grade1 | | | 16,058 | | | | 15,347 | |
| Loss Contracts with No Ratings Triggers or Deposit Requirements | | | -- | | | | -- | |
| Total Current Liability – Marked-to-Market Loss | | $ | 18,234 | | | $ | 18,770 | |
1Certain OTP derivative energy contracts contain provisions that require an investment grade credit rating from each of the major credit rating agencies on OTP’s debt. If OTP’s debt ratings were to fall below investment grade, the counterparties to these forward energy contracts could request the immediate deposit of cash to cover contracts in net liability positions. | | | | | | | | |
| Contracts Requiring Cash Deposits if OTP’s Credit Falls Below Investment Grade | | $ | 16,058 | | | $ | 15,347 | |
| Offsetting Gains with Counterparties under Master Netting Agreements | | | (416 | ) | | | (3,471 | ) |
| Reporting Date Deposit Requirement if Credit Risk Feature Triggered | | $ | 15,642 | | | $ | 11,876 | |
6. Common Shares and Earnings Per Share
Shelf Registration
On May 11, 2012 the Company filed a shelf registration statement with the U.S. Securities and Exchange Commission (SEC) under which it may offer for sale, from time to time, either separately or together in any combination, equity, debt or other securities described in the shelf registration statement, including common shares of the Company.
Common Share Distribution Agreement
On May 14, 2012 the Company entered into a Distribution Agreement (the Agreement) with J.P. Morgan Securities (JPMS) under which the Company may offer and sell its common shares from time to time through JPMS, as the Company’s distribution agent for the offer and sale of the shares, up to an aggregate sales price of $75,000,000.
Under the Agreement, the Company will designate the minimum price and maximum number of shares to be sold through JPMS on any given trading day or over a specified period of trading days, and JPMS will use commercially reasonable efforts to sell such shares on such days, subject to certain conditions. Sales of the shares, if any, will be made by means of ordinary brokers’ transactions on the NASDAQ Global Select Market at market prices or as otherwise agreed with JPMS. The Company may also agree to sell shares to JPMS, as principal for its own account, on terms agreed by the Company and JPMS in a separate agreement at the time of sale. JPMS will receive from the Company a commission of 2% of the gross sales price per share for any shares sold through it as the Company’s distribution agent under the Agreement.
The Company is not obligated to sell and JPMS is not obligated to buy or sell any of the shares under the Agreement. The shares, if issued, will be issued pursuant to the Company’s existing shelf registration statement, as amended. No shares were sold pursuant to the Agreement in 2012.2013.
2013 Common Stock Activity
Following is a reconciliation of the Company’s common shares outstanding from December 31, 20112012 through December 31, 2012:
2013:
| | | | |
Common Shares Outstanding, December 31, 20112012 | | | 36,101,69536,168,368 | |
| Issuances: | | | | |
| Stock Options Exercised | | | 56,109 | |
| Vesting of Restricted Stock Units | | | 17,535 | |
| Restricted Stock Issued to Employees | | | 26,12017,000 | |
Restricted Stock Issued to Nonemployee Directors | | | 24,00017,333 | |
Conversion of Restricted Stock Units VestedDirector’s Compensation | | | 23,4504,535 | |
| Retirements: | | | | |
| Shares Withheld for Individual Income Tax Requirements | | | (5,0727,184 | ) |
| Forfeiture of Unvested Restricted Stock | | | (1,8252,000 | ) |
Common Shares Outstanding, December 31, 20122013 | | | 36,168,36836,271,696 | |
Stock Incentive Plan
The 1999 Stock Incentive Plan, as amended (Incentive Plan), provides for the grant of stock options, stock appreciation rights, restricted stock, restricted stock units, performance awards, and other stock and stock-based awards. A total of 3,600,000 common shares arewere authorized for granting stock awards of which 957,359 were still available as of December 31, 2012 under the Incentive Plan, which terminatesterminated on December 13, 2013.
Employee Stock Purchase Plan
The 1999 Employee Stock Purchase Plan (Purchase Plan) allows eligible employees to purchase the Company’sCompany’s common shares at 85% of the market price at the end of each six-month purchase period. On April 16, 2012, the Company’s shareholders approved an amendment to the Purchase Plan, increasing the number of shares available under the Purchase Plan from 900,000 common shares to 1,400,000 common shares and making certain other changes to the terms of the Purchase Plan. Of the 1,400,000 common shares authorized to be issued under the Purchase Plan, 522,227482,782 were available for purchase as of December 31, 2012.2013. At the discretion of the Company, shares purchased under the Purchase Plan can be either new issue shares or shares purchased in the open market. To provide shares for the Purchase Plan, 43,837 common shares were purchased in the open market in 2013, 60,439 common shares were purchased in the open market in 2012 and 78,537 common shares were purchased in the open market in 2011 and 82,857 common shares were purchased in the open market in 2010.2011. The shares to be purchased by employees participating in the Purchase Plan were not material to the calculation of diluted earnings per share during the investment period.
Dividend Reinvestment and Share Purchase Plan
On May 11, 2012 the Company filed a shelf registration statement with the SEC for the issuance of up to 1,500,000 common shares pursuant to the Company’s Automatic Dividend Reinvestment and Share Purchase Plan (the Plan), which permits shares purchased by shareholders or customers who participate in the Plan to be either new issue common shares or common shares purchased in the open market. In 2013 and 2012 common shares were purchased in the open market to provide shares for the Plan. In 2010 and 2011 common shares were purchased in the open market to provide shares for the Plan under a prior shelf registration statement that expired on December 1, 2011.
Earnings Per Share
The numerator used in the calculation of both basic and diluted earnings per common share is earnings available for common shares with no adjustments in 2013, 2012 2011 or 2010.2011. The denominator used in the calculation of basic earnings per common share is the weighted average number of common shares outstanding during the period excluding nonvested restricted shares granted to the Company’s directors and employees, which are considered contingently returnable and not outstanding for the purpose of calculating basic earnings per share. The denominator used in the calculation of diluted earnings per common share is derived by adjusting outstanding shares for the following: (1) all potentially dilutive stock options, (2) underlying shares related to nonvested restricted stock units granted to employees, (3) nonvested restricted shares, (4) shares expected to be awarded for stock performance awards granted to executive officers, and (5) shares expected to be issued under the deferred compensation program for directors. The adjustmentsAdjustments to the denominatorsdenominator used to calculate basic and diluted earnings per share of 203,583 shares, 194,240 shares and 160,228 shares in 2013, 2012 and 2011, respectively, resulted in no differences greater than $0.01 between basic and diluted earnings per share in total or from continuing or discontinued operations in each of the years ended December 31, 2013, 2012 2011 and 2010.2011.
The following outstanding stock options with exercise prices greater than the average market price of the underlying shares were excluded from the calculation of diluted earnings per share for the years ended December 31, 2013, 2012 2011 and 2010:2011:
| | | |
| Year | Options Outstanding | Range of Exercise Prices | Options Outstanding | Range of Exercise Prices |
| 2013 | | -- |
| 2012 | 92,497 | $24.93 – $27.245 | 92,497 | $24.93 – $27.245 |
| 2011 | 156,397 | $24.93 – $31.34 | 156,397 | $24.93 – $31.34 |
| 2010 | 383,460 | $24.93 – $31.34 | |
7. Share-Based Payments
Purchase Plan
The Purchase Plan allows employees through payroll withholding to purchase shares of the Company’s common stock at a 15% discount from the average market price on the last day of a six month investment period. Under ASC Topic 718, Compensation—Stock Compensation (ASC 718), the Company is required to record compensation expense related to the 15% discount. The 15% discount resulted in compensation expense of $143,000 in 2013, $179,000 in 2012 and $257,000 in 2011 and $277,000 in 2010.2011. The 15% discount is not taxable to the employee and is not a deductible expense for tax purposes for the Company.
Stock Options Granted Under the Incentive Plan
Since the inception of the Incentive Plan in 1999, the Company has granted 2,041,500 options for the purchase of the Company’s common stock. All of the options granted had vested or were forfeited as of December 31, 2007. The exercise price of the options granted was the average market price of the Company’s common stock on the grant date. Under ASC 718 accounting requirements, compensation expense is recorded based on the estimated fair value of the options on their grant date using a fair-value option pricing model. Under ASC 718 accounting requirements, the fair value of the options granted has been recorded as compensation expense over the requisite service period (the vesting period of the options). The estimated fair value of all options granted under the Incentive Plan was based on the Black-Scholes option pricing model.
The following table provides information about options outstanding as of December 31, 2012:
| Exercise Price | Outstanding and
Exercisable as of
12/31/12 | Remaining
Contractual Life
(yrs) |
| $24.93 | 19,800 | 2.3 |
| $26.495 | 20,100 | 1.3 |
| $27.245 | 52,597 | 0.3 |
2013:
| | | |
Exercise Price | Outstanding and
Exercisable as of
12/31/13 | Remaining Contractual Life |
$24.93 | 17,900 | Expire on April 10, 2015 |
$26.495 | 16,800 | Expire on April 11, 2014 |
Presented below is a summary of the stock options activity:
| Stock Option Activity | | 2012 | | | 2011 | | | 2010 | | | 2013 | | | 2012 | | | 2011 | |
| | | Options | | | Average
Exercise
Price | | | Options | | | Average
Exercise Price | | | Options | | | Average
Exercise
Price | | | Options | | | Average
Exercise
Price | | | Options | | | Average
Exercise
Price | | | Options | | | Average
Exercise
Price | |
| Outstanding, Beginning of Year | | | 156,397 | | | $ | 28.53 | | | | 383,460 | | | $ | 27.28 | | | | 444,810 | | | $ | 26.82 | | | | 92,497 | | | $ | 26.59 | | | | 156,397 | | | $ | 28.53 | | | | 383,460 | | | $ | 27.28 | |
| Granted | | | -- | | | | -- | | | | -- | | | | -- | | | | -- | | | | -- | | | | -- | | | | -- | | | | -- | | | | -- | | | | -- | | | | -- | |
| Exercised | | | -- | | | | -- | | | | -- | | | | -- | | | | 27,800 | | | | 19.75 | | | | 56,109 | | | | 27.12 | | | | -- | | | | -- | | | | -- | | | | -- | |
| Forfeited or Expired | | | 63,900 | | | | 31.34 | | | | 227,063 | | | | 26.43 | | | | 33,550 | | | | 27.38 | | | | 1,688 | | | | 27.245 | | | | 63,900 | | | | 31.34 | | | | 227,063 | | | | 26.43 | |
| Outstanding, End of Year | | | 92,497 | | | | 26.59 | | | | 156,397 | | | | 28.53 | | | | 383,460 | | | | 27.28 | | | | 34,700 | | | | 25.69 | | | | 92,497 | | | | 26.59 | | | | 156,397 | | | | 28.53 | |
| Exercisable, End of Year | | | 92,497 | | | | 26.59 | | | | 156,397 | | | | 28.53 | | | | 383,460 | | | | 27.28 | | | | 34,700 | | | | 25.69 | | | | 92,497 | | | | 26.59 | | | | 156,397 | | | | 28.53 | |
| Cash Received for Options Exercised | | | | | | | -- | | | | | | | | -- | | | | | | | $ | 549,000 | | | | | | | $ | 1,522,000 | | | | | | | | -- | | | | | | | | -- | |
| Intrinsic Value of Options Exercised | | | | | | | $ | 152,000 | | | | | | | | -- | | | | | | | | -- | |
| Fair Value of Options Granted During Year | | | | | | none granted | | | | | | | none granted | | | | | | | none granted | | | | | | | none granted | | | | | | | none granted | | | | | | | none granted | |
Restricted Stock Granted to Directors
Under the Incentive Plan, restricted shares of the Company’s common stock have been granted to members of the Company’s Board of Directors as a form of compensation. Under ASC 718 accounting requirements, compensation expense related to restricted shares is based on the fair value of the restricted shares on their grant dates. On April 16, 20128, 2013 the Company’s Board of Directors granted 24,00016,000 shares of restricted stock to the Company’s nonemployee directors. The grant date fair value of each share of restricted stock granted on April 8, 2013 was $31.03 per share, the average of the high and low market price on the date of grant. On September 23, 2013 the Compensation Committee of the Company’s Board of Directors granted Steven L. Fritze, a new Director, 1,333 shares of restricted stock effective October 1, 2013. The grant date fair value of each share of restricted stock granted on October 1, 2013 was $27.67 per share, the average of the high and low market price on the date of grant. The restricted shares granted in 2013 vest 25% per year on April 8 of each year in the period 20132014 through 20162017 and are eligible for full dividend and voting rights. Restricted shares not vested and dividends on those restricted shares are subject to forfeiture under the terms of the restricted stock award agreement. The grant date fair value of each share of restricted stock was $21.32 per share, the average market price on the date of grant.
Presented below is a summary of the status of directors’ restricted stock awards for the years ended December 31:
| Directors’ Restricted Stock Awards | | 2012 | | | 2011 | | | 2010 | |
| | | Shares | | | Weighted Average
Grant-Date
Fair Value | | | Shares | | | Weighted Average Grant-Date
Fair Value | | | Shares | | | Weighted Average
Grant-Date
Fair Value | |
| Nonvested, Beginning of Year | | | 54,250 | | | $ | 23.26 | | | | 59,725 | | | $ | 24.95 | | | | 54,300 | | | $ | 27.81 | |
| Granted | | | 24,000 | | | | 21.32 | | | | 24,000 | | | | 22.51 | | | | 24,800 | | | | 21.835 | |
| Vested | | | 21,350 | | | | 24.86 | | | | 29,475 | | | | 26.07 | | | | 19,375 | | | | 28.98 | |
| Forfeited | | | -- | | | | | | | | -- | | | | | | | | -- | | | | | |
| | | | | | | | | | | | | | | | | | | | | | | | | |
| Nonvested, End of Year | | | 56,900 | | | | 21.84 | | | | 54,250 | | | | 23.26 | | | | 59,725 | | | | 24.95 | |
| Compensation Expense Recognized | | | | | | $ | 552,000 | | | | | | | $ | 740,000 | | | | | | | $ | 595,000 | |
| | | | | | | | | | | | | | | | | | | | | | | | | |
| Fair Value of Shares Vested in Year | | | | | | | 531,000 | | | | | | | | 768,000 | | | | | | | | 561,000 | |
| Directors’ Restricted Stock Awards | | 2013 | | | 2012 | | | 2011 | |
| | | Shares | | | Weighted
Average
Grant-Date Fair Value | | | Shares | | | Weighted
Average
Grant-Date
Fair Value | | | Shares | | | Weighted Average
Grant-Date
Fair Value | |
| Nonvested, Beginning of Year | | | 56,900 | | | $ | 21.84 | | | | 54,250 | | | $ | 23.26 | | | | 59,725 | | | $ | 24.95 | |
| Granted | | | 17,333 | | | | 30.77 | | | | 24,000 | | | | 21.32 | | | | 24,000 | | | | 22.51 | |
| Vested | | | 29,750 | | | | 21.87 | | | | 21,350 | | | | 24.86 | | | | 29,475 | | | | 26.07 | |
| Forfeited | | | 2,000 | | | | 31.03 | | | | -- | | | | | | | | -- | | | | | |
| Nonvested, End of Year | | | 42,483 | | | | 25.03 | | | | 56,900 | | | | 21.84 | | | | 54,250 | | | | 23.26 | |
| Compensation Expense Recognized | | | | | | $ | 611,000 | | | | | | | $ | 552,000 | | | | | | | $ | 740,000 | |
| Fair Value of Shares Vested in Year | | | | | | | 651,000 | | | | | | | | 531,000 | | | | | | | | 768,000 | |
Restricted Stock Granted to Employees
Under the Incentive Plan, restricted shares of the Company’s common stock have been granted to employees as a form of compensation. Under ASC 718 accounting requirements, compensation expense related to restricted shares is based on the fair value of the restricted shares on their grant dates. On April 16, 20128, 2013 the Company’s Board of Directors granted 24,50017,000 shares of restricted stock to the Company’s executive officers under the Incentive Plan. The restricted shares vest 25% per year on April 8 of each year in the period 20132014 through 20162017 and are eligible for full dividend and voting rights. Restricted shares not vested and dividends on those restricted shares are subject to forfeiture under the terms of the restricted stock award agreement. The grant date fair value of each share of restricted stock granted in 2013 was $21.32$31.03 per share, the average of the high and low market price on the date of grant.
On October 1, 2012 the Company’s Board of Directors granted 1,620 shares of restricted stock to the Company’s Vice President of Human Resources under the Incentive Plan. The restricted shares vest 25% per year on April 8 of each year in the period 2013 through 2016 and are eligible for full dividend and voting rights. Restricted shares not vested and dividends on those restricted shares are subject to forfeiture under the terms of the restricted stock award agreement. The grant date fair value of the award was $23.93 per share, the average market price on the date of the grant.
Presented below is a summary of the status of employees’ restricted stock awards for the years ended December 31:
| Employees’ Restricted Stock Awards | | 2012 | | | 2011 | | | 2010 | | | 2013 | | | 2012 | | | 2011 | |
| | | Shares | | | Weighted Average Grant-Date Fair Value | | | Shares | | | Weighted Average Grant-Date Fair Value | | | Shares | | | Weighted Average Grant-Date Fair Value | | | Shares | | | Weighted Average Grant-Date Fair Value | | | Shares | | | Weighted Average Grant-Date Fair Value | | | Shares | | | Weighted Average Grant-Date Fair Value | |
| Nonvested, Beginning of Year | | | 34,868 | | | $ | 22.86 | | | | 66,161 | | | $ | 24.79 | | | | 50,478 | | | $ | 28.31 | | | | 47,645 | | | $ | 21.82 | | | | 34,868 | | | $ | 22.86 | | | | 66,161 | | | $ | 24.79 | |
| Granted | | | 26,120 | | | | 21.48 | | | | 24,600 | | | | 22.51 | | | | 31,600 | | | | 21.835 | | | | 17,000 | | | | 31.03 | | | | 26,120 | | | | 21.48 | | | | 24,600 | | | | 22.51 | |
| Awards Vested | | | 11,518 | | | | 24.14 | | | | 55,893 | | | | 25.00 | | | | 15,917 | | | | 29.76 | | | | 16,330 | | | | 21.89 | | | | 11,518 | | | | 24.14 | | | | 55,893 | | | | 25.00 | |
| Forfeited | | | 1,825 | | | | 22.20 | | | | -- | | | | | | | | -- | | | | | | | | -- | | | | | | | | 1,825 | | | | 22.20 | | | | -- | | | | | |
| Nonvested, End of Year | | | 47,645 | | | | 21.82 | | | | 34,868 | | | | 22.86 | | | | 66,161 | | | | 24.79 | | | | 48,315 | | | | 25.04 | | | | 47,645 | | | | 21.82 | | | | 34,868 | | | | 22.86 | |
| Compensation Expense Recognized | | | | | | $ | 325,000 | | | | | | | $ | 832,000 | | | | | | | $ | 914,000 | | | | | | | $ | 427,000 | | | | | | | $ | 325,000 | | | | | | | $ | 832,000 | |
| Fair Value of Awards Vested | | | | | | | 278,000 | | | | | | | | 1,397,000 | | | | | | | | 474,000 | | | | | | | | 358,000 | | | | | | | | 278,000 | | | | | | | | 1,397,000 | |
Restricted Stock Units Granted to Employees
On April 16, 20128, 2013 the Company’s Board of Directors granted 12,80015,150 restricted stock units to key employees under the Incentive Plan payable in common shares on April 8, 2016,2017, the date the units vest. The grant date fair value of each restricted stock unit was $17.14$25.30 per share based on the market value of the Company’s common stock on April 16, 2012,8, 2013, discounted for the value of the dividend exclusion over the four-year vesting period.
On October 1, 2012 the Company’s Board of Director’s granted 3,000 restricted stock units to key employees under the Incentive Plan payable in common shares on April 8, 2016, the date the units vest. The grant date fair value of each restricted stock unit was $19.87 per share based on the market value of the Company’s common stock on October 1, 2012, discounted for the fair value of the dividend exclusion over the vesting period. The weighted average contractual term of stock units outstanding as of December 31, 2012 is 2.5 years.
Presented below is a summary of the status of employees’ restricted stock unit awards for the years ended December 31:
| Employees’ Restricted Stock Unit Awards | | 2012 | | | 2011 | | | 2010 | | | 2013 | | | 2012 | | | 2011 | |
| | | Restricted Stock Units | | | Weighted Average Grant-Date Fair Value | | | Restricted Stock Units | | | Weighted Average Grant-Date Fair Value | | | Restricted Stock Units | | | Weighted Average Grant-Date Fair Value | | | Restricted Stock Units | | | Weighted Average Grant-Date Fair Value | | | Restricted Stock Units | | | Weighted Average Grant-Date Fair Value | | | Restricted Stock Units | | | Weighted Average Grant-Date Fair Value | |
| Nonvested, Beginning of Year | | | 73,815 | | | $ | 20.95 | | | | 79,315 | | | $ | 23.55 | | | | 92,670 | | | $ | 25.42 | | | | 60,665 | | | $ | 18.11 | | | | 73,815 | | | $ | 20.95 | | | | 79,315 | | | $ | 23.55 | |
| Granted | | | 15,800 | | | | 17.66 | | | | 19,800 | | | | 18.03 | | | | 26,180 | | | | 17.76 | | | | 15,150 | | | | 25.30 | | | | 15,800 | | | | 17.66 | | | | 19,800 | | | | 18.03 | |
| Vested | | | 20,750 | | | | 27.13 | | | | 20,025 | | | | 27.94 | | | | 18,965 | | | | 23.93 | | | | 17,535 | | | | 18.73 | | | | 20,750 | | | | 27.13 | | | | 20,025 | | | | 27.94 | |
| Forfeited | | | 8,200 | | | | 19.97 | | | | 5,275 | | | | 22.56 | | | | 20,570 | | | | 25.55 | | | | 2,100 | | | | 19.88 | | | | 8,200 | | | | 19.97 | | | | 5,275 | | | | 22.56 | |
| Nonvested, End of Year | | | 60,665 | | | | 18.11 | | | | 73,815 | | | | 20.95 | | | | 79,315 | | | | 23.55 | | | | 56,180 | | | | 19.79 | | | | 60,665 | | | | 18.11 | | | | 73,815 | | | | 20.95 | |
| Compensation Expense Recognized | | | | | | $ | 256,000 | | | | | | | $ | 349,000 | | | | | | | $ | 250,000 | | | | | | | $ | 275,000 | | | | | | | $ | 256,000 | | | | | | | $ | 349,000 | |
| Fair Value of Units Converted in Year | | | | | | | 563,000 | | | | | | | | 559,000 | | | | | | | | 454,000 | | | | | | | | 328,000 | | | | | | | | 563,000 | | | | | | | | 559,000 | |
Stock Performance Awards granted to Executive Officers
The Compensation Committee of the Company’s Board of Directors has approved stock performance award agreements under the Incentive Plan for the Company’s executive officers. Under these agreements, the officers could be awarded shares of the Company’s common stock based on the Company’s total shareholder return relative to that of its peer group of companies in the Edison Electric Institute (EEI) Index over a three-year period beginning on January 1 of the year the awards are granted. The number of shares earned, if any, will be awarded and issued at the end of each three-year performance measurement period. The participants have no voting or dividend rights under these award agreements until the shares are issued at the end of the performance measurement period. The terms of the outstanding awards dictate that these awards be classified and accounted for as liability awards, in accordance with the requirements of ASC 718, with compensation measured over the performance period based on the fair value of the award at the end of each reporting period subsequent to the grant date.
On April 16, 20128, 2013 the Company’s Board of Directors granted performance share awards to the Company’s executive officers under the Incentive Plan for the 2012-20142013-2015 performance measurement period.
The table below provides a summary of stock performance awards granted and amounts expensed related to the stock performance awards:
Performance
Period | | Maximum
Shares Subject To Award | | | Shares Used
To Estimate
Expense | | | Grant
Date Fair
Value | | | Expense Recognized in the Year Ended December 31, | | | Shares
Awarded | | | Maximum Shares Subject To Award | | | Shares Used To Estimate Expense | | | Grant Date Fair Value | | | Expense Recognized in the Year Ended December 31, | | | Shares Awarded | |
| | | | | | | | | | | | 2012 | | | 2011 | | | 2010 | | | | | | | | | | | | | | | 2013 | | | 2012 | | | 2011 | | | | |
| 2013-2015 | | | | 100,400 | | | | 50,200 | | | $ | 37.51 | | | $ | 580,000 | | | $ | -- | | | $ | -- | | | | -- | |
| 2012-2014 | | | 161,600 | | | | 121,539 | | | $ | 21.75 | | | | 1,001,000 | | | $ | -- | | | $ | -- | | | | -- | | | | 161,600 | | | | 80,800 | | | $ | 21.75 | | | | 1,686,000 | | | | 1,001,000 | | | | -- | | | | -- | |
| 2011-2013 | | | 97,200 | | | | 15,435 | | | $ | 23.61 | | | | 254,000 | | | | 553,000 | | | | -- | | | | 26,100 | | | | 97,200 | | | | 48,600 | | | $ | 23.61 | | | | 412,000 | | | | 254,000 | | | | 553,000 | | | | 48,730 | |
| 2010-2012 | | | 146,800 | | | | 73,400 | | | $ | 20.97 | | | | -- | | | | 572,000 | | | | 513,000 | | | | 49,500 | | | | 146,800 | | | | 73,400 | | | $ | 20.97 | | | | -- | | | | -- | | | | 572,000 | | | | 49,500 | |
| 2009-2011 | | | 181,200 | | | | 90,600 | | | $ | 27.98 | | | | -- | | | | 746,000 | | | | (178,000 | ) | | | 64,500 | | | | 181,200 | | | | 90,600 | | | $ | 27.98 | | | | -- | | | | -- | | | | 746,000 | | | | 64,500 | |
| 2008-2010 | | | 114,800 | | | | 70,843 | | | $ | 37.59 | | | | -- | | | | -- | | | | 888,000 | | | | 18,600 | | |
| Total | | | | | | | | | | | | | | $ | 1,255,000 | | | $ | 1,871,000 | | | $ | 1,223,000 | | | | 158,700 | | | | | | | | | | | | | | | $ | 2,678,000 | | | $ | 1,255,000 | | | $ | 1,871,000 | | | | 162,730 | |
The Company’s former Chief Executive Officer resigned his employment with the Company effective December 15, 2011, and his resignation was treated as a termination without cause for the purposes of his employment agreement. Under the terms of his employment agreement, he received the targeted number of the Company’s common shares for the performance awards granted him in 2009, 2010 and 2011, or 88,300 shares, valued at the average of the high and low price of the Company’s common shares on December 14, 2011 of $21.191 per share, for a total value of $1,871,165.
The Company’s former Chief Operating Officer resigned his employment with the Company effective December 30, 2010 with good reason as that term is defined in his employment agreement. Under the terms of his employment agreement, he received the targeted number of the Company’s common shares for the performance awards granted him in 2008, 2009 and 2010, or 70,400 shares, valued at the average of the high and low price of the Company’s common shares on December 30, 2010 of $22.78 per share, for a total value of $1,603,712.
The shares awarded shown in the table above for the 2008-2010, 2009-2011 2010-2012 and 2011-20132010-2012 performance periods reflect only shares received under the executive employment agreements. The Company’s 2008-2010, 2009-2011 and 2010-2012 total shareholder return rankings resulted in no incentive share awards for the Company’s active plan participants for the 2008-2010, 2009-2011 and 2010-2012 performance measurement periods.
The expense recorded in 2010 related to the 2008-2010 performance measurement period reflects one-third of the grant-date fair value of the total targeted number of awards for that performance period. The expense recorded in 2010 related to the 2009-2011 performance measurement period liability awards reflects the December 31, 2010 fair value of these awards, estimated to be $0, which resulted in a reversal of $845,000 of expense accrued in 2009, plus the December 30, 2010 market value of the former Chief Operating Officer’s 2009-2011 targeted share awards of $667,000. The expense recorded in 2010 related to the 2010-2012 performance measurement period liability awards reflects the December 31, 2010 fair value of these awards, estimated to be $0, plus the December 30, 2010 market value of the former Chief Operating Officer’s 2010-2012 targeted share awards of $513,000.
As of December 31, 20122013 the total remaining unrecognized amount of compensation expense related to stock-based compensation for all of the Company’s stock-based payment programs was approximately $4.0$4.6 million (before income taxes), which will be amortized over a weighted-average period of 2.22.0 years.
8. Retained Earnings and Dividend Restriction
The Company’s Restated Articles of Incorporation, as amended, contain provisions that limit the amount of dividends that may be paid to common shareholders by the amount of any declared but unpaid dividends to holders of the Company’s cumulative preferred shares. Under these provisions none of the Company’s retained earnings were restricted at December 31, 2012.
The Company is a holding company with no significant operations of its own. The primary source of funds for payments of dividends to the Company’s shareholders is from dividends paid or distributions made by the Company’s subsidiaries. As a result of certain statutory limitations or regulatory or financing agreements, restrictions could occur on the amount of distributions allowed to be made by the Company’s subsidiaries.
Both the Company and OTP’s credit agreements contain restrictions on the payment of cash dividends upon a default or event of default. An event of default would be considered to have occurred if the Company did not meet certain financial covenants. As of December 31, 20122013 the Company was in compliance with the debt covenants. See note 10 for further information on the covenants.
Under the Federal Power Act, a public utility may not pay dividends from any funds properly included in a capital account. What constitutes “funds properly included in a capital account” is undefined in the Federal Power Act or the related regulations; however, FERC has consistently interpreted the provision to allow dividends to be paid as long as (1) the source of the dividends is clearly disclosed, (2) the dividend is not excessive and (3) there is no self-dealing on the part of corporate officials.
The MPUC indirectly limits the amount of dividends OTP can pay to the Company by requiring an equity-to-total-capitalization ratio between 46.3%44.8% and 56.7%54.8%. OTP’s equity to total capitalization ratio including short-term debt was 52.0%50.2% as of December 31, 2012.2013. Total capitalization for OTP cannot currently exceed $809$874 million.
9. Commitments and Contingencies
Construction and Other Purchase Commitments
At December 31, 20122013 OTP had commitments under contracts in connection with construction programs aggregating approximately $79,413,000.$108,227,000.
Electric Utility Capacity and Energy Requirements and Coal and Delivery Contracts
OTP has commitments for the purchase of capacity and energy requirements under agreements extending through 2032.2038. OTP has contracts providing for the purchase and delivery of a significant portion of its current coal requirements. OTP’s current coal purchase agreements, under which OTP is committed to the minimum purchase amounts or to make payments in lieu thereof, expire in 2014, 2015, 2016 and 2040. Fuel clause adjustment mechanisms lessen the risk of loss from market price changes because they provide for recovery of most fuel costs. See table below for schedule of commitments.
Operating Leases
OTP has obligations to make future operating lease payments primarily related to land leases and coal rail-car leases. The Company’s nonelectric companies have obligations to make future operating lease payments primarily related to leases of buildings, construction equipment and vehicles. Rent expense from continuing operations was $11,114,000, $11,858,000, and $10,061,000 for 2013, 2012 and $10,414,000 for 2012, 2011, and 2010, respectively.
The amounts of the Company’s commitments under capacity and energy agreements, coal and coal delivery contracts and operating leases as of December 31, 2012,2013, are as follows:
| | | | | | | | | | | | | | | | | | | | | | |
| | | Capacity and Energy Requirements | | | Coal and Freight Purchase Commitments | | | | Operating Leases | | | Capacity and
Energy | | | Coal and Freight Purchase | | | Operating Leases | |
(in thousands) | | | | | | | OTP | | | | Nonelectric | | | | Total | | | Requirements | | | Commitments | | | OTP | | | Nonelectric | | | Total | |
| 2013 | | $ | 30,964 | | | $ | 42,875 | | | $ | 2,464 | | | $ | 5,961 | | | $ | 8,425 | | |
| 2014 | | | 15,980 | | | | 20,384 | | | | 2,150 | | | | 4,830 | | | | 6,980 | | | $ | 22,565 | | | $ | 50,149 | | | $ | 2,519 | | | $ | 5,695 | | | $ | 8,214 | |
| 2015 | | | 13,762 | | | | 16,886 | | | | 1,602 | | | | 4,261 | | | | 5,863 | | | | 30,468 | | | | 20,790 | | | | 1,649 | | | | 4,533 | | | | 6,182 | |
| 2016 | | | 16,511 | | | | 20,803 | | | | 1,320 | | | | 3,465 | | | | 4,785 | | | | 22,812 | | | | 21,041 | | | | 1,309 | | | | 3,756 | | | | 5,065 | |
| 2017 | | | 15,868 | | | | 22,047 | | | | 978 | | | | 2,355 | | | | 3,333 | | | | 22,123 | | | | 23,599 | | | | 978 | | | | 2,419 | | | | 3,397 | |
| Beyond 2017 | | | 77,040 | | | | 673,961 | | | | 12,787 | | | | 549 | | | | 13,336 | | |
| 2018 | | | | 25,808 | | | | 23,135 | | | | 989 | | | | 1,554 | | | | 2,543 | |
| Beyond 2018 | | | | 223,561 | | | | 621,814 | | | | 11,812 | | | | 325 | | | | 12,137 | |
| Total | | $ | 170,125 | | | $ | 796,956 | | | $ | 21,301 | | | $ | 21,421 | | | $ | 42,722 | | | $ | 347,337 | | | $ | 760,528 | | | $ | 19,256 | | | $ | 18,282 | | | $ | 37,538 | |
Contingencies
Contingencies, by their nature, relate to uncertainties that require the Company’s management to exercise judgment both in assessing the likelihood a liability has been incurred as well as in estimating the amount of potential loss. The most significant contingencies impacting the Company’s consolidated financial statements are those related to, environmental remediation, litigation matters and the resolution of matters related to open tax years. Should all of these known items result in liabilities being incurred, the loss could be as high as $2.0 million. Additionally, the Company may become subject to significant claims of which its management is unaware, or the claims of which its management is aware, such as possible warranty claims on products that are beyond their warranty period but where a customer may claim to have provided notice of a defect while the product was under warranty. If these claims were to occur, it could result in the Company incurring a significantly greater liability than it anticipates.
Other
The Company is a party to litigation arising in the normal course of business. The Company regularly analyzes current information and, as necessary, provides accruals for liabilities that are probable of occurring and that can be reasonably estimated. The Company believes the effect on its consolidated results of operations, financial position and cash flows, if any, for the disposition of all matters pending as of December 31, 20122013 will not be material.
10. Short-Term and Long-Term Borrowings and Preferred Stock Redemption
Short-Term Debt
The following table presents the status of the Company’s lines of credit as of December 31, 20122013 and December 31, 2011:2012:
| (in thousands) | | Line Limit | | | In Use on December 31,
2012 | | | Restricted due to
Outstanding
Letters of Credit | | | Available on December 31,
2012 | | | Available on December 31,
2011 | | | Line Limit | | | In Use on December 31,
2013 | | | Restricted due to
Outstanding
Letters of Credit | | | Available on December 31,
2013 | | | Available on December 31,
2012 | |
| Otter Tail Corporation Credit Agreement | | $ | 150,000 | | | $ | -- | | | $ | 733 | | | $ | 149,267 | | | $ | 198,776 | | | $ | 150,000 | | | $ | -- | | | $ | 659 | | | $ | 149,341 | | | $ | 149,267 | |
| OTP Credit Agreement | | | 170,000 | | | | -- | | | | 3,189 | | | | 166,811 | | | | 165,950 | | | | 170,000 | | | | 51,195 | | | | 1,830 | | | | 116,975 | | | | 166,811 | |
| Total | | $ | 320,000 | | | $ | -- | | | $ | 3,922 | | | $ | 316,078 | | | $ | 364,726 | | | $ | 320,000 | | | $ | 51,195 | | | $ | 2,489 | | | $ | 266,316 | | | $ | 316,078 | |
Under the Otter Tail Corporation Credit Agreement referenced below, the maximum amount of debt outstanding in 20122013 was $66,236,000$4,754,000 on July 13, 2012December 2, 2013 and the average daily balance of debt outstanding during 20122013 was $12,078,000.$49,000. The weighted average interest rate paid on debt outstanding under the Otter Tail Corporation Credit Agreement during 20122013 was 3.8%1.9% compared with 3.7%3.8% in 2011.2012. Under the OTP Credit Agreement, referenced below, the maximum amount of debt outstanding in 20122013 was $16,582,000$53,003,000 on August 15, 2012December 13, 2013 and the average daily balance of debt outstanding during 20122013 was $5,867,000.$17,446,000. The weighted average interest rate paid on debt outstanding under the OTP Credit Agreement during 20122013 was 1.7%1.4% compared with 1.5%1.7% in 2011.2012. The weighted average interest rate on consolidated short-term debt outstanding on December 31, 2013 was 1.4%.
On October 29, 2012 the Company entered into a Third Amended and Restated Credit Agreement (the Otter Tail Corporation Credit Agreement) with the Banks named therein, which is an unsecured $150 million revolving credit facility thatwith an accordion feature whereby the line can be increased to $250 million on the terms and subject to the conditions described in the Credit Agreement. On October 29, 2013 the Otter Tail Corporation Credit Agreement was amended to extend its expiration date by one year from October 29, 2017 to October 29, 2018. The Company can draw on this credit facility to refinance certain indebtedness and support its operations and the operations of the businesses of Varistar. The Otter Tail Corporation Credit Agreement amends and restates the Company’s Second Amended and Restated Credit Agreement dated as of May 4, 2010, which was set to expire on May 4, 2013, and provided for a $200 million line of credit.its subsidiaries. Borrowings under the Otter Tail Corporation Credit Agreement currently bear interest at LIBOR plus 1.75%, subject to adjustment based on the Company’s senior unsecured credit ratings. The interest rate being charged under the Second Amended and Restated Credit Agreement prior to the renewal was LIBOR plus 3.25%. Under the Otter Tail Corporation Credit Agreement, the Company is required to pay the Banks’ commitment fees based on the average daily unused amount available to be drawn under the revolving credit facility. The Otter Tail Corporation Credit Agreement is set to expire on October 29, 2017. The Otter Tail Corporation Credit Agreement contains a number of restrictions on the Company and the businesses of Varistar, and its material subsidiaries, including restrictions on the Company’s and Varistar’s ability to merge, sell assets, make investments, create or incur liens on assets, guarantee the obligations of certain other parties and engage in transactions with related parties. The Otter Tail Corporation Credit Agreement also contains certain financial covenants. Specifically, the Company must not permit the ratio of its “Interest-bearing Debt” to “Total Capitalization” (each as defined in the Otter Tail Corporation Credit Agreement) to be greater than 0.60 to 1.00 as of the last day of any fiscal quarter of the Company, or permit its “Interest and Dividend Coverage Ratio” (as defined in the Otter Tail Corporation Credit Agreement) for any period of four consecutive fiscal quarters to be less than 1.50 to 1.00. The Otter Tail Corporation Credit Agreement also contains affirmative covenants and events of default.default and certain financial covenants described below under the heading “Financial Covenants.” It does not include provisions for the termination of the agreement or the acceleration of repayment of amounts outstanding due to changes in the Company’s credit ratings. The Company’s obligations under the Otter Tail Corporation Credit Agreement are guaranteed by certain of the Company’s material subsidiaries. Outstanding letters of credit issued by the Company under the Otter Tail Corporation Credit Agreement can reduce the amount available for borrowing under the line by up to $40 million. The Otter Tail Corporation Credit Agreement has an accordion feature whereby the line can be increased to $250 million on the terms and subject to the conditions described in the Otter Tail Corporation Credit Agreement.
On October 29, 2012 OTP entered into a Second Amended and Restated Credit Agreement (the OTP Credit Agreement) with the Banks named therein. The OTP Credit Agreement amends and restates thetherein, providing for an unsecured $170 million OTP Credit Agreement dated as of March 3, 2011, which was set to expire on March 3, 2016. The OTP Credit Agreement provides for a $170 million line ofrevolving credit facility that may be increased to $250 million on the terms and subject to the conditions described in the OTP Credit Agreement. TheOn October 29, 2013 the OTP Credit Agreement is an unsecured revolving credit facility thatwas amended to extend its expiration date by one year from October 29, 2017 to October 29, 2018. OTP can draw on this credit facility to support the working capital needs and other capital requirements of its operations, including letters of credit in an aggregate amount not to exceed $50 million outstanding at any time. Borrowings under the OTP Credit Agreement currently bear interest at LIBOR plus 1.25%, subject to adjustment based on the ratings of OTP’s senior unsecured debt. The interest rate being charged under the OTP Credit Agreement prior to the renewal was LIBOR plus 1.5%. Under the OTP Credit Agreement, OTP is required to pay the Banks’ commitment fees based on the average daily unused amount available to be drawn under the revolving credit facility. The OTP Credit Agreement is set to expire on October 29, 2017. The OTP Credit Agreement contains a number of restrictions on the business of OTP, including restrictions on its ability to merge, sell assets, make investments, create or incur liens on assets, guarantee the obligations of any other party, and engage in transactions with related parties. The OTP Credit Agreement also contains affirmative covenants and events of default and certain financial covenants as described below under the heading “Financial Covenants,” as well as a financial covenant under which OTP may not permit the ratio of its “Interest-bearing Debt” to “Total Capitalization” (as defined in the OTP Credit Agreement) to be greater than 0.60 to 1.00. The prior OTP Credit Agreement included similar covenants and events of default, but also included a financial covenant that is not included in the current OTP Credit Agreement, under which OTP could not permit its “Interest and Dividend Coverage Ratio” (as defined in the prior OTP Credit Agreement) to be less than 1.50 to 1.00. The OTP Credit Agreement does not include provisions for the termination of the agreement or the acceleration of repayment of amounts outstanding due to changes in OTP’s credit ratings. OTP’s obligations under the OTP Credit Agreement are not guaranteed by any other party.
Long-Term Debt Issuances, Retirements and Preferred Stock Redemption
Debt Retirements
On May 11, 2012November 6 and 25, 2013 the Company filed a shelf registration statement with the SEC under which it may offer for sale, from time to time, either separately or togetherpurchased, in any combination, equity and/or debt securities describedtwo separate transactions, $12,933,000 and $34,737,000, respectively, of its outstanding 9.000% notes due 2016 (the 2016 Notes), originally issued in the shelf registration statement.
On March 18, 2011 the Company borrowed $1.5 million under a Partnership in Assisting Community Expansion loan to finance capital investments at Northern Pipe Products, Inc. (Northern Pipe), the Company’s PVC pipe manufacturing subsidiary located in Fargo, North Dakota. The ten-year unsecured note bears interest at 2.54% with monthly principal and interest payments through March 2021. On April 6, 2011 Otter Tail Corporation borrowed $0.5 million under a North Dakota Development Fund loan to finance additional capital investments at Northern Pipe. The seven-year unsecured note bears interest at 3.95% with monthly principal and interest payments through April 1, 2018.
Senior Unsecured Notes 4.63%, due December 1, 2021
On December 1, 2011, OTP issued $140 million aggregate principal amount of OTP’s 4.63% Senior Unsecured$100 million. The purchased 2016 Notes (the Purchased 2016 Notes) were subsequently retired and are no longer outstanding. The remaining $52,300,000 principal amount of 2016 Notes outstanding, unless redeemed early or otherwise repaid, will mature and become due and payable on December 1, 2021 (the 202115, 2016. The price paid for the Purchased 2016 Notes was $59,404,000, which includes the principal amount of the Purchased 2016 Notes, plus accrued interest of $1,845,000 through the respective purchase dates and a negotiated premium of $9,889,000 (which is less than the premium the Company would have been required to pay to redeem them under the terms of the 2016 Notes) pursuant. The Company used cash on hand to fund the purchase of the Purchased 2016 Notes. The amount of the debt retired as a Note Purchase Agreement (the 2011 Note Purchase Agreement), dated asresult of July 29, 2011,these transactions is approximately equivalent to the remaining amount of debt that was associated with the purchasers named therein.
Debt Retirementsoperating companies the Company divested over the last two years.
On July 13, 2012 the Company prepaid in full its outstanding $50 million, 8.89% Senior Unsecured Note due November 30, 2017 (the Cascade Note) issued pursuant to the Note Purchase Agreement dated as of February 23, 2007, as amended, between the Company and Cascade Investment, L.L.C. (Cascade). Immediately before the prepayment, the Cascade Note bore interest at 8.89% annually. The price paid by the Company to prepay the Cascade Note was $63,031,000, which included the principal amount of the Cascade Note plus accrued interest of $531,000 and a negotiated prepayment premium of $12,500,000. The Company used funds available under the Otter Tail Corporation Credit Agreement for the prepayment. This early retirement reflects the Company’s desire to lower its long-term debt outstanding given its recent divestitures. On repayment, $606,000 in unamortized debt expense related to this note was immediately recognized as expense along with the $12,500,000 negotiated prepayment premium which, in total, reduced diluted earnings per share by $0.22 in the nine months ended September 30, 2012. Cascade owned approximately 9.6%9.5% of the Company’s outstanding common stock as of December 31, 2012.2013.
In addition, on February 27, 2014 the third quarterCompany repaid in full its Term Loan as described below.
Unsecured Term Loan due January 15, 2015
On March 1, 2013 OTP entered into a Credit Agreement (the Loan Agreement) with JPMorgan Chase Bank, N.A. (JPMorgan) providing for a $40.9 million unsecured term loan (the Term Loan) to OTP originally due on June 1, 2014, which was fully drawn on March 1, 2013. The Loan Agreement was amended on October 29, 2013 to extend the due date on the Term Loan to January 15, 2015. On February 27, 2014, OTP used a portion of 2012, $25,000the proceeds of the New OTP Notes described below to retire early the Term Loan.
Borrowings under the Loan Agreement bore interest at LIBOR plus 0.875%. On March 1, 2013, OTP utilized approximately $25.1 million of Term Loan proceeds to fund the redemption price for all of the 4.65% Grant County, South Dakota Pollution Control Refunding Revenue Bonds 4.65%, due September 1, 2017, and $35,000 of4.85% Mercer County, North Dakota Pollution Control Refunding Revenue Bonds 4.85%, due Septemberoutstanding on that date, in each case for which OTP pays debt service. All such bonds had been called for redemption in full on March 1, 2022,2013. Also on March 1, 2013, OTP utilized approximately $15.7 million of Term Loan proceeds to satisfy an intercompany note to the Company that had a balance and interest rate designed to equate to the balances and dividend rates of the Company’s cumulative preferred shares. Those cumulative preferred shares were redeemed on March 1, 2013 for estate settlement purposes.$15.7 million, including $0.2 million in call premiums charged to equity and included with preferred dividends paid and as part of our preferred dividend requirement for the nine-month period ending September 30, 2013.
2016 Notes
On December 4, 2009 the Company issued $100 million of its 2016 notes under the indenture (for unsecured debt securities) dated as of November 1, 20111997, as amended by the First Supplemental Indenture dated as of July 1, 2009, between the Company and U.S. Bank National Association (formerly First Trust National Association), as trustee. The 2016 Notes are senior unsecured indebtedness and bear interest at 9.000% per year, payable semi-annually in arrears on June 15 and December 15 of each year. As discussed above, in November 2013 the Company purchased and retired, in two separate transactions, $12,933,000 and $34,737,000, respectively, of the outstanding 2016 Notes. The remaining $52,300,000 principal amount of the 2016 Notes outstanding, unless previously redeemed or otherwise repaid, will mature and become due and payable on December 15, 2016.
2013 Note Purchase Agreement
On August 14, 2013 OTP entered into a Note Purchase Agreement (the 2013 Note Purchase Agreement) pursuant to which OTP has agreed to issue to the purchasers named therein, in a private placement transaction, $60 million aggregate principal amount of OTP’s 4.68% Series A Senior Unsecured Notes due February 27, 2029 (the 2029 Notes) and $90 million aggregate principal amount of OTP’s 5.47% Series B Senior Unsecured Notes due February 27, 2044 (the 2044 Notes and, together with the 2029 Notes, the New OTP Notes). The New OTP Notes were issued on February 27, 2014. OTP used a portion of the proceeds of the New OTP Notes to retire early the Term Loan as discussed above and to repay OTP’s short-term debt outstanding on February 27, 2014. The remaining proceeds of the New OTP Notes will be used to pay fees and expenses related to the issuance of the New OTP Notes and for other general purposes, including planned construction program expenditures.
The 2013 Note Purchase Agreement states that OTP may prepay all or any part of the New OTP Notes (in an amount not less than 10% of the aggregate principal amount of the New OTP Notes then outstanding in the case of a partial prepayment) at 100% of the principal amount prepaid, together with accrued interest and a make-whole amount, provided that if no default or event of default under the 2013 Note Purchase Agreement exists, any optional prepayment made by OTP of (i) all of the 2029 Notes then outstanding on or after November 27, 2028 or (ii) all of the 2044 Notes then outstanding on or after November 27, 2043, will be made at 100% of the principal prepaid but without any make-whole amount. In addition, the 2013 Note Purchase Agreement states OTP must offer to prepay all of the outstanding New OTP Notes at 100% of the principal amount together with unpaid accrued interest in the event of a change of control of OTP.
The 2013 Note Purchase Agreement contains a number of restrictions on the business of OTP, including restrictions on OTP’s ability to merge, sell assets, create or incur liens on assets, guarantee the obligations of any other party, and engage in transactions with related parties. The 2013 Note Purchase Agreement also contains affirmative covenants and events of default, as well as certain financial covenants as described below under the heading “Financial Covenants.” The 2013 Note Purchase Agreement does not include provisions for the termination of the agreement or the acceleration of repayment of amounts outstanding due to changes in OTP’s credit ratings. The 2013 Note Purchase Agreement includes a “most favored lender” provision generally requiring that in the event OTP’s existing credit agreement or any renewal, extension or replacement thereof, at any time contains any financial covenant or other provision providing for limitations on interest expense and such a covenant is not contained in the 2013 Note Purchase Agreement under substantially similar terms or would be more beneficial to the holders of the New OTP Notes than any analogous provision contained in the 2013 Note Purchase Agreement (an “Additional Covenant”), then unless waived by the Required Holders (as defined in the 2013 Note Purchase Agreement), the Additional Covenant will be deemed to be incorporated into the 2013 Note Purchase Agreement. The 2013 Note Purchase Agreement also provides for the amendment, modification or deletion of an Additional Covenant if such Additional Covenant is amended or modified under or deleted from the OTP credit agreement, provided that no default or event of default has occurred and is continuing.
2007 and 2011 Note Purchase Agreements
On December 1, 2011, OTP issued $140 million aggregate principal amount of its 4.63% Senior Unsecured Notes due December 1, 2021 (the 2021 Notes) pursuant to a Note Purchase Agreement dated as of July 29, 2011 (the 2011 Note Purchase Agreement). OTP used a portion of the proceeds of the 2021 Notes to retire $90 million aggregate principal amount of its 6.63% Senior Notes due December 1, 2011 at maturity and to retire early $10.4 million aggregate principal amount of itsoutstanding pollution control refunding revenue bonds due December 1, 2012. No penalty was paid for the early retirement.
2007 and 2011 Note Purchase Agreements
The note purchase agreement (the 2007 Note Purchase Agreement) relating to OTP’sOTP also has outstanding its $155 million senior unsecured notes issued in four series consisting of $33 million aggregate principal amount of 5.95% Senior Unsecured Notes, Series A, due 2017; $30 million aggregate principal amount of 6.15% Senior Unsecured Notes, Series B, due 2022; $42 million aggregate principal amount of 6.37% Senior Unsecured Notes, Series C, due 2027; and $50 million aggregate principal amount of 6.47% Senior Unsecured Notes, Series D, due 2037 (collectively, the 2007 Notes). The 2007 Notes were issued pursuant to a Note Purchase Agreement dated as amendedof August 20, 2007 (the 2007 Note Purchase Agreement).
The 2011 Note Purchase Agreement and the 20112007 Note Purchase Agreement each states that OTP may prepay all or any part of the notes issued thereunder (in an amount not less than 10% of the aggregate principal amount of the notes then outstanding in the case of a partial prepayment) at 100% of the principal amount prepaid, together with accrued interest and a make-whole amount. The 2011 Note Purchase Agreement states in the event of a transfer of utility assets put event, the noteholders thereunder have the right to require OTP to repurchase the notes held by them in full, together with accrued interest and a make-whole amount, on the terms and conditions specified in the 2011 Note Purchase Agreement. The 20072011 Note Purchase Agreement and the 20112007 Note Purchase Agreement each also states that OTP must offer to prepay all of the outstanding notes issued thereunder at 100% of the principal amount together with unpaid accrued interest in the event of a change of control of OTP, and each containsOTP. The note purchase agreements contain a number of restrictions on OTP. These includeOTP, including restrictions on OTP’s ability to merge, sell assets, create or incur liens on assets, guarantee the obligations of any other party, and engage in transactions with related parties. The note purchase agreements also include affirmative covenants and events of default, and certain financial covenants as described below under the heading “Financial Covenants.”
PACE Loan
On March 18, 2011 the Company borrowed $1.5 million under a Partnership in Assisting Community Expansion loan to finance capital investments at Northern Pipe Products, Inc. (Northern Pipe), the Company’s PVC pipe manufacturing subsidiary located in Fargo, North Dakota. The ten-year unsecured note bears interest at 2.54% with monthly principal and interest payments through March 2021. On April 6, 2011, Otter Tail Corporation borrowed $0.5 million under a North Dakota Development Fund loan to finance additional capital investments at Northern Pipe. The seven-year unsecured note bears interest at 3.95% with monthly principal and interest payments through April 1, 2018.
Shelf Registration
On May 11, 2012 the Company filed a shelf registration statement with the SEC under which it may offer for sale, from time to time, either separately or together in any combination, equity and/or debt securities described in the shelf registration statement, which expires on May 10, 2015.
The aggregate amounts of maturities on bonds outstanding and other long-term obligations at December 31, 20122013 for each of the next five years are:
| (in thousands) | | 2013 | | | 2014 | | | 2015 | | | 2016 | | | 2017 | | | 2014 | | | 2015 | | | 2016 | | | 2017 | | | 2018 | |
| Aggregate amounts of Debt Maturities | | $ | 176 | | | $ | 188 | | | $ | 201 | | | $ | 100,206 | | | $ | 38,284 | | | $ | 188 | | | $ | 41,101 | | | $ | 52,544 | | | $ | 33,228 | | | $ | 187 | |
The following tables provide a breakdown of the assignment of the Company’s consolidated short-term and long-term debt outstanding as of December 31, 20122013 and December 31, 2011:2012:
December 31, 2012 (in thousands) | | OTP | | | Otter Tail
Corporation | | | Otter Tail
Corporation
Consolidated | | |
December 31, 2013 (in thousands) | | | OTP | | | Otter Tail Corporation | | | Otter Tail Corporation Consolidated | |
| Short-Term Debt | | $ | -- | | | $ | -- | | | $ | -- | | | $ | 51,195 | | | $ | -- | | | $ | 51,195 | |
| Long-Term Debt: | | | | | | | | | | | | | | | | | | | | | | | | |
| Unsecured Term Loan - LIBOR plus 0.875%, due January 15, 2015 | | | $ | 40,900 | | | | | | | $ | 40,900 | |
| 9.000% Notes, due December 15, 2016 | | | | | | $ | 100,000 | | | $ | 100,000 | | | | | | | $ | 52,330 | | | | 52,330 | |
| Senior Unsecured Notes 5.95%, Series A, due August 20, 2017 | | $ | 33,000 | | | | | | | | 33,000 | | | | 33,000 | | | | | | | | 33,000 | |
| Grant County, South Dakota Pollution Control Refunding Revenue Bonds 4.65%, due September 1, 2017 | | | 5,065 | | | | | | | | 5,065 | | |
| Senior Unsecured Notes 4.63%, due December 1, 2021 | | | 140,000 | | | | | | | | 140,000 | | | | 140,000 | | | | | | | | 140,000 | |
| Senior Unsecured Notes 6.15%, Series B, due August 20, 2022 | | | 30,000 | | | | | | | | 30,000 | | | | 30,000 | | | | | | | | 30,000 | |
| Mercer County, North Dakota Pollution Control Refunding Revenue Bonds 4.85%, due September 1, 2022 | | | 20,070 | | | | | | | | 20,070 | | |
| Senior Unsecured Notes 6.37%, Series C, due August 20, 2027 | | | 42,000 | | | | | | | | 42,000 | | | | 42,000 | | | | | | | | 42,000 | |
| Senior Unsecured Notes 6.47%, Series D, due August 20, 2037 | | | 50,000 | | | | | | | | 50,000 | | | | 50,000 | | | | | | | | 50,000 | |
| Other Obligations - Various up to 3.95% at December 31, 2012 | | | | | | | 1,725 | | | | 1,725 | | |
| Other Obligations - Various up to 3.95% at December 31, 2013 | | | | -- | | | | 1,548 | | | | 1,548 | |
| Total | | $ | 320,135 | | | $ | 101,725 | | | $ | 421,860 | | | $ | 335,900 | | | $ | 53,878 | | | $ | 389,778 | |
| Less: Current Maturities | | | -- | | | | 176 | | | | 176 | | | | -- | | | | 188 | | | | 188 | |
| Unamortized Debt Discount | | | -- | | | | 4 | | | | 4 | | | | -- | | | | 1 | | | | 1 | |
| Total Long-Term Debt | | $ | 320,135 | | | $ | 101,545 | | | $ | 421,680 | | | $ | 335,900 | | | $ | 53,689 | | | $ | 389,589 | |
| Total Short-Term and Long-Term Debt (with current maturities) | | $ | 320,135 | | | $ | 101,721 | | | $ | 421,856 | | | $ | 387,095 | | | $ | 53,877 | | | $ | 440,972 | |
104December 31, 2012 (in thousands) | | OTP | | | Otter Tail
Corporation | | | Otter Tail
Corporation
Consolidated |
|
| Short-Term Debt | | $ | -- | | | $ | -- | | | $ | -- | |
| Long-Term Debt: | | | | | | | | | | | | |
| 9.000% Notes, due December 15, 2016 | | | | | | $ | 100,000 | | | $ | 100,000 | |
| Senior Unsecured Notes 5.95%, Series A, due August 20, 2017 | | $ | 33,000 | | | | | | | | 33,000 | |
| Grant County, South Dakota Pollution Control Refunding Revenue Bonds 4.65%, due September 1, 2017 | | | 5,065 | | | | | | | | 5,065 | |
| Senior Unsecured Notes 4.63%, due December 1, 2021 | | | 140,000 | | | | | | | | 140,000 | |
| Senior Unsecured Notes 6.15%, Series B, due August 20, 2022 | | | 30,000 | | | | | | | | 30,000 | |
| Mercer County, North Dakota Pollution Control Refunding Revenue Bonds 4.85%, due September 1, 2022 | | | 20,070 | | | | | | | | 20,070 | |
| Senior Unsecured Notes 6.37%, Series C, due August 20, 2027 | | | 42,000 | | | | | | | | 42,000 | |
| Senior Unsecured Notes 6.47%, Series D, due August 20, 2037 | | | 50,000 | | | | | | | | 50,000 | |
| Other Obligations - Various up to 3.95% at December 31, 2012 | | | | | | | 1,725 | | | | 1,725 | |
| Total | | $ | 320,135 | | | $ | 101,725 | | | $ | 421,860 | |
| Less: Current Maturities | | | -- | | | | 176 | | | | 176 | |
| Unamortized Debt Discount | | | -- | | | | 4 | | | | 4 | |
| Total Long-Term Debt | | $ | 320,135 | | | $ | 101,545 | | | $ | 421,680 | |
| Total Short-Term and Long-Term Debt (with current maturities) | | $ | 320,135 | | | $ | 101,721 | | | $ | 421,856 | |
December 31, 2011 (in thousands) | | OTP | | | Otter Tail
Corporation | | | Otter Tail
Corporation
Consolidated | |
| Short-Term Debt | | $ | -- | | | $ | -- | | | $ | -- | |
| Long-Term Debt: | | | | | | | | | | | | |
| 9.000% Notes, due December 15, 2016 | | | | | | $ | 100,000 | | | $ | 100,000 | |
| Senior Unsecured Notes 5.95%, Series A, due August 20, 2017 | | $ | 33,000 | | | | | | | | 33,000 | |
| Grant County, South Dakota Pollution Control Refunding Revenue Bonds 4.65%, due September 1, 2017 | | | 5,090 | | | | | | | | 5,090 | |
| Senior Unsecured Note 8.89%, due November 30, 2017 | | | | | | | 50,000 | | | | 50,000 | |
| Senior Unsecured Notes 4.63%, due December 1, 2021 | | | 140,000 | | | | | | | | 140,000 | |
| Senior Unsecured Notes 6.15%, Series B, due August 20, 2022 | | | 30,000 | | | | | | | | 30,000 | |
| Mercer County, North Dakota Pollution Control Refunding Revenue Bonds 4.85%, due September 1, 2022 | | | 20,105 | | | | | | | | 20,105 | |
| Senior Unsecured Notes 6.37%, Series C, due August 20, 2027 | | | 42,000 | | | | | | | | 42,000 | |
| Senior Unsecured Notes 6.47%, Series D, due August 20, 2037 | | | 50,000 | | | | | | | | 50,000 | |
| Other Obligations - Various up to 3.95% at December 31, 2011 | | | | | | | 1,889 | | | | 1,889 | |
| Total | | $ | 320,195 | | | $ | 151,889 | | | $ | 472,084 | |
| Less: Current Maturities | | | -- | | | | 165 | | | | 165 | |
| Unamortized Debt Discount | | | -- | | | | 4 | | | | 4 | |
| Total Long-Term Debt | | $ | 320,195 | | | $ | 151,720 | | | $ | 471,915 | |
| Total Short-Term and Long-Term Debt (with current maturities) | | $ | 320,195 | | | $ | 151,885 | | | $ | 472,080 | |
Financial Covenants
As of December 31, 2012 theThe Company wasand OTP were in compliance with the financial statement covenants that existed in itstheir debt agreements.agreements as of December 31, 2013.
No Credit or Note Purchase Agreement contains any provisions that would trigger an acceleration of the related debt as a result of changes in the credit rating levels assigned to the related obligor by rating agencies.
The Company’scompany’s and OTP’s borrowing agreements are subject to certain financial covenants. Specifically:
| ● | Under the Otter Tail Corporation Credit Agreement, the Company may not permit the ratio of its Interest-bearing Debt to Total Capitalization to be greater than 0.60 to 1.00 or permit its Interest and Dividend Coverage Ratio to be less than 1.50 to 1.00 (each measured on a consolidated basis), as provided in the Otter Tail Corporation Credit Agreement. |
| | Under the OTP Credit Agreement and the Loan Agreement (when in effect), OTP may not permit the ratio of its Interest-bearing Debt to Total Capitalization to be greater than 0.60 to 1.00. |
| | Under the 2007 Note Purchase Agreement and 2011 Note Purchase Agreement, and the financial guaranty insurance policy with Ambac Assurance Corporation relating to certain pollution control refunding bonds, OTP may not permit the ratio of its Consolidated Debt to Total Capitalization to be greater than 0.60 to 1.00 or permit its Interest and Dividend Coverage Ratio to be less than 1.50 to 1.00, in each case as provided in the related borrowing or insurance agreement. In addition, under the 2007 Note Purchase Agreementagreement, and 2011 Note Purchase Agreement, OTP may not permit its Priority Debt to exceed 20% of its Total Capitalization, as provided in the related agreement. |
| | Under the 2013 Note Purchase Agreement, OTP may not permit its Interest-bearing Debt to exceed 60% of Total Capitalization and may not permit its Priority Indebtedness to exceed 20% of its Total Capitalization, each as provided in the 2013 Note Purchase Agreement. |
11. Class B Stock Options of Subsidiary
In conjunction with the sale of IPH on May 6, 2011, all 363 outstanding IPH Class B common share options were cancelled by mutual agreement between the issuer and the holders of the options and a liability to the holders of the options was established based on the fair value of the options on May 6, 2011. The liability was assumed by the new owner of IPH. The options were adjusted to their fair value based on the fair value of an underlying share of Class B Common Stock of $2,973.90 per share on May 6, 2011. The book value of IPH Class B common share options prior to their cancellation on May 6, 2011 was based on an IPH Class B common share value of $2,085.88 per share. The $322,000 difference between the fair value and book value of the options was charged to retained earnings and earnings available for common shares were reduced by $322,000 in the second quarter of 2011.
12. Pension Plan and Other Postretirement Benefits
Pension Plan
The Company’s noncontributory funded pension plan covers substantially all corporate employees and OTP nonunion employees hired prior to January 1, 2006, and all union employees of OTP.OTP hired prior to November 1, 2013, excluding Coyote Station employees. Coyote Station employees hired before January 1, 2009 are covered under the plan. The plan provides 100% vesting after five vesting years of service and for retirement compensation at age 65, with reduced compensation in cases of retirement prior to age 62. The Company reserves the right to discontinue the plan but no change or discontinuance may affect the pensions theretofore vested.
The pension plan has a trustee who is responsible for pension payments to retirees and a separate pension fund manager responsible for managing the plan’s assets. An independent actuary assists the Company in performing the necessary actuarial valuations for the plan.
The plan assets consist of common stock and bonds of public companies, U.S. government securities, cash and cash equivalents and alternative investments. None of the plan assets are invested in common stock preferred stock or debt securities of the Company.
Components of net periodic pension benefit cost:
| (in thousands) | | 2012 | | | 2011 | | | 2010 | | | 2013 | | | 2012 | | | 2011 | |
| Service Cost--Benefit Earned During the Period | | $ | 5,084 | | | $ | 4,415 | | | $ | 4,654 | | |
| Service Cost–Benefit Earned During the Period | | | $ | 5,594 | | | $ | 5,084 | | | $ | 4,415 | |
| Interest Cost on Projected Benefit Obligation | | | 12,465 | | | | 12,666 | | | | 12,067 | | | | 12,123 | | | | 12,465 | | | | 12,666 | |
| Expected Return on Assets | | | (14,430 | ) | | | (14,140 | ) | | | (13,711 | ) | | | (14,521 | ) | | | (14,430 | ) | | | (14,140 | ) |
| Amortization of Prior-Service Cost | | | 409 | | | | 434 | | | | 683 | | |
| Amortization of Net Actuarial Loss | | | 5,041 | | | | 2,617 | | | | 2,002 | | |
| Amortization of Prior-Service Cost: | | | | | | | | | | | | | |
| From Regulatory Asset | | | | 333 | | | | 398 | | | | 423 | |
From Other Comprehensive Income1 | | | | 9 | | | | 11 | | | | 11 | |
| Amortization of Net Actuarial Loss: | | | | | | | | | | | | | |
| From Regulatory Asset | | | | 6,600 | | | | 4,910 | | | | 2,549 | |
From Other Comprehensive Income1 | | | | 176 | | | | 131 | | | | 68 | |
| Net Periodic Pension Cost | | $ | 8,569 | | | $ | 5,992 | | | $ | 5,695 | | | $ | 10,314 | | | $ | 8,569 | | | $ | 5,992 | |
1Corporate cost included in Other Nonelectric Expenses. | | 1Corporate cost included in Other Nonelectric Expenses. | |
Weighted-average assumptions used to determine net periodic pension cost for the year ended December 31:
| | | 2012 | | | 2011 | | | 2010 | | | 2013 | | | 2012 | | | 2011 | |
| Discount Rate | | | 5.15 | % | | | 6.00 | % | | | 6.00 | % | | | 4.50 | % | | | 5.15 | % | | | 6.00 | % |
| Long-Term Rate of Return on Plan Assets | | | 8.00 | % | | | 8.00 | % | | | 8.50 | % | | | 7.75 | % | | | 8.00 | % | | | 8.00 | % |
| Rate of Increase in Future Compensation Level | | | 3.38 | % | | | 3.75 | % | | | 3.75 | % | | | 3.13 | % | | | 3.38 | % | | | 3.75 | % |
The following table presents amounts recognized in the consolidated balance sheets as of December 31:
| (in thousands) | | 2012 | | | 2011 | | | 2013 | | | 2012 | |
| Regulatory Assets: | | | | | | | | | | | | |
| Unrecognized Prior Service Cost | | $ | 1,109 | | | $ | 1,507 | | | $ | 776 | | | $ | 1,109 | |
| Unrecognized Actuarial Loss | | | 98,808 | | | | 89,820 | | | | 56,051 | | | | 98,808 | |
| Total Regulatory Assets | | | 99,917 | | | | 91,327 | | | $ | 56,827 | | | $ | 99,917 | |
| | | | | | | | | | | | | | | | | |
| Accumulated Other Comprehensive Loss: | | | | | | | | | | | | | | | | |
| Unrecognized Prior Service Cost | | | 22 | | | | 28 | | | $ | 28 | | | $ | 37 | |
| Unrecognized Actuarial Loss | | | 1,114 | | | | 1,131 | | | | 448 | | | | 1,857 | |
| Total Accumulated Other Comprehensive Loss | | | 1,136 | | | | 1,159 | | | $ | 476 | | | $ | 1,894 | |
| Deferred Income Taxes | | | 758 | | | | 772 | | |
| Noncurrent Liability | | $ | 84,616 | | | $ | 77,495 | | | $ | 40,422 | | | $ | 84,616 | |
Funded status as of December 31:
| (in thousands) | | 2012 | | | 2011 | | | 2013 | | | 2012 | |
| Accumulated Benefit Obligation | | $ | (238,706 | ) | | $ | (211,324 | ) | | $ | (224,365 | ) | | $ | (238,706 | ) |
| | | | | | | | | | | | | | | | | |
| Projected Benefit Obligation | | $ | (275,634 | ) | | $ | (246,098 | ) | | $ | (254,039 | ) | | $ | (275,634 | ) |
| Fair Value of Plan Assets | | | 191,018 | | | | 168,603 | | | | 213,617 | | | | 191,018 | |
| Funded Status | | $ | (84,616 | ) | | $ | (77,495 | ) | | $ | (40,422 | ) | | $ | (84,616 | ) |
The following tables provide a reconciliation of the changes in the fair value of plan assets and the plan’s benefit obligations over the two-year period ended December 31:31, 2013:
| (in thousands) | | 2012 | | | 2011 | | | 2013 | | | 2012 | |
| Reconciliation of Fair Value of Plan Assets: | | | | | | | | | | | | |
| Fair Value of Plan Assets at January 1 | | $ | 168,603 | | | $ | 171,308 | | | $ | 191,018 | | | $ | 168,603 | |
| Actual Return on Plan Assets | | | 22,656 | | | | 6,764 | | | | 23,044 | | | | 22,656 | |
| Discretionary Company Contributions | | | 10,000 | | | | -- | | | | 10,000 | | | | 10,000 | |
| Benefit Payments | | | (10,241 | ) | | | (9,469 | ) | | | (10,445 | ) | | | (10,241 | ) |
| Fair Value of Plan Assets at December 31 | | $ | 191,018 | | | $ | 168,603 | | | $ | 213,617 | | | $ | 191,018 | |
| Estimated Asset Return | | | 13.44 | % | | | 4.06 | % | | | 11.8 | % | | | 13.4 | % |
| Reconciliation of Projected Benefit Obligation: | | | | | | | | | | | | | | | | |
| Projected Benefit Obligation at January 1 | | $ | 246,098 | | | $ | 217,049 | | | $ | 275,634 | | | $ | 246,098 | |
| Service Cost | | | 5,084 | | | | 4,415 | | | | 5,594 | | | | 5,084 | |
| Interest Cost | | | 12,465 | | | | 12,666 | | | | 12,123 | | | | 12,465 | |
| Benefit Payments | | | (10,241 | ) | | | (9,469 | ) | | | (10,445 | ) | | | (10,241 | ) |
| Actuarial Loss | | | 22,228 | | | | 21,437 | | |
| Actuarial (Gain) Loss | | | | (28,867 | ) | | | 22,228 | |
| Projected Benefit Obligation at December 31 | | $ | 275,634 | | | $ | 246,098 | | | $ | 254,039 | | | $ | 275,634 | |
Weighted-average assumptions used to determine benefit obligations at December 31:
| | | 2012 | | 2011 | | 2013 | | | 2012 | |
| Discount Rate | | | 4.50 | % | | | 5.15 | % | | | 5.30 | % | | | 4.50 | % |
| Rate of Increase in Future Compensation Level | | | 3.13 | % | | | 3.38 | % | | | 3.13 | % | | | 3.13 | % |
The assumed rate of return on pension fund assets used for the determination of 20132014 net periodic pension cost is 7.75%. The assumed long-term rate of return on plan assets is based primarily on asset category studies using historical market return and volatility data with forward looking estimates based on existing financial market conditions and forecasts of capital markets. Modest excess return expectations versus some market indices are incorporated into the return projections based on the actively managed structure of the investment programs and their records of achieving such returns historically. We review our rate of return on plan asset assumptions annually. The assumptions are largely based on the asset category rate-of-return assumptions developed annually with our pension plan investment advisors, as well as input from actuaries who work with the pension plan.
Market-related value of plan assets—The Company’s expected return on plan assets is determined based on the expected long-term rate of return on plan assets and the market-related value of plan assets.
The Company bases actuarial determination of pension plan expense or income on a market-related valuation of assets, which reduces year-to-year volatility. This market-related valuation calculation recognizes investment gains or losses over a five-year period from the year in which they occur. Investment gains or losses for this purpose are the difference between the expected return calculated using the market-related value of assets and the actual return based on the fair value of assets. Since the market-related valuation calculation recognizes gains or losses over a five-year period, the future value of the market-related assets will be impacted as previously deferred gains or losses are recognized.
| Measurement Dates: | 2012 | 2011 |
| Net Periodic Pension Cost | January 1, 2012 | January 1, 2011 |
| | | |
| End of Year Benefit Obligations | January 1, 2012 projected to
December 31, 2012 | January 1, 2011 projected to
December 31, 2011 |
| | | |
| Market Value of Assets | December 31, 2012 | December 31, 2011 |
| | | |
| Measurement Dates: | 2013 | 2012 |
| Net Periodic Pension Cost | January 1, 2013 | January 1, 2012 |
| | | |
| End of Year Benefit Obligations | January 1, 2013 projected to
December 31, 2013 | January 1, 2012 projected to
December 31, 2012 |
| | | |
| Market Value of Assets | December 31, 2013 | December 31, 2012 |
The estimated amounts of unrecognized net actuarial losses and prior service costs to be amortized from regulatory assets and accumulated other comprehensive loss into the net periodic pension cost in 20132014 are:
| (in thousands) | | 2013 | | | 2014 | |
| Decrease in Regulatory Assets: | | | | | | |
| Amortization of Unrecognized Prior Service Cost | | $ | 333 | | | $ | 257 | |
| Amortization of Unrecognized Actuarial Loss | | | 6,652 | | | | 3,477 | |
| Decrease in Accumulated Other Comprehensive Loss: | | | | | | | | |
| Amortization of Unrecognized Prior Service Cost | | | 9 | | | | 7 | |
| Amortization of Unrecognized Actuarial Loss | | | 178 | | | | 93 | |
| Total Estimated Amortization | | $ | 7,172 | | | $ | 3,834 | |
Cash flows—The Company had no minimum funding requirement as of December 31, 2012,2013, but made a discretionary plan contribution of $10,000,000contributions totaling $20,000,000 in January 2013.2014.
The following benefit payments, which reflect expected future service, as appropriate, are expected to be paid out from plan assets:
| | | | Years | |
| (in thousands) | | 2013 | | | 2014 | | | 2015 | | | 2016 | | | 2017 | | | 2018-2022 | |
| | | $ | 10,747 | | | $ | 11,095 | | | $ | 11,591 | | | $ | 12,117 | | | $ | 12,844 | | | $ | 77,356 | |
| (in thousands) | | 2014 | | | 2015 | | | 2016 | | | 2017 | | | 2018 | | | Years
2019-2023 | |
| | | $ | 11,304 | | | $ | 11,772 | | | $ | 12,363 | | | $ | 13,014 | | | $ | 13,801 | | | $ | 80,569 | |
The following objectives guide the investment strategy of the Company’s pension plan (the Plan):
| | | The assets of the Plan is managed to operatewill be invested in perpetuity.accordance with all applicable laws in a manner consistent with fiduciary standards including Employee Retirement Income Security Act standards (if applicable). Specifically: |
| | ●o | The Plan will meetsafeguards and diversity that a prudent investor would adhere to must be present in the pension benefit obligation payments of the Company.investment program. |
| | ●o | The Plan’s assets shouldAll transactions undertaken on behalf of the Plan must be invested within the objectivebest interest of meeting current and future payment requirements while minimizing annual contributionsplan participants and their volatility.beneficiaries. |
| | | The asset strategy reflectsprimary objective of the desirePlan is to meet currentprovide a source of retirement income for its participants and future benefit payments while considering a prudent level of risk and diversification.beneficiaries. |
| | The near-term primary financial objective of the Plan is to improve the funded status of the Plan. |
| | A secondary financial objective is to minimize pension funding and expense volatility where possible. |
The asset allocation strategy developed by the Company’s InvestmentRetirement Plans Administration Committee (the Committee) is based on the current needs of the Plan and the objectives listed above. An asset/liability review is conducted annually or as often as necessary to assess the impact of various asset allocations on funded status and other financial variables. The current needs of the Plan, the overall investment objectives listed above, the investment preferences and risk tolerance of the committeeCommittee and athe desired degree of diversification.diversification suggest the need for an investment allocation including multiple asset classes.
The asset allocation strategyin the table below contains guideline percentages, at market value, of the total Plan invested in various asset classes. The strategic target allocation and the tactical range shown in the table that followsPermitted Range is a guide, thatand will at times not be reflected inreflect the actual asset allocations that mayallocation, as this will be dictated by prevailing market conditions, the independent actions of the Investment Committee and/or investment manager,Investment Managers and required cash flows to and from the Plan. The tactical rangePermitted Range anticipates this fluctuation and provides flexibility for the investment manager’s portfolioInvestment Managers’ portfolios to vary around the target allocation without the need for immediate rebalancing. The Investment Manager will proactively monitor the asset allocation and will direct the purchases and sales to remain within the stated ranges.
Allocation targets and tactical ranges shown below reflect the Investment Policy Statement approved by the Company’s Investment Committee. EachThe policy of the asset categoriesPlan is within its respective tactical range. The Investment Committee monitors actual assetto invest assets in accordance with the allocations and directs contributions and withdrawals toward maintaining the current targeted allocation percentages listed below.shown below:
Asset Allocation | | Strategic TargetPermitted Range | |
| Asset Class / PBO Funded Status | | < 100% PBO | | | Tactical Range100% PBO | | | 105% PBO | | | >=110% PBO | |
Equity Securities | | | 5130% - 65 | % | | | 41%-61 | % |
Fixed-Income | | | 4425% - 60 | % | | | 34%-5420% - 55 | % |
Alternatives | | | 515% - 50 | % |
| Investment Grade Fixed Income | | | 35% - 75 | % | | | 40% - 80 | % | | | 45% - 85 | % | | | 50% - 90 | % |
| Below Investment Grade Fixed Income* | | | 0% - 15 | % | | | 0%-12 | % |
Cash | | | 0 - 15 | % | | | 0%-5 - 15 | % | | | 0% - 15 | % |
| Other** | | | 0% - 20 | % | | | 0% - 20 | % | | | 0% - 20 | % | | | 0% - 20 | % |
* Includes (but not limited to) High Yield Bond Fund and Emerging Markets Debt funds. ** Other category may include cash, alternatives, and/or other investment strategies that may be classified other than equity or fixed income, such as the Dynamic Asset Allocation fund. | |
The Company’s pension plan asset allocations at December 31, 20122013 and 2011,2012, by asset category are as follows:
| Asset Allocation | | 2012 | | | 2011 | | | 2013 | | | 2012 | |
| Large Capitalization Equity Securities | | | 24.7 | % | | | 25.7 | % | | | 21.0 | % | | | 24.7 | % |
| International Equity Securities | | | 17.8 | % | | | 14.4 | % | | | 21.7 | % | | | 17.8 | % |
| Small and Mid-Capitalization Equity Securities | | | 7.1 | % | | | 6.9 | % | | | 8.5 | % | | | 7.1 | % |
| SEI Dynamic Asset Allocation Fund | | | 4.8 | % | | | 4.8 | % | | | 5.2 | % | | | 4.8 | % |
| Equity Securities | | | 54.4 | % | | | 51.8 | % | | | 56.4 | % | | | 54.4 | % |
| Fixed-Income Securities and Cash | | | 41.1 | % | | | 43.4 | % | | | 39.3 | % | | | 41.1 | % |
| Other - SEI Special Situation Collective Investment Trust | | | 4.5 | % | | | 4.8 | % | | | 4.3 | % | | | 4.5 | % |
| | | | 100.0 | % | | | 100.0 | % | | | 100.0 | % | | | 100.0 | % |
Fair Value Measurements of Pension Fund Assets
ASC 715, Compensation – Retirement Benefits, requires disclosures about pension plan assets identified by the three levels of the fair value hierarchy established by ASC 820-10-35. The three levels defined by the hierarchy and examples of each level are as follows:
Level 1 – Quoted prices are available in active markets for identical assets or liabilities as of the reported date. The types of assets and liabilities included in Level 1 are highly liquid and actively traded instruments with quoted prices, such as equities listed by the New York Stock Exchange and commodity derivative contracts listed on the New York Mercantile Exchange.
Level 2 – Pricing inputs are other than quoted prices in active markets, but are either directly or indirectly observable as of the reported date. The types of assets and liabilities included in Level 2 are typically either comparable to actively traded securities or contracts, such as treasury securities with pricing interpolated from recent trades of similar securities, or priced with models using highly observable inputs, such as commodity options priced using observable forward prices and volatilities.
Level 3 – Significant inputs to pricing have little or no observability as of the reporting date. The types of assets and liabilities included in Level 3 are those with inputs requiring significant management judgment or estimation and may include complex and subjective models and forecasts.
The following table presents, for each of these hierarchy levels, the Company’s pension fund assets measured at fair value as of December 31, 20122013 and 2011:2012:
2012 (in thousands) | | Level 1 | | | Level 2 | | | Level 3 | |
| Large Capitalization Equity Securities | | $ | 47,083 | | | | | | | |
| International Equity Securities | | | 34,088 | | | | | | | |
| Small and Mid-Capitalization Equity Securities | | | 13,613 | | | | | | | |
| SEI Dynamic Asset Allocation Fund | | | 9,177 | | | | | | | |
| Fixed Income Securities | | | 78,480 | | | | | | | |
| Cash Management – Money Market Fund | | | 11 | | | | | | | |
| SEI Special Situation Collective Investment Trust | | | | | | | | | $ | 8,566 | |
| Total Assets | | $ | 182,452 | | | $ | -- | | | $ | 8,566 | |
2011 (in thousands) | | | | | | | | | | | | |
| Large Capitalization Equity Securities | | $ | 43,334 | | | | | | | | | |
| International Equity Securities | | | 24,294 | | | | | | | | | |
| Small and Mid-Capitalization Equity Securities | | | 11,567 | | | | | | | | | |
| SEI Dynamic Asset Allocation Fund | | | 8,133 | | | | | | | | | |
| Fixed Income Securities | | | 72,233 | | | | | | | | | |
| Cash Management – Working Capital Account | | | | | | $ | 911 | | | | | |
| SEI Special Situation Collective Investment Trust | | | | | | | | | | $ | 8,131 | |
| Total Assets | | $ | 159,561 | | | $ | 911 | | | $ | 8,131 | |
2013 (in thousands) | | Level 1 | | | Level 2 | | | Level 3 | |
| | | | | | | | | | | |
| Large Capitalization Equity Securities Mutual Fund | | $ | 44,882 | | | | | | | |
| International Equity Securities Mutual Funds | | | 46,412 | | | | | | | |
| Small and Mid-Capitalization Equity Securities Mutual Fund | | | 18,151 | | | | | | | |
| SEI Dynamic Asset Allocation Mutual Fund | | | 11,159 | | | | | | | |
| Fixed Income Securities Mutual Funds | | | 83,843 | | | | | | | |
| Cash Management – Money Market Fund | | | -- | | | | | | | |
| SEI Special Situation Collective Investment Trust Fund | | | | | | $ | 9,170 | | | | |
| Total Assets | | $ | 204,447 | | | $ | 9,170 | | | $ | -- | |
| | | | | | | | | | | | | |
2012 (in thousands) | | | | | | | | | | | | |
| Large Capitalization Equity Securities Mutual Fund | | $ | 47,083 | | | | | | | | | |
| International Equity Securities Mutual Funds | | | 34,088 | | | | | | | | | |
| Small and Mid-Capitalization Equity Securities Mutual Fund | | | 13,613 | | | | | | | | | |
| SEI Dynamic Asset Allocation Mutual Fund | | | 9,177 | | | | | | | | | |
| Fixed Income Securities Mutual Funds | | | 78,480 | | | | | | | | | |
| Cash Management – Working Capital Account | | | 11 | | | | | | | | | |
| SEI Special Situation Collective Investment Trust Fund | | | | | | | | | | $ | 8,566 | |
| Total Assets | | $ | 182,452 | | | $ | -- | | | $ | 8,566 | |
The Company’s level 3 investments inheld by the SEI Special Situation Collective Investment Trust consiston December 31, 2013 and 2012 consisted of investments primarily in hedge funds that pursue alternative strategies, private equity funds and hybrid funds, as well as investments directly in other securities and financial instruments, with the objective of achieving high returns balanced against an appropriate level of volatility and market exposure over a full market cycle. The net asset value of the SEI Special Situations Collective Investment Trust is determined by using the fair value of the portfolio as of the close of business at the end of the year. The fair value of the fund is calculated independently by the fund’s administrator and is reviewed by the management team. These assets were classified as Level 3 in 2012 because there were restrictions on trading shares in the fund that made the shares illiquid. In 2013, the restriction on the shares held by OTP’s pension fund was lifted and shares in the fund could be redeemed at net asset value, so the investment in the fund was reclassified to Level 2. There were no significantother transfers between Levels 1, 2 or 3of the fair value hierarchy during the year ended December 31, 2012. The Company’s initial investment in the SEI Special Situation Collective Investment Trust was made in January 2011.2013.
Executive Survivor and Supplemental Retirement Plan (ESSRP)
The ESSRP is an unfunded, nonqualified benefit plan for executive officers and certain key management employees. The ESSRP provides defined benefit payments to these employees on their retirements for life or to their beneficiaries on their deaths for a 15-year postretirement period. Life insurance carried on certain plan participants is payable to the Company on the employee’s death. There are no plan assets in this nonqualified benefit plan due to the nature of the plan.
Components of net periodic pension benefit cost:
| (in thousands) | | 2012 | | | 2011 | | | 2010 | | | 2013 | | | 2012 | | | 2011 | |
| Service Cost--Benefit Earned During the Period | | $ | 45 | | | $ | 81 | | | $ | 660 | | |
| Service Cost–Benefit Earned During the Period | | | $ | 51 | | | $ | 45 | | | $ | 81 | |
| Interest Cost on Projected Benefit Obligation | | | 1,479 | | | | 1,632 | | | | 1,670 | | | | 1,408 | | | | 1,479 | | | | 1,632 | |
| Amortization of Prior Service Cost | | | 73 | | | | 73 | | | | 74 | | |
| Amortization of Net Actuarial Loss | | | 327 | | | | 245 | | | | 477 | | |
| Amortization of Prior Service Cost: | | | | | | | | | | | | | |
| From Regulatory Asset | | | | 22 | | | | 22 | | | | 42 | |
From Other Comprehensive Income1 | | | | 51 | | | | 51 | | | | 31 | |
| Amortization of Net Actuarial Loss: | | | | | | | | | | | | | |
| From Regulatory Asset | | | | 208 | | | | 175 | | | | 142 | |
From Other Comprehensive Income2 | | | | 313 | | | | 152 | | | | 103 | |
| Net Periodic Pension Cost | | $ | 1,924 | | | $ | 2,031 | | | $ | 2,881 | | | $ | 2,053 | | | $ | 1,924 | | | $ | 2,031 | |
1Amortization of Prior Service Costs from Other Comprehensive Income Charged to: | | | | | | | | | | | | | |
| Electric Operation and Maintenance Expenses | | | $ | 20 | | | $ | 20 | | | $ | -- | |
| Other Nonelectric Expenses | | | | 31 | | | | 31 | | | | 31 | |
2Amortization of Net Actuarial Loss from Other Comprehensive Income Charged to: | | | | | | | | | | | | | |
| Electric Operation and Maintenance Expenses | | | $ | 193 | | | $ | 162 | | | $ | -- | |
| Other Nonelectric Expenses | | | | 120 | | | | (10 | ) | | | 103 | |
Weighted-average assumptions used to determine net periodic pension cost for the year ended December 31:
| | | 2012 | | 2011 | | 2010 | | 2013 | | | 2012 | | | 2011 | |
| Discount Rate | | | 5.15 | % | | | 6.00 | % | | | 6.00 | % | | | 4.50 | % | | | 5.15 | % | | | 6.00 | % |
| Rate of Increase in Future Compensation Level | | | 4.59 | % | | | 4.65 | % | | | 4.69 | % | | | 3.19 | % | | | 4.59 | % | | | 4.65 | % |
The following table presents amounts recognized in the consolidated balance sheets as of December 31:
| (in thousands) | | 2012 | | | 2011 | | | 2013 | | | 2012 | |
| Regulatory Assets: | | | | | | | | | | | | |
| Unrecognized Prior Service Cost | | $ | 135 | | | $ | 215 | | | $ | 113 | | | $ | 135 | |
| Unrecognized Actuarial Loss | | | 2,788 | | | | 2,427 | | | | 1,971 | | | | 2,788 | |
| Total Regulatory Assets | | | 2,923 | | | | 2,642 | | | $ | 2,084 | | | $ | 2,923 | |
| Projected Benefit Obligation Liability – Net Amount Recognized | | | (31,925 | ) | | | (29,323 | ) | | $ | (29,321 | ) | | $ | (31,925 | ) |
| Accumulated Other Comprehensive Loss: | | | | | | | | | | | | | | | | |
| Unrecognized Prior Service Cost | | | 187 | | | | 184 | | | $ | 261 | | | $ | 312 | |
| Unrecognized Actuarial Loss | | | 3,057 | | | | 2,067 | | | | 2,465 | | | | 5,095 | |
| Total Accumulated Other Comprehensive Loss | | | 3,244 | | | | 2,251 | | | $ | 2,726 | | | $ | 5,407 | |
| Deferred Income Taxes | | | 2,163 | | | | 1,500 | | |
| Cumulative Employer Contributions in Excess of Net Periodic Benefit Cost | | $ | (23,595 | ) | | $ | (22,930 | ) | |
The following tables provide a reconciliation of the changes in the fair value of plan assets and the plan’s projected benefit obligations over the two-year period ended December 31, 20122013 and a statement of the funded status as of December 31 of both years:
| (in thousands) | | 2012 | | | 2011 | |
| Reconciliation of Fair Value of Plan Assets: | | | | | | |
| Fair Value of Plan Assets at January 1 | | $ | -- | | | $ | -- | |
| Actual Return on Plan Assets | | | -- | | | | -- | |
| Employer Contributions | | | 1,259 | | | | 1,072 | |
| Benefit Payments | | | (1,259 | ) | | | (1,072 | ) |
| Fair Value of Plan Assets at December 31 | | $ | -- | | | $ | -- | |
| Reconciliation of Projected Benefit Obligation: | | | | | | | | |
| Projected Benefit Obligation at January 1 | | $ | 29,323 | | | $ | 27,797 | |
| Service Cost | | | 45 | | | | 81 | |
| Interest Cost | | | 1,479 | | | | 1,632 | |
| Benefit Payments | | | (1,259 | ) | | | (1,072 | ) |
| Plan Amendments | | | -- | | | | -- | |
| Actuarial (Gain) Loss | | | 2,337 | | | | 885 | |
| Projected Benefit Obligation at December 31 | | $ | 31,925 | | | $ | 29,323 | |
| Reconciliation of Funded Status: | | | | | | | | |
| Funded Status at December 31 | | $ | (31,925 | ) | | $ | (29,323 | ) |
| Unrecognized Net Actuarial Loss | | | 7,882 | | | | 5,872 | |
| Unrecognized Prior Service Cost | | | 448 | | | | 521 | |
| Cumulative Employer Contributions in Excess of Net Periodic Benefit Cost | | $ | (23,595 | ) | | $ | (22,930 | ) |
| (in thousands) | | 2013 | | | 2012 | |
| Reconciliation of Fair Value of Plan Assets: | | | | | | |
| Fair Value of Plan Assets at January 1 | | $ | -- | | | $ | -- | |
| Actual Return on Plan Assets | | | -- | | | | -- | |
| Employer Contributions | | | 1,137 | | | | 1,259 | |
| Benefit Payments | | | (1,137 | ) | | | (1,259 | ) |
| Fair Value of Plan Assets at December 31 | | $ | -- | | | $ | -- | |
| Reconciliation of Projected Benefit Obligation: | | | | | | | | |
| Projected Benefit Obligation at January 1 | | $ | 31,925 | | | $ | 29,323 | |
| Service Cost | | | 51 | | | | 45 | |
| Interest Cost | | | 1,408 | | | | 1,479 | |
| Benefit Payments | | | (1,137 | ) | | | (1,259 | ) |
| Plan Amendments | | | -- | | | | -- | |
| Actuarial (Gain) Loss | | | (2,926 | ) | | | 2,337 | |
| Projected Benefit Obligation at December 31 | | $ | 29,321 | | | $ | 31,925 | |
| Reconciliation of Funded Status: | | | | | | | | |
| Funded Status at December 31 | | $ | (29,321 | ) | | $ | (31,925 | ) |
| Unrecognized Net Actuarial Loss | | | 4,436 | | | | 7,882 | |
| Unrecognized Prior Service Cost | | | 374 | | | | 448 | |
| Cumulative Employer Contributions in Excess of Net Periodic Benefit Cost | | $ | (24,511 | ) | | $ | (23,595 | ) |
Weighted-average assumptions used to determine benefit obligations at December 31:
| | | 2012 | | 2011 | | 2013 | | | 2012 | |
| Discount Rate | | | 4.50 | % | | | 5.15 | % | | | 5.30% | | | | 4.50% | |
| Rate of Increase in Future Compensation Level | | | 3.19 | % | | | 4.59 | % | | | 3.18% | | | | 3.19% | |
The estimated amounts of unrecognized net actuarial losses and prior service costs to be amortized from regulatory assets and accumulated other comprehensive loss into the net periodic pension cost for the ESSRP in 20132014 are:
| (in thousands) | | 2013 | | | 2014 | |
| Decrease in Regulatory Assets: | | | | | | |
| Amortization of Unrecognized Prior Service Cost | | $ | 22 | | | $ | 22 | |
| Amortization of Unrecognized Actuarial Loss | | | 208 | | | | 142 | |
| Decrease in Accumulated Other Comprehensive Loss: | | | | | | | | |
| Amortization of Unrecognized Prior Service Cost | | | 51 | | | | 51 | |
| Amortization of Unrecognized Actuarial Loss | | | 313 | | | | 46 | |
| Total Estimated Amortization | | $ | 594 | | | $ | 261 | |
Cash flows—The ESSRP is unfunded and has no assets; contributions are equal to the benefits paid to plan participants. The following benefit payments, which reflect future service, as appropriate, are expected to be paid:
| | | | Years | |
| (in thousands) | | 2013 | | | 2014 | | | 2015 | | | 2016 | | | 2017 | | | 2018-2022 | |
| | | $ | 1,197 | | | $ | 1,239 | | | $ | 1,403 | | | $ | 1,391 | | | $ | 1,362 | | | $ | 7,954 | |
| | | | Years | |
| (in thousands) | | 2014 | | | 2015 | | | 2016 | | | 2017 | | | 2018 | | | 2019-2023 | |
| | | $ | 1,178 | | | $ | 1,392 | | | $ | 1,381 | | | $ | 1,359 | | | $ | 1,402 | | | $ | 8,939 | |
Other Postretirement Benefits
The Company provides a portion of health insurance and life insurance benefits for retired OTP and corporate employees. Substantially all of the Company’s electric utility and corporate employees may become eligible for health insurance benefits if they reach age 55 and have 10 years of service. On adoption of Statement of Financial Accounting Standards No. 106, Employers’ Accounting for Postretirement Benefits Other Than Pensions, in January 1993, the Company elected to recognize its transition obligation related to postretirement benefits earned of approximately $14,964,000 over a period of 20 years. There are no plan assets.
Components of net periodic postretirement benefit cost:
| (in thousands) | | 2012 | | | 2011 | | | 2010 | | | 2013 | | | 2012 | | | 2011 | |
| Service Cost--Benefit Earned During the Period | | $ | 1,799 | | | $ | 1,524 | | | $ | 1,634 | | |
| Service Cost–Benefit Earned During the Period | | | $ | 1,421 | | | $ | 1,544 | | | $ | 1,275 | |
| Interest Cost on Projected Benefit Obligation | | | 3,500 | | | | 3,418 | | | | 3,207 | | | | 2,050 | | | | 2,574 | | | | 2,384 | |
| Amortization of Transition Obligation | | | 748 | | | | 748 | | | | 748 | | | | | | | | | | | | | |
| From Regulatory Asset | | | | -- | | | | 729 | | | | 729 | |
From Other Comprehensive Income1 | | | | -- | | | | 19 | | | | 19 | |
| Amortization of Prior Service Cost | | | 211 | | | | 211 | | | | 211 | | | | | | | | | | | | | |
| From Regulatory Asset | | | | 205 | | | | 206 | | | | 206 | |
From Other Comprehensive Income1 | | | | 5 | | | | 5 | | | | 5 | |
| Amortization of Net Actuarial Loss | | | 1,517 | | | | 835 | | | | 832 | | | | | | | | | | | | | |
| Expense Decrease Due to Medicare Part D Subsidy | | | (2,039 | ) | | | (2,118 | ) | | | (2,078 | ) | |
| From Regulatory Asset | | | | 24 | | | | 642 | | | | -- | |
From Other Comprehensive Income1 | | | | 1 | | | | 17 | | | | -- | |
| Net Periodic Postretirement Benefit Cost | | $ | 5,736 | | | $ | 4,618 | | | $ | 4,554 | | | $ | 3,706 | | | $ | 5,736 | | | $ | 4,618 | |
| Effect of Medicare Part D Subsidy | | | $ | (1,806 | ) | | $ | (2,039 | ) | | $ | (2,118 | ) |
1Corporate cost included in Other Nonelectric Expenses. | | 1Corporate cost included in Other Nonelectric Expenses. | |
Weighted-average assumptions used to determine net periodic postretirement benefit cost for the year ended December 31:
| | | 2012 | | 2011 | | 2010 |
| Discount Rate | | | 5.05 | % | | | 5.75 | % | | | 5.75 | % |
| | | 2013 | | | 2012 | | | 2011 | |
| Discount Rate | | | 4.25 | % | | | 5.05 | % | | | 5.75 | % |
The following table presents amounts recognized in the consolidated balance sheets as of December 31:
| (in thousands) | | 2012 | | | 2011 | | | 2013 | | | 2012 | |
| Regulatory Asset: | | | | | | | | | | | | |
| Unrecognized Transition Obligation | | $ | -- | | | $ | 723 | | |
| Unrecognized Prior Service Cost | | | 745 | | | | 950 | | | $ | 540 | | | $ | 745 | |
| Unrecognized Net Actuarial Loss | | | 14,364 | | | | 6,736 | | |
| Unrecognized Net Actuarial (Gain) Loss | | | | (344 | ) | | | 14,364 | |
| Net Regulatory Asset | | | 15,109 | | | | 8,409 | | | $ | 196 | | | $ | 15,109 | |
| Projected Benefit Obligation Liability – Net Amount Recognized | | | (58,883 | ) | | | (48,263 | ) | | $ | (45,221 | ) | | $ | (58,883 | ) |
| Accumulated Other Comprehensive Loss: | | | | | | | | | | | | | | | | |
| Unrecognized Transition Obligation | | | -- | | | | 15 | | |
| Unrecognized Prior Service Cost | | | 14 | | | | 17 | | | $ | 18 | | | $ | 23 | |
| Unrecognized Net Actuarial Loss (Gain) | | | 106 | | | | 4 | | |
| Accumulated Other Comprehensive Loss | | | 120 | | | | 36 | | |
| Deferred Income Taxes | | | 80 | | | | 24 | | |
| Cumulative Employer Contributions in Excess of Net Periodic Benefit Cost | | $ | (43,574 | ) | | $ | (39,794 | ) | |
| Unrecognized Net Actuarial (Gain) Loss | | | | (261 | ) | | | 177 | |
| Accumulated Other Comprehensive (Gain) Loss | | | $ | (243 | ) | | $ | 200 | |
The following tables provide a reconciliation of the changes in the fair value of plan assets and the plan’s projected benefit obligations and accrued postretirement benefit cost over the two-year period ended December 31, 2012:2013:
| (in thousands) | | 2012 | | | 2011 | | | 2013 | | | 2012 | |
| Reconciliation of Fair Value of Plan Assets: | | | | | | | | | | | | |
| Fair Value of Plan Assets at January 1 | | $ | -- | | | $ | -- | | | $ | -- | | | $ | -- | |
| Actual Return on Plan Assets | | | -- | | | | -- | | | | -- | | | | -- | |
| Company Contributions | | | 1,956 | | | | 2,066 | | | | 2,012 | | | | 1,956 | |
| Benefit Payments (Net of Medicare Part D Subsidy) | | | (4,296 | ) | | | (4,119 | ) | | | (4,626 | ) | | | (4,296 | ) |
| Participant Premium Payments | | | 2,340 | | | | 2,053 | | | | 2,614 | | | | 2,340 | |
| Fair Value of Plan Assets at December 31 | | $ | -- | | | $ | -- | | | $ | -- | | | $ | -- | |
| Reconciliation of Projected Benefit Obligation: | | | | | | | | | | | | | | | | |
| Projected Benefit Obligation at January 1 | | $ | 48,263 | | | $ | 42,372 | | | $ | 58,883 | | | $ | 48,263 | |
| Service Cost (Net of Medicare Part D Subsidy) | | | 1,544 | | | | 1,275 | | | | 1,421 | | | | 1,544 | |
| Interest Cost (Net of Medicare Part D Subsidy) | | | 2,575 | | | | 2,384 | | | | 2,050 | | | | 2,575 | |
| Benefit Payments (Net of Medicare Part D Subsidy) | | | (4,296 | ) | | | (4,119 | ) | | | (4,626 | ) | | | (4,296 | ) |
| Participant Premium Payments | | | 2,340 | | | | 2,053 | | | | 2,614 | | | | 2,340 | |
| Actuarial Loss | | | 8,457 | | | | 4,298 | | |
| Actuarial (Gain) Loss | | | | (15,121 | ) | | | 8,457 | |
| Projected Benefit Obligation at December 31 | | $ | 58,883 | | | $ | 48,263 | | | $ | 45,221 | | | $ | 58,883 | |
| Reconciliation of Accrued Postretirement Cost: | | | | | | | | | | | | | | | | |
| Accrued Postretirement Cost at January 1 | | $ | (39,794 | ) | | $ | (37,242 | ) | | $ | (43,574 | ) | | $ | (39,794 | ) |
| Expense | | | (5,736 | ) | | | (4,618 | ) | | | (3,706 | ) | | | (5,736 | ) |
| Net Company Contribution | | | 1,956 | | | | 2,066 | | | | 2,012 | | | | 1,956 | |
| Accrued Postretirement Cost at December 31 | | $ | (43,574 | ) | | $ | (39,794 | ) | | $ | (45,268 | ) | | $ | (43,574 | ) |
Weighted-average assumptions used to determine benefit obligations at December 31:
| | | 2012 | | 2011 |
| Discount Rate | | | 4.25 | % | | | 5.05 | % |
| | | 2013 | | | 2012 | |
| Discount Rate | | | 5.10% | | | | 4.25% | |
Assumed healthcare cost-trend rates as of December 31:
| | | 2012 | | 2011 | | 2013 | | | 2012 | |
| Healthcare Cost-Trend Rate Assumed for Next Year Pre-65 | | | 6.62 | % | | | 6.78 | % | | | 6.47% | | | | 6.62% | |
| Healthcare Cost-Trend Rate Assumed for Next Year Post-65 | | | 7.01 | % | | | 7.21 | % | | | 6.82% | | | | 7.01% | |
| Rate at Which the Cost-Trend Rate is Assumed to Decline | | | 5.00 | % | | | 5.00 | % | | | 5.00% | | | | 5.00% | |
| Year the Rate Reaches the Ultimate Trend Rate | | | 2025 | | | | 2025 | | | | 2025 | | | | 2025 | |
Assumed healthcare cost-trend rates have a significant effect on the amounts reported for healthcare plans. A one-percentage-point change in assumed healthcare cost-trend rates for 20122013 would have the following effects:
| (in thousands) | | 1 Point Increase | | | 1 Point
Decrease | | | 1 Point
Increase | | | 1 Point
Decrease | |
| Effect on the Postretirement Benefit Obligation | | $ | 7,725 | | | $ | (6,401 | ) | | $ | 5,306 | | | $ | (4,449 | ) |
| Effect on Total of Service and Interest Cost | | $ | 700 | | | $ | (560 | ) | | $ | 634 | | | $ | (500 | ) |
| Effect on Expense | | $ | 1,330 | | | $ | (1,088 | ) | | $ | 1,266 | | | $ | (525 | ) |
| Measurement Dates: | 2012 | 2011 | 2013 | 2012 |
| | | | |
| Net Periodic Postretirement Benefit Cost | January 1, 2012 | January 1, 2011 | January 1, 2013 | January 1, 2012 |
| | | | | |
| End of Year Benefit Obligations | January 1, 2012 projected to
December 31, 2012 | January 1, 2011 projected to
December 31, 2011 | January 1, 2013 projected to
December 31, 2013 | January 1, 2012 projected to
December 31, 2012 |
The estimated net amounts of unrecognized transition obligation and prior service costscost to be amortized from regulatory assets and accumulated other comprehensive loss into the net periodic postretirement benefit cost in 20132014 are:
| (in thousands) | | 2013 | | | 2014 | |
| Decrease in Regulatory Assets: | | | | | | |
| Amortization of Unrecognized Prior Service Cost | | $ | 205 | | | $ | 205 | |
| Amortization of Unrecognized Actuarial Loss | | | 991 | | |
| Decrease in Accumulated Other Comprehensive Loss: | | | | | | | | |
| Amortization of Unrecognized Prior Service Cost | | | 5 | | | | 5 | |
| Amortization of Unrecognized Actuarial Loss | | | 26 | | |
| Total Estimated Amortization | | $ | 1,227 | | | $ | 210 | |
Cash flows—The Company expects to contribute $2.9$2.7 million net of expected employee contributions for the payment of retiree medical benefits and Medicare Part D subsidy receipts in 2013.2014. The Company expects to receive a Medicare Part D subsidy from the Federal government of approximately $502,000$448,000 in 2013.2014. The following benefit payments, which reflect expected future service, as appropriate, are expected to be paid:
| | | | Years | |
| (in thousands) | | 2013 | | | 2014 | | | 2015 | | | 2016 | | | 2017 | | | 2018-2022 | |
| | | $ | 2,903 | | | $ | 3,067 | | | $ | 3,170 | | | $ | 3,305 | | | $ | 3,517 | | | $ | 20,006 | |
| | | | Years | |
| (in thousands) | | 2014 | | | 2015 | | | 2016 | | | 2017 | | | 2018 | | | 2019-2023 | |
| | | $ | 2,653 | | | $ | 2,785 | | | $ | 2,899 | | | $ | 3,061 | | | $ | 3,206 | | | $ | 17,207 | |
401K Plan
The Company sponsors a 401K plan for the benefit of all corporate and subsidiary company employees. Contributions made to these plans by the Company and its subsidiary companies included in continuing operations totaled $2,553,000$3,042,000 for 2013, $2,547,000 for 2012 and $2,598,000 for 2011 and $2,122,000 for 2010.2011.
Employee Stock Ownership Plan
The Company has a stock ownership plan for the benefit of all its electric utility employees. Contributions made by the Company were $705,000 for 2013, $735,000 for 2012 and $760,000 for 2011 and $779,000 for 2010.2011.
13. Fair Value of Financial Instruments
The following methods and assumptions were used to estimate the fair value of each class of financial instruments for which it is practicable to estimate that value:
Cash and Short-Term Investments—The carrying amount approximates fair value because of the short-term maturity of those instruments.
Short-Term Debt—The carrying amount approximates fair value because the debt obligation is short-term and the balance outstanding related to the OTP Credit Agreement is subject to a variable interest rate of LIBOR plus 1.25%, which approximates current market rates.
Long-Term Debt including Current Maturities—The fair value of the Company’s long-term debt is estimated based on the current market indications of rates available to the Company for the issuance of debt. The Company’s long-term debt subject to variable interest rates approximates fair value. The fair value measurements of the Company’s long-term debt issues fall into level 2 of the fair value hierarchy set forth in ASC 820, Fair Value Measurement.820.
| | | December 31, 2012 | | | December 31, 2011 | |
| (in thousands) | | Carrying
Amount | | | Fair Value | | | Carrying
Amount | | | Fair Value | |
| Cash and Short-Term Investments | | $ | 52,362 | | | $ | 52,362 | | | $ | 15,994 | | | $ | 15,994 | |
| Long-Term Debt | | | (421,680 | ) | | | (491,244 | ) | | | (471,915 | ) | | | (525,041 | ) |
| | | December 31, 2013 | | | December 31, 2012 | |
| (in thousands) | | Carrying Amount | | | Fair Value | | | Carrying
Amount | | | Fair Value | |
| Cash and Cash Equivalents | | $ | 1,150 | | | $ | 1,150 | | | $ | 52,362 | | | $ | 52,362 | |
| Short-Term Debt | | | (51,195 | ) | | | (51,195 | ) | | | -- | | | | -- | |
| Long-Term Debt including Current Maturities | | | (389,777 | ) | | | (427,796 | ) | | | (421,856 | ) | | | (491,244 | ) |
14. Property, Plant and Equipment
| (in thousands) | | December 31,
2012 | | | December 31,
2011 | | | December 31,
2013 | | | December 31,
2012 | |
| Electric Plant in Service | | | | | | | | | | | | |
| Production | | $ | 672,120 | | | $ | 669,805 | | | $ | 679,067 | | | $ | 672,120 | |
| Transmission | | | 261,447 | | | | 229,320 | | | | 270,606 | | | | 261,447 | |
| Distribution | | | 405,461 | | | | 390,383 | | | | 421,803 | | | | 405,461 | |
| General | | | 84,275 | | | | 83,026 | | | | 89,408 | | | | 84,275 | |
| Electric Plant in Service | | | 1,423,303 | | | | 1,372,534 | | | | 1,460,884 | | | | 1,423,303 | |
| Construction Work in Progress | | | 75,758 | | | | 49,123 | | | | 184,780 | | | | 75,758 | |
| Total Gross Electric Plant | | | 1,499,061 | | | | 1,421,657 | | | | 1,645,664 | | | | 1,499,061 | |
| Less Accumulated Depreciation and Amortization | | | 526,467 | | | | 499,327 | | | | 554,818 | | | | 526,467 | |
| Net Electric Plant | | $ | 972,594 | | | $ | 922,330 | | | $ | 1,090,846 | | | $ | 972,594 | |
| Nonelectric Operations Plant | | | | | | | | | | | | | | | | |
| Equipment | | $ | 144,901 | | | $ | 137,644 | | | $ | 153,098 | | | $ | 144,901 | |
| Buildings and Leasehold Improvements | | | 37,209 | | | | 35,726 | | | | 38,074 | | | | 37,209 | |
| Land | | | 3,984 | | | | 3,958 | | | | 3,700 | | | | 3,984 | |
| Nonelectric Operations Plant | | | 186,094 | | | | 177,328 | | | | 194,872 | | | | 186,094 | |
| Construction Work in Progress | | | 2,132 | | | | 3,628 | | | | 2,681 | | | | 2,132 | |
| Total Gross Nonelectric Plant | | | 188,226 | | | | 180,956 | | | | 197,553 | | | | 188,226 | |
| Less Accumulated Depreciation and Amortization | | | 111,368 | | | | 100,424 | | | | 121,383 | | | | 111,368 | |
| Net Nonelectric Operations Plant | | $ | 76,858 | | | $ | 80,532 | | | $ | 76,170 | | | $ | 76,858 | |
| Net Plant | | $ | 1,049,452 | | | $ | 1,002,862 | | | $ | 1,167,016 | | | $ | 1,049,452 | |
The estimated service lives for rate-regulated properties is 5 to 70 years. For nonelectric property the estimated useful lives are from 3 to 40 years.
| | | Service Life Range | |
| (years) | | Low | | | High | |
| Electric Fixed Assets: | | | | | | |
| Production Plant | | | 34 | | | | 62 | |
| Transmission Plant | | | 40 | | | | 55 | |
| Distribution Plant | | | 15 | | | | 55 | |
| General Plant | | | 5 | | | | 70 | |
| Nonelectric Fixed Assets: | | | | | | | | |
| Equipment | | | 3 | | | | 12 | |
| Buildings and Leasehold Improvements | | | 7 | | | | 40 | |
15. Income Taxes
The total income tax expense differs from the amount computed by applying the federal income tax rate (35% in 2013, 2012 2011 and 2010)2011) to net income before total income tax expense for the following reasons:
| (in thousands) | | 2012 | | | 2011 | | | 2010 | | | 2013 | | | 2012 | | | 2011 | |
| Tax Computed at Federal Statutory Rate | | $ | 14,385 | | | $ | 13,661 | | | $ | 10,329 | | | $ | 22,301 | | | $ | 14,385 | | | $ | 13,661 | |
| Increases (Decreases) in Tax from: | | | | | | | | | | | | | | | | | | | | | | | | |
| Federal Production Tax Credit | | | (6,695 | ) | | | (7,281 | ) | | | (6,441 | ) | | | (6,612 | ) | | | (6,695 | ) | | | (7,281 | ) |
| State Income Taxes Net of Federal Income Tax Expense (Benefit) | | | | 1,667 | | | | (849 | ) | | | 798 | |
| North Dakota Wind Tax Credit Amortization – Net of Federal Taxes | | | (891 | ) | | | (996 | ) | | | (1,163 | ) | | | (863 | ) | | | (891 | ) | | | (996 | ) |
| State Income Taxes Net of Federal Income Tax Benefit | | | (849 | ) | | | 798 | | | | (1,186 | ) | |
| Corporate Owned Life Insurance | | | | (856 | ) | | | (585 | ) | | | (388 | ) |
| Allowance for Funds Used During Construction - Equity | | | | (638 | ) | | | (409 | ) | | | (301 | ) |
| Dividend Received/Paid Deduction | | | | (632 | ) | | | (656 | ) | | | (677 | ) |
| Investment Tax Credit Amortization | | | (720 | ) | | | (855 | ) | | | (926 | ) | | | (597 | ) | | | (720 | ) | | | (855 | ) |
| Dividend Received/Paid Deduction | | | (656 | ) | | | (677 | ) | | | (692 | ) | |
| Corporate Owned Life Insurance | | | (585 | ) | | | (388 | ) | | | (556 | ) | |
| Impact of Medicare Part D Change | | | (584 | ) | | | (599 | ) | | | 1,692 | | |
| Allowance for Funds Used During Construction - Equity | | | (409 | ) | | | (301 | ) | | | (1 | ) | |
| Tax Depreciation - Treasury Grant for Wind Farms | | | (304 | ) | | | (507 | ) | | | (845 | ) | | | (304 | ) | | | (304 | ) | | | (507 | ) |
| Differences Reversing in Excess of Federal Rates | | | (143 | ) | | | 680 | | | | 989 | | | | (100 | ) | | | (143 | ) | | | 680 | |
| Impact of Medicare Part D Change | | | | -- | | | | (584 | ) | | | (599 | ) |
| Permanent and Other Differences | | | (416 | ) | | | 586 | | | | 2,031 | | | | 177 | | | | (416 | ) | | | 586 | |
| Total Income Tax Expense – Continuing Operations | | $ | 2,133 | | | $ | 4,121 | | | $ | 3,231 | | | $ | 13,543 | | | $ | 2,133 | | | $ | 4,121 | |
| Income Tax (Benefit) Expense – Discontinued Operations | | | (14,667 | ) | | | (13,404 | ) | | | 720 | | |
| Income Tax (Benefit) Expense – Continuing and Discontinued Operations | | $ | (12,534 | ) | | $ | (9,283 | ) | | $ | 3,951 | | |
| Income Tax Expense (Benefit) – Discontinued Operations – U.S. | | | | 15 | | | | (14,667 | ) | | | (13,325 | ) |
| Income Tax (Benefit) – Discontinued Operations – Foreign | | | | -- | | | | -- | | | | (79 | ) |
| Income Tax Expense (Benefit) – Continuing and Discontinued Operations | | | $ | 13,558 | | | $ | (12,534 | ) | | $ | (9,283 | ) |
| Overall Effective Federal, State and Foreign Income Tax Rate | | | 70.4 | % | | | 41.2 | % | | | 151.5 | % | | | 21.0 | % | | | 70.4 | % | | | 41.2 | % |
| | | | | | | | | | | | | | | | | | | | | | | | | |
| Income Tax Expense From Continuing Operations Includes the Following: | | | | | | | | | | | | | | | | | | | | | | | | |
| Current Federal Income Taxes | | $ | (7,198 | ) | | $ | (4,303 | ) | | $ | (14,156 | ) | | $ | 146 | | | $ | (7,198 | ) | | $ | (4,303 | ) |
| Current State Income Taxes | | | (1,402 | ) | | | (754 | ) | | | 3,448 | | | | 37 | | | | (1,402 | ) | | | (754 | ) |
| Deferred Federal Income Taxes | | | 15,878 | | | | 14,308 | | | | 25,166 | | | | 18,310 | | | | 15,878 | | | | 14,308 | |
| Deferred State Income Taxes | | | 3,161 | | | | 4,002 | | | | (2,697 | ) | | | 3,122 | | | | 3,161 | | | | 4,002 | |
| Federal Production Tax Credit | | | (6,695 | ) | | | (7,281 | ) | | | (6,441 | ) | | | (6,612 | ) | | | (6,695 | ) | | | (7,281 | ) |
| North Dakota Wind Tax Credit Amortization – Net of Federal Taxes | | | (891 | ) | | | (996 | ) | | | (1,163 | ) | | | (863 | ) | | | (891 | ) | | | (996 | ) |
| Investment Tax Credit Amortization | | | (720 | ) | | | (855 | ) | | | (926 | ) | | | (597 | ) | | | (720 | ) | | | (855 | ) |
| Total | | $ | 2,133 | | | $ | 4,121 | | | $ | 3,231 | | | $ | 13,543 | | | $ | 2,133 | | | $ | 4,121 | |
| (Loss) Income Before Income Taxes – U.S. | | $ | (13,426 | ) | | $ | (7,547 | ) | | $ | 13,670 | | |
| Loss Before Income Taxes – Foreign | | | (4,381 | ) | | | (14,979 | ) | | | (11,063 | ) | |
| Total Income Before Income Taxes – Continuing and Discontinued Operations | | $ | (17,807 | ) | | $ | (22,526 | ) | | $ | 2,607 | | |
| Income (Loss) Before Income Taxes – U.S. | | | $ | 63,924 | | | $ | (13,426 | ) | | $ | (7,547 | ) |
| Income (Loss) Before Income Taxes – Foreign (Discontinued Operations) | | | | 499 | | | | (4,381 | ) | | | (14,979 | ) |
| Total Income (Loss) Before Income Taxes – Continuing and Discontinued Operations | | | $ | 64,423 | | | $ | (17,807 | ) | | $ | (22,526 | ) |
The Company’s deferred tax assets and liabilities were composed of the following on December 31:
| (in thousands) | | 2012 | | | 2011 | | | 2013 | | | 2012 | |
| Deferred Tax Assets | | | | | | | | | | | | |
| North Dakota Wind Tax Credits | | $ | 44,172 | | | $ | 44,370 | | | $ | 42,241 | | | $ | 44,172 | |
| Retirement Benefits Liabilities | | | | 39,524 | | | | 34,618 | |
| Benefit Liabilities | | | 35,459 | | | | 35,006 | | | | 39,290 | | | | 35,459 | |
| Retirement Benefits Liabilities | | | 34,618 | | | | 27,214 | | |
| Net Operating Loss Carryforward | | | 27,682 | | | | 7,727 | | |
| Federal Production Tax Credits | | | 27,048 | | | | 20,354 | | | | 33,620 | | | | 27,048 | |
| Cost of Removal | | | 25,869 | | | | 25,777 | | | | 27,926 | | | | 25,869 | |
| Net Operating Loss Carryforward | | | | 15,360 | | | | 27,682 | |
| Differences Related to Property | | | 12,983 | | | | 10,227 | | | | 9,462 | | | | 12,983 | |
| Vacation Accrual | | | | 1,985 | | | | 2,017 | |
| Investment Tax Credits | | | 2,554 | | | | 3,379 | | | | 1,960 | | | | 2,554 | |
| Vacation Accrual | | | 2,017 | | | | 1,945 | | |
| Other | | | 10,853 | | | | 9,393 | | | | 4,045 | | | | 10,853 | |
| Total Deferred Tax Assets | | $ | 223,255 | | | $ | 185,392 | | | $ | 215,413 | | | $ | 223,255 | |
| Deferred Tax Liabilities | | | | | | | | | | | | | | | | |
| Differences Related to Property | | $ | (301,991 | ) | | $ | (289,542 | ) | | $ | (306,232 | ) | | $ | (301,991 | ) |
| Retirement Benefits Regulatory Asset | | | (34,618 | ) | | | (27,214 | ) | | | (39,524 | ) | | | (34,618 | ) |
| North Dakota Wind Tax Credits | | | (11,923 | ) | | | (11,850 | ) | | | (11,543 | ) | | | (11,923 | ) |
| Excess Tax over Book Pension | | | (6,995 | ) | | | (6,353 | ) | | | (6,977 | ) | | | (6,995 | ) |
| Impact of State Net Operating Losses on Federal Taxes | | | (3,484 | ) | | | (2,710 | ) | | | (3,088 | ) | | | (3,484 | ) |
| Regulatory Asset | | | (1,691 | ) | | | (1,969 | ) | | | (1,805 | ) | | | (1,691 | ) |
| Renewable Resource Rider Accrued Revenue | | | (934 | ) | | | (1,913 | ) | | | (329 | ) | | | (934 | ) |
| Other | | | (2,442 | ) | | | (7,630 | ) | | | (6,066 | ) | | | (2,442 | ) |
| Total Deferred Tax Liabilities | | $ | (364,078 | ) | | $ | (349,181 | ) | | $ | (375,564 | ) | | $ | (364,078 | ) |
| Deferred Income Taxes | | $ | (140,823 | ) | | $ | (163,789 | ) | | $ | (160,151 | ) | | $ | (140,823 | ) |
Schedule of expiration of tax net operating losses and tax credits available as of December 31, 2012:2013:
| (in thousands) | | Amount | | | 2013 | | | 2014 | | | 2015 | | | 2016 | | | | 2024-33 | | | Amount | | | 2014 | | | 2015 | | | 2016 | | | 2017 | | | | 2024-33 | |
| United States | | | | | | | | | | | | | | | | | | | | | | | | | | | | | | | | | | | | | | |
| Federal Net Operating Losses | | $ | 17,824 | | | $ | -- | | | $ | -- | | | $ | -- | | | $ | -- | | | $ | 17,824 | | | $ | 6,350 | | | $ | -- | | | $ | -- | | | $ | -- | | | $ | -- | | | $ | 6,350 | |
| Federal Tax Credits | | | 28,051 | | | | -- | | | | -- | | | | -- | | | | -- | | | | 28,051 | | | | 35,350 | | | | -- | | | | -- | | | | -- | | | | -- | | | | 35,350 | |
| State Net Operating Losses | | | 9,955 | | | | -- | | | | -- | | | | -- | | | | -- | | | | 9,955 | | | | 8,823 | | | | -- | | | | -- | | | | -- | | | | -- | | | | 8,823 | |
| State Tax Credits | | | 43,400 | | | | 2,461 | | | | 1,950 | | | | 1,950 | | | | 1,950 | | | | 35,089 | | | | 40,750 | | | | 2,339 | | | | 2,339 | | | | 2,339 | | | | 389 | | | | 33,344 | |
The carryforward period on a portion of the North Dakota wind tax credits from the Langdon wind project is five years. OTP has adjusted its Deferred Tax Assets and Deferred Tax Credits by $9.2$10.3 million for potential unused North Dakota wind tax credits related to the Langdon wind project.
The following table summarizes the activity related to our unrecognized tax benefits:
| (in thousands) | | 2012 | | | 2011 | | | 2010 | | | 2013 | | | 2012 | | | 2011 | |
| Balance on January 1 | | $ | 12,138 | | | $ | 900 | | | $ | 900 | | | $ | 4,436 | | | $ | 12,138 | | | $ | 900 | |
| Increases Related to Tax Positions for Prior Years | | | -- | | | | 11,238 | | | | -- | | | | 98 | | | | -- | | | | 11,238 | |
| Decreases Related to Tax Positions for Prior Years | | | (6,802 | ) | | | | | | | | | | | (295 | ) | | | (6,802 | ) | | | -- | |
| Uncertain Positions Resolved During Year | | | (900 | ) | | | -- | | | | -- | | | | -- | | | | (900 | ) | | | -- | |
| Balance on December 31 | | $ | 4,436 | | | $ | 12,138 | | | $ | 900 | | | $ | 4,239 | | | $ | 4,436 | | | $ | 12,138 | |
The balance of unrecognized tax benefits as of December 31, 20122013 would not reduce our effective tax rate if recognized. The total amount of unrecognized tax benefits as of December 31, 20122013 is not expected to change significantly within the next 12 months. The Company classifies interest and penalties on tax uncertainties as components of the provision for income taxes in our consolidated statement of income. There was no amount accrued for interest on tax uncertainties as of December 31, 2012.2013.
The Company and its subsidiaries file a consolidated U.S. federal income tax return and various state and foreign income tax returns. As of December 31, 2012,2013, with limited exceptions, the Company is no longer subject to examinations by taxing authorities for tax years prior to 2009.
2010. On September 13, 2013 the IRS and U.S. Treasury issued final regulations on the deductibility and capitalization of expenditures related to tangible property, generally effective for tax years beginning on or after January 1, 2014. Taxpayers were allowed to elect early adoption of the regulations for the 2012 or 2013 tax year. Deferred tax liabilities at December 31, 2013 are not materially affected by the regulations. The final regulations do not impact the effect of Revenue Procedure 2013-24 issued on April 30, 2013, which provided guidance for repairs related to generation property. Among other things, the Revenue Procedure listed units of property and material components of units of property for purposes of analyzing repair versus capitalization issues. The Company will likely adopt Revenue Procedure 2013-24 and the final tangible property regulations for income tax filings for tax year 2014.
16. Asset Retirement Obligations (AROs)
The Company’s AROs are related to OTP’s coal-fired generation plants and its 92 wind turbines located in North Dakota. The AROs include items such as site restoration, closure of ash pits, and removal of certain structures, generators, asbestos and storage tanks. The Company has legal obligations associated with the retirement of a variety of other long-lived tangible assets used in electric operations where the estimated settlement costs are individually and collectively immaterial. The Company has no assets legally restricted for the settlement of any of its AROs.
OTP recorded no new AROs in 2012.2013.
Reconciliations of carrying amounts of the present value of the Company’s legal AROs, capitalized asset retirement costs and related accumulated depreciation and a summary of settlement activity for the years ended December 31, 20122013 and 20112012 are presented in the following table:
| (in thousands) | | 2012 | | | 2011 | |
| Asset Retirement Obligations | | | | | | |
| Beginning Balance | | $ | 4,808 | | | $ | 4,402 | |
| New Obligations Recognized | | | -- | | | | -- | |
| Adjustments Due to Revisions in Cash Flow Estimates | | | (20 | ) | | | 22 | |
| Accrued Accretion | | | 419 | | | | 384 | |
| Settlements | | | -- | | | | -- | |
| Ending Balance | | $ | 5,207 | | | $ | 4,808 | |
| Asset Retirement Costs Capitalized | | | | | | | | |
| Beginning Balance | | $ | 1,497 | | | $ | 1,497 | |
| New Obligations Recognized | | | -- | | | | -- | |
| Adjustments Due to Revisions in Cash Flow Estimates | | | (20 | ) | | | -- | |
| Settlements | | | -- | | | | -- | |
| Ending Balance | | $ | 1,477 | | | $ | 1,497 | |
| Accumulated Depreciation - Asset Retirement Costs Capitalized | | | | | | | | |
| Beginning Balance | | $ | 351 | | | $ | 290 | |
| New Obligations Recognized | | | -- | | | | -- | |
| Adjustments Due to Revisions in Cash Flow Estimates | | | -- | | | | 4 | |
| Depreciation Expense | | | 56 | | | | 57 | |
| Settlements | | | -- | | | | -- | |
| Ending Balance | | $ | 407 | | | $ | 351 | |
| Settlements | | | | | | | | |
| Original Capitalized Asset Retirement Cost - Retired | | $ | -- | | | $ | -- | |
| Accumulated Depreciation | | | -- | | | | -- | |
| | | | | | | | | |
| Asset Retirement Obligation | | $ | -- | | | $ | -- | |
| Settlement Cost | | | -- | | | | -- | |
| Gain on Settlement – Deferred Under Regulatory Accounting | | $ | -- | | | $ | -- | |
| (in thousands) | | 2013 | | | 2012 | |
| Asset Retirement Obligations | | | | | | |
| Beginning Balance | | $ | 5,207 | | | $ | 4,808 | |
| New Obligations Recognized | | | -- | | | | -- | |
| Adjustments Due to Revisions in Cash Flow Estimates | | | -- | | | | (20 | ) |
| Accrued Accretion | | | 454 | | | | 419 | |
| Settlements | | | -- | | | | -- | |
| Ending Balance | | $ | 5,661 | | | $ | 5,207 | |
| Asset Retirement Costs Capitalized | | | | | | | | |
| Beginning Balance | | $ | 1,477 | | | $ | 1,497 | |
| New Obligations Recognized | | | -- | | | | -- | |
| Adjustments Due to Revisions in Cash Flow Estimates | | | -- | | | | (20 | ) |
| Settlements | | | -- | | | | -- | |
| Ending Balance | | $ | 1,477 | | | $ | 1,477 | |
| Accumulated Depreciation - Asset Retirement Costs Capitalized | | | | | | | | |
| Beginning Balance | | $ | 407 | | | $ | 351 | |
| New Obligations Recognized | | | -- | | | | -- | |
| Adjustments Due to Revisions in Cash Flow Estimates | | | -- | | | | -- | |
| Depreciation Expense | | | 55 | | | | 56 | |
| Settlements | | | -- | | | | -- | |
| Ending Balance | | $ | 462 | | | $ | 407 | |
| Settlements | | None | | | None | |
| Original Capitalized Asset Retirement Cost - Retired | | $ | -- | | | $ | -- | |
| Accumulated Depreciation | | | -- | | | | -- | |
| | | | | | | | | |
| Asset Retirement Obligation | | $ | -- | | | $ | -- | |
| Settlement Cost | | | -- | | | | -- | |
| Gain on Settlement – Deferred Under Regulatory Accounting | | $ | -- | | | $ | -- | |
17. Discontinued Operations
On February 8, 2013 the Company sold substantially all of the assets of ShoreMaster, its waterfront equipment manufacturer,Shrco, formerly included in the Company’s Manufacturing segment, for approximately $13.0 million in cash subject to certain closing conditions. Theand received a working capital true-up of approximately $2.4 million in June 2013. On January 18, 2012, the Company recordedsold the assets of Aviva, a $4.6subsidiary of Shrco, for $0.3 million net-of-tax impairment of ShoreMaster’s assets in December 2012 based on the market value of the assets. cash. For discontinued operations reporting, Aviva’s results are included in Shrco’s consolidated results.
On November 30, 2012 the Company completed the sale of the fixed assets of DMI, its wind tower manufacturing company,IMD for total proceeds, net of commissions and selling costs, of $18.1 million. Prior to the sale, IMD was the only remaining entity in the Company’s former Wind Energy segment.
On February 29, 2012 the Company completed the sale of DMS, its health services company, for $24.0 million in cash net of commissions and selling costs. On January 18, 2012,costs, which was reduced by a $1.7 million working capital settlement paid to the buyer in February 2013. The DMS working capital settlement was estimated to be $1.9 million at the time of the sale. The final settlement resulted in the Company soldrecording a $0.2 million gain on the assetssale of Aviva for $0.3 millionDMS in cash. For discontinued operations reporting, Aviva’s results are includedthe first quarter of 2013. DMS was the only business in ShoreMaster’s consolidated results. the Company’s former Health Services segment.
On December 29, 2011 the Company completed the sale of Wylie for approximately $25.0 million in cash. Wylie and IMD made up the Company’s former Wind Energy segment.
On May 6, 2011 the Company completed the sale of IPH for approximately $86.0 million in cash. For segment reporting, prior to being included in discontinued operations, ShoreMaster was included in the Company’s Manufacturing segment, DMI and Wylie made up the Company’s former Wind Energy segment, DMS was the only business in the Company’s former Health Services segment and IPH was the only business in the Company’s former Food Ingredient Processing segment.
The Company’s Wind Energy, Health Services and Food Ingredient Processing segments were eliminated as a result of the sales of DMI, Wylie,IMD, DMS and IPH.
As of December 31, 2012 the Company met the ASC 360-10-45 criteria for assets held for sale for the ShoreMaster transaction and appropriately classified the assets as held for sale on December 31, 2012 and, as such, ShoreMaster’s activities were required to be reported in discontinued operations in accordance with ASC 205-20-45.
Following are summary presentations of the results of discontinued operations for the years ended December 31, 2013, 2012 2011 and 2010,2011, along with the major components of assets and liabilities of discontinued operations as of December 31, 20122013 and 2011:2012:
| | | For the Year Ended December 31, 2012 | |
| (in thousands) | | DMI | | | Wylie | | | ShoreMaster | | | DMS | | | IPH | | | Intercompany
transactions
adjustment | | | Total | |
| Operating Revenues | | $ | 186,151 | | | $ | -- | | | $ | 32,563 | | | $ | 16,362 | | | $ | -- | | | $ | (2,017 | ) | | $ | 233,059 | |
| Operating Expenses | | | 184,462 | | | | 179 | | | | 36,163 | | | | 14,741 | | | | -- | | | | (2,017 | ) | | | 233,528 | |
| Asset Impairment Charge | | | 45,573 | | | | -- | | | | 7,747 | | | | -- | | | | -- | | | | -- | | | | 53,320 | |
| Operating (Loss) Income | | | (43,884 | ) | | | (179 | ) | | | (11,347 | ) | | | 1,621 | | | | -- | | | | -- | | | | (53,789 | ) |
| Other Income | | | 135 | | | | -- | | | | 15 | | | | 122 | | | | -- | | | | -- | | | | 272 | |
| Interest Expense | | | 5,787 | | | | -- | | | | 1,553 | | | | 279 | | | | -- | | | | (7,444 | ) | | | 175 | |
| Income Tax (Benefit) Expense | | | (15,792 | ) | | | 13 | | | | (4,021 | ) | | | 1,734 | | | | 106 | | | | 2,978 | | | | (14,982 | ) |
| Net Loss from Operations | | | (33,744 | ) | | | (192 | ) | | | (8,864 | ) | | | (270 | ) | | | (106 | ) | | | 4,466 | | | | (38,710 | ) |
| Loss on Disposition Before Taxes | | | -- | | | | (62 | ) | | | -- | | | | (5,154 | ) | | | -- | | | | -- | | | | (5,216 | ) |
| Income Tax Expense (Benefit) on Disposition | | | -- | | | | 460 | | | | -- | | | | (145 | ) | | | -- | | | | -- | | | | 315 | |
| Net Loss on Disposition | | | -- | | | | (522 | ) | | | -- | | | | (5,009 | ) | | | -- | | | | -- | | | | (5,531 | ) |
| Net Loss | | $ | (33,744 | ) | | $ | (714 | ) | | $ | (8,864 | ) | | $ | (5,279 | ) | | $ | (106 | ) | | $ | 4,466 | | | $ | (44,241 | ) |
| | | For the Year Ended December 31, 2013 | |
| (in thousands) | | IMD | | | Wylie | | | Shrco | | | DMS | | | IPH | | | Intercompany Transactions Adjustment | | | Total | |
| Operating Revenues | | $ | -- | | | $ | -- | | | $ | 2,016 | | | $ | -- | | | $ | -- | | | $ | -- | | | $ | 2,016 | |
| Operating Expenses | | | (988 | ) | | | 640 | | | | 2,622 | | | | (269 | ) | | | -- | | | | -- | | | | 2,005 | |
| Other Income | | | 412 | | | | -- | | | | 67 | | | | -- | | | | -- | | | | -- | | | | 479 | |
| Income Tax Expense (Benefit) | | | 370 | | | | (256 | ) | | | (213 | ) | | | 108 | | | | -- | | | | -- | | | | 9 | |
| Net Income (Loss) from Operations | | | 1,030 | | | | (384 | ) | | | (326 | ) | | | 161 | | | | -- | | | | -- | | | | 481 | |
| Gain on Disposition Before Taxes | | | -- | | | | -- | | | | 16 | | | | 200 | | | | -- | | | | -- | | | | 216 | |
| Income Tax Expense on Disposition | | | -- | | | | -- | | | | 6 | | | | -- | | | | -- | | | | -- | | | | 6 | |
| Net Gain on Disposition | | | -- | | | | -- | | | | 10 | | | | 200 | | | | -- | | | | -- | | | | 210 | |
| Net Gain (Loss) | | $ | 1,030 | | | $ | (384 | ) | | $ | (316 | ) | | $ | 361 | | | $ | -- | | | $ | -- | | | $ | 691 | |
| | | For the Year Ended December 31, 2012 | |
| (in thousands) | | IMD | | | Wylie | | | Shrco | | | DMS | | | IPH | | | Intercompany Transactions Adjustment | | | Total | |
| Operating Revenues | | $ | 186,151 | | | $ | -- | | | $ | 32,563 | | | $ | 16,362 | | | $ | -- | | | $ | (2,017 | ) | | $ | 233,059 | |
| Operating Expenses | | | 184,462 | | | | 179 | | | | 36,163 | | | | 14,741 | | | | -- | | | | (2,017 | ) | | | 233,528 | |
| Asset Impairment Charge | | | 45,573 | | | | -- | | | | 7,747 | | | | -- | | | | -- | | | | -- | | | | 53,320 | |
| Operating (Loss) Income | | | (43,884 | ) | | | (179 | ) | | | (11,347 | ) | | | 1,621 | | | | -- | | | | -- | | | | (53,789 | ) |
| Other Income | | | 135 | | | | -- | | | | 15 | | | | 122 | | | | -- | | | | -- | | | | 272 | |
| Interest Expense | | | 5,787 | | | | -- | | | | 1,553 | | | | 279 | | | | -- | | | | (7,444 | ) | | | 175 | |
| Income Tax (Benefit) Expense | | | (15,792 | ) | | | 13 | | | | (4,021 | ) | | | 1,734 | | | | 106 | | | | 2,978 | | | | (14,982 | ) |
| Net Loss from Operations | | | (33,744 | ) | | | (192 | ) | | | (8,864 | ) | | | (270 | ) | | | (106 | ) | | | 4,466 | | | | (38,710 | ) |
| Loss on Disposition Before Taxes | | | -- | | | | (62 | ) | | | -- | | | | (5,154 | ) | | | -- | | | | -- | | | | (5,216 | ) |
| Income Tax Expense (Benefit) on Disposition | | | -- | | | | 460 | | | | -- | | | | (145 | ) | | | -- | | | | -- | | | | 315 | |
| Net Loss on Disposition | | | -- | | | | (522 | ) | | | -- | | | | (5,009 | ) | | | -- | | | | -- | | | | (5,531 | ) |
| Net Loss | | $ | (33,744 | ) | | $ | (714 | ) | | $ | (8,864 | ) | | $ | (5,279 | ) | | $ | (106 | ) | | $ | 4,466 | | | $ | (44,241 | ) |
| | | For the Year Ended December 31, 2011 | | | For the Year Ended December 31, 2011 | |
| (in thousands) | | DMI | | | Wylie | | | ShoreMaster | | | DMS | | | IPH | | | Intercompany
transactions
adjustment | | | Total | | | IMD | | Wylie | | Shrco | | DMS | | IPH | | Intercompany Transactions Adjustment | | Total | |
| Operating Revenues | | $ | 201,921 | | | $ | 49,884 | | | $ | 39,863 | | | $ | 89,558 | | | $ | 28,125 | | | $ | (6,016 | ) | | $ | 403,335 | | | $ | 201,921 | | | $ | 49,884 | | | $ | 39,863 | | | $ | 89,558 | | | $ | 28,125 | | | $ | (6,016 | ) | | $ | 403,335 | |
| Operating Expenses | | | 218,542 | | | | 55,927 | | | | 41,478 | | | | 85,244 | | | | 24,046 | | | | (6,016 | ) | | | 419,221 | | | | 218,542 | | | | 55,927 | | | | 41,478 | | | | 85,244 | | | | 24,046 | | | | (6,016 | ) | | | 419,221 | |
| Asset Impairment Charge | | | 3,142 | | | | -- | | | | 456 | | | | 56,379 | | | | -- | | | | -- | | | | 59,977 | | | | 3,142 | | | | -- | | | | 456 | | | | 56,379 | | | | -- | | | | -- | | | | 59,977 | |
| Operating (Loss) Income | | | (19,763 | ) | | | (6,043 | ) | | | (2,071 | ) | | | (52,065 | ) | | | 4,079 | | | | -- | | | | (75,863 | ) | | | (19,763 | ) | | | (6,043 | ) | | | (2,071 | ) | | | (52,065 | ) | | | 4,079 | | | | -- | | | | (75,863 | ) |
| Other (Deductions) Income | | | (46 | ) | | | 18 | | | | 1 | | | | 281 | | | | (228 | ) | | | (3 | ) | | | 23 | | | | (46 | ) | | | 18 | | | | 1 | | | | 281 | | | | (228 | ) | | | (3 | ) | | | 23 | |
| Interest Expense | | | 6,852 | | | | 709 | | | | 1,580 | | | | 1,726 | | | | 11 | | | | (10,636 | ) | | | 242 | | | | 6,852 | | | | 709 | | | | 1,580 | | | | 1,726 | | | | 11 | | | | (10,636 | ) | | | 242 | |
| Income Tax (Benefit) Expense | | | (4,768 | ) | | | (2,683 | ) | | | (1,462 | ) | | | (16,058 | ) | | | 1,462 | | | | 4,254 | | | | (19,255 | ) | | | (4,768 | ) | | | (2,683 | ) | | | (1,462 | ) | | | (16,058 | ) | | | 1,462 | | | | 4,254 | | | | (19,255 | ) |
| Net (Loss) Income from Operations | | | (21,893 | ) | | | (4,051 | ) | | | (2,188 | ) | | | (37,452 | ) | | | 2,378 | | | | 6,379 | | | | (56,827 | ) | | | (21,893 | ) | | | (4,051 | ) | | | (2,188 | ) | | | (37,452 | ) | | | 2,378 | | | | 6,379 | | | | (56,827 | ) |
| (Loss) Gain on Disposition Before Taxes | | | -- | | | | (946 | ) | | | -- | | | | -- | | | | 15,471 | | | | -- | | | | 14,525 | | | | -- | | | | (946 | ) | | | -- | | | | -- | | | | 15,471 | | | | -- | | | | 14,525 | |
| Income Tax Expense on Disposition | | | -- | | | | 2,854 | | | | -- | | | | -- | | | | 2,997 | | | | -- | | | | 5,851 | | | | -- | | | | 2,854 | | | | -- | | | | -- | | | | 2,997 | | | | -- | | | | 5,851 | |
| Net (Loss) Gain on Disposition | | | -- | | | | (3,800 | ) | | | -- | | | | -- | | | | 12,474 | | | | -- | | | | 8,674 | | | | -- | | | | (3,800 | ) | | | -- | | | | -- | | | | 12,474 | | | | -- | | | | 8,674 | |
| Net (Loss) Income | | $ | (21,893 | ) | | $ | (7,851 | ) | | $ | (2,188 | ) | | $ | (37,452 | ) | | $ | 14,852 | | | $ | 6,379 | | | $ | (48,153 | ) | | $ | (21,893 | ) | | $ | (7,851 | ) | | $ | (2,188 | ) | | $ | (37,452 | ) | | $ | 14,852 | | | $ | 6,379 | | | $ | (48,153 | ) |
| | | For the Year Ended December 31, 2010 | |
| (in thousands) | | DMI | | | Wylie | | | ShoreMaster | | | DMS | | | IPH | | | Intercompany
transactions
adjustment | | | Total | |
| Operating Revenues | | $ | 143,603 | | | $ | 54,143 | | | $ | 35,624 | | | $ | 100,301 | | | $ | 77,412 | | | $ | (5,830 | ) | | $ | 405,253 | |
| Operating Expenses | | | 159,646 | | | | 52,311 | | | | 41,351 | | | | 98,794 | | | | 65,261 | | | | (5,830 | ) | | | 411,533 | |
| Asset Impairment Charge | | | -- | | | | -- | | | | 19,740 | | | | -- | | | | -- | | | | -- | | | | 19,740 | |
| Operating Income (Loss) | | | (16,043 | ) | | | 1,832 | | | | (25,467 | ) | | | 1,507 | | | | 12,151 | | | | -- | | | | (26,020 | ) |
| Other (Deductions) Income | | | (734 | ) | | | 8 | | | | 21 | | | | 331 | | | | (326 | ) | | | -- | | | | (700 | ) |
| Interest Expense | | | 5,614 | | | | 522 | | | | 1,492 | | | | 1,289 | | | | 111 | | | | (8,844 | ) | | | 184 | |
| Income Tax (Benefit) Expense | | | (356 | ) | | | 511 | | | | (7,058 | ) | | | 369 | | | | 3,716 | | | | 3,538 | | | | 720 | |
| Net (Loss) Income | | $ | (22,035 | ) | | $ | 807 | | | $ | (19,880 | ) | | $ | 180 | | | $ | 7,998 | | | $ | 5,306 | | | $ | (27,624 | ) |
| | | December 31, 2013 | | | December 31, 2012 | |
| (in thousands) | | IMD | | | Shrco | | | Total | | | IMD | | | Shrco | | | Total | |
| Current Assets | | $ | -- | | | $ | 38 | | | $ | 38 | | | $ | 1,367 | | | $ | 17,120 | | | $ | 18,487 | |
| Investments | | | -- | | | | -- | | | | -- | | | | -- | | | | 85 | | | | 85 | |
| Net Plant | | | -- | | | | -- | | | | -- | | | | -- | | | | 520 | | | | 520 | |
| Assets of Discontinued Operations | | $ | -- | | | $ | 38 | | | $ | 38 | | | $ | 1,367 | | | $ | 17,725 | | | $ | 19,092 | |
| Current Liabilities | | $ | 2,196 | | | $ | 1,441 | | | $ | 3,637 | | | $ | 4,587 | | | $ | 6,569 | | | $ | 11,156 | |
| Liabilities of Discontinued Operations | | $ | 2,196 | | | $ | 1,441 | | | $ | 3,637 | | | $ | 4,587 | | | $ | 6,569 | | | $ | 11,156 | |
| | | December 31, 2012 | |
| (in thousands) | | DMI | | | Wylie | | | ShoreMaster | | | DMS | | | IPH | | | Total | |
| Current Assets | | $ | 1,367 | | | $ | -- | | | $ | 17,120 | | | $ | -- | | | $ | -- | | | $ | 18,487 | |
| Investments | | | -- | | | | -- | | | | 85 | | | | -- | | | | -- | | | | 85 | |
| Net Plant | | | -- | | | | -- | | | | 520 | | | | -- | | | | -- | | | | 520 | |
| Assets of Discontinued Operations | | $ | 1,367 | | | $ | -- | | | $ | 17,725 | | | $ | -- | | | $ | -- | | | $ | 19,092 | |
| Current Liabilities | | $ | 4,587 | | | $ | -- | | | $ | 6,569 | | | $ | -- | | | $ | -- | | | $ | 11,156 | |
| Liabilities of Discontinued Operations | | $ | 4,587 | | | $ | -- | | | $ | 6,569 | | | $ | -- | | | $ | -- | | | $ | 11,156 | |
| | | December 31, 2011 | |
| (in thousands) | | DMI | | | Wylie | | | ShoreMaster | | | DMS | | | IPH | | | Total | |
| Current Assets | | $ | 80,897 | | | $ | -- | | | $ | 24,311 | | | $ | 29,375 | | | $ | -- | | | $ | 134,583 | |
| Goodwill | | | 287 | | | | -- | | | | -- | | | | -- | | | | -- | | | | 287 | |
| Net Plant | | | 68,050 | | | | -- | | | | 6,637 | | | | 372 | | | | -- | | | | 75,059 | |
| Assets of Discontinued Operations | | $ | 149,234 | | | $ | -- | | | $ | 30,948 | | | $ | 29,747 | | | $ | -- | | | $ | 209,929 | |
| Current Liabilities | | $ | 24,012 | | | $ | -- | | | $ | 8,462 | | | $ | 14,341 | | | $ | -- | | | $ | 46,815 | |
| Other Noncurrent Liabilities | | | 900 | | | | -- | | | | -- | | | | -- | | | | -- | | | | 900 | |
| Deferred Income Taxes | | | 4,512 | | | | -- | | | | (791 | ) | | | (1,579 | ) | | | -- | | | | 2,142 | |
| Deferred Credits - Other | | | -- | | | | -- | | | | -- | | | | 119 | | | | -- | | | | 119 | |
| Long-Term Debt | | | -- | | | | -- | | | | -- | | | | 715 | | | | -- | | | | 715 | |
| Liabilities of Discontinued Operations | | $ | 29,424 | | | $ | -- | | | $ | 7,671 | | | $ | 13,596 | | | $ | -- | | | $ | 50,691 | |
| (in thousands) | | 2013 | | | 2012 | |
| Warranty Reserve Balance, Beginning of Year | | $ | 5,027 | | | $ | 3,170 | |
| Provision for Warranties Issued During the Year | | | 188 | | | | 3,240 | |
| Less Settlements Made During the Year | | | (715 | ) | | | (1,342 | ) |
| Decrease in Warranty Estimates for Prior Years | | | (1,413 | ) | | | (41 | ) |
| Warranty Reserve Balance, End of Year | | $ | 3,087 | | | $ | 5,027 | |
The warranty reserve balances as of December 31, 2013 and 2012 relate entirely to products produced by the Company’s former wind tower and waterfront equipment manufacturing companies. Expenses associated with remediation activities of these companies could be substantial. Although the assets of these companies have been sold and their operating results are reported under discontinued operations in the Company’s consolidated statements of income, the Company retains responsibility for warranty claims related to the products they produced prior to the sales of these companies. For wind towers, the potential exists for multiple claims based on one defect repeated throughout the production process or for claims where the cost to repair or replace the defective part is highly disproportionate to the original cost of the part. For example, if the Company is required to cover remediation expenses in addition to regular warranty coverage, the Company could be required to accrue additional expenses and experience additional unplanned cash expenditures which could adversely affect the Company’s consolidated results of operations and financial condition.
Quarterly Information (not audited)
Because of changes in the number of common shares outstanding and the impact of diluted shares, the sum of the quarterly earnings (loss) per common share may not equal total earnings (loss) per common share. Amounts shown below will differ from amounts disclosed in previously filed quarterly reports on Forms 10-Q as a result of the dispositions of DMI and ShoreMaster, which were classified as discontinued operations in the fourth quarter of 2012. See note 17 to consolidated financial statements for more details.
| Three Months Ended | | March 31 | | | June 30 | | | September 30 | | | December 31 | | | March 31 | | | June 30 | | | September 30 | | | December 31 | |
| (in thousands, except per share data) | | | 20122 | | | 2011 | | | 20123 | | | 2011 | | | 2012 | | | 2011 | | | 20124 | | | 20115 | | | 2013 | | | 20122 | | | 2013 | | | 20123 | | | 2013 | | | 2012 | | | 2013 | | | 20124 | |
Operating Revenues1 | | $ | 219,890 | | | $ | 194,281 | | | $ | 211,401 | | | $ | 216,677 | | | $ | 215,316 | | | $ | 221,946 | | | $ | 212,632 | | | $ | 207,265 | | | $ | 217,954 | | | $ | 219,890 | | | $ | 212,389 | | | $ | 211,401 | | | $ | 229,768 | | | $ | 215,316 | | | $ | 233,202 | | | $ | 212,632 | |
Operating Income (Loss)1 | | | 18,255 | | | | 20,626 | | | | 15,246 | | | | 19,068 | | | | 24,373 | | | | 19,562 | | | | 24,153 | | | | 12,641 | | | | 27,239 | | | | 18,255 | | | | 15,779 | | | | 15,246 | | | | 25,132 | | | | 24,373 | | | | 28,701 | | | | 24,153 | |
| Net Income (Loss): | | | | | | | | | | | | | | | | | | | | | | | | | | | | | | | | | | | | | | | | | | | | | | | | | | | | | | | | | | | | | | | | |
| Continuing Operations | | $ | 10,175 | | | $ | 10,019 | | | $ | 6,901 | | | $ | 9,808 | | | $ | 4,801 | | | $ | 9,091 | | | $ | 17,091 | | | $ | 5,992 | | | $ | 15,234 | | | $ | 10,175 | | | $ | 7,504 | | | $ | 6,901 | | | $ | 14,826 | | | $ | 4,801 | | | $ | 12,610 | | | $ | 17,091 | |
| Discontinued Operations | | | (2,932 | ) | | | (4,323 | ) | | | (24,257 | ) | | | 9,020 | | | | (2,928 | ) | | | (2,723 | ) | | | (14,124 | ) | | | (50,127 | ) | | | 129 | | | | (2,932 | ) | | | 197 | | | | (24,257 | ) | | | 312 | | | | (2,928 | ) | | | 53 | | | | (14,124 | ) |
| | | $ | 7,243 | | | $ | 5,696 | | | $ | (17,356 | )) | | $ | 18,828 | | | $ | 1,873 | | | $ | 6,368 | | | $ | 2,967 | | | $ | (44,135 | ) | | $ | 15,363 | | | $ | 7,243 | | | $ | 7,701 | | | $ | (17,356 | ) | | $ | 15,138 | | | $ | 1,873 | | | $ | 12,663 | | | $ | 2,967 | |
Earnings (Loss) Available for Common Shares: | | | | | | | | | | | | | | | | | | | | | | | | | | | | | | | | | | | | | | | | | | | | | | | | | | | | | | | | | | | | | | | | |
| Continuing Operations | | $ | 9,991 | | | $ | 9,835 | | | $ | 6,717 | | | $ | 9,624 | | | $ | 4,618 | | | $ | 8,907 | | | $ | 16,906 | | | $ | 5,808 | | | $ | 14,721 | | | $ | 9,991 | | | $ | 7,504 | | | $ | 6,717 | | | $ | 14,826 | | | $ | 4,618 | | | $ | 12,610 | | | $ | 16,906 | |
| Discontinued Operations | | | (2,932 | ) | | | (4,323 | ) | | | (24,257 | ) | | | 8,698 | | | | (2,928 | ) | | | (2,723 | ) | | | (14,124 | ) | | | (50,127 | ) | | | 129 | | | | (2,932 | ) | | | 197 | | | | (24,257 | ) | | | 312 | | | | (2,928 | ) | | | 53 | | | | (14,124 | ) |
| | | $ | 7,059 | | | $ | 5,512 | | | $ | (17,540 | ) | | $ | 18,322 | | | $ | 1,690 | | | $ | 6,184 | | | $ | 2,782 | | | $ | (44,319 | ) | | $ | 14,850 | | | $ | 7,059 | | | $ | 7,701 | | | $ | (17,540 | ) | | $ | 15,138 | | | $ | 1,690 | | | $ | 12,663 | | | $ | 2,782 | |
| Basic Earnings (Loss) Per Share: | | | | | | | | | | | | | | | | | | | | | | | | | | | | | | | | | | | | | | | | | | | | | | | | | | | | | | | | | | | | | | | | |
| Continuing Operations | | $ | .28 | | | $ | .27 | | | $ | .19 | | | $ | .27 | | | $ | .13 | | | $ | .25 | | | $ | .47 | | | $ | .16 | | | $ | .41 | | | $ | .28 | | | $ | .21 | | | $ | .19 | | | $ | .41 | | | $ | .13 | | | $ | .35 | | | $ | .47 | |
| Discontinued Operations | | | (.08 | ) | | | (.12 | ) | | | (.68 | ) | | | .24 | | | | (.08 | ) | | | (.08 | ) | | | (.39 | ) | | | (1.39 | ) | | | -- | | | | (.08 | ) | | | -- | | | | (.68 | ) | | | .01 | | | | (.08 | ) | | | -- | | | | (.39 | ) |
| | | $ | .20 | | | $ | .15 | | | $ | (.49 | ) | | $ | .51 | | | $ | .05 | | | $ | .17 | | | $ | .08 | | | $ | (1.23 | ) | | $ | .41 | | | $ | .20 | | | $ | .21 | | | $ | (.49 | ) | | $ | .42 | | | $ | .05 | | | $ | .35 | | | $ | .08 | |
| Diluted Earnings (Loss) Per Share | | | | | | | | | | | | | | | | | | | | | | | | | | | | | | | | | | | | | | | | | | | | | | | | | | | | | | | | | | | | | | | | |
| Continuing Operations | | $ | .28 | | | $ | .27 | | | $ | .19 | | | $ | .27 | | | $ | .13 | | | $ | .25 | | | $ | .47 | | | $ | .16 | | | $ | .41 | | | $ | .28 | | | $ | .21 | | | $ | .19 | | | $ | .41 | | | $ | .13 | | | $ | .35 | | | $ | .47 | |
| Discontinued Operations | | | (.08 | ) | | | (.12 | ) | | | (.67 | ) | | | .24 | | | | (.08 | ) | | | (.08 | ) | | | (.39 | ) | | | (1.39 | ) | | | -- | | | | (.08 | ) | | | -- | | | | (.67 | ) | | | .01 | | | | (.08 | ) | | | -- | | | | (.39 | ) |
| | | $ | .20 | | | $ | .15 | | | $ | (.48 | ) | | $ | .51 | | | $ | .05 | | | $ | .17 | | | $ | .08 | | | $ | (1.23 | ) | | $ | .41 | | | $ | .20 | | | $ | .21 | | | $ | (.48 | ) | | $ | .42 | | | $ | .05 | | | $ | .35 | | | $ | .08 | |
| | | | | | | | | | | | | | | | | | | | | | | | | | | | | | | | | | | | | | | | | | | | | | | | | | | | | | | | | | | | | | | | | |
| Dividends Declared Per Common Share | | $ | .2975 | | | $ | .2975 | | | $ | .2975 | | | $ | .2975 | | | $ | .2975 | | | $ | .2975 | | | $ | .2975 | | | $ | .2975 | | | $ | .2975 | | | $ | .2975 | | | $ | .2975 | | | $ | .2975 | | | $ | .2975 | | | $ | .2975 | | | $ | .2975 | | | $ | .2975 | |
| Price Range: | | | | | | | | | | | | | | | | | | | | | | | | | | | | | | | | | | | | | | | | | | | | | | | | | | | | | | | | | | | | | | | | |
| High | | | 22.57 | | | | 23.43 | | | | 23.00 | | | | 23.48 | | | | 24.35 | | | | 22.07 | | | | 25.25 | | | | 22.28 | | | | 31.34 | | | | 22.57 | | | | 31.70 | | | | 23.00 | | | | 31.88 | | | | 24.35 | | | | 30.95 | | | | 25.25 | |
| Low | | | 20.70 | | | | 21.01 | | | | 20.86 | | | | 20.54 | | | | 22.50 | | | | 18.28 | | | | 22.86 | | | | 17.53 | | | | 25.17 | | | | 20.70 | | | | 26.50 | | | | 20.86 | | | | 25.84 | | | | 22.50 | | | | 26.80 | | | | 22.86 | |
| Average Number of Common Shares Outstanding--Basic | | | 35,995 | | | | 35,877 | | | | 36,031 | | | | 35,926 | | | | 36,061 | | | | 35,933 | | | | 36,062 | | | | 35,953 | | | | 36,075 | | | | 35,995 | | | | 36,170 | | | | 36,031 | | | | 36,180 | | | | 36,061 | | | | 36,180 | | | | 36,062 | |
| Average Number of Common Shares Outstanding--Diluted | | | 36,129 | | | | 36,081 | | | | 36,223 | | | | 36,164 | | | | 36,253 | | | | 36,172 | | | | 36,256 | | | | 36,113 | | | | 36,259 | | | | 36,129 | | | | 36,374 | | | | 36,223 | | | | 36,382 | | | | 36,253 | | | | 36,384 | | | | 36,256 | |
| | 1 | 1From continuing operations. |
| | 2 | 2Results include pre-tax asset impairment charge of $0.4 million at OTESCO in continuing operationsoperations. |
| | 3 | 3Results include pre-tax asset impairment charge of $45.6 million at DMIIMD in discontinued operations. |
| | 4 | 4Results include pre-tax asset impairment charges of $7.7 million at ShoreMasterShrco in discontinued operations. |
| 5 | Results include pre-tax asset impairment charges of $0.5 million at OTESCO in continuing operations and $56.4 million at DMS, $3.1 million at DMI and $0.5 million at Aviva in discontinued operations. |
| CHANGES IN AND DISAGREEMENTS WITH ACCOUNTANTS ON ACCOUNTING AND FINANCIAL DISCLOSURE |
None.None.
Evaluation of Disclosures Controls and Procedures. Under the supervision and with the participation of the Company’s management, including the Chief Executive Officer and the Chief Financial Officer, the Company evaluated the effectiveness of the design and operation of its disclosure controls and procedures (as defined in Rule 13a-15(e) under the Securities Exchange Act of 1934 (the Exchange Act)) as of December 31, 2012,2013, the end of the period covered by this report. Based on that evaluation, the Chief Executive Officer and Chief Financial Officer concluded that the Company’s disclosure controls and procedures were effective as of December 31, 2012.2013.
Changes in Internal Control over Financial Reporting. There were no changes in the Company’s internal control over financial reporting (as defined in Rules 13a-15(f) under the Exchange Act) during the fourth quarter ended December 31, 20122013 that have materially affected, or are reasonably likely to materially affect, the Company’s internal control over financial reporting.
Management’s Report Regarding Internal Control Over Financial Reporting. Management is responsible for the preparation and integrity of the consolidated financial statements and representations in this Annual Report on Form 10-K. The consolidated financial statements of the Company have been prepared in conformity with generally accepted accounting principles applied on a consistent basis and include some amounts that are based on informed judgments and best estimates and assumptions of management.
In order to assure the consolidated financial statements are prepared in conformance with generally accepted accounting principles, management is responsible for establishing and maintaining adequate internal control over financial reporting, as such term is defined in Exchange Act Rule 13a-15(f). These internal controls are designed only to provide reasonable assurance, on a cost-effective basis, that transactions are carried out in accordance with management’s authorizations and assets are safeguarded against loss from unauthorized use or disposition.
Management has completed its assessment of the effectiveness of the Company’s internal control over financial reporting as of December 31, 2012.2013. In making this assessment, management used the criteria set forth by the Committee of Sponsoring Organizations of the Treadway Commission in Internal Control - Integrated Framework (1992) to conduct the required assessment of the effectiveness of the Company’s internal control over financial reporting. Based on this assessment, management concluded that, as of December 31, 2012,2013, the Company’s internal control over financial reporting was effective based on those criteria. The Company’s independent registered public accounting firm, Deloitte & Touche LLP, has audited the Company’s consolidated financial statements included in this Annual Report on Form 10-K and issued an attestation report on the Company’s internal control over financial reporting.
Attestation Report of Independent Registered Public Accounting Firm. The attestation report of Deloitte & Touche LLP, the Company’s independent registered public accounting firm, regarding the Company’s internal control over financial reporting is provided on Page 63.page 67.
None.
| DIRECTORS, EXECUTIVE OFFICERS AND CORPORATE GOVERNANCE |
The information required by this Item regarding Directors is incorporated by reference to the information under “Election of Directors” in the Company’s definitive Proxy Statement for the 20132014 Annual Meeting. The information regarding executive officers and family relationships is set forth in Item 3A hereto. The information regarding Section 16 reporting is incorporated by reference to the information under “Security Ownership of Directors and Officers - Section 16(a) Beneficial Ownership Reporting Compliance” in the Company’s definitive Proxy Statement for the 20132014 Annual Meeting. The information required by this Item regarding the Company’s procedures for recommending nominees to the Board of Directors is incorporated by reference to the information under “Meetings and Committees of the Board of Directors – Corporate Governance Committee” in the Company’s definitive Proxy Statement for the 20132014 Annual Meeting. The information required by this Item in regardsregard to the Audit Committee and the Company’s Audit Committee financial experts is incorporated by reference to the information under “Meetings and Committees of the Board of Directors – Audit Committee” in the Company’s definitive Proxy Statement for the 2013 Annual Meeting. The information regarding the Company’s Audit Committee financial experts is incorporated by reference to the information under “Meetings and Committees of the Board – Audit Committee” in the Company’s definitive Proxy Statement for the 20132014 Annual Meeting.
The Company has adopted a code of conduct that applies to all of its directors, officers (including its principal executive officer, principal financial officer, and its principal accounting officer or controller or person performing similar functions) and employees. The Company’s code of conduct is available on its website at www.ottertail.com. The Company intends to satisfy the disclosure requirements under Item 5.05 of Form 8-K regarding an amendment to, or waiver from, a provision of its code of conduct by posting such information on its website at the address specified above. Information on the Company’s website is not deemed to be incorporated by reference into this Annual Report on Form 10-K.
The information required by this Item is incorporated by reference to the information under “Compensation Discussion and Analysis,” “Report of Compensation Committee,” “Executive Compensation” and “Director Compensation” in the Company’s definitive Proxy Statement for the 20132014 Annual Meeting.
The information required by this Item regarding security ownership is incorporated by reference to the information under “Outstanding Voting Shares” and “Security Ownership of Directors and Officers” and “Proposal to Adopt the 2014 Stock Incentive Plan—Equity Compensation Plan Information” in the Company’s definitive Proxy Statement for the 20132014 Annual Meeting.
EQUITY COMPENSATION PLAN INFORMATION
The following table sets forth information as of December 31, 2012 about the Company’s common stock that may be issued under all of its equity compensation plans:
| | | Number of securities
to be issued upon
exercise of
outstanding options,
warrants and rights | | | Weighted-average
exercise price of
outstanding
options, warrants
and rights | | | Number of securities remaining
available for future issuance under
equity compensation plans
(excluding securities reflected in
column (a)) | |
| Plan Category | | (a) | | | (b) | | | (c) | |
| | | | | | | | | | |
| Equity compensation plans approved by security holders: | | | | | | | | | |
| 1999 Stock Incentive Plan | | | 391,785 | (1) | | $ | 6.28 | | | | 957,359 | (2) |
| 1999 Employee Stock Purchase Plan | | | -- | | | | N/A | | | | 522,227 | (3) |
| | | | | | | | | | | | | |
| Equity compensation plans not approved by security holders | | | -- | | | | -- | | | | -- | |
| Total | | | 391,785 | | | $ | 6.28 | | | | 1,479,586 | |
(1) | Includes 161,600 and 38,400 performance based share awards made in 2012 and 2011, respectively, 60,665 restricted stock units outstanding as of December 31, 2012, and 38,623 phantom shares as part of the deferred director compensation program, 92,497 outstanding options as of December 31, 2012 and excludes 104,545 shares of restricted stock issued under the 1999 Stock Incentive Plan. |
(2) | The 1999 Stock Incentive Plan provides for the issuance of any shares available under the plan in the form of restricted stock, performance awards and other types of stock-based awards, in addition to the granting of options, warrants or stock appreciation rights. |
| Item 13. | Shares are issued based on employee’s election to participate in the plan.
|
| CERTAIN RELATIONSHIPS AND RELATED TRANSACTIONS, AND DIRECTOR INDEPENDENCE |
The information required by this Item is incorporated by reference to the information under “Policy and Procedures Regarding Transactions with Related Persons,” “Election of Directors” and “Meetings and Committees of the Board of Directors” in the Company’s definitive Proxy Statement for the 20132014 Annual Meeting.
| PRINCIPAL ACCOUNTANT FEES AND SERVICES |
The information required by this Item is incorporated by reference to the information under “Ratification of Independent Registered Public Accounting Firm - Fees” and “Ratification of Independent Registered Public Accounting Firm – Pre-Approval of Audit/Non-Audit Services Policy” in the Company’s definitive Proxy Statement for the 20132014 Annual Meeting.
| | (a) | List of documents filed as part of this report: |
| | | Page |
| | 63 | 67 |
| | 64 | 68 |
| | 66 | 70 |
| | 67 | 71 |
| | 68 | 72 |
| | 69 | 73 |
| | 70 | 74 |
| | 71 | 75 |
| | 2. | Financial Statement Schedules |
SCHEDULE 1 - CONDENSED FINANCIAL INFORMATION OF REGISTRANT | |
| OTTER TAIL CORPORATION (PARENT COMPANY) | |
| Condensed Balance Sheets, December 31 | |
| (in thousands) | | 2012 | | | 2011 | |
| | | | | | | |
| ASSETS | | | | | | |
| | | | | | | |
| Current Assets | | | | | | |
| Cash and Cash Equivalents | | $ | 44,802 | | | $ | 7,062 | |
| Accounts Receivable from Subsidiaries | | | 3,587 | | | | 5,795 | |
| Interest Receivable from Subsidiaries | | | 317 | | | | 361 | |
| Notes Receivable from Subsidiaries | | | 17,157 | | | | 145,205 | |
| Other | | | 16,384 | | | | 9,580 | |
| Total Current Assets | | | 82,247 | | | | 168,003 | |
| | | | | | | | | |
| Investments in Subsidiaries | | | 716,453 | | | | 613,380 | |
| Notes Receivable from Subsidiaries | | | 67,925 | | | | 128,818 | |
| Deferred Income Taxes | | | 18,042 | | | | 16,515 | |
| Other Assets | | | 24,584 | | | | 26,371 | |
| | | | | | | | | |
| Total Assets | | $ | 909,251 | | | $ | 953,087 | |
| | | | | | | | | |
| LIABILITIES AND EQUITY | | | | | | | | |
| | | | | | | | | |
| Current Liabilities | | | | | | | | |
| Accounts Payable to Subsidiaries | | $ | 5,035 | | | $ | 3,725 | |
| Notes Payable to Subsidiaries | | | 231,611 | | | | 181,100 | |
| Other | | | 6,223 | | | | 5,432 | |
| Total Current Liabilities | | | 242,869 | | | | 190,257 | |
| | | | | | | | | |
| Other Noncurrent Liabilities | | | 27,363 | | | | 24,162 | |
| | | | | | | | | |
| Commitments and Contingencies | | | | | | | | |
| | | | | | | | | |
| Capitalization | | | | | | | | |
| Long-Term Debt, Net of Current Maturities | | | 101,545 | | | | 151,720 | |
| Cumulative Preferred Shares | | | 15,500 | | | | 15,500 | |
| Common Shareholder Equity | | | 521,974 | | | | 571,448 | |
| | | | | | | | | |
| Total Capitalization | | | 639,019 | | | | 738,668 | |
| | | | | | | | | |
| Total Liabilities and Equity | | $ | 909,251 | | | $ | 953,087 | |
| See accompanying notes to condensed financial statements. | | | | | | | | |
| SCHEDULE 1 - CONDENSED FINANCIAL INFORMATION OF REGISTRANT |
| OTTER TAIL CORPORATION (PARENT COMPANY) |
| Condensed Balance Sheets, December 31 |
| (in thousands) | | 2013 | | | 2012 | |
| | | | | | | |
| ASSETS | | | | | | |
| | | | | | | |
| Current Assets | | | | | | |
| Cash and Cash Equivalents | | $ | 7,907 | | | $ | 44,802 | |
| Accounts Receivable from Subsidiaries | | | 1,736 | | | | 3,587 | |
| Interest Receivable from Subsidiaries | | | 192 | | | | 317 | |
| Notes Receivable from Subsidiaries | | | 5,703 | | | | 17,157 | |
| Deferred Income Taxes | | | 28,853 | | | | 14,790 | |
| Other | | | 947 | | | | 1,594 | |
| Total Current Assets | | | 45,338 | | | | 82,247 | |
| | | | | | | | | |
| Investments in Subsidiaries | | | 541,291 | | | | 716,453 | |
| Notes Receivable from Subsidiaries | | | 52,249 | | | | 67,925 | |
| Deferred Income Taxes | | | 25,861 | | | | 18,042 | |
| Other Assets | | | 25,456 | | | | 24,584 | |
| | | | | | | | | |
| Total Assets | | $ | 690,195 | | | $ | 909,251 | |
| | | | | | | | | |
| LIABILITIES AND EQUITY | | | | | | | | |
| | | | | | | | | |
| Current Liabilities | | | | | | | | |
| Accounts Payable to Subsidiaries | | $ | 5,961 | | | $ | 5,035 | |
| Notes Payable to Subsidiaries | | | 62,562 | | | | 231,611 | |
| Other | | | 5,122 | | | | 6,223 | |
| Total Current Liabilities | | | 73,645 | | | | 242,869 | |
| | | | | | | | | |
| Other Noncurrent Liabilities | | | 28,031 | | | | 27,363 | |
| | | | | | | | | |
| Commitments and Contingencies | | | | | | | | |
| | | | | | | | | |
| Capitalization | | | | | | | | |
| Long-Term Debt, Net of Current Maturities | | | 53,689 | | | | 101,545 | |
| Cumulative Preferred Shares | | | -- | | | | 15,500 | |
| Common Shareholder Equity | | | 534,830 | | | | 521,974 | |
| | | | | | | | | |
| Total Capitalization | | | 588,519 | | | | 639,019 | |
| | | | | | | | | |
| Total Liabilities and Equity | | $ | 690,195 | | | $ | 909,251 | |
| See accompanying notes to condensed financial statements. | | | | | | | | |
| OTTER TAIL CORPORATION (PARENT COMPANY) | OTTER TAIL CORPORATION (PARENT COMPANY) | | OTTER TAIL CORPORATION (PARENT COMPANY) | |
| Condensed Statements of Income--For the Years Ended December 31 | Condensed Statements of Income--For the Years Ended December 31 | | Condensed Statements of Income--For the Years Ended December 31 | |
| (in thousands) | | 2012 | | | 2011 | | | 2010 | | | 2013 | | | 2012 | | | 2011 | |
| | | | | | | | | | | | | | | | | | | |
| Operating Income (Loss) | | | | | | | | | | |
| Operating Loss | | | | | | | | | | |
| Revenue | | $ | -- | | | $ | -- | | | $ | -- | | | $ | -- | | | $ | -- | | | $ | -- | |
| Operating Expenses | | | 15,197 | | | | 15,798 | | | | 17,409 | | | | 14,150 | | | | 15,197 | | | | 15,798 | |
| Operating Loss | | | (15,197 | ) | | | (15,798 | ) | | | (17,409 | ) | | | (14,150 | ) | | | (15,197 | ) | | | (15,798 | ) |
| | | | | | | | | | | | | | | | | | | | | | | | | |
| Other Income (Expense) | | | | | | | | | | | | | | | | | | | | | | | | |
| Equity Income (Loss) in Earnings of Subsidiaries | | | 8,430 | | | | (4,205 | ) | | | 8,998 | | | | 66,468 | | | | 8,430 | | | | (4,205 | ) |
| Loss on Early Retirement of Debt | | | (13,106 | ) | | | -- | | | | -- | | | | (10,252 | ) | | | (13,106 | ) | | | -- | |
| Interest Charges | | | (13,994 | ) | | | (17,157 | ) | | | (17,084 | ) | | | (9,940 | ) | | | (13,994 | ) | | | (17,157 | ) |
| Interest Charges to Subsidiaries | | | (512 | ) | | | (290 | ) | | | (16 | ) | | | (494 | ) | | | (512 | ) | | | (290 | ) |
| Interest Income from Subsidiaries | | | 15,700 | | | | 18,006 | | | | 15,887 | | | | 5,318 | | | | 15,700 | | | | 18,006 | |
| Other Income | | | 1,426 | | | | 548 | | | | 682 | | | | 1,413 | | | | 1,426 | | | | 548 | |
| Total Other Income (Expense) | | | (2,056 | ) | | | (3,098 | ) | | | 8,467 | | | | 52,513 | | | | (2,056 | ) | | | (3,098 | ) |
| | | | | | | | | | | | | | | | | | | | | | | | | |
| Income Before Income Taxes – Continuing Operations | | | (17,253 | ) | | | (18,896 | ) | | | (8,942 | ) | | | 38,363 | | | | (17,253 | ) | | | (18,896 | ) |
| Income Tax Benefit | | | (11,980 | ) | | | (5,653 | ) | | | (7,598 | ) | | | (12,502 | ) | | | (11,980 | ) | | | (5,653 | ) |
| Net Loss from Continuing Operations | | | (5,273 | ) | | | (13,243 | ) | | | (1,344 | ) | |
| Net Loss from Discontinued Operations | | | -- | | | | -- | | | | -- | | |
| Total Net Loss | | | (5,273 | ) | | | (13,243 | ) | | | (1,344 | ) | |
| Net Income (Loss) from Continuing Operations | | | | 50,865 | | | | (5,273 | ) | | | (13,243 | ) |
| Net Income (Loss) from Discontinued Operations | | | | -- | | | | -- | | | | -- | |
| Total Net Income (Loss) | | | | 50,865 | | | | (5,273 | ) | | | (13,243 | ) |
| Preferred Dividend Requirement and Other Adjustments | | | 736 | | | | 1,058 | | | | 833 | | | | 513 | | | | 736 | | | | 1,058 | |
| Loss Available for Common Shares | | $ | (6,009 | ) | | $ | (14,301 | ) | | $ | (2,177 | ) | |
| Income (Loss) Available for Common Shares | | | $ | 50,352 | | | $ | (6,009 | ) | | $ | (14,301 | ) |
| See accompanying notes to condensed financial statements. | | | | | | | | | | | | | | | | | | | | | | | | |
| OTTER TAIL CORPORATION (PARENT COMPANY) | |
| Condensed Statements of Cash Flows--For the Years Ended December 31 | |
| (in thousands) | | 2012 | | | 2011 | | | 2010 | |
| Cash Flows from Operating Activities | | | | | | | | | |
| Net Cash Provided by Operating Activities | | $ | 43,904 | | | $ | 30,833 | | | $ | 34,220 | |
| | | | | | | | | | | | | |
| Cash Flows from Investing Activities | | | | | | | | | | | | |
| Investment in Subsidiaries | | | (137,726 | ) | | | (24,534 | ) | | | (5,000 | ) |
| Debt Repaid by (Issued to) Subsidiaries | | | 239,452 | | | | 98,521 | | | | (38,890 | ) |
| Cash Used in Investing Activities | | | (69 | ) | | | (99 | ) | | | (686 | ) |
| Net Cash Provided by (Used in) Investing Activities | | | 101,657 | | | | 73,888 | | | | (44,576 | ) |
| | | | | | | | | | | | | |
| Cash Flows from Financing Activities | | | | | | | | | | | | |
| Change in Checks Written in Excess of Cash | | | - | | | | (253 | ) | | | 253 | |
| Net Short-Term (Repayments) Borrowings | | | - | | | | (54,176 | ) | | | 48,176 | |
| Proceeds from Issuance of Common Stock | | | - | | | | - | | | | 549 | |
| Common Stock Issuance Expenses | | | (370 | ) | | | - | | | | (141 | ) |
| Payments for Retirement of Common Stock | | | (111 | ) | | | (1,182 | ) | | | (401 | ) |
| Proceeds from Issuance of Long-Term Debt | | | - | | | | 2,006 | | | | - | |
| Short-Term and Long-Term Debt Issuance Expenses | | | (700 | ) | | | (14 | ) | | | (1,674 | ) |
| Payments for Retirement of Long-Term Debt | | | (50,164 | ) | | | (117 | ) | | | - | |
| Premium Paid for Early Retirement of Long-Term Debt | | | (12,500 | ) | | | - | | | | - | |
Dividends Paid and Other Distributions | | | (43,976 | ) | | | (43,923 | ) | | | (43,698 | ) |
| Net Cash Used in Financing Activities | | | (107,821 | ) | | | (97,659 | ) | | | 3,064 | |
| Net Change in Cash and Cash Equivalents | | | 37,740 | | | | 7,062 | | | | (7,292 | ) |
| Cash and Cash Equivalents at Beginning of Period | | | 7,062 | | | | - | | | | 7,292 | |
| Cash and Cash Equivalents at End of Period | | $ | 44,802 | | | $ | 7,062 | | | $ | - | |
| See accompanying notes to condensed financial statements. | | | | | | | | | | | | |
| OTTER TAIL CORPORATION (PARENT COMPANY) | |
| Condensed Statements of Cash Flows--For the Years Ended December 31 | |
| (in thousands) | | 2013 | | | 2012 | | | 2011 | |
| Cash Flows from Operating Activities | | | | | | | | | |
| Net Cash Provided by Operating Activities | | $ | 70,376 | | | $ | 43,904 | | | $ | 30,833 | |
| | | | | | | | | | | | | |
| Cash Flows from Investing Activities | | | | | | | | | | | | |
| Return of Capital (Investment in Subsidiaries) | | | 150,381 | | | | (137,726 | ) | | | (24,534 | ) |
| Debt (Issued to) Repaid by Subsidiaries | | | (141,919 | ) | | | 239,452 | | | | 98,521 | |
| Cash Used in Investing Activities | | | (37 | ) | | | (69 | ) | | | (99 | ) |
| Net Cash Provided by Investing Activities | | | 8,425 | | | | 101,657 | | | | 73,888 | |
| | | | | | | | | | | | | |
| Cash Flows from Financing Activities | | | | | | | | | | | | |
| Change in Checks Written in Excess of Cash | | | - | | | | - | | | | (253 | ) |
| Net Short-Term (Repayments) Borrowings | | | - | | | | - | | | | (54,176 | ) |
| Proceeds from Issuance of Common Stock | | | 1,821 | | | | - | | | | - | |
| Common Stock Issuance Expenses | | | (3 | ) | | | (370 | ) | | | - | |
| Payments for Retirement of Capital Stock | | | (15,723 | ) | | | (111 | ) | | | (1,182 | ) |
| Proceeds from Issuance of Long-Term Debt | | | - | | | | - | | | | 2,006 | |
| Short-Term and Long-Term Debt Issuance Expenses | | | (238 | ) | | | (700 | ) | | | (14 | ) |
| Payments for Retirement of Long-Term Debt | | | (47,846 | ) | | | (50,164 | ) | | | (117 | ) |
| Premium Paid for Early Retirement of Long-Term Debt | | | (9,889 | ) | | | (12,500 | ) | | | - | |
Dividends Paid and Other Distributions | | | (43,818 | ) | | | (43,976 | ) | | | (43,923 | ) |
| Net Cash Used in Financing Activities | | | (115,696 | ) | | | (107,821 | ) | | | (97,659 | ) |
| Net Change in Cash and Cash Equivalents | | | (36,895 | ) | | | 37,740 | | | | 7,062 | |
| Cash and Cash Equivalents at Beginning of Period | | | 44,802 | | | | 7,062 | | | | - | |
| Cash and Cash Equivalents at End of Period | | $ | 7,907 | | | $ | 44,802 | | | $ | 7,062 | |
See accompanying notes to condensed financial statements. | | | | | | | | | | | | |
Otter Tail Corporation (Parent Company)
Notes to Condensed Financial Statements
For the years ended December 31, 2013, 2012 2011 and 20102011
Incorporated by reference are Otter Tail Corporation’s consolidated statements of comprehensive income and common shareholders’ equity in Part II, Item 8.
Basis of Presentation
The condensed financial information of Otter Tail Corporation is presented to comply with Rule 12-04 of Regulation S-X. The unconsolidated condensed financial statements do not reflect all of the information and notes normally included with financial statements prepared in accordance with GAAP. Therefore, these condensed financial statements should be read with the consolidated financial statements and related notes included in this Annual Report on Form 10-K.
Otter Tail Corporation’s investments in subsidiaries are presented under the equity method of accounting. Under this method, the assets and liabilities of subsidiaries are not consolidated. The investments in net assets of the subsidiaries are recorded in the balance sheets. The income (loss) from operations of the subsidiaries is reported on a net basis as equity income (loss) in earnings of subsidiaries.
Related Party Transactions
As of December 31, 2013:
| (in thousands) | | Accounts
Receivable | | | Interest
Receivable | | | Current
Notes
Receivable | | | Long-Term
Notes
Receivable | | | Accounts
Payable | | | Current
Notes
Payable | |
| Otter Tail Power Company | | $ | 1,346 | | | $ | -- | | | $ | -- | | | $ | -- | | | $ | 11 | | | $ | -- | |
| Vinyltech Corporation | | | -- | | | | 32 | | | | -- | | | | 8,500 | | | | -- | | | | 17,285 | |
| Northern Pipe Products, Inc. | | | -- | | | | 9 | | | | -- | | | | 3,549 | | | | -- | | | | 11,948 | |
| BTD Manufacturing, Inc. | | | 7 | | | | 107 | | | | -- | | | | 28,500 | | | | -- | | | | 3,985 | |
| IMD, Inc. | | | -- | | | | -- | | | | 1,266 | | | | -- | | | | -- | | | | -- | |
| Shrco, Inc. | | | 2 | | | | -- | | | | 3,889 | | | | -- | | | | -- | | | | -- | |
| T.O. Plastics, Inc. | | | -- | | | | 28 | | | | -- | | | | 7,400 | | | | 1 | | | | 4,705 | |
| Aevenia, Inc. | | | -- | | | | 7 | | | | 548 | | | | 1,800 | | | | 1 | | | | -- | |
| Foley Company | | | 44 | | | | 9 | | | | -- | | | | 2,500 | | | | -- | | | | 5,343 | |
| Varistar Corporation | | | -- | | | | -- | | | | -- | | | | -- | | | | 5,948 | | | | 19,296 | |
| Otter Tail Assurance Limited | | | 337 | | | | -- | | | | -- | | | | -- | | | | -- | | | | -- | |
| | | $ | 1,736 | | | $ | 192 | | | $ | 5,703 | | | $ | 52,249 | | | $ | 5,961 | | | $ | 62,562 | |
As of December 31, 2012:
| (in thousands) | | Accounts
Receivable | | | Interest
Receivable | | | Current
Notes
Receivable | | | Long- Term
Notes
Receivable | | | Accounts
Payable | | | Current
Notes
Payable | |
| Otter Tail Power Company | | $ | 1,201 | | | $ | -- | | | $ | -- | | | $ | 15,500 | | | $ | 160 | | | $ | -- | |
| Vinyltech Corporation | | | 2 | | | | 32 | | | | -- | | | | 8,500 | | | | -- | | | | 8,251 | |
| Northern Pipe Products, Inc. | | | -- | | | | 9 | | | | -- | | | | 3,725 | | | | -- | | | | 10,537 | |
| BTD Manufacturing, Inc. | | | 41 | | | | 107 | | | | -- | | | | 28,500 | | | | -- | | | | 1,773 | |
| DMI Industries, Inc. | | | 20 | | | | 113 | | | | 1,461 | | | | -- | | | | -- | | | | -- | |
| ShoreMaster, Inc. | | | 40 | | | | 12 | | | | 15,696 | | | | -- | | | | -- | | | | -- | |
| T.O. Plastic, Inc. | | | -- | | | | 28 | | | | -- | | | | 7,400 | | | | -- | | | | 2,986 | |
| Aevenia, Inc | | | 50 | | | | 7 | | | | -- | | | | 1,800 | | | | -- | | | | 1,480 | |
| Foley Company | | | 40 | | | | 9 | | | | -- | | | | 2,500 | | | | -- | | | | 1,189 | |
| Varistar Corporation | | | 2,050 | | | | -- | | | | -- | | | | -- | | | | 4,875 | | | | 205,329 | |
| Otter Tail Energy Services Company | | | -- | | | | -- | | | | -- | | | | -- | | | | -- | | | | 66 | |
| Otter Tail Assurance Limited | | | 143 | | | | -- | | | | -- | | | | -- | | | | -- | | | | -- | |
| | | $ | 3,587 | | | $ | 317 | | | $ | 17,157 | | | $ | 67,925 | | | $ | 5,035 | | | $ | 231,611 | |
As of December 31, 2011
| (in thousands) | | Accounts
Receivable | | | Interest
Receivable | | | Current
Notes
Receivable | | | Long-term
Notes
Receivable | | | Accounts
Payable | | | Current
Notes
Payable | |
| Otter Tail Power Company | | $ | 924 | | | $ | -- | | | $ | -- | | | $ | 15,500 | | | $ | 236 | | | $ | -- | |
| Vinyltech Corporation | | | 2 | | | | 39 | | | | -- | | | | 10,500 | | | | -- | | | | 3,596 | |
| Northern Pipe Products, Inc. | | | 2 | | | | 17 | | | | -- | | | | 5,889 | | | | -- | | | | 5,085 | |
| BTD Manufacturing, Inc. | | | 24 | | | | 107 | | | | 7,023 | | | | 28,500 | | | | -- | | | | -- | |
| DMI Industries, Inc. | | | 129 | | | | 113 | | | | 89,449 | | | | 30,956 | | | | -- | | | | -- | |
| ShoreMaster, Inc. | | | 68 | | | | 12 | | | | 30,382 | | | | 3,654 | | | | -- | | | | -- | |
| DMS Health Group | | | 20 | | | | 29 | | | | 3,329 | | | | 22,118 | | | | | | | | -- | |
| T.O. Plastic, Inc. | | | -- | | | | 28 | | | | 1,978 | | | | 7,400 | | | | -- | | | | -- | |
| Aevenia, Inc | | | -- | | | | 7 | | | | 2,319 | | | | 1,800 | | | | -- | | | | -- | |
| Foley Company | | | 12 | | | | 9 | | | | 9,452 | | | | 2,500 | | | | -- | | | | -- | |
| Varistar Corporation | | | 3,893 | | | | -- | | | | -- | | | | -- | | | | 3,489 | | | | 172,419 | |
| Otter Tail Energy Services Company | | | -- | | | | -- | | | | 1,273 | | | | -- | | | | -- | | | | -- | |
| Otter Tail Assurance Limited | | | 721 | | | | -- | | | | -- | | | | -- | | | | -- | | | | -- | |
| | | $ | 5,795 | | | $ | 361 | | | $ | 145,205 | | | $ | 128,817 | | | $ | 3,725 | | | $ | 181,100 | |
| (in thousands) | | Accounts
Receivable | | | Interest
Receivable | | | Current
Notes
Receivable | | | Long-Term
Notes
Receivable | | | Accounts
Payable | | | Current
Notes
Payable | |
| Otter Tail Power Company | | $ | 1,201 | | | $ | -- | | | $ | -- | | | $ | 15,500 | | | $ | 160 | | | $ | -- | |
| Vinyltech Corporation | | | 2 | | | | 32 | | | | -- | | | | 8,500 | | | | -- | | | | 8,251 | |
| Northern Pipe Products, Inc. | | | -- | | | | 9 | | | | -- | | | | 3,725 | | | | -- | | | | 10,537 | |
| BTD Manufacturing, Inc. | | | 41 | | | | 107 | | | | -- | | | | 28,500 | | | | -- | | | | 1,773 | |
| IMD, Inc. | | | 20 | | | | 113 | | | | 1,461 | | | | -- | | | | -- | | | | -- | |
| Shrco, Inc. | | | 40 | | | | 12 | | | | 15,696 | | | | -- | | | | -- | | | | -- | |
| T.O. Plastics, Inc. | | | -- | | | | 28 | | | | -- | | | | 7,400 | | | | -- | | | | 2,986 | |
| Aevenia, Inc. | | | 50 | | | | 7 | | | | -- | | | | 1,800 | | | | -- | | | | 1,480 | |
| Foley Company | | | 40 | | | | 9 | | | | -- | | | | 2,500 | | | | -- | | | | 1,189 | |
| Varistar Corporation | | | 2,050 | | | | -- | | | | -- | | | | -- | | | | 4,875 | | | | 205,329 | |
| Otter Tail Energy Services Company | | | -- | | | | -- | | | | -- | | | | -- | | | | -- | | | | 66 | |
| Otter Tail Assurance Limited | | | 143 | | | | -- | | | | -- | | | | -- | | | | -- | | | | -- | |
| | | $ | 3,587 | | | $ | 317 | | | $ | 17,157 | | | $ | 67,925 | | | $ | 5,035 | | | $ | 231,611 | |
Dividends
Dividends paid to Otter Tail Corporation (the Parent) from its subsidiaries were as follows (in thousands):
| | | | | | | | | | |
| | | 2013 | | | 2012 | | | 2011 | |
| Cash Dividends Paid to Parent by Subsidiaries | | $ | 91,693 | | | $ | 43,018 | | | $ | 43,320 | |
| | | 2012 | | | 2011 | | | 2010 | |
| Cash Dividends Paid to Parent by Subsidiaries | | $ | 43,018 | | | $ | 43,320 | | | $ | 43,131 | |
See Otter Tail Corporation’s notes to consolidated financial statements in Part II, Item 8 for other disclosures.
Other schedules are omitted because of the absence of the conditions under which they are required, because the amounts are insignificant or because the information required is included in the financial statements or the notes thereto.
The following Exhibits are filed as part of, or incorporated by reference into, this report.
| | | | Previously Filed | | | | |
| | File No. | | Previously Filed
As Exhibit No. | | |
| 2-A | | 8-K filed 7/1/09 | | | 2.1 | | —Plan of Merger, dated as of June 30, 2009, by and among Otter Tail Corporation (now known as Otter Tail Power Company), Otter Tail Holding Company (now known as Otter Tail Corporation) and Otter Tail Merger Sub Inc. |
| 3-A | | 8-K filed 7/1/09 | | | 3.1 | | —Restated Articles of Incorporation. |
| 3-B | | 8-K filed 7/1/09 | | | 3.2 | | —Restated Bylaws. |
| 4-A | | 8-K filed 8/23/07 | | | 4.1 | | —Note Purchase Agreement, dated as of August 20, 2007. |
| 4-A-1 | | 8-K filed 12/20/07 | | | 4.3 | | —First Amendment, dated as of December 14, 2007, to Note Purchase Agreement, dated as of August 20, 2007. |
| 4-A-2 | | 8-K filed 9/15/08 | | | 4.1 | | —Second Amendment, dated as of September 11, 2008, to Note Purchase Agreement, dated as of August 20, 2007. |
| 4-A-3 | | 8-K filed 7/1/09 | | | 4.2 | | —Third Amendment, dated as of June 26, 2009, to Note Purchase Agreement dated as of August 20, 2007. |
| 4-B | | 8-K filed 11/2/12 | | | 4.1 | | —Third Amended and Restated Credit Agreement dated as of October 29, 2012 among Otter Tail Corporation, the Banks named therein, Bank of America, N.A. and JPMorgan Chase Bank, N.A., as Co-Syndication Agents, KeyBank National Association, as Documentation Agent, U.S. Bank National Association, as administration agent for the Banks and U.S. Bank National Association, Merrill Lynch, Pierce, Fenner & Smith Incorporated and J.P. Morgan Securities LLC, as Joint Lead Arrangers and Joint Book RunnersRunners. |
| 4-B-1 | | 8-K filed 11/1/13 | | | 4.1 | | —First Amendment to Third Amended and Restated Credit Agreement, dated as of October 29, 2013, among Otter Tail Corporation, U.S. Bank National Association, as Administrative Agent and as a Bank, Bank of America, N.A. and JPMorgan Chase Bank, N.A., each as a Co-Syndication Agent and as a Bank, KeyBank National Association, as Documentation Agent and as a Bank, and Bank of the West and Union Bank, N.A., as Banks. |
| 4-C | | 8-K filed 11/2/12 | | | 4.2 | | —Second Amended and Restated Credit Agreement dated as of October 29, 2012 among Otter Tail Power Company, the Banks named therein, JPMorgan Chase Bank, N.A. and Bank of America, N.A., as Co-Syndication Agents, KeyBank National Association and CoBank, ACB, as Co-Documentation Agents, U.S. Bank National Association, as administrative agent for the Banks, and U.S. Bank National Association, Merrill Lynch, Pierce, Fenner & Smith Incorporated and J.P. Morgan Securities LLC, as Joint Lead Arrangers and Joint Book Runners. |
| | | | | | |
| | File No. | | Previously Filed
As Exhibit No. | | |
| 4-C-1 | | 8-K filed 11/1/13 | | | 4.2 | | — First Amendment to Second Amended and Restated Credit Agreement, dated as of October 29, 2013, among Otter Tail Power Company, U.S. Bank National Association, as Administrative Agent and as a Bank, Bank of America, N.A. and JPMorgan Chase Bank, N.A., each as a Co-Syndication Agent and as a Bank, KeyBank National Association, as Documentation Agent and as a Bank, CoBank, ACB, as a Co-Documentation Agent and as a Bank, and Wells Fargo Bank, National Association and Union Bank, N.A., as Banks. |
| 4-D | | 8-K filed 8/3/11 | | | 4.1 | | —Note Purchase Agreement, dated as of July 29, 2011, between Otter Tail Power Company and the Purchasers named therein. |
| 4-E | | 8-K filed 11/18/97 | | | 4-D-11 | | —Indenture (For Unsecured Debt Securities) dated as of November 1, 1997 between the registrant and U.S. Bank National Association (formerly First Trust National Association), as Trustee. |
| 4-F-1 | | 8-K filed 7/1/09 | | | 4.1 | | —First Supplemental Indenture, dated as of July 1, 2009, to the Indenture (For Unsecured Debt Securities) dated as of November 1, 1997. |
| File No.4-F-2 | | Previously Filed
As Exhibit No.
| |
4-F-2 | 8-K filed 12/4/09 | | | 4.1 | | —Officer’s Certificate and Authentication Order, dated December 4, 2009, for the 9.000% Notes due 2016 (which includes the form of Note) issued pursuant to the Indenture (For Unsecured Debt Securities) dated as of November 1, 1997 and the First Supplemental Indenture thereto, dated as of July 1, 2009. |
| 4-G | | 8-K filed 3/7/13 | | | 4.1 | | —Credit Agreement dated as of March 1, 2013 between Otter Tail Power Company and JPMorgan Chase Bank, N.A. |
| 4-G-1 | | 8-K filed 11/1/13 | | | 4.3 | | —First Amendment to Credit Agreement dated as of October 29, 2013 between Otter Tail Power Company and JPMorgan Chase Bank, N.A. |
| 4-H | | 8-K filed 8/16/13 | | | 4.1 | | — Note Purchase Agreement dated as of August 14, 2013 between Otter Tail Power Company and the Purchasers named therein. |
| 10-A | | 2-39794 | | | 4-C | | —Integrated Transmission Agreement, dated August 25, 1967, between Cooperative Power Association and the Company. |
| 10-A-1 | | 10-K for year ended 12/31/92 | | | 10-A-1 | | —Amendment No. 1, dated as of September 6, 1979, to Integrated Transmission Agreement, dated as of August 25, 1967, between Cooperative Power Association and the Company. |
| 10-A-2 | | 10-K for year ended 12/31/92 | | | 10-A-2 | | —Amendment No. 2, dated as of November 19, 1986, to Integrated Transmission Agreement between Cooperative Power Association and the Company. |
| 10-C-1 | | 2-55813 | | | 5-E | | —Contract dated July 1, 1958, between Central Power Electric Corporation, Inc., and the Company. |
| 10-C-2 | | 2-55813 | | | 5-E-1 | | —Supplement Seven dated November 21, 1973. (Supplements Nos. One through Six have been superseded and are no longer in effect.) |
| 10-C-3 | | 2-55813 | | | 5-E-2 | | —Amendment No. 1 dated December 19, 1973, to Supplement Seven. |
| 10-C-4 | | 10-K for year ended 12/31/91 | | | 10-C-4 | | —Amendment No. 2 dated June 17, 1986, to Supplement Seven. |
| 10-C-5 | | 10-K for year ended 12/31/92 | | | 10-C-5 | | —Amendment No. 3 dated June 18, 1992, to Supplement Seven. |
| 10-C-6 | | 10-K for year ended 12/31/93 | | | 10-C-6 | | —Amendment No. 4 dated January 18, 1994 to Supplement Seven. |
| 10-D | | 2-55813 | | | 5-F | | —Contract dated April 12, 1973, between the Bureau of Reclamation and the Company. |
| 10-E-1 | | 2-55813 | | | 5-G | | —Contract dated January 8, 1973, between East River Electric Power Cooperative and the Company. |
| 10-E-2 | | 2-62815 | | | 5-E-1 | | —Supplement One dated February 20, 1978. |
| | | | | | |
| | File No. | | Previously Filed
As Exhibit No. | | |
| 10-E-3 | | 10-K for year ended 12/31/89 | | | 10-E-3 | | —Supplement Two dated June 10, 1983. |
| 10-E-4 | | 10-K for year ended 12/31/90 | | | 10-E-4 | | —Supplement Three dated June 6, 1985. |
| 10-E-5 | | 10-K for year ended 12/31/92 | | | 10-E-5 | | —Supplement No. Four, dated as of September 10, 1986. |
| 10-E-6 | | 10-K for year ended 12/31/92 | | | 10-E-6 | | —Supplement No. Five, dated as of January 7, 1993. |
| 10-E-7 | | 10-K for year ended 12/31/93 | | | 10-E-7 | | —Supplement No. Six, dated as of December 2, 1993. |
| 10-F | | 10-K for year ended 12/31/89 | | | 10-F | | —Agreement for Sharing Ownership of Generating Plant by and between the Company, Montana-Dakota Utilities Co., and Northwestern Public Service Company (dated as of January 7, 1970). |
| 10-F-1 | | 10-K for year ended 12/31/89 | | | 10-F-1 | | —Letter of Intent for purchase of share of Big Stone Plant from Northwestern Public Service Company (dated as of May 8, 1984). |
| 10-F-2 | | 10-K for year ended 12/31/91 | | | 10-F-2 | | —Supplemental Agreement No. 1 to Agreement for Sharing Ownership of Big Stone Plant (dated as of July 1, 1983). |
| 10-F-3 | | 10-K for year ended 12/31/91 | | | 10-F-3 | | —Supplemental Agreement No. 2 to Agreement for Sharing Ownership of Big Stone Plant (dated as of March 1, 1985). |
| 10-F-4 | | 10-K for year ended 12/31/91 | | | 10-F-4 | | —Supplemental Agreement No. 3 to Agreement for Sharing Ownership of Big Stone Plant (dated as of March 31, 1986). |
| File No.10-F-5 | | Previously Filed
As Exhibit No.
| |
10-F-5 | 10-Q for quarter ended 9/30/03 | | | 10.1 | | —Supplemental Agreement No. 4 to Agreement for Sharing Ownership of Big Stone Plant (dated as of April 24, 2003). |
| 10-F-6 | | 10-K for year ended 12/31/92 | | | 10-F-5 | | —Amendment I to Letter of Intent dated May 8, 1984, for purchase of share of Big Stone Plant. |
| 10-G | | 10-Q for quarter ended 06/30/04 | | | 10.3 | | —Master Coal Purchase and Sale Agreement by and between the Company, Montana-Dakota Utilities Co., Northwestern Corporation and Kennecott Coal Sales Company-Big Stone Plant (dated as of June 1, 2004). |
| 10-H | | 2-61043 | | | 5-H | | —Agreement for Sharing Ownership of Coyote Station Generating Unit No. 1 by and between the Company, Minnkota Power Cooperative, Inc., Montana-Dakota Utilities Co., Northwestern Public Service Company and Minnesota Power & Light Company (dated as of July 1, 1977). |
| 10-H-1 | | 10-K for year ended 12/31/89 | | | 10-H-1 | | —Supplemental Agreement No. One, dated as of November 30, 1978, to Agreement for Sharing Ownership of Coyote Generating Unit No. 1. |
| 10-H-2 | | 10-K for year ended 12/31/89 | | | 10-H-2 | | —Supplemental Agreement No. Two, dated as of March 1, 1981, to Agreement for Sharing Ownership of Coyote Generating Unit No. 1 and Amendment No. 2 dated March 1, 1981, to Coyote Plant Coal Agreement. |
| 10-H-3 | | 10-K for year ended 12/31/89 | | | 10-H-3 | | —Amendment, dated as of July 29, 1983, to Agreement for Sharing Ownership of Coyote Generating Unit No. 1. |
| 10-H-4 | | 10-K for year ended 12/31/92 | | | 10-H-4 | | —Agreement, dated as of September 5, 1985, containing Amendment No. 3 to Agreement for Sharing Ownership of Coyote Generating Unit No. 1, dated as of July 1, 1977, and Amendment No. 5 to Coyote Plant Coal Agreement, dated as of January 1, 1978. |
| 10-H-5 | | 10-Q for quarter ended 9/30/01 | | | 10-A | | —Amendment, dated as of June 14, 2001, to Agreement for Sharing Ownership of Coyote Generating Unit No. 1. |
| 10-H-6 | | 10-Q for quarter ended 9/30/03 | | | 10.2 | | —Amendment, dated as of April 24, 2003, to Agreement for Sharing Ownership of Coyote Generating Unit No. 1. |
| | | | | | |
| | File No. | | Previously Filed
As Exhibit No. | | |
| 10-I | | 2-63744 | | | 5-I | | —Coyote Plant Coal Agreement by and between the Company, Minnkota Power Cooperative, Inc., Montana-Dakota Utilities Co., Northwestern Public Service Company, Minnesota Power & Light Company, and Knife River Coal Mining Company (dated as of January 1, 1978). |
| | | | | | | |
| 10-I-1 | | 10-K for year ended 12/31/92 | | | 10-I-1 | | —Addendum, dated as of March 10, 1980, to Coyote Plant Coal Agreement. |
| 10-I-2 | | 10-K for year ended 12/31/92 | | | 10-I-2 | | —Amendment (No. 3), dated as of May 28, 1980, to Coyote Plant Coal Agreement. |
| 10-I-3 | | 10-K for year ended 12/31/92 | | | 10-I-3 | | —Fourth Amendment, dated as of August 19, 1985, to Coyote Plant Coal Agreement. |
| 10-I-4 | | 10-Q for quarter ended 6/30/93 | | | 19-A | | —Sixth Amendment, dated as of February 17, 1993, to Coyote Plant Coal Agreement. |
| 10-I-5 | | 10-K for year ended 12/31/01 | | | 10-I-5 | | —Agreement and Consent to Assignment of the Coyote Plant Coal Agreement. |
| 10-J | | 10-K for year ended 12/31/12 | | | 10-J | | —Lignite SaleSales Agreement between Coyote Creek Coal Mining Company, L.L.C. and Otter Tail Power Company, Northern Municipal Power Agency, Montana-Dakota Utilities Co., Northwestern Corporation, dated as of October 10, 2012.** |
| 10-J-1 | | 8-K filed 1/31/14 | | | 10.1 | | —First Amendment to Lignite Sales Agreement dated as of January 30, 2014 among Otter Tail Power Company, Northern Municipal Power Agency, Montana-Dakota Utilities Co., a division of MDU Resources Group, Inc., NorthWestern Corporation and Coyote Creek Mining Company, L.L.C. |
| 10-K | | 10-K for year ended 12/31/91 | | | 10-L | | —Integrated Transmission Agreement by and between the Company, Missouri Basin Municipal Power Agency and Western Minnesota Municipal Power Agency (dated as of March 31, 1986). |
| 10-K-1 | | 10-K for year ended 12/31/88 | | | 10-L-1 | | —Amendment No. 1, dated as of December 28, 1988, to Integrated Transmission Agreement (dated as of March 31, 1986). |
| File No.10-L | | Previously Filed
As Exhibit No.
| |
10-L | 10-Q for quarter ended 06/30/04 | | | 10.1 | | —Master Coal Purchase Agreement by and between the Company and Kennecott Coal Sales Company - Hoot Lake Plant (dated as of December 31, 2001). |
10-M-110-M | | 10-Q for quarter ended 03/31/13 | | | 10.1 | | —General Work Construction Agreement, dated as of February 1, 2013, between Otter Tail Power Company, in its capacity as agent for itself, Northwestern Corporation d/b/a NorthWestern Energy and Montana-Dakota Utilities Co., a division of MDU Resources Group, Inc., and Graycor Industrial Constructors Inc.** |
| 10-N | | 10-Q/A for quarter ended 06/30/13 | | | 10.1 | | —Wind Energy Purchase Agreement dated May 9, 2013 between Otter Tail Power Company and Ashtabula Wind III, LLC.** |
| 10-O-1 | | 10-K for year ended 12/31/02 | | | 10-N-1 | | —Deferred Compensation Plan for Directors, as amended.* |
10-M-1a10-O-1a | | 10-K for year ended 12/31/10 | | | 10-N-1A | | —First Amendment of Deferred Compensation Plan for Directors (2003 Restatement), as amended.* |
10-M-210-O-2 | | 8-K filed 02/04/05 | | | 10.1 | | —Executive Survivor and Supplemental Retirement Plan (2005 Restatement).* |
10-M-2a10-O-2a | | 10-K for year ended 12/31/06 | | | 10-N-2a | | —First Amendment of Executive Survivor and Supplemental Retirement Plan (2005 Restatement).* |
10-M-2b10-O-2b | | 10-K for year ended 12/31/10 | | | 10-N-2B | | —Second Amendment of Executive Survivor and Supplemental Retirement Plan (2005 Restatement).* |
10-M-3 | | | | | | |
| | File No. | | Previously Filed
As Exhibit No. | | |
| 10-O-3 | | 10-K for year ended 12/31/93 | | | 10-N-5 | | —Nonqualified Profit Sharing Plan.* |
10-M-410-O-4 | | 10-Q for quarter ended 3/31/02 | | | 10-B | | —Nonqualified Retirement Savings Plan, as amended.* |
10-M-510-O-5 | | 10-Q for quarter ended 9/30/11 | | | 10.1 | | —Nonqualified Retirement Plan (2011 Restatement).* |
10-M-610-O-6 | | 10-Q for quarter ended 6/30/12 | | | 10.6 | | —Otter Tail Corporation Executive Restoration Plus Plan. |
10-M-710-O-7 | | 8-K filed 4/19/12 | | | 10.1 | | —1999 Employee Stock Purchase Plan, As Amended (2012). |
10-M-810-O-8 | | 8-K filed 4/13/06 | | | 10.4 | | —1999 Stock Incentive Plan, As Amended (2006). |
10-M-910-O-9 | | 10-K for year ended 12/31/05 | | | 10-N-7 | | —Form of Stock Option Agreement.* |
10-M-1010-O-10 | | 8-K filed 4/19/12 | | | 10.2 | | —Form of 2012 Restricted Stock Award Agreement for Executive Officers.* |
10-M-1110-O-11 | | 8-K filed 4/19/12 | | | 10.3 | | —Form of 2012 Performance Award Agreement.* |
10-M-12 | 10-K for year ended 12/31/1110-O-12 | | 10-N-11 | | | | | —Executive Annual Incentive Plan.* |
10-M-1310-O-13 | | 8-K filed 4/19/12 | | | 10.4 | | —Form of 2012 Restricted Stock Unit Award Agreement.* |
10-M-1410-O-14 | | 8-K filed 4/13/06 | | | 10.1 | | —Form of Restricted Stock Award Agreement for Directors. |
10-N10-P | | 8-K filed 5/14/12 | | | 1.1 | | —Distribution Agreement dated May 14, 2012, between Otter Tail Corporation and J.P. Morgan Securities LLC. |
10-O-110-Q-1 | | 10-K for year ended 12/31/12 | | | 10-O-1 | | —Executive Employment Agreement, Kevin Moug.* |
10-O-210-Q-2 | | 10-K for year ended 12/31/12 | | | 10-O-2 | | —Executive Employment Agreement, George Koeck.* |
10-O-310-Q-3 | | 10-K for year ended 12/31/12 | | | 10-O-3 | | —Executive Employment Agreement, Chuck MacFarlane.* |
10-O-410-Q-4 | | 10-K for year ended 12/31/12 | | | 10-O-4 | | —Executive Employment Agreement, Shane Waslaski.* |
10-P-110-R-1 | | 10-K for year ended 12/31/10 | | | 10-Q-3 | | —Change in Control Severance Agreement, Kevin G. Moug.* |
10-P-210-R-2 | | 10-K for year ended 12/31/10 | | | 10-Q-4 | | —Change in Control Severance Agreement, George Koeck.* |
| File No.10-R-3 | | Previously Filed
As Exhibit No.
| |
10-P-3 | 10-K for year ended 12/31/11 | | | 10-Q-5 | | —Change in Control Severance Agreement, Chuck MacFarlane.* |
10-P-410-R-4 | | 10-K for year ended 12/31/11 | | | 10-Q-6 | | —Change in Control Severance Agreement, Shane Waslaski.* |
10-P-510-R-5 | | 10-K for year ended 12/31/11 | | | 10-Q-7 | | —Change in Control Severance Agreement, Edward J. McIntyre.* |
| 12.1 | | | | | | | —Calculation of Ratios of Earnings to Fixed Charges and Preferred Dividends. |
| 21-A | | | | | | | —Subsidiaries of Registrant. |
| 23-A | | | | | | | —Consent of Deloitte & Touche LLP. |
| 24-A | | | | | | | —Powers of Attorney. |
| 31.1 | | | | | | | —Certification of Chief Executive Officer Pursuant to Section 302 of the Sarbanes-Oxley Act of 2002. |
| 31.2 | | | | | | | —Certification of Chief Financial Officer Pursuant to Section 302 of the Sarbanes-Oxley Act of 2002. |
| | | | | | |
| | File No. | | Previously Filed
As Exhibit No. | | |
| 32.1 | | | | | | —Certification of Chief Executive Officer Pursuant to Section 906 of the Sarbanes-Oxley Act of 2002. |
| 32.2 | | | | | | —Certification of Chief Financial Officer Pursuant to Section 906 of the Sarbanes-Oxley Act of 2002. |
101.INS101 | | | | | | —XBRL Instance Document |
101.SCH | | | | —XBRL Taxonomy Extension Schema Document |
101.CAL | | | | —XBRL Taxonomy Extension Calculation Linkbase Document |
101.LAB | | | | —XBRL Taxonomy Extension Label Linkbase Document |
101.PRE | | | | —XBRL Taxonomy Extension Presentation Linkbase Document |
101.DEF | | | | —XBRL Taxonomy Extension Definition Linkbase DocumentFinancial statements from the Annual Report on Form 10-K of Otter Tail Corporation for the year ended December 31, 2013, formatted in Extensible Business Reporting Language: (i) the Consolidated Balance Sheets, (ii) the Consolidated Statements of Income, (iii) the Consolidated Statements of Comprehensive Income, (iv) the Consolidated Statements of Common Shareholders’ Equity (v) the Consolidated Statements of Cash Flows (vi) the Consolidated Statements of Capitalization and (vii) the Notes to Condensed Consolidated Financial Statements. |
*Management contract of compensatory plan or arrangement required to be filed pursuant to Item 601(b)(10)(iii)(A) of Regulation S-K.
**Confidential information has been omitted from this Exhibit and filed separately with the Commission pursuant to a confidential treatment request under Rule 24b-2.
Pursuant to Item 601(b)(4)(iii) of Regulation S-K, copies of certain instruments defining the rights of holders of certain long-term debt of the Company are not filed, and in lieu thereof, the Company agrees to furnish copies thereof to the Securities and Exchange Commission upon request.
Pursuant to the requirements of Section 13 or 15(d) of the Securities Exchange Act of 1934, the registrant has duly caused this report to be signed on its behalf by the undersigned, thereunto duly authorized.
| | | |
| OTTER TAIL CORPORATION | |
| | | | |
| | By | /s/ Kevin G. Moug | |
| | | Kevin G. Moug | |
| | | Chief Financial Officer and Senior Vice President
(authorized officer and principal financial officer) | |
| | | (authorized officer and principal financial officer) | |
| | Dated: February 27, 2013March 3, 2014 | |
Pursuant to the requirements of the Securities Exchange Act of 1934, this report has been signed below by the following persons on behalf of the registrant and in the capacities and on the dates indicated:
| | |
| Edward J. McIntyre | ) | | |
| Chief Executive Officer and President | ) | | |
| (principal executive officer) and Director | ) | | |
| | ) | | |
| Kevin G. Moug | ) | | |
| Chief Financial Officer and Senior Vice President | ) | | |
| (principal financial and accounting officer) | ) | | |
| | ) By | /s/ | |
| Nathan I. Partain | ) | Edward J. McIntyre | |
| Chairman of the Board and Director | ) | Pro Se and Attorney-in-Fact | |
| | ) | Dated February 27, 2013 | March 3, 2014 |
| Karen M. Bohn, Director | ) | | |
| | ) | | |
| John D. Erickson, Director | ) | |
| ) | |
| Steven L. Fritze, Director | ) | |
| | ) | | |
Arvid R. Liebe,Kathryn O. Johnson, Director | ) | | |
| | ) | | |
| Joyce Nelson Schuette, Director | ) | | |
| | ) | | |
Mark W. Olson, Director | ) | | |
| ) | | |
| Gary J. Spies, Director | ) | | |
| | ) | | |
| James B. Stake, Director | ) | |
132
EXHIBIT INDEX
Exhibit Number Description
| | 10-J | Lignite Sales Agreement between Coyote Creek Mining Company, L.L.C. and Otter Tail Power Company, Northern Municipal Power Agency, Montana-Dakota Utilities Co., Northwestern Corporation, dated as of October 10, 2012.* |
EXHIBIT INDEX
| Exhibit Number | Description |
| | 10-O-1 | Executive Employment Agreement, Kevin Moug.** |
| | 10-O-210-O-12 | Executive Employment Agreement, George Koeck.*Annual Incentive Plan.* |
| | 10-O-3 | Executive Employment Agreement, Chuck MacFarlane.** |
| | 10-O-4 | Executive Employment Agreement, Shane Waslaski.** |
| | 12.1 | Calculation of Ratios of Earnings to Fixed Charges and Preferred Dividends. |
| | |
| | 21-A | Subsidiaries of the Registrant. |
| | |
| | 23-A | Consent of Deloitte & Touche LLP. |
| | |
| | 31.1 | Certification of Chief Executive Officer Pursuant to Section 302 of the Sarbanes-Oxley Act of 2002. |
| | |
| | 31.2 | Certification of Chief Financial Officer Pursuant to Section 302 of the Sarbanes-Oxley Act of 2002. |
| | |
| | 32.1 | Certification of Chief Executive Officer Pursuant to Section 906 of the Sarbanes-Oxley Act of 2002. |
| | |
| | 32.2 | Certification of Chief Financial Officer Pursuant to Section 906 of the Sarbanes-Oxley Act of 2002. |
| | 101.INS | XBRL Instance Document |
| | 101.SCH101 | XBRL Taxonomy Extension Schema DocumentFinancial statements from the Annual Report on Form 10-K of Otter Tail Corporation for the year ended December 31, 2013, formatted in Extensible Business Reporting Language: (i) the Consolidated Balance Sheets, (ii) the Consolidated Statements of Income, (iii) the Consolidated Statements of Comprehensive Income, (iv) the Consolidated Statements of Common Shareholders’ Equity (v) the Consolidated Statements of Cash Flows (vi) the Consolidated Statements of Capitalization and (vii) the Notes to Condensed Consolidated Financial Statements. |
| 101.CAL | XBRL Taxonomy Extension Calculation Linkbase Document |
| 101.LAB | XBRL Taxonomy Extension Label Linkbase Document |
| 101.PRE | XBRL Taxonomy Extension Presentation Linkbase Document |
| 101.DEF | XBRL Taxonomy Extension Definition Linkbase Document |
* | Confidential information has been omitted from this Exhibit and filed separately with the Commission pursuant to a confidential treatment request under Rule 24b-2. |
** | Management contract of compensatory plan or arrangement required to be filed pursuant to Item 601(b)(10)(iii)(A) of Regulation S-K. |
*Management contract of compensatory plan or arrangement required to be filed pursuant to Item 601(b)(10)(iii)(A) of regulation S-K.