
UNITED STATES
SECURITIES AND EXCHANGE COMMISSION
WASHINGTON, D.C. 20549
FORM 10-K
FOR ANNUAL AND TRANSITION REPORTS
PURSUANT TO SECTIONS 13 OR 15(d) OF THE
SECURITIES EXCHANGE ACT OF 1934
(Mark One)
| x | ANNUAL REPORT PURSUANT TO SECTION 13 OR 15(d) OF THE SECURITIES EXCHANGE ACT OF 1934 |
For the fiscal year ended December 31, 20032004
OR
| ¨ | TRANSITION REPORT PURSUANT TO SECTION 13 OR 15(d) OF THE SECURITIES EXCHANGE ACT OF 1934 |
For the transition period from to
Commission file number 1-6523
Bank of America Corporation
(Exact name of registrant as specified in its charter)
| Delaware | 56-0906609 | |
(State or of Incorporation or Organization) | (IRS Employer Identification No.) | |
Bank of America Corporate Center 100 N. Tryon Street Charlotte, North Carolina | 28255 | |
| ( | (Zip Code) | |
(704) 386-8486 (Registrant’s telephone number, including area code)
|
SECURITIES REGISTERED PURSUANT TO SECTION 12(b) OF THE ACT:
Title of each class | Name of each exchange on which registered | |
Common Stock | New York Stock Exchange | |
| London Stock Exchange | ||
| Pacific Stock Exchange | ||
| Tokyo Stock Exchange | ||
Depositary shares, each representing a one-fifth interest in a share of 6.75% Perpetual Preferred Stock | New York Stock Exchange | |
DJIASM Return Linked Notes, due 2005 | American Stock Exchange | |
S&P 500 | American Stock Exchange | |
NASDAQ® 100 EAGLESSM, due 2010 | American Stock Exchange | |
S&P 500® EAGLESSM, due 2010 | American Stock Exchange | |
Nikkei 225 Return Linked Note, due 2010 | American Stock Exchange | |
Basket of Energy Stock EAGLESSM, due 2010 | American Stock Exchange | |
Russell 2000® EAGLES®, due 2009 | American Stock Exchange | |
DJIA® EAGLES®, due 2009 | American Stock Exchange | |
Nasdaq 100® EAGLES®, due 2010 | American Stock Exchange | |
S&P 500® Index CYCLES™, due 2010 | American Stock Exchange | |
S&P 400 MidCap Index CYCLES™, due 2010 | American Stock Exchange | |
Nikkei 225 Return Linked Note, due 2010 | American Stock Exchange | |
6 1/2% Subordinated InterNotesSM, due 2032 | New York Stock Exchange | |
5 1/2% Subordinated InterNotesSM, due 2033 | New York Stock Exchange | |
5 7/8% Subordinated InterNotesSM, due 2033 | New York Stock Exchange | |
| New York Stock Exchange | |
8 1/2% Subordinated Notes, due 2007 | New York Stock Exchange |
Securities registered pursuant to Section 12(g) of the Act: None
Indicate by check mark whether the registrant: (1) has filed all reports required to be filed by Section 13 or 15(d) of the Securities Exchange Act of 1934 during the preceding 12 months (or for such shorter period that the registrant was required to file such reports), and (2) has been subject to such filing requirements for the past 90 days. Yes x No ¨
Indicate by check mark if disclosure of delinquent filers pursuant to Item 405 of Regulation S-K is not contained herein, and will not be contained, to the best of registrant’s knowledge, in definitive proxy or information statements incorporated by reference in Part III of this Form 10-K or any amendment to this Form 10-K. ¨
Indicate by check mark whether the registrant is an accelerated filer (as defined in Exchange Act Rule 12b-2). Yes x No ¨
The aggregate market value of the registrant’s common stock (“Common Stock”) held by non-affiliates is approximately $116,840,744,050$170,366,355,918 (based on the June 30, 20032004 closing price of Common Stock of $79.03$42.31 per share). As of February 27, 2004,28, 2005, there were 1,448,991,0404,053,638,403 shares of Common Stock outstanding.
DOCUMENTS INCORPORATED BY REFERENCE
| Document of the Registrant | Form 10-K Reference Locations | |
Portions of the
| PART III |
PART I
Item 1. BUSINESS
General
Bank of America Corporation (the “Corporation”) is a Delaware corporation, a bank holding company and a financial holding company under the Gramm-Leach-Bliley Act. The principal executive offices of the Corporation are located in the Bank of America Corporate Center, Charlotte, North Carolina 28255.
Primary Market Areas
Through its banking subsidiaries (the “Banks”) and various nonbanking subsidiaries, the Corporation provides a diversified range of banking and nonbanking financial services and products, primarily throughout the Northeast (Connecticut, Maine, Massachusetts, New Hampshire and Rhode Island), the Mid-Atlantic (Maryland, New Jersey, New York, Pennsylvania, Virginia and the District of Columbia), the Midwest (Illinois, Iowa, Kansas and Missouri), the Southeast (Florida, Georgia, North Carolina, South Carolina and Tennessee), the Southwest (Arizona, Arkansas, New Mexico, Oklahoma and Texas), the Northwest (Oregon and Washington) and the West (California, Idaho, Nevada, Oregon and Nevada)Washington) regions of the United States and in selected international markets. Management believes that these are desirable regions in which to be located. Based on the most recent available data, personal income in the states in these regions as a whole rose 3.85.4 percent year-to-year through the third quarter of 2003,2004, compared to growth of 3.34.6 percent in the rest of the United States. In addition, the population in these states as a whole rose an estimated 1.3 percent between 20022003 and 2003,2004, compared to growth of 0.5 percent in the rest of the United States. Through December 2003,2004, the average rate of unemployment in these states was 5.65.2 percent, ranging from Virginia’s 3.63.3 percent in New Hampshire and Virginia to Oregon’s 7.29.0 percent in the District of Columbia, compared to a rate of unemployment of 5.85.7 percent in the rest of the United States. The number of housing permits authorized in 20032004 was 9nearly 10 percent higher than in 20022003 in these states as a whole.
The Corporation has the leading bank deposit market share position in California, Connecticut, Florida, Maryland, Massachusetts, Nevada, New Jersey and Washington. In addition, the Corporation ranks second in terms of bank deposit market share in Arizona, Kansas, Missouri, New Mexico, North Carolina, Rhode Island, South Carolina and Texas; third in Arkansas, Georgia, Nevada and the District of Columbia;Columbia, Georgia, Idaho and Maine; fourth in Idaho,New Hampshire, Oklahoma, Oregon and Virginia; fifth in Oklahoma and Tennessee; sixth in New York; seventh in Iowa; thirteenth in Pennsylvania; and thirteenthfourteenth in Illinois.
Acquisition and Disposition Activity
As part of its operations, the Corporation regularly evaluates the potential acquisition of, and holds discussions with, various financial institutions and other businesses of a type eligible for financial holding company ownership or control. In addition, the Corporation regularly analyzes the values of, and submits bids for, the acquisition of customer-based funds and other liabilities and assets of such financial institutions and other businesses. The Corporation also regularly considers the potential disposition of certain of its assets, branches, subsidiaries or lines of businesses. As a general rule, the Corporation publicly announces any material acquisitions or dispositions when a definitive agreement has been reached.
On October 27, 2003,April 1, 2004, the Corporation andcompleted its merger with FleetBoston Financial Corporation (“FleetBoston”) announced they had signed an Agreement and Plan of Merger dated October 27, 2003. The merger agreement has been approved by the boards of directors of the Corporation and FleetBoston and is subject to customary closing conditions, including regulatory and stockholders’ approvals. Closing is expected in April of 2004.. Additional information on the merger with FleetBoston and the Corporation’s other acquisition activity is included under Note 2 of the Notes to the Consolidated Financial Statements in the 2003 Annual Report to Stockholders (the “2003 Annual Report”) which is incorporated herein by reference.
Government Supervision and Regulation
The following discussion describes elements of an extensive regulatory framework applicable to bank holding companies, financial holding companies and banks and specific information about the Corporation and its subsidiaries. Federal regulation of banks, bank holding companies and financial holding companies is intended primarily for the protection of depositors and the Bank Insurance Fund rather than for the protection of stockholders and creditors.
1
General
As a registered bank holding company and financial holding company, the Corporation is subject to the supervision of, and regular inspection by, the Board of Governors of the Federal Reserve System (the “Federal Reserve Board”). The Banks are organized as national banking associations, which are subject to regulation, supervision and examination by the Office of the Comptroller of the Currency (the “Comptroller” or “OCC”), the Federal Deposit Insurance Corporation (the “FDIC”), the Federal Reserve Board and other federal and state regulatory agencies. In addition to banking laws, regulations and regulatory agencies, the Corporation and its subsidiaries and affiliates are subject to various other laws and regulations and supervision and examination by other regulatory agencies, all of which directly or indirectly affect the operations and management of the Corporation and its ability to make distributions to stockholders.
A financial holding company, and the companies under its control, are permitted to engage in activities considered “financial in nature” as defined by the Gramm-Leach-Bliley Act and Federal Reserve Board interpretations (including, without limitation, insurance and securities activities), and therefore may engage in a broader range of activities than permitted for bank holding companies and their subsidiaries. A financial holding company may engage directly or indirectly in activities considered financial in nature, either de novo or by acquisition, provided the financial holding company gives the Federal Reserve Board after-the-fact notice of the new activities. The Gramm-Leach-Bliley Act also permits national banks, such as the Banks, to engage in activities considered financial in nature through a financial subsidiary, subject to certain conditions and limitations and with the approval of the Comptroller.
Interstate Banking
Bank holding companies (including bank holding companies that also are financial holding companies) also are required to obtain the prior approval of the Federal Reserve Board before acquiring more than five percent of any class of voting stock of any non-affiliated bank. Pursuant to the Riegle-Neal Interstate Banking and Branching Efficiency Act of 1994 (the “Interstate Banking and Branching Act”), a bank holding company may acquire banks located in states other than its home state without regard to the permissibility of such acquisitions under state law, but subject to any state requirement that the bank has been organized and operating for a minimum period of time, not to exceed five years, and the requirement that the bank holding company, after the proposed acquisition, controls no more than 10 percent of the total amount of deposits of insured depository institutions in the United States and no more than 30 percent or such lesser or greater amount set by state law of such deposits in that state.
Subject to certain restrictions, the Interstate Banking and Branching Act also authorizes banks to merge across state lines to create interstate banks. The Interstate Banking and Branching Act also permits a bank to open new branches in a state in which it does not already have banking operations if such state enacts a law permitting de novo branching. The Corporation presently has consolidated itstwo primary retail subsidiary banks into a single interstate bank (Bank of America, N.A.) and Fleet National Bank). Bank of America, N.A., headquartered in Charlotte, North Carolina, withhas full service branch offices in 2122 states and the District of Columbia. Fleet National Bank, headquartered in Providence, Rhode Island, has full service branch offices in eight states. The Corporation intends to consolidate these banks into a single interstate retail bank under the Bank of America, N.A. charter in the second quarter of 2005 and will have retail branch offices in 29 states and the District of Columbia.
In addition, the Corporation operates atwo nationally chartered credit card bankbanks (Bank of America, N.A. (USA)) and Fleet Bank (RI), National Association), headquartered in Phoenix, Arizona and Providence, Rhode Island, respectively. The Corporation intends to consolidate these banks into a single credit card bank under the Bank of America, N.A. (USA) charter in the first quarter of 2005. The Corporation also owns a limited purpose nationally chartered bank that conducts transactions for controlled disbursement accounts (Fleet Maine, National Association), headquartered in South Portland, Maine. The Corporation intends to consolidate Fleet Maine, National Association into Fleet National Bank in the first quarter of 2005.
Finally, the Corporation owns three nationally chartered bankers’ banks: Bank of America Oregon, N.A., headquartered in Portland, Oregon; Bank of America California, N.A., headquartered in San Francisco, California; and Bank of America Georgia, N.A., headquartered in Atlanta, Georgia.
Changes in Regulations
Proposals to change the laws and regulations governing the banking industry are frequently introduced in Congress, in the state legislatures and before the various bank regulatory agencies. The likelihood and timing of any proposals or legislation and the impact they might have on the Corporation and its subsidiaries cannot be determined at this time.
Capital and Operational Requirements
The Federal Reserve Board, the Comptroller and the FDIC have issued substantially similar risk-based and leverage capital guidelines applicable to United States banking organizations. In addition, these regulatory agencies may from time to time require that a banking organization maintain capital above the minimum levels, whether because of its financial condition or actual or anticipated growth. The Federal
2
Reserve Board risk-based guidelines define a three-tier capital framework. Tier 1 capital includes common shareholders’ equity, trust preferred securities, minority interests and qualifying preferred stock, less goodwill and other adjustments. Tier 2 capital consists of preferred stock not qualifying as Tier 1 capital, mandatory convertible debt, limited amounts of subordinated debt, other qualifying term debt and the allowance for credit losses up to 1.25 percent of risk-weighted assets.assets and other adjustments. Tier 3 capital includes subordinated debt that is unsecured, fully paid, has an original maturity of at least two years, is not redeemable before maturity without prior approval by the Federal Reserve Board and includes a lock-in clause precluding payment of either interest or principal if the payment would cause the issuing bank’s risk-based capital ratio to fall or remain below the required minimum. The sum of Tier 1 and Tier 2 capital less investments in unconsolidated subsidiaries represents the Corporation’s qualifying total capital. Risk-based capital ratios are calculated by dividing Tier 1 and total capital by risk-weighted assets. Assets and off-balance sheet exposures are assigned to one of four categories of risk-weights, based primarily on relative credit risk. The minimum Tier 1 capital ratio is four percent and the minimum total capital ratio is eight percent. The Corporation’s Tier 1 and total risk-based capital ratios under these guidelines at December 31, 20032004 were 7.858.10 percent and 11.8711.63 percent, respectively. At December 31, 2003,2004, the Corporation had no subordinated debt that qualified as Tier 3 capital.
The leverage ratio is determined by dividing Tier 1 capital by adjusted average total assets. Although the stated minimum ratio is 100 to 200 basis points above three percent, banking organizations are required to maintain a ratio of at least five percent to be classified as well capitalized. The Corporation’s leverage ratio at December 31, 20032004 was 5.735.82 percent. The Corporation meets its leverage ratio requirement.
The Federal Deposit Insurance Corporation Improvement Act of 1991 (“FDICIA”), among other things, identifies five capital categories for insured depository institutions (well capitalized, adequately capitalized, undercapitalized, significantly undercapitalized and critically undercapitalized) and requires the respective federal regulatory agencies to implement systems for “prompt corrective action” for insured depository institutions that do not meet minimum capital requirements within such categories. FDICIA imposes progressively more restrictive constraints on operations, management and capital distributions, depending on the category in which an institution is classified. Failure to meet the capital guidelines could also subject a banking institution to capital raising requirements. An “undercapitalized” bank must develop a capital restoration plan and its parent holding company must guarantee that bank’s compliance with the plan. The liability of the parent holding company under any such guarantee is limited to the lesser of five percent of the bank’s assets at the time it became “undercapitalized” or the amount needed to comply with the plan. Furthermore, in the event of the bankruptcy of the parent holding company, such guarantee would take priority over the parent’s general unsecured creditors. In addition, FDICIA requires the various regulatory agencies to prescribe certain non-capital standards for safety and soundness relating generally to operations and management, asset quality and executive compensation and permits regulatory action against a financial institution that does not meet such standards.
The various regulatory agencies have adopted substantially similar regulations that define the five capital categories identified by FDICIA, using the total risk-based capital, Tier 1 risk-based capital and leverage capital ratios as the relevant capital measures. Such regulations establish various degrees of corrective action to be taken when an institution is considered undercapitalized. Under the regulations, a “well capitalized” institution must have a Tier 1 risk-based capital ratio of at least six percent, a total risk-based capital ratio of at least ten percent and a leverage ratio of at least five percent and not be subject to a
capital directive order. Under these guidelines, each of the Banks was considered well capitalized as of December 31, 2003.2004.
Regulators also must take into considerationconsideration: (a) concentrations of credit risk; (b) interest rate risk (when the interest rate sensitivity of an institution’s assets does not match the sensitivity of its liabilities or its off-balance-sheet position); and (c) risks from non-traditional activities, as well as an institution’s ability to manage those risks, when determining the adequacy of an institution’s capital. This evaluation will be made as a part of the institution’s regular safety and soundness examination. In addition, the Corporation, and any Bank with significant trading activity, must incorporate a measure for market risk in their regulatory capital calculations.
3
Distributions
The Corporation’s funds for cash distributions to its stockholders are derived from a variety of sources, including cash and temporary investments. The primary source of such funds, and funds used to pay principal and interest on its indebtedness, is dividends received from the Banks. Each of the Banks is subject to various regulatory policies and requirements relating to the payment of dividends, including requirements to maintain capital above regulatory minimums. The appropriate federal regulatory authority is authorized to determine under certain circumstances relating to the financial condition of a bank or bank holding company that the payment of dividends would be an unsafe or unsound practice and to prohibit payment thereof.
In addition, the ability of the Corporation and the Banks to pay dividends may be affected by the various minimum capital requirements and the capital and non-capital standards established under FDICIA, as described above. The right of the Corporation, its stockholders and its creditors to participate in any distribution of the assets or earnings of its subsidiaries is further subject to the prior claims of creditors of the respective subsidiaries.
Source of Strength
According to Federal Reserve Board policy, bank holding companies are expected to act as a source of financial strength to each subsidiary bank and to commit resources to support each such subsidiary. This support may be required at times when a bank holding company may not be able to provide such support. Similarly, under the cross-guarantee provisions of the Federal Deposit Insurance Act, in the event of a loss suffered or anticipated by the FDIC – either as a result of default of a banking subsidiary or related to FDIC assistance provided to a subsidiary in danger of default – the other Banks may be assessed for the FDIC’s loss, subject to certain exceptions.
Competition
The Corporation has four business segments which were recently renamed in order to align more closely with the scope of its business. The business segments are Global Consumer and Small Business Banking, Global Business and Financial Services, Global Capital Markets and Investment Banking, and Global Wealth and Investment Management. The activities in which the Corporation and its four business segments (Consumer and Commercial Banking, Asset Management, Global Corporate and Investment Banking, and Equity Investments) engage are highly competitive. Generally, the lines of activity and markets served involve competition with other banks, thrifts, credit unions and other nonbank financial institutions, such as investment banking firms, investment advisory firms, brokerage firms, investment companies and insurance companies. The Corporation also competes against banks and thrifts owned by nonregulated diversified corporations and other entities which offer financial services, located both domestically and internationally and through alternative delivery channels such as the Internet. The methods of competition center around various factors, such as customer services, interest rates on loans and deposits, lending limits and customer convenience, such as location of offices.
The commercial banking business in the various local markets served by the Corporation’s business segments is highly competitive. The four business segments compete with other banks, thrifts, finance companies and other businesses which provide similar services. The business segments actively compete in commercial lending activities with local, regional and international banks and nonbank financial organizations, some of which are larger than certain of the Corporation’s nonbanking subsidiaries and the Banks. In its consumer lending operations, the competitors of the business segments include other banks, thrifts, credit unions, finance companies and other nonbank organizations offering financial services. In the investment banking, investment advisory and brokerage business, the Corporation’s nonbanking subsidiaries compete with other banking and investment banking firms, investment advisory firms,
brokerage firms, investment companies, other organizations offering similar services and other investment alternatives available to investors. The Corporation’s mortgage banking units compete with banks, thrifts, government agencies, mortgage brokers and other nonbank organizations offering mortgage banking services. In the trust business, the Banks compete with other banks, investment counselors and insurance companies in national markets for institutional funds and insurance agents, thrifts, financial counselors and other fiduciaries for personal trust business. The Corporation and its four business segments also actively compete for funds. A primary source of funds for the Banks is deposits, and competition for deposits includes other deposit-taking organizations, such as banks, thrifts, and credit unions, as well as money market mutual funds.
4
The Corporation’s ability to expand into additional states remains subject to various federal and state laws. See “Government Supervision and Regulation – General” for a more detailed discussion of interstate banking and branching legislation and certain state legislation.
Employees
As of December 31, 2003,2004, there were 133,549175,742 full-time equivalent employees within the Corporation and its subsidiaries. Of the foregoing employees, 84,647 were employed within Consumer and Commercial Banking, 6,618 were employed within Asset Management, 6,43978,034 were employed within Global CorporateConsumer and Small Business Banking, 7,806 were employed within Global Business and Financial Services, 6,545 were employed within Global Capital Markets and Investment Banking and 18512,743 were employed within Equity Investments.Global Wealth and Investment Management. The remainder were employed elsewhere within the Corporation and its subsidiaries.
None of the domestic employees within the Corporation is subject to a collective bargaining agreement. Management considers its employee relations to be good.
Additional Information
TheSee also the following additional information set forth in the 2003 Annual Reportwhich is incorporated herein by reference: Business Segment Operations (under the caption “Business Segment Operations” in the Management’s Discussion and Analysis of Financial Condition and Results of Operations and Financial Condition (the “MD&A”) and in Note 2019 of the Notes to the Consolidated Financial Statements (the “Notes”)); Net Interest Income (under the captions “Financial Highlights”Highlights—Net Interest Income” and “Supplemental Financial Data” in the MD&A and Tables III and IIIII of the Statistical Financial Information); Securities (under the caption “Interest Rate Risk Management —Securities”Management—Securities” in the MD&A and Notes 1 and 45 of the Notes); Outstanding Loans and Leases (under the caption “Credit Risk Management” in the MD&A, Tables IV, VIII, IX and XTable III of the Statistical Financial Information, and Notes 1 and 76 of the Notes); Deposits (under the caption “Liquidity Risk Management—Deposits and Other Funding Sources” in the MD&A and Note 1110 of the Notes); Short-Term Borrowings (in Table V of(under the Statistical Financial Informationcaption “Liquidity Risk Management—Deposits and Other Funding Sources” in the MD&A and Note 1211 of the Notes); Trading Account Liabilities (in Note 53 of the Notes); Market Risk Management (under the caption “Market Risk Management” in the MD&A); Liquidity Risk Management (under the caption “Liquidity Risk Management” in the MD&A); Operational Risk Management (under the caption “Operational Risk Management” in the MD&A); and Performance by Geographic Area (under Note 2221 of the Notes).
The Corporation’s Annual Report on Form 10-K, Quarterly Reports on Form 10-Q, Current Reports on Form 8-K and amendments to those reports filed or furnished pursuant to Section 13(a) or 15(d) of the Securities Exchange Act of 1934 are available on the Corporation’s website (www.bankofamerica.comat www.bankofamerica.com/investor under the “About Bank of America—Investor Relations—10-Qs and 10-Ks” and “About Bank of America—Investor Relations—heading Complete SEC Filings” captions)Filings as soon as reasonably practicable after the Corporation electronically files such material with, or furnishes it to the Securities and Exchange Commission. In addition, the Corporation makes available on its website at www.bankofamerica.com/investor under the heading Corporate Governance its: (i) Code of Ethics and Insider Trading Policy; (ii) Corporate Governance Guidelines; and (iii) the charters of the Audit, Compensation, Corporate Governance, Asset Quality and Executive Committees, and also intends to disclose any amendments to its code of ethics, or waivers of the code of ethics on behalf of its Chief Executive Officer, Chief Financial Officer and Chief Accounting Officer, on its website. These Corporate Governance materials are also available free of charge in print to shareholders who request them in writing to: Bank of America Corporation, Attention: Shareholder Relations Department, NC1-007-23-02, 100 North Tryon Street, Charlotte, North Carolina 28255.
Item 2. PROPERTIES
As of December 31, 2003,2004, the principal offices of the Corporation and eachprimarily all of its business segments were located in the 60-story Bank of America Corporate Center in Charlotte, North Carolina, which is owned by a subsidiary of the Corporation. The Corporation occupies approximately 679,000669,000 square feet and leases approximately 521,000531,000 square feet to third parties at market rates, which represents substantially all of the space in this facility. In additionUpon the merger with FleetBoston Financial Corporation, the Corporation occupies approximately 880,000 square feet of space at 100 Federal Street in Boston, which is the headquarters for one of the Corporation’s primary business segments, the Global Wealth and Investment Management Group. The 37-story building is owned by a subsidiary of the Corporation which also leases approximately 372,000 square feet to this facility, thethird parties. The Corporation also leases or owns a significant amount of space worldwide. As of December 31, 2003,2004, the Corporation and its subsidiaries owned or leased approximately 17,50025,000 locations in 44 states, the District of Columbia and 3034 foreign countries.
Item 3. LEGAL PROCEEDINGS
In the ordinary course of business, the Corporation and its subsidiaries are routinely defendants in or parties to a number of pending and threatened legal actions and proceedings, including actions brought on behalf of various classes of claimants. In certain of these actions and proceedings, claims for substantial monetary damages are asserted against the Corporation and its subsidiaries and certain of these actions and proceedings are based on alleged violations of consumer protection, securities, environmental, banking and other laws.
5
In view of the inherent difficulty of predicting the outcome of such matters, the Corporation cannot state what the eventual outcome of pending matters will be; however, based on current knowledge, management does not believe that liabilities, if any, arising from pending litigation or regulatory matters, including the litigation and regulatory matters described below, will have a material adverse effect on the consolidated financial position or liquidity of the Corporation but may be material to the Corporation’s operating results for any particular quarter.
Mutual Fund Operations
On September 3, 2003, the Office of the Attorney General for the State of New York (NYAG) simultaneously filed and settled a complaint against Canary Capital Partners, LLC, et al. (collectively, Canary). The complaint alleged, among other things, that Canary engaged in improper trading with certain mutual funds in the Nations Funds family (Nations Funds). Specifically, the NYAG alleged that Canary engaged in activities that it characterized as “market timing” and “late trading.” The Corporation is cooperating fully with the NYAG, the U.S. Securities and Exchange Commission (SEC) and other regulators in connection with these inquiries.
On September 16, 2003, the NYAG announced a criminal action, and the SEC announced a civil action, against a former employee of Banc of America Securities LLC (BAS). The complaints allege that this former employee played a key role in enabling Canary to engage in “late trading” of shares of Nations Funds and other mutual funds in violation of state and federal law.
The Corporation has announced that it will establish a restitution fund for shareholders of the Nations Funds who were harmed by Canary’s late trading and market timing practices. In addition, the Corporation announced that it will provide restitution for shareholders of third party mutual funds who were harmed by any late trading activities by Canary that are found to have occurred through the Corporation in the event restitution is not otherwise available from Canary, its affiliates, its investors or from any other third parties. The Corporation has also committed to return to the Nations Funds all funds management and advisory fees related to the Canary market timing agreement.
The Corporation has named several key leaders and advisors external to the Corporation to review mutual fund practices. These individuals are currently leading an independent review of the Corporation’s mutual fund policies and practices, including a complete legal and regulatory compliance review of the Corporation’s mutual fund business, and coordinating a detailed review of all technology, control, and compliance systems related to the mutual fund business, including all systems relating to sales, clearing, and derivative and brokerage operations.
The Corporation is developing new policies to eliminate all lending, derivatives, brokerage services or any other services relating to mutual fund trading activity by clients known to the Corporation to engage in active mutual fund market timing not permitted by the targeted funds. The Corporation has committed that the market timing policies being established will no longer permit special exceptions.
The independent trustees of the Board of Trustees of the Nations Funds have retained an independent firm to evaluate the extent of any adverse monetary impact to any Nations Fund in which the Nations Funds’ adviser permitted a discretionary market timing agreement. They also announced that they would evaluate whether any additional steps are appropriate to assure Nations Funds shareholders that the Nations Funds are being managed in their best interests. In addition, the independent trustees announced that the Board of Trustees, with the assistance of the independent firm, will conduct a review of the issues relating to late trading in Nations Funds, consider the results of the review of these issues being conducted by the Corporation, and take action as appropriate.
As of the date hereof, a number of lawsuits and regulatory proceedings have been filed against the Corporation, its affiliates and associates in connection with these circumstances, alleging, among other things, breaches of fiduciary duties, federal securities laws, the ERISA Act, the Investment Company Act of 1940, and the Investment Advisers Act of 1940 as well as contractual and other common law claims. The Corporation has also received shareholder derivative actions purportedly brought on behalf of the
6
Corporation alleging various claims, including breach of fiduciary duty, against the Board of Directors in connection with these matters. Additional lawsuits or regulatory proceedings presenting similar or additional allegations and requests for relief arising out of these circumstances could be filed in the future against the Corporation and related parties.
During the quarter ended September 30, 2003, the Corporation recognized a $100 million charge to income in connection with these matters. The Corporation, however, cannot determine at this time the eventual outcome, timing or impact of these matters. Accordingly, it is possible that additional charges in the future may be required.
Enron Corporation (Enron) Securities Litigation
The Corporation was named as a defendant, along with a number of commercial and investment banks and their holding companies, certain former Enron officers and directors, law firms and accountants, in a putative consolidated class action pending in the United States District Court for the Southern District of Texas filed on April 8, 2002 entitled Newby v. Enron. The amended complaint, which was filed in May 2003 and is now the operative complaint, alleges claims against the Corporation and BAS under Sections 11, 12 and 15 of the Securities Act of 1933 related to the role of BAS as an underwriter of two public offerings of Enron debt and as an initial purchaser in a private placement of debt issued by an Enron-affiliated company. The Corporation and BAS have moved to dismiss all of the claims asserted against them in the operative complaint. That motion is fully briefed and remains pending. Plaintiffs’ motion for class certification is fully briefed and remains pending.
In addition, the Corporation and certain of its affiliates have been named as defendants or third-party defendants, along with other commercial and investment banks and many other parties, in various other individual and putative class actions relating to Enron. The complaints assert claims under federal securities laws, state securities laws and/or state common law or statutes. The majority of these actions were either filed in or have been transferred to the United States District Court for the Southern District of Texas and consolidated or coordinated with Newby v. Enron.
The corporation cannot determine at this time the eventual outcome, timing or impact of these matters.
WorldCom, Inc. (WorldCom) Securities Litigation
BAS, Banc of America Securities Limited (BASL), and other underwriters of WorldCom bonds issued in 2000 and 2001, as well as former officers and directors of WorldCom and other parties, have been named as defendants in a class action lawsuit filed in the United States District Court for the Southern District of New York entitled WorldCom Securities Litigation. The operative complaint alleges claims against BAS and BASL under Sections 11 andSee Note 12 of the Securities Act of 1933 in connection with 2000 and 2001 public bond offerings andConsolidated Financial Statements on page 125 for the Corporation’s litigation disclosure which is brought on behalf of purchasers and acquirers of bonds issued in or traceable to these offerings. On October 24, 2003, United States District Court Judge Denise Cote certified a class consisting of “all persons and entities who purchased or otherwise acquired publicly-traded securities of WorldCom during the period beginning April 29, 1999 through and including June 25, 2002 and who were injured thereby.” Fact discovery is presently proceeding in this class action and a trial date has been set for January 10, 2005.incorporated herein by reference.
In addition, the Corporation, BAS and BASL, along with other underwriters, certain holding companies affiliated with the underwriters, a former Salomon Smith Barney telecommunications analyst, certain former officers and directors of WorldCom and WorldCom’s former auditors have been named as defendants in numerous individual actions that were filed in either federal or state courts arising out of alleged accounting irregularities of the books and records of WorldCom. Plaintiffs in these actions are typically institutional investors, including state pension funds, who allegedly purchased debt securities issued by WorldCom pursuant to public offerings in 1997, 1998, 2000 or 2001. The majority of the complaints assert only claims under Section 11 of the Securities Act of 1933, but some complaints also include claims under the Exchange Act of 1934, state securities laws, other state statutes and under common law theories. Most of these cases were filed in state court and subsequently removed (as related to WorldCom’s bankruptcy) by defendants to federal courts and then transferred by the Judicial Panel for Multidistrict Litigation to the United States District Court for the Southern District of New York to be consolidated with WorldCom
7
Securities Litigation for pre-trial purposes. Seven of these actions, which had been removed, were remanded to state courts in Alabama (2), Tennessee, Pennsylvania (3) and Illinois.
Certain plaintiffs in actions transferred to the Southern District of New York have filed an appeal to the Second Circuit Court of Appeals arguing that their actions were not properly removed to federal court because a provision in the Securities Act prevented such removals. Defendants, including the underwriters, have argued that removal was proper.
Additional complaints were filed on behalf of purchasers of WorldCom stock in state courts in Mississippi against the Corporation and BAS, as well as certain former officers and directors of WorldCom, other commercial and investment banks and other parties. These cases have also been transferred to the United States District Court for the Southern District of New York and consolidated with WorldCom Securities Litigation for pre-trial purposes.
The corporation cannot determine at this time the eventual outcome, timing or impact of these matters.
Adelphia Communications Corporation (Adelphia) Securities Litigation
Bank of America, N.A. (BANA) and BAS are defendants in several private civil actions relating to Adelphia which have been consolidated for pre-trial purposes and are currently pending in the United States District Court for the Southern District of New York. The actions include a class action and various individual actions. BAS was a member of seven underwriting syndicates of securities issued by Adelphia, and BANA was an agent and/or lender in connection with five credit facilities in which Adelphia subsidiaries were borrowers. Additional defendants include other members of those syndicates, underwriters for additional Adelphia securities offerings, lenders and agents for that and other credit facilities, former Adelphia insiders and members of its board of directors, and Adelphia’s outside auditors and counsel. The complaints allege claims under the Securities Act of 1933 and the Securities Exchange Act of 1934.
BANA and BAS are also defendants in an adversary proceeding pending in the United States Bankruptcy Court for the Southern District of New York. The proceeding is brought by the Official Committee of Unsecured Creditors in the Adelphia Bankruptcy Proceedings (the “Creditors Committee”) on behalf of Adelphia; however, the Bankruptcy Court has not yet given the Creditors Committee authority to bring this lawsuit. The adversary proceeding complaint names over 400 defendants and asserts over 50 claims under federal statute (including Bank Holding Company Act), state common law and various provisions of the Bankruptcy Code. The Creditors Committee seeks avoidance and recovery of payments, equitable subordination, disallowance and recharacterization of claims and recovery of damages in an unspecified amount. BANA, BAS and other investment bank defendants have filed motions to dismiss. The Official Committee of Equity Security Holders in the Adelphia Bankruptcy Proceedings has filed a motion seeking to intervene in the adversary proceeding and to file its own complaint. The proposed complaint is similar to the Creditor’s Committee complaint, except that it also asserts claims under RICO and various state law theories.
The Corporation cannot determine at this time the eventual outcome, timing or impact of these matters.
Paul J. Miller v. Bank of America, N.A.
On August 13, 1998, BANA’s predecessor was named as a defendant in this class action challenging its practice, consistent with the banking industry, of debiting accounts that receive, by direct deposit, governmental benefits to repay fees incurred in those accounts. The action alleges fraud, negligent misrepresentation, and violations of certain California laws. On October 16, 2001, a class was certified consisting of more than one million California residents who have, had or will have, at any time after August 13, 1994, a deposit account with BANA into which payments of public benefits are or have been directly deposited by the government. The case proceeded to trial on January 20, 2004.
On February 25, 2004, at the conclusion of the jury phase of the trial, the jury found in BANA’s favor on three of the four claims presented to the jury. As to the fourth claim, alleging that BANA violated certain California laws, the jury imposed damages of approximately $75 million and awarded the class representative $275,000 in emotional distress damages. The jury also assessed a $1,000 penalty as to those members of the class suffering substantial economic or emotional harm as a result of the practice but did not
8
determine which or how many class members are entitled to the penalty. This and other legal issues remain outstanding in the trial court.
The Corporation believes that this case is without merit and plans to appeal any adverse judgment. The Corporation cannot determine at this time the eventual outcome, timing or impact of this matter.
D.E. Shaw Litigation
Following the merger of NationsBank Corporation and BankAmerica Corporation in September 1998, the Corporation and certain of its officers and directors were named as defendants in class actions brought on behalf of persons who purchased NationsBank or BankAmerica shares between August 4, 1998 and September 30, 1998; persons who purchased shares of the Corporation between October 1 and October 13, 1998, and persons who held NationsBank or BankAmerica shares as of the merger. The claims on behalf of the purchasers and the persons who held NationsBank shares as of the merger principally rested on the allegation that the Corporation or its predecessors failed to disclose material facts concerning a $1.4 billion financial relationship between BankAmerica Corporation and D.E. Shaw & Co. that resulted in a $372 million charge to the Corporation’s earnings in the quarter ending September 30, 1998. The claims of the persons who held BankAmerica shares as of the merger principally rested on the allegation that the defendants misrepresented a “takeover” of BankAmerica Corporation as a “merger of equals.”
On November 2, 2002, the United States District Court for the Eastern District of Missouri (the Federal Court), the Court to which all federal actions had been transferred, entered a final judgment dismissing the actions with prejudice. The Federal Court entered the judgment after approving a settlement providing for payment of $333 million to the classes of purchasers and holders of NationsBank shares and $157 million to the classes of purchasers of BankAmerica and Corporation shares and holders of BankAmerica shares (all amounts to bear interest at the 90-day Treasury Bill Rate from March 6, 2002 to the date of payment). The Eighth Circuit Court of Appeals affirmed the judgment on appeal by certain objecting plaintiffs and class members on December 2, 2003, and denied a petition for rehearing on January 9, 2004. It is expected that, in accordance with its terms, the settlement will become final in April 2004 unless further review is sought in the Supreme Court of the United States. There remain pending several actions in California that have been stayed since April 2000, when the Federal Court enjoined the plaintiffs in those actions from purporting to prosecute their claims on behalf of a class.
Regulatory
In the course of its business, the Corporation is subject to regulatory examinations, information gathering requests, inquiries and investigations. Two of the Corporation’s subsidiaries, BAS and Banc of America Investment Services, Inc. (“BAI”), are registered broker/dealers under the federal securities laws and are subject to regulation by the SEC, the National Association of Securities Dealers, the New York Stock Exchange and state securities regulators. In connection with several, formal and informal, investigations by those agencies, BAS and BAI have received numerous requests, subpoenas and orders for documents, testimony and information in connection with various aspects of its regulated activities.
The SEC is currently conducting a formal investigation with respect to certain trading and research- related activities of BAS during the period 1999 through 2001. To date, the SEC staff has not indicated whether it intends to recommend any enforcement action in connection with these trading and research-related activities. On December 30, 2003, however, BAS was advised by the SEC staff that it does intend to recommend action against BAS with respect to alleged books and records violations related to the preservation and production of materials requested during the investigation of the trading and research-related activities. BAS is cooperating with the SEC staff with respect to the ongoing investigation and is also working with the staff to reach a resolution of the books and records matter.
9
Item 4. SUBMISSION OF MATTERS TO A VOTE OF SECURITY HOLDERS
There were no matters submitted to a vote of stockholders during the quarter ended December 31, 2003.2004.
Item 4A. EXECUTIVE OFFICERS OF THE REGISTRANT
Pursuant to the Instructions to Form 10-K and Item 401(b) of Regulation S-K, the name, age and position of each current executive officer of the Corporation are listed below along with such officer’s business experience during the past five years. Officers are appointed annually by the Board of Directors at the meeting of directors immediately following the annual meeting of stockholders.
Amy Woods Brinkley, age 48, Chief49, Global Risk Officer.Executive. Ms. Brinkley was named to her present position in April 2002. From July 2001 to April 2002, she served as Chairman, Credit Policy and Deputy Corporate Risk Management Executive; from August 1999 to July 2001, she served as President, Consumer Products; and from 1993 to August 1999, she served as Marketing Group Executive. She first became an officer in 1979. She also serves as ChiefGlobal Risk OfficerExecutive and a director of Bank of America, N.A. and Fleet National Bank.
Edward J. Brown III,Alvaro G. de Molina, age 55,46, President, Global CorporateCapital Markets and Investment Banking. Mr. Brownde Molina was named to his present position in August 2000.April 2004. From September2000 to 2004, he served as Treasurer; from 1998 to August 2000, he served as President, Global Capital Raising and Global Capital Markets;Deputy Treasurer; and from June 19971992 to September 1998, he served as President, Global Finance.Balance Sheet Management Executive. He first became an officer in 1974.1989. He also serves as President, Global CorporateCapital Markets and Investment Banking and a director of Bank of America, N.A.
Richard M. DeMartini, age 51, President, Asset Management. Mr. DeMartini was named to his present position in February 2001. From January 1999 to February 2001, he served as Chairman, International Private Client Group, Morgan Stanley Dean Witter; and from March 1997 to January 1999, he served as President Individual Asset Management Group, Morgan Stanley Dean Witter. He first became an officer in February 2001. He also serves as President, Asset Management of Bank of America, N.A.Fleet National Bank.
Barbara J. Desoer, age 51, President, Consumer Products. Ms.52, Global Technology, Service and Fulfillment Executive. Ms Desoer was named to her present position in August 2004. From July 2001. From2001 to August 2004, she served as President, Consumer Products; from September 1999 to July 2001, she served as Director of Marketing; from May 1999 to September 1999, she served as Banking Group President, California Retail Bank; and from December 1996 to May 1999, she served as Regional Executive, California Retail Bank. She first became an officer in 1977. She also serves as President, Consumer ProductsGlobal Technology, Service and Fulfillment Executive and a director of Bank of America, N.A.
James H. Hance, Jr., age 59, Vice Chairman and Chief Financial Officer. Mr. Hance was named Chief Financial Officer in August 1988, and was named Vice Chairman in October 1993. He first became an officer in 1987. He also serves as a director of the Corporation and as Vice Chairman, Chief Financial Officer and a director of Bank of America, N.A.Fleet National Bank.
Kenneth D. Lewis, age 56,57, Chairman, President and Chief Executive Officer.Officer and President. Mr. Lewis was named Chairman and Chief Executive Officer in April 2001, and President in July 2004 and Chairman in February 2005. From April 2001 to April 2004, he served as Chairman; from January 1999. From1999 to April 2004, he served as President; from October 1998 to January 1999, he served as President, Consumer and Commercial Banking; from 1993 to October 1998, he served as President; and from October 1999 to April 2001, he served as Chief Operating Officer. He first became an officer in 1971. Mr. Lewis also serves as a director of the Corporation and as Chairman, President, Chief Executive Officer, President and a director of Bank of America, N.A. and Fleet National Bank.
Liam E. McGee, age 50, President, Global Consumer and Small Business Banking. Mr. McGee was named to his present position in August 2004. From August 2001 to August 2004, he served as President, Global Consumer Banking; from August 2000 to August 2001, he served as President, California; and from August 1998 to August 2000, he served as President, Southern California. He first became an officer in 1990. He also serves as President, Global Consumer and Small Business Banking and a director of Bank of America, N.A. and Fleet National Bank.
Brian T. Moynihan, age 46, President, Global Wealth and Investment Management. Mr. Moynihan was named to his present position in April 2004. Previously he held the following positions at FleetBoston Financial Corporation: from 1999 to April 2004, he served as Executive Vice President with responsibility for Brokerage and Wealth Management from 2000, and Regional Commercial Financial Services and Investment Management from May 2003. He first became an officer in 1993. He also serves as President, Global Wealth and Investment Management and a director of Bank of America, N.A. and Fleet National Bank.
Marc D. Oken, age 58, Chief Financial Officer. Mr. Oken was named to his current position in April 2004. From October 1998 to April 2004, he served as Principal Financial Executive. He first became an officer in 1989. He also serves as Chief Financial Officer and a director of Bank of America, N.A. and Fleet National Bank.
H. Jay Sarles, age 59, Vice Chairman. Mr. Sarles was named to his present position in April 2004. Previously he held the following positions at FleetBoston Financial Corporation: from 2002 to 2004, he served as Vice Chairman & Chief Administrative Officer; from 2001 to 2002, he served as Vice Chairman—Wholesale Banking; and from 1999 to 2001, he served as Vice Chairman and Chief Administrative Officer. He first became an officer in 1972. He also serves as a director of Bank of America, N.A. (USA) and Fleet Bank (RI), National Association.
R. Eugene Taylor, age 56, President, ConsumerGlobal Business and Commercial Banking.Financial Services. Mr. Taylor was named to his present position in June 2000. From June 2000 to August 2004, he served as President, Consumer and Commercial Banking; from February 2000 to June 2000, he served as President, Central Region; from October 1998 to June 2000, he served as President, West Region; and from December 1997 to October 1998, he served as President, Florida. He first became an officer in 1970. He also serves as President, ConsumerGlobal Business and Commercial BankingFinancial Services and a director of Bank of America, N.A. and Fleet National Bank.
10
PART II
Item 5. MARKET FOR REGISTRANT’S COMMON EQUITY AND RELATED STOCK HOLDER MATTERS
The principal market on which the Common Stock is traded is the New York Stock Exchange. The Common Stock is also listed on the London Stock Exchange and the Pacific Stock Exchange, and certain shares are listed on the Tokyo Stock Exchange. The following table sets forth the high and low closing sales prices of the Common Stock on the New York Stock Exchange for the periods indicated:
| Quarter | High | Low | |||||||||||
| 2004 | first | $ | 41.38 | $39.15 | |||||||||
| second | 42.72 | 38.96 | |||||||||||
| Quarter | High | Low | third | 44.98 | 41.81 | ||||||||
| fourth | 47.44 | 43.62 | |||||||||||
| 2003 | first | $72.48 | $65.63 | first | 36.24 | 32.82 | |||||||
| second | 79.89 | 68.00 | second | 39.95 | 34.00 | ||||||||
| third | 83.53 | 74.87 | third | 41.77 | 37.44 | ||||||||
| fourth | 82.50 | 72.85 | fourth | 41.25 | 36.43 | ||||||||
| 2002 | first | 69.18 | 58.85 | ||||||||||
| second | 76.90 | 67.45 | |||||||||||
| third | 71.94 | 57.90 | |||||||||||
| fourth | 71.42 | 54.15 | |||||||||||
The above table has been adjusted to reflect the August 27, 2004 2 for 1 stock split.
As of February 27, 2004,28, 2005, there were 226,7964,053,638,403 record holders of Common Stock. During 20022003 and 2003,2004, the Corporation paid dividends on the Common Stock on a quarterly basis. The following table sets forth dividends paid per share of Common Stock for the periods indicated:
| Quarter | Dividend | |||||||
| 2004 | first | $.40 | ||||||
| second | .40 | |||||||
| third | .45 | |||||||
| Quarter | Dividend | fourth | .45 | |||||
| 2003 | first | $.64 | first | .32 | ||||
| second | .64 | second | .32 | |||||
| third | .80 | third | .40 | |||||
| fourth | .80 | fourth | .40 | |||||
| 2002 | first | .60 | ||||||
| second | .60 | |||||||
| third | .60 | |||||||
| fourth | .64 | |||||||
The above table has been adjusted to reflect the August 27, 2004 2 for 1 stock split.
For additional information regarding the Corporation’s ability to pay dividends, see “Government Supervision and Regulation – Distributions”. In addition, and Note 1514 of the Notes in the 2003 Annual ReportConsolidated Financial Statements on page 139 which is incorporated herein by reference.
InformationFor information on the Corporation’s equity compensation plans, included undersee Note 1716 of the Notes inConsolidated Financial Statements on page 147 which is incorporated herein by reference.
See Note 13 of the Consolidated Financial Statements on page 135 for information on the monthly share repurchases activity for the three and twelve months ended December 31, 2004, 2003 Annual Reportand 2002, including total common shares repurchased and announced programs, weighted average per share price and the remaining buy back authority under announced programs which is incorporated herein by reference.
Item 6. SELECTED FINANCIAL DATA
The information set forth inSee Table 1 in “Management’s Discussion and Analysis of the MD&AFinancial Condition and Results of Operations” on page 14 and Table XIXVII of the Statistical Financial Information of the 2003 Annual Report ison page 80 which are incorporated herein by reference.
Item 7. MANAGEMENT’S DISCUSSION AND ANALYSIS OF FINANCIAL CONDITION AND RESULTS OF OPERATIONS
This report contains certain statements that are forward-looking within the meaning of the Private Securities Litigation Reform Act of 1995. These statements are not guarantees of future performance and involve certain risks, uncertainties and assumptions that are difficult to predict. Actual outcomes and results may differ materially from those expressed in, or implied by, our forward-looking statements. Words such as “expects,” “anticipates,” “believes,” “estimates” and other similar expressions or future or conditional verbs such as “will,” “should,” “would” and “could” are intended to identify such forward-looking statements. Readers of the Annual Report of Bank of America Corporation and its subsidiaries (the Corporation) should not rely solely on the forward-looking statements and should consider all uncertainties and risks throughout this report. The information set forthstatements are representative only as of the date they are made, and the Corporation undertakes no obligation to update any forward-looking statement.
Possible events or factors that could cause results or performance to differ materially from those expressed in our forward-looking statements include the following: changes in general economic conditions and economic conditions in the 2003 Annual Reportgeographic regions and industries in which the Corporation operates which may affect, among other things, the level of nonperforming assets, charge-offs and provision expense; changes in the MD&Ainterest rate environment which may reduce interest margins and impact funding sources; changes in foreign exchange rates; adverse movements and volatility in debt and equity capital markets; changes in market rates and prices which may adversely impact the value of financial products including securities, loans, deposits, debt and derivative financial instruments, and other similar financial instruments; political conditions and related actions by the United States abroad which may adversely affect the Corporation’s businesses and economic conditions as a whole; liabilities resulting from litigation and regulatory investigations, including costs, expenses, settlements and judgments; changes in domestic or foreign tax laws, rules and regulations as well as Internal Revenue Service (IRS) or other governmental agencies’
interpretations thereof; various monetary and fiscal policies and regulations, including those determined by the Board of Governors of the Federal Reserve System (FRB), the Office of the Comptroller of Currency, the Federal Deposit Insurance Corporation and state regulators; competition with other local, regional and international banks, thrifts, credit unions and other nonbank financial institutions; ability to grow core businesses; ability to develop and introduce new banking-related products, services and enhancements, and gain market acceptance of such products; mergers and acquisitions and their integration into the Corporation; decisions to downsize, sell or close units or otherwise change the business mix of the Corporation; and management’s ability to manage these and other risks.
The Corporation, headquartered in Charlotte, North Carolina, operates in 29 states and the District of Columbia and has offices located in 43 foreign countries. The Corporation provides a diversified range of banking and nonbanking financial services and products both domestically and internationally through four business segments. In order to more closely align with the scope of our businesses, we have renamed each of our business segments.Consumer and Small Business Banking has been renamedGlobal Consumer and Small Business Banking,Commercial Banking is now calledGlobal Business and Financial Services,Global Corporate and Investment Banking is now calledGlobal Capital Markets and Investment Banking, andWealth and Investment Management has been renamedGlobal Wealth and Investment Management.
At December 31, 2004, the Corporation had $1.1 trillion in assets and approximately 176,000 full-time equivalent employees. Notes to Consolidated Financial Statements referred to in Management’s Discussion and Analysis of Results of Operations and Financial Condition are incorporated by reference hereininto Management’s Discussion and Analysis of Results of Operations and Financial Condition. Certain prior period amounts have been reclassified to conform to current period presentation.
On April 1, 2004, we completed our merger with FleetBoston Financial Corporation (FleetBoston) (the Merger) after obtaining final shareholder and regulatory approvals. The Merger was accounted for under the purchase method of accounting. Accordingly, results for 2004 included nine months of combined company results. Results for 2003 and at December 31, 2003 excluded FleetBoston. For informational and comparative purposes, certain tables have been expanded to include a column entitled FleetBoston, April 1, 2004. This column represents balances acquired from FleetBoston as of April 1, 2004, including purchase accounting adjustments.
On October 15, 2004, we acquired 100 percent of National Processing, Inc. (NPC), for $1.4 billion in cash, creating the second largest merchant processor in the United States.
During the second quarter of 2004, our Board of Directors (the Board) approved a 2-for-1 stock split in the form of a common stock dividend and increased the quarterly cash dividend 12.5 percent from $0.40 to $0.45 per post-split share. The common stock dividend was effective August 27, 2004 to common shareholders of record on August 6, 2004 and the cash dividend was effective September 24, 2004 to common shareholders of record on September 3, 2004. All prior period common share and related per common share information has been restated to reflect the 2-for-1 stock split.
Economic Overview
In 2004, U.S. economic performance was solid, creating a generally healthy environment for banking, while global growth exceeded expectations. In the U.S., real Gross Domestic Product (GDP) grew rapidly, as the negative impact of higher oil prices was more than offset by sound fundamentals and the FRB’s accommodative monetary policy. Consumer spending continued to rise, while consumer credit quality remained healthy. Sustained gains in productivity contributed to rising corporate profits and cash flows. Businesses rebuilt inventories and increased capital spending, particularly for information processing equipment and software. Although overall corporate loan demand remained soft, corporate credit quality improved as the economy strengthened in the second half of the year. Employment grew and the unemployment rate receded, although the pace of job creation was soft relative to GDP growth, reflecting business efforts to constrain operating costs. Housing activity rose to historic levels. Inflation rose modestly but stayed low relative to historic standards. The FRB raised the federal funds rate target from one percent at mid-year to 2.25 percent, but the increases were widely anticipated and bond yields remained low, generating a flatter yield curve.
Performance Overview
For the second year in a row, we achieved record earnings. Net Income totaled $14.1 billion, or $3.69 per diluted common share in 2004, 31 percent and three percent increases, respectively, from $10.8 billion, or $3.57 per diluted common share in 2003.
Business Segment Total Revenue and Net Income
| Total Revenue | Net Income | |||||||||||||
| (Dollars in millions) | 2004 | 2003 | 2004 | 2003 | ||||||||||
Global Consumer and Small Business Banking | $ | 26,857 | $ | 20,930 | $ | 6,548 | $ | 5,706 | ||||||
Global Business and Financial Services | 6,722 | 4,517 | 2,833 | 1,471 | ||||||||||
Global Capital Markets and Investment Banking | 9,049 | 8,334 | 1,950 | 1,794 | ||||||||||
Global Wealth and Investment Management | 5,918 | 4,030 | 1,584 | 1,234 | ||||||||||
All Other | 1,064 | 746 | 1,228 | 605 | ||||||||||
Total FTE basis(1) | 49,610 | 38,557 | 14,143 | 10,810 | ||||||||||
FTE adjustment(1) | (716 | ) | (643 | ) | — | — | ||||||||
Total | $ | 48,894 | $ | 37,914 | $ | 14,143 | $ | 10,810 | ||||||
| (1) | Total revenue for the segments andAll Other is on a fully taxable-equivalent (FTE) basis. For more information on a FTE basis, see Supplemental Financial Data beginning on page 15. |
Global Consumer and Small Business Banking
Net Income increased $842 million, or 15 percent, to $6.5 billion in 2004, including the $1.1 billion impact of the Merger. Driving this increase was the $5.2 billion increase in Net Interest Income and a $1.5 billion increase in Card Income. Partially offsetting this was the $3.0 billion increase in Noninterest Expense, a $1.7 billion increase in Provision for Credit Losses and a $1.5 billion decrease in Mortgage Banking Income. The Provision for Credit Losses increased $1.7 billion to $3.3 billion, including higher credit card net charge-offs of $791 million, of which $320 million was attributed to the addition of the FleetBoston credit card portfolio. For more information onGlobal Consumer and Small Business Banking, see page 18.
Global Business and Financial Services
Net Income increased $1.4 billion, or 93 percent, to $2.8 billion for 2004 including the $824 million impact of the addition of FleetBoston. Both average Loans and Leases, and Deposits grew significantly, with increases of $36.3 billion, or 39 percent, and $21.6 billion, or 69 percent, respectively. Impacting these increases were the $29.3 billion increase in average Loans and Leases and the $17.6 billion increase in average Deposits related to the addition of FleetBoston. Also driving the improved results was the $699 million decrease in Provision for Credit Losses, driven by lower net charge-offs and the continued credit quality improvement in the commercial portfolio. For more information onGlobal Business and Financial Services, see page 24.
Global Capital Markets and Investment Banking
Net Income increased $156 million, or nine percent, to $2.0 billion in 2004. Contributing to the increase in Net Income was a reduction of $762 million in the Provision for Credit Losses and increases in Trading Account Profits and Investment Banking Income of $441 million and $147 million, respectively. Notable improvements in credit quality in the large corporate portfolio and a 71 percent reduction in net charge-offs drove the $762 million decrease in Provision for Credit Losses. Partially offsetting these increases were the $460 million impact of charges taken for litigation matters in 2004, an increase of $279 million of incentive compensation for market-based activities and the $143 million impact of the charges taken for the mutual fund matter. For more information onGlobal Capital Markets and Investment Banking, see page 26.
Global Wealth and Investment Management
Net Income increased $350 million, or 28 percent, to $1.6 billion in 2004. The increase in Net Income was driven by the $253 million impact of the addition of FleetBoston and growth in both average Loans and Leases, and Deposits. Total assets under management increased $154.8 billion, or 52 percent, to $451.5
billion at December 31, 2004, due to the addition of $148.9 billion of FleetBoston assets under management and increased market valuation partially offset by outflows, primarily in money market products. For more information onGlobal Wealth and Investment Management, see page 29.
All Other
Net Income increased $623 million, or 103 percent, to $1.2 billion in 2004. This increase was driven by a $1.1 billion increase in Gains on Sales of Debt Securities. In addition, Total Revenue increased $318 million, or 43 percent, to $1.1 billion due to improvements in bothLatin America andEquity Investments. Partially offsetting these increases was a $607 million increase in Noninterest Expense, driven by $618 million of Merger and Restructuring Charges. For more information onAll Other, see page 31.
Financial Highlights
Net Interest Income
Net Interest Income on a FTE basis increased $7.4 billion to $29.5 billion in 2004. This increase was driven by the impact of the Merger, higher asset and liability management (ALM) portfolio levels (primarily consisting of securities and whole loan mortgages), the impact of higher rates, growth in consumer loan levels (primarily credit card and home equity) and higher core deposit funding levels. Partially offsetting these increases were reductions in the large corporate and foreign loan balances, lower trading-related contributions, lower mortgage warehouse levels and the continued runoff of previously exited consumer businesses. The net interest yield on a FTE basis declined 14 basis points (bps) to 3.26 percent due to the negative impact of increased trading-related balances, which have a lower yield than other earning assets. For more information on Net Interest Income on a FTE basis, see Table I on page 75.
Noninterest Income
Noninterest Income
| (Dollars in millions) | 2004 | 2003 | ||||
Service charges | $ | 6,989 | $ | 5,618 | ||
Investment and brokerage services | 3,627 | 2,371 | ||||
Mortgage banking income | 414 | 1,922 | ||||
Investment banking income | 1,886 | 1,736 | ||||
Equity investment gains | 861 | 215 | ||||
Card income | 4,588 | 3,052 | ||||
Trading account profits | 869 | 409 | ||||
Other income | 863 | 1,127 | ||||
Total noninterest income | $ | 20,097 | $ | 16,450 | ||
Noninterest Income increased $3.6 billion to $20.1 billion in 2004, due primarily to the addition of FleetBoston, which contributed $3.8 billion of Noninterest Income.
For more information on Noninterest Income, see Business Segment Operations beginning on page 17.
Gains on Sales of Debt Securities
Gains on Sales of Debt Securities in 2004 were $2.1 billion compared to $941 million in 2003, as we continued to reposition the ALM portfolio in response to interest rate fluctuations and to manage mortgage prepayment risk. For more information on Gains on Sales of Debt Securities, see Market Risk Management beginning on page 61.
Provision for Credit Losses
The Provision for Credit Losses decreased $70 million to $2.8 billion in 2004 driven by lower commercial net charge-offs of $748 million and continued improvements in credit quality in the commercial loan portfolio. Offsetting these decreases were increases in the Provision for Credit Losses in our consumer credit card portfolio. These increases included higher credit card net charge-offs of $791 million, of which $320 million was attributed to the addition of the FleetBoston credit card portfolio. Organic growth, overall seasoning of credit card accounts, the return of securitized loans to the balance sheet, and increases in minimum payment requirements drove higher net charge-offs and Provision for Credit Losses. For more information on credit quality, see Credit Risk Management beginning on page 43.
Noninterest Expense
Noninterest Expense
| (Dollars in millions) | 2004 | 2003 | ||||
Personnel | $ | 13,473 | $ | 10,446 | ||
Occupancy | 2,379 | 2,006 | ||||
Equipment | 1,214 | 1,052 | ||||
Marketing | 1,349 | 985 | ||||
Professional fees | 836 | 844 | ||||
Amortization of intangibles | 664 | 217 | ||||
Data processing | 1,325 | 1,104 | ||||
Telecommunications | 730 | 571 | ||||
Other general operating | 4,439 | 2,930 | ||||
Merger and restructuring charges | 618 | — | ||||
Total noninterest expense | $ | 27,027 | $ | 20,155 | ||
Noninterest Expense increased $6.9 billion to $27.0 billion in 2004, due primarily to the addition of FleetBoston, which contributed $5.0 billion of Noninterest Expense.
| • | Other General Operating Expense increased $1.5 billion related to the $904 million impact of the addition of FleetBoston, $370 million of litigation expenses incurred during 2004 and the $285 million related to the mutual fund settlement (net of a $90 million reserve established in 2003). This net settlement expense was divided equally betweenGlobal Capital Markets and Investment Bankingand Global Wealth and Investment Management for business segment reporting purposes. |
For more information on Noninterest Expense, see Business Segment Operations beginning on page 17.
Income Tax Expense
Income Tax Expense was $7.1 billion, reflecting an effective tax rate of 33.4 percent, in 2004 compared to $5.1 billion and 31.8 percent, respectively, in 2003. The difference in the effective tax rate between years resulted primarily from the application of purchase accounting to certain leveraged leases acquired in the Merger, an increase in state tax expense generally related to higher tax rates in the Northeast and the reduction in 2003 of Income Tax Expense resulting from a tax settlement with the IRS. For more information on Income Tax Expense, see Note 17 of the Consolidated Financial Statements.
Assets
Average Loans and Leases increased $116.5 billion, or 33 percent, in 2004. Of this increase, $88.9 billion related to the addition of FleetBoston. The remaining increase was driven by growth in our residential mortgage and consumer credit card portfolios of $16.1 billion and $10.1 billion, respectively. Average Available-for-sale (AFS) Securities increased $79.7 billion, or 114 percent, as a result of investing excess cash from deposit growth and repositioning our ALM portfolio. Additionally, average trading-related assets increased $55.0 billion as we expanded our trading book to accommodate the needs of our clients. For more information, see Table I on page 75.
Liabilities and Shareholders’ Equity
Average core deposits increased $130.7 billion, or 36 percent. Of this increase, $95.6 billion is attributable to the addition of FleetBoston. The remaining increase was attributable to organic growth which resulted from our continued improvements in customer satisfaction, new product offerings and our account growth efforts. At December 31, 2004, our Tier 1 Capital ratio was 8.10 percent, compared to a ratio of 7.85 percent at December 31, 2003. For more information, see Table I on page 75 and Note 14 of the Consolidated Financial Statements.
FleetBoston Merger
Pursuant to the Agreement and Plan of Merger, dated October 27, 2003, between the Corporation and FleetBoston (the Merger Agreement), we acquired 100 percent of the outstanding stock of FleetBoston on April 1, 2004. The Merger created a banking institution with leading market shares throughout the Northeast, Southeast, Southwest and West regions of the United States. FleetBoston’s results of operations were included in the Corporation’s results beginning April 1, 2004.
As provided by the Merger Agreement, approximately 1.069 billion shares of FleetBoston common stock were exchanged for approximately 1.187 billion shares of the Corporation’s common stock, as adjusted for the stock split. At the date of the Merger, this represented approximately 29 percent of the Corporation’s outstanding common stock. FleetBoston shareholders also received cash of $4 million in lieu of any fractional shares of the Corporation’s common stock that would have otherwise been issued on April 1, 2004. Holders of FleetBoston preferred stock received 1.1 million shares of the Corporation’s preferred stock. The purchase price was adjusted to reflect the effect of the 15.7 million shares of FleetBoston common stock that we already owned.
In connection with the Merger, we implemented a plan to integrate our operations with FleetBoston’s. During 2004, including an infrastructure initiative, $618 million was recorded as Merger and Restructuring Charges and $658 million was recorded as an adjustment to Goodwill related to these activities. During 2004, our integration activities progressed according to schedule. We rebranded all banking centers in the former FleetBoston franchise, as well as a majority of outstanding credit cards. In addition, we began to rollout customer service platforms, includingPremier Banking, to the Northeast. We also completed several key systems conversions necessary for full integration. For more information on the Merger, see Note 2 of the Consolidated Financial Statements.
Table 1
Five-Year Summary of Selected Financial Data(1)
| (Dollars in millions, except per share information) | 2004 | 2003 | 2002 | 2001 | 2000 | |||||||||||||||
Income statement | ||||||||||||||||||||
Net interest income | $ | 28,797 | $ | 21,464 | $ | 20,923 | $ | 20,290 | $ | 18,349 | ||||||||||
Noninterest income | 20,097 | 16,450 | 13,580 | 14,348 | 14,582 | |||||||||||||||
Total revenue | 48,894 | 37,914 | 34,503 | 34,638 | 32,931 | |||||||||||||||
Provision for credit losses | 2,769 | 2,839 | 3,697 | 4,287 | 2,535 | |||||||||||||||
Gains on sales of debt securities | 2,123 | 941 | 630 | 475 | 25 | |||||||||||||||
Noninterest expense | 27,027 | 20,155 | 18,445 | 20,709 | 18,633 | |||||||||||||||
Income before income taxes | 21,221 | 15,861 | 12,991 | 10,117 | 11,788 | |||||||||||||||
Income tax expense | 7,078 | 5,051 | 3,742 | 3,325 | 4,271 | |||||||||||||||
Net income | 14,143 | 10,810 | 9,249 | 6,792 | 7,517 | |||||||||||||||
Average common shares issued and outstanding (in thousands) | 3,758,507 | 2,973,407 | 3,040,085 | 3,189,914 | 3,292,797 | |||||||||||||||
Average diluted common shares issued and outstanding (in thousands) | 3,823,943 | 3,030,356 | 3,130,935 | 3,251,308 | 3,329,858 | |||||||||||||||
Performance ratios | ||||||||||||||||||||
Return on average assets | 1.35 | % | 1.44 | % | 1.41 | % | 1.05 | % | 1.12 | % | ||||||||||
Return on average common shareholders’ equity | 16.83 | 21.99 | 19.44 | 13.96 | 15.96 | |||||||||||||||
Total equity to total assets (at year end) | 8.97 | 6.67 | 7.78 | 7.87 | 7.45 | |||||||||||||||
Total average equity to total average assets | 8.06 | 6.57 | 7.28 | 7.55 | 7.03 | |||||||||||||||
Dividend payout | 45.67 | 39.58 | 40.07 | 53.44 | 45.02 | |||||||||||||||
Per common share data | ||||||||||||||||||||
Earnings | $ | 3.76 | $ | 3.63 | $ | 3.04 | $ | 2.13 | $ | 2.28 | ||||||||||
Diluted earnings | 3.69 | 3.57 | 2.95 | 2.09 | 2.26 | |||||||||||||||
Dividends paid | 1.70 | 1.44 | 1.22 | 1.14 | 1.03 | |||||||||||||||
Book value | 24.56 | 16.63 | 16.75 | 15.54 | 14.74 | |||||||||||||||
Average balance sheet | ||||||||||||||||||||
Total loans and leases | $ | 472,645 | $ | 356,148 | $ | 336,819 | $ | 365,447 | $ | 392,622 | ||||||||||
Total assets | 1,044,660 | 749,056 | 653,774 | 644,887 | 670,078 | |||||||||||||||
Total deposits | 551,559 | 406,233 | 371,479 | 362,653 | 353,294 | |||||||||||||||
Long-term debt | 93,330 | 68,432 | 66,045 | 69,622 | 70,293 | |||||||||||||||
Common shareholders’ equity | 83,953 | 49,148 | 47,552 | 48,609 | 47,057 | |||||||||||||||
Total shareholders’ equity | 84,183 | 49,204 | 47,613 | 48,678 | 47,132 | |||||||||||||||
Capital ratios (at year end) | ||||||||||||||||||||
Risk-based capital: | ||||||||||||||||||||
Tier 1 | 8.10 | % | 7.85 | % | 8.22 | % | 8.30 | % | 7.50 | % | ||||||||||
Total | 11.63 | 11.87 | 12.43 | 12.67 | 11.04 | |||||||||||||||
Leverage | 5.82 | 5.73 | 6.29 | 6.55 | 6.11 | |||||||||||||||
Market price per share of common stock | ||||||||||||||||||||
Closing | $ | 46.99 | $ | 40.22 | $ | 34.79 | $ | 31.48 | $ | 22.94 | ||||||||||
High closing | 47.44 | 41.77 | 38.45 | 32.50 | 29.63 | |||||||||||||||
Low closing | 38.96 | 32.82 | 27.08 | 23.38 | 19.00 | |||||||||||||||
| (1) | As a result of the adoption of Statement of Financial Accounting Standards (SFAS) No. 142 “Goodwill and Other Intangible Assets” (SFAS 142) on January 1, 2002, we no longer amortizes Goodwill. Goodwill amortization expense was $662 and $635 in 2001 and 2000, respectively. |
Supplemental Financial Data
Table 2 provides a reconciliation of the supplemental financial data mentioned below with GAAP financial measures. Other companies may define or calculate supplemental financial data differently.
Operating Basis Presentation
In managing our business, we may at times look at performance excluding certain non-recurring items. For example, as an alternative to Net Income, we view results on an operating basis, which represents Net Income excluding Merger and Restructuring Charges. The operating basis of presentation is not defined by accounting principles generally accepted in the United States (GAAP). We believe that the exclusion of Merger and Restructuring Charges, which represent events outside our normal operations, provides a meaningful period-to-period comparison and is more reflective of normalized operations.
Net Interest Income - FTE Basis
In addition, we view Net Interest Income and related ratios and analysis (i.e. efficiency ratio, net interest yield and operating leverage) on a FTE basis. Although this is a non-GAAP measure, we believe managing the business with Net Interest Income on a FTE basis provides a more accurate picture of the interest margin for comparative purposes. To derive the FTE basis, Net Interest Income is adjusted to reflect tax-exempt interest income on an equivalent before tax basis with a corresponding increase in Income Tax Expense. For purposes of this calculation, we use the federal statutory tax rate of 35 percent. This measure ensures comparability of Net Interest Income arising from both taxable and tax-exempt sources.
Performance Measures
As mentioned above, certain performance measures including the efficiency ratio, net interest yield, and operating leverage utilize Net Interest Income (and thus Total Revenue) on a FTE basis. The efficiency ratio measures the costs expended to generate a dollar of revenue, and net interest yield evaluates how many basis points we are earning over the cost of funds. Operating leverage measures the total percentage revenue growth minus the total percentage expense growth for the corresponding period. During our annual integrated plan process, we set operating leverage and efficiency targets for the Corporation and each line of business. Targets vary by year and by business and are based on a variety of factors, including: maturity of the business, investment appetite, competitive environment, market factors, and other items (i.e. risk appetite). The aforementioned performance measures and ratios, earnings per common share (EPS), return on average assets, return on average common shareholders’ equity and dividend payout ratio, as well as those measures discussed more fully below are presented in Table 2, Supplemental Financial Data and Reconciliations to GAAP Financial Measures.
Return on Average Equity and Shareholder Value Added
We also evaluate our business based upon return on average equity (ROE) and shareholder value added (SVA) measures. ROE and SVA, both utilize non-GAAP allocation methodologies. ROE measures the earnings contribution of a unit as a percentage of the Shareholders’ Equity allocated to that unit. SVA is defined as cash basis earnings on an operating basis less a charge for the use of capital. For more information, see Basis of Presentation on page 18. Both measures are used to evaluate the Corporation’s use of equity (i.e. capital) at the individual unit level and are integral components in the analytics for resource allocation. Using SVA as a performance measure places specific focus on whether incremental investments generate returns in excess of the costs of capital associated with those investments. Investments and initiatives are analyzed using SVA during the annual planning process for maximizing allocation of corporate resources. In addition, profitability, relationship and investment models all use SVA and ROE as key measures to support our overall growth goal.
Table 2
Supplemental Financial Data and Reconciliations to GAAP Financial Measures
| (Dollars in millions, except per share information) | 2004 | 2003 | 2002 | 2001 | 2000 | |||||||||||||||
Operating basis(1,2) | ||||||||||||||||||||
Operating earnings | $ | 14,554 | $ | 10,810 | $ | 9,249 | $ | 8,042 | $ | 7,863 | ||||||||||
Operating earnings per common share | 3.87 | 3.63 | 3.04 | 2.52 | 2.39 | |||||||||||||||
Diluted operating earnings per common share | 3.80 | 3.57 | 2.95 | 2.47 | 2.36 | |||||||||||||||
Shareholder value added | 5,983 | 5,621 | 3,760 | 3,087 | 3,081 | |||||||||||||||
Return on average assets | 1.39 | % | 1.44 | % | 1.41 | % | 1.25 | % | 1.17 | % | ||||||||||
Return on average common shareholders’ equity | 17.32 | 21.99 | 19.44 | 16.53 | 16.70 | |||||||||||||||
Efficiency ratio (fully taxable-equivalent basis) | 53.23 | 52.27 | 52.56 | 55.47 | 54.38 | |||||||||||||||
Dividend payout ratio | 44.38 | 39.58 | 40.07 | 45.13 | 43.04 | |||||||||||||||
Fully taxable-equivalent basis data | ||||||||||||||||||||
Net interest income | $ | 29,513 | $ | 22,107 | $ | 21,511 | $ | 20,633 | $ | 18,671 | ||||||||||
Total revenue | 49,610 | 38,557 | 35,091 | 34,981 | 33,253 | |||||||||||||||
Net interest yield | 3.26 | % | 3.40 | % | 3.77 | % | 3.68 | % | 3.20 | % | ||||||||||
Efficiency ratio | 54.48 | 52.27 | 52.56 | 59.20 | 56.03 | |||||||||||||||
Reconciliation of net income to operating earnings | ||||||||||||||||||||
Net income | $ | 14,143 | $ | 10,810 | $ | 9,249 | $ | 6,792 | $ | 7,517 | ||||||||||
Merger and restructuring charges | 618 | — | — | 1,700 | 550 | |||||||||||||||
Related income tax benefit | (207 | ) | — | — | (450 | ) | (204 | ) | ||||||||||||
Operating earnings | $ | 14,554 | $ | 10,810 | $ | 9,249 | $ | 8,042 | $ | 7,863 | ||||||||||
Reconciliation of EPS to operating EPS | ||||||||||||||||||||
Earnings per common share | $ | 3.76 | $ | 3.63 | $ | 3.04 | $ | 2.13 | $ | 2.28 | ||||||||||
Effect of merger and restructuring charges, net of tax benefit | 0.11 | — | — | 0.39 | 0.11 | |||||||||||||||
Operating earnings per common share | $ | 3.87 | $ | 3.63 | $ | 3.04 | $ | 2.52 | $ | 2.39 | ||||||||||
Reconciliation of diluted EPS to diluted operating EPS | ||||||||||||||||||||
Diluted earnings per common share | $ | 3.69 | $ | 3.57 | $ | 2.95 | $ | 2.09 | $ | 2.26 | ||||||||||
Effect of merger and restructuring charges, net of tax benefit | 0.11 | — | — | 0.38 | 0.10 | |||||||||||||||
Diluted operating earnings per common share | $ | 3.80 | $ | 3.57 | $ | 2.95 | $ | 2.47 | $ | 2.36 | ||||||||||
Reconciliation of net income to shareholder value added | ||||||||||||||||||||
Net income | $ | 14,143 | $ | 10,810 | $ | 9,249 | $ | 6,792 | $ | 7,517 | ||||||||||
Amortization of intangibles | 664 | 217 | 218 | 878 | 864 | |||||||||||||||
Merger and restructuring charges, net of tax benefit | 411 | — | — | 1,250 | 346 | |||||||||||||||
Cash basis earnings on an operating basis | 15,218 | 11,027 | 9,467 | 8,920 | 8,727 | |||||||||||||||
Capital charge | (9,235 | ) | (5,406 | ) | (5,707 | ) | (5,833 | ) | (5,646 | ) | ||||||||||
Shareholder value added | $ | 5,983 | $ | 5,621 | $ | 3,760 | $ | 3,087 | $ | 3,081 | ||||||||||
Reconciliation of return on average assets to operating return on average assets | ||||||||||||||||||||
Return on average assets | 1.35 | % | 1.44 | % | 1.41 | % | 1.05 | % | 1.12 | % | ||||||||||
Effect of merger and restructuring charges, net of tax benefit | 0.04 | — | — | 0.20 | 0.05 | |||||||||||||||
Operating return on average assets | 1.39 | % | 1.44 | % | 1.41 | % | 1.25 | % | 1.17 | % | ||||||||||
Reconciliation of return on average common shareholders’ equity to operating return on average common shareholders’ equity | ||||||||||||||||||||
Return on average common shareholders’ equity | 16.83 | % | 21.99 | % | 19.44 | % | 13.96 | % | 15.96 | % | ||||||||||
Effect of merger and restructuring charges, net of tax benefit | 0.49 | — | — | 2.57 | 0.74 | |||||||||||||||
Operating return on average common shareholders’ equity | 17.32 | % | 21.99 | % | 19.44 | % | 16.53 | % | 16.70 | % | ||||||||||
Reconciliation of efficiency ratio to operating efficiency ratio (fully taxable-equivalent basis) | ||||||||||||||||||||
Efficiency ratio | 54.48 | % | 52.27 | % | 52.56 | % | 59.20 | % | 56.03 | % | ||||||||||
Effect of merger and restructuring charges, net of tax benefit | (1.25 | ) | — | — | (3.73 | ) | (1.65 | ) | ||||||||||||
Operating efficiency ratio | 53.23 | % | 52.27 | % | 52.56 | % | 55.47 | % | 54.38 | % | ||||||||||
Reconciliation of dividend payout ratio to operating dividend payout ratio | ||||||||||||||||||||
Dividend payout ratio | 45.67 | % | 39.58 | % | 40.07 | % | 53.44 | % | 45.02 | % | ||||||||||
Effect of merger and restructuring charges, net of tax benefit | (1.29 | ) | — | — | (8.31 | ) | (1.98 | ) | ||||||||||||
Operating dividend payout ratio | 44.38 | % | 39.58 | % | 40.07 | % | 45.13 | % | 43.04 | % | ||||||||||
| (1) | Operating basis excludes Merger and Restructuring Charges. Merger and Restructuring Charges were $618 and $550 in 2004 and 2000, respectively. Merger and Restructuring Charges in 2001 represented Provision for Credit Losses of $395 and Noninterest Expense of $1,305, both of which were related to the exit of certain consumer finance businesses. |
| (2) | As a result of the adoption of SFAS 142 on January 1, 2002, we no longer amortize Goodwill. Goodwill amortization expense was $662 and $635 in 2001 and 2000, respectively. |
Core Net Interest Income
In addition, we review core net interest income which adjusts reported Net Interest Income on a FTE basis for the impact of trading-related activities. As discussed in theGlobal Capital Markets and Investment Banking business segment section beginning on page 26, we evaluate our trading results and strategies based on total trading-related revenue, calculated by combining trading-related Net Interest Income with Trading Account Profits. We also adjust for loans that we originated and sold into revolving credit card, home equity line and commercial loan securitizations. Noninterest Income, rather than Net Interest Income and Provision for Credit Losses, is recorded for assets that have been securitized as we are compensated for servicing the securitized assets and record servicing income and gains or losses on securitizations, where appropriate.An analysis of core net interest income, earning assets and yields, which excludes these two non-core items from reported Net Interest Income on a FTE basis, is shown below.
Table 3
Core Net Interest Income
| (Dollars in millions) | 2004 | 2003 | 2002 | |||||||||
Net interest income | ||||||||||||
As reported (fully taxable-equivalent basis) | $ | 29,513 | $ | 22,107 | $ | 21,511 | ||||||
Trading-related net interest income | (2,039 | ) | (2,239 | ) | (1,977 | ) | ||||||
Impact of revolving securitizations | 931 | 313 | 517 | |||||||||
Core net interest income | $ | 28,405 | $ | 20,181 | $ | 20,051 | ||||||
Average earning assets | ||||||||||||
As reported | $ | 905,302 | $ | 649,548 | $ | 570,530 | ||||||
Trading-related earning assets | (227,861 | ) | (172,825 | ) | (121,291 | ) | ||||||
Impact of revolving securitizations | 10,181 | 3,342 | 5,943 | |||||||||
Core average earning assets | $ | 687,622 | $ | 480,065 | $ | 455,182 | ||||||
Net interest yield on earning assets | ||||||||||||
As reported (fully taxable-equivalent basis) | 3.26 | % | 3.40 | % | 3.77 | % | ||||||
Impact of trading-related activities | 0.80 | 0.76 | 0.58 | |||||||||
Impact of revolving securitizations | 0.06 | 0.03 | 0.05 | |||||||||
Core net interest yield on earning assets | 4.12 | % | 4.19 | % | 4.40 | % | ||||||
Core net interest income increased $8.2 billion for 2004. Approximately half of the increase was due to the Merger. Other activities within the portfolio affecting core net interest income were higher ALM portfolio levels, the impact of higher rates, higher consumer loan levels (primarily credit card loans and home equity lines) and higher core deposit funding levels, partially offset by reductions in the large corporate and foreign loan balances, and lower mortgage warehouse levels.
Core average earning assets increased $207.6 billion primarily due to higher ALM levels, (primarily securities and mortgages) and higher levels of consumer loans (primarily credit card loans and home equity lines). The increases in these assets were due to both the Merger and organic growth.
The core net interest yield decreased seven bps due to the impact of ALM portfolio repositioning, partially offset by the impact of higher levels of consumer loans and core deposits.
Business Segment Operations
Segment Description
In connection with the Merger, we realigned our business segment reporting to reflect the new business model of the combined company. As a part of this realignment, the segment formerly reported asConsumer and Commercial Banking was split into two new segments,Global Consumer and Small Business Banking andGlobal Business and Financial Services. We have repositionedAsset Management asGlobal Wealth and Investment Management, which now includesPremier Banking.Premier Banking was included inConsumer
and Commercial Banking in the past, and is made up of our affluent retail customers. This will enable us to serve our customers with a diverse offering of wealth management products.Global Capital Markets and Investment Banking remained relatively unchanged, with the exception of moving the commercial leasing business toGlobal Business and Financial Services, andLatin America moving toAll Other.All Other consists primarily ofLatin America, the formerEquity Investments segment, Noninterest Income and Expense amounts associated with the ALM process, including Gains on Sales of Debt Securities, the allowance for credit losses process, the residual impact of methodology allocations, intersegment eliminations, and the results of certain consumer finance and commercial lending businesses that are being liquidated.
Basis of Presentation
We prepare and evaluate segment results using certain non-GAAP methodologies and performance measures many of which were discussed in Supplemental Financial Data on page 15. The starting point in evaluating results is the operating results of the businesses, which by definition excludes Merger and Restructuring Charges. The segment results also reflect certain revenue and expense methodologies, which are utilized to determine operating income. The Net Interest Income of the business segments includes the results of a funds transfer pricing process that matches assets and liabilities with similar interest rate sensitivity and maturity characteristics. Net Interest Income also reflects an allocation of Net Interest Income generated by assets and liabilities used in our ALM process. The results of business segments will fluctuate based on the performance of corporate ALM activities.
Certain expenses not directly attributable to a specific business segment are allocated to the segments based on pre-determined means. The most significant of these expenses include data processing costs, item processing costs and certain centralized or shared functions. Data processing costs are allocated to the segments based on equipment usage. Item processing costs are allocated to the segments based on the volume of items processed for each segment. The costs of certain centralized or shared functions are allocated based on methodologies which reflect utilization.
Equity is allocated to business segments using a risk-adjusted methodology incorporating each unit’s credit, market and operational risk components. The nature of these risks is discussed further beginning on page 43. ROE is calculated by dividing Net Income by allocated equity. SVA is defined as cash basis earnings on an operating basis less a charge for the use of capital (i.e. equity). Cash basis earnings on an operating basis are defined as Net Income adjusted to exclude Merger and Restructuring Charges, and Amortization of Intangibles. The charge for use of capital is calculated by multiplying 11 percent (management’s estimate of the shareholders’ minimum required rate of return on capital invested) by average total common shareholders’ equity at the corporate level and by average allocated equity at the business segment level. Average equity is allocated to the business level using a methodology identical to that used in the ROE calculation. Management reviews the estimate of the rate used to calculate the capital charge annually. In 2003, management reduced this rate from 12 percent to 11 percent. We use the Capital Asset Pricing Model to estimate our cost of capital. The change in the cost of capital rate from 12 percent to 11 percent was driven by a decline in long-term Treasury rates, which impacted the risk-free rate component of the calculation.
See Note 19 of the Consolidated Financial Statements for additional business segment information, selected financial information for the business segments and reconciliations to consolidated Total Revenue, Net Income and Total Assets amounts.
Global Consumer and Small Business Banking
Our strategy is to attract, retain and deepen customer relationships. A critical component of that strategy includes continuously improving customer satisfaction. We believe this focus will help us achieve our goal of being recognized as the best retail bank in North America.
The major businesses within this segment areConsumer Banking, Consumer Products and Small Business Banking.
Consumer Banking distributes a wide range of services to 33 million consumer households in 29 states and the District of Columbia through its network of 5,885 banking centers, 16,791 domestic branded ATMs, and telephone and Internet channels.Consumer Banking distributes a wide range of products and services,
including deposit products such as checking accounts, money market savings accounts, time deposits and IRAs, debit card products and credit products such as credit card, home equity products and residential mortgages.Consumer Banking recorded $16.7 billion of Total Revenue for 2004. This represented a 35 percent increase. Total average Deposits withinConsumer Banking were $276.7 billion, up 35 percent from 2003.
Consumer Products provides and manages products and services including the issuance and servicing of credit cards, origination, fulfillment and servicing of residential mortgage loans, including home equity loan products, direct banking via the Internet, deposit services, student lending and certain insurance services.Consumer Products contributed $8.4 billion of Total Revenue, which represented a 16 percent improvement. Average Loans and Leases during the year increased 52 percent to $49.9 billion.
Small Business Banking helps small businesses grow through the offering of business products and services which include payroll, merchant services, online banking and bill payment, as well as 401(k) programs. In addition, we provide specialized products like treasury management, lockbox, check cards with photo security and succession planning.Small Business Banking reported $1.7 billion of Total Revenue, compared to $1.2 billion in 2003. Average Loans and Leases improved 28 percent to $15.3 billion. Also, Total Deposits withinSmall Business Banking grew 37 percent to $31.9 billion due to the impact of the Merger and account growth.
Global Consumer and Small Business Banking
| (Dollars in millions) | 2004 | 2003 | ||||||
Net interest income (fully taxable-equivalent basis) | $ | 17,308 | $ | 12,114 | ||||
Noninterest income | 9,549 | 8,816 | ||||||
Total revenue | 26,857 | 20,930 | ||||||
Provision for credit losses | 3,341 | 1,678 | ||||||
Gains on sales of debt securities | 117 | 13 | ||||||
Noninterest expense | 13,334 | 10,333 | ||||||
Income before income taxes | 10,299 | 8,932 | ||||||
Income tax expense | 3,751 | 3,226 | ||||||
Net income | $ | 6,548 | $ | 5,706 | ||||
Shareholder value added | $ | 3,390 | $ | 4,367 | ||||
Net interest yield (fully taxable-equivalent basis) | 5.35 | % | 4.98 | % | ||||
Return on average equity | 19.89 | 42.25 | ||||||
Efficiency ratio (fully taxable-equivalent basis) | 49.64 | 49.37 | ||||||
Average: | ||||||||
Total loans and leases | $ | 137,357 | $ | 92,776 | ||||
Total assets | 352,789 | 258,251 | ||||||
Total deposits | 314,652 | 240,371 | ||||||
Common equity/Allocated equity | 32,925 | 13,505 | ||||||
Year end: | ||||||||
Total loans and leases | 156,280 | 97,341 | ||||||
Total assets | 378,359 | 264,578 | ||||||
Total deposits | 333,723 | 240,428 | ||||||
Total Revenue forGlobal Consumer and Small Business Banking increased $5.9 billion, or 28 percent, of which FleetBoston contributed $4.3 billion. Provision for Credit Losses increased $1.7 billion to $3.3 billion. Noninterest Expense grew by $3.0 billion, or 29 percent, to $13.3 billion. Net Income rose $842 million, or 15 percent, including the $1.1 billion impact of the addition of FleetBoston. SVA decreased $977 million, or 22 percent. This decrease was caused by an increase in the capital allocation as a result of the Merger partially offset by the increase in cash basis earnings.
Our extensive network of delivery channels including banking centers, ATMs, telephone channel and online banking enable us to provide cost effective, convenient and innovative products to our customers. Active online banking subscribers increased 73 percent in 2004. Approximately half of this growth was due to the addition of FleetBoston.
Net Interest Income increased $5.2 billion largely due to the net effect of the growth in consumer loan and lease, and deposit balances, and ALM activities. Net Interest Income was positively impacted by the $44.6 billion, or 48 percent, increase in average Loans and Leases. This increase was driven by a $15.2 billion, or 54 percent, increase in average on-balance sheet consumer credit card outstandings, a $14.8 billion, or 83 percent, increase in home equity lines and a $6.8 billion, or 26 percent, increase in residential mortgages. The FleetBoston portfolio accounted for $5.0 billion, $14.0 billion and $10.8 billion of the increases, respectively.
Deposit growth positively impacted Net Interest Income. Higher consumer deposit balances from the addition of FleetBoston customers of $63.1 billion, government tax cuts, higher customer retention and our focus on adding new customers drove the $74.3 billion, or 31 percent, increase in average Deposits.
Noninterest Income increased $733 million, or eight percent, to $9.5 billion in 2004. FleetBoston contributed $1.4 billion to Noninterest Income. Overall, this increase was primarily due to a $1.5 billion, or 49 percent, increase in Card Income to $4.5 billion and a $913 million, or 25 percent, increase in Service Charges to $4.5 billion. Card Income increased mainly due to increases in purchase volumes for both credit and debit cards, and increases in average managed credit card outstandings. These increases were due to both the growth of our card businesses, and the addition of the FleetBoston portfolio. The increase in Service Charges was due primarily to the addition of FleetBoston customers and the growth in new accounts. Partially offsetting these increases was a $1.5 billion, or 72 percent, decrease in Mortgage Banking Income to $595 million and a $186 million decrease in Trading Account Profits to a loss of $359 million. The decrease in Mortgage Banking Income was due to decreases in production volume and secondary market sales, combined with the MSR impairments recorded during the second half of the year. The decrease in Trading Account Profits was due to the negative impact of faster prepayment speeds and changes in other assumptions on the value of the Excess Spread Certificates (Certificates) prior to their conversion to MSRs. For more information on the conversion of the Certificates into MSRs, see Note 1 of the Consolidated Financial Statements.
The Provision for Credit Losses increased $1.7 billion to $3.3 billion, including higher credit card net charge-offs of $791 million, of which $320 million was attributed to the addition of the FleetBoston credit card portfolio. Organic growth, overall seasoning of credit card accounts, the return of securitized loans to the balance sheet, and increases in minimum payment requirements drove higher net charge-offs and Provision for Credit Losses. The increase in minimum payment requirements is the result of changes in industry practices and will result in increased charge-offs in 2005. For more information, see Credit Risk Management beginning on page 43.
Noninterest Expense increased $3.0 billion, or 29 percent. Driving this increase were increases in Processing Costs of $977 million, Personnel Expense of $763 million and Other General Operating Expense of $512 million. Personnel Expense increased as a result of higher salaries of $537 million and higher benefit costs of $185 million. The impact of the addition of FleetBoston to Noninterest Expense was $1.9 billion, including $538 million of Personnel Expense and $443 million of Data Processing Costs.
Across the three major businesses withinGlobal Consumer and Small Business Banking, our most significant product lines are Card Services, Consumer Real Estate and Consumer Deposit Products.
Card Services
Card Services provides a broad offering of credit cards to an array of customers including consumers and small businesses. Our products include traditional credit cards, a variety of co-branded and affinity card products, as well as purchasing, and travel and entertainment card products. We also provide processing services for merchant card receipts, a business where we are a market leader, due in part to our acquisition of NPC during the fourth quarter of 2004.
We evaluate our Card Services business on both a held and managed basis. Managed card revenue excludes the impact of card securitization activity, which is used as a financing tool. On a held basis, for assets that have been securitized, we record Noninterest Income, rather than Net Interest Income and Provision for Credit Losses, as we are compensated for servicing income and gains or losses on
securitizations. Managed card revenue excludes the impact of the securitized credit card portfolio of $134 million and $7 million for 2004 and 2003, respectively. These amounts are the result of the differences in internal and external funding costs as well as the amortization of previously recognized securitization gains. After the revolving period of the securitizations, the card receivables will return to our Balance Sheet. This has the effect of increasing Loans and Leases on our Balance Sheet and increasing Net Interest Income and the Provision for Credit Losses, with a reduction in Noninterest Income.
The following table presents the components of Total Revenue for Card Services on a managed and held basis.
Card Services Revenue
| 2004 | 2003 | |||||||||||
| (Dollars in millions) | Managed | Held | Managed | Held | ||||||||
Net interest income | $ | 5,079 | $ | 4,236 | $ | 2,856 | $ | 2,537 | ||||
Noninterest income | 3,061 | 3,246 | 1,930 | 2,065 | ||||||||
Total card services revenue | $ | 8,140 | $ | 7,482 | $ | 4,786 | $ | 4,602 | ||||
Strong credit card performance and the addition of the FleetBoston card portfolio drove Card Services results. Held credit card revenue increased $2.9 billion, or 63 percent, to $7.5 billion. Driving this increase was the $1.7 billion increase in held Net Interest Income, due to a $15.2 billion, or 54 percent, increase in average held consumer credit card outstandings, partially offset by a decline in average Deposits of $3.3 billion. The increase in held consumer credit card outstandings was due to the addition of over five million new accounts through our branch network and direct marketing programs, and the $5.0 billion impact of the addition of the held FleetBoston consumer credit card portfolio. The decline in Deposits was due to a change in the fee structure in the merchant business for certain accounts from a compensating balance to a fee for service agreement. Managed credit card revenue increased $3.4 billion, or 70 percent, to $8.1 billion. This increase included the $2.2 billion, or 78 percent, increase in managed Net Interest Income. Average managed consumer credit card outstandings were $50.3 billion in 2004 compared to $31.6 billion.
The increase in held credit card Noninterest Income of $1.2 billion resulted from higher interchange fees of $381 million. Interchange fees increased mainly due to a $21.4 billion, or 38 percent, increase in consumer credit card purchase volumes. Also impacting Noninterest Income were increases in late fees of $238 million, merchant discount fees of $197 million, overlimit fees of $107 million and cash advance fees of $64 million. The effect of the addition of FleetBoston on these fee categories was $169 million on interchange fees, $77 million on late fees, $47 million on merchant discount fees, $37 million on overlimit fees, and $24 million on cash advance fees, respectively. Noninterest Income on a managed basis increased $1.1 billion, or 59 percent, during 2004.
The held Provision for Credit Losses increased $1.2 billion, or 68 percent, to $3.0 billion driven by higher net charge-offs of $791 million, of which $320 million was attributable to the addition of the FleetBoston card portfolio. Organic growth, overall seasoning of accounts, the return of securitized loans to the balance sheet and increases in minimum payment requirements drove higher net charge-offs and Provision for Credit Losses. Net losses on the portfolio that was securitized were $524 million and $177 million for 2004 and 2003. The increase was attributable to the addition of the FleetBoston portfolio. For more information, see Credit Risk Management beginning on page 43.
Consumer Real Estate
Consumer Real Estate generates revenue by providing an extensive line of mortgage products and services to customers nationwide. Consumer Real Estate products are available to our customers through a retail network of personal bankers located in 5,885 banking centers, dedicated sales account executives in over 190 locations and through a devoted sales force offering our customers direct telephone and online access to our products. Additionally, we serve our customers through a partnership with more than 7,200 mortgage brokers in all 50 states. The mortgage product offerings for home purchase and refinancing needs include fixed and adjustable rate loans, first and second lien loans, home equity lines of credit, and lot and construction loans. To manage this portfolio, these products are either sold into the secondary mortgage
market to investors while we retain the customer relationship and servicing rights or are held in our ALM portfolio.
Consumer Real Estate is managed with a focus on its two primary businesses, first mortgage and home equity. The first mortgage business includes the origination, fulfillment and servicing of first mortgage loan products. The home equity business includes lines of credit and second mortgages. These two businesses provide us with a business model that meets customer mortgage borrowing needs in various interest rate cycles.
The following table shows the revenue components of the Consumer Real Estate business.
Consumer Real Estate Revenue
| (Dollars in millions) | 2004 | 2003 | ||||||
Net interest income | $ | 2,224 | $ | 1,795 | ||||
Mortgage banking income(1, 2) | 595 | 2,140 | ||||||
Trading account profits | (349 | ) | (159 | ) | ||||
Gains on sales of debt securities | 117 | — | ||||||
Other income | 61 | 96 | ||||||
Total consumer real estate revenue | $ | 2,648 | $ | 3,872 | ||||
| (1) | Includes gains related to hedge ineffectiveness of cash flow hedges on our mortgage warehouse of $117 and $38 for 2004 and 2003. |
| (2) | For 2004 and 2003, Mortgage Banking Income included revenue of $181 and $218 for mortgage services provided to other segments that are eliminated in consolidation (inAll Other). |
Total revenue for the Consumer Real Estate business decreased by $1.2 billion, or 32 percent, in 2004. Net Interest Income increased by $429 million driven by higher average balances in the home equity line and loan portfolio, which grew from $21.7 billion in 2003 to $39.0 billion in 2004. This portfolio growth was attributable to an expanded home equity market through the addition of FleetBoston, which contributed $18.5 billion, and the increased product distribution. The home equity business had a record year in 2004, producing $57.1 billion in loans and lines compared to $23.4 billion in 2003. Partially offsetting this growth, Net Interest Income decreased $90 million in 2004 due to a lower level of escrow deposits held on loans serviced. Average escrow balances declined $2.8 billion during the year.
Mortgage Banking Income decreased from $2.1 billion in 2003 to $595 million. The following summarizes the components of Mortgage Banking Income. Mortgage Banking Income includes the performance of loans sold in the secondary market and the performance of the servicing portfolio.
Mortgage Banking Income
| (Dollars in millions) | 2004 | 2003 | ||||||
Production income | $ | 771 | $ | 1,927 | ||||
Servicing income: | ||||||||
Servicing fees and ancillary income | 614 | 348 | ||||||
Amortization of MSRs | (345 | ) | (135 | ) | ||||
Net MSR and SFAS 133 derivative hedge adjustments(1) | 18 | — | ||||||
Impairment of MSRs | (463 | ) | — | |||||
Total net servicing income | (176 | ) | 213 | |||||
Total mortgage banking income | $ | 595 | $ | 2,140 | ||||
| (1) | Represents derivative hedge gains of $228, offset by a decrease in the value of the MSRs under SFAS 133 hedges of $210 for 2004. See Note 8 of the Consolidated Financial Statements. |
The decrease in Mortgage Banking Income was primarily driven by a decline in the size of the first mortgage production market from the record levels of 2003. In 2004, we produced $87.5 billion residential first mortgages compared to $131.1 billion in the prior year. Of the 2004 volume, $57.5 billion was originated
through retail channels and $30.0 billion was originated in our wholesale channel. This compares to 2003 with $91.8 billion originated through retail channels and $39.3 billion originated through wholesale channels. During 2004, approximately 58 percent of the production was refinance activity compared to 84 percent in 2003. Additionally, the market and customer preference has shifted the mix of fixed rate loans to 64 percent in 2004, down from 80 percent in 2003. The decline in the size of the market, excess industry capacity, and the rising interest rate environment also resulted in decreased operating margins. The volume reductions resulted in lower loan sales to the secondary market, which totaled $69.4 billion, a 35 percent decrease from the prior year.
During 2004, impairment charges totaled $463 million, including a $261 million adjustment for changes in valuation assumptions and prepayment adjustments to align with changing market conditions and customer behavioral trends. As an economic hedge to the changes associated with the value of MSRs, a combination of derivatives and AFS securities (e.g. mortgage-backed securities) was utilized. During 2004, Consumer Real Estate realized $117 million in Gains on Sales of Debt Securities and $65 million of Net Interest Income from Securities used as an economic hedge of MSRs. At December 31, 2004, $564 million in MSRs were covered by these economic hedges. The remaining $1.8 billion in MSRs were hedged using a SFAS No. 133, “Accounting for Derivative Instruments and Hedging Activities” (SFAS 133) strategy.
Additionally, contributing to Consumer Real Estate revenue, Trading Account Profits decreased by $190 million. Prior to conversion of the Certificates to MSRs in June 2004, changes in the value of the Certificates, MSRs and derivatives used for risk management were recognized as Trading Account Profits. Trading Account Profits included $342 million and $310 million of downward adjustments for changes to valuation assumptions and prepayment adjustments in 2004 and 2003, respectively. For more information on the conversion, see Note 1 of the Consolidated Financial Statements.
Other income includes premiums collected through our mortgage insurance captive and other miscellaneous revenue items.
Servicing income is recognized when cash is received for performing servicing activities for others. Servicing activities primarily include collecting cash for principal, interest and escrow payments from borrowers, and accounting for and remitting principal and interest payments to investors of mortgage-backed securities. Servicing income also includes any ancillary income, such as late fees, derived in connection with these activities. The servicing portfolio includes originated and retained residential mortgages, loans serviced for others and home equity loans. As discussed more fully below, the servicing portfolio ended 2004 at $332.5 billion, an increase of $57.4 billion from December 31, 2003. The addition of FleetBoston customers contributed $33.8 billion of this increase.
We recognize an intangible asset for the MSRs, which represents the right to perform specified residential mortgage servicing activities for others. The amount capitalized as MSRs represents the current fair value of future net cash flows expected to be realized for performing servicing activities. MSRs are amortized as a reduction of actual servicing income received. The following table outlines statistical information on the MSRs:
Mortgage Servicing Rights
| December 31 | ||||||||
| (Dollars in millions) | 2004 | 2003 | ||||||
MSR data: | ||||||||
Balance(1,2) | $ | 2,359 | $ | 2,684 | ||||
Capitalization rate | 1.19 | % | 1.47 | % | ||||
Unpaid balance(3) | $ | 197,795 | $ | 183,116 | ||||
Number of customers (in thousands) | 1,582 | 1,586 | ||||||
| (1) | MSRs outside ofGlobal Consumer and Small Business Banking at December 31, 2004 and 2003 were $123 and $78, respectively, inGlobal Capital Markets and Investment Banking. |
| (2) | Includes $2,283 of Certificates at December 31, 2003. For more information on the Certificates, see Note 1 of the Consolidated Financial Statements. |
| (3) | Represents only loans serviced for others. |
As of December 31, 2004, the MSR balance was $2.4 billion, or 12 percent lower than at the end of 2003. This value represented 119 bps as a percent of the related unpaid principal balance, a 19 percent decrease from 2003. For more information on MSRs, see Notes 1 and 8 of the Consolidated Financial Statements.
Consumer Deposit Products
Consumer Deposit Products provides a comprehensive range of deposit products to consumers and small businesses. Our deposit products include traditional savings accounts, money market savings accounts, CDs and IRAs, regular and interest checking accounts, and a variety of business checking options. These products are further segmented to address customer specific needs and our multicultural strategy.
We added approximately 2.1 million net new checking accounts and 2.6 million net new savings accounts during 2004. This growth resulted from continued improvement in sales and service results in the Banking Center Channel, improved cross-sale ratios, the introduction of new products, advancement of our multicultural strategy, and access to the former FleetBoston franchise, where we opened 174,000 net new checking and 193,000 net new savings accounts since April 1, 2004. Account growth has occurred through productivity improvements in existing stores, as well as new store openings, which totaled 167 in 2004.
We generate revenue on deposit products through the results of a funds transfer pricing process that matches assets and liabilities with similar interest rate sensitivity and maturity characteristics, fees generated on our accounts, and interchange income from our debit cards. Our deposit-taking activities are integrally linked to our liquidity management and ALM interest rate risk management processes. We seek to optimize the value of deposits through both our client-facing asset generation and our ALM investment process. The following table presents the components of Total Revenue for Consumer Deposit Products.
Consumer Deposit Products Revenue
| (Dollars in millions) | 2004 | 2003 | ||||
Net interest income | $ | 7,735 | $ | 5,647 | ||
Deposit service charges | 4,496 | 3,577 | ||||
Debit card income | 1,232 | 896 | ||||
Total noninterest income | 5,728 | 4,473 | ||||
Total deposit revenue(1) | $ | 13,463 | $ | 10,120 | ||
| (1) | Deposit revenue outside ofGlobal Consumer and Small Business Banking was $985 and $666, respectively, for 2004 and 2003. |
Deposit revenue grew $3.3 billion, or 33 percent. Driving this growth was the addition of FleetBoston, which contributed $2.1 billion of deposit revenue.
Net Interest Income increased $2.1 billion, or 37 percent. The primary driver of the increase was the $80.3 billion, or 35 percent, increase in average Deposits. Of this growth, $63.0 billion was related to the addition of FleetBoston customers through the Merger. The addition of FleetBoston contributed $1.5 billion to Net Interest Income.
Deposit service charges increased $919 million, or 26 percent, due to the $515 million impact of the addition of FleetBoston, and the growth of new accounts across our franchise.
Debit card income increased $336 million, or 38 percent. Driving the increase was growth in transaction activity, evidenced by a 40 percent increase in purchase volumes, partially offset by the negative impact of a lower interchange rate on signature debit card transactions. The impact of the addition of FleetBoston to debit card income was $134 million.
Global Business and Financial Services
This segment provides financial solutions to our clients throughout all stages of their financial cycles. Our strategy is to bring the capabilities of a global financial services organization to the local level. We serve our clients through a variety of businesses includingGlobal Treasury Services,Middle Market Banking,Commercial Real Estate Banking,Leasing,Business Capital andDealer Financial Services. Beginning in
2005,Global Business and Financial Services will includeLatin America.See page 32 for more information onLatin America. Also beginning in 2005,Global Business and Financial Serviceswill includeBusiness Banking,which serves our client-managed small business customers.
Global Treasury Services provides integrated working capital management and treasury solutions to clients across the U.S. and 37 countries. Our clients include multi-nationals, middle market companies, correspondent banks, commercial real estate firms and governments. Our services include treasury management, trade finance, foreign exchange, short-term credit facilities and short-term investing. The revenues and operating results where customers and clients are serviced are reflected in this segment, as well asGlobal Consumer and Small Business Banking, andGlobal Capital Markets and Investment Banking.
Middle Market Banking provides commercial lending, treasury management products and investment banking services to middle-market companies across the U.S.
Commercial Real Estate Banking, with offices in more than 60 cities across the U.S., provides project financing and treasury management to private developers, homebuilders and commercial real estate firms.Commercial Real Estate Banking also includes community development banking, which provides lending and investing services to low- and moderate-income communities.
Leasing provides leasing solutions to small business, middle-market and large corporations in the U.S. and internationally, offering expertise in the municipal, corporate aircraft, healthcare and vendor markets.
Business Capital provides asset-based lending financing solutions customized to meet clients’ capital needs by leveraging their assets on a secured basis in the U.S., Canada and European markets.
Dealer Financial Servicesprovides lending and investing services, including floor plan programs for marine, recreational vehicle and auto dealerships to more than 10,000 dealer clients across the U.S.
Global Business and Financial Services
| (Dollars in millions) | 2004 | 2003 | ||||||
Net interest income (fully taxable-equivalent basis) | $ | 4,593 | $ | 3,118 | ||||
Noninterest income | 2,129 | 1,399 | ||||||
Total revenue | 6,722 | 4,517 | ||||||
Provision for credit losses | (241 | ) | 458 | |||||
Noninterest expense | 2,476 | 1,797 | ||||||
Income before income taxes | 4,487 | 2,262 | ||||||
Income tax expense | 1,654 | 791 | ||||||
Net income | $ | 2,833 | $ | 1,471 | ||||
Shareholder value added | $ | 884 | $ | 846 | ||||
Net interest yield (fully taxable-equivalent basis) | 3.40 | % | 3.19 | % | ||||
Return on average equity | 15.34 | 25.01 | ||||||
Efficiency ratio (fully taxable-equivalent basis) | 36.84 | 39.75 | ||||||
Average: | ||||||||
Total loans and leases | $ | 129,671 | $ | 93,378 | ||||
Total assets | 154,521 | 103,786 | ||||||
Total deposits | 53,088 | 31,461 | ||||||
Common equity/Allocated equity | 18,473 | 5,882 | ||||||
Year end: | ||||||||
Total loans and leases | 145,072 | 96,168 | ||||||
Total assets | 178,093 | 107,791 | ||||||
Total deposits | 61,395 | 37,882 | ||||||
Total Revenue forGlobal Business and Financial Services increased $2.2 billion, or 49 percent, in 2004. The addition of FleetBoston accounted for $1.7 billion of the increase. The Provision for Credit Losses decreased $699 million, to a negative $241 million. Noninterest Expense increased $679 million to $2.5
billion. Net Income rose $1.4 billion, or 93 percent, including the $824 million impact of the Merger. SVA increased $38 million, or four percent. This segment’s capital allocation increased due to Goodwill as a result of the Merger which was offset by the increase in Net Income.
Net Interest Income increased $1.5 billion, largely due to the increase in commercial loan and lease, and deposit balances driven by the addition of FleetBoston earning assets and the net results of ALM activities. Net Interest Income was positively impacted by the $36.3 billion, or 39 percent, increase in average outstanding commercial loans. Also contributing to the improvement in Net Interest Income was the $21.6 billion, or 69 percent, increase in average commercial deposits. Impacting these increases was the $29.3 billion effect on average Loans and Leases and the $17.6 billion effect on average Deposits related to the addition of FleetBoston.
During 2004, Noninterest Income increased $730 million, or 52 percent, to $2.1 billion. Included in the results was $601 million of Noninterest Income related to FleetBoston. Overall, the increase was driven by a $341 million increase in Other Noninterest Income to $518 million, and a $261 million, or 36 percent, increase in Service Charges to $988 million. Other Noninterest Income increased by $109 million due to higher income from community development tax credit real estate investments. The increase in Service Charges was primarily driven by the Merger. Also affecting the increase in Noninterest Income was the $43 million increase in Trading Account Profits.
The Provision for Credit Losses declined $699 million to a negative $241 million. The decrease was partially driven by a $264 million, or 59 percent, decrease in net charge-offs. Additionally, notable improvement in credit quality has been achieved in a number of our major businesses. For more information, see Credit Risk Management beginning on page 43.
Noninterest Expense increased $679 million, or 38 percent, due to the $644 million addition of FleetBoston. Driving the increase was a $300 million increase in total Personnel Expense and a $260 million increase in Data Processing Expense.
Global Capital Markets and Investment Banking
Our strategy is to align our resources with sectors where we can deliver value-added financial advisory solutions to our issuer and investor clients. This segment provides a broad range of financial services to domestic and international corporations, financial institutions, and government entities. Clients are supported through offices in 35 countries that are divided into four distinct geographic regions: U.S. and Canada; Asia; Europe, Middle East and Africa; and Mexico. Products and services provided include loan originations, mergers and acquisitions advisory, debt and equity underwriting and trading, cash management, derivatives, foreign exchange, leveraged finance, structured finance and trade services.
This segment offers clients a comprehensive range of global capabilities through the following three financial services:Global Investment Banking,Global Credit Products andGlobal Treasury Services.
Global Investment Banking is comprised of Corporate and Investment Banking and Global Capital Markets.Global Investment Banking underwrites and makes markets in equity and equity-linked securities, high-grade and high-yield corporate debt securities, commercial paper, and mortgage-backed and asset-backed securities. We also provide debt and equity securities research, loan syndications, mergers and acquisitions advisory services and private placements. Further, we provide risk management solutions for customers using interest rate, equity, credit and commodity derivatives, foreign exchange, fixed income and mortgage-related products. In support of these activities, the businesses may take positions in these products and participate in market-making activities. TheGlobal Investment Banking business is a primary dealer in the U.S. and in several international locations.
Global Credit Products provides credit and lending services for our corporate clients and institutional investors.Global Credit Products is also responsible for actively managing loan and counterparty risk in our large corporate portfolio using available risk mitigation techniques, including credit default swaps.
Global Treasury Services provides the technology, strategies and integrated solutions to help financial institutions, government agencies and corporate clients manage their cash flows.
Global Capital Markets and Investment Banking
| (Dollars in millions) | 2004 | 2003 | ||||||
Net interest income (fully taxable-equivalent basis) | $ | 4,122 | $ | 4,289 | ||||
Noninterest income | 4,927 | 4,045 | ||||||
Total revenue | 9,049 | 8,334 | ||||||
Provision for credit losses | (459 | ) | 303 | |||||
Losses on sales of debt securities | (10 | ) | (14 | ) | ||||
Noninterest expense | 6,556 | 5,327 | ||||||
Income before income taxes | 2,942 | 2,690 | ||||||
Income tax expense | 992 | 896 | ||||||
Net income | $ | 1,950 | $ | 1,794 | ||||
Shareholder value added | $ | 891 | $ | 893 | ||||
Net interest yield (fully taxable-equivalent basis) | 1.49 | % | 1.86 | % | ||||
Return on average equity | 19.46 | 21.35 | ||||||
Efficiency ratio (fully taxable-equivalent basis) | 72.45 | 63.91 | ||||||
Average: | ||||||||
Total loans and leases | $ | 34,237 | $ | 36,640 | ||||
Total assets | 323,101 | 272,942 | ||||||
Total deposits | 76,884 | 66,095 | ||||||
Common equity/Allocated equity | 10,021 | 8,404 | ||||||
Year end: | ||||||||
Total loans and leases | 33,899 | 29,104 | ||||||
Total assets | 307,451 | 225,839 | ||||||
Total deposits | 79,376 | 58,504 | ||||||
Total Revenue was $9.0 billion, reflecting a $715 million, or nine percent, increase in 2004. The increase in Market-based revenues was driven by trading-related revenue and Investment Banking Income. The Provision for Credit Losses decreased $762 million to a negative $459 million. Total Noninterest Expense increased $1.2 billion to $6.6 billion. Net Income increased $156 million, or nine percent. SVA was relatively flat in 2004.
Net Interest Income decreased $167 million, or four percent, to $4.1 billion. Driving this decrease was the $200 million, or nine percent, decrease in trading-related Net Interest Income. Despite the growth in trading-related average earning assets during the year, a flattening yield curve decreased the contribution to Net Interest Income. Nontrading-related Net Interest Income increased $33 million, or two percent, as the benefit of the $10.8 billion, or 16 percent, increase in average Deposits was partially offset by the $2.4 billion, or seven percent, decrease in average Loans and Leases. Average Deposits increased despite the withdrawal of compensating balances by the U.S. Treasury due to changes in our compensation agreements with them.
Noninterest Income increased $882 million, or 22 percent. Increases in Trading Account Profits, Investment Banking Income and Service Charges drove the improvement. The following table presents the detail of Investment Banking Income within the segment.
Investment Banking Income
| (Dollars in millions) | 2004 | 2003 | ||||
Securities underwriting | $ | 920 | $ | 962 | ||
Syndications | 521 | 407 | ||||
Advisory services | 310 | 229 | ||||
Other | 32 | 38 | ||||
Total investment banking income(1) | $ | 1,783 | $ | 1,636 | ||
| (1) | Investment Banking Income recorded in other business units in 2004 and 2003 was $103 and $100. |
Investment Banking Income increased $147 million, or nine percent, due to market share increases in high-yield debt, mortgage-backed securities and convertible debt. The continued strong momentum in mergers and acquisitions, and syndicated loans drove the 35 percent and 28 percent increases, respectively, in advisory services and syndication fees.
Trading-related revenue, which includes Net Interest Income from trading-related positions and Trading Account Profits in Noninterest Income, is presented in the following table. Not included are commissions from equity transactions which are recorded in Noninterest Income as Investment and Brokerage Services Income.
Trading-related Revenue
| (Dollars in millions) | 2004 | 2003 | ||||||
Net interest income (fully taxable-equivalent basis) | $ | 2,039 | $ | 2,239 | ||||
Trading account profits(1) | 1,028 | 587 | ||||||
Total trading-related revenue(1) | $ | 3,067 | $ | 2,826 | ||||
Trading-related revenue by product | ||||||||
Fixed income | $ | 1,547 | $ | 1,352 | ||||
Interest rate (fully taxable-equivalent basis) | 667 | 954 | ||||||
Foreign exchange | 757 | 551 | ||||||
Equities(2) | 195 | 344 | ||||||
Commodities | 45 | (45 | ) | |||||
Market-based trading-related revenue | 3,211 | 3,156 | ||||||
Credit portfolio hedges(3) | (144 | ) | (330 | ) | ||||
Total trading-related revenue(1) | $ | 3,067 | $ | 2,826 | ||||
| (1) | Trading Account Profits for the Corporation were $869 and $409 for 2004 and 2003. In 2004, the difference relates to the impact of the valuation of the Certificates, which was partially offset by gains inGlobal Wealth and Investment ManagementandLatin America of $86 and $72, respectively. In 2003, the difference relates primarily to the impact of the Certificates. See page 23 for more information on the Certificates. Total trading-related revenue for the Corporation was $2,908 and $2,648 for 2004 and 2003, and was impacted in a similar manner as Trading Account Profits. |
| (2) | Does not include commissions from equity transactions which were $666 and $648 in 2004 and 2003. |
| (3) | Includes credit default swaps and related products used for credit risk management. |
Market-based trading-related revenue increased by $55 million, or two percent. Fixed income continued to show strong results increasing $195 million, or 14 percent, driven by growth in our commercial mortgage-backed and structured finance activity. Foreign exchange revenue increased $206 million, or 37 percent, due to volatility of the dollar in the latter half of the year and increased customer activity. Commodities revenue increased $90 million due to the absence of the negative impact of the SARS outbreak, which occurred during 2003.
Partially offsetting these increases were declines in interest rate and equities revenues. Interest rate revenues declined by $287 million, or 30 percent, largely due to reduced corporate customer activity and lower trading-related profits as a result of FRB tightening, uncertainty related to the election, declining volatility in the options market and more subdued economic growth than anticipated during the year. Trading-related equities revenues declined by $149 million, or 43 percent. Including commissions on equity transactions, trading-related equities revenues declined $131 million, or 13 percent. The overall decline in trading-related equities revenue was driven by net losses on a single retained stock position in 2004 combined with the absence of gains on a single position that we recorded in 2003.
Total trading-related revenues also included the cost associated with credit portfolio hedges of $144 million in 2004, an improvement of $186 million. The improvement was primarily due to stable spreads in the first half of the year versus spreads tightening throughout 2003.
The Provision for Credit Losses decreased $762 million to a negative $459 million due to notable improvements in credit quality in the large corporate portfolio partially due to the high levels of liquidity in the capital markets, which enabled us to distribute paper more readily. Also contributing to the decrease in
the Provision for Credit Losses was the reduction in net charge-offs of $311 million, or 71 percent. Additionally, nonperforming assets declined $589 million, or 58 percent, to $424 million at December 31, 2004. For more information, see Credit Risk Management beginning on page 43.
Noninterest Expense increased $1.2 billion, or 23 percent. This increase was due, in part, to an increase in litigation-related charges of $460 million, including the reversal of legal expenses previously recorded inAll Other that were reclassified to this segment. Also impacting Noninterest Expense were higher incentive compensation for market-based activities of $279 million and the mutual fund settlement of $143 million.
Global Wealth and Investment Management
This segment provides tailored investment services to individual and institutional clients in various stages and economic cycles. Our clients are served through five major businesses,Premier Banking, Banc of America Investments (BAI), The Private Bank, Columbia Management Group (CMG) andOther Services, each offering specific products and services based on clients’ needs.
Premier Banking joins withBAI, our full-service retail brokerage business, to bring together personalized banking and investment expertise through priority service with client-dedicated teams. These teams provide comprehensive advice, cash management strategies, and customized investment and financial planning solutions for mass affluent clients. Mass affluent clients have a personal wealth profile that includes investable assets plus a mortgage that exceeds $250,000 or they have at least $100,000 of investable assets.
BAI serves 1.3 million accounts through a network of over 2,100 financial advisors throughout the U.S.
The Private Bank provides integrated wealth management solutions to high-net-worth individuals, mid-market institutions and charitable organizations with investable assets greater than $3 million. Services include investment, trust, banking and lending services.
During the third quarter of 2004, we announced a new business designed to serve the needs of ultra high-net-worth individuals and families. The goal is for this new business to provide a higher level of contact and tailored wealth management solutions to clients with investable assets greater than $50 million. We expect this business to be rolled out during the first quarter of 2005.
CMG is an asset management organization primarily serving the needs of institutional customers.CMG provides asset management services, liquidity strategies and separate accounts.CMG also provides mutual funds offering a full range of investment styles across an array of products including equities, fixed income (taxable and nontaxable) and cash products. In addition to its service of institutional clients,CMG distributes its products and services to individuals throughThe Private Bank,BAI and nonproprietary channels including other brokerage firms.
Other Services include theInvestment Services Group, which provides products and services from traditional capital markets products to alternative investments andBanc of America Specialist, a New York Stock Exchange market-maker.Other Services also includedU.S. Clearing which provides retail clearing services to broker/dealers and other correspondent firms.U.S. Clearing was sold in the fourth quarter of 2004.
Global Wealth and Investment Management
| (Dollars in millions) | 2004 | 2003 | ||||||
Net interest income (fully taxable-equivalent basis) | $ | 2,854 | $ | 1,952 | ||||
Noninterest income | 3,064 | 2,078 | ||||||
Total revenue | 5,918 | 4,030 | ||||||
Provision for credit losses | (20 | ) | 11 | |||||
Noninterest expense | 3,449 | 2,101 | ||||||
Income before income taxes | 2,489 | 1,918 | ||||||
Income tax expense | 905 | 684 | ||||||
Net income | $ | 1,584 | $ | 1,234 | ||||
Shareholder value added | $ | 782 | $ | 854 | ||||
Net interest yield (fully taxable-equivalent basis) | 3.35 | % | 3.52 | % | ||||
Return on average equity | 20.17 | 33.94 | ||||||
Efficiency ratio (fully taxable-equivalent basis) | 58.28 | 52.11 | ||||||
Average: | ||||||||
Total loans and leases | $ | 44,049 | $ | 37,675 | ||||
Total assets | 91,443 | 58,606 | ||||||
Total deposits | 83,049 | 53,996 | ||||||
Common equity/Allocated equity | 7,854 | 3,637 | ||||||
Year end: | ||||||||
Total loans and leases | 49,776 | 38,689 | ||||||
Total assets | 121,974 | 69,370 | ||||||
Total deposits | 111,107 | 62,730 | ||||||
Total Revenue forGlobal Wealth and Investment Management increased $1.9 billion, or 47 percent, for 2004. The Provision for Credit Losses decreased $31 million to a negative $20 million. Total Noninterest Expense increased $1.3 billion to $3.4 billion. Net Income increased 28 percent to $1.6 billion. SVA decreased $72 million, or eight percent, as the increase in cash basis earnings was more than offset by the increase in the capital allocation that resulted from the Merger.
Net Interest Income increased 46 percent to $2.9 billion due to growth in Deposits in bothPremier BankingandThe Private Bank, loan growth inThe Private Bank, and the addition of FleetBoston earning assets to the portfolio. Net results of ALM activities also drove the increase. Average Deposits increased $29.1 billion, or 54 percent, primarily due to migration of account balances fromConsumer Banking toPremier Banking, the impact of the Merger, as well as increased deposit-taking inThe Private Bank. Average Loans and Leases increased $6.4 billion, or 17 percent, due to the inclusion of the FleetBoston Loans and Leases and increased loan activity inThe Private Bank.
Client Assets
| December 31 | ||||||
| (Dollars in billions) | 2004 | 2003 | ||||
Assets under management | $ | 451.5 | $ | 296.7 | ||
Client brokerage assets | 149.9 | 88.8 | ||||
Assets in custody | 107.0 | 49.9 | ||||
Total client assets | $ | 708.4 | $ | 435.4 | ||
Assets under management generate fees based on a percentage of their market value. They consist largely of mutual funds and separate accounts, which are comprised of money market products, equities, and taxable and nontaxable fixed income securities. Compared to 2003, assets under management increased $154.8 billion, or 52 percent, due to the addition of $148.9 billion of FleetBoston assets under management and increased market valuation partially offset by outflows primarily in money market products. Client
brokerage assets, a source of commission revenue, were up $61.1 billion, or 69 percent, due to the addition of $55.4 billion FleetBoston client brokerage assets. Client brokerage assets consist largely of investments in annuities, money market mutual funds, bonds and equities. Assets in custody increased $57.1 billion, or 114 percent, and represent trust assets administered for customers. The addition of $54.5 billion of assets in custody from FleetBoston drove the increase. Trust assets encompass a broad range of asset types including real estate, private company ownership interest, personal property and investments.
Noninterest Income consists primarily of Investment and Brokerage Services, which represents fees earned on client assets, as well as brokerage commissions and trailer fees. Investment and Brokerage Services revenue increased $1.1 billion, or 71 percent, to $2.7 billion. The increase in Investment and Brokerage Services revenue was primarily due to growth in all client assets categories, driven by the addition of FleetBoston. The impact of FleetBoston on Investment and Brokerage Services was $974 million.
Noninterest Expense increased $1.3 billion, or 64 percent, due to the $889 million increase in expenses related to the inclusion of FleetBoston and this segment’s allocation of the mutual fund settlement, which amounted to approximately $143 million pre-tax. Also impacting Noninterest Expense was an increase in Personnel Expense reflecting the addition of 637 client managers inPremier Banking, additional financial advisors inBAI and increased incentives inBAI due to increased sales and changes to payout schedules.
All Other
Included in All Other are our Latin America and Equity Investments businesses, and Other.
Latin America includes our full-service Latin American operations in Brazil, Argentina and Chile. These businesses provide a wide array of products to indigenous and multinational corporations, as well as consumers. These services include lending, deposit-taking, asset management, private banking and treasury operations. The consumer business focuses on the affluent and middle-market segments. Our largest book of business is in Brazil, while Argentina has our largest branch network, with 87 branches. Our Brazilian and Chilean operations have 65 branches and 43 branches, respectively. Beginning in 2005,Latin America will be re-aligned with theGlobal Business and Financial Services segment. For more information on our Latin American operations, see Foreign Portfolio beginning on page 51.
Equity Investments include Principal Investing and other corporate investments. Principal Investing is comprised of a diversified portfolio of investments in privately-held and publicly-traded companies at all stages of their lifecycle from start-up to buyout.
Otherincludes Noninterest Income and Expense amounts associated with the ALM process, including Gains on Sales of Debt Securities, the allowance for credit losses process, the residual impact of methodology allocations, intersegment eliminations, and the results of certain consumer finance and commercial lending businesses that are being liquidated.
All Other
| (Dollars in millions) | 2004 | 2003 | |||||
Net interest income (fully taxable-equivalent basis) | $ | 636 | $ | 634 | |||
Noninterest income | 428 | 112 | |||||
Total revenue | 1,064 | 746 | |||||
Provision for credit losses | 148 | 389 | |||||
Gains on sales of debt securities | 2,016 | 942 | |||||
Merger and restructuring charges | 618 | — | |||||
Noninterest expense | 594 | 597 | |||||
Income before income taxes | 1,720 | 702 | |||||
Income tax expense | 492 | 97 | |||||
Net income | $ | 1,228 | $ | 605 | |||
Shareholder value added | $ | 36 | $ | (1,339 | ) | ||
Latin America
The results ofLatin America are driven by the addition of the FleetBoston operations in the region. For more information on our Latin American operations, see Foreign Portfolio beginning on page 51. Prior to the Merger, our business in the region had been reduced to very low levels. For 2004,Latin America reported Net Income of $310 million compared to a Net Loss of $48 million in 2003. Total Revenue increased $801 million from $33 million to $834 million. The results reflect an improvement in credit quality including the disposition of problem assets, as well as improved economic conditions in the region. Our increased presence in the region as a result of the addition of the FleetBoston business also contributed to the results. SVA increased by $227 million due to higher Net Income.
Net Interest Income increased $470 million from $24 million to $494 million. The increase was driven by the $458 million impact of the addition of the FleetBoston Latin America business.
Noninterest Income increased $331 million from $9 million to $340 million in 2004. The increase was driven by increases in Service Charges, Investment and Brokerage Services, and Trading Account Profits of $78 million, $77 million and $72 million, respectively, due to the addition of FleetBoston.
The Provision for Credit Losses decreased $284 million from $89 million in 2003 to a negative $195 million, due to continued improvement in the credit quality of the portfolio. Driving this decrease was a reduction in net charge-offs of $113 million and improved credit quality.
Noninterest Expense increased $509 million from $19 million to $528 million for 2004 due to the $497 million impact of the addition of the FleetBoston business.
Equity Investments
Equity Investments reported Net Income of $192 million in 2004, a $441 million improvement compared to a $249 million Net Loss in 2003. Total Revenue increased $696 million to $440 million. The improvements were primarily due to higher gains in Principal Investing driven by increasing liquidity in the private equity markets. SVA increased by $364 million, or 77 percent, due to the improvement in the results.
The following table presents the Principal Investing equity portfolio by major industry at December 31, 2004 and 2003:
Principal Investing Equity Portfolio
| December 31 | FleetBoston | ||||||||
| (Dollars in millions) | 2004 | 2003 | April 1, 2004 | ||||||
Consumer discretionary | $ | 2,058 | $ | 1,435 | $ | 834 | |||
Industrials | 1,118 | 876 | 527 | ||||||
Information technology | 1,089 | 741 | 391 | ||||||
Telecommunication services | 769 | 639 | 271 | ||||||
Financials | 606 | 332 | 146 | ||||||
Healthcare | 576 | 385 | 211 | ||||||
Materials | 421 | 266 | 188 | ||||||
Consumer staples | 230 | 245 | 88 | ||||||
Real estate | 229 | 229 | 113 | ||||||
Energy | 81 | 29 | 67 | ||||||
Individual trusts, nonprofits, government | 49 | 48 | 162 | ||||||
Utilities | 24 | 35 | 6 | ||||||
Total | $ | 7,250 | $ | 5,260 | $ | 3,004 | |||
Noninterest Income within the Principal Investing portfolio primarily consists of Equity Investment Gains (Losses), and increased $712 million to $594 million. While impairments were relatively unchanged at $445 million, cash gains increased by $576 million to $849 million. Also contributing to the improvement was an increase of $143 million in fair value adjustment gains.
Other
Other recorded $726 million of Net Income in 2004, compared to $902 million in 2003. Total Revenue decreased $1.2 billion to a negative $210 million. The decrease was the result of a $440 million decrease in Net Interest Income, from $771 million to $331 million, primarily caused by a reduction of capital inOther, as more capital has been deployed to the business segments, and by the continued runoff of previously exited businesses. The revenue decrease was also caused by the $739 million decline in Noninterest Income primarily caused by the absence of whole mortgage loan sale gains during 2004. Gains on Sales of Debt Securities increased $1.1 billion to $2.0 billion as we continue to reposition the ALM portfolio in response to interest rate fluctuations and to manage mortgage prepayment risk. Provision for Credit Losses increased $65 million resulting from higher ALM whole loan mortgage portfolio levels, changes to components of the formula and other factors, partially offset by reduced credit costs associated with previously exited businesses. Noninterest Expense increased $87 million to $555 million, and included Merger and Restructuring Charges of $618 million offset by costs allocated to the segments. For more information on Merger and Restructuring Charges, see Note 2 of the Consolidated Financial Statements.
Managing Risk
Overview
Our management governance structure enables us to manage all major aspects of our business through an integrated planning and review process that includes strategic, financial, associate and risk planning. We derive much of our revenue from managing risk from customer transactions for profit. Through our management governance structure, risk and return are evaluated with a goal of producing sustainable revenue, reducing earnings volatility and increasing shareholder value. Our business exposes us to the following major risks: strategic, liquidity, credit, market and operational.
Strategic risk is the risk that adverse business decisions, ineffective or inappropriate business plans or failure to respond to changes in the competitive environment, business cycles, customer preferences, product obsolescence, execution and/or other intrinsic risks of business will impact our ability to meet our objectives. Liquidity risk is the inability to accommodate liability maturities and deposit withdrawals, fund asset growth and meet contractual obligations through unconstrained access to funding at reasonable market rates. Credit risk is the risk of loss arising from a borrower’s or counterparty’s inability to meet its obligations. Market risk is the risk that values of assets and liabilities or revenues will be adversely affected by changes in market conditions, such as interest rate movements. Operational risk is the risk of loss resulting from inadequate or failed internal processes, people and systems or external events.
Risk Management Processes and Methods
We have established control processes and use various methods to align risk-taking and risk management throughout our organization. These control processes and methods are designed around “three lines of defense”: lines of business; support units (including Risk Management, Compliance, Finance, Personnel and Legal); and Corporate Audit.
Management is responsible for identifying, quantifying, mitigating and managing all risks within their lines of business, while certain enterprise-wide risks are managed centrally. For example, except for trading-related business activities, interest rate risk associated with our business activities is managed centrally in the Corporate Treasury function. Line of business management makes and executes the business plan and is closest to the changing nature of risks and, therefore, we believe is best able to take actions to manage and mitigate those risks. Our lines of business prepare quarterly self-assessment reports to identify the status of risk issues, including mitigation plans, if appropriate. These reports roll up to executive management to ensure appropriate risk management and oversight, and to identify enterprise-wide issues. Our management processes, structures and policies aid us in complying with laws and regulations and provide clear lines for decision-making and accountability. Wherever practical, we attempt to house decision-making authority as close to the customer as possible while retaining supervisory control functions from both in and outside of the lines of business.
The Risk Management organization translates approved business plans into approved limits, approves requests for changes to those limits, approves transactions as appropriate, and works closely with lines of
business to establish and monitor risk parameters. Risk Management has assigned a Risk Executive to each of the four lines of business who is responsible for the oversight of all risks associated with that line of business. In addition, Risk Management has assigned Risk Executives to monitor enterprise-wide credit, market and operational risks.
Corporate Audit provides an independent assessment of our management and internal control systems. Corporate Audit activities are designed to provide reasonable assurance that resources are adequately protected; significant financial, managerial and operating information is materially complete, accurate and reliable; and employees’ actions are in compliance with corporate policies, standards, procedures, and applicable laws and regulations.
We use various methods to manage risks at the line of business levels and corporate-wide. Examples of these methods include planning and forecasting, risk committees and forums, limits, models, and hedging strategies. Planning and forecasting facilitates analysis of actual versus planned results and provides an indication of unanticipated risk level. Generally, risk committees and forums are comprised of line of business, risk management, compliance, legal and finance personnel, among others, who actively monitor performance against plan, limits, potential issues, and introduction of new products. Limits, the amount of exposure that may be taken in a product, relationship, region or industry, seek to align risk goals with those of each line of business and are part of our overall risk management process to help reduce the volatility of market, credit and operational losses. Models are used to estimate market value and net interest income sensitivity, and to estimate both expected and unexpected losses for each product and line of business, where appropriate. Hedging strategies are used to manage the risk of borrower/counterparty concentration risk and to manage market risk in the portfolio.
The formal processes used to manage risk represent only one portion of our overall risk management process. Corporate culture and the actions of our associates are also critical to effective risk management. Through our Code of Ethics, we set a high standard for our associates. The Code of Ethics provides a framework for all of our associates to conduct themselves with the highest integrity in the delivery of our products or services to our customers. We instill a risk-conscious culture through communications, training, policies, procedures, and organizational roles and responsibilities. Additionally, we continue to strengthen the linkage between the associate performance management process and individual compensation to encourage associates to work toward corporate-wide risk goals.
Oversight
The Board evaluates risk through the Chief Executive Officer (CEO) and three committees. The Finance Committee, a committee appointed by the Board, establishes policies and strategies for managing the strategic, liquidity, credit, market and operational risks to corporate earnings and capital. The Asset Quality Committee, a Board committee, reviews credit and selected market risks; and the Audit Committee, a Board committee, provides direct oversight of the corporate audit function and the independent registered public accounting firm. Additionally, senior management oversight of our risk-taking and risk management activities is conducted through three senior management committees: the Risk and Capital Committee (RCC), the Asset and Liability Committee (ALCO) and the Credit Risk Committee (CRC). The RCC, a senior management committee, reviews corporate strategies and corporate objectives, evaluates business performance, and reviews business plans, including capital allocation, for the Corporation and for major businesses. The ALCO, a subcommittee of the Finance Committee, approves limits for trading activities, and was established to manage the risk of loss of value and related Net Interest Income of our trading positions. ALCO also provides oversight for Corporate Treasury’s and Corporate Investment’s process of managing interest rate risk, otherwise known as the ALM process, and reviews hedging techniques. In addition, ALCO provides oversight guidance over our credit hedging program. The CRC, a subcommittee of the Finance Committee, establishes corporate credit practices and limits, including industry and country concentration limits, approval requirements and exceptions. The CRC also reviews business asset quality results versus plan, portfolio management, and the adequacy of the allowance for credit losses. Each committee and subcommittee has the ability to delegate authority to officers of subcommittees to manage specific risks.
Management is in the process of finalizing its plans to address the Basel Committee on Banking Supervision’s new risk-based capital standards (Basel II). The Finance Committee and the Audit Committee provide oversight of management’s plans including the Corporation’s preparedness and compliance with Basel II. For additional information, see Note 14 of the Consolidated Financial Statements.
In 2005, the Finance Committee chartered the Compliance and Operational Risk Committee (CORC) as a subcommittee of the Finance Committee. CORC provides oversight and consistent communication of operational and compliance issues.
The following sections, Strategic Risk Management, Liquidity Risk Management, Credit Risk Management beginning on page 43, Market Risk Management beginning on page 61 and Operational Risk Management beginning on page 68, address in more detail the specific procedures, measures and analyses of the major categories of risk that we manage.
Strategic Risk Management
The Board provides oversight for strategic risk through the CEO and the Finance Committee. We use an integrated business planning process to help manage strategic risk. A key component of the planning process aligns strategies, goals, tactics and resources. The process begins with an assessment that creates a plan for the Corporation, setting the corporate strategic direction. The planning process then cascades through the business units, creating business unit plans that are aligned with the Corporation’s direction. Tactics and metrics are monitored to ensure adherence to the plans. As part of this monitoring, business units perform a quarterly self-assessment further described in the Operational Risk Management section on page 68. This assessment looks at changing market and business conditions, and the overall risk in meeting objectives. Corporate Audit in turn monitors, and independently reviews and evaluates the plans and self-assessments.
One of the key tools for managing strategic risk is capital allocation. Through allocating capital, we effectively manage each business segment’s ability to take on risk. Review and approval of business plans incorporates approval of capital allocation and economic capital usage is monitored through financial and risk reporting.
Liquidity Risk Management
Liquidity is the ongoing ability to accommodate liability maturities and deposit withdrawals, fund asset growth and business operations, and meet contractual obligations through unconstrained access to funding at reasonable market rates. Liquidity management involves forecasting funding requirements and maintaining sufficient capacity to meet the needs and accommodate fluctuations in asset and liability levels due to changes in our business operations or unanticipated events. Sources of liquidity include deposits and other customer-based funding, wholesale market-based funding, and liquidity provided by the sale or securitization of assets.
We manage liquidity at two levels. The first is the liquidity of the parent company, which is the holding company that owns the banking and nonbanking subsidiaries. The second is the liquidity of the banking subsidiaries. The management of liquidity at both levels is essential because the parent company and banking subsidiaries each have different funding needs and sources, and each are subject to certain regulatory guidelines and requirements. Through ALCO, the Finance Committee is responsible for establishing our liquidity policy as well as approving operating and contingency procedures, and monitoring liquidity on an ongoing basis. Corporate Treasury is responsible for planning and executing our funding activities and strategy.
In order to ensure adequate liquidity through the full range of potential operating environments and market conditions, we conduct our liquidity management and business activities in a manner that will preserve and enhance funding stability, flexibility, and diversity. Key components of this operating strategy include a strong focus on customer-based funding, maintaining direct relationships with wholesale market funding providers, and maintaining the ability to liquefy certain assets when, and if requirements warrant.
We develop and maintain contingency funding plans for both the parent company and bank liquidity positions. These plans evaluate our liquidity position under various operating circumstances and allow us to ensure that we would be able to operate through a period of stress when access to normal sources of funding is constrained. The plans project funding requirements during a potential period of stress, specify and quantify sources of liquidity, outline actions and procedures for effectively managing through the problem period, and define roles and responsibilities. They are reviewed and approved annually by ALCO.
Our borrowing costs and ability to raise funds are directly impacted by our credit ratings. The credit ratings of Bank of America Corporation and Bank of America, National Association (Bank of America, N.A.) and Fleet National Bank are reflected in the table below.
Table 4
Credit Ratings
| December 31, 2004 | ||||||||||||||
| Bank of America Corporation | Bank of America, N.A. | Fleet National Bank | ||||||||||||
| Senior Debt | Subordinated Debt | Commercial Paper | Short-term Borrowings | Long-term Debt | Short-term Borrowings | Long-term Debt | ||||||||
Moody’s | Aa2 | Aa3 | P-1 | P-1 | Aa1 | P-1 | Aa1 | |||||||
Standard & Poor’s | A+ | A | A-1 | A-1+ | AA- | A-1+ | AA- | |||||||
Fitch, Inc. | AA- | A+ | F1+ | F1+ | AA- | F1+ | AA- | |||||||
On February 1, 2005, Standard & Poor’s raised its credit ratings on Bank of America Corporation and its subsidiaries to AA- on senior debt, A+ on subordinated debt and A-1+ on commercial paper; Bank of America, N.A. to AA on long-term debt; and Fleet National Bank to AA on long-term debt.
Under normal business conditions, primary sources of funding for the parent company include dividends received from its banking and nonbanking subsidiaries, and proceeds from the issuance of senior and subordinated debt, as well as commercial paper and equity. Primary uses of funds for the parent company include repayment of maturing debt and commercial paper, share repurchases, dividends paid to shareholders, and subsidiary funding through capital or debt.
The parent company maintains a cushion of excess liquidity that would be sufficient to fully fund holding company and nonbank affiliate operations for an extended period during which funding from normal sources is disrupted. The primary measure used to assess the parent company’s liquidity is the “Time to Required Funding” during such a period of liquidity disruption. This measure assumes that the parent company is unable to generate funds from debt or equity issuance, receives no dividend income from subsidiaries, and no longer pays dividends to shareholders while continuing to meet nondiscretionary uses needed to maintain bank operations and repayment of contractual principal and interest payments owed by the parent company and affiliated companies. Under this scenario, the amount of time the parent company and its nonbank subsidiaries can operate and meet all obligations before the current liquid assets are exhausted is considered the “Time to Required Funding”. ALCO approves the target range set for this metric, in months, and monitors adherence to the target. Maintaining excess parent company cash that ensures that “Time to Required Funding” remains in the target range is the primary driver of the timing and amount of the Corporation’s debt issuances. As of December 31, 2004 “Time to Required Funding” was 29 months.
Primary sources of funding for the banking subsidiaries include customer deposits, wholesale market-based funding, and asset securitizations. Primary uses of funds for the banking subsidiaries include repayment of maturing obligations, and growth in the ALM and core asset portfolios, including loan demand.
ALCO determines prudent parameters for wholesale market-based borrowing and regularly reviews the funding plan for the bank subsidiaries to ensure compliance with these parameters. The contingency funding plan for the banking subsidiaries evaluates liquidity over a 12-month period in a variety of business environment scenarios assuming different levels of earnings performance and credit ratings as well as public and investor relations factors. Funding exposure related to our role as liquidity provider to certain off-balance sheet financing entities is also measured under a stress scenario. In this analysis, ratings are
downgraded such that the off-balance sheet financing entities are not able to issue commercial paper and backup facilities that we provide are drawn upon. In addition, potential draws on credit facilities to issuers with ratings below a certain level are analyzed to assess potential funding exposure.
One ratio used to monitor the stability of our funding composition is the “loan to domestic deposit” (LTD) ratio. This ratio reflects the percent of Loans and Leases that are funded by domestic customer deposits, a relatively stable funding source. A ratio below 100 percent indicates that our loan portfolio is completely funded by domestic customer deposits. The ratio was 93 percent for 2004 compared to 98 percent for 2003. For further discussion, see Deposits and Other Funding Sources below.
We originate loans both for retention on our Balance Sheet and for distribution. As part of our “originate to distribute” strategy, commercial loan originations are distributed through syndication structures, and residential mortgages originated by Consumer Real Estate are frequently distributed in the secondary market. In connection with our balance sheet management activities, we may retain mortgage loans originated as well as purchase and sell loans based on our assessment of market conditions.
Deposits and Other Funding Sources
Deposits are a key source of funding. Table I on page 75 provides information on the average amounts of deposits and the rates paid by deposit category. Average Deposits increased $145.3 billion to $551.6 billion due to a $97.9 billion increase in average domestic interest-bearing deposits, a $31.1 billion increase in average noninterest-bearing deposits and a $16.3 billion increase in average foreign interest-bearing deposits. These increases included the $71.0 billion, $25.3 billion and $5.5 billion impact of the addition of FleetBoston domestic interest-bearing deposits, noninterest-bearing deposits and foreign interest-bearing deposits, respectively. We categorize our deposits into either core or market-based deposits. Core deposits, which are generally customer-based, are an important stable, low-cost funding source and typically react more slowly to interest rate changes than market-based deposits. Core deposits exclude negotiable CDs, public funds, other domestic time deposits and foreign interest-bearing deposits. Average core deposits increased $130.7 billion to $494.1 billion, a 36 percent increase from a year ago, which included $95.6 billion in average core deposits from the addition of FleetBoston. The increase was distributed between NOW and money market deposits, noninterest-bearing deposits, consumer CDs and IRAs, and savings. Average market-based deposit funding increased $14.6 billion to $57.5 billion. The increase was due to a $16.3 billion increase in foreign interest-bearing deposits offset by a $1.7 billion decrease in negotiable CDs, public funds and other domestic time deposits. These increases also reflected the $6.2 billion impact to average market-based deposit funding from the addition of FleetBoston market-based deposit funding. Deposits, on average, represented 53 percent and 54 percent of total sources of funds in 2004 and 2003, respectively.
Table 5 summarizes average deposits by category.
Table 5
Average Deposits
| (Dollars in millions) | 2004 | 2003 | ||||
Deposits by type | ||||||
Domestic interest-bearing: | ||||||
Savings | $ | 33,959 | $ | 24,538 | ||
NOW and money market accounts | 214,542 | 148,896 | ||||
Consumer CDs and IRAs | 94,770 | 70,246 | ||||
Negotiable CDs and other time deposits | 5,977 | 7,627 | ||||
Total domestic interest-bearing | 349,248 | 251,307 | ||||
Foreign interest-bearing: | ||||||
Banks located in foreign countries | 18,426 | 13,959 | ||||
Governments and official institutions | 5,327 | 2,218 | ||||
Time, savings and other | 27,739 | 19,027 | ||||
Total foreign interest-bearing | 51,492 | 35,204 | ||||
Total interest-bearing | 400,740 | 286,511 | ||||
Noninterest-bearing | 150,819 | 119,722 | ||||
Total deposits | $ | 551,559 | $ | 406,233 | ||
Core and market-based deposits | ||||||
Core deposits | $ | 494,090 | $ | 363,402 | ||
Market-based deposits | 57,469 | 42,831 | ||||
Total deposits | $ | 551,559 | $ | 406,233 | ||
Additional sources of funds include short-term borrowings, Long-term Debt and Shareholders’ Equity. Average short-term borrowings, a relatively low-cost source of funds, were up $87.1 billion to $227.6 billion due to increases in securities sold under agreements to repurchase of $59.4 billion, commercial paper of $18.2 billion, notes payable of $8.6 billion and other short-term borrowings of $2.9 billion. These funds were used to fund asset growth or facilitate trading activities and were partially offset by a decrease of $2.0 billion in federal funds purchased. The increases in average short-term borrowings included the $4.0 billion, $274 million, $18 million, and $1.1 billion impact of the addition of FleetBoston securities sold under agreements to repurchase, commercial paper, notes payable and other short-term borrowings, respectively. Issuances and repayments of Long-term Debt were $21.3 billion and $16.9 billion, respectively, for 2004.
Table 6
Short-term Borrowings
| 2004 | 2003 | 2002 | ||||||||||||||||
| (Dollars in millions) | Amount | Rate | Amount | Rate | Amount | Rate | ||||||||||||
Federal funds purchased | ||||||||||||||||||
At December 31 | $ | 3,108 | 2.32 | % | $ | 2,356 | 0.84 | % | $ | 5,167 | 1.15 | % | ||||||
Average during year | 3,724 | 1.31 | 5,736 | 1.10 | 5,470 | 1.63 | ||||||||||||
Maximum month-end balance during year | 7,852 | — | 7,877 | — | 9,663 | — | ||||||||||||
Securities sold under agreements to repurchase | ||||||||||||||||||
At December 31 | 116,633 | 2.85 | 75,690 | 1.12 | 59,912 | 1.44 | ||||||||||||
Average during year | 161,494 | 2.08 | 102,074 | 1.15 | 67,751 | 1.73 | ||||||||||||
Maximum month-end balance during year | 191,899 | — | 124,746 | — | 99,313 | — | ||||||||||||
Commercial paper | ||||||||||||||||||
At December 31 | 25,379 | 1.71 | 7,605 | 1.09 | 114 | 1.20 | ||||||||||||
Average during year | 21,178 | 1.45 | 2,976 | 1.29 | 1,025 | 1.73 | ||||||||||||
Maximum month-end balance during year | 26,486 | — | 9,136 | — | 1,946 | — | ||||||||||||
Other short-term borrowings | ||||||||||||||||||
At December 31 | 53,219 | 2.49 | 27,375 | 1.98 | 16,599 | 1.29 | ||||||||||||
Average during year | 41,162 | 1.73 | 29,672 | 2.02 | 24,231 | 2.90 | ||||||||||||
Maximum month-end balance during year | 53,756 | — | 46,635 | — | 33,549 | — | ||||||||||||
Obligations and Commitments
We have contractual obligations to make future payments on debt and lease agreements. Additionally, in the normal course of business, we enter into contractual arrangements whereby we commit to future purchases of products or services from unaffiliated parties. Obligations that are legally binding agreements whereby we agree to purchase products or services with a specific minimum quantity defined at a fixed, minimum or variable price over a specified period of time are defined as purchase obligations. Included in purchase obligations are vendor contracts of $4.9 billion, commitments to purchase securities of $3.3 billion and commitments to purchase loans of $3.8 billion. The most significant of our vendor contracts include communication services, processing services and software contracts. Other long-term liabilities include our obligations related to the Qualified Pension Plans, Nonqualified Pension Plans and Postretirement Health and Life Plans (the Plans). Obligations to the Plans are based on the current and projected obligations of the Plans, performance of the Plans’ assets and any participant contributions, if applicable. During 2004 and 2003, we contributed $303 million and $460 million, respectively, to the Plans, and we expect to make at least $150 million of contributions during 2005. Management believes the effect of the Plans on liquidity is not significant to our overall financial condition. Debt and lease obligations are more fully discussed in Note 11 of the Consolidated Financial Statements.
Table 7 presents total long-term debt and other obligations at December 31, 2004.
Table 7
Long-term Debt and Other Obligations
| December 31, 2004 | |||||||||||||||
| (Dollars in millions) | Due in or less | Due after 3 years | Due after 5 years | Due after 5 years | Total | ||||||||||
Long-term debt and capital leases(1) | $ | 9,511 | $ | 22,498 | $ | 17,298 | $ | 48,771 | $ | 98,078 | |||||
Purchase obligations(2) | 7,970 | 1,551 | 1,303 | 1,186 | 12,010 | ||||||||||
Operating lease obligations | 1,373 | 2,136 | 1,543 | 3,384 | 8,436 | ||||||||||
Other long-term liabilities | 151 | — | — | — | 151 | ||||||||||
Total | $ | 19,005 | $ | 26,185 | $ | 20,144 | $ | 53,341 | $ | 118,675 | |||||
| (1) | Includes principal payments only and capital lease obligations of $46. |
| (2) | Obligations that are legally binding agreements whereby we agree to purchase products or services with a specific minimum quantity defined at a fixed, minimum or variable price over a specified period of time are defined as purchase obligations. |
Many of our lending relationships contain both funded and unfunded elements. The funded portion is reflected on our Balance Sheet. The unfunded component of these commitments is not recorded on our Balance Sheet until a draw is made under the loan facility.
These commitments, as well as guarantees, are more fully discussed in Note 12 of the Consolidated Financial Statements.
The following table summarizes the total unfunded, or off-balance sheet, credit extension commitment amounts by expiration date. At December 31, 2004, charge cards (nonrevolving card lines) to individuals and government entities guaranteed by the U.S. government in the amount of $10.9 billion (related outstandings of $205 million) were not included in credit card line commitments in the table below.
Table 8
Credit Extension Commitments
| December 31, 2004 | |||||||||||||||
| (Dollars in millions) | Expires in 1 year or less | Expires after 1 year through 3 years | Expires after 3 years through 5 years | Expires after 5 years | Total | ||||||||||
Loan commitments(1) | $ | 111,412 | $ | 63,528 | $ | 53,056 | $ | 19,098 | $ | 247,094 | |||||
Home equity lines of credit | 690 | 1,599 | 2,059 | 55,780 | 60,128 | ||||||||||
Standby letters of credit and financial guarantees | 24,755 | 10,472 | 3,151 | 4,472 | 42,850 | ||||||||||
Commercial letters of credit | 5,374 | 52 | 20 | 207 | 5,653 | ||||||||||
Legally binding commitments | 142,231 | 75,651 | 58,286 | 79,557 | 355,725 | ||||||||||
Credit card lines | 177,286 | 8,175 | — | — | 185,461 | ||||||||||
Total | $ | 319,517 | $ | 83,826 | $ | 58,286 | $ | 79,557 | $ | 541,186 | |||||
| (1) | Equity commitments of $2,052, of which $838 were acquired from FleetBoston, related to obligations to fund existing equity investments were included in loan commitments at December 31, 2004. |
On- and Off-balance Sheet Financing Entities
Off-balance Sheet Commercial Paper Conduits
In addition to traditional lending, we also support our customers’ financing needs by facilitating their access to the commercial paper markets. These markets provide an attractive, lower-cost financing alternative for our customers. Our customers sell assets, such as high-grade trade or other receivables or leases, to a commercial paper financing entity, which in turn issues high-grade short-term commercial paper that is collateralized by the assets sold. Additionally, some customers receive the benefit of commercial paper financing rates related to certain lease arrangements. We facilitate these transactions and collect fees from the financing entity for the services it provides including administration, trust services and marketing the commercial paper.
We receive fees for providing combinations of liquidity, standby letters of credit (SBLCs) or similar loss protection commitments, and derivatives to the commercial paper financing entities. These forms of asset support are senior to the first layer of asset support provided by customers through over-collateralization or by support provided by third parties. The rating agencies require that a certain percentage of the commercial paper entity’s assets be supported by both the seller’s over-collateralization and our SBLC in order to receive their respective investment rating. The SBLC would be drawn on only when the over-collateralization provided by the seller is not sufficient to cover losses of the related asset. Liquidity commitments made to the commercial paper entity are designed to fund scheduled redemptions of commercial paper if there is a market disruption or the new commercial paper cannot be issued to fund the redemption of the maturing commercial paper. The liquidity facility has the same legal priority as the commercial paper. We do not enter into any other form of guarantee with these entities.
We manage our credit risk on these commitments by subjecting them to our normal underwriting and risk management processes. At December 31, 2004 and 2003, the Corporation had off-balance sheet liquidity
commitments and SBLCs to these entities of $23.8 billion and $21.6 billion, respectively. Substantially all of these liquidity commitments and SBLCs mature within one year. These amounts are included in Table 8. Net revenues earned from fees associated with these off-balance sheet financing entities were approximately $80 million and $72 million for 2004 and 2003, respectively.
From time to time, we may purchase some of the commercial paper issued by certain of these entities for our own account or acting as a dealer on behalf of third parties. Derivative instruments related to these entities are marked to market through the Consolidated Statement of Income. SBLCs are initially recorded at fair value in accordance with Financial Accounting Standards Board (FASB) Interpretation No. 45, “Guarantor’s Accounting and Disclosure Requirements for Guarantees” (FIN 45). Liquidity commitments and SBLCs subsequent to inception are accounted for pursuant to SFAS No. 5, “Accounting for Contingencies” (SFAS 5), and are discussed further in Note 12 of the Consolidated Financial Statements.
In January 2003, the FASB issued FASB Interpretation No. 46, “Consolidation of Variable Interest Entities, an interpretation of ARB No. 51” (FIN 46), which provides a framework for identifying variable interest entities (VIEs) and determining when a company should include the assets, liabilities, noncontrolling interests and results of activities of a VIE in its entirety,consolidated financial statements. We adopted FIN 46 on July 1, 2003 and consolidated approximately $12.2 billion of assets and liabilities related to certain of our multi-seller asset-backed commercial paper conduits (ABCP). On October 8, 2003, one of these entities, Ranger Funding Company (RFC) (formerly known as Receivables Capital Corporation), entered into a Subordinated Note Purchase Agreement (the Note) with an unrelated third party which reduced our exposure to this entity’s losses under liquidity and credit agreements as these agreements are senior to the Note. This Note was issued in the principal amount of $23 million, an original maturity of five years and pays interest at 23 percent. Proceeds from the issuance of the note were deposited into a separate account and may be used to cover losses incurred by RFC. Upon RFC’s issuance of this Note, we evaluated whether the Corporation continued to be the primary beneficiary of RFC and determined that the unrelated party which purchased the Note absorbed over 50 percent of the expected losses of RFC. We determined the amount of expected loss through mathematical analysis utilizing a Monte Carlo model that incorporates the cash flows from RFC’s assets and utilizes independent loss information. The noteholder is therefore the primary beneficiary of and is required to consolidate the entity. As a result of the sale of the Note, we deconsolidated approximately $8.0 billion of the previously consolidated assets and liabilities of the entity. The impact of this transaction on the Consolidated Statement of Income was the reduction in Interest Income of approximately $1 million and the Reportreclassification of Managementapproximately $37 million from Net Interest Income to Noninterest Income for 2003. At December 31, 2004, this entity had total assets of $10.0 billion. Our exposure to this entity is included in the total amount of liquidity agreements and SBLCs noted above. There was no material impact to Net Income or Tier 1 Capital as a result of the adoption of FIN 46 or the subsequent deconsolidation of this entity, and prior periods were not restated. In December 2003, Annual Reportthe FASB issued FASB Interpretation No. 46 (Revised December 2003), “Consolidation of Variable Interest Entities, an interpretation of ARB No. 51” (FIN 46R), which is an update of FIN 46. We adopted FIN 46R as of March 31, 2004. As a result of the adoption of FIN 46R, there was no material impact on our results of operations or financial condition.
On-balance Sheet Commercial Paper Conduits
In addition to the off-balance sheet financing entities previously described, we also utilize commercial paper conduits that have been consolidated based on our determination that we are the primary beneficiary of the entities in accordance with FIN 46R. At December 31, 2004 and 2003, the consolidated assets and liabilities of these conduits were reflected in AFS Securities, Other Assets, and Commercial Paper and Other Short-term Borrowings in theGlobal Capital Markets and Investment Banking business segment. At December 31, 2004 and 2003, we held $7.7 billion and $5.6 billion, respectively, of assets of these entities while our maximum loss exposure associated with these entities, including unfunded lending commitments, was approximately $9.4 billion and $7.6 billion, respectively.
Qualified Special Purpose Entities
In addition, to control our capital position, diversify funding sources and provide customers with commercial paper investments, we will, from time to time, sell assets to off-balance sheet commercial paper entities. The commercial paper entities are Qualified Special Purpose Entities (QSPEs) that have been
isolated beyond our reach or that of our creditors, even in the event of bankruptcy or other receivership. The accounting for these entities is governed by SFAS 140, “Accounting for Transfers and Servicing of Financial Assets and Extinguishments of Liabilities – a replacement of FASB Statement No. 125” (SFAS 140), which provides that QSPEs are not included in the consolidated financial statements of the seller. Assets sold to the entities consist of high-grade corporate or municipal bonds, collateralized debt obligations and asset-backed securities. These entities issue collateralized commercial paper or notes with similar repricing characteristics to third party market participants and passive derivative instruments to us. Assets sold to the entities typically have an investment rating ranging from Aaa/AAA to Aa/AA. We may provide liquidity, SBLCs or similar loss protection commitments to the entity, or we may enter into derivatives with the entity in which we assume certain risks. The liquidity facility and derivatives have the same legal standing with the commercial paper.
The derivatives provide interest rate, currency and a pre-specified amount of credit protection to the entity in exchange for the commercial paper rate. These derivatives are provided for in the legal documents and help to alleviate any cash flow mismatches. In some cases, if an asset’s rating declines below a certain investment quality as evidenced by its investment rating or defaults, we are no longer exposed to the risk of loss. At that time, the commercial paper holders assume the risk of loss. In other cases, we agree to assume all of the credit exposure related to the referenced asset. Legal documents for each entity specify asset quality levels that require the entity to automatically dispose of the asset once the asset falls below the specified quality rating. At the time the asset is disposed, we are required to reimburse the entity for any credit-related losses depending on the pre-specified level of protection provided.
We also receive fees for the services we provide to the entities, and we manage any credit or market risk on commitments or derivatives through normal underwriting and risk management processes. Derivative activity related to these entities is included in Note 4 of the Consolidated Financial Statements. At December 31, 2004 and 2003, the Corporation had off-balance sheet liquidity commitments, SBLCs and other financial guarantees to the entities of $7.4 billion and $7.3 billion, respectively. Substantially all of these liquidity commitments, SBLCs and other financial guarantees mature within one year. These amounts are included in Table 8. Net revenues earned from fees associated with these entities were $61 million and $65 million in 2004 and 2003, respectively.
We generally do not purchase any of the commercial paper issued by these types of financing entities other than during the underwriting process when we act as issuing agent nor do we purchase any of the commercial paper for our own account. Derivative instruments related to these entities are marked to market through the Consolidated Statement of Income. SBLCs are initially recorded at fair value in accordance with FIN 45. Liquidity commitments and SBLCs subsequent to inception are accounted for pursuant to SFAS 5 and are discussed further in Note 12 of the Consolidated Financial Statements.
Credit and Liquidity Risks
Because we provide liquidity and credit support to the commercial paper conduits and QSPEs described above, our credit ratings and changes thereto will affect the borrowing cost and liquidity of these entities. In addition, significant changes in counterparty asset valuation and credit standing may also affect the liquidity of the commercial paper issuance. Disruption in the commercial paper markets may result in our having to fund under these commitments and SBLCs discussed above. We seek to manage these risks, along with all other credit and liquidity risks, within our policies and practices. See Notes 1 and 8 of the Consolidated Financial Statements for additional discussion of off-balance sheet financing entities.
Other Off-balance Sheet Financing Entities
To improve our capital position and diversify funding sources, we also sell assets, primarily loans, to other off-balance sheet QSPEs that obtain financing primarily by issuing term notes. We may retain a portion of the investment grade notes issued by these entities, and we may also retain subordinated interests in the entities which reduce the credit risk of the senior investors. We may provide liquidity support in the form of foreign exchange or interest rate swaps. We generally do not provide other forms of credit support to these entities. In addition to the above, we had significant involvement with VIEs other than the commercial paper conduits. These VIEs were not consolidated because we will not absorb a majority of the expected losses or expected residual returns and are therefore not the primary beneficiary of the VIEs. These entities are described more fully in Note 8 of the Consolidated Financial Statements.
Capital Management
The final component of liquidity risk is capital management, which focuses on the level of Shareholders’ Equity. Shareholders’ Equity was $99.6 billion at December 31, 2004, an increase of $51.7 billion from December 31, 2003. This increase was driven by stock issued for the acquisition of FleetBoston of $46.8 billion, Net Income of $14.1 billion and Common Stock Issued Under Employee Plans and Related Tax Benefits of $3.9 billion, offset by dividends paid of $6.5 billion and common share repurchases of $6.3 billion. For additional information on common share repurchases, see Note 13 of the Consolidated Financial Statements. We will continue to repurchase shares, from time to time, in the open market or in private transactions through our previously approved repurchase plans.
During the second quarter of 2004, the Board approved a 2-for-1 stock split in the form of a common stock dividend and increased the quarterly cash dividend 12.5 percent from $0.40 to $0.45 per post-split share. The common stock dividend was effective August 27, 2004 to common shareholders of record on August 6, 2004 and the cash dividend was effective September 24, 2004 to common shareholders of record on September 3, 2004. All prior period common share and related per common share information has been restated to reflect the 2-for-1 stock split.
As part of the SVA calculation, equity is allocated to business units based on an assessment of risk. The allocated amount of capital varies according to the risk characteristics of the individual business segments and the products they offer. Capital is allocated separately based on the following types of risk: credit, market and operational. Average common equity allocated to business units was $69.3 billion and $31.4 billion in 2004 and 2003, respectively. The increase in average allocated common equity was primarily due to the Merger. Average unallocated common equity (not allocated to business units) was $14.7 billion and $17.7 billion in 2004 and 2003, respectively.
As a regulated financial services company, we are governed by certain regulatory capital requirements. The regulatory Tier 1 Capital ratio was 8.10 percent at December 31, 2004, an increase of 25 bps from a year ago, reflecting higher Tier 1 Capital partially offset by higher risk-weighted assets. The minimum Tier 1 Capital ratio required is four percent. As of December 31, 2004, we were classified as “well-capitalized” for regulatory purposes, the highest classification. For additional information on the regulatory capital ratios along with a description of the components of risk-based capital, capital adequacy requirements and prompt corrective action provisions, see Note 14 of the Consolidated Financial Statements.
The capital treatment of trust preferred securities (Trust Securities) is currently under review by the FRB due to the issuing trust companies being deconsolidated under FIN 46R. On May 6, 2004, the FRB proposed to allow Trust Securities to continue to qualify as Tier 1 Capital with revised quantitative limits that would be effective after a three-year transition period. As a result, we will continue to report Trust Securities in Tier 1 Capital. In addition, the FRB is proposing to revise the qualitative standards for capital instruments included in regulatory capital. The proposed quantitative limits and qualitative standards are not expected to have a material impact to our current Trust Securities position included in regulatory capital.
On July 28, 2004, the FRB and other regulatory agencies issued the Final Capital Rule for Consolidated Asset-backed Commercial Paper Program Assets (the Final Rule). The Final Rule allows companies to exclude from risk-weighted assets, the assets of consolidated ABCP conduits when calculating Tier 1 and Total Risk-based Capital ratios. The Final Rule also requires that liquidity commitments provided by the Corporation to ABCP conduits, whether consolidated or not, be included in the capital calculations. The Final Rule was effective September 30, 2004. There was no material impact to Tier 1 and Risk-based Capital as a result of the adoption of this rule.
Credit Risk Management
Credit risk is the risk of loss arising from a borrower’s or counterparty’s inability to meet its obligations. Credit risk exists in our outstanding loans and leases, derivatives, trading account assets and unfunded lending commitments that include loan commitments, letters of credit and financial guarantees. We define the credit exposure to a borrower or counterparty as the loss potential arising from all product classifications, including loans and leases, standby letters of credit and financial guarantees, derivative and
trading account assets, assets held-for-sale and commercial letters of credit. For derivative positions, we use the current mark-to-market value to represent credit exposure without giving consideration to future mark-to-market changes. Our consumer and commercial credit extension and review procedures take into account credit exposures that are both funded and unfunded. For additional information on derivatives and credit extension commitments, see Notes 4 and 12 of the Consolidated Financial Statements.
We manage credit risk based on the risk profile of the borrower or counterparty, repayment sources, the nature of underlying collateral, and other support given current events and conditions. We classify our Loans and Leases as either consumer or commercial and monitor their credit risk separately as discussed below.
Consumer Portfolio Credit Risk Management
Credit risk management for the consumer portfolio begins with initial underwriting and continues throughout a borrower’s credit cycle. Statistical techniques are used to establish product pricing, risk appetite, operating processes and metrics to balance risks and rewards. Consumer exposure is grouped by product and other attributes for purposes of evaluating credit risk. Statistical models are built using detailed behavioral information from external sources such as credit bureaus as well as internal historical experience. These models are essential to our consumer credit risk management process and are used, where applicable, in the determination of credit decisions, collections management procedures, portfolio management decisions, determination of the allowance for consumer loan and lease losses, and economic capital allocation for credit risk.
Table 9 presents outstanding consumer loans and leases for each year in the five-year period ending at December 31, 2004.
Table 9
Outstanding Consumer Loans and Leases
| December 31 | FleetBoston April 1, 2004 | |||||||||||||||||||||||||||||||||||
| 2004 | 2003 | 2002 | 2001 | 2000 | ||||||||||||||||||||||||||||||||
| (Dollars in millions) | Amount | Percent | Amount | Percent | Amount | Percent | Amount | Percent | Amount | Percent | Amount | Percent | ||||||||||||||||||||||||
Residential mortgage | $ | 178,103 | 54.3 | % | $ | 140,513 | 58.5 | % | $ | 108,197 | 54.8 | % | $ | 78,203 | 47.3 | % | $ | 84,394 | 44.7 | % | $ | 34,571 | 55.2 | % | ||||||||||||
Credit card | 51,726 | 15.8 | 34,814 | 14.5 | 24,729 | 12.5 | 19,884 | 12.0 | 14,094 | 7.5 | 6,848 | 10.9 | ||||||||||||||||||||||||
Home equity lines | 50,126 | 15.3 | 23,859 | 9.9 | 23,236 | 11.8 | 22,107 | 13.4 | 21,598 | 11.5 | 13,799 | 22.1 | ||||||||||||||||||||||||
Direct/Indirect consumer | 40,513 | 12.3 | 33,415 | 13.9 | 31,068 | 15.7 | 30,317 | 18.4 | 29,859 | 15.8 | 6,113 | 9.8 | ||||||||||||||||||||||||
Other consumer(1) | 7,439 | 2.3 | 7,558 | 3.2 | 10,355 | 5.2 | 14,744 | 8.9 | 38,706 | 20.5 | 1,272 | 2.0 | ||||||||||||||||||||||||
Total consumer loans and leases | $ | 327,907 | 100.0 | % | $ | 240,159 | 100.0 | % | $ | 197,585 | 100.0 | % | $ | 165,255 | 100.0 | % | $ | 188,651 | 100.0 | % | $ | 62,603 | 100.0 | % | ||||||||||||
| (1) | Includes consumer finance of $3,395, $3,905, $4,438, $5,331 and $25,799 at December 31, 2004, 2003, 2002, 2001 and 2000, respectively; foreign consumer of $3,563, $1,969, $1,970, $2,092 and $2,308 at December 31, 2004, 2003, 2002, 2001 and 2000, respectively; and consumer lease financing of $481, $1,684, $3,947, $7,321 and $10,599 at December 31, 2004, 2003, 2002, 2001 and 2000, respectively. |
Concentrations of Consumer Credit Risk
Our consumer credit risk is diversified through our geographic span, diversity of our franchise and our product offerings. In addition, credit decisions are statistically based with tolerances set to decrease the percentage of approvals as the risk profile increases.
We purchase credit protection on certain portions of our consumer portfolio. Beginning in 2003, we entered into several transactions to purchase credit protection on a portion of our residential mortgage loan portfolio. These transactions are designed to enhance our overall risk management strategy. In 2004, we entered into a similar transaction for a portion of our indirect automobile loan portfolio. At December 31, 2004 and 2003, approximately $88.7 billion and $63.4 billion of residential mortgage and indirect automobile loans were credit protected. Our regulatory risk-weighted assets were reduced as a result of these
transactions because we transferred a portion of our credit risk to unaffiliated parties. These transactions had the cumulative effect of reducing our risk-weighted assets by $25.5 billion and $18.6 billion at December 31, 2004 and 2003, respectively, and resulted in 26 bp increases in our Tier 1 Capital ratio at both December 31, 2004 and 2003.
Consumer Portfolio Credit Quality Performance
Credit card charge-offs increased in 2004 as a result of organic card portfolio growth, continued seasoning of accounts and the return of previously securitized loans to the balance sheet. Consumer credit quality remained strong in all other categories.
As presented in Table 10, nonperforming consumer loans and leases increased $100 million to $738 million, and represented 0.23 percent of consumer loans and leases at December 31, 2004 compared to $638 million, representing 0.27 percent of consumer loans and leases at December 31, 2003. The increase in nonperforming consumer loans and leases was driven by loan growth and the addition of $127 million of nonperforming consumer loans and leases on April 1, 2004 related to FleetBoston, partially offset by consumer loan sales of $95 million. Broad-based growth in the consumer portfolio more than offset the increase in consumer nonperforming assets, resulting in an improvement in the nonperforming ratios.
Table 10
Nonperforming Consumer Assets(1)
| December 31 | FleetBoston April 1, 2004 | |||||||||||||||||||||||
| (Dollars in millions) | 2004 | 2003 | 2002 | 2001 | 2000 | |||||||||||||||||||
Nonperforming consumer loans and leases | ||||||||||||||||||||||||
Residential mortgage | $ | 554 | $ | 531 | $ | 612 | $ | 556 | $ | 551 | $ | 55 | ||||||||||||
Home equity lines | 66 | 43 | 66 | 80 | 32 | 13 | ||||||||||||||||||
Direct/Indirect consumer | 33 | 28 | 30 | 27 | 19 | 10 | ||||||||||||||||||
Other consumer | 85 | 36 | 25 | 16 | 1,104 | 49 | ||||||||||||||||||
Total nonperforming consumer loans and leases | 738 | 638 | 733 | 679 | 1,706 | 127 | ||||||||||||||||||
Consumer foreclosed properties | 69 | 81 | 99 | 334 | 182 | — | ||||||||||||||||||
Total nonperforming consumer assets(2) | $ | 807 | $ | 719 | $ | 832 | $ | 1,013 | $ | 1,888 | $ | 127 | ||||||||||||
Nonperforming consumer loans and leases as a percentage of outstanding consumer loans and leases | 0.23 | % | 0.27 | % | 0.37 | % | 0.41 | % | 0.90 | % | 0.20 | % | ||||||||||||
Nonperforming consumer assets as a percentage of outstanding consumer loans, leases and foreclosed properties | 0.25 | 0.30 | 0.42 | 0.61 | 1.00 | 0.20 | ||||||||||||||||||
| (1) | In 2004, $40 in Interest Income was estimated to be contractually due on nonperforming consumer loans and leases. |
| (2) | Balances do not include $28, $16, $41, $646 and $0 of nonperforming consumer loans held-for-sale, included in Other Assets at December 31, 2004, 2003, 2002, 2001 and 2000, respectively. |
Credit card loans are charged off at 180 days past due or 60 days from notification of bankruptcy filing and are not classified as nonperforming. Unsecured consumer loans and deficiencies in non-real estate secured loans and leases are charged off at 120 days past due and not classified as nonperforming. Real estate secured consumer loans are placed on nonaccrual and classified as nonperforming at 90 days past due. The amount deemed uncollectible on real estate secured loans is charged off at 180 days past due.
Table 11 presents the additions and reductions to nonperforming assets in the consumer portfolio during 2004 and 2003.
Table 11
Nonperforming Consumer Assets Activity
| (Dollars in millions) | 2004 | 2003 | ||||||
Nonperforming loans and leases, and foreclosed properties | ||||||||
Balance, January 1 | $ | 719 | $ | 832 | ||||
Additions to nonperforming assets: | ||||||||
FleetBoston balance, April 1, 2004 | 127 | — | ||||||
New nonaccrual loans and leases, and foreclosed properties | 1,476 | 1,583 | ||||||
Transfers from assets held-for-sale(1) | 1 | 5 | ||||||
Total additions | 1,604 | 1,588 | ||||||
Reductions in nonperforming assets: | ||||||||
Paydowns and payoffs | (376 | ) | (447 | ) | ||||
Sales | (219 | ) | (265 | ) | ||||
Returns to performing status(2) | (793 | ) | (878 | ) | ||||
Charge-offs(3) | (128 | ) | (111 | ) | ||||
Total reductions | (1,516 | ) | (1,701 | ) | ||||
Total net additions to (reductions in) nonperforming assets | 88 | (113 | ) | |||||
Nonperforming consumer assets, December 31 | $ | 807 | $ | 719 | ||||
| (1) | Includes assets held-for-sale that were foreclosed and transferred to foreclosed properties. |
| (2) | Consumer loans are generally returned to performing status when principal or interest is less than 90 days past due. |
| (3) | Consumer credit card and consumer non-real estate loans and leases are not classified as nonperforming;therefore, the charge-offs on these loans are not included above. |
On-balance sheet consumer loans and leases past due 90 days or more and still accruing interest totaled $1.2 billion at December 31, 2004. This amount included $1.1 billion of credit card loans. When the FleetBoston portfolio was acquired on April 1, 2004, it included consumer loans and leases past due 90 days or more and still accruing interest of $116 million including credit card loans of $98 million. At December 31, 2003, the comparable amount was $698 million, which included $616 million of credit card loans.
Nonperforming consumer asset sales in 2004 were $219 million, comprised of $95 million of nonperforming consumer loans and $124 million of consumer foreclosed properties. Nonperforming consumer asset sales in 2003 totaled $265 million, comprised of $141 million of nonperforming consumer loans and $124 million of consumer foreclosed properties.
During the fourth quarter of 2004, we sold $1.1 billion of credit card loans included in our held-for-sale portfolio that were acquired as part of the FleetBoston acquisition.
Table 12 presents consumer net charge-offs and net charge-off ratios for 2004 and 2003.
Table 12
Consumer Net Charge-offs and Net Charge-off Ratios(1)
| 2004 | 2003 | |||||||||||
| (Dollars in millions) | Amount | Percent | Amount | Percent | ||||||||
Residential mortgage | $ | 36 | 0.02 | % | $ | 40 | 0.03 | % | ||||
Credit card | 2,305 | 5.31 | 1,514 | 5.37 | ||||||||
Home equity lines | 15 | 0.04 | 12 | 0.05 | ||||||||
Direct/Indirect consumer | 208 | 0.55 | 181 | 0.55 | ||||||||
Other consumer | 193 | 2.51 | 255 | 2.89 | ||||||||
Total consumer | $ | 2,757 | 0.93 | % | $ | 2,002 | 0.91 | % | ||||
| (1) | Percentage amounts are calculated as net charge-offs divided by average outstanding loans and leases during the year for each loan category. |
On-balance-sheet credit card net charge-offs increased $791 million to $2.3 billion in 2004. The $6.8 billion of credit card loans acquired from FleetBoston on April 1, 2004 accounted for $320 million in net charge-offs. Other causes of the increase in credit card charge-offs were organic growth, the continued seasoning of accounts, and the return of $4.2 billion of previously securitized loan balances to the balance sheet. Formerly securitized credit card loans are recorded on the balance sheet after the revolving period of the securitization, which has the effect of increasing loans on the balance sheet, increasing Net Interest Income, Provision for Credit Losses and net charge-offs, while reducing Noninterest Income.
Included in Other Assets were consumer loans held-for-sale of $6.1 billion and $6.8 billion at December 31, 2004 and 2003, respectively. Included in these balances were nonperforming consumer loans held-for-sale of $28 million and $16 million at December 31, 2004 and 2003, respectively.
Commercial Portfolio Credit Risk Management
Credit risk management for the commercial portfolio begins with an assessment of the credit risk profile of the borrower or counterparty based on an analysis of the borrower’s or counterparty’s financial position. As part of the overall credit risk assessment of a borrower or counterparty, each commercial credit exposure or transaction is assigned a risk rating and is subject to approval based on defined credit approval standards. Subsequent to loan origination, risk ratings are monitored on an ongoing basis. If necessary, they are adjusted to reflect changes in the borrower’s or counterparty’s financial condition, cash flow or financial situation. We use risk rating aggregations to measure and evaluate concentrations within portfolios. Risk ratings are a factor in determining the level of assigned economic capital and the allowance for credit losses. In making decisions regarding credit, we consider risk rating, collateral, country, industry and single name concentration limits while also balancing the total borrower or counterparty relationship and SVA.
Our lines of business and Risk Management personnel use a variety of tools to continuously monitor a borrower’s or counterparty’s ability to perform under its obligations. Adjustments in credit exposures are made as a result of this ongoing analysis and review. Additionally, we utilize syndication of exposure to other entities, loan sales and other risk mitigation techniques to manage the size and risk profile of the loan portfolio.
Table 13 presents outstanding commercial loans and leases for each year in the five-year period ending at December 31, 2004.
Table 13
Outstanding Commercial Loans and Leases
| December 31 | FleetBoston April 1, 2004 | |||||||||||||||||||||||||||||||||||
| 2004 | 2003 | 2002 | 2001 | 2000 | ||||||||||||||||||||||||||||||||
| (Dollars in millions) | Amount | Percent | Amount | Percent | Amount | Percent | Amount | Percent | Amount | Percent | Amount | Percent | ||||||||||||||||||||||||
Commercial - domestic | $ | 122,095 | 62.9 | % | $ | 91,491 | 69.7 | % | $ | 99,151 | 68.3 | % | $ | 110,981 | 67.7 | % | $ | 138,367 | 68.0 | % | $ | 31,796 | 51.6 | % | ||||||||||||
Commercial real estate(1) | 32,319 | 16.7 | 19,367 | 14.7 | 20,205 | 13.9 | 22,655 | 13.8 | 26,436 | 13.0 | 9,982 | 16.2 | ||||||||||||||||||||||||
Commercial lease financing | 21,115 | 10.9 | 9,692 | 7.4 | 10,386 | 7.2 | 11,404 | 7.0 | 11,888 | 5.8 | 10,720 | 17.4 | ||||||||||||||||||||||||
Commercial - foreign | 18,401 | 9.5 | 10,754 | 8.2 | 15,428 | 10.6 | 18,858 | 11.5 | 26,851 | 13.2 | 9,160 | 14.8 | ||||||||||||||||||||||||
Total commercial loans and leases | $ | 193,930 | 100.0 | % | $ | 131,304 | 100.0 | % | $ | 145,170 | 100.0 | % | $ | 163,898 | 100.0 | % | $ | 203,542 | 100.0 | % | $ | 61,658 | 100.0 | % | ||||||||||||
| (1) | Includes domestic commercial real estate loans of $31,879, $19,043, $19,910, $22,272 and $26,154 at December 31, 2004, 2003, 2002, 2001 and 2000, respectively; and foreign commercial real estate loans of $440, $324, $295, $383 and $282 at December 31, 2004, 2003, 2002, 2001 and 2000, respectively. |
Concentrations of Commercial Credit Risk
Portfolio credit risk is evaluated and managed with a goal that concentrations of credit exposure do not result in undesirable levels of risk. We review, measure, and manage concentrations of credit exposure by industry, product, geography and customer relationship. Distribution of Loans and Leases by loan size is an additional measure of the portfolio risk diversification. We also review, measure, and manage commercial real estate loans by geographic location and property type. In addition, within our international portfolio, we evaluate borrowings by region and by country. Tables 14 through 19 summarize these concentrations. These activities play an important role in managing credit risk concentrations and for other risk mitigation purposes.
From the perspective of portfolio risk management, customer concentration management is most relevant inGlobal Capital Markets and Investment Banking. WithinGlobal Capital Markets and Investment Banking, concentrations continue to be addressed through the underwriting and ongoing monitoring processes, the established strategy of “originate to distribute” and partly through the purchase of credit protection through credit derivatives. We utilize various risk mitigation tools to economically hedge our risk to certain credit counterparties. Credit derivatives are financial instruments that we purchase for protection against the deterioration of credit quality. At December 31, 2004, we had $13.1 billion of credit protection. The total cost of the premium of the credit derivatives portfolio was $84 million and $68 million for 2004 and 2003, respectively. Two widely used tools are credit default swaps and collateralized loan obligations (CLOs) in which a layer of loss is sold to third parties. Earnings volatility increases due to accounting asymmetry as we mark to market the credit default swaps, as required by SFAS 133, and CLOs through Trading Account Profits, while the loans are recorded at historical cost less allowance for credit losses or, if held-for-sale, the lower of cost or market. The cost of credit portfolio hedges including the negative mark-to-market was $144 million and $330 million for 2004 and 2003, respectively.
Table 14 shows commercial utilized credit exposure by industry based on Standard & Poor’s industry classifications and includes commercial loans and leases, SBLCs and financial guarantees, derivatives, assets held-for-sale and commercial letters of credit. As shown in the following table, commercial utilized credit exposure is diversified across a range of industries.
Table 14
Commercial Utilized Credit Exposure by Industry
| December 31 | FleetBoston April 1, 2004 | ||||||||
| (Dollars in millions) | 2004 | 2003 | |||||||
Real estate(1) | $ | 36,672 | $ | 22,228 | $ | 12,957 | |||
Diversified financials | 25,932 | 20,427 | 3,557 | ||||||
Banks | 25,265 | 25,088 | 1,040 | ||||||
Retailing | 23,149 | 15,152 | 6,539 | ||||||
Education and government | 17,429 | 13,919 | 1,629 | ||||||
Individuals and trusts | 16,110 | 14,307 | 2,627 | ||||||
Materials | 14,123 | 8,860 | 5,079 | ||||||
Consumer durables and apparel | 13,427 | 8,313 | 3,482 | ||||||
Leisure and sports, hotels and restaurants | 13,331 | 10,099 | 2,940 | ||||||
Transportation | 13,234 | 9,355 | 3,268 | ||||||
Healthcare equipment and services | 12,643 | 7,064 | 4,939 | ||||||
Capital goods | 12,633 | 8,244 | 4,355 | ||||||
Commercial services and supplies | 11,944 | 7,206 | 3,866 | ||||||
Food, beverage and tobacco | 11,687 | 9,134 | 2,552 | ||||||
Energy | 7,579 | 4,348 | 2,044 | ||||||
Media | 6,232 | 4,701 | 2,616 | ||||||
Insurance | 5,851 | 3,638 | 2,822 | ||||||
Religious and social organizations | 5,710 | 4,272 | 475 | ||||||
Utilities | 5,615 | 5,012 | 1,948 | ||||||
Food and staples retailing | 3,610 | 1,837 | 1,456 | ||||||
Technology hardware and equipment | 3,398 | 1,941 | 1,463 | ||||||
Software and services | 3,292 | 1,655 | 770 | ||||||
Telecommunication services | 3,030 | 2,526 | 883 | ||||||
Automobiles and components | 1,894 | 1,326 | 746 | ||||||
Pharmaceuticals and biotechnology | 994 | 466 | 590 | ||||||
Household and personal products | 371 | 302 | 195 | ||||||
Other | 3,132 | 1,474 | 3,751 | ||||||
Total | $ | 298,287 | $ | 212,894 | $ | 78,589 | |||
| (1) | Industries are viewed from a variety of perspectives to best isolate the perceived risks. For purposes of this table, the real estate industry is defined based upon the borrowers’ or counterparties’ primary business activity using operating cash flow and primary source of repayment as key factors. |
Table 15 presents the non-real estate outstanding commercial loans and leases by industry. As shown in the table, the non-real estate commercial loan and lease portfolio is diversified across a range of industries.
Table 15
Non-real Estate Outstanding Commercial Loans and Leases by Industry
| December 31 | FleetBoston April 1, 2004 | ||||||||
| (Dollars in millions) | 2004 | 2003 | |||||||
Retailing | $ | 16,908 | $ | 11,474 | $ | 4,287 | |||
Diversified financials | 12,454 | 6,469 | 2,135 | ||||||
Individuals and trusts | 12,357 | 10,510 | 2,681 | ||||||
Transportation | 11,135 | 7,715 | 2,806 | ||||||
Education and government | 10,134 | 7,874 | 1,155 | ||||||
Capital goods | 9,673 | 5,729 | 4,073 | ||||||
Materials | 9,547 | 5,704 | 4,191 | ||||||
Commercial services and supplies | 9,362 | 5,701 | 2,876 | ||||||
Food, beverage and tobacco | 9,344 | 6,942 | 2,326 | ||||||
Leisure and sports, hotels and restaurants | 8,987 | 7,477 | 2,488 | ||||||
Healthcare equipment and services | 7,972 | 4,052 | 3,460 | ||||||
Real estate(1) | 6,140 | 4,413 | 3,608 | ||||||
Energy | 4,627 | 2,516 | 1,740 | ||||||
Consumer durables and apparel | 4,564 | 2,161 | 2,269 | ||||||
Media | 4,468 | 2,821 | 2,566 | ||||||
Religious and social organizations | 3,951 | 2,975 | 431 | ||||||
Utilities | 3,274 | 2,635 | 1,431 | ||||||
Food and staples retailing | 2,701 | 1,364 | 1,349 | ||||||
Technology hardware and equipment | 2,482 | 1,260 | 1,142 | ||||||
Software and services | 2,430 | 948 | 713 | ||||||
Telecommunication services | 2,382 | 1,967 | 812 | ||||||
Banks | 2,044 | 1,199 | 454 | ||||||
Automobiles and components | 1,643 | 1,029 | 570 | ||||||
Insurance | 1,478 | 840 | 492 | ||||||
Other(2) | 1,554 | 6,162 | 1,621 | ||||||
Total | $ | 161,611 | $ | 111,937 | $ | 51,676 | |||
| (1) | Commercial product loans and leases to borrowers in the real estate industry for which the ultimate source of repayment is not dependent on the sale, lease, rental or refinancing of real estate. |
| (2) | Other includes loans and leases to the pharmaceutical, biotechnology, household and personal products industries. Reduction in the Other category was primarily attributable to a revision in the methodology for assigning industries to margin loan and commercial credit card exposure. These exposures were previously assigned to Other. |
Table 16 presents outstanding commercial real estate loans by geographic region and by property type. The amounts outstanding exclude commercial loans and leases secured by owner-occupied real estate. Therefore, the amounts exclude outstanding loans and leases that were made on the general creditworthiness of the borrower for which real estate was obtained as security and for which the ultimate repayment of the credit is not dependent on the sale, lease, rental or refinancing of the real estate. As shown in the table, the commercial real estate loan portfolio is diversified in terms of geographic region and property type.
Table 16
Outstanding Commercial Real Estate Loans(1)
| December 31 | FleetBoston April 1, 2004 | ||||||||
| (Dollars in millions) | 2004 | 2003 | |||||||
By Geographic Region(2) | |||||||||
Northeast | $ | 6,700 | $ | 683 | $ | 3,732 | |||
California | 6,293 | 4,705 | 567 | ||||||
Florida | 3,562 | 2,663 | 215 | ||||||
Southeast | 3,448 | 2,642 | 387 | ||||||
Southwest | 3,265 | 2,725 | 389 | ||||||
Northwest | 2,038 | 1,976 | 68 | ||||||
Midwest | 1,860 | 1,431 | 347 | ||||||
Midsouth | 1,379 | 1,139 | 152 | ||||||
Other states(3) | 1,184 | 448 | 3,234 | ||||||
Geographically diversified | 2,150 | 631 | 769 | ||||||
Non-U.S. | 440 | 324 | 122 | ||||||
Total | $ | 32,319 | $ | 19,367 | $ | 9,982 | |||
By Property Type | |||||||||
Residential | $ | 5,992 | $ | 3,631 | $ | 314 | |||
Office buildings | 5,434 | 3,431 | 2,649 | ||||||
Apartments | 4,940 | 3,411 | 1,687 | ||||||
Shopping centers/retail | 4,490 | 2,295 | 1,474 | ||||||
Land and land development | 2,388 | 1,494 | 155 | ||||||
Industrial/warehouse | 2,263 | 1,790 | 351 | ||||||
Hotels/motels | 909 | 548 | 531 | ||||||
Multiple use | 744 | 560 | 269 | ||||||
Resorts | 252 | 261 | — | ||||||
Other | 4,907 | 1,946 | 2,552 | ||||||
Total | $ | 32,319 | $ | 19,367 | $ | 9,982 | |||
| (1) | For purposes of this table, commercial real estate product reflects loans dependent on the sale, lease or refinance of real estate as the final source of repayment. |
| (2) | Distribution is based on geographic location of collateral. Geographic regions are in the U.S. unless otherwise noted. |
| (3) | The reduction in Other states subsequent to April 1, 2004 is the result of a more granular distribution of the FleetBoston portfolio to other geographic regions including the Northeast. |
Foreign Portfolio
Table 17 sets forth total foreign exposure broken out by region at December 31, 2004 and 2003. Total foreign exposure is defined to include credit exposure, net of local liabilities, plus securities and other investments for all exposure with a country of risk other than the United States.
Table 17
Regional Foreign Exposure(1)
| December 31 | FleetBoston April 1, 2004 | ||||||||
| (Dollars in millions) | 2004 | 2003 | |||||||
Europe | $ | 62,428 | $ | 39,496 | $ | 5,003 | |||
Latin America(2,3) | 10,823 | 5,791 | 7,568 | ||||||
Asia Pacific(2,4) | 10,736 | 9,547 | 443 | ||||||
Middle East | 527 | 584 | 82 | ||||||
Africa | 238 | 108 | 41 | ||||||
Other(5) | 5,327 | 4,374 | 865 | ||||||
Total | $ | 90,079 | $ | 59,900 | $ | 14,002 | |||
| (1) | The balances above reflect the subtraction of local funding or liabilities from local exposures as allowed by the Federal Financial Institutions Examination Council (FFIEC). |
| (2) | Exposures for Latin America and Asia Pacific have been reduced by $196 and $14, respectively, at December 31, 2004, and $173 and $13, respectively, at December 31, 2003. Such amounts represent the fair value of U.S. Treasury securities held as collateral outside the country of exposure. |
| (3) | Includes Bermuda and Cayman Islands. |
| (4) | Includes Australia and New Zealand. |
| (5) | Other includes Canada and supranational entities. |
Our total foreign exposure was $90.1 billion at December 31, 2004, an increase of $30.2 billion from December 31, 2003. Our foreign exposure was concentrated in Europe, which accounted for $62.4 billion, or 69 percent, of total foreign exposure. The increase in total foreign exposure is due to growth in Europe and the addition of exposure associated with FleetBoston. Growth of exposure in Europe during 2004 was mostly in Western Europe and was distributed across a variety of industries with the largest concentration in the banking sector that accounted for approximately 53 percent of the growth. At December 31, 2004 and 2003, the United Kingdom and Germany were the only countries whose total cross-border outstandings exceeded 0.75 percent of our total assets. Our second largest foreign exposure was in Latin America, which accounted for $10.8 billion, or 12 percent, of total foreign exposure. Growth of exposure in Latin America during 2004 was due to the addition of operations associated with FleetBoston. Latin America, including Brazil and Argentina, may continue to experience economic, political and social uncertainties, which may impact market, credit, and transfer risk of this region. For more information on our Latin America exposure, see the discussion of emerging markets on page 52.
As shown in Table 18, at December 31, 2004 and 2003, Germany had total cross-border exposure of $12.0 billion and $6.9 billion, respectively, representing 1.08 percent and 0.95 percent of total assets, respectively. At December 31, 2004 and 2003, the United Kingdom had total cross-border exposure of $11.9 billion and $10.1 billion, respectively, representing 1.07 percent and 1.41 percent of total assets, respectively. The largest concentration of the exposure to both of these countries was with banks.
Table 18
Cross-border Exposure Exceeding One Percent of Total Assets(1,2)
| (Dollars in millions) | December 31 | Public Sector | Banks | Private Sector | Cross - border Exposure | Exposure as a Percentage of Total Assets | |||||||||||
Germany | 2004 2003 2002 | $ | 659 441 334 | $ | 6,251 3,436 2,898 | $ | 5,081 2,978 2,534 | $ | 11,991 6,855 5,766 | 1.08 0.95 0.89 | % | ||||||
United Kingdom | 2004 2003 2002 | $ | 74 143 167 | $ | 3,239 3,426 2,492 | $ | 8,606 6,552 6,758 | $ | 11,919 10,121 9,417 | 1.07 1.41 1.46 | % | ||||||
| (1) | Exposure includes cross-border claims by our foreign offices as follows: loans, accrued interest receivable, acceptances, time deposits placed, trading account assets, securities, derivative assets, other interest-earning investments and other monetary assets. Amounts also include unused commitments, SBLCs, commercial letters of credit and formal guarantees. Sector definitions are based on the FFIEC instructions for preparing the Country Exposure Report. |
| (2) | The total cross-border exposure for Germany and United Kingdom at December 31, 2004 includes derivatives exposure of $3,641 and $2,564, respectively, against which we hold collateral totaling $1,477 and $1,788, respectively. |
As shown in Table 19, at December 31, 2004, foreign exposure to borrowers or counterparties in emerging markets increased 42 percent to $15.5 billion, or 17 percent, of total foreign exposure, from $10.9 billion, or 18 percent, of total exposure at the end of 2003. At December 31, 2004, 58 percent of the emerging markets exposure was in Latin America compared to 42 percent at December 31, 2003. The increase in Latin America was attributable to the addition of the $6.7 billion FleetBoston portfolio on April 1, 2004. This growth was partially offset by continued reductions in Loans and Leases, and trading activity exposure in Argentina, Brazil and Chile. Our 24.9 percent investment in Grupo Financiero Santander Serfin (GFSS) accounted for $1.9 billion of reported exposure in Mexico.
The company’s largest exposure in Latin America was in Brazil. Our exposure in Brazil at December 31, 2004 and 2003, included $1.4 billion and $331 million, respectively, of traditional cross-border credit exposure (Loans and Leases, letters of credit, etc.), and $1.8 billion and $193 million, respectively, of local country exposure net of local liabilities. Nonperforming assets in Brazil were $38 million at December 31, 2004, compared to $39 million at December 31, 2003. For 2004 and 2003, net charge-offs totaled $59 million and $33 million, respectively.
We have risk mitigation instruments associated with certain exposures for Brazil, including structured trade transactions intended to mitigate transfer risk of $950 million and third party funding of $286 million, resulting in our total foreign exposure net of risk mitigation for Brazil of $2.2 billion.
Our exposure in Argentina at December 31, 2004 and 2003, included $286 million and $135 million, respectively, of traditional cross-border credit exposure (Loans and Leases, letters of credit, etc.), and $16 million and $24 million, respectively, of local country exposure net of local liabilities. Also included in Argentina’s December 31, 2004 balance were $89 million of securities. At December 31, 2004, Argentina nonperforming assets, including securities, were $350 million compared to $107 million at December 31, 2003. For 2004, net recoveries for Argentina totaled $3 million compared to net charge-offs of $82 million in 2003.
At December 31, 2004, 41 percent of the emerging markets exposure was in Asia Pacific compared to 55 percent at December 31, 2003. Asia Pacific emerging markets exposure was largely unchanged. Increases in Taiwan and Hong Kong were offset by decreases in South Korea, Singapore and Other Asia Pacific. The increase in Taiwan was attributable to higher short-term placements with other financial institutions, and commercial loans and leases. The increase in Hong Kong was due to higher swaps and derivatives exposure to other financial institutions. Higher commercial loans and leases also contributed to the increase in Hong Kong.
Table 19 sets forth regional foreign exposure to selected countries defined as emerging markets.
Table 19
Selected Emerging Markets(1)
| (Dollars in millions) | Loans and Leases, and Loan Commitments | Other Financing(2) | Derivative Assets | Securities/ Other Investments(3,4) | Total Cross- border Exposure(5) | Local Country Exposure Net of Local Liabilities(6) | Total Foreign Exposure December 31, 2004 | Increase/ (Decrease) from December 31, 2003 | Fleet- Boston April 1, 2004 | |||||||||||||||||||
Region/Country | ||||||||||||||||||||||||||||
Latin America | ||||||||||||||||||||||||||||
Brazil | $ | 1,179 | $ | 268 | $ | 19 | $ | 122 | $ | 1,588 | $ | 1,837 | $ | 3,425 | $ | 2,754 | $ | 3,838 | ||||||||||
Mexico(7) | 578 | 148 | 136 | 2,004 | 2,866 | — | 2,866 | 83 | 570 | |||||||||||||||||||
Chile | 215 | 122 | 1 | 3 | 341 | 839 | 1,180 | 1,049 | 1,186 | |||||||||||||||||||
Argentina | 181 | 105 | — | 89 | 375 | 16 | 391 | 80 | 542 | |||||||||||||||||||
Other Latin America(8) | 311 | 180 | 144 | 248 | 883 | 192 | 1,075 | 358 | 579 | |||||||||||||||||||
Total Latin America | 2,464 | 823 | 300 | 2,466 | 6,053 | 2,884 | 8,937 | 4,324 | 6,715 | |||||||||||||||||||
Asia Pacific | ||||||||||||||||||||||||||||
India | 311 | 268 | 140 | 225 | 944 | 548 | 1,492 | (73 | ) | 9 | ||||||||||||||||||
South Korea | 290 | 477 | 89 | 213 | 1,069 | 314 | 1,383 | (235 | ) | 158 | ||||||||||||||||||
Taiwan | 214 | 114 | 82 | 42 | 452 | 875 | 1,327 | 786 | 26 | |||||||||||||||||||
Hong Kong | 225 | 57 | 307 | 129 | 718 | 401 | 1,119 | 249 | 6 | |||||||||||||||||||
Singapore | 200 | 23 | 70 | 47 | 340 | — | 340 | (227 | ) | 21 | ||||||||||||||||||
Other Asia Pacific(8) | 81 | 80 | 58 | 278 | 497 | 157 | 654 | (222 | ) | 50 | ||||||||||||||||||
Total Asia Pacific | 1,321 | 1,019 | 746 | 934 | 4,020 | 2,295 | 6,315 | 278 | 270 | |||||||||||||||||||
Central and Eastern Europe(8) | 7 | 30 | 31 | 173 | 241 | — | 241 | (29 | ) | — | ||||||||||||||||||
Total | $ | 3,792 | $ | 1,872 | $ | 1,077 | $ | 3,573 | $ | 10,314 | $ | 5,179 | $ | 15,493 | $ | 4,573 | $ | 6,985 | ||||||||||
| (1) | There is no generally accepted definition of emerging markets. The definition that we use includes all countries in Latin America excluding Cayman Islands and Bermuda; all countries in Asia Pacific excluding Japan, Australia and New Zealand; and all countries in Central and Eastern Europe excluding Greece. |
| (2) | Includes acceptances, SBLCs, commercial letters of credit and formal guarantees. |
| (3) | Amounts outstanding for Other Latin America and Other Asia Pacific have been reduced by $196 and $14, respectively, at December 31, 2004 and $173 and $13, respectively, at December 31, 2003. Such amounts represent the fair value of U.S. Treasury securities held as collateral outside the country of exposure. |
| (4) | Cross-border resale agreements are presented based on the domicile of the counterparty because the counterparty has the legal obligation for repayment. For regulatory reporting under FFIEC guidelines, cross-border resale agreements are presented based on the domicile of the issuer of the securities that are held as collateral. |
| (5) | Cross-border exposure includes amounts payable to us by borrowers or counterparties with a country of residence other than the one in which the credit is booked, regardless of the currency in which the claim is denominated, consistent with FFIEC reporting rules. |
| (6) | Local country exposure includes amounts payable to us by borrowers with a country of residence in which the credit is booked, regardless of the currency in which the claim is denominated. Management subtracts local funding or liabilities from local exposures as allowed by the FFIEC. Total amount of local country exposure funded by local liabilities at December 31, 2004 was $17,189 compared to $5,336 at December 31, 2003. Local country exposure funded by local liabilities at December 31, 2004 in Latin America and Asia Pacific was $9,098 and $8,091, respectively, of which $4,240 was in Brazil, $3,432 in Hong Kong, $2,596 in Singapore, $1,662 in Argentina, $1,210 in Chile and $1,092 in Mexico. There were no other countries with local country exposure funded by local liabilities greater than $500. |
| (7) | Includes $1,859 related to GFSS acquired in the first quarter of 2003. |
| (8) | Other Latin America, Other Asia Pacific, and Central and Eastern Europe include countries each with total foreign exposure of less than $300. |
Commercial Portfolio Credit Quality Performance
Overall commercial credit quality continued to improve in 2004 due to an improving economy and high levels of liquidity in the capital markets. All major commercial asset quality performance indicators showed positive trends. Net charge-offs, nonperforming assets and criticized exposure continued to decline. As presented in Table 20, commercial criticized credit exposure decreased $2.4 billion, or 19 percent, to $10.2 billion at December 31, 2004. The net decrease was driven by $16.8 billion of paydowns, payoffs, credit quality improvements, loan sales and net charge-offs; partially offset by the addition of $7.1 billion of FleetBoston commercial criticized exposure on April 1, 2004 and $7.3 billion of newly criticized exposure.
The decrease in 2004 was centered inGlobal Capital Markets and Investment Banking, Global Business and Financial Services andLatin America. These businesses combined to reduce commercial criticized exposure by $2.2 billion during 2004, despite the addition of the FleetBoston commercial criticized exposure balance of $6.8 billion on April 1, 2004, related to these businesses. Reductions were concentrated in the utilities, aerospace and defense, and telecommunications industries.
Table 20 presents commercial criticized exposure at December 31, 2004 and 2003.
Table 20
Commercial Criticized Exposure(1)
| December 31 | FleetBoston April 1, 2004 | |||||||||||||||||
| 2004 | 2003 | |||||||||||||||||
| (Dollars in millions) | Amount | Percent(2) | Amount | Percent(2) | Amount | Percent(2) | ||||||||||||
Commercial - domestic | $ | 6,340 | 3.38 | % | $ | 8,044 | 5.73 | % | $ | 4,830 | 9.86 | % | ||||||
Commercial real estate | 1,028 | 2.54 | 983 | 3.89 | 406 | 4.08 | ||||||||||||
Commercial lease financing | 1,347 | 6.38 | 1,011 | 10.43 | 768 | 5.42 | ||||||||||||
Commercial - foreign | 1,534 | 3.12 | 2,612 | 6.97 | 1,057 | 10.01 | ||||||||||||
Total commercial criticized exposure | $ | 10,249 | 3.44 | % | $ | 12,650 | 5.94 | % | $ | 7,061 | 8.44 | % | ||||||
| (1) | Criticized exposure corresponds to the Special Mention, Substandard and Doubtful asset categories defined by regulatory authorities. Exposure amounts include loans and leases, SBLCs and financial guarantees, derivative assets, assets held-for-sale and commercial letters of credit. |
| (2) | Commercial criticized exposure is taken as a percentage of total commercial utilized exposure which includes loans and leases, SBLCs and financial guarantees, derivative assets, assets held-for-sale and commercial letters of credit. |
We routinely review the loan and lease portfolio to determine if any credit exposure should be placed on nonperforming status. An asset is placed on nonperforming status when it is determined that full collection of principal and/or interest in accordance with its contractual terms is not probable. As presented in Table 21, nonperforming commercial assets decreased $654 million to $1.6 billion at December 31, 2004 due primarily to the $760 million decrease in the nonperforming commercial loans and leases despite the addition of the $944 million FleetBoston nonperforming commercial loans and leases at April 1, 2004. The decrease in 2004 was centered inLatin America, Global Capital Markets and Investment Banking andGlobal Business and Financial Services.These businesses combined to reduce nonperforming commercial loans and leases by $566 million during 2004, despite the addition of the FleetBoston commercial nonperforming loan and lease balance of $874 million on April 1, 2004, related to these businesses. The decreases in total nonperforming commercial loans and leases resulted from paydowns and payoffs of $1.4 billion, charge-offs of $640 million, loan sales of $515 million and returns to performing status of $348 million, partially offset by new nonaccrual loan inflows of $1.3 billion and the addition of nonperforming loans and leases from the FleetBoston portfolio. Increased levels of paydowns and payoffs compared to 2003 resulted from the improvement in credit quality experienced in 2004.
Nonperforming commercial – domestic loans decreased by $533 million and represented 0.70 percent of commercial – domestic loans at December 31, 2004 compared to 1.52 percent at December 31, 2003. Nonperforming commercial – foreign loans decreased $311 million and represented 1.45 percent of commercial – foreign loans at December 31, 2004 compared to 5.37 percent at December 31, 2003. The improvement in the percentage of nonperforming commercial – domestic loans to the total commercial –domestic loans was driven by the growth in commercial – domestic loans and the addition of the FleetBoston portfolio.
Nonperforming commercial asset sales in 2004 were $601 million, comprised of $515 million of nonperforming commercial loans, $74 million of commercial foreclosed properties and $12 million of nonperforming securities. Nonperforming commercial asset sales in 2003 totaled $1.6 billion, comprised of $1.5 billion of nonperforming commercial loans and $123 million of commercial foreclosed properties.
Table 21 presents nonperforming commercial assets for each year in the five-year period ending at December 31, 2004.
Table 21
Nonperforming Commercial Assets(1)
| December 31 | FleetBoston April 1, 2004 | |||||||||||||||||||||||
| (Dollars in millions) | 2004 | 2003 | 2002 | 2001 | 2000 | |||||||||||||||||||
Nonperforming commercial loans and leases | ||||||||||||||||||||||||
Commercial - domestic | $ | 855 | $ | 1,388 | $ | 2,621 | $ | 2,991 | $ | 2,715 | $ | 317 | ||||||||||||
Commercial real estate | 87 | 142 | 164 | 243 | 239 | 80 | ||||||||||||||||||
Commercial lease financing | 266 | 127 | 160 | 134 | 65 | 51 | ||||||||||||||||||
Commercial - foreign | 267 | 578 | 1,359 | 459 | 482 | 496 | ||||||||||||||||||
Total nonperforming commercial loans and leases | 1,475 | 2,235 | 4,304 | 3,827 | 3,501 | 944 | ||||||||||||||||||
Nonperforming securities(2) | 140 | — | — | — | — | 135 | ||||||||||||||||||
Commercial foreclosed properties | 33 | 67 | 126 | 68 | 67 | 13 | ||||||||||||||||||
Total nonperforming commercial assets(3) | $ | 1,648 | $ | 2,302 | $ | 4,430 | $ | 3,895 | $ | 3,568 | $ | 1,092 | ||||||||||||
Nonperforming commercial loans and leases as a percentage of outstanding commercial loans and leases | 0.76 | % | 1.70 | % | 2.96 | % | 2.33 | % | 1.72 | % | 1.53 | % | ||||||||||||
Nonperforming commercial assets as a percentage of outstanding commercial loans, leases and foreclosed properties | 0.85 | 1.75 | 3.05 | 2.38 | 1.75 | 1.77 | ||||||||||||||||||
| (1) | In 2004, $111 in Interest Income was estimated to be contractually due on nonperforming commercial loans and leases, and troubled debt restructured loans. |
| (2) | Primarily related to international securities held in the AFS securities portfolio. |
| (3) | Balances do not include $123, $186, $73, $289 and $84 of nonperforming commercial assets, primarily commercial loans held-for-sale included in Other Assets at December 31, 2004, 2003, 2002, 2001 and 2000, respectively. |
Table 22 presents the additions and reductions to nonperforming assets in the commercial portfolio during 2004 and 2003.
Table 22
Nonperforming Commercial Assets Activity
| (Dollars in millions) | 2004 | 2003 | ||||||
Nonperforming loans and leases, and foreclosed properties | ||||||||
Balance, January 1 | $ | 2,302 | $ | 4,430 | ||||
Additions to nonperforming assets: | ||||||||
FleetBoston balance, April 1, 2004 | 957 | — | ||||||
New nonaccrual | 1,294 | 2,134 | ||||||
Advances | 82 | 199 | ||||||
Total additions | 2,333 | 2,333 | ||||||
Reductions in nonperforming assets: | ||||||||
Paydowns and payoffs | (1,405 | ) | (1,221 | ) | ||||
Sales | (589 | ) | (1,583 | ) | ||||
Returns to performing status(1) | (348 | ) | (197 | ) | ||||
Charge-offs(2) | (640 | ) | (1,352 | ) | ||||
Transfers to assets held-for-sale | (145 | ) | (108 | ) | ||||
Total reductions | (3,127 | ) | (4,461 | ) | ||||
Total net reductions in nonperforming assets | (794 | ) | (2,128 | ) | ||||
Nonperforming securities(3) | ||||||||
Balance, January 1 | — | — | ||||||
Additions to nonperforming assets: | ||||||||
FleetBoston balance, April 1, 2004 | 135 | — | ||||||
New nonaccrual | 56 | — | ||||||
Reductions in nonperforming assets: | ||||||||
Paydowns and payoffs | (39 | ) | — | |||||
Sales | (12 | ) | — | |||||
Total net securities additions to nonperforming assets | 140 | — | ||||||
Nonperforming commercial assets, December 31 | $ | 1,648 | $ | 2,302 | ||||
| (1) | Commercial loans and leases may be restored to performing status when all principal and interest is current and full repayment of the remaining contractual principal and interest is expected, or when the loan otherwise becomes well secured and is in the process of collection. |
| (2) | Certain loan and lease products, including commercial credit card, are not classified as nonperforming; therefore, the charge-offs on these loans are not included above. |
| (3) | Primarily related to international securities held in the AFS securities portfolio. |
Domestic commercial loans past due 90 days or more and still accruing interest were $121 million at December 31, 2004 compared to $108 million at December 31, 2003. The increase was driven by the addition of the FleetBoston past due portfolio of $28 million on April 1, 2004.
Table 23 presents commercial net charge-offs and net charge-off ratios for 2004 and 2003.
Table 23
Commercial Net Charge-offs and Net Charge-off Ratios(1)
| 2004 | 2003 | ||||||||||||
| (Dollars in millions) | Amount | Percent | Amount | Percent | |||||||||
Commercial - domestic | $ | 177 | 0.15 | % | $ | 633 | 0.68 | % | |||||
Commercial real estate | (3 | ) | (0.01 | ) | 41 | 0.20 | |||||||
Commercial lease financing | 9 | 0.05 | 124 | 1.23 | |||||||||
Commercial - foreign | 173 | 1.05 | 306 | 2.36 | |||||||||
Total commercial | $ | 356 | 0.20 | % | $ | 1,104 | 0.81 | % | |||||
| (1) | Percentage amounts are calculated as net charge-offs divided by averageoutstanding loans and leases during the year for each loan category. |
Commercial — domestic loan net charge-offs, as presented in Table 23, decreased $456 million to $177 million in 2004, reflecting overall improvement in the portfolio.
Commercial — foreign loan net charge-offs were $173 million in 2004 compared to $306 million in 2003. The decrease reflected lower net charge-offs in Argentina, the United Kingdom and Italy. The industry with the largest decrease in net charge-offs was utilities. The country with the largest net charge-offs in 2004 was Italy.
At December 31, 2004 and 2003, our credit exposure related to Parmalat Finanziaria S.p.A. and its related entities (Parmalat) was less than $1 million and $274 million, respectively; the latter number included $30 million of derivatives. Nonperforming loans related to Parmalat were less than $1 million and $226 million at December 31, 2004 and 2003, respectively.
Included in Other Assets were commercial loans held-for-sale and leveraged lease partnership interests of $1.3 billion and $198 million, respectively, at December 31, 2004 and $1.6 billion and $332 million, respectively, at December 31, 2003. Included in these balances were nonperforming loans held-for-sale and leveraged lease partnership interests of $100 million and $23 million, respectively, at December 31, 2004 and $183 million and $3 million, respectively, at December 31, 2003.
Provision for Credit Losses
The Provision for Credit Losses was $2.8 billion in 2004, a two percent decline, despite the addition of the FleetBoston portfolio. The consumer portion of the Provision for Credit Losses increased to $3.6 billion in 2004 driven by consumer net charge-offs of $2.8 billion. Organic growth, overall seasoning of credit card accounts, the return of securitized loans to the balance sheet, and increases in minimum payment requirements drove higher consumer net charge-offs and consumer provision. The commercial portion of the Provision for Credit Losses was a negative $623 million in 2004 with commercial net charge-offs of $356 million. The commercial provision decreased due to continued commercial credit quality improvement. The Provision for Credit Losses included a negative $70 million related to changes in the general portion of the Allowance for Loan and Lease Losses due to improved economic conditions. The Provision for Credit Losses also included a negative $99 million related to changes in the reserve for unfunded lending commitments due to continued commercial credit quality improvement and improved economic conditions.
We expect that continued seasoning of credit card accounts, the return of approximately $4.5 billion of securitized loans to the balance sheet in 2005 and increased minimum payment requirements will result in higher levels of consumer net charge-offs in 2005. Commercial net charge-offs may return to more normalized levels during 2005. These anticipated increases in net charge-offs, coupled with less dramatic improvement in commercial credit quality than experienced in 2004, are expected to result in increases in the consumer and commercial portions of the Provision for Credit Losses in 2005.
Allowance for Credit Losses
Allowance for Loan and Lease Losses
The Allowance for Loan and Lease Losses is allocated based on three components. We evaluate the adequacy of the Allowance for Loan and Lease Losses based on the combined total of these three components.
The first component of the Allowance for Loan and Lease Losses covers those commercial loans that are either nonperforming or impaired. An allowance is allocated when the discounted cash flows (or collateral value or observable market price) are lower than the carrying value of that loan. For purposes of computing the specific loss component of the allowance, larger impaired loans are evaluated individually and smaller impaired loans are evaluated as a pool using historical loss experience for the respective product type and risk rating of the loans.
The second component of the Allowance for Loan and Lease Losses covers performing commercial loans and leases, and consumer loans. The allowance for commercial loans and leases is established by product type after analyzing historical loss experience, by internal risk rating, current economic conditions and performance trends within each portfolio segment. The commercial historical loss experience is updated quarterly to incorporate the most recent data reflective of the current economic environment. As of December 31, 2004, this resulted in an immaterial decrease to the commercial allowance for loan losses from updating the historical loss experience. The allowance for consumer loans is based on aggregated portfolio segment evaluations, generally by product type. Loss forecast models are utilized for consumer products that consider a variety of factors including, but not limited to, historical loss experience, estimated defaults or foreclosures based on portfolio trends, delinquencies, economic trends and credit scores. These consumer loss forecast models are updated on a quarterly basis in order to incorporate information reflective of the current economic environment. As of December 31, 2004, this resulted in an immaterial increase to the allowance for consumer loan and lease losses from updating the loss forecast models.
The third, or general component of the Allowance for Loan and Lease Losses is maintained to cover uncertainties that affect our estimate of probable losses. These uncertainties include the imprecision inherent in the forecasting methodologies, as well as domestic and global economic uncertainty and large single name defaults or event risk. We assess these components, and consider other current events, like the Merger, and other conditions, to determine the overall level of the third component. The relationship of the third component to the total Allowance for Loan and Lease Losses may fluctuate from period to period.
We monitor differences between estimated and actual incurred loan and lease losses. This monitoring process includes periodic assessments by senior management of loan and lease portfolios and the models used to estimate incurred losses in those portfolios.
Additions to the Allowance for Loan and Lease Losses are made by charges to the Provision for Credit Losses. Credit exposures deemed to be uncollectible are charged against the Allowance for Loan and Lease Losses. Recoveries of previously charged off amounts are credited to the Allowance for Loan and Lease Losses.
The Allowance for Loan and Lease Losses for the consumer portfolio as presented in Table 25 increased $1.3 billion to $3.8 billion from December 31, 2003 due to the addition of $592 million on April 1, 2004 of FleetBoston allowance for consumer loan and lease losses, and continued organic growth in consumer loans, primarily credit card. The Allowance for Loan and Lease Losses on the credit card portfolio increased $1.2 billion to $2.8 billion driven by the $466 million addition related to the FleetBoston on-balance sheet card portfolio on April 1, 2004, organic credit card portfolio growth, the return of previously securitized credit card balances to the balance sheet and increases in the minimum payment requirements.
The allowance for commercial loan and lease losses as presented in Table 25 was $3.2 billion at December 31, 2004, a $726 million increase from December 31, 2003. This increase was due to the addition on April 1, 2004 of $1.7 billion of FleetBoston allowance for commercial loans and leases to the portfolio partially offset by reductions resulting from improvement in the commercial loan portfolio. Commercial
credit quality continues to improve as reflected in the continued declines in both commercial criticized exposure and commercial nonperforming loans and leases. Specific reserves on commercial impaired loans decreased $189 million, or 48 percent, in 2004, reflecting the decrease in our investment in specific loans considered impaired of $910 million to $1.2 billion at December 31, 2004. The net decrease of $910 million included the addition of FleetBoston impaired loans on April 1, 2004 of $914 million offset by net decreases of $1.8 billion in 2004. The decreased levels of criticized, nonperforming and impaired loans, and the respective reserves were driven by overall improvement in commercial credit quality, including paydowns and payoffs, loan sales, net charge-offs and returns to performing status.
The general portion of the Allowance for Loan and Lease Losses increased $438 million during 2004. The addition of FleetBoston general reserves on April 1, 2004 accounted for $508 million of the increase. Although uncertainty regarding the depth and pace of the economic recovery existed early in the year, the fourth quarter demonstrated a strengthening of the economy, which led to a reduction in general reserves of $70 million in 2004.
Reserve for Unfunded Lending Commitments
In addition to the Allowance for Loan and Lease Losses, we also estimate probable losses related to unfunded lending commitments, such as letters of credit and financial guarantees, and binding unfunded loan commitments. Unfunded lending commitments are subject to individual reviews, and are analyzed and segregated by risk according to the Corporation’s internal risk rating scale. These risk classifications, in conjunction with an analysis of historical loss experience, current economic conditions and performance trends within specific portfolio segments, and any other pertinent information result in the estimation of the reserve for unfunded lending commitments. The reserve for unfunded lending commitments is included in Accrued Expenses and Other Liabilities on the Consolidated Balance Sheet.
We monitor differences between estimated and actual incurred credit losses. This monitoring process includes periodic assessments by senior management of credit portfolios and the models used to estimate incurred losses in those portfolios.
Additions to the reserve for unfunded lending commitments are made by charges to the Provision for Credit Losses. Credit exposures (excluding derivatives) deemed to be uncollectible are charged against the reserve.
The reserve for unfunded lending commitments decreased $14 million from December 31, 2003, primarily due to improved economic conditions and improvement in the level of criticized letters of credit, partially offset by the addition of $85 million of reserves on April 1, 2004 associated with FleetBoston unfunded lending commitments.
Table 24 presents a rollforward of the allowance for credit losses for five years ending December 31, 2004.
Table 24
Allowance for Credit Losses
| (Dollars in millions) | 2004 | 2003 | 2002 | 2001 | 2000 | |||||||||||||||
Allowance for loan and lease losses, January 1 | $ | 6,163 | $ | 6,358 | $ | 6,278 | $ | 6,365 | $ | 6,314 | ||||||||||
FleetBoston balance, April 1, 2004 | 2,763 | — | — | — | — | |||||||||||||||
Loans and leases charged off | ||||||||||||||||||||
Residential mortgage | (62 | ) | (64 | ) | (56 | ) | (39 | ) | (36 | ) | ||||||||||
Credit card | (2,536 | ) | (1,657 | ) | (1,210 | ) | (753 | ) | (392 | ) | ||||||||||
Home equity lines | (38 | ) | (38 | ) | (40 | ) | (32 | ) | (29 | ) | ||||||||||
Direct/Indirect consumer | (344 | ) | (322 | ) | (355 | ) | (389 | ) | (395 | ) | ||||||||||
Other consumer(1) | (295 | ) | (343 | ) | (395 | ) | (1,216 | ) | (582 | ) | ||||||||||
Total consumer | (3,275 | ) | (2,424 | ) | (2,056 | ) | (2,429 | ) | (1,434 | ) | ||||||||||
Commercial - domestic | (504 | ) | (857 | ) | (1,625 | ) | (2,021 | ) | (1,396 | ) | ||||||||||
Commercial real estate | (12 | ) | (46 | ) | (45 | ) | (46 | ) | (31 | ) | ||||||||||
Commercial lease financing | (39 | ) | (132 | ) | (168 | ) | (99 | ) | (17 | ) | ||||||||||
Commercial - foreign | (262 | ) | (408 | ) | (566 | ) | (249 | ) | (117 | ) | ||||||||||
Total commercial | (817 | ) | (1,443 | ) | (2,404 | ) | (2,415 | ) | (1,561 | ) | ||||||||||
Total loans and leases charged off | (4,092 | ) | (3,867 | ) | (4,460 | ) | (4,844 | ) | (2,995 | ) | ||||||||||
Recoveries of loans and leases previously charged off | ||||||||||||||||||||
Residential mortgage | 26 | 24 | 14 | 13 | 9 | |||||||||||||||
Credit card | 231 | 143 | 116 | 81 | 54 | |||||||||||||||
Home equity lines | 23 | 26 | 14 | 13 | 9 | |||||||||||||||
Direct/Indirect consumer | 136 | 141 | 145 | 139 | 149 | |||||||||||||||
Other consumer | 102 | 88 | 99 | 135 | 197 | |||||||||||||||
Total consumer | 518 | 422 | 388 | 381 | 418 | |||||||||||||||
Commercial - domestic | 327 | 224 | 314 | 167 | 122 | |||||||||||||||
Commercial real estate | 15 | 5 | 7 | 7 | 20 | |||||||||||||||
Commercial lease financing | 30 | 8 | 9 | 4 | 4 | |||||||||||||||
Commercial - foreign | 89 | 102 | 45 | 41 | 31 | |||||||||||||||
Total commercial | 461 | 339 | 375 | 219 | 177 | |||||||||||||||
Total recoveries of loans and leases previously charged off | 979 | 761 | 763 | 600 | 595 | |||||||||||||||
Net charge-offs | (3,113 | ) | (3,106 | ) | (3,697 | ) | (4,244 | ) | (2,400 | ) | ||||||||||
Provision for loan and lease losses(2) | 2,868 | 2,916 | 3,801 | 4,163 | 2,576 | |||||||||||||||
Transfers(3) | (55 | ) | (5 | ) | (24 | ) | (6 | ) | (125 | ) | ||||||||||
Allowance for loan and lease losses, December 31 | 8,626 | 6,163 | 6,358 | 6,278 | 6,365 | |||||||||||||||
Reserve for unfunded lending commitments, January 1 | 416 | 493 | 597 | 473 | 514 | |||||||||||||||
FleetBoston balance, April 1, 2004 | 85 | — | — | — | — | |||||||||||||||
Provision for unfunded lending commitments | (99 | ) | (77 | ) | (104 | ) | 124 | (41 | ) | |||||||||||
Reserve for unfunded lending commitments, | 402 | 416 | 493 | 597 | 473 | |||||||||||||||
Total | $ | 9,028 | $ | 6,579 | $ | 6,851 | $ | 6,875 | $ | 6,838 | ||||||||||
Loans and leases outstanding at December 31 | $ | 521,837 | $ | 371,463 | $ | 342,755 | $ | 329,153 | $ | 392,193 | ||||||||||
Allowance for loan and lease losses as a percentage of loans and leases outstanding at December 31 | 1.65 | % | 1.66 | % | 1.85 | % | 1.91 | % | 1.62 | % | ||||||||||
Consumer allowance for loan and lease losses as a percentage of consumer loans and leases outstanding at December 31 | 1.17 | 1.06 | 0.95 | 1.12 | 0.97 | |||||||||||||||
Commercial allowance for loan and lease losses as a percentage of commercial loans and leases outstanding at December 31 | 1.64 | 1.87 | 2.43 | 2.16 | 1.81 | |||||||||||||||
Average loans and leases outstanding during the year | $ | 472,645 | $ | 356,148 | $ | 336,819 | $ | 365,447 | $ | 392,622 | ||||||||||
Net charge-offs as a percentage of average loans and leases outstanding during the year | 0.66 | % | 0.87 | % | 1.10 | % | 1.16 | % | 0.61 | % | ||||||||||
Allowance for loan and lease losses as a percentage of nonperforming loans and leases at December 31 | 390 | 215 | 126 | 139 | 122 | |||||||||||||||
Ratio of the allowance for loan and lease losses at December 31 to net charge-offs | 2.77 | 1.98 | 1.72 | 1.48 | 2.65 | |||||||||||||||
| (1) | Includes $635 related to the exit of the subprime real estate lending business in 2001. |
| (2) | Includes $395 related to the exit of the subprime real estate lending business in 2001. |
| (3) | Includes primarily transfers to loans held-for-sale. |
For reporting purposes, we allocate the allowance for credit losses across products. However, the allowance is available to absorb any credit losses without restriction. Table 25 presents our allocation by product type.
Table 25
Allocation of the Allowance for Credit Losses by Product Type
| December 31 | FleetBoston April 1, 2004 | |||||||||||||||||||||||||||||||||||
| 2004 | 2003 | 2002 | 2001 | 2000 | ||||||||||||||||||||||||||||||||
| (Dollars in millions) | Amount | Percent | Amount | Percent | Amount | Percent | Amount | Percent | Amount | Percent | Amount | Percent | ||||||||||||||||||||||||
Allowance for loan and lease losses | ||||||||||||||||||||||||||||||||||||
Residential mortgage | $ | 199 | 2.3 | % | $ | 149 | 2.4 | % | $ | 108 | 1.7 | % | $ | 145 | 2.3 | % | $ | 151 | 2.4 | % | $ | 40 | 1.4 | % | ||||||||||||
Credit card | 2,757 | 32.0 | 1,602 | 26.0 | 1,031 | 16.2 | 821 | 13.1 | 549 | 8.6 | 466 | 16.9 | ||||||||||||||||||||||||
Home equity lines | 92 | 1.1 | 61 | 1.0 | 49 | 0.8 | 83 | 1.3 | 77 | 1.2 | 17 | 0.6 | ||||||||||||||||||||||||
Direct/Indirect consumer | 405 | 4.7 | 340 | 5.5 | 361 | 5.7 | 367 | 5.8 | 320 | 5.0 | 43 | 1.6 | ||||||||||||||||||||||||
Other consumer | 382 | 4.4 | 384 | 6.2 | 332 | 5.2 | 443 | 7.1 | 733 | 11.5 | 26 | 0.9 | ||||||||||||||||||||||||
Total consumer | 3,835 | 44.5 | 2,536 | 41.1 | 1,881 | 29.6 | 1,859 | 29.6 | 1,830 | 28.7 | 592 | 21.4 | ||||||||||||||||||||||||
Commercial - domestic | 1,382 | 16.0 | 1,257 | 20.4 | 2,231 | 35.1 | 1,901 | 30.3 | 1,926 | 30.3 | 704 | 25.5 | ||||||||||||||||||||||||
Commercial real estate | 505 | 5.9 | 413 | 6.7 | 439 | 6.9 | 905 | 14.4 | 980 | 15.4 | 264 | 9.6 | ||||||||||||||||||||||||
Commercial lease financing | 365 | 4.2 | 207 | 3.4 | n/a | n/a | n/a | n/a | n/a | n/a | 84 | 3.0 | ||||||||||||||||||||||||
Commercial - foreign | 926 | 10.7 | 575 | 9.3 | 855 | 13.4 | 730 | 11.6 | 778 | 12.2 | 611 | 22.1 | ||||||||||||||||||||||||
Total commercial(1) | 3,178 | 36.8 | 2,452 | 39.8 | 3,525 | 55.4 | 3,536 | 56.3 | 3,684 | 57.9 | 1,663 | 60.2 | ||||||||||||||||||||||||
General | 1,613 | 18.7 | 1,175 | 19.1 | 952 | 15.0 | 883 | 14.1 | 851 | 13.4 | 508 | 18.4 | ||||||||||||||||||||||||
Allowance for loan and lease losses | 8,626 | 100.0 | % | 6,163 | 100.0 | % | 6,358 | 100.0 | % | 6,278 | 100.0 | % | 6,365 | 100.0 | % | 2,763 | 100.0 | % | ||||||||||||||||||
Reserve for unfunded lending commitments | 402 | 416 | 493 | 597 | 473 | 85 | ||||||||||||||||||||||||||||||
Total | $ | 9,028 | $ | 6,579 | $ | 6,851 | $ | 6,875 | $ | 6,838 | $ | 2,848 | ||||||||||||||||||||||||
| (1) | Includes allowance for loan and lease losses of commercial impaired loans of $202, $391, $919, $763 and $640 at December 31, 2004, 2003, 2002, 2001 and 2000, respectively. |
| n/a | = Not available; included in commercial - domestic at December 31, 2002, 2001 and 2000. |
Problem Loan Management
Banc of America Strategic Solutions, Inc. (SSI) is a majority-owned consolidated subsidiary of Bank of America, N.A., a wholly owned subsidiary of the Corporation, which manages problem asset resolution and the coordination of exit strategies. This may include bulk sales, collateralized debt obligations and other resolutions of domestic commercial distressed assets and, beginning in 2004, certain consumer distressed loans.
During 2004 and 2003, Bank of America, N.A. sold commercial loans with a gross book balance of approximately $1.0 billion and $3.0 billion, respectively, to SSI. In addition, in December of 2004, Bank of America, N.A. and NationsCredit Financial Services Corporation sold manufactured housing loans with a gross book balance of $2.9 billion, to SSI. For tax purposes, under the Code, the sales were treated as a taxable exchange. The sales had no financial statement impact on us because the sales were transfers among entities under common control, and there was no change in the individual loan resolution strategies.
Market Risk Management
Market risk is the risk that values of assets and liabilities or revenues will be adversely affected by changes in market conditions such as market movements. This risk is inherent in the financial instruments associated with our operations and/or activities including loans, deposits, securities, short-term borrowings, long-term debt, trading account assets and liabilities, and derivatives. Market-sensitive assets and liabilities are generated through loans and deposits associated with our traditional banking business, our customer and proprietary trading operations, our ALM process, credit risk mitigation activities, and mortgage banking activities.
Our traditional banking loan and deposit products are nontrading positions and are reported at amortized cost for assets or the amount owed for liabilities (historical cost). While the accounting rules require a historical cost view of traditional banking assets and liabilities, these positions are still subject to changes in economic value based on varying market conditions. Interest rate risk is the effect of changes in the economic value of our loans and deposits, as well as our other interest rate sensitive instruments, and is reflected in the levels of future income and expense produced by these positions versus levels that would be generated by current levels of interest rates. We seek to mitigate interest rate risk as part of the ALM process.
We seek to mitigate trading risk within our prescribed risk appetite using hedging techniques. Trading positions are reported at estimated market value with changes reflected in income. Trading positions are subject to various risk factors, which include exposures to interest rates and foreign exchange rates, as well as mortgage, equity market, commodity and issuer credit risk factors. We seek to mitigate these risk exposures by utilizing a variety of financial instruments. The following discusses the key risk components along with respective risk mitigation techniques.
Interest Rate Risk
Interest rate risk represents exposures we have to instruments whose values vary with the level of interest rates. These instruments include, but are not limited to, loans, debt securities, certain trading-related assets and liabilities, deposits, borrowings and derivative instruments. We seek to mitigate risks associated with the exposures in a variety of ways that typically involve taking offsetting positions in cash or derivative markets. The cash and derivative instruments allow us to seek to mitigate risks by reducing the effect of movements in the level of interest rates, changes in the shape of the yield curve as well as changes in interest rate volatility. Hedging instruments used to mitigate these risks include related derivatives such as options, futures, forwards and swaps.
Foreign Exchange Risk
Foreign exchange risk represents exposures we have to changes in the values of current holdings and future cash flows denominated in other currencies. The types of instruments exposed to this risk include investments in foreign subsidiaries, foreign currency-denominated loans, foreign currency-denominated securities, future cash flows in foreign currencies arising from foreign exchange transactions, and various foreign exchange derivative instruments whose values fluctuate with changes in currency exchange rates or foreign interest rates. Instruments used to mitigate this risk are foreign exchange options, currency swaps, futures, forwards and deposits. These instruments help insulate us against losses that may arise due to volatile movements in foreign exchange rates or interest rates.
Mortgage Risk
Our exposure to mortgage risk takes several forms. First, we trade and engage in market-making activities in a variety of mortgage securities, including whole loans, pass-through certificates, commercial mortgages, and collateralized mortgage obligations. Second, we originate a variety of asset-backed securities, which involves the accumulation of mortgage-related loans in anticipation of eventual securitization. Third, we may hold positions in mortgage securities and residential mortgage loans as part of the ALM portfolio. Fourth, we create MSRs as part of our mortgage activities. See Notes 1 and 8 of the Consolidated Financial Statements for additional information on MSRs. These activities generate market risk since these instruments are sensitive to changes in the level of market interest rates, changes in mortgage prepayments and interest rate volatility. Options, futures, forwards, swaps, swaptions, U.S. Treasury securities and mortgage-backed securities are used to hedge mortgage risk by seeking to mitigate the effects of changes in interest rates.
Equity Market Risk
Equity market risk arises from exposure to securities that represent an ownership interest in a corporation in the form of common stock or other equity-linked instruments. The instruments held that would lead to this exposure include, but are not limited to, the following: common stock, listed equity options (puts and calls), over-the-counter equity options, equity total return swaps, equity index futures and convertible bonds. We seek to mitigate the risk associated with these securities via hedging on a portfolio or name basis that focuses on reducing volatility from changes in stock prices. Instruments used for risk mitigation include options, futures, swaps, convertible bonds and cash positions.
Commodity Risk
Commodity risk represents exposures we have to products traded in the petroleum, natural gas, metals and power markets. Our principal exposure to these markets emanates from customer-driven transactions. These transactions consist primarily of futures, forwards, swaps and options. We seek to mitigate exposure to the commodity markets with instruments including, but not limited to, options, futures and swaps in the same or similar commodity product, as well as cash positions.
Issuer Credit Risk
Our portfolio is exposed to issuer credit risk where the value of an asset may be adversely impacted for various reasons directly related to the issuer, such as management performance, financial leverage or reduced demand for the issuer’s goods or services. Perceived changes in the creditworthiness of a particular debtor or sector can have significant effects on the replacement costs of both cash and derivative positions. We seek to mitigate the impact of credit spreads, credit migration and default risks on the market value of the trading portfolio with the use of credit default swaps, and credit fixed income and similar securities.
Trading Risk Management
Trading-related revenues represent the amount earned from our trading positions, which include trading account assets and liabilities, as well as derivative positions and, prior to the conversion of the Certificates into MSRs, market value adjustments to the Certificates and the MSRs. Trading positions are taken in a diverse range of financial instruments and markets. Trading account assets and liabilities, and derivative positions are reported at fair value. MSRs are reported at lower of cost or market. For more information on fair value, see Complex Accounting Estimates beginning on page 69. For additional information on MSRs, see Notes 1 and 8 of the Consolidated Financial Statements. Trading Account Profits represent the net amount earned from our trading positions and, as reported in the Consolidated Statement of Income, do not include the Net Interest Income recognized on trading positions, or the related funding charge or benefit. Trading Account Profits can be volatile and are largely driven by general market conditions and customer demand. Trading Account Profits are dependent on the volume and type of transactions, the level of risk assumed, and the volatility of price and rate movements at any given time within the ever-changing market environment.
The histogram of daily revenue or loss below is a graphic depiction of trading volatility and illustrates the level of trading-related revenue for 2004. Trading-related revenue encompasses both proprietary trading and customer-related activities. In 2004, positive trading-related revenue was recorded for 87 percent of trading days. Furthermore, only five percent of the total trading days had losses greater than $10 million, and the largest loss was $27 million. This can be compared to 2003 and 2002 as follows:
The above histogram does not include two losses greater than $50 million associated with MSRs as the losses were related to model changes rather than market changes in the portfolio. For additional information on MSRs, see Notes 1 and 8 of the Consolidated Financial Statements.
To evaluate risk in our trading activities, we focus on the actual and potential volatility of individual positions as well as portfolios. At a portfolio and corporate level, we use Value-at-Risk (VAR) modeling and stress testing. VAR is a key statistic used to measure and manage market risk. Trading limits and VAR are used to manage day-to-day risks and are subject to testing where we compare expected performance to actual performance. This testing provides us a view of our models’ predictive accuracy. All limit excesses are communicated to senior management for review.
A VAR model estimates a range of hypothetical scenarios within which the next day’s profit or loss is expected. These estimates are impacted by the nature of the positions in the portfolio and the correlation within the portfolio. Within any VAR model, there are significant and numerous assumptions that will differ from company to company. Our VAR model assumes a 99 percent confidence level. Statistically this means that losses will exceed VAR, on average, one out of 100 trading days, or two to three times each year.
In addition to reviewing our underlying model assumptions with senior management, we seek to mitigate the uncertainties related to these assumptions and estimates through close monitoring and by updating the assumptions and estimates on an ongoing basis. If the results of our analysis indicate higher than expected levels of risk, proactive measures are taken to adjust risk levels.
The following graph shows actual losses did not exceed VAR in 2004. Actual losses exceeded VAR twice during 2003.
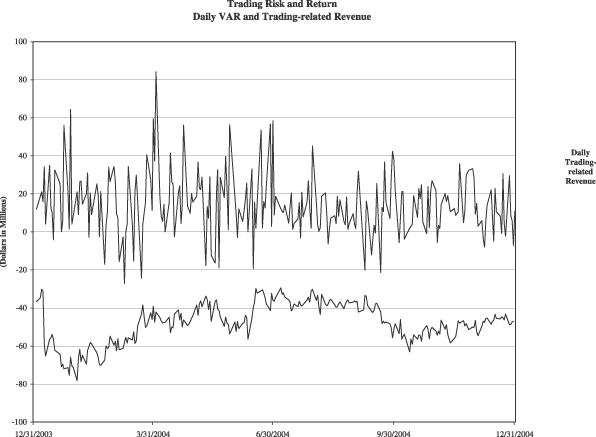
Table 26 presents average, high and low daily VAR for 2004 and 2003.
Table 26
Trading Activities Market Risk
| Twelve Months Ended December 31 | ||||||||||||||||||||
| 2004 | 2003 | |||||||||||||||||||
| (Dollars in millions) | Average VAR | High VAR(1) | Low VAR(1) | Average VAR | High VAR(1) | Low VAR(1) | ||||||||||||||
Foreign exchange | $ | 3.6 | $ | 8.1 | $ | 1.4 | $ | 4.1 | $ | 7.8 | $ | 2.1 | ||||||||
Interest rate | 26.2 | 51.5 | 10.7 | 27.0 | 65.2 | 15.1 | ||||||||||||||
Credit(2) | 35.7 | 61.4 | 21.9 | 20.7 | 32.6 | 14.9 | ||||||||||||||
Real estate/mortgage(3) | 10.5 | 26.0 | 4.6 | 14.1 | 41.4 | 3.6 | ||||||||||||||
Equities | 21.8 | 51.5 | 7.9 | 19.9 | 53.8 | 6.6 | ||||||||||||||
Commodities | 6.5 | 10.2 | 3.8 | 8.7 | 19.3 | 4.1 | ||||||||||||||
Portfolio diversification | (56.3 | ) | — | — | (60.9 | ) | — | — | ||||||||||||
Total trading portfolio | $ | 48.0 | $ | 78.5 | $ | 29.4 | $ | 33.6 | $ | 91.0 | $ | 11.2 | ||||||||
Total market-based trading portfolio(4) | $ | 44.1 | $ | 79.0 | $ | 23.7 | $ | 33.2 | $ | 82.0 | $ | 11.8 | ||||||||
| (1) | The high and low for the total portfolio may not equal the sum of the individual components as the highs or lows of the individual portfolios may have occurred on different trading days. |
| (2) | Credit includes credit fixed income and credit default swaps used for credit risk management. Average VAR for credit default swaps was $23.5 and $20.9 in 2004 and 2003, respectively. |
| (3) | Real estate/mortgage includes capital market real estate and the Certificates. Effective June 1, 2004, Real estate/mortgage no longer includes the Certificates. For additional information on the Certificates, see Note 1 of the Consolidated Financial Statements. |
| (4) | Total market-based trading portfolio excludes credit default swaps used for credit risk management, net of the effect of diversification. |
Approximately $4 million of the increase in average VAR for 2004 was attributable to the addition of FleetBoston in the second quarter of 2004. The remaining increase in average VAR for 2004 was primarily due to increases in the average risk taken in credit and equities. The increase in equities was mainly due to the increased economic risk from customer-facilitated transactions that were held in inventory during portions of 2004. The increase in credit was mainly due to an increase in credit protection purchased to hedge the credit risk in our commercial credit portfolio.
Stress Testing
Because the very nature of a VAR model suggests results can exceed our estimates, we “stress test” our portfolio. Stress testing estimates the value change in our trading portfolio due to abnormal market movements. Various stress scenarios are run regularly against the trading portfolio to verify that, even under extreme market moves, we will preserve our capital; to determine the effects of significant historical events; and to determine the effects of specific, extreme hypothetical, but plausible events. The results of the stress scenarios are calculated daily and reported to senior management as part of the regular reporting process. The results of certain specific, extreme hypothetical scenarios are presented to ALCO.
Interest Rate Risk Management
Interest rate risk represents the most significant market risk exposure to our nontrading financial instruments. Our overall goal is to manage interest rate sensitivity so that movements in interest rates do not adversely affect Net Interest Income. Interest rate risk is measured as the potential volatility in our Net Interest Income caused by changes in market interest rates. Client facing activities, primarily lending and deposit-taking, create interest rate sensitive positions on our Balance Sheet. Interest rate risk from these activities as well as the impact of ever-changing market conditions, is mitigated using the ALM process.
Sensitivity simulations are used to estimate the impact on Net Interest Income of numerous interest rate scenarios, balance sheet trends and strategies. These simulations estimate levels of short-term financial instruments, debt securities, loans, deposits, borrowings and derivative instruments. In addition, these
simulations incorporate assumptions about balance sheet dynamics such as loan and deposit growth and pricing, changes in funding mix, and asset and liability repricing and maturity characteristics. In addition to Net Interest Income sensitivity simulations, market value sensitivity measures are also utilized.
The Balance Sheet Management group maintains a Net Interest Income forecast utilizing different rate scenarios, with the base case utilizing the forward market curve. The Balance Sheet Management group constantly updates the Net Interest Income forecast for changing assumptions and differing outlooks based on economic trends and market conditions.
The Balance Sheet Management group reviews the impact on Net Interest Income of parallel and nonparallel shifts in the yield curve over different time horizons. The overall interest rate risk position and strategies are reviewed on an ongoing basis with ALCO. At December 31, 2004, we remain positioned for future rising interest rates and curve flattening to the extent implied by the forward market curve.
The estimated impact to Net Interest Income over the subsequent year from December 31, 2004, resulting from a 100 bp gradual (over 12 months) parallel increase or decrease in interest rates from the forward market curve calculated as of December 31, 2004 was (1.5) percent and 0.5 percent, respectively. The estimated impact to Net Interest Income over the subsequent year from December 31, 2003, resulting from a 100 bp gradual (over 12 months) parallel increase or decrease in interest rates from the forward market curve calculated as of December 31, 2003, was (1.1) percent and 1.2 percent, respectively.
As part of the ALM process, we use securities, residential mortgages, and interest rate and foreign exchange derivatives in managing interest rate sensitivity.
Securities
The securities portfolio is integral to our ALM process. The decision to purchase or sell securities is based upon the current assessment of economic and financial conditions, including the interest rate environment, liquidity and regulatory requirements, and the relative mix of our cash and derivative positions. During 2004 and 2003, we purchased securities of $232.6 billion and $195.9 billion, respectively, sold $105.0 billion and $171.5 billion, respectively, and received paydowns of $31.8 billion and $27.2 billion, respectively. Not included in the purchases above were $46.7 billion of forward purchase contracts of both mortgage-backed securities and mortgage loans at December 31, 2004 settling from January 2005 to February 2005 with an average yield of 5.26 percent, and $65.2 billion of forward purchase contracts of both mortgage-backed securities and mortgage loans at December 31, 2003 that settled from January 2004 to February 2004 with an average yield of 5.79 percent. There were also $25.8 billion of forward sale contracts of mortgage-backed securities at December 31, 2004 settling from January 2005 to February 2005 with an average yield of 5.47 percent compared to $8.0 billion at December 31, 2003 that settled in February 2004 with an average yield of 6.14 percent. These forward purchase and sale contracts were accounted for as derivatives and designated as cash flow hedges with their net-of-tax unrealized gains and losses included in Accumulated Other Comprehensive Income (OCI). For additional information on derivatives designated as cash flow hedges, see Note 4 of the Consolidated Financial Statements. The forward purchase and sale contracts at December 31, 2004 and 2003 were also included in Table IV on pages 77 and 78. During the year, we continuously monitored the interest rate risk position of the portfolio and repositioned the securities portfolio in order to manage prepayment risk and to take advantage of interest rate fluctuations. Through sales in the securities portfolio, we realized $2.1 billion and $941 million in Gains on Sales of Debt Securities in 2004 and 2003, respectively.
Residential Mortgage Portfolio
In 2004 and 2003, we purchased $65.9 billion and $92.8 billion, respectively, of residential mortgages for our ALM portfolio and interest rate risk management. Not included in the purchases above were $3.3 billion of forward purchase commitments of mortgage loans at December 31, 2004 settling from January 2005 to February 2005 and $4.6 billion at December 31, 2003 that settled in January 2004. These commitments, included in Table IV on pages 77 and 78, were accounted for as derivatives and designated as cash flow hedges, and their net-of-tax unrealized gains and losses were included in Accumulated OCI. During 2004, there were no sales of whole mortgage loans. In 2003, we sold $27.5 billion of whole mortgage loans and recognized $772 million in gains on the sales included in Other Noninterest Income. Additionally, during the same periods, we received paydowns of $44.4 billion and $62.8 billion, respectively.
Interest Rate and Foreign Exchange Derivative Contracts
Interest rate and foreign exchange derivative contracts are utilized in our ALM process and serve as an efficient, low-cost tool to mitigate our risk. We use derivatives to hedge or offset the changes in cash flows or market values of our Balance Sheet. See Note 4 of the Consolidated Financial Statements for additional information on our hedging activities.
Our interest rate contracts are generally nonleveraged generic interest rate and basis swaps, options, futures, and forwards. In addition, we use foreign currency contracts to mitigate the foreign exchange risk associated with foreign currency-denominated assets and liabilities, as well as our equity investments in foreign subsidiaries. Table IV, on pages 77 and 78, reflects the notional amounts, fair value, weighted average receive fixed and pay fixed rates, expected maturity, and estimated duration of our ALM derivatives at December 31, 2004 and 2003.
Consistent with our strategy of managing interest rate sensitivity to mitigate changes in value of other financial instruments, the notional amount of our net received fixed interest rate swap position decreased $11.7 billion to $9.5 billion at December 31, 2004 compared to December 31, 2003. The net option position increased $238.9 billion to $323.8 billion at December 31, 2004 compared to December 31, 2003 to offset interest rate risk in other portfolios. The changes in our swap and option positions were part of our interest sensitivity management.
Mortgage Banking Risk Management
We manage changes in the value of MSRs by entering into derivative financial instruments and by purchasing and selling securities. MSRs are assets created when the underlying mortgage loan is sold to investors and we retain the right to service the loan. As of December 31, 2004, the MSR balance was $2.5 billion, or 10 percent lower than December 31, 2003.
We designate certain derivatives such as purchased options and interest rate swaps as fair value hedges of specified MSRs under SFAS 133. At December 31, 2004, the amount of MSRs identified as being hedged by derivatives in accordance with SFAS 133 was approximately $1.8 billion. The notional amount of the derivative contracts designated as SFAS 133 hedges of MSRs at December 31, 2004 was $18.5 billion. The changes in the fair values of the derivative contracts are substantially offset by changes in the fair values of the MSRs that are hedged by these derivative contracts. During 2004, derivative hedge gains of $228 million were offset by a decrease in the value of the MSRs of $210 million resulting in $18 million of hedge ineffectiveness.
From time to time, we hold additional derivatives and certain securities (i.e. mortgage-backed securities) as economic hedges of MSRs, which are not designated as SFAS 133 accounting hedges. During 2004, Gains on Sales of Debt Securities of $117 million and $65 million of Interest Income from Securities used as an economic hedge of MSRs were realized. At December 31, 2004, the amount of MSRs covered by such economic hedges was $564 million. The carrying value of AFS Securities held as economic hedges of MSRs was $1.9 billion at December 31, 2004. The related net-of-tax unrealized gain on these AFS Securities, which is recorded in Accumulated OCI, was $13 million at December 31, 2004.
See Notes 1 and 8 of the Consolidated Financial Statements for additional information.
Operational Risk Management
Operational risk is the risk of loss resulting from inadequate or failed internal processes, people and systems, including system conversions and integration, and external events. Successful operational risk management is particularly important to a diversified financial services company like ours because of the very nature, volume and complexity of our various businesses.
In keeping with our management governance structure, the lines of business are responsible for all the risks within the business including operational risks. Such risks are managed through corporate-wide or line of business specific policies and procedures, controls, and monitoring tools. Examples of these include personnel management practices, data reconciliation processes, fraud management units, transaction processing monitoring and analysis, business recovery planning, and new product introduction processes.
We approach operational risk from two perspectives, enterprise-wide and line of business-specific. The Compliance and Operational Risk Committee (CORC), chartered in 2005 as a subcommittee of the Finance Committee, provides consistent communication and oversight of significant operational and compliance issues and oversees the adoption of best practices. Two groups within Risk Management, Compliance Risk Management and Enterprise Operational Risk, facilitate the consistency of effective policies, industry best practices, controls and monitoring tools for managing and assessing operational risks across the Corporation. These groups also work with the line of business executives and their risk counterparts to implement appropriate policies, processes and assessments at the line of business level and support groups. Compliance and operational risk awareness is also incorporated herein by reference.driven across the Corporation through training and strategic communication efforts. For selected risks, we establish specialized support groups, for example, Information Security and Supply Chain Management. These specialized groups develop corporate-wide risk management practices, such as an information security program and a supplier program to ensure suppliers adopt appropriate policies and procedures when performing work on behalf of the Corporation. These specialized groups also assist the lines of business in the development and implementation of risk management practices specific to the needs of the individual businesses.
At the line of business level, the Line of Business Risk Executives are responsible for adherence to corporate practices and oversight of all operational risks in the line of business they support. Operational and compliance risk management, working in conjunction with senior line of business executives, have developed key tools to help manage, monitor and summarize operational risk. One tool the businesses and executive management utilize is a corporate-wide self-assessment process, which helps to identify and evaluate the status of risk issues, including mitigation plans, if appropriate. Its goal is to continuously assess changing market and business conditions and evaluate all operational risks impacting the line of business. The self-assessment process assists in identifying emerging operational risk issues and determining at the line of business or corporate level how they should be managed. In addition to information gathered from the self-assessment process, key operational risk indicators have been developed and are used to help identify trends and issues on both a corporate and a line of business level.
More generally, we mitigate operational risk through a broad-based approach to process management and process improvement. Improvement efforts are focused on reduction of variation in outputs. We have a dedicated Quality and Productivity team to manage and certify the process management and improvement efforts.
Recent Accounting and Reporting Developments
See Note 1 of the Consolidated Financial Statements for a discussion of recent accounting and reporting developments.
Complex Accounting Estimates
Our significant accounting principles as described in Note 1 of the Consolidated Financial Statements are essential in understanding Management’s Discussion and Analysis of Results of Operations and Financial Condition. Many of our significant accounting principles require complex judgments to estimate values of assets and liabilities. We have procedures and processes to facilitate making these judgments.
The more judgmental estimates are summarized below. We have identified and described the development of the variables most important in the estimation process that, with the exception of accrued taxes, involves mathematical models to derive the estimates. In many cases, there are numerous alternative judgments that could be used in the process of determining the inputs to the model. Where alternatives exist, we have used the factors that we believe represent the most reasonable value in developing the inputs. Actual performance that differs from our estimates of the key variables could impact Net Income. Separate from the possible future impact to Net Income from input and model variables, the value of our lending portfolio and market sensitive assets and liabilities may change subsequent to the balance sheet measurement, often significantly, due to the nature and magnitude of future credit and market conditions. Such credit and market conditions may change quickly and in unforeseen ways and the resulting volatility could have a significant, negative effect on future operating results. These fluctuations would not be indicative of deficiencies in our models or inputs.
Allowance for Credit Losses
The allowance for credit losses is our estimate of probable losses in the loans and leases portfolio and within our unfunded lending commitments. Changes to the allowance for credit losses are reported in the Consolidated Statement of Income in the Provision for Credit Losses. Our process for determining the allowance for credit losses is discussed in the Credit Risk Management section beginning on page 43 and Note 1 of the Consolidated Financial Statements. Due to the variability in the drivers of the assumptions made in this process, estimates of the portfolio’s inherent risks and overall collectibility change with changes in the economy, individual industries, countries and individual borrowers’ or counterparties’ ability and willingness to repay their obligations. The degree to which any particular assumption affects the allowance for credit losses depends on the severity of the change and its relationship to the other assumptions.
Key judgments used in determining the allowance for credit losses include: (i) risk ratings for pools of commercial loans and leases, (ii) market and collateral values and discount rates for individually evaluated loans, (iii) product type classifications for both consumer and commercial loans and leases, (iv) loss rates used for both consumer and commercial loans and leases, (v) adjustments made to assess current events and conditions, (vi) considerations regarding domestic and global economic uncertainty, and (vii) overall credit conditions.
Our Allowance for Loan and Lease Losses is sensitive to the risk rating assigned to commercial loans and leases and to the loss rates used for both the consumer and commercial portfolios. Assuming a downgrade of one level in the internal risk rating for commercial loans and leases, except loans already risk rated Doubtful as defined by regulatory authorities, the Allowance for Loan and Lease Losses for the commercial portfolio would increase by approximately $1.6 billion at December 31, 2004. The Allowance for Loan and Lease Losses as a percentage of loan and lease outstandings at December 31, 2004 was 1.65 percent and this hypothetical increase in the allowance would raise the ratio to approximately 2.0 percent. A 10 percent increase in the loss rates used on both the consumer and commercial loan and lease portfolios would increase the Allowance for Loan and Lease Losses at December 31, 2004 by approximately $370 million, of which $250 million would relate to consumer and $120 million to commercial.
These sensitivity analyses do not represent management’s expectations of the deterioration in risk ratings or the increases in loss rates but are provided as hypothetical scenarios to assess the sensitivity of the Allowance for Loan and Lease Losses to changes in key inputs. We believe the risk ratings and loss severities currently in use are appropriate and that the probability of a downgrade of one level of the internal credit ratings for commercial loans and leases within a short period of time is remote.
The process of determining the level of the allowance for credit losses requires a high degree of judgment. It is possible that others, given the same information, may at any point in time reach different reasonable conclusions.
Fair Value of Financial Instruments
Trading Account Assets and Liabilities are recorded at fair value, which is primarily based on actively traded markets where prices are based on either direct market quotes or observed transactions. Liquidity is a significant factor in the determination of the fair value of Trading Account Assets or Liabilities. Market price quotes may not be readily available for some positions, or positions within a market sector where trading activity has slowed significantly or ceased. Situations of illiquidity generally are triggered by the market’s perception of credit uncertainty regarding a single company or a specific market sector. In these instances, fair value is determined based on limited available market information and other factors, principally from reviewing the issuer’s financial statements and changes in credit ratings made by one or more rating agencies. At December 31, 2004, $4.4 billion of Trading Account Assets were fair valued using these alternative approaches, representing five percent of total Trading Account Assets at December 31, 2004. An immaterial amount of Trading Account Liabilities were fair valued using these alternative approaches at December 31, 2004.
Trading Account Profits, which represent the net amount earned from our trading positions, can be volatile and are largely driven by general market conditions and customer demand. Trading Account Profits are dependent on the volume and type of transactions, the level of risk assumed, and the volatility of price and rate movements at any given time. To evaluate risk in our trading activities, we focus on the actual and
potential volatility of individual positions as well as portfolios. At a portfolio and corporate level, we use trading limits, stress testing and tools such as VAR modeling, which estimates a range within which the next day’s profit or loss is expected, to measure and manage market risk. At December 31, 2004, the amount of our VAR was $47 million based on a 99 percent confidence interval. For more information on VAR, see pages 64 through 66.
The fair values of Derivative Assets and Liabilities traded in the over-the-counter market are determined using quantitative models that require the use of multiple market inputs including interest rates, prices and indices to generate continuous yield or pricing curves and volatility factors, which are used to value the position. The predominance of market inputs are actively quoted and can be validated through external sources, including brokers, market transactions and third-party pricing services. Estimation risk is greater for derivative asset and liability positions that are either option-based or have longer maturity dates where observable market inputs are less readily available or are unobservable, in which case quantitative-based extrapolations of rate, price or index scenarios are used in determining fair values.
The fair values of Derivative Assets and Liabilities include adjustments for market liquidity, counterparty credit quality, future servicing costs and other deal specific factors, where appropriate. To ensure the prudent application of estimates and management judgment in determining the fair value of Derivative Assets and Liabilities, various processes and controls have been adopted, which include: a Model Validation Policy that requires a review and approval of quantitative models used for deal pricing, financial statement fair value determination and risk quantification; a Trading Product Valuation Policy that requires verification of all traded product valuations; and a periodic review and substantiation of daily profit and loss reporting for all traded products. These processes and controls are performed independently within the business segment. At December 31, 2004, the fair values of Derivative Assets and Liabilities determined by these quantitative models were $10.3 billion and $7.3 billion, respectively. These amounts reflect the full fair value of the derivatives and do not isolate the discrete value associated with the subjective valuation variable. Further, they represent five percent and four percent of Derivative Assets and Liabilities, respectively, before the impact of legally enforceable master netting agreements. For the period ended December 31, 2004, there were no changes to the quantitative models, or uses of such models, that resulted in a material adjustment to the Consolidated Statement of Income.
AFS Securities are recorded at fair value, which is generally based on direct market quotes from actively traded markets.
Principal Investing
Principal Investing is included withinEquity Investments and is discussed in more detail in Business Segment Operations on page 32. Principal Investing is comprised of a diversified portfolio of investments in privately-held and publicly-traded companies at all stages, from start-up to buyout. These investments are made either directly in a company or held through a fund. Some of these companies may need access to additional cash to support their long-term business models. Market conditions and company performance may impact whether funding is available from private investors or the capital markets.
Investments with active market quotes are carried at estimated fair value; however, the majority of our investments do not have publicly available price quotations. At December 31, 2004, we had nonpublic investments of $7.0 billion, or approximately 96 percent of the total portfolio. Valuation of these investments requires significant management judgment. Management determines values of the underlying investments based on multiple methodologies including in-depth semi-annual reviews of the investee’s financial statements and financial condition, discounted cash flows, the prospects of the investee’s industry, and current overall market conditions for similar investments. In addition, on a quarterly basis as events occur or information comes to the attention of management that indicates a change in the value of an investment is warranted, investments are adjusted from their original invested amount to estimated fair values at the balance sheet date with changes being recorded in Equity Investment Gains (Losses) in the Consolidated Statement of Income. Investments are not adjusted above the original amount invested unless there is clear evidence of a fair value in excess of the original invested amount. This evidence is often in the form of a recent transaction in the investment. As part of the valuation process, senior management reviews the portfolio and determines when an impairment needs to be recorded. The Principal Investing portfolio is not material to our Consolidated Balance Sheet, but the impact of the valuation adjustments may be material to our operating results for any particular quarter.
Accrued Income Taxes
As more fully described in Notes 1 and 17 of the Consolidated Financial Statements, we account for income taxes in accordance with SFAS No. 109, “Accounting for Income Taxes” (SFAS 109). Accrued income taxes, reported as a component of Accrued Expenses and Other Liabilities on our Consolidated Balance Sheet, represents the net amount of current income taxes we expect to pay to or receive from various taxing jurisdictions attributable to our operations to date. We currently file income tax returns in more than 100 jurisdictions and consider many factors—including statutory, judicial and regulatory guidance—in estimating the appropriate accrued income taxes for each jurisdiction.
In applying the principles of SFAS 109, we monitor the state of relevant tax authorities and change our estimate of accrued income taxes due to changes in income tax laws and their interpretation by the courts and regulatory authorities. These revisions of our estimate of accrued income taxes, which also may result from our own income tax planning and from the resolution of income tax controversies, can materially affect our operating results for any given quarter.
Goodwill
The nature of and accounting for Goodwill is discussed in detail in Notes 1 and 9 of the Consolidated Financial Statements. Goodwill is reviewed for potential impairment at the reporting unit level on an annual basis, or in interim periods if events or circumstances indicate a potential impairment. The reporting units utilized for this test were those that are one level below the business segments identified beginning on page 17. The impairment test is performed in two phases. The first step of the Goodwill impairment test compares the fair value of the reporting unit with its carrying amount, including Goodwill. If the fair value of the reporting unit exceeds its carrying amount, Goodwill of the reporting unit is considered not impaired; however, if the carrying amount of the reporting unit exceeds its fair value, an additional procedure must be performed. That additional procedure compares the implied fair value of the reporting unit’s Goodwill (as defined in SFAS 142) with the carrying amount of that Goodwill. An impairment loss is recorded to the extent that the carrying amount of Goodwill exceeds its implied fair value.
The fair values of the reporting units were determined using a combination of valuation techniques consistent with the income approach and the market approach. For purposes of the income approach, discounted cash flows were calculated by taking the net present value of estimated cash flows using a combination of historical results, estimated future cash flows and an appropriate price to earnings multiple. We use our internal forecasts to estimate future cash flows and actual results may differ from forecasted results. However, these differences have not been material and we believe that this methodology provides a reasonable means to determine fair values. Cash flows were discounted using a discount rate based on expected equity return rates, which was 11 percent for 2004. Expected rates of equity returns were estimated based on historical market returns and risk/return rates for similar industries of the reporting unit. For purposes of the market approach, valuations of reporting units were based on actual comparable market transactions and market earnings multiples for similar industries of the reporting unit.
Our evaluations for the year ended December 31, 2004 indicated there was no impairment of our Goodwill.
2003 Compared to 2002
The following discussion and analysis provides a comparison of our results of operations for 2003 and 2002. This discussion should be read in conjunction with the Consolidated Financial Statements and related Notes on pages 86 through 158. In addition, Tables 1 and 2 contain financial data to supplement this discussion.
Overview
Net Income
Net Income totaled $10.8 billion, or $3.57 per diluted common share, in 2003 compared to $9.2 billion, or $2.95 per diluted common share, in 2002. The return on average common shareholders’ equity was 21.99 percent in 2003 compared to 19.44 percent in 2002. These earnings provided sufficient cash flow to allow us to return $9.8 billion and $8.5 billion in 2003 and 2002, respectively, in capital to shareholders in the form of dividends and share repurchases, net of employee stock options exercised.
Net Interest Income
Net Interest Income on a FTE basis increased $596 million to $22.1 billion in 2003. This increase was driven by higher ALM portfolio levels (consisting of securities, whole loan mortgages and derivatives), higher consumer loan levels, larger trading-related contributions, higher mortgage warehouse and higher core deposit funding levels. Partially offsetting these increases was the impact of lower interest rates and reductions in the large corporate, foreign and exited consumer loan businesses portfolios. The net interest yield on a FTE basis declined 37 bps to 3.40 percent in 2003 due to the negative impact of increases in lower-yielding trading-related assets and declining rates offset partially by our ALM portfolio repositioning.
Noninterest Income
Noninterest Income increased $2.9 billion to $16.5 billion in 2003, due to increases in Mortgage Banking Income of $1.2 billion, Equity Investment Gains of $495 million, Other Noninterest Income of $484 million, Card Income of $432 million, and Service Charges of $342 million. The increase in Mortgage Banking Income was driven by gains from higher volumes of mortgage loans sold into the secondary market and improved profit margins. Other Noninterest Income of $1.1 billion included gains of $772 million, an increase of $272 million over 2002, as we sold whole loan mortgages to manage prepayment risk due to the longer than anticipated low interest rate environment. Additionally, Other Noninterest Income included the equity in the earnings of our investment in GFSS of $122 million.
Gains on Sales of Debt Securities
Gains on Sales of Debt Securities in 2003 and 2002, were $941 million and $630 million, respectively, as we continued to reposition the ALM portfolio in response to interest rate fluctuations.
Provision for Credit Losses
The Provision for Credit Losses declined $858 million to $2.8 billion in 2003 due to an improvement in the commercial portfolio partially offset by a stable but growing consumer portfolio. This improvement was driven by reduced levels of inflows to nonperforming assets inGlobal Capital Markets and Investment Banking, together with loan sales and payoffs facilitated by high levels of liquidity in the capital markets.
Noninterest Expense
Noninterest Expense increased $1.7 billion in 2003 from 2002, driven by higher personnel costs, increased Professional Fees including legal expense and increased Marketing Expense. Higher personnel costs resulted from increased costs of employee benefits of $504 million and revenue-related incentives of $435 million. Employee benefits expense increased due to stock option expense of $120 million in 2003 and the impacts of a change in the expected long-term rates of return on plan assets to 8.5 percent for 2003 from 9.5 percent in 2002 and a change in the discount rate to 6.75 percent in 2003 from 7.25 percent in 2002 for the Bank of America Pension Plan. The increase in Professional Fees of $319 million was driven by an increase in litigation accruals of $220 million associated with pending litigation principally related to securities matters. Marketing Expense increased by $232 million due to higher advertising costs, as well as marketing investments in direct marketing for the credit card business. In addition, recorded in other expense during 2003 was a $100 million charge related to issues surrounding our mutual fund practices.
Income Tax Expense
Income Tax Expense was $5.1 billion, reflecting an effective tax rate of 31.8 percent, in 2003 compared to $3.7 billion and 28.8 percent, respectively, in 2002. The 2002 effective tax rate was impacted by a $488 million reduction in Income Tax Expense resulting from a settlement with the IRS generally covering tax years ranging from 1984 to 1999 but including tax returns as far back as 1971.
Business Segment Operations
Global Consumer and Small Business Banking
Total Revenue increased $2.6 billion, or 14 percent, in 2003 compared to 2002. Overall deposit and loan growth contributed to the $703 million, or six percent, increase in Net Interest Income. This increase was offset by the compression of deposit interest margins and the results of ALM activities. Increases in
Mortgage Banking Income of 118 percent, Service Charges of 14 percent and Card Income of 17 percent drove the $1.9 billion, or 28 percent, increase in Noninterest Income. These increases were offset by a decrease in Trading Account Profits. Net Income rose $965 million, or 20 percent, due to the increases in Net Interest Income and Noninterest Income discussed above, offset by an increase in the Provision for Credit Losses. Higher provision in the credit card loan portfolio, offset by a decline in provision for other consumer loans resulted in a $157 million, or 10 percent, increase in the Provision for Credit Losses.
Global Business and Financial Services
Total Revenue increased $108 million, or two percent, in 2003 compared to 2002. Net Interest Income decreased $77 million, or two percent. Increases in Other Noninterest Income of 58 percent, Service Charges of seven percent and Investment Banking Income of seven percent drove the $185 million, or 15 percent, increase in Noninterest Income. These increases were offset by a decrease in Trading Account Profits. Provision for Credit Losses remained relatively flat. Net Income rose $102 million, or seven percent, due to the increase in Noninterest Income discussed above, offset by the decrease in Net Interest Income.
Global Capital Markets and Investment Banking
Total Revenue increased $133 million, or two percent, in 2003 compared to 2002 driven by an increase in Noninterest Income. Net Interest Income remained relatively flat at $4.3 billion as average Loans and Leases declined $12.0 billion, or 25 percent and average Deposits increased $1.4 billion, or two percent. Noninterest Income increased $189 million, or five percent, resulting from increases in Investment Banking Income, Service Charges, Investment and Brokerage Services, and Equity Investment Gains offset by declines in Trading Account Profits. In 2003, Net Income increased $192 million, or 12 percent, due to the increase in Noninterest Income and lower Provision for Credit Losses offset by an increase in Noninterest Expense. Provision for Credit Losses declined $465 million to $303 million due to continued improvements in credit quality. Noninterest Expense increased by $402 million, or eight percent, driven by costs associated with downsizing operations in South America and Asia and restructuring locations outside the U.S., higher market-based compensation, increases in litigation expenses and reserves, and the allocation of the charge related to issues surrounding our mutual fund practices.
Global Wealth and Investment Management
Total Revenue increased $401 million, or 11 percent, in 2003. Net Interest Income remained relatively flat as growth in Deposits and increased loan spreads were offset by the net results of ALM activities. Noninterest Income increased $372 million, or 22 percent, an increase in Equity Investment Gains of $198 million related to gains from securities sold that were received in satisfaction of debt that had been restructured and charged off in prior periods, and higher asset management fees. Net Income increased $351 million, or 40 percent. This increase was due to the increase in Noninterest Income and lower Provision for Credit Losses. Provision for Credit Losses decreased $309 million, driven by one large charge-off recorded in 2002. The allocation of the charge related to issues surrounding our mutual fund practices and increased expenses associated with the addition of financial advisors were the drivers of the $182 million, or nine percent, increase in Noninterest Expense.
All Other
In 2003 compared to 2002, Total Revenue inLatin America decreased $10 million, or 24 percent. Net Interest Income decreased $11 million, or 31 percent, due to lower Loan and Lease balances. Noninterest Income remained relatively unchanged at $9 million. Provision for Credit Losses decreased $155 million, or 64 percent, due to continued improvement in credit quality and Noninterest Expense increased $12 million. As a result, Net Loss inLatin America improved $100 million or 68 percent. Total Revenue inEquity Investments increased $190 million, or 43 percent, in 2003 compared to 2002 due to an improvement in Equity Investment Gains.Equity Investments had a Net Loss of $249 million in 2003 compared to a Net Loss of $330 million in 2002. In 2003, Principal Investing recorded cash gains of $273 million and fair value adjustment gains of $47 million, offset by impairment charges of $438 million. Noninterest Income primarily consists of Equity Investment Gains (Losses). Total Revenue inOther increased $38 million, or four percent, in 2003 compared to 2002. Net Income decreased $147 million, or 14 percent. Net Interest Income remained relatively flat. Noninterest Income increased $35 million resulting from increases in gains on whole mortgage loan sales. Gains on Sales of Debt Securities increased $235 million to $942 million in 2003, as we continued to reposition the ALM portfolio in response to changes in interest rates. Noninterest Expense increased $132 million, or 39 percent.
Statistical Financial Information
Table I
Average Balances and Interest Rates - Fully Taxable-equivalent Basis
| 2004 | 2003 | 2002 | |||||||||||||||||||||||||
| (Dollars in millions) | Average Balance | Interest Income/ Expense | Yield/ Rate | Average Balance | Interest Income/ Expense | Yield/ Rate | Average Balance | Interest Income/ Expense | Yield/ Rate | ||||||||||||||||||
Earning assets | |||||||||||||||||||||||||||
Time deposits placed and other short-term investments | $ | 14,254 | $ | 362 | 2.54 | % | $ | 9,056 | $ | 172 | 1.90 | % | $ | 10,038 | $ | 243 | 2.42 | % | |||||||||
Federal funds sold and securities purchased under agreements to resell | 128,981 | 2,043 | 1.58 | 78,857 | 1,373 | 1.74 | 45,640 | 870 | 1.91 | ||||||||||||||||||
Trading account assets | 104,616 | 4,092 | 3.91 | 97,222 | 4,005 | 4.12 | 79,562 | 3,806 | 4.78 | ||||||||||||||||||
Securities | 150,171 | 7,326 | 4.88 | 70,666 | 3,131 | 4.43 | 73,715 | 4,006 | 5.43 | ||||||||||||||||||
Loans and leases(1): | |||||||||||||||||||||||||||
Residential mortgage | 167,298 | 9,074 | 5.42 | 127,059 | 6,872 | 5.41 | 97,204 | 6,423 | 6.61 | ||||||||||||||||||
Credit card | 43,435 | 4,653 | 10.71 | 28,210 | 2,886 | 10.23 | 21,410 | 2,195 | 10.25 | ||||||||||||||||||
Home equity lines | 39,400 | 1,835 | 4.66 | 22,890 | 1,040 | 4.55 | 22,807 | 1,213 | 5.32 | ||||||||||||||||||
Direct/Indirect consumer | 38,078 | 2,093 | 5.50 | 32,593 | 1,964 | 6.03 | 30,264 | 2,145 | 7.09 | ||||||||||||||||||
Other consumer(2) | 7,717 | 594 | 7.70 | 8,865 | 588 | 6.63 | 12,554 | 930 | 7.41 | ||||||||||||||||||
Total consumer | 295,928 | 18,249 | 6.17 | 219,617 | 13,350 | 6.08 | 184,239 | 12,906 | 7.01 | ||||||||||||||||||
Commercial - domestic | 114,644 | 7,126 | 6.22 | 93,458 | 6,729 | 7.20 | 102,835 | 7,011 | 6.82 | ||||||||||||||||||
Commercial real estate | 28,085 | 1,263 | 4.50 | 20,042 | 862 | 4.30 | 21,569 | 1,060 | 4.91 | ||||||||||||||||||
Commercial lease financing | 17,483 | 819 | 4.68 | 10,061 | 395 | 3.92 | 11,227 | 505 | 4.49 | ||||||||||||||||||
Commercial - foreign | 16,505 | 849 | 5.15 | 12,970 | 460 | 3.54 | 16,949 | 678 | 4.00 | ||||||||||||||||||
Total commercial | 176,717 | 10,057 | 5.69 | 136,531 | 8,446 | 6.19 | 152,580 | 9,254 | 6.06 | ||||||||||||||||||
Total loans and leases | 472,645 | 28,306 | 5.99 | 356,148 | 21,796 | 6.12 | 336,819 | 22,160 | 6.58 | ||||||||||||||||||
Other earning assets | 34,635 | 1,814 | 5.24 | 37,599 | 1,729 | 4.60 | 24,756 | 1,557 | 6.29 | ||||||||||||||||||
Total earning assets(3) | 905,302 | 43,943 | 4.85 | 649,548 | 32,206 | 4.96 | 570,530 | 32,642 | 5.72 | ||||||||||||||||||
Cash and cash equivalents | 28,511 | 22,637 | 21,166 | ||||||||||||||||||||||||
Other assets, less allowance for loan and lease losses | 110,847 | 76,871 | 62,078 | ||||||||||||||||||||||||
Total assets | $ | 1,044,660 | $ | 749,056 | $ | 653,774 | |||||||||||||||||||||
Interest-bearing liabilities | |||||||||||||||||||||||||||
Domestic interest-bearing deposits: | |||||||||||||||||||||||||||
Savings | $ | 33,959 | $ | 119 | 0.35 | % | $ | 24,538 | $ | 108 | 0.44 | % | $ | 21,691 | $ | 138 | 0.64 | % | |||||||||
NOW and money market deposit accounts | 214,542 | 1,921 | 0.90 | 148,896 | 1,236 | 0.83 | 131,841 | 1,369 | 1.04 | ||||||||||||||||||
Consumer CDs and IRAs | 94,770 | 2,533 | 2.67 | 70,246 | 2,784 | 3.96 | 67,695 | 2,968 | 4.39 | ||||||||||||||||||
Negotiable CDs, public funds and other time deposits | 5,977 | 290 | 4.85 | 7,627 | 130 | 1.70 | 4,237 | 128 | 3.03 | ||||||||||||||||||
Total domestic interest-bearing deposits | 349,248 | 4,863 | 1.39 | 251,307 | 4,258 | 1.69 | 225,464 | 4,603 | 2.04 | ||||||||||||||||||
Foreign interest-bearing deposits(4): | |||||||||||||||||||||||||||
Banks located in foreign countries | 18,426 | 1,040 | 5.64 | 13,959 | 403 | 2.89 | 15,464 | 442 | 2.86 | ||||||||||||||||||
Governments and official institutions | 5,327 | 97 | 1.82 | 2,218 | 31 | 1.40 | 2,316 | 43 | 1.86 | ||||||||||||||||||
Time, savings and other | 27,739 | 275 | 0.99 | 19,027 | 216 | 1.14 | 18,769 | 346 | 1.84 | ||||||||||||||||||
Total foreign interest-bearing deposits | 51,492 | 1,412 | 2.74 | 35,204 | 650 | 1.85 | 36,549 | 831 | 2.27 | ||||||||||||||||||
Total interest-bearing deposits | 400,740 | 6,275 | 1.57 | 286,511 | 4,908 | 1.71 | 262,013 | 5,434 | 2.07 | ||||||||||||||||||
Federal funds purchased, securities sold under agreements to repurchase and other short-term borrowings | 227,558 | 4,434 | 1.95 | 140,458 | 1,871 | 1.33 | 98,477 | 1,982 | 2.01 | ||||||||||||||||||
Trading account liabilities | 35,326 | 1,317 | 3.73 | 37,176 | 1,286 | 3.46 | 31,600 | 1,260 | 3.99 | ||||||||||||||||||
Long-term debt | 93,330 | 2,404 | 2.58 | 68,432 | 2,034 | 2.97 | 66,045 | 2,455 | 3.72 | ||||||||||||||||||
Total interest-bearing liabilities(3) | 756,954 | 14,430 | 1.91 | 532,577 | 10,099 | 1.90 | 458,135 | 11,131 | 2.43 | ||||||||||||||||||
Noninterest-bearing sources: | |||||||||||||||||||||||||||
Noninterest-bearing deposits | 150,819 | 119,722 | 109,466 | ||||||||||||||||||||||||
Other liabilities | 52,704 | 47,553 | 38,560 | ||||||||||||||||||||||||
Shareholders’ equity | 84,183 | 49,204 | 47,613 | ||||||||||||||||||||||||
Total liabilities and shareholders’ equity | $ | 1,044,660 | $ | 749,056 | $ | 653,774 | |||||||||||||||||||||
Net interest spread | 2.94 | 3.06 | 3.29 | ||||||||||||||||||||||||
Impact of noninterest-bearing sources | 0.32 | 0.34 | 0.48 | ||||||||||||||||||||||||
Net interest income/yield on earning assets | $ | 29,513 | 3.26 | % | $ | 22,107 | 3.40 | % | $ | 21,511 | 3.77 | % | |||||||||||||||
| (1) | Nonperforming loans are included in the respective average loan balances. Income on these nonperforming loans is recognized on a cash basis. |
| (2) | Includes consumer finance of $3,735, $4,137 and $5,031 in 2004, 2003 and 2002, respectively; foreign consumer of $3,020, $1,977 and $2,021 in 2004, 2003 and 2002, respectively; and consumer lease financing of $962, $2,751 and $5,502 in 2004, 2003 and 2002, respectively. |
| (3) | Interest income includes the impact of interest rate risk management contracts, which increased interest income on the underlying assets $2,400, $2,972 and $1,983 in 2004, 2003 and 2002, respectively. These amounts were substantially offset by corresponding decreases in the income earned on the underlying assets. Interest expense includes the impact of interest rate risk management contracts, which increased interest expense on the underlying liabilities $888, $305 and $141 in 2004, 2003 and 2002, respectively. These amounts were substantially offset by corresponding decreases in the interest paid on the underlying liabilities. For further information on interest rate contracts, see “Interest Rate Risk Management” beginning on page 66. |
| (4) | Primarily consists of time deposits in denominations of $100,000 or more. |
Table II
Analysis of Changes in Net Interest Income - Fully Taxable-equivalent Basis
| From 2003 to 2004 | From 2002 to 2003 | |||||||||||||||||||||||
| Due to Change in(1) | Net Change | Due to Change in(1) | Net Change | |||||||||||||||||||||
| (Dollars in millions) | Volume | Rate | Volume | Rate | ||||||||||||||||||||
Increase (decrease) in interest income | ||||||||||||||||||||||||
Time deposits placed and other short-term investments | $ | 99 | $ | 91 | $ | 190 | $ | (24 | ) | $ | (47 | ) | $ | (71 | ) | |||||||||
Federal funds sold and securities purchased under agreements to resell | 871 | (201 | ) | 670 | 636 | (133 | ) | 503 | ||||||||||||||||
Trading account assets | 305 | (218 | ) | 87 | 841 | (642 | ) | 199 | ||||||||||||||||
Securities | 3,522 | 673 | 4,195 | (169 | ) | (706 | ) | (875 | ) | |||||||||||||||
Loans and leases: | ||||||||||||||||||||||||
Residential mortgage | 2,179 | 23 | 2,202 | 1,976 | (1,527 | ) | 449 | |||||||||||||||||
Credit card | 1,557 | 210 | 1,767 | 697 | (6 | ) | 691 | |||||||||||||||||
Home equity lines | 753 | 42 | 795 | 5 | (178 | ) | (173 | ) | ||||||||||||||||
Direct/Indirect consumer | 332 | (203 | ) | 129 | 166 | (347 | ) | (181 | ) | |||||||||||||||
Other consumer | (76 | ) | 82 | 6 | (273 | ) | (69 | ) | (342 | ) | ||||||||||||||
Total consumer | 4,899 | 444 | ||||||||||||||||||||||
Commercial - domestic | 1,525 | (1,128 | ) | 397 | (637 | ) | 355 | (282 | ) | |||||||||||||||
Commercial real estate | 346 | 55 | 401 | (76 | ) | (122 | ) | (198 | ) | |||||||||||||||
Commercial lease financing | 290 | 134 | 424 | (53 | ) | (57 | ) | (110 | ) | |||||||||||||||
Commercial - foreign | 124 | 265 | 389 | (159 | ) | (59 | ) | (218 | ) | |||||||||||||||
Total commercial | 1,611 | (808 | ) | |||||||||||||||||||||
Total loans and leases | 6,510 | (364 | ) | |||||||||||||||||||||
Other earning assets | (136 | ) | 221 | 85 | 808 | (636 | ) | 172 | ||||||||||||||||
Total interest income | $ | 11,737 | $ | (436 | ) | |||||||||||||||||||
Increase (decrease) in interest expense | ||||||||||||||||||||||||
Domestic interest-bearing deposits: | ||||||||||||||||||||||||
Savings | $ | 41 | $ | (30 | ) | $ | 11 | $ | 19 | $ | (49 | ) | $ | (30 | ) | |||||||||
NOW and money market deposit accounts | 545 | 140 | 685 | 180 | (313 | ) | (133 | ) | ||||||||||||||||
Consumer CDs and IRAs | 969 | (1,220 | ) | (251 | ) | 116 | (300 | ) | (184 | ) | ||||||||||||||
Negotiable CDs, public funds and other time deposits | (28 | ) | 188 | 160 | 103 | (101 | ) | 2 | ||||||||||||||||
Total domestic interest-bearing deposits | 605 | (345 | ) | |||||||||||||||||||||
Foreign interest-bearing deposits: | ||||||||||||||||||||||||
Banks located in foreign countries | 130 | 507 | 637 | (43 | ) | 4 | (39 | ) | ||||||||||||||||
Governments and official institutions | 44 | 22 | 66 | (2 | ) | (10 | ) | (12 | ) | |||||||||||||||
Time, savings and other | 100 | (41 | ) | 59 | 4 | (134 | ) | (130 | ) | |||||||||||||||
Total foreign interest-bearing deposits | 762 | (181 | ) | |||||||||||||||||||||
Total interest-bearing deposits | 1,367 | (526 | ) | |||||||||||||||||||||
Federal funds purchased, securities sold under agreements to repurchase and other short-term borrowings | 1,156 | 1,407 | 2,563 | 841 | (952 | ) | (111 | ) | ||||||||||||||||
Trading account liabilities | (64 | ) | 95 | 31 | 223 | (197 | ) | 26 | ||||||||||||||||
Long-term debt | 738 | (368 | ) | 370 | 91 | (512 | ) | (421 | ) | |||||||||||||||
Total interest expense | 4,331 | (1,032 | ) | |||||||||||||||||||||
Net increase in net interest income | $ | 7,406 | $ | 596 | ||||||||||||||||||||
| (1) | The changes for each category of interest income and expense are divided between the portion of change attributable to the variance in volume or rate for that category. The unallocated change in rate or volume variance has been allocated between the rate and volume variances. |
Table III
Selected Loan Maturity Data(1)
| December 31, 2004 | ||||||||||||||||
| (Dollars in millions) | Due in 1 Year or Less | Due After 1 Year Through 5 Years | Due After 5 Years | Total | ||||||||||||
Commercial - domestic | $ | 45,238 | $ | 50,037 | $ | 26,820 | $ | 122,095 | ||||||||
Commercial real estate - domestic | 11,564 | 17,312 | 3,003 | 31,879 | ||||||||||||
Foreign(2) | 16,088 | 4,855 | 1,461 | 22,404 | ||||||||||||
Total selected loans | $ | 72,890 | $ | 72,204 | $ | 31,284 | $ | 176,378 | ||||||||
Percent of total | 41.4 | % | 40.9 | % | 17.7 | % | 100.0 | % | ||||||||
Sensitivity of loans to changes in interest rates for loans due after one year: | ||||||||||||||||
Fixed interest rates | $ | 7,975 | $ | 12,672 | ||||||||||||
Floating or adjustable interest rates | 64,229 | 18,612 | ||||||||||||||
Total | $ | 72,204 | $ | 31,284 | ||||||||||||
| (1) | Loan maturities are based on the remaining maturities under contractual terms. |
| (2) | Loan maturities include other consumer, commercial—foreign and commercial real estate loans. |
Table IV
Asset and Liability Management Interest Rate and Foreign Exchange Contracts
| December 31, 2004 | ||||||||||||||||||||||||||||||||||
Fair Value | Expected Maturity | Average Duration | ||||||||||||||||||||||||||||||||
| (Dollars in millions, average estimated duration in years) | Total | 2005 | 2006 | 2007 | 2008 | 2009 | Thereafter | |||||||||||||||||||||||||||
Cash flow hedges | ||||||||||||||||||||||||||||||||||
Receive fixed interest rate swaps(1) | $ | (1,413 | ) | 4.16 | ||||||||||||||||||||||||||||||
Notional amount | $ | 122,274 | $ | — | $ | 2,927 | $ | 21,098 | $ | 44,223 | $ | 22,237 | $ | 31,789 | ||||||||||||||||||||
Weighted average fixed rate | 3.68 | % | — | % | 3.46 | % | 2.94 | % | 3.47 | % | 3.73 | % | 4.43 | % | ||||||||||||||||||||
Pay fixed interest rate swaps(1) | (2,248 | ) | 4.77 | |||||||||||||||||||||||||||||||
Notional amount | $ | 157,837 | $ | 39 | $ | 6,320 | $ | 62,584 | $ | 16,136 | $ | 10,289 | $ | 62,469 | ||||||||||||||||||||
Weighted average fixed rate | 4.24 | % | 5.01 | % | 3.54 | % | 3.58 | % | 3.91 | % | 3.85 | % | 5.13 | % | ||||||||||||||||||||
Basis swaps | (4 | ) | ||||||||||||||||||||||||||||||||
Notional amount | $ | 6,700 | $ | 500 | $ | 4,400 | $ | — | $ | — | $ | — | $ | 1,800 | ||||||||||||||||||||
Option products(2) | 3,492 | |||||||||||||||||||||||||||||||||
Notional amount(3) | 323,835 | 145,200 | 90,000 | 17,500 | 58,404 | — | 12,731 | |||||||||||||||||||||||||||
Foreign exchange contracts | 9 | |||||||||||||||||||||||||||||||||
Notional amount | 16 | — | — | — | 16 | — | — | |||||||||||||||||||||||||||
Futures and forward rate contracts (4) | 287 | |||||||||||||||||||||||||||||||||
Notional amount(3) | (10,889 | ) | 10,111 | (21,000 | ) | — | — | — | — | |||||||||||||||||||||||||
Total net cash flow positions | $ | 123 | ||||||||||||||||||||||||||||||||
Fair value hedges | ||||||||||||||||||||||||||||||||||
Receive fixed interest rate swaps(1) | $ | 534 | 5.14 | |||||||||||||||||||||||||||||||
Notional amount | $ | 45,050 | $ | 2,580 | $ | 4,363 | $ | 2,500 | $ | 2,694 | $ | 3,364 | $ | 29,549 | ||||||||||||||||||||
Weighted average fixed rate | 5.02 | % | 4.78 | % | 5.23 | % | 4.53 | % | 3.47 | % | 4.44 | % | 5.25 | % | ||||||||||||||||||||
Foreign exchange contracts | 2,739 | |||||||||||||||||||||||||||||||||
Notional amount | $ | 13,590 | $ | 71 | $ | 1,529 | $ | 55 | $ | 1,571 | $ | 2,091 | $ | 8,273 | ||||||||||||||||||||
Total net fair value positions | $ | 3,273 | ||||||||||||||||||||||||||||||||
Closed interest rate contracts(5) | 1,328 | |||||||||||||||||||||||||||||||||
Total ALM contracts | $ | 4,724 | ||||||||||||||||||||||||||||||||
Table IV
Asset and Liability Management Interest Rate and Foreign Exchange Contracts
| December 31, 2003 | ||||||||||||||||||||||||||||||||||
| Expected Maturity | ||||||||||||||||||||||||||||||||||
| (Dollars in millions, average estimated duration in years) | Fair Value | Total | 2004 | 2005 | 2006 | 2007 | 2008 | Thereafter | Average Estimated Duration | |||||||||||||||||||||||||
Cash flow hedges | ||||||||||||||||||||||||||||||||||
Receive fixed interest rate swaps(1) | $ | (2,184 | ) | 5.22 | ||||||||||||||||||||||||||||||
Notional amount | $ | 122,547 | $ | — | $ | 2,000 | $ | — | $ | 33,848 | $ | 33,561 | $ | 53,138 | ||||||||||||||||||||
Weighted average fixed rate | 3.46 | % | — | % | 2.10 | % | — | % | 3.08 | % | 2.97 | % | 4.06 | % | ||||||||||||||||||||
Pay fixed interest rate swaps(1) | (2,101 | ) | 5.51 | |||||||||||||||||||||||||||||||
Notional amount | $ | 134,654 | $ | — | $ | 3,641 | $ | 14,501 | $ | 39,142 | $ | 13,501 | $ | 63,869 | ||||||||||||||||||||
Weighted average fixed rate | 4.00 | % | — | % | 2.09 | % | 2.92 | % | 3.33 | % | 3.77 | % | 4.81 | % | ||||||||||||||||||||
Basis swaps | 38 | |||||||||||||||||||||||||||||||||
Notional amount | $ | 16,356 | $ | 9,000 | $ | 500 | $ | 4,400 | $ | 45 | $ | 590 | $ | 1,821 | ||||||||||||||||||||
Option product(2) | 1,582 | |||||||||||||||||||||||||||||||||
Notional amount(3) | 84,965 | 1,267 | 50,000 | 3,000 | — | 30,000 | 698 | |||||||||||||||||||||||||||
Futures and forward rate | 1,911 | |||||||||||||||||||||||||||||||||
Notional amount(3) | 106,760 | 86,760 | 20,000 | — | — | — | — | |||||||||||||||||||||||||||
Total net cash flow positions | $ | (754 | ) | |||||||||||||||||||||||||||||||
Fair value hedges | ||||||||||||||||||||||||||||||||||
Receive fixed interest rate swaps(1) | $ | 980 | 6.12 | |||||||||||||||||||||||||||||||
Notional amount | $ | 34,225 | $ | — | $ | 2,580 | $ | 4,363 | $ | 2,500 | $ | 2,638 | $ | 22,144 | ||||||||||||||||||||
Weighted average fixed rate | 4.96 | % | — | % | 4.78 | % | 5.22 | % | 4.53 | % | 3.46 | % | 5.16 | % | ||||||||||||||||||||
Pay fixed interest rate swaps(1) | (2 | ) | 3.70 | |||||||||||||||||||||||||||||||
Notional amount | $ | 924 | $ | 81 | $ | 47 | $ | 80 | $ | 112 | $ | 149 | $ | 455 | ||||||||||||||||||||
Weighted average fixed rate | 6.00 | % | 6.04 | % | 4.84 | % | 4.54 | % | 7.61 | % | 4.77 | % | 6.38 | % | ||||||||||||||||||||
Foreign exchange contracts | 1,129 | |||||||||||||||||||||||||||||||||
Notional amount | $ | 7,364 | $ | 100 | $ | 488 | $ | 468 | $ | (379 | ) | $ | 1,560 | $ | 5,127 | |||||||||||||||||||
Futures and forward rate contracts(4) | (3 | ) | ||||||||||||||||||||||||||||||||
Notional amount(3) | (604 | ) | (604 | ) | — | — | — | — | — | |||||||||||||||||||||||||
Total net fair value positions | $ | 2,104 | ||||||||||||||||||||||||||||||||
Closed interest rate contracts(5) | 839 | |||||||||||||||||||||||||||||||||
Total ALM contracts | $ | 2,189 | ||||||||||||||||||||||||||||||||
| (1) | At December 31, 2004, $39.9 billion of the receive fixed interest rate swap notional and $75.9 billion of the pay fixed interest swap notional represented forward starting swaps that will not be effective until their respective contractual start dates. At December 31, 2003, $14.2 billion of the receive fixed interest rate swap notional and $114.5 billion of the pay fixed interest rate swap notional represented forward starting swaps that will not be effective until their respective contractual start dates. |
| (2) | Option products include caps, floors, swaptions and exchange-traded options on index futures contracts. These strategies may include option collars or spread strategies, which involve the buying and selling of options on the same underlying security or interest rate index. |
| (3) | Reflects the net of long and short positions. |
| (4) | Futures and forward rate contracts include Eurodollar futures, U.S. Treasury futures, and forward purchase and sale contracts. Included are $50.0 billion of forward purchase contracts, and $25.6 billion of forward sale contracts of mortgage-backed securities and mortgage loans, at December 31, 2004, as discussed on pages 67 and 68. At December 31, 2003, the forward purchase and sale contracts of mortgage-backed securities and mortgage loans amounted to $69.8 billion and $8.0 billion, respectively. |
| (5) | Represents the unamortized net realized deferred gains associated with closed contracts. As a result, no notional amount is reflected for expected maturity. The $1.3 billion and $839 million deferred gains as of December 31, 2004 and 2003, respectively, on closed interest rate contracts primarily consisted of gains on closed ALM swaps and forward contracts. Of the $1.3 billion unamortized net realized deferred gains, a gain of $836 million was included in Accumulated OCI, a gain of $514 million was included as a basis adjustment of Long-term Debt, and a loss of $22 million was primarily included as a basis adjustment to mortgage loans, AFS Securities and Long-term Debt at December 31, 2004. As of December 31, 2003, a gain of $238 million was included in Accumulated OCI, a gain of $631 million was primarily included as a basis adjustment of long-term debt, and a loss of $30 million was included as a basis adjustment to mortgage loans. |
Table V
Non-exchange Traded Commodity Contracts
| (Dollars in millions) | Asset Positions | Liability Positions | ||||||
Net fair value of contracts outstanding, January 1, 2004 | $ | 1,724 | $ | 1,473 | ||||
Effects of legally enforceable master netting agreements | 3,344 | 3,344 | ||||||
Gross fair value of contracts outstanding, January 1, 2004 | 5,068 | 4,817 | ||||||
Contracts realized or otherwise settled | (2,196 | ) | (2,347 | ) | ||||
Fair value of new contracts(1) | 2,129 | 1,991 | ||||||
Other changes in fair value | 1,643 | 1,440 | ||||||
Gross fair value of contracts outstanding, December 31, 2004 | 6,644 | 5,901 | ||||||
Effects of legally enforceable master netting agreements | (4,449 | ) | (4,449 | ) | ||||
Net fair value of contracts outstanding, December 31, 2004 | $ | 2,195 | $ | 1,452 | ||||
| (1) | Includes the fair value of $0 of asset and $4 of liability positions of new contracts assumed in the Merger. |
Table VI
Non-exchange Traded Commodity Contract Maturities
| December 31, 2004 | ||||||||
| (Dollars in millions) | Asset Positions | Liability Positions | ||||||
Maturity of less than 1 year | $ | 1,741 | $ | 1,688 | ||||
Maturity of 1-3 years | 3,946 | 3,353 | ||||||
Maturity of 4-5 years | 862 | 751 | ||||||
Maturity in excess of 5 years | 95 | 109 | ||||||
Gross fair value of contracts | 6,644 | 5,901 | ||||||
Effects of legally enforceable master netting agreements | (4,449 | ) | (4,449 | ) | ||||
Net fair value of contracts outstanding | $ | 2,195 | $ | 1,452 | ||||
Table VII
Selected Quarterly Financial Data
| 2004 Quarters | 2003 Quarters | |||||||||||||||||||||||||||||||
| (Dollars in millions, except per share information) | Fourth | Third | Second | First | Fourth | Third | Second | First | ||||||||||||||||||||||||
Income statement | ||||||||||||||||||||||||||||||||
Net interest income | $ | 7,750 | $ | 7,665 | $ | 7,581 | $ | 5,801 | $ | 5,586 | $ | 5,304 | $ | 5,365 | $ | 5,209 | ||||||||||||||||
Noninterest income | 5,964 | 4,922 | 5,481 | 3,730 | 4,049 | 4,446 | 4,262 | 3,693 | ||||||||||||||||||||||||
Total revenue | 13,714 | 12,587 | 13,062 | 9,531 | 9,635 | 9,750 | 9,627 | 8,902 | ||||||||||||||||||||||||
Provision for credit losses | 706 | 650 | 789 | 624 | 583 | 651 | 772 | 833 | ||||||||||||||||||||||||
Gains on sales of debt securities | 101 | 732 | 795 | 495 | 139 | 233 | 296 | 273 | ||||||||||||||||||||||||
Noninterest expense | 7,334 | 7,021 | 7,242 | 5,430 | 5,288 | 5,077 | 5,065 | 4,725 | ||||||||||||||||||||||||
Income before income taxes | 5,775 | 5,648 | 5,826 | 3,972 | 3,903 | 4,255 | 4,086 | 3,617 | ||||||||||||||||||||||||
Income tax expense | 1,926 | 1,884 | 1,977 | 1,291 | 1,177 | 1,333 | 1,348 | 1,193 | ||||||||||||||||||||||||
Net income | 3,849 | 3,764 | 3,849 | 2,681 | 2,726 | 2,922 | 2,738 | 2,424 | ||||||||||||||||||||||||
Average common shares issued and outstanding (in thousands) | 4,032,979 | 4,052,304 | 4,062,384 | 2,880,306 | 2,926,494 | 2,980,206 | 2,988,187 | 2,998,811 | ||||||||||||||||||||||||
Average diluted common shares issued and outstanding (in thousands) | 4,106,040 | 4,121,375 | 4,131,290 | 2,933,402 | 2,978,962 | 3,039,282 | 3,046,612 | 3,052,576 | ||||||||||||||||||||||||
Performance ratios | ||||||||||||||||||||||||||||||||
Return on average assets | 1.33 | % | 1.37 | % | 1.41 | % | 1.29 | % | 1.42 | % | 1.50 | % | 1.44 | % | 1.40 | % | ||||||||||||||||
Return on average common shareholders’ equity | 15.63 | 15.56 | 16.63 | 22.16 | 22.42 | 23.74 | 21.86 | 19.92 | ||||||||||||||||||||||||
Total equity to total assets (period end) | 8.97 | 9.14 | 9.35 | 6.10 | 6.67 | 6.98 | 6.78 | 7.51 | ||||||||||||||||||||||||
Total average equity to total average assets | 8.51 | 8.79 | 8.52 | 5.84 | 6.32 | 6.34 | 6.62 | 7.06 | ||||||||||||||||||||||||
Dividend payout | 47.45 | 48.75 | 42.60 | 43.21 | 42.70 | 40.85 | 35.06 | 39.64 | ||||||||||||||||||||||||
Per common share data | ||||||||||||||||||||||||||||||||
Earnings | $ | 0.95 | $ | 0.93 | $ | 0.95 | $ | 0.93 | $ | 0.93 | $ | 0.98 | $ | 0.92 | $ | 0.81 | ||||||||||||||||
Diluted earnings | 0.94 | 0.91 | 0.93 | 0.91 | 0.92 | 0.96 | 0.90 | 0.79 | ||||||||||||||||||||||||
Dividends paid | 0.45 | 0.45 | 0.40 | 0.40 | 0.40 | 0.40 | 0.32 | 0.32 | ||||||||||||||||||||||||
Book value | 24.56 | 24.14 | 23.51 | 16.85 | 16.63 | 16.92 | 17.03 | 16.69 | ||||||||||||||||||||||||
Average balance sheet | ||||||||||||||||||||||||||||||||
Total loans and leases | $ | 515,463 | $ | 503,078 | $ | 497,158 | $ | 374,077 | $ | 371,071 | $ | 357,288 | $ | 350,279 | $ | 345,662 | ||||||||||||||||
Total assets | 1,152,551 | 1,096,683 | 1,094,459 | 833,192 | 764,186 | 771,255 | 759,906 | 699,926 | ||||||||||||||||||||||||
Total deposits | 609,936 | 587,878 | 582,305 | 425,075 | 418,840 | 414,569 | 405,307 | 385,760 | ||||||||||||||||||||||||
Long-term debt | 99,588 | 98,361 | 96,395 | 78,852 | 70,596 | 66,788 | 68,927 | 67,399 | ||||||||||||||||||||||||
Common shareholders’ equity | 97,828 | 96,120 | 92,943 | 48,632 | 48,238 | 48,816 | 50,212 | 49,343 | ||||||||||||||||||||||||
Total shareholders’ equity | 98,100 | 96,392 | 93,266 | 48,686 | 48,293 | 48,871 | 50,269 | 49,400 | ||||||||||||||||||||||||
Capital ratios (period end) | ||||||||||||||||||||||||||||||||
Risk-based capital: | ||||||||||||||||||||||||||||||||
Tier 1 | 8.10 | % | 8.08 | % | 8.20 | % | 7.73 | % | 7.85 | % | 8.25 | % | 8.08 | % | 8.20 | % | ||||||||||||||||
Total | 11.63 | 11.71 | 11.97 | 11.46 | 11.87 | 12.17 | 11.95 | 12.29 | ||||||||||||||||||||||||
Leverage | 5.82 | 5.92 | 5.83 | 5.43 | 5.73 | 5.95 | 5.92 | 6.24 | ||||||||||||||||||||||||
Market price per share of common stock | ||||||||||||||||||||||||||||||||
Closing | $ | 46.99 | $ | 43.33 | $ | 42.31 | $ | 40.49 | $ | 40.22 | $ | 39.02 | $ | 39.52 | $ | 33.42 | ||||||||||||||||
High closing | 47.44 | 44.98 | 42.72 | 41.38 | 41.25 | 41.77 | 39.95 | 36.24 | ||||||||||||||||||||||||
Low closing | 43.62 | 41.81 | 38.96 | 39.15 | 36.43 | 37.44 | 34.00 | 32.82 | ||||||||||||||||||||||||
Table VIII
Quarterly Average Balances and Interest Rates - Fully Taxable-equivalent Basis
| Fourth Quarter 2004 | Third Quarter 2004 | |||||||||||||||||
| (Dollars in millions) | Average Balance | Interest Income/ Expense | Yield/ Rate | Average Balance | Interest Income/ Expense | Yield/ Rate | ||||||||||||
Earning assets | ||||||||||||||||||
Time deposits placed and other short-term investments | $ | 15,620 | $ | 128 | 3.24 | % | $ | 14,726 | $ | 127 | 3.45 | % | ||||||
Federal funds sold and securities purchased under agreements to resell | 149,226 | 712 | 1.90 | 128,339 | 484 | 1.50 | ||||||||||||
Trading account assets | 110,585 | 1,067 | 3.85 | 98,459 | 975 | 3.96 | ||||||||||||
Securities | 171,173 | 2,083 | 4.87 | 169,515 | 2,095 | 4.94 | ||||||||||||
Loans and leases(1): | ||||||||||||||||||
Residential mortgage | 178,879 | 2,459 | 5.49 | 175,046 | 2,371 | 5.41 | ||||||||||||
Credit card | 49,366 | 1,351 | 10.88 | 45,818 | 1,265 | 10.98 | ||||||||||||
Home equity lines | 48,336 | 609 | 5.01 | 44,309 | 514 | 4.62 | ||||||||||||
Direct/Indirect consumer | 39,526 | 551 | 5.55 | 38,951 | 538 | 5.49 | ||||||||||||
Other consumer(2) | 7,557 | 153 | 8.07 | 7,693 | 152 | 7.91 | ||||||||||||
Total consumer | 323,664 | 5,123 | 6.31 | 311,817 | 4,840 | 6.19 | ||||||||||||
Commercial - domestic | 121,412 | 1,917 | 6.28 | 122,093 | 1,855 | 6.04 | ||||||||||||
Commercial real estate | 31,355 | 392 | 4.98 | 30,792 | 344 | 4.44 | ||||||||||||
Commercial lease financing | 20,204 | 254 | 5.01 | 20,125 | 233 | 4.64 | ||||||||||||
Commercial - foreign | 18,828 | 272 | 5.76 | 18,251 | 245 | 5.34 | ||||||||||||
Total commercial | 191,799 | 2,835 | 5.88 | 191,261 | 2,677 | 5.57 | ||||||||||||
Total loans and leases | 515,463 | 7,958 | 6.15 | 503,078 | 7,517 | 5.95 | ||||||||||||
Other earning assets | 35,937 | 456 | 5.08 | 34,266 | 460 | 5.33 | ||||||||||||
Total earning assets(3) | 998,004 | 12,404 | 4.96 | 948,383 | 11,658 | 4.90 | ||||||||||||
Cash and cash equivalents | 31,028 | 29,469 | ||||||||||||||||
Other assets, less allowance for loan and lease losses | 123,519 | 118,831 | ||||||||||||||||
Total assets | $ | 1,152,551 | $ | 1,096,683 | ||||||||||||||
Interest-bearing liabilities | ||||||||||||||||||
Domestic interest-bearing deposits: | ||||||||||||||||||
Savings | $ | 36,927 | $ | 36 | 0.39 | % | $ | 36,823 | $ | 35 | 0.38 | % | ||||||
NOW and money market deposit accounts | 234,596 | 589 | 1.00 | 233,602 | 523 | 0.89 | ||||||||||||
Consumer CDs and IRAs | 109,243 | 711 | 2.59 | 101,250 | 668 | 2.63 | ||||||||||||
Negotiable CDs, public funds and other time deposits | 7,563 | 81 | 4.27 | 5,654 | 69 | 4.85 | ||||||||||||
Total domestic interest-bearing deposits | 388,329 | 1,417 | 1.45 | 377,329 | 1,295 | 1.37 | ||||||||||||
Foreign interest-bearing deposits(4): | ||||||||||||||||||
Banks located in foreign countries | 17,953 | 275 | 6.11 | 17,864 | 307 | 6.83 | ||||||||||||
Governments and official institutions | 5,843 | 33 | 2.21 | 5,021 | 22 | 1.80 | ||||||||||||
Time, savings and other | 30,459 | 104 | 1.36 | 29,513 | 87 | 1.17 | ||||||||||||
Total foreign interest-bearing deposits | 54,255 | 412 | 3.02 | 52,398 | 416 | 3.16 | ||||||||||||
Total interest-bearing deposits | 442,584 | 1,829 | 1.64 | 429,727 | 1,711 | 1.58 | ||||||||||||
Federal funds purchased, securities sold under agreements to repurchase and other short-term borrowings | 252,384 | 1,543 | 2.43 | 226,025 | 1,152 | 2.03 | ||||||||||||
Trading account liabilities | 37,387 | 352 | 3.74 | 37,706 | 333 | 3.51 | ||||||||||||
Long-term debt | 99,588 | 724 | 2.91 | 98,361 | 626 | 2.54 | ||||||||||||
Total interest-bearing liabilities(3) | 831,943 | 4,448 | 2.13 | 791,819 | 3,822 | 1.92 | ||||||||||||
Noninterest-bearing sources: | ||||||||||||||||||
Noninterest-bearing deposits | 167,352 | 158,151 | ||||||||||||||||
Other liabilities | 55,156 | 50,321 | ||||||||||||||||
Shareholders’ equity | 98,100 | 96,392 | ||||||||||||||||
Total liabilities and shareholders’ equity | $ | 1,152,551 | $ | 1,096,683 | ||||||||||||||
Net interest spread | 2.83 | 2.98 | ||||||||||||||||
Impact of noninterest-bearing sources | 0.35 | 0.32 | ||||||||||||||||
Net interest income/yield on earning assets | $ | 7,956 | 3.18 | % | $ | 7,836 | 3.30 | % | ||||||||||
| (1) | Nonperforming loans are included in the respective average loan balances. Income on these nonperforming loans is recognized on a cash basis. |
| (2) | Includes consumer finance of $3,473, $3,644, $3,828 and $3,999 in the fourth, third, second and first quarters of 2004, and $3,938 in the fourth quarter of 2003, respectively; foreign consumer of $3,523, $3,304, $3,256 and $1,989 in the fourth, third, second and first quarters of 2004, and $1,939 in the fourth quarter of 2003, respectively; and consumer lease financing of $561, $745, $1,058 and $1,491 in the fourth, third, second and first quarters of 2004 and $1,860 in the fourth quarter of 2003, respectively. |
Earning assets Time deposits placed and other short-term investments Federal funds sold and securities purchased under agreements to resell Trading account assets Securities Loans and leases(1): Residential mortgage Credit card Home equity lines Direct/Indirect consumer Other consumer(2) Total consumer Commercial - domestic Commercial real estate Commercial lease financing Commercial - foreign Total commercial Total loans and leases Other earning assets Total earning assets(3) Cash and cash equivalents Other assets, less allowance for loan and lease losses Total assets Interest-bearing liabilities Domestic interest-bearing deposits: Savings NOW and money market deposit accounts Consumer CDs and IRAs Negotiable CDs, public funds and other time deposits Total domestic interest-bearing deposits Foreign interest-bearing deposits(4): Banks located in foreign countries Governments and official institutions Time, savings and other Total foreign interest-bearing deposits Total interest-bearing deposits Federal funds purchased, securities sold under agreements to repurchase and other short-term borrowings Trading account liabilities Long-term debt Total interest-bearing liabilities(3) Noninterest-bearing sources: Noninterest-bearing deposits Other liabilities Shareholders’ equity Total liabilities and shareholders’ equity Net interest spread Impact of noninterest-bearing sources Net interest income/yield on earning assets Second Quarter 2004 First Quarter 2004 Fourth Quarter 2003 (Dollars in millions) Average
Balance Interest
Income/
Expense Yield/
Rate Average
Balance Interest
Income/
Expense Yield/
Rate Average
Balance Interest
Income/
Expense Yield/
Rate $ 14,384 $ 59 1.65 % $ 12,268 $ 48 1.57 % $ 11,231 $ 49 1.71 % 124,383 413 1.33 113,761 434 1.53 96,713 506 2.08 104,391 1,025 3.94 105,033 1,025 3.91 94,630 926 3.91 159,797 1,925 4.82 99,755 1,223 4.91 59,197 742 5.01 173,158 2,284 5.29 141,898 1,960 5.53 142,482 1,931 5.41 43,160 1,167 10.88 35,303 870 9.92 32,734 810 9.83 40,424 450 4.48 24,379 262 4.31 23,206 255 4.36 39,763 540 5.44 34,045 464 5.49 33,422 478 5.67 8,142 169 8.32 7,479 120 6.42 7,737 124 6.37 304,647 4,610 6.07 243,104 3,676 6.07 239,581 3,598 5.98 123,970 1,843 5.98 90,946 1,511 6.68 90,309 1,612 7.08 30,311 317 4.20 19,815 210 4.26 19,616 211 4.27 20,086 237 4.72 9,459 95 4.00 9,971 93 3.71 18,144 237 5.24 10,753 95 3.57 11,594 101 3.45 192,511 2,634 5.50 130,973 1,911 5.87 131,490 2,017 6.09 497,158 7,244 5.85 374,077 5,587 6.00 371,071 5,615 6.02 38,407 494 5.17 29,914 404 5.42 33,938 367 4.32 938,520 11,160 4.77 734,808 8,721 4.76 666,780 8,205 4.90 30,320 23,187 22,975 125,619 75,197 74,431 $ 1,094,459 $ 833,192 $ 764,186 $ 35,864 $ 31 0.34 % $ 26,159 $ 17 0.27 % $ 25,494 $ 19 0.30 % 233,702 488 0.84 155,835 321 0.83 155,369 400 1.02 93,017 587 2.54 75,341 567 3.03 73,246 476 2.58 4,737 66 5.60 5,939 74 5.01 6,195 44 2.81 367,320 1,172 1.28 263,274 979 1.50 260,304 939 1.43 18,945 287 6.10 18,954 171 3.62 13,225 177 5.34 5,739 23 1.58 4,701 19 1.63 2,654 11 1.58 29,882 47 0.64 21,054 37 0.71 20,019 51 1.02 54,566 357 2.63 44,709 227 2.04 35,898 239 2.65 421,886 1,529 1.46 307,983 1,206 1.57 296,202 1,178 1.58 235,701 1,019 1.74 195,866 720 1.48 144,082 515 1.42 31,620 298 3.78 34,543 334 3.90 38,298 317 3.28 96,395 563 2.34 78,852 491 2.49 70,596 450 2.55 785,602 3,409 1.74 617,244 2,751 1.79 549,178 2,460 1.78 160,419 117,092 122,638 55,172 50,170 44,077 93,266 48,686 48,293 $ 1,094,459 $ 833,192 $ 764,186 3.03 2.97 3.12 0.28 0.29 0.31 $ 7,751 3.31 % $ 5,970 3.26 % $ 5,745 3.43 %
| (3) | Interest income includes the impact of interest rate risk management contracts, which increased interest income on the underlying assets $496, $531, $658 and $715 in the fourth, third, second and first quarters of 2004 and $884 in the fourth quarter of 2003, respectively. These amounts were substantially offset by corresponding decreases in the income earned on the underlying assets. Interest expense includes the impact of interest rate risk management contracts, which increased interest expense on the underlying liabilities $155, $217, $333 and $183 in the fourth, third, second and first quarters of 2004 and $90 in the fourth quarter of 2003, respectively. These amounts were substantially offset by corresponding decreases in the interest paid on the underlying liabilities. For further information on interest rate contracts, see “Interest Rate Risk Management” beginning on page 66. |
| (4) | Primarily consists of time deposits in denominations of $100,000 or more. |
Item 7A. QUANTITATIVE AND QUALITATIVE DISCLOSURES ABOUT MARKET RISK
The information set forth in the 2003 Annual Report under the caption “MarketSee “Management’s Discussion and Analysis of Financial Condition and Results of Operations—Market Risk Management” in the MD&A isbeginning on page 61 which are incorporated herein by reference.
Item 8. CONSOLIDATED FINANCIAL STATEMENTS AND SUPPLEMENTARY DATA
Report of Management on Internal Control Over Financial Reporting
The following informationmanagement of Bank of America Corporation is responsible for establishing and maintaining adequate internal control over financial reporting.
The Corporation’s internal control over financial reporting is a process designed to provide reasonable assurance regarding the reliability of financial reporting and the preparation of financial statements for external purposes in accordance with accounting principles generally accepted in the United States of America. The Corporation’s internal control over financial reporting includes those policies and procedures that (i) pertain to the maintenance of records that, in reasonable detail, accurately and fairly reflect the transactions and dispositions of the assets of the company; (ii) provide reasonable assurance that transactions are recorded as necessary to permit preparation of financial statements in accordance with accounting principles generally accepted in the United States of America, and that receipts and expenditures of the company are being made only in accordance with authorizations of management and directors of the company; and (iii) provide reasonable assurance regarding prevention or timely detection of unauthorized acquisition, use, or disposition of the company’s assets that could have a material effect on the financial statements.
Because of its inherent limitations, internal control over financial reporting may not prevent or detect misstatements. Also, projections of any evaluation of effectiveness to future periods are subject to the risk that controls may become inadequate because of changes in conditions, or that the degree of compliance with the policies or procedures may deteriorate.
Management assessed the effectiveness of the Corporation’s internal control over financial reporting as of December 31, 2004, based on the framework set forth by the Committee of Sponsoring Organizations of the Treadway Commission (COSO) inInternal Control–Integrated Framework. Based on that assessment, management concluded that, as of December 31, 2004, the Corporation’s internal control over financial reporting is effective based on the criteria established inInternal Control–Integrated Framework.
Management’s assessment of the effectiveness of the Corporation’s internal control over financial reporting as of December 31, 2004, has been audited by PricewaterhouseCoopers, LLP, an independent registered public accounting firm, as stated in their report appearing on page 85, which expresses unqualified opinions on management’s assessment and on the 2003 Annual effectiveness of the Corporation’s internal control over financial reporting as of December 31, 2004.
 |  | |||
Kenneth D. Lewis | Marc D. Oken | |||
Chairman, President and Chief Executive Officer | Chief Financial Officer | |||
Report is incorporated herein by reference:of Independent Registered Public Accounting Firm
To the Board of Directors and Shareholders of Bank of America Corporation:
We have completed an integrated audit of Bank of America Corporation’s 2004 Consolidated Financial Statements and Notes toof its internal control over financial reporting as of December 31, 2004 and audits of its 2003 and 2002 Consolidated Financial Statements in accordance with the standards of the Public Company Accounting Oversight Board (United States). Our opinions, based on our audits, are presented below.
Consolidated Financial Statements
In our opinion, the accompanying Consolidated Balance Sheets and the related Consolidated Statements of Income, Consolidated Statements of Changes in Shareholders’ Equity and Consolidated Statements of Cash Flows present fairly, in all material respects, the financial position of Bank of America Corporation and Subsidiaries,its subsidiaries at December 31, 2004 and 2003, and the results of their operations and their cash flows for each of the three years in the period ended December 31, 2004 in conformity with accounting principles generally accepted in the United States of America. These Consolidated Financial Statements are the responsibility of the Corporation’s management. Our responsibility is to express an opinion on these Consolidated Financial Statements based on our audits. We conducted our audits of these Consolidated Financial Statements in accordance with the standards of the Public Company Accounting Oversight Board (United States). Those standards require that we plan and perform the audit to obtain reasonable assurance about whether the financial statements are free of material misstatement. An audit of financial statements includes examining, on a test basis, evidence supporting the amounts and disclosures in the financial statements, assessing the accounting principles used and significant estimates made by management, and evaluating the overall financial statement presentation. We believe that our audits provide a reasonable basis for our opinion.
11Internal Control Over Financial Reporting
Also, in our opinion, management’s assessment, included in the Report of Management on Internal Control Over Financial Reporting appearing on page 84 of the Annual Report, that the Corporation maintained effective internal control over financial reporting as of December 31, 2004 based on criteria established inInternal Control – Integrated Framework issued by the Committee of Sponsoring Organizations of the Treadway Commission (COSO), is fairly stated, in all material respects, based on those criteria. Furthermore, in our opinion, the Corporation maintained, in all material respects, effective internal control over financial reporting as of December 31, 2004, based on criteria established inInternal Control – Integrated Framework issued by the COSO. The Corporation’s management is responsible for maintaining effective internal control over financial reporting and for its assessment of the effectiveness of internal control over financial reporting. Our responsibility is to express opinions on management’s assessment and on the effectiveness of the Corporation’s internal control over financial reporting based on our audit. We conducted our audit of internal control over financial reporting in accordance with the standards of the Public Company Accounting Oversight Board (United States). Those standards require that we plan and perform the audit to obtain reasonable assurance about whether effective internal control over financial reporting was maintained in all material respects. An audit of internal control over financial reporting includes obtaining an understanding of internal control over financial reporting, evaluating management’s assessment, testing and evaluating the design and operating effectiveness of internal control, and performing such other procedures as we consider necessary in the circumstances. We believe that our audit provides a reasonable basis for our opinions.
A company’s internal control over financial reporting is a process designed to provide reasonable assurance regarding the reliability of financial reporting and the preparation of financial statements for external purposes in accordance with generally accepted accounting principles. A company’s internal control over financial reporting includes those policies and procedures that (i) pertain to the maintenance of records that, in reasonable detail, accurately and fairly reflect the transactions and dispositions of the assets of the company; (ii) provide reasonable assurance that transactions are recorded as necessary to permit preparation of financial statements in accordance with generally accepted accounting principles, and that receipts and expenditures of the company are being made only in accordance with authorizations of management and directors of the company; and (iii) provide reasonable assurance regarding prevention or timely detection of unauthorized acquisition, use, or disposition of the company’s assets that could have a material effect on the financial statements.
Because of its inherent limitations, internal control over financial reporting may not prevent or detect misstatements. Also, projections of any evaluation of effectiveness to future periods are subject to the risk that controls may become inadequate because of changes in conditions, or that the degree of compliance with the policies or procedures may deteriorate.

Charlotte, North Carolina
February 25, 2005
BANK OF AMERICA CORPORATION AND SUBSIDIARIES
Consolidated Statement of Income
| Year Ended December 31 | ||||||||||
| (Dollars in millions, except per share information) | 2004 | 2003 | 2002 | |||||||
Interest income | ||||||||||
Interest and fees on loans and leases | $ | 28,216 | $ | 21,668 | $ | 22,030 | ||||
Interest and dividends on securities | 7,265 | 3,068 | 3,941 | |||||||
Federal funds sold and securities purchased under agreements to resell | 2,043 | 1,373 | 870 | |||||||
Trading account assets | 4,016 | 3,947 | 3,757 | |||||||
Other interest income | 1,687 | 1,507 | 1,456 | |||||||
Total interest income | 43,227 | 31,563 | 32,054 | |||||||
Interest expense | ||||||||||
Deposits | 6,275 | 4,908 | 5,434 | |||||||
Short-term borrowings | 4,434 | 1,871 | 1,982 | |||||||
Trading account liabilities | 1,317 | 1,286 | 1,260 | |||||||
Long-term debt | 2,404 | 2,034 | 2,455 | |||||||
Total interest expense | 14,430 | 10,099 | 11,131 | |||||||
Net interest income | 28,797 | 21,464 | 20,923 | |||||||
Noninterest income | ||||||||||
Service charges | 6,989 | 5,618 | 5,276 | |||||||
Investment and brokerage services | 3,627 | 2,371 | 2,237 | |||||||
Mortgage banking income | 414 | 1,922 | 761 | |||||||
Investment banking income | 1,886 | 1,736 | 1,545 | |||||||
Equity investment gains (losses) | 861 | 215 | (280 | ) | ||||||
Card income | 4,588 | 3,052 | 2,620 | |||||||
Trading account profits | 869 | 409 | 778 | |||||||
Other income | 863 | 1,127 | 643 | |||||||
Total noninterest income | 20,097 | 16,450 | 13,580 | |||||||
Total revenue | 48,894 | 37,914 | 34,503 | |||||||
Provision for credit losses | 2,769 | 2,839 | 3,697 | |||||||
Gains on sales of debt securities | 2,123 | 941 | 630 | |||||||
Noninterest expense | ||||||||||
Personnel | 13,473 | 10,446 | 9,682 | |||||||
Occupancy | 2,379 | 2,006 | 1,780 | |||||||
Equipment | 1,214 | 1,052 | 1,124 | |||||||
Marketing | 1,349 | 985 | 753 | |||||||
Professional fees | 836 | 844 | 525 | |||||||
Amortization of intangibles | 664 | 217 | 218 | |||||||
Data processing | 1,325 | 1,104 | 1,017 | |||||||
Telecommunications | 730 | 571 | 481 | |||||||
Other general operating | 4,439 | 2,930 | 2,865 | |||||||
Merger and restructuring charges | 618 | — | — | |||||||
Total noninterest expense | 27,027 | 20,155 | 18,445 | |||||||
Income before income taxes | 21,221 | 15,861 | 12,991 | |||||||
Income tax expense | 7,078 | 5,051 | 3,742 | |||||||
Net income | $ | 14,143 | $ | 10,810 | $ | 9,249 | ||||
Net income available to common shareholders | $ | 14,127 | $ | 10,806 | $ | 9,244 | ||||
Per common share information | ||||||||||
Earnings | $ | 3.76 | $ | 3.63 | $ | 3.04 | ||||
Diluted earnings | $ | 3.69 | $ | 3.57 | $ | 2.95 | ||||
Dividends paid | $ | 1.70 | $ | 1.44 | $ | 1.22 | ||||
Average common shares issued and outstanding (in thousands) | 3,758,507 | 2,973,407 | 3,040,085 | |||||||
Average diluted common shares issued and outstanding (in thousands) | 3,823,943 | 3,030,356 | 3,130,935 | |||||||
See accompanying notes to Consolidated Financial Statements.
BANK OF AMERICA CORPORATION AND SUBSIDIARIES
Consolidated Balance Sheet
| December 31 | ||||||||
| (Dollars in millions) | 2004 | 2003 | ||||||
Assets | ||||||||
Cash and cash equivalents | $ | 28,936 | $ | 27,084 | ||||
Time deposits placed and other short-term investments | 12,361 | 8,051 | ||||||
Federal funds sold and securities purchased under agreements to resell (includes$91,243 and $76,446 pledged as collateral) | 91,360 | 76,492 | ||||||
Trading account assets (includes$38,929 and $18,722 pledged as collateral) | 93,587 | 68,547 | ||||||
Derivative assets | 30,235 | 29,009 | ||||||
Securities: | ||||||||
Available-for-sale (includes$45,127 and $20,858 pledged as collateral) | 194,743 | 66,382 | ||||||
Held-to-maturity, at cost (market value -$329 and $254) | 330 | 247 | ||||||
Total securities | 195,073 | 66,629 | ||||||
Loans and leases | 521,837 | 371,463 | ||||||
Allowance for loan and lease losses | (8,626 | ) | (6,163 | ) | ||||
Loans and leases, net of allowance | 513,211 | 365,300 | ||||||
Premises and equipment, net | 7,517 | 6,036 | ||||||
Mortgage servicing rights | 2,482 | 2,762 | ||||||
Goodwill | 45,262 | 11,455 | ||||||
Core deposit intangibles and other intangibles | 3,887 | 908 | ||||||
Other assets | 86,546 | 57,210 | ||||||
Total assets | $ | 1,110,457 | $ | 719,483 | ||||
Liabilities | ||||||||
Deposits in domestic offices: | ||||||||
Noninterest-bearing | $ | 163,833 | $ | 118,495 | ||||
Interest-bearing | 396,645 | 262,032 | ||||||
Deposits in foreign offices: | ||||||||
Noninterest-bearing | 6,066 | 3,035 | ||||||
Interest-bearing | 52,026 | 30,551 | ||||||
Total deposits | 618,570 | 414,113 | ||||||
Federal funds purchased and securities sold under agreements to repurchase | 119,741 | 78,046 | ||||||
Trading account liabilities | 36,654 | 26,844 | ||||||
Derivative liabilities | 17,928 | 15,062 | ||||||
Commercial paper and other short-term borrowings | 78,598 | 34,980 | ||||||
Accrued expenses and other liabilities (includes$402 and $416 of reserve for unfunded lending commitments) | 41,243 | 27,115 | ||||||
Long-term debt | 98,078 | 75,343 | ||||||
Total liabilities | 1,010,812 | 671,503 | ||||||
Commitments and contingencies (Notes 8 and 12) | ||||||||
Shareholders’ equity | ||||||||
Preferred stock, $0.01 par value; authorized -100,000,000 shares; issued and outstanding -1,090,189 and 2,539,200 shares | 271 | 54 | ||||||
Common stock and additional paid-in capital, $0.01 par value; authorized -7,500,000,000 and 5,000,000,000 shares; issued and outstanding -4,046,546,212 and 2,882,287,572 shares | 44,236 | 29 | ||||||
Retained earnings | 58,006 | 50,198 | ||||||
Accumulated other comprehensive income (loss) | (2,587 | ) | (2,148 | ) | ||||
Other | (281 | ) | (153 | ) | ||||
Total shareholders’ equity | 99,645 | 47,980 | ||||||
Total liabilities and shareholders’ equity | $ | 1,110,457 | $ | 719,483 | ||||
See accompanying notes to Consolidated Financial Statements.
BANK OF AMERICA CORPORATION AND SUBSIDIARIES
Consolidated Statement of Changes in Shareholders’ Equity
| (Dollars in millions, shares in thousands) | Preferred Stock | Common Stock and Additional Paid-in Capital | Retained Earnings | Accumulated Other Comprehensive Income (Loss)(1) | Other | Total Share- holders’ Equity | Comprehensive Income | ||||||||||||||||||||||||
| Shares | Amount | ||||||||||||||||||||||||||||||
Balance, December 31, 2001 | $ | 65 | 3,118,594 | $ | 5,076 | $ | 42,980 | $ | 437 | $ | (38 | ) | $ | 48,520 | |||||||||||||||||
Net income | 9,249 | 9,249 | $ | 9,249 | |||||||||||||||||||||||||||
Net unrealized gains on available-for-sale debt and marketable equity securities | 974 | 974 | 974 | ||||||||||||||||||||||||||||
Net unrealized gains on foreign currency translation adjustments | 3 | 3 | 3 | ||||||||||||||||||||||||||||
Net unrealized losses on derivatives | (93 | ) | (93 | ) | (93 | ) | |||||||||||||||||||||||||
Cash dividends paid: | |||||||||||||||||||||||||||||||
Common | (3,704 | ) | (3,704 | ) | |||||||||||||||||||||||||||
Preferred | (5 | ) | (5 | ) | |||||||||||||||||||||||||||
Common stock issued under employee plans and related tax benefits | 100,008 | 2,611 | 21 | 2,632 | |||||||||||||||||||||||||||
Common stock repurchased | (217,800 | ) | (7,466 | ) | (7,466 | ) | |||||||||||||||||||||||||
Conversion of preferred stock | (7 | ) | 530 | 7 | |||||||||||||||||||||||||||
Other | 50 | 268 | (3 | ) | (89 | ) | 33 | 209 | (89 | ) | |||||||||||||||||||||
Balance, December 31, 2002 | 58 | 3,001,382 | 496 | 48,517 | 1,232 | 16 | 50,319 | 10,044 | |||||||||||||||||||||||
Net income | 10,810 | 10,810 | 10,810 | ||||||||||||||||||||||||||||
Net unrealized losses on available-for-sale debt and marketable equity securities | (564 | ) | (564 | ) | (564 | ) | |||||||||||||||||||||||||
Net unrealized gains on foreign currency translation adjustments | 2 | 2 | 2 | ||||||||||||||||||||||||||||
Net unrealized losses on derivatives | (2,803 | ) | (2,803 | ) | (2,803 | ) | |||||||||||||||||||||||||
Cash dividends paid: | |||||||||||||||||||||||||||||||
Common | (4,277 | ) | (4,277 | ) | |||||||||||||||||||||||||||
Preferred | (4 | ) | (4 | ) | |||||||||||||||||||||||||||
Common stock issued under employee plans and related tax benefits | 139,298 | 4,372 | (123 | ) | 4,249 | ||||||||||||||||||||||||||
Common stock repurchased | (258,686 | ) | (4,936 | ) | (4,830 | ) | (9,766 | ) | |||||||||||||||||||||||
Conversion of preferred stock | (4 | ) | 294 | 4 | |||||||||||||||||||||||||||
Other | 93 | (18 | ) | (15 | ) | (46 | ) | 14 | (15 | ) | |||||||||||||||||||||
Balance, December 31, 2003 | 54 | 2,882,288 | 29 | 50,198 | (2,148 | ) | (153 | ) | 47,980 | 7,430 | |||||||||||||||||||||
Net income | 14,143 | 14,143 | 14,143 | ||||||||||||||||||||||||||||
Net unrealized losses on available-for-sale debt and marketable equity securities | (126 | ) | (126 | ) | (126 | ) | |||||||||||||||||||||||||
Net unrealized gains on foreign currency translation adjustments | 13 | 13 | 13 | ||||||||||||||||||||||||||||
Net unrealized losses on derivatives | (294 | ) | (294 | ) | (294 | ) | |||||||||||||||||||||||||
Cash dividends paid: | |||||||||||||||||||||||||||||||
Common | (6,452 | ) | (6,452 | ) | |||||||||||||||||||||||||||
Preferred | (16 | ) | (16 | ) | |||||||||||||||||||||||||||
Common stock issued under employee plans and related tax benefits | 121,149 | 4,066 | (127 | ) | 3,939 | ||||||||||||||||||||||||||
Stocks issued in acquisition(2) | 271 | 1,186,728 | 46,480 | 46,751 | |||||||||||||||||||||||||||
Common stock repurchased | (147,859 | ) | (6,375 | ) | 89 | (6,286 | ) | ||||||||||||||||||||||||
Conversion of preferred stock | (54 | ) | 4,240 | 54 | |||||||||||||||||||||||||||
Other | (18 | ) | 44 | (32 | ) | (1 | ) | (7 | ) | (32 | ) | ||||||||||||||||||||
Balance, December 31, 2004 | $ | 271 | 4,046,546 | $ | 44,236 | $ | 58,006 | $ | (2,587 | ) | $ | (281 | ) | $ | 99,645 | $ | 13,704 | ||||||||||||||
| (1) | At December 31, 2004, 2003 and 2002, Accumulated Other Comprehensive Income (Loss) includes Net Unrealized Gains (Losses) on Available-for-sale (AFS) Debt and Marketable Equity Securities of $(196), $(70) and $494, respectively; Net Unrealized Losses on Foreign Currency Translation Adjustments of $153, $166 and $168, respectively; and Net Unrealized Gains (Losses) on Derivatives of $(2,102), $(1,808) and $995, respectively. |
| (2) | Includes adjustment for the fair value of outstanding FleetBoston Financial Corporation (FleetBoston) stock options of $862. |
See accompanying notes to Consolidated Financial Statements.
BANK OF AMERICA CORPORATION AND SUBSIDIARIES
Consolidated Statement of Cash Flows
| Year Ended December 31 | ||||||||||||
| (Dollars in millions) | 2004 | 2003 | 2002 | |||||||||
Operating activities | ||||||||||||
Net income | $ | 14,143 | $ | 10,810 | $ | 9,249 | ||||||
Reconciliation of net income to net cash provided by (used in) operating activities: | ||||||||||||
Provision for credit losses | 2,769 | 2,839 | 3,697 | |||||||||
Gains on sales of debt securities | (2,123 | ) | (941 | ) | (630 | ) | ||||||
Depreciation and premises improvements amortization | 972 | 890 | 886 | |||||||||
Amortization of intangibles | 664 | 217 | 218 | |||||||||
Deferred income tax benefit | (402 | ) | (263 | ) | (444 | ) | ||||||
Net increase in trading and hedging instruments | (13,180 | ) | (13,153 | ) | (13,133 | ) | ||||||
Net (increase) decrease in other assets | (11,928 | ) | 10,647 | (2,345 | ) | |||||||
Net increase (decrease) in accrued expenses and other liabilities | 4,583 | 12,067 | (11,019 | ) | ||||||||
Other operating activities, net | 547 | 37 | 2,837 | |||||||||
Net cash provided by (used in) operating activities | (3,955 | ) | 23,150 | (10,684 | ) | |||||||
Investing activities | ||||||||||||
Net increase in time deposits placed and other short-term investments | (1,147 | ) | (1,238 | ) | (881 | ) | ||||||
Net increase in federal funds sold and securities purchased under agreements to resell | (3,880 | ) | (31,614 | ) | (16,770 | ) | ||||||
Proceeds from sales of available-for-sale securities | 107,107 | 171,711 | 137,702 | |||||||||
Proceeds from maturities of available-for-sale securities | 26,973 | 26,953 | 26,777 | |||||||||
Purchases of available-for-sale securities | (232,609 | ) | (195,852 | ) | (145,962 | ) | ||||||
Proceeds from maturities of held-to-maturity securities | 153 | 779 | 43 | |||||||||
Proceeds from sales of loans and leases | 4,416 | 32,672 | 28,068 | |||||||||
Other changes in loans and leases, net | (32,344 | ) | (74,202 | ) | (37,184 | ) | ||||||
Originations and purchases of mortgage servicing rights | (1,075 | ) | (1,690 | ) | (900 | ) | ||||||
Net purchases of premises and equipment | (863 | ) | (209 | ) | (939 | ) | ||||||
Proceeds from sales of foreclosed properties | 198 | 247 | 142 | |||||||||
Investment in unconsolidated subsidiary | — | (1,600 | ) | — | ||||||||
Cash equivalents acquired net of purchase acquisitions | 4,953 | (140 | ) | (110 | ) | |||||||
Other investing activities, net | 986 | 898 | 2,676 | |||||||||
Net cash used in investing activities | (127,132 | ) | (73,285 | ) | (7,338 | ) | ||||||
Financing activities | ||||||||||||
Net increase in deposits | 64,423 | 27,655 | 12,963 | |||||||||
Net increase in federal funds purchased and securities sold under agreements to repurchase | 35,752 | 12,967 | 17,352 | |||||||||
Net increase (decrease) in commercial paper and other short-term borrowings | 37,437 | 13,917 | (790 | ) | ||||||||
Proceeds from issuance of long-term debt | 21,289 | 16,963 | 10,850 | |||||||||
Retirement of long-term debt | (16,904 | ) | (9,282 | ) | (15,364 | ) | ||||||
Proceeds from issuance of common stock | 3,723 | 3,970 | 2,373 | |||||||||
Common stock repurchased | (6,286 | ) | (9,766 | ) | (7,466 | ) | ||||||
Cash dividends paid | (6,468 | ) | (4,281 | ) | (3,709 | ) | ||||||
Other financing activities, net | (91 | ) | (72 | ) | (66 | ) | ||||||
Net cash provided by financing activities | 132,875 | 52,071 | 16,143 | |||||||||
Effect of exchange rate changes on cash and cash equivalents | 64 | 175 | 15 | |||||||||
Net increase (decrease) in cash and cash equivalents | 1,852 | 2,111 | (1,864 | ) | ||||||||
Cash and cash equivalents at January 1 | 27,084 | 24,973 | 26,837 | |||||||||
Cash equivalents at December 31 | $ | 28,936 | $ | 27,084 | $ | 24,973 | ||||||
Supplemental cash flow disclosures | ||||||||||||
Cash paid for interest | $ | 13,765 | $ | 10,214 | $ | 11,253 | ||||||
Cash paid for income taxes | 5,754 | 3,870 | 3,999 | |||||||||
Assets and liabilities of a certain multi-seller asset-backed commercial paper conduit that was consolidated amounted to $4,350 in 2003.
Net transfers of Loans and Leases from loans held-for-sale (included in Other Assets) to the loan portfolio for Asset and Liability Management (ALM) purposes amounted to $1,106, $9,683 and $8,468 in 2004, 2003 and 2002, respectively.
The fair values of noncash assets acquired and liabilities assumed in the merger with FleetBoston were $224,492 and $182,862, respectively.
Approximately 1.2 billion shares of common stock, valued at approximately $45,622, were issued in connection with the merger with FleetBoston.
See accompanying notes to Consolidated Financial Statements.
BANK OF AMERICA CORPORATION AND SUBSIDIARIES
Notes to Consolidated Financial Statements
Bank of America Corporation and its subsidiaries (the Corporation) through its banking and nonbanking subsidiaries, provide a diverse range of financial services and products throughout the United States and in selected international markets. At December 31, 2004, the Corporation operated its banking activities primarily under three charters: Bank of America, National Association (Bank of America, N.A.), Bank of America, N.A. (USA) and Fleet National Bank.
On April 1, 2004, the Corporation acquired all of the outstanding stock of FleetBoston (the Merger). FleetBoston’s results of operations were included in the Corporation’s results beginning on April 1, 2004. The Merger was accounted for as a purchase. For informational and comparative purposes, certain tables have been expanded to include a column entitled FleetBoston, April 1, 2004. This column represents balances acquired from FleetBoston as of April 1, 2004, including purchase accounting adjustments.
In order to more closely align with the scope of its businesses, the Corporation has renamed each of its business segments.Consumer and Small Business Banking has been renamedGlobal Consumer and Small Business Banking,Commercial Banking is now calledGlobal Business and Financial Services,Global Corporate and Investment Banking is now calledGlobal Capital Markets and Investment Banking andWealth and Investment Management has been renamedGlobal Wealth and Investment Management.
Note 1—Summary of Significant Accounting Principles
Principles of Consolidation and Basis of Presentation
The Consolidated Financial Statements include the accounts of the Corporation and its majority-owned subsidiaries, and those variable interest entities (VIEs) where the Corporation is the primary beneficiary. All significant intercompany accounts and transactions have been eliminated. Results of operations of companies purchased are included from the dates of acquisition. Certain prior period amounts have been reclassified to conform to current period presentation. Assets held in an agency or fiduciary capacity are not included in the Consolidated Financial Statements. The Corporation accounts for investments in companies in which it owns a voting interest of 20 percent to 50 percent and for which it may have significant influence over operating and financing decisions using the equity method of accounting. These investments are included in Other Assets and the Corporation’s proportionate share of income or loss is included in Other Income.
The preparation of the Consolidated Financial Statements in conformity with accounting principles generally accepted in the United States requires management to make estimates and assumptions that affect reported amounts and disclosures. Actual results could differ from those estimates and assumptions.
During the second quarter of 2004, the Corporation’s Board of Directors (the Board) approved a 2-for-1 stock split in the form of a common stock dividend effective August 27, 2004, to common shareholders of record on August 6, 2004. All prior period common share and related per common share information has been restated to reflect the 2-for-1 stock split.
Recently Issued Accounting Pronouncements
In January 2003, the Financial Accounting Standards Board (FASB) issued FASB Interpretation No. 46, “Consolidation of Variable Interest Entities, an interpretation of ARB No. 51” (FIN 46), which provides a framework for identifying VIEs and determining when a company should include the assets, liabilities, noncontrolling interests and results of activities of a VIE in its consolidated financial statements. The Corporation adopted FIN 46 on July 1, 2003, and consolidated approximately $12.2 billion of assets and liabilities related to certain of our multi-seller asset-backed commercial paper conduits (ABCP). On October 8, 2003, one of these entities, Ranger Funding Company (RFC) (formerly known as Receivables Capital Corporation), entered into a Subordinated Note Purchase Agreement (the Note) with an unrelated third
BANK OF AMERICA CORPORATION AND SUBSIDIARIES
Notes to Consolidated Financial Statements—(Continued)
party which reduced our exposure to this entity’s losses under liquidity and credit agreements as these agreements are senior to the Note. This Note was issued in the principal amount of $23 million, an original maturity of five years and pays interest at 23 percent. Proceeds from the issuance of the Note were deposited into a separate account and may be used to cover losses incurred by RFC. Upon RFC’s issuance of this Note, the Corporation evaluated whether the Corporation continued to be the primary beneficiary of RFC and determined that the unrelated party which purchased the Note absorbed over 50 percent of the expected losses of RFC. We determined the amount of expected loss through mathematical analysis utilizing a Monte Carlo model that incorporates the cash flows from RFC’s assets and utilizes independent loss information. The noteholder is therefore the primary beneficiary of and is required to consolidate the entity. As a result of the sale of the Note, we deconsolidated approximately $8.0 billion of the previously consolidated assets and liabilities of the entity. The impact of this transaction on Net Income was the reduction in Interest Income of approximately $1 million and the reclassification of approximately $37 million from Net Interest Income to Noninterest Income for 2003. At December 31, 2004, this entity had total assets of $10.0 billion. There was no material impact to Net Income or Tier 1 Capital as a result of the adoption of FIN 46 or the subsequent deconsolidation of this entity, and prior periods were not restated. In December 2003, the FASB issued FASB Interpretation No. 46 (Revised December 2003), “Consolidation of Variable Interest Entities, an interpretation of ARB No. 51” (FIN 46R), which is an update of FIN 46. The Corporation adopted FIN 46R as of March 31, 2004. Adoption of this rule did not have a material impact on the Corporation’s results of operations or financial condition. For additional information on VIEs, see Note 8 of the Consolidated Financial Statements.
On December 12, 2003, the American Institute of Certified Public Accountants issued Statement of Position No. 03-3, “Accounting for Certain Loans or Debt Securities Acquired in a Transfer” (SOP 03-3). SOP 03-3 requires acquired impaired loans for which it is probable that the investor will be unable to collect all contractually required payments receivable to be recorded at the present value of amounts expected to be received and prohibits carrying over or creation of valuation allowances in the initial accounting for these loans. SOP 03-3 is effective for loans acquired in fiscal years beginning after December 31, 2004. SOP 03-3 is not expected to have a material impact on the Corporation’s results of operations or financial condition.
On March 9, 2004, the Securities and Exchange Commission (SEC) issued Staff Accounting Bulletin No. 105, “Application of Accounting Principles to Loan Commitments” (SAB 105), which specifies that servicing assets embedded in commitments for loans to be held-for-sale should be recognized only when the servicing asset has been contractually separated from the associated loans by sale or securitization. The adoption of SAB 105 is effective for commitments entered into after March 31, 2004. The adoption of SAB 105 had no material impact on the Corporation’s results of operations or financial condition.
On March 18, 2004, the Emerging Issues Task Force (EITF) issued EITF 03-1, “The Meaning of Other-Than-Temporary Impairment and Its Application to Certain Investments” (EITF 03-1). EITF 03-1 provides recognition and measurement guidance regarding when impairments of equity and debt securities are considered other-than-temporary thereby requiring a charge to earnings, and also requires additional annual disclosures for investments in unrealized loss positions. The additional annual disclosure requirements were previously issued by the EITF in November 2003 and were effective for the Corporation for the year ended December 31, 2003. In September 2004, the FASB issued FASB Staff Position (FSP) EITF 03-1-1, which delays the recognition and measurement provisions of EITF 03-1 pending the issuance of further implementation guidance. We are currently evaluating the effect of the recognition and measurement provisions of EITF 03-1.
In the third quarter of 2004, the Corporation adopted FSP No. FAS 106-2, “Accounting and Disclosure Requirements Related to the Medicare Prescription Drug, Improvement and Modernization Act of 2003” (FSP No. 106-2), which superseded FSP No. FAS 106-1. FSP No. 106-2 provides authoritative guidance on accounting for the federal subsidy and other provisions of the Medicare Prescription Drug, Improvement and
BANK OF AMERICA CORPORATION AND SUBSIDIARIES
Notes to Consolidated Financial Statements—(Continued)
Modernization Act of 2003 (the Medicare Act). The effects of these provisions were recognized prospectively from July 1, 2004. A remeasurement on that date resulted in a reduction of $53 million in the Corporation’s accumulated postretirement benefit obligation. In addition, the Corporation’s net periodic benefit cost for other postretirement benefits has decreased by $15 million for 2004 as a result of the remeasurement.
On December 16, 2004, the FASB issued Statement of Financial Accounting Standards (SFAS) No. 123 (revised 2004) “Share-based Payment” (SFAS 123R) which eliminates the ability to account for share-based compensation transactions using Accounting Principles Board (APB) Opinion No. 25, “Accounting for Stock Issued to Employees,” (APB 25) and generally requires that such transactions be accounted for using a fair value-based method with the resulting compensation cost recognized over the period that the employee is required to provide service in order to receive their compensation. SFAS 123R also amends SFAS No. 95, “Statement of Cash Flows,” requiring the benefits of tax deductions in excess of recognized compensation cost to be reported as a financing cash flow, rather than as an operating cash flow as currently required. The Corporation plans to adopt SFAS 123R beginning July 1, 2005, using the modified-prospective method. The Corporation adopted the fair value-based method of accounting for stock-based employee compensation prospectively as of January 1, 2003, and as a result, adoption of SFAS 123R is not expected to have a material impact on the Corporation’s results of operations or financial condition.
On December 21, 2004, the FASB issued FSP No. 109-2, “Accounting and Disclosure Guidance for the Foreign Earnings Repatriation Provision within the American Jobs Creation Act of 2004” (FSP No. 109-2). FSP No. 109-2 provides accounting and disclosure guidance for the foreign earnings repatriation provision within the American Jobs Creation Act of 2004 (the Act). The Act, signed into law on October 22, 2004, provided U.S. companies with the ability to elect to apply a special one-time tax deduction equal to 85 percent of certain earnings remitted from foreign subsidiaries, provided certain criteria are met. Much of the detailed guidance about how this special deduction will operate has yet to be issued by the U.S. Department of the Treasury and the Internal Revenue Service (IRS). Management is currently evaluating its opportunity to make this election for 2005 and expects to complete its evaluation after the release of detailed guidance, expected to occur by the third quarter of 2005. In accordance with FSP No. 109-2, the special deduction elective provision of the Act has not been considered in determining the provision for deferred U.S. income taxes on unremitted earnings of foreign subsidiaries. The range of unremitted earnings that management is considering for the special deduction election is $0 to $899 million, and the range of income tax effects that could result from remitting earnings from certain foreign subsidiaries that have been assumed to be permanently reinvested is approximately $0 to $30 million.
Stock-based Compensation
SFAS No. 148, “Accounting for Stock-Based Compensation—Transition and Disclosure—an amendment of FASB Statement No. 123,” (SFAS 148) was adopted prospectively by the Corporation on January 1, 2003. SFAS 148 provides alternative methods of transition for a voluntary change to the fair value-based method of accounting for stock-based employee compensation. All stock options granted under plans before the adoption date will continue to be accounted for under APB 25 unless these stock options are modified or settled subsequent to adoption. SFAS 148 was effective for all stock option awards granted in 2003 and thereafter. Under APB 25, the Corporation accounted for stock options using the intrinsic value method and no compensation expense was recognized, as the grant price was equal to the strike price. Under the fair value method, stock option compensation expense is measured on the date of grant using an option-pricing model. The option-pricing model is based on certain assumptions and changes to those assumptions may result in different fair value estimates.
BANK OF AMERICA CORPORATION AND SUBSIDIARIES
Notes to Consolidated Financial Statements—(Continued)
In accordance with SFAS 148, the Corporation provides disclosures as if it had adopted the fair value-based method of measuring all outstanding employee stock options during 2004, 2003 and 2002. The following table presents the effect on Net Income and Earnings per Common Share had the fair value-based method been applied to all outstanding and unvested awards for 2004, 2003 and 2002.
| Year Ended December 31 | ||||||||||||
| (Dollars in millions, except per share data) | 2004 | 2003 | 2002 | |||||||||
Net income (as reported) | $ | 14,143 | $ | 10,810 | $ | 9,249 | ||||||
Stock-based employee compensation expense recognized during the year, net of related tax effects | 161 | 78 | — | |||||||||
Stock-based employee compensation expense determined under fair value-based method, net of related tax effects(1) | (198 | ) | (225 | ) | (413 | ) | ||||||
Pro forma net income | $ | 14,106 | $ | 10,663 | $ | 8,836 | ||||||
As reported | ||||||||||||
Earnings per common share | $ | 3.76 | $ | 3.63 | $ | 3.04 | ||||||
Diluted earnings per common share | 3.69 | 3.57 | 2.95 | |||||||||
Pro forma | ||||||||||||
Earnings per common share | 3.75 | 3.59 | 2.90 | |||||||||
Diluted earnings per common share | 3.69 | 3.52 | 2.82 | |||||||||
| (1) | Includes all awards granted, modified or settled for which the fair value was required to be measured under SFAS 123, except restricted stock. Restricted stock expense, included in Net Income for 2004, 2003 and 2002 was $288, $276 and $250, respectively. |
In determining the pro forma disclosures in the previous table, the fair value of options granted was estimated on the date of grant using the Black-Scholes option-pricing model and assumptions appropriate to each plan. The Black-Scholes model was developed to estimate the fair value of traded options, which have different characteristics than employee stock options, and changes to the subjective assumptions used in the model can result in materially different fair value estimates. The weighted average grant date fair values of the options granted during 2004, 2003 and 2002 were based on the assumptions below. See Note 16 of the Consolidated Financial Statements for further discussion.
| Risk-free Interest Rate | Dividend Yield | |||||||||||||||||
| 2004 | 2003 | 2002 | 2004 | 2003 | 2002 | |||||||||||||
Shareholder approved plans | 3.36 | % | 3.82 | % | 5.00 | % | 4.56 | % | 4.40 | % | 4.76 | % | ||||||
Broad-based plans(1) | n/a | n/a | 4.14 | n/a | n/a | 4.37 | ||||||||||||
| Expected Lives (Years) | Volatility | |||||||||||||||||
| 2004 | 2003 | 2002 | 2004 | 2003 | 2002 | |||||||||||||
Shareholder approved plans | 5 | 7 | 7 | 22.12 | % | 26.57 | % | 26.86 | % | |||||||||
Broad-based plans(1) | n/a | n/a | 4 | n/a | n/a | 31.02 | ||||||||||||
| (1) | There were no options granted under broad-based plans in 2004 or 2003. |
n/a = not applicable
Compensation expense under the fair value-based method is recognized over the vesting period of the related stock options. Accordingly, the pro forma results of applying SFAS 123 in 2004, 2003 and 2002 may not be indicative of future amounts.
Cash and Cash Equivalents
Cash on hand, cash items in the process of collection, and amounts due from correspondent banks and the Federal Reserve Bank are included in Cash and Cash Equivalents.
BANK OF AMERICA CORPORATION AND SUBSIDIARIES
Notes to Consolidated Financial Statements—(Continued)
Securities Purchased under Agreements to Resell and Securities Sold under Agreements to Repurchase
Securities Purchased under Agreements to Resell and Securities Sold under Agreements to Repurchase are treated as collateralized financing transactions and are recorded at the amounts at which the securities were acquired or sold plus accrued interest. The Corporation’s policy is to obtain the use of Securities Purchased under Agreements to Resell. The market value of the underlying securities, which collateralize the related receivable on agreements to resell, is monitored, including accrued interest. The Corporation may require counterparties to deposit additional collateral or return collateral pledged, when appropriate.
Collateral
The Corporation has accepted collateral that it is permitted by contract or custom to sell or repledge. At December 31, 2004, the fair value of this collateral was approximately $152.5 billion of which $117.5 billion was sold or repledged. At December 31, 2003, the fair value of this collateral was approximately $86.9 billion of which $62.8 billion was sold or repledged. The primary source of this collateral is reverse repurchase agreements. The Corporation pledges securities as collateral in transactions that consist of repurchase agreements, public and trust deposits, Treasury tax and loan notes, and other short-term borrowings. This collateral can be sold or repledged by the counterparties to the transactions.
In addition, the Corporation obtains collateral in connection with its derivative activities. Required collateral levels vary depending on the credit risk rating and the type of counterparty. Generally, the Corporation accepts collateral in the form of cash, U.S. Treasury securities and other marketable securities. Based on provisions contained in legal netting agreements, the Corporation has netted cash collateral against the applicable derivative mark-to-market exposures. Accordingly, the Corporation offsets its obligation to return or its right to reclaim cash collateral against the fair value of the derivatives being collateralized.
Trading Instruments
Financial instruments utilized in trading activities are stated at fair value. Fair value is generally based on quoted market prices. If quoted market prices are not available, fair values are estimated based on dealer quotes, pricing models or quoted prices for instruments with similar characteristics. Realized and unrealized gains and losses are recognized in Trading Account Profits.
Derivatives and Hedging Activities
All derivatives are recognized on the Consolidated Balance Sheet at fair value, taking into consideration the effects of legally enforceable master netting agreements that allow the Corporation to settle positive and negative positions and offset cash collateral held with the same counterparty on a net basis. For exchange-traded contracts, fair value is based on quoted market prices. For non-exchange traded contracts, fair value is based on dealer quotes, pricing models or quoted prices for instruments with similar characteristics. The Corporation designates at inception whether the derivative contract is considered hedging or non-hedging for SFAS No. 133, “Accounting for Derivative Instruments and Hedging Activities” (SFAS 133) accounting purposes. Non-hedging derivatives held for trading purposes are included in the Corporation’s trading portfolio with changes in fair value reflected in Trading Account Profits. Other non-hedging derivatives for accounting purposes that are considered economic hedges are also included in the trading portfolio with changes in fair value generally recorded in Trading Account Profits. Most credit derivatives used by the Corporation do not qualify for hedge accounting under SFAS 133 and despite being effective economic hedges, changes in the fair value of these derivatives are included in Trading Account Profits. Changes in the fair value of derivatives that serve as economic hedges of MSRs are recorded in Mortgage Banking Income.
For SFAS 133 hedges, the Corporation formally documents at inception all relationships between hedging instruments and hedged items, as well as its risk management objectives and strategies for
BANK OF AMERICA CORPORATION AND SUBSIDIARIES
Notes to Consolidated Financial Statements—(Continued)
undertaking various accounting hedges. Additionally, the Corporation uses dollar offset or regression analysis at the hedge’s inception, and quarterly thereafter, to assess whether the derivative used in its hedging transaction is expected to be or has been highly effective in offsetting changes in the fair value or cash flows of the hedged items. The Corporation discontinues hedge accounting when it is determined that a derivative is not expected to be or has ceased to be highly effective as a hedge, and then reflects changes in fair value in earnings after termination of the hedge relationship.
The Corporation uses its derivatives designated as hedging for accounting purposes as either fair value hedges, cash flow hedges or hedges of net investments in foreign operations. The Corporation manages interest rate and foreign currency exchange rate sensitivity predominantly through the use of derivatives. Fair value hedges are used to limit the Corporation’s exposure to total changes in the fair value of its fixed interest-earning assets or interest-bearing liabilities that are due to interest rate or foreign exchange volatility. Cash flow hedges are used to minimize the variability in cash flows of interest-earning assets or interest-bearing liabilities or forecasted transactions caused by interest rate or foreign exchange fluctuation. Changes in the fair value of derivatives designated for hedging activities that are highly effective as hedges are recorded in earnings or Accumulated Other Comprehensive Income (OCI), depending on whether the hedging relationship satisfies the criteria for a fair value or cash flow hedge, respectively. Hedge ineffectiveness, and gains and losses on the excluded component of a derivative in assessing hedge effectiveness are recorded in earnings in the same income statement caption that is used to record hedge effectiveness. SFAS 133 retains certain concepts under SFAS No. 52, “Foreign Currency Translation,” (SFAS 52) for foreign currency exchange hedging. Consistent with SFAS 52, the Corporation records changes in the fair value of derivatives used as hedges of the net investment in foreign operations as a component of Accumulated OCI.
The Corporation, from time to time, purchases or issues financial instruments containing embedded derivatives. The embedded derivative is separated from the host contract and carried at fair value if the economic characteristics of the derivative are not clearly and closely related to the economic characteristics of the host contract. To the extent that the Corporation cannot reliably identify and measure the embedded derivative, the entire contract is carried at fair value on the Consolidated Balance Sheet with changes in fair value reflected in earnings.
If a derivative instrument in a fair value hedge is terminated or the hedge designation removed, the previous adjustments of the carrying amount of the hedged asset or liability are subsequently accounted for in the same manner as other components of the carrying amount of that asset or liability. For interest-earning assets and interest-bearing liabilities, such adjustments are amortized to earnings over the remaining life of the respective asset or liability. If a derivative instrument in a cash flow hedge is terminated or the hedge designation is removed, related amounts in Accumulated OCI are reclassified into earnings in the same period or periods during which the hedged forecasted transaction affects earnings.
Interest Rate Lock Commitments
The Corporation enters into interest rate lock commitments (IRLCs) in connection with its mortgage banking activities to fund residential mortgage loans at specified times in the future. IRLCs that relate to the origination of mortgage loans that will be held for sale are considered derivative instruments under Statement of Financial Accounting Standards No. 149, “Amendment of Statement 133 on Derivative Instruments and Hedging Activities”. As such, these IRLCs are recognized at fair value with changes in fair value recorded in the Consolidated Statement of Income.
Consistent with SAB 105, the Corporation does not record any unrealized gain or loss at the inception of the loan commitment, which is the time the commitment is issued to the borrower. The initial value of the loan commitment derivative is based on the consideration exchanged, if any, for entering into the commitment. In estimating the subsequent fair value of an IRLC, the Corporation assigns a probability to the loan commitment based on an expectation that it will be exercised and the loan will be funded. This probability is commonly referred to as the pull through assumption. The fair value of the commitments is
BANK OF AMERICA CORPORATION AND SUBSIDIARIES
Notes to Consolidated Financial Statements—(Continued)
derived from the fair value of related mortgage loans, which is based on a highly liquid, readily observable market. Changes to the fair value of IRLCs are recognized based on interest rate changes, changes in the probability that the commitment will be exercised and the passage of time. Changes from the expected future cash flows related to the customer relationship or loan servicing are excluded from the valuation of the IRLCs.
Outstanding IRLCs expose the Corporation to the risk that the price of the loans underlying the commitments might decline from inception of the rate lock to funding of the loan due to increases in mortgage interest rates. To protect against this risk, the Corporation utilizes forward loan sales commitments and other derivatives instruments, including options, to economically hedge the risk of potential changes in the value of the loans that would result from the commitments. The Corporation expects that the changes in the fair value of these derivative instruments will offset changes in the fair value of the IRLCs.
Securities
Debt securities are classified based on management’s intention on the date of purchase and recorded on the Consolidated Balance Sheet as Securities as of the trade date. Debt securities which management has the intent and ability to hold to maturity are classified as held-to-maturity and reported at amortized cost. Debt securities that are bought and held principally for the purpose of resale in the near term are classified as trading instruments and are stated at fair value with unrealized gains and losses included in Trading Account Profits. All other debt securities are classified as available-for-sale (AFS) and carried at fair value with net unrealized gains and losses included in Accumulated OCI on an after-tax basis.
Interest on debt securities, including amortization of premiums and accretion of discounts, are included in Interest Income. Realized gains and losses from the sales of debt securities, which are included in Gains on Sales of Debt Securities, are determined using the specific identification method.
Marketable equity securities are classified based on management’s intention on the date of purchase and recorded on the Consolidated Balance Sheet as of the trade date. Marketable equity securities that are bought and held principally for the purpose of resale in the near term are classified as trading instruments and are stated at fair value with unrealized gains and losses included in Trading Account Profits. Other marketable equity securities are classified as AFS and either recorded as AFS Securities if they are a component of the ALM portfolio, or otherwise recorded as Other Assets. All AFS marketable equity securities are carried at fair value with net unrealized gains and losses included in Shareholders’ Equity on an after-tax basis. Dividend income on AFS marketable equity securities is included in Interest Income. Dividend income on marketable equity securities recorded in Other Assets is included in Noninterest Income. Realized gains and losses on the sale of all AFS marketable equity securities, which are recorded in Equity Investment Gains, are determined using the weighted average method.
Venture capital investments for which there are active market quotes are carried at estimated fair value based on market prices and recorded as Other Assets. Nonpublic and other venture capital investments for which representative market quotes are not readily available are initially valued at cost. Subsequently, these investments are reviewed semi-annually and on a quarterly basis, where appropriate, and adjusted to reflect changes in value as a result of initial public offerings, market liquidity, the investees’ financial results, sales restrictions, or other than temporary declines in value. Gains and losses on all venture capital investments, both unrealized and realized, are recorded in Equity Investment Gains.
Loans and Leases
Loans are reported at their outstanding principal balances net of any unearned income, charge-offs, unamortized deferred fees and costs on originated loans, and premiums or discounts on purchased loans. Loan origination fees and certain direct origination costs are deferred and recognized as adjustments to
BANK OF AMERICA CORPORATION AND SUBSIDIARIES
Notes to Consolidated Financial Statements—(Continued)
income over the lives of the related loans. Unearned income, discounts and premiums are amortized to income using methods that approximate the interest method.
The Corporation provides equipment financing to its customers through a variety of lease arrangements. Direct financing leases are carried at the aggregate of lease payments receivable plus estimated residual value of the leased property, less unearned income. Leveraged leases, which are a form of financing lease, are carried net of nonrecourse debt. Unearned income on leveraged and direct financing leases is amortized over the lease terms by methods that approximate the interest method.
Allowance for Credit Losses
The allowance for credit losses which includes the Allowance for Loan and Lease Losses, and the reserve for unfunded lending commitments represents management’s estimate of probable losses inherent in our lending activities. The Allowance for Loan and Lease Losses represents our estimated probable credit losses in our funded consumer, and commercial loans and leases while our reserve for unfunded lending commitments, including standby letters of credit and binding unfunded loan commitments, represents estimated probable credit losses in these off-balance sheet credit instruments based on utilization assumptions. Credit exposures, excluding Derivative Assets and Trading Account Assets, deemed to be uncollectible are charged against these accounts. Cash recovered on previously charged off amounts are credited to these accounts.
The Corporation performs periodic and systematic detailed reviews of its lending portfolios to identify credit risks and to assess the overall collectibility of those portfolios. The allowance on certain homogeneous loan portfolios, which generally consist of consumer loans, is based on aggregated portfolio segment evaluations generally by product type. Loss forecast models are utilized for these segments which consider a variety of factors including, but not limited to, historical loss experience, estimated defaults or foreclosures based on portfolio trends, delinquencies, economic conditions and credit scores. These consumer loss forecast models are updated on a quarterly basis in order to incorporate information reflective of the current economic environment. The remaining commercial portfolios are reviewed on an individual loan basis. Loans subject to individual reviews are analyzed and segregated by risk according to the Corporation’s internal risk rating scale. These risk classifications, in conjunction with an analysis of historical loss experience, current economic conditions and performance trends within specific portfolio segments, and any other pertinent information (including individual valuations on nonperforming loans in accordance with SFAS No. 114, “Accounting by Creditors for Impairment of a Loan,” (SFAS 114)) result in the estimation of the allowance for credit losses. The historical loss experience is updated quarterly to incorporate the most recent data reflective of the current economic environment.
If necessary, a specific Allowance for Loan and Lease Losses is established for individual impaired commercial loans. A loan is considered impaired when, based on current information and events, it is probable that the Corporation will be unable to collect all amounts due, including principal and interest, according to the contractual terms of the agreement. Once a loan has been identified as individually impaired, management measures impairment in accordance with SFAS 114. Individually impaired loans are measured based on the present value of payments expected to be received, observable market prices, or for loans that are solely dependent on the collateral for repayment, the estimated fair value of the collateral. If the recorded investment in impaired loans exceeds the present value of payments expected to be received, a specific allowance is established as a component of the Allowance for Loan and Lease Losses.
Three components of the Allowance for Loan and Lease Losses are allocated to cover the estimated probable losses in each loan and lease category based on the results of the Corporation’s detailed review process described above. The first component covers those commercial loans that are either nonperforming or impaired. The second component of the allocated allowance covers consumer loans and leases, and performing commercial loans and leases. The third or general component of the Allowance for Loan and Lease Losses, determined separately from the procedures outlined above, is maintained to cover uncertainties that affect our estimate of probable losses. These uncertainties include the imprecision
BANK OF AMERICA CORPORATION AND SUBSIDIARIES
Notes to Consolidated Financial Statements—(Continued)
inherent in the forecasting methodologies, as well as domestic and global economic uncertainty and large single name defaults or event risk. Management assesses each of these components to determine the overall level of the third component. The relationship of the general component to the total Allowance for Loan and Lease Losses may fluctuate from period to period. Management evaluates the adequacy of the Allowance for Loan and Lease Losses based on the combined total of these three components.
In addition to the Allowance for Loan and Lease Losses, the Corporation also estimates probable losses related to unfunded lending commitments, such as letters of credit and financial guarantees, and binding unfunded loan commitments. Unfunded lending commitments are subject to individual reviews and are analyzed and segregated by risk according to the Corporation’s internal risk rating scale. These risk classifications, in conjunction with an analysis of historical loss experience, current economic conditions, performance trends within specific portfolio segments and any other pertinent information, result in the estimation of the reserve for unfunded lending commitments.
The allowance for credit losses related to the loan and lease portfolio, and the reserve for unfunded lending commitments are reported on the Consolidated Balance Sheet in the Allowance for Loan and Lease Losses, and Accrued Expenses and Other Liabilities, respectively. Provision for Credit Losses related to the loans and leases portfolio, and unfunded lending commitments are both reported in the Consolidated Statement of Income in the Provision for Credit Losses.
Nonperforming Loans and Leases
Credit card loans are charged off at 180 days past due or 60 days from notification of bankruptcy filing and are not classified as nonperforming. Unsecured consumer loans and deficiencies in non-real estate secured loans and leases are charged off at 120 days past due and not classified as nonperforming. Real estate secured consumer loans are placed on nonaccrual status and classified as nonperforming at 90 days past due. The amount deemed uncollectible on real estate secured loans is charged off at 180 days past due. Consumer loans are generally returned to performing status when principal or interest is less than 90 days past due.
Commercial loans and leases that are past due 90 days or more as to principal or interest, or where reasonable doubt exists as to timely collection, including loans that are individually identified as being impaired, are generally classified as nonperforming unless well-secured and in the process of collection. Loans whose contractual terms have been restructured in a manner which grants a concession to a borrower experiencing financial difficulties, without compensation on restructured loans, are classified as nonperforming until the loan is performing for an adequate period of time under the restructured agreement. In situations where the Corporation does not receive adequate compensation, the restructuring is considered a troubled debt restructuring. Interest accrued but not collected is reversed when a commercial loan is classified as nonperforming. Interest collections on commercial nonperforming loans and leases for which the ultimate collectibility of principal is uncertain are applied as principal reductions; otherwise, such collections are credited to income when received. Commercial loans and leases may be restored to performing status when all principal and interest is current and full repayment of the remaining contractual principal and interest is expected, or when the loan otherwise becomes well-secured and is in the process of collection.
Loans Held-for-Sale
Loans held-for-sale include residential mortgages, loan syndications, and to a lesser degree, commercial real estate, consumer finance and other loans, and are carried at the lower of aggregate cost or market value. Loans held-for-sale are included in Other Assets.
Premises and Equipment
Premises and Equipment are stated at cost less accumulated depreciation and amortization. Depreciation and amortization are recognized using the straight-line method over the estimated useful lives
BANK OF AMERICA CORPORATION AND SUBSIDIARIES
Notes to Consolidated Financial Statements—(Continued)
of the assets. Estimated lives range up to 40 years for buildings, up to 12 years for furniture and equipment, and the shorter of lease term or estimated useful life for leasehold improvements.
Mortgage Servicing Rights
Pursuant to agreements between the Corporation and its counterparties, $2.2 billion of Excess Spread Certificates (the Certificates) were converted into Mortgage Servicing Rights (MSRs) on June 1, 2004. Prior to the conversion of the Certificates into MSRs, the Certificates were accounted for on a mark-to-market basis (i.e. fair value) and changes in the value were recognized as Trading Account Profits. On the date of the conversion, the Corporation recorded these MSRs at the Certificates’ fair market value, and that value became their new cost basis. Subsequent to the conversion, the Corporation accounts for the MSRs at the lower of cost or market with impairment recognized as a reduction of Mortgage Banking Income. Except for Note 8 of the Consolidated Financial Statements, what are now referred to as MSRs include the Certificates for periods prior to the conversion.
During the second quarter of 2004, the Corporation entered into discussions with the Securities and Exchange Commission Staff (the Staff) regarding the accounting treatment for the Certificates and MSRs. The Corporation has concluded its discussions with the Staff regarding the prior accounting for the Certificates. Following discussions with the Staff, the conclusion was reached that the Certificates lacked sufficient separation from the MSRs to be accounted for as described above (i.e. fair value). Accordingly, the Corporation should have continued to account for the Certificates as MSRs (i.e. lower of cost or market). The effect on our previously filed Consolidated Financial Statements of following lower of cost or market accounting for the Certificates compared to fair value accounting (i.e. the prior accounting) is not material. Consequently, no revisions were made to previously filed Consolidated Financial Statements.
When applying SFAS 133 hedge accounting for derivative financial instruments that have been designated to hedge MSRs, loans underlying the MSRs being hedged are stratified into pools that possess similar interest rate and prepayment risk exposures. The Corporation has designated the hedged risk as the change in the overall fair value of these stratified pools within a daily hedge period. The Corporation performs both prospective and retrospective hedge effectiveness evaluations, using regression analyses. A prospective test is performed to determine whether the hedge is expected to be highly effective at the inception of the hedge. A retrospective test is performed at the end of the hedge period to determine whether the hedge was actually effective during the hedge period.
Other derivatives are used as economic hedges of the MSRs, but are not designated as hedges under SFAS 133. These derivatives are marked to market and recognized through Mortgage Banking Income. Securities are also used as economic hedges of MSRs, but do not qualify as hedges under SFAS 133 and, therefore, are accounted for as AFS Securities with realized gains recorded in Gains on Sales of Debt Securities and unrealized gains or losses recorded in Accumulated OCI.
Goodwill and Other Intangibles
Net assets of companies acquired in purchase transactions are recorded at fair value at the date of acquisition, as such, the historical cost basis of individual assets and liabilities are adjusted to reflect their fair value. Identified intangibles are amortized on an accelerated or straight-line basis over the period benefited. Goodwill is not amortized but is reviewed for potential impairment on an annual basis, or if events or circumstances indicate a potential impairment, at the reporting unit level. The impairment test is performed in two phases. The first step of the Goodwill impairment test compares the fair value of the reporting unit with its carrying amount, including Goodwill. If the fair value of the reporting unit exceeds its carrying amount, Goodwill of the reporting unit is considered not impaired; however, if the carrying amount of the reporting unit exceeds its fair value, an additional procedure must be performed. That additional procedure compares the implied fair value of the reporting unit’s Goodwill (as defined in SFAS No. 142, “Goodwill and Other Intangible Assets” (SFAS 142)) with the carrying amount of that Goodwill. An impairment loss is recorded to the extent that the carrying amount of Goodwill exceeds its implied fair
BANK OF AMERICA CORPORATION AND SUBSIDIARIES
Notes to Consolidated Financial Statements—(Continued)
value. In 2004, 2003 and 2002, Goodwill was tested for impairment and no impairment charges were recorded.
Other intangible assets subject to amortization are evaluated for impairment in accordance with SFAS No. 144 “Accounting for the Impairment or Disposal of Long-Lived Assets” (SFAS 144). An impairment loss will be recognized if the carrying amount of the intangible asset is not recoverable and exceeds fair value. The carrying amount of the intangible is considered not recoverable if it exceeds the sum of the undiscounted cash flows expected to result from the use of the asset. At December 31, 2004, intangible assets included on the Consolidated Balance Sheet consist of core deposit intangibles, purchased credit card relationship intangibles and other customer-related intangibles that are amortized on an accelerated basis using an estimated range of anticipated lives of 6 to 10 years.
Special Purpose Financing Entities
In the ordinary course of business, the Corporation supports its customers’ financing needs by facilitating the customers’ access to different funding sources, assets and risks. In addition, the Corporation utilizes certain financing arrangements to meet its balance sheet management, funding, liquidity, and market or credit risk management needs. These financing entities may be in the form of corporations, partnerships, limited liability companies or trusts, and are generally not consolidated on the Corporation’s Consolidated Balance Sheet. The majority of these activities are basic term or revolving securitization vehicles for mortgages or other types of loans which are generally funded through term-amortizing debt structures. Other special purpose entities finance their activities by issuing short-term commercial paper. Both types of vehicles are designed to be paid off from the underlying cash flows of the assets held in the vehicle.
Securitizations
The Corporation securitizes, sells and services interests in residential mortgage loans, and from time to time, consumer finance, commercial and credit card loans. The accounting for these activities are governed by SFAS 140, “Accounting for Transfers and Servicing of Financial Assets and Extinguishments of Liabilities—a replacement of FASB Statement No. 125” (SFAS 140). The securitization vehicles are Qualified Special Purpose Entities (QSPEs) which, in accordance with SFAS 140, are legally isolated, bankruptcy remote and beyond the control of the seller. QSPEs are not included in the consolidated financial statements of the seller. When the Corporation securitizes assets, it may retain interest-only strips, one or more subordinated tranches and, in some cases, a cash reserve account which are generally considered residual interests in the securitized assets. The Corporation may also retain senior tranches in these securitizations. Gains and losses upon sale of the assets depend, in part, on the Corporation’s allocation of the previous carrying amount of the assets to the retained interests. Previous carrying amounts are allocated in proportion to the relative fair values of the assets sold and interests retained.
Quoted market prices are used to obtain fair values of senior retained interests. Generally, quoted market prices for retained residual interests are not available; therefore, the Corporation estimates fair values based upon the present value of the associated expected future cash flows. This may require management to estimate credit losses, prepayment speeds, forward yield curves, discount rates and other factors that impact the value of retained interests. See Note 8 of the Consolidated Financial Statements for further discussion.
The excess cash flows expected to be received over the amortized cost of the retained interest is recognized as Interest Income using the effective yield method. If the fair value of the retained interest has declined below its carrying amount and there has been an adverse change in estimated contractual cash flows of the underlying assets, then such decline is determined to be other-than-temporary and the retained interest is written down to fair value with a corresponding adjustment to earnings.
BANK OF AMERICA CORPORATION AND SUBSIDIARIES
Notes to Consolidated Financial Statements—(Continued)
Other Special Purpose Financing Entities
Other special purpose financing entities are generally funded with short-term commercial paper. These financing entities are usually contractually limited to a narrow range of activities that facilitate the transfer of or access to various types of assets or financial instruments and provide the investors in the transaction protection from creditors of the Corporation in the event of bankruptcy or receivership of the Corporation. In certain situations, the Corporation provides liquidity commitments and/or loss protection agreements.
The Corporation determines whether these entities should be consolidated by evaluating the degree to which it maintains control over the financing entity and will receive the risks and rewards of the assets in the financing entity. In making this determination, the Corporation considers whether the entity is a QSPE, which is generally not required to be consolidated by the seller or investors in the entity. For non-QSPE structures or VIEs, the Corporation assesses whether it is the primary beneficiary of the entity. In accordance with FIN 46R, the primary beneficiary is the party that consolidates a VIE based on its assessment that it will absorb a majority of the expected losses or expected residual returns of the entity, or both. For additional information on other special purpose financing entities, see Note 8 of the Consolidated Financial Statements.
Income Taxes
The Corporation accounts for income taxes in accordance with SFAS No. 109, “Accounting for Income Taxes” (SFAS 109), resulting in two components of Income Tax Expense: current and deferred. Current income tax expense approximates taxes to be paid or refunded for the current period. Deferred income tax expense results from changes in deferred tax assets and liabilities between periods. These gross deferred tax assets and liabilities represent decreases or increases in taxes expected to be paid in the future because of future reversals of temporary differences in the bases of assets and liabilities as measured by tax laws and their bases as reported in the financial statements.
Deferred tax assets have also been recognized for net operating loss carryforwards and tax credit carryforwards. Valuation allowances are then recorded to reduce deferred tax assets to the amounts management concludes are more likely than not to be realized.
Retirement Benefits
The Corporation has established qualified retirement plans covering substantially all full-time and certain part-time employees. Pension expense under these plans is charged to current operations and consists of several components of net pension cost based on various actuarial assumptions regarding future experience under the plans.
In addition, the Corporation has established unfunded supplemental benefit plans and supplemental executive retirement plans for selected officers of the Corporation and its subsidiaries that provide benefits that cannot be paid from a qualified retirement plan due to Internal Revenue Code restrictions. These plans are nonqualified under the Internal Revenue Code and assets used to fund benefit payments are not segregated from other assets of the Corporation; therefore, in general, a participant’s or beneficiary’s claim to benefits under these plans is as a general creditor.
In addition, the Corporation has established several postretirement healthcare and life insurance benefit plans.
Other Comprehensive Income
The Corporation records unrealized gains and losses on AFS Securities, foreign currency translation adjustments, related hedges of net investments in foreign operations, and gains and losses on cash flow hedges in Accumulated OCI. Gains and losses on AFS Securities are reclassified to Net Income as the gains
BANK OF AMERICA CORPORATION AND SUBSIDIARIES
Notes to Consolidated Financial Statements—(Continued)
or losses are realized upon sale of the securities. Other-than-temporary impairment charges are reclassified to Net Income at the time of the charge. Translation gains or losses on foreign currency translation adjustments are reclassified to Net Income upon the sale or liquidation of investments in foreign operations. Gains or losses on derivatives accounted for as hedges are reclassified to Net Income in the same caption of the Consolidated Statement of Income that was affected by the hedged item.
Earnings Per Common Share
Earnings per Common Share is computed by dividing Net Income Available to Common Shareholders by the weighted average common shares issued and outstanding. For Diluted Earnings per Common Share, Net Income Available to Common Shareholders can be affected by the conversion of the registrant’s convertible preferred stock. Where the effect of this conversion would have been dilutive, Net Income Available to Common Shareholders is adjusted by the associated preferred dividends. This adjusted Net Income is divided by the weighted average number of common shares issued and outstanding for each period plus amounts representing the dilutive effect of stock options outstanding, restricted stock units and the dilution resulting from the conversion of the registrant’s convertible preferred stock, if applicable. The effects of convertible preferred stock, restricted stock units and stock options are excluded from the computation of diluted earnings per common share in periods in which the effect would be antidilutive. Dilutive potential common shares are calculated using the treasury stock method.
Foreign Currency Translation
Assets, liabilities and operations of foreign branches and subsidiaries are recorded based on the functional currency of each entity. For certain of the foreign operations, the functional currency is the local currency, in which case the assets, liabilities and operations are translated, for consolidation purposes, at current exchange rates from the local currency to the reporting currency, the U.S. dollar. The resulting unrealized gains or losses are reported as a component of Accumulated OCI on an after-tax basis. When the foreign entity is not a free-standing operation or is in a hyperinflationary economy, the functional currency used to measure the financial statements of a foreign entity is the U.S. dollar. In these instances, the resulting realized gains or losses are included in income.
Co-Branding Credit Card Arrangements
The Corporation has co-brand arrangements that entitle a cardholder to receive benefits based on purchases made with the card. These arrangements have remaining terms generally not exceeding five years. The Corporation may pay one-time fees which would be deferred ratably over the term of the arrangement. The Corporation makes monthly payments to the co-brand partners based on the volume of cardholders’ purchases and on the number of points awarded to cardholders. Such payments are expensed as incurred and are recorded as contra-revenue.
Note 2—Merger and Restructuring Activity
FleetBoston
Pursuant to the Agreement and Plan of Merger, dated October 27, 2003, by and between the Corporation and FleetBoston (the Merger Agreement), the Corporation acquired 100 percent of the outstanding stock of FleetBoston on April 1, 2004, in a tax-free merger, in order to expand the Corporation’s presence in the Northeast. FleetBoston’s results of operations were included in the Corporation’s results beginning April 1, 2004.
As provided by the Merger Agreement, approximately 1.069 billion shares of FleetBoston common stock were exchanged for approximately 1.187 billion shares of the Corporation’s common stock, as adjusted for the stock split. At the date of the Merger, this represented approximately 29 percent of the Corporation’s outstanding common stock. FleetBoston shareholders also received cash of $4 million in lieu of any fractional shares of the Corporation’s common stock that would have otherwise been issued on April 1, 2004. Holders of
BANK OF AMERICA CORPORATION AND SUBSIDIARIES
Notes to Consolidated Financial Statements—(Continued)
FleetBoston preferred stock received 1.1 million shares of the Corporation’s preferred stock. The Corporation’s preferred stock that was exchanged was valued using the book value of FleetBoston preferred stock. The depositary shares underlying the FleetBoston preferred stock, each representing a one-fifth interest in the FleetBoston preferred stock prior to the Merger, now represent a one-fifth interest in a share of the Corporation’s preferred stock. The purchase price was adjusted to reflect the effect of the 15.7 million shares of FleetBoston common stock that the Corporation already owned.
The Merger was accounted for under the purchase method of accounting in accordance with SFAS No. 141, “Business Combinations” (SFAS 141). Accordingly, the purchase price was allocated to the assets acquired and the liabilities assumed based on their estimated fair values at the Merger date as summarized below.
| (Dollars in millions) | |||||||
Purchase price | |||||||
FleetBoston common stock exchanged (in thousands) | 1,068,635 | ||||||
Exchange ratio (as adjusted for the stock split) | 1.1106 | ||||||
Total shares of the Corporation’s common stock exchanged (in thousands) | 1,186,826 | ||||||
Purchase price per share of the Corporation’s common stock(1) | $ | 38.44 | |||||
Total value of the Corporation’s common stock exchanged | $ | 45,622 | |||||
FleetBoston preferred stock converted to the Corporation’s preferred stock | 271 | ||||||
Fair value of outstanding stock options, direct acquisition costs and the effect of FleetBoston shares already owned by the Corporation | 1,360 | ||||||
Total purchase price | $ | 47,253 | |||||
Allocation of the purchase price | |||||||
FleetBoston stockholders’ equity | $ | 19,329 | |||||
FleetBoston goodwill and other intangible assets | (4,709 | ) | |||||
Adjustments to reflect assets acquired and liabilities assumed at fair value: | |||||||
Securities | (84 | ) | |||||
Loans and leases | (770 | ) | |||||
Premises and equipment | (738 | ) | |||||
Identified intangibles | 3,243 | ||||||
Other assets and deferred income tax | 243 | ||||||
Deposits | (313 | ) | |||||
Other liabilities | (286 | ) | |||||
Exit and termination liabilities | (658 | ) | |||||
Long-term debt | (1,182 | ) | |||||
Fair value of net assets acquired | 14,075 | ||||||
Estimated goodwill resulting from the Merger | $ | 33,178 | |||||
| (1) | The value of the shares of common stock exchanged with FleetBoston shareholders was based upon the average of the closing prices of the Corporation’s common stock for the period commencing two trading days before, and ending two trading days after, October 27, 2003, the date of the Merger Agreement, as adjusted for the stock split. |
Merger and Restructuring Charges
Merger and Restructuring Charges are recorded in the Consolidated Statement of Income, and include incremental costs to integrate Bank of America’s and FleetBoston’s operations. These charges represent costs associated with merger activities and do not represent on-going costs of the fully integrated combined organization. Systems integrations and related charges, and other, as shown in the table below, are expensed as incurred.
BANK OF AMERICA CORPORATION AND SUBSIDIARIES
Notes to Consolidated Financial Statements—(Continued)
In addition, Merger and Restructuring Charges include costs related to an infrastructure initiative undertaken in the third quarter of 2004 to simplify the Corporation’s business model. In 2004, management engaged in a thorough review of major business units and supporting functions to ensure the Corporation is operating in a cost efficient manner. As a result of this review and additional opportunities the Corporation has identified to operate more efficiently through the Merger, the Corporation announced that it will reduce its workforce by approximately 2.5 percent, or 4,500 positions resulting in total severance costs of $149 million. Included in Merger and Restructuring Charges are $102 million incurred for this initiative. An additional $47 million of severance liabilities were recorded related to this initiative for legacy FleetBoston associates resulting in an increase in Goodwill. See analysis of exit costs and restructuring reserves below. The Corporation expects to incur additional severance costs related to this initiative of less than $5 million in 2005.
| (Dollars in millions) | 2004 | ||
Severance and employee-related charges: | |||
Merger-related | $ | 138 | |
Infrastructure initiative | 102 | ||
Systems integrations and related charges | 249 | ||
Other | 129 | ||
Total merger and restructuring charges | $ | 618 | |
Exit Costs and Restructuring Reserves
On April 1, 2004, $680 million of liabilities for FleetBoston’s exit and termination costs as a result of the Merger were recorded as purchase accounting adjustments resulting in an increase in Goodwill. Included in the $680 million were $507 million for severance, relocation and other employee-related costs, $168 million for contract terminations, and $5 million for other charges. As previously mentioned, during 2004, $47 million of additional liabilities was recorded related to severance costs for legacy FleetBoston associates in connection with the infrastructure initiative. In addition, during 2004, reductions in the exit costs reserve were recorded, due to revised estimates of $50 million for contract terminations and $19 million for severance costs. During 2004, cash payments of $276 million have been charged against this liability including $244 million of severance, relocation and other employee-related costs, and $32 million of contract terminations.
Restructuring charges through December 31, 2004 include the establishment of a reserve for legacy Bank of America associate severance and other employee-related charges of $240 million. Of this amount, $102 million was related to the infrastructure initiative. During 2004, cash payments of $74 million have been charged against this reserve.
Payments under these reserves are expected to be substantially completed by the end of 2005.
Exit Costs and Restructuring Reserves
| (Dollars in millions) | Exit Costs Reserves(1) | Restructuring Reserves(2) | ||||||
Balance, January 1, 2004 | $ | — | $ | — | ||||
FleetBoston exit costs | 658 | — | ||||||
Restructuring charges | — | 138 | ||||||
Infrastructure initiative | — | 102 | ||||||
Cash payments | (276 | ) | (74 | ) | ||||
Balance, December 31, 2004 | $ | 382 | $ | 166 | ||||
| (1) | Exit costs reserves were established in purchase accounting resulting in an increase in Goodwill. |
| (2) | Restructuring reserves were established by a charge to income. |
BANK OF AMERICA CORPORATION AND SUBSIDIARIES
Notes to Consolidated Financial Statements—(Continued)
Unaudited Pro Forma Condensed Combined Financial Information
The following unaudited pro forma condensed combined financial information presents the results of operations of the Corporation had the Merger taken place at the beginning of each period.
| (Dollars in millions, except per common share information) | 2004 | 2003 | ||||
Net interest income | $ | 30,584 | $ | 28,208 | ||
Noninterest income | 21,615 | 21,877 | ||||
Provision for credit losses | 2,769 | 3,864 | ||||
Gains on sales of debt securities | 2,172 | 1,069 | ||||
Merger and restructuring charges | 618 | — | ||||
Other noninterest expense | 28,522 | 27,319 | ||||
Income before income taxes | 22,462 | 19,971 | ||||
Net income | 14,903 | 13,298 | ||||
Per common share information | ||||||
Earnings | $ | 3.67 | $ | 3.21 | ||
Diluted earnings | 3.61 | 3.17 | ||||
Average common shares issued and outstanding (in thousands) | 4,054,322 | 4,138,139 | ||||
Average diluted common shares issued and outstanding (in thousands) | 4,124,671 | 4,201,053 | ||||
National Processing, Inc.
On October 15, 2004, the Corporation acquired all outstanding shares of National Processing, Inc. (NPC) for $1.4 billion in cash. NPC is a merchant acquirer of card transactions. As a part of the preliminary purchase price allocation, the Corporation allocated $482 million to other intangible assets and $625 million to Goodwill.
Note 3—Trading Account Assets and Liabilities
The Corporation engages in a variety of trading-related activities that are either for clients or its own account.
The following table presents the fair values of the components of Trading Account Assets and Liabilities at December 31, 2004 and 2003.
| December 31 | |||||||||
| (Dollars in millions) | 2004 | 2003 | FleetBoston April 1, 2004 | ||||||
Trading account assets | |||||||||
U.S. government and agency securities | $ | 20,462 | $ | 16,073 | $ | 561 | |||
Corporate securities, trading loans and other | 35,227 | 25,647 | 353 | ||||||
Equity securities | 19,504 | 11,445 | 2 | ||||||
Mortgage trading loans and asset-backed securities | 9,625 | 8,221 | 2,199 | ||||||
Foreign sovereign debt | 8,769 | 7,161 | 94 | ||||||
Total | $ | 93,587 | $ | 68,547 | $ | 3,209 | |||
Trading account liabilities | |||||||||
U.S. government and agency securities | $ | 14,332 | $ | 7,304 | $ | 64 | |||
Equity securities | 8,952 | 8,863 | — | ||||||
Corporate securities, trading loans and other | 8,538 | 5,379 | 356 | ||||||
Foreign sovereign debt | 4,793 | 5,276 | — | ||||||
Mortgage trading loans and asset-backed securities | 39 | 22 | 355 | ||||||
Total | $ | 36,654 | $ | 26,844 | $ | 775 | |||
BANK OF AMERICA CORPORATION AND SUBSIDIARIES
Notes to Consolidated Financial Statements—(Continued)
Note 4—Derivatives
The Corporation designates a derivative as held for trading or hedging purposes when it enters into the derivative contract. The designation may change based upon management’s reassessment or changing circumstances. Derivatives utilized by the Corporation include swaps, financial futures and forward settlement contracts, and option contracts. A swap agreement is a contract between two parties to exchange cash flows based on specified underlying notional amounts, assets and/or indices. Financial futures and forward settlement contracts are agreements to buy or sell a quantity of a financial instrument, index, currency or commodity at a predetermined future date, and rate or price. An option contract is an agreement that conveys to the purchaser the right, but not the obligation, to buy or sell a quantity of a financial instrument (including another derivative financial instrument), index, currency or commodity at a predetermined rate or price during a period or at a time in the future. Option agreements can be transacted on organized exchanges or directly between parties. The Corporation also provides credit derivatives to customers who wish to increase or decrease credit exposures. In addition, the Corporation utilizes credit derivatives to manage the credit risk associated with the loan portfolio.
Credit Risk Associated with Derivative Activities
Credit risk associated with derivatives is measured as the net replacement cost in the event the counterparties with contracts in a gain position to the Corporation completely fail to perform under the terms of those contracts. In managing derivative credit risk, both the current exposure, which is the replacement cost of contracts on the measurement date, as well as an estimate of the potential change in value of contracts over their remaining lives are considered. The Corporation’s derivative activities are primarily with financial institutions and corporations. To minimize credit risk, the Corporation enters into legally enforceable master netting agreements, which reduce risk by permitting the closeout and netting of transactions with the same counterparty upon occurrence of certain events. In addition, the Corporation reduces credit risk by obtaining collateral from counterparties. The determination of the need for and the levels of collateral will vary based on an assessment of the credit risk of the counterparty. Generally, the Corporation accepts collateral in the form of cash, U.S. Treasury securities and other marketable securities. The Corporation held $26.9 billion of collateral on derivative positions, of which $16.8 billion could be applied against credit risk at December 31, 2004.
A portion of the derivative activity involves exchange-traded instruments. Exchange-traded instruments conform to standard terms and are subject to policies set by the exchange involved, including margin and security deposit requirements. Management believes the credit risk associated with these types of instruments is minimal.
BANK OF AMERICA CORPORATION AND SUBSIDIARIES
Notes to Consolidated Financial Statements—(Continued)
The following table presents the contract/notional and credit risk amounts at December 31, 2004 and 2003 of the Corporation’s derivative positions held for trading and hedging purposes. These derivative positions are primarily executed in the over-the-counter market. The credit risk amounts take into consideration the effects of legally enforceable master netting agreements, and on an aggregate basis have been reduced by the cash collateral held against Derivative Assets. At December 31, 2004 and 2003, the cash collateral held against Derivative Assets on the Consolidated Balance Sheet was $9.4 billion and $7.5 billion, respectively. In addition, at December 31, 2004 and 2003, the cash collateral placed against Derivative Liabilities was $6.0 billion and $9.5 billion, respectively.
Derivatives(1)
| December 31 | ||||||||||||||||||
| 2004 | 2003 | FleetBoston April 1, 2004 | ||||||||||||||||
| (Dollars in millions) | Contract/ Notional | Credit Risk | Contract/ Notional | Credit Risk | Contract/ Notional | Credit Risk | ||||||||||||
Interest rate contracts | ||||||||||||||||||
Swaps | $ | 11,597,813 | $ | 12,705 | $ | 8,873,600 | $ | 14,893 | $ | 105,366 | $ | 1,671 | ||||||
Futures and forwards | 1,833,216 | 332 | 2,437,907 | 633 | 18,383 | 2 | ||||||||||||
Written options | 988,253 | — | 1,174,014 | — | 104,118 | — | ||||||||||||
Purchased options | 1,243,809 | 4,840 | 1,132,486 | 3,471 | 159,408 | 91 | ||||||||||||
Foreign exchange contracts | ||||||||||||||||||
Swaps | 305,999 | 7,859 | 260,210 | 4,473 | 9,928 | 307 | ||||||||||||
Spot, futures and forwards | 956,995 | 3,593 | 775,105 | 4,202 | 33,941 | 403 | ||||||||||||
Written options | 167,225 | — | 138,474 | — | 2,854 | — | ||||||||||||
Purchased options | 163,243 | 679 | 133,512 | 669 | 2,776 | 58 | ||||||||||||
Equity contracts | ||||||||||||||||||
Swaps | 34,130 | 1,039 | 30,850 | 364 | 1,026 | 127 | ||||||||||||
Futures and forwards | 4,078 | — | 3,234 | — | — | — | ||||||||||||
Written options | 37,080 | — | 25,794 | — | 779 | — | ||||||||||||
Purchased options | 32,893 | 5,741 | 24,119 | 5,370 | 811 | 55 | ||||||||||||
Commodity contracts | ||||||||||||||||||
Swaps | 10,480 | 2,099 | 15,491 | 1,554 | — | — | ||||||||||||
Futures and forwards | 6,307 | 6 | 5,726 | — | 275 | — | ||||||||||||
Written options | 9,270 | — | 11,695 | — | — | — | ||||||||||||
Purchased options | 5,535 | 301 | 7,223 | 294 | — | — | ||||||||||||
Credit derivatives | 499,741 | 430 | 136,788 | 584 | 29,763 | 75 | ||||||||||||
Credit risk before cash collateral | 39,624 | 36,507 | 2,789 | |||||||||||||||
Less: Cash collateral held | 9,389 | 7,498 | 96 | |||||||||||||||
Total derivative assets | $ | 30,235 | $ | 29,009 | $ | 2,693 | ||||||||||||
| (1) | Includes both long and short derivative positions. |
The average fair value of Derivative Assets for 2004 and 2003 was $28.0 billion and $27.8 billion, respectively. The average fair value of Derivative Liabilities for 2004 and 2003 was $15.7 billion and $15.9 billion, respectively. Included in the average fair value of Derivative Assets and Derivative Liabilities in 2004 was $1.5 billion and $920 million, respectively, from the addition of derivatives acquired from FleetBoston.
ALM Process
Interest rate contracts and foreign exchange contracts are utilized in the Corporation’s ALM process. The Corporation maintains an overall interest rate risk management strategy that incorporates the use of interest rate contracts to minimize significant unplanned fluctuations in earnings that are caused by interest rate volatility. The Corporation’s goal is to manage interest rate sensitivity so that movements in interest rates do not significantly adversely affect Net Interest Income. As a result of interest rate fluctuations, hedged fixed-rate assets and liabilities appreciate or depreciate in market value. Gains or
BANK OF AMERICA CORPORATION AND SUBSIDIARIES
Notes to Consolidated Financial Statements—(Continued)
losses on the derivative instruments that are linked to the hedged fixed-rate assets and liabilities are expected to substantially offset this unrealized appreciation or depreciation. Interest Income and Interest Expense on hedged variable-rate assets and liabilities, respectively, increase or decrease as a result of interest rate fluctuations. Gains and losses on the derivative instruments that are linked to these hedged assets and liabilities are expected to substantially offset this variability in earnings.
Interest rate contracts, which are generally non-leveraged generic interest rate and basis swaps, options and futures, allow the Corporation to manage its interest rate risk position. Non-leveraged generic interest rate swaps involve the exchange of fixed-rate and variable-rate interest payments based on the contractual underlying notional amount. Basis swaps involve the exchange of interest payments based on the contractual underlying notional amounts, where both the pay rate and the receive rate are floating rates based on different indices. Option products primarily consist of caps, floors, swaptions and options on index futures contracts. Futures contracts used for the ALM process are primarily index futures providing for cash payments based upon the movements of an underlying rate index.
The Corporation uses foreign currency contracts to manage the foreign exchange risk associated with certain foreign currency-denominated assets and liabilities, as well as the Corporation’s equity investments in foreign subsidiaries. Foreign exchange contracts, which include spot, futures and forward contracts, represent agreements to exchange the currency of one country for the currency of another country at an agreed-upon price on an agreed-upon settlement date. Foreign exchange option contracts are similar to interest rate option contracts except that they are based on currencies rather than interest rates. Exposure to loss on these contracts will increase or decrease over their respective lives as currency exchange and interest rates fluctuate.
Fair Value and Cash Flow Hedges
The Corporation uses various types of interest rate and foreign currency exchange rate derivative contracts to protect against changes in the fair value of its fixed-rate assets and liabilities due to fluctuations in interest rates and exchange rates. The Corporation also uses these contracts to protect against changes in the cash flows of its variable-rate assets and liabilities, and other forecasted transactions.
For cash flow hedges, gains and losses on derivative contracts reclassified from Accumulated OCI to current period earnings are included in the line item in the Consolidated Statement of Income in which the hedged item is recorded and in the same period the hedged item affects earnings. During the next 12 months, net losses on derivative instruments included in Accumulated OCI, of approximately $136 million (pre-tax) are expected to be reclassified into earnings. These net gains reclassified into earnings are expected to increase income or decrease expense on the respective hedged items.
The following table summarizes certain information related to the Corporation’s hedging activities for 2004 and 2003.
| (Dollars in millions) | 2004 | 2003 | ||||||
Fair value hedges | ||||||||
Hedge ineffectiveness recognized in earnings(1) | $ | 10 | $ | — | ||||
Net loss excluded from assessment of effectiveness(2) | (6 | ) | (101 | ) | ||||
Cash flow hedges | ||||||||
Hedge ineffectiveness recognized in earnings(3) | 104 | 53 | ||||||
Net gain excluded from assessment of effectiveness | — | 26 | ||||||
Net investment hedges | ||||||||
Gains (losses) included in foreign currency translation adjustments within accumulated other comprehensive income | (157 | ) | (194 | ) | ||||
| (1) | Included $(8) recorded in Net Interest Income and $18 recorded in Mortgage Banking Income in the Consolidated Statement of Income in 2004. |
| (2) | Included $(5) and $(101), respectively, recorded in Net Interest Income related to the excluded time value of certain hedges and $(1) and $0, respectively, recorded in Mortgage Banking Income in the Consolidated Statement of Income in 2004 and 2003. |
| (3) | Included $117 and $38, respectively, recorded in Mortgage Banking Income in the Consolidated Statement of Income for 2004 and 2003, and $(13) and $15 recorded in Net Interest Income from other various cash flow hedges in 2004 and 2003, respectively. |
BANK OF AMERICA CORPORATION AND SUBSIDIARIES
Notes to Consolidated Financial Statements—(Continued)
Note 5—Securities
The amortized cost, gross unrealized gains and losses, and fair value of AFS debt and marketable equity securities, and Held-to-maturity Securities at December 31, 2004, 2003 and 2002 were:
| (Dollars in millions) | Amortized Cost | Gross Unrealized Gains | Gross Unrealized Losses | Fair Value | ||||||||
Available-for-sale securities | ||||||||||||
2004 | ||||||||||||
U.S. Treasury securities and agency debentures | $ | 826 | $ | — | $ | 1 | $ | 825 | ||||
Mortgage-backed securities | 173,697 | 174 | 624 | 173,247 | ||||||||
Foreign sovereign securities | 7,437 | 36 | 26 | 7,447 | ||||||||
Other taxable securities | 9,493 | — | 13 | 9,480 | ||||||||
Total taxable | 191,453 | 210 | 664 | 190,999 | ||||||||
Tax-exempt securities | 3,662 | 87 | 5 | 3,744 | ||||||||
Total available-for-sale securities | $ | 195,115 | $ | 297 | $ | 669 | $ | 194,743 | ||||
Available-for-sale marketable equity securities(1) | $ | 3,571 | $ | 32 | $ | 2 | $ | 3,601 | ||||
2003 | ||||||||||||
U.S. Treasury securities and agency debentures | $ | 710 | $ | 5 | $ | 2 | $ | 713 | ||||
Mortgage-backed securities | 56,403 | 63 | 575 | 55,891 | ||||||||
Foreign sovereign securities | 2,816 | 23 | 38 | 2,801 | ||||||||
Other taxable securities | 4,765 | 36 | 69 | 4,732 | ||||||||
Total taxable | 64,694 | 127 | 684 | 64,137 | ||||||||
Tax-exempt securities | 2,167 | 79 | 1 | 2,245 | ||||||||
Total available-for-sale securities | $ | 66,861 | $ | 206 | $ | 685 | $ | 66,382 | ||||
Available-for-sale marketable equity securities(1) | $ | 2,803 | $ | 394 | $ | 31 | $ | 3,166 | ||||
2002 | ||||||||||||
U.S. Treasury securities and agency debentures | $ | 691 | $ | 20 | $ | — | $ | 711 | ||||
Mortgage-backed securities | 58,813 | 847 | 5 | 59,655 | ||||||||
Foreign sovereign securities | 2,235 | 30 | 103 | 2,162 | ||||||||
Other taxable securities | 1,095 | 25 | 38 | 1,082 | ||||||||
Total taxable | 62,834 | 922 | 146 | 63,610 | ||||||||
Tax-exempt securities | 2,824 | 96 | 4 | 2,916 | ||||||||
Total available-for-sale securities | $ | 65,658 | $ | 1,018 | $ | 150 | $ | 66,526 | ||||
Available-for-sale marketable equity securities(1) | $ | 2,761 | $ | 19 | $ | 127 | $ | 2,653 | ||||
Held-to-maturity securities | ||||||||||||
2004 | ||||||||||||
Taxable securities | $ | 41 | $ | 4 | $ | 4 | $ | 41 | ||||
Tax-exempt securities | 289 | — | 1 | 288 | ||||||||
Total held-to-maturity securities | $ | 330 | $ | 4 | $ | 5 | $ | 329 | ||||
2003 | ||||||||||||
Mortgage-backed securities | $ | 1 | $ | — | $ | — | $ | 1 | ||||
Foreign sovereign securities | 49 | — | 3 | 46 | ||||||||
Other taxable securities | 46 | 3 | — | 49 | ||||||||
Total taxable | 96 | 3 | 3 | 96 | ||||||||
Tax-exempt securities | 151 | 7 | — | 158 | ||||||||
Total held-to-maturity securities | $ | 247 | $ | 10 | $ | 3 | $ | 254 | ||||
2002 | ||||||||||||
Mortgage-backed securities | $ | 3 | $ | — | $ | — | $ | 3 | ||||
Foreign sovereign securities | 788 | 10 | 49 | 749 | ||||||||
Other taxable securities | 45 | 4 | — | 49 | ||||||||
Total taxable | 836 | 14 | 49 | 801 | ||||||||
Tax-exempt securities | 190 | 10 | — | 200 | ||||||||
Total held-to-maturity securities | $ | 1,026 | $ | 24 | $ | 49 | $ | 1,001 | ||||
| (1) | Represents those AFS marketable equity securities that are recorded in Other Assets on the Consolidated Balance Sheet. |
BANK OF AMERICA CORPORATION AND SUBSIDIARIES
Notes to Consolidated Financial Statements—(Continued)
At December 31, 2004, accumulated net unrealized losses on AFS debt and marketable equity securities included in Shareholders’ Equity were $196 million, net of the related income tax benefit of $146 million. At December 31, 2003, accumulated net unrealized losses on these securities were $70 million, net of the related income tax benefit of $46 million.
The following table presents the current fair value and the associated unrealized losses only on investments in securities with unrealized losses at December 31, 2004. Unrealized losses on marketable equity securities at December 31, 2004 were not considered material. The table also discloses whether these securities have had unrealized losses for less than 12 months, or for 12 months or longer.
| Less than 12 months | 12 months or longer | Total | |||||||||||||||||||
| (Dollars in millions) | Fair Value | Unrealized Losses | Fair Value | Unrealized Losses | Fair Value | Unrealized Losses | |||||||||||||||
Available-for-sale securities | |||||||||||||||||||||
U.S. Treasury securities and agency debentures(1) | $ | 381 | $ | (1 | ) | $ | 22 | $ | — | $ | 403 | $ | (1 | ) | |||||||
Mortgage-backed securities | 52,687 | (297 | ) | 17,426 | (327 | ) | 70,113 | (624 | ) | ||||||||||||
Foreign sovereign securities | 4,964 | (11 | ) | 99 | (15 | ) | 5,063 | (26 | ) | ||||||||||||
Other taxable securities | 1,130 | (9 | ) | 37 | (4 | ) | 1,167 | (13 | ) | ||||||||||||
Total taxable | 59,162 | (318 | ) | 17,584 | (346 | ) | 76,746 | (664 | ) | ||||||||||||
Tax-exempt securities(1) | 1,088 | (5 | ) | 21 | — | 1,109 | (5 | ) | |||||||||||||
Total temporarily-impaired available-for-sale securities | 60,250 | (323 | ) | 17,605 | (346 | ) | 77,855 | (669 | ) | ||||||||||||
Temporarily-impaired marketable equity securities | 83 | (2 | ) | — | — | 83 | (2 | ) | |||||||||||||
Held-to-maturity securities | |||||||||||||||||||||
Taxable securities | 41 | (4 | ) | — | — | 41 | (4 | ) | |||||||||||||
Tax-exempt securities | 288 | (1 | ) | — | — | 288 | (1 | ) | |||||||||||||
Total temporarily-impaired held-to-maturity securities | 329 | (5 | ) | — | — | 329 | (5 | ) | |||||||||||||
Total temporarily-impaired securities | $ | 60,662 | $ | (330 | ) | $ | 17,605 | $ | (346 | ) | $ | 78,267 | $ | (676 | ) | ||||||
| (1) | Unrealized losses less than $500,000 are shown as zero. |
The unrealized losses associated with U.S. Treasury securities and agency debentures, mortgage-backed securities, certain foreign sovereign securities, other taxable securities and tax-exempt securities are not considered to be other-than-temporary because their unrealized losses are related to changes in interest rates and do not affect the expected cash flows of the underlying collateral or issuer. The Corporation also has unrealized losses associated with other foreign sovereign securities; however, these losses are not considered other-than-temporary because the principal of these securities is guaranteed by the U. S. government.
The Corporation had investments in Securities from the Federal National Mortgage Association (Fannie Mae) and Federal Home Loan Mortgage Corporation (Freddie Mac) that exceeded 10 percent of consolidated Shareholders’ Equity as of December 31, 2004 and 2003. Those investments had market values of $133.6 billion and $35.8 billion, respectively, at December 31, 2004 and $36.6 billion and $5.9 billion, respectively, as of December 31, 2003. In addition, these investments had total amortized costs of $132.9 billion and $35.9 billion, respectively, as of December 31, 2004 and $37.1 billion and $6.0 billion, respectively, as of December 31, 2003.
BANK OF AMERICA CORPORATION AND SUBSIDIARIES
Notes to Consolidated Financial Statements—(Continued)
Securities are pledged or assigned to secure borrowed funds, government and trust deposits, and for other purposes. The carrying value of pledged Securities was $45.1 billion and $20.9 billion at December 31, 2004 and 2003, respectively.
The contractual maturity distribution and yields of the Corporation’s securities portfolio at December 31, 2004 are summarized in the following table. Actual maturities may differ from the contractual or expected maturities shown below since borrowers may have the right to prepay obligations with or without prepayment penalties.
| Due in 1 year or less | Due after 1 year through 5 years | Due after 5 years through 10 years | Due after 10 years(1) | Total | ||||||||||||||||||||||||||
| (Dollars in millions) | Amount | Yield(2) | Amount | Yield(2) | Amount | Yield(2) | Amount | Yield(2) | Amount | Yield(2) | ||||||||||||||||||||
Fair value of available-for-sale securities | ||||||||||||||||||||||||||||||
U.S. Treasury securities and agency debentures | $ | 101 | 1.94 | % | $ | 576 | 3.04 | % | $ | 131 | 3.86 | % | $ | 17 | 5.40 | % | $ | 825 | 3.09 | % | ||||||||||
Mortgage-backed securities | 4 | 2.15 | 91,665 | 5.08 | 65,622 | 5.31 | 15,956 | 5.51 | 173,247 | 5.21 | ||||||||||||||||||||
Foreign sovereign securities | 757 | 4.90 | 1,377 | 2.46 | 1,799 | 3.04 | 3,514 | 3.98 | 7,447 | 3.56 | ||||||||||||||||||||
Other taxable securities | 140 | 2.90 | 2,614 | 3.56 | 2,877 | 4.98 | 3,849 | 5.56 | 9,480 | 4.81 | ||||||||||||||||||||
Total taxable | 1,002 | 4.31 | 96,232 | 4.99 | 70,429 | 5.23 | 23,336 | 5.29 | 190,999 | 5.11 | ||||||||||||||||||||
Tax-exempt securities(3) | 924 | 2.55 | 181 | 4.52 | 1,554 | 6.11 | 1,085 | 6.54 | 3,744 | 5.28 | ||||||||||||||||||||
Total available-for-sale securities | $ | 1,926 | 3.47 | % | $ | 96,413 | 4.99 | % | $ | 71,983 | 5.25 | % | $ | 24,421 | 5.34 | % | $ | 194,743 | 5.12 | % | ||||||||||
Amortized cost of available-for-sale securities | $ | 1,926 | $ | 96,439 | $ | 72,010 | $ | 24,740 | $ | 195,115 | ||||||||||||||||||||
Amortized cost of held-to- maturity securities | ||||||||||||||||||||||||||||||
Taxable securities | $ | 41 | 2.30 | % | $ | — | — | % | $ | — | — | % | $ | — | — | % | $ | 41 | 2.30 | % | ||||||||||
Tax-exempt securities(3) | 258 | 1.72 | 26 | 2.70 | 4 | 4.37 | 1 | 0.26 | 289 | 1.85 | ||||||||||||||||||||
Total held-to-maturity securities | $ | 299 | 1.80 | % | $ | 26 | 2.70 | % | $ | 4 | 4.37 | % | $ | 1 | 0.26 | % | $ | 330 | 1.90 | % | ||||||||||
Fair value of held-to- maturity securities | $ | 298 | $ | 26 | $ | 4 | $ | 1 | $ | 329 | ||||||||||||||||||||
| (1) | Includes securities with no stated maturity. |
| (2) | Yields are calculated based on the amortized cost of the securities. |
| (3) | Yield of tax-exempt securities calculated on a fully taxable-equivalent basis. |
The components of realized gains and losses on sales of debt securities for 2004, 2003 and 2002 were:
| (Dollars in millions) | 2004 | 2003 | 2002 | |||||||||
Gross gains | $ | 2,270 | $ | 1,246 | $ | 1,035 | ||||||
Gross losses | (147 | ) | (305 | ) | (405 | ) | ||||||
Net gains on sales of debt securities | $ | 2,123 | $ | 941 | $ | 630 | ||||||
BANK OF AMERICA CORPORATION AND SUBSIDIARIES
Notes to Consolidated Financial Statements—(Continued)
The Income Tax Expense attributable to realized net gains on debt securities sales was $788 million, $329 million and $220 million in 2004, 2003 and 2002, respectively.
Note 6—Outstanding Loans and Leases
Outstanding loans and leases at December 31, 2004 and 2003 were:
| December 31 | FleetBoston April 1, 2004 | ||||||||
| (Dollars in millions) | 2004 | 2003 | |||||||
Consumer | |||||||||
Residential mortgage | $ | 178,103 | $ | 140,513 | $ | 34,571 | |||
Credit card | 51,726 | 34,814 | 6,848 | ||||||
Home equity lines | 50,126 | 23,859 | 13,799 | ||||||
Direct/Indirect consumer | 40,513 | 33,415 | 6,113 | ||||||
Other consumer(1) | 7,439 | 7,558 | 1,272 | ||||||
Total consumer | 327,907 | 240,159 | 62,603 | ||||||
Commercial | |||||||||
Commercial - domestic | 122,095 | 91,491 | 31,796 | ||||||
Commercial real estate(2) | 32,319 | 19,367 | 9,982 | ||||||
Commercial lease financing | 21,115 | 9,692 | 10,720 | ||||||
Commercial - foreign | 18,401 | 10,754 | 9,160 | ||||||
Total commercial | 193,930 | 131,304 | 61,658 | ||||||
Total | $ | 521,837 | $ | 371,463 | $ | 124,261 | |||
| (1) | Includes consumer finance, foreign consumer and consumer lease financing of $3,395, $3,563 and $481 at December 31, 2004, respectively, and $3,905, $1,969 and $1,684 at December 31, 2003, respectively. |
| (2) | Includes domestic and foreign commercial real estate loans of $31,879 and $440 at December 31, 2004, respectively, and $19,043 and $324 at December 31, 2003, respectively. |
The Corporation sold whole mortgage loans and recognized gains (losses) in Other Income on the Consolidated Statement of Income of ($2), $772 and $500, for 2004, 2003 and 2002, respectively.
The following table presents the gross recorded investment in specific loans, without consideration to the specific component of the Allowance for Loan and Lease Losses, that were considered individually impaired in accordance with SFAS 114 at December 31, 2004 and 2003. SFAS 114 impairment includes performing troubled debt restructurings, and excludes all commercial leases.
| December 31 | FleetBoston April 1, 2004 | ||||||||
| (Dollars in millions) | 2004 | 2003 | |||||||
Commercial - domestic | $ | 868 | $ | 1,404 | $ | 349 | |||
Commercial real estate | 87 | 153 | 85 | ||||||
Commercial - foreign | 273 | 581 | 480 | ||||||
Total impaired loans | $ | 1,228 | $ | 2,138 | $ | 914 | |||
The average recorded investment in certain impaired loans for 2004, 2003 and 2002 was approximately $1.6 billion, $3.0 billion and $3.9 billion, respectively. At December 31, 2004 and 2003, the recorded investment in impaired loans requiring an Allowance for Loan and Lease Losses based on individual analysis per SFAS 114 guidelines was $926 million and $2.0 billion, and the related Allowance for Loan and Lease Losses was $202 million and $391 million, respectively. For 2004, 2003 and 2002, Interest Income recognized on impaired loans totaled $21 million, $105 million and $156 million, respectively, all of which was recognized on a cash basis.
BANK OF AMERICA CORPORATION AND SUBSIDIARIES
Notes to Consolidated Financial Statements—(Continued)
At December 31, 2004 and 2003, nonperforming loans and leases, including impaired loans and nonaccrual consumer loans, totaled $2.2 billion and $2.9 billion, respectively. Nonperforming securities, which are primarily related to international securities held in the AFS securities portfolio, were obtained through troubled debt restructurings, largely acquired through FleetBoston, and amounted to $140 million at December 31, 2004. In addition, included in Other Assets were nonperforming loans held-for-sale and leveraged lease partnership interests of $151 million and $202 million at December 31, 2004 and 2003, respectively.
Foreclosed properties amounted to $102 million and $148 million at December 31, 2004 and 2003, respectively, and are included in Other Assets on the Consolidated Balance Sheet. The cost of carrying foreclosed properties in 2004, 2003 and 2002 amounted to $3 million, $3 million and $7 million, respectively.
Note 7—Allowance for Credit Losses
The following table summarizes the changes in the allowance for credit losses for 2004, 2003 and 2002:
| (Dollars in millions) | 2004 | 2003 | 2002 | |||||||||
Allowance for loan and lease losses, January 1 | $ | 6,163 | $ | 6,358 | $ | 6,278 | ||||||
FleetBoston balance, April 1, 2004 | 2,763 | — | — | |||||||||
Loans and leases charged off | (4,092 | ) | (3,867 | ) | (4,460 | ) | ||||||
Recoveries of loans and leases previously charged off | 979 | 761 | 763 | |||||||||
Net charge-offs | (3,113 | ) | (3,106 | ) | (3,697 | ) | ||||||
Provision for loan and lease losses | 2,868 | 2,916 | 3,801 | |||||||||
Transfers(1) | (55 | ) | (5 | ) | (24 | ) | ||||||
Allowance for loan and lease losses, December 31 | 8,626 | 6,163 | 6,358 | |||||||||
Reserve for unfunded lending commitments, January 1 | 416 | 493 | 597 | |||||||||
FleetBoston balance, April 1, 2004 | 85 | — | — | |||||||||
Provision for unfunded lending commitments | (99 | ) | (77 | ) | (104 | ) | ||||||
Reserve for unfunded lending commitments, December 31 | 402 | 416 | 493 | |||||||||
Total | $ | 9,028 | $ | 6,579 | $ | 6,851 | ||||||
| (1) | Includes primarily transfers to loans held-for-sale. |
Note 8—Special Purpose Financing Entities
The Corporation securitizes assets and may retain a portion or all of the securities, subordinated tranches, interest-only strips and, in some cases, a cash reserve account, all of which are considered retained interests in the securitized assets. Those assets may be serviced by the Corporation or by third parties. The Corporation also uses other special purpose financing entities to access the commercial paper market and for other lending, leasing and real estate activities. See Note 1 of the Consolidated Financial Statements for a more detailed discussion of securitizations and other special purpose financing entities.
Mortgage-related Securitizations
The Corporation securitizes the majority of its residential mortgage loan originations in conjunction with or shortly after loan closing. In addition, the Corporation may, from time to time, securitize commercial mortgages and first residential mortgages that it originates or purchases from other entities. In 2004 and 2003, the Corporation converted a total of $96.9 billion (including $18.0 billion originated by other entities) and $121.1 billion (including $13.0 billion originated by other entities), respectively, of residential first mortgages and commercial mortgages into mortgage-backed securities issued through Fannie Mae, Freddie
BANK OF AMERICA CORPORATION AND SUBSIDIARIES
Notes to Consolidated Financial Statements—(Continued)
Mac, Government National Mortgage Association (Ginnie Mae), Bank of America, N.A. and Banc of America Mortgage Securities. At December 31, 2004 and 2003, the Corporation retained $9.2 billion (including $1.2 billion issued prior to 2004) and $1.7 billion of securities, respectively. At December 31, 2004, these retained interests were valued using quoted market prices.
For 2004, the Corporation reported $952 million in gains on loans converted into securities and sold, of which $886 million was from loans originated by the Corporation and $66 million was from loans originated by other entities. For 2003, the Corporation reported $2.4 billion in gains on loans converted into securities and sold, of which $2.0 billion was from loans originated by the Corporation and $381 million was from loans originated by other entities. At December 31, 2004, the Corporation had recourse obligations of $558 million with varying terms up to seven years on loans that had been securitized and sold.
In addition to the retained interests in the securities, the Corporation has retained MSRs from the sale or securitization of residential mortgage loans. Servicing fee and ancillary fee income on all loans serviced, including securitizations, was $568 million and $314 million in 2004 and 2003, respectively. The activity in MSRs for 2004 and 2003 is as follows:
| (Dollars in millions) | 2004 | 2003 | ||||||
Balance, January 1 | $ | 479 | $ | 499 | ||||
Additions(1) | 3,036 | 201 | ||||||
Amortization | (360 | ) | (145 | ) | ||||
Change in value attributed to SFAS 133 hedged MSRs(2) | (210 | ) | — | |||||
Impairment, net of recoveries | (463 | ) | (76 | ) | ||||
Balance, December 31(3, 4) | $ | 2,482 | $ | 479 | ||||
| (1) | Includes $2.2 billion of Certificates converted to MSRs on June 1, 2004. |
| (2) | Excludes $228 of offsetting derivative hedge gains recognized in Mortgage Banking Income for 2004. |
| (3) | Net of impairment allowance of $361 for 2004. |
| (4) | 2003 does not include $2.3 billion of Certificates. |
The estimated fair value of MSRs was $2.5 billion and $479 million at December 31, 2004 and 2003, respectively. The additions during 2004 included $2.2 billion of MSRs as a result of the conversion of Certificates discussed in Note 1 of the Consolidated Financial Statements.
The key economic assumptions used in valuations of MSRs include modeled prepayment rates and resultant expected weighted average lives of the MSRs and the option adjusted spread (OAS) levels. An OAS model runs multiple interest rate scenarios and projects prepayments specific to each one of those interest rate scenarios.
As of December 31, 2004, the modeled weighted average lives of MSRs related to fixed and adjustable rate loans (including hybrid ARMs) were 4.65 years and 3.02 years, respectively. A decrease of 10 and 20 percent in modeled prepayments would extend the expected weighted average lives for MSRs related to fixed rate loans to 5.01 years and 5.40 years, respectively, and would extend the expected weighted average lives for MSRs related to adjustable rate loans to 3.32 years and 3.68 years, respectively. The expected extension of weighted average lives would increase the value of MSRs by a range of $143 million to $295 million. An increase of 10 and 20 percent in modeled prepayments would reduce the expected weighted average lives for MSRs related to fixed rate loans to 4.38 years and 4.11 years, respectively, and would reduce the expected weighted average lives for MSRs related to adjustable rate loans to 2.78 years and 2.57 years, respectively. The expected reduction of weighted average lives would decrease the value of MSRs by a range of $112 million to $219 million. A decrease of 100 and 200 basis points (bps) in the OAS level would result in an increase in the value of MSRs ranging from $89 million to $185 million, and an increase of 100 and 200 bps in the OAS level would result in a decrease in the value of MSRs ranging from $83 million to $160 million.
BANK OF AMERICA CORPORATION AND SUBSIDIARIES
Notes to Consolidated Financial Statements—(Continued)
For purposes of evaluating and measuring impairment, the Corporation stratifies the portfolio based on the predominant risk characteristics of loan type and note rate. Indicated impairment, by risk stratification, is recognized as a reduction in Mortgage Banking Income, through a valuation allowance, for any excess of adjusted carrying value over estimated fair value. Impairment, net of recoveries of MSRs totaled $463 million for 2004. For 2003, changes in the value of the Certificates and MSRs were recognized as Trading Account Profits. Impairment charges in 2004 included changes to valuation assumptions and prepayment adjustments related to expectations regarding future prepayment speeds and other assumptions totaling $261 million. Additional impairment reflects decreases in the value of MSRs primarily due to increased probability of prepayments driven by decreases in market interest rates during the second half of 2004.
Other Securitizations
As a result of the Merger, the Corporation acquired an interest in several credit card, home equity loan and commercial loan securitization vehicles, which had aggregate debt securities outstanding of $10.3 billion as of December 31, 2004. During 2004, the Corporation securitized $2.0 billion of automobile loans and retained $1.7 billion of the AAA securities, which are held in the AFS securities portfolio.
At December 31, 2004 and 2003, investment grade securities of $2.9 billion and $2.1 billion, respectively, which are valued using quoted market prices remained in the AFS securities portfolio. At December 31, 2004 there were no recognized servicing assets associated with these securitization transactions.
The Corporation has provided protection on a subset of one consumer finance securitization in the form of a guarantee with a maximum payment of $220 million that will only be paid if over-collateralization is not sufficient to absorb losses and certain other conditions are met. The Corporation projects no payments will be due over the life of the contract, which is approximately one year.
BANK OF AMERICA CORPORATION AND SUBSIDIARIES
Notes to Consolidated Financial Statements—(Continued)
Key economic assumptions used in measuring the fair value of certain residual interests (included in Other Assets) in securitizations and the sensitivity of the current fair value of residual cash flows to changes in those assumptions are as follows:
| Credit Card | Subprime Consumer Finance(1) | Automobile Loans(2) | Home Equity Lines | Commercial Loans | ||||||||||||||||||||||||
| (Dollars in millions) | 2004 | 2003 | 2004 | 2003 | 2004 | 2004 | 2004 | |||||||||||||||||||||
Carrying amount of residual interests (at fair value)(2) | $ | 349 | $ | 76 | $ | 313 | $ | 328 | $ | 34 | $ | 17 | $ | 130 | ||||||||||||||
Balance of unamortized securitized loans | 6,903 | 1,782 | 5,886 | 9,409 | 1,644 | 630 | 3,337 | |||||||||||||||||||||
Weighted average life to call (in years)(3) | 1.2 | 1.4 | 1.3 | 1.6 | 1.4 | 1.3 | n/a | |||||||||||||||||||||
Revolving structures - annual payment rate | 13.7 | % | 14.9 | % | 45.0 | % | 4.5 | %(4) | ||||||||||||||||||||
Amortizing structures - annual constant prepayment rate: | ||||||||||||||||||||||||||||
Fixed rate loans | 7.5%-32.7 | % | 7.8-32.6 | % | 24.9 | % | ||||||||||||||||||||||
Adjustable rate loans | 27.0-40.8 | 27.0-42.4 | — | |||||||||||||||||||||||||
Impact on fair value of 100 bps favorable change | $ | 1 | $ | — | $ | 1 | $ | 4 | $ | — | $ | — | $ | 2 | ||||||||||||||
Impact on fair value of 200 bps favorable change | 2 | — | 11 | 11 | — | 1 | 2 | |||||||||||||||||||||
Impact on fair value of 100 bps adverse change | (1 | ) | — | (9 | ) | (11 | ) | — | — | (1 | ) | |||||||||||||||||
Impact on fair value of 200 bps adverse change | (2 | ) | — | (17 | ) | (15 | ) | (1 | ) | (1 | ) | (1 | ) | |||||||||||||||
Expected credit losses(5) | 5.3-9.7 | % | 5.3 | % | 5.1-12.3 | % | 4.6-11.0 | % | 1.6 | % | 0.2 | % | 0.4 | % | ||||||||||||||
Impact on fair value of 10% favorable change | $ | 18 | $ | 2 | $ | 27 | $ | 37 | $ | 3 | $ | — | $ | 1 | ||||||||||||||
Impact on fair value of 25% favorable change | 47 | 5 | 71 | 100 | 6 | — | 2 | |||||||||||||||||||||
Impact on fair value of 10% adverse change | (15 | ) | (2 | ) | (27 | ) | (37 | ) | (2 | ) | — | (1 | ) | |||||||||||||||
Impact on fair value of 25% adverse change | (27 | ) | (5 | ) | (68 | ) | (82 | ) | (6 | ) | — | (2 | ) | |||||||||||||||
Residual cash flows discount rate (annual rate) | 6.0-12.0 | % | 6.0 | % | 15.0-30.0 | % | 15.0-30.0 | % | 20.0 | % | 12.0 | % | 12.3 | % | ||||||||||||||
Impact on fair value of 100 bps favorable change | $ | — | $ | — | $ | 6 | $ | 8 | $ | 1 | $ | — | $ | 1 | ||||||||||||||
Impact on fair value of 200 bps favorable change | — | — | 12 | 16 | 1 | — | 2 | |||||||||||||||||||||
Impact on fair value of 100 bps adverse change | — | — | (6 | ) | (8 | ) | (1 | ) | — | (1 | ) | |||||||||||||||||
Impact on fair value of 200 bps adverse change | — | — | (12 | ) | (15 | ) | (1 | ) | — | (2 | ) | |||||||||||||||||
| (1) | Subprime consumer finance includes subprime real estate loan and manufactured housing loan securitizations, which are all serviced by third parties. |
| (2) | Residual interests include interest-only strips, one or more subordinated tranches, accrued interest receivable, and in some cases, a cash reserve account. |
| (3) | Before any optional clean-up calls are executed, economic analyses will be performed. |
| (4) | Monthly average net pay rate (pay rate less draw rate). |
| (5) | Annual rates of expected credit losses are presented for credit card, home equity lines and commercial securitizations. Cumulative lifetime rates of expected credit losses (incurred plus projected) are presented for subprime consumer finance securitizations and the auto loan securitizations. |
n/a = not applicable
The sensitivities in the preceding table are hypothetical and should be used with caution. As the amounts indicate, changes in fair value based on variations in assumptions generally cannot be extrapolated because the relationship of the change in assumption to the change in fair value may not be linear. Also, the effect of a variation in a particular assumption on the fair value of the retained interest is calculated without
BANK OF AMERICA CORPORATION AND SUBSIDIARIES
Notes to Consolidated Financial Statements—(Continued)
changing any other assumption. In reality, changes in one factor may result in changes in another, which might magnify or counteract the sensitivities. Additionally, the Corporation has the ability to hedge interest rate risk associated with retained residual positions. The above sensitivities do not reflect any hedge strategies that may be undertaken to mitigate such risk.
Static pool net credit losses are considered in determining the value of retained interests. Static pool net credit losses include actual losses incurred plus projected credit losses divided by the original balance of each securitization pool. Expected static pool net credit losses at December 31, 2004 for the 2004 auto loan securitization were 1.63 percent. For the subprime consumer finance securitizations, weighted average static pool net credit losses for 2001, 1999, 1998, 1997 and 1995 were 5.93 percent, 11.67 percent, 9.20 percent, 4.92 percent and 12.25 percent, respectively at December 31, 2004, and 5.83 percent, 9.91 percent, 8.22 percent, 4.92 percent and 10.83 percent, respectively, at December 31, 2003.
Proceeds from collections reinvested in revolving credit card securitizations were $6.8 billion and $3.8 billion in 2004 and 2003, respectively. Credit card servicing fee income totaled $134 million and $51 million in 2004 and 2003, respectively. Other cash flows received on retained interests, such as cash flows from interest-only strips, were $345 million and $279 million in 2004 and 2003, respectively, for credit card securitizations. Proceeds from collections reinvested in revolving commercial loan securitizations were $1.1 billion in 2004. Servicing fees and other cash flows received on retained interests, such as cash flows from interest-only strips, were $4 million and $11 million, respectively, in 2004 for commercial loan securitizations.
The Corporation reviews its loans and leases portfolio on a managed basis. Managed loans and leases are defined as on-balance sheet Loans and Leases as well as loans in revolving securitizations, which include credit cards, home equity lines and commercial loans. New advances under previously securitized accounts will be recorded on the Corporation’s Consolidated Balance Sheet after the revolving period of the securitization, which has the effect of increasing Loans and Leases on the Corporation’s Consolidated Balance Sheet and increasing Net Interest Income and charge-offs, with a corresponding reduction in Noninterest Income. Portfolio balances, delinquency and historical loss amounts of the managed loans and leases portfolio for 2004 and 2003 were as follows:
| December 31, 2004 | December 31, 2003 | |||||||||||||||||||
| (Dollars in millions) | Total Principal Amount of Loans and Leases | Principal Amount of Accruing Loans and Leases Past Due 90 Days or More(1) | Principal Amount of Nonperforming Loans and Leases | Total Principal Amount of Loans and Leases | Principal Amount of Accruing Loans and Leases Past Due 90 Days or More(1) | Principal Amount of Nonperforming Loans and Leases | ||||||||||||||
Residential mortgage | $ | 178,103 | $ | — | $ | 554 | $ | 140,513 | $ | — | $ | 531 | ||||||||
Credit card | 58,629 | 1,223 | — | 36,596 | 647 | — | ||||||||||||||
Home equity lines | 50,756 | 3 | 66 | 23,859 | — | 43 | ||||||||||||||
Direct/Indirect consumer | 40,513 | 58 | 33 | 33,415 | 47 | 28 | ||||||||||||||
Other consumer | 7,439 | 23 | 85 | 7,558 | 35 | 36 | ||||||||||||||
Total consumer | 335,440 | 1,307 | 738 | 241,941 | 729 | 638 | ||||||||||||||
Commercial - domestic | 125,432 | 121 | 855 | 91,491 | 108 | 1,388 | ||||||||||||||
Commercial real estate | 32,319 | 1 | 87 | 19,367 | 23 | 141 | ||||||||||||||
Commercial lease financing | 21,115 | 14 | 266 | 9,692 | 2 | 127 | ||||||||||||||
Commercial - foreign | 18,401 | 2 | 267 | 10,754 | 29 | 578 | ||||||||||||||
Total commercial | 197,267 | 138 | 1,475 | 131,304 | 162 | 2,234 | ||||||||||||||
Total managed loans and leases | 532,707 | $ | 1,445 | $ | 2,213 | 373,245 | $ | 891 | $ | 2,872 | ||||||||||
Loans in revolving securitizations | (10,870 | ) | (1,782 | ) | ||||||||||||||||
Total held loans and leases | $ | 521,837 | $ | 371,463 | ||||||||||||||||
BANK OF AMERICA CORPORATION AND SUBSIDIARIES
Notes to Consolidated Financial Statements—(Continued)
| Year Ended December 31, 2004 | Year Ended December 31, 2003 | ||||||||||||||||||||
| (Dollars in millions) | Average Loans and Leases Outstanding | Loans and Leases Net Losses | Net Loss Ratio(2) | Average Loans and Leases Outstanding | Loans and Leases Net Losses | Net Loss Ratio(2) | |||||||||||||||
Residential mortgage | $ | 167,298 | $ | 36 | 0.02 | % | $ | 127,059 | $ | 40 | 0.03 | % | |||||||||
Credit card | 50,296 | 2,829 | 5.62 | 31,552 | 1,691 | 5.36 | |||||||||||||||
Home equity lines | 39,942 | 15 | 0.04 | 22,890 | 11 | 0.05 | |||||||||||||||
Direct/Indirect consumer | 38,078 | 208 | 0.55 | 32,593 | 181 | 0.55 | |||||||||||||||
Other consumer | 7,717 | 193 | 2.50 | 8,865 | 256 | 2.89 | |||||||||||||||
Total consumer | 303,331 | 3,281 | 1.08 | 222,959 | 2,179 | 0.98 | |||||||||||||||
Commercial - domestic | 117,422 | 184 | 0.16 | 93,458 | 633 | 0.68 | |||||||||||||||
Commercial real estate | 28,085 | (3 | ) | (0.01 | ) | 20,042 | 41 | 0.20 | |||||||||||||
Commercial lease financing | 17,483 | 9 | 0.05 | 10,061 | 124 | 1.23 | |||||||||||||||
Commercial - foreign | 16,505 | 173 | 1.05 | 12,970 | 306 | 2.36 | |||||||||||||||
Total commercial | 179,495 | 363 | 0.20 | 136,531 | 1,104 | 0.81 | |||||||||||||||
Total managed loans and leases | 482,826 | $ | 3,644 | 0.75 | % | 359,490 | $ | 3,283 | 0.91 | % | |||||||||||
Loans in revolving securitizations | (10,181 | ) | (3,342 | ) | |||||||||||||||||
Total held loans and leases | $ | 472,645 | $ | 356,148 | |||||||||||||||||
| (1) | Excludes consumer real estate loans, which are placed on nonperforming status at 90 days past due. |
| (2) | The net loss ratio is calculated by dividing managed loans and leases net losses by average managed loans and leases outstanding for each loan and lease category. |
Variable Interest Entities
At December 31, 2004, the assets and liabilities of ABCP conduits that have been consolidated in accordance with FIN 46 were reflected in AFS Securities, Other Assets, and Commercial Paper and Other Short-term Borrowings in theGlobal Capital Markets and Investment Banking business segment. As of December 31, 2004 and 2003, the Corporation held $7.7 billion and $5.6 billion of assets in these entities, respectively, while the Corporation’s maximum loss exposure associated with these entities including unfunded lending commitments was approximately $9.4 billion and $7.6 billion, respectively. The Corporation also had contractual relationships with other consolidated VIEs that engage in leasing or lending activities or real estate joint ventures. As of December 31, 2004 and 2003, the amount of assets of these entities was $560 million and $382 million, respectively, and the Corporation’s maximum possible loss exposure was $132 million and $131 million, respectively.
Additionally, the Corporation had significant variable interests in other VIEs that it did not consolidate because it was not deemed to be the primary beneficiary. In such cases, the Corporation does not absorb the majority of the entities’ expected losses nor does it receive a majority of the entities’ expected residual returns, or both. These entities typically support the financing needs of the Corporation’s customers by facilitating their access to the commercial paper markets. The Corporation functions as administrator and provides either liquidity and letters of credit, or derivatives to the VIE. The Corporation also provides asset management and related services to other special purpose vehicles that engage in lending, investing, or real estate activities. Total assets of these entities at December 31, 2004 and 2003 were approximately $32.9 billion and $28.0 billion, respectively; revenues associated with administration, liquidity, letters of credit and other services were approximately $154 million in 2004 and $94 million in 2003. At December 31, 2004 and 2003, the Corporation’s maximum loss exposure associated with these VIEs was approximately $25.0 billion and $21.7 billion, respectively, which is net of amounts syndicated.
Management does not believe losses resulting from its involvement with the entities discussed above will be material. See Note 1 of the Consolidated Financial Statements for additional discussion of special purpose financing entities.
BANK OF AMERICA CORPORATION AND SUBSIDIARIES
Notes to Consolidated Financial Statements—(Continued)
Note 9—Goodwill and Other Intangibles
The following table presents allocated Goodwill at December 31, 2004 and 2003 for each business segment. The increases from December 31, 2003 were primarily due to the Merger and the acquisition of NPC, which added approximately $33.2 billion and $625 million, respectively, of Goodwill.
| December 31 | ||||||
| (Dollars in millions) | 2004 | 2003 | ||||
Global Consumer and Small Business Banking | $ | 22,501 | $ | 6,000 | ||
Global Business and Financial Services | 13,269 | 1,144 | ||||
Global Capital Markets and Investment Banking | 4,500 | 1,953 | ||||
Global Wealth and Investment Management | 4,727 | 2,223 | ||||
All Other | 265 | 135 | ||||
Total | $ | 45,262 | $ | 11,455 | ||
The gross carrying value and accumulated amortization related to core deposit intangibles and other intangibles at December 31, 2004 and 2003 are presented below:
| December 31 | ||||||||||||
| 2004 | 2003 | |||||||||||
| (Dollars in millions) | Gross Carrying Value | Accumulated Amortization | Gross Carrying Value | Accumulated Amortization | ||||||||
Core deposit intangibles | $ | 3,668 | $ | 1,354 | $ | 1,495 | $ | 886 | ||||
Other intangibles | 2,256 | 683 | 787 | 488 | ||||||||
Total | $ | 5,924 | $ | 2,037 | $ | 2,282 | $ | 1,374 | ||||
As a result of the Merger, the Corporation recorded $2.2 billion of core deposit intangibles, $660 million of purchased credit card relationship intangibles and $409 million of other customer relationship intangibles. As of December 31, 2004, the weighted average amortization period for the core deposit intangibles as well as the other intangibles was approximately 9 years. As a result of the acquisition of NPC, the Corporation preliminarily allocated $482 million to other intangibles with a weighted average amortization period of approximately 10 years as of December 31, 2004. Included in this number is $84 million related to trade names, to which we have assigned an indefinite life.
Amortization expense on core deposit intangibles and other intangibles was $664 million, $217 million and $218 million for 2004, 2003 and 2002, respectively. The Corporation estimates that aggregate amortization expense will be $809 million, $745 million, $602 million, $499 million and $393 million for 2005, 2006, 2007, 2008 and 2009, respectively.
Note 10—Deposits
The Corporation had domestic certificates of deposit of $100 thousand or more totaling $56.2 billion and $32.8 billion at December 31, 2004 and 2003, respectively. The Corporation had other domestic time deposits of $100 thousand or more totaling $1.1 billion and $1.0 billion at December 31, 2004 and 2003, respectively. Foreign certificates of deposit and other foreign time deposits of $100 thousand or more totaled $28.6 billion and $15.4 billion at December 31, 2004 and 2003, respectively.
BANK OF AMERICA CORPORATION AND SUBSIDIARIES
Notes to Consolidated Financial Statements—(Continued)
The following table presents the maturities of domestic certificates of deposit of $100 thousand or more and of other domestic time deposits of $100 thousand or more at December 31, 2004.
| (Dollars in millions) | Three months or less | Over three months to six months | Over six months to twelve months | Thereafter | Total | ||||||||||
Certificates of deposit of $100 thousand or more | $ | 20,253 | $ | 11,588 | $ | 17,904 | $ | 6,410 | $ | 56,155 | |||||
Other time deposits of $100 thousand or more | 154 | 117 | 96 | 758 | 1,125 | ||||||||||
At December 31, 2004, the scheduled maturities for total time deposits were as follows:
| (Dollars in millions) | |||
Due in 2005 | $ | 152,317 | |
Due in 2006 | 9,206 | ||
Due in 2007 | 6,810 | ||
Due in 2008 | 2,033 | ||
Due in 2009 | 2,828 | ||
Thereafter | 1,334 | ||
Total | $ | 174,528 | |
Note 11—Short-term Borrowings and Long-term Debt
Short-term Borrowings
Bank of America Corporation and certain other subsidiaries issue commercial paper in order to meet short-term funding needs. Commercial paper outstanding at December 31, 2004 was $25.4 billion compared to $7.6 billion at December 31, 2003.
Bank of America, N.A. maintains a domestic program to offer up to a maximum of $60.0 billion, at any one time, of bank notes with fixed or floating rates and maturities of at least seven days from the date of issue. Short-term bank notes outstanding under this program totaled $9.6 billion at December 31, 2004 compared to $3.3 billion at December 31, 2003. These short-term bank notes, along with Treasury tax and loan notes, term federal funds purchased and commercial paper, are reflected in Commercial Paper and Other Short-term Borrowings on the Consolidated Balance Sheet.
BANK OF AMERICA CORPORATION AND SUBSIDIARIES
Notes to Consolidated Financial Statements—(Continued)
Long-term Debt
The following table presents Long-term Debt at December 31, 2004 and 2003:
| December 31 | ||||||
| (Dollars in millions) | 2004 | 2003 | ||||
Notes issued by Bank of America Corporation(1,2) | ||||||
Senior notes: | ||||||
Fixed, ranging from 1.62% to 7.25%, due 2005 to 2028 | $ | 4,102 | $ | 8,219 | ||
Floating, ranging from 0.20% to 8.33%, due 2005 to 2043 | 46,641 | 28,669 | ||||
Subordinated notes: | ||||||
Fixed, ranging from 3.95% to 8.63%, due 2005 to 2029 | 2,866 | 2,299 | ||||
Floating, ranging from 1.63% to 5.25%, due 2005 to 2037 | 19,683 | 16,742 | ||||
Junior subordinated notes (related to trust preferred securities): | ||||||
Fixed, ranging from 6.00% to 11.45%, due 2026 to 2033 | 2,498 | 2,127 | ||||
Floating, ranging from 2.07% to 3.56%, due 2026 to 2034 | 7,079 | 3,344 | ||||
Total notes issued by Bank of America Corporation | 82,869 | 61,400 | ||||
Notes issued by Bank of America, N.A. and other subsidiaries(1,2) | ||||||
Senior notes: | ||||||
Fixed, ranging from 0% to 8.50%, due 2005 to 2073 | 406 | 606 | ||||
Floating, ranging from 0% to 3.51%, due 2005 to 2051 | 6,090 | 3,491 | ||||
Subordinated notes: | ||||||
Fixed, ranging from 5.75% to 8.63%, due 2005 to 2009 | 2,186 | 300 | ||||
Floating, 2.56%, due 2019 | 8 | 8 | ||||
Total notes issued by Bank of America, N.A. and other subsidiaries | 8,690 | 4,405 | ||||
Notes issued by NB Holdings Corporation(1,2) | ||||||
Junior subordinated notes (related to trust preferred securities): | ||||||
Fixed | — | 515 | ||||
Floating, ranging from 2.40% to 3.19% due 2026 to 2027 | 773 | 258 | ||||
Total notes issued by NB Holdings Corporation | 773 | 773 | ||||
Other debt | ||||||
Advances from the Federal Home Loan Bank - Georgia | 2,750 | 2,750 | ||||
Advances from the Federal Home Loan Bank - Oregon | 2,081 | 5,989 | ||||
Advances from the Federal Home Loan Bank - Massachusetts | 868 | — | ||||
Other | 47 | 26 | ||||
Total other debt | 5,746 | 8,765 | ||||
Total | $ | 98,078 | $ | 75,343 | ||
| (1) | Certain fixed-rate and floating-rate classifications as well as interest rates include the effect of interest rate swap contracts. |
| (2) | Rates and maturity dates reflect outstanding debt at December 31, 2004. |
The majority of the floating rates are based on three- and six-month London InterBank Offered Rates (LIBOR). Bank of America Corporation and Bank of America, N.A. maintain various domestic and international debt programs to offer both senior and subordinated notes. The notes may be denominated in U.S. dollars or foreign currencies. Foreign currency contracts are used to convert certain foreign currency-denominated debt into U.S. dollars.
At December 31, 2004 and 2003, Bank of America Corporation was authorized to issue approximately $37.1 billion and $26.0 billion, respectively, of additional corporate debt and other securities under its existing shelf registration statements. At December 31, 2004 and 2003, Bank of America, N.A. was
BANK OF AMERICA CORPORATION AND SUBSIDIARIES
Notes to Consolidated Financial Statements—(Continued)
authorized to issue approximately $27.2 billion and $25.9 billion, respectively, of bank notes and Euro medium-term notes.
Including the effects of interest rate contracts for certain long-term debt issuances, the weighted average effective interest rates for total long-term debt, total fixed-rate debt and total floating-rate debt (based on the rates in effect at December 31, 2004) were 3.19 percent, 6.36 percent and 2.67 percent, respectively, at December 31, 2004 and (based on the rates in effect at December 31, 2003) were 2.36 percent, 6.01 percent and 1.41 percent, respectively, at December 31, 2003. These obligations were denominated primarily in U.S. dollars.
Aggregate annual maturities of long-term debt obligations (based on final maturity dates) at December 31, 2004 are as follows:
| (Dollars in millions) | 2005 | 2006 | 2007 | 2008 | 2009 | Thereafter | Total | ||||||||||||||
Bank of America Corporation | $ | 5,867 | $ | 8,326 | $ | 8,286 | $ | 6,191 | $ | 8,153 | $ | 46,046 | $ | 82,869 | |||||||
Bank of America, N.A. | 1,760 | 1,437 | 1,145 | 2,429 | 400 | 1,519 | 8,690 | ||||||||||||||
NB Holdings Corporation | — | — | — | — | — | 773 | 773 | ||||||||||||||
Other | 1,884 | 2,739 | 565 | 104 | 21 | 433 | 5,746 | ||||||||||||||
Total | $ | 9,511 | $ | 12,502 | $ | 9,996 | $ | 8,724 | $ | 8,574 | $ | 48,771 | $ | 98,078 | |||||||
Trust Preferred Securities
Trust preferred securities (Trust Securities) are issued by the trust companies (the Trusts) that were deconsolidated by the Corporation as a result of the adoption of FIN 46. These securities are mandatorily redeemable preferred security obligations of the Trusts. The sole assets of the Trusts are Junior Subordinated Deferrable Interest Notes of the Corporation (the Notes). The Trusts are 100 percent owned finance subsidiaries of the Corporation. Obligations associated with these securities are included in junior subordinated notes related to Trust Securities in the Long-term Debt table on page 121. See Note 14 of the Consolidated Financial Statements for a discussion regarding the potential change in treatment for regulatory capital purposes of the Trust Securities.
At December 31, 2004, the Corporation had 30 Trusts which have issued Trust Securities to the public. Certain of the Trust Securities were issued at a discount and may be redeemed prior to maturity at the option of the Corporation. The Trusts have invested the proceeds of such Trust Securities in the Notes. Each issue of the Notes has an interest rate equal to the corresponding Trust Securities distribution rate. The Corporation has the right to defer payment of interest on the Notes at any time, or from time to time, for a period not exceeding five years provided that no extension period may extend beyond the stated maturity of the relevant Notes. During any such extension period, distributions on the Trust Securities will also be deferred, and the Corporation’s ability to pay dividends on its common and preferred stock will be restricted.
The Trust Securities are subject to mandatory redemption upon repayment of the related Notes at their stated maturity dates or their earlier redemption at a redemption price equal to their liquidation amount plus accrued distributions to the date fixed for redemption and the premium, if any, paid by the Corporation upon concurrent repayment of the related Notes.
Periodic cash payments and payments upon liquidation or redemption with respect to Trust Securities are guaranteed by the Corporation to the extent of funds held by the Trusts (the Preferred Securities Guarantee). The Preferred Securities Guarantee, when taken together with the report thereonCorporation’s other obligations, including its obligations under the Notes, will constitute a full and unconditional guarantee, on a subordinated basis, by the Corporation of payments due on the Trust Securities.
BANK OF AMERICA CORPORATION AND SUBSIDIARIES
Notes to Consolidated Financial Statements—(Continued)
The following table is a summary of the outstanding Trust Securities and the Notes at December 31, 2004 as originated by Bank of America Corporation and the predecessor banks.
(Dollars in millions)
Issuer | Issuance Date | Aggregate Principal Amount of Trust Securities | Aggregate Principal Amount of the Notes | Stated | Per Annum | Interest Payment Dates | Redemption | |||||||||
NationsBank | ||||||||||||||||
Capital Trust II | December 1996 | $ | 365 | $ | 376 | December 2026 | 7.83% | 6/15,12/15 | On or after 12/15/06(1,3) | |||||||
Capital Trust III | February 1997 | 494 | 509 | January 2027 | 3-mo. LIBOR +55 bps | 1/15,4/15, 7/15,10/15 | On or after 1/15/07(1) | |||||||||
Capital Trust IV | April 1997 | 498 | 513 | April 2027 | 8.25 | 4/15,10/15 | On or after 4/15/07(1,4) | |||||||||
BankAmerica | ||||||||||||||||
Institutional Capital A | November 1996 | 450 | 464 | December 2026 | 8.07 | 6/30,12/31 | On or after 12/31/06(2,5) | |||||||||
Institutional Capital B | November 1996 | 300 | 309 | December 2026 | 7.70 | 6/30,12/31 | On or after 12/31/06(2,6) | |||||||||
Capital II | December 1996 | 450 | 464 | December 2026 | 8.00 | 6/15,12/15 | On or after 12/15/06(2,7) | |||||||||
Capital III | January 1997 | 400 | 412 | January 2027 | 3-mo. LIBOR +57 bps | 1/15,4/15, 7/15,10/15 | On or after 1/15/02(2) | |||||||||
Barnett | ||||||||||||||||
Capital I | November 1996 | 300 | 309 | December 2026 | 8.06 | 6/1,12/1 | On or after 12/01/06(1,8) | |||||||||
Capital II | December 1996 | 200 | 206 | December 2026 | 7.95 | 6/1,12/1 | On or after 12/01/06(1,9) | |||||||||
Capital III | January 1997 | 250 | 258 | February 2027 | 3-mo. LIBOR +62.5 bps | 2/1,5/1, 8/1,11/1 | On or after 2/01/07(1) | |||||||||
Bank of America | ||||||||||||||||
Capital Trust I | December 2001 | 575 | 593 | December 2031 | 7.00 | 3/15,6/15, 9/15,12/15 | On or after 12/15/06(10) | |||||||||
Capital Trust II | January 2002 | 900 | 928 | February 2032 | 7.00 | 2/1, 5/1, 8/1,11/1 | On or after 2/01/07(11) | |||||||||
Capital Trust III | August 2002 | 500 | 516 | August 2032 | 7.00 | 2/15, 5/15, 8/15,11/15 | On or after 8/15/07(12) | |||||||||
Capital Trust IV | April 2003 | 375 | 387 | May 2033 | 5.88 | 2/1, 5/1, 8/1,11/1 | On or after 5/01/08(13) | |||||||||
Capital Trust V | November 2004 | 518 | 534 | November 2034 | 6.00 | 2/3, 5/3, 8/3,11/3 | On or after 11/03/09(14) | |||||||||
Fleet | ||||||||||||||||
Capital Trust II | December 1996 | 250 | 258 | December 2026 | 7.92 | 6/15,12/15 | On or after 12/15/06(2,15) | |||||||||
Capital Trust V | December 1998 | 250 | 258 | December 2028 | 3-mo. LIBOR +100 bps | 3/18, 6/18, 9/18, 12/18 | On or after 12/18/03(2) | |||||||||
Capital Trust VI | June 2000 | 300 | 309 | June 2030 | 8.80 | 3/31, 6/30, 9/30,12/31 | On or after 6/30/05(2) | |||||||||
Capital Trust VII | September 2001 | 500 | 515 | December 2031 | 7.20 | 3/15, 6/15, 9/15, 12/15 | On or after 9/17/06(2) | |||||||||
Capital Trust VIII | March 2002 | 534 | 551 | March 2032 | 7.20 | 3/15, 6/15, 9/15,12/15 | On or after 3/08/07(2,16) | |||||||||
Capital Trust IX | July 2003 | 175 | 180 | August 2033 | 6.00 | 2/1, 5/1, 8/1,11/1 | On or after 7/31/08(1) | |||||||||
BankBoston | ||||||||||||||||
Capital Trust I | November 1996 | 250 | 258 | December 2026 | 8.25 | 6/15,12/15 | On or after 12/15/06(2,17) | |||||||||
Capital Trust II | December 1996 | 250 | 258 | December 2026 | 7.75 | 6/15,12/15 | On or after 12/15/06(2,18) | |||||||||
Capital Trust III | June 1997 | 250 | 258 | June 2027 | 3-mo. LIBOR +75 bps | 3/15, 6/15, 9/15,12/15 | On or after 6/15/07(2) | |||||||||
Capital Trust IV | June 1998 | 250 | 258 | June 2028 | 3-mo. LIBOR +60 bps | 3/8, 6/8, 9/8,12/8 | On or after 6/08/03(2) | |||||||||
Summit | ||||||||||||||||
Capital Trust I | March 1997 | 150 | 155 | March 2027 | 8.40 | 3/15,9/15 | On or after 3/15/07(2,19) | |||||||||
Progress | ||||||||||||||||
Capital Trust I | June 1997 | 9 | 9 | June 2027 | 10.50 | 6/1,12/1 | On or after 6/01/07(2,20) | |||||||||
Capital Trust II | July 2000 | 6 | 6 | July 2030 | 11.45 | 1/19,7/19 | On or after 7/19/10(2,21) | |||||||||
Capital Trust III | November 2002 | 10 | 10 | November 2032 | 3-mo. LIBOR +33.5 bps | 5/15,11/15 | On or after 11/15/07(2) | |||||||||
Capital Trust IV | December 2002 | 5 | 5 | January 2033 | 3-mo. LIBOR +33.5 bps | 1/7, 4/7, 7/7,10/7 | On or after 1/07/08(1) | |||||||||
Total | $ | 9,764 | $ | 10,066 | ||||||||||||
BANK OF AMERICA CORPORATION AND SUBSIDIARIES
Notes to Consolidated Financial Statements—(Continued)
| (1) | The Corporation may redeem the Notes prior to the indicated redemption period upon the occurrence of certain events relating to tax treatment of the related Trust or the Notes, relating to capital treatment of the Trust Securities or relating to a change in the treatment of the related Trust under the Investment Company Act of 1940, as amended, at a redemption price at least equal to the principal amount of the Notes. |
| (2) | The Corporation may redeem the Notes prior to the indicated redemption period upon the occurrence of certain events relating to tax treatment of the related Trust or the Notes or relating to capital treatment of the Trust Securities at a redemption price at least equal to the principal amount of the Notes. |
| (3) | The Notes may be redeemed on or after December 15, 2006 and prior to December 15, 2007 at 103.915 percent of the principal amount, and thereafter, at prices declining to 100 percent on December 15, 2016 and thereafter. |
| (4) | The Notes may be redeemed on or after April 15, 2007 and prior to April 15, 2008 at 103.85 percent of the principal amount, and thereafter, at prices declining to 100 percent on April 15, 2017 and thereafter. |
| (5) | The Notes may be redeemed on or after December 31, 2006 and prior to December 31, 2007 at 104.035 percent of the principal amount, and thereafter, at prices declining to 100 percent on December 31, 2016 and thereafter. |
| (6) | The Notes may be redeemed on or after December 31, 2006 and prior to December 31, 2007 at 103.7785 percent of the principal amount, and thereafter, at prices declining to 100 percent on December 31, 2016 and thereafter. |
| (7) | The Notes may be redeemed on or after December 15, 2006 and prior to December 15, 2007 at 103.969 percent of the principal amount, and thereafter, at prices declining to 100 percent on December 15, 2016 and thereafter. |
| (8) | The Notes may be redeemed on or after December 1, 2006 and prior to December 1, 2007 at 104.03 percent of the principal amount, and thereafter, at prices declining to 100 percent on December 1, 2016 and thereafter. |
| (9) | The Notes may be redeemed on or after December 1, 2006 and prior to December 1, 2007 at 103.975 percent of the principal amount, and thereafter, at prices declining to 100 percent on December 1, 2016 and thereafter. |
| (10) | The Corporation may redeem the Notes prior to the indicated redemption period upon the occurrence and continuation of a tax event, an investment company event or a capital treatment event. The Corporation may extend the stated maturity date of the junior subordinated notes to a date no later than December 15, 2050. |
| (11) | The Corporation may redeem the Notes prior to the indicated redemption period upon the occurrence and continuation of a tax event, an investment company event or a capital treatment event. The Corporation may extend the stated maturity date of the junior subordinated notes to a date no later than February 1, 2051. |
| (12) | The Corporation may redeem the Notes prior to the indicated redemption period upon the occurrence and continuation of a tax event, an investment company event or a capital treatment event. The Corporation may extend the stated maturity date of the junior subordinated notes to a date no later than April 15, 2051. |
| (13) | The Corporation may redeem the Notes prior to the indicated redemption period upon the occurrence and continuation of a tax event, an investment company event or a capital treatment event. The Corporation may extend the stated maturity date of the junior subordinated notes to a date no later than May 3, 2052. |
| (14) | The Corporation may redeem the Notes prior to the indicated redemption period upon the occurrence and continuation of a tax event, an investment company event or a capital treatment event. The Corporation may extend the stated maturity date of the junior subordinated notes to a date no later than November 3, 2053. |
| (15) | The Notes may be redeemed on or after December 15, 2006 and prior to December 15, 2007 at 103.908 percent of the principal amount, and thereafter, at prices declining to 100 percent on December 15, 2016 and thereafter. |
| (16) | The Corporation may extend the stated maturity date of the junior subordinated notes to a date no later than March 15, 2051. |
| (17) | The Notes may be redeemed on or after December 15, 2006 and prior to December 15, 2007 at 104.125 percent of the principal amount, and thereafter, at prices declining to 100 percent on December 15, 2016 and thereafter. |
| (18) | The Notes may be redeemed on or after December 15, 2006 and prior to December 15, 2007 at 103.875 percent of the principal amount, and thereafter, at prices declining to 100 percent on December 15, 2016 and thereafter. |
| (19) | The Notes may be redeemed on or after March 15, 2007 and prior to March 15, 2008 at 104.20 percent of the principal amount, and thereafter, at prices declining to 100 percent on March 15, 2017 and thereafter. |
| (20) | The Notes may be redeemed on or after June 1, 2007 and prior to June 1, 2008 at 105.25 percent of the principal amount, and thereafter, at prices declining to 100 percent on June 1, 2017 and thereafter. |
| (21) | The Notes may be redeemed on or after July 19, 2010 and prior to July 19, 2011 at 102.861 percent of the principal amount, and thereafter, at prices declining to 100 percent on July 19, 2015 and thereafter. |
BANK OF AMERICA CORPORATION AND SUBSIDIARIES
Notes to Consolidated Financial Statements—(Continued)
Note 12—Commitments and Contingencies
In the normal course of business, the Corporation enters into a number of off-balance sheet commitments. These commitments expose the Corporation to varying degrees of credit and market risk and are subject to the same credit and market risk limitation reviews as those recorded on the Corporation’s Consolidated Balance Sheet.
Credit Extension Commitments
The Corporation enters into commitments to extend credit such as loan commitments, standby letters of credit (SBLCs) and commercial letters of credit to meet the financing needs of its customers. The outstanding unfunded lending commitments shown in the following table have been reduced by amounts participated to other financial institutions of $23.4 billion and $12.5 billion at December 31, 2004 and 2003, respectively. The carrying amount for these commitments, which represents the liability recorded related to these instruments, at December 31, 2004 and 2003 was $520 million and $418 million, respectively.
| December 31 | FleetBoston April 1, 2004 | ||||||||
| (Dollars in millions) | 2004 | 2003 | |||||||
Loan commitments(1) | $ | 247,094 | $ | 180,078 | $ | 61,012 | |||
Home equity lines of credit | 60,128 | 31,703 | 13,891 | ||||||
Standby letters of credit and financial guarantees | 42,850 | 31,150 | 12,914 | ||||||
Commercial letters of credit | 5,653 | 3,260 | 1,689 | ||||||
Legally binding commitments | 355,725 | 246,191 | 89,506 | ||||||
Credit card lines | 185,461 | 93,771 | 77,997 | ||||||
Total | $ | 541,186 | $ | 339,962 | $ | 167,503 | |||
| (1) | Equity commitments of $2,052 and $1,678 related to obligations to fund existing equity investments were included in loan commitments at December 31, 2004 and 2003, respectively. Included in loan commitments at December 31, 2004, were $838 of equity commitments related to obligations to fund existing equity investments acquired from FleetBoston. |
Legally binding commitments to extend credit generally have specified rates and maturities. Certain of these commitments have adverse change clauses that help to protect the Corporation against deterioration in the borrowers’ ability to pay.
The Corporation issues SBLCs and financial guarantees to support the obligations of its customers to beneficiaries. Additionally, in many cases, the Corporation holds collateral in various forms against these SBLCs. As part of its risk management activities, the Corporation continuously monitors the creditworthiness of the customer as well as SBLC exposure; however, if the customer fails to perform the specified obligation to the beneficiary, the beneficiary may draw upon the SBLC by presenting documents that are in compliance with the letter of credit terms. In that event, the Corporation either repays the money borrowed or advanced, makes payment on account of the indebtedness of the customer or makes payment on account of the default by the customer in the performance of an obligation to the beneficiary up to the full notional amount of the SBLC. The customer is obligated to reimburse the Corporation for any such payment. If the customer fails to pay, the Corporation would, as contractually permitted, liquidate collateral and/or set off accounts.
Commercial letters of credit, issued primarily to facilitate customer trade finance activities, are usually collateralized by the underlying goods being shipped to the customer and are generally short-term. Credit card lines are unsecured commitments that are not legally binding. Management reviews credit card lines at least annually, and upon evaluation of the customers’ creditworthiness, the Corporation has the right to terminate or change certain terms of the credit card lines.
The Corporation uses various techniques to manage risk associated with these types of instruments that include collateral and/or adjusting commitment amounts based on the borrower’s financial condition;
BANK OF AMERICA CORPORATION AND SUBSIDIARIES
Notes to Consolidated Financial Statements—(Continued)
therefore, the total commitment amount does not necessarily represent the actual risk of loss or future cash requirements. For each of these types of instruments, the Corporation’s exposure to credit loss is represented by the contractual amount of these instruments.
Other Commitments
At December 31, 2004 and 2003, charge cards (nonrevolving card lines) to individuals and government entities guaranteed by the U.S. government in the amount of $10.9 billion and $13.7 billion, respectively, were not included in credit card line commitments in the previous table. The outstandings related to these charge cards were $205 million and $233 million, respectively.
At December 31, 2004, the Corporation had whole mortgage loan purchase commitments of $3.3 billion, of which $2.9 billion will settle in January 2005, and $430 million will settle in February 2005. At December 31, 2003, the Corporation had whole mortgage loan purchase commitments of $4.6 billion, all of which were settled in January and February 2004. At December 31, 2004 and 2003, the Corporation had no forward whole mortgage loan sale commitments.
The Corporation has entered into operating leases for certain of its premises and equipment. Commitments under these leases approximate $1.4 billion in 2005, $1.1 billion in 2006, $995 million in 2007, $854 million in 2008, $689 million in 2009 and $3.4 billion for all years thereafter.
Other Guarantees
The Corporation sells products that offer book value protection primarily to plan sponsors of Employee Retirement Income Security Act of 1974 (ERISA)-governed pension plans such as 401(k) plans, 457 plans, etc. The book value protection is provided on portfolios of intermediate/short-term investment grade fixed income securities and is intended to cover any shortfall in the event that plan participants withdraw funds when market value is below book value. The Corporation retains the option to exit the contract at any time. If the Corporation exercises its option, the purchaser can require the Corporation to purchase zero coupon bonds with the proceeds of the liquidated assets to assure the return of principal. To hedge its exposure, the Corporation imposes significant restrictions and constraints on the timing of the withdrawals, the manner in which the portfolio is liquidated and the funds are accessed, and the investment parameters of the underlying portfolio. These constraints, combined with structural protections, are designed to provide adequate buffers and guard against payments even under extreme stress scenarios. These guarantees are booked as derivatives and marked to market in the trading portfolio. At December 31, 2004 and 2003, the notional amount of these guarantees totaled $26.3 billion and $24.9 billion, respectively, with estimated maturity dates between 2006 and 2034. As of December 31, 2004 and 2003, the Corporation has not made a payment under these products, and management believes that the probability of payments under these guarantees is remote.
The Corporation also sells products that guarantee the return of principal to investors at a preset future date. These guarantees cover a broad range of underlying asset classes and are designed to cover the shortfall between the market value of the underlying portfolio and the principal amount on the preset future date. To manage its exposure, the Corporation requires that these guarantees be backed by structural and investment constraints and certain pre-defined triggers that would require the underlying assets or portfolio to be liquidated and invested in zero-coupon bonds that mature at the preset future date. The Corporation is required to fund any shortfall at the preset future date between the proceeds of the liquidated assets and the purchase price of the zero-coupon bonds. These guarantees are booked as derivatives and marked to market in the trading portfolio. At December 31, 2004 and 2003, the notional amount of these guarantees totaled $8.1 billion and $6.7 billion, respectively; however, at December 31, 2004 and 2003, the Corporation had not made a payment under these products, and management believes that the probability of payments under these guarantees is remote. These guarantees have various maturities ranging from 2006 to 2016.
BANK OF AMERICA CORPORATION AND SUBSIDIARIES
Notes to Consolidated Financial Statements—(Continued)
The Corporation has also written puts on highly rated fixed income securities. Its obligation under these agreements is to buy back the assets at predetermined contractual yields in the event of a severe market disruption in the short-term funding market. These agreements have various maturities ranging from two to seven years, and the pre-determined yields are based on the quality of the assets and the structural elements pertaining to the market disruption. The notional amount of these put options was $653 million and $666 million at December 31, 2004 and 2003, respectively. Due to the high quality of the assets and various structural protections, management believes that the probability of incurring a loss under these agreements is remote.
In the ordinary course of business, the Corporation enters into various agreements that contain indemnifications, such as tax indemnifications, whereupon payment may become due if certain external events occur, such as a change in tax law. These agreements typically contain an early termination clause that permits the Corporation to exit the agreement upon these events. The maximum potential future payment under indemnification agreements is difficult to assess for several reasons, including the inability to predict future changes in tax and other laws, the difficulty in determining how such laws would apply to parties in contracts, the absence of exposure limits contained in standard contract language and the timing of the early termination clause. Historically, any payments made under these guarantees have been de minimis. Management has assessed the probability of making such payments in the future as remote.
The Corporation has entered into additional guarantee agreements, including lease end obligation agreements, partial credit guarantees on certain leases, real estate joint venture guarantees, sold risk participation swaps and sold put options that require gross settlement. The maximum potential future payment under these agreements was approximately $2.1 billion and $1.3 billion at December 31, 2004 and 2003, respectively. The estimated maturity dates of these obligations are between 2005 and 2033. At December 31, 2004 and 2003, the Corporation had made no material payments under these products.
The Corporation provides credit and debit card processing services to various merchants, processing credit and debit card transactions on their behalf. In connection with these services, a liability may arise in the event of a billing dispute between the merchant and a cardholder that is ultimately resolved in the cardholder’s favor and the merchant defaults upon its obligation to reimburse the cardholder. A cardholder, through its issuing bank, generally has until the later of up to four months after the date a transaction is processed or the delivery of the product or service to present a chargeback to the Corporation as the merchant processor. If the Corporation is unable to collect this amount from the merchant, it bears the loss for the amount paid to the cardholder. In 2004 and 2003, the Corporation processed $143.1 billion and $71.8 billion, respectively, of transactions and recorded losses as a result of these chargebacks of $6 million in both years.
At December 31, 2004 and 2003, the Corporation held as collateral approximately $203 million and $182 million, respectively, of merchant escrow deposits which the Corporation has the right to set off against amounts due from the individual merchants. The Corporation also has the right to offset any payments with cash flows otherwise due to the merchant. Accordingly, the Corporation believes that the maximum potential exposure is not representative of the actual potential loss exposure. Management believes the maximum potential exposure for chargebacks would not exceed the total amount of merchant transactions processed through Visa and MasterCard for the last four months, which represents the claim period for the cardholder, plus any outstanding delayed-delivery transactions. As of December 31, 2004 and 2003, the maximum potential exposure totaled approximately $93.4 billion and $25.0 billion, respectively.
Within the Corporation’s brokerage business, the Corporation has contracted with third parties to provide clearing services that include underwriting margin loans to the Corporation’s clients. These contracts stipulate that the Corporation will indemnify the third parties for any margin loan losses that occur in their issuing margin to the Corporation’s clients. The maximum potential future payment under these indemnifications was $1.2 billion and $486 million at December 31, 2004 and 2003, respectively. Historically, any payments made under these indemnifications have not been material. As these margin loans are highly collateralized by the securities held by the brokerage clients, the Corporation has assessed
BANK OF AMERICA CORPORATION AND SUBSIDIARIES
Notes to Consolidated Financial Statements—(Continued)
the probability of making such payments in the future as remote. These indemnifications would end with the termination of the clearing contracts.
For additional information on recourse obligations related to residential mortgage loans sold and other guarantees related to securitizations, see Note 8 of the Consolidated Financial Statements.
Litigation and Regulatory Matters
In the ordinary course of business, the Corporation and its subsidiaries are routinely defendants in or parties to many pending and threatened legal actions and proceedings, including actions brought on behalf of various classes of claimants. In certain of these actions and proceedings, claims for substantial monetary damages are asserted against the Corporation and its subsidiaries, and certain of these actions and proceedings are based on alleged violations of consumer protection, securities, environmental, banking, employment and other laws.
In view of the inherent difficulty of predicting the outcome of such matters, particularly where the claimants seek very large or indeterminate damages or where the cases present novel legal theories or involve a large number of parties, the Corporation cannot state with confidence what the eventual outcome of the pending matters will be, what the timing of the ultimate resolution of these matters will be or what the eventual loss, fines or penalties related to each pending matter may be. Based on current knowledge, management does not believe that liabilities, if any, arising from pending litigation or regulatory matters, including the litigation and regulatory matters described below, will have a material adverse effect on the consolidated financial position or liquidity of the Corporation, but may be material to the Corporation’s operating results for any particular reporting period.
Adelphia Communications Corporation (Adelphia)
Bank of America, N.A. and Banc of America Securities LLC (BAS) are defendants, among other defendants, in a putative class action and other civil actions relating to Adelphia. The first of these actions was filed in June 2002; these actions have been consolidated for pre-trial purposes in the U.S. District Court for the Southern District of New York. BAS was a member of seven underwriting syndicates of securities issued by Adelphia, and Bank of America, N.A. was an agent and/or lender in connection with five credit facilities in which Adelphia subsidiaries were borrowers. Fleet National Bank and Fleet Securities, Inc. (FSI) are also named as defendants in certain of the actions. FSI was a member of three underwriting syndicates of securities issued by Adelphia, and Fleet National Bank was a lender in connection with four credit facilities in which Adelphia subsidiaries were borrowers. The complaints allege claims under the Securities Act of 1933, the Securities Exchange Act of 1934 and various state law theories. The complaints seek damages of unspecified amounts. Bank of America, N.A., BAS, Fleet National Bank and FSI have moved to dismiss all claims asserted against them, with the exception of certain claims brought under Sections 11 and 12 of the Securities Act of 1933. That motion is pending.
Bank of America, N.A., BAS, Fleet National Bank and FSI are also defendants in an adversary proceeding pending in the U.S. Bankruptcy Court for the Southern District of New York. The proceeding is brought by the Official Committee of Unsecured Creditors on behalf of Adelphia; however, the bankruptcy court has not yet given the Creditors’ Committee authority to bring this lawsuit. The lawsuit names over 400 defendants and asserts over 50 claims under federal statutes, including the Bank Holding Company Act, state common law and various provisions of the Bankruptcy Code. The Creditors’ Committee seeks avoidance and recovery of payments, equitable subordination, disallowance and recharacterization of claims and recovery of damages in an unspecified amount. The Official Committee of Equity Security Holders has filed a motion seeking to intervene in the adversary proceeding and to file its own complaint. The proposed complaint is similar to the Creditors’ Committee complaint, and also asserts claims under RICO and additional state law theories. Bank of America, N.A., BAS and FSI have filed objections to the standing of the Creditors’ and Equity Committees to bring such claims, and have also filed motions to dismiss. Those motions are pending.
BANK OF AMERICA CORPORATION AND SUBSIDIARIES
Notes to Consolidated Financial Statements—(Continued)
American Express
On November 15, 2004, American Express Travel Related Services Company (American Express) brought suit in the U.S. District Court for the Southern District of New York against the Visa and MasterCard associations, as well as several banks, including Bank of America, N.A. (USA) and the Corporation. American Express alleges that it has incurred damages in an unspecified amount by reason of certain MasterCard and Visa rules that allegedly restricted their member banks from issuing American Express-branded debit and credit cards. Motions to dismiss are pending. Enforcement of the MasterCard and Visa rules was enjoined by the court inUnited States v. Visa USA, et al.,in which none of the Corporation or its subsidiaries was a defendant.
Argentine Re-Dollarization
In December 2001, the Argentine Government issued a decree imposing limitations on the ability of FleetBoston bank customers in Argentina to withdraw funds from their accounts in Argentine banks (the corralito). Since the corralito was issued, a large number of customers of the FleetBoston Argentine operations (BankBoston Argentina) have filed complaints in a number of Argentine federal and provincial courts against BankBoston Argentina seeking to invalidate the corralito on constitutional grounds and withdraw their funds. Since 2002, Argentine courts have ordered many of these deposits to be paid out at original dollar value.
Enron Corporation (Enron)
The Corporation was named as a defendant, along with a number of other parties, in a putative consolidated class action pending in the U.S. District Court for the Southern District of Texas filed on April 8, 2002 entitledNewby v. Enron. The amended complaint alleges claims against the Corporation and BAS under Sections 11, 12 and 15 of the Securities Act of 1933 related to the role of BAS as an underwriter of two public offerings of Enron debt and as an initial purchaser in a private placement of debt issued by an Enron-affiliated company.
On July 2, 2004, the Corporation reached an agreement to settle the above litigation. Under the terms of the settlement, which is subject to court approval, the Corporation will make a payment of approximately $69 million to the settlement class inNewby v. Enron. The class consists of all persons who purchased or otherwise acquired securities issued by Enron during the period from October 19, 1998 to November 27, 2001. On January 18, 2005, the lead plaintiff filed a motion seeking preliminary approval of the settlement, and on February 4, 2005, the court granted preliminary approval of the settlement and set a hearing date of April 11, 2005 for final approval.
In addition, the Corporation and certain of its affiliates have been named as defendants or third-party defendants in various individual and putative class actions relating to Enron. These actions were either filed in or have been transferred to the U.S. District Court of the Southern District of Texas and consolidated or coordinated withNewby v. Enron. The complaints assert claims under federal securities laws, state securities laws and/or state common law or statutes, or for contribution. In nine cases, plaintiffs seek damages or contribution for damages ranging from at least $15,000 to $472 million from all defendants, including financial institutions, accounting firms, law firms and numerous individuals. In the remaining cases, the plaintiffs seek damages in unspecified amounts.
Fleet Specialist
On March 30, 2004, Fleet Specialist and certain other specialist firms entered into agreements with the SEC and the New York Stock Exchange (the NYSE) to settle charges that the firms violated certain federal securities laws and NYSE rules in the course of their specialist trading activity. The settlement, which involves no admission or denial of wrongdoing, includes disgorgement and civil penalties for Fleet Specialist totaling approximately $59.1 million, a censure, cease and desist order, and certain undertakings, including
BANK OF AMERICA CORPORATION AND SUBSIDIARIES
Notes to Consolidated Financial Statements—(Continued)
the retention of an independent consultant to review compliance systems, policies and procedures. Separately, putative class action complaints seeking unspecified damages have been filed in the U.S. District Court for the Southern District of New York against Fleet Specialist, FleetBoston, the Corporation, and other specialist firms (and their parent companies) on behalf of investors who traded stock on the NYSE between 1998 and 2003, and were allegedly disadvantaged by the improper practices of the specialist firms. These federal court actions have been consolidated. A multi-defendant motion to dismiss has been filed. The settlement with the SEC and NYSE does not resolve the putative class actions, although a portion of the payment is expected to be allocated to restitution for allegedly disadvantaged customers.
Foreign Currency
Bank of America, N.A. (USA) and the Corporation, together with Visa and MasterCard associations and several other banks, are defendants in a consolidated class action lawsuit pending in U.S. District Court for the Southern District of New York entitledIn re Currency Conversion Fee Antitrust Litigation. The plaintiff cardholders allege that Visa and MasterCard, together with their member banks, conspired to set the price of foreign currency conversion services on credit card transactions and that each bank failed to disclose the applicable price in compliance with the Truth in Lending Act resulting in damages to the class of an unspecified amount. By decision dated July 3, 2003, the court granted the motion of the Corporation and Bank of America, N.A. (USA) to compel arbitration of the claims asserted by Bank of America, N.A. (USA) cardholders. However, the court denied a motion brought by all defendants to dismiss the antitrust claims, so Bank of America, N.A. (USA) and the Corporation remain as defendants with respect to antitrust claims alleged on behalf of certain co-defendants’ cardholders. By order dated October 15, 2004, the court granted plaintiffs’ motion to certify a class of cardholders of the defendant banks who used MasterCard or Visa-branded credit cards for one or more transactions denominated in foreign currency.
In re Initial Public Offering Securities
Beginning in 2001, Robertson Stephens, Inc. (an investment banking subsidiary of FleetBoston that ceased operations during 2002), BAS, other underwriters, and various issuers and others, were named as defendants in purported class action lawsuits alleging violations of federal securities laws in connection with the underwriting of initial public offerings (IPOs) and seeking unspecified damages. Robertson Stephens, Inc. and BAS were named in certain of the 309 purported class actions that have been consolidated in the U.S. District Court for the Southern District of New York as In re Initial Public Offering Securities Litig. The plaintiffs contend that the defendants failed to make certain required disclosures, manipulated prices of IPO securities through, among other things, alleged agreements with institutional investors receiving allocations to purchase additional shares in the aftermarket, and false and misleading analyst reports. On October 13, 2004, the court granted in part and denied in part plaintiffs’ motions to certify as class actions six of 309 cases filed. The underwriter defendants are currently seeking a discretionary appeal of that decision in the U.S. Court of Appeals for the Second Circuit. Discovery is proceeding in the underlying actions.
In addition, the plaintiffs have reached a settlement with 298 of the issuer defendants in which the issuer defendants guaranteed that the plaintiffs will receive at least $1 billion in the settled actions and assigned to the plaintiffs the issuers’ interest in all claims against the underwriters for “excess compensation.” On February 15, 2005, the court conditionally approved the settlement, with a fairness hearing still to be scheduled. The plaintiffs have not reached a settlement with any of the underwriter defendants, including Robertson Stephens, Inc. and BAS.
Robertson Stephens, Inc. and other underwriters also have been named as defendants in class action lawsuits filed in the U.S. District Court for the Southern District of New York under the antitrust laws alleging that the underwriters conspired to manipulate the aftermarkets for IPO securities and to extract anticompetitive fees in connection with IPOs. Those antitrust lawsuits have been dismissed. Plaintiffs have appealed that decision to the Court of Appeals for the Second Circuit.
BANK OF AMERICA CORPORATION AND SUBSIDIARIES
Notes to Consolidated Financial Statements—(Continued)
Miller
On August 13, 1998, Bank of America, N.A.’s predecessor was named as a defendant in a class action filed in Superior Court of California, County of San Francisco entitledPaul J. Miller v. Bank of America, N.A.challenging its practice of debiting accounts that received, by direct deposit, governmental benefits to repay fees incurred in those accounts. The action alleges fraud, negligent misrepresentation and violations of certain California laws. On October 16, 2001, a class was certified consisting of more than one million California residents who have, had or will have, at any time after August 13, 1994, a deposit account with Bank of America, N.A. into which payments of public benefits are or have been directly deposited by the government. The case proceeded to trial on January 20, 2004.
On February 15, 2004, the jury found that Bank of America, N.A. violated certain California laws and imposed damages of approximately $75 million and awarded the class representative $275,000 in emotional distress damages. The jury also assessed a $1,000 penalty as to those members of the class suffering substantial economic or emotional harm as a result of the practice but did not determine which or how many class members are entitled to the penalty.
On December 30, 2004, the trial court issued a final ruling on claims tried to the court at the conclusion of the February 2004 jury trial. The ruling awards the plaintiff class restitution in the amount of $284 million, plus attorneys’ fees. The ruling also concludes that any class members whose account was wrongfully debited and suffered substantial emotional or economic harm is entitled to an additional $1,000 penalty, but did not determine which or how many class members are entitled to the penalty, and includes injunctive relief, which is temporarily stayed.
Once the jury verdict and final decision are entered as a judgment, Bank of America, N.A. will appeal to the California Court of Appeal, First Appellate District and move to stay the injunction pending appeal.
Mutual Fund Operations Matters
On March 15, 2004, the Corporation announced agreements in principle with the New York Attorney General (the NYAG) and the SEC to settle matters related to late trading and market timing of mutual funds. The Corporation agreed, without admitting or denying wrongdoing, to (1) pay $250 million in disgorgement and $125 million in civil penalties; (2) the issuance of an order against three subsidiaries of the Corporation, Banc of America Capital Management, LLC (BACAP), BACAP Distributors, LLC (BACAP Distributors), and BAS to cease and desist from violations of the federal securities laws, as well as the implementation of enhanced governance and compliance procedures; (3) retain an independent consultant to review BACAP’s, BACAP Distributor’s and BAS applicable compliance, control and other policies and procedures; and (4) exit the unaffiliated introducing broker/dealer clearing business. In addition, the agreement with the NYAG provides for reduction of mutual fund management fees of the Nations Funds by $80 million over five years. These settlements were finalized with the NYAG and the SEC on February 9, 2005.
On February 24, 2004, the SEC filed a civil action in the U.S. District Court for the District of Massachusetts against two FleetBoston subsidiaries, Columbia Management Advisors, Inc. and Columbia Funds Distributor, Inc. (the Columbia Subsidiaries), alleging that the Columbia Subsidiaries allowed certain customers to engage in short-term or excessive trading without disclosing this fact in the relevant fund prospectuses. The complaint alleged violations of federal securities laws in relation to at least nine trading arrangements pertaining to these customers during the period 1998-2003, and requested injunctive and monetary relief. A similar action was filed the same day in a state court in New York by the NYAG, claiming relief under New York state statutes. On March 15, 2004, FleetBoston and its subsidiaries announced agreements in principle with the NYAG and the SEC, agreeing, without admitting or denying wrongdoing, to (1) pay $70 million in disgorgement and $70 million in civil penalties; (2) the issuance of an order requiring the Columbia Subsidiaries to cease and desist from violations of the federal securities laws, as well as the implementation of enhanced governance and compliance procedures; and (3) retain an independent consultant to review the Columbia Subsidiaries’ applicable compliance, control and other policies and
BANK OF AMERICA CORPORATION AND SUBSIDIARIES
Notes to Consolidated Financial Statements—(Continued)
procedures. In addition, the agreement with the NYAG provides for reduction of mutual fund management fees of the Columbia funds by $80 million over five years. These settlements were finalized with the NYAG and the SEC on February 9, 2005.
On February 9, 2005, the Corporation entered an agreement with the Federal Reserve Bank of Richmond, and Bank of America, N.A. entered an agreement with the Office of the Comptroller of the Currency (OCC). Under the agreements, the Corporation and Bank of America, N.A. agreed to continue with existing plans to implement remedial actions. The federal banking regulators did not impose any monetary penalties or fines under the agreements.
The Corporation is continuing to respond to inquiries from federal and state regulatory and law enforcement agencies concerning mutual fund related matters.
Private lawsuits seeking unspecified damages concerning mutual fund trading against the Corporation and its pre-FleetBoston-merger subsidiaries include putative class actions purportedly brought on behalf of shareholders in Nations Funds mutual funds, derivative actions brought on behalf of one or more Nations Funds mutual funds by Nations Funds shareholders, putative ERISA class actions brought on behalf of participants in the Corporation’s 401(k) plan, derivative actions brought against the Corporation’s directors on behalf of the Corporation by shareholders in the Corporation, class actions and derivative actions brought by shareholders in third-party mutual funds alleging that the Corporation or its subsidiaries facilitated improper trading in those funds, and a private attorney general action brought under California law. The lawsuits filed to date with respect to FleetBoston and its subsidiaries include putative class actions purportedly brought on behalf of shareholders in Columbia mutual funds, derivative actions brought on behalf of one or more Columbia mutual funds or trusts by Columbia mutual fund shareholders, and an individual shareholder action.
On February 20, 2004, the Judicial Panel on Multidistrict Litigation (MDL Panel) ordered that all lawsuits pending in federal court with respect to alleged late trading or market timing in mutual funds be transferred to the U.S. District Court for the District of Maryland for coordinated pretrial proceedings. The private lawsuits have been transferred to the court with the exception of one case that was remanded to a state court in Illinois and two cases where motions to remand to state court remain pending. On September 29, 2004, plaintiffs filed consolidated amended complaints in the U.S. District Court for the District of Maryland. Motions to dismiss the consolidated amended complaints are to be filed on February 25, 2005.
Parmalat Finanziaria S.p.A.
On December 24, 2003, Parmalat Finanziaria S.p.A. was admitted into insolvency proceedings in Italy, known as “extraordinary administration.” The Corporation, through certain of its subsidiaries, including Bank of America, N.A., provided financial services and extended credit to Parmalat and its related entities. On June 21, 2004, Extraordinary Commissioner Dr. Enrico Bondi filed with the Italian Ministry of Production Activities a plan of reorganization for the restructuring of the companies of the Parmalat group that are included in the Italian extraordinary administration proceeding.
In July 2004, the Italian Ministry of Production Activities approved a restructuring plan, as amended, for the Parmalat group companies that are included in the Italian extraordinary administration proceeding. This plan will be voted on by creditors whose claims the Court of Parma recognizes as valid. Voting is expected to take place by June 30, 2005. In August 2004, the Extraordinary Commissioner filed objections to certain claims with the Court of Parma, Italy. In that filing, the Extraordinary Commissioner rejected all the Corporation’s claims on various grounds. On September 18, 2004, the Corporation filed its responses to the filing with the Court of Parma and on December 16, 2004, the court admitted and accepted the majority of the Corporation’s claims. The Corporation will appeal the court’s decision regarding the portion of its claims which were not admitted.
On January 8, 2004, The Public Prosecutor’s Office for the Court of Milan, Italy identified Luca Sala, a former employee, as a subject of its investigation into the Parmalat matter. On March 2, 2004, the Public
BANK OF AMERICA CORPORATION AND SUBSIDIARIES
Notes to Consolidated Financial Statements—(Continued)
Prosecutor further advised the Corporation that the activities of the Corporation and two additional employees in Milan, Italy, Luis Moncada and Antonio Luzi, were also under investigation. These employees concurrently submitted letters of resignation.
On May 26, 2004, the Public Prosecutor’s Office filed criminal charges against the Corporation’s former employees, Antonio Luzi, Luis Moncada, and Luca Sala, alleging market manipulation in connection with Parmalat. The Public Prosecutor’s Office also filed a related charge against the Corporation asserting administrative liability based on an alleged failure to maintain an organizational model sufficient to prevent the alleged criminal activities of its former employees.
Preliminary hearings regarding the administrative charge against the Corporation and the criminal charges against the former employees have been held in the Court of Milan, Italy, the first of which took place on October 5, 2004. At this and subsequent hearings, a number of persons filed requests to participate in the proceedings as damaged civil parties under Italian law. Various preliminary hearings and pre-trial proceedings are on-going.
On March 5, 2004, a First Amended Complaint was filed in a putative securities class action pending in the U.S. District Court for the Southern District of New York entitledSouthern Alaska Carpenters Pension Fund et al. v. Bonlat Financing Corporation et al., which names the Corporation as a defendant. The First Amended Complaint alleges causes of action against the Corporation for violations of the federal securities laws based upon the Corporation’s alleged role in the alleged Parmalat accounting fraud. This action was consolidated with several other class actions filed against multiple defendants, and on October 18, 2004, an Amended Consolidated Complaint was filed. Unspecified damages are being sought. The Corporation filed a motion to dismiss the Amended Consolidated Complaint. The motion to dismiss is pending.
On October 7, 2004, Enrico Bondi filed an action in the U.S. District Court for the Western District of North Carolina against the Corporation and various related entities, entitledDr. Enrico Bondi, Extraordinary Commissioner of Parmalat Finanziaria, S.p.A., et al v. Bank of America Corporation, et al(the Bondi Action). The complaint alleges federal and state RICO claims and various state law claims, including fraud. The plaintiff seeks $10 billion in damages. A motion to dismiss is pending.
The Corporation has requested that the MDL Panel consolidate and/or coordinate pre-trial proceedings in the Bondi Action with other lawsuits filed by Enrico Bondi against non-Bank of America defendants. On December 14, 2004, the Corporation requested that the Bondi Action be transferred to the federal court in New York for pre-trial purposes. That request is pending before the MDL Panel.
Pension Plan Matters
The Corporation is a defendant in a putative class action, entitledAnita Pothier, et al. v. Bank of America Corp., et al., which was filed in June 2004 in the U.S. District Court for the Southern District of Illinois. The action is brought on behalf of all participants in or beneficiaries of any cash balance defined benefit plan maintained by the Corporation or its predecessors. The complaint names as defendants the Corporation, Bank of America, N.A., The Bank of America Pension Plan (formerly known as the NationsBank Cash Balance Plan) and its predecessor plans, The Bank of America 401(k) Plan (formerly known as the NationsBank 401(k) Plan) and its predecessor plans, the Bank of America Corporation Corporate Benefits Committee and various members thereof, various current and former directors of the Corporation and certain of its predecessors, and PricewaterhouseCoopers LLPLLP. The named plaintiffs are alleged to be current or former participants in one or more employee benefit pension plans sponsored or participated in by the Corporation or its predecessors.
The complaint alleges the defendants violated various provisions of ERISA, including that the cash balance formula of The Bank of America Pension Plan and a predecessor plan, the BankAmerica Pension Plan, violated ERISA’s defined benefit pension plan standards. In addition, the complaint alleges age discrimination in the design and operation of the cash balance plans at issue, improper benefit to the
BANK OF AMERICA CORPORATION AND SUBSIDIARIES
Notes to Consolidated Financial Statements—(Continued)
Corporation and its predecessors, interference with the attainment of pension rights, and various prohibited transactions and fiduciary breaches. The complaint further alleges that certain voluntary transfers of assets by participants in The Bank of America 401(k) Plan and certain predecessor plans to The Bank of America Pension Plan violated ERISA.
The complaint alleges that the participants in these plans are entitled to greater benefits and seeks declaratory relief, monetary relief in an unspecified amount, equitable relief, including an order reforming The Bank of America Pension Plan, attorneys’ fees and interest.
On February 9, 2005, the defendants in the Pothier action moved to transfer the venue of the Pothier action to the U.S. District Court for the Western District of North Carolina and to dismiss the complaint. These motions are pending. On February 8, 2005, plaintiffs informed the court that they intend to file a motion for partial summary judgment with respect to their claim relating to the calculation of lump sum benefits under the NationsBank Cash Balance Plan and/or The Bank of America Pension Plan. On February 18, 2005, one of the named plaintiffs moved to certify a class with respect to that claim. The motion for class certification is pending.
The IRS is conducting an audit of the 1998 and 1999 tax returns of The Bank of America Pension Plan and The Bank of America 401(k) Plan. This audit includes a review of voluntary transfers by participants of 401(k) plan assets to The Bank of America Pension Plan and whether such transfers were in accordance with applicable law. By letter dated December 10, 2004, the IRS advised the Corporation that the IRS has tentatively concluded that the voluntary transfers of participant accounts from The Bank of America 401(k) Plan to The Bank of America Pension Plan violated the anti-cutback rule of Section 411(d)(6) of the Internal Revenue Code. The Corporation is entitled to a conference of right to discuss this tentative conclusion before the IRS reaches a final decision, and the Corporation intends to exercise this right. The Corporation believes that it could be approximately one to two years before these IRS audit issues are resolved.
On September 29, 2004, a separate putative class action, entitledDonna C. Richards vs. FleetBoston Financial Corp. and the FleetBoston Financial Pension Plan(Fleet Pension Plan), was filed in the U.S. District Court for the District of Connecticut on behalf of any and all persons who are former or current Fleet employees who on December 31, 1996, were not at least age 50 with 15 years of vesting service and who participated in the Fleet Pension Plan before January 1, 1997, and who have participated in the Fleet Pension Plan at any time since January 1, 1997.
The complaint alleges that FleetBoston or its predecessor violated ERISA by amending the Fleet Financial Group, Inc. Pension Plan (a predecessor to the Fleet Pension Plan) to add a cash balance benefit formula without notifying participants that the amendment significantly reduced their plan benefits, by conditioning the amount of benefits payable under the Fleet Pension Plan upon the form of benefit elected, by reducing the rate of benefit accruals on account of age, and by failing to inform participants of the correct amount of their pensions and related claims. The complaint also alleges that the Fleet Pension Plan violates the “anti-backloading” rule of ERISA.
The complaint seeks equitable and remedial relief, including a declaration that the cash balance amendment to the Fleet Pension Plan was ineffective, additional unspecified benefit payments, attorneys’ fees and interest.
On December 28, 2004, plaintiff filed a motion for class certification. On January 25, 2005, the defendants in the Richards case moved to dismiss the action. These motions are pending.
WorldCom, Inc. (WorldCom)
BAS, Banc of America Securities Limited (BASL), FSI, other underwriters of WorldCom bonds issued in 2000 and 2001, and other parties have been named as defendants in a class action lawsuit filed in the U.S. District Court for the Southern District of New York entitledWorldCom Securities Litigation. The
BANK OF AMERICA CORPORATION AND SUBSIDIARIES
Notes to Consolidated Financial Statements—(Continued)
complaint alleges claims against BAS and Fleet under Sections 11 and 12 of the Securities Act of 1933 in connection with 2000 (BAS) and 2001 (BAS and Fleet) public bond offerings and is brought on behalf of purchasers and acquirers of bonds issued in or traceable to these offerings. On October 24, 2003, the court certified a class consisting of “all persons and entities who purchased or otherwise acquired publicly-traded securities of WorldCom during the period beginning April 29, 1999 through and including June 25, 2002 and who were injured thereby.” Plaintiffs seek damages up to the amount of the public bond offerings underwritten by BAS and FSI, allegedly totaling approximately $1.5 billion. The court granted BASL’s motion to dismiss all claims against BASL. On December 15, 2004, the court issued a ruling, which granted in part and denied in part the underwriters’ summary judgment motion and the lead plaintiff’s summary judgment motion. On December 30, 2004, the underwriters filed a motion for reconsideration on the issue of plaintiff standing and a motion seeking resolution of certain issues not decided by the summary judgment ruling. These motions are pending. A trial date has been scheduled for March 17, 2005.
In addition, the Corporation, BAS, BASL, Fleet and Robertson Stephens International Limited (RSIL), along with other persons and entities, have been named as defendants in numerous individual actions that were filed in either federal or state courts arising out of alleged accounting irregularities of the books and records of WorldCom. Plaintiffs in these actions are typically institutional investors, including state pension funds, who allegedly purchased debt securities issued by WorldCom pursuant to public offerings in 1997, 1998, 2000 or 2001 and a private offering in December 2000. The majority of the complaints assert claims under Section 11 of the Securities Act of 1933, and some complaints include additional claims under the Securities Act of 1933 and/or claims under the Securities Exchange Act of 1934, state securities laws, other state statutes and common law theories. The complaints seek damages of unspecified amounts. Most of these cases were filed in state court, subsequently removed by defendants to federal courts and then transferred by the MDL Panel to the court where they were consolidated with WorldCom Securities Litigation for pre-trial purposes. Certain plaintiffs in these actions appealed the court’s decision denying their requests that the court remand their actions to the state courts in which they were originally filed. The Court of Appeals for the Second Circuit affirmed the court in May 2004. Certain plaintiffs petitioned the U.S. Supreme Court for a writ of certiorari, which the U.S. Supreme Court denied on January 10, 2005.
Three other such actions, one in Illinois state court, another in Tennessee state court, and another in Alabama state court remain pending.
Other Regulatory Matters
In the course of its business, the Corporation is subject to regulatory examinations, information gathering requests, inquiries and investigations. BAS and Banc of America Investment Services, Inc. (BAI) are registered broker/dealers and are subject to regulation by the SEC, the National Association of Securities Dealers, the New York Stock Exchange and state securities regulators. In connection with several formal and informal inquiries by those agencies, BAS and BAI have received numerous requests, subpoenas and orders for documents, testimony and information in connection with various aspects of their regulated activities.
The SEC is currently conducting a formal investigation with respect to certain trading and research-related activities of BAS during the period 1999 through 2001. The investigation is continuing, and the SEC staff has recently indicated informally that it is considering whether to recommend enforcement action against BAS with respect to certain of the matters under investigation.
Note 13—Shareholders’ Equity and Earnings Per Common Share
During the second quarter of 2004, the Board approved a 2-for-1 stock split in the form of a common stock dividend and increased the quarterly cash dividends 12.5 percent from $0.40 to $0.45 per post-split share. The common stock dividend was effective August 27, 2004 to common shareholders of record on August 6, 2004 and the Selected Quarterlycash dividend was effective September 24, 2004 to common shareholders of record on September 3, 2004. All prior period common share and related per common share information has been restated to reflect the 2-for-1 stock split.
BANK OF AMERICA CORPORATION AND SUBSIDIARIES
Notes to Consolidated Financial DataStatements—(Continued)
The following table presents the monthly share repurchase activity for the three months and years ended December 31, 2004, 2003 and 2002, including total common shares repurchased under announced programs, weighted average per share price and the remaining buyback authority under announced programs.
| Number of Common Shares Repurchased under Announced Programs(1) | Weighted Average Per Share Price(1) | Remaining Buyback Authority under Announced Programs(2) | ||||||||
(Dollars in millions, except per share information; shares in thousands) | Dollars | Shares | ||||||||
Three months ended March 31, 2004 | 24,306 | $ | 40.03 | $ | 12,378 | 204,178 | ||||
Three months ended June 30, 2004 | 49,060 | 41.07 | 7,978 | 155,118 | ||||||
Three months ended September 30, 2004 | 40,430 | 43.56 | 6,217 | 114,688 | ||||||
October 1-31, 2004 | 16,102 | 44.24 | 5,505 | 98,586 | ||||||
November 1-30, 2004 | 11,673 | 45.84 | 4,969 | 86,913 | ||||||
December 1-31, 2004 | 6,288 | 46.32 | 4,678 | 80,625 | ||||||
Three months ended December 31, 2004 | 34,063 | 45.17 | ||||||||
Year ended December 31, 2004 | 147,859 | 42.52 | ||||||||
| Number of Common Shares Repurchased under Announced Programs(3) | Weighted Average Per Share Price(3) | Remaining Buyback Authority under Announced Programs(4) | ||||||||
(Dollars in millions, except per share information; shares in thousands) | Dollars | Shares | ||||||||
Three months ended March 31, 2003 | 36,800 | $ | 34.24 | $ | 13,930 | 270,370 | ||||
Three months ended June 30, 2003 | 60,600 | 37.62 | 10,610 | 209,770 | ||||||
Three months ended September 30, 2003 | 50,230 | 40.32 | 8,585 | 159,540 | ||||||
October 1-31, 2003 | 13,800 | 40.28 | 8,029 | 145,740 | ||||||
November 1-30, 2003 | 64,212 | 37.68 | 5,610 | 81,528 | ||||||
December 1-31, 2003 | 33,044 | 38.10 | 4,351 | 48,484 | ||||||
Three months ended December 31, 2003 | 111,056 | 38.13 | ||||||||
Year ended December 31, 2003 | 258,686 | 37.88 | ||||||||
| Number of Common Shares Repurchased under Announced Programs(5) | Weighted Average Per Share Price(5) | Remaining Buyback Authority under Announced Programs(6) | ||||||||
(Dollars in millions, except per share information; shares in thousands) | Dollars | Shares | ||||||||
Three months ended March 31, 2002 | 62,414 | $ | 31.33 | $ | 8,200 | 202,556 | ||||
Three months ended June 30, 2002 | 102,430 | 36.36 | 4,476 | 100,126 | ||||||
Three months ended September 30, 2002 | 33,556 | 33.31 | 3,359 | 66,570 | ||||||
October 1-31, 2002 | 15,200 | 34.29 | 2,837 | 51,370 | ||||||
November 1-30, 2002 | 4,200 | 35.02 | 2,690 | 47,170 | ||||||
December 1-31, 2002 | — | — | 2,690 | 47,170 | ||||||
Three months ended December 31, 2002 | 19,400 | 34.45 | ||||||||
Year ended December 31, 2002 | 217,800 | 34.28 | ||||||||
| (1) | Reduced Shareholders’ Equity by $6.3 billion and increased diluted earnings per common share by $0.06 in 2004. These repurchases were partially offset by the issuance of approximately 121 million shares of common stock under employee plans, which increased Shareholders’ Equity by $3.9 billion, net of $127 of deferred compensation related to restricted stock awards, and decreased diluted earnings per common share by $0.06 in 2004. |
| (2) | On January 22, 2003, the Board authorized a stock repurchase program of up to 260 million shares of the Corporation’s common stock at an aggregate cost of $12.5 billion. This repurchase plan was completed during the second quarter of 2004. On January 28, |
BANK OF AMERICA CORPORATION AND SUBSIDIARIES
Notes to Consolidated Financial Statements—(Continued)
2004, the Board authorized a stock repurchase program of up to 180 million shares of the Corporation’s common stock at an aggregate cost not to exceed $9.0 billion and to be completed within a period of 18 months. |
| (3) | Reduced Shareholders’ Equity by $9.8 billion and increased diluted earnings per common share by $0.11 in 2003. These repurchases were partially offset by the issuance of approximately 139 million shares of common stock under employee plans, which increased Shareholders’ Equity by $4.2 billion, net of $123 of deferred compensation related to restricted stock awards, and decreased diluted earnings per common share by $0.08 in 2003. |
| (4) | On December 11, 2001, the Board authorized a stock repurchase program of up to 260 million shares of the Corporation’s common stock at an aggregate cost of up to $10.0 billion. This repurchase plan was completed during the second quarter of 2003. On January 22, 2003, the Board authorized a stock repurchase program of up to 260 million shares of the Corporation’s common stock at an aggregate cost of $12.5 billion. This repurchase plan was completed during the second quarter of 2004. |
| (5) | Reduced Shareholders’ Equity by $7.5 billion and increased diluted earnings per common share by $0.11 in 2002. These repurchases were partially offset by the issuance of approximately 100 million shares of common stock under employee plans, which increased Shareholders' Equity by $2.6 billion and decreased diluted earnings per common share by $0.06 in 2002. |
| (6) | On July 26, 2000, the Board authorized a stock repurchase program of up to 200 million shares of the Corporation’s common stock at an aggregate cost of up to $7.5 billion. This repurchase plan was completed during the first quarter of 2002. On December 11, 2001, the Board authorized a stock repurchase program of up to 260 million shares of the Corporation’s common stock at an aggregate cost of up to $10.0 billion. This repurchase plan was completed during the second quarter of 2003. |
We will continue to repurchase shares, from time to time, in Table XIXthe open market or in private transactions through our previously approved repurchase plans.
At December 31, 2004, the Corporation had no shares issued and outstanding of ESOP Convertible Preferred Stock, Series C (ESOP Preferred Stock). ESOP Preferred Stock in the amounts of $54 million, $4 million and $7 million for 2004, 2003 and 2002, respectively, was converted into the Corporation’s common stock at a ratio of 3.36 shares of the Statistical Financial Information.Corporation’s common stock.
At December 31, 2004, the Corporation had 690,000 shares authorized and 382,450 shares, or $95 million, outstanding of Bank of America 6.75% Perpetual Preferred Stock with a stated value of $250 per share. Ownership is held in the form of depositary shares paying dividends quarterly at an annual rate of 6.75 percent. On or after April 15, 2006, the Corporation may redeem Bank of America 6.75% Perpetual Preferred Stock, in whole or in part, at its option, at $250 per share, plus accrued and unpaid dividends.
The Corporation also had 805,000 shares authorized and 700,000 shares, or $175 million, outstanding of Bank of America Fixed/Adjustable Rate Cumulative Preferred Stock with a stated value of $250 per share. Ownership is held in the form of depositary shares paying dividends quarterly at an annual rate of 6.60 percent through April 1, 2006. After April 1, 2006, the rate will adjust based on a U.S. Treasury security plus 50 bps. On or after April 1, 2006, the Corporation may redeem Bank of America Fixed/Adjustable Rate Cumulative Preferred Stock, in whole or in part, at its option, at $250 per share, plus accrued and unpaid dividends.
In addition to the preferred stock described above, the Corporation had 35,045 shares authorized and 7,739 shares, or $1 million, outstanding of the Series B Preferred Stock with a stated value of $100 per share paying dividends quarterly at an annual rate of 7.00 percent. The Corporation may redeem the Series B Preferred Stock, in whole or in part, at its option, at $100 per share, plus accrued and unpaid dividends.
All preferred stock outstanding has preference over our common stock with respect to the payment of dividends and distribution of our assets in the event of a liquidation or dissolution. Except in certain circumstances, the holders of preferred stock have no voting rights.
BANK OF AMERICA CORPORATION AND SUBSIDIARIES
Notes to Consolidated Financial Statements—(Continued)
The following table presents the changes in Accumulated OCI for 2004 and 2003.
| 2004 | 2003 | |||||||||||||||||||||||
| (Dollars in millions) | Pre-tax Amount | Income Tax Expense (Benefit) | After-tax Amount | Pre-tax Amount | Income Tax Expense (Benefit) | After-tax Amount | ||||||||||||||||||
Balance, January 1 | $ | (3,242 | ) | $ | (1,094 | ) | $ | (2,148 | ) | $ | 1,944 | $ | 712 | $ | 1,232 | |||||||||
Net unrealized gains (losses)(1) | 1,691 | 547 | 1,144 | (3,774 | ) | (1,314 | ) | (2,460 | ) | |||||||||||||||
Less: Net realized gains recorded to net income | 2,513 | 930 | 1,583 | 1,412 | 492 | 920 | ||||||||||||||||||
Balance, December 31 | $ | (4,064 | ) | $ | (1,477 | ) | $ | (2,587 | ) | $ | (3,242 | ) | $ | (1,094 | ) | $ | (2,148 | ) | ||||||
| (1) | Net unrealized gains (losses) include the valuation changes of AFS debt and marketable equity securities, foreign currency translation adjustments, derivatives, and other. |
The calculation of earnings per common share and diluted earnings per common share for 2004, 2003 and 2002 is presented below. See Note 1 of the Consolidated Financial Statements for a discussion on the calculation of earnings per common share.
| (Dollars in millions, except per share information; shares in thousands) | 2004 | 2003 | 2002 | |||||||||
Earnings per common share | ||||||||||||
Net income | $ | 14,143 | $ | 10,810 | $ | 9,249 | ||||||
Preferred stock dividends | (16 | ) | (4 | ) | (5 | ) | ||||||
Net income available to common shareholders | $ | 14,127 | $ | 10,806 | $ | 9,244 | ||||||
Average common shares issued and outstanding | 3,758,507 | 2,973,407 | 3,040,085 | |||||||||
Earnings per common share | $ | 3.76 | $ | 3.63 | $ | 3.04 | ||||||
Diluted earnings per common share | ||||||||||||
Net income available to common shareholders | $ | 14,127 | $ | 10,806 | $ | 9,244 | ||||||
Convertible preferred stock dividends | 2 | 4 | 5 | |||||||||
Net income available to common shareholders and assumed conversions | $ | 14,129 | $ | 10,810 | $ | 9,249 | ||||||
Average common shares issued and outstanding | 3,758,507 | 2,973,407 | 3,040,085 | |||||||||
Dilutive potential common shares(1, 2) | 65,436 | 56,949 | 90,850 | |||||||||
Total diluted average common shares issued and outstanding | 3,823,943 | 3,030,356 | 3,130,935 | |||||||||
Diluted earnings per common share | $ | 3.69 | $ | 3.57 | $ | 2.95 | ||||||
| (1) | For 2004, 2003 and 2002, average options to purchase 10 million, 19 million and 45 million shares, respectively, were outstanding but not included in the computation of earnings per common share because they were antidilutive. |
| (2) | Includes incremental shares from assumed conversions of convertible preferred stock, restricted stock units, restricted stock shares and stock options. |
BANK OF AMERICA CORPORATION AND SUBSIDIARIES
Notes to Consolidated Financial Statements—(Continued)
Note 14—Regulatory Requirements and Restrictions
The Board of Governors of the Federal Reserve System (FRB) requires the Corporation’s banking subsidiaries to maintain reserve balances based on a percentage of certain deposits. Average daily reserve balances required by the FRB were $6.9 billion and $4.1 billion for 2004 and 2003, respectively. Currency and coin residing in branches and cash vaults (vault cash) are used to partially satisfy the reserve requirement. The average daily reserve balances, in excess of vault cash, held with the Federal Reserve Bank amounted to $70 million and $317 million for 2004 and 2003, respectively.
The primary source of funds for cash distributions by the Corporation to its shareholders is dividends received from its banking subsidiaries. Bank of America, N.A. and Fleet National Bank declared and paid dividends of $5.9 billion and $1.3 billion, respectively, for 2004 to the parent. In 2005, Bank of America, N.A. and Fleet National Bank can declare and pay dividends to the parent of $4.7 billion and $790 million plus an additional amount equal to their net profits for 2005, as defined by statute, up to the date of any such dividend declaration. The other subsidiary national banks can initiate aggregate dividend payments in 2005 of $2.6 billion plus an additional amount equal to their net profits for 2005, as defined by statute, up to the date of any such dividend declaration. The amount of dividends that each subsidiary bank may declare in a calendar year without approval by the OCC is the subsidiary bank’s net profits for that year combined with its net retained profits, as defined, for the preceding two years.
The FRB, the OCC and the Federal Deposit Insurance Corporation (collectively, the Agencies) have issued regulatory capital guidelines for U.S. banking organizations. Failure to meet the capital requirements can initiate certain mandatory and discretionary actions by regulators that could have a material effect on the Corporation’s financial statements. At December 31, 2004 and 2003, the Corporation and Bank of America, N.A. were classified as well-capitalized under this regulatory framework. At December 31, 2004, Fleet National Bank was classified as well-capitalized under this regulatory framework. There have been no conditions or events since December 31, 2004 that management believes have changed the Corporation’s, Bank of America, N.A.’s or Fleet National Bank’s capital classifications.
The regulatory capital guidelines measure capital in relation to the credit and market risks of both on- and off-balance sheet items using various risk weights. Under the regulatory capital guidelines, Total Capital consists of three tiers of capital. Tier 1 Capital includes Common Shareholders’ Equity, Trust Securities, minority interests and qualifying Preferred Stock, less Goodwill and other adjustments. Tier 2 Capital consists of Preferred Stock not qualifying as Tier 1 Capital, mandatory convertible debt, limited amounts of subordinated debt, other qualifying term debt, the allowance for credit losses up to 1.25 percent of risk-weighted assets and other adjustments. Tier 3 Capital includes subordinated debt that is unsecured, fully paid, has an original maturity of at least two years, is not redeemable before maturity without prior approval by the FRB and includes a lock-in clause precluding payment of either interest or principal if the payment would cause the issuing bank’s risk-based capital ratio to fall or remain below the required minimum. Tier 3 Capital can only be used to satisfy the Corporation’s market risk capital requirement and may not be used to support its credit risk requirement. At December 31, 2004 and 2003, the Corporation had no subordinated debt that qualified as Tier 3 Capital.
The capital treatment of Trust Securities is currently under review by the FRB due to the issuing trust companies being deconsolidated under FIN 46R. On May 6, 2004, the FRB proposed to allow Trust Securities to continue to qualify as Tier 1 Capital with revised quantitative limits that would be effective after a three-year transition period. As a result, the Corporation will continue to report Trust Securities in Tier 1 Capital. In addition, the FRB is proposing to revise the qualitative standards for capital instruments included in regulatory capital. The proposed quantitative limits and qualitative standards are not expected to have a material impact to the Corporation’s current Trust Securities position included in regulatory capital.
BANK OF AMERICA CORPORATION AND SUBSIDIARIES
Notes to Consolidated Financial Statements—(Continued)
On July 28, 2004, the FRB and other regulatory agencies issued the Final Capital Rule for Consolidated Asset-backed Commercial Paper Program Assets (the Final Rule). The Final Rule allows companies to exclude from risk-weighted assets, the assets of consolidated ABCP conduits when calculating Tier 1 and Total Risk-based Capital ratios. The Final Rule also requires that liquidity commitments provided by the Corporation to ABCP conduits, whether consolidated or not, be included in the capital calculations. The Final Rule was effective September 30, 2004. There was no material impact to Tier 1 and Total Risk-based Capital as a result of the adoption of this rule.
To meet minimum, adequately-capitalized regulatory requirements, an institution must maintain a Tier 1 Capital ratio of four percent and a Total Capital ratio of eight percent. A well-capitalized institution must generally maintain capital ratios 200 bps higher than the minimum guidelines. The risk-based capital rules have been further supplemented by a leverage ratio, defined as Tier 1 Capital divided by adjusted quarterly average Total Assets, after certain adjustments. The leverage ratio guidelines establish a minimum of three percent. Banking organizations must maintain a leverage capital ratio of at least five percent to be classified as well-capitalized. As of December 31, 2004, the Corporation was classified as well-capitalized for regulatory purposes, the highest classification.
Net Unrealized Gains (Losses) on AFS Debt Securities, Net Unrealized Gains on AFS Marketable Equity Securities and the Net Unrealized Gains (Losses) on Derivatives included in Shareholders’ Equity at December 31, 2004 and 2003, are excluded from the calculations of Tier 1 Capital and leverage ratios. The Total Capital ratio excludes all of the above with the exception of up to 45 percent of Net Unrealized Gains on AFS Marketable Equity Securities.
Regulatory Capital Developments
On June 26, 2004, the Basel Committee on Banking Supervision, consisting of an international consortium of central banks and bank supervisors, published the framework for a new set of risk-based capital standards (Basel II). Anticipating this event, in August 2003, the U.S. banking regulators had already issued an advance notice of proposed rulemaking to address issues in advance of publishing their proposed rules incorporating the new Basel II standards. Since then, the regulatory agencies have issued extensive supervisory guidance on the proposed standards. A notice of proposed rule-making covering possible revisions to risk-based capital regulations relating to the framework is expected in mid-2005; and final rules are expected by mid-2006. The Corporation and other large internationally active U.S. banks and bank holding companies will be expected to implement the framework’s “advanced approaches”—the advanced internal ratings-based approach for measuring credit risk and the advanced measurement approaches for operational risk—by year-end 2007. The Corporation is in the process of finalizing its plans to address Basel II.
BANK OF AMERICA CORPORATION AND SUBSIDIARIES
Notes to Consolidated Financial Statements—(Continued)
The following table presents the regulatory risk-based capital ratios, actual capital amounts and minimum required capital amounts for the Corporation, Bank of America, N.A. and Bank of America, N.A. (USA) at December 31, 2004 and 2003, and for Fleet National Bank at December 31, 2004:
| December 31 | ||||||||||||||||||
| 2004 | 2003 | |||||||||||||||||
| Actual | Minimum | Actual | Minimum | |||||||||||||||
| (Dollars in millions) | Ratio | Amount | Required(1) | Ratio | Amount | Required(1) | ||||||||||||
Risk-based capital | ||||||||||||||||||
Tier 1 | ||||||||||||||||||
Bank of America Corporation | 8.10 | % | $ | 64,281 | $ | 31,741 | 7.85 | % | $ | 44,050 | $ | 22,452 | ||||||
Bank of America, N.A. | 8.29 | 46,891 | 22,614 | 8.73 | 42,030 | 19,247 | ||||||||||||
Fleet National Bank | 10.10 | 14,741 | 5,837 | — | — | — | ||||||||||||
Bank of America, N.A. (USA) | 8.54 | 3,879 | 1,817 | 8.41 | 3,079 | 1,465 | ||||||||||||
Total | ||||||||||||||||||
Bank of America Corporation | 11.63 | 92,266 | 63,482 | 11.87 | 66,651 | 44,904 | ||||||||||||
Bank of America, N.A. | 10.33 | 58,424 | 45,228 | 11.31 | 54,408 | 38,494 | ||||||||||||
Fleet National Bank | 13.32 | 19,430 | 11,673 | — | — | — | ||||||||||||
Bank of America, N.A. (USA) | 11.93 | 5,418 | 3,634 | 12.29 | 4,502 | 2,930 | ||||||||||||
Leverage | ||||||||||||||||||
Bank of America Corporation | 5.82 | 64,281 | 33,142 | 5.73 | 44,050 | 23,055 | ||||||||||||
Bank of America, N.A. | 6.27 | 46,891 | 22,445 | 6.88 | 42,030 | 18,319 | ||||||||||||
Fleet National Bank | 8.15 | 14,741 | 5,427 | — | — | — | ||||||||||||
Bank of America, N.A. (USA) | 9.19 | 3,879 | 1,266 | 9.17 | 3,079 | 1,008 | ||||||||||||
| (1) | Dollar amount required to meet guidelines for adequately capitalized institutions. |
BANK OF AMERICA CORPORATION AND SUBSIDIARIES
Notes to Consolidated Financial Statements—(Continued)
Note 15—Employee Benefit Plans
Pension and Postretirement Plans
The Corporation sponsors noncontributory trusteed qualified pension plans that cover substantially all officers and employees. The plans provide defined benefits based on an employee’s compensation, age and years of service. The Bank of America Pension Plan (the Pension Plan) provides participants with compensation credits, based on age and years of service. The Pension Plan allows participants to select from various earnings measures, which are based on the returns of certain funds or common stock of the Corporation. The participant-selected earnings measures determine the earnings rate on the individual participant account balances in the Pension Plan. Participants may elect to modify earnings measure allocations on a periodic basis subject to the provisions of the Pension Plan. The benefits become vested upon completion of five years of service. It is the policy of the Corporation to fund not less than the minimum funding amount required by ERISA.
The Pension Plan has a balance guarantee feature, applied at the time a benefit payment is made from the plan, that protects participant balances transferred and certain compensation credits from future market downturns. The Corporation is responsible for funding any shortfall on the guarantee feature.
The Corporation sponsors a number of noncontributory, nonqualified pension plans. These plans, which are unfunded, provide defined pension benefits to certain employees.
In addition to retirement pension benefits, full-time, salaried employees and certain part-time employees may become eligible to continue participation as retirees in health care and/or life insurance plans sponsored by the Corporation. Based on the other provisions of the individual plans, certain retirees may also have the cost of these benefits partially paid by the Corporation.
As a result of the Merger, the Corporation assumed the obligations related to the plans of former FleetBoston. These plans are substantially similar to the legacy Bank of America plans discussed above, however, the FleetBoston Financial Pension Plan does not allow participants to select various earnings measures, rather the earnings rate is based on a benchmark rate. The tables within this Note include the information related to these plans beginning on April 1, 2004.
Reflected in these results are key changes to the Postretirement Health and Life Plans and the Nonqualified Pension Plans. On December 8, 2003, the President signed the Medicare Act into law. The Medicare Act introduces a voluntary prescription drug benefit under Medicare as well as a federal subsidy to sponsors of retiree health care plans that provide at least an actuarially equivalent benefit. In the third quarter of 2004, the Corporation adopted FSP No. 106-2, which resulted in a reduction of $53 million in the Corporation’s accumulated postretirement benefit obligation. In addition, the Corporation’s net periodic benefit cost for other postretirement benefits has decreased by $15 million for 2004 as a result of the remeasurement. Additionally, in 2002, a one-time curtailment charge resulted from freezing benefits for supplemental executive retirement agreements.
The following table summarizes the changes in the fair value of plan assets, changes in the projected benefit obligation (PBO), the funded status of both the accumulated benefit obligation (ABO) and the PBO, and the weighted average assumptions used to determine benefit obligations for the pension plans and postretirement plans at December 31, 2004 and 2003. Prepaid and accrued benefit costs are reflected in Other Assets, and Accrued Expenses and Other Liabilities, respectively, on the Consolidated Balance Sheet. The discount rate assumption is based on the internal rate of return for a portfolio of high quality bonds (Moody’s Aa Corporate bonds) with maturities that are consistent with projected future cash flows. For the Pension Plan and the FleetBoston Pension Plan (the Qualified Pension Plans), as well as the Postretirement Health and Life Plans, the discount rate at December 31, 2004, was 5.75 percent. For both the Qualified Pension Plans and the Postretirement Health and Life Plans, the expected long-term return on plan assets will be 8.50 percent for 2005. The expected return on plan assets is determined using the calculated market-
BANK OF AMERICA CORPORATION AND SUBSIDIARIES
Notes to Consolidated Financial Statements—(Continued)
related value for the Qualified Pension Plans and the fair value for the Postretirement Health and Life Plans. The asset valuation method for the Qualified Pension Plans recognizes 60 percent of the market gains or losses in the first year, with the remaining 40 percent spread equally over the next four years.
Qualified Pension Plans(1) | Nonqualified Pension Plans(1) | Postretirement Health and | ||||||||||||||||||||||
| (Dollars in millions) | 2004 | 2003 | 2004 | 2003 | 2004 | 2003 | ||||||||||||||||||
Change in fair value of plan assets | ||||||||||||||||||||||||
(Primarily listed stocks, fixed income and real estate) | ||||||||||||||||||||||||
Fair value, January 1 | $ | 8,975 | $ | 7,518 | $ | — | $ | — | $ | 156 | $ | 181 | ||||||||||||
FleetBoston balance, April 1, 2004 | 2,277 | — | 1 | — | 45 | — | ||||||||||||||||||
Actual return on plan assets | 1,447 | 1,671 | — | — | 25 | 25 | ||||||||||||||||||
Company contributions(2) | 200 | 400 | 63 | 47 | 40 | 13 | ||||||||||||||||||
Plan participant contributions | — | — | — | — | 82 | 62 | ||||||||||||||||||
Benefits paid | (746 | ) | (614 | ) | (63 | ) | (47 | ) | (182 | ) | (125 | ) | ||||||||||||
Fair value, December 31 | $ | 12,153 | $ | 8,975 | $ | 1 | $ | — | $ | 166 | $ | 156 | ||||||||||||
Change in projected benefit obligation | ||||||||||||||||||||||||
Projected benefit obligation, January 1 | $ | 8,428 | $ | 7,627 | $ | 712 | $ | 652 | $ | 1,127 | $ | 1,058 | ||||||||||||
FleetBoston balance, April 1, 2004 | 2,045 | — | 377 | — | 196 | — | ||||||||||||||||||
Service cost | 257 | 187 | 27 | 25 | 9 | 9 | ||||||||||||||||||
Interest cost | 623 | 514 | 62 | 45 | 76 | 68 | ||||||||||||||||||
Plan participant contributions | — | — | — | — | 82 | 62 | ||||||||||||||||||
Plan amendments | 19 | — | (74 | ) | — | (12 | ) | (36 | ) | |||||||||||||||
Actuarial loss | 835 | 714 | 53 | 37 | 56 | 91 | ||||||||||||||||||
Benefits paid | (746 | ) | (614 | ) | (63 | ) | (47 | ) | (182 | ) | (125 | ) | ||||||||||||
Projected benefit obligation, December 31 | $ | 11,461 | $ | 8,428 | $ | 1,094 | $ | 712 | $ | 1,352 | $ | 1,127 | ||||||||||||
Funded status, December 31 | ||||||||||||||||||||||||
Accumulated benefit obligation (ABO) | $ | 11,025 | $ | 8,028 | $ | 1,080 | $ | 628 | n/a | n/a | ||||||||||||||
Overfunded (unfunded) status of ABO | 1,128 | 947 | (1,079 | ) | (628 | ) | n/a | n/a | ||||||||||||||||
Provision for future salaries | 436 | 400 | 14 | 84 | n/a | n/a | ||||||||||||||||||
Projected benefit obligation (PBO) | 11,461 | 8,428 | 1,094 | 712 | $ | 1,352 | $ | 1,127 | ||||||||||||||||
Overfunded (unfunded) status of PBO | $ | 692 | $ | 547 | $ | (1,093 | ) | $ | (712 | ) | $ | (1,186 | ) | $ | (971 | ) | ||||||||
Unrecognized net actuarial loss | 2,364 | 2,153 | 234 | 195 | 112 | 139 | ||||||||||||||||||
Unrecognized transition obligation | — | — | — | — | 252 | 291 | ||||||||||||||||||
Unrecognized prior service cost | 328 | 364 | (59 | ) | 18 | — | 6 | |||||||||||||||||
Prepaid (accrued) benefit cost | $ | 3,384 | $ | 3,064 | $ | (918 | ) | $ | (499 | ) | $ | (822 | ) | $ | (535 | ) | ||||||||
Weighted average assumptions, December 31 | ||||||||||||||||||||||||
Discount rate(3) | 5.75 | % | 6.25 | % | 5.75 | % | 6.25 | % | 5.75 | % | 6.25 | % | ||||||||||||
Expected return on plan assets | 8.50 | 8.50 | n/a | n/a | 8.50 | 8.50 | ||||||||||||||||||
Rate of compensation increase | 4.00 | 4.00 | 4.00 | 4.00 | n/a | n/a | ||||||||||||||||||
| (1) | The measurement date for the Qualified Pension Plans, Nonqualified Pension Plans, and Postretirement Health and Life Plans was December 31 of each year reported. |
| (2) | The Corporation’s best estimate of its contributions to be made to the Qualified Pension Plans, Nonqualified Pension Plans, and Postretirement Health and Life Plans in 2005 is $0, $114 and $37, respectively. |
| (3) | In connection with the Merger, the plans of former FleetBoston were remeasured on April 1, 2004 using a discount rate of 6 percent. |
| n/a | = not applicable |
BANK OF AMERICA CORPORATION AND SUBSIDIARIES
Notes to Consolidated Financial Statements—(Continued)
Amounts recognized in the Consolidated Financial Statements at December 31, 2004 and 2003 are as follows:
| Qualified Pension Plans | Nonqualified Pension Plans | Postretirement Health and Life Plans | ||||||||||||||||||||
| (Dollars in millions) | 2004 | 2003 | 2004 | 2003 | 2004 | 2003 | ||||||||||||||||
Prepaid benefit cost | $ | 3,384 | $ | 3,064 | $ | — | $ | — | $ | — | $ | — | ||||||||||
Accrued benefit cost | — | — | (918 | ) | (499 | ) | (822 | ) | (535 | ) | ||||||||||||
Additional minimum liability | — | — | (161 | ) | (129 | ) | — | — | ||||||||||||||
Intangible asset | — | — | 1 | 18 | — | — | ||||||||||||||||
Accumulated other comprehensive income | — | — | 160 | 111 | — | — | ||||||||||||||||
Net amount recognized at December 31, | $ | 3,384 | $ | 3,064 | $ | (918 | ) | $ | (499 | ) | $ | (822 | ) | $ | (535 | ) | ||||||
Net periodic pension benefit cost for 2004, 2003 and 2002 included the following components:
| Qualified Pension Plans | Nonqualified Pension Plans | |||||||||||||||||||||||
| (Dollars in millions) | 2004 | 2003 | 2002 | 2004 | 2003 | 2002 | ||||||||||||||||||
Components of net periodic pension benefit cost | ||||||||||||||||||||||||
Service cost | $ | 257 | $ | 187 | $ | 199 | $ | 27 | $ | 25 | $ | 27 | ||||||||||||
Interest cost | 623 | 514 | 540 | 62 | 45 | 44 | ||||||||||||||||||
Expected return on plan assets | (915 | ) | (735 | ) | (746 | ) | — | — | — | |||||||||||||||
Amortization of transition asset | — | — | — | — | — | — | ||||||||||||||||||
Amortization of prior service cost | 55 | 55 | 55 | 3 | 3 | 10 | ||||||||||||||||||
Recognized net actuarial loss | 92 | 47 | — | 14 | 11 | 11 | ||||||||||||||||||
Recognized loss due to settlements and curtailments | — | — | — | — | — | 26 | ||||||||||||||||||
Net periodic pension benefit cost | $ | 112 | $ | 68 | $ | 48 | $ | 106 | $ | 84 | $ | 118 | ||||||||||||
Weighted average assumptions used to determine net cost for years ended December 31 | ||||||||||||||||||||||||
Discount rate(1) | 6.25 | % | 6.75 | % | 7.25 | % | 6.25 | % | 6.75 | % | 7.25 | % | ||||||||||||
Expected return on plan assets | 8.50 | 8.50 | 8.50 | n/a | n/a | n/a | ||||||||||||||||||
Rate of compensation increase | 4.00 | 4.00 | 4.00 | 4.00 | 4.00 | 4.00 | ||||||||||||||||||
| (1) | In connection with the Merger, the plans of former FleetBoston were remeasured on April 1, 2004, using a discount rate of 6 percent. |
| n/a | = not applicable |
For 2004, 2003 and 2002, net periodic postretirement benefit cost included the following components:
| (Dollars in millions) | 2004(1) | 2003 | 2002 | |||||||||
Components of net periodic postretirement benefit cost | ||||||||||||
Service cost | $ | 9 | $ | 9 | $ | 11 | ||||||
Interest cost | 76 | 68 | 67 | |||||||||
Expected return on plan assets | (16 | ) | (15 | ) | (17 | ) | ||||||
Amortization of transition obligation | 32 | 32 | 32 | |||||||||
Amortization of prior service cost | 1 | 4 | 6 | |||||||||
Recognized net actuarial loss | 74 | 89 | 40 | |||||||||
Net periodic postretirement benefit cost | $ | 176 | $ | 187 | $ | 139 | ||||||
Weighted average assumptions used to determine net cost for years ended December 31 | ||||||||||||
Discount rate(2) | 6.25 | % | 6.75 | % | 7.25 | % | ||||||
Expected return on plan assets | 8.50 | 8.50 | 8.50 | |||||||||
| (1) | Includes the effect of the adoption of FSP No. 106-2, which reduced net periodic postretirement benefit cost by $15. |
| (2) | In connection with the Merger, the plans of former FleetBoston were remeasured on April 1, 2004, using a discount rate of 6 percent. |
BANK OF AMERICA CORPORATION AND SUBSIDIARIES
Notes to Consolidated Financial Statements—(Continued)
Net periodic postretirement health and life expense was determined using the “projected unit credit” actuarial method. Gains and losses for all benefits except postretirement health care are recognized in accordance with the standard amortization provisions of the applicable accounting standards. For the Postretirement Health Care Plans, 50 percent of the unrecognized gain or loss at the beginning of the fiscal year (or at subsequent remeasurement) is recognized on a level basis during the year.
Assumed health care cost trend rates affect the postretirement benefit obligation and benefit cost reported for the Postretirement Health Care Plans. The assumed health care cost trend rate used to measure the expected cost of benefits covered by the Postretirement Health Care Plans was 10 percent for 2005, reducing in steps to 5 percent in 2008 and later years. A one-percentage-point increase in assumed health care cost trend rates would have increased the service and interest costs and the benefit obligation by $4 million and $56 million, respectively, in 2004, $4 million and $52 million, respectively, in 2003, and $5 million and $61 million, respectively, in 2002. A one-percentage-point decrease in assumed health care cost trend rates would have lowered the service and interest costs and the benefit obligation by $3 million and $48 million, respectively, in 2004, $3 million and $48 million, respectively, in 2003, and $4 million and $52 million, respectively, in 2002.
Plan Assets
The Qualified Pension Plans have been established as retirement vehicles for participants, and trusts have been established to secure benefits promised under the Qualified Pension Plans. The Corporation’s policy is to invest the trust assets in a prudent manner for the exclusive purpose of providing benefits to participants and defraying reasonable expenses of administration. The Corporation’s investment strategy is designed to provide a total return that, over the long-term, increases the ratio of assets to liabilities. The strategy attempts to maximize the investment return on assets at a level of risk deemed appropriate by the Corporation while complying with ERISA and any subsequent applicable regulations and laws. The investment strategy utilizes asset allocation as a principal determinant for establishing the risk/reward profile of the assets. Asset allocation ranges are established, periodically reviewed, and adjusted as funding levels and liability characteristics change. Active and passive investment managers are employed to help enhance the risk/return profile of the assets. An additional aspect of the investment strategy used to minimize risk (part of the asset allocation plan) includes matching the equity exposure of participant-selected earnings measures. For example, the common stock of the Corporation held in the trust is maintained as an offset to the exposure related to participants who selected to receive an earnings measure based on the return performance of common stock of the Corporation.
The Expected Return on Asset Assumption (EROA assumption) was developed through analysis of historical market returns, historical asset class volatility and correlations, current market conditions, anticipated future asset allocations, the funds’ past experience, and expectations on potential future market returns. The EROA assumption represents a long-term average view of the performance of the Qualified Pension Plans and Postretirement Health and Life Plan assets, a return that may or may not be achieved during any one calendar year. In a simplistic analysis of the EROA assumption, the building blocks used to arrive at the long-term return assumption would include an implied return from equity securities of 9 percent, debt securities of 6 percent, and real estate of 9 percent for all pension plans and postretirement health and life plans.
The Qualified Pension Plans’ asset allocation at December 31, 2004 and 2003 and target allocation for 2005 by asset category are as follows:
| 2005 Target Allocation | Percentage of Plan Assets at December 31 | ||||||||
Asset Category | 2004 | 2003 | |||||||
Equity securities | 65 – 80 | % | 75 | % | 71 | % | |||
Debt securities | 20 – 35 | % | 23 | 28 | |||||
Real estate | 0 – 3 | % | 2 | 1 | |||||
Total | 100 | % | 100 | % | |||||
BANK OF AMERICA CORPORATION AND SUBSIDIARIES
Notes to Consolidated Financial Statements—(Continued)
Equity securities include common stock of the Corporation in the amounts of $871 million (7.17 percent of total plan assets) and $809 million (9.02 percent of total plan assets) at December 31, 2004 and 2003, respectively.
The Postretirement Health and Life Plans’ asset allocation at December 31, 2004 and 2003 and target allocation for 2005 by asset category are as follows:
| 2005 Target Allocation | Percentage of Plan Assets at December 31 | ||||||||
Asset Category | 2004 | 2003 | |||||||
Equity securities | 60 –75 | % | 75 | % | 69 | % | |||
Debt securities | 22 – 40 | % | 24 | 31 | |||||
Real estate | 0 – 3 | % | 1 | — | |||||
Total | 100 | % | 100 | % | |||||
The Bank of America Postretirement Health and Life Plans had no investment in the common stock of the Corporation at December 31, 2004 or 2003. The FleetBoston Postretirement Health and Life Plans included common stock of the Corporation in the amount of $0.3 million (0.20 percent of total plan assets) at December 31, 2004.
Projected Benefit Payments
Benefit payments projected to be made from the Qualified Pension Plans, the Nonqualified Pension Plans and the Postretirement Health and Life Plans are as follows:
| Postretirement Health and Life Plans | |||||||||||||
| (Dollars in millions) | Qualified Pension Plans(1) | Nonqualified Pension Plans(2) | Net Payments(3) | Medicare Subsidy | |||||||||
2005 | $ | 806 | $ | 114 | $ | 109 | $ | — | |||||
2006 | 831 | 89 | 109 | (6 | ) | ||||||||
2007 | 856 | 81 | 107 | (6 | ) | ||||||||
2008 | 881 | 93 | 104 | (6 | ) | ||||||||
2009 | 908 | 92 | 101 | (6 | ) | ||||||||
2010 – 2014 | 4,803 | 519 | 457 | (26 | ) | ||||||||
| (1) | Benefit payments expected to be made from the plans’ assets. |
| (2) | Benefit payments expected to be made from the Corporation’s assets. |
| (3) | Benefit payments (net of retiree contributions) expected to be made from a combination of the plans’ and the Corporation’s assets. |
Defined Contribution Plans
The Corporation maintains qualified defined contribution retirement plans and nonqualified defined contribution retirement plans. As a result of the Merger, beginning on April 1, 2004, the Corporation maintains the defined contribution plans of former FleetBoston. There are two components of the qualified defined contribution plans, the Bank of America 401(k) Plan and the FleetBoston Financial Savings Plan (the 401(k) Plans), and an employee stock ownership plan (ESOP) and a profit-sharing plan. See Note 13 of the Consolidated Financial Statements for additional information on the ESOP provisions.
The Corporation contributed approximately $267 million, $204 million and $200 million for 2004, 2003 and 2002, respectively, in cash and stock. Contributions in 2003 and 2002 were utilized primarily to purchase the Corporation’s common stock under the terms of the Bank of America 401(k) Plan. At December 31, 2004 and 2003, an aggregate of 113 million shares and 45 million shares, respectively, of the Corporation’s common stock were held by the 401(k) Plans. During 2004, the Corporation converted the ESOP Preferred Stock held by the Bank of America 401(k) Plan to common stock so that there were no outstanding shares at December 31, 2004 in the 401(k) Plans. At December 31, 2003, one million shares of ESOP Preferred Stock were held by the Bank of America 401(k) Plan.
BANK OF AMERICA CORPORATION AND SUBSIDIARIES
Notes to Consolidated Financial Statements—(Continued)
Under the terms of the ESOP Preferred Stock provision, payments to the plan for dividends on the ESOP Preferred Stock were $4 million for 2004, $4 million for 2003 and $5 million for 2002. Payments to the plan for dividends on the ESOP Common Stock were $181 million, $128 million and $106 million during the same periods.
In addition, certain non-U.S. employees within the Corporation are covered under defined contribution pension plans that are separately administered in accordance with local laws.
Note 16—Stock-based Compensation Plans
At December 31, 2004, the Corporation had certain stock-based compensation plans that are described below. For all stock-based compensation awards issued prior to January 1, 2003, the Corporation applied the provisions of APB 25 in accounting for its stock option and award plans. Stock-based compensation plans enacted after December 31, 2002, are accounted for under the provisions of SFAS 123. For additional information on the accounting for stock-based compensation plans and pro forma disclosures, see Note 1 of the Consolidated Financial Statements.
The following table presents information on equity compensation plans at December 31, 2004:
| Number of Shares to be Issued Upon Exercise of Outstanding Options(1,4) | Weighted Average Exercise Price of Outstanding Options(2) | Number of Shares Remaining for Future Issuance Under Equity Compensation Plans(3) | |||||
Plans approved by shareholders | 228,770,883 | $ | 33.69 | 210,238,781 | |||
Plans not approved by shareholders | 38,264,137 | 29.61 | — | ||||
Total | 267,035,020 | $ | 33.09 | 210,238,781 | |||
| (1) | Includes 7,422,369 unvested restricted stock units. |
| (2) | Does not take into account unvested restricted stock units. |
| (3) | Excludes shares to be issued upon exercise of outstanding options. |
| (4) | In addition to the securities presented in the table above, there were outstanding options to purchase 77,938,908 shares of the Corporation's common stock and 2,597,920 unvested restricted stock units granted to employees of predecessor companies assumed in mergers. The weighted average option price of the assumed options was $32.39 at December 31, 2004. |
The Corporation has certain stock-based compensation plans that were approved by its shareholders. These plans are the Key Employee Stock Plan and the Key Associate Stock Plan. Descriptions of the material features of these plans follow.
Key Employee Stock Plan
The Key Employee Stock Plan, as amended and restated, provided for different types of awards. These include stock options, restricted stock shares and restricted stock units. Under the plan, ten-year options to purchase approximately 260 million shares of common stock were granted through December 31, 2002, to certain employees at the closing market price on the respective grant dates. Options granted under the plan generally vest in three or four equal annual installments. At December 31, 2004, approximately 111 million options were outstanding under this plan. No further awards may be granted.
Key Associate Stock Plan
On April 24, 2002, the shareholders approved the Key Associate Stock Plan to be effective January 1, 2003. This approval authorized and reserved 200 million shares for grant in addition to the remaining amount under the Key Employee Stock Plan as of December 31, 2002, which was approximately 34 million shares plus any shares covered by awards under the Key Employee Stock Plan that terminate, expire, lapse or are cancelled after December 31, 2002. Upon the Merger, the shareholders authorized an additional 102 million shares for grant under the Key Associate Stock Plan. At December 31, 2004, approximately 110 million options were outstanding under this plan. Approximately 10 million shares of restricted stock and
BANK OF AMERICA CORPORATION AND SUBSIDIARIES
Notes to Consolidated Financial Statements—(Continued)
restricted stock units were granted during 2004. These shares of restricted stock generally vest in three equal annual installments beginning one year from the grant date. The Corporation incurred restricted stock expense of $288 million, $276 million and $250 million in 2004, 2003 and 2002, respectively.
The Corporation has certain stock-based compensation plans that were not approved by its shareholders. These broad-based plans are the 2002 Associates Stock Option Plan and Take Ownership!. Descriptions of the material features of these plans follow.
2002 Associates Stock Option Plan
The Bank of America Corporation 2002 Associates Stock Option Plan covered all employees below a specified executive grade level. Under the plan, eligible employees received a one-time award of a predetermined number of options entitling them to purchase shares of the Corporation’s common stock. All options are nonqualified and have an exercise price equal to the fair market value on the date of grant. Approximately 108 million options were granted on February 1, 2002. During 2003, the first option vesting trigger was achieved. During 2004, the second option vesting trigger was achieved. In addition, the options continue to be exercisable following termination of employment under certain circumstances. At December 31, 2004, approximately 33 million options were outstanding under this plan. The options expire on January 31, 2007. No further awards may be granted.
Take Ownership!
The Bank of America Global Associate Stock Option Program (Take Ownership!) covered all employees below a specified executive grade level. Under the plan, eligible employees received an award of a predetermined number of stock options entitling them to purchase shares of the Corporation’s common stock at the fair market value on the grant date. All options are nonqualified. At January 2, 2004, all options issued under this plan were fully vested. These options expire five years after the grant date. In addition, the options continue to be exercisable following termination of employment under certain circumstances. At December 31, 2004, approximately 6 million options were outstanding under this plan. No further awards may be granted.
Additional stock option plans assumed in connection with various acquisitions remain outstanding and are included in the following tables. No further awards may be granted under these plans.
The following tables present the status of all plans at December 31, 2004, 2003 and 2002, and changes during the years then ended:
| 2004 | 2003 | 2002 | ||||||||||||||||
Employee stock options | Shares | Weighted Average Exercise Price | Shares | Weighted Average Exercise Price | Shares | Weighted Average Exercise Price | ||||||||||||
Outstanding at January 1 | 320,331,380 | $ | 30.66 | 411,447,300 | $ | 29.10 | 369,100,032 | $ | 27.60 | |||||||||
Options assumed through acquisition | 78,761,708 | 28.68 | — | — | — | — | ||||||||||||
Granted | 63,472,170 | 40.80 | 61,336,790 | 35.03 | 171,671,430 | 30.73 | ||||||||||||
Exercised | (111,958,135 | ) | 27.77 | (132,491,842 | ) | 27.72 | (98,116,356 | ) | 26.20 | |||||||||
Forfeited | (13,055,564 | ) | 34.15 | (19,960,868 | ) | 31.41 | (31,207,806 | ) | 29.37 | |||||||||
Outstanding at December 31 | 337,551,559 | 32.93 | 320,331,380 | 30.66 | 411,447,300 | 29.10 | ||||||||||||
Options exercisable at December 31 | 243,735,846 | 30.73 | 167,786,372 | 30.02 | 179,151,940 | 29.51 | ||||||||||||
Weighted average fair value of options granted during the year | $ | 5.59 | $ | 6.77 | $ | 6.21 | ||||||||||||
BANK OF AMERICA CORPORATION AND SUBSIDIARIES
Notes to Consolidated Financial Statements—(Continued)
| 2004 | 2003 | 2002 | ||||||||||||||||
Restricted stock/unit awards | Shares | Weighted Average Grant Price | Shares | Weighted Average Grant Price | Shares | Weighted Average Grant Price | ||||||||||||
Outstanding unvested grants at January 1 | 16,170,546 | $ | 31.64 | 15,679,946 | $ | 30.37 | 13,183,492 | $ | 29.21 | |||||||||
Share obligations assumed through acquisition | 7,720,476 | 31.62 | — | — | — | — | ||||||||||||
Granted | 10,338,327 | 41.03 | 8,893,718 | 34.69 | 9,532,754 | 30.57 | ||||||||||||
Vested | (12,031,945 | ) | 29.43 | (7,697,576 | ) | 32.47 | (6,763,746 | ) | 28.44 | |||||||||
Canceled | (1,747,839 | ) | 38.10 | (705,542 | ) | 32.85 | (272,554 | ) | 29.48 | |||||||||
Outstanding unvested grants at December 31 | 20,449,565 | $ | 37.12 | 16,170,546 | $ | 31.64 | 15,679,946 | $ | 30.37 | |||||||||
The following table summarizes information about stock options outstanding at December 31, 2004:
| Outstanding Options | Options Exercisable | |||||||||||
Range of Exercise Prices | Number Outstanding at December 31, 2004 | Weighted Average Remaining Term | Weighted Average Exercise Price | Number Exercisable at December 31, 2004 | Weighted Average Exercise Price | |||||||
$ 5.00 - $15.00 | 1,262,953 | 0.4 years | $ | 12.23 | 1,262,953 | $ | 12.23 | |||||
$15.01 - $23.25 | 10,692,931 | 5.1 years | 18.94 | 10,692,931 | 18.94 | |||||||
$23.26 - $32.75 | 168,421,939 | 4.8 years | 28.93 | 168,068,284 | 28.92 | |||||||
$32.76 - $49.50 | 157,173,736 | 7.1 years | 38.34 | 63,711,678 | 37.86 | |||||||
Total | 337,551,559 | 5.9 years | $ | 32.93 | 243,735,846 | $ | 30.73 | |||||
Note 17—Income Taxes
The components of Income Tax Expense for 2004, 2003 and 2002 were as follows:
| (Dollars in millions) | 2004 | 2003 | 2002 | |||||||||
Current income tax expense | ||||||||||||
Federal | $ | 6,392 | $ | 4,642 | $ | 3,386 | ||||||
State | 683 | 412 | 451 | |||||||||
Foreign | 405 | 260 | 349 | |||||||||
Total current expense | 7,480 | 5,314 | 4,186 | |||||||||
Deferred income tax (benefit) expense | ||||||||||||
Federal | (407 | ) | (222 | ) | (270 | ) | ||||||
State | (11 | ) | (45 | ) | (200 | ) | ||||||
Foreign | 16 | 4 | 26 | |||||||||
Total deferred benefit | (402 | ) | (263 | ) | (444 | ) | ||||||
Total income tax expense(1) | $ | 7,078 | $ | 5,051 | $ | 3,742 | ||||||
| (1) | Does not reflect the deferred tax effects of Unrealized Gains and Losses on AFS Debt and Marketable Equity Securities, Foreign Currency Translation Adjustments and Derivatives that are included in Shareholders’ Equity. As a result of these tax effects, Shareholders’ Equity increased (decreased) by $383, $1,806 and $(1,090) in 2004, 2003 and 2002, respectively. Also, does not reflect tax benefits associated with the Corporation's employee stock plans which increased Shareholders' Equity by $401, $443 and $251 in 2004, 2003 and 2002, respectively. Goodwill has been reduced by $101, reflecting the tax benefits attributable to 2004 exercises of employee stock options issued by FleetBoston which had vested prior to the merger date. |
Income Tax Expense for 2004, 2003 and 2002 varied from the amount computed by applying the statutory income tax rate to Income before Income Taxes. A reconciliation between the expected federal
BANK OF AMERICA CORPORATION AND SUBSIDIARIES
Notes to Consolidated Financial Statements—(Continued)
income tax expense using the federal statutory tax rate of 35 percent to the Corporation’s actual Income Tax Expense and resulting effective tax rate for 2004, 2003 and 2002 follows:
| 2004 | 2003 | 2002 | |||||||||||||||||||
| (Dollars in millions) | Amount | Percent | Amount | Percent | Amount | Percent | |||||||||||||||
Expected federal income tax expense | $ | 7,427 | 35.0 | % | $ | 5,551 | 35.0 | % | $ | 4,547 | 35.0 | % | |||||||||
Increase (decrease) in taxes resulting from: | |||||||||||||||||||||
Tax-exempt income, including dividends | (526 | ) | (2.5 | ) | (325 | ) | (2.1 | ) | (297 | ) | (2.3 | ) | |||||||||
State tax expense, net of federal benefit | 437 | 2.1 | 239 | 1.5 | 210 | 1.6 | |||||||||||||||
Goodwill amortization | — | — | 12 | 0.1 | — | — | |||||||||||||||
IRS tax settlement | — | — | (84 | ) | (0.5 | ) | (488 | ) | (3.8 | ) | |||||||||||
Low income housing credits/other credits | (352 | ) | (1.6 | ) | (212 | ) | (1.3 | ) | (222 | ) | (1.7 | ) | |||||||||
Foreign tax differential | (78 | ) | (0.4 | ) | (50 | ) | (0.3 | ) | (58 | ) | (0.4 | ) | |||||||||
Other | 170 | 0.8 | (80 | ) | (0.6 | ) | 50 | 0.4 | |||||||||||||
Total income tax expense | $ | 7,078 | 33.4 | % | $ | 5,051 | 31.8 | % | $ | 3,742 | 28.8 | % | |||||||||
During 2002, the Corporation reached a tax settlement agreement with the IRS. This agreement resolved issues for numerous tax returns of the Corporation and various predecessor companies and finalized all federal income tax liabilities,excluding those relating to FleetBoston, through 1999. As a result of the settlement, reductions in Income Tax Expense of $84 million in 2003 and $488 million in 2002 were recorded representing refunds received and reductions in previously accrued taxes.
The IRS is currently examining the Corporation’s federal income tax returns for the years 2000 through 2002, as well as the tax returns of FleetBoston and certain other subsidiaries for years ranging from 1997 to 2000. The Corporation’s current estimate of the resolution of these various examinations is reflected in accrued income taxes; however, final settlement of the examinations or changes in the Corporation’s estimate may result in future income tax expense or benefit.
Significant components of the Corporation’s net deferred tax liability at December 31, 2004 and 2003 are presented in the following table.
| December 31 | ||||||||
| (Dollars in millions) | 2004 | 2003 | ||||||
Deferred tax liabilities | ||||||||
Equipment lease financing | $ | 6,192 | $ | 5,321 | ||||
Investments | 1,088 | 905 | ||||||
Intangibles | 803 | 955 | ||||||
Deferred gains and losses | 251 | 189 | ||||||
State income taxes | 192 | 281 | ||||||
Fixed assets | 47 | 246 | ||||||
Employee compensation and retirement benefits | 13 | 17 | ||||||
Other | 435 | 560 | ||||||
Gross deferred tax liabilities | 9,021 | 8,474 | ||||||
Deferred tax assets | ||||||||
Allowance for credit losses | 3,668 | 2,421 | ||||||
Security valuations | 2,326 | 1,876 | ||||||
Accrued expenses | 533 | 421 | ||||||
Foreign tax credit carryforward | 467 | — | ||||||
Available-for-sale securities | 146 | 46 | ||||||
Loan fees and expenses | 241 | 85 | ||||||
Net operating loss carryforwards | 91 | 129 | ||||||
Other | 1,150 | 280 | ||||||
Gross deferred tax assets | 8,622 | 5,258 | ||||||
Valuation allowance(1) | (155 | ) | (120 | ) | ||||
Total deferred tax assets, net of valuation allowance | 8,467 | 5,138 | ||||||
Net deferred tax liabilities(2) | $ | 554 | $ | 3,336 | ||||
BANK OF AMERICA CORPORATION AND SUBSIDIARIES
Notes to Consolidated Financial Statements—(Continued)
| (1) | At December 31, 2004, $70 of the valuation allowance related to gross deferred tax assets was attributable to the Merger. Future recognition of the tax attributes associated with these gross deferred tax assets would result in tax benefits being allocated to reduce Goodwill. |
| (2) | The Corporation’s net deferred tax liability was adjusted on April 1, 2004, to include a net deferred tax asset of $2.0 billion attributable to the Merger. |
The valuation allowance recorded by the Corporation at December 31, 2004 and 2003 represents net operating loss carryforwards generated by foreign subsidiaries and certain state deferred tax assets, where, in each case, it is more likely than not that realization will not occur. These net operating loss carryforwards begin to expire after 2005 and could fully expire after 2010.
The foreign tax credit carryforward reflected in the table above represents foreign income taxes paid that are creditable against future U.S. income taxes. If not used, these credits begin to expire after 2009 and could fully expire after 2014.
At December 31, 2004 and 2003, federal income taxes had not been provided on $1.1 billion and $871 million, respectively, of undistributed earnings of foreign subsidiaries, earned prior to 1987 and after 1997 that have been reinvested for an indefinite period of time. If the earnings were distributed, an additional $221 million and $185 million of tax expense, net of credits for foreign taxes paid on such earnings and for the related foreign withholding taxes, would result in 2004 and 2003, respectively.
On December 21, 2004, the FASB issued FSP No. 109-2 that provides accounting and disclosure guidance for the foreign earnings repatriation provision within the Act. For additional information on FSP No. 109-2 and the Act, see Note 1 of the Consolidated Financial Statements.
Note 18—Fair Value of Financial Instruments
SFAS No. 107, “Disclosures About Fair Value of Financial Instruments” (SFAS 107), requires the disclosure of the estimated fair value of financial instruments. The fair value of a financial instrument is the amount at which the instrument could be exchanged in a current transaction between willing parties, other than in a forced or liquidation sale. Quoted market prices, if available, are utilized as estimates of the fair values of financial instruments. Since no quoted market prices exist for certain of the Corporation’s financial instruments, the fair values of such instruments have been derived based on management’s assumptions, the estimated amount and timing of future cash flows and estimated discount rates. The estimation methods for individual classifications of financial instruments are described more fully below. Different assumptions could significantly affect these estimates. Accordingly, the net realizable values could be materially different from the estimates presented below. In addition, the estimates are only indicative of the value of individual financial instruments and should not be considered an indication of the fair value of the combined Corporation.
The provisions of SFAS 107 do not require the disclosure of the fair value of lease financing arrangements and nonfinancial instruments, including intangible assets such as goodwill, franchise, and credit card and trust relationships.
Short-term Financial Instruments
The carrying value of short-term financial instruments, including cash and cash equivalents, time deposits placed, federal funds sold and purchased, resale and repurchase agreements, commercial paper and other short-term investments and borrowings, approximates the fair value of these instruments. These financial instruments generally expose the Corporation to limited credit risk and have no stated maturities or have short-term maturities and carry interest rates that approximate market.
BANK OF AMERICA CORPORATION AND SUBSIDIARIES
Notes to Consolidated Financial Statements—(Continued)
Financial Instruments Traded in the Secondary Market
Held-to-maturity securities, AFS debt and marketable equity securities, trading account instruments and long-term debt traded actively in the secondary market have been valued using quoted market prices. The fair values of trading account instruments and securities are reported in Notes 3 and 5 of the Consolidated Financial Statements.
Derivative Financial Instruments
All derivatives are recognized on the Consolidated Balance Sheet at fair value, net of cash collateral held and taking into consideration the effects of legally enforceable master netting agreements that allow the Corporation to settle positive and negative positions with the same counterparty on a net basis. For exchange-traded contracts, fair value is based on quoted market prices. For non-exchange traded contracts, fair value is based on dealer quotes, pricing models or quoted prices for instruments with similar characteristics. The fair value of the Corporation’s derivative assets and liabilities is presented in Note 4 of the Consolidated Financial Statements.
Loans
Fair values were estimated for groups of similar loans based upon type of loan and maturity. The fair value of loans was determined by discounting estimated cash flows using interest rates approximating the Corporation’s current origination rates for similar loans and adjusted to reflect the inherent credit risk. Where quoted market prices were available, primarily for certain residential mortgage loans and commercial loans, such market prices were utilized as estimates for fair values.
Substantially all of the foreign loans reprice within relatively short timeframes. Accordingly, for foreign loans, the net carrying values were assumed to approximate their fair values.
Deposits
The fair value for deposits with stated maturities was calculated by discounting contractual cash flows using current market rates for instruments with similar maturities. The carrying value of foreign time deposits approximates fair value. For deposits with no stated maturities, the carrying amount was considered to approximate fair value and does not take into account the significant value of the cost advantage and stability of the Corporation’s long-term relationships with depositors.
The book and fair values of certain financial instruments at December 31, 2004 and 2003 were as follows:
| December 31 | ||||||||||||
| 2004 | 2003 | |||||||||||
| (Dollars in millions) | Book Value | Fair Value | Book Value | Fair Value | ||||||||
Financial assets | ||||||||||||
Loans | $ | 491,615 | $ | 496,873 | $ | 353,924 | $ | 357,770 | ||||
Financial liabilities | ||||||||||||
Deposits | 618,570 | 618,409 | 414,113 | 414,379 | ||||||||
Long-term debt | 98,078 | 102,439 | 75,343 | 79,442 | ||||||||
Note 19—Business Segment Information
In connection with the Merger, the Corporation realigned its business segment reporting to reflect the new business model of the combined company. The Corporation reports the results of its operations through four business segments:Global Consumer and Small Business Banking,Global Business and Financial Services,Global Capital Markets and Investment Banking, andGlobal Wealth and Investment Management. Certain operating segments have been aggregated into a single business segment. The Corporation may periodically reclassify business segment results based on modifications to its management reporting and profitability measurement methodologies, and changes in organizational alignment.
BANK OF AMERICA CORPORATION AND SUBSIDIARIES
Notes to Consolidated Financial Statements—(Continued)
Global Consumer and Small Business Banking provides a diversified range of products and services to individuals and small businesses through multiple delivery channels.Global Business and Financial Services primarily provides commercial lending and treasury management services to middle-market companies.Global Capital Markets and Investment Banking provides capital-raising solutions, advisory services, derivatives capabilities, equity and debt sales and trading for the Corporation’s clients as well as traditional bank deposit and loan products, treasury management and payment services to large corporations and institutional clients.Global Wealth and Investment Management offers investment, fiduciary and comprehensive banking and credit expertise, asset management services to institutional clients, high-net-worth individuals and retail customers, investment, securities and financial planning services to affluent and high-net-worth individuals, and retail clearing services for broker/dealers.
All Other consists primarily ofLatin America,Equity Investments, Noninterest Income and Expense amounts associated with the ALM process, including Gains on Sales of Debt Securities, the allowance for credit losses process, the residual impact of methodology allocations, intersegment eliminations, and the results of certain consumer finance and commercial lending businesses that are being liquidated.Latin America includes the Corporation’s full-service Latin American operations in Brazil, Argentina and Chile.
Total Revenue includes Net Interest Income on a fully taxable-equivalent basis and Noninterest Income. The adjustment of Net Interest Income to a fully taxable-equivalent basis results in a corresponding increase in Income Tax Expense. The Net Interest Income of the business segments includes the results of a funds transfer pricing process that matches assets and liabilities with similar interest rate sensitivity and maturity characteristics. Net Interest Income also reflects an allocation of Net Interest Income generated by assets and liabilities used in the Corporation’s ALM process.
Certain expenses not directly attributable to a specific business segment are allocated to the segments based on pre-determined means. The most significant of these expenses include data processing costs, item processing costs and certain centralized or shared functions. Data processing costs are allocated to the segments based on equipment usage. Item processing costs are allocated to the segments based on the volume of items processed for each segment. The costs of certain centralized or shared functions are allocated based on methodologies which reflect utilization.
The following table presents Total Revenue and Net Income for 2004, 2003 and 2002, and Total Assets at December 31, 2004 and 2003 for each business segment, as well asAll Other.
Business Segments
At and for the Year ended December 31
| Total Corporation | Global Consumer and Small Business Banking(1) | |||||||||||||||||
| (Dollars in millions) | 2004 | 2003 | 2002 | 2004 | 2003 | 2002 | ||||||||||||
Net interest income (fully taxable-equivalent basis) | $ | 29,513 | $ | 22,107 | $ | 21,511 | $ | 17,308 | $ | 12,114 | $ | 11,411 | ||||||
Noninterest income | 20,097 | 16,450 | 13,580 | 9,549 | 8,816 | 6,911 | ||||||||||||
Total revenue | 49,610 | 38,557 | 35,091 | 26,857 | 20,930 | 18,322 | ||||||||||||
Provision for credit losses | 2,769 | 2,839 | 3,697 | 3,341 | 1,678 | 1,521 | ||||||||||||
Gains on sales of debt securities | 2,123 | 941 | 630 | 117 | 13 | 20 | ||||||||||||
Amortization of intangibles | 664 | 217 | 218 | 463 | 147 | 143 | ||||||||||||
Other noninterest expense | 26,363 | 19,938 | 18,227 | 12,871 | 10,186 | 9,168 | ||||||||||||
Income before income taxes | 21,937 | 16,504 | 13,579 | 10,299 | 8,932 | 7,510 | ||||||||||||
Income tax expense | 7,794 | 5,694 | 4,330 | 3,751 | 3,226 | 2,769 | ||||||||||||
Net income | $ | 14,143 | $ | 10,810 | $ | 9,249 | $ | 6,548 | $ | 5,706 | $ | 4,741 | ||||||
Period-end total assets | $ | 1,110,457 | $ | 719,483 | $ | 378,359 | $ | 264,578 | ||||||||||
BANK OF AMERICA CORPORATION AND SUBSIDIARIES
Notes to Consolidated Financial Statements—(Continued)
| Global Business and Financial Services(1) | Global Capital Markets and Investment Banking(1) | |||||||||||||||||||||
| (Dollars in millions) | 2004 | 2003 | 2002 | 2004 | 2003 | 2002 | ||||||||||||||||
Net interest income (fully taxable-equivalent basis) | $ | 4,593 | $ | 3,118 | $ | 3,195 | $ | 4,122 | $ | 4,289 | $ | 4,345 | ||||||||||
Noninterest income | 2,129 | 1,399 | 1,214 | 4,927 | 4,045 | 3,856 | ||||||||||||||||
Total revenue | 6,722 | 4,517 | 4,409 | 9,049 | 8,334 | 8,201 | ||||||||||||||||
Provision for credit losses | (241 | ) | 458 | 453 | (459 | ) | 303 | 768 | ||||||||||||||
Losses on sales of debt securities | — | — | — | (10 | ) | (14 | ) | (92 | ) | |||||||||||||
Amortization of intangibles | 82 | 21 | 21 | 44 | 24 | 29 | ||||||||||||||||
Other noninterest expense | 2,394 | 1,776 | 1,810 | 6,512 | 5,303 | 4,896 | ||||||||||||||||
Income before income taxes | 4,487 | 2,262 | 2,125 | 2,942 | 2,690 | 2,416 | ||||||||||||||||
Income tax expense | 1,654 | 791 | 756 | 992 | 896 | 814 | ||||||||||||||||
Net income | $ | 2,833 | $ | 1,471 | $ | 1,369 | $ | 1,950 | $ | 1,794 | $ | 1,602 | ||||||||||
Period-end total assets | $ | 178,093 | $ | 107,791 | $ | 307,451 | $ | 225,839 | ||||||||||||||
| Global Wealth and Investment Management(1) | All Other | |||||||||||||||||||
| (Dollars in millions) | 2004 | 2003 | 2002 | 2004 | 2003 | 2002 | ||||||||||||||
Net interest income (fully taxable-equivalent basis) | $ | 2,854 | $ | 1,952 | $ | 1,923 | $ | 636 | $ | 634 | $ | 637 | ||||||||
Noninterest income | 3,064 | 2,078 | 1,706 | 428 | 112 | (107 | ) | |||||||||||||
Total revenue | 5,918 | 4,030 | 3,629 | 1,064 | 746 | 530 | ||||||||||||||
Provision for credit losses | (20 | ) | 11 | 320 | 148 | 389 | 635 | |||||||||||||
Gains on sales of debt securities | — | — | — | 2,016 | 942 | 702 | ||||||||||||||
Amortization of intangibles | 62 | 20 | 20 | 13 | 5 | 5 | ||||||||||||||
Other noninterest expense | 3,387 | 2,081 | 1,899 | 1,199 | 592 | 454 | ||||||||||||||
Income before income taxes | 2,489 | 1,918 | 1,390 | 1,720 | 702 | 138 | ||||||||||||||
Income tax expense (benefit) | 905 | 684 | 507 | 492 | 97 | (516 | ) | |||||||||||||
Net income | $ | 1,584 | $ | 1,234 | $ | 883 | $ | 1,228 | $ | 605 | $ | 654 | ||||||||
Period-end total assets | $ | 121,974 | $ | 69,370 | $ | 124,580 | $ | 51,905 | ||||||||||||
| (1) | There were no material intersegment revenues among the segments. |
BANK OF AMERICA CORPORATION AND SUBSIDIARIES
Notes to Consolidated Financial Statements—(Continued)
The following table presents reconciliations of the four business segments’ Total Revenue, Net Income and Total Assets to consolidated totals. The adjustments presented in the table below include consolidated income and expense amounts not specifically allocated to individual business segments.
| Year Ended December 31 | ||||||||||||
| (Dollars in millions) | 2004 | 2003 | 2002 | |||||||||
Segments’ revenue | $ | 48,546 | $ | 37,811 | $ | 34,561 | ||||||
Adjustments: | ||||||||||||
Revenue associated with unassigned capital | 318 | 674 | 560 | |||||||||
ALM activities(1) | (74 | ) | 500 | 294 | ||||||||
Latin America | 834 | 33 | 43 | |||||||||
Equity investments | 440 | (256 | ) | (445 | ) | |||||||
Liquidating businesses | 282 | 324 | 539 | |||||||||
Fully taxable-equivalent basis adjustment | (716 | ) | (643 | ) | (588 | ) | ||||||
Other | (736 | ) | (529 | ) | (461 | ) | ||||||
Consolidated revenue | $ | 48,894 | $ | 37,914 | $ | 34,503 | ||||||
Segments’ net income | $ | 12,915 | $ | 10,205 | $ | 8,595 | ||||||
Adjustments, net of taxes: | ||||||||||||
Earnings associated with unassigned capital | 212 | 459 | 399 | |||||||||
ALM activities(1, 2) | 1,117 | 870 | 523 | |||||||||
Latin America | 310 | (48 | ) | (148 | ) | |||||||
Equity investments | 192 | (249 | ) | (330 | ) | |||||||
Liquidating businesses | 79 | (19 | ) | 58 | ||||||||
Merger and restructuring charges | (411 | ) | — | — | ||||||||
Litigation expense | 66 | (150 | ) | — | ||||||||
Tax settlement | — | — | 488 | |||||||||
Severance charge | — | — | (86 | ) | ||||||||
Other | (337 | ) | (258 | ) | (250 | ) | ||||||
Consolidated net income | $ | 14,143 | $ | 10,810 | $ | 9,249 | ||||||
| December 31 | ||||||||
| 2004 | 2003 | |||||||
Segments’ total assets | $ | 985,877 | $ | 667,578 | ||||
Adjustments: | ||||||||
ALM activities | 131,751 | 103,313 | ||||||
Securities portfolio | 177,803 | 59,333 | ||||||
Latin America | 12,402 | 515 | ||||||
Equity investments | 8,064 | 6,250 | ||||||
Liquidating businesses | 4,390 | 6,528 | ||||||
Elimination of excess earning asset allocations | (254,225 | ) | (177,303 | ) | ||||
Other, net | 44,395 | 53,269 | ||||||
Consolidated total assets | $ | 1,110,457 | $ | 719,483 | ||||
| (1) | Includes pre-tax whole mortgage loan sale gains/(losses) of $(2), $772 and $500 for 2004, 2003 and 2002, respectively. |
| (2) | Includes pre-tax Gains on Sales of Debt Securities of $2,011, $938 and $701 for 2004, 2003 and 2002, respectively. |
BANK OF AMERICA CORPORATION AND SUBSIDIARIES
Notes to Consolidated Financial Statements—(Continued)
Note 20—Bank of America Corporation (Parent Company Only)
The following tables present the Parent Company Only financial information:
Condensed Statement of Income
| Year Ended December 31 | |||||||||||
| (Dollars in millions) | 2004 | 2003 | 2002 | ||||||||
Income | |||||||||||
Dividends from subsidiaries: | |||||||||||
Bank subsidiaries | $ | 8,100 | $ | 8,950 | $ | 11,100 | |||||
Other subsidiaries | 133 | 34 | 10 | ||||||||
Interest from subsidiaries | 1,085 | 610 | 775 | ||||||||
Other income | 1,351 | 2,140 | 1,138 | ||||||||
Total income | 10,669 | 11,734 | 13,023 | ||||||||
Expense | |||||||||||
Interest on borrowed funds | 1,861 | 1,391 | 1,700 | ||||||||
Noninterest expense | 1,797 | 2,181 | 1,361 | ||||||||
Total expense | 3,658 | 3,572 | 3,061 | ||||||||
Income before income taxes and equity in undistributed earnings of subsidiaries | 7,011 | 8,162 | 9,962 | ||||||||
Income tax (expense) benefit | (122 | ) | 461 | 1,154 | |||||||
Income before equity in undistributed earnings of subsidiaries | 6,889 | 8,623 | 11,116 | ||||||||
Equity in undistributed earnings of subsidiaries: | |||||||||||
Bank subsidiaries | 6,680 | 2,093 | (1,607 | ) | |||||||
Other subsidiaries | 574 | 94 | (260 | ) | |||||||
Total equity in undistributed earnings (losses) of subsidiaries | 7,254 | 2,187 | (1,867 | ) | |||||||
Net income | $ | 14,143 | $ | 10,810 | $ | 9,249 | |||||
Net income available to common shareholders | $ | 14,127 | $ | 10,806 | 9,244 | ||||||
BANK OF AMERICA CORPORATION AND SUBSIDIARIES
Notes to Consolidated Financial Statements—(Continued)
Condensed Balance Sheet
| December 31 | ||||||
| (Dollars in millions) | 2004 | 2003 | ||||
Assets | ||||||
Cash held at bank subsidiaries | $ | 47,138 | $ | 20,436 | ||
Securities | 2,694 | 1,441 | ||||
Receivables from subsidiaries: | ||||||
Bank subsidiaries | 10,546 | 10,042 | ||||
Other subsidiaries | 19,897 | 15,103 | ||||
Investments in subsidiaries: | ||||||
Bank subsidiaries | 114,868 | 59,085 | ||||
Other subsidiaries | 1,499 | 818 | ||||
Other assets | 13,859 | 13,459 | ||||
Total assets | $ | 210,501 | $ | 120,384 | ||
Liabilities and shareholders’ equity | ||||||
Commercial paper and other short-term borrowings | $ | 20,774 | $ | 3,333 | ||
Accrued expenses and other liabilities | 7,124 | 7,469 | ||||
Payables to subsidiaries: | ||||||
Bank subsidiaries | 76 | 173 | ||||
Other subsidiaries | 13 | 29 | ||||
Long-term debt | 82,869 | 61,400 | ||||
Shareholders’ equity | 99,645 | 47,980 | ||||
Total liabilities and shareholders’ equity | $ | 210,501 | $ | 120,384 | ||
Condensed Statement of Cash Flows
| Year Ended December 31 | ||||||||||||
| (Dollars in millions) | 2004 | 2003 | 2002 | |||||||||
Operating activities | ||||||||||||
Net income | $ | 14,143 | $ | 10,810 | $ | 9,249 | ||||||
Reconciliation of net income to net cash provided by operating activities: | ||||||||||||
Equity in undistributed earnings (losses) of subsidiaries | (7,254 | ) | (2,187 | ) | 1,867 | |||||||
Other operating activities, net | (1,168 | ) | 40 | (2,537 | ) | |||||||
Net cash provided by operating activities | 5,721 | 8,663 | 8,579 | |||||||||
Investing activities | ||||||||||||
Net purchases of securities | (1,348 | ) | (59 | ) | (428 | ) | ||||||
Net payments from (to) subsidiaries | 821 | (1,160 | ) | (2,025 | ) | |||||||
Other investing activities, net | 3,348 | (1,597 | ) | (158 | ) | |||||||
Net cash provided by (used in) investing activities | 2,821 | (2,816 | ) | (2,611 | ) | |||||||
Financing activities | ||||||||||||
Net increase (decrease) in commercial paper and other short-term borrowings | 16,332 | 2,482 | (7,505 | ) | ||||||||
Proceeds from issuance of long-term debt | 19,965 | 14,713 | 8,753 | |||||||||
Retirement of long-term debt | (9,220 | ) | (5,928 | ) | (1,464 | ) | ||||||
Proceeds from issuance of common stock | 3,939 | 4,249 | 2,632 | |||||||||
Common stock repurchased | (6,286 | ) | (9,766 | ) | (7,466 | ) | ||||||
Cash dividends paid | (6,468 | ) | (4,281 | ) | (3,709 | ) | ||||||
Other financing activities, net | (102 | ) | 276 | (338 | ) | |||||||
Net cash provided by (used in) financing activities | 18,160 | 1,745 | (9,097 | ) | ||||||||
Net increase (decrease) in cash held at bank subsidiaries | 26,702 | 7,592 | (3,129 | ) | ||||||||
Cash held at bank subsidiaries at January 1 | 20,436 | 12,844 | 15,973 | |||||||||
Cash held at bank subsidiaries at December 31 | $ | 47,138 | $ | 20,436 | $ | 12,844 | ||||||
BANK OF AMERICA CORPORATION AND SUBSIDIARIES
Notes to Consolidated Financial Statements—(Continued)
Note 21—Performance by Geographic Area
Since the Corporation’s operations are highly integrated, certain asset, liability, income and expense amounts must be allocated to arrive at Total Assets, Total Revenue, Income (Loss) Before Income Taxes and Net Income (Loss) by geographic area. The Corporation identifies its geographic performance based upon the business unit structure used to manage the capital or expense deployed in the region, as applicable. This requires certain judgments related to the allocation of revenue so that revenue can be appropriately matched with the related expense or capital deployed in the region.
| At December 31 | Year Ended December 31 | |||||||||||||||
| (Dollars in millions) | Year | Total Assets(1) | Total Revenue(2) | Income (Loss) Before Income Taxes | Net Income (Loss) | |||||||||||
Domestic(3) | 2004 2003 2002 | $ | 1,046,639 672,834 | $ | 46,156 36,541 32,884 | $ | 20,072 15,955 13,537 | $ | 13,384 10,843 9,548 | |||||||
Asia | 2004 2003 2002 | 21,658 20,016 | 708 414 639 | 330 82 218 | 237 71 157 | |||||||||||
Europe, Middle East and Africa | 2004 2003 2002 | 27,536 23,858 | 1,136 847 838 | 353 (14 (367 | ) ) | 234 (1 (210 | ) ) | |||||||||
Latin America and the Caribbean | 2004 2003 2002 | 14,624 2,775 | 894 112 142 | 466 (162 (397 | ) ) | 288 (103 (246 | ) ) | |||||||||
Total Foreign | 2004 2003 2002 | 63,818 46,649 | 2,738 1,373 1,619 | 1,149 (94 (546 | ) ) | 759 (33 (299 | ) ) | |||||||||
Total Consolidated | 2004 2003 2002 | $ | 1,110,457 719,483 | $ | 48,894 37,914 34,503 | $ | 21,221 15,861 12,991 | $ | 14,143 10,810 9,249 | |||||||
| (1) | Total Assets includes long-lived assets, which are primarily located in the U.S. |
| (2) | There were no material intercompany revenues between geographic regions for any of the periods presented. |
| (3) | Includes the Corporation's Canadian operations, which had Total Assets of $4,849 and $2,799 at December 31, 2004 and 2003, respectively; Total Revenue of $88, $96 and $96; Income before Income Taxes of $49, $60 and $111; and Net Income of $41, $12 and $83 for the years ended December 31, 2004, 2003 and 2002, respectively. |
Item 9. CHANGES IN AND DISAGREEMENTS WITH ACCOUNTANTS ON ACCOUNTING AND FINANCIAL DISCLOSURE
There were no changes in or disagreements with accountants on accounting and financial disclosure.
Item 9A. CONTROLS AND PROCEDURES
Evaluation of disclosure controls and procedures
As of the end of the period covered by this report and pursuant to Rule 13a-15 of the Securities Exchange Act of 1934 (the “Exchange Act”), the Corporation’s management, including the Chief Executive Officer and Chief Financial Officer, conducted an evaluation of the effectiveness and design of the Corporation’s disclosure controls and procedures (as that term is defined in Rules 13a-15(e) and 15d-15(e) of the Exchange Act). Based upon that evaluation, the Corporation’s Chief Executive Officer and Chief Financial Officer concluded, as of the end of the period covered by this report, that the Corporation’s disclosure controls and procedures were effective in recording, processing, summarizing and reporting information required to be disclosed by the Corporation, within the time periods specified in the Securities and Exchange Commission’s rules and forms.
Changes inSee Report of Management on Page 84 for management’s report on the Corporation’s internal controlscontrol over financial reporting which is incorporated herein by reference.
In addition and as of the end of the period covered by this report, there have been no changes in internal control over financial reporting (as defined in Rule 13a-15(f) and 15d-15(f) of the Exchange Act) during the Corporation’s fourth fiscal quarter that have materially affected or are reasonably likely to materially affect, the internal control over financial reporting.
PART III
Item 10. DIRECTORS AND EXECUTIVE OFFICERS OF THE REGISTRANT
Information included under the following captions in the Corporation’s proxy statement relating to its 20042005 annual meeting of stockholders (the “2004“2005 Proxy Statement”) is incorporated herein by reference:
Additional information required by Item 10 with respect to executive officers is set forth in Part I, Item 4A hereof.
Item 11. EXECUTIVE COMPENSATION
Information included under the following captions in the 20042005 Proxy Statement is incorporated herein by reference:
Item 12. SECURITY OWNERSHIP OF CERTAIN BENEFICIAL OWNERS AND MANAGEMENT AND RELATED STOCKHOLDER MATTERS
Information included under the following caption in the 20042005 Proxy Statement is incorporated herein by reference:
12
Information included underSee also Note 1716 of the Notes inConsolidated Financial Statements for information on the 2003 Annual Report, including the table presentingCorporation’s equity compensation plan information, is incorporated herein by reference.plans.
Item 13. CERTAIN RELATIONSHIPS AND RELATED TRANSACTIONS
Information included under the following captions in the 20042005 Proxy Statement is incorporated herein by reference:
Item 14. PRINCIPAL ACCOUNTANT FEES AND SERVICES
Information included under the following captions in the 20042005 Proxy Statement is incorporated herein by reference:
PART IV
Item 15. EXHIBITS, FINANCIAL STATEMENT SCHEDULES AND REPORTS ON FORM 8-K
| (1 | ) | Financial Statements: | |||
| 85 | |||||
| |||||
Consolidated Statement of Income for the years ended December 31, 2004, 2003 | |||||
| 86 | |||||
Consolidated Balance Sheet at December 31, | |||||
| 87 | |||||
| 88 | |||||
Consolidated Statement of Cash Flows for the years ended December 31, 2004, 2003 | |||||
| 89 | |||||
| |||||
| 90 | |||||
| (2 | ) | Schedules: | |||
None | |||||
| (3 | ) | The exhibits filed as part of this report and exhibits incorporated herein by reference to other documents are listed in the Index to Exhibits to this Annual Report on Form 10-K (pages E-1 through | |||
With the exception of the information expressly incorporated herein by reference, the 2003 Annual Report and the 20042005 Proxy Statement areis not to be deemed filed as part of this Annual Report on Form 10-K.
13
SIGNATURES
Pursuant to the requirements of Section 13 of the Securities Exchange Act of 1934, the registrant has duly caused this report to be signed on its behalf by the undersigned, thereunto duly authorized.
Date: March 1, 20042005
| ||
By: | */s/ KENNETH D. LEWIS | |
Kenneth D. Lewis Chairman, President and Chief Executive Officer | ||
Pursuant to the requirements of the Securities Exchange Act of 1934, this report has been signed below by the following persons on behalf of the registrant and in the capacities and on the dates indicated.
Signature | Title | Date | ||
*/s/ KENNETH D. LEWIS Kenneth D. Lewis | Chairman, President, Chief Executive Officer and Director (Principal Executive Officer) | March 1, | ||
|
| |||
*/s/ MARC D. OKEN Marc D. Oken |
| March 1, | ||
*/s/
| Senior Vice President and Chief Accounting Officer (Principal Accounting Officer) | March 1, 2005 | ||
*/s/ WILLIAM BARNET, III William Barnet, III | Director | March 1, | ||
*/s/ CHARLES W. COKER Charles W. Coker | Director | March 1, | ||
*/s/
| Director | March 1, | ||
*/s/
| Director | March 1, | ||
*/s/ PAUL FULTON Paul Fulton | Director | March 1, | ||
*/s/ CHARLES K. GIFFORD Charles K. Gifford | Director | March 1, 2005 | ||
*/s/ DONALD E. GUINN Donald E. Guinn | Director | March 1, | ||
Walter E. Massey | Director | March 1, | ||
*/s/
| Director | March 1, | ||
|
| |||
14
Signature | Title | Date | ||
Patricia E. Mitchell | Director | March 1, 2005 | ||
*/s/ EDWARD L. ROMERO Edward L. Romero | Director | March 1, | ||
*/s/ THOMAS M. RYAN Thomas M. Ryan | Director | March 1, 2005 | ||
*/s/ O. TEMPLE SLOAN, JR. O. Temple Sloan, Jr. | Director | March 1, | ||
*/s/ MEREDITH R. SPANGLER Meredith R. Spangler | Director | March 1, | ||
|
| |||
*/s/ JACKIE M. WARD Jackie M. Ward | Director | March 1, | ||
|
| |||
*By: /s/
Attorney-in-Fact | ||||
15
INDEX TO EXHIBITS
| Exhibit No. | Description | |||
| 3(a) | Amended and Restated Certificate of Incorporation of registrant, as in effect on the date hereof, incorporated by reference to Exhibit 99.1 of registrant’s Current Report on Form 8-K filed May 7, 1999. | |||
| (b) | Certificate of Amendment of Amended and Restated Certificate of Incorporation of registrant, as in effect on the date hereof, incorporated by reference to Exhibit 3.1 of registrant’s Current Report on Form 8-K filed March 30, 2004. | |||
| (c) | Amended and Restated Bylaws of registrant, as in effect on the date hereof, incorporated by reference to Exhibit 99.1 of registrant’s Current Report on Form 8-K filed October 14, 2003. | |||
| 4(a) | Specimen certificate of registrant’s Common Stock, incorporated by reference to Exhibit 4.13 of registrant’s Registration No. 333-83503. | |||
| (b) | Specimen certificate of registrant’s | |||
| (c) | Amended Certificate of Designation of registrant’s 6.75 % Perpetual Preferred Stock, incorporated by reference to Exhibit 4.1 of registrant’s Current Report on Form 8-K filed March 30, 2004. | |||
| (d) | Amended Certificate of Designation of registrant’s Fixed/Adjustable Rate Cumulative Preferred Stock, incorporated by reference to Exhibit 4.2 of registrant’s Current Report on Form 8-K filed March 30, 2004. | |||
| (e) | Deposit Agreement relating to registrant’s Series VI 6.75% Perpetual Preferred Stock of Fleet Financial Group, Inc., dated as of February 21, 1996, by and among Fleet Financial Group, Inc., Fleet National Bank, as depositary, and the holders from time to time of the Depositary Shares, incorporated by reference to Exhibit 4.3 of registrant’s Current Report on Form 8-K filed March 30, 2004. | |||
| (f) | Amendment to the Deposit Agreement relating to registrant’s Series VI 6.75% Perpetual Preferred Stock of Fleet Financial Group, Inc. and dated as of February 21, 1996, effective as of April 1, 2004, by and between Bank of America Corporation and EquiServe, Inc., incorporated by reference to Exhibit 4.4 of registrant’s Current Report on Form 8-K filed March 30, 2004. | |||
| (g) | Deposit Agreement relating to registrant’s Series VII Fixed/Adjustable Rate Cumulative Preferred Stock of Fleet Financial Group, Inc., dated as of April 1, 1996, by and among Fleet Financial Group, Inc., Fleet National Bank, as depositary, and the holders from time to time of the Depositary Shares, incorporated by reference to Exhibit 4.5 of registrant’s Current Report on Form 8-K filed March 30, 2004. | |||
| (h) | Amendment to the Deposit Agreement relating to registrant’s Series VII Fixed/Adjustable Rate Cumulative Preferred Stock of Fleet Financial Group, Inc. and dated as of February 21, 1996, effective as of April 1, 2004, by and between Bank of America Corporation and EquiServe, Inc., incorporated by reference to Exhibit 4.6 of registrant’s Current Report on Form 8-K filed March 30, 2004. | |||
| (i) | Indenture dated as of September 1, 1989 between registrant (successor to NationsBank Corporation, formerly known as NCNB Corporation) and The Bank of New York, pursuant to which registrant issued its 9 3/8% Subordinated Notes, due 2009; and its 10.20% Subordinated Notes, due 2015, incorporated by reference to Exhibit 4.1 of registrant’s Registration No. 33-30717; and First Supplemental Indenture thereto dated as of August 28, 1998, incorporated by reference to Exhibit 4(f) of the 1998 10-K. | |||
| | Indenture dated as of November 1, 1992 between registrant (successor to NationsBank Corporation) and The Bank of New York, pursuant to which registrant issued its 6 7/8% Subordinated Notes, due 2005, incorporated by reference to Exhibit 4.1 of registrant’s Amendment to Application or Report on Form 8-K dated March 1, 1993; First Supplemental Indenture thereto dated as of July 1, 1993 pursuant to which registrant issued its Subordinated Medium-Term Notes, Series |
| Exhibit No. | Description | |||
| | Indenture dated as of January 1, 1995 between registrant (successor to NationsBank Corporation) and U.S. Bank Trust National Association (successor to BankAmerica National Trust Company), pursuant to which registrant issued its 6 3/8% Senior Notes, due 2005; its |
E-1
| ||||
| | Indenture dated as of January 1, 1995 between registrant (successor to NationsBank Corporation) and The Bank of New York, pursuant to which registrant issued its 7 5/8% Subordinated Notes, due 2005; its 7 3/4% Subordinated Notes, due 2015; its 7 1/4% Subordinated Notes, due 2025; its 6 1/2% Subordinated Notes, due 2006; its 7 1/2% Subordinated Notes, due 2006; its 7.80% Subordinated Notes, due 2016; its 6 3/8% Subordinated Notes, due 2008; its 6.80% Subordinated Notes, due 2028; its 6.60% Subordinated Notes, due 2010; its 7.80% Subordinated Notes due 2010; its 7.40% Subordinated Notes, due 2011; its 4 3/4% Subordinated Notes, due 2013; its 5 1/4% Subordinated Notes, due 2015; its 4 3/4% Fixed/Floating Rate Callable Subordinated Notes, due 2019 and its Subordinated Medium-Term Notes, Series F | |||
| | Amended and Restated Agency Agreement dated as of August 1, 2003 between registrant, Bank of America, N.A., JPMorgan Chase, London Branch, and J.P. Morgan Luxembourg S.A., incorporated by reference to Exhibit 4(m) of registrant’s Annual Report on Form 10-K for the fiscal year ended December 31, 2003. | |||
| | Amended and Restated Issuing and Paying Agency Agreement dated as of | |||
| | Indenture dated as of November 27, 1996 between registrant (successor to NationsBank Corporation) and The Bank of New York, incorporated by reference to Exhibit 4.10 of registrant’s Registration No. 333-15375. | |||
| | Second Supplemental Indenture dated as of December 17, 1996 to the Indenture dated as of November 27, 1996 between registrant (successor to NationsBank Corporation) and The Bank of New York pursuant to which registrant issued its 7.83% Junior Subordinated Deferrable Interest Notes due 2026, incorporated by reference to Exhibit 4.3 of registrant’s Current Report on Form 8-K dated December 10, 1996. | |||
| | Third Supplemental Indenture dated as of February 3, 1997 to the Indenture dated as of November 27, 1996 between registrant (successor to NationsBank Corporation) and The Bank of New York pursuant to which registrant issued its Floating Rate Junior Subordinated Deferrable Interest Notes due 2027, incorporated by reference to Exhibit 4.3 of registrant’s Current Report on Form 8-K dated January 22, 1997. | |||
| | Fourth Supplemental Indenture dated as of April 22, 1997 to the Indenture dated as of November 27, 1996 between registrant (successor to NationsBank Corporation) and The Bank of New York pursuant to which registrant issued |
| Exhibit No. | Description | |||
| its 8 1/4% Junior Subordinated Deferrable Interest Notes, due 2027, incorporated by reference to Exhibit 4.3 of registrant’s Current Report on Form 8-K dated April 15, 1997. | ||||
| | Fifth Supplemental Indenture dated as of August 28, 1998 to the Indenture dated as of November 27, 1996 between registrant and The Bank of New York, incorporated by reference to Exhibit 4(t) of the 1998 10-K. | |||
| | Indenture dated as of November 27, 1996, between Barnett Banks, Inc. and Bank One (successor to The First National Bank of Chicago), as Trustee, and First Supplemental Indenture dated as of January 9, 1998, among NationsBank Corporation, NB Holdings Corporation, Barnett Banks, Inc. and The First National Bank of Chicago (predecessor to Bank One), as Trustee, pursuant to which registrant (as successor to NationsBank Corporation) issued its 8.06% Junior Subordinated Debentures, due 2026, incorporated by reference to Exhibit 4(u) of registrant’s 1997 Annual Report on Form 10-K (the “1997 10-K”). | |||
| | Indenture dated as of November 1, 1991 between the former BankAmerica Corporation and J.P. Morgan Trust Company, National Association, as successor trustee to the former Manufacturers Hanover Trust Company of California, pursuant to which registrant (as successor to the former BankAmerica Corporation) issued its 7.20% Subordinated Notes due 2006; |
E-2
| ||||
| | Junior Subordinated Indenture dated as of November 27, 1996 between the former BankAmerica Corporation and Deutsche Bank Trust Company Americas, as successor trustee to Bankers Trust Company, pursuant to which registrant (as successor to the former BankAmerica Corporation) issued its 8.07% Junior Subordinated Debentures Series A due 2026; and its 7.70% Junior Subordinated Debentures Series B due 2026; and First Supplemental Indenture thereto dated as of September 15, 1998, incorporated by reference to Exhibit 4(z) of the 1998 10-K. | |||
| | Junior Subordinated Indenture dated as of December 20, 1996 between the former BankAmerica Corporation and Deutsche Bank Trust Company Americas, as successor trustee to Bankers Trust Company, pursuant to which registrant (as successor to the former BankAmerica Corporation) issued its 8.00% Junior Subordinated Deferrable Interest Debentures, Series 2 due 2026 and its Floating Rate Junior Subordinated Deferrable Interest Debentures, Series 3 due 2027; and First Supplemental Indenture thereto dated as of September 15, 1998, incorporated by reference to Exhibit 4(aa) of the 1998 10-K. | |||
| | Restated Senior Indenture dated as of January 1, 2001 between registrant and The Bank of New York, pursuant to which registrant issued its Senior InterNotesSM, incorporated by reference to Exhibit 4.1 of registrant’s Registration No. 333-47222. | |||
| | Restated Subordinated Indenture dated as of January 1, 2001 between registrant and The Bank of New York, pursuant to which registrant issued its Subordinated InterNotesSM, incorporated by reference to Exhibit 4.2 of registrant’s Registration No. 333-47222. | |||
| | Amended and Restated Senior Indenture dated as of July 1, 2001 between registrant and The Bank of New York, pursuant to which registrant issued its Senior InterNotesSM, incorporated by reference to Exhibit 4.1 of registrant’s Registration No. 333-65750. | |||
| | Amended and Restated Subordinated Indenture dated as of July 1, 2001 between registrant and The Bank of New York, pursuant to which registrant issued its Subordinated InterNotesSM, incorporated by reference to Exhibit 4.2 of registrant’s Registration No. 333-65750. | |||
| | Restated Indenture dated as of November 1, 2001 between registrant and The Bank of New York, incorporated by reference to Exhibit 4.10 of registrant’s Registration No. 333-70984. |
| Exhibit No. | Description | |||
| | First Supplemental Indenture dated as of December 14, 2001 to the Restated Indenture dated as of November 1, 2001 between registrant and The Bank of New York pursuant to which registrant issued its 7% Junior Subordinated Notes due 2031, incorporated by reference to Exhibit 4.3 of registrant’s Current Report on Form 8-K dated December 6, 2001. | |||
| | Second Supplemental Indenture dated as of January 31, 2002 to the Restated Indenture dated as of November 1, 2001 between registrant and The Bank of New York pursuant to which registrant issued its 7% Junior Subordinated Notes due 2032, incorporated by reference to Exhibit 4.3 of registrant’s Current Report on Form 8-K dated January 24, 2002. | |||
| | Third Supplemental Indenture dated as of August 9, 2002 to the Restated Indenture dated as of November 1, 2001 between registrant and The Bank of New York pursuant to which registrant issued its 7% Junior Subordinated Notes due 2032, incorporated by reference to Exhibit 4.3 of registrant’s Current Report on Form 8-K dated August 2, 2002. | |||
| | Fourth Supplemental Indenture dated as of April 30, 2003 between registrant and The Bank of New York pursuant to which registrant issued its 5 7/8% Junior Subordinated Notes due 2033, incorporated by reference to Exhibit 4.3 of registrant’s Current Report on Form 8-K dated April 23, 2003. | |||
| (gg) | Fifth Supplemental Indenture dated as of November 3, 2004 between registrant and The Bank of New York pursuant to which registrant issued its 6% Junior Subordinated Notes due 2034, incorporated by reference to Exhibit 4.3 of registrant’s Current Report on Form 8-K dated October 21, 2004. | |||
| (hh) | Indenture dated as of November 26, 1996 between registrant (successor to Bank of Boston Corporation) and The Bank of New York, as Debenture Trustee, pursuant to which registrant issued its 8.25% Junior Subordinated Deferrable Interest Debentures due 2026, incorporated by reference to Exhibit 4.1 to BankBoston Corporation’s Registration Statement on Form S-4 (File No. 333-19083); First Supplemental Indenture thereto dated as of October 1, 1999; and Second Supplemental Indenture thereto dated as of March 18, 2004. | |||
| (ii) | Indenture dated as of December 10, 1996 between registrant (successor to Bank of Boston Corporation) and The Bank of New York, as Trustee, pursuant to which registrant issued its 7 3/4% Junior Subordinated Deferrable Interest Debentures due 2026, incorporated by reference to Exhibit 4.1 to BankBoston Corporation’s Registration Statement on Form S-4 (File No. 333-19111); First Supplemental Indenture thereto dated as of October 1, 1999; and Second Supplemental Indenture thereto dated as of March 18, 2004. | |||
| (jj) | Indenture dated as of June 4, 1997 between registrant (successor to BankBoston Corporation) and The Bank of New York, as Trustee, pursuant to which registrant issued its Floating Rate Junior Subordinated Deferrable Interest Debentures due 2027, incorporated by reference to Exhibit 4.1 to BankBoston Corporation’s Registration Statement on Form S-3 (File No. 333-27229); First Supplemental Indenture thereto dated as of October 1, 1999; and Second Indenture thereto dated as of March 18, 2004. | |||
| (kk) | Indenture dated as of December 11, 1996 between registrant (successor to Fleet Financial Group, Inc.) and The First National Bank of Chicago (predecessor to Bank One), as Trustee, incorporated by reference to Exhibit 4(b) of Fleet Financial Group, Inc.’s Current Report on Form 8-K (File No. 1-6366) dated December 20, 1996; First Supplemental Indenture thereto dated as of December 11, 1996 pursuant to which registrant issued its 7.92% Junior Subordinated Deferrable Interest Debentures due 2026, incorporated by reference to Exhibit 4(c) of Fleet Financial Group, Inc.’s Current Report on Form 8-K (File No. 1-6366) dated December 20, 1996; and Third Supplemental Indenture thereto dated as of March 18, 2004. | |||
| (ll) | Indenture dated as of December 18, 1998 between registrant (successor to Fleet Financial Group, Inc.) and The First National Bank of Chicago (predecessor to Bank One), as Trustee, incorporated by reference to Exhibit | |||
| 4(b) of Fleet Financial Group, Inc.’s Current Report on Form 8-K (File No. 1-6366) dated December 18, 1998; First Supplemental Indenture thereto dated as of December 18, 1998 pursuant to which registrant issued its Floating Rate Junior Subordinated Deferrable Interest Debentures due 2028, incorporated by reference to Exhibit 4(c) to Fleet Financial Group, Inc.’s Current Report on Form 8-K (File No. 1-6366) dated December 18, 1998; and Second Supplemental Indenture thereto dated as of March 18, 2004. |
E-3
| Exhibit No. | Description | |||
| (mm) | Indenture dated as of June 30, 2000 between registrant (successor to FleetBoston Financial Corporation) and The Bank of New York, as Trustee, incorporated by reference to Exhibit 4(b) of FleetBoston Financial Corporation’s Current Report on Form 8-K dated (File No. 1-6366) June 30, 2000. | |||
| (nn) | First Supplemental Indenture dated as of June 30, 2000 to the Indenture dated as of June 30, 2000 between registrant (successor to FleetBoston Financial Corporation) and The Bank of New York pursuant to which registrant issued its 8.80% Junior Subordinated Deferrable Interest Debentures due 2030, incorporated by reference to Exhibit 4(c) of FleetBoston Financial Corporation’s Current Report on Form 8-K (File No. 1-6366) dated June 30, 2000. | |||
| (oo) | Second Supplemental Indenture dated as of September 17, 2001 to the Indenture dated as of June 30, 2000 between registrant (successor to FleetBoston Financial Corporation) and The Bank of New York pursuant to which registrant issued its 7.20% Junior Subordinated Deferrable Interest Debentures due 2031, incorporated by reference to Exhibit 2.6 to FleetBoston Financial Corporation’s Registration Statement on Form 8-A (File No. 1-6366) filed on September 21, 2001. | |||
| (pp) | Third Supplemental Indenture dated as of March 8, 2002 to the Indenture dated as of June 30, 2000 between registrant (successor to FleetBoston Financial Corporation) and The Bank of New York pursuant to which registrant issued its 7.20% Junior Subordinated Deferrable Interest Debentures due 2032, incorporated by reference to Exhibit 2.7 to FleetBoston Financial Corporation’s Registration Statement on Form 8-A (File No. 1-6366) filed on March 8, 2002. | |||
| (qq) | Fourth Supplemental Indenture dated as of July 31, 2003 to the Indenture dated as of June 30, 2000 between registrant (successor to FleetBoston Financial Corporation) and The Bank of New York pursuant to which registrant issued its 6.00% Junior subordinated Deferrable Interest Debentures due 2033, incorporated by reference to Exhibit 2.8 to FleetBoston Financial Corporation’s Registration Statement on Form 8-A (File No. 1-6366) filed on July 31, 2003. | |||
| (rr) | Fifth Supplemental Indenture dated as of March 18, 2004 to the Indenture dated as of June 30, 2000 between the registrant (successor to FleetBoston Financial Corporation) and The Bank of New York. | |||
| (ss) | Indenture dated December 6, 1999 between registrant (successor to Fleet Boston Corporation) and the Bank of New York, as Trustee, pursuant to which registrant issued its 7.25% Senior Notes, due 2005; its 4 7/8% Senior Notes, due 2006; its 3.85% Senior Notes, due 2008; and its Senior Medium-Term Notes, Series T, incorporated by reference to Exhibit 4(a) to FleetBoston Financial Corporation’s Registration Statement on Form S-3 (File No. 333-72912); and First Supplemental Indenture thereto dated as of March 18, 2004, incorporated by reference to Exhibit 4.61 of registrant’s Registration Statement on Form S-3/A (File No. 333-112708). | |||
| (tt) | Indenture dated October 1, 1992 between registrant (successor to Fleet Financial Group, Inc.) and The First National Bank of Chicago (predecessor to J.P. Morgan Trust Company, N.A.), as Trustee, incorporated by reference to Exhibit 4(d) to Fleet Financial Group, Inc.’s Registration Statement on Form S-3/A (File No. 33-50216) pursuant to which registrant issued its 7 1/8% Subordinated Notes, due 2006; its 6 7/8% Subordinated Notes, due 2028; its 6½% Subordinated Notes, due 2008; its 6 3/8% Subordinated Notes, due 2008; its 6.70% Subordinated Notes, due 2028; and its 7 3/8% Subordinated Notes, due 2009; First Supplemental Indenture thereto dated as of November 30, 1992, incorporated by reference to Exhibit 4 of Fleet Financial Group, Inc.’s Current Report on Form 8-K (File No. 1-06366) filed December 2, 1992; and | |||
| Second Supplemental Indenture thereto dated as of March 18, 2004, incorporated by reference to Exhibit 4.59 of registrant’s Registration Statement on Form S-3/A (File No. 333-112708). |
| Exhibit No. | Description | |||
| (uu) | Indenture dated June 15, 1992 between registrant (successor to Bank of Boston Corporation) and Norwest Bank Minnesota, National Association (predecessor to Wells Fargo Bank, N.A.), incorporated by reference to Exhibit 4(d) to Bank of Boston Corporation’s Registration Statement on Form S-3 (File No. 333-48418) pursuant to which registrant issued its 6 5/8% Subordinated Notes, due 2005; First Supplemental Indenture thereto dated as of June 24, 1993, incorporated by reference to Exhibit 4(e) of Bank of Boston Corporation’s Current Report on Form 8-K (File No. 1-6522) filed June 24, 1993; Second Supplemental Indenture thereto dated as of October 1, 1999, incorporated by reference to Exhibit 4.52 of registrant’s Registration Statement on Form S-3/A (File No. 333-112708); and Third Supplemental Indenture thereto dated as of March 18, 2004, incorporated by reference to Exhibit 4.53 of registrant’s Registration Statement on Form S-3/A (File No. 333-112708). | |||
| The registrant has other long-term debt agreements, but these are not material in amount. Copies of these agreements will be furnished to the Commission on request. | ||||
| 10(a) | NationsBank Corporation and Designated Subsidiaries Supplemental Executive Retirement Plan, incorporated by reference to Exhibit 10(j) of the 1994 10-K; Amendment thereto dated as of June 28, 1989, incorporated by reference to Exhibit 10(g) of registrant’s 1989 Annual Report on Form 10-K (the “1989 10-K”); Amendment thereto dated as of June 27, 1990, incorporated by reference to Exhibit 10(g) of registrant’s 1990 Annual Report on Form 10-K (the “1990 10-K”); Amendment thereto dated as of July 21, 1991, incorporated by reference to Exhibit 10(bb) of the 1991 10-K; Amendments thereto dated as of December 3, 1992 and December 15, 1992, incorporated by reference to Exhibit 10(l) of registrant’s 1992 Annual Report on Form 10-K (the “1992 10-K”); Amendment thereto dated as of September 28, 1994, incorporated by reference to Exhibit 10(j) of registrant’s 1994 Annual Report on Form 10-K (the “1994 Form 10-K”); Amendments thereto dated March 27, 1996 and June 25, 1997, incorporated by reference to Exhibit 10(c) of the 1997 10-K; Amendments thereto dated April 10, 1998, June 24, 1998 and October 1, 1998, incorporated by reference to Exhibit 10(b) of the 1998 10-K; Amendment thereto dated December 14, 1999, incorporated by reference to Exhibit 10(b) of registrant’s 1999 Annual Report on Form 10-K (the “1999 10-K”); and Amendment thereto dated as of March 28, 2001, incorporated by reference to Exhibit 10(b) of registrant’s 2001 Annual Report on Form 10-K (the “2001 10-K”); and Amendment thereto dated December 10, 2002, incorporated by reference to Exhibit 10(b) of registrant’s 2002 Annual Report on Form 10-K (the “2002 10-K”). | * | ||
| (b) | NationsBank Corporation and Designated Subsidiaries Deferred Compensation Plan for Key Employees, incorporated by reference to Exhibit 10(k) of the 1994 10-K; Amendment thereto dated as of June 28, 1989, incorporated by reference to Exhibit 10(h) of the 1989 10-K; Amendment thereto dated as of June 27, 1990, incorporated by reference to Exhibit 10(h) of the 1990 10-K; Amendment thereto dated as of July 21, 1991, incorporated by reference to Exhibit 10(bb) of the 1991 10-K; Amendment thereto dated as of December 3, 1992, incorporated by reference to Exhibit 10(m) of the 1992 10-K; and Amendments thereto dated April 10, 1998 and October 1, 1998, incorporated by reference to Exhibit 10(b) of the 1998 10-K. | * | ||
| (c) | Bank of America Pension Restoration Plan, as amended and restated effective January 1, | * | ||
| (d) | NationsBank Corporation Benefit Security Trust dated as of June 27, 1990, incorporated by reference to Exhibit 10(t) of the 1990 10-K; First Supplement thereto dated as of November 30, 1992, incorporated by reference to Exhibit 10(v) of the 1992 10-K; and Trustee Removal/Appointment Agreement dated as of December 19, 1995, incorporated by reference to Exhibit 10(o) of registrant’s 1995 Annual Report on Form 10-K. | * | ||
| (e) | Bank of America 401(k) Restoration Plan, as amended and restated effective January 1, 2002, incorporated by reference to Exhibit 10(f) of the 2002 10-K. | * | ||
| Exhibit No. | Description | |||
| (f) | Bank of America Executive Incentive Compensation Plan, as amended and restated effective December 10, 2002, incorporated by reference to Exhibit 10(g) of the 2002 10-K. | * | ||
| (g) | Bank of America Director Deferral Plan, as amended and restated effective January 27, 1999, incorporated by reference to Exhibit 10(i) of the 1998 10-K; Amendment thereto dated April 24, 2002, incorporated by reference to Exhibit 10(h) of the 2002 10-K; and Bank of America Corporation Director Deferral Plan, as amended and restated, effective December 10, 2002, incorporated by reference to Exhibit 10(h) of the 2002 10-K. | * | ||
| (h) | Bank of America Corporation Directors’ Stock Plan, as amended and restated effective January 1, 2002, incorporated by reference to Exhibit 10(j) of the 2001 10-K; Amendment thereto dated April 24, 2002, incorporated by reference to Exhibit 10(i) of the 2002 10-K; and Bank of America Corporation Directors’ Stock Plan, as amended and restated effective December 10, 2002, incorporated by reference to Exhibit 10(i) of the 2002 | * | ||
| (i) | Bank of America Corporation 2003 Key Associate Stock Plan, effective January 1, 2003, as amended and restated effective April 1, 2004, incorporated by reference to Exhibit | * | ||
E-4
| ||||
| (j) | Split Dollar Life Insurance Agreement dated as of October 16, 1998 between registrant and NationsBank, N. A., as Trustee under that certain Irrevocable Trust Agreement No. 2 dated October 1, 1998, by and between James H. Hance, Jr., as Grantor, and NationsBank, N. A., as Trustee, incorporated by reference to Exhibit 10(dd) of the 1998 10-K; and Amendment thereto dated January 24, 2002, incorporated by reference to Exhibit 10(o) of the 2001 10-K. | * | ||
| (k) | Split Dollar Life Insurance Agreement dated as of September 28, 1998 between registrant and J. Steele Alphin, as Trustee under that certain Irrevocable Trust Agreement dated June 23, 1998, by and between Kenneth D. Lewis, as Grantor, and J. Steele Alphin, as Trustee, incorporated by reference to Exhibit 10(ee) of the 1998 10-K; and Amendment thereto dated January 24, 2002, incorporated by reference to Exhibit 10(p) of the 2001 10-K. | * | ||
| (l) | ||||
| Global Corporate and Investment Banking Equity Incentive Plan, as established effective January 1, 2000, incorporated by reference to Exhibit 10(t) of the 2000 10-K. | * | |||
| (m) | Bank of America Corporation Equity Incentive Plan; Amendment thereto dated March 4, 2003; Amendment thereto dated October 9, 2004; and Amendment thereto dated December 12, 2004. | |||
| | ||||
| Bank of America Corporation 2002 Associates Stock Option Plan, effective February 1, 2002, incorporated be reference to Exhibit 10(s) of the 2002 10-K. | ||||
| Take Ownership!, The BankAmerica Global Associate Stock Option Program, effective October 1, 1998, incorporated by reference to Exhibit 10(t) of the 2002 10-K. | ||||
| Barnett Bank Employee Stock Option Plan, effective January 13, 1997, incorporated by reference to Exhibit 10(u) of the 2002 10-K. | ||||
| Amendment to various plans in connection with FleetBoston Financial Corporation | ||||
| (r) | FleetBoston Supplemental Executive Retirement Plan, as amended by Amendment One thereto effective January 1, 1997; Amendment Two thereto effective October 15, 1997; Amendment Three thereto effective July 1, 1998; Amendment Four thereto effective August 15, 1999; Amendment Five thereto effective January 1, 2000; Amendment Six thereto effective October 10, 2001; Amendment Seven thereto effective February 19, 2002; Amendment Eight thereto effective October 15, 2002; Amendment Nine thereto effective January 1, 2003; Amendment Ten thereto effective October 21, 2003; and Amendment Eleven thereto effective December 31, 2004. | |||
| (s) | FleetBoston Amended and Restated 1992 Stock Option and Restricted Stock Plan. | |||
| Exhibit No. | Description | ||||
| (t | ) | FleetBoston Executive Deferred Compensation Plan No. 1, as amended by Amendment One thereto effective January 1, 2000; Amendment Two thereto effective January 1, 2003; and Amendment Three thereto effective December 16, 2003. | |||
| (u | ) | FleetBoston Executive Deferred Compensation Plan No. 2, as amended by Amendment One thereto effective February 1, 1999; Amendment Two thereto effective January 1, 2000; Amendment Three thereto effective January 1, 2002; Amendment Four thereto effective October 15, 2002; Amendment Five thereto effective January 1, 2003; and Amendment Six thereto effective December 16, 2003. | |||
| (v | ) | FleetBoston Executive Supplemental Plan, as amended by Amendment One thereto effective January 1, 2000; Amendment Two thereto effective January 1, 2002; Amendment Three thereto effective January 1, 2003; Amendment Four thereto effective January 1, 2003; and Amendment Five thereto effective December 31, 2004. | |||
| (w | ) | FleetBoston Retirement Income Assurance Plan, as amended by Amendment One thereto effective January 1, 1997; Amendment Two thereto effective January 1, 2000; Amendment Three thereto effective November 1, 2001; Amendment Four thereto effective January 1, 2003; Amendment Five thereto effective December 16, 2003; and Amendment Six thereto effective December 31, 2004. | |||
| (x | ) | Trust Agreement for the FleetBostonExecutive Deferred Compensation Plans No. 1 and 2 | |||
| (y | ) | Trust Agreement for the FleetBoston Executive Supplemental Plan. | |||
| (z | ) | Trust Agreement for the FleetBoston Retirement Income Assurance Plan and the FleetBoston Supplemental Executive Retirement Plan. | |||
| (aa | ) | FleetBoston Directors Deferred Compensation and Stock Unit Plan, as amended by an amendment thereto effective as of July 1, 2000; a Second Amendment thereto effective as of January 1, 2003; a Third Amendment thereto dated April 14, 2003; and a Fourth Amendment thereto effective January 1, 2004. | |||
| (bb | ) | FleetBoston 1996 Long-Term Incentive Plan. | |||
| (cc | ) | BankBoston Corporation and its Subsidiaries Deferred Compensation Plan, as amended by a First Amendment thereto; a Second Amendment thereto; a Third Amendment thereto; an Instrument thereto (providing for the cessation of accruals effective December 31, 2000) and an Amendment thereto dated December 24, 2001. | |||
| (dd | ) | BankBoston, N.A. Bonus Supplemental Employee Retirement Plan, as amended by a First Amendment, a Second Amendment, a Third Amendment and a Fourth Amendment thereto. | |||
| (ee | ) | Description of BankBoston Supplemental Life Insurance Plan. | |||
| (ff | ) | BankBoston, N.A. Excess Benefit Supplemental Employee Retirement Plan, as amended by a First Amendment, a Second Amendment and a Third Amendment thereto (assumed by FleetBoston on October 1, 1999). | |||
| (gg | ) | Description of BankBoston Supplemental Long-Term Disability Plan. | |||
| (hh | ) | BankBoston Director Stock Award Plan. | |||
| (ii | ) | BankBoston Directors Deferred Compensation Plan, as amended by a First Amendment and a Second Amendment thereto. | |||
| (jj | ) | BankBoston, N.A. Directors Deferred Compensation Plan, as amended by a First Amendment and a Second Amendment thereto. | |||
| (kk | ) | BankBoston 1997 Stock Option Plan for Non-Employee Directors, as amended by an amendment thereto dated as of October 16, 2001. | |||
| (ll | ) | Description of BankBoston Director Retirement Benefits Exchange Program. | |||
| (mm | ) | Employment Agreement, dated as of March 14, 1999, between FleetBoston and Charles K. Gifford, as amended by an amendment thereto effective as of February 7, 2000; a Second Amendment thereto effective as of April 22, 2002; and a Third Amendment thereto effective as of October 1, 2002. | |||
| (nn | ) | Form of Change in Control Agreement entered into with Charles K. Gifford. |
| Exhibit No. | Description | |||
| (oo) | Global amendment to definition of “change in control” or “change of control,” together with a list of plans affective by such amendment. | |||
| (pp) | Employment Agreement dated October 27, 2003 between Bank of America Corporation and Brian T. Moynihan, incorporated by reference to Exhibit 10(d) of registrant’s Registration Statement on Form S-4 (File No. 333-110924). | |||
| (qq) | Employment Agreement dated October 27, 2003 between Bank of America Corporation and H. Jay Sarles, incorporated by reference to Exhibit 10(b) of registrant’s Registration Statement on Form S-4 (File No. 333-110924). | |||
| (rr) | Retirement Agreement dated January 26, 2005 between Bank of America Corporation and Charles K. Gifford, incorporated by reference to Exhibit 10.1 to the registrant’s Form 8-K filed on January 26, 2005. | |||
| (ss) | Amendment to various FleetBoston stock option awards, dated March 25, 2004. | |||
| (tt) | Agreement and Plan of Merger, dated as of October 27, 2003, by and between FleetBoston Financial Corporation and Bank of America Corporation, incorporated by reference to Exhibit 99.1 of registrant’s Current Report on Form 8-K filed October 28, 2003. | |||
| 12 | Ratio of Earnings to Fixed Charges. | |||
| Ratio of Earnings to Fixed Charges and Preferred Dividends. | ||||
| 21 | List of Subsidiaries. | |||
| 23 | Consent of PricewaterhouseCoopers LLP. | |||
| 24(a) | Power of Attorney. | |||
| (b) | Corporate Resolution. | |||
| 31(a) | Certification of the Chief Executive Officer pursuant to Section 302 of the Sarbanes-Oxley Act of 2002 | |||
| (b) | Certification of the Chief Financial Officer pursuant to Section 302 of the Sarbanes-Oxley Act of 2002 | |||
| 32(a) | Certification of the Chief Executive Officer pursuant to 18 U.S.C. Section 1350, as adopted pursuant to Section 906 of the Sarbanes-Oxley Act of 2002 | |||
| (b) | Certification of the Chief Financial Officer pursuant to 18 U.S.C. Section 1350, as adopted pursuant to Section 906 of the Sarbanes-Oxley Act of 2002 | |||
| * | Denotes executive compensation plan or arrangement. |
E-5E-9