Crown Castle International completed its merger with Global Signal, Inc. in 2007. As a result of these consolidations, American Tower and Crown Castle are substantially larger and have greater financial resources than us which provides them advantages with respect to leasing terms with wireless services providers or ability to acquire available towers. Wireless service providers that own and operate their own tower networks and several of the other tower companiesare also generally are substantially larger and have greater financial resources than we do. We believe that tower location and capacity, quality of service, density within a geographic market and, to a lesser extent, price historically have been and will continue to be the most significant competitive factors affecting the site leasing business.
Our primary competitors for our site leasing activities and building and/or acquiring new tower assets are fivethe large independent tower companies, American Tower Corporation and Crown Castle International Corp., Global Signal, Inc., SpectraSite, Inc., and AAT Communications Corp., and a large number of smaller independent tower owners. In addition, we compete with AT&T Wireless, Sprint PCS and other wireless service providers who currently market excess space on their owned towers to other wireless service providers.
The site development business is extremely competitive and price sensitive. We believe that the majority of our competitors in the site development business operate within local market areas exclusively, while some firms appear to offer their services nationally, including American Tower Corporation, Alcoa Fujikura Ltd., Bechtel Corporation, Black & Veach Corporation, General Dynamics Corporation, LCC International, Inc. and Wireless Facilities, Inc. The market includes participants from a variety of market segments offering individual, or combinations of, competing services. The field of competitors includes site development consultants, zoning consultants, real estate firms, right-of-way consulting firms, construction companies, tower owners/managers, radio frequency engineering consultants, telecommunications equipment vendors, which provide end-to-end site development services through multiple subcontractors, and wireless service providers’ internal staff. We believe that providers base their decisions for site development services on a number of criteria, including a company’s experience, track record, local reputation, price and time for completion of a project. We believe that weour experience base and our established relationships with wireless service providers have allowed us to favorably compete favorablyfor higher margin site development contracts, which has resulted in these areas.
increasing margins in this segment during 2006 as compared to prior years.
Employees
As of December 31, 2003,2006, we had approximately 600615 employees, none of whom isare represented by a collective bargaining agreement. We consider our employee relations to be good.
Regulatory and Environmental Matters
Federal Regulations.Both the FCCFederal Communications Commission (the “FCC”) and the FAAFederal Aviation Administration (the “FAA”) regulate antenna towers and structures that support wireless communications and radio or television antennas. Many FAA requirements are implemented in FCC regulations. These regulations govern the construction, lighting and painting or other marking of towers and structures and may, depending on the characteristics of particular towers or structures, require prior approval and registration of towers or structures. Wireless communications equipment and radio or television stations operating on towers or structures are separately regulated and may require independent licensing depending upon the particular frequency or frequency band used.
Pursuant to the requirements of the Communications Act of 1934, as amended, the FCC, in conjunction with the FAA, has developed standards to consider proposals involving new or modified antenna towers or structures.
These standards mandate that the FCC and the FAA consider the height of the proposed tower or structure, the relationship of the tower or structure to existing natural or man-made obstructions and the proximity of the tower or structure to runways and airports. Proposals to construct or to modify existing towers or structures above certain heights must be reviewed by the FAA to ensure the structure will not present a hazard to air navigation. The FAA may condition its issuance of a no-hazard determination upon compliance with specified lighting and/or painting requirements. Antenna towers that meet certain height and location criteria must also be registered with the FCC. A tower or structure that
requires FAA clearance will not be registered by the FCC until it is cleared by the FAA. Upon registration, the FCC may also require special lighting and/or painting. Owners of wireless communications antenna towers and structures may have an obligation to maintain painting and lighting or other marking in conformance with FAA and FCC standards. Antenna tower and structure owners and licensees that operate on those towers or structures also bear the responsibility of monitoring any lighting systems and notifying the FAA of any lighting outage or malfunction. In addition, any applicant for an FCC antenna tower or structure registration must certify that, consistent with the Anti-Drug Abuse Act of 1988, neither the applicant nor its principals are subject to a denial of Federal benefits because of a conviction for the possession or distribution of a controlled substance. We generally indemnify our customers against any failure to comply with applicable regulatory standards.standards relating to the construction, modification, or placement of antenna towers or structures. Failure to comply with the applicable requirements may lead to civil penalties.
The Telecommunications Act of 1996 amended the Communications Act of 1934 by preserving state and local zoning authorities’ jurisdiction over the construction, modification and placement of towers. The law, however, limits local zoning authority by prohibiting any action that would (1) discriminate among different providers of personal wireless services or (2) ban altogether the construction, modification or placement of radio communication towers. Finally, the Telecommunications Act of 1996 requires the federal government to help licensees for wireless communications services gain access to preferred sites for their facilities. This may require that federal agencies and departments work directly with licensees to make federal property available for tower facilities.
Owners and operators of antenna towers and structures may be subject to, and therefore must comply with, environmental laws. Any licensed radio facility on an antenna tower or structure is subject to environmental review pursuant to the National Environmental Policy Act of 1969, among other statutes, which requires federal agencies to evaluate the environmental impact of their decisions under certain circumstances. The FCC has issued regulations implementing the National Environmental Policy Act. These regulations place responsibility on applicants to investigate potential environmental effects of their operations and to disclose any potential significant effects on the environment in an environmental assessment prior to constructing or modifying an antenna tower or structure and prior to commencing certain operation of wireless communications or radio or television stations from the tower or structure. In the event the FCC determines the proposed structure or operation would have a significant environmental impact based on the standards the FCC has developed, the FCC would be required to prepare an environmental impact statement, which will be subject to public comment. This process could significantly delay the registration of a particular tower or structure.
As an owner and operator of real property, we are subject to certain environmental laws that impose strict, joint and several liability for the cleanup of on-site or off-site contamination and related personal or property damage. We are also subject to certain environmental laws that govern tower or structure placement, including pre-construction environmental studies. Operators of towers or structures must also take into consideration certain radio frequency (“RF”) emissions regulations that impose a variety of procedural and operating requirements. Certain proposals to operate wireless communications and radio or television stations from antenna towers and structures are also reviewed by the FCC to ensure compliance with requirements relating to human exposure to RF emissions. Exposure to high levels of RF energy can produce negative health effects. The potential connection between low-level RF energy and certain negative health effects, including some forms of cancer, has been the subject of substantial study by the scientific community in recent years. We believe that we are in substantial compliance with and we have no material liability under any applicable environmental laws. These costs of compliance with existing or future environmental laws and liability related thereto may have a material adverse effect on our prospects, financial condition or results of operations.
State and Local Regulations.Most states regulate certain aspects of real estate acquisition, leasing activities and construction activities. Where required, we conduct the site acquisition portions of our site development services business through licensed real estate brokers’ agents, who may be our employees or hired as independent contractors, and conduct the construction portions of our site development services
through licensed contractors, who may be our employees or independent contractors.
Local regulations include city and other local ordinances, zoning restrictions and restrictive covenants imposed by community developers. These regulations vary greatly from jurisdiction to jurisdiction, but typically require tower and structure owners to obtain approval from local officials or community standards organizations, or certain other entities prior to tower or structure construction and establish regulations regarding maintenance and removal of towers or structures. In addition, many local zoning authorities require tower and structure owners to post bonds or cash collateral to secure their removal obligations. Local zoning authorities generally have been unreceptive to construction of new antenna towers and structures in their communities because of the height and visibility of the towers or structures, and have, in some instances, instituted moratoria.
Backlog
Our backlogBacklog related to our site leasing business consists of pending leases for antenna space on our towers varies from time to timelease agreements and reflects the relatively short-cycle of three to six months of the antenna space leasing process. Leasing backlogs vary widely within a fiscal quarter, and are generally lowest on the last day of a quarter as our customers strive to meet their own quarterly antenna site deployment goals.amendments, which have been signed, but have not yet commenced. As of December 31, 20032006, we had136 179 new leases and 15 amendments which had been executed with customers but which had not begun generating revenue. These leases contractually provided for approximately $2.8$3.7 million of annual revenues. As ofrevenue. By comparison, at December 31, 20022005 we had150 122 new leases and 9 amendments which had been executed with customers but which had not begun generating revenue. These leases contractually provided for approximately $3.3$2.6 million of annual revenues.
revenue.
Our backlog for site development services was approximately $80$37.4 million of contractually committed revenue as of December 31, 2006 as compared to approximately $47.5 million as of December 31, 2003 as compared to approximately $29 million as of December 31, 2002.2005. The increasedecrease in 20032006 is attributable to a 2003 contract received fromsigned with Sprint for site development work whichthat is expected to result in revenues of $70be completed by early 2008. This contract represented approximately $11.7 million to $90 million over a two year period of which approximately $60 million is reflected in backlog as of December 31, 2003. We had no2006 and approximately $25.8 million in backlog for pending tower acquisitions as of December 31, 2003.2005.
Availability of Reports and Other Information
Our corporate website iswww.sbasite.com. We make available, free of charge, access to our Annual Report on Form 10-K, Quarterly Reports on Form 10-Q, Current Reports on Form 8-K, Proxy Statement on Schedule 14A and amendments to those materials filed or furnished pursuant to Section 13(a) or 15(d) of the Securities and Exchange Act of 1934 on our website under “Investor Relations—SEC Filings,” as soon as reasonably practicable after we file electronically such material with, or furnish it to, the United States Securities and Exchange Commission (the “Commission”). In addition, the Commission’s website iswww.sec.gov. The Commission makes available on this website, free of charge, reports, proxy and information statements, and other information regarding issuers, such as us, that file electronically with the Commission. Additionally, our reports, proxy and information statements may be read and copied at the Commission’s public reference room at 100 F Street, NE, Washington, DC 20549. Information on our website or the Commission’s website is not part of this document.
| ITEM 1A. | RISK FACTORS |
Risks Related to Our Business
We may not secure as many site leasing tenants as planned or our lease rates for new tenant leases may decline.
If tenant demand for tower space or our lease rates on new leases decrease, we may not be able to servicesuccessfully grow our substantial indebtedness.
As indicated below, we have and will continue to have a significant amount of indebtedness relative to our equity.
| As of December 31, | ||||||
| 2003 | 2002 | |||||
| (in thousands) | ||||||
Total indebtedness* | $ | 866,199 | $ | 1,019,046 | ||
Shareholders’ equity | $ | 43,877 | $ | 203,490 | ||
Our ability to service our debt obligations will depend on our future operating performance. Our earnings were insufficient to cover our fixed charges for the year ended December 31, 2003 by $162 million and $184 million for the year ended December 31, 2002. Subsequent to December 31, 2003 we obtained a new senior credit facility. A portion of the proceeds from this facility were used to repay the then existing credit facility, to purchase 12% senior discount notes in the open market, to redeem all 12% senior discount notes outstanding on March 1, 2004, and to repurchase 10¼% senior notes in the open market. As adjusted for these transactions, we would require approximately $53.5 million of cash flow from operating activities (before net cash interest expenses) to discharge our cash interest and principal obligations for the year ending December 31, 2004. By comparison, for the year ended December 31, 2003, we generated $56.7 million of cash flow from operations (before net cash interest expenses). In order to manage our substantial amount of indebtedness, wesite leasing business. This may from time to time sell assets, issue equity, or
repurchase, restructure or refinance some or all of our debt. We may not be able to effectuate any of these alternative strategies on satisfactory terms, if at all. The implementation of any of these alternative strategies may dilute our current shareholders or subject us to additional costs or restrictions on our ability to manage our business and as a result could have a material adverse effect on our financial conditionstrategy, revenue growth and growth strategy.
We may not have sufficient liquidity or cash flow from operations to repay the remaining amount of our outstanding senior credit facility, our 10¼% senior notes and our 9¾% senior discount notes upon their respective maturities in 2008, 2009 and 2011. Therefore, prior to the maturity of our outstanding debt we may be required to refinance and/or restructure some or all of this debt. There can be no assurance that we will be able to refinance or restructure this debt on acceptable terms or at all. If we were unable to refinance, restructure or otherwise repay the principal amount of this debt upon its maturity, we may need to sell assets, cease operations and/or file for protection under the bankruptcy laws.
As of December 31, 2003, adjusted for the transactions discussed above, we would have had approximately $21 million of additional borrowing capacity under our senior credit facility, subject to maintenance covenants, borrowing base limitations and other conditions. Furthermore, we and our subsidiaries may be able to incur significant additional indebtedness in the future, subject to the restrictions contained in our debt instruments, some of which may be secured debt.
We are dependent on the financial stability of our customers and any deterioration in their financial condition may reduce the demand for our services which would adversely affect our growth strategy, revenues and financial condition.
Our business depends on the financial stability of our customers. The economic slowdown and intense competition in the wireless and telecommunications industries over the past several years have impaired the financial condition of some of our customers, certain of which operate with substantial leverage and certain of which have filed or may file for bankruptcy. The financial uncertainties facing our customers could reduce demand for our communications sites, increase our bad debt expense and reduce prices on new customer contracts. This could affect our ability to satisfy our obligations.
In addition, we may be negatively impacted by our customers’ limited access to debtfinancial and equity capital. Recently when capital market conditions were difficultother contractual obligations. Our plan for the telecommunications industry, wireless service providers conserved capital by not spending as much as originally anticipated to finance expansion activities. This decrease adversely impacted demand for our services and consequently our financial condition. As a result, we adjusted our business during 2002 and early 2003 to significantly reduce and subsequently suspend any material investment for new towers andgrowth of our site development activities. Ifleasing business largely depends on our customers are not able to access the capital markets in themanagement’s expectations and assumptions concerning future our growth strategy, revenuestenant demand and financial condition may again be adversely affected.
Our substantial indebtedness may negatively impact our ability to implement our business plan.
Our substantial indebtedness may negatively impact our ability to implement our business plan. For example, it could:
Our debt instruments contain restrictive covenants that could adversely affect our business.
Our senior credit facility and the indentures governing our outstanding notes each contain certain restrictive covenants. Among other things, these covenants restrict our ability to:
If we fail to comply with these covenants, it could result in an event of default under one or all of these debt instruments. The acceleration of amounts due under one of our debt instruments would also cause a cross-default under our other debt instruments.
SBA Senior Finance Inc. (“SBA Senior Finance”), which owns, directly or indirectly, all of the common stock of our operating subsidiaries, is the borrower under our senior credit facility. The senior credit facility requires SBA Senior Finance to maintain specified financial ratios, including ratios regarding SBA Senior Finance’s debt to annualized operating cash flow, debt service, cash interest expense and fixed charges for each quarter. In addition, the senior credit facility contains additional negative covenants that, among other things, restrict our ability to commit to capital expenditures and build towers without anchor tenants. Our ability to meet these financial ratios and tests and comply with these covenants can be affected by events beyond our control, and we may not be able to do so. A breach of any of these covenants, if not remedied within the specified period, could result in an event of default under the senior credit facility.
Upon the occurrence of any default, our senior credit facility lenders can prevent us from borrowing any additional amounts under the senior credit facility. In addition, upon the occurrence of any event of default, other than certain bankruptcy events, senior credit facility lenders, by a majority vote, can elect to declare all amounts of principal outstanding under the senior credit facility, together with all accrued interest, to be immediately due and payable. The acceleration of amounts due under our senior credit facility would cause a cross-default under our indentures, thereby permitting the acceleration of such indebtedness. If the indebtedness under the senior credit facility and/or indebtedness under our outstanding notes were to be accelerated, our current assets would not be sufficient to repay in full the indebtedness. If we were unable to repay amounts that become due under the senior credit facility, the senior credit lenders could proceed against the collateral granted to them to secure that indebtedness. Substantially all of our assets are pledged as security under the senior credit facility. In such an event of default, our assets may not be sufficient to satisfy our obligations under the notes.
independently owned towers.
If our wireless service provider customers combine their operations to a significant degree, our growth, our revenue and our ability to generate positive cash flowservice our indebtedness could be adversely affected.
Demand for our services may decline if there is significant consolidation among our wireless service provider customers as they may then reduce capital expenditures in the aggregate because many of their existing networks and expansion plans overlap. InAs a result of regulatory changes in January 2003 the spectrum cap, which previously prohibitedremoved prior restrictions on wireless carriersservice providers from owning more than 45 MHz of spectrum in any given geographical area, expired. Some wireless carriers may be encouraged to consolidate with each other as a resultthere have been significant consolidations of this regulatory change and as a means to strengthen their financial condition. Economic conditions have resulted in the consolidation of severallarge wireless service providersproviders. Specifically, Cingular acquired AT&T Wireless in October 2004 and this trend is likelySprint PCS and Nextel merged to continue.form Sprint Nextel Corporation in August 2005. To the
extent that our customers have consolidated or that other customers may consolidate in the future, they may not renew any duplicative leases that they have on our towers and/or may not lease as many spacesmuch space on our towers in the future. This would adversely affect our growth, our revenue and our ability to generate positive cash flow. In February 2004, Cingular Wireless and AT&T Wireless entered into an agreement by which Cingular would acquire AT&T in a transaction anticipated to close in late 2004 or 2005. service our indebtedness.
As of December 31, 20032006, Cingular and the former AT&T wereWireless both tenantshad leases on 287an aggregate of our 3,032 towers.290 of the 5,551 towers that we owned on such date. The annualized contractual revenue generated by both of these tenants on these 287 towersleases at December 31, 20032006 was approximately $12$14.9 million. If, as a result of this transaction,Consequently, if Cingular were not to renew duplicate leases, we could lose up to 50% or more of such revenue. TheAs of December 31, 2006, the average remaining contractual life of such duplicate leases was approximately 32.9 years. Our risk of revenue loss from the integration of Cingular and AT&T Wireless is not limited to leases on the same tower. We expect Cingular (now AT&T) to terminate or not renew some leases on our towers where they have other antenna sites in close proximity. During the second half of 2006, we began experiencing some decommissioning of antennae sites and non-renewal of leases from the Cingular and AT&T Wireless acquisition. Cingular terminated lease agreements during 2006 with total annualized revenue of $1.5 million. In addition, we have received termination or non-renewal notices for leases expiring in the twenty-four months after December 31, 2006 with total annualized revenue of $4.4 million. In addition, we have received notifications from Cingular that it expects to non-renew other leases with lease terms expiring in three or more years and we may receive additional notifications in the future. Such terminations or non-renewals could have a material adverse impact on our growth rate.
As of December 31, 2006, Sprint Nextel and affiliated entities had multiple leases on 555 of the 5,551 towers that we owned on such date. The annualized contractual revenue generated by these leases at December 31, 2006 was approximately $27.1 million. During the second half of 2006, Sprint Nextel extended by seven years the term of each duplicate lease. Consequently, as of December 31, 2006, the average remaining contractual life of such duplicate leases was approximately 9.6 years. However, our risk of revenue loss from the integration of Sprint and Nextel is not limited to leases on the same tower. Sprint Nextel could terminate or not renew some leases on our towers where they have other antenna sites in close proximity. Furthermore at the end of such lease extensions, Sprint Nextel may terminate the duplicate leases. Such terminations or non-renewals could have a material adverse impact on our growth rate.
Similar consequences may occur if wireless service providers engage in extensive sharing or roaming or resale arrangements as an alternative to leasing our antenna space. Wireless voice service providers frequently
enter into roaming agreements with competitors allowing them to use another’s wireless communications facilities to accommodate customers who are out of range of their home provider’s services. Wireless voice service providers may view these roaming agreements as a superior alternative to leasing antenna space on communications sites owned or controlled by us or others. The proliferation of these roaming agreements could have a material adverse effect on our revenue.
New technologies and their use by carriers may have a material adverse effect on our growth rate and results of operations.
The emergence of new technologies could reduce the demand for space on our towers. For example, the increased use by wireless service providers of signal combining and related technologies and products that allow two or more wireless service providers to provide services on different transmission frequencies using the communications antenna and other facilities normally used by only one wireless service provider could reduce the demand for our tower space. Additionally, the use of technologies that enhance spectral capacity, such as beam forming or “smart antennae,” that can increase the range and capacity of an antenna could reduce the number of additional sites a wireless service provider needs to adequately serve a certain subscriber base and therefore reduce demand for our tower space. The development and growth of communications and other new technologies that do not require ground-based sites, such as the growth in delivery of video, voice and data services by satellites or other technologies, could also adversely affect the demand for our tower space. In addition, the deployment of WiFi and WiMax technologies could impact the network needs of our existing customers providing wireless telephony services. This could have a material adverse effect on our growth rate and results of operations.
We depend on a relatively small number of customers for most of our revenue.
We derive a significant portion of our revenue from a small number of customers, particularly in our site development services business. The loss of any significant customer could have a material adverse effect on our revenue.
The following is a list of significant customers and the percentage of our total revenues for the specified time periods derived from these customers:
| Percentage of Total Revenues for the years ended December 31, | ||||||
| 2003 | 2002 | |||||
Bechtel Corporation | 14.3 | % | 15.3 | % | ||
AT&T Wireless | 10.8 | % | 10.1 | % | ||
Cingular Wireless | 10.2 | % | 12.6 | % | ||
Percentage of Total Leasing Revenues for the year ended December 31, | |||||||||
| 2006 | 2005 | 2004 | |||||||
Sprint Nextel | 27.6 | % | 30.9 | % | 31.0 | % | |||
Cingular (now AT&T) | 21.4 | % | 25.5 | % | 22.7 | % | |||
We also have client concentrations with respect to revenues in each of our financial reporting segments:
Percentage of Site Leasing ended December 31, | ||||||
| 2003 | 2002 | |||||
AT&T Wireless | 16.9 | % | 15.5 | % | ||
Cingular Wireless | 11.1 | % | 10.8 | % | ||
Percentage of Site Leasing Revenue for the year ended December 31, | |||||||||
| 2006 | 2005 | 2004 | |||||||
Cingular (now AT&T) | 26.7 | % | 28.0 | % | 27.5 | % | |||
Sprint Nextel | 26.2 | % | 30.7 | % | 29.4 | % | |||
Verizon | 9.7 | % | 10.1 | % | 9.5 | % | |||
Percentage of Site Development Consulting Revenue for the year ended December 31, Sprint Nextel Verizon Wireless Bechtel Corporation* Cingular (now AT&T) 2006 2005 2004 38.0 % 1.9 % 2.6 % 26.6 % 32.4 % 26.1 % 10.0 % 23.3 % 24.7 % 6.8 % 28.3 % 26.7 %
Percentage of Site Development Consulting Revenue for the years | ||||||
| 2003 | 2002 | |||||
Bechtel Corporation | 30.5 | % | 34.2 | % | ||
Cingular Wireless | 24.0 | % | 29.6 | % | ||
Verizon Wireless | 14.5 | % | 3.9 | % | ||
Percentage of Site Revenue for the years ended | ||||||
| 2003 | 2002 | |||||
Bechtel Corporation | 37.7 | % | 28.1 | % | ||
Sprint PCS | 12.9 | % | 3.0 | % | ||
Percentage of Site Development Construction Revenue for the year ended December 31, Sprint Nextel Bechtel Corporation* Cingular (now AT&T) 2006 2005 2004 30.0 % 36.0 % 39.7 % 17.4 % 11.6 % 14.5 % 6.9 % 20.3 % 12.5 %
| * | Substantially all of the work performed for Bechtel Corporation was for its client Cingular (now AT&T). |
Revenues from these clients are derived from numerous different site leasing contracts and site development contracts. Each site leasing contract relates to the lease of space at an individual tower site and is generally for an initial term of five years renewable for five five-year periods at the option of the tenant. Our site development customers engage us on a project-by-project basis, and a customer can generally terminate an assignment at any time without penalty. In addition, a customer’s need for site development services can decrease, and we may not be successful in establishing relationships with new customers. Furthermore, our existing customers may not continue to engage us for additional projects.
We may not secure as many site leasing tenants as planned or our lease rates may decline.
If tenant demand for tower space or our lease rates for new tenants decrease, we may not be able to successfully growservice our site leasing business. Thissubstantial indebtedness.
As indicated below, we have and will continue to have a significant amount of indebtedness relative to our equity.
| As of December 31, | ||||||
| 2006 | 2005 | |||||
| (in thousands) | ||||||
Total indebtedness | $ | 1,555,000 | $ | 784,392 | ||
Shareholders’ equity | $ | 385,921 | $ | 81,431 | ||
As of December 31, 2006, we had approximately $1.6 billion in indebtedness, all of which is secured in the CMBS market. In addition, we have the ability to borrow additional amounts under our senior revolving credit facility and may incur additional indebtedness through other debt instruments. Our ability to service our current and future debt obligations will depend on our future operating performance. In order to manage our substantial amount of indebtedness, we may from time to time sell assets, issue equity, restructure or refinance some or all of our debt (all of which we have done at various times in the last four years). We may not be able to effectuate any of these alternative strategies on satisfactory terms in the future, if at all. The implementation of any of these alternative strategies may dilute our current shareholders or subject us to additional costs or restrictions on our ability to manage our business and as a result could have a material adverse effect on our strategy, revenuefinancial condition and growth strategy.
We may not have sufficient liquidity or cash flow from operations to repay the CMBS Certificates. The amounts borrowed under the mortgage loan in connection with the Initial CMBS Certificates have an anticipated repayment date of November 2010 and a final repayment date of November 2035 while the amounts borrowed under the mortgage loan in connection with the Additional CMBS Certificates have an anticipated repayment date of November 2011 and a final repayment date of November 2036. However, if we do not repay the full amount of each mortgage loan component before its respective anticipated repayment date, the interest rate payable on such mortgage loan outstanding will significantly increase in accordance with the formula set forth in the mortgage loan. We may not be able to service these higher interests costs if we cannot refinance the amounts outstanding under the mortgage loan before their anticipated repayment dates. Furthermore, if we cannot refinance these amounts prior to the final repayment date, we may be required to sell a portion or all of our interests in the 4,975 tower sites that, among other things, secure along with their operating cash flows the mortgage loan. Although, the mortgage loan is a limited recourse obligation of SBA Properties, Inc., SBA Sites, Inc., SBA Structures, Inc., SBA Towers, Inc., SBA Towers Puerto Rico, Inc. and SBA Towers USVI, Inc. (collectively, the “Borrowers”) and no holder of the mortgage loan will have recourse to SBA Communications, our operations would be adversely affected if the Borrowers are unable to repay the components of the mortgage loan. We cannot assure you that our assets would be sufficient to repay this indebtedness in full.
We and our subsidiaries may incur significant additional indebtedness in the future, subject to the restrictions contained in our debt instruments, some of which may be secured debt.
Our substantial indebtedness may negatively impact our ability to satisfyimplement our business plan.
Our substantial indebtedness may negatively impact our ability to implement our business plan. For example, it could:
limit our ability to fund future working capital, capital expenditures and development costs;
limit our flexibility in planning for, or reacting to, changes in our business and the industry in which we operate;
increase our vulnerability to general economic and industry conditions;
subject us to interest rate risk in connection with any potential future refinancing of our CMBS Certificates;
place us at a competitive disadvantage to our competitors that are less leveraged;
require us to sell debt or equity securities or sell some of our core assets, possibly on unfavorable terms in order to meet payment obligations; and
limit our ability to borrow additional funds.
Risks associated with our plans to increase our tower portfolio could negatively impact our results of operations or our financial condition.
We currently intend to increase our tower portfolio through new builds and other contractual obligations. Ouracquisitions. We intend to review all available acquisition opportunities and some of these acquisitions could have the effect of materially increasing our tower portfolio. While we intend to fund a portion of the cash required to implement this plan forfrom our cash flow from operating activities, we may finance some or all of the growthcosts associated with these new builds and acquisitions. Furthermore, if we were to consummate any significant acquisition, we would be required to finance these acquisitions through additional indebtedness, which would increase our indebtedness and interest expense and could increase our leverage ratio, and/or issuances of equity, which could be dilutive to our site leasing business largely depends onshareholders. If we were unable to recognize the expected returns from these new towers, or if we did not recognize the expected returns in our management’s expectationsanticipated time frames, an increase in debt levels without a proportionate increase in our revenues could negatively impact our results of operations and assumptions concerning future tenant demand and potential lease rates for independently owned towers.
our financial condition.
Due to the long-term expectationsnature of revenue from our tenant leases, we are very sensitive todependent on the financial strength and creditworthiness of our tenants.customers.
Due to the long-term nature of our tenant leases, we, like others in the tower industry, are dependent on the continued financial strength of our tenants. Wireless service providers oftenThe economic slowdown and intense competition in the wireless and telecommunications industries in 2001 through 2003 had impaired the financial condition of some of our customers, certain of which operate with substantial leverage, and financial problems for our customers couldleverage. As a result, in uncollected accounts receivable, the loss of customers and lower than anticipated lease revenues. During the past three years, a number of our site leasing customers have filed for bankruptcy including almost all of our paging customers. Although these bankruptcies have not had a material adverse effect on our business or revenues, any future bankruptcies may have a material adverse effect on our business, revenues, and/or the collectability of our accounts receivable. In the future, the financial uncertainties facing our customers could reduce demand for our communications sites, increase our bad debt expense and reduce prices on new customer contracts. This could affect our ability to satisfy our obligations.
In addition, our anticipated growth could be negatively impacted if our customers’ access to debt and equity capital were limited. From 2001 through 2003, when capital market conditions were difficult for the telecommunications industry, wireless service providers conserved capital by not spending as much as originally anticipated to finance expansion activities. This decrease adversely impacted demand for our services and consequently our financial condition. If our customers are not able to access the capital markets in the future, our growth strategy, revenues and financial condition may again be adversely affected.
Our debt instruments contain restrictive covenants that could adversely affect our business.
Our senior revolving credit facility contains certain restrictive covenants. Among other things, these covenants limit the ability of certain of our subsidiaries to:
| �� | • | incur additional indebtedness; |
engage in mergers and acquisitions or sell all or substantially all of their assets;
pay dividends, repurchase capital stock or engage in other restricted payments;
make certain investments;
make certain capital expenditures;
incur liens; and
enter into affiliate transactions.
If our subsidiaries fail to comply with these covenants, it could result in an event of default under our senior revolving credit facility. Additionally, under our senior revolving credit facility, SBA Senior Finance II, LLC (“Senior Finance II”) which owns, directly or indirectly, all of the common stock and membership interests of certain of our operating subsidiaries and is the borrower under our senior revolving credit facility, is required to maintain specified financial ratios, including ratios regarding Senior Finance II’s debt to annualized operating cash flow, cash interest expense and fixed charges for each quarter. In addition, the senior revolving credit facility contains additional negative covenants that, among other things, limit our ability to commit to capital expenditures and build or acquire towers without anchor or acceptable tenants. Our ability to meet these financial ratios and tests and comply with these covenants can be affected by events beyond our control, and we may not be able to do so.
A breach of any of these covenants, if not remedied within the specified period, could result in an event of default. Amounts borrowed under the senior revolving credit facility are secured by a lien on substantially all of Senior Finance II’s assets and are guaranteed by us and certain of our subsidiaries.
Upon the occurrence of any default, our senior revolving credit facility lenders can prevent us from borrowing any additional amounts under the senior revolving credit facility. In addition, upon the occurrence of any event of default, other than certain bankruptcy events, the lenders under our senior revolving credit facility, by a majority vote, can elect to declare all amounts of principal outstanding under such facility, together with all accrued interest, to be immediately due and payable. If we were unable to repay amounts that become due under the senior revolving credit facility, such lenders could proceed against the collateral granted to them to secure that indebtedness.
Our mortgage loan relating to our CMBS Certificates contains a covenant requiring that all of the Borrowers’ cash flow in excess of amounts required to make debt service payments, fund required reserves, pay management fees and budgeted operating expenses and make other payments required under the loan documents be deposited into a reserve account if the debt service coverage ratio is less than 1.30 times, as of the end of any calendar quarter. The mortgage loan defines debt service coverage ratio as the Net Cash Flow (as defined in the mortgage loan) divided by the amount of interest on the mortgage loan, servicing fees and trustee fees that the Borrowers will be required to pay over the succeeding twelve months. If the debt service coverage ratio is less than 1.15 times as of the end of any calendar quarter, then an “amortization period” will commence and all funds on deposit in the reserve account will be applied to prepay the mortgage loan. If the debt service coverage ratio is less than 1.30 times, then the funds in the reserve account will not be released to the Borrowers until the debt service coverage ratio exceeds 1.30 times for two consecutive calendar quarters. As significantly all of our cash flow is generated by the Borrowers, failure to maintain the debt service coverage ratio above 1.30 times would impact our ability to pay our indebtedness, other than the mortgage loan, and to operate our business.
The mortgage loan provides for customary remedies if an event of default occurs including foreclosure against all or part of the property pledged as security for the mortgage loan. The mortgage loan is secured by (1) mortgages, deeds of trust and deeds to secure debt on substantially all of the Borrowers’ tower sites and their operating cash flows, (2) a security interest in substantially all of the Borrowers’ personal property and fixtures and (3) the Borrowers’ rights under the management agreement they entered into with SBA Network Management, Inc. (“SBA Network Management”) relating to the management of the Borrowers’ tower sites by SBA Network Management pursuant to which SBA Network Management arranges for the payment of all operating expenses and the funding of all capital expenditures out of amounts on deposit in one or more operating accounts maintained on the Borrowers’ behalf. We cannot assure you that our assets would be sufficient to repay this indebtedness in full.
Our quarterly operating results for our site development services fluctuate and therefore shouldwe may not be considered indicative ofable to adjust our long-term results.cost structure on a timely basis with regard to such fluctuations.
The demand for our site development services fluctuates from quarter to quarter and should not be considered as indicative of long-term results. Numerous factors cause these fluctuations, including:
the timing and amount of our customers’ capital expenditures;
the size and scope of assignments;our projects;
the business practices of customers, such as deferring commitments on new projects until after the end of the calendar year or the customers’ fiscal year;
seasonal factors, such as weather, vacation days and total business days in a quarter;
the use of third party providers by our customers;
the rate and volume of wireless service providers’ network development; and
general economic conditions.
Although the demand for our site development services fluctuates, we incur significant fixed costs, such as maintaining a staff and office space in anticipation of future contracts. In addition, the timing of revenues is difficult to forecast because our sales cycle may be relatively long. Therefore, we may not be able to adjust our cost structure in a timely basis to adjustrespond to market slowdowns.the fluctuations in demand for our site development services.
We are not profitable and expect to continue to incur losses.
We are not profitable. The following chart shows the net losses we incurred for the periods indicated:
| For the years ended December 31, | |||||||||
| 2003 | 2002 | 2001 | |||||||
| (in thousands) | |||||||||
Net losses | $ | 172,171 | $ | 248,996 | $ | 125,792 | |||
| For the year ended December 31, | ||||||||||||
| 2006 | 2005 | 2004 | ||||||||||
| (in thousands) | ||||||||||||
Net loss | $ | (133,448 | ) | $ | (94,709 | ) | $ | (147,280 | ) | |||
Our losses are principally due to significant interest expense, depreciation, amortization, and depreciationaccretion expenses and amortization in each of the periods presented above. We recorded an asset impairment charge of $17.0 million, a charge associated with the write-off of deferred financing fees and loss on extinguishment of debt of $24.2 million, and a restructuring charge of $2.5 million during the year ended December 31, 2003. Additionally, we recognized a loss, net of taxes, of approximately $7.7 million for the year ended December 31, 2003 in connection with discontinued operations. We recorded restructuring and other charges of $47.8 million, a $60.7 million charge related to the cumulative effect of a change in accounting principle related to the adoption of SFAS No. 142, and an asset impairment charge of $25.5 million in the year ended December 31, 2002. We recorded restructuring and other charges of $24.4 million in the year ended December 31, 2001.
In 2004, we expect to incur material additional charges forlosses from the write-off of deferred financing fees and extinguishment of debt associatedin the periods presented above. For the year ended December 31, 2006, we had interest expense, non-cash interest expense and amortization of deferred financing fees of $99.7 million, depreciation, amortization, and accretion expense of $133.1 million, and losses from the write-off of deferred financing fees and extinguishment of debt of $57.2 million in connection with the senior credit facility refinancing, 10¼extinguishment of our outstanding 9 3/4% senior note repurchasesdiscount notes, our outstanding 8 1/2% senior notes, and our $1.1 billion bridge loan. For the year ended December 31, 2005, we had interest expense, non-cash interest expense and amortization of deferred financing fees of $69.6 million, depreciation, amortization, and accretion expense of $87.2 million, and losses from the write-off of deferred financing fees and extinguishment of debt of $29.3 million in connection with the extinguishment of a portion of our outstanding 9 3/4% senior discount notes, a portion of our outstanding 8 1/2% senior notes, our remaining outstanding 10 1/4% senior notes, and our prior credit facility. For the year ended December 31, 2004, we had interest expense, non-cash interest expense and amortization of deferred financing fees of $79.0 million, depreciation, amortization and accretion expense of $90.5 million, and losses from the write-off of deferred financing fees and extinguishment of debt of $41.2 million in connection with the retirement of our outstanding 12% senior discount note repurchasesnotes, a portion of our 10 1/4% senior notes, and redemptions which occurred subsequentthe termination of another prior credit facility. We expect to December 31, 2003. Interest expense and depreciation charges will continue to be substantial in the future.
incur significant losses, which may affect our ability to service our indebtedness.
Increasing competition in the tower industry may adversely affect us.
Our industry is highly competitive, particularly with respect to securing quality tower assets and adequate capital to support tower networks.competitive. Competitive pressures for tenants on their towers from theseour competitors could adversely affect our lease rates and services income. In addition, the loss of existing customers or the failure to attract new customers would lead to an accompanying adverse effect on our revenues, margins and financial condition. Increasing competition could also make the acquisition of quality tower assets more costly.costly, which could adversely affect our ability to successfully implement and/or maintain our tower acquisition program.
WeIn the site leasing business, we compete with:
wireless service providers that own and operate their own towers and lease, or may in the future decide to lease, antenna space to other providers;
smaller local independent tower operators.
There has been significant consolidation among the large independent tower companies in the past three years. Specifically, American Tower Corporation completed its merger with SpectraSite, Inc. in 2005, we completed our acquisition of AAT in 2006 and
Crown Castle International completed its merger with Global Signal, Inc. in 2007. As a result of these consolidations, American Tower and Crown Castle are substantially larger and have greater financial resources than us. This could provide them with advantages with respect to establishing favorable leasing terms with wireless service providers or in their ability to acquire available towers.
Wireless service providers that own and operate their own tower networks and several of the other tower companiesare also generally are substantially larger and have greater financial resources than we do. We believe that tower location and capacity, quality of service, density within a geographic market and, to a lesser extent, price historically have been and will continue to be the most significant competitive factors affecting the site leasing business.
The site development market includes participants from a varietyservices segment of market segments offering individual,our industry is also extremely competitive. There are numerous large and small companies that offer one or combinationsmore of competing services. We believe that a company’s experience, track record, local reputation, price and time for completion of a project have been and will continue to be the most significant competitive factors affecting theservices offered by our site development business.
We may not be able to build and/or acquire as many towers as we anticipate.
We currently intend to build 80 to 100 new towers during 2007 and to consummate a number of tower acquisitions. However, our ability to build these new towers is dependent upon the availability of sufficient capital to fund construction, our ability to locate, and acquire at commercially reasonable prices, attractive locations for such towers and our ability to obtain the necessary zoning and permits.
Our ability to consummate tower acquisitions is also subject to risks. Specifically, these risks include (1) sufficient cash flow from operations or our ability to use debt or equity to fund such acquisitions, (2) our ability to identify those towers that would be attractive to our clients and accretive to our financial results, and (3) our ability to negotiate and consummate agreements to acquire such towers.
Due to these risks, it may take longer to complete our new tower builds than anticipated, the costs of constructing or acquiring these towers may be higher than we expect or we may not be able to add as many towers as we had planned in 2007. If we are not able to increase our tower portfolio as anticipated, it could negatively impact our ability to achieve our financial goals.
The loss of the services of certain of our key personnel or a significant number of our employees may negatively affect our business.
Our success depends to a significant extent upon performance and active participation of our key personnel. We cannot guarantee that we will be successful in retaining the services of these key personnel. We have employment agreements with Jeffrey A. Stoops, our President and Chief Executive Officer, Kurt L. Bagwell, our Senior Vice President and Chief Operating Officer, and Thomas P. Hunt, our Senior Vice President and General Counsel.Counsel and Anthony J. Macaione, our Senior Vice President and Chief Financial Officer. We do not have employment agreements with any of our other key personnel. If we were to lose any key personnel, we may not be able to find an appropriate replacement on a timely basis and our results of operations could be negatively affected. We do not currently have a permanent Chief Financial Officer, and if we are unable to timely hire one, our business may be negatively impacted. Further, the loss of a significant number of employees or our inability to hire a sufficient number of qualified employees could have a material adverse effect on our business.
NewDelays or changes in the deployment or adoption of new technologies as well as lower consumer demand and their use by carriersslower consumer adoption rates than anticipated may have a material adverse effect on our growth rate and results of operations.rate.
The emergence ofThere can be no assurances that 3G, 4G or other new wireless technologies will be deployed or adopted as rapidly as projected or that these new technologies could reducewill be implemented in the manner anticipated. The deployment of 3G has already experienced significant delays from the original projected timelines of the wireless and broadcast industries. The announcement of 4G is relatively new and its deployment schedule has not been determined as of yet. Additionally, the demand by consumers and the adoption rate of consumers for space on our towers. For example, the development of and use of products that would permit multiple wireless carriers to use a single antenna, share networksthese new technologies once deployed may be lower or increase the range and capacity of an antenna could reduce the number of antennas needed by our customers. Thisslower than anticipated. These factors could have a material adverse effect on our growth rate since growth opportunities and resultsdemand for our tower space as a result of operations.such new technologies may not be realized at the times or to the extent anticipated.
Our costs could increase and our revenues could decrease due to perceived health risks from radio frequency (“RF”) energy.
The government imposes requirements and other guidelines on our towers relating to RF energy. Exposure to high levels of RF energy can cause negative health effects.
Theeffects the potential connection between exposure to low levels of RF energy and certain negative health effects, including some forms of cancer, has been the subject of substantial study by the scientific community in recent years. According to the Federal Communications Commission (“FCC”(the “FCC”), the results of these studies to date have been inconclusive. However, public perception of possible health risks associated with cellular and other wireless communications media could slow the growth of wireless companies, which could in turn slow our growth. In particular, negative public perception of, and regulations regarding, health risks could cause a decrease in the demand for wireless communications services. Moreover, if a connection between exposure to low levels of RF energy and possible negative health effects, including cancer, were demonstrated, we could be subject to numerous claims. If we were subject to claims relating to RF energy, even if such claims were not ultimately found to have merit, our financial condition wouldcould be materially and adversely affected.
Our business is subject to government regulations and changes in current or future regulations could harm our business.
We are subject to federal, state and local regulation of our business. In particular, both the Federal Communications Commission (“FCC”) and the Federal Aviation Administration (“FAA”) and FCC regulate the construction and maintenance of antenna towers and structures that support wireless communications and radio and television antennas. In addition, the FCC separately licenses and regulates wireless communications equipment and television and radio stations operating from such towers and structures. FAA and FCC regulations govern construction, lighting, painting and marking of towers and structures and may, depending on the characteristics of the tower or structure, require registration of the tower or structure. Certain proposals to construct new towers or structures or to modify existing towers or structures are reviewed by the FAA to ensure that the tower or structure will not present a hazard to air navigation.
Antenna tower owners and antenna structure owners may have an obligation to mark or paint towers or structures or install lighting to conform to FAA standardsand FCC regulations and to maintain such marking, painting and lighting. Antenna tower owners and antenna structure owners may also bear the responsibility of notifying the FAA of any lighting outages. Certain proposals to operate wireless communications and radio or television stations from antenna towers and structures are also reviewed by the FCC to ensure compliance with environmental impact requirements. Failure to comply with existing or future applicable requirements may lead to civil penalties or other liabilities and may subject us to significant indemnification liability to our customers against any such failure to comply. In addition, new regulations may impose additional costly burdens on us, which may affect our revenues and cause delays in our growth.
Local regulations, including municipal or local ordinances, zoning restrictions and restrictive covenants imposed by community developers, vary greatly, but typically require antenna tower owners and antenna structure owners to obtain approval from local officials or community standards organizations prior to tower or structure construction or modification. Local regulations can delay, prevent, or increase the cost of new construction, co-locations, or site upgrade projects,upgrades, thereby limiting our ability to respond to customer demand. In addition, new regulations may be adopted that increase delays or result in additional costs to us. These factors could have a material adverse effect on our future growth and operations.
Our towers are subject to damage from natural disasters.
Our towers are subject to risks associated with natural disasters such as tornadoes and hurricanes. We maintain insurance to cover the estimated cost of replacing damaged towers, but these insurance policies are subject to loss limits and deductibles. We also maintain third party liability insurance, subject to loss limits and deductibles, to protect us in the event of an accident involving a tower. A tower accident for which we are uninsured or underinsured, or damage to a significant number of our towers, could require us to make significant capital expenditures and may have a material adverse effect on our operations or financial condition.
We could have liability under environmental laws that could have a material adverse effect on our business, financial condition and results of operations.
Our operations, like those of other companies engaged in similar businesses, are subject to the requirements of various federal, state, local and foreign environmental and occupational safety and health laws and regulations, including those relating to the management, use, storage, disposal, emission and remediation of, and exposure to, hazardous and non-hazardous substances, materials, and wastes. As owner, lessee or operator of numerous tower sites, we may be liable for substantial costs of remediating soil and groundwater contaminated by hazardous materials, without regard to whether we, as the owner, lessee or operator, knew of or were responsible for the contamination. We may be subject to potentially significant fines or penalties if we fail to comply with any of these requirements. The current cost of complying with these laws is not material to our financial condition or results of operations. However, the requirements of these laws and regulations are complex, change frequently, and could become more stringent in the future. It is possible that these requirements will change or that liabilities will arise in the future in a manner that could have a material adverse effect on our business, financial condition and results of operations.
Our dependence on our subsidiaries for cash flow may negatively affect our business.
We are a holding company with no business operations of our own. Our only significant asset is and is expected to be the outstanding capital stock and membership interests of our subsidiaries. We conduct, and expect to conduct, all of our business operations through our subsidiaries. Accordingly, our ability to pay our obligations including the principal and interest, premium, if any, and additional interest, if any, on our outstanding 10¼% senior notes and our 9¾% senior discount notes, is dependent upon dividends and other distributiondistributions from our subsidiaries to us. Additionally, the Borrowers under the CMBS Transaction must repay the components of the mortgage loan thereto. If the Borrowers’ cash flow is insufficient to cover such repayments, we may be required to refinance the mortgage loan or sell a portion or all of our interests in the 4,975 tower sites that among other things, secure, along with their operating cash flows, the mortgage loan. Other than the amounts required to make interest and principal payments onrepayment of amounts under the notes,CMBS Transaction, we currently expect that the earnings and cash flow of our subsidiaries will be retained and used by
them in their operations, including servicing their debt obligations. Our operating subsidiaries are separate and distinct legal entities and have no obligation, contingent or otherwise to payrepay the principal, interestcomponents of the mortgage loan pursuant to the CMBS Transaction (other than the Borrowers and other amounts on the notesSBA CMBS-1 Guarantor LLC and CMBS-1 Holdings, LLC, as guarantors), or make any funds available to us for payment. The ability of our operating subsidiaries to pay dividends or transfer assets to us may be restricted by applicable state law and contractual restrictions, including the terms of the senior revolving credit facility. Althoughfacility and the indenture governing the notes willCMBS Certificates.
We have adopted anti-takeover provisions that could make it more difficult for a third party to acquire us.
Provisions of our articles of incorporation, our bylaws and Florida law could make it more difficult for a third party to acquire us, even if doing so would be beneficial to our shareholders. We adopted a shareholder rights agreement, which could make it considerably more difficult or costly for a person or group to acquire control of us in a transaction that our board of directors opposes. These provisions, alone or in combination with each other, may discourage transactions involving actual or potential changes of control, including transactions that otherwise could involve payment of a premium over prevailing market prices to holders of our Class A common stock, or could limit the ability of our operating subsidiariesshareholders to enter into consensual restrictions onapprove transactions that they may deem to be in their best interests.
Our issuance of equity securities and other associated transactions may trigger a future ownership change which may negatively impact our ability to pay dividendsutilize net operating loss deferred tax assets in the future.
The issuance of equity securities and other associated transactions may increase the chance that we will have a future ownership change under Section 382 of the Internal Revenue Code of 1986. We may also have a future ownership change, outside of our control, caused by future equity transactions by our current shareholders. Depending on our market value at the time of such future ownership change, an ownership change under Section 382 could negatively impact our ability to us, these limitations are subject toutilize our net operating loss deferred tax assets in the event we generate future taxable income. Currently we have recorded a number of significant qualifications and exceptions.full valuation allowance against our net operating loss deferred tax asset because we have concluded that our loss history indicates that it is not “more likely than not” that such deferred tax assets will be realized.
As a company whoseThe market price of our Class A common stock could be affected by significant volatility.
The market price of our Class A common stock has historically experienced significant fluctuations. The market price of our Class A common stock is publicly traded, we arelikely to continue to be volatile and subject to the rulessignificant price and regulations of federal, state and financial market exchange entities.
Involume fluctuations in response to recent laws enacted by Congress (most notably the Sarbanes-Oxley Act of 2002), some of these entities have recently issued new requirements and some are continuing to develop additional requirements (most notably, the requirements associated with Section 404 of the Sarbanes-Oxley Act). Our material internal control systems, processes and procedures will have to be in compliance with the new requirements and such compliance may require the commitment of significant financial and managerial resources and significant changes to such controls, systems, processes and procedures.
Availability of Reports and Other Information
Our corporate website iswww.sbasite.com. We make available, free of charge, access to our Annual Report on Form 10-K, Quarterly Reports on Form 10-Q, Current Reports on Form 8-K, Proxy Statement on Schedule 14A and amendments to those materials filed or furnished pursuant to Section 13(a) or 15(d) of the Securities and Exchange Act of 1934 on our website under “Investor Relations—SEC Filings,” as soon as reasonably practicable after we file electronically such material with, or furnish it to, the United States Securities and Exchange Commission (the “Commission”). In addition, the Commission’s website iswww.sec.gov. The Commission makes available on this website, free of charge, reports, proxy and information statements,market and other information regarding issuers, such as us, that file electronically withfactors, including the Commission. Additionally,other factors discussed elsewhere in “Risk Factors” and in “Forward-Looking Statements.” Volatility or depressed market prices of our reports, proxy and information statements may be read and copiedClass A common stock could make it difficult for shareholders to resell their shares of Class A common stock, when they want or at the Commission’s public reference room at 450 Fifth Street, NW, Washington, DC 20549. Information on our website or the Commission’s website is not part of this document.attractive prices.
| ITEM | UNRESOLVED STAFF COMMENTS |
None.
| ITEM | 2. PROPERTIES |
We are headquartered in Boca Raton, Florida, where we currently lease approximately 73,000 square feet of space. We have entered into long-term leases for regional and certain site development office locations where we expect our activities to be longer-term. We open and close project offices from time to time in connection with our site development business,business. We believe our existing facilities are adequate for our current and officesplanned levels of operations and that additional office space suited for new tower build projects are generally leased for periods not to exceed 18 months.
our needs is reasonably available in the markets within which we operate.
Our interests in towers are comprised of a variety of fee interests, leasehold interests created by long-term lease agreements, private easements, easements and licenses or rights-of-way granted by government entities. Of the 3,0325,551 towers in our portfolio, approximately 16%11% are located on parcels of land that we own and approximately 84%89% are located on parcels of land that have leasehold interests created by long-term lease agreements, private easements and easements, licenses or right-of-way granted by government entities. In rural areas, a wireless communications site typically consists of up to a 10,000 square foot tract, which supports towers, equipment shelters and guy wires to stabilize the structure. Less than 2,500 square feet is required for a monopole or self-supporting tower structure of the kind typically used in metropolitan areas for wireless communication tower sites. Land leases generally have an initial term of five years with five or more additional automatic renewal periods of five years, for a total of thirty years or more. In some instances, we have entered into 99 year ground leases.
| ITEM | 3. LEGAL PROCEEDINGS |
We are involved in various legal proceedings relating to claims arising in the ordinary course of business. We do not believe that the ultimate resolution of these matters will have a material adverse effect on our business, financial condition, results of operations or liquidity.
| ITEM | 4. SUBMISSION OF MATTERS TO A VOTE OF SECURITY HOLDERS |
No matter was submitted to the vote of security holders during the fourth quarter of fiscal 2003.2006.
| ITEM 5. | MARKET FOR REGISTRANT’S COMMON EQUITY, RELATED STOCKHOLDER MATTERS AND ISSUER PURCHASES OF EQUITY SECURITIES |
TheOur Class A common stock commenced tradingis traded under the symbol “SBAC” on The Nasdaq National Market System (“Nasdaq”) on June 16, 1999.NASDAQ Global Select Market. The following table presents trading informationthe high and low sales price for the Class A common stock for the periods indicated on the Nasdaq:indicated:
| High | Low | |||||
Quarter ended March 31, 2003 | $ | 1.45 | $ | 0.40 | ||
Quarter ended June 30, 2003 | $ | 3.49 | $ | 1.11 | ||
Quarter ended September 30, 2003 | $ | 4.13 | $ | 2.47 | ||
Quarter ended December 31, 2003 | $ | 4.35 | $ | 3.10 | ||
Quarter ended March 31, 2002 | $ | 14.05 | $ | 1.59 | ||
Quarter ended June 30, 2002 | $ | 3.40 | $ | 1.14 | ||
Quarter ended September 30, 2002 | $ | 1.92 | $ | 1.04 | ||
Quarter ended December 31, 2002 | $ | 1.03 | $ | 0.19 | ||
| High | Low | |||
Quarter ended December 31, 2006 | 28.89 | 23.97 | ||
Quarter ended September 30, 2006 | 25.90 | 21.95 | ||
Quarter ended June 30, 2006 | 26.75 | 20.60 | ||
Quarter ended March 31, 2006 | 24.19 | 18.29 | ||
Quarter ended December 31, 2005 | 19.19 | 14.45 | ||
Quarter ended September 30, 2005 | 16.59 | 13.72 | ||
Quarter ended June 30, 2005 | 13.96 | 8.45 | ||
Quarter ended March 31, 2005 | 10.06 | 8.14 | ||
As of March 10, 2004,February 26, 2007, there were 194152 record holders of our Class A common stock.
Dividends
We have never paid a dividend on any class of common stock and anticipate that we will retain future earnings, if any, to fund the development and growth of our business. Consequently, we do not anticipate paying cash dividends on our common stock in the foreseeable future. In addition, we are restricted under theour Initial CMBS Certificates, Additional CMBS Certificates and our senior credit facility the 9¾% senior discount notes and the 10¼% senior notes from paying dividends or making distributions and repurchasing, redeeming or otherwise acquiring any shares of common stock except under certain circumstances.
Equity Compensation Plan Information
The following table gives information about our common stock that may be issued upon the exercise of options, warrants, and rights under all existing equity compensation plans as of December 31, 2003.2006:
| Equity Compensation Plan Information | Equity Compensation Plan Information | |||||||||||||
| (in thousands except exercise price) | (in thousands except exercise price) | |||||||||||||
| Number of Securities to be Issued Upon Exercise of Outstanding Options, Warrants and Rights | Weighted Average Exercise Price of Outstanding Options, Warrants and Rights | Number of Securities Remaining Available for Future Issuance Under Equity Compensation Plans (excluding securities reflected in column) | Number of Securities to be Issued Upon Exercise of Outstanding Options, Warrants and Rights | Weighted Average Exercise Price of Outstanding Options, Warrants and Rights | Number of Securities Remaining Available for Future Issuance Under Equity Compensation Plans (excluding securities reflected in first column) | |||||||||
Equity compensation plans approved by security holders | 3,788 | $ | 7.79 | 8,159 | 4,152 | $ | 9.87 | 8,301 | ||||||
Equity compensation plans not approved by security holders | — | — | — | — | — | — | ||||||||
Total | 3,788 | $ | 7.79 | 8,159 | 4,152 | $ | 9.87 | 8,301 | ||||||
| ITEM 6. | SELECTED |
The following table sets forth selected historical financial data as of and for each of the five years ended December 31, 2003.2006. The financial data for the fiscal years ended 2006, 2005, 2004, 2003, 2002 and 2001 have been derived from, and are qualified by reference to, our restated audited consolidated financial statements. The financial data as of and for the fiscal years ended 2000 and 1999,2002 have been derived from our unauditedaudited consolidated financial statements. The unaudited financial data as of and for the years ended December 31, 2000 and 1999, have been derived from our books and records without audit and, in the opinion of management, include all adjustments, (consisting only of normal, recurring adjustments) that management considers necessary for a fair statement of results for these periods. The following consolidated financial statements have been reclassified to reflect the discontinued operations treatment of our western site development services and the disposition, or intended disposition2004 reclassification of 848 towers.14 towers previously classified as discontinued operations into continuing operations. You should read the information set forth below in conjunction with our “Management’s Discussion and Analysis of Financial Condition and Results of Operations” and our consolidated financial statements and the related notes to those consolidated financial statements included in this Form 10-K.
| For the years ended December 31, | ||||||||||||||||||||
| 2003 | 2002 | 2001 | 2000 | 1999 | ||||||||||||||||
| (audited) | (audited) | (audited) | (unaudited) | |||||||||||||||||
| (in thousands) | ||||||||||||||||||||
Operating Data: | ||||||||||||||||||||
Revenues: | ||||||||||||||||||||
Site leasing | $ | 127,842 | $ | 115,081 | $ | 85,487 | $ | 44,332 | $ | 23,176 | ||||||||||
Site development | 84,218 | 125,041 | 139,735 | 115,892 | 60,570 | |||||||||||||||
Total revenues | 212,060 | 240,122 | 225,222 | 160,224 | 83,746 | |||||||||||||||
Cost of revenues (exclusive of depreciation, accretion and amortization shown below): | ||||||||||||||||||||
Cost of site leasing | 42,021 | 40,650 | 30,657 | 16,904 | 10,742 | |||||||||||||||
Cost of site development | 77,810 | 102,473 | 108,532 | 88,892 | 45,804 | |||||||||||||||
Total cost of revenues | 119,831 | 143,123 | 139,189 | 105,796 | 56,546 | |||||||||||||||
Gross profit | 92,229 | 96,999 | 86,033 | 54,428 | 27,200 | |||||||||||||||
Operating expenses: | ||||||||||||||||||||
Selling, general and administrative | 31,244 | 34,352 | 42,103 | 27,404 | 19,659 | |||||||||||||||
Restructuring and other charges | 2,505 | 47,762 | 24,399 | — | — | |||||||||||||||
Asset impairment charges | 16,965 | 25,545 | — | — | — | |||||||||||||||
Depreciation, accretion and amortization | 84,380 | 85,728 | 66,104 | 27,921 | 13,275 | |||||||||||||||
Total operating expenses | 135,094 | 193,387 | 132,606 | 55,325 | 32,934 | |||||||||||||||
Operating loss from continuing operations | (42,865 | ) | (96,388 | ) | (46,573 | ) | (897 | ) | (5,734 | ) | ||||||||||
Other income (expense): | ||||||||||||||||||||
Interest income | 692 | 601 | 7,059 | 6,253 | 881 | |||||||||||||||
Interest expense, net of amounts capitalized | (81,501 | ) | (54,822 | ) | (47,709 | ) | (4,879 | ) | (5,244 | ) | ||||||||||
Non-cash interest expense | (9,277 | ) | (29,038 | ) | (25,843 | ) | (23,000 | ) | (20,467 | ) | ||||||||||
Amortization of debt issuance costs | (5,115 | ) | (4,480 | ) | (3,887 | ) | (3,006 | ) | (1,596 | ) | ||||||||||
Write-off of deferred financing fees and loss on extinguishment of debt | (24,219 | ) | — | (5,069 | ) | — | (1,150 | ) | ||||||||||||
Other | 169 | (169 | ) | (76 | ) | 68 | 48 | |||||||||||||
Total other expense | (119,251 | ) | (87,908 | ) | (75,525 | ) | (24,564 | ) | (27,528 | ) | ||||||||||
Loss from continuing operations before provision for income taxes and cumulative effect of changes in accounting principles | (162,116 | ) | (184,296 | ) | (122,098 | ) | (25,461 | ) | (33,262 | ) | ||||||||||
Benefit from (provision for) income taxes | (1,820 | ) | (309 | ) | (1,493 | ) | (1,195 | ) | 196 | |||||||||||
Loss from continuing operations before cumulative effect of changes in accounting principles | (163,936 | ) | (184,605 | ) | (123,591 | ) | (26,656 | ) | (33,066 | ) | ||||||||||
Loss from discontinued operations, net of income taxes | (7,690 | ) | (3,717 | ) | (2,201 | ) | (2,259 | ) | (1,525 | ) | ||||||||||
Loss before cumulative effect of changes in accounting principles | (171,626 | ) | (188,322 | ) | (125,792 | ) | (28,915 | ) | (34,591 | ) | ||||||||||
Cumulative effect of changes in accounting principles | (545 | ) | (60,674 | ) | — | — | — | |||||||||||||
Net loss | (172,171 | ) | (248,996 | ) | (125,792 | ) | (28,915 | ) | (34,591 | ) | ||||||||||
Dividends on preferred stock | — | — | — | — | 733 | |||||||||||||||
Net loss applicable to shareholders | $ | (172,171 | ) | $ | (248,996 | ) | $ | (125,792 | ) | $ | (28,915 | ) | $ | (33,858 | ) | |||||
Balance Sheet Data: Cash and cash equivalents(1) Short-term investments Restricted cash(2) Property and equipment (net) Total assets Total debt(3) Total shareholders’ equity Other Data: Cash provided by (used in): Operating activities Investing activities Financing activities Tower Data (Before Discontinued Operations Treatment): Towers owned at the beginning of period Towers constructed Towers acquired Towers reclassified/disposed of(4) Towers held for sale Total towers owned at the end of period Tower Data (After Discontinued Operations Treatment): Total towers owned at the end of period Operating data: Revenues: Site leasing Site development Total revenues Operating expenses: Cost of revenues (exclusive of depreciation, accretion and amortization shown below): Cost of site leasing Cost of site development Selling, general and administrative Restructuring and other (credits) charges Asset impairment charges Depreciation, accretion and amortization Total operating expenses Operating income (loss) Other income (expense): Interest income Interest expense, net of amounts capitalized Non-cash interest expense Amortization of deferred financing fees Loss from write-off of deferred financing fees and extinguishment of debt Other Total other expense Loss from continuing operations before income taxes and cumulative effect of change in accounting principle Provision for income taxes Loss from continuing operations before cumulative effect of change in accounting principle (Loss) gain from discontinued operations, net of income taxes Loss before cumulative effect of change in accounting principle Cumulative effect of change in accounting principle Net loss Basic and diluted loss per common share amounts: Loss from continuing operations before cumulative effect of change in accounting principle Loss from discontinued operations Cumulative effect of change in accounting principle Net loss per common share Basic and diluted weighted average shares outstanding As of December 31, 2003 2002 2001 2000 1999 (audited) (audited) (audited) (unaudited) (in thousands) $ 8,338 $ 61,141 $ 13,904 $ 14,980 $ 3,131 15,200 — — — — 10,344 — — — — 856,213 940,961 987,053 766,221 339,079 982,982 1,303,365 1,407,543 948,818 429,823 870,758 1,024,282 845,453 248,273 320,767 43,877 203,490 448,744 538,160 48,582 For the years ended December 31, 2003 2002 2001 2000 1999 (audited) (audited) (audited) (unaudited) (in thousands) $ (29,808 ) $ 17,807 $ 28,753 $ 47,516 $ 23,134 155,456 (102,716 ) (554,700 ) (445,280 ) (208,870 ) (178,451 ) 132,146 524,871 409,613 162,124 For the years ended December 31, 2003 2002 2001 2000 1999 (unaudited) 3,877 3,734 2,390 1,163 494 13 141 667 779 438 — 53 677 448 231 (797 ) (51 ) — — — (61 ) — — — — 3,032 3,877 3,734 2,390 1,163 3,032 3,030 2,910 1,830 902 For the year ended December 31, 2006 2005 2004 2003 2002 (audited) (audited) (audited) (audited) (audited) (in thousands except for per share data) $ 256,170 $ 161,277 $ 144,004 $ 127,852 $ 115,121 94,932 98,714 87,478 64,257 99,352 351,102 259,991 231,482 192,109 214,473 70,663 47,259 47,283 47,793 46,709 85,923 92,693 81,398 58,683 81,565 42,277 28,178 28,887 30,714 32,740 (357 ) 50 250 2,094 47,762 — 398 7,092 12,993 24,194 133,088 87,218 90,453 93,657 95,627 331,594 255,796 255,363 245,934 328,597 19,508 4,195 (23,881 ) (53,825 ) (114,124 ) 3,814 2,096 516 692 601 (81,283 ) (40,511 ) (47,460 ) (81,501 ) (54,822 ) (6,845 ) (26,234 ) (28,082 ) (9,277 ) (29,038 ) (11,584 ) (2,850 ) (3,445 ) (5,115 ) (4,480 ) (57,233 ) (29,271 ) (41,197 ) (24,219 ) — 692 31 236 169 (169 ) (152,439 ) (96,739 ) (119,432 ) (119,251 ) (87,908 ) (132,931 ) (92,544 ) (143,313 ) (173,076 ) (202,032 ) (517 ) (2,104 ) (710 ) (1,729 ) (300 ) (133,448 ) (94,648 ) (144,023 ) (174,805 ) (202,332 ) — (61 ) (3,257 ) 202 (4,081 ) (133,448 ) (94,709 ) (147,280 ) (174,603 ) (206,413 ) — — — (545 ) (60,674 ) $ (133,448 ) $ (94,709 ) $ (147,280 ) $ (175,148 ) $ (267,087 ) $ (1.36 ) $ (1.28 ) $ (2.47 ) $ (3.35 ) $ (4.01 ) — — (0.05 ) — (0.08 ) — — — (0.01 ) (1.20 ) $ (1.36 ) $ (1.28 ) $ (2.52 ) $ (3.36 ) $ (5.29 ) 98,193 73,823 58,420 52,204 50,491
Balance Sheet Data: Cash and cash equivalents Short-term investments Restricted cash, current(1) Property and equipment, net Intangibles, net Total assets Total debt (2) Total shareholders’ equity (deficit)(3) Other Data: Cash provided by (used in): Operating activities Investing activities Financing activities Tower Data Rollforward: Towers owned at the beginning of period Towers acquired in AAT Acquisition Towers acquired Towers constructed Towers reclassified/disposed of(4) Total towers owned at the end of period Other Tower Data: Towers held for sale at end of period Towers in continuing operations at end of period As of December 31, 2006 2005 2004 2003 2002 (audited) (audited) (audited) (audited) (audited) (in thousands) $ 46,148 $ 45,934 $ 69,627 $ 8,338 $ 61,141 — 19,777 — 15,200 — 34,403 19,512 2,017 10,344 — 1,105,942 728,333 745,831 830,145 922,392 724,872 31,491 — — — 2,046,292 952,536 917,244 958,252 1,279,267 1,555,000 784,392 927,706 870,758 1,024,282 385,921 81,431 (88,671 ) (1,566 ) 161,024 For the year ended December 31, 2006 2005 2004 2003 2002 (audited) (audited) (audited) (audited) (audited) (in thousands) $ 75,960 $ 49,767 $ 14,216 $ (29,808 ) $ 17,807 (739,876 ) (99,283 ) 1,326 155,456 (102,716 ) 664,130 25,823 45,747 (178,451 ) 132,146 For the year ended December 31, 2006 2005 2004 2003 2002 3,304 3,066 3,093 3,877 3,734 1,850 — — — — 339 208 5 — 53 60 36 10 13 141 (2 ) (6 ) (42 ) (797 ) (51 ) 5,551 3,304 3,066 3,093 3,877 — — 6 47 837 5,551 3,304 3,060 3,046 3,040 5,551 3,304 3,066 3,093 3,877
| (1) |
| $3.7 million of payment and performance bonds which primarily related to collateral requirements relating to tower construction currently in process. Restricted cash of $19.5 million as of December 31, 2005 consisted of $17.9 million related to CMBS mortgage loan requirements and $1.6 million of payment and performance bonds which primarily related to collateral requirements relating to tower construction currently in process. Restricted cash of $2.0 million as of December 31, 2004 was payment and performance bonds which primarily related to collateral requirements relating to tower construction currently in process. Restricted cash of $10.3 million as of December 31, 2003 |
| Includes deferred gain on interest rate swap of $1.9 million as of December 31, 2004, $4.6 million as of December 31, 2003 and $5.2 million as of December 31, |
| (3) | Includes deferred loss from the termination of nine interest rate swap agreements of $12.8 million as of December 31, |
| (4) | Reclassifications reflect the combination for reporting purposes of multiple acquired tower structures on a single parcel of real estate, which we market and customers view as a single location, into a single owned tower site. Dispositions reflect the decommissioning, sale, conveyance or other legal transfer of owned tower sites. |
| ITEM 7. | MANAGEMENT’S DISCUSSION AND ANALYSIS OF FINANCIAL CONDITION AND RESULTS OF OPERATIONS |
The following discussion of our financial condition and results of operations should be read in conjunction with the information contained in our consolidated financial statements and the notes thereto. The following discussion includes forward-looking statements that involve certain risks and uncertainties, including, but not limited to, those described in Item 1A. Risk Factors of this Form 10-K. Our actual results may differ materially from those discussed below. See “Forward-looking statements” and Item 1A. Risk Factors.
We are a leading independent owner and operator of over 3,000 wireless communications towers in the eastern third47 of the 48 contiguous United States. We generate revenues fromStates, Puerto Rico, and the U.S. Virgin Islands. Our principal business line is our two primary businesses, site leasing and site development.business, which contributes over 90% of our segment operating profit. In our site leasing business, we lease antenna space to wireless service providers on towers and other structures that we own, or manage for or lease from others. The towers that we own have
been constructed by us at the request of a carrier,wireless service provider, built or constructed based on our own initiative or acquired. InAs of December 31, 2006, we owned 5,551 towers. We also manage or lease over 5,700 actual or potential communications sites, of which 785 are revenue producing. Our second business line is our site development business, through which we offerassist wireless service providers assistance in developing and maintaining their own wireless service networks.
Site Leasing Services
The percentage of revenues derived fromOur primary focus is the leasing of antenna space at, or on, communication towers continued to increase as a result of our emphasis on our site leasing business through the leasing and management of tower sites. Subsequent to the sale of 784multi-tenant towers to AAT Communications Corp. during 2003 (“Western tower sale”) we have focused our leasing activities in the eastern thirda variety of the United States where substantially all of our remaining towers are located.
Operating results in prior periods may not be meaningful predictors of future results. You should be aware of the significant changes in the nature and scope of our business when reviewing the ensuing discussion of comparative historical results. The 784 towers sold in the Western tower sale during 2003 have been accounted for as discontinued operations in accordance with generally accepted accounting principles. Additionally, 64 towers located in the Western two-thirds of the United States that we had previously decided to sell have also been accounted for as discontinued operations in accordance with generally accepted accounting principles. As of December 31, 2003, 61 of these towers remain as held for sale. All discussion related to the Consolidated Statements of Operations for the periods discussed in this “Management’s Discussion and Analysis of Financial Condition and Results of Operations” have been adjusted to reflect these towers as discontinued operations.
Site Leasing Services
wireless service providers under long-term lease contracts. Site leasing revenues are received primarily from wireless communications companies. Revenues from these clients are derived fromservice provider tenants, including Alltel, Cingular (now AT&T), Sprint Nextel, T-Mobile and Verizon Wireless. Wireless service providers enter into numerous different site leasing contracts. Each site leasing contracttenant leases with us, each of which relates to the lease or use of space at an individual tower site andsite. Each tenant lease is generally for an initial term of five years, and is renewable for five five-year5-year periods at the option of the tenant. Almost all of our site leasing contractstenant leases contain specific rent escalators, which average 3-4% per year, including the renewal option periods. Site leasing contractsTenant leases are generally paid on a monthly basis and revenue from site leasing is recorded monthly on a straight-line basis over the current term of the related lease agreements. Rental amounts received in advance are recorded in deferred revenue.
Additional site leasing revenue is generated through the execution of (1) new lease agreements for new tenant installations and (2) amendments to leases for additional equipment being added by existing tenants. Of the total annualized revenue added through leases and amendments executed during 2006, 73% resulted from new tenant leases. The remaining 27% resulted from amendments for additional equipment. By comparison, for leases and amendments executed during 2005, 82% of the total annualized revenue resulted from new tenant leases while 18% resulted from amendments for additional equipment.
Cost of site leasing revenue primarily consists of:
Rental payments for rental on ground and other underlying property;property leases;
Straight line rent adjustment for the difference between rental payments made and the expense recorded as if the payments had been made evenly throughout the minimum lease term (which may include renewal terms) of the underlying property lease;
Site maintenance and monitoring costs (exclusive of employee related costs);
Utilities;
Property insurance; and
Property taxes.
For any given tower, such costs are generally unrelated to the number of tenants on such tower.relatively fixed over a monthly or an annual time period. As such, operating costs for owned towers do not generally increase significantly as a result of adding additional customers to the tower.
Site leasing revenues comprised 60.3% The amount of other direct costs associated with operating a tower varies from site to site depending on the taxing jurisdiction and the height and age of the tower but typically do not make up a large percentage of total revenuesoperating costs. The ongoing maintenance requirements are typically minimal and include replacing lighting systems, painting a tower or upgrading or repairing an access road or fencing. Lastly, ground leases are generally for an initial term of 5 years or more, renewable, at our option, for multiple five-year periods, and provide for either annual rent escalators which typically average 3% - 4% annually or for term escalations of approximately 15%.
The table below details the year ended December 31, 2003, and 47.9%percentage of total company revenues forand operating profit contributed by the year ended December 31, 2002. Sitesite leasing contributed 93.1%segment. Information regarding the total and percentage of total gross profit for the year ended December 31, 2003 and 76.7%assets used in our site leasing services business is included in Note 22 of total gross profit for the year ended December 31, 2002.our Consolidated Financial Statements included in this Report.
| Percentage of Revenues | Site Leasing Segment Operating Profit Contribution(1) | |||
For the year ended December 31, 2006 | 73.0% | 95.4% | ||
For the year ended December 31, 2005 | 62.0% | 95.0% | ||
For the year ended December 31, 2004 | 62.2% | 94.1% | ||
(1) Site Leasing Segment Operating Profit is a non-GAAP financial measure. We reconcile this measure and provide other Regulations G disclosure later in this annual report in the section titled Non-GAAP Financial Measures. | ||||
As a result of the Western tower sale,AAT Acquisition, we reducedexpect that site leasing revenues and segment operating profit will increase substantially in 2007. We believe that over the long-term site leasing revenues will continue to grow as wireless service providers lease additional antenna space on our towers due to increasing minutes of network use and network coverage requirements. We believe our site leasing business is characterized by stable and long-term recurring revenues, predictable operating costs and minimal capital expenditures. Due to the relatively young age and mix of our tower portfolio, we expect future expenditures required to maintain these towers to be minimal. Consequently, we expect to grow our cash flows by 784 towers. During 2003,adding tenants to further improve efficiencies in our portfolio, we decidedtowers at minimal incremental costs by using existing tower capacity or requiring wireless service providers to sell an additional 64 towers remaining in the western two-thirdsbear all or a portion of the United States, which were not partcost of the Western tower sale. Three of thesemodifications. Furthermore, because our towers were sold during the fourth quarter of 2003, leaving 61 towers held for sale at December 31, 2003.
Gross profit margins on the towers sold in the Western tower sale were relatively comparable to the gross profit margins on the towers we retained. Therefore, the sale of these towers is not expected to have a material impact onare strategically positioned and our site leasing gross profit margin. Wecustomers typically do not anticipate making any other material changes to our tower portfolio in 2004.
Asre-locate, we have historically experienced low customer churn as a percentage of December 31, 2003, we owned 3,032 towers, substantially all of which are in the eastern third of the United States. This number excludes the 61 towers held for sale at December 31, 2003.
revenue.
Site Development Services
Our site development business is complementary to our site leasing business, and provides us the ability to (1) keep in close contact with the wireless service providers who generate substantially all of our site leasing revenue and (2) capture ancillary revenues that are generated by our site leasing activities, such as antenna installation and equipment installation at our tower locations. Our site development services business consists of two segments, site development consulting and site development construction, through which we provide wireless service providers a full range of end-to-end services. In the consulting segmentWe principally perform services for third parties in our core, historical areas of ourwireless expertise, specifically site development business, we offer clients the following services: (1) network pre-design; (2) site audits; (3) identification of potential locations for towersacquisition, zoning, technical services and antennas; (4) support in buying or leasing of the location; and (5) assistance in obtaining zoning approvals and permits. In the construction segment of our site development business, we provide a number of services, including, but not limited to the following: (1) tower and related site construction; (2) antenna installation; and (3) radio equipment installation, commissioning and maintenance.
construction.
Site development services revenues are received primarily from wireless communications companiesservice providers or companies providing development or project management services to wireless communications companies.service providers. Our site development customers engage us on a project-by-project basis, and a customer can generally terminate an assignment at any time without penalty. Site development projects, both consulting and construction, include contracts on a time and materials basis or a fixed price basis. The majority of our site development services are billed on a fixed price basis. Time and materials based site development contracts are billed and revenue is recognized at contractual rates as the services are rendered. Our site development projects generally take from 3three to 12twelve months to complete. For those site development consulting contracts in which we perform work on a fixed price basis, we bill the client, and recognize revenue, based on the completion of agreed upon phases of thethis project on a per site basis. Upon the completion of each phase, we recognize the revenue related to that phase.
Our revenue from construction projects is recognized on the percentage-of-completion method of accounting, determined by the percentage of cost incurred to date compared to management’s estimated total anticipated cost for each contract. This method is used because management considers total cost to be the best available measure of progress on the contracts. These amounts are based on estimates, and the uncertainty inherent in the estimates initially is reduced as work on the contracts nears completion.
Revenue from our site development construction business may fluctuate from period to period depending on construction activities, which are a function of the timing and amount of our clients’ capital expenditures, the number and significance of active customer engagements during a period, weather and other factors.
Cost of site development consulting revenue and construction revenue include all costs of materials, salaries and labor costs, including payroll taxes, subcontract labor, vehicle expense and other costs directly and indirectly related to the projects. All costs related to site development consulting projects and construction projects are recognized as incurred.
Our
The table below provides the percentage of total company revenues and total segment operating profit contributed by site development revenuesservices over the last three years. Information regarding the total and profit margins decreased significantly during 2002 and 2003. This decrease was primarily attributable to a declinepercentage of assets used in capital expenditures by wireless carriers and vigorous competition, particularly for our site development construction services businesses is included in Note 22 of our Consolidated Financial Statements included in this Report.
| For the year ended December 31, | ||||||||||||||||||||
| Percentage of Revenues | Segment Operating Profit Contribution | |||||||||||||||||||
| 2006 | 2005 | 2004 | 2006 | 2005 | 2004 | |||||||||||||||
Site development consulting | 4.7 | % | 5.2 | % | 6.2 | % | 1.3 | % | 1.3 | % | 1.6 | % | ||||||||
Site development construction | 22.3 | % | 32.8 | % | 31.6 | % | 3.3 | % | 3.7 | % | 4.3 | % | ||||||||
During 2004, we completed our previously announced plan to exit the services business in the Western portion of the United States based on our determination that the business was no longer beneficial to our site leasing business at the time. In connection with this plan, we realized gross proceeds from sales during the fiscal year ended December 31, 2004 of $0.4 million, and recorded a loss on disposal of discontinued operations of $0.8 million both of which adversely affectedare included in loss from discontinued operations, net of income taxes in our volumeConsolidated Statements of activityOperations.
Additional CMBS Certificates Issuance
On November 6, 2006, SBA CMBS -1 Depositor LLC, (the “Depositor”) an indirect subsidiary of ours, sold in a private transaction, $1.15 billion of Commercial Mortgage Pass-Through Certificates Series 2006-1 issued by SBA CMBS Trust (the “Trust”), a trust established by the Depositor (the “Additional CMBS Transaction”). The Additional CMBS Certificates have a weighted average monthly fixed coupon interest rate of 6.0%, and a weighted average interest rate to us of 6.3% after giving effect to the pricingsettlement of the hedging arrangements we entered into in anticipation of the financing. We used a substantial portion of the net proceeds from this issuance to repay the bridge facility, fund required reserves, and pay fees and expenses associated with the Additional CMBS Transaction. The remainder of the net proceeds were used for our services.
Percentage of Revenues December 31, Gross Profit Contribution December 31, Site development consulting Site development construction
For the years ended
For the years ended 2003 2002 2003 2002 8.5 % 11.3 % 1.5 % 6.8 % 31.2 % 40.8 % 5.5 % 16.5 %
working capital. The Additional CMBS Certificates have an anticipated repayment date of five years with a final repayment date in November 2036.
Critical Accounting Policies and Estimates
We have identified the policies and significant estimation processes below as critical to our business operations and the understanding of our results of operations. The listing is not intended to be a comprehensive list. In many cases, the accounting treatment of a particular transaction is specifically dictated by accounting principles generally accepted in the United States, with no need for management’s judgment in their application. In other cases, management is required to exercise judgment in the application of accounting principles with respect to particular transactions. The impact and any associated risks related to these policies on our business operations is discussed throughout “Management’s Discussion and Analysis of Financial Condition and Results of Operations” where such policies affect reported and expected financial results. For a detailed discussion on the application of these and other accounting policies, see Note 2 in the Notes to Consolidated Financial Statements for the year ended December 31, 2003,2006, included herein. Note that ourOur preparation of our financial statements requires us to make estimates and assumptions that affect the reported amount of assets and liabilities, disclosure of contingent assets and liabilities at the date of our financial statements, and the reported amounts of revenue and expenses during the reporting periods. Management bases its estimates on historical experience and on various other assumptions that are believed to be reasonable under the circumstances. There can be no assurance that actual results will not differ from those estimates and such differences could be significant.
Construction Revenue
Revenue from construction projects is recognized on the percentage-of-completion method of accounting, determined by the percentage of cost incurred to date compared to management’s estimated total anticipated cost for each contract. This method is used because we consider total cost to be the best available measure of progress on each contract. These amounts are based on estimates, and the uncertainty inherent in the estimates initially is reduced as work on each contract nears completion. The asset “Costs“costs and estimated earnings in excess of billings on uncompleted contracts” represents expenses incurred and revenues recognized in excess of amounts billed. The liability “Billings“billings in excess of costs and estimated earnings on uncompleted contracts” represents billings in excess of revenues recognized. See Note 11 to the Consolidated Financial Statements.
Allowance for Doubtful Accounts
We perform periodic credit evaluations of our customers. We continuously monitor collections and payments from our customers and maintain an allowance for estimated credit losses based upon our historical experience and any specific customer collection issues that we have identified. Establishing reserves against specific accounts receivable and the overall adequacy of our allowance is a matter of judgment. See the Consolidated Balance Sheet.
Asset Impairment
We evaluate the potential impairment of individual long-lived assets, principally the tower sites.sites and intangible assets. We record an impairment charge when we believe an investment in towers or the intangible asset has been impaired, such that future undiscounted cash flows would not recover the then current carrying value of the investment in the tower site. We consider many factors and make certain assumptions when making this assessment, including but not limited to;to: general market and economic conditions, historical operating results, geographic location, lease-up potential and expected timing of lease-up. In addition, we make certain assumptions in determining an asset’s fair value less costs to sell for purposes of calculating the amount of an impairment
charge. Changes in those assumptions or market conditions may result in a fair value less costs to sell which is different from management’s estimates. Future adverse changes in market conditions could result in losses or an inability to recover the carrying value, thereby possibly requiring an impairment charge in the future. In addition, if our assumptions regarding future undiscounted cash flows and related assumptions are incorrect, a future impairment charge may be required. See Note 18
Property Tax Expense
We typically receive notifications and invoices in arrears for property taxes associated with the tangible personal property and real property used in our site leasing business. As a result, we recognize property tax expense, which is reflected as a component of site leasing cost of revenue, based on our best estimate of anticipated property tax payments related to the Consolidated Financial Statements.
Asset Retirement Obligations
Effective January 1, 2003, we adoptedcurrent period. We consider several factors in establishing this estimate, including our historical level of incurred property taxes, the provisions of SFAS 143. Under the new accounting principle, we recognize asset retirement obligations in the period in which they are incurred if a reasonable estimate of a fair value can be made and we accrete such liability through the obligation’s estimated settlement date. The associated asset retirement costs are capitalized as partlocation of the carrying amountproperty, our awareness of thejurisdictional property value assessment methods and industry related tower fixed assets and depreciated over its estimated useful life.property tax information. If our estimates regarding anticipated property tax expenses are incorrect, a future increase or decrease in site leasing cost of revenue may be required.
Significant management estimates and assumptions are required in determining the scope and fair value of our obligations to restore leaseholds to their original condition upon termination of ground leases. In determining the scope and fair value of our obligations, assumptions were made with respect to the : historical retirement experience as an indicator of future restoration probabilities, intent in renewing existing ground leases through lease termination dates, current and future value and timing of estimated restoration costs, and the credit adjusted risk-free rate used to discount future obligations. While we feel the assumptions were appropriate, there can be no assurances that actual costs and the probability of incurring obligations will not differ from estimates. We will review these assumptions periodically and we may need to adjust them as necessary. See Note 5a to the Consolidated Financial Statements.
RESULTS OF OPERATIONS
As our gross profit mix shifts more towards site leasing, operating results in prior periods may not be meaningful predictors of future results. You should be aware of the dramatic changes in the nature and scope of our business when reviewing the ensuing discussion of comparative historical results.
Year Ended 20032006 Compared to Year Ended 20022005
Revenues:
| For the years ended December 31, | |||||||||||||||
| 2003 | Percentage of Revenues | 2002 | Percentage of Revenues | Percentage (Decrease) | |||||||||||
| (dollars in thousands) | |||||||||||||||
Site leasing | $ | 127,842 | 60.3 | % | $ | 115,081 | 47.9 | % | 11.1 | % | |||||
Site development consulting | 18,092 | 8.5 | % | 27,204 | 11.3 | % | (33.5 | )% | |||||||
Site development construction | 66,126 | 31.2 | % | 97,837 | 40.8 | % | (32.4 | )% | |||||||
Total revenues | $ | 212,060 | 100.0 | % | $ | 240,122 | 100.0 | % | (11.7 | )% | |||||
| For the year ended December 31, | |||||||||||||||
| 2006 | Percentage of Revenues | 2005 | Percentage of Revenues | Percentage Change | |||||||||||
| (in thousands except for percentages) | |||||||||||||||
Site leasing | $ | 256,170 | 73.0 | % | $ | 161,277 | 62.0 | % | 58.8 | % | |||||
Site development consulting | 16,660 | 4.7 | % | 13,549 | 5.2 | % | 23.0 | % | |||||||
Site development construction | 78,272 | 22.3 | % | 85,165 | 32.8 | % | (8.1 | )% | |||||||
Total revenues | $ | 351,102 | 100.0 | % | $ | 259,991 | 100.0 | % | 35.0 | % | |||||
Site leasing revenue increased due to the increased number of tenants andnew tenant installations, the amount of lease amendments related to equipment added to our towers.towers, revenue generated by the towers that we acquired in the AAT Acquisition, other towers acquired, and towers constructed during 2006. The AAT Acquisition contributed approximately $63.2 million of the increase in total revenues. As of December 31, 20032006, we had 6,84713,602 tenants as compared to 6,3898,278 tenants at December 31, 2002. During the year ended 2003, 88.7% of contractual revenues from new leases and amendments executed in 2003 were related to new tenant installation and 11.3% were related to additional equipment being added by existing tenants. During the year ended 2002, 86.7% of contractual revenues from new leases and amendments executed in 2002 were related to new tenant installation and 13.3% were related to additional equipment being added by existing tenants.2005. Additionally, we have experienced on average, higher rents per tenant due to higher rents from new tenants, higher rents upon renewal by existing tenants and additional equipment added by existing tenants. Both siteLastly, we added 2,249 towers to our portfolio in 2006 versus only adding 244 towers in 2005.
Site development consulting andrevenues increased as a result of a higher volume of work in 2006 versus 2005. Site development construction revenue decreased due to the roll-off of certain of our prior construction contracts from the larger wireless carriers and our efforts to focus on capturing the higher margin services work rather than volume.
Operating Expenses:
| For the year ended December 31, | ||||||||||
| 2006 | 2005 | Percentage Change | ||||||||
| (in thousands) | ||||||||||
Cost of revenues (exclusive of depreciation, accretion and amortization): | ||||||||||
Site leasing | $ | 70,663 | $ | 47,259 | 49.5 | % | ||||
Site development consulting | 14,082 | 12,004 | 17.3 | % | ||||||
Site development construction | 71,841 | 80,689 | (11.0 | )% | ||||||
Selling, general and administrative | 42,277 | 28,178 | 50.0 | % | ||||||
Asset impairment and other (credits) charges | (357 | ) | 448 | (179.6 | )% | |||||
Depreciation, accretion and amortization | 133,088 | 87,218 | 52.6 | % | ||||||
Total operating expenses | $ | 331,594 | $ | 255,796 | 29.6 | % | ||||
Site leasing cost of revenues increased primarily as a result of the declinegrowth in capital expendituresthe number of towers owned by wireless
carriers for additional antenna sites and vigorous competition,us, which adversely affected our volumewas 5,551 at December 31, 2006 up from 3,304 at December 31, 2005. The AAT Acquisition contributed approximately $19.6 million to the increase in total site leasing cost of activity and the pricing for our services.
Cost of Revenues:
| For the years ended December 31, | Percentage Increase (Decrease) | ||||||||
| 2003 | 2002 | ||||||||
| (in thousands) | |||||||||
Site leasing | $ | 42,021 | $ | 40,650 | 3.4 | % | |||
Site development consulting | 16,723 | 20,594 | (18.8 | )% | |||||
Site development construction | 61,087 | 81,879 | (25.4 | )% | |||||
Total cost of revenues | $ | 119,831 | $ | 143,123 | (16.3 | )% | |||
Both siterevenues. Site development consulting and construction cost of revenues decreased due primarily to lower levels of activity.
Gross Profit:
| For the years ended December 31, | Percentage Increase (Decrease) | ||||||||
| 2003 | 2002 | ||||||||
| (in thousands) | |||||||||
Site leasing | $ | 85,821 | $ | 74,431 | 15.4 | % | |||
Site development consulting | 1,369 | 6,610 | (79.3 | )% | |||||
Site development construction | 5,039 | 15,958 | (68.4 | )% | |||||
Total gross profit | $ | 92,229 | $ | 96,999 | (4.9 | )% | |||
Gross profit for the site leasing business increased as a result of higher revenues per tower and tower operating cost reduction initiatives. Gross profit from both site development consulting and construction decreased as a resultvolume of the lower volumes and lower pricing without a commensurate reduction in cost.
Gross Profit Margin Percentages:
Percentage of revenue December 31, | ||||||
| 2003 | 2002 | |||||
Site leasing | 67.1 | % | 64.6 | % | ||
Site development consulting | 7.6 | % | 24.3 | % | ||
Site development construction | 7.6 | % | 16.3 | % | ||
Gross profit margin | 43.5 | % | 40.4 | % | ||
Operating Expenses:
| For the years ended December 31, | Percentage (Decrease) | ||||||||
| 2003 | 2002 | ||||||||
| (in thousands) | |||||||||
Selling, general and administrative | $ | 31,244 | $ | 34,352 | (9.0 | )% | |||
Restructuring and other charges | 2,505 | 47,762 | (94.8 | )% | |||||
Asset impairment charges | 16,965 | 25,545 | (33.6 | )% | |||||
Depreciation, accretion and amortization | 84,380 | 85,728 | (1.6 | )% | |||||
Total operating expenses | $ | 135,094 | $ | 193,387 | (30.1 | )% | |||
Selling, general and administrative expenses decreased primarily as a result of reductions in the number of offices, elimination of personnel and elimination of other infrastructure. As of December 31, 2003, we had approximately 600 employees whereas as of December 2002, we had approximately 750 employees.
In 2003, we recognized approximately $17.0 million in asset impairment charges related to 70 towers. By comparison, in 2002 we recognized approximately $16.4 million of asset impairment charges related to 144 towers. The impairment of operational tower assets resulted primarily from our evaluations of the fair
value of our operating tower portfolio through a discounted cash flow analysis. Towers determined to be impaired were primarily towers with no tenants and/or with little or deteriorating prospects for future lease-up. In addition, the 2002 asset impairment charge included $9.2 million of goodwill that was recorded during the first two quarters of 2002, which was determined to be impaired during June 2002 when the transitional impairment test of goodwill was performed under SFAS 142.
In February 2002, as a result of the deterioration of capital market conditions for wireless carriers, we reduced our capital expenditures for new tower development and acquisition activities, suspended any new investment for additional towers, reduced our workforce and closed or consolidated offices. Of the $47.3 million charge recorded during the year ended December 31, 2002, approximately $40.4 million related to the abandonment of new tower build and acquisition work in progress and related construction materials on approximately 764 sites. The remaining $6.9 million related primarily to the costs of employee separation for approximately 470 employees and exit costs associated with the closing and consolidation of approximately 40 offices. During 2003, in response to a decline in expenditures by wireless service providers, particularly with respect to site development activities, we committed to new plans of restructuring associated with further downsizing activities. Of the $2.5 million charge recorded for the year ended December 31, 2003,2006 versus the same period of 2005. Site development construction cost of revenue decreased due to the roll-off of certain of our prior construction contracts from the larger wireless carriers and our efforts to focus on capturing the higher margin services work rather than volume. That focus and changing market conditions for the year ended December 31, 2006 resulted in higher margin jobs in 2006 versus 2005.
Selling, general, and administrative expense increased $14.1 million, which was due to a $6.9 million increase in salaries, benefits, and other backoffice operating expenses resulting primarily from a higher number of employees, a significant portion of which is attributable to the AAT Acquisition. Selling, general, and administrative expense was also impacted by $5.3 million of stock option and employee stock purchase plan expense that we recognized in 2006 in accordance with SFAS 123R as compared to $0.5 million in 2005. The remaining portion of the increase was due to $2.3 million of bonus, transition, and integration expenses incurred in connection with the AAT Acquisition. These bonus, transition, and integration expenses are not expected to recur in future years.
Depreciation, accretion and amortization expense increased primarily due to expense on assets acquired in the AAT Acquisition, which represented approximately $0.6$46.4 million, offset by the decrease in certain towers becoming fully depreciated since December 31, 2005.
Operating Income:
For the year ended December 31, | |||||||||
| 2006 | 2005 | Percentage Change | |||||||
| (in thousands) | |||||||||
Operating income | $ | 19,508 | $ | 4,195 | 365.0 | % | |||
The increase in operating income was primarily due to increases in the segment operating profit (see below) of the site leasing segment, which was primarily due to an increased number of towers acquired in the AAT Acquisition. This increase was further augmented by an increase in segment operating profit of the site development construction segment which was due to the roll-off of certain of our prior construction contracts from the larger wireless carriers which were at lower margins than subsequent work that was at higher margins. These increases were offset by an increase in selling, general, and administrative expense and depreciation, accretion, and amortization expense for the year ended December 31, 2006 versus the year ended December 31, 2005.
Segment Operating Profit:
| For the year ended December 31, | |||||||||
| 2006 | 2005 | Percentage Change | |||||||
| (in thousands) | |||||||||
Segment operating profit: | |||||||||
Site leasing | $ | 185,507 | $ | 114,018 | 62.7 | % | |||
Site development consulting | 2,578 | 1,545 | 66.9 | % | |||||
Site development construction | 6,431 | 4,476 | 43.7 | % | |||||
Total | $ | 194,516 | $ | 120,039 | 62.0 | % | |||
The increase in site leasing segment operating profit related primarily to additional revenue generated by the increased number of towers acquired in the AAT Acquisition, which contributed $43.6 million of the increase. The remaining increase is primarily due to the revenue from the increased number of tenants and tenant equipment on our sites in 2006 versus 2005, which had minimal incremental associated costs.
Other Income (Expense):
For the year ended ended December 31, | |||||||||||
| 2006 | 2005 | Percentage Change | |||||||||
| (in thousands) | |||||||||||
Interest income | $ | 3,814 | $ | 2,096 | 82.0 | % | |||||
Interest expense | (81,283 | ) | (40,511 | ) | 100.6 | % | |||||
Non-cash interest expense | (6,845 | ) | (26,234 | ) | (73.9 | )% | |||||
Amortization of deferred financing fees | (11,584 | ) | (2,850 | ) | 306.5 | % | |||||
Loss from write-off of deferred financing fees and extinguishment of debt | (57,233 | ) | (29,271 | ) | 95.5 | % | |||||
Other | 692 | 31 | 2,132.3 | % | |||||||
Total other expense | $ | (152,439 | ) | $ | (96,739 | ) | 57.6 | % | |||
Interest expense for the year ended December 31, 2006 increased $40.8 million from the year ended December 31, 2005. This increase is primarily due to the higher aggregate amount of cash-interest bearing debt outstanding during 2006, which consisted of a $1.1 billion bridge loan during the second, third, and a portion of the fourth quarters of 2006 and $405 million of Initial CMBS Certificates outstanding for all twelve months of 2006 and $1.15 billion of Additional CMBS Certificates outstanding for the last two months of 2006, versus an average balance of $587.6 million of cash interest bearing debt in 2005, which was primarily comprised of our 8 1/2% senior notes, our senior secured credit facility and the Initial CMBS Certificates.
Non-cash interest expense for the year ended December 31, 2006 decreased $19.4 million from the year ended December 31, 2005. The decrease was a result of the redemption and repurchase of $111.8 million of 9 3/4% senior discount notes in June and November of 2005 and the repurchase of the remaining aggregate principal amount of $223.7 million of these notes in April 2006.
Amortization of deferred financing fees for the year ended December 31, 2006 increased by $8.7 million, as compared to the year ended December 31, 2005. This increase was primarily due to amortization of fees relating to the $1.1 billion bridge loan, the $1.15 billion of Additional CMBS Certificates, the $405.0 million of Initial CMBS Certificates, and the senior revolving credit facility for the year ended December 31, 2006 versus the amortization of fees on outstanding 8 1/2% senior notes, 9 3/4% senior discount notes, and the senior secured credit facility for the year ended December 31, 2005.
Loss from write-off of deferred financing fees and extinguishment of debt for the year ended December 31, 2006 was $57.2 million, an increase of $27.9 million from the year ended December 31, 2005. The increase was attributable to the loss from write-off of $10.2 million of deferred financing fees and $47.0 million of losses on the extinguishment of debt resulting from the repayment of the $1.1 billion of the bridge loan in November 2006, repurchase of $223.7 million of our 9 3/4% senior discount notes and $162.5 million of our 8 1/2% senior notes in April 2006, versus the loss from write-off of $2.3 million of deferred financing fees and $10.9 million of losses on the extinguishment of debt associated with the redemption of $111.8 million of our 9 3/4% senior discount notes, the write-off of $1.7 million of deferred financing fees and $7.4 million of losses from the write-off of $87.5 million of our 8 1/2% senior notes, the write-off of $5.4 million of deferred financing fees associated with the repayment and refinancing of our prior senior credit facility, and the write-off of $0.8 million of deferred financing fees and $0.7 million on the extinguishment of debt associated with the redemption of $50.0 million of our 10 1/4%senior notes during 2005.
Adjusted EBITDA:
For the year ended December 31, | Percentage | ||||||||
| 2006 | 2005 | Change | |||||||
| (in thousands) | |||||||||
Adjusted EBITDA | $ | 161,814 | $ | 95,322 | 69.8 | % | |||
The increase in Adjusted EBITDA for the year ended December 31, 2006 was primarily the result of increased segment operating profit from our site leasing segment. Adjusted EBITDA is a non-GAAP financial measure. We reconcile this measure and provide other Regulation G disclosures later in this annual report in the section titled Non-GAAP Financial Measures.
Net Loss:
For the year ended December 31, | Percentage | ||||||||||
| 2006 | 2005 | Change | |||||||||
| (in thousands) | |||||||||||
Net loss | $ | (133,448 | ) | $ | (94,709 | ) | 40.9 | % | |||
Net loss for year ended December 31, 2006 increased $38.7 million from the year ended December 31, 2005. The increase in net loss is primarily a result of higher interest expense, an increase in loss from write-off of deferred financing fees and extinguishment of debt, and higher amortization of deferred financing fees, offset by improved operating income and lower non-cash interest expense for the year ended December 31, 2006 as compared to the year ended December 31, 2005.
Year Ended 2005 Compared to Year Ended 2004
Revenues:
| For the year ended December 31, | |||||||||||||||
| 2005 | Percentage of Revenues | 2004 | Percentage of Revenues | Percentage Change | |||||||||||
| (in thousands except for percentages) | |||||||||||||||
Site leasing | $ | 161,277 | 62.0 | % | $ | 144,004 | 62.2 | % | 12.0 | % | |||||
Site development consulting | 13,549 | 5.2 | % | 14,456 | 6.2 | % | (6.3 | )% | |||||||
Site development construction | 85,165 | 32.8 | % | 73,022 | 31.6 | % | 16.6 | % | |||||||
Total revenues | $ | 259,991 | 100.0 | % | $ | 231,482 | 100.0 | % | 12.3 | % | |||||
Site leasing revenue increased due to the increased number of new tenant installations, the amount of lease amendments related to equipment added to our towers and the towers we acquired and constructed during 2005. As of December 31, 2005, we had 8,278 tenants as compared to 7,449 tenants at December 31, 2004. Additionally, we have experienced on average higher rents per tenant due to higher rents from new tenants, higher rents upon renewal by existing tenants and additional equipment added by existing tenants. Lastly, we added 244 towers in 2005 versus only 15 towers in 2004.
Site development construction revenue increased primarily as a result of revenue generated from a services contract with Cingular in the North and South Carolina markets that was only in its initial stages in 2004. The increase in site development construction revenue is also a result of an increase in the overall volume of work in the second, third, and fourth quarters of 2005 as compared to the same periods of 2004.
Operating Expenses:
For the year ended December 31, | |||||||||
| 2005 | 2004 | Percentage Change | |||||||
| (in thousands) | |||||||||
Cost of revenues (exclusive of depreciation, accretion and amortization): | |||||||||
Site leasing | $ | 47,259 | $ | 47,283 | (0.1 | )% | |||
Site development consulting | 12,004 | 12,768 | (6.0 | )% | |||||
Site development construction | 80,689 | 68,630 | 17.6 | % | |||||
Selling, general and administrative | 28,178 | 28,887 | (2.5 | )% | |||||
Asset impairment and other charges | 448 | 7,342 | (93.9 | )% | |||||
Depreciation, accretion and amortization | 87,218 | 90,453 | (3.6 | )% | |||||
Total operating expenses | $ | 255,796 | $ | 255,363 | 0.2 | % | |||
Site development construction cost of revenue increased primarily as a result of the increase in volume related to the abandonmentCingular contract mentioned above, as well as an increase in the overall volume of new tower build work in processthe second, third, and trailing costs associated with previously abandoned new tower build work in process. The remaining $1.9 million related primarilyfourth quarters of 2005 as compared to the costssame periods of employee separation2004.
Asset impairment charges decreased as a result of impairment charges taken on one tower for approximately 165 employees$0.2 million and exit costs associated with the closing or consolidationremaining value of 17 offices. Annualized aggregate lease costs associated with the 17 offices closed or consolidated during 2003 were $0.7 million.
microwave network equipment of $0.2 million for the year ended December 31, 2005 as opposed to charges on 40 towers of $2.6 million and microwave network equipment of $4.5 million for the year ended December 31, 2004.
Operating Loss From Continuing Operations:Income (Loss):
| For the years ended December 31, | Percentage (Decrease) | ||||||||||
| 2003 | 2002 | ||||||||||
| (in thousands) | |||||||||||
Operating loss from continuing operations | $ | (42,865 | ) | $ | (96,388 | ) | (55.5 | %) | |||
| For the year ended December 31, | ||||||||||
| 2005 | 2004 | Percentage Change | ||||||||
| (in thousands) | ||||||||||
Operating income (loss) | $ | 4,195 | $ | (23,881 | ) | 117.6 | % | |||
ThisThe decrease in operating loss from continuing operations primarily was a result of lower restructuring and other chargeshigher revenues and lower overall operating expenses, in particular asset impairment charges, and a decrease in 2003depreciation, accretion and amortization expense in 2005 as compared to 2002.
2004.
Other Expense:Segment Operating Profit:
| For the years ended December 31, | Percentage Increase | ||||||||||
| 2003 | 2002 | ||||||||||
| (in thousands) | |||||||||||
Interest income | $ | 692 | $ | 601 | 15.1 | % | |||||
Interest expense, net of amounts capitalized | (90,778 | ) | (83,860 | ) | 8.2 | % | |||||
Amortization of debt issue costs | (5,115 | ) | (4,480 | ) | 14.2 | % | |||||
Write-off of deferred financial fees and loss on extinguishment of debt | (24,219 | ) | — | 100.0 | % | ||||||
Other | 169 | (169 | ) | 200.0 | % | ||||||
| $ | (119,251 | ) | $ | (87,908 | ) | 35.7 | % | ||||
For the year ended December 31, | |||||||||
| 2005 | 2004 | Percentage Change | |||||||
| (in thousands) | |||||||||
Segment operating profit: | |||||||||
Site leasing | $ | 114,018 | $ | 96,721 | 17.9 | % | |||
Site development consulting | 1,545 | 1,688 | (8.5 | )% | |||||
Site development construction | 4,476 | 4,392 | 1.9 | % | |||||
Total | $ | 120,039 | $ | 102,801 | 16.8 | % | |||
The increase in site leasing segment operating profit was related primarily to additional revenue per tower generated by the increased number of tenants on our sites in 2005 versus 2004, without a commensurate increase in the cost of revenues (excluding depreciation, accretion, and amortization) due to property tax reductions and tower operating cost reduction initiatives.
Other Income (Expense):
| For the year ended ended December 31, | |||||||||||
| 2005 | 2004 | Percentage Change | |||||||||
| (in thousands) | |||||||||||
Interest income | $ | 2,096 | $ | 516 | 306.2 | % | |||||
Interest expense | (40,511 | ) | (47,460 | ) | (14.6 | )% | |||||
Non-cash interest expense | (26,234 | ) | (28,082 | ) | (6.6 | )% | |||||
Amortization of deferred financing fees | (2,850 | ) | (3,445 | ) | (17.3 | )% | |||||
Loss from write-off of deferred financing fees and extinguishment of debt | (29,271 | ) | (41,197 | ) | (28.9 | )% | |||||
Other | 31 | 236 | (86.9 | )% | |||||||
Total other expense | $ | (96,739 | ) | $ | (119,432 | ) | (19.0 | )% | |||
Interest expense, increasednon-cash interest expense, and amortization of deferred financing fees decreased primarily as a result of higher borrowings and higher weighted average interest rates. Additionally, interest expense in 2002 was reduced as a resultthe redemptions of 35% of our interest rate swap agreement that existed during most of 2002. The write-off of deferred financing fees and loss on extinguishment of debt is attributable to a write-off of $4.4 million of deferred financing fees associated with the termination of the prior senior credit facility and $19.8 million associated with the early retirement of a portion of our 12%9 3/4% senior discount notes and our 10¼8 1/2% senior notes. We expect to incur additional material chargesnotes from the proceeds of our May and October equity offerings totaling $226.9 million in 20042005.
The decrease in loss from the write-off of deferred financing fees and extinguishment of debt associated withwas attributed to the write-off of $10.2 million of deferred financing fees and $19.1 million of losses on the extinguishment of debt resulting from the retirement of our 10 1/4% senior notes, refinancing our senior credit refinancing, the 10¼facility, and redemptions of 35% of our 9 3/4% senior note repurchasesdiscount notes and the 12%our 8 1/2% senior discount note repurchases and redemptions which occurred subsequent to December 31, 2003.
Discontinued Operations:
| For the years ended December 31, | Percentage | ||||||||||||
2003 | 2002 | Increase | |||||||||||
| (in thousands) | |||||||||||||
Loss from discontinued operations, net of income taxes | $ | (7,690 | ) | $ | (3,717 | ) | 106.9 | % | |||||
As previously discussed a total of 848 towers (784 towers sold in the Western tower sale and 64 additional towers held for sale) meet the criteria for discontinued operations treatment. The increase in loss from discontinued operations resulted primarily from a loss on sale of $2.1 million related to the Western tower sale.
Cumulative Effect of Changes In Accounting Principle:
| For the years ended December 31, | Percentage | ||||||||||
| 2003 | 2002 | (Decrease) | |||||||||
| (in thousands) | |||||||||||
Cumulative effect of changes in accounting principle | $ | (545 | ) | $ | (60,674 | ) | (99.1 | %) | |||
Effective January 1, 2003, we adopted a method of accounting for asset retirement obligations in accordance with SFAS 143. Under the new accounting principle, we recognize asset retirement obligations in the period in which they are incurred if a reasonable estimate of a fair value can be made. The associated asset retirement costs are capitalized as part of the carrying amount of our tower fixed assets. The cumulative effect of the change on prior years resulted in a cumulative effect adjustment of approximately $0.5 million that is included in net lossnotes for the year ended December 31, 2003.2005, versus a write-off of $13.1 million of deferred financing fees and $28.1 million of losses on the extinguishment of debt associated with the early retirement of our 12% senior discount notes, a significant portion of our 10 1/4% senior notes and the termination of a prior senior credit facility in the year ended December 31, 2004.
Adjusted EBITDA:
| For the year ended December 31, | |||||||||
| 2005 | 2004 | Percentage Change | |||||||
| (in thousands) | |||||||||
Adjusted EBITDA | $ | 95,322 | $ | 78,794 | 21.0 | % | |||
During 2002, we completedThe increase in Adjusted EBITDA was primarily the transitional impairment testresult of goodwill required under SFAS 142, whichimprovement in the site leasing segment operating profit for the year ended December 31, 2005 versus the year ended December 31, 2004. Adjusted EBITDA is a non-GAAP financial measure. We reconcile this measure and provide other Regulation G disclosures later in this annual report in the section titled Non-GAAP Financial Measures.
Discontinued Operations, Net of Income Taxes:
| For the year ended December 31, | |||||||||||
| 2005 | 2004 | Percentage Change | |||||||||
| (in thousands) | |||||||||||
Loss from discontinued operations, net of income taxes | $ | (61 | ) | $ | (3,257 | ) | (98.1 | )% | |||
Loss from discontinued operations of $3.3 million in 2004 was adopted effective January 1, 2002. Asprimarily a result of completing the required transitional test, we recorded a charge retroactive toloss on the adoption date for the cumulative effect of accounting changewestern services business, which was sold in the amount of $60.7 million representing the excess of the carrying value of certain assets2004, as compared to their estimated fair value. Of the total $60.7only trailing costs of $0.06 million cumulative effect adjustment, $58.5 million related to the site development construction reporting segment and $2.2 million related to the site leasing reporting segment.in 2005.
Net Loss:
For the years ended December 31, | Percentage | ||||||||||||
| 2003 | 2002 | (Decrease) | |||||||||||
| (in thousands) | |||||||||||||
Net loss | $ | (172,171 | ) | $ | (248,996 | ) | (30.9 | %) | |||||
For the year ended December 31, | Percentage | ||||||||||
| 2005 | 2004 | Change | |||||||||
| (in thousands) | |||||||||||
Net loss | $ | (94,709 | ) | $ | (147,280 | ) | (35.7 | )% | |||
ThisThe decrease in net loss is primarily a result of lower restructuring and other charges,improved operating income (loss), lower asset impairment charges, lower depreciation, accretion, and amortization expense and lower amounts resulting from a cumulative effect in change in accounting principle offset by an increase in interest expense and write offs associated with the extinguishment of debt. We expect to incur additional net losses in 2004.
Year Ended 2002 Compared to Year Ended 2001
Revenues:
| For the years ended December 31, | |||||||||||||||
| 2002 | Percentage of Revenues | 2001 | Percentage of Revenues | Percentage (Decrease) | |||||||||||
| (dollars in thousands) | |||||||||||||||
Site leasing | $ | 115,081 | 47.9 | % | $ | 85,487 | 38.0 | % | 34.6 | % | |||||
Site development consulting | 27,204 | 11.3 | % | 24,251 | 10.8 | % | 12.2 | % | |||||||
Site development construction | 97,837 | 40.8 | % | 115,484 | 51.2 | % | (15.3 | %) | |||||||
Total revenues | $ | 240,122 | 100 | % | $ | 225,222 | 100 | % | 6.6 | % | |||||
Site leasing revenue increased due to the increased number of tenants added to our towers, higher average rents received and the increase in the number of towers in our portfolio. As of December 31, 2002 we had 6,389 tenants as compared to 5,558 tenants at December 31, 2001. Site development consulting revenues increased due to several new contracts for site acquisition and zoning services from wireless communications carriers. Site development construction revenue decreased due primarily to reduced carrier activity and price competition resulting from lower capital expenditures by wireless carriers on or around cell sites.
Cost of Revenues:
| For the years ended December 31, | Percentage Increase | ||||||||||
| 2002 | 2001 | (Decrease) | |||||||||
| (in thousands) | |||||||||||
Site leasing | $ | 40,650 | $ | 30,657 | 32.6 | % | |||||
Site development consulting | 20,594 | 17,097 | 20.5 | % | |||||||
Site development construction | 81,879 | 91,435 | (10.5 | %) | |||||||
Total cost of revenues | $ | 143,123 | $ | 139,189 | 2.8 | % | |||||
Site leasing cost of revenue increased due to the increased number of towers owned resulting in an increased amount of lease payments to site owners and related site costs as well as increases in operating costs of certain sites, maintenance and property taxes. Site development consulting cost of revenue increased, reflecting higher levels of activity and increased personnel costs. Site development construction cost of revenue decreased, due primarily to lower levels of activity.
Gross Profit:
| For the years ended December 31, | Percentage Increase | ||||||||
| 2002 | 2001 | (Decrease) | |||||||
| (in thousands) | |||||||||
Site leasing | $ | 74,431 | $ | 54,830 | 35.7 | % | |||
Site development consulting | 6,610 | 7,154 | (7.6 | %) | |||||
Site development construction | 15,958 | 24,049 | (33.6 | %) | |||||
Total gross profit | $ | 96,999 | $ | 86,033 | 12.7 | % | |||
Gross profit for the site leasing business increased as a result of the increased number of tenants added to our towers, and to a lesser extent, additional towers added to our portfolio. Gross profit decreased for both site development consulting and construction. This decrease primarily resulted from lower pricing for our services due to competition.
Gross Profit Margin Percentages:
| Percentage of revenue | ||||||
| For the years ended December 31, | ||||||
| 2002 | 2001 | |||||
Site leasing | 64.7 | % | 64.1 | % | ||
Site development consulting | 24.3 | % | 29.5 | % | ||
Site development construction | 16.3 | % | 20.8 | % | ||
Gross profit margin | 40.4 | % | 38.2 | % | ||
Operating Expenses:
| For the years ended December 31, | Percentage Increase | ||||||||
| 2002 | 2001 | (Decrease) | |||||||
| (in thousands) | |||||||||
Selling, general and administrative | $ | 34,352 | $ | 42,103 | (18.4 | %) | |||
Restructuring and other charges | 47,762 | 24,399 | 95.8 | % | |||||
Asset impairment charges | 25,545 | — | 100.0 | % | |||||
Depreciation and amortization | 85,728 | 66,104 | 29.7 | % | |||||
Total operating expenses | $ | 193,387 | $ | 132,606 | 45.8 | % | |||
The decrease in selling, general and administrativenon-cash interest expense primarily resulted from a decrease in tower developmental expenses as well as the reduction of offices, elimination of personnel and elimination of other infrastructure that had previously been necessary to support our prior level of new asset growth but was no longer required as a result of the restructurings previously discussed. Included within selling, general and administrative expenses is a provision for doubtful accounts. The provision for doubtful accounts increased to $3.4 million for the year ended December 31, 2002 from $2.6 million for2005 as compared with the year ended December 31, 2001, reflecting our assessment of a more challenging financial environment for our customers.
During the year ended December 31, 2002 we incurred restructuring charges in the amount of $47.3 million. Of the $47.3 million charge, approximately $40.4 million related to the abandonment of new tower build and acquisition work in process and related construction materials on approximately 764 sites. The remaining $6.9 million of restructuring expense related primarily to the costs of employee separation for approximately 470 employees and exit costs associated with the closing and consolidation of approximately 40 offices. Exit costs associated with the closing and consolidation of offices primarily represented our estimate of future lease obligations after considering sublease opportunities.
In the first quarter of 2002, certain tower sites held and used in operations were considered to be impaired resulting in a $16.4 million impairment charge. Towers determined to be impaired were primarily towers with no tenants and little or no prospects for future lease-up. In addition, during the first six months of 2002, we recorded additional goodwill totaling approximately $9.2 million resulting from the achievement of certain earn-out obligations under various construction acquisition agreements entered into prior to July 1, 2001, which was determined to be impaired and written off. The $16.4 million and the $9.2 million are included within asset impairment charges in the year ended December 31, 2002 Consolidated Statement of Operations.
The increase in depreciation, amortization and accretion is directly related to the increased amount of fixed assets, primarily towers, we owned in 2002 as compared to 2001, offset by a decrease in amortization resulting from the write-off of goodwill which was recorded in connection with the implementation of SFAS No. 142.
Operating Loss From Continuing Operations:
| For the years ended December 31, | Percentage Increase | ||||||||||||
2002 | 2001 | (Decrease) | |||||||||||
| (in thousands) | |||||||||||||
Operating loss from continuing operations | $ | (96,388 | ) | $ | (46,573 | ) | 107.0 | % | |||||
This increase in operating loss was a result of increased restructuring and other charges and the asset impairment charges recorded in the year ended December 31, 2002.
Other Expenses:
| For the years ended December 31, | Percentage Increase | ||||||||||||
| 2002 | 2001 | (Decrease) | |||||||||||
| (in thousands) | |||||||||||||
Interest income | $ | 601 | $ | 7,059 | (91.5 | %) | |||||||
Interest expense | (83,860 | ) | (73,552 | ) | 14.0 | % | |||||||
Amortization of debt issue costs | (4,480 | ) | (3,887 | ) | 15.3 | % | |||||||
Write-off of deferred financing fees and loss on extinguishment of debt | — | (5,069 | ) | (100.0 | %) | ||||||||
Other | (169 | ) | (76 | ) | 122.4 | % | |||||||
Total other expenses | $ | (87,908 | ) | $ | (75,525 | ) | 16.4 | % | |||||
Total other expenses increased primarily as a result of a reduction in interest income, increased interest expense, and increased non-cash amortization of original issue discount and debt issuance costs. The decrease in interest income was due to lower cash balances during 2002. The increase in interest expense was primarily due to higher principal amounts outstanding under the senior credit facility in 2002 as compared to 2001 and to a full quarter of interest expense on our $500.0 million 10¼% senior notes in the first quarter of 2002 compared to a partial quarter of interest expense on these senior notes in the first quarter of 2001. Although the aggregate principal amount of total debt increased from the prior year, the resulting increase in interest expense associated with the higher principal in 2002 was offset in part by the interest rate reduction we recognized in connection with our interest rate swap agreement. The increase in non-cash amortization was primarily due to higher accretion on the 12% senior discount notes.
Discontinued Operations:
| For the years ended December 31, | Percentage | ||||||||||
| 2002 | 2001 | Increase | |||||||||
| (in thousands) | |||||||||||
Loss from discontinued operations, net of income taxes | $ | (3,717 | ) | $ | (2,201 | ) | 68.9 | % | |||
The increase in loss is primarily attributable to interest expense allocated to discontinued operations in 2002. No interest expense was allocated to discontinued operations in 2001 as a result of the lower debt balances in 2001 as compared to 2002.
Cumulative Effect of Changes in Accounting Principle:
For the years ended December 31, | Percentage | ||||||||
| 2002 | 2001 | Increase | |||||||
| (in thousands) | |||||||||
Cumulative effect of change in accounting principle | $ | (60,674 | ) | — | 100.0 | % | |||
During the period ended June 30, 2002, we completed the transitional impairment test of goodwill required under SFAS 142, which was adopted effective January 1, 2002. As a result of completing the required transitional test, we recorded a charge retroactive to the adoption date for the cumulative effect of the accounting change in the amount of $60.7 million, representing the excess of the carrying value of certain assets as compared to their estimated fair value at January 1, 2002. Of the total $60.7 million cumulative effect adjustment, $58.5 million related to the site development construction reporting segment and $2.2 million related to the site leasing reporting segment.
Net Loss:
For the years ended December 31, | Percentage | ||||||||||
2002 | 2003 | Increase | |||||||||
| (in thousands) | |||||||||||
Net loss | $(248,996) | $ | (125,792 | ) | 97.9 | % | |||||
As a result of the factors discussed above, net loss significantly increased from 2001 to 2002.
2004.
LIQUIDITY AND CAPITAL RESOURCES
SBA Communications Corporation (“SBA Communications”) is a holding company with no business operations of its own. Our only significant asset is the outstanding capital stock of SBA Telecommunications, Inc. (“Telecommunications”) which is also a holding company that owns the outstanding capital stock of SBA Senior Finance. Finance, Inc. (“SBA Senior Finance ownsFinance”), which, directly or indirectly, owns the capital stockequity interest in substantially all of our subsidiaries. We conduct all of our business operations through our subsidiaries.SBA Senior Finance subsidiaries, primarily through the borrowers under the mortgage loan underlying the Initial CMBS Certificates and Additional CMBS Certificates (collectively, the “CMBS Certificates”), and SBA Senior Finance II LLC, the borrower under the revolving credit facility.
Accordingly, our only source of cash to pay our obligations, other than financings, is distributions with respect to our ownership interest in our subsidiaries from the net earnings and cash flow generated by these subsidiaries. Even if we decided to pay a dividend on or make a distribution of the capital stock of our subsidiaries, we cannot assure you that our subsidiaries will generate sufficient cash flow to pay a dividend. The ability of our subsidiaries to pay cash or stock dividends is restricted under the terms of our current senior credit facility.
CMBS Certificates and our other debt instruments.
A summary of our cash flows is as follows:
For the year ended December 31, 2003 | ||||
| (in thousands) | ||||
Summary Cash Flow Information: | ||||
Cash used in operations | $ | (29,808 | ) | |
Cash provided by investing activities | 155,456 | |||
Cash used in financing activities | (178,451 | ) | ||
Decrease in cash and cash equivalents | (52,803 | ) | ||
Cash and cash equivalents, December 31, 2002 | 61,141 | |||
Cash and cash equivalents, December 31, 2003 | $ | 8,338 | ||
For the year ended December 31, 2006 | ||||
| (in thousands) | ||||
Summary cash flow information: | ||||
Cash provided by operating activities | $ | 75,960 | ||
Cash used in investing activities | (739,876 | ) | ||
Cash provided by financing activities | 664,130 | |||
Increase in cash and cash equivalents | 214 | |||
Cash and cash equivalents, December 31, 2005 | 45,934 | |||
Cash and cash equivalents, December 31, 2006 | $ | 46,148 | ||
Sources of Liquidity:Liquidity
We have traditionally funded our growth, including our tower portfolio growth, through borrowings under our revolving credit facility, long-term indebtedness and equity issuances. In addition, we have recently begun to fund our growth with cash flows from operations.
During 2003,the past few years, we sold 784 sites, representing substantially allhave pursued a strategy of refinancing our towershigher cost long-term debt with lower cost debt and equity in the western two-thirdsorder to lower our total indebtedness, our interest expense and our weighted average cost of the United States, in exchange for gross cash proceeds of approximately $196.7 million.debt. As a result of this transaction,these initiatives, we produced cash from investing activities. The purchase and sale agreement contained a numberredeemed and/or repurchased an aggregate of provisions providing for adjustments to the purchase price. We anticipate that the final gross cash proceeds to be realized from the Western tower sale, after all potential purchase price adjustments, will be approximately $194.1 million.
In December 2003, SBA Communications and Telecommunications co-issued $402.0 million of its 9¾% senior discount notes, which produced net proceeds of approximately $267.1 million after deducting offering expenses. Proceeds from the senior discount notes were used to tender for approximately $153.3$249.3 million of our 12% high-yield notes during 2005 and the remaining $386.2 million in 2006. In addition, we reduced our weighted average cost of debt from 7.35% at December 31, 2005 to 5.96% at December 31, 2006.
In connection with the AAT Acquisition, we repurchased all of our outstanding 9 3/4%senior discount notes and 8 1/2% senior notes. We funded these repurchases, including the associated premiums and fees, and the cash consideration paid in the AAT Acquisition, with a portion of $1.1 billion bridge loan entered into by Senior Finance.
On November 6, 2006, SBA CMBS-1 Depositor LLC, an indirect subsidiary of ours, sold in a private transaction $1.15 billion of Commercial Mortgage Pass-Through Certificates, Series 2006-1 issued by SBA CMBS Trust. The Additional CMBS Certificates have a weighted average fixed coupon interest rate of 6.0%, and a weighted average interest rate to us of 6.3% after giving effect to the settlement of the hedging arrangements we entered into in anticipation of the financing. The Additional CMBS Certificates have an expected life of five years with a final repayment date in 2036. We used a substantial portion of the net proceeds received from this offering to repay our $1.1 billion bridge facility, to fund required reserves, and pay fees and expenses associated with the Additional CMBS Transaction. The remainder of the net proceeds were used for general working capital purposes.capital. Upon the closing of the Additional CMBS Transaction, we had total indebtedness outstanding of $1.6 billion, consisting entirely of a mortgage loan held by the Trust bearing a weighted average coupon fixed interest rate of 5.9%.
During January 2004, SBA Senior Finance closed onOn December 22, 2005, we entered into a newcredit agreement for a senior secured revolving credit facility in the amount of $400.0$160.0 million. This facility consists of a $275.0$160.0 million termrevolving loan, which was fundedmay be borrowed, repaid and redrawn, subject to compliance with certain covenants. This facility will mature on December 21, 2007. Amounts borrowed under the facility will accrue interest at closing,LIBOR plus a $50.0 million delayed draw term loan andmargin that ranges from 75 basis points to 200 basis points or at a $75.0 million revolving linebase rate plus a margin that ranges from 12.5 basis points to 100 basis points. Amounts borrowed under this facility will be secured by a first lien on substantially all of credit. SBA Senior Finance usedII’s assets and are guaranteed by certain of our other subsidiaries. No amounts were outstanding under this facility at December 31, 2006. As of December 31, 2006, we were in full compliance with the proceedsterms of the credit facility and based on our current leverage, we had the ability to draw an additional $29.0 million.
Cash provided by operating activities was $76.0 million for the year ended December 31, 2006. This amount was primarily the result of operating income from the fundingsite leasing segment exclusive of the $275.0 million term loan under the new senior credit facility to, in part, repay the old credit facility in full, consisting of $144.2 million outstanding. In addition to the amounts outstanding, we were required to pay $8.0 million to the lenders under the old facility to facilitate the assignment of the old facility to the new lenders. SBA Senior Finance has recorded additional deferred financing fees of approximately $5.4 million associated with this new facility. See Note 14 of Notes to Consolidated Financial Statements for further details relating to the financial impact of this refinancing.
depreciation, accretion, and amortization.
In addition to our capital restructuring activities completed in 2003 and the first quarter of 2004, in order to manage our significant levels of indebtednessleverage position and to ensure continued compliance with our financial covenants, we may exploredecide to pursue a numbervariety of alternatives, includingactions. These actions may include incurring additional indebtedness to stay at target leverage levels, selling certain assets or lines of business, issuing equity, repurchasing, restructuring or refinancing or exchanging for equity some or all of our debt or pursuing other financial alternatives, and we may from time to time implement one or more of these alternatives. One or more of the alternatives may include the possibility of issuing additional shares of common stock or securities convertible into shares of common stock, or converting our existing indebtedness into shares of common stock pursuing other financial alternatives, including securitization transactions. If implemented these actions could increase one interest expense and/or securities convertible into shares of common stock, any of which would dilute our existing shareholders. We cannot assure you that we will implement any of these strategies canor that if implemented, these strategies could be consummated, or if consummated, would effectively address the risks associatedimplemented on terms favorable to our company and its shareholders.
Registration Statements
In connection with our significant levelacquisitions, we have on file with the Securities and Exchange Commission shelf registration statements on Form S-4 registering shares of indebtedness.Class A common stock that we may issue in connection with the acquisition of wireless communication towers or companies that provide related services. During 2006, the Company filed a shelf registration statement on Form S-4 with the Securities and Exchange Commission registering an aggregate 4.0 million shares of its Class A common stock. During 2006, we issued approximately 1.8 million shares of Class A common stock under these registration statements in connection with the acquisition of 131 towers and related assets. As of December 31, 2006, we had approximately 4.5 million shares of Class A common stock remaining under these shelf registration statements.
On April 14, 2006, we filed with the Commission an automatic shelf registration statement for well-known seasoned issuers on Form S-3ASR. This registration statement enables us to issue shares of our Class A common stock, shares of preferred stock, which may be represented by depositary shares, unsecured senior, senior subordinated or subordinated debt securities; and warrants to purchase any of these securities in any amounts approved by our board of directors, subject to the requirements of the Nasdaq Stock Market and the securities and other laws applicable to us. Under the rules governing the automatic shelf registration statements, we
will file a prospectus supplement and advise the Commission of the amount and type of securities each time we issue securities under this registration statement.
Uses of Liquidity:Liquidity
We usedOur principal use of liquidity is cash capital expenditures associated with the proceeds from the May 2003 credit facility discussed in this report, cash on hand and a portiongrowth of the proceeds from the Westernour tower sale to repay in full the prior credit facility, which had $255.0 million outstanding immediately prior to repayment. As discussed above, subsequent to December 31, 2003 we used a portion of the proceeds from the January 2004 credit facility to repay the May 2003 credit facility, to repurchase 12% senior discount notes and 10¼% senior notes in the open market and to redeem all outstanding 12% senior discount notes on March 1, 2004. As a result primarily of the repayment of $255 million under a prior credit facility, we used $178.5 million of cash in financing activities.
portfolio. Our cash capital expenditures, including cash used for acquisitions, for the year ended December 31, 20032006 were $15.1$754.5 million, as comparedcomprised of $644.4 million of cash capital expenditures associated with the AAT Acquisition and $110.1 million of other cash capital expenditures. The $110.1 million included $16.3 million related to $86.4new tower construction, $4.1 million for maintenance tower capital expenditures, $5.7 million for augmentations and tower upgrades, $2.9 million for general corporate expenditures, and $5.8 million for ground lease purchases. This amount also includes cash capital expenditures of $75.3 million that we incurred in connection with the acquisition of 339 completed towers, two towers in process, related prorated rental receipts and payments, and earnouts for the year ended December 31, 2002. This decrease is a result2006. The $16.3 million of lower investment in new tower assets. During 2003, we built 13construction included costs associated with the completion of 60 new towers as compared to 2002 when we built 141 new towersduring 2006 and bought 53 existing towers. costs incurred on sites currently in process.
We currently planexpect to make totalincur cash capital expenditures associated with tower maintenance and general corporate expenditures of $8.0 million to $10.0 million during 2007. Based upon our current plans, we expect our discretionary cash capital expenditures during 2004 of $5.02007 to be at least $75.0 million to $8.0$80.0 million. DuePrimarily, these cash capital expenditures would relate to the relatively young age80 to 100 new towers we intend to build in 2007, ground lease purchases and current acquisitions plans, including, as of February 22, 2007, the 16 towers acquired since December 31, 2006 and the 148 towers that are subject to pending acquisition agreements. However, we are continually and actively looking for additional acquisition opportunities, which if consummated, would result in additional capital expenditures. We expect to fund our discretionary cash capital expenditures from cash on hand, cash flow from operations, availability under our senior credit facility, and/or through the issuances of our towers and remaining capacity available to accommodate new tenants, it is not necessary for us to spend a significant amount of dollars for capital improvements or modifications to our towers to accommodate new tenants. Class A common stock in connection with tower acquisitions.
We estimate we will incur approximately $1,000 per tower per year on these type offor capital expenditures.improvements or modifications to our towers. All of these planned capital expenditures are expected to be funded by cash on hand and cash flow from operations. The exact amount of our future capital expenditures will depend on a number of factors including amounts necessary to support our tower portfolio, our new tower build and to complete pending build-to-suit obligations.
Cash used in operations was $29.8 million for the year ended December 31, 2003. Of this amount $15.2 million was related to an increase in short-term investmentstower acquisition program and approximately $6.0 million was related to the reduction in accounts payable. During 2003, we focused our efforts on improving our outstanding receivables balances. As a result of these efforts, our accounts receivable balance, after allowances and write-offs, was improved by approximately $17.0 million. Additionally, during 2003 approximately $84.8 million of cash was paid for interest on our various debt instruments. As a result of our refinancing activities discussed above, our cash interest requirements for 2004 are expected to be significantly lower than the requirements in 2003.
ground lease purchase program.
Debt Service Requirements:Requirements
At December 31, 20032006, we had $406.4 million$1.15 billion outstanding of our 10¼% senior notes. As of theAdditional CMBS Certificates. The Additional CMBS Certificates have an anticipated repayment date of this filing we had $355.4 million outstanding of our 10¼% senior notes. The 10¼% senior notes mature February 1, 2009.November 15, 2011. Interest on these notesthe Additional CMBS Certificates is payable February 1 and August 1monthly at a blended annual rate of each year.6.0%. Based on the amounts outstanding at the time of this filing,December 31, 2006, annual debt service requirements are approximately $36.4on the Additional CMBS Certificates is $68.9 million.
At December 31, 20032006, we had $275.8$405.0 million outstanding of our 9¾% senior discount notes.Initial CMBS Certificates. The 9¾% notes accrete in value until DecemberInitial CMBS Certificates have an anticipated repayment date of November 15, 2007 at which time the notes will have a balance of $402.0 million. These notes mature December 15, 2011.2010. Interest on these notesthe Initial CMBS Certificates is payable June 15 andmonthly at a blended annual rate of 5.6%. Based on the amounts outstanding at December 15 beginning June 15, 2008.
31, 2006, annual debt service on the Initial CMBS Certificates is $22.7 million.
At December 31, 20032006, we had $65.7 million outstanding of our 12% senior discount notes. The 12% senior discount notes were originally scheduled to mature on March 1, 2008. These notes were redeemed on March 1, 2004 at the call price of 107.5% of the aggregate principal amount.
As of December 31, 2003 we had $118.2 millionno amounts outstanding under the senior credit facility in existence at that time. As of March 10, 2003, we had $275.0 million outstanding under the newour senior credit facility. Based on no amounts outstanding and the outstanding amount of $275.0 million and ratesunused commitment fees in effect, at such time, we estimate our annual debt service including amortization to be approximately $13.9$0.6 million related toannually on our senior credit facility.
Capital Instruments
CMBS Certificates
On November 18, 2005, the Depositor sold, in a private transaction $405.0 million of Initial CMBS Certificates, Series 2005-1 issued by the Trust. The Initial CMBS Certificates consist of five classes, all of which are rated investment grade, as indicated in the table below:
Subclass | Initial Subclass Principal Balance | Pass through Interest Rate | ||||
| (in thousands) | ||||||
2005-1A | $ | 238,580 | 5.369 | % | ||
2005-1B | 48,320 | 5.565 | % | |||
2005-1C | 48,320 | 5.731 | % | |||
2005-1D | 48,320 | 6.219 | % | |||
2005-1E | 21,460 | 6.706 | % | |||
| $ | 405,000 | 5.608 | % | |||
The issuanceweighted average monthly fixed coupon interest rate of our 9¾% senior discount notesthe Initial CMBS Certificates is 5.6%, and the new senior credit facility coupled with the retirementeffective weighted average fixed interest rate is 4.8% after giving effect to a settlement of two interest rate swap agreements entered in contemplation of the 12% senior discount notes, open market purchases and exchangestransaction. The Initial CMBS Certificates have an expected life of our 10¼% senior notes andfive years with a final repayment date in 2035. The proceeds of the repayment of ourInitial CMBS Certificates were primarily used to purchase the prior senior credit facility will resultof SBA Senior Finance and to fund reserves and pay expenses associated with the offering.
On November 6, 2006, the Depositor sold, in a private transaction, $1.15 billion of Additional CMBS Certificates. The Additional CMBS Certificates consist of nine classes. The principal balance and pass through interest rate for each class is indicated in the table below:
Subclass | Initial Subclass Principal Balance | Pass through Interest Rate | ||||
| (in thousands) | ||||||
2006-1A | $ | 439,420 | 5.314 | % | ||
2006-1B | 106,680 | 5.451 | % | |||
2006-1C | 106,680 | 5.559 | % | |||
2006-1D | 106,680 | 5.852 | % | |||
2006-1E | 36,540 | 6.174 | % | |||
2006-1F | 81,000 | 6.709 | % | |||
2006-1G | 121,000 | 6.904 | % | |||
2006-1H | 81,000 | 7.389 | % | |||
2006-1J | 71,000 | 7.825 | % | |||
Total | $ | 1,150,000 | 5.993 | % | ||
The weighted average monthly fixed coupon interest rate of the Additional CMBS Certificates is 6.0%, and the effective weighted average fixed interest rate is 6.3% after giving effect to the settlement of the nine interest rate swap agreements entered in contemplation of the transaction. The Additional CMBS Certificates have an expected life of five years with a final repayment date in 2036. The proceeds of the Additional CMBS Certificates were primarily used to repay the bridge loan and fund required reserves and expenses associated with the Additional CMBS Transaction.
The assets of the Trust, which issued both the Initial CMBS Certificates and the Additional CMBS Certificates, consist of a non-recourse mortgage loan initially made in favor of SBA Properties, Inc. (the “Initial Borrower”). In connection with the issuance of the Additional CMBS Certificates, each of SBA Sites, Inc., SBA Structures, Inc., SBA Towers, Inc., SBA Puerto Rico, Inc. and SBA Towers USVI, Inc. (the “Additional Borrowers” and collectively with the Initial Borrower, the “Borrowers”) were added as additional borrowers under the mortgage loan and the principal amount of the mortgage loan was increased by $1.15 billion to an aggregate of $1.555 billion. The Borrowers are jointly and severally liable under the mortgage loan. The mortgage loan is to be paid from the operating cash savingsflows from the aggregate 4,975 towers owned by the Borrowers. Subject to certain limited exceptions described below, no payments of approximately $50.0 millionprincipal will be required to be made prior to the monthly payment date in November 2010, which is the anticipated repayment date for the components of the mortgage loan corresponding to the Initial CMBS Certificates, and no payments of principal will be required to be made on the components of the mortgage loan corresponding to the Additional CMBS Certificates prior to the monthly payment date in November 2011, which is the anticipated repayment date for the components of the mortgage loan corresponding to the Additional CMBS Certificates. However, if the debt service coverage ratio, defined as the Net
Cash Flow (as defined in the mortgage loan agreement) divided by the amount of interest on the mortgage loan, servicing fees and amortizationtrustee fees that the Borrowers will be required to pay over the succeeding twelve months, as of the end of any calendar quarter, falls to 1.30 times or lower, then all cash flow in excess of amounts required to make debt service payments, to fund required reserves, to pay management fees and budgeted operating expenses and to make other payments required under the loan documents, referred to as excess cash flow, will be deposited into a reserve account instead of being released to the Borrowers. The funds in 2004.the reserve account will not be released to the Borrowers unless the debt service coverage ratio exceeds 1.30 times for two consecutive calendar quarters. If the debt service coverage ratio falls below 1.15 times as of the end of any calendar quarter, then an “amortization period” will commence and all funds on deposit in the reserve account will be applied to prepay the Mortgage Loan. Otherwise, on a monthly basis, the excess cash flow of the Borrowers held by the Trustee is distributed to the Borrowers.
The Borrowers may not prepay the mortgage loan in whole or in part at any time prior to November 2010 for the components of the mortgage loan corresponding to the Initial CMBS Certificates and November 2011 for the components of the mortgage loan corresponding to the Additional CMBS Certificates, except in limited circumstances (such as the occurrence of certain casualty and condemnation events relating to the Borrowers’ tower sites). Thereafter, prepayment is permitted provided it is accompanied by any applicable prepayment consideration. If the prepayment occurs within nine months of the final maturity date, no prepayment consideration is due. The entire unpaid principal balance of the mortgage loan components corresponding to the Initial CMBS Certificates will be due in November 2035 and those corresponding to the Additional CMBS Certificates will be due in November 2036. However, to the extent that the full amount of the mortgage loan component corresponding to the Initial CMBS Certificates or the amount of the mortgage loan component corresponding to the Additional CMBS Certificates are not fully repaid by their respective anticipated repayment dates, the interest rate payable on any such mortgage loan outstanding will significantly increase in accordance with the formula set forth in the mortgage loan. The mortgage loan may be defeased in whole at any time.
Capital Instruments:
Senior NotesThe mortgage loan is secured by (1) mortgages, deeds of trust and Senior Discount Notes:
The10¼% senior notes were issueddeeds to secure debt on substantially all of the Borrowers’ tower sites and their operating cash flows, (2) a security interest in substantially all of the Borrowers’ personal property and fixtures and (3) the Borrowers’ rights under the management agreement entered into with SBA Network Management, Inc. (“SBA Network Management”) relating to the management of the Borrowers’ tower sites by SBA Communications, are unsecuredNetwork Management pursuant to which SBA Network Management arranges for the payment of all operating expenses and arepari passuthe funding of all capital expenditures out of amounts on deposit in rightone or more operating accounts maintained on the Borrowers’ behalf. For each calendar month, SBA Network Management is entitled to receive a management fee equal to 7.5% of payment with our other existing and future senior indebtedness. The 9¾% senior discount notes were co-issued by SBA Communications and Telecommunicationsthe Borrowers’ operating revenues for the immediately preceding calendar month. This management fee was reduced from 10% in December 2003, are unsecured, rankpari passuconnection with the senior indebtedness and are structurally senior to all indebtedness of SBA Communications. Both, the 10¼% senior notes and the 9¾% senior discount notes place certain restrictions on, among other things, the incurrence of debt and liens, issuance of preferred stock, payment of dividends or other distributions, sale of assets, transactions with affiliates, sale and leaseback transactions, certain investments and our ability to merge or consolidate with other entities.
the Additional CMBS Certificates.
May 2003 SeniorRevolving Credit Facility:Facility
On May 9, 2003, Telecommunications closed onDecember 22, 2005, SBA Senior Finance II, our wholly-owned subsidiary, entered into a senior secured revolving credit facility with the senior credit lenders in the amount of $195.0 million. In November, 2003, in connection with the offering of our 9¾% senior discount notes and our tender offer for 70% of our outstanding 12% senior discount notes, SBA Senior Finance, a newly formed wholly-owned subsidiary of Telecommunications, assumed all rights and obligations of Telecommunications under the senior credit facility pursuant to an amended and restated credit agreement with the senior credit lenders. Telecommunications was released from any obligation to repay the indebtedness under the senior credit facility. Simultaneously with this assumption, Telecommunications contributed substantially all of its assets, consisting primarily of stock in our various operating subsidiaries, to SBA Senior Finance. SBA Senior Finance refinanced this credit facility in January 2004 and used the proceeds from the new facility to repay this facility in full.
This prior senior credit facility, as amended, provided for $95.0$160.0 million, in term loans and $100.0 million in revolving lines of credit, which couldmay be borrowed, repaid and redrawn, and which would have convertedsubject to a term loan January 28, 2004. Amortization of amounts borrowed under this facility was to commence in 2004, at an annual rate of 10% in 2004 and 15% in each of 2005, 2006 and 2007. All remaining amounts were to be due and payable at maturity on December 31, 2007.compliance with certain covenants. Amounts borrowed under thisthe facility accruedaccrue interest at base rate, as defined in the agreementLIBOR plus 300a margin that ranges from 75 basis points to 200 basis points or the Euro dollarat a base rate plus 400a margin that ranges from 12.5 basis points to 100 basis points. Additional interest of 3.5% per annum also accrued, but was not due to be paid until maturity. As of December 31, 2003, $3.2 million of this additional interest was converted to a term loan. As a result, at December 31, 2003, we had $98.2 millionAll outstanding amounts under the term loan of the senior credit facility at variable cash rates of 5.16% to 5.17% (excluding the 3.5% of additional interest) and we had $20.0 million outstandingare due December 21, 2007. The borrower under the revolving credit facility, at a rate of 5.15%. As of December 31, 2003 the remaining $80.0 million under the revolver was fully available to us. The credit facility was pre-payable at our option. AmountsSBA Senior Finance II, has agreed that amounts borrowed under the revolving credit facility werewill be secured by a first lien on substantially all of SBA Senior Finance’sits assets. In addition, each of SBA Senior Finance’s domestic subsidiaries guaranteed the obligations of SBA Senior Finance under the senior credit facility and pledged substantially all of its assets to secure such guarantee. In addition, SBA Communications and Telecommunications pledged, on a non-recourse basis, all of the common stock of Telecommunications and SBA Senior Finance, respectively, to secure SBA Senior Finance’s obligations under this senior credit facility.
This prior senior credit facility, as amended, required SBA Senior Finance to maintain specified financial ratios, including ratios regarding its leverage, debt service, cash interest expense and fixed charges
for each quarter. The senior credit facility contained affirmative and negative covenants that, among other things, restricted SBA Senior Finance’s and its subsidiaries’ ability to incur debt and liens, sell assets, make or commit to make capital expenditures, enter into affiliate transactions or sale-leaseback transactions, and/or build towers without anchor tenants. Additionally, as of December 31, 2003, we were in full compliance with all of the financial covenants of this facility.
January 2004 Senior Credit Facility:
On January 29, 2004, SBA Senior Finance closed on a new senior credit facility in the amount of $400.0 million. This facility consists of a $275.0 million term loan which was funded at closing, a $50.0 million delayed draw term loan which we have until November 15, 2004 to draw, and a $75.0 million revolving line of credit. The revolving lines of credit may be borrowed, repaid and redrawn. Amortization of the term loans commence September 2004 at an annual rate of 1% in each of 2004, 2005, 2006 and 2007. All remaining amounts under the term loan are due October 31, 2008. There is no amortization of the revolving loans and all amounts outstanding under the revolving facility are due on August 31, 2008. Amounts borrowed under this facility accrue interest at either the base rate, as defined in the agreement, plus 250 basis points or a Euro dollar rate plus 350 basis points. This facility may be prepaid at any time with no prepayment penalty. Amounts borrowed under this facility are secured by a first lien on substantially all of SBA Senior Finance’s assets. In addition, each of SBA Senior Finances’s domesticII’s subsidiaries has guaranteed the obligations of SBA Senior Finance II under the senior credit facility and has pledged substantially all of their respective assets to secure such guarantee. In addition, SBA Communications and Telecommunications have pledged, on a non-recourse basis, all of the common stock of Telecommunications and SBA Senior Finance to secure SBA Senior Finance’s obligations under this senior credit facility.
This new senior credit facility requires SBA Senior Finance to maintain specified financial ratios, including ratios regarding its debt to annualized operating cash flow, debt service, cash interest expense and fixed charges for each quarter. This new senior credit facility contains affirmative and negative covenants that, among other things, restricts its ability to incur debt and liens, sell assets, commit to capital expenditures, enter into affiliate transactions or sale-leaseback transactions, and/or build towers without anchor tenants. Additionally, this facility permits distributions by SBA Senior Finance to Telecommunications and SBA Communications to service their debt, pay consolidated taxes, pay holding company expenses and for the repurchase of senior notes or senior discount notes subject to compliance with the covenants discussed above. SBA Senior Finance’s ability in the future to comply with the covenants and access the available funds under the senior credit facility in the future will depend on its future financial performance. Had this facility been in place on December 31, 2003, we would have had the ability to draw an additional approximately $21 million over the $275 million drawn at closing.
Inflation
The impact of inflation on our operations has not been significant to date. However, we cannot assure you that a highchange in the rate of inflation in the future will not adversely affect our operating results.
Recent Accounting Pronouncements
Accounting Pronouncements Adopted in 2003Stock-based Compensation
Effective January 1, 2006, we adopted the provisions of Statement of Financial Accounting Standards No. 123R, “Share-Based Payments,” (“SFAS 123R”) which requires the measurement and recognition of compensation expense for all share-based payment awards to employees and directors based on estimated fair values. SFAS 123R supersedes the Company’s previous accounting methodology using the intrinsic value method under Accounting Principles Board Opinion No. 25 (“APB 25”), “Accounting for Stock Issued to Employees.”
We adopted SFAS 123R using the modified prospective transition method. Under this transition method, compensation expense recognized during the year ended December 31, 2006 included: (a) compensation expense for all share-based awards granted prior to, but not yet vested, as of December 31, 2005, based on the grant date fair value estimated in accordance with the original provisions of SFAS 123, and (b) compensation expense for all share-based awards granted subsequent to December 31, 2005, based on the grant date fair value estimated in accordance with the provisions of SFAS 123R. In accordance with the modified prospective transition method, our Consolidated Financial Statements for prior periods have not been restated to reflect the impact of SFAS 123R.
On November 10, 2005 the Financial Accounting Standards Board (“FASB”) issued FASB Staff Position No. FAS 123R-3, “Transition Election Related to Accounting for Tax Effects of Share-Based Payment Awards.” We have elected to adopt the alternative transition method provided in the FASB Staff Position for calculating the tax effects of share-based compensation pursuant to SFAS 123R. The alternative transition method includes simplified methods to establish the beginning balance of the additional paid-in capital pool (“APIC Pool”) related to the tax effects of employee share-based compensation, and to determine the subsequent impact on the APIC Pool and our Consolidated Statements of Cash Flows of the tax effects of employee and director share-based awards that are outstanding upon adoption of SFAS 123R.
Other Pronouncements
In October 2001,September 2006, the FASBSEC issued SFAS No. 143,Staff Accounting for Asset Retirement ObligationsBulletin (“SAB”) 108, “Considering the Effects of Prior Year Misstatements when Quantifying Misstatements in Current Year Financial Statements” (“SFAS 143”SAB 108”). This standard requires companiesSAB 108 was issued to recordprovide interpretive guidance on how the fair value of a liability for an asset retirement obligation in the period in which it is incurred. When the liability is initially recorded, a company capitalizes a cost by increasing the carrying amounteffects of the related long-lived asset. Over time,carryover or reversal of prior year misstatements should be considered in quantifying a current year misstatement. SAB 108 requires the liabilityuse of both the “iron curtain” and “rollover” approaches in quantifying the materiality of misstatements. SAB 108 is accretedeffective for annual financial statements covering the first fiscal year ending after November 15, 2006. Early adoption of SAB 108 is permitted. We elected to its present value each period, andadopt SAB 108 effective September 30, 2006. Upon initial application of SAB 108, we evaluated the capitalized cost is depreciated overuncorrected financial statement misstatements that were previously considered immaterial under the useful life of“rollover” method using the related asset. Upon settlement of the liability, a company either settles the obligation for its recorded amount or incurs a gain or loss upon settlement. We adopted this standard effective January 1, 2003.dual methodology required by SAB 108. As a result of this dual methodology approach of SAB 108, we corrected the cumulative error in our obligationaccounting for equity-based compensation for periods prior to restore leaseholdsJanuary 1, 2006 in accordance with the transitional guidance in SAB 108.
Pursuant to their original condition upon termination of ground leases
underlyingSAB 108, we corrected the aforementioned cumulative error in its accounting for equity-based compensation by recording a majority of our towers and our estimate as to the probability of incurring these obligations, we recorded anon-cash cumulative effect adjustment of approximately $0.5$8.4 million duringto additional paid-in capital with an off-setting amount of $7.7 million to accumulated deficit within shareholders’ equity as well as adjustments to property and equipment in the first quarteramount of 2003.$0.4 million and intangible assets of $0.3 million in our consolidated balance sheet as of December 31, 2006. The capitalized amounts relate to acquisition related costs. For additional discussion regarding the adoption of SFAS 143 resultedSAB 108 and its implications, please see “Current Accounting Pronouncements” in an increase in tower fixed assets of approximately $0.9 million and the recording of an asset retirement obligation liability of approximately $1.4 million.
In April 2002, the FASB issued SFAS No. 145,Rescission of FASB Statements Nos. 4, 44 and 62, Amendment of SFAS No. 13 and Technical Corrections (“SFAS 145”). SFAS 145 requires gains and losses on extinguishments of debtnote 3 to be classified as income or loss from continuing operations rather than as extraordinary items as previously required under SFAS 4. Extraordinary treatment is required for certain extinguishments as provided in APB Opinion No. 30. The statement also amended SFAS 13 for certain sale-leaseback and sublease accounting. We adopted the provisions of SFAS 145 effective January 1, 2003. Pursuant to SFAS 145, our previously reported extraordinary item of $5.1 million, related to the early extinguishment of debt, was reclassified to operating expense in the accompanying December 31, 2001 Consolidated Statement of Operations.
In July 2002, the FASB issued SFAS No. 146,Accounting for Costs Associated with Exit or Disposal Activities (“SFAS 146”) and nullified EITF Issue No. 94-3. SFAS 146 requires that a liability for a cost associated with an exit or disposal activity be recognized when the liability is incurred, whereas EITF No. 94-3 had recognized the liability at the commitment date to an exit plan. SFAS 146 requires that the initial measurement of a liability be at fair value. We adopted the provisions of SFAS 146 effective January 1, 2003. The adoption of SFAS 146 did not have a material effect on our consolidated financial statements.
In September 2006, the Financial Accounting Standards Board (“FASB”) issued Statement of Financial Accounting Standard (“SFAS”) No. 157, “Fair Value Measurements,” (“SFAS No. 157”) which defines fair
In December 2002, the FASB issued SFAS 148. SFAS 148 provides alternative methods of transition
value, establishes guidelines for a voluntary change to themeasuring fair value based method of accounting for stock-based employee compensation. This statement also amends the disclosure requirements ofand expands disclosures regarding fair value measurements. SFAS 123 to require disclosures in both annual and interim financial statements regarding the method of accounting for stock-based employee compensation and the effect of the method used on reported results. The standardNo. 157 is effective for fiscal years beginning after November 15, 2007. We are currently evaluating what impact, if any, the adoption of SFAS No. 157 will have on our consolidated financial condition, results of operations or cash flows.
In September 2006, the FASB issued SFAS No. 158, “Employer’s Accounting for Defined Benefit Pension and Other Postretirement Plans (an amendment of FASB Statements No. 87, 88, 106, and 132(R)” (“SFAS No. 158”). Among other items, SFAS No. 158 requires recognition of the overfunded or underfunded status of an entity’s defined benefit postretirement plan as an asset or liability in the financial statements, requires the measurement of defined benefit postretirement plan assets and obligations as of the end of the employer’s fiscal year, and requires recognition of the funded status of defined benefit postretirement plans in other comprehensive income. SFAS No. 158 is effective for fiscal years ending after December 15, 2002.2006. We adopted SFAS 158 on December 31, 2006. We currently measure the funded status of our plan as of the date of our year-end statement of financial position.
In July 2006, the FASB issued FASB Interpretation Number 48, Accounting for Uncertainty in Income Taxes, an Interpretation of FASB Statement No. 109, (“FIN No. 48”). FIN No. 48 prescribes a recognition threshold and measurement attribute for the financial statement recognition and measurement of a tax position taken in a tax return. We must determine whether it is “more-likely-than-not” that a tax position will be sustained upon examination, including resolution of any related appeals or litigation processes, based on the technical merits of the position. Once it is determined that a position meets the more-likely-than-not recognition threshold, the position is measured to determine the amount of benefit to recognize in the financial statements. FIN No. 48 applies to all tax positions related to income taxes subject to FASB Statement No. 109, Accounting for Income Taxes. The interpretation clearly scopes out income tax positions related to FASB Statement No. 5, Accounting for Contingencies. This statement is effective beginning for fiscal years beginning after December 15, 2006. The cumulative effect of applying the provisions of FIN No. 48 will be reported as an adjustment to the opening balance of retained earnings on January 1, 2007. We adopted the disclosure-only provisions of SFAS 148 asthis statement beginning in the first quarter of December 31, 2002. We will continue to account for stock-based compensation in accordance with APB 25. As such, we do2007. The adoption of FIN No. 48 did not expect this standard will have a material impact on our consolidated financial position or results of operations.
In April 2003, the FASB issued Statement of Financial Accounting Standards No. 149 (“SFAS 149”),Amendment of Statement 133 on Derivative Instruments and Hedging Activities. This Statement amends and clarifies financial accounting and reporting for derivative instruments, including certain derivative instruments embedded in other contracts (collectively referred to as derivatives) and for hedging activities under Statement of Financial Accounting Standards No. 133 (“SFAS 133”),Accounting for Derivative Instruments and Hedging Activities.The statement was effective for contracts entered into or modified after June 30, 2003. The adoption of this standard did not have a material impact on our financial positioncondition or results of operations.
In May 2003,February 2006, the FASB issued Statement of Financial Accounting StandardsSFAS No. 150 (“SFAS 150”),Accounting155, “Accounting for Certain Hybrid Financial Instruments with CharacteristicsInstruments—an Amendment of Both LiabilitiesFASB Statements No. 133 and Equity140” (“SFAS No. 155”). This Statement establishes standards for how an issuer classifies and measures certainSFAS No. 155 allows financial instruments with characteristics of both liabilitiesthat contain an embedded derivative and equity. It requires that an issuer classify a financial instrument that is within its scopeotherwise would require bifurcation to be accounted for as a liability (or an asset in some circumstances). This standard was effectivewhole on a fair value basis, at the beginningholders’ election. SFAS No. 155 also clarifies and amends certain other provisions of the first interim periodSFAS No. 133 and SFAS No. 140. This statement is effective for all financial instruments acquired or issued in fiscal years beginning after JuneSeptember 15, 2003, except for mandatorily redeemable financial instruments of nonpublic entities that are subject to the provisions of this Statement for the first fiscal period beginning after December 15, 2003.2006. The adoption of this standard didSFAS No. 155 is not have a material impact on our financial position or results of operations.
In November 2002, the FASB issued FASB Interpretation No. 45 (“FIN 45”),Guarantor’s Accounting and Disclosure Requirements for Guarantees, Including Indirect Guarantees of Indebtedness of Others.
Fin 45 elaborates on the disclosures to be made by a guarantor in its interim and annual financial statements about its obligations under certain guarantees that it has issued. FIN 45 also clarifies requirements for the recognition of guarantees at the onset of an arrangement. The initial recognition and measurement provisions of FIN 45 are applicable on a prospective basis to guarantees used or modified after December 31, 2002. The disclosure requirements of FIN 45 are effective for interim or annual financial statements after December 15, 2002. We implemented the disclosure requirements of FIN 45 as of December 31, 2002 and there was no material impact on our consolidated financial statements as a result of this implementation.
In January 2003, the FASB issued Interpretation No. 46,Consolidation for Variable Interest Entities, an Interpretation of ARB No. 51 which requires all variable interest entities (“VIES”) to be consolidated by the primary beneficiary. The primary beneficiary is the entity that holds the majority of the beneficial interest in the VIE. In addition, the interpretation expands the disclosure requirements for both variable interest entities that are consolidated as well as VIEs from which the entity is the holder of a significant amount of beneficial interests, but not the majority. FIN 46 is effective immediately for all VIEs and for all special purpose entities created or acquired after January 31, 2003. For VIEs created or acquired prior to February 1, 2003, the provisions of FIN 46 must be applied for the first quarter ended March 31, 2004. The adoption of FIN 46 did not have, nor is it expected to have a material impact on the consolidatedour results of operations or financial statements.
position.
Commitments and Contractual Obligations
The following table summarizes our scheduled contractual commitments as of December 31, 2003:2006 (in thousands):
Contractual Obligations | Total | Less than 1 year | 1 – 3 Years | 4 – 5 Years | More than 5 Years | ||||||||||
Short-term and long-term debt | $ | 992,365 | $ | 11,500 | $ | 34,500 | $ | 137,900 | $ | 808,465 | |||||
Capital leases | 38 | 38 | — | — | — | ||||||||||
Operating leases | 124,980 | 26,195 | 33,758 | 18,407 | 46,620 | ||||||||||
Employment agreements | 1,378 | 948 | 430 | — | — | ||||||||||
Purchase obligations | 13,067 | 13,067 | — | — | — | ||||||||||
Asset retirement obligations | 1,195 | — | — | — | 1,195 | ||||||||||
Total | $ | 1,133,023 | $ | 51,748 | $ | 68,688 | $ | 156,307 | $ | 856,280 | |||||
Contractual Obligations Less than 1 Year More than 5 Years Long-term debt Interest payments (1) Operating leases Employment agreements Total 1-3 Years 4-5 Years $ 1,555,000 $ — $ — $ 1,555,000 $ — 425,593 92,729 184,293 148,571 — 1,010,261 44,395 88,746 85,662 791,458 3,467 1,314 2,153 — — $ 2,994,321 $ 138,438 $ 275,192 $ 1,789,233 $ 791,458
(1) | Represents interest payments on the CMBS Certificates based on a weighted average coupon fixed interest rate of 5.9% and unused line fees associated with the senior credit facility. |
Off-Balance Sheet Arrangements
We are not involved in any off-balance sheet arrangements.
| ITEM 7A. | QUANTITATIVE AND QUALITATIVE DISCLOSURES ABOUT MARKET RISK |
We are exposed to certain market risks that are inherent in our financial instruments. These instruments arise from transactions entered into in the normal course of business. We are subject to interest rate risk on our senior credit facility and any future financing requirements. We attempt to limit our exposure to interest rate risk by managing the mix of our long-term fixed rate senior notesdebt and our borrowings under our senior credit facility. As of December 31, 2003,2006, long-term fixed rate borrowings represented approximately 86%100% of our total borrowings. Assuming a 100 basis-point change in LIBOR, our annual interest cost would change by approximately $2.8 million, based on outstanding balances as of the date of this report.
The following table presents the future principal payment obligations and interest rates associated with our long-term debt instruments assuming our actual level of long-term debt indebtedness as of December 31, 2003:2006:
| 2004 | 2005 | 2006 | 2007 | 2008 | Thereafter | Fair Value | |||||||||||||||
| (in thousands) | |||||||||||||||||||||
Long-term debt: | |||||||||||||||||||||
Fixed rate (12.0%) | — | — | — | — | $ | 65,673 | — | $ | 71,584 | ||||||||||||
Fixed rate (10¼%) | — | — | — | — | — | $ | 406,441 | $ | 398,312 | ||||||||||||
Fixed rate (9¾%) | — | — | — | — | — | $ | 402,024 | $ | 279,929 | ||||||||||||
Term loan, $98.2 million, variable cash rates (8.66% to 8.67% at December 31, 2003) | $ | 9,500 | $ | 14,250 | $ | 14,250 | $ | 60,227 | — | — | $ | 98,227 | |||||||||
Revolving loans, variable cash rate (8.65% at December 31, 2003) | $ | 2,000 | $ | 3,000 | $ | 3,000 | $ | 12,000 | — | — | $ | 20,000 | |||||||||
Notes payable, variable rates (2.9% to 11.4% at December 31, 2003) | $ | 38 | — | — | — | $ | — | — | $ | 38 | |||||||||||
Fair Value Long-term debt: Fixed rate CMBS Certificates(1) 2007 2008 2009 2010 2011 Thereafter Total (in thousands) — — — $ 405,000 $ 1,150,000 $ — $ 1,555,000 $ 1,560,103
(1) | The anticipated repayment date for the CMBS Certificates is November 2010 for the $405,000 of Initial CMBS Certificates and November 2011 for the $1,150,000 Additional CMBS Certificates. |
Our current primary market risk exposure relates to (1) the impact of interest rate riskmovements on variable-rate long-term and short-term borrowings, (2) our ability to refinance our 9¾% senior discount notes and our 10¼% senior notes,the CMBS Certificates at their expected repayment dates or at maturity at market rates, and (3) the impact of interest rate movements on(2) our ability to meet financial covenants. We manage the interest rate risk on our outstanding long-term and short-term debt through our use of fixed and variable rate debt.debt and interest rate hedging arrangements. While we cannot predict or manage our ability to refinance existing debt or the impact interest rate movements will have on our existing debt, we continue to evaluate our financial position on an ongoing basis.
Senior Note and Senior Discount Note Disclosure Requirements
The indentures governing our 10¼% senior notes and our 9¾% senior discount notes require certain financial disclosures for restricted subsidiaries separate from unrestricted subsidiaries. As of December 31, 2003 we had no unrestricted subsidiaries. Additionally, we are required to disclose(i) Tower Cash Flow, as defined in the indentures, for the most recent fiscal quarter and (ii) Adjusted Consolidated Cash Flow, as defined in the indentures, for the most recently completed four-quarter period. This information is presented solely as a requirement of the indentures. Such information is not intended as an alternative measure of financial position, operating results or cash flows from operations (as determined in accordance with generally accepted accounting principles). Furthermore, our measure of the following information may not be comparable to similarly titled measures of other companies.
Tower Cash Flow and Adjusted Consolidated Cash Flow as defined in our senior note and senior discount note indentures are as follows:
10¼% Senior Notes | 9¾% Senior Discount Notes | |||||
| (in thousands) | ||||||
HoldCo Tower Cash Flow for the three months ended December 31, 2003(1) | $ | 18,249 | $ | 22,676 | ||
OpCo Tower Cash Flow for the three months ended December 31, 2003(2) | n/a | $ | 22,676 | |||
HoldCo Adjusted Consolidated Cash Flow for the twelve months ended December 31, 2003 | $ | 67,324 | $ | 68,679 | ||
OpCo Adjusted Consolidated Cash Flow for the twelve months ended December 31, 2003 | n/a | $ | 73,340 | |||
Special Note Regarding Forward LookingForward-Looking Statements
This annual report contains “forward-looking statements” within the meaning of Section 27A of the Securities Act of 1933 and Section 21E of the Securities Exchange Act of 1934. These statements concern expectations, beliefs, projections, future plans and strategies, anticipated events or trends and similar expressions concerning matters that are not historical facts. Specifically,Forward-looking statements included in this annual report contains forward-looking statements regarding:include, but are not limited to, the following:
expectations regarding the quality of our assets, our ability to capitalize on our asset quality and the recurring nature of revenue streams from our site leasing business;
our expectations regarding our liquidity, capital expenditures and sources of both, our leverage ratios and our ability to fund operations and meet our obligations as they become due;
our expectations regarding our cash capital expenditures in 2007 for maintenance and augmentation and for new tower builds, tower acquisitions and ground lease purchases and our ability to fund such cash capital expenditures;
our intent to build approximately 80 to 100 new towers in 2007;
our intent that substantially all of our new builds will have at least one tenant upon completion and our expectation that some will have multiple tenants;
our intent to pursue tower acquisitions that meet or exceed our internal guidelines, our expectations regarding the incurrencenumber of material additional chargestowers that we will be able to acquire in 2004 for2007, the write-offamount and type of deferred financing feesconsideration that will be paid in consideration and extinguishment of debt;
our intent to purchase and/or enter into long-term leases for the land that underlies our towers if available at commercially reasonable prices and the effect of such ground lease purchases on our margins and long-term financial condition;
our estimates regarding non-cash compensation expenseour annual debt service in each year from 2004 through 2006.2007 and thereafter;
our expectation that any potential tax implications relating to the stock option grants will not have a material impact on our financial position; and
our estimates regarding certain accounting and tax matters, including the adoption of certain accounting pronouncements and the availability of sufficient net operating losses to offset future taxable income.
These forward-looking statements reflect our current views about future events and are subject to risks, uncertainties and assumptions. We wish to caution readers that certain important factors may have affected and could in the future affect our actual results and could cause actual results to differ significantly from those expressed in any forward-looking statement. The most important factors that could prevent us from achieving our goals, and cause the assumptions underlying forward-looking statements and the actual results to differ materially from those expressed in or implied by those forward-looking statements include, but are not limited to, the following:
our inabilityability to sufficiently increase our revenues and maintain or decrease expenses and cash capital expenditures to permit us to fund operations and meet our obligations as they become due;
the purchase price of the Western tower sale;
our ability to continue to comply with covenants and the terms of our seniorrevolving credit facility and to access sufficient capital to fund our operations;mortgage loan which supports our CMBS Certificates;
our ability to secure as many site leasing tenants as planned;
our ability to secure and deliver anticipated services business at contemplated margins;
our ability to successfully implement our strategy of generally having at least one tenant on each new build upon completion;
our ability to successfully address zoning issues;issues, permitting and other issues that arise in connection with the building of new towers;
the impact of our lack of a permanent Chief Financial Officerbusiness climate for the wireless communications industry in general and our inability totimely hire a permanent Chief Financial Officer; andwireless communications infrastructure providers in particular;
the continued use of towers and dependence on outsourced site development servicesbyservices by the wireless communications industry.industry; and
our ability to successfully estimate certain accounting and tax matters, including the effect on our company of adopting certain accounting pronouncements and the availability of sufficient net operating losses to offset taxable income.
Non-GAAP Financial Measures
This report contains certain non-GAAP measures, including Adjusted EBITDA and Segment Operating Profit information. We have provided below a description of such non-GAAP measures, a reconciliation of such non-GAAP measures to their most directly comparable GAAP measures, an explanation as to why management utilizes these measures, their respective limitations and how management compensates for such limitations.
Adjusted EBITDA
We assume no responsibilitydefine Adjusted EBITDA as loss from continuing operations plus net interest expense, provision for updating forward-looking statements containedtaxes, depreciation, accretion and amortization, asset impairment and other charges, non-cash compensation, and other expenses and excluding non-cash leasing revenue, non-cash ground lease expense and other income. We have included this non-GAAP financial measure because we believe this item is an indicator of the performance of our core operations and reflects the changes in this Annual Report on Form 10-K.our operating results. In addition, Adjusted EBITDA is a component of the calculation used by our lenders to determine compliance with some of our debt instruments, particularly our senior credit facility. Adjusted EBITDA is not intended to be an alternative measure of operating income as determined in accordance with GAAP.
The Non-GAAP measurement of Adjusted EBITDA has certain material limitations, including:
it does not include interest expense. Because we have borrowed money in order to finance our operations, interest expense is a necessary element of our costs and ability to generate profits and cash flows. Therefore any measure that excludes interest expense has material limitations,
it does not include depreciation, accretion and amortization expense. Because we use capital assets, depreciation, accretion and amortization expense is a necessary element of our costs and ability to generate profits. Therefore any measure that excludes depreciation, accretion and amortization expense has material limitations,
it does not include provision for taxes. Because the payment of taxes is a necessary element of our costs, particularly in the future, any measure that excludes tax expense has material limitations,
it does not include non-cash expenses such as asset impairment and other charges, non-cash compensation, other expenses, non-cash leasing revenue and non-cash ground lease expense. Because these non-cash items are a necessary element of our costs and our ability to generate profits, any measure that excludes these non-cash items has material limitations, and
it does not include costs related to transition, integration, severance and bonuses associated with the AAT Acquisition. Because these costs are indicative of actual company expenses, any measure that excludes these costs has material limitations.
We compensate for these limitations by using Adjusted EBITDA as only one of several comparative tools, together with GAAP measurements, to assist in the evaluation of our profitability and operating results.
The reconciliation of Adjusted EBITDA is as follows:
| For the year ended December 31, | ||||||||||||
| 2006 | 2005 | 2004 | ||||||||||
| (in thousands) | ||||||||||||
Loss from continuing operations | $ | (133,448 | ) | $ | (94,648 | ) | $ | (144,023 | ) | |||
Add back (deduct): | ||||||||||||
Interest income | (3,814 | ) | (2,096 | ) | (516 | ) | ||||||
Interest expense | 81,283 | 40,511 | 47,460 | |||||||||
Non-cash interest expense | 6,845 | 26,234 | 28,082 | |||||||||
Provision for taxes | 1,375 | 2,104 | 710 | |||||||||
Amortization of deferred financing fees | 11,584 | 2,850 | 3,445 | |||||||||
Depreciation, accretion and amortization | 133,088 | 87,218 | 90,453 | |||||||||
Asset impairment and other (credits) charges | (357 | ) | 448 | 7,342 | ||||||||
Loss from write off of deferred financing fees and extinguishment of debt | 57,233 | 29,271 | 41,197 | |||||||||
Non-cash compensation | 5,410 | 462 | 470 | |||||||||
Non-cash leasing revenue | (6,575 | ) | (1,765 | ) | (1,169 | ) | ||||||
Non-cash ground lease expense | 7,569 | 4,764 | 5,579 | |||||||||
Other income | (692 | ) | (31 | ) | (236 | ) | ||||||
AAT integration costs | 2,313 | — | — | |||||||||
Adjusted EBITDA | $ | 161,814 | $ | 95,322 | $ | 78,794 | ||||||
Segment Operating Profit
Each respective Segment Operating Profit is defined as segment revenues less segment cost of revenues (excluding depreciation, accretion and amortization). Total Segment Operating Profit is the total of the operating profits of the two segments. Segment Operating Profit is, in our opinion, an indicator of the operating performance of our site leasing and site development segments and is used to provide management with the ability to monitor the operating results and margin of each segment, while excluding the impact of depreciation and amortization which is largely fixed. Segment Operating Profit is not intended to be an alternative measure of revenue or gross profit as determined in accordance with GAAP.
The Non-GAAP measurement of Segment Operating Profit has certain material limitations. Specifically this measurement does not include depreciation, accretion, and amortization expense. As we use capital assets in our business, depreciation, accretion, and amortization expense is a necessary element of our costs and ability to generate profit. Therefore any measure that excludes depreciation, accretion and amortization expense has material limitations. We compensate for these limitations by using Segment Operating Profit as only one of several comparative tools, together with GAAP measurements, to assist in the evaluation of the cash generation of our segment operations.
Segment revenue Segment cost of revenues (excluding depreciation, accretion and amortization) Segment operating profit Site leasing segment For the year ended December 31, 2006 2005 2004 (in thousands) $ 256,170 $ 161,277 $ 144,004 (70,663 ) (47,259 ) (47,283 ) $ 185,507 $ 114,018 $ 96,721
| Site development consulting segment | ||||||||||||
| For the year ended December 31, | ||||||||||||
| 2006 | 2005 | 2004 | ||||||||||
| (in thousands) | ||||||||||||
Segment revenue | $ | 16,660 | $ | 13,549 | $ | 14,456 | ||||||
Segment cost of revenues (excluding depreciation, accretion and amortization) | (14,082 | ) | (12,004 | ) | (12,768 | ) | ||||||
Segment operating profit | $ | 2,578 | $ | 1,545 | $ | 1,688 | ||||||
| Site development construction segment | ||||||||||||
| For the year ended December 31, | ||||||||||||
| 2006 | 2005 | 2004 | ||||||||||
| (in thousands) | ||||||||||||
Segment revenue | $ | 78,272 | $ | 85,165 | $ | 73,022 | ||||||
Segment cost of revenues (excluding depreciation, accretion and amortization) | (71,841 | ) | (80,689 | ) | (68,630 | ) | ||||||
Segment operating profit | $ | 6,431 | $ | 4,476 | $ | 4,392 | ||||||
| ITEM 8. | FINANCIAL STATEMENTS AND SUPPLEMENTARY DATA |
Financial statements and supplementary data for the Company are on pages F-1 through F-35.F-39.
| ITEM 9. | CHANGES IN AND DISAGREEMENTS WITH ACCOUNTANTS ON ACCOUNTING AND FINANCIAL DISCLOSURE |
None.
In orderDisclosure Controls and Procedures���We maintain disclosure controls and procedures that are designed to ensure that the information we must discloserequired to be disclosed in our filings withreports under the Securities and Exchange CommissionAct of 1934, as amended (the “Exchange Act”), is recorded, processed, summarized and reported on awithin the time periods specified in the SEC’s rules and forms, and that such information is accumulated and communicated to management, including our Chief Executive Officer (“CEO”) and Chief Financial Officer (“CFO”), as appropriate, to allow timely basis, we have formalized ourdecisions regarding required disclosure. In designing and evaluating the disclosure controls and procedures. Our principal executive officerprocedures, management recognized that any controls and principal financial officer have reviewedprocedures, no matter how well designed and evaluatedoperated, can provide only reasonable assurance of achieving the desired control objectives, as ours are designed to do, and management necessarily was required to apply its judgment in evaluating the cost-benefit relationship of possible controls and procedures.
In connection with the preparation of this Annual Report on Form 10-K, as of December 31, 2006, an evaluation was performed under the supervision and with the participation of our management, including the CEO and CFO, of the effectiveness of our disclosure controls and procedures as(as defined in Rule 13a-15(e) under the Exchange Act Rules 13a-15(e) and 15d-15(e), as of December 31, 2003.Act). Based on such evaluation, such officers haveour CEO and CFO concluded that, as of December 31, 2003,2006, our disclosure controls and procedures were effective in timelyeffective.
alerting them to material information relating to us (and our consolidated subsidiaries) required to be includedThere has been no change in our periodic SEC filings.
As previously discussed, in performinginternal control over financial reporting during the audits of our consolidated financial statements for the yearsquarter ended December 31, 20012006 that has materially affected, or is reasonably likely to materially affect, our internal control over financial reporting.
Management’s Annual Report on Internal Control over Financial Reporting—Management of the Company is responsible for establishing and 2002maintaining adequate internal control over financial reporting as defined in Rule 13a-15(f) under the Exchange Act. The Company’s internal control system is designed to provide reasonable assurance to the Company’s management and Board of Directors regarding the interim reviewspreparation and fair presentation of our consolidatedpublished financial statements forstatements. All internal control systems, no matter how well designed, have inherent limitations. Therefore, even those systems determined to be effective can provide only reasonable assurance with respect to financial statement preparation and presentation.
Under the threesupervision and six month periods ended June 30, 2003, our independent auditors,with the participation of management, including the CEO and CFO, the Company conducted an evaluation of the effectiveness of its internal control over financial reporting, as of December 31, 2006, based upon the framework in Internal Control — Integrated Framework issued by the Committee of Sponsoring Organizations of the Treadway Commission. Based on such evaluation under the framework in Internal Control — Integrated Framework, management concluded that the Company’s internal control over financial reporting was effective as of December 31, 2006. Management’s assessment of the effectiveness of the Company’s internal control over financial reporting as of December 31, 2006 has been audited by Ernst & Young LLP, (“E&Y”), noted a matter involvingan independent registered certified public accounting firm, as stated in their attestation report which appears below.
Report of Independent Registered Certified Public Accounting Firm on Internal Control over Financial Reporting
The Board of Directors and Shareholders of SBA Communications Corporation and Subsidiaries
We have audited management’s assessment, included in the accompanying Management’s Annual Report on Internal Control over Financial Reporting, that SBA Communications Corporation and Subsidiaries maintained effective internal control over financial reporting as of December 31, 2006, based on criteria established in Internal Control--Integrated Framework issued by the Committee of Sponsoring Organizations of the Treadway Commission (the COSO criteria). SBA Communications Corporation and Subsidiaries’ management is responsible for maintaining effective internal control over financial reporting and for its assessment of the effectiveness of internal control over financial reporting. Our responsibility is to express an opinion on management’s assessment and an opinion on the effectiveness of the company’s internal control over financial reporting based on our audit.
We conducted our audit in accordance with the standards of the Public Company Accounting Oversight Board (United States). Those standards require that we plan and perform the audit to obtain reasonable assurance about whether effective internal control over financial reporting was maintained in all material respects. Our audit included obtaining an understanding of internal control over financial reporting, evaluating management’s assessment, testing and evaluating the design and operating effectiveness of internal control, and its operationperforming such other procedures as we considered necessary in the circumstances. We believe that E&Y consideredour audit provides a reasonable basis for our opinion.
A company’s internal control over financial reporting is a process designed to be a material weakness. Specifically, E&Y, notedprovide reasonable assurance regarding the reliability of financial reporting and the preparation of financial statements for external purposes in accordance with generally accepted accounting principles. A company’s internal control over financial reporting includes those policies and procedures that we did not have an adequate process(1) pertain to the maintenance of records that, in place to ensure thatreasonable detail, accurately and fairly reflect the appropriate personnel, with adequate understandingtransactions and dispositions of the relevantassets of the company; (2) provide reasonable assurance that transactions are recorded as necessary to permit preparation of financial statements in accordance with generally accepted accounting principles, and that receipts and expenditures of the company are being made only in accordance with authorizations of management and directors of the company; and (3) provide reasonable assurance regarding prevention or timely detection of unauthorized acquisition, use, or disposition of the company’s assets that could have a material effect on the financial statements.
Because of its inherent limitations, internal control over financial reporting implications, thoroughly assessedmay not prevent or detect misstatements. Also, projections of any evaluation of effectiveness to future periods are subject to the risk that controls may become inadequate because of changes in conditions, or that the degree of compliance with the policies or procedures may deteriorate.
In our opinion, management’s assessment that SBA Communications Corporation and appliedSubsidiaries maintained effective internal control over financial reporting as of December 31, 2006, is fairly stated, in all material respects, based on the proper accountingCOSO criteria. Also, in our opinion, SBA Communications Corporation and Subsidiaries maintained, in all material respects, effective internal control over financial reporting principles to certain significant asset or business acquisitionas of December 31, 2006, based on the COSO criteria.
We also have audited, in accordance with the standards of the Public Company Accounting Oversight Board (United States), the consolidated balance sheets of SBA Communications Corporation and disposition transactions.Subsidiaries as of December 31, 2006 and 2005, and the related consolidated statements of operations, shareholders’ equity (deficit) and cash flows for each of the three years in the period ended December 31, 2006, and our report dated February 27, 2007 expressed an unqualified opinion thereon.
/s/ Ernst & Young LLP
West Palm Beach, Florida
February 27, 2007
| ITEM 9B. | OTHER INFORMATION |
To address the matter identified, weNone.
| ITEM 10. | DIRECTORS, EXECUTIVE OFFICERS AND CORPORATE GOVERNANCE |
We have establishedadopted a processCode of Ethics that applies to ensure that our Chief Executive Officer, Chief Financial Officer and Chief Accounting Officer are involved throughout each significant asset or business acquisition or disposition and that such officers have the appropriate knowledgeOfficer. The Code of generally accepted accounting principles and consult the applicable accounting literature and outside professionals as appropriate. In performing the audit ofEthics is located on our consolidated financial statements for the year ended December 31, 2003, E&Y, noted no matters involving internal control and its operation that it considered to be a material weakness. As of the date of the filing of this report, we do not have a Chief Financial Officer. We have continued to actively pursue our search for a qualified individual to fill the vacancy in our Chief Financial Officer position by engaging an executive search firm who has identified several possible candidates.
PART IIIinternet web site atwww.sbasite.com under “Investor Relations-Corporate Governance.”
The remaining items required by Part III, Item 10 are incorporated herein by reference from the Registrant’s Proxy Statement for its 20042007 Annual Meeting of Shareholders to be filed on or before April 29, 2004.30, 2007.
| ITEM 11. | EXECUTIVE COMPENSATION |
The items required by Part III, Item 11 are incorporated herein by reference from the Registrant’s Proxy Statement for its 20042007 Annual Meeting of Shareholders to be filed on or before April 29, 2004.30, 2007.
| ITEM 12. | SECURITY OWNERSHIP OF CERTAIN BENEFICIAL OWNERS AND MANAGEMENT AND RELATED STOCKHOLDER MATTERS |
The items required by Part III, Item 12 are incorporated herein by reference from the Registrant’s Proxy Statement for its 20042007 Annual Meeting of Shareholders to be filed on or before April 29, 2004.30, 2007.
| ITEM 13. | CERTAIN RELATIONSHIPS, |
The items required by Part III, Item 13 are incorporated herein by reference from the Registrant’s Proxy Statement for its 20042007 Annual Meeting of Shareholders to be filed on or before April 29, 2004.30, 2007.
| ITEM 14. | PRINCIPAL ACCOUNTANT FEES AND SERVICES |
The items required by Part III, Item 14 are incorporated herein by reference from the Registrant’s Proxy Statement for its 20042007 Annual Meeting of Shareholders to be filed on or before April 29, 2004.
| ITEM 15. | EXHIBITS AND FINANCIAL STATEMENT SCHEDULES |
| (a) | Documents filed as part of this report: |
| (1) Financial Statements |
See “Item 8. Financial Statements and Supplementary Data”Item 8 for Financial Statements included with this Annual Report on Form 10-K.
| (2) Financial Statement Schedules |
See “Item 8. Financial Statements and Supplementary Data” for Financial Statements Schedules included with this Annual Report on Form 10-K.None.
(3) Exhibits
All other schedules have been omitted because they are not required, not applicable, or the information is otherwise set forth in the financial statements or notes thereto.
Exhibit No. | Description of Exhibits | |
| 3.4 | Fourth Amended and Restated Articles of Incorporation of SBA Communications Corporation. (1) | |
| 3.5 | ||
| ||
| ||
| 4.6 | ||
| 4.6A | First Amendment to Rights Agreement, dated as of March 17, 2006, between SBA Communications Corporation and Computershare Trust Company, N.A.(3) | |
| 4.7 |
SBA Telecommunications, Inc. and U.S. Bank National Association, relating to the $402,024,000 in aggregate principal amount at maturity of 9 3/4% senior discount notes due 2011.(4) | |
| 4.7A | First Supplemental Indenture, dated March 31, 2006, among SBA Communications Corporation, SBA Telecommunications, Inc. and U.S. Bank National | |
| 4.8 | ||
| 4.9 | Indenture, dated as of December 14, 2004, between SBA Communications Corporation and U.S. Bank, N.A., relating to $250,000,000 aggregate principal amount of 8 1/2% senior notes due 2012.(6) | |
| 4.9A | First Supplemental Indenture, dated March 31, 2006, between SBA Communications Corporation and U.S. Bank National Association.(7) | |
| 4.10 | Form of 8 1/2% senior note due December 1, 2012.(6) | |
| 5.1 | Opinion of Holland & Knight LLP regarding validity of common stock.* | |
| 10.1 |
| |
| ||
| 10.23 | ||
| 10.24 | ||
| 10.25 |
| ||
| 10.27 |
| ||
| 10.28 |
| ||
| 10.33 | |||
| 10.35 | |||
| 10.35A | Amendment to Employment Agreement, dated as of June 24, 2005, by and between SBA Properties, Inc. and Jeffrey A. Stoops.(6)+ | |
| 10.35B | Amendment to Employment Agreement, dated as of November 10, 2005, by and between SBA Properties, Inc., SBA Communications Corporation and Jeffrey A. Stoops.(12)+ | |
| 10.36 | ||
| 10.36A | Amendment to Employment Agreement, dated as of November 10, 2005, by and between SBA Properties, Inc., SBA Communications Corporation and Kurt L. Bagwell.(12)+ | |
| 10.37 | ||
| ||
| 10.47 | $160,000,000 Credit Agreement, dated as of December 21, 2005, among SBA Senior Finance II LLC, the Several Lenders from Time to Time Parties Hereto, GE Capital Markets, Inc., General Electric Capital Corporation, TD Securities (USA) LLC, and DB Structured Products, Inc. and Lehman Commercial Paper, Inc.(13) | |
| 10.48 | Guarantee and Collateral Agreement, dated as of December 21, 2005, among SBA Communications Corporation, SBA Telecommunications, Inc., SBA Senior Finance, Inc., SBA Senior Finance II LLC and certain of its Subsidiaries in favor of General Electric Capital Corporation.(13) | |
| 10.49 | Amended and Restated Loan and Security Agreement, dated as of November | |
| 10.50 | Management Agreement, dated as of November 18, 2005, by and among SBA Properties, Inc., SBA Network Management, Inc. and SBA Senior Finance, Inc.(12) | |
| 10.51 | Stock Purchase Agreement, dated March 17, 2006, by and among AAT Holdings, LLC II, AAT Communications Corp., AAT Acquisition LLC and SBA Communications Corporation.(14) | |
| 10.54 | $1,100,000,000 Credit Agreement, dated as of April 27, 2006, among SBA Senior Finance, Inc., | |
| ||
| ||
| 10.56 | Omnibus Agreement, dated as of April 27, 2006, among SBA Senior Finance II LLC, General Electric Capital Corporation, and Toronto Dominion (Texas) LLC, DB Structured Products Inc., JPMorgan Chase Bank, N.A. and Lehman Commercial Paper Inc., SBA Senior Finance, Inc., DB Structured Products Inc. and JPMorgan Chase Bank, N.A., and Deutsche Bank AG, New York Branch.(3) | |
| 10.57 | Employment Agreement, dated as of September 18, 2006, between SBA Communications Corporation and Kurt L. Bagwell.(15)+ | |
| 10.58 | Employment Agreement, dated as of September 18, 2006, between SBA Communications Corporation and Thomas P. Hunt.(15)+ | |
| 10.59 | Employment Agreement, dated as of September 18, 2006, between SBA Communications Corporation and Anthony J. Macaione.(15)+ | |
| 10.60 | Joinder and Amendment to Management Agreement, dated November 6, 2006, by and among SBA Properties, Inc., SBA Towers, Inc., SBA Puerto Rico, Inc., SBA Sites, Inc., SBA Towers USVI, Inc., and SBA Structures, Inc., and SBA Network Management, Inc., and SBA Senior Finance, Inc.* | |
| 10.61 | Second Loan and Security Agreement Supplement and Amendment, dated as of November 6, 2006, by and among SBA Properties, Inc., and SBA Towers, Inc., SBA Puerto Rico, Inc., SBA Sites, Inc., SBA Towers USVI, Inc., and SBA Structures, Inc. and Midland Loan Services, Inc., as Servicer on behalf of LaSalle Bank National Association, as Trustee* | |
| 21 | ||
| 23.1 | ||
| 31.1 | ||
| 31.2 | ||
| 32.1 | ||
| 32.2 | ||
| + | Management contract or compensatory plan or arrangement. |
| * | Filed herewith |
| (1) | Incorporated by reference to the Registration Statement on Form S-1, previously filed by the Registrant (Registration No. 333-76547). |
| (2) | Incorporated by reference to the Form 8-K, dated January 11, 2002, previously filed by the Registrant. |
| (3) | Incorporated by reference to the Form 10-Q for the quarter ended March 31, 2006, previously filed by the Registrant. |
| (4) | Incorporated by reference to the Form 10-K for the year ended December 31, 2003, previously filed by the Registrant. |
| (5) | Incorporated by reference to Exhibit 10.52 filed with the Form 8-K dated April 27, 2006, previously filed by the Registrant. |
| (6) | Incorporated by reference to the Form 10-K for the year ended December 31, 2004, previously filed by the Registrant. |
| (7) | Incorporated by reference to Exhibit 10.53 filed with the Form 8-K dated April 27, 2006, previously filed by the Registrant. |
| (8) | Incorporated by reference to the Registration Statement on Form S-4, previously filed by the Registrant (Registration No. 333-50219). |
| Incorporated by reference to the Form 10-K for the year ended December 31, 2000, previously filed by the Registrant. |
| Incorporated by reference to the |
| Incorporated by reference to the Form 10-K for the year ended December 31, 2002, previously filed by the Registrant. |
| Incorporated by reference to the Form |
| Incorporated by reference to the Form 8-K, dated |
The Company filed a report on Form 8-K dated October 1, 2003. In the report, the Company reported under Items 5 and 7 that its re-audit had been substantially completed and announced its plans to restate its fiscal year 2001, fiscal year 2002, first and second quarter 2003 financial statements and discussed the anticipated impact of the restatement.
The Company filed a report on Form 8-K dated November 10, 2003. In the report, the Company furnished under Item 12, the Company’s financial results for the third quarter ended September 30, 2003.
The Company filed a report on Form 8-K dated November 10, 2003. In the report, under Items 5 and 12, the Company announced its plans to restate its financial statements for fiscal year 2002, fiscal year 2001 and the three and six months ended June 30, 2003 and 2002, and discussed the anticipated impact of the restatement.
The Company filed a report on Form 8-K dated November 14, 2003. In the report, the Company disclosed under Items 5 and 12, the effect of the financial statement restatements for fiscal year 2002, fiscal year fiscal year 2001 and the six months ended June 30, 2003 and 2002, and the restated audited financial statements for fiscal years 2002 and 2001 and the amended Management’s Discussion and Analysis of Financial Condition and Results of Operations for Fiscal Years 2002 and 2001.
The Company filed a report on Form 8-K dated November 21, 2003. In the report, the Company reported under Item 5, that SBA Senior Finance, Inc., a newly formed wholly-owned subsidiary of SBA Telecommunications, Inc., assumed all rights and obligations of SBA Telecommunications, Inc., under the existing $195.0 million senior credit facility pursuant to an amended and restated credit agreement. Under Item 7, the Company included the Amended and Restated Credit Agreement dated as of November 21, 2003.
The Company filed a report on Form 8-K dated December 1, 2003. In the report under Item 7, the Company included a press release announcing its intent to issue approximately $200 million in gross proceeds of senior discount notes due 2011. Under Items 9 and 12, the Company released selected historical financial data for the years ended December 31, 2000, 1999, and 1998, and other financial and operations data.
The Company filed a report for Form 8-K dated December 10, 2003. In the report under Items 5 and 7, the Company reported that on December 8, 2003, it priced an offering by the Company and SBA Telecommunications, Inc., of $402.0 million aggregate principal amount at maturity ($275 million in gross proceeds) of 9¾% senior discount notes due 2011.
The Company filed a report on Form 8-K on December 23, 2003. In the report under Items 5 and 7, the Company announced the expiration of a tender offer and its related consent solicitation with respect to its 12% senior discount notes due 2008 and its use of net proceeds from its recent issue of $275 million of 9¾% senior discount notes due 2011. Additionally, the Company reported that 5.5 million shares of Class B common stock held by Steven E. Bernstein, SBA’s Chairman, converted into 5.5 million shares of Class A common stock. As a result, the Class A common stock now held by Mr. Bernstein no longer have the super-voting rights that the Class B common stock held by Mr. Bernstein had.
| (15) | Incorporated by reference to the Form 10-Q for the quarter ended September 30, 2006, previously filed by the Registrant. |
SIGNATURES
Pursuant to the requirements of Section 13 or 15(d) of the Securities Exchange Act of 1934, the Registrant has duly caused this report to be signed on its behalf by the undersigned, thereunto duly authorized.
SBA COMMUNICATIONS CORPORATION | ||
By: | /s/ | |
Steven E. Bernstein Chairman of the Board of Directors | ||
Date: | March | |
1, 2007 | ||
Pursuant to the requirements of the Securities Exchange Act of 1934, this report has been signed below by the following persons on behalf of the registrant and in the capacities and on the dates indicated.
Signature | Title | Date | ||
/s/ | Chairman of the Board of Directors | March 1, 2007 | ||
Steven E. Bernstein |
| |||
/s/ | Chief Executive Officer and President | March 1, 2007 | ||
Jeffrey A. Stoops |
| |||
/s/
| Chief | March | ||
Anthony J. Macaione | (Principal Financial Officer) | |||
/s/
|
| March | ||
Brendan T. Cavanagh | (Principal Accounting Officer) | |||
/s/
| Director | March | ||
Brian C. Carr | ||||
/s/ | Director | March 1, 2007 | ||
Duncan H. Cocroft | ||||
/s/ Philip L. Hawkins | Director | March 1, 2007 | ||
Philip L. Hawkins | ||||
/s/ Jack Langer | Director | March 1, 2007 | ||
Jack Langer | ||||
/s/ Steven E. | Director | March 1, 2007 | ||
Steven E. Nielsen |
| |||
SBA COMMUNICATIONS CORPORATION AND SUBSIDIARIES
CONSOLIDATED FINANCIAL STATEMENTS
| Page | ||
| ||
Consolidated Balance Sheets as of December 31, | ||
REPORT OF INDEPENDENT REGISTERED CERTIFIED PUBLIC ACCOUNTANTSACCOUNTING FIRM
The Board of Directors
and Shareholders of SBA Communications Corporation and Subsidiaries
We have audited the accompanying consolidated balance sheets of SBA Communications Corporation and Subsidiaries as of December 31, 20032006 and 2002,2005, and the related consolidated statements of operations, shareholders’ equity (deficit) and cash flows for each of the three years in the period ended December 31, 2003. Our audits also included the financial statement schedule listed in the Index at Item 15(a).2006. These financial statements are the responsibility of the Company’s management. Our responsibility is to express an opinion on these financial statements based on our audits.
We conducted our audits in accordance with auditingthe standards generally accepted inof the United States.Public Company Accounting Oversight Board (United States). Those standards require that we plan and perform the audit to obtain reasonable assurance about whether the financial statements are free of material misstatement. An audit includes examining, on a test basis, evidence supporting the amounts and disclosures in the financial statements. An audit also includes assessing the accounting principles used and significant estimates made by management, as well as evaluating the overall financial statement presentation. We believe that our audits provide a reasonable basis for our opinion.
In our opinion, the financial statements referred to above present fairly, in all material respects, the consolidated financial position of SBA Communications Corporation and Subsidiaries as ofat December 31, 20032006 and 2002,2005, and the consolidated results of their operations and their cash flows for each of the three years in the period ended December 31, 2003,2006, in conformity with accounting principlesU.S. generally accepted in the United States. Also, in our opinion, the related financial statement schedule, when considered in relation to the basic financial statements taken as a whole, presents fairly in all material respects the information set forth therein.accounting principles.
As discussed in Note 5Notes 2 and 14 to the consolidated financial statements, effective January 1, 2003, the Company adopted Statement of Financial Accounting Standards No. 143, “Accounting for Asset Retirement Obligations.” As also discussed in Note 5,123(R) (revised 2004),Share-Based Payment, effective January 1, 2002,2006, which requires the Company changed its methodto recognize expense related to the fair value of accountingshare-based compensation awards. Also, as described in Note 3 to the consolidated financial statements, the Company adopted Securities and Exchange Commission Staff Accounting Bulletin (“SAB”) No. 108,Considering the Effects of Prior Year Misstatements when Quantifying Misstatements in the Current Year Financial Statements,effective September 30, 2006. In accordance with the transition provisions of SAB No. 108, the Company recorded a cumulative decrease to retained earnings as of January 1, 2006 for goodwillcorrection of prior period errors in recording equity-based compensation charges.
We also have audited, in accordance with the standards of the Public Company Accounting Oversight Board (United States), the effectiveness of SBA Communications Corporation and other intangible assets to conform to StatementSubsidiaries internal control over financial reporting as of Financial Accounting Standards No. 142, “GoodwillDecember 31, 2006, based on criteria established in Internal Control--Integrated Framework issued by the Committee of Sponsoring Organizations of the Treadway Commission and Other Intangible Assets.”our report dated February 27, 2007 expressed an unqualified opinion thereon.
/s/ ERNST & YOUNG LLP
West Palm Beach, Florida
March 5, 2004
| West Palm Beach, Florida | /s/ ERNST & YOUNG LLP | |||
| February 27, 2007 |
SBA COMMUNICATIONS CORPORATION AND SUBSIDIARIES
(in thousands, except par values)
December 31, 2003 | December 31, 2002 | |||||||
| ASSETS | ||||||||
Current assets: | ||||||||
Cash and cash equivalents | $ | 8,338 | $ | 61,141 | ||||
Short-term investments | 15,200 | — | ||||||
Restricted cash | 10,344 | — | ||||||
Accounts receivable, net of allowances of $1,400 and $5,572 in 2003 and 2002, respectively | 19,414 | 36,292 | ||||||
Costs and estimated earnings in excess of billings on uncompleted contracts | 10,227 | 10,425 | ||||||
Prepaid and other current assets | 5,009 | 5,129 | ||||||
Assets held for sale | 395 | 202,409 | ||||||
Total current assets | 68,927 | 315,396 | ||||||
Property and equipment, net | 856,213 | 940,961 | ||||||
Deferred financing fees, net | 24,253 | 24,517 | ||||||
Other assets | 31,181 | 18,787 | ||||||
Intangible assets, net | 2,408 | 3,704 | ||||||
Total assets | $ | 982,982 | $ | 1,303,365 | ||||
| LIABILITIES AND SHAREHOLDERS’ EQUITY | ||||||||
Current liabilities: | ||||||||
Accounts payable | $ | 11,352 | $ | 16,810 | ||||
Accrued expenses | 17,709 | 13,943 | ||||||
Deferred revenue | 11,137 | 11,142 | ||||||
Interest payable | 20,319 | 22,919 | ||||||
Long-term debt, current portion | 11,538 | 60,083 | ||||||
Billings in excess of costs and estimated earnings on uncompleted contracts | 1,577 | 2,362 | ||||||
Other current liabilities | 1,807 | 3,595 | ||||||
Liabilities held for sale | 608 | 2,685 | ||||||
Total current liabilities | 76,047 | 133,539 | ||||||
Long-term liabilities: | ||||||||
Long-term debt | 859,220 | 964,199 | ||||||
Deferred revenue | 511 | 703 | ||||||
Other long-term liabilities | 3,327 | 1,434 | ||||||
Total long-term liabilities | 863,058 | 966,336 | ||||||
Commitments and contingencies | ||||||||
Shareholders’ equity: | ||||||||
Preferred stock-$.01 par value, 30,000 shares authorized, none issued or outstanding | — | — | ||||||
Common stock-Class A par value $.01 (200,000 and 100,000 shares authorized, 55,016 and 45,674 shares issued and outstanding in 2003 and 2002, respectively) | 550 | 457 | ||||||
Common stock-Class B par value $.01 (8,100 shares authorized, 0 and 5,456 shares issued and outstanding in 2003 and 2002, respectively) | — | 55 | ||||||
Additional paid-in capital | 679,961 | 667,441 | ||||||
Accumulated deficit | (636,634 | ) | (464,463 | ) | ||||
Total shareholders’ equity | 43,877 | 203,490 | ||||||
Total liabilities and shareholders’ equity | $ | 982,982 | $ | 1,303,365 | ||||
| December 31, 2006 | December 31, 2005 | |||||||
ASSETS | ||||||||
Current assets: | ||||||||
Cash and cash equivalents | $ | 46,148 | $ | 45,934 | ||||
Short term investments | — | 19,777 | ||||||
Restricted cash | 34,403 | 19,512 | ||||||
Accounts receivable, net of allowance of $1,316 and $1,136 in 2006 and 2005, respectively | 20,781 | 17,533 | ||||||
Costs and estimated earnings in excess of billings on uncompleted contracts | 19,403 | 25,184 | ||||||
Prepaid and other current assets | 6,872 | 4,248 | ||||||
Total current assets | 127,607 | 132,188 | ||||||
Property and equipment, net | 1,105,942 | 728,333 | ||||||
Intangible assets, net | 724,872 | 31,491 | ||||||
Deferred financing fees, net | 33,221 | 19,931 | ||||||
Other assets | 54,650 | 40,593 | ||||||
Total assets | $ | 2,046,292 | $ | 952,536 | ||||
LIABILITIES AND SHAREHOLDERS' EQUITY | ||||||||
Current liabilities: | ||||||||
Accounts payable | $ | 9,746 | $ | 17,283 | ||||
Accrued expenses | 17,600 | 15,544 | ||||||
Deferred revenue | 24,665 | 11,838 | ||||||
Interest payable | 4,056 | 3,880 | ||||||
Billings in excess of costs and estimated earnings on uncompleted contracts | 1,055 | 1,391 | ||||||
Other current liabilities | 1,232 | 2,207 | ||||||
Total current liabilities | 58,354 | 52,143 | ||||||
Long term liabilities: | ||||||||
Long term debt | 1,555,000 | 784,392 | ||||||
Deferred revenue | 1,992 | 302 | ||||||
Other long term liabilities | 45,025 | 34,268 | ||||||
Total long term liabilities | 1,602,017 | 818,962 | ||||||
Commitments and contingencies | ||||||||
Shareholders' equity: | ||||||||
Preferred stock - $.01 par value, 30,000 shares authorized, none issued or outstanding | — | — | ||||||
Common Stock - Class A par value $.01, 200,000 shares authorized, 105,672 and 85,615 shares issued and outstanding at December 31, 2006 and 2005, respectively | 1,057 | 856 | ||||||
Additional paid-in capital | 1,450,754 | 990,181 | ||||||
Accumulated deficit | (1,065,224 | ) | (924,066 | ) | ||||
Accumulated other comprehensive (loss) income, net | (666 | ) | 14,460 | |||||
Total shareholders' equity | 385,921 | 81,431 | ||||||
Total liabilities and shareholders' equity | $ | 2,046,292 | $ | 952,536 | ||||
The accompanying notes to consolidated financial statements are an integral part of these consolidated financial statements.
SBA COMMUNICATIONS CORPORATION AND SUBSIDIARIES
CONSOLIDATED STATEMENTS OF OPERATIONS
(in thousands, except per share amounts)
| For the years ended December 31, | ||||||||||||
| 2003 | 2002 | 2001 | ||||||||||
Revenues: | ||||||||||||
Site leasing | $ | 127,842 | $ | 115,081 | $ | 85,487 | ||||||
Site development | 84,218 | 125,041 | 139,735 | |||||||||
Total revenues | 212,060 | 240,122 | 225,222 | |||||||||
Cost of revenues (exclusive of depreciation, accretion and amortization shown below): | ||||||||||||
Cost of site leasing | 42,021 | 40,650 | 30,657 | |||||||||
Cost of site development | 77,810 | 102,473 | 108,532 | |||||||||
Total cost of revenues | 119,831 | 143,123 | 139,189 | |||||||||
Gross profit | 92,229 | 96,999 | 86,033 | |||||||||
Operating expenses: | ||||||||||||
Selling, general and administrative | 31,244 | 34,352 | 42,103 | |||||||||
Restructuring and other charges | 2,505 | 47,762 | 24,399 | |||||||||
Asset impairment charges | 16,965 | 25,545 | — | |||||||||
Depreciation, accretion and amortization | 84,380 | 85,728 | 66,104 | |||||||||
Total operating expenses | 135,094 | 193,387 | 132,606 | |||||||||
Operating loss from continuing operations | (42,865 | ) | (96,388 | ) | (46,573 | ) | ||||||
Other income (expense): | ||||||||||||
Interest income | 692 | 601 | 7,059 | |||||||||
Interest expense, net of amounts capitalized | (81,501 | ) | (54,822 | ) | (47,709 | ) | ||||||
Non-cash interest expense | (9,277 | ) | (29,038 | ) | (25,843 | ) | ||||||
Amortization of debt issuance costs | (5,115 | ) | (4,480 | ) | (3,887 | ) | ||||||
Write-off of deferred financing fees and loss on extinguishment of debt | (24,219 | ) | — | (5,069 | ) | |||||||
Other | 169 | (169 | ) | (76 | ) | |||||||
Total other expense | (119,251 | ) | (87,908 | ) | (75,525 | ) | ||||||
Loss from continuing operations before provision for income taxes and cumulative effect of changes in accounting principle | (162,116 | ) | (184,296 | ) | (122,098 | ) | ||||||
Provision for income taxes | (1,820 | ) | (309 | ) | (1,493 | ) | ||||||
Loss from continuing operations before cumulative effect of changes in accounting principle | (163,936 | ) | (184,605 | ) | (123,591 | ) | ||||||
Loss from discontinued operations, net of income taxes | (7,690 | ) | (3,717 | ) | (2,201 | ) | ||||||
Loss before cumulative effect of changes in accounting principle | (171,626 | ) | (188,322 | ) | (125,792 | ) | ||||||
Cumulative effect of changes in accounting principle | (545 | ) | (60,674 | ) | — | |||||||
Net loss | $ | (172,171 | ) | $ | (248,996 | ) | $ | (125,792 | ) | |||
Basic and diluted loss per common share amounts: | ||||||||||||
Loss from continuing operations before cumulative effect of changes in accounting principle | $ | (3.14 | ) | $ | (3.66 | ) | $ | (2.61 | ) | |||
Loss from discontinued operations | (0.15 | ) | (0.07 | ) | (0.05 | ) | ||||||
Cumulative effect of changes in accounting principle | (0.01 | ) | (1.20 | ) | — | |||||||
Net loss per common share | $ | (3.30 | ) | $ | (4.93 | ) | $ | (2.66 | ) | |||
Weighted average number of common shares | 52,204 | 50,491 | 47,321 | |||||||||
| For the year ended December 31, | ||||||||||||
| 2006 | 2005 | 2004 | ||||||||||
Revenues: | ||||||||||||
Site leasing | $ | 256,170 | $ | 161,277 | $ | 144,004 | ||||||
Site development | 94,932 | 98,714 | 87,478 | |||||||||
Total revenues | 351,102 | 259,991 | 231,482 | |||||||||
Operating expenses: | ||||||||||||
Cost of revenues (exclusive of depreciation, accretion and amortization shown below): | ||||||||||||
Cost of site leasing | 70,663 | 47,259 | 47,283 | |||||||||
Cost of site development | 85,923 | 92,693 | 81,398 | |||||||||
Selling, general and administrative | 42,277 | 28,178 | 28,887 | |||||||||
Asset impairment and other (credits) charges | (357 | ) | 448 | 7,342 | ||||||||
Depreciation, accretion and amortization | 133,088 | 87,218 | 90,453 | |||||||||
Total operating expenses | 331,594 | 255,796 | 255,363 | |||||||||
Operating income (loss) | 19,508 | 4,195 | (23,881 | ) | ||||||||
Other income (expense): | ||||||||||||
Interest income | 3,814 | 2,096 | 516 | |||||||||
Interest expense | (81,283 | ) | (40,511 | ) | (47,460 | ) | ||||||
Non-cash interest expense | (6,845 | ) | (26,234 | ) | (28,082 | ) | ||||||
Amortization of deferred financing fees | (11,584 | ) | (2,850 | ) | (3,445 | ) | ||||||
Loss from write-off of deferred financing fees and extinguishment of debt | (57,233 | ) | (29,271 | ) | (41,197 | ) | ||||||
Other | 692 | 31 | 236 | |||||||||
Total other expense | (152,439 | ) | (96,739 | ) | (119,432 | ) | ||||||
Loss from continuing operations before provision for income taxes | (132,931 | ) | (92,544 | ) | (143,313 | ) | ||||||
Provision for income taxes | (517 | ) | (2,104 | ) | (710 | ) | ||||||
Loss from continuing operations | (133,448 | ) | (94,648 | ) | (144,023 | ) | ||||||
Loss from discontinued operations, net of income taxes | — | (61 | ) | (3,257 | ) | |||||||
Net loss | $ | (133,448 | ) | $ | (94,709 | ) | $ | (147,280 | ) | |||
Basic and diluted loss per common share amounts: | ||||||||||||
Loss from continuing operations | $ | (1.36 | ) | $ | (1.28 | ) | $ | (2.47 | ) | |||
Loss from discontinued operations | — | — | (0.05 | ) | ||||||||
Net loss per common share | $ | (1.36 | ) | $ | (1.28 | ) | $ | (2.52 | ) | |||
Weighted average number of common shares | 98,193 | 73,823 | 58,420 | |||||||||
The accompanying notes to consolidated financial statements are an integral part of these consolidated financial statements.
SBA COMMUNICATIONS CORPORATION AND SUBSIDIARIES
CONSOLIDATED STATEMENTS OF SHAREHOLDERS’ EQUITY (DEFICIT)
FOR THE YEARS ENDED DECEMBER 31, 2003, 20022006, 2005, AND 20012004
(in thousands)
| Common Stock | Additional Paid-In Capital | Accumulated Deficit | Total | |||||||||||||||||||||
| Class A | Class B | |||||||||||||||||||||||
| Number | Amount | Number | Amount | |||||||||||||||||||||
BALANCE, December 31, 2000 | 40,989 | $ | 410 | 5,456 | $ | 55 | $ | 627,370 | $ | (89,675 | ) | $ | 538,160 | |||||||||||
Common stock issued in connection with acquisitions | 1,575 | 16 | — | — | 29,784 | — | 29,800 | |||||||||||||||||
Non-cash compensation | — | — | — | — | 3,326 | — | 3,326 | |||||||||||||||||
Common stock issued in connection with employee stock purchase/ option plans | 669 | 6 | — | — | 3,244 | — | 3,250 | |||||||||||||||||
Net loss | — | — | — | — | — | (125,792 | ) | (125,792 | ) | |||||||||||||||
BALANCE, December 31, 2001 | 43,233 | 432 | 5,456 | 55 | 663,724 | (215,467 | ) | 448,744 | ||||||||||||||||
Common stock issued in connection with acquisitions | 1,316 | 13 | — | — | 1,383 | — | 1,396 | |||||||||||||||||
Non-cash compensation | — | — | — | — | 2,017 | — | 2,017 | |||||||||||||||||
Common stock issued in connection with employee stock purchase/ option/severance plans | 1,125 | 12 | — | — | 317 | — | 329 | |||||||||||||||||
Net loss | — | — | — | — | — | (248,996 | ) | (248,996 | ) | |||||||||||||||
BALANCE, December 31, 2002 | 45,674 | 457 | 5,456 | 55 | 667,441 | (464,463 | ) | 203,490 | ||||||||||||||||
Conversion of Class B common stock into Class A common stock | 5,456 | 55 | (5,456 | ) | (55 | ) | — | — | — | |||||||||||||||
Non-cash compensation | — | — | — | — | 832 | — | 832 | |||||||||||||||||
Payment of restricted stock guarantee | — | — | — | — | (936 | ) | — | (936 | ) | |||||||||||||||
Common stock issued in exchange for 10¼% senior notes | 3,853 | 38 | — | — | 12,593 | — | 12,631 | |||||||||||||||||
Common stock issued in connection with employee stock option plans | 33 | — | — | — | 31 | — | 31 | |||||||||||||||||
Net loss | — | — | — | — | — | (172,171 | ) | (172,171 | ) | |||||||||||||||
BALANCE, December 31, 2003 | 55,016 | $ | 550 | — | $ | — | $ | 679,961 | $ | (636,634 | ) | $ | 43,877 | |||||||||||
| Class A Common Stock | Additional Paid-In Capital | Accumulated Deficit | Accumulated Other Comprehensive Income (Loss) | Total | Comprehensive Loss | |||||||||||||||||||
| Shares | Amount | |||||||||||||||||||||||
BALANCE, December 31, 2003 | 55,016 | $ | 550 | $ | 679,961 | $ | (682,077 | ) | $ | — | $ | (1,566 | ) | |||||||||||
Net loss | — | — | — | (147,280 | ) | — | (147,280 | ) | ||||||||||||||||
Common stock issued in connection with acquisitions | 413 | 4 | 3,003 | — | — | 3,007 | ||||||||||||||||||
Non-cash compensation | — | — | 470 | — | — | 470 | ||||||||||||||||||
Common stock issued in exchange for 10 1/4% senior notes and 9 3/4% senior discount notes | 8,817 | 88 | 54,484 | — | — | 54,572 | ||||||||||||||||||
Common stock issued in connection with stock purchase/option plans | 657 | 7 | 2,119 | — | — | 2,126 | ||||||||||||||||||
BALANCE, December 31, 2004 | 64,903 | 649 | 740,037 | (829,357 | ) | — | (88,671 | ) | ||||||||||||||||
Net loss | — | — | — | (94,709 | ) | — | (94,709 | ) | $ | (94,709 | ) | |||||||||||||
Amortization of deferred gain from settlement of derivative financial instrument, net | — | — | — | — | (314 | ) | (314 | ) | $ | (314 | ) | |||||||||||||
Deferred gain from settlement of derivative financial instrument | — | — | — | — | 14,774 | 14,774 | 14,774 | |||||||||||||||||
Total comprehensive loss | $ | (80,249 | ) | |||||||||||||||||||||
Common stock issued in connection with acquisitions and earn outs | 1,665 | 17 | 18,329 | — | — | 18,346 | ||||||||||||||||||
Non-cash compensation | — | — | 462 | — | — | 462 | ||||||||||||||||||
Common stock issued in connection with public offerings | 18,000 | 180 | 226,677 | — | — | 226,857 | ||||||||||||||||||
Common stock issued in connection with stock purchase/option plans | 1,047 | 10 | 4,676 | — | — | 4,686 | ||||||||||||||||||
BALANCE, December 31, 2005 | 85,615 | 856 | 990,181 | (924,066 | ) | 14,460 | 81,431 | |||||||||||||||||
Cumulative effect of adoption of SAB 108 | — | — | 8,444 | (7,710 | ) | — | 734 | |||||||||||||||||
Net loss | — | — | — | (133,448 | ) | (133,448 | ) | $ | (133,448 | ) | ||||||||||||||
Minimum pension liability | — | — | — | — | 80 | 80 | ||||||||||||||||||
Amortization of deferred gain/loss from settlement of derivative financial instrument, net | — | — | — | — | (2,370 | ) | (2,370 | ) | (2,370 | ) | ||||||||||||||
Deferred loss from settlement of derivative financial instrument | — | — | — | — | (12,836 | ) | (12,836 | ) | (12,836 | ) | ||||||||||||||
Total comprehensive loss | $ | (148,654 | ) | |||||||||||||||||||||
Common stock issued in connection with acquisitions and earn outs | 18,829 | 189 | 434,960 | — | — | 435,149 | ||||||||||||||||||
Non-cash compensation | — | — | 6,690 | — | — | 6,690 | ||||||||||||||||||
Common stock issued in connection with stock purchase/option plans | 1,228 | 12 | 10,479 | — | — | 10,491 | ||||||||||||||||||
BALANCE, December 31, 2006 | 105,672 | $ | 1,057 | $ | 1,450,754 | $ | (1,065,224 | ) | $ | (666 | ) | $ | 385,921 | |||||||||||
The accompanying notes to consolidated financial statements are an integral part of these consolidated financial statements.
SBA COMMUNICATIONS CORPORATION AND SUBSIDIARIES
CONSOLIDATED STATEMENTS OF CASH FLOWS
(in thousands)
| For the years ended December 31, | ||||||||||||
| 2003 | 2002 | 2001 | ||||||||||
CASH FLOWS FROM OPERATING ACTIVITIES: | ||||||||||||
Net loss | $ | (172,171 | ) | $ | (248,996 | ) | $ | (125,792 | ) | |||
Adjustments to reconcile net loss to net cash provided by (used in) operating activities: | ||||||||||||
Depreciation, accretion and amortization | 84,380 | 85,728 | 66,104 | |||||||||
Non-cash restructuring and other charges | 1,327 | 43,438 | 24,119 | |||||||||
Asset impairment charges | 16,965 | 25,545 | — | |||||||||
Non-cash items reported in discontinued operations (primarily depreciation, asset impairment charges and loss on sale of towers) | 9,837 | 16,600 | 12,604 | |||||||||
Non-cash compensation expense | 832 | 2,017 | 3,326 | |||||||||
Provision for doubtful accounts | 3,554 | 3,371 | 2,641 | |||||||||
Amortization of original issue discount and debt issuance costs | 11,011 | 33,518 | 29,730 | |||||||||
Write-off of deferred financing fees and loss on extinguishment of debt | 24,219 | — | 5,069 | |||||||||
Amortization of deferred gain from derivative | (676 | ) | (133 | ) | — | |||||||
Interest converted to term loan | 3,227 | — | — | |||||||||
Cumulative effect of changes in accounting principles | 545 | 60,674 | — | |||||||||
Changes in operating assets and liabilities, net of effect of acquisitions: | ||||||||||||
Short-term investments | (15,200 | ) | — | — | ||||||||
Accounts receivable | 13,129 | 17,133 | (3,972 | ) | ||||||||
Costs and estimated earnings in excess of billings on uncompleted contracts | 198 | 908 | 3,201 | |||||||||
Prepaid and other current assets | (343 | ) | 1,356 | (3,849 | ) | |||||||
Other assets | (4,176 | ) | (5,674 | ) | 2,721 | |||||||
Accounts payable | (5,758 | ) | (15,229 | ) | (12,183 | ) | ||||||
Accrued expenses | (54 | ) | (144 | ) | (2,417 | ) | ||||||
Deferred revenue | 1,466 | 761 | 6,113 | |||||||||
Interest payable | (2,387 | ) | 1,104 | 21,766 | ||||||||
Other liabilities | 1,052 | (230 | ) | (584 | ) | |||||||
Billings in excess of costs and estimated earnings on uncompleted contracts | (785 | ) | (3,940 | ) | 156 | |||||||
Total adjustments | 142,363 | 266,803 | 154,545 | |||||||||
Net cash provided by (used in) operating activities | (29,808 | ) | 17,807 | 28,753 | ||||||||
CASH FLOWS FROM INVESTING ACTIVITIES: | ||||||||||||
Proceeds from termination of interest rate swap agreement | — | 5,369 | — | |||||||||
Capital expenditures | (15,136 | ) | (86,361 | ) | (307,557 | ) | ||||||
Acquisitions and related earn-outs | (3,126 | ) | (29,724 | ) | (239,143 | ) | ||||||
Proceeds from sale of towers | 192,450 | — | — | |||||||||
Receipt (payment) of restricted cash | (18,732 | ) | 8,000 | (8,000 | ) | |||||||
Net cash provided by (used in) investing activities | 155,456 | (102,716 | ) | (554,700 | ) | |||||||
CASH FLOWS FROM FINANCING ACTIVITIES: | ||||||||||||
Proceeds from employee stock purchase/option plans | 31 | 329 | 3,250 | |||||||||
Proceeds from 9¾% senior discount notes payable, net of financing fees | 267,109 | — | — | |||||||||
Proceeds from 10¼% senior notes, net of financing fees | — | — | 484,223 | |||||||||
Borrowings under senior credit facility, net of financing fees | 356,955 | 143,809 | 134,430 | |||||||||
Repayment of senior credit facility and notes payable | (505,085 | ) | (445 | ) | (105,634 | ) | ||||||
Repurchase of senior discount notes and senior notes | (296,925 | ) | — | — | ||||||||
Payment of restricted stock guarantee | (936 | ) | — | — | ||||||||
| For the year ended December 31, | ||||||||||||
| 2006 | 2005 | 2004 | ||||||||||
CASH FLOWS FROM OPERATING ACTIVITIES: | ||||||||||||
Net loss | $ | (133,448 | ) | $ | (94,709 | ) | $ | (147,280 | ) | |||
Adjustments to reconcile net loss to net cash provided by operating activities: | ||||||||||||
Depreciation, accretion, and amortization | 133,088 | 87,218 | 90,549 | |||||||||
Deferred tax provision | 47 | — | — | |||||||||
Asset impairment and other (credits) charges | (357 | ) | 448 | 7,433 | ||||||||
(Gain) loss on sale of assets | (244 | ) | 79 | (158 | ) | |||||||
Non-cash compensation expense | 5,410 | 462 | 470 | |||||||||
Provision (credit) for doubtful accounts | 100 | (300 | ) | (287 | ) | |||||||
Accretion of interest income on short-term investments | (123 | ) | (145 | ) | — | |||||||
Amortization of original issue discount and deferred financing fees | 18,429 | 29,084 | 30,994 | |||||||||
Interest converted to term loan | — | — | 554 | |||||||||
Loss from write-off of deferred financing fees and extinguishment of debt | 57,233 | 29,271 | 41,197 | |||||||||
Amortization of deferred gain of derivative | (2,370 | ) | (346 | ) | (746 | ) | ||||||
Changes in operating assets and liabilities: | ||||||||||||
Short term investments | — | — | 15,200 | |||||||||
Accounts receivable | (2,144 | ) | 3,891 | (1,208 | ) | |||||||
Costs and estimated earnings in excess of billings on uncompleted contracts | 5,781 | (6,118 | ) | (8,839 | ) | |||||||
Prepaid and other current assets | 220 | 754 | 641 | |||||||||
Other assets | (9,927 | ) | (5,685 | ) | (3,759 | ) | ||||||
Accounts payable | (7,022 | ) | 138 | 3,559 | ||||||||
Accrued expenses | (1,370 | ) | 618 | (3,164 | ) | |||||||
Deferred revenue | 4,842 | (291 | ) | (493 | ) | |||||||
Interest payable | 176 | 151 | (15,732 | ) | ||||||||
Other liabilities | 7,975 | 5,106 | 5,202 | |||||||||
Billings in excess of costs and estimated earnings on uncompleted contracts | (336 | ) | 141 | 83 | ||||||||
Net cash provided by operating activities | 75,960 | 49,767 | 14,216 | |||||||||
CASH FLOWS FROM INVESTING ACTIVITIES: | ||||||||||||
Maturity of short term investments | 19,900 | — | — | |||||||||
Purchase of short term investments | — | (34,628 | ) | — | ||||||||
Sale of short term investment | — | 14,996 | — | |||||||||
Payment for purchase of AAT Communications, Corp., net of cash acquired | (644,441 | ) | — | — | ||||||||
Capital expenditures | (28,969 | ) | (19,648 | ) | (7,214 | ) | ||||||
Other acquisitions and related earn-outs | (81,089 | ) | (61,326 | ) | (1,791 | ) | ||||||
Proceeds from sale of fixed assets | 265 | 1,335 | 1,496 | |||||||||
(Payment) receipt of restricted cash relating to tower removal obligations | (5,542 | ) | (12 | ) | 8,835 | |||||||
Net cash (used in) provided by investing activities | (739,876 | ) | (99,283 | ) | 1,326 | |||||||
CASH FLOWS FROM FINANCING ACTIVITIES: | ||||||||||||
Proceeds from bridge financing, net of fees paid | 1,088,734 | — | — | |||||||||
Repayment of bridge financing | (1,100,000 | ) | — | — | ||||||||
Proceeds from CMBS Certificates, net of fees paid | 1,126,235 | 393,328 | — | |||||||||
Initial funding of restricted cash relating to CMBS Certificates | (7,494 | ) | (6,687 | ) | — | |||||||
Net increase in restricted cash relating to CMBS Certificates | (5,260 | ) | (11,250 | ) | — | |||||||
(Payment) proceeds relating to settlement of swap | (14,503 | ) | 14,774 | — | ||||||||
Proceeds from equity offering, net of fees paid | (707 | ) | 226,857 | — | ||||||||
Borrowings under senior credit facility, net of fees paid | (89 | ) | 25,321 | 363,457 | ||||||||
Repurchase of 9 3/4% senior discount notes | (251,826 | ) | (122,681 | ) | — | |||||||
Repurchase of 8 1/2% senior notes | (181,451 | ) | (94,938 | ) | — | |||||||
Proceeds from 8 1/2% senior notes, net of fees paid | — | (96 | ) | 244,788 | ||||||||
Repayment of senior credit facility | — | (350,375 | ) | (173,403 | ) | |||||||
Repurchase of 10 1/4% senior notes | — | (52,590 | ) | (320,553 | ) | |||||||
Repurchase of 12% senior discount notes | — | — | (70,794 | ) | ||||||||
Proceeds from employee stock purchase/stock option plans | 10,491 | 4,686 | 2,126 | |||||||||
Bank overdraft (repayments) borrowings | — | (526 | ) | 126 | ||||||||
Net cash provided by financing activities | 664,130 | 25,823 | 45,747 | |||||||||
NET INCREASE (DECREASE) IN CASH AND CASH EQUIVALENTS | 214 | (23,693 | ) | 61,289 | ||||||||
CASH AND CASH EQUIVALENTS: | ||||||||||||
Beginning of period | 45,934 | 69,627 | 8,338 | |||||||||
End of period | $ | 46,148 | $ | 45,934 | $ | 69,627 | ||||||
(continued)
SBA COMMUNICATIONS CORPORATION AND SUBSIDIARIES
CONSOLIDATED STATEMENTS OF CASH FLOWS (Continued)
(in thousands)
| For the years ended December 31, | ||||||||||||
| 2003 | 2002 | 2001 | ||||||||||
Bank overdraft borrowings (repayments) | 400 | (11,547 | ) | 8,602 | ||||||||
Net cash provided by (used in) financing activities | (178,451 | ) | 132,146 | 524,871 | ||||||||
Net increase (decrease) in cash and cash equivalents | (52,803 | ) | 47,237 | (1,076 | ) | |||||||
CASH AND CASH EQUIVALENTS: | ||||||||||||
Beginning of year | 61,141 | 13,904 | 14,980 | |||||||||
End of year | $ | 8,338 | $ | 61,141 | $ | 13,904 | ||||||
SUPPLEMENTAL DISCLOSURE OF CASH FLOW INFORMATION: | ||||||||||||
Cash paid during the year for: | ||||||||||||
Interest, net of amounts capitalized | $ | 84,847 | $ | 58,261 | $ | 25,943 | ||||||
Taxes | $ | 1,852 | $ | 1,502 | $ | 2,215 | ||||||
NON-CASH ACTIVITIES: | ||||||||||||
Assets acquired in connection with acquisitions | $ | — | $ | 3,396 | $ | 4,835 | ||||||
Liabilities assumed in connection with acquisitions | $ | — | $ | (2,000 | ) | $ | (3,685 | ) | ||||
Common stock issued in connection with acquisitions | $ | — | $ | (1,396 | ) | $ | (29,800 | ) | ||||
Class A common stock issued in exchange for 10¼% senior notes and accrued interest | $ | 12,631 | $ | — | $ | — | ||||||
10¼% senior notes and accrued interest redeemed for Class A common stock | $ | (13,713 | ) | $ | — | $ | — | |||||
| For the year ended December 31, | ||||||||||
| 2006 | 2005 | 2004 | ||||||||
SUPPLEMENTAL DISCLOSURE OF CASH FLOW INFORMATION: | ||||||||||
Cash paid during the period for: | ||||||||||
Interest | $ | 82,215 | $ | 40,744 | $ | 63,746 | ||||
Income taxes | $ | 1,158 | $ | 1,425 | $ | 971 | ||||
SUPPLEMENTAL CASH FLOW INFORMATION OF NON-CASH ACTIVITIES: | ||||||||||
Class A common stock issued relating to acquisitions and earnouts | $ | 435,857 | $ | 18,346 | $ | 3,007 | ||||
Class A common stock issued in exchange for 10 1/4% senior notes, 9 3/4% senior discount notes, and accrued interest | $ | — | $ | — | $ | 54,572 | ||||
10 1/4% senior notes and accrued interest exchanged for Class A common stock | $ | — | $ | — | $ | (51,433 | ) | |||
The accompanying notes to consolidated financial statements are an integral part of these consolidated financial statements.
SBA COMMUNICATIONS CORPORATION AND SUBSIDIARIES
NOTES TO CONSOLIDATED FINANCIAL STATEMENTS
1. GENERAL
SBA Communications Corporation (the “Company”"Company" or “SBA”"SBA") was incorporated in the State of Florida in March 1997. The Company is a holding company that holds all of the outstanding capital stock of SBA Telecommunications, Inc. (“Telecommunications”("Telecommunications"). Telecommunications is a holding company that holds all of the capital stock of SBA Senior Finance, Inc. (“SBA Senior Finance”). SBA Senior Finance is a holding company that holds, directly and indirectly, the equity interest in certain subsidiaries that issued the Commercial Mortgage Pass Through Certificates, Series 2005-1 (the “Initial CMBS Certificates”) and the Commercial Mortgage Pass Through Certificates, Series 2006-1 (the “Additional CMBS Certificates”) (collectively, the “CMBS Certificates”) and certain subsidiaries that were not involved in the issuance of the CMBS Certificates. With respect to the subsidiaries involved in the issuance of the CMBS Certificates, SBA Senior Finance is the sole member of SBA CMBS-1 Holdings LLC and SBA CMBS-1 Depositor LLC. SBA CMBS-1 Holdings is the sole member of SBA CMBS-1 Guarantor LLC. SBA CMBS-1 Guarantor LLC holds all of the capital stock of SBA Towers,Properties, Inc. (“SBA Properties”), SBA Properties,Towers, Inc. (“SBA Towers”), SBA Puerto Rico, Inc. (“SBA Puerto Rico”), SBA Sites, Inc. (“SBA Sites”), SBA Towers USVI, Inc. (“SBA Towers USVI”), and SBA Structures, Inc. (“SBA Structures”) (collectively known as the “Borrowers”). With respect to the subsidiaries not involved in the issuance of the CMBS Certificates, SBA Senior Finance holds all of the membership interests of SBA Senior Finance II LLC (“SBA Senior Finance II”) and certain non-operational subsidiaries. SBA Senior Finance II holds, directly and indirectly, all the capital stock and/or membership interests of certain other tower companies (“Other Tower Companies”) (collectively “Tower Companies”with the Borrowers known as "Tower Companies"),. SBA Leasing, Inc. (“Leasing”) andSenior Finance II also holds, directly or indirectly, all the capital stock and/or membership interests of certain other subsidiaries involved in providing services, including SBA Network Services, Inc. (“Network Services”). SBA Network Services, Inc.Senior Finance II also holds all of the capital stock of other companies engaged in similar businesses (collectively “Network Services”SBA Network Management, Inc. (“Network Management”). which manages and administers the operations of the Borrowers.
The table below outlines the legal structure of the Company at December 31, 2006:
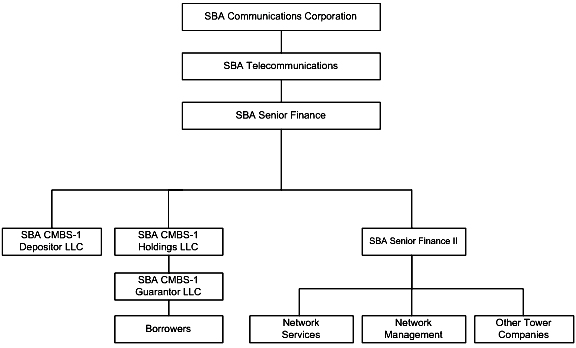
The Tower Companies own and operate transmission towers in the eastern third47 of the 48 contiguous United States, Puerto Rico and the U.S. Virgin Islands. Space on these towers is leased primarily to wireless communications carriers. The Borrowers own 4,975 towers, which are the collateral for the CMBS Certificates.
Leasing leases antenna tower sites from owners and then subleases such sites to wireless telecommunications providers.
Network Services provides comprehensive turnkey services for the telecommunications industry in the areas of site development services for wireless carriers and the construction and repair of transmission towers. Site development services provided by Network Services include network pre-design, site audits, site identification and acquisition, contract and title administration, zoning and land use permitting, construction management, microwave relocation and the construction and repair of transmission towers, including the hanging of antennas, cabling and associated tower components. In addition to providing turnkey services to the telecommunications industry, Network Services historically has constructed, or has overseen the construction of approximately 60%44% of the newly-builtnewly built towers that the Company owns.
During 2006, the Company completed the acquisition of all of the outstanding shares of common stock of AAT Communications Corp. (“AAT”) from AAT Holdings, LLC II, which the Company refers to as the AAT Acquisition. The total consideration paid was (i) $634.0 million in cash and (ii) 17,059,336 newly issued shares of our Class A common stock. In connection with the AAT Acquisition, the Company repurchased all of its outstanding 9 3/4% senior discount notes and 8 1/2% senior notes. The Company funded these repurchases, including the associated premiums and fees, and the cash consideration paid in the AAT Acquisition with a $1.1 billion bridge loan. On November 6, 2006, the Company issued $1.15 billion of Commercial Mortgage Pass Through Certificates, Series 2006-1, and used the proceeds to repay the bridge loan.
2. SUMMARY OF SIGNIFICANT ACCOUNTING POLICIES
A summary of the significant accounting policies applied in the preparation of the accompanying consolidated financial statements is as follows:
a. Basis of Consolidation
The consolidated financial statements include the accounts of the Company and all of its wholly-owned subsidiaries. All significant inter-company accounts and transactions have been eliminated in consolidation.
b. Use of Estimates
The preparation of the consolidated financial statements in conformity with accounting principles generally accepted in the United States requires management to make estimates and assumptions that affect the reported amounts of assets and liabilities and disclosure of contingent assets and liabilities at the dates of the financial statements and the reported amounts of revenues and expenses during the reporting periods. The more significant estimates made by management relate to the allowance for doubtful accounts, the costs and revenue relating to the Company’s site development andCompany's construction contracts, valuation allowance on deferred tax assets, carrying value of long-lived assets, the useful lives of towers and intangible assets, anticipated property tax assessments, and asset retirement obligations. Actual results will differ from those estimates and such differences could be material.
c. Cash Equivalents and Cash EquivalentsShort-Term Investments
The Company classifies as cash and cash equivalents all interest-bearing deposits orhighly liquid investments purchased with an original maturitiesmaturity of three months or less as cash equivalents. Marketable short-term investments are generally classified and highly liquidaccounted for as held-to-maturity. Investments in debt securities classified as held-to-maturity are reported at amortized cost plus accrued interest. The Company does not hold these securities for speculative or trading purposes. During 2005, the Company sold $15.0 million of short-term investments which were classified as held-to-maturity, the proceeds of which were used to fund acquisitions that closed in 2006. At December 31, 2005, short term investments were comprised of commercial paper.paper with a carrying amount of $19.8 million and had original maturities between three and four months. There were no short term investments at December 31, 2006.
d. Short Term InvestmentsRestricted Cash
The Company classifies all cash pledged as collateral to secure certain obligations and all cash whose use is limited as restricted cash. This includes cash held in escrow to fund certain reserve accounts relating to the CMBS Certificates, for payment and performance bonds, and surety bonds issued for the benefit of the Company in the ordinary course of business.
The Company’s short-term investments consist
In connection with the issuance of the CMBS Certificates, the Company is required to fund a restricted cash amount, which represents the cash held in escrow pursuant to the mortgage loan agreement governing the CMBS Certificates to fund certain reserve accounts for the payment of debt securities whichservice costs, ground rents, real estate and personal property taxes, insurance premiums related to tower sites, trustee and service expenses, and to reserve a portion of advance rents from tenants. Based on the terms of the CMBS Certificates, all rental cash receipts each month are acquiredrestricted and held for a short periodby the indenture trustee. The restricted cash held by the indenture trustee in excess of time. Trading securitiesrequired reserve balances is subsequently released to the Borrowers, on or before the 15 th calendar day following month end. All monies held by the indenture trustee after the release date are recorded at fair value. Investment income and unrealized holding gains and losses are included in earnings.
classified as restricted cash on the Company’s balance sheet.
e. e.Property and Equipment
Property and equipment are recorded at cost, adjusted for asset impairment and estimated asset retirement obligations. Costs associated with the acquisition, development and construction of towers are capitalized as a cost of the towers. Costs for self-constructed towers include direct materials and labor, indirect costs and capitalized interest. Depreciation on towers and related components is provided using the straight-line method over the estimated useful lives.lives, not to exceed the minimum lease term of the underlying ground lease. Leasehold improvements are amortized on a straight-line basis over the shorter of the useful life of the improvement or the minimum lease term of the lease. The Company defines the minimum lease term as the shorter of the period from lease inception through the end of the term of all tenant lease obligations in existence at ground lease inception, including renewal periods, or the ground lease term, including renewal periods.
If no tenant lease obligation exists at the date of ground lease inception, the initial term of the ground lease is considered the minimum lease term. All rental obligations due to be paid out over the minimum lease term, including fixed escalations are straight-lined evenly over the minimum lease term.
For all other property and equipment, depreciation is provided using the straight-line method over the estimated useful lives. The Company performs ongoing evaluations of the estimated useful lives of its property and equipment for depreciation purposes. The estimated useful lives are determined and continually evaluated based on the period over which services are expected to be rendered by the asset. If the useful lives of assets are reduced, depreciation may be accelerated in future years. Maintenance and repair items are expensed as incurred.
Asset classes and related estimated useful lives are as follows:
Towers and related components | ||
Furniture, equipment and vehicles | 2 - 7 years | |
Buildings and improvements | 5 |
Capitalized costs incurred subsequent to when an asset is originally placed in service are depreciated over the remaining estimated useful life of the respective asset. Changes in an asset’sasset's estimated useful life are accounted for prospectively, with the book value of the asset at the time of the change being depreciated over the revised remaining useful life. There has been no material impact for changes in estimated useful lives for any years presented.
Interest is capitalized in connection with the self-construction of Company-owned towers. Capitalized interest is recorded as part of the asset to which it relates and is amortized over the asset’sasset's estimated useful life. Approximately $0.1$0.4 million, $1.7$0.08 million and $3.9$0.01 million of interest cost was capitalized in 2003, 20022006, 2005, and 2001,2004, respectively. Approximately $1.9 million of capitalized interest was reclassified to discontinued operations in 2002. No capitalized interest was reclassified in 2003.
f. f.Deferred Financing Fees
Financing fees related to the issuance of debt have been deferred and are being amortized using a method that approximates the effective interest rate method over the expected length of indebtedness to which they relate.
related indebtedness.
g.Deferred Lease Costs
The Company defers certain initial direct costs associated with lease originationsthe origination of tenant leases and lease amendments and amortizes these costs over the initial lease term, generally five years.years, or over the lease term remaining if related to a lease amendment. Such costs deferred were approximately $2.8 million, $2.2 million, and $1.8 million in 2006, 2005, and 2004, respectively.
Amortization expense was $2.0 million, $1.7$1.8 million, and $1.6 million in 2003, 2002, and 2001, respectively. Amortization expense was $1.3 million, $0.8 million and $0.5 million for the years ended December 31, 2003, 20022006, 2005 and 2001,2004, respectively, and is included in cost of site leasing in the accompanying Consolidated Statements of Operations. As of December 31, 20032006 and 2002,2005, unamortized deferred lease costs were $4.1$5.5 million and $3.4$4.7 million, respectively, and are included in other assets. Accumulated amortization totaled $3.2 million and $1.6 million at December 31, 2003 and 2002, respectively.
h. Intangible Assets
IntangibleThe Company classifies as intangible assets are comprisedthe fair value of costs paidcurrent leases in place at the acquisition date of towers and related assets (referred to covenants notas the “current contract intangibles”), and the fair value of future tenant leases anticipated to compete.be added to the acquired towers (referred to as the “network location intangible”). These finite-lived intangibles are being amortizedestimated to have an economic useful life consistent with the economic useful life of the related tower assets, which is typically 15 years. For all intangible assets, amortization is provided using the straight line method over the termsestimated useful lives as the benefit associated with these intangible assets is anticipated to be derived evenly over the life of the contracts, which range from 3 to 5 years.
asset.
i. Goodwill
There was no goodwill at December 31, 2003 or 2002 or amortization of goodwill during 2003 and 2002, as a result of adopting the provisions of Statement of Financial Accounting Standards (“SFAS”) No. 142,Goodwill and Other Intangible Assets (“SFAS 142”) in 2002.
j. Impairment of Long-Lived Assets
In accordance with Statement of Financial Accounting Standards (“SFAS”)SFAS No. 144,Accounting for the Impairment ofor Disposal of Long-Lived Assets (“SFAS 144”), long-lived assets and definite lived intangibles are reviewed for impairment whenever events or changes in circumstances indicate that the carrying amount of an asset may not be recoverable. If an asset is determined to be impaired, the loss is measured by the excess of the carrying amount of the asset over its fair value as determined by an estimate of discounted future cash flows. Estimates and assumptions inherent in the impairment evaluation include, but are not limited to, general market conditions, historical operating results, tower lease-up potential and expected timing of lease-up.
k.j. Fair Value of Financial Instruments
The carrying values of the Company’sCompany's financial instruments, which primarily includes cash and cash equivalents, short-term investments, restricted cash, accounts receivable, prepaid expenses,and accounts payable, accrued expenses and notes payable, approximates fair value due to the short maturity of those instruments. The senior credit facility has a floating rate of interest and is carried at an amount which approximates fair value.
The Company’s 12% senior discount notes and 10¼% senior notes are publicly traded. The 9¾% senior discount notes were sold in December 2003 pursuant to Rule 144A of the Securities and Exchange Commission. Since the 9¾% senior discount notes are not registered, they are subject to certain restrictions on resale. The following table reflects yields, fair values as determined by quoted market prices and carrying values of these notes as of December 31, 20032006 and 2002:2005:
| As of December 31, 2003 | As of December 31, 2002 | |||||||||||||||||
| Yield | Fair Value | Carrying Value | Yield | Fair Value | Carrying Value | |||||||||||||
| (dollars in millions) | (dollars in millions) | |||||||||||||||||
12% Senior Discount Notes | 2.8 | % | $ | 71.6 | $ | 65.7 | 28.5 | % | $ | 145.1 | $ | 263.9 | ||||||
10¼% Senior Notes | 10.8 | % | $ | 398.3 | $ | 406.4 | 25.0 | % | $ | 275.0 | $ | 500.0 | ||||||
9¾% Senior Discount Notes | 8.8 | % | $ | 279.9 | $ | 275.8 | — | — | — | |||||||||
| At December 31, 2006 | At December 31, 2005 | |||||||||||
| Fair Value | Carrying Value | Fair Value | Carrying Value | |||||||||
| (in millions) | ||||||||||||
Additional CMBS Certificates | $ | 1,152.5 | $ | 1,150.0 | $ | — | $ | — | ||||
Initial CMBS Certificates | $ | 407.7 | $ | 405.0 | $ | 408.5 | $ | 405.0 | ||||
9 3/4% Senior Discount Notes | $ | — | $ | — | $ | 243.7 | $ | 216.9 | ||||
8 1/2% Senior Notes | $ | — | $ | — | $ | 181.2 | $ | 162.5 | ||||
l. k.Revenue Recognition and Accounts Receivable
Revenue from site leasing is recorded monthly and recognized on a straight-line basis over the term of the related lease agreements.agreements, which are generally five years. Receivables recorded related to the straight-lining of site leases isare reflected in prepaid and other current assets and other assets in the consolidated balance sheets.Consolidated Balance Sheets. Rental amounts received in advance are recorded as deferred revenue in the consolidated balance sheets.
Consolidated Balance Sheets.
Site development projects in which the Company performs consulting services include contracts on a time and materials basis or a fixed price basis. Time and materials based contracts are billed at contractual rates as the services are rendered. For those site development contracts in which the Company performs work on a fixed price basis, site development billing (and revenue recognition) is based on the completion of agreed upon phases of the project on a per site basis. Upon the completion of each phase on a per site basis, the Company recognizes the revenue related to that phase. Revenue related to services performed on
uncompleted phases of site development projects was not recorded by the Company at the end of the reporting periods presented as it was not material to the Company’s results of operations. Any estimated losses on a particular phase of completion are recognized in the period in which the loss becomes evident. Site development projects generally take from 3 to 12 months to complete.
Revenue from construction projects is recognized on the percentage-of-completion method of accounting, determined by the percentage of cost incurred to date compared to management’smanagement's estimated total cost for each contract. This method is used because management considers total cost to be the best available measure of progress on the contracts. These amounts are based on estimates, and the uncertainty inherent in the estimates initially is reduced as work on the contracts nears completion. The asset “Costs"costs and estimated earnings in excess of billings on uncompleted contracts”contracts" represents expenses incurred and revenues recognized in excess of amounts billed. The liability “Billings"billings in excess of costs and estimated earnings on uncompleted contracts”contracts" represents billings in excess of revenues recognized. Provisions for estimated losses on uncompleted contracts are made in the period in which such losses are determined to be probable.
Cost of site leasing revenue includes ground lease rent, property taxes, maintenance (exclusive of employee related costs) and other tower operating expenses. Liabilities recorded related to the straight lining of ground leases are reflected in other long term liabilities on the Consolidated Balance Sheet. Cost of site development revenue includes allthe cost of materials, costs, salaries and labor costs, including payroll taxes, subcontract labor, vehicle expense and other costs directly and indirectly related to the projects. All costs related to site development projects are recognized as incurred.
The Company performs periodic credit evaluations of its customers. The Company continuously monitors collections and payments from its customers and maintains a provision for estimated credit losses based upon historical experience, specific customer collection issues identified and past due balances as determined based on contractual terms. Interest is charged on outstanding receivables from customers on a case by case basis in accordance with the terms of the respective contracts or agreements with those customers. Amounts determined to be uncollectible are written off against the allowance for doubtful accounts in the period in which uncollectability is determined to be probable. If the capital markets and the ability of wireless carriers to access capital were to deteriorate, the ultimate collectability of accounts receivable may be negatively impacted.
m. Selling, General and Administrative Expenses
Selling, general and administrative expenses represent those costs incurred which are related to the administration or managementThe following is a rollforward of the Company. Also included in this category are corporate development expenses incurred in the normal course of business that represent costs incurred in connection with proposed acquisitions which have not been consummated, new build activities where a capital asset is not produced, and expansion of the customer base. The above costs are expensed as incurred. There were no corporate development expenses in 2003 or 2002. Development expenses included in selling, general and administrative were $4.2 millionallowance for doubtful accounts for the yearyears ended December 31, 2001.2006, 2005, and 2004:
| For the year ended December 31, | ||||||||||||
| 2006 | 2005 | 2004 | ||||||||||
| (in thousands) | ||||||||||||
Beginning balance | $ | 1,136 | $ | 1,731 | $ | 1,400 | ||||||
Allowance recorded relating to Acquisition of AAT | 1,000 | — | — | |||||||||
Provision (credits) for doubtful accounts | 100 | (300 | ) | (287 | ) | |||||||
Write-offs, net of recoveries | (920 | ) | (295 | ) | 618 | |||||||
Ending balance | $ | 1,316 | $ | 1,136 | $ | 1,731 | ||||||
n.l. Income Taxes
The Company accounts for income taxes in accordance with the provisions of SFAS No. 109,Accounting for Income Taxes (“(“SFAS 109”). SFAS 109 requires the Company to recognize deferred tax liabilities and assets for the expected future income tax consequences of events that have been recognized in the Company’sCompany's consolidated financial statements. Deferred tax liabilities and assets are determined based on the temporary differences between the consolidated financial statements carrying amounts and the tax bases of assets and liabilities, using enacted tax rates in the years in which the temporary differences are expected to reverse. In assessing the likelihood of utilization of existing deferred tax assets, management has considered historical results of operations and the current operating environment.
As a result of the acquisition of AAT by the Company, AAT underwent an ownership change as defined by Section 382 of the Internal Revenue Code (“IRC”). Section 382 imposes limitations on the use of net operating loss (“NOL”) carry forwards if there has been an “ownership change.” Therefore, the amount of the Company’s taxable income for any post-change year that may be offset by AAT’s pre-change net operating losses cannot exceed AAT’s Section 382 limitation for the year. In the current and future tax years limited by Section 382, the Company estimates that it will have sufficient net operating losses available to offset taxable income.
o.m. Stock-Based Compensation
In December 2002, the FASB issued SFAS 148,Accounting for Stock-Based Compensation—Transition and Disclosure—an Amendment of SFAS 123 (“SFAS 148”) which provides alternative methods for a voluntary change to the fair value method of accounting for stock-based employee compensation and amends the disclosure requirements of SFAS 123,Accounting for Stock-Based Compensation. The Company has
elected to continue to account for its stock-based employee compensation plans under APB 25,Accounting for Stock Issued to Employees (“APB 25”), and related interpretations and adopt the disclosure provisions of SFAS 148.
p. Loss Per Share
Basic and diluted loss per share are calculated in accordance with SFAS No. 128,Earnings per Share. Weighted average shares outstanding include the effect of shares issuable under acquisition earn-out obligations. The Company has potential common stock equivalents related to its outstanding stock options. These potential common stock equivalents were not included in diluted loss per share because the effect would have been anti-dilutive. Accordingly, basic and diluted loss per common share and the weighted average number of shares used in the computations are the same for all periods presented. There were 3.8 million, 2.8 million and 3.8 million options outstanding at December 31, 2003, 2002, and 2001, respectively.
q. Comprehensive Loss
During the years ended December 31, 2003, 2002, and 2001, the Company did not have any changes in its equity resulting from non-owner sources and, accordingly, comprehensive loss was equal to the net loss amounts presented for the respective periods in the accompanying Consolidated Statements of Operations.
r. Reclassifications
Certain reclassifications have been made to the 2002 and 2001 consolidated financial statements to conform to the 2003 presentation.
3. DISCONTINUED OPERATIONS
In March 2003 certain of the Company’s subsidiaries entered into a definitive agreement (the “Western tower sale”) to sell up to an aggregate of 801 towers, which represented substantially all of the Company’s towers in the Western two-thirds of the United States. The Company ultimately sold 784 of the 801 towers. Gross proceeds realized during 2003 from the sale of the 784 towers was $196.7 million, subject to certain remaining potential adjustments. At December 31, 2003, approximately $7.3 million of the proceeds were held by an escrow agent in accordance with adjustment provisions of the agreement. At December 31, 2003, the Company had recorded a liability of approximately $2.6 million for the estimated remaining potential adjustments associated with the Western tower sale which is reflected in accrued expenses in the December 31, 2003 Consolidated Balance Sheet. Accordingly, we estimate that the final gross cash proceeds to be realized from the Western tower sale, after all potential remaining purchase price adjustments, will be approximately $194.1 million.
In consideration of the Company’s recent Western tower sale, the Company evaluated the scope and operating plan with respect to its 64 remaining towers in the same U.S. geographic market as the 784 towers sold. This evaluation resulted in the Company’s decision to sell all tower operations in this geographic market. The Company has begun to market these towers for sale on its own and believes that the activities necessary to sell the towers will be completed within one year. As a result of this decision, the Company has accounted for the remaining 64 towers as discontinued operations, which includes the 17 towers subsequently excluded from the original 801 Western tower sale. During 2003, the Company sold 3 of the 64 towers held for sale leaving 61 towers held for sale as of December 31, 2003.
The Company evaluated these 61 towers for impairment. The December 31, 2003 loss from discontinued operations includes a $4.5 million asset impairment charge associated with the write-down of the carrying value of these towers to their fair value less estimated costs to sell.
In accordance with SFAS No. 144, the Company has classified the operating results of the 784 towers sold in the Western tower sale and 64 remaining western
towers as discontinued operations in the accompanying Consolidated Financial Statements. All prior periods have been reclassified to conform to the current year presentation.
The discontinued operations affect only the Company’s site leasing segment. The following is a summary of the operating results of the discontinued operations:
| For the years ended December 31, | ||||||||||||
| 2003 | 2002 | 2001 | ||||||||||
| (in thousands) | ||||||||||||
Revenues | $ | 11,198 | $ | 24,542 | $ | 17,672 | ||||||
Site leasing gross profit | $ | 7,049 | $ | 15,564 | $ | 11,607 | ||||||
Loss from discontinued operations, net of income taxes | $ | (5,605 | ) | $ | (3,717 | ) | $ | (2,201 | ) | |||
Loss on disposal of discontinued operations, net of income taxes | (2,085 | ) | — | — | ||||||||
Loss from discontinued operations, net of income taxes | $ | (7,690 | ) | $ | (3,717 | ) | $ | (2,201 | ) | |||
A portion of the Company’s interest expense has been allocated to discontinued operations based upon the debt balance attributable to those operations. Interest expense allocated to discontinued operations was $0.8 million and $1.4 million for the years ended December 31, 2003 and 2002, respectively. No interest expense was allocated to discontinued operations in 2001 as there was no associated debt outstanding during 2001.
The following is a summarized balance sheet presenting the carrying amounts of the major classes of assets and liabilities related to the towers held for sale and classified as discontinued operations as of December 31, 2003 and 2002, respectively:
| As of December 31, | ||||||
| 2003 | 2002 | |||||
| (in thousands) | ||||||
Property and equipment, net | $ | 148 | $ | 198,259 | ||
Other assets | 247 | 4,150 | ||||
Assets held for sale | $ | 395 | $ | 202,409 | ||
Liabilities held for sale | $ | 608 | $ | 2,685 | ||
The notes to the consolidated financial statements for all years presented have been adjusted for the discontinued operations described above.
4. ACCOUNTING PRONOUNCEMENTS
In October 2001, the FASB issued SFAS No. 143,Accounting for Asset Retirement Obligations (“SFAS 143”). This standard requires companies to record the fair value of a liability for an asset retirement obligation in the period in which it is incurred. When the liability is initially recorded, we capitalize a cost by increasing the carrying amount of the related long-lived asset. Over time, the liability is accreted to its present value each period, and the capitalized cost is depreciated over the useful life of the related asset. Upon settlement of the liability, we either settle the obligation for its recorded amount or incur a gain or loss upon settlement. We adopted this standard effective January 1, 2003. As a result of our obligation to restore leaseholds to their original condition upon termination of ground leases underlying a majority of our towers and our estimate as to the probability of incurring these obligations, we recorded a cumulative effect adjustment of approximately $0.5 million during the first quarter of 2003. The adoption of SFAS 143 resulted in an increase in tower fixed assets of approximately $0.9 million and the recording of an asset retirement obligation liability of approximately $1.4 million.
In April 2002, the FASB issued SFAS No. 145,Rescission of FASB Statements Nos. 4, 44 and 62, Amendment of SFAS No. 13 and Technical Corrections (“SFAS 145”). SFAS 145 requires gains and losses on extinguishments of debt to be classified as income or loss from continuing operations rather than as extraordinary items as previously required under SFAS 4. Extraordinary treatment is required for certain extinguishments as provided in APB Opinion No. 30. The statement also amended SFAS 13 for certain sale-
leaseback and sublease accounting. We adopted the provisions of SFAS 145 effective January 1, 2003. Pursuant to SFAS 145, our previously reported extraordinary item of $5.1 million, related to the early extinguishment of debt, was reclassified to operating expense in the accompanying December 31, 2001 Consolidated Statement of Operations.
In July 2002, the FASB issued SFAS No. 146,Accounting for Costs Associated with Exit or Disposal Activities (“SFAS 146”) and nullified EITF Issue No. 94-3. SFAS 146 requires that a liability for a cost associated with an exit or disposal activity be recognized when the liability is incurred, whereas EITF No. 94-3 had recognized the liability at the commitment date to an exit plan. SFAS 146 requires that the initial measurement of a liability be at fair value. We adopted the provisions of SFAS 146 effective January 1, 2003. The adoption of SFAS 146 did not have a material effect on our consolidated financial statements.
In December 2002, the FASB issued SFAS No. 148. SFAS 148 provides alternative methods of transition for a voluntary change to the fair value based method of accounting for stock-based employee compensation. This statement also amends the disclosure requirements of SFAS 123 to require disclosures in both annual and interim financial statements regarding the method of accounting for stock-based employee compensation and the effect of the method used on reported results. The standard is effective for fiscal years beginning after December 15, 2002. We adopted the disclosure-only provisions of SFAS 148 as of December 31, 2002. We will continue to account for stock-based compensation in accordance with APB 25. As such, we do not expect this standard will have a material impact on our consolidated financial position or results of operations.
In April 2003, the FASB issued SFAS No. 149 (“SFAS 149”),Amendment of Statement 133 on Derivative Instruments and Hedging Activities. This Statement amends and clarifies financial accounting and reporting for derivative instruments, including certain derivative instruments embedded in other contracts (collectively referred to as derivatives) and for hedging activities under Statement of Financial Accounting Standards No. 133 (“SFAS 133”),Accounting for Derivative Instruments and Hedging Activities.The statement was effective for contracts entered into or modified after June 30, 2003. The adoption of this standard did not have a material impact on our financial position or results of operations.
In May 2003, the FASB issued SFAS No. 150 (“SFAS 150”),Accounting for Certain Financial Instruments with Characteristics of Both Liabilities and Equity. This Statement establishes standards for how an issuer classifies and measures certain financial instruments with characteristics of both liabilities and equity. It requires that an issuer classify a financial instrument that is within its scope as a liability (or an asset in some circumstances). This standard was effective at the beginning of the first interim period beginning after June 15, 2003, except for mandatorily redeemable financial instruments of nonpublic entities that are subject to the provisions of this Statement for the first fiscal period beginning after December 15, 2003. The adoption of this standard did not have a material impact on our financial position or results of operations.
In November 2002, the FASB issued FASB Interpretation No. 45 (“FIN 45”),Guarantor’s Accounting and Disclosure Requirements for Guarantees, Including Indirect Guarantees of Indebtedness of Others.FIN 45 elaborates on the disclosures to be made by a guarantor in its interim and annual financial statements about its obligations under certain guarantees that it has issued. FIN 45 also clarifies requirements for the recognition of guarantees at the onset of an arrangement. The initial recognition and measurement provisions of FIN 45 are applicable on a prospective basis to guarantees used or modified after December 31, 2002. The disclosure requirements of FIN 45 are effective for interim or annual financial statements after December 15, 2002. We implemented the disclosure requirements of FIN 45 as of December 31, 2002 and there was no material impact on our consolidated financial statements as a result of this implementation.
In January 2003, the FASB issued Interpretation No. 46,Consolidation for Variable Interest Entities, an Interpretation of ARB No. 51 which requires all variable interest entities (“VIES”) to be consolidated by the primary beneficiary. The primary beneficiary is the entity that holds the majority of the beneficial interest in the VIE. In addition, the interpretation expands the disclosure requirements for both variable interest entities that are consolidated as well as VIEs from which the entity is the holder of a significant amount of beneficial
interests, but not the majority. FIN 46 is effective immediately for all VIEs and for all special purpose entities created or acquired after January 31, 2003. For VIEs created or acquired prior to February 1, 2003, the provisions of FIN 46 must be applied for the first quarter ended March 31, 2004. The adoption of FIN 46 did not have, nor is it expected to have, a material impact on the consolidated financial statements.
5. CUMULATIVE EFFECT OF CHANGES IN ACCOUNTING PRINCIPLES
a. SFAS 143
Effective January 1, 2003,2006, the Company adopted the provisions of SFAS 143.No. 123R (“SFAS 123R”), “Share-Based Payments,” which requires the measurement and recognition of compensation expense for all share-based payment awards to employees and directors based on estimated fair values. SFAS 123R supersedes the Company’s previous accounting methodology using the intrinsic
value method under APB Opinion No. 25 (“APB 25”). The Company accounts for stock issued to non-employees in accordance with the provisions of Emerging Issues Task Force (“EITF”) Issue No. 96-18, “Accounting for Equity Instruments That Are Issued to Other Than Employees for Acquiring, or in Conjunction with Selling Goods or Services.”
The Company adopted SFAS 123R using the modified prospective transition method. Under this transition method, compensation expense recognized during the new accounting principle, year ended December 31, 2006 included: (a) compensation expense for all share-based awards granted prior to, but not yet vested, as of December 31, 2005, based on the grant date fair value estimated in accordance with the original provisions of SFAS 123, and (b) compensation expense for all share-based awards granted subsequent to December 31, 2005, based on the grant date fair value estimated in accordance with the provisions of SFAS 123R. In accordance with the modified prospective transition method, the Company’s Consolidated Financial Statements for prior periods have not been restated to reflect the impact of SFAS 123R.
On November 10, 2005, the FASB issued FASB Staff Position No. FAS 123R-3, “Transition Election Related to Accounting for Tax Effects of Share-Based Payment Awards.” The Company has elected to adopt the alternative transition method provided in the FASB Staff Position for calculating the tax effects of share-based compensation pursuant to SFAS 123R. The alternative transition method includes simplified methods to establish the beginning balance of the additional paid-in capital pool (“APIC Pool”) related to the tax effects of employee share-based compensation, and to determine the subsequent impact on the APIC Pool and consolidated statements of cash flows of the tax effects of employee and director share-based awards that are outstanding upon adoption of SFAS 123R.
n. Asset Retirement Obligations
Under SFAS 143,“Accounting for Asset Retirement Obligations”,the Company recognizes asset retirement obligations in the period in which they are incurred, if a reasonable estimate of a fair value can be made, and accretes such liability through the obligation’s estimated settlement date. The associated asset retirement costs are capitalized as part of the carrying amount of the related tower fixed assets and depreciated over the estimated useful life.
The Company has entered into ground leases for the land underlying the majority of the Company’s towers. A majority of these leases require the Company to restore leaseholds to their original condition upon termination of the ground lease. SFAS 143 requires that the net present value of future restoration obligations be recorded as a liability as of the date the legal obligation arises and this amount be capitalized to the related operating asset. At January 1, 2003, the effective date of adoption, the cumulative effect of the change on prior years resulted in a charge of approximately $0.5 million ($0.01 per share), which is included in net loss for the year ended December 31, 2003. In addition, at the date of adoption, the Company recorded an increase in tower assets of approximately $0.9 million and recorded an asset retirement obligation liability of approximately $1.4 million. The asset retirement obligation at December 31, 2003 of $1.22006 and December 31, 2005 was $2.6 million and $0.9 million, respectively and is included in other long-term liabilities in the December 31, 2003 Consolidated Balance Sheet. In determining the impact of SFAS 143, the Company considered the nature and scope of legal restoration obligation provisions contained in its third party ground leases, the historical retirement experience as an indicator of future restoration probabilities, intent in renewing existing ground leases through lease termination dates, current and future value and timing of estimated restoration costs, and the credit adjusted risk-free rate used to discount future obligations.
The following pro-forma summary presents the Company’s loss from continuing operations, net loss and related loss per share information as if the Company had been accounting for asset retirement obligations under SFAS 143 for the periods presented:
| For the years ended December 31, | ||||||||
| 2002 | 2001 | |||||||
| (in thousands, except per share data) | ||||||||
Loss from continuing operations before cumulative effect of changes in accounting principles | $ | (184,794 | ) | $ | (123,748 | ) | ||
Per share loss from continuing operations before cumulative effect of changes in accounting principles | $ | (3.66 | ) | $ | (2.62 | ) | ||
Net loss | $ | (249,206 | ) | $ | (125,970 | ) | ||
Per share net loss | $ | (4.94 | ) | $ | (2.66 | ) | ||
The following summarizes the activity of the asset retirement obligation liability:
| For the years ended December 31, | For the year ended December 31, | |||||||||||||||
| 2003 | 2002 | 2006 | 2005 | |||||||||||||
| (in thousands) | (in thousands) | |||||||||||||||
Asset retirement obligation at January 1 | $ | — | $ | 957 | $ | 942 | $ | 1,404 | ||||||||
Liability recorded in transition | 1,140 | — | ||||||||||||||
AAT fair value of liability assumed | 1,322 | — | ||||||||||||||
Amounts added from Acquired towers | 223 | 61 | ||||||||||||||
Amounts utilized in tower removals | (4 | ) | (1 | ) | ||||||||||||
Accretion expense | 119 | 130 | 172 | 22 | ||||||||||||
Revision in estimates | (64 | ) | (38 | ) | (23 | ) | (544 | ) | ||||||||
Asset retirement obligation at December 31 | $ | 1,195 | $ | 1,049 | $ | 2,632 | $ | 942 | ||||||||
b. SFAS 142o. Loss Per Share
During 2002,Basic and diluted loss per share is calculated in accordance with SFAS No. 128,Earnings per Share.The Company has potential common stock equivalents related to its outstanding stock options. These potential common stock equivalents were not included in diluted loss per share because the effect would have been anti-dilutive. Accordingly, basic and diluted loss per common share and the weighted average number of shares used in the computations are the same for all periods presented. There were 4.2 million, 4.6 million and 4.4 million options outstanding at December 31, 2006, 2005, and 2004, respectively. For the year ended December 31, 2006, the Company completedgranted approximately 1.1 million options at exercise prices between $19.10 and $26.36 per share, which was the transitional impairment testfair market value at the date of goodwill required under SFAS 142,grant.
Goodwillp. Comprehensive Income (Loss)
Comprehensive income (loss) is defined as the change in equity (net assets) of a business enterprise during a period from transactions and other Intangible Assetsevents and circumstances from non-owner sources, and is comprised of net income (loss) and “other comprehensive income (loss).” Comprehensive loss is presented in the Consolidated Statements of Shareholders’ Equity (Deficit).
3. CURRENT ACCOUNTING PRONOUNCEMENTS AND RECENT DEVELOPMENTS
Current Accounting Pronouncements(
In September 2006, the SEC issued Staff Accounting Bulletin (“SAB”) 108, “SFAS 142”Considering the Effects of Prior Year Misstatements when Quantifying Misstatements in Current Year Financial Statements” (“SAB 108”), which. SAB 108 was adoptedissued to provide interpretive guidance on how the effects of the carryover or reversal of prior year misstatements should be considered in quantifying a current year misstatement. SAB 108 requires the use of both the “iron curtain” and “rollover” approach in quantifying the materiality of misstatements. SAB 108 is effective January 1, 2002.for annual financial statements covering the first fiscal year ending after November 15, 2006. Early adoption of SAB 108 is permitted. The Company elected to adopt SAB 108 effective September 30, 2006. Upon initial application of SAB 108, the Company evaluated the uncorrected financial statement misstatements that were previously considered immaterial under the “rollover” method using the dual methodology required by SAB 108. As a result of completingthis dual methodology approach of SAB 108, the requiredCompany corrected the cumulative error in its accounting for equity-based compensation for periods prior to January 1, 2006 (discussed more fully below under “Recent Developments”) in accordance with the transitional test,guidance in SAB 108.
In September 2006, the Financial Accounting Standards Board (“FASB”) issued Statement of Financial Accounting Standard (“SFAS”) No. 157, “Fair Value Measurements,” (“SFAS No. 157”) which defines fair value, establishes guidelines for measuring fair value and expands disclosures regarding fair value measurements. SFAS No. 157 is effective for fiscal years beginning after November 15, 2007. The Company is currently evaluating what impact, if any, the adoption of SFAS No. 157 will have on its consolidated financial condition, results of operations or cash flows.
In September 2006, the FASB issued SFAS No. 158, “Employer’s Accounting for Defined Benefit Pension and Other Postretirement Plans (an amendment of FASB Statements No. 87, 88, 106, and 132(R)” (“SFAS No. 158”). Among other items, SFAS No. 158 requires recognition of the overfunded or underfunded status of an entity’s defined benefit postretirement plan as an asset or liability in the financial statements, requires the measurement of defined benefit postretirement plan assets and obligations as of the end of the employer’s fiscal year, and requires recognition of the funded status of defined benefit postretirement plans in other comprehensive income. SFAS No. 158 is effective for fiscal years ending after December 15, 2006. The Company adopted SFAS No. 158 on December 31, 2006. The Company currently measures the funded status of its plan as of the date of its year-end statement of financial position. See Note 21 for further discussion regarding the adoption of SFAS No.158.
In July 2006, FASB issued FASB Interpretation Number 48, Accounting for Uncertainty in Income Taxes, an Interpretation of FASB Statement No. 109, (“FIN No. 48”). FIN No. 48 prescribes a recognition threshold and measurement attribute for the financial statement recognition and measurement of a tax position taken in a tax return. The Company must determine whether it is “more-likely-than-not” that a tax position will be sustained upon examination, including resolution
of any related appeals or litigation processes, based on the technical merits of the position. Once it is determined that a position meets the more-likely-than-not recognition threshold, the position is measured to determine the amount of benefit to recognize in the financial statements. FIN No. 48 applies to all tax positions related to income taxes subject to FASB Statement No. 109, Accounting for Income Taxes. The interpretation clearly scopes out income tax positions related to FASB Statement No. 5, Accounting for Contingencies. This statement is effective for fiscal years beginning after December 15, 2006. The cumulative effect of applying the provisions of FIN No. 48 will be reported as an adjustment to the opening balance of retained earnings on January 1, 2007. The Company adopted the provisions of this statement beginning in the first quarter of 2007. The adoption of FIN No. 48 is not expected to have a material impact on the Company’s results of operation or financial position.
In February 2006, FASB issued SFAS No. 155, “Accounting for Certain Hybrid Financial Instruments—an Amendment of FASB Statements No. 133 and 140” (“SFAS No. 155”). SFAS No. 155 allows financial instruments that contain an embedded derivative and that otherwise would require bifurcation to be accounted for as a whole on a fair value basis, at the holders’ election. SFAS No. 155 also clarifies and amends certain other provisions of SFAS No. 133 and SFAS No. 140. This statement is effective for all financial instruments acquired or issued in fiscal years beginning after September 15, 2006. The adoption of SFAS No. 155 is not expected to have a material impact on the Company’s results of operations or financial position.
Recent Developments
The Company has undertaken a comprehensive review of the Company’s stock option grant practices, including a review of its underlying stock option grant documentation and procedures and related accounting. This review was initiated voluntarily by management of the Company on September 26, 2006 following the public release of a letter dated September 19, 2006 from the SEC’s Office of Chief Accountant, which provided further interpretive guidance related to stock option granting practices. Management’s findings and conclusions have been reviewed by outside legal counsel and the Company’s internal auditors, and have been presented to the Company’s Board of Directors. Both outside counsel and internal audit reviewed such documentation and interviewed such persons as they deemed necessary to reach their own conclusions with respect to the matters reviewed by management.
This review identified various deficiencies in the historical process of granting and documenting stock options. The Company believes that, with respect to certain stock option grants, (i) the proper measurement date for accounting purposes differs from the measurement dates used by SBA, and (ii) the Company incorrectly accounted for options held by persons who served as independent contractors of SBA. During its review, management did not identify any evidence of fraudulent conduct relating to stock option grants. As a result of these findings, the Company has determined that from fiscal 1999 through the end of fiscal year 2005, it had unrecorded non-cash equity-based compensation charges of $8.4 million.
Pursuant to SAB 108, the Company corrected the aforementioned cumulative error in its accounting for equity-based compensation by recording a non-cash cumulative effect adjustment of $8.4 million to additional paid-in capital with an offsetting amount of $7.7 million to accumulated deficit within shareholders’ equity as well as adjustments to property and equipment in the amount of $0.4 million and intangible assets of $0.3 million in its consolidated balance sheet as of December 31, 2006. The capitalized amounts relate to acquisition related costs. For additional discussion regarding the adoption of SAB 108 and its implications, please see “Current Accounting Pronouncements” above.
In connection with the year ended December 31, 2006, the Company recorded a non-cash equity adjustment of $0.9 million to additional paid-in capital within shareholders’ equity with an off-setting adjustment to property and equipment of $0.4 million and intangible assets of $0.3 million in the consolidated balance sheet as of December 31, 2006 and a $0.2 million charge retroactive toin the consolidated statement of operations for the year ended December 31, 2006. The 2006 adjustment above is not a result of the adoption date for the cumulative effect of the accounting change in the amount of $60.7 million, representing the excess of the carrying value of certain assets as compared to their estimated fair value. Of the total $60.7 million cumulative effect adjustment, $58.5 million related to the site development construction reporting segment and $2.2 million related to the site leasing reporting segment. In addition, during 2002, the Company recorded additional goodwill totaling approximately $9.2 million resulting from the achievement of certain earn-out obligations under various construction acquisition agreements entered into prior to July 1, 2001, which was determined to be impaired during 2002 and written off (See Note 18). The Company currently does not have any remaining goodwill or other intangible assets subject to SFAS 142.SAB 108.
The following unaudited pro forma summary presents the Company’s net loss and per share information as if the Company had been accounting for its goodwill under SFAS 142 for all periods presented:
| For the years ended December 31, | ||||||||
| 2002 | 2001 | |||||||
| (in thousands, except per share data) | ||||||||
Reported net loss | $ | (248,996 | ) | $ | (125,792 | ) | ||
Cumulative effect of change in accounting principle | 60,674 | — | ||||||
Loss excluding cumulative effect of change in accounting principle | (188,322 | ) | (125,792 | ) | ||||
Add back goodwill amortization | — | 3,802 | ||||||
Adjusted net loss | $ | (188,322 | ) | $ | (121,990 | ) | ||
Reported basic and diluted loss per share | $ | (4.93 | ) | $ | (2.66 | ) | ||
Cumulative effect of change in accounting principle | 1.20 | — | ||||||
Loss per share excluding cumulative effect of change in accounting principle | (3.73 | ) | (2.66 | ) | ||||
Add back goodwill amortization | — | .08 | ||||||
Adjusted net loss per share | $ | (3.73 | ) | $ | (2.58 | ) | ||
6. SHORT-TERM INVESTMENTS
The carrying value of short-term investments of $15.2 million equaled the fair value of these investments at December 31, 2003. In January 2004 these investments were sold for their face value plus accrued interest.
7.4. RESTRICTED CASH
Restricted cash at December 31, 2003 was $18.7 million. Thisconsists of the following:
| As of December 31, 2006 | As of December 31, 2005 | Included on Balance Sheets | ||||||
| (in thousands) | ||||||||
CMBS Certificates | $ | 30,690 | $ | 17,937 | restricted cash - current asset | |||
Payment and performance bonds | 3,713 | 1,575 | restricted cash - current asset | |||||
Surety bonds | 13,696 | 10,291 | Other assets - noncurrent | |||||
Total restricted cash | $ | 48,099 | $ | 29,803 | ||||
In connection with the issuance of the CMBS Certificates, the Company is required to fund a restricted cash amount, which represents the cash held in escrow pursuant to the mortgage loan agreement governing the CMBS Certificates to fund certain reserve accounts for the payment of debt service costs, ground rents, real estate and personal property taxes, insurance premiums related to tower sites, trustee and service expenses, and to reserve a portion of advance rents from tenants. Based on the terms of the CMBS Certificates, all rental cash receipts each month are restricted and held by the indenture trustee. The restricted cash held by the indenture trustee in excess of required reserve balances is subsequently released to the Borrowers on or before the 15th calendar day following month end. All monies held by the indenture trustee after the release date are classified as restricted cash on the Company’s balance includes $11.4 million of cashsheet.
Payment and performance bonds relate primarily to collateral requirements relating to tower construction currently in process by the Company. Cash pledged as collateral to secure certain obligations of the Company and certain of its affiliates related to surety bonds are issued for the benefit of the Company or its affiliates in the ordinary course of business. Approximately $8.4 millionbusiness which primarily relate to the Company’s tower removal obligations.
5. ACQUISITIONS
AAT Acquisition
On April 27, 2006, a subsidiary of SBA Communications acquired 100 percent of the collateral relatesoutstanding common stock of AAT Communications Corporation from AAT Holdings, LLC II. AAT owned 1,850 tower sites in the United States. The acquisition provides the Company with a nationwide platform to tower removal obligations, is long-termpursue its asset growth strategy and allows the Company to leverage its fixed overhead costs.
Pursuant to the terms of the Stock Purchase Agreement, the Company paid cash of $634.0 million and issued 17,059,336 shares of the Company’s Class A common stock, valued at $392.7 million based on the average market price of the Company’s Class A common stock over the 5-trading day period ended March 21, 2006. The Company incurred approximately $10.4 million in nature, and isacquisition related costs in connection with the AAT Acquisition. The results of AAT’s operations have been included in other assets in the December 31, 2003 Consolidated Balance Sheet. Approximately $3.0 millionconsolidated financial statements since the date of acquisition. The Company has accounted for the collateral relates to payment and performance bonds, which are shorter term in nature and are included in restricted cash and reflected as a current asset. The remaining $7.3 millionacquisition under the purchase method of restricted cash relates to funds being held by an escrow agentaccounting in accordance with certain potentialSFAS 141 – Business Combinations (“FAS 141”). Under this method of accounting, assets acquired and liabilities assumed were recorded on the Company’s balance sheet at their estimated fair values as of the date of acquisition. The total purchase price adjustments toof approximately $1.0 billion includes the Western tower purchasefair value of the Class A common stock issued, the cash paid, and sale agreement. These funds are classifiedthe acquisition related costs incurred.
The determination, as currentupdated as they are expected to be released, net of any required obligations, to the Company during the next twelve months.
8. INTANGIBLE ASSETS, NET
Amortization expense was $1.3 million, $1.1 million and $1.2 million for the years ended December 31, 2003, 2002 and 2001, respectively. As of December 31, 20032006, of the estimated fair value of the assets acquired and 2002, total costsliabilities assumed relating to the AAT acquisition is summarized below (in thousands):
Accounts receivable Other current assets Property, plant, and equipment Intangible assets: Current contract intangible Network location intangible Other assets Total assets acquired Current liabilities Other liabilities Total liabilities assumed Net assets acquired $ 1,204 1,996 368,947 421,026 256,710 726 1,050,609 (10,283 ) (3,179 ) (13,462 ) $ 1,037,147
The fair values of covenantsthe property, plant, and equipment as well as the intangible assets were determined in connection with a third party valuation. The Company is currently in the process of finalizing the purchase price allocation. The primary areas of the purchase price allocation which are not yet finalized relate to competecurrent assets and current liabilities.
Unaudited Pro Forma Financial Information
The following table presents the unaudited pro forma consolidated results of operations of the Company for years December 31, 2006 and 2005, respectively, as if the AAT acquisition and the related financing transactions were $6.3 million and $6.4 million, respectively, and accumulated amortization totaled $3.9 million and $2.7 million, respectively.completed as of January 1 of each of the respective years (in thousands, except per share amounts):
| For the year ended December 31, | ||||||||
| 2006 | 2005 | |||||||
Revenues | $ | 379,863 | $ | 342,441 | ||||
Operating income (loss) | $ | 14,710 | $ | (20,390 | ) | |||
Net loss | $ | (162,573 | ) | $ | (153,967 | ) | ||
Basic and diluted net loss per common share | $ | (1.57 | ) | $ | (1.69 | ) | ||
EstimatedThe pro forma amounts include the historical operating results of the Company and AAT with appropriate adjustments to give effect to (1) depreciation, amortization and accretion, (2) interest expense, on(3) selling, general and administrative expense, and (4) certain conforming accounting policies of the Company’s covenantsCompany. The pro forma amounts are not to compete is as follows:
| Year ending December 31, | |||
| (in thousands) | |||
2004 | $ | 1,051 | |
2005 | 976 | ||
2006 | 375 | ||
2007 | 6 | ||
Total | $ | 2,408 | |
indicative of the operating results that would have occurred if the acquisition and related transactions had been completed at the beginning of the applicable periods presented and are not indicative of the operating results in future periods.
9. ACQUISITIONSOther Acquisitions
During 2003, the Company did not acquire any towers or businesses. However, during 2003, the Company paid approximately $3.1 in settlement of contingent purchase price amounts payable as a result of towers or businesses it acquired having met or exceeded earnings or new tower targets.
During 2002,2006, the Company acquired 53248 completed towers, 2 towers in process, and related assets from various sellers.sellers as well as the equity interest of three entities, whose assets consisted almost entirely of 91 towers and related assets. The aggregate consideration paid was $15.5$66.7 million in cash and 330,736approximately 1.8 million shares of Class A common stock.stock valued at $42.9 million. The Company accounted for all of the above tower acquisitions at fair market value at the date of acquisition. The results of operations of the acquired assets and companies are included with those of the Company from the dates of the respective acquisitions. Other than the AAT Acquisition, none of the individual acquisitions or aggregate acquisitions consummated during 2006 were significant to the Company and accordingly, pro forma financial information has not been presented. In addition, the Company also paid $2.1 million and issued 397,773approximately 13,000 shares of Class A common stock in settlement of contingent purchase price amounts payable as a result of acquired towers or businesses it acquired having met or exceededexceeding certain earnings or new towerperformance targets.
During 2001, the Company purchased two site development construction companies. The Company paid $14.5 million in cash and issued 413,631 shares of Class A common stock to the sellers. During 2002 the Company paid $7.0 million in cash and issued 587,260 shares of Class A common stock to the former owners of these two companies as a result of certain earnings targets having been met. In addition, as of December 31, 2002, certain of the former owners were entitled to receive an additional $2.0 million as a result of certain 2002 earnings targets being met. The Company accrued the $2.0 million within other current liabilities in the Consolidated Balance Sheet as of December 31, 2002. The $12.2 million in original goodwill plus the $12.0 million that was recorded as a result of the earn-out targets having been met were written off during 2002 in connection with the implementation of SFAS 142 (See Note 5). During 2003, the $2.0 million accrued at December 31, 2002 was paid in cash.
Additionally, during 2001,2005, the Company acquired 677172 towers and related assets from various sellers.sellers as well as the equity of two entities, whose assets consisted almost entirely of 36 towers and related assets. The aggregate purchase price for all acquisitions was $73.5 million. The aggregate consideration paid to the sellers for these acquisitions for the year ended December 31, 2001 was $218.7$55.1 million in cash and 370,502approximately 1.6 million shares of Class A common stock. In addition, the Company issued 790,495 shares of Class A common stock as a result of towers or businesses it acquired having met or exceeded certain earnings or new tower targets identified in the various acquisition agreements.
The Company accounted for all of the above tower acquisitions usingat fair market value at the purchase method
date of accounting.acquisition. The results of operations of the acquired assets and companies are included with those of the Company from the dates of the respective acquisitions. None of the individual acquisitions or aggregate acquisitions consummated were significant to the Company and, accordingly, pro forma financial information has not been presented. In addition, the Company paid $0.2 million and issued approximately 24,000 shares of Class A common stock in settlement of contingent purchase price amounts payable as a result of acquired towers exceeding certain performance targets.
In accordance with the provisions of SFAS No. 141, Business Combinations, the Company continues to evaluate all acquisitions within one year after the applicable closing date of each transaction to determine whether any additional adjustments are needed to the allocation of the purchase price paid for the assets acquired and liabilities assumed by major balance sheet caption, as well as the separate recognition of intangible assets from goodwill if certain criteria are met. These intangible assets represent the value associated with current leases in place (“Current Contract Intangibles”) at the acquisition date and future tenant leases anticipated to be added (“Network Location Intangible”) to the acquired towers and were calculated using the discounted values of the current or future expected cash flows. The intangible assets are estimated to have an economic useful life consistent with the economic useful life of the related tower assets, which is typically 15 years.
From time to time, the Company agrees to pay additional consideration for such acquisitions if the towers or businesses that are acquired meet or exceed certain performance targets in the 1-3 years after they have been acquired. As of December 31, 2006, the Company had an obligation to pay up to an additional $4.8 million in consideration if the performance targets contained in various acquisition agreements are met. These obligations are associated with acquisitions within the Company’s site leasing segment. In certain acquisitions the additional consideration may be paid in cash or shares of Class A common stock at the Company’s option. The Company records such obligations as additional consideration when it becomes probable that the targets will be met.
6. INTANGIBLE ASSETS, NET
The following table provides the gross and net carrying amounts for each major class of intangible assets:
| At December 31, 2006 | At December 31, 2005 | |||||||||||||||||||
| Gross carrying amount | Accumulated amortization | Net book value | Gross carrying amount | Accumulated amortization | Net book value | |||||||||||||||
Current contract intangibles | $ | 468,561 | $ | (21,405 | ) | $ | 447,156 | $ | 20,210 | $ | (620 | ) | $ | 19,590 | ||||||
Network location intangibles | 290,768 | (13,052 | ) | 277,716 | 11,805 | (309 | ) | 11,496 | ||||||||||||
Covenants not to compete | 6,231 | (6,231 | ) | — | 6,231 | (5,826 | ) | 405 | ||||||||||||
| $ | 765,560 | $ | (40,688 | ) | $ | 724,872 | $ | 38,246 | $ | (6,755 | ) | $ | 31,491 | |||||||
All intangibles noted above are contained in our site leasing segment. Amortization expense relating to the intangible assets above was $33.9 million, $1.9 million and $1.0 million for the years ended December 31, 2006, 2005 and 2004, respectively. These amounts are subject to changes in estimates until the preliminary allocation of the purchase price is finalized for all acquisitions.
Estimated amortization expense on the Company’s current contract and network location intangibles is as follows:
For the year ended December 31, | (in thousands) | ||
2007 | $ | 50,622 | |
2008 | 50,622 | ||
2009 | 50,622 | ||
2010 | 50,622 | ||
2011 | 50,622 | ||
Thereafter | 471,762 | ||
Total | $ | 724,872 | |
10.7. PROPERTY AND EQUIPMENT, NET
Property and equipment consists of the following:
| As of December 31, 2006 | As of December 31, 2005 | |||||||
| (in thousands) | ||||||||
Towers and related components | $ | 1,571,340 | $ | 1,117,497 | ||||
Construction-in-process | 4,555 | 4,792 | ||||||
Furniture, equipment and vehicles | 27,391 | 25,552 | ||||||
Land, buildings and improvements | 40,947 | 22,549 | ||||||
| 1,644,233 | 1,170,390 | |||||||
Less: accumulated depreciation | (538,291 | ) | (442,057 | ) | ||||
Property and equipment, net | $ | 1,105,942 | $ | 728,333 | ||||
Construction-in-process represents costs incurred related to towers that are under development and will be used in the Company's operations.
Depreciation expense was $99.0 million, $85.3 million, and $89.3 million for the years ended December 31, 2006, 2005, and 2004, respectively. At December 31, 2006, non-cash capital expenditures that are included in accounts payable and accrued expenses were $2.6 million, compared to $3.2 million at December 31, 2005.
8. COSTS AND ESTIMATED EARNINGS IN EXCESS OF BILLINGS ON UNCOMPLETED CONTRACTS
Costs and estimated earnings in excess of billings on uncompleted contracts consist of the following:
| As of December 31, 2006 | As of December 31, 2005 | |||||||
| (in thousands) | ||||||||
Costs incurred on uncompleted contracts | $ | 104,157 | $ | 94,323 | ||||
Estimated earnings | 18,771 | 15,609 | ||||||
Billings to date | (104,580 | ) | (86,139 | ) | ||||
| $ | 18,348 | $ | 23,793 | |||||
These amounts are included in the accompanying consolidated balance sheets under the following captions:
| As of December 31, 2006 | As of December 31, 2005 | |||||||
| (in thousands) | ||||||||
Costs and estimated earnings in excess of billings on uncompleted contracts | $ | 19,403 | $ | 25,184 | ||||
Billings in excess of costs and estimated earnings on uncompleted contracts | (1,055 | ) | (1,391 | ) | ||||
| $ | 18,348 | $ | 23,793 | |||||
At December 31, 2006 one significant customer comprised 69.3% of the costs and estimated earnings in excess of billings, net of billings in excess of costs, while at December 31, 2005, three significant customers comprised 75.4% of the costs and estimated earnings in excess of billings, net of billings in excess of costs.
9. CONCENTRATION OF CREDIT RISK
The Company’sCompany's credit risks consist primarily of accounts receivable with national, regional and local wireless communications providers and federal and state governmental agencies. The Company performs periodic credit evaluations of its customers’customers' financial condition and provides allowances for doubtful accounts as
required based upon factors surrounding the credit risk of specific customers, historical trends and other information. The Company generally does not require collateral. The following is a list of significant customers and the percentage of total revenue derived from such customers:
| ||
| ||
| ||
| ||
| ||
| ||
| ||
| ||
| ||
| For the year ended December 31, | |||||||||
| 2006 | 2005 | 2004 | |||||||
Sprint Nextel | 27.6 | % | 30.9 | % | 31.0 | % | |||
Cingular (now AT&T) | 21.4 | % | 25.5 | % | 22.7 | % | |||
The Company’sCompany's site development consulting, site development construction and site leasing segments derive revenue from these customers. Client concentrations with respect to revenues in each of the segments are as follows:
11. COSTS AND ESTIMATED EARNINGS ON UNCOMPLETED CONTRACTS
Percentage of Site Leasing Revenue | |||||||||
| 2006 | 2005 | 2004 | |||||||
Cingular (now AT&T) | 26.7 | % | 28.0 | % | 27.5 | % | |||
Sprint/Nextel | 26.2 | % | 30.7 | % | 29.4 | % | |||
Verizon | 9.7 | % | 10.1 | % | 9.5 | % | |||
Percentage of Site Development for the year ended December 31, | |||||||||
| 2006 | 2005 | 2004 | |||||||
Sprint Nextel | 38.0 | % | 1.9 | % | 2.6 | % | |||
Verizon Wireless | 26.6 | % | 32.4 | % | 26.1 | % | |||
Bechtel Corporation* | 10.0 | % | 23.3 | % | 24.7 | % | |||
Cingular (now AT&T) | 6.8 | % | 28.3 | % | 26.7 | % | |||
Sprint Nextel Bechtel Corporation* Cingular (now AT&T)Costs Percentage of Site Development
Construction Revenue
for the year ended December 31, 2006 2005 2004 30.0 % 36.0 % 39.7 % 17.4 % 11.6 % 14.5 % 6.9 % 20.3 % 12.5 %
| * | Substantially all the work performed for Bechtel Corporation was for its client Cingular. |
At December 31, 2006 and estimated earnings on uncompleted contracts consist2005, two significant customers comprise 57.1% and three significant customers comprise 49.6%, respectively, of site development consulting and construction segments combined accounts receivable. These same customers comprise 49.2% and 46.6% of the following:
| As of December 31, | ||||||||
| 2003 | 2002 | |||||||
| (in thousands) | ||||||||
Costs incurred on uncompleted contracts | $ | 43,738 | $ | 74,506 | ||||
Estimated earnings | 3,809 | 17,148 | ||||||
Billings to date | (38,897 | ) | (83,591 | ) | ||||
| $ | 8,650 | $ | 8,063 | |||||
These amounts are included in the accompanying consolidated balance sheets under the following captions:
| As of December 31, | ||||||||
| 2003 | 2002 | |||||||
| (in thousands) | ||||||||
Costs and estimated earnings in excess of billings on uncompleted contracts | $ | 10,227 | $ | 10,425 | ||||
Billings in excess of costs and estimated earnings on uncompleted contracts | (1,577 | ) | (2,362 | ) | ||||
| $ | 8,650 | $ | 8,063 | |||||
12. PROPERTY AND EQUIPMENT
Property and equipment, excluding assets held for sale, consists of the following:
| As of December 31, | ||||||||
| 2003 | 2002 | |||||||
| (in thousands) | ||||||||
Towers and related components | $ | 1,055,912 | $ | 1,058,805 | ||||
Construction-in-process | 498 | 4,595 | ||||||
Furniture, equipment and vehicles | 38,403 | 40,883 | ||||||
Land, buildings and improvements | 16,160 | 16,500 | ||||||
| 1,110,973 | 1,120,783 | |||||||
Less: accumulated depreciation and amortization | (254,760 | ) | (179,822 | ) | ||||
Property and equipment, net | $ | 856,213 | $ | 940,961 | ||||
Construction-in-process represents costs incurred related to towers that are under development and will be used in the Company’s operations.
Depreciation expense was $83.0 million, $84.5 million and $61.0 million for the years endedtotal accounts receivable at December 31, 2003, 20022006 and 2001,2005, respectively.
13.10. ACCRUED EXPENSES
The Company’s accrued expenses are comprised of the following:
| As of December 31, | ||||||||||||
| 2003 | 2002 | As of December 31, 2006 | As of December 31, 2005 | |||||||||
| (in thousands) | (in thousands) | |||||||||||
Salaries and benefits | $ | 2,421 | $ | 1,791 | $ | 3,418 | $ | 3,746 | ||||
Real estate and property taxes | 6,084 | 5,289 | 6,648 | 4,410 | ||||||||
Restructuring and other charges | 1,040 | 1,706 | ||||||||||
Insurance | 1,234 | 3,738 | ||||||||||
Tower sale purchase price adjustment | 2,573 | — | ||||||||||
Other | 4,357 | 1,419 | 7,534 | 7,388 | ||||||||
| $ | 17,709 | $ | 13,943 | $ | 17,600 | $ | 15,544 | |||||
14. CURRENT AND LONG-TERM11. DEBT
| As of December 31, | ||||||||
| 2003 | 2002 | |||||||
| (in thousands) | ||||||||
| 10¼% senior notes, unsecured, interest payable semi-annually, balloon principal payment of $406,441 due at maturity on February 1, 2009, including deferred gain related to termination of derivative of $4,559 and $5,236 at December 31, 2003, and 2002, respectively. See Note 20. | $ | 411,000 | $ | 505,236 | ||||
| 9¾% senior discount notes, net of unamortized original issue discount of $126,204 at December 31, 2003, unsecured, cash interest payable semi-annually in arrears beginning June 15, 2008, balloon principal payment of $402,024 due at maturity on December 15, 2011. | 275,820 | — | ||||||
| 12% senior discount notes, net of unamortized original issue discount of $5,077 at December 31, 2002, unsecured, cash interest payable semi-annually in arrears beginning September 1, 2003, balloon principal payment of $65,673 due at maturity on March 1, 2008. See Note 24. | 65,673 | 263,923 | ||||||
| Senior secured credit facility loans, interest at varying cash rates (5.15% to 5.17% at December 31, 2003). Additional interest accrues at 3.5% and is payable at maturity. See Note 24. | 118,227 | — | ||||||
Senior secured credit facility loans. This facility was paid in full in May 2003. | — | 255,000 | ||||||
| Notes payable, interest at varying rates (2.9% to 11.4% at December 31, 2003 maturing at various dates through 2004). | 38 | 123 | ||||||
| 870,758 | 1,024,282 | |||||||
Less: current maturities | (11,538 | ) | (60,083 | ) | ||||
Long-term debt | $ | 859,220 | $ | 964,199 | ||||
| As of December 31, 2006 | As of December 31, 2005 | |||||
| (in thousands) | ||||||
Commercial mortgage pass-through certificates, series 2005-1, secured, interest payable monthly in arrears, balloon payment principal of $405,000 with an anticipated repayment date of November 15, 2010. Interest at varying rates (5.369% to 6.706%) at December 31, 2006 and 2005. | $ | 405,000 | $ | 405,000 | ||
Commercial mortgage pass-through certificates, series 2006-1, secured, interest payable monthly in arrears, balloon payment principal of $1,150,000 with an anticipated repayment date of November 15, 2011. Interest at varying rates (5.314% to 7.825%) at December 31, 2006. | 1,150,000 | — | ||||
8 1/2% senior notes, unsecured, interest payable semi-annually in arrears on June 1 and December 1. Balance repurchased in full April 27, 2006. | — | 162,500 | ||||
9 3/4% senior discount notes, net of unamortized original issue discount of $44,424 at December 31, 2005, unsecured, cash interest payable semi-annually in arrears beginning June 15, 2008, and the accreted balance of $223,736 repurchased on April 27, 2006. | — | 216,892 | ||||
Senior revolving credit facility. Facility originated in December 2005. No amounts outstanding at December 31, 2006 and 2005. | — | — | ||||
Total debt | $ | 1,555,000 | $ | 784,392 | ||
10¼% Senior NotesCommercial Mortgage Pass-Through Certificates, Series 2005-1
In February 2001,On November 18, 2005, SBA CMBS-1 Depositor LLC (the “Depositor”), an indirect subsidiary of the Company, issued $500.0 million of its 10¼% senior notes due 2009, which produced net proceeds of approximately $484.3 million after deducting offering expenses. Interest accrues on the notes and is payablesold in cash semi-annually in arrears on February 1 and August 1, commencing August 1, 2001. Proceeds from the senior notes were used to acquire and construct telecommunications towers, repay borrowings under the senior credit facility, and for general working capital purposes.
Approximately $105.6a private transaction, $405 million of the proceeds were usedInitial CMBS Certificates issued by SBA CMBS Trust (the “Trust”), a trust established by the Depositor (the “Initial CMBS Transaction”). The Initial CMBS Certificates consisted of five classes, all of which are rated investment grade, as indicated in the table below:
Subclass | Initial Subclass Principal Balance | Pass through Interest Rate | ||||
| (in thousands) | ||||||
2005-1A | $ | 238,580 | 5.369 | % | ||
2005-1B | 48,320 | 5.565 | % | |||
2005-1C | 48,320 | 5.731 | % | |||
2005-1D | 48,320 | 6.219 | % | |||
2005-1E | 21,460 | 6.706 | % | |||
| $ | 405,000 | 5.608 | % | |||
The weighted average monthly fixed coupon interest rate of the Initial CMBS Certificates is 5.6% and the effective weighted average fixed interest rate is 4.8%, after giving effect to repay all borrowings under the Company’s former senior credit facility.settlement of two interest rate swap agreements entered in contemplation of the transaction (See note 12). The Initial CMBS Certificates have an anticipated repayment date of November 15, 2010 with a final repayment date in 2035. The Company wrote off theincurred deferred financing fees relatingof $12.2 million associated with the closing of this transaction.
Commercial Mortgage Pass-Through Certificates, Series 2006-1
On November 6, 2006, the Depositor, sold in a private transaction, $1.15 billion of the Additional CMBS Certificates, issued by the Trust (the “Additional CMBS Transaction”). The Additional CMBS Certificates consist of nine classes as indicated in the table below:
Subclass | Initial Subclass Principal Balance | Pass through Interest Rate | ||||
| (in thousands) | ||||||
2006-1A | $ | 439,420 | 5.314 | % | ||
2006-1B | 106,680 | 5.451 | % | |||
2006-1C | 106,680 | 5.559 | % | |||
2006-1D | 106,680 | 5.852 | % | |||
2006-1E | 36,540 | 6.174 | % | |||
2006-1F | 81,000 | 6.709 | % | |||
2006-1G | 121,000 | 6.904 | % | |||
2006-1H | 81,000 | 7.389 | % | |||
2006-1J | 71,000 | 7.825 | % | |||
Total | $ | 1,150,000 | 5.993 | % | ||
The contractual weighted average monthly fixed interest rate of the Additional CMBS Certificates is 6.0%, and the effective weighted average fixed interest rate is 6.3% after giving effect to the former senior credit facility and recordedsettlement of the nine interest rate swap agreements entered in contemplation of the transaction (see note 12). The Additional CMBS Certificates have an expected life of five years with a $5.1 million chargefinal repayment date in 2036. The proceeds of the first quarter of 2001Additional CMBS Certificates primarily repaid the bridge loan secured in connection with the termination of this facility. DuringAAT Acquisition and fund required reserves and expenses associated with the year ended December 31, 2003, theAdditional CMBS Transaction. The Company exchanged $13.5 million in principal amount of its 10¼% senior notes for 3.85 million shares of Class A common stock. Additionally, the Company repurchased $80.1 million in principal amount of its 10¼% senior notes in the open market for $79.5 million in cash. During 2003, the Company recognized a gain on extinguishment of debt of $1.5 million and wrote-offincurred deferred financing fees of $1.9$23.3 million associated with the closing of this transaction.
The CMBS Certificates
In connection with the Initial CMBS Transaction, the $400 million Amended and Restated Credit Agreement (“Senior Credit Facility”), dated as of January 30, 2004, among SBA Senior Finance, as borrower and the lenders (the “Loan Agreement”) was amended and restated to replace SBA Properties as the new borrower under the Loan Agreement and to completely release SBA Senior Finance and the other guarantors of any obligations under the Loan Agreement, to increase the principal amount of the loan to $405.0 million and to amend various other terms (as amended and restated, the “Mortgage Loan Agreement”). Furthermore, the Mortgage Loan Agreement was purchased by the Depositor with proceeds from the Initial CMBS Transaction. The Depositor then assigned the underlying mortgage loan to the Trust, who will have all rights as Lender under the Mortgage Loan Agreement.
The assets of the Trust, which issued the CMBS Certificates, consists of non-recourse mortgage loan initially made in favor of SBA Properties, Inc. (the “Initial Borrower”). In connection with the issuance of the Additional CMBS Certificates, each of SBA Sites, Inc., SBA Structures, Inc., SBA Towers, Inc., SBA Towers Puerto Rico, Inc. and SBA Towers USVI, Inc. (the “Additional Borrowers”) were added as additional borrowers under the mortgage loan and the principal amount of the mortgage loan was increased by $1.15 billion to an aggregate of $1.56 billion. The Borrowers are jointly and severally liable under the mortgage loan. The mortgage loan is to be paid from the operating cash flows from the aggregate 4,975 towers owned by the Borrowers. Subject to certain limited exceptions described below, no payments of principal will be required to be made prior to the monthly payment date in November 2010, which is the anticipated repayment date for the components of the mortgage loan corresponding to the Initial CMBS Certificates, and no payments of principal will be required to be made in relation to the components of the mortgage loan corresponding to the Additional CMBS Certificates prior to the monthly payment date in November 2011. However, if the debt service coverage ratio, defined as the Net Cash Flow (as defined in the Mortgage Loan Agreement) divided by the amount of interest on the mortgage loan, servicing fees and trustee fees that the Borrowers will be required to pay over the succeeding twelve months, as of the end of any calendar quarter, falls to 1.30 times or lower, then all cash flow in excess of amounts required to make debt service payments, to fund required reserves, to pay management fees and budgeted operating expenses and to make other payments required under the loan documents, referred to as excess cash flow, will be deposited into a reserve account instead of being released to the
Borrowers. The funds in the reserve account will not be released to the Borrowers unless the debt service coverage ratio exceeds 1.30 times for two consecutive calendar quarters. If the debt service coverage ratio falls below 1.15 times as of the end of any calendar quarter, then an “amortization period” will commence and all funds on deposit in the reserve account will be applied to prepay the mortgage loan. Otherwise, on a monthly basis, the excess cash flow of the Borrowers held by the Trustee after payment of principal, interest, reserves and expenses is distributed to the Borrowers.
The Borrowers may not prepay the mortgage loan in whole or in part at any time prior to November 2010 (the “Initial CMBS Certificates Anticipated Repayment Date”) for the components of the mortgage loan corresponding to the Initial CMBS Certificates and November 2011 (the “Additional CMBS Certificates Anticipated Repayment Date”) for the components of the mortgage loan corresponding to the Additional CMBS Certificates, except in limited circumstances (such as the occurrence of certain casualty and condemnation events relating to the Borrowers’ tower sites). Thereafter, prepayment is permitted provided it is accompanied by any applicable prepayment consideration. If the prepayment occurs within nine months of the final maturity date, no prepayment consideration is due. The entire unpaid principal balance of the mortgage loan components corresponding to the Initial CMBS Certificates will be due in November 2035 and those corresponding to the Additional CMBS Certificates will be due in November 2036. However, to the extent that the full amount of the mortgage loan component corresponding to the Initial CMBS Certificates or the amount of the mortgage loan component corresponding to the Additional CMBS Certificates are not fully repaid by their respective anticipated repayment dates, the interest rate payable on any such mortgage loan outstanding will significantly increase in accordance with the formula set forth in the mortgage loan. The mortgage loan may be defeased in whole at any time.
The mortgage loan is secured by (1) mortgages, deeds of trust and deeds to secure debt on substantially all of the tower sites and their operating cash flows, (2) a security interest in substantially all of the Borrowers’ personal property and fixtures and (3) the Borrowers’ rights under the management agreement they entered into with Network Management. relating to the management of the Borrowers’ tower sites by Network Management pursuant to which SBA Network Management arranges for the payment of all operating expenses and the funding of all capital expenditures out of amounts on deposit in one or more operating accounts maintained on the Borrowers’ behalf. For each calendar month, Network Management is entitled to receive a management fee equal to 7.5% of the Borrowers’ operating revenues for the immediately preceding calendar month. This management fee was reduced from 10% in connection with the 10¼% senior note retirement transactions. See Note 24issuance of the Additional CMBS Certificates.
In connection with issuance of the CMBS Certificates, the Company is required to fund a restricted cash amount, which represents the cash held in escrow pursuant to the mortgage loan governing the Certificates to fund certain reserve accounts for further discussion of repurchase activity subsequent to December 31, 2003.
The 10¼% senior notes are unsecured and are pari passu in right ofthe payment with the Company’s other existing and future senior indebtedness. The 10¼% senior notes place certain restrictions on, among other things, the incurrence of debt service costs, ground rents, real estate and liens, issuancepersonal property taxes, insurance premiums related to tower sites, trustee and service expenses, and to reserve a portion of preferred stock, payment of dividends or other distributions, sales of assets, transactions with affiliates, sale and leaseback transactions, certain investments andadvance rents from tenants on the Company’s ability to merge or consolidate with other entities. The ability of4,975 tower sites. Based on the Company to comply with the covenants and other terms of the 10¼CMBS Certificates, all rental cash receipts each month are restricted and held by the indenture trustee. The monies held by the indenture trustee as of December 31, 2006 are classified as restricted cash on the Company’s Balance Sheet (see note 4). The monies held by the indenture trustee in excess of required reserve balances are subsequently released to the Borrowers on or before the 15th calendar day following month end.
Bridge Loan
In connection with the AAT Acquisition, on April 27, 2006, SBA Senior Finance entered into a credit agreement for a $1.1 billion bridge loan. The proceeds of the loan were used in the acquisition of AAT and to repurchase the remaining amounts outstanding of the Company’s 8 1/2% senior notes and to satisfy its respective debt obligations will depend on the future operating performance of the Company. In the event the Company fails to comply with the various covenants contained in the 10¼% senior notes, it would be in default thereunder, and in any such case, the maturity of a portion or all of its long-term indebtedness could be accelerated. In addition, the acceleration of amounts due under the senior credit facility would also cause a cross-default under the indenture for the 10¼% senior notes.
9 9¾% Senior Discount Notes 3
In December 2003, the Company and Telecommunications co-issued $402.0 million of its 9¾/4% senior discount notes due 2011, which produced net(see below). The bridge loan had a maturity date (after extension of an option by the Company) of January 27, 2007, but was repaid in full on November 6, 2006 with the proceeds of approximately $267.1 million after deducting offering expenses. The senior discount notes accrete in value until December 15, 2007 at which time they will have an aggregate principal amount of $402.0 million. Thereafter, interest accrues on the senior discount notes and will be payable in cash semi-annually in arrears on June 15 and December 15, commencing June 15, 2008. Proceeds from the senior discount notes were used to tender for approximately $153.3Additional CMBS Transaction. The Company recorded a $3.4 million of the Company’s 12% senior discount notes and for general working capital purposes.
The 9¾% senior discount notes are unsecured and are pari passu in right of payment with the Company’s other existing and future senior indebtedness. The 9¾% senior discount notes place certain restrictions on, among other things, the incurrence of debt and liens, issuance of preferred stock, payment of dividends or other distributions, sales of assets, transaction with affiliates, sale and leaseback transactions, certain investments and the Company’s ability to merge or consolidate with other entities. The ability of the Company to comply with the covenants and other terms of the 9¾% senior discount notes and to satisfy its respective debt obligations will depend on the future operating performance of the Company. In the event the Company fails to comply with the various covenants contained in the 9¾% senior discount notes, it would be in default thereunder, and in any such case, the maturity of a portion or all of its long-term indebtedness could be accelerated. In addition, the acceleration of amounts due under the senior credit facility would also cause a cross-default under the indenture for the 9¾% senior discount notes.
12% Senior Discount Notes
In March 1998, the Company issued $269.0 million of its 12% senior discount notes due March 1, 2008, which produced net proceeds of approximately $150.2 million. The senior discount notes accreted in value until March 1, 2003 at which time they had an aggregate principal amount of $269.0 million. Thereafter, interest accrues on the senior discount notes and is payable in cash semi-annually in arrears on March 1 and September 1, commencing September 1, 2003. Proceedsloss from the senior discount notes were used to acquire and construct telecommunications towers as well as for general working capital purposes. During the year ended December 31, 2003, the Company repurchased $50.0 million in principal amountwrite-off of its 12% senior discount notes in the open market for $50.3 million in cash. Additionally, during 2003, the Company
completed a tender for 70% of its outstanding 12% senior discount notes and retired $153.3 million face value of its 12% senior discount notes for $167.1 million. During 2003, the Company recognized a loss on extinguishment of $14.6 million and wrote-off deferred financing fees and extinguishment of $4.8 milliondebt in connection with the 12%repayment of this facility.
8 1/2% Senior Notes and 93/4% Senior Discount Notes
On April 27, 2006, the remaining outstanding amounts of $162.5 million of the 8 1/2% senior discount note retirement transactions. See Note 24 for a discussionnotes and $223.7 million of repurchase activity subsequent to December 31, 2003.
The 12%the 9 3/4% senior discount notes (the accreted value at April 27, 2006) were unsecured and were pari passurepaid from the proceeds of the $1.1 billion bridge loan obtained in right of paymentconnection with the Company’s other existingAAT Acquisition. The Company recorded a $53.9 million loss from write-off of deferred financing fees and future senior indebtedness. The 12% senior discount notes placed certain restrictions on, among other things, the incurrenceextinguishment of debt and liens, issuancein connection with the repurchase of preferred stock, payment of dividends or other distributions, sales of assets, transactions with affiliates, sale and leaseback transactions, certain investments and the Company’s ability to merge or consolidate with other entities.these notes.
Senior SecuredRevolving Credit Facility (put in place January 2004)
During January 2004,On December 22, 2005, SBA Senior Finance II LLC, a subsidiary of the Company, closed on a new seniorsecured revolving credit facility in the amount of $400.0$160.0 million. This facility consists of a $275.0 million term loan which was funded at closing, a $50.0 million delayed draw term loan which the Company has until November 15, 2004 to draw and a $75.0 million revolving line of credit. The revolving lines of credit may be borrowed, repaid and redrawn. Amortization of the term loans commence September 2004 at an annual rate of 1% in each of 2004, 2005, 2006 and 2007. All remaining amounts under the term loan are due in 2008. There is no amortization of the revolving loans and all amounts outstanding are due on August 31, 2008. Amounts borrowed under this facility accrue interest at either the base rate, as defined in the agreement, plus 250 basis points or the Euro dollar rate plus 350 basis points. Had this facility been in place on December 31, 2003, the borrowing rate under this facility would have been 4.6%. This facility may be prepaid at any time with no prepayment penalty. Amounts borrowed under this facility are secured by a first lien on substantially all of SBA Senior Finance’s assets. In addition, eachFinance II’s assets and are guaranteed by the Company and certain of SBA Senior Finance’s domestic subsidiaries has guaranteedits other subsidiaries. This facility replaces the obligationsprior facility which was assigned and became the mortgage loan underlying the Initial CMBS Certificates issuance. The Company incurred deferred financing fees of SBA Senior Finance$1.2 million associated with the closing of this transaction.
This facility consists of a $160.0 million revolving loan which may be borrowed, repaid and redrawn, subject to compliance with certain covenants. The Company was restricted from borrowing under this facility during the senior credit facility and has pledged substantially allperiod of their respective assets to secure such guarantee,time that the bridge loan remained outstanding based on an agreement with its lenders. Upon repayment of the bridge loan on November 6, 2006 from the proceeds of the Additional CMBS Transaction, this restriction was removed and the Company and Telecommunications have pledged substantially allis able to utilize the revolving credit facility according to the initial terms of their assetsthe borrowing arrangement.
The revolving credit facility matures on December 21, 2007. Amounts borrowed under the facility will accrue interest at LIBOR plus a margin that ranges from 75 basis points to secure SBA Senior Finance’s obligations under200 basis points or at a base rate plus a margin that ranges from 12.5 basis points to 100 basis points. Unused amounts on this senior credit facility.facility accrue interest at 37.5 basis points on the $160.0 million committed amount.
This newThe revolving credit facility requires SBA Senior Finance II to maintain specified financial ratios, including ratios regarding its debt to annualized operating cash flow, debt service, cash interest expense and fixed charges for each quarter. This new seniorThe revolving credit facility also contains affirmative and negative covenants that, among other things, restricts SBA Senior Finance’slimit the Company’s ability to incur debt and liens, sell assets, commit to capital expenditures, enter into affiliate transactions or sale-leaseback transactions, and build and/or buildacquire towers without anchor or acceptable tenants. Additionally, this facility permits distributions by SBA Senior Finance to Telecommunications and SBA Communications to service their debt, pay consolidated taxes, pay holding company expenses and for the repurchase of senior notes and senior discount notes subject to compliance with the covenants discussed above. SBA Senior Finance’sII’s ability in the future to comply with the covenants and access the available funds under the seniorrevolving credit facility in the future will depend on its future financial performance.
On January 30, 2004, SBA Senior Finance used the proceeds from funding of the $275.0 million term loan under the new senior credit facility to repay the old credit facility in full, consisting of $144.2 million outstanding. In addition to the amounts outstanding, the Company was required to pay $8.0 million to the lenders under the old facility to facilitate the assignment of the old facility to the new lenders. As a result of this prepayment, SBA Senior Finance has written off deferred financing fees associated with the old facility of $5.4 million in addition to the $8.0 million fee paid to facilitate the assignment during the first quarter of 2004. Additionally, SBA Senior Finance has recorded deferred financing fees of approximately $5.4 million associated with this new facility in the first quarter of 2004.
Senior Secured Credit Facility (paid in full January 2004)
On May 9, 2003, Telecommunications closed on a senior credit facility in the amount of $195.0 million from General Electric Capital Corporation (“GECC”) and affiliates of Oak Hill Advisors, Inc. (“Affiliates of Oak Hill”). The facility consisted of $95.0 million of term loans and a $100.0 million revolving line of credit. In November, 2003, in connection with the offering of the Company’s 9¾% senior discount notes and the Company’s tender offer for 70% of its outstanding 12% senior discount notes, SBA Senior Finance, a newly formed wholly-owned subsidiary of Telecommunications, assumed all rights and obligations of Telecommunications under the senior credit facility pursuant to an amended and restated credit agreement with the senior credit lenders. Telecommunications was released from any obligation to repay the indebtedness under the senior credit facility. Simultaneously with this assumption, Telecommunications contributed substantially all of its assets, consisting primarily of stock in our various operating subsidiaries,
to SBA Senior Finance. As of December 31, 2003, the Company had $98.2 million outstanding under the term loan and $20.0 million outstandingavailability under the revolving line of credit. The Company refinanced this credit facility in January 2004 and used the proceeds from the new facility to repay this facility in full. See senior credit facility discussion above.
Senior Secured Credit Facility (paid in full May 2003)
In June 2001, Telecommunications entered into a $300.0of $29.0 million senior secured credit facility. The facility provided for a $100.0 million term loan and a $200.0 million revolving line of credit. As of December 31, 2002, the Company had $100.0 million outstanding under the term loan and $155.0 million outstanding under the revolving line of credit. In addition, the Company had $14.5 million of letters of credit issued on its behalf to serve as collateral to secure certain obligations in the ordinary course of business. The Company refinanced this credit facility in May 2003 and used the proceeds from the new credit facility, cash on hand and a portion of the proceeds from the Western tower sale to repay this credit facility in full. As a result of this prepayment, the Company has written off deferred financing fees associated with this facility of approximately $4.4 million during 2003.
At December 31, 2002 the current portion of long-term debt in the amount of $60.0 million had been reclassified to reflect the amount by which the senior credit facility borrowings were reduced through the May 2003 refinancing. The portion of this debt reflected as long-term at December 31, 2002, $195.0 million, represents the amount of the facility which was replaced by the new facility.
2006.
As of December 31, 2003,2006, the Company was in compliance with the covenants of eachthe indentures relating to the Initial and Additional CMBS Certificates and the revolving credit facility.
The Company's debt is expected to mature as follows:
For the year ended December 31, | (in thousands) | ||
2007 | $ | — | |
2008 | — | ||
2009 | — | ||
2010 | 405,000 | ||
2011 | 1,150,000 | ||
Total | $ | 1,555,000 | |
12. DERIVATIVE FINANCIAL INSTRUMENTS
Additional CMBS Certificate Swaps
At various dates during 2006, a subsidiary of the above agreements, as applicable.
The Company’s debt, excluding the deferredCompany entered into nine forward-starting interest rate swap discussed below,agreements (the “Additional CMBS Certificate Swaps”), at an aggregate notional principal amount of $1.0 billion, to hedge the variability of future interest rates in anticipation of the issuance of debt, which the Company originally expected to be issued on or before December 31, 2003, would have matured21, 2007 by an affiliate of the Company. Under the swap agreements, the subsidiary had agreed to pay a fixed interest rate ranging from 5.019% to 5.47% on the total notional amount of $1.0 billion, beginning on the originally expected debt issuance dates for a period of five years, in exchange for receiving floating payments based on three month LIBOR on the same $1.0 billion notional amount for the same five year period.
On November 6, 2006, a subsidiary of the Company entered into a purchase agreement with JP Morgan Securities, Inc., Lehman Brothers Inc. and Deutsche Bank Securities Inc. regarding the Additional CMBS Transaction. In connection with this agreement, The Company terminated the Additional CMBS Certificate Swaps, resulting in a $14.5 million settlement payment by the Company. The Company determined a portion of the swaps to be ineffective, and as follows hada result, the senior credit facility not been refinanced:Company recorded $1.7 million as interest expense on the Statement of Operations. The additional deferred loss of $12.8 million is being amortized utilizing the effective interest method over the anticipated five year life of the Additional CMBS Certificates and will increase the effective interest rate on these certificates by 0.3% over the weighted average fixed interest rate of 6.0%. The unamortized value of the settlement payment is recorded in accumulated other comprehensive income in the Consolidated Balance Sheets.
| (in thousands) | |||
2004 | $ | 11,538 | |
2005 | 17,250 | ||
2006 | 17,250 | ||
2007 | 72,227 | ||
2008 | 65,673 | ||
Thereafter | 682,261 | ||
Total | $ | 866,199 | |
Initial CMBS Certificates Swaps
On June 22, 2005, in anticipation of the Initial CMBS Transaction (see note 11), the Company entered into two forward starting interest rate swap agreements, each with a notational principal amount of $200.0 million to hedge the variability of future interest rates on the Initial CMBS Transaction. Under the swap agreements, we agreed to pay the counterparties a fixed interest rate of 4.199% on the total notional amount of $400.0 million, beginning on December 22, 2005 through December 22, 2010 in exchange for receiving floating payments based on the three-month LIBOR on the same notional amount for the same five-year period. The Company determined the swaps to be effective cash flow hedges and recorded the fair value of the interest rate swaps in accumulated other comprehensive income, net of applicable income taxes.
On November, 4, 2005, two of the Company’s subsidiaries entered into a purchase agreement with Lehman Brothers Inc. and Deutsche Bank Securities Inc. regarding the purchase and sale of $405.0 million of commercial mortgage pass-through certificates issued by SBA CMBS Trust, a trust established by a special purpose subsidiary of the Company. In connection with this agreement, the Company terminated the Initial CMBS Certificates Swaps, resulting in a $14.8 million settlement payment to the Company. The settlement payment will be amortized into interest expense on the Consolidated Statement of Operations utilizing the effective interest method over the anticipated five year life of the Initial CMBS Certificates and will reduce the effective interest rate on the Certificates by 0.8%. The unamortized value of the settlement payment is recorded in accumulated other comprehensive income in the Consolidated Balance Sheets.
Fair Value Hedge
The Company previously entered intohad an interest rate swap agreement to manage its exposure to interest rate movements by effectively converting a portion of its $500.0 millionfixed rate 10 1/4% senior notes from fixedto variable rates. The swap qualified as a fair value hedge. The notional principal amount of the swap was $100.0 million and the maturity date and payment provisions matched that of the underlying senior notes.
The counter-party to the interest rate to variable rate notes. During October 2002, the counter-party to thisswap agreement terminated the agreement. Thisswap agreement in October 2002. In connection with this termination, resultedthe counter-party paid the Company $6.2 million, which included approximately $0.8 million in aaccrued interest. The remaining approximately $5.4 million received was deferred gain which is recorded in long-term debt and is being recognized as a reduction to interest expense over the remaining term of the senior notes to whichusing the swap related.effective interest method. Amortization of the deferred gain during 2003 and 20022004 was approximately $0.7 million. Additionally, $1.9 million and $0.2 million, respectively. The amortization of the remaining deferred gain was recognized as a reduction in loss from write-off of deferred financing fees and extinguishment of debt in connection with the repurchase of $186.5 million of 10 1/4% senior notes in December 2004. The balance of $1.9 million outstanding at December 31, 20032004 was written off in connection with the repayment of the 10 1/4% senior notes in February 2005 and is included as follows:
| (in thousands) | |||
2004 | $ | 740 | |
2005 | 810 | ||
2006 | 886 | ||
2007 | 969 | ||
2008 | 1,061 | ||
2009 | 93 | ||
Total | $ | 4,559 | |
See Note 20 for further discussion regardinga reduction in loss from write-off of deferred financing fees and extinguishment of debt on the interest rate swap agreement.Statement of Operations.
15. SHAREHOLDERS’13. SHAREHOLDERS' EQUITY
a. Offerings of Common Stock
In July 2000, the Company filed a universal shelf registration statement on Form S-3 with the Securities and Exchange Commission registering the sale of up to $500.0 million of any combination of Class A common stock, preferred stock, debt securities, depositarydepository shares, or warrants. On May 11, 2005, the Company issued 8.0 million shares of Class A common stock. The net proceeds were $75.4 million after deducting underwriters’ fees and offering expenses, and were used to redeem an accreted balance of $68.9 million of the 9 3/4% senior discount notes.
On October 5, 2005, the Company issued 10.0 million shares of Class A common stock. The net proceeds were $151.4 million after deducting underwriters’ fees and offering expenses, and were used to redeem $130.4 million of the Company’s 9 3/4% senior discount notes and 8 1/2% senior notes.
During the year ended December 31, 2006, the Company did not issue any securities under this shelf registration. At December 31, 2006, the Company can issue up to $21.4 million of securities under the universal shelf registration statement.
b. Registration of Additional Shares
During 2001,2006, the Company filed a shelf registration statement on Form S-4 with the Securities and Exchange Commission registering an aggregate 5.04.0 million shares of its Class A common stock. These 5.04.0 million shares are in addition to 3.0 million and 5.0 million shares registered during 2000.2000 and 2001, respectively. These shares may be issued in connection with acquisitions of wireless communication towers or companies that provide related services. During the years ended December 31, 2003, 20022006, 2005 and 2001,2004, the Company issued zero1.8 million shares, 1.31.7 million shares and 1.60.4 million shares, respectively, of its Class A common stock pursuant to these registration statements in connection with acquisitions. At December 31, 2006, 4.5 million shares remain available for issuance under this shelf registration.
On November 27, 2006, the Company filed a registration statement on Form S-8 with the Securities and Exchange Commission registering an additional 2.5 million shares of its Class A common stock issuable under the 2001 Equity Participation Plan.
On April 14, 2006, the Company filed with the Commission an automatic shelf registration statement for well-known seasoned issuers on Form S-3ASR. This registration statement enables the Company to issue shares of its Class A common stock, shares of preferred stock, which may be represented by depositary shares, unsecured senior, senior subordinated or subordinated debt securities; and warrants to purchase any of these securities. Under the rules governing the automatic shelf registration statements, the Company will file a prospectus supplement and advise the Commission of the amount and type of securities each time the Company issues securities under this registration statement. During the year ended December 31, 2006, the Company did not issue any securities under this shelf registration statement.
c. Other Common Stock Transactions
During 2006, in connection with the AAT Acquisition the Company issued 17,059,336 shares of its Class A common stock.
During 2003,2004, the Company exchanged $13.5$49.7 million of its 10¼10 1/4% senior notes for 3.858.7 million shares of its Class A common stock.
The issuanceCompany also exchanged $1.3 million in face value of these shares triggered an event whereby the 5.5 million of Class B common stock outstanding automatically converted to Class A common stock.
its 9d. Employee Stock Purchase Plan 3
In 1999, the Board of Directors of the Company adopted the 1999 Stock Purchase Plan (the “Purchase Plan”). A total of 500,000/4% senior discount notes for approximately 136,000 shares of its Class A common stock were reserved for purchase under the Purchase Plan. During 2003, an amendment to the Purchase Plan was adopted which increased the number of shares reserved for purchase from 500,000 to 1,500,000 shares. The Purchase Plan permits eligible employee participants to purchase Class A common stock at a price per share which is equal to the lesser of 85% of the fair market value of the Class A common stock on the first or the last day of an offering period. As of December 31, 2003, employees had purchased 271,038 shares under the Purchase Plan.
during 2004.
e. Non-cash Compensation
From time to time, restricted shares of Class A common stock or options to purchase Class A common stock have been granted under the Company’s equity participation plans at prices below market value at the time of grant. As a result, the Company expects to record approximately $0.5 million in non-cash compensation expense in each year from 2004 through 2006. In addition, the Company had bonus agreements with certain executives and employees to issue shares of the Company’s Class A common stock in lieu of cash payments. The Company recorded approximately $0.8 million and $2.0 million of non-cash compensation expense during the years ended December 31, 2003 and 2002, respectively.
In connection with an employment agreement with one of the officers of the Company, the Company was obligated to pay an amount equal to the difference between $1.0 million and the value of all vested options and restricted stock belonging to this officer on September 19, 2003. The Company had the option of settling the obligation in cash or shares of Class A common stock. This obligation was settled in September 2003 in cash for $0.9 million. This amount had been expensed over the three-year period of the original agreement as non-cash compensation expense.
f.d. Shareholder Rights Plan and Preferred Stock
During January 2002, the Company’sCompany's Board of Directors adopted a shareholder rights plan and declared a dividend of one preferred stock purchase right for each outstanding share of the Company’sCompany's common stock. Each of these rights which are currently not exercisable will entitle the holder to purchase one one-thousandth (1/1000) of a share of the Company’sCompany's newly designated Series E Junior Participating Preferred Stock. In the event that any person or group acquires beneficial ownership of 15% or more of the outstanding shares of the Company’sCompany's common stock or commences or announces an
intention to commence a tender offer that would result in such person or group owning 15% or more of the Company’sCompany's common stock, each holder of a right (other than the acquirer) will be entitled to receive, upon payment of the exercise price, a number of shares of common stock having a market value equal to two times the exercise price of the right. In order to retain flexibility and the ability to maximize shareholder value in the event of transactions that may arise in the future, the Board retains the power to redeem the rights for a set amount. The rights were distributed on January 25, 2002 and expire on January 10, 2012, unless earlier redeemed or exchanged or terminated in accordance with the Rights Agreement.
14. STOCK BASED COMPENSATION
Effective January 1, 2006, the Company adopted SFAS 123R using the modified prospective transition method. Under this transition method, compensation expense recognized during the year ended December 31, 2006 included: (a) compensation expense for all share-based awards granted prior to, but not yet vested, as of December 31, 2005, based on the grant date fair value estimated in accordance with the original provisions of SFAS 123, and (b) compensation expense for all share-based awards granted subsequent to December 31, 2006, based on the grant date fair value estimated in accordance with the provisions of SFAS 123R. In accordance with the modified prospective transition method, the Company’s Consolidated Financial Statements for prior periods have not been restated to reflect the impact of SFAS 123R. The Company accounts for stock issued to non-employees in accordance with the provisions of Emerging Issues Task Force (“EITF”) Issue No. 96-18, “Accounting for Equity Instruments That Are Issued to Other Than Employees for Acquiring, or in Conjunction with Selling Goods or Services.” As a result of applying SFAS 123R to unvested stock options at December 31, 2005, the Company’s loss from continuing operations and net loss was $5.4 million higher for the year ended December 31, 2006. Basic and diluted loss per share was $0.06 higher as a result of applying SFAS 123R for the year ended December 31, 2006. Additionally, there was no effect on cash flows from operations and financing activities.
On November 10, 2005, the FASB issued FASB Staff Position No. FAS 123R-3, “Transition Election Related to Accounting for Tax Effects of Share-Based Payment Awards.” The Company has elected to adopt the alternative transition method provided in the FASB Staff Position for calculating the tax effects of share-based compensation pursuant to SFAS 123R. The alternative transition method includes simplified methods to establish the beginning balance of the additional paid-in capital pool (“APIC Pool”) related to the tax effects of employee share-based compensation, and to determine the subsequent impact on the APIC Pool and consolidated statements of cash flows of the tax effects of employee and director share-based awards that are outstanding upon adoption of SFAS 123R.
16. STOCK OPTIONS AND WARRANTSStock Options
The Company has three stock optionequity participation plans (the 1996 Stock Option Plan, the 1999 Equity Participation Plan and the 2001 Equity Participation Plan) whereby options (both non-qualified and incentive stock options), stock appreciation rights and restricted stock may be granted to directors, employees and consultants. Upon adoption of the 2001 Equity Participation Plan, all unissued optionsno further grants are permitted under the 1996 Stock Option Plan and the 1999 Equity Participation Plan were cancelled.Plan. The 2001 Equity Participation Plan provides for a maximum issuance of shares, together with all outstanding options and unvested shares of restricted stock under all three of the plans, equal to 15% of the Company’s common stock outstanding, adjusted for certain shares issued pursuant toand the exercise of certain options. These options generally vest between three and six years from the date of grant on a straight-line basis and generally have a ten year life.
From time to time, restricted shares of Class A common stock or options to purchase Class A common stock have been granted under the Company’s equity participation plans at prices below market value at the time of grant. The Company recorded approximately $0.4 million, $0.5 million and $0.5 million of non-cash compensation expense during the years ended December 31, 2006, 2005 and 2004, respectively, relating to the issuance of these shares.
The Company records compensation expense for employee stock options based on the estimated fair value of the options on the date of grant using the Black-Scholes option-pricing model with the assumptions included in the table below. The Company uses a combination of historical data and implied volatility to establish the expected volatility. Historical data is used to estimate the expected option life and the expected forfeiture rate. The risk-free rate is based on the U.S. Treasury yield curve in effect at the time of grant for the estimated life of the option. The following assumptions were used to estimate the fair value of options granted using the Black-Scholes option-pricing model:
Risk free interest rate Dividend yield Expected volatility Expected lives For the year ended December 31, 2006 2005 2004 4.2% - 5.1% 3.8% - 4.2% 3.5% 0.0% 0.0% 0.0% 43.7% - 45% 45% 113% 3.75 years 3.75 years 4 years
A summary of shares reserved for future issuance under these plans as of December 31, 20032006 is as follows:
| (in thousands) | |||
Reserved for 1996 Stock Option Plan | |||
Reserved for 1999 Equity Participation Plan | |||
Reserved for 2001 Equity Participation Plan | |||
| 12,453 | |||
The following table summarizes the Company’s activities with respect to its stock option plan years ended 2006, 2005, and 2004 as follows (dollars and number of shares in thousands, except for per share data):
These
Options | Number of Shares | Weighted- Average Exercise Price Per Share | Weighted- Average Remaining Contractual Term | ||||||
Outstanding at January 1, 2003 | 3,788 | $ | 7.79 | ||||||
Granted | 1,390 | $ | 4.27 | ||||||
Exercised | (173 | ) | $ | (3.11 | ) | ||||
Canceled | (590 | ) | $ | (6.81 | ) | ||||
Outstanding at December 31, 2004 | 4,415 | $ | 7.04 | ||||||
Granted | 1,345 | $ | 8.91 | ||||||
Exercised | (978 | ) | $ | (4.04 | ) | ||||
Canceled | (207 | ) | $ | (7.29 | ) | ||||
Outstanding at December 31, 2005 | 4,575 | $ | 8.22 | ||||||
Granted | 1,126 | $ | 20.02 | ||||||
Exercised | (1,181 | ) | $ | (8.07 | ) | ||||
Canceled | (368 | ) | $ | (26.04 | ) | ||||
Outstanding at December 31, 2006 | 4,152 | $ | 9.87 | 7.4 | |||||
Exercisable at December 31, 2006 | 1,263 | $ | 6.70 | 6.0 | |||||
Unvested at December 31, 2006 | 2,889 | $ | 11.26 | 8.0 | |||||
The weighted-average fair value of options generallygranted during the years ended December 31, 2006, 2005 and 2004 was $8.18, $3.43 and $3.28, respectively. The total intrinsic value for options exercised during the years ended December 31, 2006, 2005 and 2004 was $21.2 million, $10.2 million and $0.9 million, respectively.
Cash received from option exercises under all plans for years ended December 31, 2006, 2005 and 2004 was approximately $9.5 million, $3.9 million and $0.5 million, respectively. No tax benefit was realized for the tax deductions from option exercises under all plans for the years ended December 31, 2006, 2005 and 2004, respectively.
Additional information regarding options outstanding and exercisable at December 31, 2006 is as follows:
| Options Outstanding | Options Exercisable | ||||||||||||||
Range | Outstanding (in thousands) | Weighted Average Contractual Life (in years) | Weighted Average Exercise Price | Exercisable (in thousands) | Weighted Average Exercise Price | Aggregate Intrinsic Value | |||||||||
$ 0.05 - $ 2.63 | 662 | 5.9 | $ | 2.08 | 354 | $ | 2.07 | ||||||||
$ 3.27 - $ 9.69 | 2,212 | 7.3 | $ | 6.74 | 740 | $ | 6.61 | ||||||||
$10.67 - $ 14.80 | 98 | 7.0 | $ | 13.74 | 54 | $ | 12.98 | ||||||||
$15.25 - $ 24.75 | 1,048 | 8.4 | $ | 18.78 | 98 | $ | 15.27 | ||||||||
$26.14 - $ 50.13 | 132 | 8.5 | $ | 27.86 | 17 | $ | 38.15 | ||||||||
| 4,152 | 1,263 | $ | 26,300 | ||||||||||||
The following table summarizes the activity of options to purchase shares of SBA common stock that had not yet vested:
| Number of Shares | Weighted- Per Share | Aggregate Intrinsic Value | |||||||
| (in thousands, except for per share amounts) | |||||||||
Unvested as of December 31, 2005 | 3,059 | $ | 3.29 | ||||||
Shares Granted | 1,126 | $ | 8.18 | ||||||
Vesting during period | (1,180 | ) | $ | 3.46 | |||||
Forfeited or cancelled | (116 | ) | $ | 5.93 | |||||
Unvested as of December 31, 2006 | 2,889 | $ | 5.00 | $ | 46,927 | ||||
As of December 31, 2006, there were options to purchase 2.9 million shares of SBA common stock that had not yet vested and were expected to vest between threein future periods at a weighted average exercise price of $11.26. The aggregate intrinsic value for stock options in the preceding tables represents the total intrinsic value, based on Company’s closing stock price of $27.50 as of December 31, 2006. The amount represents the total intrinsic value that would have been received by the holders of the stock-based awards had these awards been exercised and six years fromsold as of that date.
As of December 31, 2006, the date of grant on a straight-line basis and generally have a ten year life. The Company accounts for these plans under APB 25, under whichtotal unrecognized compensation cost related to unvested stock options outstanding under the Plans is not$11.2 million. That cost is expected to be recognized on those issuances whereover a weighted average period of 1.3 years.
The total fair value of shares vested during 2006, 2005, and 2004 was $4.1 million, $3.7 million, and $2.5 million, respectively.
Employee Stock Purchase Plan
In 1999, the exercise price equals or exceeds the market priceBoard of Directors of the underlying stock onCompany adopted the grant date. From time to time, options to purchase1999 Stock Purchase Plan (the “Purchase Plan”). A total of 500,000 shares of Class A common stock were reserved for purchase under the Purchase Plan. During 2003, an amendment to the Purchase Plan was adopted which increased the number of shares reserved for purchase from 500,000 to 1,500,000 shares. The Purchase Plan permits eligible employee participants to purchase Class A common stock at a price per share which is equal to 85% of the fair market value of the Class A common stock on the last day of an offering period. For the year ended December 31, 2006 approximately 46,700 shares of the Company’s Class A common stock were issued under the Purchase Plan, which resulted in cash proceeds to the Company of $1.0 million compared to the year ended December 31, 2005 when approximately 69,700 shares of the Company’s Class A common stock were issued under the Purchase Plan, which resulted in cash proceeds to the Company of $1.0 million. At December 31, 2006, approximately 628,000 shares remain which can be issued under the Purchase Plan. In addition, the Company recorded $0.2 million of non-cash compensation expense relating to these shares for the year ended December 31, 2006.
Non-Cash Compensation Expense
The table below reflects a break out by category of the amounts recognized in the statement of operations for the year ended December 31, 2006 for non-cash compensation expense (in thousands):
| For the year ended December 31, 2006 | |||
Cost of revenues | $ | 151 | |
Selling, general and administrative | 5,259 | ||
Total cost of non-cash compensation included in income, before income tax | 5,410 | ||
Amount of income tax recognized in earnings | — | ||
Amount charged against income | $ | 5,410 | |
For the years ended December 31, 2006, 2005, and 2004, non-cash compensation expense included in the Consolidated Statement of Operations relating to employees was $5.1 million, $0.5 million, and $0.5 million, respectively. For the year ended December 31, 2006, non-cash compensation expense included in the Consolidated Statement of Operations relating to non-employees was $0.3 million. In addition, the Company capitalized $1.3 million of non-cash compensation to fixed and intangible assets relating to non-employees for the year ended December 31, 2006.
Pro-Forma Non-Cash Compensation Expense
Prior to December 31, 2005, the Company accounted for non-cash compensation arrangements in accordance with the provisions and related interpretations of APB 25. Had compensation cost for share-based awards been determined consistent with SFAS No. 123R, the net income and earnings per share would have been granted underadjusted to the 1999 Equity Participation Plan andfollowing pro forma amounts (in thousands, except for per share data):
| For the year ended December 31, | ||||||||
| 2005 | 2004 | |||||||
Net loss, as reported | $ | (94,709 | ) | $ | (147,280 | ) | ||
Non-cash compensation charges included in net loss | 462 | 470 | ||||||
Incremental stock-based compensation (expense determined under the fair value based method for all awards, net of related tax effects) | (4,247 | ) | (5,359 | ) | ||||
Pro forma net loss | $ | (98,494 | ) | $ | (152,169 | ) | ||
Loss per share: | ||||||||
Basic and diluted - as reported | $ | (1.28 | ) | $ | (2.52 | ) | ||
Basic and diluted - pro forma | $ | (1.33 | ) | $ | (2.61 | ) | ||
15. ASSET IMPAIRMENT AND OTHER (CREDITS) CHARGES
During the 2001 Equity Participation Plan at prices which were below market value atthird quarter of 2006, the time of grant.Company reevaluated the remaining liability relating to its restructuring program initiated in 2002. The Company determined that the liability was no longer needed as all office space included in the restructuring liability is now being fully utilized by the Company in its operations. As a result, the Company recorded non-cash compensation expensea credit of $0.8$0.4 million $2.0 millionwhich is shown in asset impairment and $3.3 million forother (credits) charges in the years ended December 31, 2003, 2002 and 2001, respectively.Consolidated Statement of Operations.
As required by SFAS 123,During 2005, the Company has determined the pro-forma effect of the options granted had the Company accounted for stock options granted under the fair value method of SFAS 123.
A summary of the status of the Company’s stock option plans including their weighted average exercise price is as follows:
| 2003 | 2002 | 2001 | ||||||||||||||||
| Shares | Price | Shares | Price | Shares | Price | |||||||||||||
| (shares in thousands) | ||||||||||||||||||
Outstanding at beginning of year | 2,848 | $ | 11.37 | 3,824 | $ | 20.57 | 3,090 | $ | 16.97 | |||||||||
Granted | 1,630 | $ | 2.20 | 2,445 | $ | 10.17 | 1,748 | $ | 23.34 | |||||||||
Exercised/redeemed | (34 | ) | $ | 1.26 | (145 | ) | $ | 0.93 | (588 | ) | $ | 4.26 | ||||||
Forfeited/canceled | (656 | ) | $ | 9.78 | (3,276 | ) | $ | 21.59 | (426 | ) | $ | 27.65 | ||||||
Outstanding at end of year | 3,788 | $ | 7.79 | 2,848 | $ | 11.37 | 3,824 | $ | 20.57 | |||||||||
Options exercisable at end of year | 1,235 | $ | 12.66 | 993 | $ | 12.63 | 1,617 | $ | 14.12 | |||||||||
Weighted average fair value of options granted during the year | $ | 2.20 | $ | 6.63 | $ | 27.37 | ||||||||||||
Option groups outstanding at December 31, 2003 and related weighted average exercise price and remaining life, in years, information are as follows:
Options Outstanding | Options Exercisable | |||||||||
Range | Outstanding (in thousands) | Weighted Average Contractual Life | Weighted Average | Exercisable ( in thousands) | Weighted Average | |||||
$ 0.05 – $ 4.00 | 1,890 | 8.7 | $ 2.13 | 249 | $ 2.19 | |||||
$ 5.37 – $ 9.75 | 1,060 | 5.3 | $ 8.03 | 464 | $ 8.06 | |||||
$10.17 – $13.35 | 311 | 7.0 | $12.40 | 92 | $12.14 | |||||
$15.25 – $24.75 | 303 | 4.9 | $17.31 | 262 | $16.62 | |||||
$26.63 – $51.94 | 224 | 2.5 | $35.12 | 168 | $35.03 | |||||
| 3,788 | $ 7.79 | 1,235 | $12.66 | |||||||
The Company has various stock-based employee compensation plans. From time to time, options to purchase Class A common stock have been granted under the Company’s 1999 Equity Participation Plan and the 2001 Equity Participation Plan which were below market value at the time of the grant. The Company recorded non-cash compensation expense of $0.8 million, $2.0 million and $3.3 million for the years ended December 31, 2003, 2002 and 2001, respectively. Except for the amount of non-cash compensation recognized, no other stock-based employee compensation cost is reflected in net loss, as all other options granted under the Company’s stock-based employee compensation plans had an exercise price equal to, or in excess of, the market value of the underlying common stock on the date of grant.
The Black-Scholes option-pricing model was used with the following assumptions:
| For the years ended December 31, | |||||||||
| 2003 | 2002 | 2001 | |||||||
Risk free interest rate | 2.0 | % | 3.25 | % | 4.5 | % | |||
Dividend yield | 0 | % | 0 | % | 0 | % | |||
Expected volatility | 90 | % | 171 | % | 99 | % | |||
Expected lives | 4 years | 4 years | 4 years | ||||||
The following table illustrates the effect on net loss and loss per share as if the Company had applied the fair value recognition provisions of SFAS 123, to stock-based employee compensation:
| For the years ended December 31, | ||||||||||||
| 2003 | 2002 | 2001 | ||||||||||
| (in millions) | ||||||||||||
Net loss, as reported | $ | (172.2 | ) | $ | (249.0 | ) | $ | (125.8 | ) | |||
Non-cash compensation charges included in net loss | 0.8 | 2.0 | 3.3 | |||||||||
Incremental stock-based employee compensation expense determined under fair value based method for all awards, net of related tax effects | (4.2 | ) | (6.2 | ) | (19.9 | ) | ||||||
Pro forma net loss | $ | (175.6 | ) | $ | (253.2 | ) | $ | (142.4 | ) | |||
Loss per shares | ||||||||||||
Basic and diluted – as reported | $ | (3.30 | ) | $ | (4.93 | ) | $ | (2.66 | ) | |||
Basic and diluted – pro forma | $ | (3.36 | ) | $ | (5.01 | ) | $ | (3.01 | ) | |||
The effect of applying SFAS 123 in the pro-forma disclosure is not necessarily indicative of future results.
17. RESTRUCTURING AND OTHER CHARGES
In response to capital market conditions in the telecommunications industry during the past three years, the Company has implemented various restructuring plans discussed below.
Restructuring expense consisted of the following during these three years:
| For the years ended December 31, | |||||||||
| 2003 | 2002 | 2001 | |||||||
| (in thousands) | |||||||||
Abandonment of new tower build and acquisition work-in-process and related construction materials | $ | 635 | $ | 40,380 | $ | 24,088 | |||
Employee separation and exit costs | 1,870 | 6,907 | 311 | ||||||
| $ | 2,505 | $ | 47,287 | $ | 24,399 | ||||
In August 2001, in response to deteriorating capital market conditions within the telecommunications industry, the Company implemented a plan of restructuring primarily associated with the downsizing ofreevaluated its new tower build construction activities. The plan included the abandonment of certain acquisition and new tower build sites resulting in a non-cash charge of approximately $24.1 million. The plan also included the elimination of 102 employee positions and closing and/or consolidation of selected offices. Payments made related to employee separation and office closings were approximately $0.3 million.
In February 2002, as a result of the continuing deterioration of capital market conditions for wireless carriers, the Company further reduced its capital expenditures for new tower development and acquisition activities, suspended any material new investment for additional towers, reduced its workforce and closed or consolidated offices. Under then existing capital market conditions, the Company did not anticipate building or buying a material number of new towers beyond those it was currently contractually obligated to build or buy, thereby resulting in the abandonment of a majority of its existing new tower build and acquisition work in process during 2002. In connection with this restructuring, a portion of the Company’s workforce was reduced and certain offices were closed, substantially all of which were primarily dedicated to new tower development activities. As a result of the implementation of its plans, the Company recorded a restructuring charge of $47.3 million in accordance with SFAS 144, and Emerging Issues Task Force 94-3,Liability Recognition for Certain Employee Termination Benefits and Other Costs to Exit an Activity, including Certain Costs Incurred in a Restructuring. Of the $47.3 million restructuring charge recorded during the year ended December 31, 2002, approximately $40.4 million related to the abandonment of new tower build and acquisition work in process and related construction materials on approximately 764 sites. The remaining $6.9 million of restructuring expense related primarily to the costs of employee separation for approximately 470 employees and exit costs associated with the closing and consolidation of approximately 40 offices. The accrual of approximately $1.0 million remaining at December 31, 2003, with respect to the 2002 plan, relates primarily to remaining obligations through the year 2012 associated with offices exited or downsized as part of this plan.
The following summarizes the activity during the year ended December 31, 2003, related to the 2002 and 2001 restructuring plans:
| Accrued as of January 1, 2003 | Restructuring Charges | Payments/ Adjustments | Payments Related to January 1, 2003 Accrual | Accrual as of December 31, 2003 | |||||||||||||||||
| Cash | Non-Cash | ||||||||||||||||||||
| (in thousands) | |||||||||||||||||||||
Abandonment of new tower build work in process | $ | — | $ | 59 | $ | $ | (59 | ) | $ | — | $ | — | |||||||||
Employee separation and exit costs | 1,706 | 122 | (167 | ) | 45 | (666 | ) | 1,040 | |||||||||||||
| $ | 1,706 | $ | 181 | $ | (167 | ) | $ | (14 | ) | $ | (666 | ) | $ | 1,040 | |||||||
In 2003, in response to the continued deterioration in expenditures by wireless service providers, particularly with respect to site development activities, the Company committed to new plans of restructuring associated with further downsizing activities, including reduction in workforce and closing or consolidation of offices. As a result of the implementation of its plans, the Company recorded a restructuring charge of $2.5 million during the year ended December 31, 2003, in accordance with SFAS 146. Of the $2.5 million charge recorded during the year ended December 31, 2003, approximately $0.6 million related to the abandonment of new tower build work in process. The remaining $1.9 million related primarily to the costs of employee separation for approximately 165 employees and exit costs associated with the closing or consolidation of approximately 17 offices. In connection with employee separation costs, the Company paid approximately $0.7 million in one-time termination benefits. Of the $2.5 million in expense recorded during the year ended December 30, 2003, $2.4 million pertains to the Company’s site development segment and $0.1 million pertains to the Company’s site leasing segment.
The following summarizes the activity related to the 2003 restructuring plan for the year ended December 31, 2003:
Restructuring Charges | Payments/ Adjustments | Accrual as of December 31, 2003 | ||||||||||||
| Cash | Non-Cash | |||||||||||||
| (in thousands) | ||||||||||||||
Abandonment of new tower build work in process | $ | 576 | $ | — | $ | (576 | ) | $ | — | |||||
Employee separation and exit costs | 1,748 | (1,012 | ) | (736 | ) | — | ||||||||
| $ | 2,324 | $ | (1,012 | ) | $ | (1,312 | ) | $ | — | |||||
18. ASSET IMPAIRMENT CHARGES
In accordance with SFAS 144, long-lived assets consisting primarily of tower assets are reviewed for impairment whenever events or changes in circumstances indicate that the carrying amount of an asset may not be recoverable. If an asset is determined to be impaired, the loss is measured by the excess of the carrying amount of the asset over its fair value as determined by an estimate of discounted future cash flows. Estimates and assumptions inherent in the impairment evaluation include, but are not limited to, general market conditions, historical operating results, lease-up potential and expected timing of lease-up. During the second and fourth quarters of 2003, the Company modified its futureflow expectations on one tower lease-up assumptions for certain tower assets that had not achieved expected lease-uplease up results. The changes toresulting change in fair value of this tower, as determined using a discounted cash flow analysis, resulted in an impairment charge of $0.2 million. By comparison, in 2004 the Company reevaluated its future cash flow expectations on ten towers and the resultingother related equipment that had not achieved expected lease up results. The change in the fair value of these towers, as determined using a discounted cash flow analysis, resulted in an impairment charge of $10.3 million during$2.6 million.
Additionally in 2004, the second quarterCompany reevaluated its future cash flow expectations on three microwave networks utilized by its customers. One of 2003 related to approximately 40 operating towers and an impairment chargethese customers rejected their microwave backhaul agreements under the settlement plan approved as part of $6.2 million duringtheir bankruptcy. The other customer notified the Company in the fourth quarter of 2003 related2004 of their intention not to approximately 30renew their agreement upon expiration. An analysis of these networks resulted in a remote possibility of other customers utilizing the network. As a result, the Company wrote down the value of the underlying equipment utilized in these networks and recorded a charge of $4.5 million. Furthermore, in the fourth quarter of 2005, the Company determined that the remaining microwave network equipment has no residual value and recorded an additional operating towers.charge of $0.2 million. These amounts are included in asset impairment charges in the Consolidated Statement of Operations for the yearyears ended December 31, 2003.2004 and 2005, respectively.
During the firstsecond quarter of 2003, tower assets2004, the Company identified 14 towers previously impairedclassified as held for sale and included in 2002 were evaluated under the provisionsdiscontinued operations and reclassified them into continuing operations as of recently adopted SFAS 143 as to the existence of asset retirement obligations. In connection with the adoption of SFAS 143, effective January 1, 2003, approximately $0.5 million of additional tower costs were capitalized to the previously impaired assets effective January 1, 2003. The recoverability of the capitalized tower costs were evaluatedJune 30, 2004 in accordance with the provisions of SFAS 144, and determined to be impaired. As discussed above, during“Accounting for the second and fourth quartersImpairment or Disposal of 2003, the Company identified approximately 70 operating towers that were determined to be impaired.
During the first and second quarters of 2002, the Company recorded goodwill totaling approximately $9.2 million resulting from the achievement of certain earn-out obligations under various construction acquisition agreements entered into prior to July 1, 2001. In accordance with SFAS 142, goodwill is subject to an impairment assessment at least annually, or at any time that indicators of impairment are present. The Company determined that as of June 30, 2002, indicators of impairment were present, thereby requiring an impairment analysis be completed. The indicators of impairment during the quarter ended June 30, 2002 giving rise to this analysis included significant deterioration of overall Company value, continued negative trends with respect to wireless carrier capital expenditure plans and related demand for wireless construction services, and perceived reduction in value of similar site development construction services businesses.Long-Lived Assets”. As a result of this analysis, using a discounted cash flow valuation methodreclassification, the book value of the towers were recorded at the lower of (1) the carrying amount of the tower before it was classified as held for estimatingsale, net of any depreciation expense that would have been recognized had the asset never been classified as held for sale; or (2) the estimated fair value $9.2of the tower at the date of the subsequent decision not to sell. As a result of applying SFAS 144, the Company increased the book value of these towers by $0.3 million, and recorded this credit as a net reduction to asset impairment charges in the Consolidated Statements of goodwill withinOperations for the year ended December 31, 2004.
16.ACCUMULATED OTHER COMPREHENSIVE INCOME (LOSS)
Accumulated other comprehensive income (loss) has no impact on the Company’s net loss but is reflected in the consolidated balance sheet through adjustments to shareholders’ equity (deficit). Accumulated other comprehensive income (loss) derives from the amortization of deferred gain/loss from settlement of derivative financial statements relating to the CMBS Certificates issuance and minimum pension liability relating to the Company’s pension plan (see note 21). We specifically identify the amount of the amortization of deferred gain/loss from settlement of derivative financial statements recognized in other comprehensive loss from settlement of derivative financial statements. A rollforward of accumulated other comprehensive income (loss) for the year ended December 31, 2006 and 2005 is as follows:
| Deferred Gain/(Loss) from Settlement of Derivative Financial Instruments | Minimum Pension Liability Adjustment | Total | |||||||||
| (in thousands) | |||||||||||
Balance December 31, 2004 | $ | — | $ | — | $ | — | |||||
Deferred gain from settlement of terminated swaps | 14,774 | — | 14,774 | ||||||||
Amortization of deferred gain from settlement of terminated swaps | (314 | ) | — | (314 | ) | ||||||
Balance December 31, 2005 | 14,460 | — | 14,460 | ||||||||
Deferred loss from settlement of terminated swaps | (12,836 | ) | — | (12,836 | ) | ||||||
Amortization of deferred gain/loss from settlement of terminated swaps, net | (2,370 | ) | — | (2,370 | ) | ||||||
Minimum pension liability adjustment | 80 | 80 | |||||||||
Balance December 31, 2006 | $ | (746 | ) | $ | 80 | $ | (666 | ) | |||
There is no net tax impact for the components of other comprehensive income (loss) due to the valuation allowance on the Company’s deferred tax assets.
17. DISCONTINUED OPERATIONS
In March 2003 certain of the Company's subsidiaries entered into a definitive agreement (the "Western tower sale") to sell up to an aggregate of 801 towers, which represented substantially all of the Company's towers in the Western two-thirds of the United States. The Company ultimately sold 784 of the 801 towers as part of the Western tower sale, representing all but three of the 787 total towers sold in 2003. On April 29, 2004, the Company received notification from the purchaser of the Western towers as to certain claims for indemnification totaling approximately $4.3 million. In December 2004, the claims for indemnification of $4.3 million were settled for $2.8 million and this amount was released to the purchaser of the Western towers. The remaining $1.5 million was released to the Company in December 2004. The Company recorded a charge of $2.1 million in 2004 relating to the settlement of the claims, which is included in discontinued operations, net of income taxes in the Consolidated Statement of Operations.
During the year ended December 31, 2004, the Company sold or disposed of 41 of the 61 towers held for sale at December 31, 2003, and reclassified 14 towers back to continuing operations, leaving six towers accounted for as discontinued operations as of December 31, 2004. These six towers were sold in the first two quarters of 2005. Gross proceeds realized from the sale of towers during the years ended December 31, 2005 and 2004 were $0.2 million and $1.2 million, respectively. These sales resulted in a gain of approximately $0.1 million and a loss on sale of approximately $1.6 million for the years ended December 31, 2005 and 2004, which is included in loss from discontinued operations, net of income taxes in the accompanying Consolidated Statement of Operations.
The following is a summary of the operating results of the discontinued operations relating to the Western tower sale and the 47 additional towers accounted for as discontinued operations:
| For the year ended December 31, | |||||||||||
| 2006 | 2005 | 2004 | |||||||||
| (in thousands) | |||||||||||
Revenues | $ | — | $ | 16 | $ | 168 | |||||
Loss from operations, net of income taxes | $ | — | $ | (43 | ) | $ | (270 | ) | |||
Gain (loss) on disposal of discontinued operations, net of income taxes | — | 101 | (1,622 | ) | |||||||
Gain (loss) from discontinued operations, net of income taxes | $ | — | $ | 58 | $ | (1,892 | ) | ||||
In May 2004, the Company’s Board of Directors approved a plan of disposition related to site development services operations (including both the site development consulting and site development construction reporting segment was determined to be impaired assegments) in the Western portion of the United States (“Western site development services”). In June 30, 20022004, two business units were sold, and was written off.
two business units were abandoned within the Western site development services unit. In the firstthird quarter of 2002, certain tower sites held2004, the remaining two site development construction business units within the Western site development services unit were sold. Gross proceeds realized from sale during 2004 were $0.4 million, and used ina loss on disposal of discontinued operations were considered to be impaired. Towers determined to be impaired were primarily towers with no tenants and little or no prospects for future lease-up. An asset impairment charge of approximately $16.4$0.8 million was recorded during 2004.
The following is a summary of the first quarteroperating results of 2002.the discontinued operations relating to the Western site development services:
| For the year ended December 31, | |||||||||||
| 2006 | 2005 | 2004 | |||||||||
| (in thousands) | |||||||||||
Revenues | $ | — | $ | 51 | $ | 14,280 | |||||
Loss from operations, net of income taxes | $ | — | $ | (119 | ) | $ | (578 | ) | |||
Loss on disposal of discontinued operations, net of income taxes | — | — | (787 | ) | |||||||
Loss from discontinued operations, net of income taxes | $ | — | $ | (119 | ) | $ | (1,365 | ) | |||
No interest expense has been allocated to discontinued operations for the years ended December 31, 2006, 2005 and 2004. At December 31, 2006 and December 31, 2005, there were no assets or liabilities held for sale. The notes to the consolidated financial statements for all years presented have been adjusted for the discontinued operations described above.
19. 18.INCOME TAXES
The provision (benefit) for income taxes from continuing operations consists of the following components:
| For the years ended December 31, | ||||||||||||
| 2003 | 2002 | 2001 | ||||||||||
| (in thousands) | ||||||||||||
Current provision (benefit) for taxes: | ||||||||||||
Federal income tax | $ | 125 | $ | (1,382 | ) | $ | — | |||||
State and local taxes | 1,695 | 1,691 | 1,493 | |||||||||
Total current | 1,820 | 309 | 1,493 | |||||||||
Deferred provision (benefit) for taxes: | ||||||||||||
Federal income tax | (58,122 | ) | (57,000 | ) | (39,868 | ) | ||||||
State and local taxes | 7,728 | (3,767 | ) | (1,528 | ) | |||||||
Increase in valuation allowance | 50,394 | 60,767 | 41,396 | |||||||||
Total deferred | — | — | — | |||||||||
Total | $ | 1,820 | $ | 309 | $ | 1,493 | ||||||
| For the year ended December 31, | ||||||||||||
| 2006 | 2005 | 2004 | ||||||||||
| (in thousands) | ||||||||||||
Current provision for taxes: | ||||||||||||
Federal income tax | $ | — | $ | — | $ | — | ||||||
State and local taxes | 470 | 2,104 | 710 | |||||||||
Total current | 470 | 2,104 | 710 | |||||||||
Deferred provision (benefit) for taxes: | ||||||||||||
Federal income tax | (53,747 | ) | (30,686 | ) | (44,937 | ) | ||||||
State and local taxes | (13,827 | ) | (3,259 | ) | (10,622 | ) | ||||||
Increase in valuation allowance | 67,621 | 33,945 | 55,559 | |||||||||
Total deferred | 47 | — | — | |||||||||
Total | $ | 517 | $ | 2,104 | $ | 710 | ||||||
A reconciliation of the provision (benefit) for income taxes from continuing operations at the statutory U.S. Federal tax rate (34%(35%) and the effective income tax rate is as follows:
| For the years ended December 31, | ||||||||||||
| 2003 | 2002 | 2001 | ||||||||||
| (in thousands) | ||||||||||||
Statutory Federal benefit | $ | (55,119 | ) | $ | (62,653 | ) | $ | (41,513 | ) | |||
State and local taxes | 6,219 | (1,371 | ) | (23 | ) | |||||||
Cumulative effect of changes in accounting principle | — | 3,018 | — | |||||||||
Other | 326 | 395 | 367 | |||||||||
Goodwill amortization | — | 153 | 1,266 | |||||||||
Valuation allowance | 50,394 | 60,767 | 41,396 | |||||||||
| $ | 1,820 | $ | 309 | $ | 1,493 | |||||||
| For the year ended December 31, | ||||||||||||
| 2006 | 2005 | 2004 | ||||||||||
| (in thousands) | ||||||||||||
Statutory Federal benefit | $ | (46,526 | ) | $ | (31,466 | ) | $ | (48,726 | ) | |||
State and local taxes | (13,827 | ) | (762 | ) | (6,542 | ) | ||||||
Federal rate differential | (3,847 | ) | — | — | ||||||||
Other | (2,904 | ) | 387 | 419 | ||||||||
Valuation allowance | 67,621 | 33,945 | 55,559 | |||||||||
| $ | 517 | $ | 2,104 | $ | 710 | |||||||
The components of the net deferred income tax asset (liability) accounts are as follows:
| As of December 31, | ||||||||
| 2003 | 2002 | |||||||
| (in thousands) | ||||||||
Allowance for doubtful accounts | $ | 759 | $ | 1,922 | ||||
Deferred revenue | 4,465 | 8,555 | ||||||
Accrued liabilities | 5,654 | 4,612 | ||||||
Other | 48 | 106 | ||||||
Valuation allowance | (10,926 | ) | (15,195 | ) | ||||
Current net deferred taxes | $ | — | $ | — | ||||
Original issue discount | $ | 13,028 | $ | 44,559 | ||||
Net operating loss | 198,385 | 96,731 | ||||||
Book vs. tax depreciation | (34,566 | ) | (38,726 | ) | ||||
Straight-line rents | (6,152 | ) | (4,930 | ) | ||||
Other | 2,323 | 5,720 | ||||||
Valuation allowance | (173,018 | ) | (103,354 | ) | ||||
Non-current net deferred taxes | $ | — | $ | — | ||||
| As of December 31, | ||||||||
| 2006 | 2005 | |||||||
| (in thousands) | ||||||||
Allowance for doubtful accounts | $ | 477 | $ | 370 | ||||
Deferred revenue | 10,583 | 4,675 | ||||||
Accrued liabilities | 4,059 | 3,661 | ||||||
Valuation allowance | (15,119 | ) | (8,706 | ) | ||||
Current net deferred taxes | $ | — | $ | — | ||||
Original issue discount | — | 13,476 | ||||||
Net operating loss | 354,459 | 245,585 | ||||||
Property, equipment & intangible basis differences | (265,295 | ) | (6,827 | ) | ||||
Straight-line rents | 6,440 | 5,792 | ||||||
Early extinguishment of debt | (284 | ) | 5,249 | |||||
Other | 3,792 | 2,399 | ||||||
Valuation allowance | (99,112 | ) | (265,674 | ) | ||||
Non-current net deferred taxes | $ | — | $ | — | ||||
The Company has recorded a valuation allowance for deferred tax assets as management believes that it is not “more"more likely than not”not" that the Company will be able to generate sufficient taxable income in future periods to recognize the assets.
The net change in the valuation allowance for the years ended December 31, 2006, 2005 and 2004 was $(160.1) million, $(3.7) million, and $57.9 million, respectively. In addition, $31.9 million of the valuation allowance may be utilized in future periods to reduce intangible assets recorded in connection with the acquisition of AAT.
The Company has available at December 31, 2003,2006, a net federal operating tax loss carry-forward of approximately $583.5 million. Approximately $8.6 million, $35.8 million, $105.7 million, $140.0 million and $293.4$957.5 million of which approximately $61.3 million will benefit additional paid in capital when the loss is utilized. These net operating tax loss carry-forwards will expire in 2019,between 2020 2021 2022, and 2023, respectively.2026. The Internal Revenue Code places limitations upon the future availability of net operating losses based upon changes in the equity of the Company. If these occur, the ability for the Company to offset future income with existing net operating losses may be limited.
20. DERIVATIVE FINANCIAL INSTRUMENT
The Company previously had an interest rate swap agreement to manage its exposure to interest rate movements by effectively converting a portion of its fixed rate senior notes to variable rates. The swap qualified as a fair value hedge.
The notional principal amount of the swap was $100.0 million and the maturity date and payment provisions matched that of the underlying senior notes. The swap was to mature in seven years and provided for the exchange of fixed rate payments for variable rate payments without the exchange of the underlying notional amount. The variable rates were based on six-month EURO plus 4.47% and were reset on a semi-annual basis. The differential between fixed and variable rates to be paid or received was accrued as interest rates changed in accordance with the agreement and were recognized as an adjustment to interest expense. The Company recorded a reduction of approximately $3.1 million to interest expense during the year ended December 31, 2002 as a result of the differential between fixed and variable rates.
The counter-party to the interest rate swap agreement terminated the swap agreement in October 2002. In connection with this termination, the counter-party paidaddition the Company $6.2 million, which included approximately $0.8 million in accrued interest. The remaining approximately $5.4 million received was deferred and is being recognized as a reduction to interest expense over the remaining term of the senior notes using the effective interest method. Amortization of the deferred gain during 2003 and 2002 was approximately $0.7 million and $0.2 million, respectively. The remaining deferred gain balancehas available at December 31, 20032006, a net state operating tax loss carry-forward of approximately $742.1 million. These net operating tax loss carry-forwards will expire between 2007 and 2002 of $4.5 million and $5.2 million, respectively is included in long-term debt in the Consolidated Balance Sheets.
21.19. COMMITMENTS AND CONTINGENCIES
a.Operating Leases
The Company is obligated under various non-cancelable operating leases for land, office space, vehicles and equipment, and site leases that expire at various times through May 2100.December 2105. The annual minimum lease payments under non-cancelable operating leases in effect as of December 31, 20032006 are as follows:
| (in thousands) | |||
2004 | $ | 26,195 | |
2005 | 20,162 | ||
2006 | 13,596 | ||
2007 | 10,477 | ||
2008 | 7,930 | ||
Thereafter | 46,620 | ||
Total | $ | 124,980 | |
For the year ended December 31, | (in thousands) | ||
2007 | $ | 44,395 | |
2008 | 44,672 | ||
2009 | 44,074 | ||
2010 | 43,310 | ||
2011 | 42,352 | ||
Thereafter | 791,458 | ||
Total | $ | 1,010,261 | |
Principally, all of the leases provide for renewal at varying escalations. Fixed rate escalations have been included in the table disclosed above.
Rent expense for operating leases was $29.5$47.5 million, $29.3$32.6 million and $23.3$33.0 million for the years ended December 31, 2003, 2002,2006, 2005 and 2001,2004, respectively. The rent expense of $29.5 million and $29.3 million for the years ended December 31, 2003 and 2002, respectively, excludes $0.8 million and $2.4 million, respectively, which is included in restructuring and other charges. In addition, certain of the Company’sCompany's leases include contingent rent provisions which provide for the lessor to receive additional rent upon the attainment of certain tower operating results and/or lease-up. Contingent rent expense for the yearsyear ended December 31, 2003, 20022006, 2005 and 20012004 was $1.4$5.3 million, $1.6$2.2 million and $0.8$2.0 million, respectively.
b.Tenant Leases
The annual minimum tower lease income to be received for tower space and antenna rental under non-cancelable operating leases in effect as of December 31, 20032006 are as follows:
| (in thousands) | |||
2004 | $ | 129,114 | |
2005 | 108,744 | ||
2006 | 79,291 | ||
2007 | 50,669 | ||
2008 | 30,840 | ||
Thereafter | 44,850 | ||
Total | $ | 443,508 | |
For the year ended December 31, | (in thousands) | ||
2007 | $ | 251,575 | |
2008 | 224,397 | ||
2009 | 191,697 | ||
2010 | 136,344 | ||
2011 | 59,859 | ||
Thereafter | 62,942 | ||
Total | $ | 926,814 | |
Principally, all of the leases provide for renewal, generally at the tenant’stenant's option, at varying escalations. Fixed rate escalations have been included in the table disclosed above.
c.Employment Agreements
The Company has employment agreements with certain officers of the Company that grant these employees the right to receive their base salary and continuation of certain benefits, for a defined period of time, in the event of a termination, as defined by the agreement of such employees. In connection with one of these agreements, the Company was obligated to pay an amount equal to the difference between $1.0 million and the value of all vested options and restricted stock belonging to a particular officer on September 19, 2003. The Company had the option of settling the obligation in cash or shares of Class A common stock. This obligation was settled in September 2003 in cash for $0.9 million. This amount had been expensed over the three year period of the original agreement which ended in September 2003 as non cash compensation expense.
d.Litigation
The Company is involved in various claims, lawsuits and proceedings arising in the ordinary course of business. While there are uncertainties inherent in the ultimate outcome of such matters and it is impossible to presently determine the ultimate costs that may be incurred, management believes the resolution of such uncertainties and the incurrence of such costs will not have a material adverse effect on the Company’sCompany's consolidated financial position, results of operations or liquidity.
e.d.Contingent Purchase Obligations
TheFrom time to time, the Company sometimes agrees to pay additional acquisition purchase price consideration for acquisitions if the towers or businesses that are acquired meet or exceed certain earnings or new towerperformance targets in the 1-3 years after they have been acquired. As of December 31, 2003,2006, the Company hadhas an obligation to pay up to an additional $1.4$4.8 million in consideration if the earnings targets contained in various acquisition agreements are met. This obligation wasThese obligations are associated with acquisitions within the Company’s site leasing segment. AtOn certain acquisitions, at the Company’s option, a majority of the additional consideration may be paid in cash or shares of Class A common stock. The Company records such obligations as additional consideration when it becomes probable that the earnings targets will be met. As ofFor the year ended December 31, 2002,2006, 2005 and 2004 certain earnings targets associated with an acquisition within the site development construction segmentacquired towers were achieved, and therefore, the Company accrued approximately $2.0 million, within other current liabilities on the December 31, 2002 Consolidated Balance Sheet. This amount was paid in cash in February 2003.$2.1 million, $0.2 million and $0.6 million, respectively. In addition, approximately $1.1 million in cash was paid duringfor the year ended December 31, 2003 associated with2006 and December 31, 2005, the Company issued approximately 13,000 shares and 24,000 shares, respectively of Class A common stock in settlement of contingent price amounts payable as a result of acquired towers meeting or exceeding new tower targets during 2003.
certain performance targets.
22.20. DEFINED CONTRIBUTION PLAN
The Company has a defined contribution profit sharing plan under Section 401 (k)401(k) of the Internal Revenue Code that provides for voluntary employee contributions of 1%up to 14%$15,000 of compensation. Employees have the opportunity to participate following completion of three months of employment and must be 21 years of age. Employer matching begins after completion of one year of service.immediately upon the employee’s participation in the plan. For the years ended December 31, 20032006, 2005 and 2002,2004, the Company made a discretionary matching contribution of 50% of an employee’semployee's contributions up to a maximum of $3,000. ForCompany matching contributions were approximately $0.5 million for each of the three years ended December 31, 2006, 2005 and 2004, respectively.
21. PENSION BENEFITS
The Company has a defined benefit pension plan (the “Pension Plan”) for all employees of AAT Communications hired on or before January 1, 1996. AAT ceased all benefit accruals for active participants on December 31, 1996. The Pension Plan was included in the acquisition of AAT Communications by the Company on April 27, 2006. The Pension Plan provides for defined benefits based on the number of years of service and average salary.
In December 2006, the Company adopted the recognition and disclosure provisions of SFAS No. 158, which required us to recognize assets for all of our overfunded postretirement benefit plans and liabilities for our underfunded plans at December 31, 2006, with a corresponding noncash adjustment to accumulated other comprehensive loss, net of tax, in stockholders’ equity. The funded status is measured as the difference between the fair value of the plan’s assets and the projected benefit obligation (PBO) of the plan. The adjustment to stockholders’ equity represents the net unrecognized actuarial losses and prior service costs in accordance with SFAS No. 87.
The unrecognized amounts recorded in accumulated other comprehensive loss will be subsequently recognized as net periodic pension cost. Actuarial gains and losses that arise in future periods and are not recognized as net periodic pension cost in those periods will be recognized as increases or decreases in other comprehensive income, net of tax, in the period they arise. Actuarial gains and losses recognized in other comprehensive income are adjusted as they are subsequently recognized as a component of net periodic pension cost.
The incremental impact of adopting the provisions of SFAS No. 158 on our balance sheet at December 31, 2006 was to record $0.1 million of liability which is recorded in other long term liabilities and in accumulated other comprehensive income on the Company’s Consolidated Balance Sheet. The adoption of FAS 158 had no effect on our statements of earnings or cash flows for the year ended December 31, 2001,2006, or for any prior period presented, and will not affect our operating results in future periods. Included in accumulated other comprehensive loss at December 31, 2006 is approximately $0.1 million of losses not yet recognized through the Company made a discretionary matching contributionConsolidated Statement of 50%Operations. None of an employee’s contributions upthis amount is expected to a maximumbe reclassified into the Consolidated Statement of $1,000. Company matching contributionsOperations from accumulated other comprehensive income during 2007.
The following table includes the components of pension costs, the fair value of plan assets, and the funded status of the Pension Plan for the period of April 27 through December 31, 2006 ( in thousands):
Change in benefit obligation | ||||
Obligation at April 27, 2006 | $ | 1,849 | ||
Interest Cost | 66 | |||
Actuarial loss | (57 | ) | ||
Benefit payments | (110 | ) | ||
Obligation at end of year | $ | 1,748 | ||
Change in fair value of plan assets | ||||
Fair value of plan assets at April 27, 2006 | $ | 1,532 | ||
Actual return on plan assets | 84 | |||
Employer contributions | 130 | |||
Benefits payments and plan expenses | (110 | ) | ||
Fair value of plan assets at end of year | $ | 1,636 | ||
The accumulated benefit obligation for the Pension Plan at the acquisition date was approximately $1.8 million. Information for the benefit obligations relative to the fair value of the Pension Plan’s assets is as follows as of December 31, 2006 (in thousands):
Projected benefit obligation | $ | 1,748 | ||
Accumulated benefit obligation | $ | 1,748 | ||
Fair value of plan assets | $ | 1,636 | ||
| Assumptions used to determined benefit obligations: | ||||
Discount rate | 5.50 | % | ||
The following table summarizes the components of net period pension costs (in thousands):
Interest Cost | $ | (66 | ) | |
Expected return on plan assets | 62 | |||
Amortization of actuarial net loss | — | |||
Net periodic pension cost | $ | (4 | ) | |
Assumptions used for net benefit cost: | ||||
Discount rate | 5.50 | % | ||
Expected long-term reate of return on plan assets | 6.00 | % | ||
Benefits paid by the Pension Plan were approximately $0.4 million, $0.8 million and $0.6$0.1 million for the years endedperiod from April 27, 2006 to December 31, 2003, 20022006. The Company expects to contribute $0.1 million to the Pension Plan in fiscal year 2007. The Pension Plan’s assets were invested in approximately 39% equity securities, 34% fixed income securities, and 2001, respectively.27% in other securities at December 31, 2006.
Investment policies and strategies governing the assets of the plans are designed to achieve investment objectives within prudent risk parameters. Risk management practices include the use of external investment managers and the maintenance of a portfolio diversified by asset class, investment approach and security holdings, and the maintenance of sufficient liquidity to meet benefit obligations as they come due.
The overall expected long-term rate of return on assets has been derived from the return assumptions for each of the investment sectors, applied to investments held at the acquisition date.
The following table summarizes the future expected pension benefits to be paid:
Year ending December 31 (in thousands): | |||
2007 | $ | 104 | |
2008 | 111 | ||
2009 | 114 | ||
2010 | 112 | ||
2011 | 118 | ||
Five years therafter | 553 | ||
Total | $ | 1,112 | |
23.22. SEGMENT DATA
The Company operates principally in three business segments: site leasing, site development consulting, and site development construction, and site leasing.construction. The Company’sCompany's reportable segments are strategic business units that offer different services. They are managed separately based on the fundamental differences in their operations. The site leasing segment includes results of the managed and sublease businesses. Revenues, gross profit,cost of revenues (exclusive of depreciation, accretion and amortization), capital expenditures (including assets acquired through the issuance of shares of the Company’sCompany's Class A common stock) and identifiable assets pertaining to the segments in which the Company continues to operate are presented below:
| Site Leasing | Site Development Consulting | Site Development Construction | Assets Not Identified by Segment | Total | |||||||||||
For the year ended December 31, 2003 | |||||||||||||||
Revenues | $ | 127,842 | $ | 18,092 | $ | 66,126 | $ | — | $ | 212,060 | |||||
Cost of revenues | 42,021 | 16,723 | 61,087 | — | 119,831 | ||||||||||
Gross profit | 85,821 | 1,369 | 5,039 | — | 92,229 | ||||||||||
Capital expenditures | 15,105 | 124 | 2,458 | 575 | 18,262 | ||||||||||
For the year ended December 31, 2002 | |||||||||||||||
Revenues | $ | 115,081 | $ | 27,204 | $ | 97,837 | $ | — | $ | 240,122 | |||||
Cost of revenues | 40,650 | 20,594 | 81,879 | — | 143,123 | ||||||||||
Gross profit | 74,431 | 6,610 | 15,958 | — | 96,999 | ||||||||||
Capital expenditures | 93,999 | 430 | 21,487 | 1,565 | 117,481 | ||||||||||
For the year ended December 31, 2001 | |||||||||||||||
Revenues | $ | 85,487 | $ | 24,251 | $ | 115,484 | $ | — | $ | 225,222 | |||||
Cost of revenues | 30,657 | 17,097 | 91,435 | — | 139,189 | ||||||||||
Gross profit | 54,830 | 7,154 | 24,049 | — | 86,033 | ||||||||||
Capital expenditures | 536,151 | 1,794 | 34,125 | 4,430 | 576,500 | ||||||||||
Assets | |||||||||||||||
As of December 31, 2003 | $ | 897,880 | $ | 9,511 | $ | 46,807 | $ | 28,784 | $ | 982,982 | |||||
As of December 31, 2002 | 958,684 | 13,294 | 54,755 | 276,632 | 1,303,365 | ||||||||||
Assets not identified by segment consist primarily of assets held for sale and general corporate assets.
The Company has client concentrations with respect to revenues in each of its financial reporting segments as follows:
| Percentage of Site Leasing Revenue for the years ended December 31, | ||||||
| 2003 | 2002 | |||||
AT&T Wireless | 16.9 | % | 15.5 | % | ||
Cingular Wireless | 11.1 | % | 10.8 | % | ||
| Percentage of Site Development Consulting Revenue for the years ended December 31, | ||||||
| 2003 | 2002 | |||||
Bechtel Corporation | 30.5 | % | 34.2 | % | ||
Cingular Wireless | 24.0 | % | 29.6 | % | ||
Verizon Wireless | 14.5 | % | 3.9 | % | ||
| Percentage of Site Development Construction Revenue for the years ended December 31, | ||||||
| 2003 | 2002 | |||||
Bechtel Corporation | 37.7 | % | 28.1 | % | ||
Sprint PCS | 12.9 | % | 3.0 | % | ||
For the year ended December 31, 2006 Revenues Cost of revenues Operating income (loss) Capital expenditures(2) For the year ended December 31, 2005 Revenues Cost of revenues Operating income (loss) Capital expenditures(2) For the year ended December 31, 2004 Revenues Cost of revenues Operating income (loss) Capital expenditures(2) Assets As of December 31, 2006 As of December 31, 2005 Site Leasing Site
Development
Consulting Site
Development
Construction Not
Identified by
Segment(1) Total (in thousands) $ 256,170 $ 16,660 $ 78,272 $ — $ 351,102 $ 70,663 $ 14,082 $ 71,841 $ — $ 156,586 $ 30,037 $ 1,306 $ 7 $ (11,842 ) $ 19,508 $ 1,187,903 $ 216 $ 1,233 $ 1,004 $ 1,190,356 $ 161,277 $ 13,549 $ 85,165 $ — $ 259,991 $ 47,259 $ 12,004 $ 80,689 $ — $ 139,952 $ 14,349 $ 544 $ (2,360 ) $ (8,338 ) $ 4,195 $ 100,879 $ 57 $ 361 $ 804 $ 102,101 $ 144,004 $ 14,456 $ 73,022 $ — $ 231,482 $ 47,283 $ 12,768 $ 68,630 $ — $ 128,681 $ (11,706 ) $ 431 $ (3,127 ) $ (9,479 ) $ (23,881 ) $ 7,706 $ 63 $ 317 $ 919 $ 9,005 $ 1,952,126 $ 4,723 $ 42,476 $ 46,967 $ 2,046,292 $ 834,923 $ 4,005 $ 51,381 $ 62,227 $ 952,536
(1) | Assets not identified by segment consist primarily of general corporate assets |
(2) | Includes acquisitions and related earn-outs |
24. SUBSEQUENT EVENTS
During January 2004, SBA Senior Finance closed on a new senior credit facility in the amount of $400.0 million. This facility consists of a $275.0 million term loan which was funded at closing, a $50.0 million delayed draw term loan which the Company has until November 15, 2004 to draw and a $75.0 million revolving line of credit. The revolving line of credit may be borrowed, repaid and redrawn. Amortization of the term loans commence September 2004 at an annual rate of 1% in each of 2004, 2005, 2006 and 2007. All remaining amounts under the term loan are due in 2008. There is no amortization of the revolving loans and all amounts outstanding are due on August 31, 2008. This facility will require amortization payments of approximately $1.6 million in 2004, as compared to $11.5 million which would have been required under the facility which was in existence at December 31, 2003. Amounts borrowed under this facility accrue interest at either the base rate, as defined in the agreement, plus 250 basis points or the Euro dollar rate plus 350 basis points. This facility may be prepaid at any time with no prepayment penalty. Amounts borrowed under this facility are secured by a first lien on substantially all of SBA Senior Finance’s assets. In addition, each of SBA Senior Finance’s domestic subsidiaries has guaranteed the obligations of SBA Senior Finance under the senior credit facility and has pledged substantially all of their respective assets to secure such guarantee, and the Company and Telecommunications have pledged substantially all of their assets to secure SBA Senior Finance’s obligations under this senior credit facility.
This new credit facility requires SBA Senior Finance to maintain specified financial ratios, including ratios regarding its debt to annualized operating cash flow, debt service, cash interest expense and fixed charges for each quarter. This new senior credit facility contains affirmative and negative covenants that, among other things, restricts its ability to incur debt and liens, sell assets, commit to capital expenditures, enter into affiliate transactions or sale-leaseback transactions, and/or build towers without anchor tenants. SBA Senior Finance’s ability in the future to comply with the covenants and access the available funds under the senior credit facility will depend on its future financial performance.
On January 30, 2004, SBA Senior Finance used the proceeds from the funding of the $275.0 million term loan under the new senior credit facility to repay the old credit facility in full, consisting of $144.2 million outstanding. In addition to the amounts outstanding, the Company was required to pay $8.0 million associated with the assignment to the new lenders of the old facility. As a result of this prepayment, SBA Senior Finance has written off deferred financing fees associated with the old facility of $5.4 million in addition to the $8.0 million fee paid to facilitate the assignment during the first quarter of 2004. Additionally, SBA Senior Finance has recorded additional deferred financing fees of approximately $5.4 million associated with this new facility.
Subsequent to December 31, 2003, the Company repurchased $19.3 million of its 12% senior discount notes in open market transactions. The Company paid $20.9 million plus accrued interest in cash and recognized a loss of $1.6 million related to these debt repurchases and write-off $0.4 million of deferred financing fees. Additionally, on March 1, 2004, the Company, pursuant to the indentures for the 12% senior discount notes, called and retired all remaining outstanding 12% notes. These notes were callable at a price of 107.5% of the principal balances outstanding. In accordance with this transaction, the Company recorded a loss of $3.5 million associated with the premium paid and wrote off $1.0 million of deferred financing fees associated with this debt issue.
Subsequent to December 31, 2003, the Company repurchased $51.1 million of it’s 10¼% senior notes in open market transactions. The Company paid $51.9 million plus accrued interest in cash and issued 1.0 million shares of its Class A Common Stock. The Company recognized a loss of $0.8 million related to these repurchases and wrote off $1.0 million of deferred financing fees associated with this debt retirement.
25.23. QUARTERLY FINANCIAL DATA (unaudited)
| Quarters Ended | ||||||||||||||||
| December 31, 2003 | September 30, 2003 | June 30, 2003 | March 31, 2003 | |||||||||||||
| (in thousands, except per share amounts) | ||||||||||||||||
Revenues | $ | 57,588 | $ | 52,386 | $ | 50,390 | $ | 51,696 | ||||||||
Gross profit | 24,507 | 22,566 | 22,879 | 22,277 | ||||||||||||
Restructuring and other charges | (68 | ) | (1,065 | ) | (396 | ) | (976 | ) | ||||||||
Asset impairment charges | (6,199 | ) | (50 | ) | (10,265 | ) | (451 | ) | ||||||||
Write-off of deferred financing fees and loss on extinguishment of debt | (18,968 | ) | (409 | ) | (4,842 | ) | — | |||||||||
Loss from continuing operations before cumulative effect of changes in accounting principle | (53,149 | ) | (32,584 | ) | (45,448 | ) | (32,755 | ) | ||||||||
Loss from discontinued operations | 1,981 | 12,918 | (22,134 | ) | (455 | ) | ||||||||||
Cumulative effect of changes in accounting principle | — | — | — | (545 | ) | |||||||||||
Net loss | $ | (51,168 | ) | $ | (19,666 | ) | $ | (67,582 | ) | $ | (33,755 | ) | ||||
Per common share – basic and diluted: | ||||||||||||||||
Loss from continuing operations before cumulative effect of changes in accounting principle | $ | (0.98 | ) | $ | (0.62 | ) | $ | (0.89 | ) | $ | (0.64 | ) | ||||
Loss from discontinued operations | 0.03 | 0.24 | (0.43 | ) | (0.01 | ) | ||||||||||
Cumulative effect of changes in accounting principle | — | — | — | (0.01 | ) | |||||||||||
Net loss | $ | (0.95 | ) | $ | (0.38 | ) | $ | (1.32 | ) | $ | (0.66 | ) | ||||
| Quarters Ended | ||||||||||||||||
| December 31, 2002 | September 30, 2002 | June 30, 2002 | March 31, 2002 | |||||||||||||
| (in thousands, except per share amounts) | ||||||||||||||||
Revenues | $ | 57,425 | $ | 60,811 | $ | 63,627 | $ | 58,259 | ||||||||
Gross profit | 23,216 | 23,892 | 25,556 | 24,335 | ||||||||||||
Restructuring and other charges | (1,132 | ) | (1,225 | ) | (7,667 | ) | (37,738 | ) | ||||||||
Asset impairment charges | — | — | (9,165 | ) | (16,380 | ) | ||||||||||
Loss from continuing operations before cumulative effect of changes in accounting principle | (29,354 | ) | (30,526 | ) | (42,257 | ) | (82,468 | ) | ||||||||
Loss from discontinued operations | (983 | ) | (1,147 | ) | (826 | ) | (761 | ) | ||||||||
Cumulative effect of changes in accounting principle | — | — | — | (60,674 | ) | |||||||||||
Net loss | $ | (30,337 | ) | $ | (31,673 | ) | $ | (43,083 | ) | $ | (143,903 | ) | ||||
Per common share – basic and diluted: | ||||||||||||||||
Loss from continuing operations before cumulative effect of changes in accounting principle | $ | (0.57 | ) | $ | (0.60 | ) | $ | (0.84 | ) | $ | (1.66 | ) | ||||
Loss from discontinued operations | (0.02 | ) | (0.02 | ) | (0.01 | ) | (0.01 | ) | ||||||||
Cumulative effect of changes in accounting principle | — | — | — | (1.22 | ) | |||||||||||
Net loss | $ | (0.59 | ) | $ | (0.62 | ) | $ | (0.85 | ) | $ | (2.89 | ) | ||||
| Quarter Ended | ||||||||||||||||
| December 31, 2006 | September 30, 2006 | June 30, 2006 | March 31, 2006 (1) | |||||||||||||
| (in thousands, except per share amounts) | ||||||||||||||||
Revenues | $ | 96,750 | $ | 98,172 | $ | 87,376 | $ | 68,804 | ||||||||
Operating income | 6,054 | 6,316 | 2,820 | 4,318 | ||||||||||||
Depreciation, accretion, and amortization | (39,893 | ) | (39,015 | ) | (32,885 | ) | (21,295 | ) | ||||||||
Asset impairment and other (credits) charges | — | (357 | ) | — | — | |||||||||||
Loss from writeoff of deferred financing fees and extinguishment of debt | (3,361 | ) | (34 | ) | (53,838 | ) | — | |||||||||
Loss from continuing operations | (24,265 | ) | (24,340 | ) | (75,638 | ) | (9,205 | ) | ||||||||
Net loss | $ | (24,265 | ) | $ | (24,340 | ) | $ | (75,638 | ) | $ | (9,205 | ) | ||||
Per common share—basic and diluted: | ||||||||||||||||
Loss per share from continuing operations | $ | (0.23 | ) | $ | (0.23 | ) | $ | (0.77 | ) | $ | (0.03 | ) | ||||
Net loss per share | $ | (0.23 | ) | $ | (0.23 | ) | $ | (0.77 | ) | $ | (0.03 | ) | ||||
The reported amounts for 2002 and the quarter ended March 31, 2003 above have been restated to reflect the Company’s discontinued operations discussed in Note 3.
| Quarter Ended | ||||||||||||||||
| December 31, 2005 | September 30, 2005 | June 30, 2005 | March 31, 2005 | |||||||||||||
| (in thousands, except per share amounts) | ||||||||||||||||
Revenues | $ | 72,418 | $ | 66,021 | $ | 63,248 | $ | 58,304 | ||||||||
Operating income (loss) | 3,885 | 2,603 | (229 | ) | (2,064 | ) | ||||||||||
Depreciation, accretion, and amortization | (22,258 | ) | (21,673 | ) | (21,644 | ) | (21,643 | ) | ||||||||
Asset impairment and other (credits) charges | (160 | ) | (15 | ) | (42 | ) | (231 | ) | ||||||||
Loss from writeoff of deferred financing fees and extinguishment of debt | (19,541 | ) | — | (8,244 | ) | (1,486 | ) | |||||||||
Loss from continuing operations | (32,282 | ) | (14,447 | ) | (26,376 | ) | (21,543 | ) | ||||||||
Gain (loss) from discontinued operations | (15 | ) | 3 | 121 | (170 | ) | ||||||||||
Net loss | $ | (32,297 | ) | $ | (14,444 | ) | $ | (26,255 | ) | $ | (21,713 | ) | ||||
Per common share—basic and diluted: | ||||||||||||||||
Loss from continuing operations | $ | (0.38 | ) | $ | (0.19 | ) | $ | (0.38 | ) | $ | (0.33 | ) | ||||
Gain (loss) from discontinued operations | — | — | — | — | ||||||||||||
Net loss per share | $ | (0.38 | ) | $ | (0.19 | ) | $ | (0.38 | ) | $ | (0.33 | ) | ||||
| (1) | The company has reclassified $0.2 million of franchise tax expense from the provision of income taxes expense to selling, general and administrative expense. |
Because loss per share amounts are calculated using the weighted average number of common and dilutive common shares outstanding during each quarter, the sum of the per share amounts for the four quarters may not equal the total loss per share amounts for the year.
24. SUBSEQUENT EVENTS
SBA COMMUNICATIONS CORPORATION AND SUBSIDIARIESSubsequent to December 31, 2006, the Company closed on the acquisition of 66 towers for an aggregate purchase price of $24.1 million, which was paid in cash.
SCHEDULE II
VALUATION AND QUALIFYING ACCOUNTS
| Balance at Beginning of Period | Additions Charged to Costs and Expenses (1) | Deduction From Reserves(3) | Balance at End of Period | ||||||||||
| (in thousands) | |||||||||||||
Allowance for Doubtful Accounts For the Years Ended: | |||||||||||||
December 31, 2003 | $ | 5,572 | $ | 3,554 | $ | 7,726 | $ | 1,400 | |||||
December 31, 2002 | $ | 5,921 | $ | 3,371 | $ | 3,720 | $ | 5,572 | |||||
December 31, 2001 | $ | 2,117 | $ | 3,941 | (2) | $ | 137 | $ | 5,921 | ||||
Tax Valuation Account For the Years Ended: | |||||||||||||
December 31, 2003 | $ | 118,549 | $ | 65,395 | $ | — | $ | 183,944 | |||||
December 31, 2002 | $ | 54,422 | $ | 64,127 | $ | — | $ | 118,549 | |||||
December 31, 2001 | $ | 35,202 | $ | 19,219 | $ | — | $ | 54,422 | |||||
F-35F-39