UNITED STATES
SECURITIES AND EXCHANGE COMMISSION
WASHINGTON, D.C. 20549
FORM 10-K
| x | ANNUAL REPORT PURSUANT TO SECTION 13 OR 15(d) OF THE SECURITIES EXCHANGE ACT OF 1934 |
FOR THE FISCAL YEAR ENDED DECEMBER 31, 20042005
OR
| ¨ | TRANSITION REPORT PURSUANT TO SECTION 13 OR 15(d) OF THE SECURITIES EXCHANGE ACT OF 1934 |
FOR THE TRANSITION PERIOD FROM TO
COMMISSION FILE NUMBER: 1-11535
Burlington Northern Santa Fe Corporation
Exact name of registrant as specified in its charter
| Delaware | 41-1804964 | |
| State of Incorporation | I.R.S. Employer Identification No. | |
2650 Lou Menk Drive Fort Worth, Texas 76131-2830 | (800) 795-2673 | |
| Address of principal executive offices, including zip code | Registrant’s telephone number, including area code | |
Securities registered pursuant to Section 12(b) of the Act:
| ||
Title of each class | Name of each exchange on which registered | |
| Common Stock, $0.01 par value | New York Stock Exchange
| |
Securities registered pursuant to Section 12(g) of the Act:
None
Indicate by check mark if the registrant is a well-known seasoned issuer, as defined in Rule 405 of the Securities Act. YesxNo¨
Indicate by check mark if the registrant is not required to file reports pursuant to Section 13 or Section 15(d) of the Act. Yes ¨ No x
Indicate by check mark whether the registrant (1) has filed all reports required to be filed by Section 13 or 15(d) of the Securities Exchange Act of 1934 during the preceding 12 months (or for such shorter period that the registrant was required to file such reports), and (2) has been subject to such filing requirement for the past 90 days. Yes x No ¨
Indicate by check mark if disclosure of delinquent filers pursuant to Item 405 of Regulation S-K is not contained herein, and will not be contained, to the best of registrant’s knowledge, in definitive proxy or information statements incorporated by reference in Part III of this Form 10-K or any amendment to this Form 10-K.x
Indicate by check mark whether the registrant is a large accelerated filer, accelerated filer, or a non-accelerated filer (as defined in Rule 12b-2 of the Act).
Large accelerated filer x Accelerated filer ¨ Non-accelerated filer ¨
Indicate by check mark whether the registrant is an accelerated filera shell company (as defined in Rule 12b-2 of the Act). Yes x No ¨ No x
The aggregate market value of the voting stock held by non-affiliates of the registrant was approximately $12.908$17.373 billion on June 30, 2004.2005. For purposes of this calculation only, the registrant has excluded stock beneficially owned by directors and officers. By doing so, the registrant does not admit that such persons are affiliates within the meaning of Rule 405 under the Securities Act of 1933 or for any other purpose.
Indicate the number of shares outstanding of each of the registrant’s classes of common stock, as of the latest practicable date: Common Stock, $0.01 par value, 377,927,038372,960,559 shares outstanding as of February 2, 2005.2006.
DOCUMENTS INCORPORATED BY REFERENCE
LIST HEREUNDER THE DOCUMENTS FROM WHICH PARTS THEREOF HAVE BEEN INCORPORATED BY REFERENCE AND THE PART OF THE FORM 10-K INTO WHICH SUCH INFORMATION IS INCORPORATED:
Burlington Northern Santa Fe Corporation’s definitive Proxy Statement, to be filed not
later than 120 days after the end of the fiscal year covered by this report Part III
Part I |
| 3 | ||
| 7 | ||||
| 8 | ||||
| 15 | ||||
Part II | Item 5.Market for Registrant’s Common Equity, Related Stockholder Matters and Issuer Purchases of Equity Securities | |||
Item 7.Management’s Discussion and Analysis of Financial Condition and Results of Operations | ||||
Item 7A.Quantitative and Qualitative Disclosures About Market Risk | ||||
Item 9.Changes in and Disagreements With Accountants on Accounting and Financial Disclosure | ||||
Part III | ||||
Item 12.Security Ownership of Certain Beneficial Owners and Management and Related Stockholder Matters | ||||
Part IV | ||||
| S-1 | ||||
| E-1 | ||||
Items 1 and 2.Item 1. Business and Properties
Burlington Northern Santa Fe Corporation (BNSF or Company) was incorporated in the State of Delaware on December 16, 1994. On September 22, 1995, the stockholders of Burlington Northern Inc. (BNI) and Santa Fe Pacific Corporation (SFP) became the stockholders of BNSF pursuant to a business combination of the two companies.
On December 30, 1996, BNI merged with and into SFP. On December 31, 1996, The Atchison, Topeka and Santa Fe Railway Company (ATSF) merged with and into Burlington Northern Railroad Company (BNRR), and BNRR changed its name to The Burlington Northern and Santa Fe Railway Company. On January 2, 1998, SFP merged with and into The Burlington Northern and Santa Fe Railway Company. On January 20, 2005, The Burlington Northern and Santa Fe Railway Company changed its name to BNSF Railway Company (BNSF Railway).
Through its subsidiaries, BNSF is engaged primarily in the rail transportation business. At December 31, 2004,2005, BNSF and its subsidiaries had approximately 38,00040,000 employees. The rail operations of BNSF Railway, BNSF’s principal operating subsidiary, comprise one of the largest railroad systems in North America. BNSF Railway’s business and operations are described below.
BNSF’s Internet address is www.bnsf.com. Through this internet website (under the “Investors” link), BNSF makes available, free of charge, its Annual Report on Form 10-K, Quarterly Reports on Form 10-Q, and Current Reports on Form 8-K, andas well as all amendments to those reports, as soon as reasonably practicable after these reports are electronically filed with or furnished to the Securities and Exchange Commission.Commission (SEC). Filing on Forms 3, 4 and 5 are also available on this website within one day after filing. BNSF’s annual CEO certification filed pursuant to the New York Stock Exchange’s Corporate Governance Listing Standards is filed as an exhibit to this Form 10-K. BNSF also makes available on its website other previously filed SEC reports, registration statements and exhibits via a link to the SEC’s website at www.sec.gov. The following documents are also made available on the Company’s website, and a copy will be mailed, without charge, upon request to Investor Relations:
Further discussion of the Company’s business, including equipment and business sectors, is incorporated by reference from Item 2, “Properties.”
The Company faces intense competition from rail carriers and other transportation providers, and its failure to compete effectively could adversely affect its results of operations, financial condition or liquidity.
The Company operates in a highly competitive business environment. Depending on the specific market, the Company faces intermodal, intramodal, product and geographic competition. For example, the Company believes that high service truck lines, due to their ability to deliver non-bulk products on an expedited basis, have had and will continue to have an adverse effect on the Company’s ability to compete for deliveries of non-bulk, time-sensitive freight. While the Company must build or acquire and maintain its rail system, trucks and barges are able to use public rights-of-way maintained by public entities. Any material increase in the scope and quality of these alternative methods or the passage of legislation granting greater latitude to motor carriers with respect to size and weight restrictions could have an adverse effect on the Company’s results of operations, financial condition or liquidity.
A downturn in the economy or change in government policy could negatively impact demand for the Company’s services.
Significant, extended negative changes in economic conditions that impact the producers and consumers of the commodities transported by the Company may have an adverse effect on the Company’s operating results, financial condition or liquidity. In addition, changes in United States and foreign government policies could change the economic environment and affect demand for our services. For example, changes in clean air laws may impact demand for coal and United States and foreign government agriculture subsidies may impact the demand for grain.
As part of its railroad operations, the Company frequently transports chemicals and other hazardous materials.
The Company is required to transport these commodities to the extent of its common carrier obligation. An accidental release of these commodities could result in a significant loss of life and extensive property damage. The associated costs could have an adverse effect on the Company’s operating results, financial condition or liquidity.
Future acts of terrorism or war, as well as the threat of war, may cause significant disruptions in the Company’s business operations.
Terrorist attacks, such as those that occurred on September 11, 2001, as well as the more recent attacks on the transportation systems in Madrid and London, any government response to those types of attacks and war or risk of war may adversely affect the Company’s results of operations, financial condition or liquidity. The Company’s rail lines and facilities could be direct targets or indirect casualties of an act or acts of terror, which could cause significant business interruption and result in increased costs and liabilities and decreased revenues, which could have an adverse effect on its operating results and financial condition. Such effects could be magnified where releases of hazardous materials are involved. Any act of terror, retaliatory strike, sustained military campaign or war or risk of war may have an adverse impact on the Company’s operating results and financial condition by causing or resulting in unpredictable operating or financial conditions, including disruptions of rail lines, volatility or sustained increase of fuel prices, fuel shortages, general economic decline and instability or weakness of financial markets which could restrict its ability to raise capital. In addition, insurance premiums charged for some or all of the coverage currently maintained by the Company could increase dramatically or certain coverage may not be available to the Company in the future.
The Company is subject to stringent environmental laws and regulations which may impose significant costs on its business operations.
The Company’s operations are subject to extensive federal, state and local environmental laws and regulations concerning, among other things, emissions to the air; discharges to waters; the generation, handling, storage, transportation and disposal of waste and hazardous materials; and the cleanup of hazardous material or petroleum releases. In addition, many of the Company’s land holdings are and have been used for industrial or transportation-related purposes or leased to commercial or industrial companies whose activities may have resulted in discharges onto the property. Environmental liability can extend to previously owned or operated properties, leased properties and properties owned by third parties, as well as to properties currently owned and used by the Company. Environmental liabilities have arisen and may continue to arise from claims asserted by adjacent landowners or other third parties in toxic tort litigation. The Company has been and may continue to be subject to allegations or findings to the effect that it has violated, or is strictly liable under, these laws or regulations. The Company’s operating results, financial condition or liquidity could be adversely affected as a result of any of the foregoing, and it may be required to incur significant expenses to investigate and remediate environmental contamination. The Company records liabilities for environmental cleanup when the amount of its liability is both probable and reasonably estimable.
The Company’s future success depends on its ability to continue to comply with the significant federal, state and local governmental regulations to which it is subject.
The Company is subject to a significant amount of governmental regulation with respect to its rates and practices, railroad operations and a variety of health, safety, labor, environmental and other matters. Failure to comply with applicable laws and regulations could have a material adverse effect on the Company. Governments may change the legislative framework within which the Company operates without providing the Company with any recourse for any adverse effects that the change may have on its business. Also, some of the regulations require the Company to obtain and maintain various licenses, permits and other authorizations, and it cannot assure that it will continue to be able to do so. Increased economic regulation of the rail industry could negatively impact the Company’s ability to determine prices for rail services and to make capital improvements to its rail network, resulting in an adverse effect on the Company’s results of operations, financial condition or liquidity.
The availability of qualified personnel and an aging workforce may adversely affect the Company’s operations.
Changes in demographics, training requirements and the availability of qualified personnel, particularly train crew members, could negatively impact service levels. In addition, approximately 45 percent of the workforce will be eligible for retirement within the next 10 years. The Company’s efforts to attract and retain qualified personnel may be hindered due to increased demand in the job market. Unpredictable increases in demand for rail services may exacerbate these risks and may have an adverse effect on the Company’s operating results, financial condition or liquidity.
Most of the Company’s employees are represented by unions, and failure to successfully negotiate collective bargaining agreements may result in strikes, work stoppages, or substantially higher ongoing labor costs.
A significant majority of BNSF Railway’s employees are union-represented. BNSF Railway’s union employees work under collective bargaining agreements with various labor organizations. A negotiating process for new, major collective bargaining agreements covering all of BNSF Railway’s union employees has been underway since the bargaining round was initiated on November 1, 2004. Wages, health and welfare benefits, work rules and other issues have traditionally been addressed through industry-wide negotiations. These negotiations have generally taken place over an extended period of time and have previously not resulted in any extended work stoppages. The existing agreements have remained in effect and will continue to remain in effect until new agreements are reached or the Railway Labor Act’s procedures (which include mediation, cooling-off periods and the possibility of Presidential intervention) are exhausted. While the negotiations have not yet resulted in any extended work stoppages, if the Company is unable to negotiate acceptable new agreements, it could result in strikes by the affected workers, loss of business and increased operating costs as a result of higher wages or benefits paid to union members, any of which could have an adverse effect on the Company’s operating results, financial condition or liquidity.
Severe weather and natural disasters could disrupt normal business operations, which would result in increased costs and liabilities and decreases in revenues.
The Company’s success is dependent on its ability to operate its railroad system efficiently. Severe weather and natural disasters, such as tornados, flooding and earthquakes, could cause significant business interruptions and result in increased costs and liabilities and decreased revenues. In addition, damages to or loss of use of significant aspects of the Company’s infrastructure due to natural or man-made disruptions could have an adverse affect on the Company’s operating results, financial condition or liquidity for an extended period of time until repairs or replacements could be made. Extreme swings in weather could also negatively affect the performance of locomotives and rolling stock.
Fuel supply availability and fuel prices may adversely affect the Company’s results of operations, financial condition or liquidity.
Fuel supply availability could be impacted as a result of limitations in refining capacity, disruptions to the supply chain, or rising global demand. A significant reduction in fuel availability could impact the Company’s ability to provide transportation services at current levels, increase fuel costs and impact the economy. Each of these factors could have an adverse effect on the Company’s operating results, financial condition or liquidity. Additionally, the Company is expected to be able to offset a significant portion of the anticipated higher fuel costs through its fuel surcharge program and fuel hedging activities in 2006. However, to the extent that the Company is unable to maintain and expand its existing fuel surcharge program, increases in fuel prices could have an adverse effect on the Company’s operating results, financial condition or liquidity.
The Company depends on the stability and availability of its information technology systems.
The Company relies on information technology in all aspects of its business. A significant disruption or failure of its information technology systems could result in service interruptions, safety failures, security violations, regulatory compliance failures, and the inability to protect corporate information assets against intruders or other operational difficulties. Although the Company has taken steps to mitigate these risks, including Business Continuity Planning, Disaster Recovery Planning and Business Impact Analysis, a significant disruption could adversely affect the Company’s results of operations, financial condition or liquidity. Additionally, if the Company is unable to acquire or implement new technology, it may suffer a competitive disadvantage, which could also have an adverse effect on the Company’s results of operations, financial condition or liquidity.
Personal injury claims constitute a significant expense, and increases in the amount or severity of these claims could adversely affect the Company’s operating results.
The Company is subject to various personal injury claims by third parties and employees, including claims by employees who worked around asbestos until it was substantially eliminated by 1985. Personal injury claims by BNSF Railway employees are subject to the Federal Employees’ Liability Act (FELA), rather than state workers’ compensation laws. The Company believes that the FELA system, which includes unscheduled awards and a reliance on the jury system, has contributed to increased expenses in the past. Future events, such as increases in the number of claims that will be filed, developments in legislative and judicial standards and the costs of settling claims, could result in an adverse effect on the Company’s operating results.
Item 1B. Unresolved Staff Comments
None
TRACK CONFIGURATION
As of December 31, 2004, BNSF Railway operates over a railroad system consisting of approximately 32,000 route miles of track (excluding second, third and fourth main tracks, yard tracks, and sidings), approximately 24,000 miles of which are owned route miles, including easements, in 28 states and two Canadian provinces.provinces as of December 31, 2005. Approximately 8,000 route miles of BNSF Railway’s system consist of trackage rights that permit BNSF Railway to operate its trains with its crews over another railroad’sother railroads’ tracks. BNSF Railway operates over other trackage through lease or other contractual arrangements.
As of December 31, 2004,2005, the total BNSF Railway system, including first, second, third and fourth main tracks, yard tracks, and sidings, consists of approximately 50,000 operated miles of track, all of which are owned by or held under easement by BNSF Railway except for approximately 9,000 route miles operated under trackage rights. At December 31, 2004,2005, approximately 26,000 miles of BNSF Railway’s track consists of 112-pound per yard or heavier rail, including approximately 19,000 track miles of 131-pound per yard or heavier rail.
EQUIPMENT CONFIGURATION
BNSF Railway owned or had under non-cancelable leases exceeding one year the following units of railroad rolling stock and other equipment as of the dates shown below:
At December 31, | 2004 | 2003 | 2002 | 2005 | 2004 | 2003 | ||||||
Locomotives | 5,715 | 5,377 | 5,226 | 5,790 | 5,715 | 5,377 | ||||||
Freight Cars: | ||||||||||||
Covered hopper | 35,066 | 36,255 | 37,609 | 34,631 | 35,066 | 36,255 | ||||||
Gondola | 16,070 | 15,327 | 14,942 | 12,579 | 16,070 | 15,327 | ||||||
Open hopper | 10,973 | 11,257 | 10,866 | |||||||||
Box-specially equipped | 9,625 | 10,021 | 9,612 | 8,658 | 9,625 | 10,021 | ||||||
Open hopper | 11,257 | 10,866 | 10,848 | |||||||||
Flat | 8,132 | 7,854 | 7,946 | 8,537 | 8,132 | 7,854 | ||||||
Refrigerator | 5,420 | 5,427 | 5,588 | 4,983 | 5,420 | 5,427 | ||||||
Autorack | 894 | 827 | 843 | 748 | 894 | 827 | ||||||
Tank | 612 | 639 | 501 | 422 | 612 | 639 | ||||||
Box-general purpose | 27 | 31 | 559 | 27 | 27 | 31 | ||||||
Other | 273 | 302 | 319 | 323 | 273 | 302 | ||||||
Total freight cars | 87,376 | 87,549 | 88,767 | 81,881 | 87,376 | 87,549 | ||||||
Domestic chassis | 12,649 | 9,846 | 9,864 | |||||||||
Domestic containers | 10,501 | 10,627 | 8,197 | 10,412 | 10,501 | 10,627 | ||||||
Domestic chassis | 9,846 | 9,864 | 8,180 | |||||||||
Company service cars | 3,999 | 4,028 | 4,035 | 4,091 | 3,999 | 4,028 | ||||||
Trailers | 2,152 | 2,152 | 2,163 | 1,916 | 2,152 | 2,152 | ||||||
Commuter passenger cars | 166 | 163 | 160 | 179 | 166 | 163 | ||||||
Average age from date of manufacture- locomotive fleet (years)a | 15 | 15 | 15 | 15 | 15 | 15 | ||||||
Average age from date of manufacture- freight car fleet (years)a | 16 | 16 | 16 | 15 | 16 | 16 | ||||||
| a | These averages are not weighted to reflect the greater capacities of the newer equipment. |
CAPITAL EXPENDITURES AND MAINTENANCE
CAPITAL EXPENDITURES
The extent of the BNSF Railway’s maintenance and capacity program is outlined in the following table:
Year Ended December 31, | 2006 Estimate | 2005 | 2004 | 2003 | ||||
Track miles of rail laida | 854 | 711 | 695 | 749 | ||||
Cross ties inserted (thousands)a | 3,314 | 3,171 | 2,695 | 2,353 | ||||
Track resurfaced (miles) | 14,528 | 12,790 | 11,450 | 12,399 |
| a | Includes both maintenance of existing route system and expansion projects. Expenditures for these maintenance programs are primarily capitalized. |
A breakdown of the Company’s cash capital expenditures for the three years ended December 31, 2004,2005, is incorporated by reference from a table in Item 7, Management’s Discussion and Analysis of Financial Condition and Results of Operations under the headings “Liquidity and Capital Resources,Resources; Investing Activities.”
BNSF’s planned 20052006 cash capital expenditures are incorporated by reference from Item 7, Management’s Discussion and Analysis of Financial Condition and Results of Operations under the heading “Introduction.headings “Executive Summary; Business Outlook for 2006.”
MAINTENANCE
As of December 31, 2004,2005, General Electric Company, Alstom Transportation Inc., OmniTRAX Locomotive Services, LLC and the Electro-Motive Division of General Motors CorporationDiesel, Inc. performed locomotive maintenance and overhauls for BNSF Railway at its facilities under various maintenance agreements that covered approximately 3,6504,080 locomotives.
The extent of the BNSF Railway’s maintenance and capacity program is outlined in the following table:
Year Ended December 31, | 2005 Estimate | 2004 | 2003 | 2002 | ||||
Track miles of rail laida | 630 | 695 | 749 | 685 | ||||
Cross ties inserted (thousands)a | 3,100 | 2,695 | 2,353 | 2,248 | ||||
Track resurfaced (miles) | 12,100 | 11,450 | 12,399 | 12,499 |
PROPERTY AND FACILITIES
BNSF Railway operates various facilities and equipment to support its transportation system, including its infrastructure and locomotives and freight cars as previously described. It also owns or leases other equipment to support rail operations, including highway trailers, containers and vehicles. Support facilities for rail operations include yards and terminals throughout its rail network, system locomotive shops to perform locomotive servicing and maintenance, a centralized network operations center for train dispatching and network operations monitoring and management in Fort Worth, Texas, regional dispatching centers, computers, telecommunications equipment, signal systems, and other support systems. Transfer facilities are maintained for rail-to-rail as well as intermodal transfer of containers, trailers and other freight traffic. These facilities include 3533 major intermodal hubs located across the system. BNSF Railway’s largest intermodal facilities in terms of 20042005 volume were:were as follows:
Intermodal Facilities | Lifts | |
Hobart Yard (Los Angeles, California) | ||
Willow Springs (Illinois) | 770,000 | |
Corwith Yard (Chicago, Illinois) | ||
| ||
Alliance (Fort Worth, Texas) | ||
San Bernardino (California) | ||
Cicero (Illinois) | ||
Logistics Park Chicago (Illinois) | 454,000 | |
Argentine (Kansas City, Kansas) | ||
|
BNSF Railway owns 23 automotive distribution facilities and serves eight port facilities where automobiles are loaded or unloaded from multi-level rail cars and serves eight port facilities in the United States and Canada.
BNSF Railway’s largest freight car classification yards based on the average daily number of cars processed (excluding cars that do not change trains at the terminal and intermodal and coal cars) are shown below:
Classification Yard | Daily Average Cars Processed | |
Argentine (Kansas City, Kansas) | ||
Galesburg (Illinois) | ||
Pasco (Washington) | 1,393 | |
Barstow (California) | ||
| ||
Memphis (Tennessee) |
As of December 31, 2004,2005, certain BNSF Railway properties and other assets are subject to liens securing $388$384 million of mortgage debt. Certain locomotives and rolling stock of BNSF Railway are subject to equipment obligations and leases, as referred to in Notes 9 and 10 of the Consolidated Financial Statements.
PRODUCTIVITY
Productivity in 2005, as measured by thousand gross ton miles per employee, has risen steadily in the last three yearswas relatively consistent with 2004 as shown in the table below. Gross ton miles is defined as the product of the number of loaded and empty miles traveled and the combined weight of the car and contents.
Year Ended December 31, | 2004 | 2003 | 2002 | 2005 | 2004 | 2003 | ||||||
Thousand gross ton miles divided by average number of employees | 26,898 | 24,875 | 23,368 | 26,847 | 26,898 | 24,875 |
Volumes as measured by gross ton miles increased 5 percent in 2005 over 2004 and 11 percent in 2004 over 2003 and 4 percent in 2003 over 2002.2003. In turn, the increase in volumes has led the Company to increase employee headcounts. A discussion of Employees and Labor Relations is incorporated by reference from Item 7, Management’s Discussion and Analysis of Financial Condition and Results of Operations, under the heading “Other Matters; Employee and Labor Relations.”
BUSINESS MIX
In serving the Midwest, Pacific Northwest and the Western, Southwestern, and Southeastern regions and ports of the country, BNSF Railway transports, through one operating transportation services segment, a range of products and commodities derived from manufacturing, agricultural and natural resource industries. Approximately 7065 percent of the freight revenuerevenues originated by the Company is covered by contractual agreements of varying duration, while the balance is subject to common carrier, published prices or quotations offered by the Company. BNSF’s financial performance is influenced by, among other things, general and industry economic conditions at the international, national and regional levels. The following map below illustrates the Company’s primary routes, including trackage rights, which allow BNSF Railway to access major cities and ports in the western United States as well as Canadian and Mexican traffic. In addition to major cities and ports, BNSF Railway efficiently serves many smaller markets by working closely with approximately 200 shortline partners. BNSF has also entered into marketing agreements with Canadian National Railway Company and Kansas City Southern Railway Company, expanding the marketing reach for the organizations.each railroad and their customers.

CONSUMER PRODUCTS:
The Consumer Products’ freight business provided approximately 4041 percent of freight revenues in 20042005 and consisted of the following business sectors:
INDUSTRIAL PRODUCTS:
Industrial Products’ freight business provided approximately 23 percent of BNSF’s freight revenues in 20042005 and consisted of the following four business areas:
COAL:
In 2004,2005, the transportation of coal contributed about 2119 percent of freight revenues. BNSF Railway is the largest transporter of low-sulfur coal originating from the Powder River Basin of Wyoming and Montana, which accounted for approximately 9093 percent of all BNSF Railway’s coal tons during the three years endingyear ended December 31, 2004.2005. These coal shipments were destined for coal-fired electric generating stations located primarily in the North Central, South Central, Southeast and Mountain regions of the United States. BNSF Railway also transports coal from the Powder River Basin to markets in Canada and the eastern United States. Demand for Powder River Basin coal has increased substantially over the past 20 years due to environmental compliance issues, abundant reserves, relatively inexpensive mine production and competitive delivered cost to power plants.
Other BNSF coal shipments originate principally in Colorado, Illinois, New Mexico and North Dakota. These shipments move to electrical generating stations and industrial plants in the Mountain and North Central regions of the United States and to Mexico.
The Company has received a Civil Investigative Demand from the Antitrust Division of the Department of Justice requesting information concerning the Company’s pricing activities relating to the shipment of coal from the southern Powder River Basin. The Company is responding to the request.
AGRICULTURAL PRODUCTS:
The transportation of Agricultural Products provided approximately 1617 percent of 20042005 total freight revenues and includes wheat, corn, bulk foods, soybeans, oil seeds and meals, feeds, barley, oats and rye, flour and mill products, milo, oils, specialty grains, malt, ethanol and fertilizer. The BNSF Railway system is strategically located to serve the grain-producing regions of the Midwest and Great Plains. The Company is developing and operating a shuttle network for grain and grain products, and fertilizer, which allows more efficient use of equipment and improved cycle times as a result of the shuttle process.times. In addition to serving most grain-producing areas, BNSF Railway serves most major terminal, storage, feeding and food-processing locations. Furthermore, BNSF Railway has access to major export markets in the Pacific Northwest, western Great Lakes, Texas Gulf and Mexico.
FREIGHT STATISTICS:
The following table sets forth certain freight statistics relating to rail operations for the periods indicated:
Year Ended December 31, | 2004 | 2003 | 2002 | 2005 | 2004 | 2003 | ||||||||||||
Revenue ton miles (millions) | 570,688 | 508,200 | 490,234 | |||||||||||||||
Revenue ton miles (millions)* | 596,575 | 570,688 | 508,200 | |||||||||||||||
Freight revenue per thousand revenue ton miles | $ | 18.82 | $ | 18.27 | $ | 18.10 | $ | 21.13 | $ | 18.82 | $ | 18.27 | ||||||
Average length of haul (miles) | 1,045 | 1,014 | 992 | 1,068 | 1,045 | 1,014 | ||||||||||||
| * | Revenue ton miles is defined as the product of the number of loaded miles traveled and the weight of the contents. |
Revenue, cars/units and average revenue per car/unit information for the three years ended December 31, 2004,2005, is incorporated by reference from a table in Item 7, Management’s Discussion and Analysis of Financial Condition and Results of Operations, under the headings “Results of Operations; Revenue Table.”
GOVERNMENT REGULATION AND LEGISLATION
The Company is subject to federal, state and local laws and regulations generally applicable to all businesses. Rail operations are subject to the regulatory jurisdiction of the Surface Transportation Board (STB) of the United States Department of Transportation (DOT), the Federal Railroad Administration of the DOT, the Occupational Safety and Health Administration (OSHA), as well as other federal and state regulatory agencies. The STB has jurisdiction over disputes and complaints involving certain rates, routes and services, the sale or abandonment of rail lines, applications for line extensions and construction, and consolidation or merger with, or acquisition of control of, rail common carriers. The outcome of STB proceedings can affect the profitability of BNSF’s business.
DOT and OSHA have jurisdiction under several federal statutes over a number of safety and health aspects of rail operations, including the transportation of hazardous materials. State agencies regulate some aspects of rail operations with respect to health and safety in areas not otherwise preempted by federal law.
BNSF Railway’s rail operations, as well as those of its competitors, are also subject to extensive federal, state and local environmental regulation. These laws cover discharges to water, air emissions, toxic substances, and the generation, handling, storage, transportation and disposal of waste and hazardous materials. This regulation has the effect of increasing the cost and liabilities associated with rail operations. Environmental risks are also inherent in rail operations, which frequently involve transporting chemicals and other hazardous materials.
Many of BNSF Railway’s land holdings are and have been used for industrial or transportation-related purposes or leased to commercial or industrial companies whose activities may have resulted in discharges onto the property. As a result, BNSF Railway is now subject to, and will from time to time continue to be subject to, environmental cleanup and enforcement actions. In particular, the federal Comprehensive Environmental Response, Compensation and Liability Act (CERCLA), also known as the Superfund law, generally imposes joint and several liability for cleanup and enforcement costs on current and former owners and operators of a site, without regard to fault or the legality of the original conduct. Accordingly, BNSF Railway may be responsible under CERCLA and other federal and state statutes for all or part of the costs to cleanupclean up sites at which certain substances may have been released by BNSF Railway, its current lessees, former owners or lessees of properties, or other third parties. Further discussion is incorporated by reference from Note 10 of the Consolidated Financial Statements.
RAILROAD RETIREMENT
Railroad industry personnel are covered by the Railroad Retirement System instead of Social Security. BNSF Railway’s contributions under the Railroad Retirement System have been approximately triple those in industries covered by Social Security. The Railroad Retirement System, funded primarily by payroll taxes on covered employers and employees, includes a benefit roughly equivalent to Social Security (Tier I), an additional benefit similar to that allowed in some private defined-benefit plans (Tier II), and other benefits. For 2005, the Railroad Retirement System required up to a 20.25 percent contribution by railroad employers on eligible wages, while the Social Security and Medicare Acts only required a 7.65 percent contribution on similar wage bases.
COMPETITION
The business environment in which BNSF Railway operates is highly competitive. Depending on the specific market, deregulated motor carriers, other railroads and river barges may exert pressure on price and service levels. The presence of advanced, high service truck lines with expedited delivery, subsidized infrastructure and minimal empty mileage continues to affect the market for non-bulk, time sensitivetime-sensitive freight. The potential expansion of longer combination vehicles could further encroach upon markets traditionally served by railroads. In order to remain competitive, BNSF Railway and other railroads continue to develop and implement operating efficiencies to improve productivity.
As railroads streamline, rationalize and otherwise enhance their franchises, competition among rail carriers intensifies. BNSF Railway’s primary rail competitor in the western region of the United States is the Union Pacific Railroad Company (UP). Other Class I railroads and numerous regional railroads and motor carriers also operate in parts of the same territories served by BNSF Railway.
Based on weekly reporting to the Association of American Railroads, in 2004, BNSF’s share of the western United States rail traffic in 2005 was approximately 46.448 percent.
Ray Ridgeway, et al. v. Burlington Northern Santa Fe Corporation and The Burlington Northern and Santa Fe Railway Company, No. 48-185170-00 (District Court of Tarrant County, Texas, 48th48th Judicial District) is a state court action filed on October 27, 2000. The plaintiffs’ causes of action include alleged breach of contract, negligence, and breach of fiduciary duties with respect to a special dividend that was paid in 1988 by a Burlington Northern Santa Fe Corporation (BNSF)BNSF predecessor, Santa Fe Southern Pacific Corporation (SFSP). The complaint alleges that SFSP erroneously informed shareholders as to the tax treatment of the dividend–specifically, the apportionment of the dividend as either a distribution of earnings and profits or a return of capital–which allegedly caused some shareholders to overpay their income taxes. The plaintiffs assert, through their expert’s report, that SFSP had essentially no accumulated earnings and profits and that the entire dividend distribution should have been treated as a return of capital, rather than the approximately 34 percent that SFSP determined was a return of capital. On December 15, 2004,July 8, 2005, the court issued a letter to the parties indicating that it intends to denyentered an order denying the plaintiffs’ requests to certify a class action, and will be issuingthe plaintiffs subsequently filed an orderappeal of this ruling to that effect.the Texas Court of Appeals. BNSF believes these claims lack merit and that it has substantial defenses on both the merits of these claims and the attempted class action, as evidenced by the court’s letter, and it is defending these claims vigorously.
ReferenceBNSF Railway was notified by the Minnesota Pollution Control Agency (MPCA) of a proposed Stipulation Agreement to resolve alleged environmental violations with respect to BNSF Railway’s Dilworth, Minnesota fueling facility. The MPCA alleges violations involving BNSF Railway’s wastewater permit, tank regulations, and hazardous waste regulations. In October 2005, the MPCA presented BNSF Railway with proposed monetary sanctions. Although the parties are negotiating a settlement, it is made topossible that resolution of this matter could result in monetary sanctions exceeding $100,000.
Information concerning certain pending tax-related administrative or adjudicative state proceedings or appeals is incorporated by reference from Note 5 of the Consolidated Financial Statements, forand information concerning certain pending tax related administrative or adjudicative state proceedings or appealsother claims and tolitigation is incorporated by reference from Note 10 of the Consolidated Financial Statements for information concerning other claims and litigation.Statements.
Item 4. Submission of Matters to a Vote of Security Holders
No matters were submitted by BNSF to a vote of its securities holders during the fourth quarter of 2004.2005.
EXECUTIVE OFFICERS OF THE REGISTRANT
Listed below are the names, ages, and positions of all executive officers of BNSF and their business experience during the past five years. Executive officers hold office until their successors are elected or appointed, or until their earlier death, retirement, resignation, or removal.
MATTHEW K. ROSE, 4546
Chairman, President and Chief Executive Officer of BNSF since March 2002. Previously President and Chief Executive Officer of BNSF from December 2000. Also, Chairman, President and Chief Executive Officer of BNSF Railway from December 2000. Previously, President and Chief Operating Officer of BNSF from June 1999 to December 2000.
THOMAS N. HUND, 5152
Executive Vice President and Chief Financial Officer since January 2001. Prior to that, Senior Vice President and Chief Financial Officer and Treasurer from August 1999.
CARL R. ICE, 4849
Executive Vice President and Chief Operations Officer since January 2001. Prior to that, Senior Vice President-Operations from June 1999.
DENNIS R. JOHNSON, 43
Vice President and Controller since August 1999.
JOHN P. LANIGAN, JR., 4950
Executive Vice President and Chief Marketing Officer since January 2003. Prior to that, President and Chief Executive Officer of Logistics.com, Inc. (provider of ASP-based transportation procurement services to shippers and carriers) from May 2000, and President and Chief Operating Officer from March 2000; and Chief Operating Officer of Schneider National, Inc. (truckload freight hauler) from 1999 to 2000.
JEFFREY R. MORELAND, 6061
Executive Vice President Law & Government Affairs and Secretary since December 2001. Prior to that, Executive Vice President-Law and Chief of Staff since January 2001, and Senior Vice President-Law and Chief of Staff since February 1998.
PETER J. RICKERSHAUSER, 5657
Vice President-Network Development since May 1999.
Item 5. Market for Registrant’s Common Equity, Related Stockholder Matters and Issuer Purchases of Equity Securities
BNSF’s common stock is listed on the New York Stock Exchange under the symbol “BNI.” TheIn 2005, the Company decided to de-list its common stock is also listed onfrom the Chicago Stock Exchange and the Pacific Exchange.Exchange, effective December 31, 2005, due to low trading volume and regulatory compliance costs. Information as to the high and low sales prices of such stock for the two years ending December 31, 2004,2005, and the frequency and amount of dividends declared on such stock during such periods, is set forth in Note 17 of the Consolidated Financial Statements. The approximate number of holders of record of the common stock at February 2, 2005,2006, was 40,000.35,000.
COMMON STOCK REPURCHASES
The following table presents repurchases by the Company of its common stock for each of the three months for the quarter ended December 31, 20042005 (shares in thousands):
Issuer Purchases of Equity Securities
| |||||||||
Period | Total Number (a) | Average Price Per | Total Number of Shares Purchased as Part of Publicly Announced Plans or Programs (b) | Maximum Number May Yet Be Under the Plans or Programs | |||||
October 1 – 31 | 965 | $ | 40.18 | 950 | 17,601 | ||||
November 1 – 30 | 980 | 44.01 | 950 | 16,651 | |||||
December 1 – 31 | 848 | 45.85 | 816 | 15,835 | |||||
Total | 2,793 | $ | 43.25 | 2,716 | |||||
Issuer Purchases of Equity Securities
Period | Total Number of Shares Purchaseda | Average Price Paid Per Share | Total Number of Shares Purchased as Part of Publicly Announced Plans or Programsb | Maximum Number of Shares that May Yet Be Purchased Under the Plans or Programsb | |||||
October 1 – 31 | 37 | $ | 60.12 | — | 5,160 | ||||
November 1 – 30 | 1,625 | 63.89 | 1,597 | 3,563 | |||||
December 1 – 31 | 1,840 | 66.38 | 1,800 | 31,763 | |||||
Total | 3,502 | $ | 65.15 | 3,397 | |||||
| Total number of shares purchased includes approximately |
| On July 17, 1997, the Board initially authorized and the Company announced the repurchase of up to 30 million shares of the Company’s common stock from time to time |
Item 6. Selected Financial Data
The following table presents, as of and for the dates indicated, selected historical financial information for the Company (dollars in millions, except per share data):
December 31, | 2004 | 2003 | 2002 | 2001 | 2000 | 2005 | 2004 | 2003 | 2002 | 2001 | ||||||||||||||||||||||||||||||
For the year ended: | ||||||||||||||||||||||||||||||||||||||||
Revenues | $ | 10,946 | $ | 9,413 | $ | 8,979 | $ | 9,208 | $ | 9,207 | $ | 12,987 | $ | 10,946 | $ | 9,413 | $ | 8,979 | $ | 9,208 | ||||||||||||||||||||
Operating income | $ | 1,686 | a | $ | 1,665 | $ | 1,656 | $ | 1,750 | $ | 2,113 | $ | 2,922 | a | $ | 1,686 | b | $ | 1,665 | $ | 1,656 | $ | 1,750 | |||||||||||||||||
Income before cumulative effect of accounting change | $ | 791 | a | $ | 777 | b | $ | 760 | $ | 731 | $ | 980 | $ | 1,531 | a | $ | 791 | b | $ | 777 | c | $ | 760 | $ | 731 | |||||||||||||||
Basic earnings per share (before cumulative effect of accounting change) | $ | 2.14 | a | $ | 2.10 | $ | 2.01 | $ | 1.89 | $ | 2.38 | $ | 4.12 | a | $ | 2.14 | b | $ | 2.10 | c | $ | 2.01 | $ | 1.89 | ||||||||||||||||
Average basic shares (in millions) | 370.0 | 369.1 | 378.0 | 387.3 | 412.1 | 371.8 | 370.0 | 369.1 | 378.0 | 387.3 | ||||||||||||||||||||||||||||||
Diluted earnings per share (before cumulative effect of accounting change) | $ | 2.10 | a | $ | 2.09 | b | $ | 2.00 | $ | 1.87 | $ | 2.36 | $ | 4.01 | a | $ | 2.10 | b | $ | 2.09 | c | $ | 2.00 | $ | 1.87 | |||||||||||||||
Average diluted shares (in millions) | 376.6 | 372.3 | 380.8 | 390.7 | 415.2 | 381.8 | 376.6 | 372.3 | 380.8 | 390.7 | ||||||||||||||||||||||||||||||
Dividends declared per common share | $ | 0.64 | $ | 0.54 | $ | 0.48 | $ | 0.48 | $ | 0.48 | $ | 0.74 | $ | 0.64 | $ | 0.54 | $ | 0.48 | $ | 0.48 | ||||||||||||||||||||
At year end: | ||||||||||||||||||||||||||||||||||||||||
Total assets | $ | 28,925 | $ | 26,947 | $ | 25,767 | $ | 24,721 | $ | 24,375 | $ | 30,304 | $ | 28,925 | $ | 26,947 | $ | 25,767 | $ | 24,721 | ||||||||||||||||||||
Long-term debt and commercial paper, including current portion | $ | 6,516 | $ | 6,684 | $ | 6,814 | $ | 6,651 | $ | 6,846 | $ | 7,154 | $ | 6,516 | $ | 6,684 | $ | 6,814 | $ | 6,651 | ||||||||||||||||||||
Stockholders’ equity | $ | 9,311 | $ | 8,495 | $ | 7,932 | $ | 7,849 | $ | 7,480 | $ | 9,508 | $ | 9,311 | $ | 8,495 | $ | 7,932 | $ | 7,849 | ||||||||||||||||||||
Net debt to total capitalizationc | 39.9 | % | 44.0 | % | 46.1 | % | 45.8 | % | 47.7 | % | ||||||||||||||||||||||||||||||
Net debt to total capitalizationd | 42.7 | % | 39.9 | % | 44.0 | % | 46.1 | % | 45.8 | % | ||||||||||||||||||||||||||||||
For the year ended: | ||||||||||||||||||||||||||||||||||||||||
Total capital expenditures | $ | 1,527 | $ | 1,726 | $ | 1,358 | $ | 1,459 | $ | 1,399 | $ | 1,750 | $ | 1,527 | $ | 1,726 | $ | 1,358 | $ | 1,459 | ||||||||||||||||||||
Depreciation and amortization | $ | 1,012 | $ | 910 | $ | 931 | $ | 909 | $ | 895 | $ | 1,075 | $ | 1,012 | $ | 910 | $ | 931 | $ | 909 | ||||||||||||||||||||
| a | 2005 operating income, income before cumulative effect of accounting change and earnings per share include a loss related to an agreement to sell certain line segments to the state of New Mexico in the future of $71 million pre-tax, $44 million net of tax, or $0.12 per basic and diluted share. |
| b | 2004 operating income, |
| 2003 income before cumulative effect of accounting change excludes the favorable cumulative effect of an accounting change of $39 million, net of tax, or $0.11 per basic share and $0.10 per diluted share, as described in Note 2 of the Consolidated Financial Statements. |
| Net debt is calculated as total debt less cash and cash equivalents, and total capitalization is calculated as the sum of net debt and total stockholders’ equity. |
CALCULATION OF RETURN ON INVESTED CAPITAL
BNSF’s return on invested capital (ROIC), as discussed in the “Letter from the Chairman, President, and Chief Executive Officer” in the Company’s 2005 Annual Report, is a non-GAAP measure and should be considered in addition to, but not as a substitute or preferable to, other information prepared in accordance with GAAP. However, the information is included herein as management believes that ROIC provides meaningful information that can be useful in assessing the long-term performance of the Company’s business and in evaluating potential strategic transactions. Below is the calculation of ROIC for the years ended December 31, 2005, 2004 and 2003.
Year ended December 31, | 2005 | 2004 | 2003 | |||||||||
Average capitalizationa | $ | 19,831 | $ | 19,069 | $ | 18,409 | ||||||
Operating income | $ | 2,922 | $ | 1,686 | $ | 1,665 | ||||||
Other expense | (37 | ) | (4 | ) | (14 | ) | ||||||
Financing chargesb | 305 | 274 | 262 | |||||||||
Exclude 2004 charge for change in estimate of unasserted asbestos and environmental liabilities | — | 465 | — | |||||||||
Taxesc | (1,196 | ) | (917 | ) | (707 | ) | ||||||
After-tax income excluding financing charges and 2004 charge | $ | 1,994 | $ | 1,504 | $ | 1,206 | ||||||
Return on invested capitald | 10.1 | % | 7.9 | % | 6.6 | % | ||||||
| a | Average capitalization is calculated as the average of the sum of stockholders’ equity, net debt (total debt less cash and cash equivalents), the net present value of future operating lease commitments, and the receivables sold under the accounts receivable sales program for the most recent preceding 13 month ends. |
| b | Financing charges represent the estimated interest expense included in operating lease payments and A/R sales fees. |
| c | Taxes are calculated as the sum of monthly operating income, other expense, A/R sales, and an operating lease interest factor (estimated interest expense included in operating lease payments) multiplied by a federal tax rate respective to each month. |
| d | Return on invested capital is calculated as the total after-tax income excluding financing charges and 2004 charge divided by average capitalization. |
Item 7. Management’s Discussion and Analysis of Financial Condition and Results of Operations
Management’s discussion and analysis relates to the financial condition and results of operations of Burlington Northern Santa Fe Corporation and its majority-owned subsidiaries and a variable interest entity for which Burlington Northern Santa Fe is the primary beneficiary, all of which are separate legal entities (collectively BNSF, Registrant or Company). The principal operating subsidiary of BNSF is the BNSF Railway Company (BNSF Railway). through which BNSF derives substantially all of its revenues. All earnings per share information is stated on a diluted basis.
INTRODUCTIONCOMPANY OVERVIEW
Through its subsidiaries, BNSF is engaged primarily in the rail transportation business. The rail operations of BNSF’s primary operating subsidiary, BNSF Railway, continues to be one of the primary rail transporters in North America withcomprise one of the largest railroad networks consisting ofin North America, with 32,000 route miles in 28 states and two Canadian provinces. Through one operating transportation services segment, BNSF Railway transports a wide range of products and commodities including the transportation of Consumer Products, Industrial Products, Coal and Agricultural Products. Based on
Additional operational information, including weekly reportingintermodal and carload unit reports as submitted to the American Association of American Railroads for 2004, BNSF’s share ofand annual reports submitted to the western United States rail traffic was approximately 46.4 percent.Surface Transportation Board, are available on the Company’s website at www.bnsf.com/investors.
BNSFEXECUTIVE SUMMARY
FISCAL YEAR 2005 – FINANCIAL OVERVIEW
2004 earnings per share were $2.10, which includes the impact of the charge discussed below. This compares to 2003 earnings per share of $2.19, which included the favorable cumulative effect of an accounting change of $0.10 per diluted share.
During the third quarter of 2004, BNSF recorded a $465 million pre-tax charge in 2004 related to reflect changesa change in its estimateBNSF’s estimates of unasserted asbestos liabilities and environmental liabilities. Of this amount, $293 million and $172 million were related
Operating expenses for 2004 increased 20 percent compared to 2003, primarily driven by the charge mentioned above. The increase in expenses was also the result of an 11 percent increase in gross ton-miles handled and significant fuel price increases.
BUSINESS OUTLOOK FOR 2006
RESULTS OF OPERATIONS
REVENUE TABLE
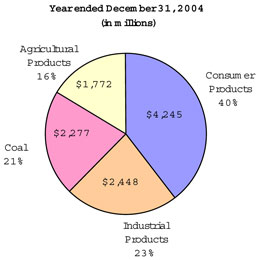
The following table presents BNSF’s revenue information by commodity group for the years ended December 31, 2005, 2004 2003 and 2002:2003:
Revenues (in millions) | Cars / units (in thousands) | Average revenue per car / unit | Revenues (in millions) | Cars / units (in thousands) | Average revenue per car / unit | |||||||||||||||||||||||||||||||||||||||||||
Year ended December 31, | 2004 | 2003 | 2002 | 2004 | 2003 | 2002 | 2004 | 2003 | 2002 | 2005 | 2004 | 2003 | 2005 | 2004 | 2003 | 2005 | 2004 | 2003 | ||||||||||||||||||||||||||||||
Consumer Products | $ | 4,245 | $ | 3,657 | $ | 3,353 | 4,859 | 4,336 | 3,880 | $ | 874 | $ | 843 | $ | 864 | $ | 5,156 | $ | 4,245 | $ | 3,657 | 5,306 | 4,859 | 4,336 | $ | 972 | $ | 874 | $ | 843 | ||||||||||||||||||
Industrial Products | 2,448 | 2,138 | 2,041 | 1,561 | 1,428 | 1,415 | 1,568 | 1,497 | 1,442 | 2,871 | 2,448 | 2,138 | 1,564 | 1,561 | 1,428 | 1,836 | 1,568 | 1,497 | ||||||||||||||||||||||||||||||
Coal | 2,277 | 2,025 | 2,071 | 2,216 | 2,048 | 2,097 | 1,028 | 989 | 988 | 2,448 | 2,277 | 2,025 | 2,238 | 2,216 | 2,048 | 1,094 | 1,028 | 989 | ||||||||||||||||||||||||||||||
Agricultural Products | 1,772 | 1,465 | 1,408 | 900 | 834 | 794 | 1,969 | 1,757 | 1,773 | 2,131 | 1,772 | 1,465 | 916 | 900 | 834 | 2,326 | 1,969 | 1,757 | ||||||||||||||||||||||||||||||
Total freight revenues | 10,742 | 9,285 | 8,873 | 9,536 | 8,646 | 8,186 | $ | 1,126 | $ | 1,074 | $ | 1,084 | 12,606 | 10,742 | 9,285 | 10,024 | 9,536 | 8,646 | $ | 1,258 | $ | 1,126 | $ | 1,074 | ||||||||||||||||||||||||
Other revenues | 204 | 128 | 106 | 381 | 204 | 128 | ||||||||||||||||||||||||||||||||||||||||||
Total operating revenues | $ | 10,946 | $ | 9,413 | $ | 8,979 | $ | 12,987 | $ | 10,946 | $ | 9,413 | ||||||||||||||||||||||||||||||||||||
EXPENSE TABLE
The following table presents BNSF’s expense information for the years ended December 31, 2005, 2004, 2003, and 20022003 (in millions):
Year Ended December 31, | 2004 | 2003 | 2002 | 2005 | 2004 | 2003 | ||||||||||||||
Compensation and benefits | $ | 3,322 | $ | 2,963 | $ | 2,894 | $ | 3,515 | $ | 3,322 | $ | 2,963 | ||||||||
Fuel | 1,959 | 1,335 | 1,093 | |||||||||||||||||
Purchased services | 1,424 | 1,252 | 1,146 | 1,714 | 1,424 | 1,252 | ||||||||||||||
Depreciation and amortization | 1,012 | 910 | 931 | 1,075 | 1,012 | 910 | ||||||||||||||
Equipment rents | 790 | 705 | 698 | 886 | 790 | 705 | ||||||||||||||
Fuel | 1,335 | 1,093 | 848 | |||||||||||||||||
Materials and other | 1,377 | a | 825 | 806 | 916 | 1,377 | a | 825 | ||||||||||||
Total operating expenses | $ | 9,260 | $ | 7,748 | $ | 7,323 | $ | 10,065 | $ | 9,260 | $ | 7,748 | ||||||||
Interest expense | $ | 409 | $ | 420 | $ | 428 | $ | 437 | $ | 409 | $ | 420 | ||||||||
Other expense, net | $ | 4 | $ | 14 | $ | 12 | $ | 37 | $ | 4 | $ | 14 | ||||||||
Income tax expense | $ | 482 | $ | 454 | $ | 456 | $ | 917 | $ | 482 | $ | 454 | ||||||||
| a | 2004 materials and other expense includes a $465 million pre-tax charge related to changes in estimates of the Company’s unasserted asbestos and environmental liabilities (see Note 10 of the Consolidated Financial Statements). |
YEAR ENDED DECEMBER 31, 2005 COMPARED WITH YEAR ENDED DECEMBER 31, 2004
BNSF recorded net income for 2005 of $1,531 million, or $4.01 per share, which included a $0.12 per share loss related to an agreement to sell certain line segments to the state of New Mexico (see Item 7, Management’s Discussion and Analysis of Financial Position and Results of Operations under the heading “New Mexico Department of Transportation”). In comparison, net income for 2004 was $791 million, or $2.10 per share, which included a $288 million, net of tax, or $0.77 per share charge for a change in the Company’s estimate of unasserted asbestos liabilities and environmental liabilities (see Note 10 of the Consolidated Financial Statements).
REVENUES
FREIGHT
Freight revenues of $12,606 million for 2005 were $1,864 million, or 17 percent, higher than 2004. Freight revenues were up due to a 5 percent increase in volumes, despite a decrease in car velocity from 199 miles per day in 2004 to approximately 190 miles per day in 2005. Freight revenues in 2005 included fuel surcharges of approximately $1.1 billion compared with approximately $350 million in the prior year. Growth in rates and fuel surcharges drove average revenue per car/unit up 12 percent in 2005 to $1,258 from $1,126 in 2004.
CONSUMER PRODUCTS The Consumer Products’ freight business consists of the following business areas: international intermodal, domestic intermodal, automotive, and perishables and dry boxcar. Consumer Products revenues of $5,156 million for 2005 were $911 million, or 22 percent, greater than 2004. The increase in Consumer Products revenues was strong in all sectors. The increase in average revenue per unit of 11 percent was primarily related to rate increases and increased fuel surcharges. |  | |
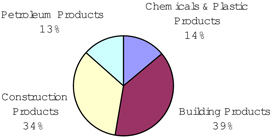
INDUSTRIAL PRODUCTS Industrial Products’ freight business consists of four business areas: building products, construction products, chemicals and plastic products, and petroleum products. | | |
Industrial Products revenues increased $423 million, or 17 percent, to $2,871 million for 2005. The revenue increase was primarily due to increased lumber, panel and paper traffic in the building products sector, as well as increased traffic in petroleum products, partially offset by decreased volumes in waste products in the building products sector as well as steel and taconite in the construction products sector. Rate increases along with increased fuel surcharges contributed to a 17 percent increase in average revenue per car. | ||
COAL
BNSF is one of the largest transporters of low-sulfur coal in the United States. Approximately 93 percent of all BNSF Railway’s coal tons originate from the Powder River Basin of Wyoming and Montana.
Coal revenues of $2,448 million for 2005 increased $171 million, or 8 percent, versus a year ago. Coal volumes increased slightly as a result of new customer business and higher demand from existing customers, partially offset by weather-related operational and maintenance disruptions in the Powder River Basin. Average revenue per car increased 6 percent primarily driven by contractual rate escalations and increased average length of haul.
AGRICULTURAL PRODUCTS The Agricultural Products’ freight business transports agricultural products including corn, wheat, soybeans, bulk foods, fertilizer and other products. | 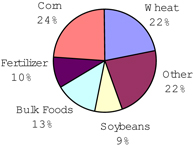 | |
Agricultural Products revenues of $2,131 million for 2005 were $359 million, or 20 percent, higher than revenues for 2004. Average revenue per car increased 18 percent primarily driven by mix as a result of strong exports out of the Pacific Northwest, price increases and increased fuel surcharges. |
OTHER REVENUES
Other Revenues increased $177 million, or 87 percent, to $381 million for 2005 compared to 2004. This increase was primarily attributable to increases in storage-related revenues and volume growth, in addition to the acquisitions and volume growth of BNSF Logistics, a wholly-owned non-rail subsidiary that specializes in providing third-party logistic services.
EXPENSES
Total operating expenses for 2005 were $10,065 million, an increase of $805 million, or 9 percent, over 2004. The increase in operating expenses was the result of significant fuel price increases, a 5-percent increase in gross-ton miles handled and a $71 million pre-tax loss related to an agreement to sell certain line segments to the state of New Mexico, offset by lower asbestos and environmental costs due to the $465 million pre-tax charge taken in 2004 to reflect changes in the Company’s estimate of unasserted asbestos liabilities and environmental liabilities.
COMPENSATION AND BENEFITS
Compensation and benefits includes expenses for BNSF employee compensation and benefit programs. The primary factors influencing the expenses recorded are volume, headcount, utilization, wage rates, incentives earned during the period, benefit plan participation as well as pension-related expenses.
Compensation and benefits expenses of $3,515 million were $193 million, or 6 percent, higher than 2004. The increase was primarily related to the significant increase in freight volumes experienced in 2005. The increases in freight volumes drove an increase in crew training costs and an approximate 5 percent increase in employee headcount.
FUEL
Fuel expense is driven by market price, the level of locomotive consumption of diesel fuel and the effects of hedging activities.
Fuel expenses of $1,959 million for 2005 were $624 million, or 47 percent, higher than 2004. The increase in fuel expense is due to an increase in the average all-in cost per gallon of diesel fuel, as well as an increase in consumption driven by higher volumes. The average all-in cost per gallon of diesel fuel increased by 40 cents, or $566 million, which is comprised of an increase in the average purchase price of 53 cents, or $759 million, partially offset by an increase in the hedge benefit of 13 cents, or $193 million (2005 benefit of $531 million less 2004 benefit of $338 million). Consumption in 2005 was 1,402 million gallons compared with 1,344 million gallons in 2004, resulting in a $58 million increase in fuel expense.
In the future, benefits from hedging activities are expected to decrease as the Company increases its fuel surcharge program. When compared to 2005, operating income is expected to be negatively impacted by the combination of fuel prices, hedges and fuel surcharge recoveries.
PURCHASED SERVICES
Purchased services expense includes ramping (lifting of containers onto and off of cars); drayage (highway movements to and from railway facilities); maintenance of locomotives, freight cars and equipment; transportation costs over other railroads; technology services outsourcing; professional services; and other contract services provided to BNSF. Purchased services expense also includes purchased transportation costs for BNSF Logistics. The expenses are driven by the rates established in the related contracts and the volume of services required.
Purchased services expenses of $1,714 million for 2005 were $290 million, or 20 percent, higher than 2004. This increase was primarily due to increases in the following volume-related costs: approximately $75 million higher intermodal ramp costs; approximately $70 million higher locomotive, freight car and equipment maintenance expense; approximately $45 million higher purchased transportation costs for BNSF Logistics and approximately $30 million higher payments for transportation over other railroads.
DEPRECIATION AND AMORTIZATION
Depreciation and amortization expenses for the period are determined by using the group method of depreciation, applying a single rate to the gross investment in a particular class of property. Due to the capital-intensive nature of BNSF’s operations, depreciation expense is a significant component of the Company’s operating expense. The full effect of inflation is not reflected in operating expenses since depreciation is based on historical cost.
Depreciation and amortization expenses of $1,075 million for 2005 were $63 million, or 6 percent, higher than 2004. This increase was primarily due to ongoing capital expenditures.
EQUIPMENT RENTS
Equipment rents expense includes long-term and short-term payments primarily for locomotives, freight cars, containers and trailers. Variances in expense are driven primarily by volume, lease and rental rates, utilization of equipment and changes in business mix resulting in equipment usage variances.
Equipment rents expenses for 2005 of $886 million were $96 million, or 12 percent, higher than 2004. Expense increases of $70 million for freight car equipment and $26 million for locomotive leases were driven by increases in units resulting from significant volume increases as well as higher lease rates.
MATERIALS AND OTHER
Material expenses consist mainly of the costs involved to purchase mechanical and engineering materials and other items for construction and maintenance of property and equipment. Other expenses include personal injury claims, environmental remediation and derailments as well as employee separation costs, utilities, impairments of long-lived assets and property and miscellaneous taxes. The total is offset by gains on land sales and other recoveries.
Materials and other expenses of $916 million for 2005, which consists of approximately $360 million of materials expense with the remainder consisting of numerous other items, were $461 million, or 33 percent, lower than 2004. In 2005, materials and other expense was impacted by an impairment charge of $71 million related to the future sale of certain line segments as well as $70 million of increased material costs for locomotives, freight cars and track structure, partially offset by lower environmental and personal injury expense in 2005. However, the $465 million pre-tax charge recorded in 2004 to reflect a change in BNSF’s estimates of unasserted asbestos and environmental liabilities more than offset these changes by a significant amount.
INTEREST EXPENSE
Interest expense of $437 million for 2005 was $28 million, or 7 percent, higher than 2004. This increase was primarily the result of higher average interest rates in 2005.
OTHER EXPENSE, NET
Other expense of $37 million for 2005 was $33 million higher than in 2004. The increase in other expense, net was predominantly due to the receipt of interest income on a settlement that occurred in 2004, losses on BNSF’s participation in a synthetic fuel partnership for which tax credits are generated and higher accounts receivable sales fees driven primarily by higher interest rates.
YEAR ENDED DECEMBER 31, 2004 COMPARED WITH YEAR ENDED DECEMBER 31, 2003
BNSF recorded net income for 2004 of $791 million, or $2.10 per share. 2004 net income includes a $288 million, net of tax, or $0.77 per share charge for a change in the Company’s estimate of unasserted asbestos liabilities and environmental liabilities (see Note 10 of the Consolidated Financial Statements). In comparison, net income for 2003 was $816 million, or $2.19 per share, which includes the favorable cumulative effect of an accounting change of $39 million, net of tax, or $0.10 per share (see Note 2 of the Consolidated Financial Statements).
REVENUES
FREIGHT
Freight revenues of $10,742 million for 2004 were $1,457 million, or 16 percent, higher than 2003. Freight revenues in 2004 included fuel surcharges of $357approximately $350 million compared with $110approximately $100 million in the prior year. Average revenue per car/unit increased 5 percent in 2004 to $1,126 from $1,074 in 2003.
CONSUMER PRODUCTS
The Consumer Products’ freight business includes a significant intermodal component and consists of the following business areas: international, direct marketing, truckload, intermodal marketing companies, automotive, and perishables and dry boxcar.
Consumer Products revenues of $4,245 million for 2004 were $588 million, or 16 percent, greater than 2003. The increase in Consumer Products revenue is primarily due to double digit volume growth in the international, truckload, and perishables sectors. The increase in average revenue per unit of 4 percent is primarily related to rate increases and increased fuel surcharges.
INDUSTRIAL PRODUCTS
Industrial Products’ freight business consists of four business areas: building products, construction products, chemicals and plastics, and petroleum products.
Industrial Products revenues increased $310 million, or 15 percent, to $2,448 million for 2004. The revenue increase is primarily due to increased lumber, plywood, particle board
CONSUMER PRODUCTS Consumer Products revenues of $4,245 million for 2004 were $588 million, or 16 percent, greater than 2003. The increase in Consumer Products revenues was primarily due to double-digit volume growth in the international and domestic intermodal sectors. The increase in average revenue per unit of 4 percent was primarily related to rate increases and increased fuel surcharges. | 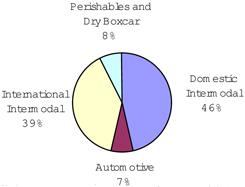 | |
INDUSTRIAL PRODUCTS | ||
Industrial Products revenues increased $310 million, or 15 percent, to $2,448 million for 2004. The revenue increase was primarily due to increased lumber, plywood, particleboard and paper traffic in the building products sector and increased business in steel, taconite and clay in the construction products sector, as well as increased traffic in petroleum products and plastics. Rate increases along with increased fuel surcharges contributed to a 5 percent increase in average revenue per car. |  |
COAL
BNSF is one of the largest transporters of low-sulfur coal in the United States. Approximately 90 percent of all BNSF Railway’s coal tons originate from the Powder River Basin of Wyoming and Montana.
Coal revenues of $2,277 million for 2004 increased $252 million, or 12 percent, versus a year ago. The increase iswas primarily a result of new customer business volumes and higher demand from existing customers. Average revenue per car increased 4 percent primarily driven by contractual rate escalations and increased average length of haul.
AGRICULTURAL PRODUCTS
The Agricultural Products’ freight business is the transportation of agricultural products including corn, wheat, soybeans, bulk foods, fertilizer, and other products.
Agricultural Products revenues of $1,772 million for 2004 were $307 million, or 21 percent, higher than revenues for 2003. This increase is primarily driven by strong corn and wheat exports out of the Pacific Northwest. The average revenue per car increased 12 percent primarily driven by the mix of commodity and destination price increases, increased fuel surcharges and increased average length of haul.
AGRICULTURAL PRODUCTS
Agricultural Products revenues of $1,772 million for 2004 were $307 million, or 21 percent, higher than revenues for 2003. This increase was primarily driven by strong corn and wheat exports out of the Pacific Northwest. The average revenue per car increased 12 percent primarily driven by the mix of commodity and destination price increases, increased fuel surcharges and increased average length of haul. | 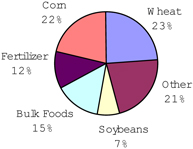 |
OTHER REVENUES
Other Revenues increased $76 million, or 59 percent, to $204 million for 2004 compared to 2003. This increase iswas primarily attributable to increased volumes related to BNSF Logistics, a wholly-owned non-rail subsidiary that specializes in providing third-party logistic services, and demurrage.
EXPENSES
Total operating expenses for 2004 were $9,260 million, an increase of $1,512 million, or 20 percent, over 2003. The increase was primarily due to a $465 million pre-tax charge to reflect changes in the Company’s estimate of unasserted asbestos liabilities and environmental liabilities. The increase in operating expenses was also the result of an 11 percent increase in gross-ton miles handled and significant fuel price increases.
COMPENSATION AND BENEFITS
Compensation and benefits includes expenses for BNSF employee compensation and benefit programs. The primary factors influencing the expenses recorded are volume, headcount, utilization, wage rates, incentives earned during the period, benefit plan participation and pension expenses.
Compensation and benefits expenses of $3,322 million were $359 million, or 12 percent, higher than 2003. The increase iswas primarily related to the significant increase in volumes. These increases in traffic volume drove an approximate 3 percent increase in employee headcount as well as greater overtime and crew training costs. Improved financial performance has led to higher incentive expenses for the Company’s salaried and scheduled workforce. Additionally, BNSF recognized increased pension costs of $17 million.
FUEL
Fuel expenses of $1,335 million for 2004 were $242 million, or 22 percent, higher than 2003. The increase in fuel expense is due to an increase in the average all-in cost per gallon of diesel fuel, as well as an increase in consumption driven by higher volumes. The average all-in cost per gallon of diesel fuel increased by 9 cents, or $124 million, which is comprised of an increase in the average purchase price of 29 cents, or $394 million, partially offset by an increase in the hedge benefit of 20 cents, or $270 million (2004 benefit of $338 million less 2003 benefit of $68 million). Consumption in 2004 was 1,344 million gallons compared with 1,213 million gallons in 2003.
PURCHASED SERVICES
Purchased services expense includes ramping and drayage, maintenance of locomotive and freight car equipment and technology services outsourcing, and other services, such as vegetation control, provided to BNSF, as well as purchased transportation costs for BNSF Logistics. The expenses are driven by the rates established in the service contracts and the volume of services required.
Purchased services expenses of $1,424 million for 2004 were $172 million, or 14 percent, higher than 2003 primarily due to higher costs for locomotive contract maintenance expense of $50 million, haulage expense of $27 million and intermodal ramp costs of $20 million for contracted transportation over other railroads, all of which were primarily driven by higher volume. Additionally, purchased transportation costs for BNSF Logistics increased $45 million as a result of increases in its business.
DEPRECIATION AND AMORTIZATION
Depreciation and amortization expenses for the period are determined by using the group method of depreciation, applying a single rate to the gross investment in a particular class of property. Due to the capital-intensive nature of BNSF’s operations, depreciation expense is a significant component of the Company’s operating expense. The full effect of inflation is not reflected in operating expenses since depreciation is based on historical cost.
Depreciation and amortization expenses of $1,012 million for 2004 were $102 million, or 11 percent, higher than 2003. The majority of the increase iswas due to ongoing capital expenditures. Additionally, about $40 million of this increase was due to the expiration of credits to depreciation expense resulting from the application of purchase accounting at the time of the merger in 1996. As a result of a depreciation rate study completed with the assistance of third-party consultants in 2004, BNSF adopted new depreciation rates applied to track structure. This change in rate caused a net decrease in annual depreciation expense of approximately $5 million for 2004 and approximately $16 million on an ongoing annual basis, as calculated using the asset base at the time of the rate change.
EQUIPMENT RENTS
Equipment rents expense includes long-term and short-term payments primarily for locomotives, freight cars, containers and trailers. Variances in expense are driven primarily by volume, rental rates, the results of lease negotiations, utilization of owned equipment versus leased equipment, and changes in business mix resulting in equipment usage variances.
Equipment rents expenses for 2004 of $790 million were $85 million, or 12 percent, higher than 2003. Expense increases of $68 million for freight car equipment and $17 million for locomotive leases are predominantly related to significant volume increases.
FUEL
Fuel expense is driven by the level of locomotive consumption, market price and the effects of hedging activities.
Fuel expenses of $1,335 million for 2004 were $242 million, or 22 percent, higher than 2003. The increase in fuel expense is due to an increase in the average all-in cost per gallon of diesel fuel, as well as an increase in consumption driven by higher volumes. The average all-in cost per gallon of diesel fuel increased by 9-cents, or $124 million, which is comprised of an increase in the average purchase price of 29 cents, or $394 million, partially offset by an increase in the hedge benefit of 20-cents, or $270 million (2004 benefit of $338 million less 2003 benefit of $68 million). Consumption in 2004 was 1,344 million gallons compared with 1,213 million gallons in 2003.
MATERIALS AND OTHER
Material expenses consist mainly of the costs involved to purchase mechanical and engineering materials and other items for construction and maintenance of property and equipment. Other expenses include personal injury claims, environmental remediation, and derailments as well as employee separation costs, utilities, and property and miscellaneous taxes. The total is offset by gains on land sales and other recoveries.
Materials and other expenses of $1,377 million for 2004, which consists of approximately $300 million of materials expense with the remainder consisting of other items, including a charge of $465 million pre-tax related to a change in BNSF’s estimates of unasserted asbestos liabilities and environmental liabilities, were $552 million higher than 2003. In addition to the charge, materials and other expenses increased due to higher material costs of $44 million primarily to maintain freight cars and locomotives due to higher volumes, increased environmental expenses of $28 million primarily related to developments at two former fueling facility sites, increased casualty costs of $32 million driven by two large derailments, and a $24 million decrease in the carrying value of certain assets (see Note 7 of the Consolidated Financial Statements) partially offset by decreases in property and other miscellaneous taxes of $9 million, and increased gains from land sales of $23 million.
INTEREST EXPENSE
Interest expense of $409 million for 2004 was $11 million, or 3 percent, lower than 2003. This decrease was primarily the result of lower average interest rates and lower average debt outstanding.
OTHER EXPENSE, NET
Other expense of $4 million for 2004 was $10 million lower than in 2003. The decrease in expense was due to the receipt of interest income on a settlement that occurred during the third quarter of 2004, partially offset by losses on company owned life insurance.
INCOME TAXES
The effective tax rate in 2004 was 37.9 percent compared with 36.9 percent for the prior-year.prior year. The increase in the effective tax rate primarily reflects a tax settlement attributable to prior years that was settled favorably in 2003.
YEAR ENDED DECEMBER 31, 2003 COMPARED WITH YEAR ENDED DECEMBER 31, 2002
BNSF recorded net income for 2003 of $816 million, or $2.19 per share, which includes the favorable cumulative effect of an accounting change of $39 million, net of tax, or $0.10 per share (see Note 2 of the Consolidated Financial Statements), compared with net income for 2002 of $760 million, or $2.00 per share. Operating income of $1,665 million in 2003 was $9 million higher than 2002.
REVENUES
FREIGHT
Freight revenues of $9,285 million for 2003 were $412 million, or 5 percent, higher than 2002. Freight revenues in 2003 included fuel surcharges of $110 million compared with $26 million in the prior year. Average revenue per car/unit decreased 1 percent in 2003 to $1,074 from $1,084 in 2002.
CONSUMER PRODUCTS
Consumer Products revenues of $3,657 million for 2003 were $304 million, or 9 percent, greater than 2002. The increase in Consumer Products revenue is primarily due to increased volumes in the international and truckload sectors. The reduction in average revenue per unit of 2 percent is primarily related to the strong growth in the international sector, which has lower average revenue per unit.
INDUSTRIAL PRODUCTS
Industrial Products revenues increased $97 million, or 5 percent, to $2,138 million for 2003. The revenue increase is primarily due to increased business in steel, taconite, clay and minerals in the construction products sector and increased military, lumber, plywood, particle board and paper traffic in the building products sector, which were somewhat offset by lower plastics traffic. Rate increases along with increased fuel surcharges contributed to a 4 percent increase in average revenue per car.
COAL
Coal revenues of $2,025 million for 2003 decreased $46 million, or 2 percent, versus a year ago. The decrease is primarily a result of lower volumes from the first quarter draw-down of utility stockpiles, weaker demand due to milder weather, utility plant shutdowns and the conversion of a utility plant from coal to natural gas. The average revenue per car grew slightly.
AGRICULTURAL PRODUCTS
Agricultural Products revenues of $1,465 million for 2003 were $57 million, or 4 percent, higher than revenues for 2002. This increase is primarily due to more ethanol shipments from plants in the Midwest to California and higher shipments of ethanol by-products. Increased export shipments of soybeans also contributed to growth. The average revenue per car was down slightly due to a change in traffic mix partially offset by increased fuel surcharges.
EXPENSES
Total operating expenses for 2003 were $7,748 million, an increase of $425 million, or 6 percent, over 2002 primarily due to higher fuel expenses and greater volumes handled.
COMPENSATION AND BENEFITS
Compensation and benefits expenses of $2,963 million were $69 million, or 2 percent, higher than 2002 primarily due to higher volumes and the implementation of Statement of Financial Accounting Standards (SFAS) No. 143,Accounting for Asset Retirement Obligations, as described in Note 2 of the Consolidated Financial Statements, as well as wage inflation, higher pension costs and new hire crew training, partially offset by lower head counts and the favorable impact of railroad retirement reform on payroll tax costs.
PURCHASED SERVICES
Purchased services expenses of $1,252 million for 2003 were $106 million, or 9 percent, higher than 2002 primarily due to volume-related intermodal ramp and drayage costs and increased locomotive maintenance costs associated with maintaining more locomotives as well as higher service contracts expense related to an agreement to outsource the management of a large portion of BNSF’s information technology infrastructure entered into during the third quarter of 2002 and the implementation of SFAS No. 143.
DEPRECIATION AND AMORTIZATION
Depreciation and amortization expenses of $910 million for 2003 were $21 million, or 2 percent, lower than 2002 primarily due to the implementation of SFAS No. 143, as well as new lower depreciation rates for locomotives partially offset by normal increases for capital expenditures.
EQUIPMENT RENTS
Equipment rents expenses for 2003 of $705 million were $7 million, or 1 percent, higher than 2002 primarily due to volume growth partially offset by decreases in intermodal and carload equipment rent expenses. Decreases in intermodal and carload equipment rent expenses are a result of greater use of private trailers and containers, as well as favorable lease renegotiations and short term lease rate incentives.
FUEL
Fuel expenses of $1,093 million for 2003 were $245 million, or 29 percent, higher than 2002. The increase in fuel expense was primarily the result of a 16-cent, or $194 million, increase in the average all-in cost per gallon of diesel fuel. The increase in the average all-in cost per gallon of diesel fuel is comprised of a 17-cent, or $212 million, increase in the average purchase price which is partially offset by an increase in the hedge benefit of 1-cent, or $18 million (2003 benefit of $68 million less 2002 benefit of $50 million). Consumption in 2003 was 1,213 million gallons compared with 1,149 million gallons in 2002.
MATERIALS AND OTHER
Materials and other expenses of $825 million for 2003 were $19 million, or 2 percent, higher than 2002 principally due to the implementation of SFAS No. 143, employee severance costs and lower gains from property sales substantially offset by decreased material costs and bad debt expense.
INTEREST EXPENSE
Interest expense of $420 million for 2003 was $8 million, or 2 percent, lower than 2002. This decrease was primarily the result of lower average interest rates and an increased benefit from interest rate hedges, partially offset by higher average debt outstanding.
OTHER EXPENSE, NET
Other expense of $14 million for 2003 was $2 million higher than in 2002.
INCOME TAXES
The effective tax rate in 2003 was 36.9 percent compared with 37.5 percent for the prior-year period. The decrease in the effective tax rate primarily reflects a tax settlement attributable to prior years that was settled favorably in the second quarter of 2003.
LIQUIDITY AND CAPITAL RESOURCES
Cash generated from operations is BNSF’s principal source of liquidity. BNSF generally funds any additional liquidity requirements through debt issuance including commercial paper, the leasing of assets and the sale of a portion of its accounts receivable.
OPERATING ACTIVITIES
2005
Net cash provided by operating activities was $2,609 million during 2005 compared with $2,377 million during 2004. The increase was primarily the result of an increase in earnings before the effect of the 2004 third quarter charge related to a change in BNSF’s estimates of unasserted asbestos liabilities and environmental liabilities, which had no impact on the Company’s cash flows (see note 10 of the Consolidated Financial Statements) and a use of cash related to the $350 million decrease in the Company’s accounts receivable sales program (see Note 6 of the Consolidated Financial Statements). The decrease in the Company’s accounts receivable sales program resulted in higher commercial paper (see Note 9 of the Consolidated Financial Statements).
2004
Net cash provided by operating activities was $2,377 million during 2004 compared with $2,285 million during 2003. The increase iswas primarily the result of an increase in earnings before the effect of the aforementioned third quarter charge related to a change in BNSF’s estimates of unasserted asbestos liabilities and environmental liabilities, which had a de minimis impact on the Company’s cash flows.2004 charge.
INVESTING ACTIVITIES
20032005
Net cash provided by operatingused for investing activities was $2,285$2,023 million during 20032005 compared with $2,106$1,595 million during 2002.2004. Investing activities for the year include $1,750 million of capital expenditures, which were $223 million higher than 2004 primarily due to an increase in capital expenditures for maintenance of BNSF’s track structure and for terminal and line expansions. The increase wasin cash used for other investing activities primarily reflects the resulttiming of changesequipment financing activities, consideration paid to another carrier for trackage rights and alternative access rights (see Note 7 of the Consolidated Financial Statements), line acquisitions and investment in working capital andPace Synfuels as well as a $26 million cash source in the Seattle Sound Transit transactionfirst quarter of 2004 related to the consolidation of San Jacinto Rail Limited (see further discussion underNote 2 of the headings “Other Matters; Seattle Sound Transit”)Consolidated Financial Statements).
INVESTING ACTIVITIES
2004
Net cash used for investing activities was $1,595 million during 2004 compared with $1,806 million during 2003. Investing activities for the year include $1,527 million of capital expenditures, which were $199 million lower than 2003 primarily due to the fact that most of the locomotives acquired in 2004 were leased, whereas the majority of locomotives acquired in 2003 were purchased.
2003
Net cash used for investing activities was $1,806 million during 2003 compared with $1,517 million during 2002. Investing activities for the year included $1,726 million of capital expenditures which were $368 million higher than 2002 primarily related to the purchase, instead of lease, of locomotives as well as the advance construction of double track on a portion of BNSF Railway’s transcontinental route.
A breakdown of cash capital expenditures during 2005, 2004 2003 and 20022003 is set forth in the following table (in millions):
Year Ended December 31, | 2004 | 2003 | 2002 | 2005 | 2004 | 2003 | ||||||||||||
Maintenance of way: | ||||||||||||||||||
Rail | $ | 219 | $ | 202 | $ | 193 | $ | 232 | $ | 219 | $ | 202 | ||||||
Ties | 257 | 227 | 222 | 284 | 257 | 227 | ||||||||||||
Surfacing | 159 | 160 | 161 | 183 | 159 | 160 | ||||||||||||
Other | 359 | 337 | 325 | 354 | 359 | 337 | ||||||||||||
Total maintenance of way | 994 | 926 | 901 | 1,053 | 994 | 926 | ||||||||||||
Mechanical | 114 | 133 | 168 | 136 | 114 | 133 | ||||||||||||
Information services | 73 | 63 | 79 | 64 | 73 | 63 | ||||||||||||
Other | 107 | 116 | 107 | 108 | 107 | 116 | ||||||||||||
Total maintenance of business | 1,288 | 1,238 | 1,255 | 1,361 | 1,288 | 1,238 | ||||||||||||
New locomotive acquisitions | 16 | 270 | — | — | 16 | 270 | ||||||||||||
Terminal and line expansion | 223 | 218 | 103 | 389 | 223 | 218 | ||||||||||||
Total | $ | 1,527 | $ | 1,726 | $ | 1,358 | $ | 1,750 | $ | 1,527 | $ | 1,726 | ||||||
The above table does not include expenditures for equipment financed through operating leases (principally related to locomotives).
FINANCING ACTIVITIES
20042005
Net cash used for financing activities during 20042005 was $478$833 million primarily related to:to the following: (i) dividend payments of $231 million; (ii) net debt repayments of $292 million; and (iii) common stock repurchases of $376$799 million, (ii) prepaid forward share repurchases of $600 million (see Note 15 of the Consolidated Financial Statements), and (iii) dividend payments of $267 million, which werewhere partially offset by net debt borrowings of $599 million and proceeds from stock options exercised of $420$244 million.
In December 2005, BNSF issued $500 million of 6.613 percent junior subordinated notes due December 31, 2055. The junior subordinated notes are callable on or after January 15, 2026, at par plus accrued and unpaid interest. On January 15, 2026, if the junior subordinated notes are not called, the interest rate will change to an annual rate equal to the 3-month LIBOR rate plus 2.35%, reset quarterly. Interest payments may be deferred, at the option of the Company, on a cumulative basis for a period of up to five consecutive years; however, during this time the Company will not be permitted to declare or pay dividends on its common stock. In the event that certain financial covenants are not maintained, the Company will be required to sell common stock, the proceeds of which will be used to pay any accrued and unpaid interest. At December 31, 2005, the Company was in compliance with these covenants. Because of this structure, certain rating agencies provide a considerable degree of equity treatment for purposes of calculating various ratios and metrics. The majority of the net proceeds of the debt issuance are being used to repurchase common stock, with the remainder used for general corporate purposes.
Aggregate debt to mature in 20052006 is $465$456 million. BNSF’s ratio of net debt to total capitalization was 42.7 percent at December 31, 2005, compared with 39.9 percent at December 31, 2004, compared with 44.0 percent at December 31, 2003.2004. The Company’s adjusted net debt to total capitalization including operating lease commitments was 51.5 percent at December 31, 2005, compared to 51.0 percent at December 31, 2004, compared to 54.3 percent at December 31, 2003.2004. BNSF’s adjusted net debt to total capitalization is a non-GAAP measure and should be considered in addition to, but not as a substitute or preferable to, the information prepared in accordance with GAAP. However, the information is included herein as management believes that adjusted net debt to total capitalization provides meaningful additional information about the ability of BNSF to service long-term debt and other fixed obligations and to fund future growth.
The following table presents a reconciliation of the calculation of adjusted net debt to total capitalization percentage:
Year Ended December 31, | 2004 | 2003 | ||||
Net debt to total capitalizationa | 39.9 | % | 44.0 | % | ||
Adjustment for long-term operating leases | 9.3 | % | 8.7 | % | ||
Adjustment for other debt equivalents | 1.8 | % | 1.6 | % | ||
Adjusted net debt to total capitalizationb | 51.0 | % | 54.3 | % | ||
Year Ended December 31, | 2005 | 2004 | ||||
Net debt to total capitalization a | 42.7 | % | 39.9 | % | ||
Adjustment for long-term operating leases | 9.4 | % | 9.3 | % | ||
Adjustment for other debt equivalents b | 0.6 | % | 1.8 | % | ||
Adjustment for junior subordinated notes c | (1.2 | )% | — | % | ||
Adjusted net debt to total capitalization | 51.5 | % | 51.0 | % | ||
| a | Net debt to total capitalization is calculated as total debt less cash and cash equivalents divided by the sum of net debt and total stockholders’ |
| b | Adjustment for other debt equivalents principally includes accounts receivable financing. See Note 6 of the Consolidated Financial Statements. |
Pursuant to existing Board authority, BNSF can issue up to an additional $1 billion of debt securities. The decrease in adjustedCompany expects that it will file shelf registration statements for this additional $1 billion when it is ready to issue the debt.
2004
Net cash used for financing activities during 2004 was $478 million primarily related to the following: (i) dividend payments of $231 million; (ii) net debt to total capitalization reflects the improved financial performancerepayments of BNSF.$292 million; and (iii) common stock repurchases of $376 million, which were offset by proceeds from stock options exercised of $420 million.
The Company issued $250 million of 4.88 percent notes due January 15, 2015. The net proceeds of the debt issuance were used for general corporate purposes including the repayment of outstanding commercial paper.
BNSF had $500 million of debt capacity available under its shelf registration at December 31, 2004.
2003
Net cash used for financing activities during 2003 was $489 million primarily related to common stock repurchases of $217 million, dividend payments of $191 million and net debt repayments of $151 million partially offset by proceeds from stock options exercised of $68 million.
The Company exercised an option to call $150 million of 7.50 percent bonds due July 2023. The bonds were called at a price of 103.02 percent of par, and commercial paper was used to fund the call.
BNSF issued $250 million of 4.30 percent notes due July 1, 2013. The net proceeds of the debt issuance were used for general corporate purposes including the repayment of outstanding commercial paper.
The Company exercised an option to call $29 million of 2.63 percent mortgage bonds issued by a predecessor company and due January 1, 2010. Cash generated from operations was used to fund the call.
2002
Net cash used for financing activities during 2002 was $587 million primarily related to common stock repurchases of $353 million, a net reduction in borrowings of $90 million and dividend payments of $183 million, partially offset by proceeds of $40 million resulting from the exercise of 2.3 million stock options.
The Company constructed an intermodal facility built by a third party real estate developer and entered into an agreement to lease the intermodal facility for 20 years from a third party lessor. Under accounting guidance, the Company was considered the owner of the facility during the construction period. The transaction was evaluated and it was determined that sale-leaseback accounting did not apply due to the existence of a purchase option. Accordingly, the transaction was treated as a financing for which the Company recorded an asset in property and equipment, net and a liability in long-term debt and commercial paper of $138 million that represented the fair market value at lease inception.
BNSF issued $300 million of 5.90 percent notes due July 1, 2012. The net proceeds of the debt issuance were used for general corporate purposes including the repayment of outstanding commercial paper.
DIVIDENDS
Common stock dividends declared were $0.74 per share, $0.64 per share, $0.54 per share, and $0.48$0.54 per share annually for 2005, 2004 2003 and 2002,2003, respectively. Dividends paid on common stock were $267 million, $231 million and $191 million during 2005, 2004 and $183 million during 2004, 2003, and 2002, respectively.
COMMON STOCK REPURCHASE PROGRAM
In July 1997, the Board authorized the repurchase of up to 30 million shares of the Company’s common stock from time to time in thethrough open market.market transactions or otherwise. In December 1999, April 2000, September 2000, and January 2003 and December 2005, the Board authorized extensions of the BNSF share repurchase program, adding 30 million shares at each date to the total shares previously authorized bringing BNSF’s share repurchase program to 150180 million shares. During 2005, 2004 2003 and 2002,2003, the Company repurchased approximately 14 million, 10 million, 8 million, and 138 million shares, respectively, of its common stock at average prices of $54.95 per share, $35.98 per share, $27.25 per share, and $27.85$27.25 per share, respectively. Total repurchases through December 31, 2004,2005, were 134148 million shares at a total average cost of $26.82$29.49 per share, leaving 1632 million shares available for repurchase out of the 150180 million shares presently authorized.
LONG-TERM DEBT AND OTHER OBLIGATIONS
The Company’s business is capital intensive. BNSF has historically generated a significant amount of cash from operating activities, which it uses to fund capital additions, service debt, repurchase shares and pay dividends. Additionally, the Company relies on access to the debt and leasing markets to finance a portion of capital additions on a long-term basis.
BNSF has agreed to acquire 1,315845 locomotives by 2009. As of December 31, 2004,2005, BNSF has taken delivery of 615403 of the 1,315845 locomotives. During 2004,2005, BNSF took delivery of 334288 locomotives, which were primarily financed through operating leases.
In the first quarter of 2004, BNSF entered into a contractual obligation to acquire 6,000 grain cars over the course of the nextfollowing four years. Through December 31, 2004,2005, BNSF has taken delivery of 1,4934,500 of the hoppers, which were primarily financed through operating leases.
The locomotives and grain cars under these agreements have been or are expected to be financed through one or a combination of sources including, but not limited to, cash from operations, capital or operating leases and debt issuances. The decision on the method used for a particular acquisition financing will depend on market conditions and other factors at that time.
The Company also utilizes a commercial paper program backed by a bank revolving credit agreementsagreement to manage liquidity needs. The following table summarizes the more significant obligations of the Company at December 31, 2004. For 20052006 and the foreseeable future, the Company expects that cash from operating activities, access to capital markets, the accounts receivable sales program and the bank revolving credit agreementsagreement will be sufficient to enable the Company to meet its obligations when due. The Company believes these sources of funds will also be sufficient to fund capital additions that are necessary to maintain its competitiveness and position the Company for future revenue growth.
The Company’s ratio of earnings to fixed charges was 3.064.62 and 3.003.06 times for the years ended December 31, 20042005 and 2003,2004, respectively. Additionally, the Company’s ratio of net cash provided by operating activities divided by total average debt was 3539 percent and 3335 percent for the years ended December 31, 20042005 and 2003,2004, respectively. The increase in the ratio of net cash provided by operating activities divided by total average debt is primarily due to increased revenue and lower average debt outstanding.
The following table summarizes the Company’s obligations under long-term debt and other contractual commitments at December 31, 20042005 (in millions):
| Payments Due by Period | Payments Due by Period | |||||||||||||||||||||||||||||
Contractual Obligations | Total | Less than 1 year | 1–3 years | 3–5 years | More than 5 years | Total | Less than 1 year | 1–3 years | 3–5 years | More than 5 years | ||||||||||||||||||||
Long-term debta | $ | 5,884 | $ | 371 | $ | 716 | $ | 321 | $ | 4,476 | $ | 6,550 | $ | 348 | $ | 415 | $ | 1,155 | $ | 4,632 | ||||||||||
Capital lease obligations | 632 | 94 | 194 | 166 | 178 | 604 | 108 | 211 | 140 | 145 | ||||||||||||||||||||
Operating lease obligationsb | 5,412 | 492 | 861 | 779 | 3,280 | 6,143 | 461 | 1,031 | 897 | 3,754 | ||||||||||||||||||||
Purchase obligationsc | 6,287 | 1,091 | 1,059 | 770 | 3,367 | 9,353 | 1,370 | 1,433 | 1,256 | 5,294 | ||||||||||||||||||||
Other long-term liabilities reflected on the balance sheet under GAAPd | 295 | 63 | 82 | 73 | 77 | 268 | 44 | 76 | 67 | 81 | ||||||||||||||||||||
Total Contractual Obligations | $ | 18,510 | $ | 2,111 | $ | 2,912 | $ | 2,109 | $ | 11,378 | ||||||||||||||||||||
Total contractual obligations | $ | 22,918 | $ | 2,331 | $ | 3,166 | $ | 3,515 | $ | 13,906 | ||||||||||||||||||||
| a | Excludes capital lease obligations. |
| b | Gross payments due which include an interest component. |
| c | Includes short-line minimum usage commitments, asset maintenance and other purchase commitments. |
| d | Consists of employee separation payments as discussed in Note 11 of the Consolidated Financial Statements, the |
In the normal course of business, the Company enters into long-term contractual requirements for future goods and services needed for the operations of the business. Such commitments are not in excess of expected requirements and are not reasonably likely to result in performance penalties or payments that would have a material adverse effect on the Company’s liquidity.
CREDIT AGREEMENTSAGREEMENT
Commercial paper and the revolving credit agreementsagreement are discussed in Note 9 of the Consolidated Financial Statements. The revolving credit agreements includeagreement includes covenants and events of default typical for this type of facility, including a minimum consolidated tangible net worth test, a maximum debt-to-capital test, and a $75 million cross-default provision. At December 31, 2004,2005, the Company was in compliance with its debt covenants. BNSF’s tangible net worth is $4 billion greater than the minimum consolidated tangible net worth required under the agreement, and the maximum debt-to-capital test provides approximately $7$6 billion of debt capacity above BNSF’s outstanding debt as of December 31, 2004,2005, before an event of default would occur under these covenants. With the exception of a voluntary bankruptcy or insolvency, any event of default has either or both a cure period or notice requirement before termination of the agreements.agreement. A voluntary bankruptcy or insolvency would be considered an immediate termination event.
OFF-BALANCE SHEET ARRANGEMENTS
SALE OF ACCOUNTS RECEIVABLE
The accounts receivable sales program of Santa Fe Receivables Corporation (SFRC), as described in Note 6 of the Consolidated Financial Statements, includes various provisions that, if triggered, would allow the investors participating in this program, at their option, to cancel the program. These provisions include a minimum consolidated tangible net worth test and a maximum debt-to-capital test, which are the same as in the BNSF revolving credit agreements described above. BNSF’s tangible net worth is approximately $4 billion greater than the minimum consolidated tangible net worth required under the agreement, and the maximum debt-to-capital test provides approximately $7$6 billion of debt capacity above BNSF’s outstanding debt as of December 31, 2004. At December 31, 2004, investor interests of $650 million were outstanding under the $700 million accounts receivable facility. SFRC renewed $350 million of the $700 million accounts receivables facility, effective June 2004, for an additional 364 days. In addition, SFRC entered into a separate $350 million accounts receivables facility, effective June 2003, with a five-year term. As a result of amendments2005. The Company’s capacity to the facilities in October, 2004, the commitments of the investors to purchasesell undivided interests for the two facilitiesto investors under the accounts receivable sales program are currently scheduledwas $700 million at December 31, 2005, which was comprised of two $350 million, 364-day accounts receivable facilities. The Company amended these facilities on October 14, 2005, modifying their expiration dates to expire in October 2005 and October 2008, respectively.2006. Management expects to be able to either extend the commitment of the current investors under the accounts receivable sales program past October 20052006 or to find additional investors in the accounts receivable sales program who will be committed to purchase undivided interests after October 2005.
The accounts receivable sales program provides efficient financing at a competitive interest rate toas compared with traditional borrowing arrangements.arrangements and provides diversification of funding sources. Since the funding is collateralized by BNSF receivables, the risk of exposure is only as great as the risk of default on these receivables (see Note 6 of the Consolidated Financial Statements).
GUARANTEES
The Company acts as guarantor for certain debt and lease obligations of others. During the year ended December 31, 2004past few years the Company has primarily utilized guarantees to allow third-party entities to obtain favorable terms to finance the construction of assets that will benefit the Company. Additionally, in the ordinary course of business, BNSF enters into agreements with third parties that include indemnification clauses. The Company does not expect performance under these guarantees or indemnities to have a material adverse effect on the Company’s liquidity in the foreseeable future (see Note 9 of the Consolidated Financial Statements).
PENSION FUNDING
The Company will make required contributions of approximately $13 million to the qualified BNSF Retirement Plan in 2005.
INFLATION
Due to the capital-intensive nature of BNSF’s business, the full effect of inflation is not reflected in operating expenses because depreciation is based on historical cost. An assumption that all operating assets were depreciated at current price levels would result in substantially greater expense than historically reported amounts.
OTHER MATTERS
COMMERCIAL
In July 2004, BNSF Railway initiated an arbitration proceeding under a Joint Service Agreement (JSA) with J.B. Hunt Transportation (J.B. Hunt), a major truckload carrier (the “carrier”) with which BNSF Railway handles substantial joint intermodal movements. In the proceeding, BNSF Railway is seekingsought an increase in its divisions of joint revenue for intermodal movements. InAdditionally, the pending proceeding, J.B. Hunt is also challengingcarrier challenged the basis of the divisions basis and raisingraised other issues under the JSA. TheAn Interim Award decision was issued by the arbitration panel on September 16, 2005, increasing BNSF’s revenue divisions, and favorably resolving other issues raised in the proceeding. Both parties accepted the Interim Award as the final and binding award in the arbitration on October 17, 2005. By agreement of the parties, on October 19 the panel entered an order terminating the proceeding. In the fourth quarter of 2005, BNSF recorded a gain of approximately $26 million pre-tax, $16 million, net of tax, or $0.04 per share, as a result of this proceeding is not expected to haveretroactive award of compensation for the period of July 7, 2004 through September 30, 2005. Of this gain, $21 million was recorded as an increase in Consumer Products revenue, and the remaining $5 million was recorded in purchased services expense as a material adverse effect onreimbursement of legal fees.
In February 2005, the Company received a Civil Investigative Demand from the Antitrust Division of the Department of Justice requesting information concerning the Company’s resultspricing activities relating to the shipment of operations, financial position or liquidity.
HEDGING ACTIVITIES
The Company uses derivatives to hedge against increases in diesel fuel prices and interest rates as well as to convert a portion of its fixed-rate long-term debt to floating-rate debt. The Company formally documents the relationship between the hedging instrument and the hedged item, as well as the risk management objective and strategy for the use of the hedging instrument. This documentation includes linking the derivatives that are designated as fair value or cash flow hedges to specific assets or liabilities on the balance sheet, commitments or forecasted transactions. The Company assesses at the time a derivative contract is entered into, and at least quarterly thereafter, whether the derivative item is effective in offsetting the changes in fair value or cash flows. Any change in fair value resulting from ineffectiveness, as defined by SFASStatement of Financial Accounting Standards (SFAS) No. 133,Accounting for Derivative Instruments and Hedging Activities,as amended, is recognized in current period earnings. For derivative instruments that are designated and qualify as cash flow hedges, the effective portion of the gain or loss on the derivative instrument is recorded in Accumulated Other Comprehensive Incomeaccumulated other comprehensive income (AOCI) as a separate component of stockholders’ equity and reclassified into earnings in the period during which the hedge transaction affects earnings.
FUEL
BNSF measures the fair value of fuel hedges from data provided by various external counterparties. To value a swap, the Company uses the forward commodity price for the period hedged. The fair values of costless collars are calculated and provided by the corresponding counterparties. BNSF monitors its hedging positions and credit ratings of its counterparties and does not anticipate losses due to counterparty nonperformance (see Note 3 of the Consolidated Financial Statements).
Between January 1, 2006 and February 13, 2006, the Company converted approximately 66 million gallons of WTI collars into HO swaps at an average price of approximately $0.95 per gallon. Additionally, the Company entered into HO-WTI swap agreements for 1.5 million barrels at an average price of $10.18 per barrel. These hedges will expire during 2006.
INTEREST RATE
From time to time, the Company enters into various interest rate hedging transactions for the purpose of managing exposure to fluctuations in interest rates and establishing rates in anticipation of future debt issuances as well as to convert a portion of its fixed-rate long-term debt to floating-rate debt. The Company uses interest rate swaps and treasury locks as part of its interest rate risk management strategy. BNSF’s measurement of the fair value of interest rate swaps and treasury locks is based on estimates of the mid-market values for the transactions provided by the counterparties to these agreements (see Note 3 of the Consolidated Financial Statements).
EMPLOYEE AND LABOR RELATIONS
Approximately 88 percentA significant majority of BNSF Railway’s employees are union-represented. BNSF Railway’s union employees work under collective bargaining agreements with various different labor organizations. A negotiating process for new, major collective bargaining agreements covering all of BNSF Railway’s union employees has been underway since athe bargaining round was initiated November 1, 1999.2004. Wages, health and welfare benefits, work rules and other issues have traditionally been addressed through industry-wide negotiations. These negotiations have generally taken place over an extended period of time and have previously not resulted in any extended work stoppages. The existing agreements have remained in effect and will continue to remain in effect until new agreements are reached or the Railway Labor Act’s procedures (which include mediation, cooling-off periods and the possibility of Presidentialpresidential intervention) are exhausted. TheAgreements undergoing renegotiation in the current agreementsbargaining round provide for periodic wage increases until new agreements are reached.
UNIONS WITH AN AGREEMENT UNDER THE PREVIOUS BARGAINING ROUND
In the previous bargaining round, which began on November 1, 1999, BNSF’s entire unionized workforce, reached final agreements that cover periods through December 2004.
2005 BARGAINING ROUND
The current bargaining round for all unions with contracts that will comecame into effect after January 1, 2005, began on and after November 1, 2004, with the serving of Section 6 notices, which are each side’s initial proposals. BNSF will participateis participating in coordinated national handling of these proposals. The current agreements as discussed above, areremain in effect until new agreements are reached or until changes to the existing agreements are made.
UNIONS WITH AN AGREEMENT UNDER THE PREVIOUS BARGAINING ROUND
In the previous bargaining round, the United Transportation Union, the Brotherhood of Maintenance of Way Employes, the Brotherhood of Locomotive Engineers and Trainmen, the Transportation Communications Union, the Brotherhood of Railroad Signalmen, the American Train Dispatchers Association, and the International Brotherhood of Electrical Workers representing approximately 91 percent, collectively, of BNSF’s unionized workforce, have reached final agreements that cover periods through December 2004.
UNIONS WHICH HAVE NOT SETTLED AN AGREEMENT UNDER THE PREVIOUS BARGAINING ROUND
Through the National Carriers’ Conference Committee, BNSF is continuing efforts to settle the previous bargaining round with the International Association of Machinists, Sheet Metal Workers’ International Association, and National Conference of Firemen and Oilers, which together represent approximately 9 percent of the Company’s unionized workforce.
RAILROAD RETIREMENT REFORM
Railroad industry personnel are covered by the Railroad Retirement System instead of Social Security. BNSF Railway’s contributions under the Railroad Retirement System have been approximately triple those in industries covered by Social Security. The Railroad Retirement System, funded primarily by payroll taxes on covered employers and employees, includes a benefit roughly equivalent to Social Security (Tier I), an additional benefit similar to that allowed in some private defined-benefit plans (Tier II), and other benefits. Investment of Tier II Railroad Retirement assets had, until 2001, been limited to special interest-bearing U.S. Treasury securities. The Railroad Retirement and Survivors’ Improvement Act of 2001 (Act) creates a new National Railroad Retirement Investment Trust to hold Tier II Railroad Retirement assets and empowers the trustees to invest these assets in the same types of investments available to private sector retirement plans. In addition to liberalizing certain retirement benefit requirements for rail employees, the Act reduced Tier II Railroad Retirement tax rates on rail employers beginning in 2002 and eliminated a supplemental annuity tax. In 2002, the Company realized savings of approximately $20 million and realized incremental savings of approximately $30 million and $20 million in 2003 and 2004, respectively. Based on projected wage levels and number of employees, the Company expects to realize further incremental savings in 2005 of approximately $10 million due to an additional 0.5 percentage point reduction in the Tier II rate for 2005. Future adjustments in the Tier II Railroad Retirement tax rates assessed will depend on Railroad Retirement fund levels.
SEATTLE SOUND TRANSIT
In December 2003, the Company entered into several agreements with Central Puget Sound Regional Transit Authority (Sound Transit), a government authority established by King, Pierce and Snohomish counties within the state of Washington. BNSF has agreed to sell to Sound Transit under the threat of condemnation a combination of (a) four easements enabling Sound Transit to offer commuter rail service over the existing BNSF track from Seattle to Everett and (b) 18 miles of railroad line from south of Tacoma to Nisqually, Washington.
Sound Transit will pay BNSF approximately $260 million for four commuter easements to operate trains on the segment between Seattle and Everett and entered into agreements both for service on the commuter easements and joint use of track for commuter and freight purposes. The Company received approximately $80 million of cash in 2003 upon the closing of the first easement and $80 million of cash in 2004 upon closing of the second easement. The sale proceeds will be recognized in income over the use of the associated track structure (approximately 37 years). Over the next threetwo years, upon the subsequent closings subject to conditions in the sale agreement, BNSF will receive an additional $100 million for the remaining two easements.
Sound Transit will also pay BNSF to convey the 18 miles of railroad line and associated real estate from south of Tacoma to Nisqually in three separate sell transactions. First, the Company received approximately $8 million of cash in 2003 and reported a gain in income of $2 million, net of tax, as a result of the real estate sale for station-related parcels to Sound Transit. Second, the Company received $6 million of cash and a $6 million note receivable in the third quarter of 2004 associated with the sale of approximately half of the 18 miles. The gain on this sale was deferred due to certain continuing involvement in the property. This continuing involvement expired in November 2004, and the Company recognized a gain in income of $7 million, net of tax. The Company collected $3 million of the $6 million note receivable related to this sale in 2005, and the remaining $3 million is expected to be collected in 2006. Third, the Company received $3 million of cash and a $9 million note receivable in the fourth quarter of 2005 associated with the sale of the remaining railroad line and real estate. The Company recognized a gain of approximately $9 million, net of tax, associated with the sale. The Company is expected to collect the $6$9 million note receivable over the next two years. Third,
NEW MEXICO DEPARTMENT OF TRANSPORTATION
In the fourth quarter of 2005, BNSF Railway Company expectsentered into an agreement with the New Mexico Department of Transportation (NMDOT) to sell the remaining railroadCompany’s rail line and real estatecertain adjacent property between Belen, New Mexico and Trinidad, Colorado while maintaining freight easement rights on the line. Upon satisfaction of closing conditions, the sale is anticipated to close in 2005segments over the next 3 years for approximately $15 million.a total purchase price of $76 million and will allow NMDOT to create a commuter rail line. The Company expectsrecognized an impairment charge of $71 million in the fourth quarter of 2005 related to recognizethis agreement and anticipates recording a gain of approximately $8$21 million netin the first quarter of tax, associated with that sale.2006 upon the sale of one of the line segments. The Company received $9 million in 2005 related to this sale, and expects to receive cash payments of $45 million in 2006, $18 million in 2007, and $4 million in 2008. While this rail line has been a critical alternative route for the Company, it will become less significant over the next several years as the double-tracking of the main line transcontinental route is completed.
AMERICAN JOBS CREATION ACT OF 2004
In October 2004, the American Jobs Creation Act of 2004 was signed into law. Part of the legislation includes the repeal of a 4.3–cent tax per gallon of diesel fuel. The tax will beis being gradually phased out in 2005 and 2006 and will be completely phased out by 2007. Based on actual and projected fuel consumption, the repeal of the tax resulted in $21 million in incremental savings in 2005 and is expected to result in incremental savings of approximately $20 million, $10 million and $30 million for BNSF in 2005, 2006 and 2007, respectively.
CRITICAL ACCOUNTING ESTIMATES
In the ordinary course of business, the Company makes a number of estimates and assumptions related to the reporting of results of operations and financial position in the preparation of its financial statements in conformity with accounting principles generally accepted in the United States of America. Actual results could differ significantly from those estimates under different assumptions and conditions. The following discussion addresses the Company’s most critical accounting estimates.
Management has discussed the development and selection of the critical accounting estimates described below with the Audit Committee of the Board of Directors, and the Audit Committee has reviewed the Company’s disclosure relating to them in this Management’s Discussion and Analysis of Financial Condition and Results of Operations.
LEGAL
BNSF’s most significant legal claims relate to personal injury claims and environmental matters. These claims are discussed in more detail below.
During 2004, BNSF recorded a $465 million pre-tax charge to reflect changes in its estimate of unasserted asbestos liabilities and environmental liabilities. Of this amount, $293 million and $172 million were related to unasserted asbestos and environmental liabilities, respectively. The $465 million pre-tax charge was recorded in materials and other expense and reduced net income by $288 million, or $0.77 per share during 2004.
PERSONAL INJURY
Personal injury claims, including asbestos claims and employee work-related injuries asbestos claims and third party injuries (collectively, other personal injury), are a significant expense for the railroad industry. Personal injury claims by BNSF Railway employees are subject to the provisions of the Federal Employers’ Liability Act (FELA) rather than state workers’ compensation laws. FELA’s system of requiring the finding of fault, coupled with unscheduled awards and reliance on the jury system, contributed to increased expenses in past years. Other proceedings include claims by non-employees for punitive as well as compensatory damages. A few proceedings purport to be class actions. The variability present in settling these claims, including non-employee personal injury and matters in which punitive damages are alleged, could result in increased expenses in future years. BNSF has implemented a number of safety programs designed to reduce the number of personal injuries as well as the associated claims and personal injury expense.
BNSF records a liability for personal injury claims when the expected loss is both probable and reasonably estimable. The liability and ultimate expense projections are estimated using standard actuarial methodologies. Liabilities recorded for unasserted personal injury claims are based on information currently available. Due to the inherent uncertainty involved in projecting future events such as the number of claims filed each year, developments in judicial and legislative standards and the average costs to settle projected claims, actual costs may differ from amounts recorded.
ASBESTOS
The Company is party to a number of personal injury claims by employees and non-employees who worked aroundmay have been exposed to asbestos. The heaviest exposure for BNSF employees was due to work conducted in and around the use of steam locomotive engines that were phased out between the years of 1950 and 1967. However, other types of exposures, including exposure from locomotive component parts and building materials, continued after 1967, until it was substantially eliminated by 1985.
Prior to 2000, claim filings against the Company for asbestos were not numerous and were sporadic. Accordingly, while the Company had concluded that a probable loss had occurred, it did not believe it could estimate the range of reasonably possible loss because of the lack of experience with such claims and the lack of detailed employment records for the population of exposed employees. The Company believed, however, that the low end of the range of reasonably possible loss, as that term is used in FASBFinancial Accounting Standards Board (FASB) Interpretation No. 14 (FIN 14),Reasonable Estimation of the Amount of a Loss, was immaterial. Subsequent to this period, claim filings increased and, when they continued into 2004, the Company concluded that the low end of the range of reasonably possible loss would be material and that an estimate for unasserted asbestos exposure liability needed to be recorded. BNSF then engaged a third party with extensive experience in performing asbestos studies to assist in assessing the unasserted liability exposure. The objective of the assessment was to determine the number of estimated unasserted asbestos claims and the estimated average cost per claim. The Company, with the assistance of the third party, first determined its exposed population from which it was able to derive the estimated number of unasserted claims. The estimated average cost per claim was then determined utilizing recent actual average cost per claim data.
Based on the assessment, the Company recorded an undiscounted $293 million pre-tax charge for unasserted asbestos claims.claims in the third quarter of 2004. The $293 million pre-tax charge was recorded in materials and other expense and reduced net income by $182 million, or $0.49 per share, for the year ended December 31, 2004.
Key elements of the assessment included:
From these assumptions BNSF projected the incidence of each type of disease to the estimated population to arrive at an estimate of the total number of employees that could potentially assert a claim. Historical claim filing rates were applied for each type of disease to the total number of employees that could potentially assert a claim to determine the total number of anticipated claim filings by disease type. Historical dismissal rates, which represent claims that are closed without payment, were then applied to calculate the number of future claims by disease type that would likely require payment by the Company. Finally, the number of such claims was multiplied by the average settlement value to estimate BNSF’s future liability for unasserted asbestos claims.
The most sensitive assumptions for this accrual are the estimated future filing rates and estimated average claim values. Asbestos claim filings are typically sporadic and may include large batches of claims solicited by law firms. To reflect these factors, BNSF used a multi-year calibration period (i.e., the average historical filing rate for the period 2000-2003) because it believed it would be most representative of its future claim experience. In addition, for non-malignant claims, the number of future claims to be filed against BNSF declines at a rate consistent with both mortality and age as there is a decreasing propensity to file a claim as the population ages. BNSF believes the average claim values by type of disease from the historical period 2002-2004 are most representative of future claim values. Non-malignant claims, which represent approximately 95 percent of the total number and 80 percent of the cost of estimated future asbestos claims, were priced by age of the projected claimants. Historically, the ultimate settlement value of these types of claims is most sensitive to the age of the claimant. A 10 percent increase or decrease in either the forecasted number of unasserted claims or the average claim values would result in an approximate $30 million increase or decrease in the liability recorded for unasserted asbestos claims.
BNSF anticipates obtaining annual updatesDuring the third quarter of 2005, the study.Company obtained an update of this study, which concluded that the original September 2004 study continues to represent a reasonable estimate of BNSF’s future asbestos exposure. Therefore, management recorded no additional expense as a result of this update. The Company plans to update the study in the third quarter of 2006. On a quarterly basis, BNSF will monitormonitors actual experience against the number of forecasted claims to be received and expected claim payments. Adjustments to the Company’s estimates will be recorded quarterly if necessary. More periodic updates towhen necessary (see Note 10 of the study will occur if trends necessitate a change.Consolidated Financial Statements for additional information).
The following table summarizes the activity in the Company’s accrued obligations for both asserted and unasserted asbestos matters (in millions):
| 2004 | 2003 | 2002 | 2005 | 2004 | 2003 | |||||||||||||||||||
Beginning balance | $ | 60 | $ | 55 | $ | 41 | $ | 345 | $ | 60 | $ | 55 | ||||||||||||
Accruals | 308 | 25 | 31 | — | 308 | 25 | ||||||||||||||||||
Payments | (23 | ) | (20 | ) | (17 | ) | (19 | ) | (23 | ) | (20 | ) | ||||||||||||
Ending balance at December 31, | $ | 345 | $ | 60 | $ | 55 | $ | 326 | $ | 345 | $ | 60 | ||||||||||||
Of the obligations at December 31, 2004 obligation, $2922005, $266 million is related to unasserted claims while $53and $60 million is related to asserted claims. At both December 31, 2005 and 2004, $21 and 2003, $18 million isare included in current liabilities.liabilities, respectively. The recorded liability wasis not discounted. In addition, defense and processing costs, which are recorded on an as-reported basis, are not included in the recorded liability. The Company is presently self-insured for asbestos-related claims.
The following table summarizes information regarding onlythe number of asserted asbestos claims filed against BNSF:
| 2004 | 2003 | 2005 | 2004 | |||||||||
Claims unresolved at January 1, | 1,985 | 1,719 | 1,926 | 1,985 | ||||||||
Claims filed | 712 | 1,023 | 835 | 712 | ||||||||
Claims settled, dismissed or otherwise resolved | (771 | ) | (757 | ) | (640 | ) | (771 | ) | ||||
Claims unresolved at December 31, | 1,926 | 1,985 | 2,121 | 1,926 | ||||||||
Based on BNSF’s estimate of the potentially exposed employees and related mortality assumptions, it is anticipated that unasserted claims will continue to be filed through the year 2050. The Company recorded an amount for the full estimated filing period through 2050 because it had a relatively finite exposed population (former and current employees hired prior to 1985) which it was able to identify and reasonably estimate and about which it had obtained reliable demographic data (including age, hire date and occupation) derived from industry or BNSF specific data that was the basis for the study. BNSF projects that approximately 50, 70, and 90 percent of the future unasserted asbestos claims will be incurred within the next 10, 15, and 25 years, respectively.
Because of the uncertainty surrounding the factors used in the study, it is reasonably possible that future costs to settle asbestos claims may range from approximately $250$225 million to $450$425 million. However, BNSF believes that the $345$326 million recorded at December 31, 2005, is the best estimate of the Company’s future obligation for the settlement of asbestos claims.
The amounts recorded by BNSF for the asbestos-related liability were based upon currently known facts. Projecting futureFuture events, such as the number of new claims to be filed each year, the average cost of disposing of claims, as well as the numerous uncertainties surrounding asbestos litigation in the United States, could cause the actual costs to be higher or lower than projected.
While the final outcome of asbestos-related matters cannot be predicted with certainty, considering among other things the meritorious legal defenses available and liabilities that have been recorded, it is the opinion of BNSF that none of these items, when finally resolved, will have a material adverse effect on the Company’s financial position or liquidity. However, should a number of these items occur in the same period, it could have a material adverse effect on the results of operations in a particular quarter or fiscal year.
OTHER PERSONAL INJURY
BNSF uses a third party actuary to assist the Company in estimating its other personal injury liability claims and expense. These estimates are based on the covered population, activity levels and trends in frequency, and the costs of covered injuries. These actuarial estimates include unasserted claims except for certain repetitive stress and other occupational trauma claims that result from prolonged repeated events or exposure. Such claims are estimated on an as-reported basis because, while the Company has concluded that a probable loss has occurred, it cannot estimate the range of reasonably possible loss due to other contributing causes of such injuries and the fact that continued exposure is required for the potential injury to manifest itself as a claim. The Company believes that the low end of the range of reasonably possible loss, as that term is used in FASB Interpretation No.FIN 14, (FIN 14),Reasonable Estimation of the Amount of a Loss, is immaterial for these other occupational trauma claims.
Key elements of the actuarial assessment include:
From these assumptions, BNSF estimates the number of open claims by accident year that will likely require payment by the Company. The projected number of open claims by accident year that will require payment is multiplied by the expected average cost per claim by accident year and type to determine BNSF’s estimated liability for all asserted claims. Additionally, BNSF estimates the number of its incurred but not reported claims that will likely result in payment based upon historical emergence patterns by type of claim. The estimated number of projected claims by accident year requiring payment is multiplied by the expected average cost per claim by accident year and type to determine BNSF’s estimated liability for incurred but not reported claims.
The most sensitive assumptions for this accrual are the expected average cost per claim and the projected frequency rates for the number of claims that will ultimately result in payment. A 10 percent increase or decrease in either the expected average cost per claim or the frequency rate for claims with payment would result in an approximate $45 million increase or decrease in BNSF’s recorded other personal injury reserves.reserves (see Note 10 of the Consolidated Financial Statements for additional information).
BNSF obtains quarterly actuarial updates for other personal injury liabilities and monitors actual experience against the number of forecasted claims to be received, the forecasted number of claims closing with payment and expected claims payments. Adjustments to the Company’s estimates are recorded quarterly as necessary or more frequently as new events or revised estimates develop.
The following table summarizes the activity in the Company’s accrued obligations for other personal injury matters (in millions):
| 2004 | 2003 | 2002 | 2005 | 2004 | 2003 | |||||||||||||||||||
Beginning balance | $ | 453 | $ | 441 | $ | 417 | $ | 459 | $ | 453 | $ | 441 | ||||||||||||
Accruals | 194 | 190 | 197 | 181 | 194 | 190 | ||||||||||||||||||
Payments | (188 | ) | (178 | ) | (173 | ) | (218 | ) | (188 | ) | (178 | ) | ||||||||||||
Ending balance at December 31, | $ | 459 | $ | 453 | $ | 441 | $ | 422 | $ | 459 | $ | 453 | ||||||||||||
At December 31, 2005 and 2004, $164 million and 2003, $170 million and $182 million wereare included in current liabilities, respectively. BNSF’s liabilities for other personal injury claims are undiscounted. In addition, defense and processing costs, which are recorded on an as-reported basis, are not included in the recorded liability. The Company is substantially self-insured for other personal injury claims.
The following table summarizes information regarding the number of personal injury claims, other than asbestos, filed against BNSF:
| 2004 | 2003 | 2005 | 2004 | |||||||||
Claims unresolved at January 1, | 4,393 | 4,669 | 4,116 | 4,393 | ||||||||
Claims filed | 3,632 | 3,779 | 3,758 | 3,632 | ||||||||
Claims settled, dismissed or otherwise resolved | (3,909 | ) | (4,055 | ) | (4,257 | ) | (3,909 | ) | ||||
Claims unresolved at December 31, | 4,116 | 4,393 | 3,617 | 4,116 | ||||||||
Because of the uncertainty surrounding the ultimate outcome of other personal injury claims, it is reasonably possible that future costs to settle other personal injury claims may range from approximately $400$375 million to $550$525 million. However, BNSF believes that the $459$422 million recorded at December 31, 2005, is the best estimate of the Company’s future obligation for the settlement of other personal injury claims.
The amounts recorded by BNSF for other personal injury claims were based upon currently known facts. Future events, such as the number of new claims to be filed each year, the average cost of disposing of claims, as well as the numerous uncertainties surrounding personal injury litigation in the United States, could cause the actual costs to be higher or lower than projected.
While the final outcome of these other personal injury matters cannot be predicted with certainty, considering among other things the meritorious legal defenses available and liabilities that have been recorded, it is the opinion of BNSF that none of these items, when finally resolved, will have a material adverse effect on the Company’s financial position or liquidity. However, should a number of these items occur in the same period, it could have a material adverse effect on the results of operations in a particular quarter or fiscal year.
ENVIRONMENTAL
The Company’s operations, as well as those of its competitors, are subject to extensive federal, state and local environmental regulation. BNSF’s operating procedures include practices to protect the environment from the risks inherent in railroad operations, which frequently involve transporting chemicals and other hazardous materials. Additionally, many of BNSF’s land holdings are and have been used for industrial or transportation-related purposes or leased to commercial or industrial companies whose activities may have resulted in discharges onto the property. As a result, BNSF is subject to environmental cleanup and enforcement actions. In particular, the Federal Comprehensive Environmental Response, Compensation and Liability Act of 1980 (CERCLA), also known as the Superfund law, as well as similar state laws generally impose joint and several liability for cleanup and enforcement costs on current and former owners and operators of a site without regard to fault or the legality of the original conduct. BNSF has been notified that it is a potentially responsible party (PRP) for study and cleanup costs at Superfund sites for which investigation and remediation payments are or will be made or are yet to be determined (the Superfund sites) and, in many instances, is one of several PRPs. In addition, BNSF may be considered a PRP under certain other laws. Accordingly, under CERCLA and other federal and state statutes, BNSF may be held jointly and severally liable for all environmental costs associated with a particular site. If there are other PRPs, BNSF generally participates in the cleanup of these sites through cost-sharing agreements with terms that vary from site to site. Costs are typically allocated based on such factors as relative volumetric contribution of material, the amount of time the site was owned or operated, and/or the portion of the total site owned or operated by each PRP.
Liabilities for environmental cleanup costs are recorded when BNSF’s liability for environmental cleanup is both probable and a reasonable estimate of associated loss can be made.reasonably estimable. Subsequent adjustments to initial estimates are recorded as necessary based upon additional information developed in subsequent periods. Environmental costs include initial site surveys and environmental studies as well as costs for remediation of sites determined to be contaminated.
During the first half of 2004, the Company experienced a significant increase in expense relating to environmental remediation developments at known sites for which the majority of the contamination occurred decades ago. Because of these and other developments, in recent periods, the Company performed an assessment in 2004 to determine if it was feasible to better estimate developments at its known sites. The Company determined that a third party actuary had proprietary data that included information from the EPAEnvironmental Protection Agency (EPA) and other governmental agencies as well as information accumulated from public sources and work performed for other clients. Because of its determination that a better estimate of future developmentsdevelopment could be made with this data, BNSF engaged this third party actuary, which has an extensive background in performing various studies for large companies, including environmental matters, to assist BNSF in determining itsthe Company’s potential future environmental exposure at known sites. As a result of this study, the Company revised its estimate of its probable environmental losses and its accrued liabilities.
Consequently, during the third quarter of 2004, BNSF recorded an undiscounted $172 million pre-tax charge related to its change in estimated environmental liabilities on a site by site basis. The $172 million pre-tax charge was recorded in materials and other expense and reduced net income by $106 million, or $0.28 per share, for 2004. The charge doesdid not include (i) contaminated sites of which the Company is not aware, andor (ii) additional amounts for third party claims, which arise out of contaminants allegedly migrating from BNSF property, due to a limited number of sites. BNSF continues to estimate third party claims on a site by site basis when the liability for such claims is probable and a reasonable estimate of associated loss can be made.reasonably estimable. BNSF’s recorded liability for third party claims as of December 31, 20042005 is approximately $25$24 million.
During the third quarter of 2005, the Company obtained an update of this study. Based on the results of the study, management recorded additional expense of approximately $12 million. The Company plans to update the study in the third quarter of 2006. On a quarterly basis, BNSF monitors actual experience against the forecasted remediation and related payments made on existing sites. Adjustments to the Company’s estimates will continue to be recorded when necessary based on developments in subsequent periods. Additionally, environmental accruals include amounts for newly identified sites or contaminants, third-party claims and legal fees incurred for defense of third-party claims and recovery efforts (see Note 10 of the Consolidated Financial Statements for additional information).
The Company’s estimate of ultimate cost for clean upcleanup efforts at its known environmental sites utilizes BNSF’s historical payment patterns, its current estimated percentage to closure ratios, and the actuary’s proprietary benchmark patterns developed from data accumulated from public sources and work performed by it for other clients, including the EPA and other governmental agencies. These factors incorporate experience gained from clean upcleanup efforts at other similar sites into the estimates for which remediation and restoration efforts are still in progress. The most significant assumptions are:are as follows: (i) historical payment patterns of site development, (ii) percentage to closure ratios, and (iii)(ii) variance from benchmark costs. A 10 percent change in any of these individual assumptions could result in an increase of up to $40$50 million or a decrease of up to $20$40 million in BNSF’s estimated environmental liability. BNSF also conducts an ongoing environmental contingency analysis, which considers a combination of factors including independent consulting reports, site visits, legal reviews and analysis of the likelihood of participation in, and the ability to pay for, cleanup of other PRPs.
BNSF anticipates obtaining annual updates of the study. On a quarterly basis, BNSF will also monitor actual experience against the forecasted remediation and related payments made on existing sites. Additionally, BNSF will continue its existing, quarterly process to monitor developments to further benchmark actuarial results. Adjustments to the Company’s estimates will continue to be recorded quarterly if necessary based upon developments in subsequent periods. More periodic updates to the study will occur if trends necessitate a change.
BNSF is involved in a number of administrative and judicial proceedings and other mandatory cleanup efforts for 384369 sites, including Superfund sites, at which it is participating in the study or cleanup, or both, of alleged environmental contamination.
The following table summarizes the activity in the Company’s accrued obligations for environmental matters (in millions):
| 2004 | 2003 | 2002 | 2005 | 2004 | 2003 | |||||||||||||||||||
Beginning balance | $ | 199 | $ | 196 | $ | 202 | $ | 385 | $ | 199 | $ | 196 | ||||||||||||
Accruals | 258 | 59 | 43 | 33 | 258 | 59 | ||||||||||||||||||
Payments | (72 | ) | (56 | ) | (49 | ) | (48 | ) | (72 | ) | (56 | ) | ||||||||||||
Ending balance at December 31, | $ | 385 | $ | 199 | $ | 196 | $ | 370 | $ | 385 | $ | 199 | ||||||||||||
At December 31, 2005 and 2004, $55 million and 2003, $60 million and $50 million wereare included in current liabilities, respectively. BNSF’s environmental liabilities are not discounted. BNSF anticipates that the majority of the accrued costs at December 31, 20042005 will be paid over the next ten years and no individual site is considered to be material.
The following table summarizes the environmental sites:
| BNSF sites | Superfund sites | BNSF sites | Superfund sites | |||||||||||||||||||||
| 2004 | 2003 | 2004 | 2003 | 2005 | 2004 | 2005 | 2004 | |||||||||||||||||
Number of sites at January 1, | 402 | 396 | 22 | 23 | 384 | 402 | 24 | 22 | ||||||||||||||||
Sites added during the period | 34 | 33 | 5 | 3 | 24 | 34 | — | 5 | ||||||||||||||||
Sites closed during the period | (52 | ) | (27 | ) | (3 | ) | (4 | ) | (39 | ) | (52 | ) | (4 | ) | (3 | ) | ||||||||
Number of sites at December 31, | 384 | 402 | 24 | 22 | 369 | 384 | 20 | 24 | ||||||||||||||||
Liabilities recorded for environmental costs represent BNSF’s best estimate of its probable future obligation for the remediation and settlement of these sites and include both asserted and unasserted claims. Unasserted claims are not a material component of the liability. Although recorded liabilities include BNSF’s best estimate of all probable costs, without reduction for anticipated recoveries from third parties, BNSF’s total cleanup costs at these sites cannot be predicted with certainty due to various factors such as the extent of corrective actions that may be required, evolving environmental laws and regulations, advances in environmental technology, the extent of other parties’ participation in cleanup efforts, developments in ongoing environmental analyses related to sites determined to be contaminated, and developments in environmental surveys and studies of contaminated sites.
Because of the uncertainty surrounding these factors, it is reasonably possible that future costs for environmental liabilities may range from approximately $300 million to $600 million. However, BNSF believes that the $385$370 million recorded at December 31, 2005, is the best estimate of the Company’s future obligation for environmental costs.
While the final outcome of these environmental matters cannot be predicted with certainty, it is the opinion of BNSF that none of these items, when finally resolved, will have a material adverse effect on the Company’s financial position or liquidity. However, an unexpected adverse resolution of one or more of these items could have a material adverse effect on the results of operations in a particular quarter or fiscal year.
OTHER CLAIMS AND LITIGATION
In addition to asbestos, other personal injury, and environmental matters discussed above, BNSF and its subsidiaries are also parties to a number of other legal actions and claims, various governmental proceedings and private civil suits arising in the ordinary course of business, including those related to disputes and complaints involving certain transportation rates and charges (including complaints seeking refunds of prior charges paid for coal transportation and the prescription of future rates for such movements). Some of the legal proceedings include claims for punitive as well as compensatory damages, and a few proceedings purport to be class actions. While the final outcome of these matters cannot be predicted with certainty, considering among other things the meritorious legal defenses available and liabilities that have been recorded along with applicable insurance, it is the opinion of BNSF that none of these items, when finally resolved, will have a material adverse effect on the Company’s financial position or liquidity. However, an unexpected adverse resolution of one or more of these items could have a material adverse effect on the results of operations in a particular quarter or fiscal year.
INCOME TAXES
BNSF is subject to various federal, state and local income taxes in the taxing jurisdictions where the Company operates. BNSF accounts for income taxes by providing for taxes payable or refundable in the current year and for deferred tax assets and liabilities for future tax consequences of events that have been recognized in financial statements or tax returns.
BNSF recorded total income tax expense, including federal, state and other income taxes, of $917 million, $482 million $454 million and $456$454 million for the years ended December 31, 2005, 2004 2003 and 2002,2003, respectively. BNSF’s Consolidated Balance Sheets reflect $308$218 million and $292$308 million of net current deferred tax assets at December 31, 20042005 and 2003,2004, respectively. Also included in BNSF’s Consolidated Balance Sheets are $7,820$7,916 million and $7,481$7,820 million of net non-current deferred tax liabilities at December 31, 20042005 and 2003,2004, respectively. Classification of deferred tax assets and liabilities as current or non-current is determined by the financial statement classification of the asset or liability to which the temporary difference is related. If a temporary difference is not related to an asset or liability for financial reporting, it is classified according to the expected reversal date of the temporary difference.
Valuation allowances are established to reduce deferred tax assets if it is more likely than not that some or all of the deferred tax asset will not be realized. BNSF has not recorded a valuation allowance, as it believes that the deferred tax assets will be fully realized in the future.
All federal income tax returns of BNSF’s predecessor companies, Burlington Northern Inc. and Santa Fe Pacific Corporation are closed through 1994 and the business combination date of September 22, 1995, respectively. Internal Revenue Service examination of the years 1995 through 1999 for BNSF is completed, and protests of the unagreed issues have been filed with IRSare pending before Internal Revenue Service (IRS) Appeals. BNSF is currently under examination for years 2000 through 2002. In addition, BNSF and its subsidiaries have various state income tax returns in the process of examination, administrative appeal or litigation. Due to the capital-intensive nature of BNSF’s business, a significant portion of the audit issues with the IRS and other taxing authorities relate to whether expenditures are classified as maintenance or capital and whether certain asset valuations are appropriate. A provision for taxes resulting from ongoing and future federal and state audits is based on an estimation of aggregate adjustments that may be required as a result of the audits. The Company believes that adequate provision has been made for any adjustment that might be assessed for open years through 2004.
BNSF makes estimates of the potential liability based on its assessment of all potential tax exposures. In addition, the Company uses factors such as applicable law, current information and past experience with similar issues to make these judgments.
Deferred tax assets and liabilities are measured using the tax rates that apply to taxable income in the period in which the deferred tax asset or liability is expected to be realized or paid. Changes in the Company’s estimates regarding the statutory tax rate to be applied to the reversal of deferred tax assets and liabilities could materially affect the effective tax rate.
The Company has not materiallysignificantly changed its methodology for calculating income tax expense for the years presented, and there are currently no known trends, demands, commitments, events or uncertainties that are reasonably likely to occur and materially affect the methodology or assumptions described above.
PENSIONS AND OTHER POST-EMPLOYMENT BENEFITS
BNSF sponsors a funded, noncontributory qualified BNSF Retirement Plan, which covers substantially all non-union employees, and an unfunded nonqualified BNSF Supplemental Retirement Plan, which covers certain officers and other employees. The benefits under these pension plans are based on years of credited service and the highest five-year averageconsecutive sixty months of compensation levels.for the last ten years of salaried employment with BNSF. BNSF’s funding policy is to contribute annually not less than the regulatory minimum and not more than the maximum amount deductible for income tax purposes with respect to the funded plan.
Certain salaried employees of BNSF that have met age and years of service requirements are eligible for life insurance coverage and medical benefits, and life insuranceincluding prescription drug coverage, during retirement. The retiree medical plan is contributory and provides benefits to retirees, their covered dependents and beneficiaries. Retiree contributions are adjusted annually. The plan also contains fixed deductibles, coinsurance and out-of-pocket limitations. The basic life insurance plan is noncontributory and covers retirees only. Optional life insurance coverage is available for some retirees; however, the retiree is responsible for the full cost. BNSF’s policy is to fund benefits payable under the medical and life insurance plans as they come due. EmployeesGenerally, employees beginning salaried employment with BNSF subsequent to September 22, 1995, are not eligible for medical benefits during retirement.
The amounts recorded in the Consolidated Statements of Income for pensions and other post-employment costbenefits (OPEB) were as follows (in millions):
Year Ended December 31, | 2005 Estimate | 2004 | 2003 | 2002 | 2006 Estimate | 2005 | 2004 | 2003 | |||||||||||||||||||
Net pension cost (benefit) | $ | 38 | $ | 15 | $ | (3 | ) | $ | (7 | ) | $ | 68 | $ | 38 | $ | 15 | $ | (3 | ) | ||||||||
Net other post-employment benefits cost | $ | 16 | $ | 24 | $ | 32 | $ | 30 | $ | 14 | $ | 11 | $ | 24 | $ | 32 | |||||||||||
The increased pension cost in 2004, 2005, and 20052006 is primarily the result of recognition of previously unrecognized losses as well as a decrease in both the expected long-term rate of return on plan assets and discount rate assumptions. OPEBOther post-employment benefits costs declinedare expected to increase in 2006 due primarily to a decrease in the discount rate and an increase in the assumed cost of future health care benefits.
At December 31, 2005, BNSF had unrecognized net losses of $524 million and $61 million related to the recognitionpension and health and welfare benefits plans, respectively. These net losses are comprised of Medicare Part D prescription drug benefit (see Note 13gains and losses from changes in discount rates, actuarial assumptions, and census data as well as market gains and losses. The Company will recognize the portion of these net losses that exceeds 10 percent of the Consolidated Financial Statements).benefit obligation as a component of compensation and benefits expense. The table below outlines the net losses expected to be recognized over the next 15 years.
Pension and other post-employment benefit plan obligations were as follows (in millions):
December 31, | 2004 | 2003 | ||||
Pension benefit obligations | $ | 1,710 | $ | 1,678 | ||
Other post-employment benefit obligations | $ | 299 | $ | 366 | ||
| Deferred Losses to be Recognized (in millions) | ||||||
Fiscal Year | Pension | Health and Welfare Benefits | ||||
2006 | $ | 46 | $ | 3 | ||
2007 | 40 | 3 | ||||
2008 | 30 | 4 | ||||
2009 | 23 | 4 | ||||
2010 | 18 | 4 | ||||
Thereafter | 161 | 16 | ||||
BNSF uses a third party actuary to assist the Company in estimating liabilities and expenses for pension and OPEB. Estimated amounts are based on historical information, current information and estimates about future events and circumstances. Significant assumptions used in the valuation of pension or OPEB obligations include expected return on plan assets, discount rate, rate of increase in compensation levels and the health care cost trend rate. These assumptions are critical to the Company’s estimate of expenses and liabilities, and changes to these estimates could have a material impact on the Company’s results of operations and financial position.
The discount rate is a component estimate of both pension and OPEB. The expected return on plan assets is a factor that only influences the funded pension plans. Health care cost trend rates only affect OPEB. BNSF uses a discount rate that reflects the current bond market and an expected rate of return on assets that reflects the expected long-term rates of return on plan assets.
From time to time, the Company will change pension and OPEB assumptions to better approximate current conditions and expected future experience. Assumptions for return on assets and the discount rateSignificant assumptions for the past three years are as follows:
Assumptions used to determine net (benefit) cost for fiscal years ended December 31, | Pension Benefits | Health and Welfare Benefits | ||||||||||||||||||||||||||||||||||
| Pension Benefits | Health and Welfare Benefits | |||||||||||||||||||||||||||||||||||
Assumptions used to determine net (benefit) cost for fiscal years ended December 31, | 2004 | 2003 | 2002 | 2004 | 2003 | 2002 | 2005 | 2004 | 2003 | 2005 | 2004 | 2003 | ||||||||||||||||||||||||
| 6.00 | % | 6.50 | % | 7.00 | % | 6.00 | % | 6.50 | % | 7.00 | % | 5.75 | % | 6.00 | % | 6.50 | % | 5.75 | % | 6.00 | % | 6.50 | % | |||||||||||||
Expected long-term rate of return on plan assets | 8.25 | % | 8.50 | % | 8.50 | % | — | — | — | 8.00 | % | 8.25 | % | 8.50 | % | — | — | — | ||||||||||||||||||
Rate of compensation increase | 3.90 | % | 3.90 | % | 4.00 | % | 3.90 | % | 3.90 | % | 4.00 | % | ||||||||||||||||||||||||
Assumed health care cost trend rate | — | — | — | 10.00 | % | 11.00 | % | 11.00 | % | |||||||||||||||||||||||||||
Rate of compensation increase b | 3.90 | % | 3.90 | % | 3.90 | % | 3.90 | % | 3.90 | % | 3.90 | % | ||||||||||||||||||||||||
Assumptions used to determine benefit obligations at September 30a, | Pension Benefits | Health and Welfare Benefits | ||||||||||
| 2004 | 2003 | 2004 | 2003 | |||||||||
Discount rate | 5.75 | % | 6.00 | % | 5.75 | % | 6.00 | % | ||||
Rate of compensation increase | 3.90 | % | 3.90 | % | 3.90 | % | 3.90 | % | ||||
| Pension Benefits | Health and Welfare Benefits | |||||||||||
Assumptions used to determine benefit obligations at September 30 a, | 2005 | 2004 | 2005 | 2004 | ||||||||
Discount rate | 5.25 | % | 5.75 | % | 5.25 | % | 5.75 | % | ||||
Assumed health care cost trend rate | — | — | 10.50 | % | 10.00 | % | ||||||
Rate of compensation increaseb | 3.90 | % | 3.90 | % | 3.90 | % | 3.90 | % | ||||
| a | The Company’s pension and OPEB plans use a measurement date of September 30. |
| b | Determined based on historical experience |
The discount rate is a key assumption used in the estimates of both the pension and OPEB expense and liability. BNSF determined the discount rate by adjusting the Moody’s Aa Corporate bond yield to reflect the difference between the duration of the future estimated cash flows of the Company’s pension and health and welfare plans and the duration of the Moody’s Aa index. The expected ratereturn on plan assets, which reflects the expected long-term rates of return on those assets, is also a key assumption. Finally, the health care cost trend rates are also considered a significant assumption and only impact the OPEB-related estimates.
The discount rate used for the 20052006 calculation of net benefit cost werewas lowered to 5.755.25 percent and 8.00 percent, respectively to reflect current market conditions. UnforeseenThe expected rate of return on plan assets remained consistent from 2005 to 2006, and the Company does not expect any significant changes to the current investment allocation of assets. However, unforeseen changes in the investment markets or other external factors could prompt changes in these estimates in future years.
The following table is an estimate of the impact toon future net benefit cost that could result from hypothetical changes to the most sensitive assumptions, the discount rate orand rate of return on plan assets:
Sensitivity Analysis
| ||||||
| Change in Net Benefit Cost | |||||
Hypothetical discount rate change | Pension | OPEB | ||||
50 basis point decrease | $ | $ | ||||
50 basis point increase | $ | $ | ||||
Hypothetical rate of return on plan assets change | Pension | |||||
50 basis point decrease | $ | 6 million increase | ||||
50 basis point increase | $ | 6 million decrease | ||||
The Company contributed $40 million to the BNSF Retirement Plan in December 2005. The Company is not required to make any contributions to this plan in 2006. The Company determines this required funding by amortizing asset gains and losses over a period of five years. Additionally, the Company expects to make benefit payments in 2006 of approximately $21 million and $7 million to its OPEB plan and the BNSF Supplemental Retirement Plan, respectively. If the Company was required to fully fund the unfunded portion of its projected benefit obligation, which was $511 million at December 31, 2005 for the pension plans and $295 million for the health and welfare plan, the Company’s management believes that it would have sufficient liquidity, and it could fund the balance without a significant impact to the Company’s financial position.
Further information on pensions and other post-employment benefits is incorporated by reference from Note 13 of the Consolidated Financial Statements.
DEPRECIATION
Due to the capital-intensive nature of the railroad industry, depreciation expense is a significant component of the Company’s operating expense. The Company recorded depreciation and amortization expenses of $1,075 million, $1,012 million $910 million and $931$910 million for the years ended December 31, 2005, 2004 2003 and 2002,2003, respectively. At December 31, 20042005 and 2003,2004, the Company had property and equipment, net balances of $25,814$26,551 million and $25,068$25,814 million, which include $6,518$7,210 million and $6,006$6,518 million, respectively, of accumulated depreciation.
The Company uses the group method of depreciation under which a single depreciation rate is applied to the gross investment in a particular class of property, despite differences in the service life or salvage value of individual property units within the same class. As required by the Federal Surface Transportation Board (STB), theThe Company conducts studies of depreciation rates and the required accumulated depreciation balance at leastas required by the Federal Surface Transportation Board (STB), which is generally every three years for equipment property and at least every six years for track structure and other roadway property. The Company uses external consultants to assist management with these studies. The consultants rely on statistical analysis, historical retirement data, industry knowledge and discussions with management to assess the impact of new technologies and maintenance practices. Changes in the estimated service lives of the assets and their related depreciation rates are implemented prospectively, and the difference between the calculated accumulated depreciation and the amount recorded is amortized over the average remaining service lives of the assets.
A study conducted in 2004 resulted in the Company adopting new depreciation rates for track structure that resulted in a net decrease in 2004 depreciation expense of $5 million and approximately $16 million on an ongoing annual basis, as calculated using the asset base at the time of the rate change. A study conducted in 2003 resulted in the Company adopting new depreciation rates for locomotives, other road assets, as well as hardware and software that resulted in a net decrease in annual depreciation expense of $9 million. There were no material changes in depreciation rates in 2002.
ACCOUNTING PRONOUNCEMENTS
See Note 16 of the Consolidated Financial Statements for information about recent accounting pronouncements.
FORWARD-LOOKING INFORMATION
To the extent that statements made by the Company relate to the Company’s future economic performance or business outlook, projections or expectations of financial or operational results, or refer to matters that are not historical facts, such statements are “forward-looking” statements within the meaning of the federal securities laws. Forward-looking statements involve a number of risks and uncertainties, and actual performance or results may differ materially. Important factors that could cause actual performance or results to differ materially include, but are not limited to:to the following:
•• Economic and industry conditions:conditions: material adverse changes in economic or industry conditions, both in the United States and globally, changes in customer demand, effects of adverse economic conditions affecting shippers, adverse economic conditions in the industries and geographic areas that produce and consume freight, adverse economic conditions in BNSF’s supplier base, competition and consolidation within the transportation industry, the extent to which BNSF is successful in gaining new long-term relationships with customers or retaining existing ones, changes in fuel prices and other key materials and disruptions in supply chains for these materials, changes in the securities and capital markets, and changes in crew availability, labor costs and labor difficulties, including stoppages affecting either BNSF’s operations or our customers’ abilities to deliver goods to BNSF for shipment;
•• Legal and regulatory factors:factors: developments and changes in laws and regulations, including those affecting train operations or the marketing of services, the ultimate outcome of shipper and rate claims subject to adjudication, increased economic regulation of the rail industry, developments in environmental investigations or proceedings with respect to rail operations or current or past ownership or control of real property, and developments in other types of claims and litigation, including those relating to personal injuries, asbestos and other occupational disease, the release of hazardous materials, environmental contamination and damage to property;property, and rates or service; and
•Operating factorsfactors:: technical difficulties, changes in operating conditions and costs, commodity concentrations, the availability of equipment and human resources to meet changes in demand, the extent of the Company’s ability to achieve its operational and financial initiatives and to contain costs, the effectiveness of steps taken to maintain and improve operations and network fluidity, including the management of the amount of traffic on the system to meet demand and the ability to acquire sufficient resources to meet that demand, congestion on other railroads, disruptions to BNSF’s technology network including computer systems and software, as well as natural events such as severe weather, fires, floods and earthquakes or man-made or other disruptions of BNSF Railway’s operating systems, structures, or equipment including the effects of acts of terrorism on the Company’s system or other railroads’ systems.
The Company cautions against placing undue reliance on forward-looking statements, which reflect its current beliefs and are based on information currently available to it as of the date a forward-looking statement is made. The Company undertakes no obligation to revise forward-looking statements to reflect future events, changes in circumstances, or changes in beliefs. In the event the Company does update any forward-looking statement, no inference should be made that the Company will make additional updates with respect to that statement, related matters, or any other forward-looking statements. Any corrections or revisions may appear in the Company’s public filings with the Securities and Exchange Commission, which are accessible at www.sec.gov, and on the Company’s website at www.bnsf.com, and which investors are advised to consult.
Item 7A. Quantitative and Qualitative Disclosures About Market Risk
In the ordinary course of business, BNSF utilizes various financial instruments that inherently have some degree of market risk. The following table summarizes the impact of these hedging programsactivities on the Company’s results of operations (in millions):
December 31, | 2004 | 2003 | 2005 | 2004 | ||||||||||||
Fuel hedge benefit (including ineffective portion of unexpired hedges) | $ | 338 | $ | 68 | $ | 531 | $ | 338 | ||||||||
Interest rate hedge benefit | 36 | 35 | 17 | 36 | ||||||||||||
Total hedge benefit | 374 | 103 | 548 | 374 | ||||||||||||
Tax effect | (144 | ) | (39 | ) | (209 | ) | (144 | ) | ||||||||
Hedge benefit, net of tax | $ | 230 | $ | 64 | $ | 339 | $ | 230 | ||||||||
The Company’s fuel hedge benefit is due to increases in fuel prices subsequent to the initiation of various hedges. Additionally, BNSF has expanded the percentage of fuel consumption covered by hedges which has further contributed to the hedge benefit. The interest rate hedge benefit is the result of the conversion of fixed-rate long-term debt to floating-rate debt coupled with lower interest rates. The information presented in the Management’s Discussion and Analysis of Financial Condition and Results of Operations section and Notes 3 and 9 of the Consolidated Financial Statements describedescribes significant aspects of BNSF’s financial instrument programsactivities, which have a material market risk. Additionally, the Company has auses fuel surcharge program (see further discussion undersurcharges to mitigate the freight revenue sectionrisk of Item 7).fuel price volatility.
COMMODITY PRICE SENSITIVITY
BNSF has a programengages in hedging activities to hedge againstpartially mitigate the risk of fluctuations in the price of its diesel fuel purchases. Existing hedge transactions as of December 31, 2004,2005, are based on the front month settlement prices of NYMEXNew York Mercantile Exchange (NYMEX) #2 heating oil (HO), West Texas Intermediate crude oil (WTI), or the HO refining spread (HO-WTI), which is defined as the difference between HO and WTI. A WTI hedge combined with a HO-WTI hedge will result in the equivalent of a HO hedge. For swaps, BNSF either pays or receives the difference between the hedge price and the actual average price of the hedge commodity during a specified determination period for a specified number of gallons. For costless collars, if the average hedge commodity price for a specified determination period is greater than the cap price, BNSF receives the difference for a specified number of gallons. If the average commodity price is less than the floor price, BNSF pays the difference for a specified number of gallons. If the commodity price is between the floor price and the cap price, BNSF neither makes nor receives a payment. Hedge transactions are generally settled with the counterparty in cash. Based on historical information, BNSF believes there is a significant correlation between the market prices for diesel fuel, WTI, and HO.
At December 31, 2004,2005, BNSF had recorded in the Consolidated Balance Sheet a fuel hedging asset of $369$336 million for fuel hedges covering 2005 through2006 and 2007.
The following table is an estimate of the impact to earnings that could result from hypothetical price changes during the twelvetwelve- month period ending December 31, 20052006 and the balance sheet impact from the hypothetical price changes, both based on hedge position at December 31, 2004:2005:
Sensitivity Analysis | ||||||
Hedged commodity price change | Fuel hedge annual pre-tax
| Balance Sheet impact of
| ||||
| $ | $ | ||||
| $ | $ | ||||
Based on fuel consumption during the twelve monthtwelve-month period ending December 31, 20042005 of 1,3441,402 million gallons and fuel prices during that same period, excluding the impact of the Company’s hedging program,activities, a ten percent increase or decrease in the commodity price per gallon would result in an approximate $152$231 million increase or decrease, respectively, in fuel expense (pre-tax) on an annual basis.
At December 31, 2004,2005, BNSF maintained fuel inventories for use in normal operations, which were not material to BNSF’s overall financial position and, therefore, represent no significant market exposure. Further information on fuel hedges is incorporated by reference from Note 3 of the Consolidated Financial Statements.
INTEREST RATE SENSITIVITY
From time to time, BNSF enters into various interest rate hedging transactions for purposes of managing exposure to fluctuations in interest rates and establishing rates in anticipation of future debt issuances as well as to convert a portion of its fixed-rate long-term debt to floating-rate debt. These interest rate hedges are accounted for either as cash flow or fair value hedges. BNSF’s measurement of the fair value of these hedges areis based on estimates of the mid-market values for the transactions provided by the counterparties to these agreements.
At December 31, 2004,2005, the fair value of BNSF’s debt, excluding capital leases, was $6,628$7,195 million, and the interest rate hedging asset was $35 million.less than $1 million for fair value hedges and $8 million for cash flow hedges.
The following table is an estimate of the impact to earnings and the fair value of the total debt and interest rate hedges that could result from hypothetical interest rate changes during the twelve monthtwelve-month period ending December 31, 20052006 based on debt levels and outstanding hedges as of December 31, 2004:2005:
Sensitivity Analysis | |||||||||
Hypothetical change in interest rates | Floating rate debt - Annual pre-tax earnings | Change in fair value | |||||||
| Total debt | Interest rate hedges | ||||||||
1 percent decrease | $ | $ | $ | ||||||
1 percent increase | $ | $ | $ | ||||||
Further information on interest rate hedges is incorporated by reference from Note 3 of the Consolidated Financial Statements. Information on the Company’s debt, which may be sensitive to interest rate fluctuations, is incorporated by reference from Note 9 of the Consolidated Financial Statements.
Item 8. Financial Statements and Supplementary Data
The Consolidated Financial Statements of BNSF and subsidiary companies, together with the report of the Company’s independent registered public accounting firm, are included as part of this filing.
The following documents are filed as a part of this report:
Management’s Report on Internal Control Over Financial Reporting
To the Shareholders of Burlington Northern Santa Fe Corporation and Subsidiaries
The management of Burlington Northern Santa Fe Corporation (the “Company”) is responsible for establishing and maintaining adequate internal control over financial reporting. The Company’s internal control over financial reporting was designed to provide reasonable assurance regarding the reliability of financial reporting and the preparation of the Company’s financial statements for external reporting purposes in accordance with generally accepted accounting principles.
Because of its inherent limitations, internal control over financial reporting may not prevent or detect misstatements. Also, projections of any evaluation of effectiveness to future periods are subject to the risk that controls may become inadequate because of changes in conditions, or that the degree of compliance with the policies or procedures may deteriorate.
Management assessed the effectiveness of the Company’s internal control over financial reporting as of December 31, 2004.2005. In making this assessment, it used the criteria set forth by the Committee of Sponsoring Organizations of the Treadway Commission (COSO) inInternal Control – Integrated Framework. Based on our assessment we concluded that, as of December 31, 2004,2005, the Company’s internal control over financial reporting is effective based on those criteria.
Our management’sManagement’s assessment of the Company’s internal control over financial reporting as of December 31, 20042005, has been audited by PricewaterhouseCoopers LLP, the Company’s independent registered public accounting firm, as stated in their report, which appears on the following pages.
Report of Independent Registered Public Accounting Firm
To the Shareholders and Board of Directors of Burlington Northern Santa Fe Corporation
We have completed an integrated auditaudits of Burlington Northern Santa Fe Corporation’s 2005 and 2004 consolidated financial statements and of its internal control over financial reporting as of December 31, 20042005 and auditsan audit of its 2003 and 2002 consolidated financial statements in accordance with the standards of the Public Company Accounting Oversight Board (United States). Our opinions, based on our audits, are presented below.
Consolidated financial statements
In our opinion, the consolidated financial statements listed in the accompanying index present fairly, in all material respects, the financial position of Burlington Northern Santa Fe Corporation and its subsidiaries (the Company) at December 31, 20042005 and 2003,2004, and the results of their operations and their cash flows for each of the three years in the period ended December 31, 20042005 in conformity with accounting principles generally accepted in the United States of America. These financial statements are the responsibility of the Company’s management. Our responsibility is to express an opinion on these financial statements based on our audits. We conducted our audits of these statements in accordance with the standards of the Public Company Accounting Oversight Board (United States). Those standards require that we plan and perform the audit to obtain reasonable assurance about whether the financial statements are free of material misstatement. An audit of financial statements includes examining, on a test basis, evidence supporting the amounts and disclosures in the financial statements, assessing the accounting principles used and significant estimates made by management, and evaluating the overall financial statement presentation. We believe that our audits provide a reasonable basis for our opinion.
As discussed in Note 2 to the consolidated financial statements, effective January 1, 2003, the Company changed the manner in which it accounts for asset retirement costs.
Internal control over financial reporting
Also, in our opinion, management’s assessment, included in Management’s Report on Internal Control Over Financial Reporting appearing under Item 8, that the Company maintained effective internal control over financial reporting as of December 31, 20042005 based on criteria established inInternal Control - Integrated Framework issued by the Committee of Sponsoring Organizations of the Treadway Commission (COSO), is fairly stated, in all material respects, based on those criteria. Furthermore, in our opinion, the Company maintained, in all material respects, effective internal control over financial reporting as of December 31, 2004,2005, based on criteria established inInternal Control - Integrated Framework issued by the COSO. The Company’s management is responsible for maintaining effective internal control over financial reporting and for its assessment of the effectiveness of internal control over financial reporting. Our responsibility is to express opinions on management’s assessment and on the effectiveness of the Company’s internal control over financial reporting based on our audit. We conducted our audit of internal control over financial reporting in accordance with the standards of the Public Company Accounting Oversight Board (United States). Those standards require that we plan and perform the audit to obtain reasonable assurance about whether effective internal control over financial reporting was maintained in all material respects. An audit of internal control over financial reporting includes obtaining an understanding of internal control over financial reporting, evaluating management’s assessment, testing and evaluating the design and operating effectiveness of internal control, and performing such other procedures as we consider necessary in the circumstances. We believe that our audit provides a reasonable basis for our opinions.
A company’s internal control over financial reporting is a process designed to provide reasonable assurance regarding the reliability of financial reporting and the preparation of financial statements for external purposes in accordance with generally accepted accounting principles. A company’s internal control over financial reporting includes those policies and procedures that (i) pertain to the maintenance of records that, in reasonable detail, accurately and fairly reflect the transactions and dispositions of the assets of the company; (ii) provide reasonable assurance that transactions are recorded as necessary to permit preparation of financial statements in accordance with generally accepted accounting principles, and that receipts and expenditures of the company are being made only in accordance with authorizations of management and directors of the company; and (iii) provide reasonable assurance regarding prevention or timely detection of unauthorized acquisition, use, or disposition of the company’s assets that could have a material effect on the financial statements.
Because of its inherent limitations, internal control over financial reporting may not prevent or detect misstatements. Also, projections of any evaluation of effectiveness to future periods are subject to the risk that controls may become inadequate because of changes in conditions, or that the degree of compliance with the policies or procedures may deteriorate.
/s/ PricewaterhouseCoopers LLP |
|
|
Fort Worth, Texas
February 13, 2006
Burlington Northern Santa Fe Corporation and Subsidiaries
Consolidated Statements of Income
Dollars in millions, except per share data
Year Ended December 31, | 2004 | 2003 | 2002 | 2005 | 2004 | 2003 | ||||||||||||
Revenues | $ | 10,946 | $ | 9,413 | $ | 8,979 | $ | 12,987 | $ | 10,946 | $ | 9,413 | ||||||
Operating expenses: | ||||||||||||||||||
Compensation and benefits | 3,322 | 2,963 | 2,894 | 3,515 | 3,322 | 2,963 | ||||||||||||
Fuel | 1,959 | 1,335 | 1,093 | |||||||||||||||
Purchased services | 1,424 | 1,252 | 1,146 | 1,714 | 1,424 | 1,252 | ||||||||||||
Depreciation and amortization | 1,012 | 910 | 931 | 1,075 | 1,012 | 910 | ||||||||||||
Equipment rents | 790 | 705 | 698 | 886 | 790 | 705 | ||||||||||||
Fuel | 1,335 | 1,093 | 848 | |||||||||||||||
Materials and other | 1,377 | 825 | 806 | 916 | 1,377 | 825 | ||||||||||||
Total operating expenses | 9,260 | 7,748 | 7,323 | 10,065 | 9,260 | 7,748 | ||||||||||||
Operating income | 1,686 | 1,665 | 1,656 | 2,922 | 1,686 | 1,665 | ||||||||||||
Interest expense | 409 | 420 | 428 | 437 | 409 | 420 | ||||||||||||
Other expense, net | 4 | 14 | 12 | 37 | 4 | 14 | ||||||||||||
Income before income taxes and cumulative effect of accounting change | 1,273 | 1,231 | 1,216 | 2,448 | 1,273 | 1,231 | ||||||||||||
Income tax expense | 482 | 454 | 456 | 917 | 482 | 454 | ||||||||||||
Income before cumulative effect of accounting change | 791 | 777 | 760 | 1,531 | 791 | 777 | ||||||||||||
Cumulative effect of accounting change, net of tax | — | 39 | — | — | — | 39 | ||||||||||||
Net income | $ | 791 | $ | 816 | $ | 760 | $ | 1,531 | $ | 791 | $ | 816 | ||||||
Earnings per share: | ||||||||||||||||||
Basic earnings per share (before cumulative effect of accounting change) | $ | 2.14 | $ | 2.10 | $ | 2.01 | $ | 4.12 | $ | 2.14 | $ | 2.10 | ||||||
Basic earnings per share (after cumulative effect of accounting change) | $ | 2.14 | $ | 2.21 | $ | 2.01 | $ | 4.12 | $ | 2.14 | $ | 2.21 | ||||||
Diluted earnings per share (before cumulative effect of accounting change) | $ | 2.10 | $ | 2.09 | $ | 2.00 | $ | 4.01 | $ | 2.10 | $ | 2.09 | ||||||
Diluted earnings per share (after cumulative effect of accounting change) | $ | 2.10 | $ | 2.19 | $ | 2.00 | $ | 4.01 | $ | 2.10 | $ | 2.19 | ||||||
Average shares (in millions): | ||||||||||||||||||
Basic | 370.0 | 369.1 | 378.0 | 371.8 | 370.0 | 369.1 | ||||||||||||
Dilutive effect of stock awards | 6.6 | 3.2 | 2.8 | 10.0 | 6.6 | 3.2 | ||||||||||||
Diluted | 376.6 | 372.3 | 380.8 | 381.8 | 376.6 | 372.3 | ||||||||||||
See accompanying Notes to Consolidated Financial Statements.
BURLINGTON NORTHERN SANTA FE CORPORATION AND SUBSIDIARIES
Consolidated Balance Sheets
Dollars in millions, shares in thousands
December 31, | 2004 | 2003 | 2005 | 2004 | ||||||||||||
Assets | ||||||||||||||||
Current assets: | ||||||||||||||||
Cash and cash equivalents | $ | 322 | $ | 18 | $ | 75 | $ | 322 | ||||||||
Accounts receivable, net | 181 | 137 | 678 | 181 | ||||||||||||
Materials and supplies | 339 | 266 | 396 | 339 | ||||||||||||
Current portion of deferred income taxes | 308 | 292 | 218 | 308 | ||||||||||||
Current portion of fuel-hedging asset | 303 | 264 | ||||||||||||||
Other current assets | 465 | 157 | 210 | 201 | ||||||||||||
Total current assets | 1,615 | 870 | 1,880 | 1,615 | ||||||||||||
Property and equipment, net | 25,814 | 25,068 | 26,551 | 25,814 | ||||||||||||
Other assets | 1,496 | 1,009 | 1,873 | 1,496 | ||||||||||||
Total assets | $ | 28,925 | $ | 26,947 | $ | 30,304 | $ | 28,925 | ||||||||
Liabilities and stockholders’ equity | ||||||||||||||||
Current liabilities: | ||||||||||||||||
Accounts payable and other current liabilities | $ | 2,251 | $ | 2,110 | $ | 2,773 | $ | 2,251 | ||||||||
Long-term debt due within one year | 465 | 244 | 456 | 465 | ||||||||||||
Total current liabilities | 2,716 | 2,354 | 3,229 | 2,716 | ||||||||||||
Long-term debt and commercial paper | 6,051 | 6,440 | 6,698 | 6,051 | ||||||||||||
Deferred income taxes | 7,820 | 7,481 | 7,916 | 7,820 | ||||||||||||
Casualty and environmental liabilities | 941 | 462 | 878 | 941 | ||||||||||||
Minimum pension liability | 353 | 359 | 417 | 353 | ||||||||||||
Employee separation costs | 124 | 144 | 107 | 124 | ||||||||||||
Other liabilities | 1,609 | 1,212 | 1,551 | 1,609 | ||||||||||||
Total liabilities | 19,614 | 18,452 | 20,796 | 19,614 | ||||||||||||
Commitments and contingencies (see Notes 3, 9 and 10) | ||||||||||||||||
Stockholders’ equity: | ||||||||||||||||
Common stock, $0.01 par value 600,000 shares authorized; 517,275 shares and 500,685 shares issued, respectively | 5 | 5 | ||||||||||||||
Common stock, $0.01 par value 600,000 shares authorized; 527,289 shares and 517,275 shares issued, respectively | 5 | 5 | ||||||||||||||
Additional paid-in-capital | 6,299 | 5,766 | 6,702 | 6,299 | ||||||||||||
Retained earnings | 6,792 | 6,240 | 8,045 | 6,792 | ||||||||||||
Treasury stock, at cost, 140,463 shares and 129,225 shares, respectively | (3,741 | ) | (3,340 | ) | ||||||||||||
Treasury stock, at cost, 155,718 shares and 140,463 shares, respectively | (4,569 | ) | (3,741 | ) | ||||||||||||
Prepaid forward repurchase of treasury stock | (600 | ) | — | |||||||||||||
Unearned compensation | (43 | ) | (36 | ) | (22 | ) | (43 | ) | ||||||||
Accumulated other comprehensive income (loss) | (1 | ) | (140 | ) | (53 | ) | (1 | ) | ||||||||
Total stockholders’ equity | 9,311 | 8,495 | 9,508 | 9,311 | ||||||||||||
Total liabilities and stockholders’ equity | $ | 28,925 | $ | 26,947 | $ | 30,304 | $ | 28,925 | ||||||||
See accompanying Notes to Consolidated Financial Statements.
BURLINGTON NORTHERN SANTA FE CORPORATION AND SUBSIDIARIES
Consolidated Statements of Cash Flows
Dollars in millions
Year Ended December 31, | 2004 | 2003 | 2002 | 2005 | 2004 | 2003 | ||||||||||||||||||
Operating activities | ||||||||||||||||||||||||
Net income | $ | 791 | $ | 816 | $ | 760 | $ | 1,531 | $ | 791 | $ | 816 | ||||||||||||
Adjustments to reconcile net income to net cash provided by operating activities: | ||||||||||||||||||||||||
Depreciation and amortization | 1,012 | 910 | 931 | 1,075 | 1,012 | 910 | ||||||||||||||||||
Deferred income taxes | 237 | 460 | 432 | 217 | 237 | 460 | ||||||||||||||||||
Employee separation costs paid | (33 | ) | (43 | ) | (55 | ) | (30 | ) | (33 | ) | (43 | ) | ||||||||||||
Cumulative effect of accounting change, net of tax | — | (39 | ) | — | — | — | (39 | ) | ||||||||||||||||
Long-term Casualty and environmental liabilities, net | 477 | 20 | 32 | |||||||||||||||||||||
Long-term casualty and environmental liabilities, net | (71 | ) | 477 | 20 | ||||||||||||||||||||
Other, net | (84 | ) | 28 | (41 | ) | (54 | ) | (84 | ) | 28 | ||||||||||||||
Changes in current assets and liabilities: | ||||||||||||||||||||||||
Accounts receivable, net | (40 | ) | 4 | 31 | (138 | ) | (65 | ) | (27 | ) | ||||||||||||||
Change in accounts receivable sales program | (350 | ) | 25 | 31 | ||||||||||||||||||||
Materials and supplies | (73 | ) | (39 | ) | (25 | ) | (57 | ) | (73 | ) | (39 | ) | ||||||||||||
Other current assets | (144 | ) | 5 | (28 | ) | (5 | ) | (144 | ) | 5 | ||||||||||||||
Accounts payable and other current liabilities | 234 | 163 | 69 | 491 | 234 | 163 | ||||||||||||||||||
Net cash provided by operating activities | 2,377 | 2,285 | 2,106 | 2,609 | 2,377 | 2,285 | ||||||||||||||||||
Investing activities | ||||||||||||||||||||||||
Capital expenditures | (1,527 | ) | (1,726 | ) | (1,358 | ) | (1,750 | ) | (1,527 | ) | (1,726 | ) | ||||||||||||
Other, net | (68 | ) | (80 | ) | (159 | ) | (273 | ) | (68 | ) | (80 | ) | ||||||||||||
Net cash used for investing activities | (1,595 | ) | (1,806 | ) | (1,517 | ) | (2,023 | ) | (1,595 | ) | (1,806 | ) | ||||||||||||
Financing activities | ||||||||||||||||||||||||
Net decrease in commercial paper and bank borrowings | (242 | ) | (77 | ) | (96 | ) | ||||||||||||||||||
Net increase (decrease) in commercial paper and bank borrowings | 563 | (242 | ) | (77 | ) | |||||||||||||||||||
Proceeds from issuance of long-term debt | 250 | 265 | 300 | 500 | 250 | 265 | ||||||||||||||||||
Payments on long-term debt | (300 | ) | (339 | ) | (294 | ) | (464 | ) | (300 | ) | (339 | ) | ||||||||||||
Dividends paid | (231 | ) | (191 | ) | (183 | ) | (267 | ) | (231 | ) | (191 | ) | ||||||||||||
Proceeds from stock options exercised | 420 | 68 | 40 | 244 | 420 | 68 | ||||||||||||||||||
Purchase of BNSF common stock | (376 | ) | (217 | ) | (353 | ) | (799 | ) | (376 | ) | (217 | ) | ||||||||||||
Prepaid forward repurchase of treasury stock | (600 | ) | — | — | ||||||||||||||||||||
Other, net | 1 | 2 | (1 | ) | (10 | ) | 1 | 2 | ||||||||||||||||
Net cash used for financing activities | (478 | ) | (489 | ) | (587 | ) | (833 | ) | (478 | ) | (489 | ) | ||||||||||||
Increase (decrease) in cash and cash equivalents | 304 | (10 | ) | 2 | (247 | ) | 304 | (10 | ) | |||||||||||||||
Cash and cash equivalents: | ||||||||||||||||||||||||
Beginning of year | 18 | 28 | 26 | 322 | 18 | 28 | ||||||||||||||||||
End of year | $ | 322 | $ | 18 | $ | 28 | $ | 75 | $ | 322 | $ | 18 | ||||||||||||
Supplemental cash flow information | ||||||||||||||||||||||||
Interest paid, net of amounts capitalized | $ | 476 | $ | 458 | $ | 463 | $ | 427 | $ | 476 | $ | 458 | ||||||||||||
Income taxes paid, net of refunds | $ | 159 | $ | 26 | $ | 55 | $ | 545 | $ | 159 | $ | 26 | ||||||||||||
Non-cash financing | $ | 104 | $ | 24 | $ | 166 | ||||||||||||||||||
Non-cash asset financing | $ | 68 | $ | 104 | $ | 24 | ||||||||||||||||||
See accompanying Notes to Consolidated Financial Statements.
BURLINGTON NORTHERN SANTA FE CORPORATION AND SUBSIDIARIES
Consolidated Statements of Changes in Stockholders’ Equity
Shares in thousands, dollars in millions, except per share data
| Common Shares | Treasury Shares | Common Stock and Paid–in Capital | Retained Earnings | Treasury Stock | Unearned Compensation | Accumulated (Loss) | Total Stockholders’ Equity | |||||||||||||||||||||||||||||||||||||||||||||||||||||
Balance at December 31, 2001 | 492,818 | (107,041 | ) | $ | 5,589 | $ | 5,048 | $ | (2,745 | ) | $ | (34 | ) | $ | (9 | ) | $ | 7,849 | ||||||||||||||||||||||||||||||||||||||||||
Comprehensive income: | ||||||||||||||||||||||||||||||||||||||||||||||||||||||||||||
Net income | — | 760 | — | — | — | 760 | ||||||||||||||||||||||||||||||||||||||||||||||||||||||
Minimum pension liability adjustment, net of tax benefit of $136 | — | — | — | — | (220 | ) | (220 | ) | ||||||||||||||||||||||||||||||||||||||||||||||||||||
Fuel/ interest hedge mark-to-market, net of tax expense of $12 | — | — | — | — | 20 | 20 | ||||||||||||||||||||||||||||||||||||||||||||||||||||||
Total comprehensive income | — | 760 | — | — | (200 | ) | (560 | ) | ||||||||||||||||||||||||||||||||||||||||||||||||||||
Common stock dividends, $0.48 per share | — | — | (183 | ) | — | — | — | (183 | ) | |||||||||||||||||||||||||||||||||||||||||||||||||||
Adjustments associated with unearned compensation, restricted stock | 1,527 | (634 | ) | 25 | — | — | (5 | ) | — | 20 | ||||||||||||||||||||||||||||||||||||||||||||||||||
Exercise of stock options and related tax benefit of $6 | 2,338 | (555 | ) | 55 | — | (16 | ) | — | — | 39 | ||||||||||||||||||||||||||||||||||||||||||||||||||
Purchase of BNSF common stock | — | (12,675 | ) | — | — | (353 | ) | — | — | (353 | ) | |||||||||||||||||||||||||||||||||||||||||||||||||
| Common Shares | Treasury Shares | Common Stock and Paid–in Capital | Retained Earnings | Treasury Stock | Prepaid Forward Repurchase of Treasury Stock | Unearned Compensation | Accumulated (Loss) | Total Stockholders’ Equity | ||||||||||||||||||||||||||||||||||||||||||||||||||||
Balance at December 31, 2002 | 496,683 | (120,905 | ) | 5,669 | 5,625 | (3,114 | ) | (39 | ) | (209 | ) | 7,932 | 496,683 | (120,905 | ) | $ | 5,669 | $ | 5,625 | $ | (3,114 | ) | $ | — | $ | (39 | ) | $ | (209 | ) | $ | 7,932 | ||||||||||||||||||||||||||||
Comprehensive income: | ||||||||||||||||||||||||||||||||||||||||||||||||||||||||||||
Net income | — | 816 | — | — | 816 | — | 816 | — | — | — | — | 816 | ||||||||||||||||||||||||||||||||||||||||||||||||
Minimum pension liability adjustment, net of tax expense of $3 | — | — | — | — | 6 | 6 | — | — | — | — | — | 6 | 6 | |||||||||||||||||||||||||||||||||||||||||||||||
Fuel/ interest hedge mark-to-market, net of tax expense of $38 | — | — | — | — | 63 | 63 | ||||||||||||||||||||||||||||||||||||||||||||||||||||||
Fuel/interest hedge mark-to-market, net of tax expense of $38 | — | — | — | — | — | 63 | 63 | |||||||||||||||||||||||||||||||||||||||||||||||||||||
Total comprehensive income | — | 816 | — | — | 69 | 885 | — | 816 | — | — | — | 69 | 885 | |||||||||||||||||||||||||||||||||||||||||||||||
Common stock dividends, $0.54 per share | — | — | (201 | ) | — | — | (201 | ) | — | (201 | ) | — | — | — | — | (201 | ) | |||||||||||||||||||||||||||||||||||||||||||
Adjustments associated with unearned compensation, restricted stock | 781 | (54 | ) | 22 | — | — | 3 | — | 25 | 781 | (54 | ) | 22 | — | — | — | 3 | — | 25 | |||||||||||||||||||||||||||||||||||||||||
Exercise of stock options and related tax benefit of $7 | 3,221 | (316 | ) | 80 | — | (9 | ) | — | — | 71 | 3,221 | (316 | ) | 80 | — | (9 | ) | — | — | — | 71 | |||||||||||||||||||||||||||||||||||||||
Purchase of BNSF common stock | — | (7,950 | ) | — | — | (217 | ) | — | — | (217 | ) | — | (7,950 | ) | — | — | (217 | ) | — | — | — | (217 | ) | |||||||||||||||||||||||||||||||||||||
Balance at December 31, 2003 | 500,685 | (129,225 | ) | 5,771 | 6,240 | (3,340 | ) | (36 | ) | (140 | ) | 8,495 | 500,685 | (129,225 | ) | 5,771 | 6,240 | (3,340 | ) | — | (36 | ) | (140 | ) | 8,495 | |||||||||||||||||||||||||||||||||||
Comprehensive income: | ||||||||||||||||||||||||||||||||||||||||||||||||||||||||||||
Net income | — | 791 | — | — | — | 791 | — | 791 | — | — | — | — | 791 | |||||||||||||||||||||||||||||||||||||||||||||||
Minimum pension liability adjustment, net of tax expense of $3 | — | — | — | — | 3 | 3 | — | — | — | — | — | 3 | 3 | |||||||||||||||||||||||||||||||||||||||||||||||
Fuel/ interest hedge mark-to-market, net of tax expense of $83 | — | — | — | — | 136 | 136 | ||||||||||||||||||||||||||||||||||||||||||||||||||||||
Fuel/interest hedge mark-to-market, net of tax expense of $83 | — | — | — | — | — | 136 | 136 | |||||||||||||||||||||||||||||||||||||||||||||||||||||
Total comprehensive income | — | 791 | — | — | 139 | 930 | — | 791 | — | — | — | 139 | 930 | |||||||||||||||||||||||||||||||||||||||||||||||
Common stock dividends, $0.64 per share | — | — | — | (239 | ) | (239 | ) | — | (239 | ) | — | — | — | — | (239 | ) | ||||||||||||||||||||||||||||||||||||||||||||
Adjustments associated with unearned compensation, restricted stock | 1,135 | (49 | ) | 44 | — | (7 | ) | — | 37 | 1,135 | (49 | ) | 44 | — | — | — | (7 | ) | — | 37 | ||||||||||||||||||||||||||||||||||||||||
Exercise of stock options and related tax benefit of $53 | 15,455 | (746 | ) | 489 | — | (25 | ) | — | — | 464 | 15,455 | (746 | ) | 489 | — | (25 | ) | — | — | — | 464 | |||||||||||||||||||||||||||||||||||||||
Purchase of BNSF common stock | — | (10,443 | ) | — | — | (376 | ) | — | — | (376 | ) | — | (10,443 | ) | — | — | (376 | ) | — | — | — | (376 | ) | |||||||||||||||||||||||||||||||||||||
Balance at December 31, 2004 | 517,275 | (140,463 | ) | $ | 6,304 | $ | 6,792 | $ | (3,741 | ) | $ | (43 | ) | $ | (1 | ) | 9,311 | 517,275 | (140,463 | ) | 6,304 | 6,792 | (3,741 | ) | — | (43 | ) | (1 | ) | 9,311 | ||||||||||||||||||||||||||||||
Comprehensive income: | ||||||||||||||||||||||||||||||||||||||||||||||||||||||||||||
Net income | — | 1,531 | — | — | — | — | 1,531 | |||||||||||||||||||||||||||||||||||||||||||||||||||||
Minimum pension liability adjustment, net of tax benefit of $25 | — | — | — | — | — | (39 | ) | (39 | ) | |||||||||||||||||||||||||||||||||||||||||||||||||||
Fuel/interest hedge mark-to-market, net of tax benefit of $8 | — | — | — | — | — | (13 | ) | (13 | ) | |||||||||||||||||||||||||||||||||||||||||||||||||||
Other | — | — | — | — | — | — | — | |||||||||||||||||||||||||||||||||||||||||||||||||||||
Total comprehensive income | — | 1,531 | — | — | — | (52 | ) | 1,479 | ||||||||||||||||||||||||||||||||||||||||||||||||||||
Common stock dividends, $0.74 per share | — | (278 | ) | — | — | — | — | (278 | ) | |||||||||||||||||||||||||||||||||||||||||||||||||||
Adjustments associated with unearned compensation, restricted stock | 665 | (140 | ) | 36 | — | — | — | 21 | — | 57 | ||||||||||||||||||||||||||||||||||||||||||||||||||
Exercise of stock options and related tax benefit of $94 | 9,349 | (540 | ) | 367 | — | (29 | ) | — | — | — | 338 | |||||||||||||||||||||||||||||||||||||||||||||||||
Purchase of BNSF common stock | — | (14,575 | ) | — | — | (799 | ) | — | — | — | (799 | ) | ||||||||||||||||||||||||||||||||||||||||||||||||
Prepaid forward repurchase of treasury stock | — | — | — | — | — | (600 | ) | — | — | (600 | ) | |||||||||||||||||||||||||||||||||||||||||||||||||
Balance at December 31, 2005 | 527,289 | (155,718 | ) | $ | 6,707 | $ | 8,045 | $ | (4,569 | ) | $ | (600 | ) | $ | (22 | ) | $ | (53 | ) | $ | 9,508 | |||||||||||||||||||||||||||||||||||||||
See accompanying Notes to Consolidated Financial Statements.
BURLINGTON NORTHERN SANTA FE CORPORATION AND SUBSIDIARIES
Notes to Consolidated Financial Statements
1. The Company
Burlington Northern Santa Fe Corporation (BNSF) is a holding company that conducts no operating activities and owns no significant assets other than through its interests in its subsidiaries. BNSF, its majority-owned subsidiaries, and a variable interest entity for which BNSF is the primary beneficiary (see Note 2 of the Consolidated Financial Statements below), all of which are separate legal entities (collectively, the Company), is engaged primarily in management of its investment in itsBNSF’s principal, and wholly-owned subsidiary is BNSF Railway Company (BNSF Railway). BNSF Railway, which operates one of the largest railroad networks in North America with approximately 32,000 route miles covering 28 states and two Canadian provinces. Through one operating transportation services segment, BNSF Railway transports a wide range of products and commodities including the transportation of Consumer Products, Industrial Products, Coal and Agricultural Products, derived from manufacturing, agriculturalProducts. These consolidated financial statements include BNSF, BNSF Railway, other majority-owned subsidiaries, and natural resource industries,a variable interest entity for which constituted 40 percent, 23 percent, 21 percent and 16 percent, respectively,BNSF is the primary beneficiary (see Note 2 of total freight revenues for the year ended December 31, 2004.Consolidated Financial Statements below), all of which are separate legal entities (collectively, the Company).
2. Significant Accounting Policies
PRINCIPLES OF CONSOLIDATION
The Consolidated Financial Statements include the accounts of BNSF, including its principal subsidiary BNSF Railway. All significant intercompany accounts and transactions have been eliminated.
IMPLEMENTATION OF FIN 46R
In 2001, BNSF Railway entered into the San Jacinto Rail Limited partnershipPartnership (the Partnership) with subsidiaries of three chemical manufacturing companies. The original purpose of this Partnership was to construct and BNSF to operate a 13-mile rail line to service these and other chemical and plastics manufacturing facilities in the Houston, Texas area. BNSF Railway owns a 48 percent48-percent limited partnership interest and a one percentone-percent general partnership interest in the Partnership and acts as the general partner and operator of this facility.
The Company determined that San Jacinto Rail Limited,the Partnership, a previously unconsolidated subsidiary, was required to be consolidated pursuant to Financial Accounting Standards Board (FASB) Interpretation No. 46R (FIN 46R),Consolidation of Variable Interest Entities,on March 31, 2004, as the Partnership qualifies as a variable interest entity and the Company is the primary beneficiary. This consolidation had a minimal impact to the Consolidated Statements of Income due to the fact that the Company accounted for this investment prior to the adoption of FIN 46R under the equity method of accounting and the Partnership’s losses to date have been minimal. The consolidation of the Partnership in 2004 resulted in an increase in assets of $54 million, which includes $26 million in cash and $23 million in land and related development costs, an increase in liabilities of $55 million, including $50 million of short-term debt, and a decrease in equity of $1 million (see Note 7 of the Consolidated Financial Statements for additional information regarding the Partnership).
CUMULATIVE EFFECT OF ACCOUNTING CHANGE, NET OF TAX
The Company adopted Statement of Financial Accounting Standards (SFAS) No. 143,Accounting for Asset Retirement Obligations, on January 1, 2003. This statement requires BNSF to recognize a liability for legally obligated asset retirement costs associated with tangible long-lived assets. SFAS No. 143 also disallows the accrual of retirement costs that are not legal obligations. As a result, BNSF and other railroads were required to change their accounting policies for certain track structure assets to exclude removal costs as a component of depreciation expense where the inclusion of such costs would result in accumulated depreciation balances exceeding the historical basis of the assets. This change results in lower depreciation and amortization expense primarily offset by higher compensation and benefits, purchased services and materials and other expenses in the period in which removal costs are incurred.
The following table presentsillustrates the pro formaeffect on net income and earnings per share if the Company had applied SFAS No. 143, would have been applied retroactivelyAccounting for Asset Retirement Obligations prior to its adoption by the Company in 2004 (in millions, except per share data):
Year ended December 31, | 2004 | 2003 | 2002 | 2005 | 2004 | 2003 | ||||||||||||
Net income as reported | $ | 791 | $ | 816 | $ | 760 | $ | 1,531 | $ | 791 | $ | 816 | ||||||
Pro forma net income | $ | 791 | $ | 777 | $ | 749 | $ | 1,531 | $ | 791 | $ | 777 | ||||||
Earnings per share | ||||||||||||||||||
Basic – as reported | $ | 2.14 | $ | 2.21 | $ | 2.01 | $ | 4.12 | $ | 2.14 | $ | 2.21 | ||||||
Basic – pro forma | $ | 2.14 | $ | 2.10 | $ | 1.98 | $ | 4.12 | $ | 2.14 | $ | 2.10 | ||||||
Diluted – as reported | $ | 2.10 | $ | 2.19 | $ | 2.00 | $ | 4.01 | $ | 2.10 | $ | 2.19 | ||||||
Diluted – pro forma | $ | 2.10 | $ | 2.09 | $ | 1.97 | $ | 4.01 | $ | 2.10 | $ | 2.09 | ||||||
USE OF ESTIMATES
The preparation of financial statements in accordance with generally accepted accounting principles (GAAP) requires management to make estimates and assumptions that affect the reported amounts of assets and liabilities and disclosure of contingent assets and liabilities at the date of the financial statements and the reported amounts of revenues and expenses during the periods presented. These estimates and assumptions are periodically reviewed by management. Actual results could differ from those estimates.
REVENUE RECOGNITION
Transportation revenues are recognized based upon the proportion of service provided as of the balance sheet date. Revenues from ancillary services are recognized when performed. Customer incentives, which are primarily provided for shipping a specified cumulative volume or shipping to/from specific locations, are recorded as a reduction to revenue on a pro-rata basis based on actual or projected future customer shipments. When using projected shipments, the Company relies on historic trends as well as economic and other indicators to estimate the liability for customer incentives.
ACCOUNTS RECEIVABLE, NET
Accounts receivable, net includes accounts receivable reduced by an allowance for bill adjustments and uncollectible accounts. The allowance for bill adjustments and uncollectible accounts is based on historical experience as well as any known trends or uncertainties related to customer billing and account collectibility.
CASH AND CASH EQUIVALENTS
All short-term investments with original maturities of less than 90 days are considered cash equivalents. Cash equivalents are stated at cost, which approximates market value because of the short maturity of these instruments.
MATERIALS AND SUPPLIES
Materials and supplies, which consist mainly of rail, ties and other items for construction and maintenance of property and equipment, as well as diesel fuel, are valued at the lower of average cost or market.
PROPERTY AND EQUIPMENT, NET
Property and equipment are depreciated and amortized on a straight-line basis over their estimated useful lives. The Company uses the group method of depreciation in which a single depreciation rate is applied to the gross investment in a particular class of property, despite differences in the service life or salvage value of individual property units within the same class. Upon normal sale or retirement of certain depreciable railroad property, cost less net salvage value is charged to accumulated depreciation, and no gain or loss is recognized. The disposals of land and non-rail property as well as significant premature retirements are recorded as gains or losses at the time of their occurrence.
The Company self-constructs portions of its track structure and rebuilds certain classes of rolling stock. In addition to direct labor and material, certain indirect costs are capitalized. Expenditures whichthat significantly increase asset values or extend useful lives are capitalized. Repair and maintenance expenditures are charged to operating expense when the work is performed. Property and equipment are stated at cost.
The Company incurs certain direct labor, contract service and other costs associated with the development and installation of internal-use computer software. Costs for newly developed software or significant enhancements to existing software are typically capitalized. Research, preliminary project, operations, maintenance and training costs are charged to operating expense when the work is performed.
Long-lived assets are reviewed for impairment when events or changes in circumstances indicate that the carrying amount of an asset may not be recoverable. If impairment indicators are present and the estimated future undiscounted cash flows are less than the carrying value of the long-lived assets, the carrying value is reduced to the estimated fair value as measured by the discounted cash flows.
ENVIRONMENTAL LIABILITIES
Liabilities for environmental cleanup costs are initially recorded when BNSF’s liability for environmental cleanup is both probable and reasonably estimable. BNSF utilizes a third party actuary to assist the Company in estimating substantially all of its environmental liabilities. Subsequent adjustments to initial estimates are recorded as necessary based upon additional information developed in subsequent periods. Estimates for these liabilities are undiscounted.
PERSONAL INJURY CLAIMS
Liabilities for personal injury claims are initially recorded when the expected loss is both probable and reasonably estimable. Subsequent adjustments to initial estimates are recorded as necessary based upon additional information developed in subsequent periods. The liability and ultimate expense projections are developed with the assistance of third parties. Liabilities recorded for unasserted personal injury claims, including those related to asbestos, are based on information currently available. Estimates of liabilities for personal injury claims are undiscounted.
INCOME TAXES
Deferred tax assets and liabilities are measured using the tax rates that apply to taxable income in the period in which the deferred tax asset or liability is expected to be realized or paid. Valuation allowances are established to reduce deferred tax assets if it is more likely than not that some or all of the deferred tax asset will not be realized.
STOCK-BASED COMPENSATION
At December 31, 2004,2005, the Company had stock-based employee compensation plans. The Company applies Accounting Principles Board (APB) Opinion 25,Accounting for Stock Issued to Employees, and related interpretations in accounting for its stock based plans. In accordance with APB Opinion 25, the Company records the intrinsic value of stock basedstock-based compensation as expense. Accordingly, no compensation expense has been recognized for its fixed stock option plansoptions as the exercise price equals the stock price on the date of grant. Stock-based compensation expense related to restricted stock and restricted stock units has been recognized as compensation expense.
The following table below illustrates the effect on net income and earnings per share if the Company had applied the fair value recognition provisions of SFAS No. 123,Accounting for Stock-Based Compensation, to stock-based employee compensation (in millions, except per share data):
Year Ended December 31, | 2004 | 2003 | 2002 | 2005 | 2004 | 2003 | ||||||||||||||||||
Net income, as reported | $ | 791 | $ | 816 | $ | 760 | $ | 1,531 | $ | 791 | $ | 816 | ||||||||||||
Stock-based employee compensation expense included in reported net income, net of related tax effects | 19 | 11 | 10 | 23 | 19 | 11 | ||||||||||||||||||
Total stock-based compensation expense determined under fair value method for all awards, net of related tax effects | (41 | ) | (36 | ) | (32 | ) | (42 | ) | (41 | ) | (36 | ) | ||||||||||||
Pro forma net income | $ | 769 | $ | 791 | $ | 738 | $ | 1,512 | $ | 769 | $ | 791 | �� | |||||||||||
Earnings per share: | ||||||||||||||||||||||||
Basic – as reported | $ | 2.14 | $ | 2.21 | $ | 2.01 | $ | 4.12 | $ | 2.14 | $ | 2.21 | ||||||||||||
Basic – pro forma | $ | 2.08 | $ | 2.14 | $ | 1.95 | $ | 4.07 | $ | 2.08 | $ | 2.14 | ||||||||||||
Diluted – as reported | $ | 2.10 | $ | 2.19 | $ | 2.00 | $ | 4.01 | $ | 2.10 | $ | 2.19 | ||||||||||||
Diluted – pro forma | $ | 2.04 | $ | 2.13 | $ | 1.94 | $ | 3.96 | $ | 2.04 | $ | 2.13 | ||||||||||||
The pro forma amounts were estimated using the Black-Scholes option-pricing model with the following assumptions:
Year Ended December 31, | 2004 | 2003 | 2002 | 2005 | 2004 | 2003 | ||||||||||||||||||
Weighted average expected life (years) | 3.9 | 4.0 | 4.0 | 4.5 | 3.9 | 4.0 | ||||||||||||||||||
Weighted average expected volatility | 26.1 | % | 35.0 | % | 35.0 | % | 24.0 | % | 26.1 | % | 35.0 | % | ||||||||||||
Weighted average dividend per share | $ | 0.61 | $ | 0.49 | $ | 0.48 | $ | 0.69 | $ | 0.61 | $ | 0.49 | ||||||||||||
Weighted average risk free interest rate | 3.45 | % | 2.17 | % | 3.89 | % | 3.75 | % | 3.45 | % | 2.17 | % | ||||||||||||
Weighted average fair value of options granted per share | $ | 7.03 | $ | 7.20 | $ | 7.84 | $ | 11.33 | $ | 7.03 | $ | 7.20 | ||||||||||||
See Note 16 of the Consolidated Financial Statements for additional information regarding developments related to SFAS No. 123 and SFAS 123R.
PENSION AND OTHER POST-EMPLOYMENT BENEFITS
BNSF uses a third party actuary to assist the Company in estimating liabilities and expenses for pensions and OPEB.other post-employment benefits (OPEB). Estimated amounts are based on historical information, current information and estimates regarding future events and circumstances. Significant assumptions used in the valuation of pension and/or OPEB liabilities include the expected return on plan assets, discount rate, rate of increase in compensation levels and the health care cost trend rate.
RECLASSIFICATIONS
Certain comparative prior year amounts in the Consolidated Financial Statements and accompanying notes have been reclassified to conform to the current year presentation. These reclassifications had no effect on previously reported operating income and net income.
3. Hedging Activities
The Company uses derivatives to hedge against increases in diesel fuel prices and interest rates as well as to convert a portion of its fixed-rate long-term debt to floating-rate debt. The Company formally documents the relationship between the hedging instrument and the hedged item, as well as the risk management objective and strategy for the use of the hedging instrument. This documentation includes linking the derivatives that are designated as fair value or cash flow hedges to specific assets or liabilities on the balance sheet, commitments or forecasted transactions. The Company assesses at the time a derivative contract is entered into, and at least quarterly thereafter, whether the derivative item is effective in offsetting the changes in fair value or cash flows. Any change in fair value resulting from ineffectiveness, as defined by SFAS No. 133,Accounting for Derivative Instruments and Hedging Activities, as amended, is recognized in current period earnings. For derivative instruments that are designated and qualify as cash flow hedges, the effective portion of the gain or loss on the derivative instrument is recorded in accumulated other comprehensive income (AOCI) as a separate component of stockholders’ equity and reclassified into earnings in the period during which the hedge transaction affects earnings.
BNSF monitors its hedging positions and credit ratings of its counterparties and does not anticipate losses due to counterparty nonperformance.
FUEL
Fuel costs represented 19 percent of total operating expenses during 2005 and 14 percent of total operating expenses during 2004 and 2003 and 12 percent of total operating expenses during 2002.2003. Due to the significance of diesel fuel expenses to the operations of BNSF and the historical volatility of fuel prices, the Company maintains a programhas entered into hedges to hedge againstpartially mitigate the risk of fluctuations in the price of its diesel fuel purchases. The fuel-hedging program includesfuel hedges include the use of derivatives that are accounted for as cash flow hedges. The intent of the programhedging is intended to protect the Company’s operating margins and overall profitability from adverse fuel price changes by entering into fuel-hedge instruments based on management’s evaluation of current and expected diesel fuel price trends. However, to the extent the Company hedges portions of its fuel purchases, it may not realize the impact of decreases in fuel prices. Conversely, to the extent the Company does not hedge portions of its fuel purchases, it may be adversely affected by increases in fuel prices. Based on fuel consumption during 20042005 and excluding the impact of the hedging program,hedges, each one-cent increase in the price of fuel would result in approximately $13$14 million of additional fuel expense on an annual basis.
TOTAL FUEL HEDGING PROGRAMFUEL-HEDGING ACTIVITIES
As of December 31, 2004,2005, BNSF’s total fuel hedging programactivities covered approximately 52 percent, 2726 percent and 3 percent of estimated fuel purchases for 2005, 2006 and 2007, respectively. Hedge positions are closely monitored to ensure that they will not exceed actual fuel requirements in any period.
The amounts recorded in the Consolidated Statements of Income for fuel hedgefuel-hedge transactions were as follows (in millions):
Year Ended December 31, | 2004 | 2003 | 2002 | 2005 | 2004 | 2003 | ||||||||||||||||||
Hedge benefit | $ | 337 | $ | 65 | $ | 50 | $ | 535 | $ | 337 | $ | 65 | ||||||||||||
Ineffective portion of unexpired hedges | 1 | 3 | — | (4 | ) | 1 | 3 | |||||||||||||||||
Tax effect | (130 | ) | (26 | ) | (19 | ) | (203 | ) | (130 | ) | (26 | ) | ||||||||||||
Hedge benefit, net of tax | $ | 208 | $ | 42 | $ | 31 | $ | 328 | $ | 208 | $ | 42 | ||||||||||||
The amounts recorded in the Consolidated Balance Sheets for fuel hedge transactions were as follows (in millions):
December 31, | 2004 | 2003 | ||||||
Short-term fuel hedging asset | $ | 264 | $ | 102 | ||||
Long-term fuel hedging asset | 105 | 43 | ||||||
Ineffective portion of unexpired hedges | (4 | ) | (3 | ) | ||||
Tax effect | (140 | ) | (55 | ) | ||||
Amount included in AOCI, net of tax | $ | 225 | $ | 87 | ||||
Settled fuel hedging contracts receivable | $ | 131 | $ | 21 | ||||
Amounts recorded in AOCI represent the fair value less the ineffective portion of unexpired hedges.
December 31, | 2005 | 2004 | ||||||
Short-term fuel-hedging asset | $ | 303 | $ | 264 | ||||
Long-term fuel-hedging asset | 33 | 105 | ||||||
Ineffective portion of unexpired hedges | — | (4 | ) | |||||
Tax effect | (129 | ) | (140 | ) | ||||
Amount included in AOCI, net of tax | $ | 207 | $ | 225 | ||||
Settled fuel-hedging contracts receivable | $ | 143 | $ | 131 | ||||
BNSF measures the fair value of hedges from data provided by various external counterparties. To value a swap, the Company uses the forward commodity price for the period hedged. The fair values of costless collars are calculated and provided by the corresponding counterparties.
NYMEX #2 HEATING OIL HEDGES
As of December 31, 2004,2005, BNSF had entered into fuel swap and costless collar agreements utilizing NYMEXNew York Mercantile Exchange (NYMEX) #2 heating oil (HO). The hedge prices do not include taxes, transportation costs, certain other fuel handling costs and any differences which may occur between the prices of HO and the purchase price of BNSF’s diesel fuel. TheOver the twelve months ended December 31, 2005, the sum of all such costs typically ranges between 7 and 17averaged approximately 16 cents per gallon.
During 2004,2005, the Company entered into fuel swap agreements utilizing HO to hedge the equivalent of 85converted approximately 19 million gallons of fuel2006 West Texas Intermediate (WTI) collars into HO swaps at an average price of approximately $0.95 per gallon and costless collar agreements utilizing HO to hedge the equivalent of approximately 170 million gallons of fuel with an average cap price of $0.94 per gallon and an average floor price of $0.87$1.08 per gallon. The following table provides fuel hedge data based upon the quarter being hedged for all HO fuel hedges outstanding at December 31, 2004.2005.
| Quarter Ending | Quarter Ending | |||||||||||||||||||||||||||||
2005 | March 31, | June 30, | September 30, | December 31, | Annual | |||||||||||||||||||||||||
2006 | March 31, | June 30, | September 30, | December 31, | Annual | |||||||||||||||||||||||||
HO Swaps | ||||||||||||||||||||||||||||||
Gallons hedged (in millions) | 9.45 | 25.20 | 18.90 | 15.75 | 69.30 | 18.90 | — | — | — | 18.90 | ||||||||||||||||||||
Average swap price (per gallon) | $ | 1.00 | $ | 0.92 | $ | 0.91 | $ | 0.93 | $ | 0.93 | 1.08 | — | — | — | 1.08 | |||||||||||||||
Fair value (in millions) | $ | 2 | $ | 5 | $ | 4 | $ | 4 | $ | 15 | $ | 13 | $ | — | $ | — | $ | — | $ | 13 | ||||||||||
HO Collars | ||||||||||||||||||||||||||||||
Gallons hedged (in millions) | — | 6.30 | 12.60 | 22.05 | 40.95 | 15.75 | 22.05 | 28.35 | 31.50 | 97.65 | ||||||||||||||||||||
Average cap price (per gallon) | $ | — | $ | 0.97 | $ | 0.96 | $ | 0.98 | $ | 0.97 | $ | 0.97 | $ | 0.92 | $ | 0.91 | $ | 0.94 | $ | 0.93 | ||||||||||
Average floor price (per gallon) | $ | — | $ | 0.89 | $ | 0.88 | $ | 0.90 | $ | 0.89 | $ | 0.90 | $ | 0.84 | $ | 0.84 | $ | 0.87 | $ | 0.86 | ||||||||||
Fair value (in millions) | $ | — | $ | 1 | $ | 3 | $ | 4 | $ | 8 | $ | 12 | $ | 18 | $ | 24 | $ | 28 | $ | 82 | ||||||||||
| Quarter Ending | ||||||||||||||||||||||||||||||
2007 | March 31, | June 30, | September 30, | December 31, | Annual | |||||||||||||||||||||||||
HO Collars | ||||||||||||||||||||||||||||||
Gallons hedged (in millions) | 31.50 | — | — | — | 31.50 | |||||||||||||||||||||||||
Average cap price (per gallon) | $ | 0.93 | $ | — | $ | — | $ | — | $ | 0.93 | ||||||||||||||||||||
Average floor price (per gallon) | $ | 0.86 | $ | — | $ | — | $ | — | $ | 0.86 | ||||||||||||||||||||
Fair value (in millions) | $ | 28 | $ | — | $ | — | $ | — | $ | 28 | ||||||||||||||||||||
2006 HO Collars Gallons hedged (in millions) Average cap price (per gallon) Average floor price (per gallon) Fair value (in millions) 2007 HO Collars Gallons hedged (in millions) Average cap price (per gallon) Average floor price (per gallon) Fair value (in millions) Quarter Ending March 31, June 30, September 30, December 31, Annual 15.75 22.05 28.35 31.50 97.65 $ 0.97 $ 0.92 $ 0.91 $ 0.94 $ 0.93 $ 0.90 $ 0.84 $ 0.84 $ 0.87 $ 0.86 $ 3 $ 4 $ 5 $ 5 $ 17 Quarter Ending March 31, June 30, September 30, December 31, Annual �� 31.50 — — — 31.50 $ 0.93 $ — $ — $ — $ 0.93 $ 0.86 $ — $ — $ — $ 0.86 $ 6 $ — $ — $ — $ 6
WEST TEXAS INTERMEDIATEWTI CRUDE OIL HEDGES
In addition, BNSF enters into fuel swap and costless collar agreements utilizing WTI.WTI crude oil. The hedge prices do not include taxes, transportation costs, certain other fuel handling costs, and any differences which may occur between the prices of WTI and the purchase price of BNSF’s diesel fuel, including refining costs. TheOver the twelve months ended December 31, 2005, the sum of all such costs typically ranges between 12 and 32averaged approximately 45 cents per gallon.
During 2004,No additional WTI hedges were entered into during 2005. However, the Company entered into costless collar agreements utilizing WTI to hedge the equivalent ofconverted approximately 15419 million gallons of fuel with an average cap price of $32.61 per barrel and an average floor price of $28.31 per barrel.WTI collars into HO swaps as stated in the NYMEX #2 Heating Oil Hedges section. The following tables provide fuel hedge data based upon the quarter being hedged for all WTI fuel hedges outstanding at December 31, 2004.2005.
| Quarter Ending | |||||||||||||||
2005 | March 31, | June 30, | September 30, | December 31, | Annual | ||||||||||
WTI Swaps | |||||||||||||||
Barrels hedged (in thousands) | 600 | 675 | 1,125 | 1,350 | 3,750 | ||||||||||
Equivalent gallons hedged (in millions) | 25.20 | 28.35 | 47.25 | 56.70 | 157.50 | ||||||||||
Average swap price (per barrel) | $ | 24.26 | $ | 24.67 | $ | 24.55 | $ | 24.54 | $ | 24.52 | |||||
Fair value (in millions) | $ | 12 | $ | 12 | $ | 20 | $ | 22 | $ | 66 | |||||
WTI Collars | |||||||||||||||
Barrels hedged (in thousands) | 3,750 | 3,225 | 2,325 | 1,650 | 10,950 | ||||||||||
Equivalent gallons hedged (in millions) | 157.50 | 135.45 | 97.65 | 69.30 | 459.90 | ||||||||||
Average cap price (per barrel) | $ | 26.73 | $ | 26.47 | $ | 26.66 | $ | 27.11 | $ | 26.69 | |||||
Average floor price (per barrel) | $ | 22.13 | $ | 21.89 | $ | 22.07 | $ | 22.57 | $ | 22.11 | |||||
Fair value (in millions) | $ | 62 | $ | 53 | $ | 36 | $ | 24 | $ | 175 | |||||
| Quarter Ending | Quarter Ending | |||||||||||||||||||||||||||||
2006 | March 31, | June 30, | September 30, | December 31, | Annual | March 31, | June 30, | September 30, | December 31, | Annual | ||||||||||||||||||||
WTI Swaps | ||||||||||||||||||||||||||||||
Barrels hedged (in thousands) | 1,350 | 675 | 375 | — | 2,400 | 1,350 | 675 | 375 | — | 2,400 | ||||||||||||||||||||
Equivalent gallons hedged (in millions) | 56.70 | 28.35 | 15.75 | — | 100.80 | 56.70 | 28.35 | 15.75 | — | 100.80 | ||||||||||||||||||||
Average swap price (per barrel) | $ | 24.43 | $ | 25.16 | $ | 25.69 | $ | — | $ | 24.83 | $ | 24.43 | $ | 25.16 | $ | 25.69 | $ | — | $ | 24.83 | ||||||||||
Fair value (in millions) | $ | 21 | $ | 10 | $ | 5 | $ | — | $ | 36 | $ | 50 | $ | 25 | $ | 14 | $ | — | $ | 89 | ||||||||||
WTI Collars | ||||||||||||||||||||||||||||||
Barrels hedged (in thousands) | 1,500 | 1,500 | 825 | 525 | 4,350 | 1,050 | 1,500 | 825 | 525 | 3,900 | ||||||||||||||||||||
Equivalent gallons hedged (in millions) | 63.00 | 63.00 | 34.65 | 22.05 | 182.70 | 44.10 | 63.00 | 34.65 | 22.05 | 163.80 | ||||||||||||||||||||
Average cap price (per barrel) | $ | 30.05 | $ | 30.20 | $ | 30.81 | $ | 31.93 | $ | 30.47 | $ | 29.23 | $ | 30.20 | $ | 30.81 | $ | 31.93 | $ | 30.30 | ||||||||||
Average floor price (per barrel) | $ | 25.66 | $ | 25.79 | $ | 26.32 | $ | 27.42 | $ | 26.04 | $ | 24.73 | $ | 25.79 | $ | 26.32 | $ | 27.42 | $ | 25.84 | ||||||||||
Fair value (in millions) | $ | 17 | $ | 16 | $ | 8 | $ | 4 | $ | 45 | $ | 34 | $ | 47 | $ | 26 | $ | 16 | $ | 123 | ||||||||||
| Quarter Ending | Quarter Ending | |||||||||||||||||||||||||||||
2007 | March 31, | June 30, | September 30, | December 31, | Annual | March 31, | June 30, | September 30, | December 31, | Annual | ||||||||||||||||||||
WTI Collars | ||||||||||||||||||||||||||||||
Barrels hedged (in thousands) | 150 | — | — | — | 150 | 150 | — | — | — | 150 | ||||||||||||||||||||
Equivalent gallons hedged (in millions) | 6.30 | — | — | — | 6.30 | 6.30 | — | — | — | 6.30 | ||||||||||||||||||||
Average cap price (per barrel) | $ | 33.00 | $ | — | $ | — | $ | — | $ | 33.00 | $ | 33.00 | $ | — | $ | — | $ | — | $ | 33.00 | ||||||||||
Average floor price (per barrel) | $ | 29.00 | $ | — | $ | — | $ | — | $ | 29.00 | $ | 29.00 | $ | — | $ | — | $ | — | $ | 29.00 | ||||||||||
Fair value (in millions) | $ | 1 | $ | — | $ | — | $ | — | $ | 1 | $ | 5 | $ | — | $ | — | $ | — | $ | 5 | ||||||||||
NYMEX #2 HEATING OIL REFINING SPREAD HEDGES
In addition, BNSF hasDuring 2005, the Company entered into fuel swap agreements utilizing the HO refining spread (HO-WTI). to hedge the equivalent of approximately 57 million gallons of fuel with an average swap price $15.69 per barrel. HO-WTI is the difference in price between HO and WTI; therefore, a HO-WTI swap in combination with a WTI swap is equivalent to a HO swap. As of December 31, 2003,The following table provides fuel hedge data based upon the Company was utilizing HO-WTI fuel hedges. However, the Company did not enter into any additional HO-WTI swaps during 2004 and there were noquarter being hedged for all HO-WTI fuel hedges outstanding as of December 31, 2004.2005.
2006 HO-WTI Swaps Barrels hedged (in thousands) Equivalent gallons hedged (in millions) Average swap price (per barrel) Fair value (in millions) Quarter Ending
March 31, 1,350 56.70 $ 15.69 $ (4 )
SUMMARIZED COMPARATIVE PRIOR YEAR INFORMATION
The following table provides summarized comparative information for hedge transactions as of December 31, 2003.2004.
| December 31, 2003 | ||||||||||||||||||
Year ending, | December 31, | |||||||||||||||||
| 2004 | 2005 | 2006 | 2005 | 2006 | 2007 | |||||||||||||
| HO Swaps | ||||||||||||||||||
Gallons hedged (in millions) | 696.15 | — | — | 69.30 | — | — | ||||||||||||
Average swap price (per gallon) | $ | 0.71 | $ | — | $ | — | $ | 0.93 | $ | — | $ | — | ||||||
Fair value (in millions) | $ | 79 | $ | — | $ | — | $ | 15 | $ | — | $ | — | ||||||
HO Collars | ||||||||||||||||||
Gallons hedged (in millions) | 40.95 | 97.65 | 31.50 | |||||||||||||||
Average cap price (per gallon) | $ | 0.97 | $ | 0.93 | $ | 0.93 | ||||||||||||
Average floor price (per gallon) | $ | 0.89 | $ | 0.86 | $ | 0.86 | ||||||||||||
Fair value (in millions) | $ | 8 | $ | 17 | $ | 6 | ||||||||||||
| WTI Swaps | ||||||||||||||||||
Barrels hedged (in thousands) | 2,250 | 3,750 | 2,400 | 3,750 | 2,400 | — | ||||||||||||
Equivalent gallons hedged (in millions) | 94.50 | 157.50 | 100.8 | 157.50 | 100.80 | — | ||||||||||||
Weighted average swap price | $ | 20.85 | $ | 24.52 | $ | 24.83 | ||||||||||||
Average swap price (per barrel) | $ | 24.52 | $ | 24.83 | $ | — | ||||||||||||
Fair value (in millions) | $ | 21 | $ | 10 | $ | 4 | $ | 66 | $ | 36 | $ | — | ||||||
| WTI Collars | ||||||||||||||||||
Barrels hedged (in thousands) | 975 | 9,900 | 1,875 | 10,950 | 4,350 | 150 | ||||||||||||
Equivalent gallons hedged (in millions) | 40.95 | 415.8 | 78.75 | 459.90 | 182.70 | 6.30 | ||||||||||||
Weighted average cap price | $ | 28.52 | $ | 26.06 | $ | 27.69 | ||||||||||||
Weighted average floor price | $ | 24.10 | $ | 21.46 | $ | 23.06 | ||||||||||||
Average cap price (per barrel) | $ | 26.69 | $ | 30.47 | $ | 33.00 | ||||||||||||
Average floor price (per barrel) | $ | 22.11 | $ | 26.04 | $ | 29.00 | ||||||||||||
Fair value (in millions) | $ | 2 | $ | 27 | $ | 2 | $ | 175 | $ | 45 | $ | 1 | ||||||
| HO-WTI Swaps | ||||||||||||||||||
Barrels hedged (in thousands) | 2,250 | — | — | |||||||||||||||
Equivalent gallons hedged (in millions) | 94.50 | — | — | |||||||||||||||
Average swap price (per barrel) | $ | 4.16 | $ | — | $ | — | ||||||||||||
Fair value (in millions) | $ | — | $ | — | $ | — | ||||||||||||
INTEREST RATE
From time to time, the Company enters into various interest rate hedging transactions for the purpose of managing exposure to fluctuations in interest rates and establishing rates in anticipation of future debt issuances as well as to convert a portion of its fixed-rate long-term debt to floating-rate debt. The Company uses interest rate swaps and treasury locks as part of its interest rate risk management strategy.
TOTAL INTEREST RATE HEDGING PROGRAM
All interest rate hedgingderivative transactions outstanding with an interest rate component are reflected in the tables below.following table:
| December 31, 2004 | December 31, 2005 | |||||||||||||||||||||||||||||||||||||||||||||||||||||||
| Maturity Date | Total | Fair | Maturity Date | Fair Value | ||||||||||||||||||||||||||||||||||||||||||||||||||||
| 2005 | 2006 | 2007 | 2008 | 2009 | Thereafter | 2006 | 2007 | 2008 | 2009 | 2010 | Thereafter | Total | ||||||||||||||||||||||||||||||||||||||||||||
| Fair value hedges | ||||||||||||||||||||||||||||||||||||||||||||||||||||||||
Fixed to variable swaps (in millions) | $ | 300 | — | $ | 300 | — | $ | 200 | $ | 250 | $ | 1,050 | $ | 35 | $ | — | $ | 300 | $ | — | $ | 200 | $ | 250 | $ | — | $ | 750 | $ | — | ||||||||||||||||||||||||||
Average fixed rate | 6.38 | % | — | 7.88 | % | — | 6.13 | % | 7.13 | % | 6.93 | % | — | 7.88 | % | — | 6.13 | % | 7.13 | % | — | 7.16 | % | |||||||||||||||||||||||||||||||||
Average floating rate | 3.95 | % | — | 4.67 | % | — | 2.97 | % | 5.36 | % | 4.31 | % | — | 6.75 | % | — | 4.97 | % | 7.36 | % | — | 6.48 | % | |||||||||||||||||||||||||||||||||
Cash flow hedges | ||||||||||||||||||||||||||||||||||||||||||||||||||||||||
Forward-starting swaps (in millions) | $ | 250 | $ | — | $ | — | $ | — | $ | — | $ | — | $ | 250 | $ | 8 | ||||||||||||||||||||||||||||||||||||||||
Average swap rate | 4.87 | % | — | — | — | — | — | 4.87 | % | |||||||||||||||||||||||||||||||||||||||||||||||
BNSF’s measurement of the fair value of interest rate swaps and treasury locks is based on estimates of the mid-market values for the transactions provided by the counterparties to these agreements.
SUMMARIZED COMPARATIVE PRIOR YEAR INFORMATION
| December 31, 2003 | December 31, 2004 | |||||||||||||||||||||||||||||||||||||||||||||||||||||||
| Maturity Date | Total | Fair | Maturity Date | Fair Value | ||||||||||||||||||||||||||||||||||||||||||||||||||||
| 2004 | 2005 | 2006 | 2007 | 2008 | Thereafter | 2005 | 2006 | 2007 | 2008 | 2009 | Thereafter | Total | ||||||||||||||||||||||||||||||||||||||||||||
| Fair value hedges | ||||||||||||||||||||||||||||||||||||||||||||||||||||||||
Fixed to variable swaps (in millions) | $ | 100 | $ | 300 | — | $ | 300 | — | $ | 200 | $ | 900 | $ | 65 | $ | 300 | $ | — | $ | 300 | $ | — | $ | 200 | $ | 250 | $ | 1,050 | $ | 35 | ||||||||||||||||||||||||||
Average fixed rate | 8.63 | % | 6.38 | % | — | 7.88 | % | — | 6.13 | % | 7.07 | % | 6.38 | % | $ | — | 7.88 | % | $ | — | 6.13 | % | 7.13 | % | 6.93 | % | ||||||||||||||||||||||||||||||
Average floating rate | 5.44 | % | 2.63 | % | — | 3.75 | % | — | 1.65 | % | 3.10 | % | 3.95 | % | $ | — | 4.67 | % | $ | — | 2.97 | % | 5.36 | % | 4.31 | % | ||||||||||||||||||||||||||||||
FAIR VALUE INTEREST RATE HEDGES
The Company enters into interest rate swaps to convert fixed-rate long-term debt to floating-rate debt. These swaps are accounted for as fair value hedges under SFAS No. 133. These fair value hedges qualify for the short cutshort-cut method of recognition; therefore, no portion of these swaps is treated as ineffective. As of December 31, 20042005 and 2003,2004, BNSF had thirteenten and ninethirteen separate swaps outstanding, respectively, on awith an aggregate notional amount of $1,050$750 million and $900$1,050 million, respectively, in which it pays an average floating rate, which fluctuates quarterly, based on London Interbank Offered Rate (LIBOR). The average floating rate to be paid by BNSF as of December 31, 2004,2005, was 4.316.48 percent, and the average fixed rate BNSF is to receive is 6.937.16 percent. These swaps will expire between 20052007 and 2010.
The amounts recorded in the Consolidated Statements of Income, as a reduction of interest expense, for interest rate fair value hedge transactions wereare as follows (in millions):
Year Ended December 31, | 2004 | 2003 | 2002 | |||||||||||||||||||||
December 31, | 2005 | 2004 | 2003 | |||||||||||||||||||||
Hedge benefit | $ | 36 | $ | 35 | $ | 26 | $ | 17 | $ | 36 | $ | 35 | ||||||||||||
Tax effect | (14 | ) | (13 | ) | (10 | ) | (6 | ) | (14 | ) | (13 | ) | ||||||||||||
Hedge benefit, net of tax | $ | 22 | $ | 22 | $ | 16 | $ | 11 | $ | 22 | $ | 22 | ||||||||||||
The amounts recorded on the Consolidated Balance Sheets for interest rate fair value hedge transactions, which represent the fair value of unexpired hedges, with a corresponding increase to debt or accrued interest, wereare as follows (in millions):
December 31, | 2004 | 2003 | 2005 | 2004 | |||||||||
Short-term interest rate hedging asset | $ | 10 | $ | 9 | $ | 1 | $ | 10 | |||||
Long-term interest rate hedging asset | $ | 25 | $ | 56 | $ | (1 | ) | $ | 25 | ||||
CASH FLOW INTEREST RATE HEDGES
The Company uses interest rate swaps to fix the LIBOR component of commercial paper. These swaps are accounted for as cash flow hedges under SFAS No. 133 and qualify for the short cut method of recognition; therefore, no portion of these swaps is treated as ineffective. As of December 31, 2004 and 2003, BNSF had no interest rate swaps outstanding to fix the LIBOR component of commercial paper, but had interest rate swaps outstanding for a notional amount of $100 million at December 31, 2002 which expired in 2003. The Company recorded a Hedge loss of $1 million, net of a tax benefit of $1 million for the year ended December 31, 2002 related to this interest rate swap.
In anticipation of a future debt issuance, BNSFthe Company entered into three treasury lock transactionsfive forward starting interest rate swaps in July and August 2004, with a2005 having an aggregate notional amount of $250 million to fix a portion of the treasury component onrate for a future 10-year30-year unsecured debt issuance. The weighted-averageforward starting swaps have an average swap rate of 4.87 percent, which includes an average forward treasury rate of 4.41 percent and a swap spread of 0.46 percent. The forward starting date of the swaps is October 16, 2006, but the Company may terminate the swaps at any time prior to that date. The swaps must be terminated on or prior to February 28, 2007. The resulting locked-in rate was 4.41 percent. The treasury locks were closed in November 2004 in connection withon the debt to be issued (excluding the credit spread and issuance of $250 million of 4.88 percent notes due January 15, 2015. BNSF paid the counterparties $3.6 million on November 22, 2004, and this paymentfees) will be 4.87 percent minus the swap spread received by BNSF on the termination date. Any gain or loss on these hedges will be amortized to interest expense over the life of the related notes.issued debt. These transactions are accounted for as cash flow hedges.
In 2002, BNSF entered into three treasury lockThe amounts recorded in the Consolidated Balance Sheets for interest rate cash flow hedge transactions, totaling $150 million to fixwhich represent the treasury component on a future 10-year debt issuance. The average locked-in rate was 4.38 percent. These treasury locks were closed in May 2003 in connection with the issuancefair value of $250 million of 4.30 percent notes due July 1, 2013. BNSF paid the counterparties $10 million on the closing date and this payment will be amortized over the life of the related notes.unexpired hedges, are as follows (in millions):
December 31, | 2005 | 2004 | |||||
Interest rate hedging asset | $ | 8 | $ | — | |||
Tax effect | (3 | ) | — | ||||
Interest rate hedging asset in AOCI, net of tax | $ | 5 | $ | — | |||
4. Other Expense, Net
Other expense, net includes the following (in millions):
Year Ended December 31, | 2004 | 2003 | 2002 | 2005 | 2004 | 2003 | ||||||||||||||
Accounts receivable sale fees | $ | 10 | $ | 9 | $ | 12 | $ | 15 | $ | 10 | $ | 9 | ||||||||
Loss from participation in synthetic fuel partnership | 3 | — | — | 14 | 3 | — | ||||||||||||||
Miscellaneous, net | (9 | ) | 5 | — | 8 | (9 | ) | 5 | ||||||||||||
Total | $ | 4 | $ | 14 | $ | 12 | $ | 37 | $ | 4 | $ | 14 | ||||||||
The increase in other expense, net was predominantly due to higher accounts receivable sales fees driven primarily by higher interest rates, losses on BNSF’s participation in a synthetic fuel partnership and the receipt of interest income on a settlement that occurred in 2004.
During the fourth quarter of 2004, BNSF indirectly purchased a 4.17 percent ownership of a synthetic fuel partnership through a 50 percent interest in a limited liability company with an unrelated entity. The synthetic fuel partnership generates Section 29 synthetic fuel tax credits, which reduce the Company’s effective tax rate (see Note 5 of the Consolidated Financial Statements for additional information). In 2005 and 2004, BNSF received a tax benefit from its participation in the partnership of approximately $16.2 and $3.5 million, respectively, related to the fuel tax credits and the deduction of partnership operating losses. TheIn 2005 and 2004, the Company recorded approximately $14 million and $3 million, respectively, of other expense, net related to the Company’s share of the partnership’s losses under the equity method of accounting. The partnership does not qualify for consolidation under FIN 46R, as BNSF is not the primary beneficiary of the partnership. The Company’s maximum future exposure to loss related to the activities of the synthetic fuel partnership is based upon the actual synthetic fuel produced by the partnership and is estimated to equal $36$25 million. However, the Company believes that any losses will be more than offset by the synthetic fuel tax credits.
5. Income Taxes
Income tax expense (benefit) was as follows (in millions):
Year Ended December 31, | 2004 | 2003 | 2002 | 2005 | 2004 | 2003 | ||||||||||||||
Current: | ||||||||||||||||||||
Federal | $ | 212 | $ | (12 | ) | $ | 21 | $ | 620 | $ | 212 | $ | (12 | ) | ||||||
State | 33 | 6 | 3 | 80 | 33 | 6 | ||||||||||||||
Total current | $ | 245 | $ | (6 | ) | $ | 24 | 700 | 245 | (6 | ) | |||||||||
Deferred: | ||||||||||||||||||||
Federal | $ | 211 | $ | 408 | $ | 378 | 183 | 211 | 408 | |||||||||||
State | 26 | 52 | 54 | 34 | 26 | 52 | ||||||||||||||
Total deferred | $ | 237 | $ | 460 | $ | 432 | 217 | 237 | 460 | |||||||||||
Total | $ | 482 | $ | 454 | $ | 456 | $ | 917 | $ | 482 | $ | 454 | ||||||||
Reconciliation of the federal statutory income tax rate to the effective tax rate was as follows:
Year Ended December 31, | 2004 | 2003 | 2002 | 2005 | 2004 | 2003 | ||||||||||||
Federal statutory income tax rate | 35.0 | % | 35.0 | % | 35.0 | % | 35.0 | % | 35.0 | % | 35.0 | % | ||||||
State income taxes, net of federal tax benefit | 3.0 | 3.0 | 3.1 | 3.0 | 3.0 | 3.0 | ||||||||||||
Tax settlement | — | (1.0 | ) | — | — | — | (1.0 | ) | ||||||||||
Synthetic fuel credits | (0.2 | ) | — | —�� | (0.4 | ) | (0.2 | ) | — | |||||||||
Other, net | 0.1 | (0.1 | ) | (0.6 | ) | (0.1 | ) | 0.1 | (0.1 | ) | ||||||||
Effective tax rate | 37.9 | % | 36.9 | % | 37.5 | % | 37.5 | % | 37.9 | % | 36.9 | % | ||||||
The lower effective tax rate in 2003 primarily reflects a tax settlement attributable to prior years that was settled favorably in 2003.
The components of deferred tax assets and liabilities were as follows (in millions):
December 31, | 2004 | 2003 | 2005 | 2004 | ||||||||||||
Deferred tax liabilities: | ||||||||||||||||
Depreciation and amortization | $ | (8,222 | ) | $ | (7,806 | ) | $ | (8,406 | ) | $ | (8,222 | ) | ||||
Hedging | (139 | ) | (56 | ) | (132 | ) | (139 | ) | ||||||||
Other | (210 | ) | (190 | ) | (221 | ) | (210 | ) | ||||||||
Total deferred tax liabilities | (8,571 | ) | (8,052 | ) | (8,759 | ) | (8,571 | ) | ||||||||
Deferred tax assets: | ||||||||||||||||
Casualty and environmental | 387 | 215 | 360 | 387 | ||||||||||||
Pension and other post-employment benefits | 245 | 227 | ||||||||||||||
Compensation and benefits | 125 | 123 | ||||||||||||||
Employee separation costs | 58 | 67 | 49 | 58 | ||||||||||||
Compensation and Benefits | 123 | 93 | ||||||||||||||
Pension and post-retirement benefits | 227 | 233 | ||||||||||||||
Other | 264 | 255 | 282 | 264 | ||||||||||||
Total deferred tax assets | 1,059 | 863 | 1,061 | 1,059 | ||||||||||||
Net deferred tax liability | $ | (7,512 | ) | $ | (7,189 | ) | $ | (7,698 | ) | $ | (7,512 | ) | ||||
Non-current deferred income tax liability | $ | (7,820 | ) | $ | (7,481 | ) | $ | (7,916 | ) | $ | (7,820 | ) | ||||
Current deferred income tax asset | 308 | 292 | ||||||||||||||
Current portion of deferred income taxes | 218 | 308 | ||||||||||||||
Net deferred tax liability | $ | (7,512 | ) | $ | (7,189 | ) | $ | (7,698 | ) | $ | (7,512 | ) | ||||
All federal income tax returns of BNSF’s predecessor companies, Burlington Northern Inc. and Santa Fe Pacific Corporation, are closed through 1994 and the business combination date of September 22, 1995, respectively. Internal Revenue Service examination of the years 1995
through 1999 for BNSF is completed, and protests of the unagreed issues have been filed with IRSare pending before Internal Revenue Service (IRS) Appeals. BNSF is currently under examination for years 2000 through 2002. In addition, BNSF and its subsidiaries have various state income tax returns in the process of examination, administrative appeal or litigation. Due to the capital-intensive nature of BNSF’s business, a significant portion of the audit issues with the IRS and other taxing authorities relate to whether expenditures are classified as maintenance or capital and whether certain asset valuations are appropriate. A provision for taxes resulting from ongoing and future federal and state audits is based on an estimation of aggregate adjustments that may be required as a result of the audits. The Company believes that adequate provision has been made for any adjustment that might be assessed for open years through 2004.2005.
6. Accounts Receivable, netNet
BNSF Railway transfers most of its accounts receivable to Santa Fe Receivables Corporation (SFRC), a special purpose subsidiary. SFRC transfers an undivided interest in such receivables, with limited exceptions, to a master trust, and causes the trust to issue an undivided interest in the receivables to investors (the A/R sales program). The undivided interests in the master trust may be in the form of certificates or purchased interests.
SFRC renewed $350 million of its $700 million accounts receivable facility, effective June 2004, for an additional 364 days. In addition, SFRC entered into a separate $350 million accounts receivable facility with a five year term in June 2003. As a result of amendments to the facilities, the commitments of the investors are currently scheduled to expire in October 2005 and October 2008, respectively. The Company’s total capacity to sell undivided interests to investors under the A/R sales program was $700 million at December 31, 2004.2005, which was comprised of two $350 million, 364-day accounts receivable facilities. The Company amended these facilities on October 14, 2005, modifying their expiration dates to October 2006. Outstanding undivided interests held by investors under the A/R sales program were $650$300 million and $625$650 million at December 31, 20042005 and 2003,2004, respectively. These receivables were derecognized by BNSF Railway in connection with the sale of undivided interests under the A/R sales program. The undivided interests were supported by $894$1,008 million and $808$864 million of receivables transferred by SFRC to the master trust at December 31, 20042005 and December 31, 2003,2004, respectively. When SFRC transfers these receivables to the master trust, it retains an undivided interest in the receivables sold. This retained interest is included in accounts receivable in the Company’s financial statements. SFRC’s retained interest in these receivables of $244$708 million and $183$214 million at December 31, 20042005 and 2003,2004, respectively, less an allowance for uncollectible accounts, reflected the total accounts receivable transferred by SFRC to the master trust less $650$300 million and $625$650 million at December 31, 20042005 and 2003,2004, respectively, of outstanding undivided interests held by investors. Due to a relatively short collection cycle, the fair value of the undivided interest transferred to investors in the A/R sales program approximated book value, and there was no gain or loss from the transaction.
The Company retains the collection responsibility with respect to the accounts receivable. Proceeds from collections reinvested in the A/R sales program were approximately $13.6 billion, $11.6 billion and $9.8 billion in 2005, 2004 and $9.5 billion in 2004, 2003, and 2002, respectively. No servicing asset or liability has been recorded because the fees the Company receives for servicing the receivables approximate the related costs. SFRC’s costs of the sale of receivables are included in other expense, net and were $15 million, $10 million $9 million and $12$9 million for the years ended December 31, 2005, 2004 2003 and 2002,2003, respectively. These costs fluctuate monthly with changes in prevailing interest rates and were based on weighted average interest rates of 3.3 percent, 1.4 percent 1.1 percent and 2.01.1 percent for the years ended December 31, 2005, 2004 2003 and 2002,2003, respectively. These costs include interest, discounts associated with transferring the receivables under the A/R sales program to SFRC, program fees paid to banks, incidental commercial paper issuing costs, and fees for unused commitment availability.
The amount of accounts receivable transferred by BNSF Railway to SFRC fluctuates based upon the availability of receivables and is directly affected by changing business volumes and credit risks, including dilution and delinquencies. BNSF Railway has historically experienced very low levels of default or dilution. If dilution or delinquency percentages were to increase by one percentage point, there would be no impact to the valueamount of receivables BNSF Railway’s retained interest would increase by approximately $8 million.Railway could sell.
Receivables funded under the A/R sales program may not include among other things, amounts over 90 days past due or concentrations over certain limits with any one customer.customer and certain other receivables. At December 31, 20042005 and December 31, 2003, $772004, $36 million and $78$47 million, respectively, of accounts receivable were greater than 90 days old. The Company maintains an allowance for bill adjustments and uncollectible accounts based upon the expected collectibility of accounts receivable, including receivables transferred to the master trust. Credit losses are based on specific identification of uncollectible accounts and application of historical collection percentages by aging category. At December 31, 20042005 and December 31, 2003, $592004, $45 million and $85$59 million, respectively, of such allowances had been recorded of which $52$42 million and $77$52 million, respectively, had been recorded as a reduction to accounts receivable, net. Additionally, at December 31, 20042005 and December 31, 2003,2004, approximately $7$3 million and $8$7 million, respectively, had been recorded as an allowance for bill adjustments and uncollectible accounts in accounts payable and other current liabilities because they relate to the $650 million and $625 million of outstanding undivided interests held by investors at December 31, 2004 and 2003, respectively.investors. During each of the years ended December 31, 20042005 and 2003,2004, $8 million and $7 million, respectively, of accounts receivable were written off.
The investors in the master trust have no recourse toagainst BNSF Railway’s other assets except for customary warranty and indemnity claims. Creditors of BNSF Railway have no recourse to the assets of the master trust or SFRC unless and until all claims of their respective creditors have been paid. The A/R sales program includes provisions that, if triggered, allow the investors participating in this program, at their option, to cancel the program. At December 31, 2004,2005, BNSF Railway wasis in compliance with these provisions.
7. Property and Equipment, Net
Property and equipment, net (in millions), and the weighted average annual depreciation rates (%) were as follows:
December 31, | 2004 | 2003 | 2004 Depreciation Rates | 2005 | 2004 | 2005 Depreciation Rates | ||||||||||||||||
Land | $ | 1,554 | $ | 1,519 | — | % | $ | 1,649 | $ | 1,554 | — | % | ||||||||||
Track structure | 14,427 | 13,818 | 3.4 | 15,631 | 14,427 | 3.4 | ||||||||||||||||
Other roadway | 10,670 | 10,199 | 2.5 | 10,671 | 10,670 | 2.5 | ||||||||||||||||
Locomotives | 3,492 | 3,468 | 4.9 | 3,412 | 3,492 | 4.9 | ||||||||||||||||
Freight cars and other equipment | 1,807 | 1,757 | 4.8 | 1,949 | 1,807 | 4.9 | ||||||||||||||||
Computer hardware and software | 382 | 313 | 11.8 | 449 | 382 | 13.4 | ||||||||||||||||
Total cost | 32,332 | 31,074 | 33,761 | 32,332 | ||||||||||||||||||
Less accumulated depreciation and amortization | (6,518 | ) | (6,006 | ) | (7,210 | ) | (6,518 | ) | ||||||||||||||
Property and equipment, net | $ | 25,814 | $ | 25,068 | $ | 26,551 | $ | 25,814 | ||||||||||||||
The Consolidated Balance Sheets at December 31, 2005 and 2004, included $1,000 million, net of $372 million of amortization, and 2003, included $978 million, net of $332 million of amortization, and $940 million, net of $281 million of amortization, respectively, for property and equipment under capital leases, primarily for locomotives.
The Company capitalized $13 million, $10 million $9 million, and $13$9 million of interest for the years ended December 31, 2005, 2004 and 2003, and 2002, respectively.
SAN JACINTO RAIL LIMITED PARTNERSHIP
As described in Note 2 of the Consolidated Financial Statements, the original purpose of the San Jacinto Rail Limited Partnership was to construct and BNSF to operate a 13-mile rail line to service several chemical and plastics manufacturing facilities in the Houston, Texas area. In the fourth quarter of 2004, BNSF reached an agreement with another carrier for an alternative means of access to the facilities by using the other railroad’s existing line. As consideration for the trackage rights and alternative access rights, BNSF agreed to compensate the other railroad, in lieu of rent, by a combination of cash and waiver of certain payment obligations of the other carrier for future payments related to prospective capital projects to be performed on jointly-operated facilities of BNSF and the other carrier. In January 2005, upon implementation of the terms of this agreement, the Company recorded an intangible asset of $92 million for the trackage rights, amortization of which is estimated to be approximately $3 million per year. In February 2005, the Surface Transportation Board announced its approval of the alternative access by means of trackage rights over the other carrier’s existing lines.
The current fair market value of San Jacinto’s assets, including land, iswas approximately $4 million, determined based on comparable sales and existing property listing information on other properties located near the subject properties. As a result of a plan to sell these assets, in 2005, the Company recorded a pre-tax impairment charge of $24 million in materials and other expense, which reduced net income by $15 million or $0.04 per share for 2004. Additionally, the short-term debt that was recorded upon consolidation was repaid during the fourth quarter.quarter of 2004.
8. Accounts Payable and Other Current Liabilities
Accounts payable and other current liabilities consisted of the following (in millions):
December 31, | 2004 | 2003 | 2005 | 2004 | ||||||||
Compensation and benefits payable | $ | 545 | $ | 448 | $ | 596 | $ | 545 | ||||
Customer incentives | 297 | 281 | ||||||||||
Accounts payable | 278 | 234 | ||||||||||
Casualty and environmental liabilities | 248 | 250 | 240 | 248 | ||||||||
Accounts payable | 234 | 222 | ||||||||||
Income tax liabilities | 232 | 79 | ||||||||||
Rents and leases | 210 | 161 | ||||||||||
Property tax liabilities | 134 | 132 | 126 | 134 | ||||||||
Income tax liabilities | 79 | 3 | ||||||||||
Customer incentives | 141 | 107 | ||||||||||
Rents and leases | 161 | 121 | ||||||||||
Equipment purchases | 6 | 114 | ||||||||||
Accrued interest | 99 | 111 | 115 | 99 | ||||||||
Employee separation costs | 30 | 35 | ||||||||||
Dividends payable | 75 | 64 | ||||||||||
Other | 574 | 567 | 604 | 406 | ||||||||
Total | $ | 2,251 | $ | 2,110 | $ | 2,773 | $ | 2,251 | ||||
9. Debt
Debt outstanding was as follows (in millions):
December 31, | 2004 | 2003 | 2005 | 2004 | ||||||||||||
Notes and debentures, weighted average rate of 6.2 percent, due 2005 to 2097 | $ | 4,909 | $ | 4,790 | ||||||||||||
Equipment obligations, weighted average rate of 7.0 percent, due 2005 to 2016 | 476 | 537 | ||||||||||||||
Capitalized lease obligations, weighted average rate of 7.5 percent, due 2005 to 2023 | 632 | 612 | ||||||||||||||
Notes and debentures, weighted average rate of 6.7 percent, due 2006 to 2097 | $ | 5,077 | $ | 4,909 | ||||||||||||
Equipment obligations, weighted average rate of 6.8 percent, due 2006 to 2016 | 413 | 476 | ||||||||||||||
Capitalized lease obligations, weighted average rate of 7.3 percent, due 2006 to 2023 | 604 | 632 | ||||||||||||||
Mortgage bonds, weighted average rate of 8.3 percent, due 2006 to 2047 | 388 | 391 | 384 | 388 | ||||||||||||
Financing obligations, weighted average rate of 6.3 percent, due 2012 to 2028 | 153 | 153 | 153 | 153 | ||||||||||||
Commercial paper | — | 242 | ||||||||||||||
Commercial paper, weighted average rate of 4.3 percent | 563 | — | ||||||||||||||
Unamortized discount and other, net | (42 | ) | (41 | ) | (40 | ) | (42 | ) | ||||||||
Total | 6,516 | 6,684 | 7,154 | 6,516 | ||||||||||||
Less current portion of long-term debt | (465 | ) | (244 | ) | (456 | ) | (465 | ) | ||||||||
Long-term debt | $ | 6,051 | $ | 6,440 | $ | 6,698 | $ | 6,051 | ||||||||
Notes and debentures include increases related toa fair value adjustmentsadjustment decrease for hedges of $31less than $1 million and $59an increase of $31 million at December 31, 20042005 and 2003,2004, respectively.
Certain BNSF Railway properties and other assets are subject to liens securing $388$384 million of mortgage debt. Certain locomotives and rolling stock of BNSF Railway are subject to equipment obligations and capital leases.
The following tables provide fair value information for the Company’s debt obligations including principal cash flows and related weighted average interest rates by contractual maturity dates. Weighted average variable rates are based on implied forward rates in the yield curve at December 31, 2004. The fair values presented2005.
| December 31, 2005 | ||||||||||||||||||||||||||||||||||
| Maturity Date | Total including capital leases | Total excluding capital leases | Fair value excluding capital leases | |||||||||||||||||||||||||||||||
| 2006 | 2007 | 2008 | 2009 | 2010 | Thereafter | |||||||||||||||||||||||||||||
Fixed-rate debt (in millions) | $ | 456 | $ | 164 | $ | 161 | $ | 135 | $ | 149 | $ | 4,777 | $ | 5,842 | $ | 5,238 | $ | 5,843 | ||||||||||||||||
Average interest rate | 8.6 | % | 7.9 | % | 7.6 | % | 7.4 | % | 7.2 | % | 6.7 | % | 6.9 | % | ||||||||||||||||||||
Variable-rate debt (in millions) | $ | — | $ | 301 | $ | — | $ | 205 | $ | 806 | $ | — | $ | 1,312 | $ | 1,312 | $ | 1,352 | ||||||||||||||||
Average interest rate | — | % | 7.3 | % | — | 5.2 | % | 5.3 | % | — | % | 5.8 | % | |||||||||||||||||||||
BNSF has included maturities of $563 million of commercial paper in the tables do not include the fair value of the swaps and treasury locks.2010 column above.
| December 31, 2004 | December 31, 2004 | |||||||||||||||||||||||||||||||||||||||||||||||||||||||||||||||||||
| Maturity Date | Total including capital leases | Total excluding capital leases | Fair value excluding capital leases | Maturity Date | Total including capital leases | Total excluding capital leases | Fair value excluding capital leases | |||||||||||||||||||||||||||||||||||||||||||||||||||||||||||||
| 2005 | 2006 | 2007 | 2008 | 2009 | Thereafter | 2005 | 2006 | 2007 | 2008 | 2009 | Thereafter | |||||||||||||||||||||||||||||||||||||||||||||||||||||||||
Fixed-rate debt (in millions) | $ | 160 | $ | 448 | $ | 151 | $ | 150 | $ | 123 | $ | 4,404 | $ | 5,436 | $ | 4,804 | $ | 5,455 | $ | 160 | $ | 448 | $ | 151 | $ | 150 | $ | 123 | $ | 4,404 | $ | 5,436 | $ | 4,804 | $ | 5,455 | ||||||||||||||||||||||||||||||||
Average interest rate | 7.8 | % | 8.7 | % | 8.0 | % | 7.8 | % | 7.5 | % | 6.7 | % | 7.0 | % | 7.8 | % | 8.7 | % | 8.0 | % | 7.8 | % | 7.5 | % | 6.7 | % | 7.0 | % | ||||||||||||||||||||||||||||||||||||||||
Variable-rate debt (in millions) | $ | 305 | $ | — | $ | 311 | $ | — | $ | 214 | $ | 250 | $ | 1,080 | $ | 1,080 | $ | 1,173 | $ | 305 | $ | — | $ | 311 | $ | — | $ | 214 | $ | 250 | $ | 1,080 | $ | 1,080 | $ | 1,173 | ||||||||||||||||||||||||||||||||
Average interest rate | 4.5 | % | — | 6.0 | % | — | 4.3 | % | 7.0 | % | 5.5 | % | 4.5 | % | — | 6.0 | % | — | 4.3 | % | 7.0 | % | 5.5 | % | ||||||||||||||||||||||||||||||||||||||||||||
| December 31, 2003 | ||||||||||||||||||||||||||||||||||||||||||||||||||||||||||||||||||||
| Maturity Date | Total including capital leases | Total excluding capital leases | Fair value excluding capital leases | |||||||||||||||||||||||||||||||||||||||||||||||||||||||||||||||||
| 2004 | 2005 | 2006 | 2007 | 2008 | Thereafter | |||||||||||||||||||||||||||||||||||||||||||||||||||||||||||||||
Fixed-rate debt (in millions) | $ | 142 | $ | 146 | $ | 432 | $ | 135 | $ | 135 | $ | 4,493 | $ | 5,483 | $ | 4,871 | $ | 5,380 | ||||||||||||||||||||||||||||||||||||||||||||||||||
Average interest rate | 7.1 | % | 7.1 | % | 8.4 | % | 6.9 | % | 6.9 | % | 6.8 | % | 7.0 | % | ||||||||||||||||||||||||||||||||||||||||||||||||||||||
Variable-rate debt (in millions) | $ | 102 | $ | 316 | $ | — | $ | 322 | $ | 242 | $ | 219 | $ | 1,201 | $ | 1,201 | $ | 1,276 | ||||||||||||||||||||||||||||||||||||||||||||||||||
Average interest rate | 5.6 | % | 3.6 | % | — | 5.5 | % | 3.5 | % | 4.3 | % | 4.4 | % | |||||||||||||||||||||||||||||||||||||||||||||||||||||||
In the two tables above, maturities in 2008 exclude $200 million of 7.29 percent debentures which mature in 2036 but are redeemable in 2008 at the option of the debt holders. In addition, maturities in 2008 in the 2003 table above include $242 million of commercial paper.
The fair value of BNSF’s long-term debt is primarily based on quoted market prices for the same or similar issues, or on the current rates that would be offered to BNSF for debt of the same remaining maturities. Capital leases have been excluded from the calculation of fair value for both 20032004 and 2004.2005. The carrying amount of commercial paper and bank debt approximates fair value because of the short maturity of these instruments.
NOTES AND DEBENTURES
2005
In December 2005, BNSF issued $500 million of 6.613 percent junior subordinated notes due December 31, 2055. The junior subordinated notes are callable on or after January 15, 2026, at par plus accrued and unpaid interest. On January 15, 2026, if the junior subordinated notes are not called, the interest rate will change to an annual rate equal to the 3-month LIBOR rate plus 2.35%, reset quarterly. Interest payments may be deferred, at the option of the Company, on a cumulative basis for a period of up to five consecutive years; however, during this time the Company will not be permitted to declare or pay dividends on its common stock. In the event that certain financial covenants are not maintained, the Company will be required to sell common stock, the proceeds of which will be used to pay any accrued and unpaid interest. At December 31, 2005, the Company was in compliance with these covenants. Because of this structure, certain rating agencies provide a considerable degree of equity treatment for purposes of calculating various ratios and metrics. The majority of the net proceeds of the debt issuance are being used to repurchase common stock, with the remainder used for general corporate purposes.
Pursuant to existing Board authority, BNSF can issue up to an additional $1 billion of debt securities. The Company expects that it will file shelf registration statements for this additional $1 billion when it is ready to issue the debt.
2004
The Company issued $250 million of 4.88 percent notes due January 15, 2015. The net proceeds of the debt issuance were used for general corporate purposes including the repayment of outstanding commercial paper.
BNSF had $500 million of debt capacity available under its shelf registration at December 31, 2004.
2003
The Company exercised an option to call $150 million of 7.50 percent bonds due July 2023 at a price of 103.02 percent of par. Commercial paper was used to fund the call.
BNSF issued $250 million of 4.30 percent notes due July 1, 2013. The net proceeds of the debt issuance were used for general corporate purposes including the repayment of outstanding commercial paper.
2002
BNSF issued $300 million of 5.90 percent notes due July 1, 2012. The net proceeds of the debt issuance were used for general corporate purposes including the repayment of outstanding commercial paper.
MORTGAGE BONDS
2003
The Company exercised an option to call $29 million of 2.63 percent mortgage bonds issued by a predecessor company and due January 1, 2010. Cash generated from operations was used to fund the call.
COMMERCIAL PAPER
BNSF issues commercial paper from time to time that is supported by a bank revolving credit agreements.agreement. At December 31, 2004,2005, there were no bank borrowings against the revolving credit agreements.agreement. Outstanding commercial paper balances are considered as reducing the amount of borrowings available under these agreements.this agreement. In June 2004,2005, the Company extendedlet its $700 million 364-day facility expire. The Company amended its multi-year facility to increase the facility size to $1.2 billion and to extend the expiration date of the Company’s $700 million short-term facility to June 2005. The Company has the ability to have any amounts then outstanding mature as late as June 2006. The Company also has a long-term facility in the amount of $500 million which expires in June 2008. In total, the bank revolving credit agreements allow borrowings of up to $1.2 billion at December 31, 2004.2010. Annual facility fees are currently 0.100 percent and 0.150 percent for the short-term and long-term facilities, respectively. Both rates arefacility. This rate is subject to change based upon changes in BNSF’s senior unsecured debt ratings. Borrowing rates are based upon: (i) LIBOR plus a spread determined by BNSF’s senior unsecured debt ratings, (ii) money market rates offered at the option of the lenders, or (iii) an alternate base rate. The Company classifies commercial paper as long-term to the extent of its borrowing capacity under these facilities.the facility. BNSF must maintain compliance with certain financial covenants under its revolving credit agreements.agreement. At December 31, 2004,2005, the Company was in compliance.compliance with these covenants.
Commercial paper outstanding of $891 million as of December 31, 2004, is2005, includes $328 million issued to a consolidated subsidiary of BNSF and is eliminated upon consolidation. However, theThe maturity value of commercial paper as of December 31, 2004,2005, of $311$891 million, reduces the total capacity available under the revolving credit agreements to approximately $889$309 million.
FINANCING OBLIGATIONS
2002
The Company constructed an intermodal facility built by a third party real estate developer and entered into an agreement to lease the intermodal facility for 20 years from a third party lessor. Under accounting guidance, the Company was considered the owner of the facility during the construction period. The transaction was evaluated and it was determined that sale-leaseback accounting did not apply due to the existence of a purchase option. Accordingly, the transaction was treated as a financing for which the Company recorded an asset in property and equipment, net and a liability in long-term debt and commercial paper of $138 million that represented the fair market value at lease inception.
GUARANTEES
Debt and other obligations of non-consolidated entities guaranteed by the Company as of December 31, 20042005 are as follows (dollars in millions):
| Guarantees | Capitalized | Guarantees | ||||||||||||||||||||||||||||||||
| BNSF Ownership Percentage | Principal Amount Guaranteed | Maximum Future Payments | Maximum Recourse Amounta | Remaining Term (in years) | BNSF Ownership Percentage | Principal Amount Guaranteed | Maximum Future Payments | Maximum Recourse Amounta | Remaining Term (in years) | Capitalized Obligations b | ||||||||||||||||||||||||
Kinder Morgan Energy Partners, L.P. | 0.5 | % | $ | 190 | $ | 190 | $ | — | Termination of Ownership | — | 0.5 | % | $ | 190 | $ | 190 | $ | — | Termination of Ownership | $ | — | |||||||||||||
Kansas City Terminal Intermodal Transportation Corporation | 0.0 | % | $ | 65 | $ | 104 | $ | 104 | 14 | $ | 37 | 0.0 | % | $ | 62 | $ | 96 | $ | 96 | 13 | $ | 34 | ||||||||||||
Westside Intermodal Transportation Corporation | 0.0 | % | $ | 45 | $ | 73 | $ | — | 19 | $ | 39 | 0.0 | % | $ | 43 | $ | 69 | $ | — | 18 | $ | 36 | ||||||||||||
The Unified Government of Wyandotte County/Kansas City, Kansas | 0.0 | % | $ | 14 | $ | 23 | $ | — | 19 | $ | 12 | 0.0 | % | $ | 14 | $ | 21 | $ | — | 18 | $ | 11 | ||||||||||||
Various lessors (Residual value guarantees) | 0.0 | % | N/A | $ | 298 | $ | 298 | Various | $ | — | 0.0 | % | N/A | $ | 298 | $ | 298 | Various | $ | 68c | ||||||||||||||
All other | 0.0 | % | $ | 10 | $ | 11 | $ | 5 | Various | $ | — | 0.0 | % | $ | 8 | $ | 9 | $ | 4 | Various | $ | — | ||||||||||||
| a | Reflects the maximum amount the Company could recover from a third party other than the counterparty. |
| b | Reflects capitalized obligations that are recorded on the Company’s Consolidated Balance Sheets. |
| c | Reflects the FIN 45 asset and corresponding liability for the fair value of the residual value guarantees on the Company’s Consolidated Balance Sheet. |
KINDER MORGAN ENERGY PARTNERS, L.P.
Santa Fe Pacific Pipelines, IncInc. (SFPP), an indirect, wholly-ownedwholly owned subsidiary of BNSF, has a guarantee in connection with its remaining special limited partnership interest in SFPP, L.P., a subsidiary of Kinder Morgan Energy Partners, L.P. to be paid only upon default by the partnership. All obligations with respect to the guarantee will cease upon termination of ownership rights which would occur upon a put notice issued by BNSF or the exercise of the call rights by the general partners of SFPP, L.P.
KANSAS CITY TERMINAL INTERMODAL TRANSPORTATION CORPORATION
BNSF Railway and another major railroad jointly and severally guarantee $65$62 million of debt of Kansas City Terminal Intermodal Transportation Corporation, the proceeds of which were used to finance construction of a double track grade separation bridge in Kansas City, Missouri, which is operated and used by Kansas City Terminal Railway Company (KCTRC). BNSF has a 25 percent ownership in KCTRC, and accounts for its interest using the equity method of accounting.accounting, and will be required to fund a portion of the remaining obligation upon default by the original debtor.
WESTSIDE INTERMODAL TRANSPORTATION CORPORATION AND THE UNIFIED GOVERNMENT OF WYANDOTTE COUNTY/KANSAS CITY, KANSAS
BNSF Railway has guaranteed $59$57 million of debt, the proceeds of which were used to finance construction of a bridge that connects BNSF Railway’s Argentine Yard in Kansas City, Kansas, with the KCTRC mainline tracks in Kansas City, Missouri. The bridge is operated by KCTRC.KCTRC, and payments related to BNSF’s guarantee of this obligation will only be called for upon default by the original debtor.
RESIDUAL VALUE GUARANTEES (RVG)
In the normal course of business, the Company enters into leases in which it guarantees the residual value of certain leased equipment. Some of these leases have renewal or purchase options, or both, that the Company may exercise at the end of the lease term. If the Company elects not to exercise these options, it may be required to pay the lessor an amount not exceeding the RVG. The amount of any payment is contingent upon the actual residual value of the leased equipment. Some of these leases also require the lessor to pay the Company any surplus in the actual residual value of the leased equipment over the RVG. These guarantees will expire between 20052006 and 2011.
The maximum future payments, as disclosed in the Guarantees table above, represent the undiscounted maximum amount that BNSF could be required to pay in the event the Company did not exercise its renewal option and the fair market value of the equipment was zero.had significantly declined. BNSF does not anticipate such a large reduction in the fair market value of the leased equipment. As of December 31, 2004,2005, the Company has recorded a $68 million asset and corresponding liability for the fair value of the RVGs. This amount includes a $21 million asset and corresponding liability related to locomotives financed during the fourth quarter of 2004.
ALL OTHER
As of December 31, 2004,2005, BNSF Railway guarantees $10$8 million of other debt and leases. BNSF holds a performance bond and has the option to sub-lease property to recover up to $5$4 million of the $10$8 million of guarantees. These guarantees expire between 20052006 and 2014.
Other than as discussed above, there is no collateral held by a third party which the Company could obtain and liquidate to recover any amounts paid under the above guarantees.
Other than as discussed above, none of the guarantees are recorded in the Consolidated Financial Statements of the Company. The Company does not expect performance under these guarantees to have a material effect on the Company in the foreseeable future.
INDEMNITIES
In the ordinary course of business, BNSF enters into agreements with third parties that include indemnification clauses. In general, these clauses are customary for the types of agreements in which they are included. At times, these clauses may involve indemnification for the acts of the Company, its employees and agents, indemnification for another party’s acts, indemnification for future events, indemnification based upon a certain standard of performance, indemnification for liabilities arising out of the Company’s use of leased equipment or other property, or other types of indemnification. Due to the uncertainty of whether events which would trigger the indemnification obligations would ever occur, the Company does not believe that these indemnity agreements will have a material adverse effect on the Company’s results of operations, financial position or liquidity. Additionally, the Company believes that due to lack of historical payment experience, the fair value of indemnities cannot be estimated with any amount of certainty and that the fair value of any such amount would be immaterial to the financial statements. Accordingly, no fair value liability related to indemnities has been recorded in the financial statements.
10. Commitments and Contingencies
LEASE COMMITMENTS
BNSF has substantial lease commitments for locomotives, freight cars, trailers and containers, office buildings and other property, and many of these leases provide the option to purchase the leased item at fair market value at the end of the lease. However, some provide fixed price purchase options. Future minimum lease payments (which reflect leases having non-cancelable lease terms in excess of one year) as of December 31, 2004,2005 are summarized as follows (in millions):
December 31, | Capital Leases | Operating Leases | Capital Leases | Operating Leasesa | ||||||||||
2005 | $ | 134 | $ | 492 | ||||||||||
2006 | 133 | 454 | $ | 145 | $ | 461 | ||||||||
2007 | 120 | 407 | 135 | 536 | ||||||||||
2008 | 109 | 398 | 123 | 495 | ||||||||||
2009 | 82 | 381 | 95 | 461 | ||||||||||
2010 | 61 | 436 | ||||||||||||
Thereafter | 199 | 3,280 | 161 | 3,754 | ||||||||||
Total | 777 | $ | 5,412 | 720 | $ | 6,143 | ||||||||
Less amount representing interest | (145 | ) | (116 | ) | ||||||||||
Present value of minimum lease payments | $ | 632 | $ | 604 | ||||||||||
| a | Excludes leases having non-cancelable lease terms of less than one year and per diem leases. |
Lease rental expense for all operating leases was $565 million, $496 million $462 million and $448$462 million for the years ended December 31, 2005, 2004 2003 and 2002,2003, respectively. Contingent rentals and sublease rentals were not significant.
OTHER COMMITMENTS
In the normal course of business, the Company enters into long-term contractual requirements for future goods and services needed for the operations of the business. Such commitments are not in excess of expected requirements and are not reasonably likely to result in performance penalties or payments that would have a material adverse effect on the Company’s liquidity.
PERSONAL INJURY AND ENVIRONMENTAL COSTS
CHARGE FOR ASBESTOS AND ENVIRONMENTAL COSTS
During 2004, BNSF recorded a $465 million pre-tax charge to reflect changes in its estimate of unasserted asbestos liabilities and environmental liabilities. Of this amount, $293 million and $172 million were related to unasserted asbestos and environmental liabilities, respectively. The $465 million pre-tax charge was recorded in materials and other expense and reduced net income by $288 million, or $0.77 per share during 2004.
PERSONAL INJURY
Personal injury claims, including asbestos claims and employee work-related injuries asbestos claims and third party injuries (collectively, other personal injury), are a significant expense for the railroad industry. Personal injury claims by BNSF Railway employees are subject to the provisions of the Federal Employers’ Liability Act (FELA) rather than state workers’ compensation laws. FELA’s system of requiring the finding of fault, coupled with unscheduled awards and reliance on the jury system, contributed to increased expenses in past years. Other proceedings include claims by non-employees for punitive as well as compensatory damages. A few proceedings purport to be class actions. The variability present in settling these claims, including non-employee personal injury and matters in which punitive damages are alleged, could result in increased expenses in future years. BNSF has implemented a number of safety programs designed to reduce the number of personal injuries as well as the associated claims and personal injury expense.
BNSF records a liability for personal injury claims when the expected loss is both probable and reasonably estimable. The liability and ultimate expense projections are estimated using standard actuarial methodologies. Liabilities recorded for unasserted personal injury claims are based on information currently available. Due to the inherent uncertainty involved in projecting future events such as the number of claims filed each year, developments in judicial and legislative standards, and the average costs to settle projected claims, actual costs may differ from amounts recorded.
ASBESTOS
The Company is party to a number of personal injury claims by employees and non-employees who worked aroundmay have been exposed to asbestos. The heaviest exposure for BNSF employees was due to work conducted in and around the use of steam locomotive engines that were phased out between the years of 1950 and 1967. However, other types of exposures, including exposure from locomotive component parts and building materials, continued after 1967, until it was substantially eliminated by 1985.
Prior to 2000, claim filings against the Company for asbestos were not numerous and were sporadic. Accordingly, while the Company had concluded that a probable loss had occurred, it did not believe it could estimate the range of reasonably possible loss because of the lack of experience with such claims and the lack of detailed employment records for the population of exposed employees. The Company believed, however, that the low end of the range of reasonably possible loss, as that term is used in FASB Interpretation No. 14 (FIN 14),Reasonable Estimation of the Amount of a Loss, was immaterial. Subsequent to this period, claim filings increased and, when they continued into 2004, the Company concluded that the low end of the range of reasonably possible loss would be material and that an estimate for unasserted asbestos exposure liability needed to be recorded. BNSF then engaged a third party with extensive experience in performing asbestos studies to assist in assessing the unasserted liability exposure. The objective of the assessment was to determine the number of estimated unasserted asbestos claims and the estimated average cost per claim. The Company, with the assistance of the third party, first determined its exposed population from which it was able to derive the estimated number of unasserted claims. The estimated average cost per claim was then determined utilizing recent actual average cost per claim data.
Based on the assessment, the Company recorded an undiscounted $293 million pre-tax charge for unasserted asbestos claims.claims in the third quarter of 2004. The $293 million pre-tax charge was recorded in materials and other expense and reduced net income by $182 million, or $0.49 per share, for the year ended December 31, 2004.
BNSF anticipates obtaining annual updatesDuring the third quarter of 2005, the study.Company obtained an update of this study which concluded that the original September 2004 study continues to represent a reasonable estimate of BNSF’s future asbestos exposure. Therefore, management recorded no additional expense as a result of this update. The Company plans to update the study in the third quarter of 2006. On a quarterly basis, BNSF will monitormonitors actual experience against the number of forecasted claims to be received and expected claim payments. Adjustments to the Company’s estimates will be recorded quarterly ifwhen necessary. More periodic updates to the study will occur if trends necessitate a change.
The following table summarizes the activity in the Company’s accrued obligations for both asserted and unasserted asbestos matters (in millions):
| 2004 | 2003 | 2002 | 2005 | 2004 | 2003 | |||||||||||||||||||
Beginning balance | $ | 60 | $ | 55 | $ | 41 | $ | 345 | $ | 60 | $ | 55 | ||||||||||||
Accruals | 308 | 25 | 31 | — | 308 | 25 | ||||||||||||||||||
Payments | (23 | ) | (20 | ) | (17 | ) | (19 | ) | (23 | ) | (20 | ) | ||||||||||||
Ending balance at December 31, | $ | 345 | $ | 60 | $ | 55 | $ | 326 | $ | 345 | $ | 60 | ||||||||||||
Of the obligations at December 31, 2004, obligation, $2922005, $266 million is related to unasserted claims while $53and $60 million is related to asserted claims. At both December 31, 2005 and 2004, $21 and 2003, $18 million isare included in current liabilities.liabilities, respectively. The recorded liability wasis not discounted. In addition, defense and processing costs, which are recorded on an as-reported basis, are not included in the recorded liability. The Company is presently self-insured for asbestos-related claims.
The following table summarizes information regarding onlythe number of asserted asbestos claims filed against BNSF:
| 2004 | 2003 | 2005 | 2004 | |||||||||
Claims unresolved at January 1, | 1,985 | 1,719 | 1,926 | 1,985 | ||||||||
Claims filed | 712 | 1,023 | 835 | 712 | ||||||||
Claims settled, dismissed or otherwise resolved | (771 | ) | (757 | ) | (640 | ) | (771 | ) | ||||
Claims unresolved at December 31, | 1,926 | 1,985 | 2,121 | 1,926 | ||||||||
Based on BNSF’s estimate of the potentially exposed employees and related mortality assumptions, it is anticipated that unasserted claims will continue to be filed through the year 2050. The Company recorded an amount for the full estimated filing period through 2050 because it had a relatively finite exposed population (former and current employees hired prior to 1985) which it was able to identify and reasonably estimate and about which it had obtained reliable demographic data (including age, hire date and occupation) derived from industry or BNSF specific data that was the basis for the study. BNSF projects that approximately 50, 70, and 90 percent of the future unasserted asbestos claims will be incurred within the next 10, 15, and 25 years, respectively.
Because of the uncertainty surrounding the factors used in the study, it is reasonably possible that future costs to settle asbestos claims may range from approximately $250$225 million to $450$425 million. However, BNSF believes that the $345$326 million recorded at December 31, 2005, is the best estimate of the Company’s future obligation for the settlement of asbestos claims.
The amounts recorded by BNSF for the asbestos-related liability were based upon currently known facts. Projecting futureFuture events, such as the number of new claims to be filed each year, the average cost of disposing of claims, as well as the numerous uncertainties surrounding asbestos litigation in the United States, could cause the actual costs to be higher or lower than projected.
While the final outcome of asbestos-related matters cannot be predicted with certainty, considering among other things the meritorious legal defenses available and liabilities that have been recorded, it is the opinion of BNSF that none of these items, when finally resolved, will have a material adverse effect on the Company’s financial position or liquidity. However, should a number of these items occur in the same period, it could have a material adverse effect on the results of operations in a particular quarter or fiscal year.
OTHER PERSONAL INJURY
BNSF uses a third party actuary to assist the Company in estimating its other personal injury liability claims and expense. These estimates are based on the covered population, activity levels and trends in frequency, and the costs of covered injuries. These actuarial estimates include unasserted claims except for certain repetitive stress and other occupational trauma claims that result from prolonged repeated events or exposure. Such claims are estimated on an as-reported basis because, while the Company has concluded that a probable loss has occurred, it cannot estimate the range of reasonably possible loss due to other contributing causes of such injuries and the fact that continued exposure is required for the potential injury to manifest itself as a claim. The Company believes that the low end of the range of reasonably possible loss, as that term is used in FASB Interpretation No.FIN 14, (FIN 14),Reasonable Estimation of the Amount of a Loss,is immaterial.
BNSF obtains quarterly actuarial updates for other personal injury liabilities and monitors actual experience against the number of forecasted claims to be received, the forecasted number of claims closing with payment and expected claims payments. Adjustments to the Company’s estimates are recorded quarterly as necessary or more frequently as new events or revised estimates develop.
The following table summarizes the activity in the Company’s accrued obligations for other personal injury matters (in millions):
| 2004 | 2003 | 2002 | 2005 | 2004 | 2003 | |||||||||||||||||||
Beginning balance | $ | 453 | $ | 441 | $ | 417 | $ | 459 | $ | 453 | $ | 441 | ||||||||||||
Accruals | 194 | 190 | 197 | 181 | 194 | 190 | ||||||||||||||||||
Payments | (188 | ) | (178 | ) | (173 | ) | (218 | ) | (188 | ) | (178 | ) | ||||||||||||
Ending balance at December 31, | $ | 459 | $ | 453 | $ | 441 | $ | 422 | $ | 459 | $ | 453 | ||||||||||||
At December 31, 2005 and 2004, $164 million and 2003, $170 million and $182 million wereare included in current liabilities, respectively. BNSF’s liabilities for other personal injury claims are undiscounted. In addition, defense and processing costs, which are recorded on an as-reported basis, are not included in the recorded liability. The Company is substantially self-insured for other personal injury claims.
The following table summarizes information regarding the number of personal injury claims, other than asbestos, filed against BNSF:
| 2004 | 2003 | 2005 | 2004 | |||||||||
Claims unresolved at January 1, | 4,393 | 4,669 | 4,116 | 4,393 | ||||||||
Claims filed | 3,632 | 3,779 | 3,758 | 3,632 | ||||||||
Claims settled, dismissed or otherwise resolved | (3,909 | ) | (4,055 | ) | (4,257 | ) | (3,909 | ) | ||||
Claims unresolved at December 31, | 4,116 | 4,393 | 3,617 | 4,116 | ||||||||
Because of the uncertainty surrounding the ultimate outcome of other personal injury claims, it is reasonably possible that future costs to settle other personal injury claims may range from approximately $400$375 million to $550$525 million. However, BNSF believes that the $459$422 million recorded at December 31, 2005, is the best estimate of the Company’s future obligation for the settlement of other personal injury claims.
The amounts recorded by BNSF for other personal injury claims were based upon currently known facts. Future events, such as the number of new claims to be filed each year, the average cost of disposing of claims, as well as the numerous uncertainties surrounding personal injury litigation in the United States, could cause the actual costs to be higher or lower than projected.
While the final outcome of these other personal injury matters cannot be predicted with certainty, considering among other things the meritorious legal defenses available and liabilities that have been recorded, it is the opinion of BNSF that none of these items, when finally resolved, will have a material adverse effect on the Company’s financial position or liquidity. However, should a number of these items occur in the same period, it could have a material adverse effect on the results of operations in a particular quarter or fiscal year.
BNSF INSURANCE COMPANY
The Company has a consolidated, wholly owned subsidiary, Burlington Northern Santa Fe Insurance Company LTD. (BNSF IC) that provides insurance coverage for certain risks incurred after April 1, 1998, FELA claims, railroad protective and force account insurance claims incurred after January 1, 2002, and certain other claims which are subject to reinsurance. During the first quarter ofBeginning in 2004, BNSF IC entered into aannual reinsurance pooling agreementagreements with several other companies. The pool insurespooling agreements insure workers compensation, general liability, auto liability, and FELA risk. In accordance with the agreement,agreements, BNSF IC cedes a portion of its FELA exposure to the pool and assumes a proportionate share of the entire pool’s risk. The pooling agreement is subjectEach year BNSF IC reviews the objectives and performance of the pool to annual renewal.determine its continued participation in the pool. At December 31, 2004,2005, BNSF IC had invested in commercial paper issued by BNSF and third party time deposits and money market accounts.
ENVIRONMENTAL
The Company’s operations, as well as those of its competitors, are subject to extensive federal, state and local environmental regulation. BNSF’s operating procedures include practices to protect the environment from the risks inherent in railroad operations, which frequently involve transporting chemicals and other hazardous materials. Additionally, many of BNSF’s land holdings are and have been used for industrial or transportation-related purposes or leased to commercial or industrial companies whose activities may have resulted in discharges onto the property. As a result, BNSF is subject to environmental cleanup and enforcement actions. In particular, the Federal Comprehensive Environmental Response, Compensation and Liability Act of 1980 (CERCLA), also known as the Superfund law, as well as similar state laws generally impose joint and several liability for cleanup and enforcement costs on current and former owners and operators of a site without regard to fault or the legality of the original conduct. BNSF has been notified that it is a potentially responsible party (PRP) for study and cleanup costs at Superfund sites for which investigation and remediation payments are or will be made or are yet to be determined (the Superfund sites) and, in many instances, is one of several PRPs. In addition, BNSF may be considered a PRP under certain other laws. Accordingly, under CERCLA and other federal and state statutes, BNSF may be held jointly and severally liable for all environmental costs associated with a particular site. If there are other PRPs, BNSF generally participates in the cleanup of these sites through cost-sharing agreements with terms that vary from site to site. Costs are typically allocated based on such factors as relative volumetric contribution of material, the amount of time the site was owned or operated, and/or the portion of the total site owned or operated by each PRP.
Liabilities for environmental cleanup costs are recorded when BNSF’s liability for environmental cleanup is both probable and a reasonable estimate of associated loss can be made.reasonably estimable. Subsequent adjustments to initial estimates are recorded as necessary based upon additional information developed in subsequent periods. Environmental costs include initial site surveys and environmental studies as well as costs for remediation of sites determined to be contaminated.
During the first half of 2004, the Company experienced a significant increase in expense relating to environmental remediation developments at known sites for which the majority of the contamination occurred decades ago. Because of these and other developments, in recent periods, the Company performed an assessment in 2004 to determine if it was feasible to better estimate developments at its known sites. The Company determined that a third party actuary had proprietary data that included information from the EPAEnvironmental Protection Agency (EPA) and other governmental agencies as well as information accumulated from public sources and work performed for other clients. Because of its determination that a better estimate of future developmentsdevelopment could be made with this data, BNSF engaged this third party actuary, which has an extensive background in performing various studies for large companies, including environmental matters, to assist BNSF in determining itsthe Company’s potential future environmental exposure at known sites. As a result of this study, the Company revised its estimate of its probable environmental losses and its accrued liabilities.
Consequently, during the third quarter of 2004, BNSF recorded an undiscounted $172 million pre-tax charge related to its change in estimated environmental liabilities on a site by site basis. The $172 million pre-tax charge was recorded in materials and other expense and reduced net income by $106 million, or $0.28 per share, for 2004. The charge doesdid not include (i) contaminated sites of which the Company is not aware, andor (ii) additional amounts for third party claims, which arise out of contaminants allegedly migrating from BNSF property, due to a limited number of sites. BNSF continues to estimate third party claims on a site by site basis when the liability for such claims is probable and a reasonable estimate of associated loss can be made.reasonably estimable. BNSF’s recorded liability for third party claims as of December 31, 20042005 is approximately $25$24 million.
During the third quarter of 2005, the Company obtained an update of this study. Based on the results of the study, management recorded additional expense of approximately $12 million. The Company plans to update the study in the third quarter of 2006. On a quarterly basis, BNSF monitors actual experience against the forecasted remediation and related payments made on existing sites. Adjustments to the Company’s estimates will continue to be recorded when necessary based on developments in subsequent periods. Additionally, environmental accruals include amounts for newly identified sites or contaminants, third-party claims and legal fees incurred for defense of third-party claims and recovery efforts.
The Company’s estimate of ultimate cost for clean upcleanup efforts at its known environmental sites utilizes BNSF’s historical payment patterns, its current estimated percentage to closure ratios, and the actuary’s proprietary benchmark patterns developed from data accumulated from public sources and work performed by it for other clients, including the EPA and other governmental agencies. These factors incorporate experience gained from clean upcleanup efforts at other similar sites into the estimates for which remediation and restoration efforts are still in progress. BNSF also conducts an ongoing environmental contingency analysis, which considers a combination of factors including independent consulting reports, site visits, legal reviews and analysis of the likelihood of participation in, and the ability to pay for, cleanup of other PRPs.
BNSF anticipates obtaining annual updates of the study. On a quarterly basis, BNSF will also monitor actual experience against the forecasted remediation and related payments made on existing sites. Additionally, BNSF will continue its existing, quarterly process to monitor developments to further benchmark actuarial results. Adjustments to the Company’s estimates will continue to be recorded quarterly if necessary based upon developments in subsequent periods. More periodic updates to the study will occur if trends necessitate a change.
BNSF is involved in a number of administrative and judicial proceedings and other mandatory cleanup efforts for 384369 sites, including Superfund sites, at which it is participating in the study or cleanup, or both, of alleged environmental contamination.
The following table summarizes the activity in the Company’s accrued obligations for environmental matters (in millions):
| 2004 | 2003 | 2002 | 2005 | 2004 | 2003 | |||||||||||||||||||
Beginning balance | $ | 199 | $ | 196 | $ | 202 | $ | 385 | $ | 199 | $ | 196 | ||||||||||||
Accruals | 258 | 59 | 43 | 33 | 258 | 59 | ||||||||||||||||||
Payments | (72 | ) | (56 | ) | (49 | ) | (48 | ) | (72 | ) | (56 | ) | ||||||||||||
Ending balance at December 31, | $ | 385 | $ | 199 | $ | 196 | $ | 370 | $ | 385 | $ | 199 | ||||||||||||
At December 31, 2005 and 2004, $55 million and 2003, $60 million and $50 million wereare included in current liabilities, respectively. BNSF’s environmental liabilities are not discounted. BNSF anticipates that the majority of the accrued costs at December 31, 20042005 will be paid over the next ten years and no individual site is considered to be material.
The following table summarizes the environmental sites:
| BNSF sites | Superfund sites | BNSF sites | Superfund sites | |||||||||||||||||||||
| 2004 | 2003 | 2004 | 2003 | 2005 | 2004 | 2005 | 2004 | |||||||||||||||||
Number of sites at January 1, | 402 | 396 | 22 | 23 | 384 | 402 | 24 | 22 | ||||||||||||||||
Sites added during the period | 34 | 33 | 5 | 3 | 24 | 34 | — | 5 | ||||||||||||||||
Sites closed during the period | (52 | ) | (27 | ) | (3 | ) | (4 | ) | (39 | ) | (52 | ) | (4 | ) | (3 | ) | ||||||||
Number of sites at December 31, | 384 | 402 | 24 | 22 | 369 | 384 | 20 | 24 | ||||||||||||||||
Liabilities recorded for environmental costs represent BNSF’s best estimate of its probable future obligation for the remediation and settlement of these sites and include both asserted and unasserted claims. Unasserted claims are not a material component of the liability. Although recorded liabilities include BNSF’s best estimate of all probable costs, without reduction for anticipated recoveries from third parties, BNSF’s total cleanup costs at these sites cannot be predicted with certainty due to various factors such as the extent of corrective actions that may be required, evolving environmental laws and regulations, advances in environmental technology, the extent of other parties’ participation in cleanup efforts, developments in ongoing environmental analyses related to sites determined to be contaminated, and developments in environmental surveys and studies of contaminated sites.
Because of the uncertainty surrounding these factors, it is reasonably possible that future costs for environmental liabilities may range from approximately $300 million to $600 million. However, BNSF believes that the $385$370 million recorded at December 31, 2005, is the best estimate of the Company’s future obligation for environmental costs.
While the final outcome of these environmental matters cannot be predicted with certainty, it is the opinion of BNSF that none of these items, when finally resolved, will have a material adverse effect on the Company’s financial position or liquidity. However, an unexpected adverse resolution of one or more of these items could have a material adverse effect on the results of operations in a particular quarter or fiscal year.
OTHER CLAIMS AND LITIGATION
In addition to asbestos, other personal injury, and environmental matters discussed above, BNSF and its subsidiaries are also parties to a number of other legal actions and claims, various governmental proceedings and private civil suits arising in the ordinary course of business, including those related to disputes and complaints involving certain transportation rates and charges (including complaints seeking refunds of prior charges paid for coal transportation and the prescription of future rates for such movements). Some of the legal proceedings include claims for punitive as well as compensatory damages, and a few proceedings purport to be class actions. While the final outcome of these matters cannot be predicted with certainty, considering among other things the meritorious legal defenses available and liabilities that have been recorded along with applicable insurance, it is the opinion of BNSF that none of these items, when finally resolved, will have a material adverse effect on the Company’s financial position or liquidity. However, an unexpected adverse resolution of one or more of these items could have a material adverse effect on the results of operations in a particular quarter or fiscal year.
11. Employee Separation Costs
Employee separation costs activity was as follows (in millions):
| 2004 | 2003 | 2002 | 2005 | 2004 | 2003 | |||||||||||||||||||
Beginning balance at January 1, | $ | 179 | $ | 210 | $ | 274 | $ | 154 | $ | 179 | $ | 210 | ||||||||||||
Accruals | 8 | 15 | 1 | 8 | 8 | 12 | ||||||||||||||||||
Payments | (33 | ) | (43 | ) | (55 | ) | (30 | ) | (33 | ) | (43 | ) | ||||||||||||
Other | — | (3 | ) | (10 | ) | |||||||||||||||||||
Ending balance at December 31, | $ | 154 | $ | 179 | $ | 210 | $ | 132 | $ | 154 | $ | 179 | ||||||||||||
Employee separation liabilities of $154$132 million and $179$154 million are included in the Consolidated Balance Sheets at December 31, 20042005 and 2003,2004, respectively, and principally represent: (i) deferred benefits payable upon separation or retirement to certain active conductors, trainmen and locomotive engineers; (ii) employee-related severance costs for the consolidation of clerical functions, material handlers in mechanical shops and trainmen on reserve boards; and (iii) certain non-union employee severance costs. Employee separation expenses are recorded in materials and other in the Consolidated Statements of Income. At December 31, 2004, $302005, $25 million of the remaining liabilities are included in current liabilities for anticipated costs to be paid in 2005.2006.
CONDUCTORS, TRAINMEN AND LOCOMOTIVE ENGINEERS
Liabilities related to deferred benefits payable upon separation or retirement to certain active conductors, trainmen and locomotive engineers were $128$116 million and $144$128 million at December 31, 20042005 and 2003,2004, respectively. These costs were primarily incurred in connection with labor agreements reached prior to the consummation of the business combination of BNSF’s predecessor companies Burlington Northern, Inc. and Santa Fe Pacific Corporation (the Merger) which, among other things, reduced train crew sizes and allowed for more flexible work rules. The remaining costs will be paid between 20052006 and approximately 2024. In 2005, 2004 and 2003, the Company updated its estimates and recorded an additional liabilityliabilities of $2 million, $2 million and $3 million, respectively, related to deferred benefits.
CONSOLIDATION OF CLERICAL FUNCTIONS
Liabilities related to the consolidation of clerical functions were $15$10 million and $20$15 million at December 31, 20042005 and 2003,2004, respectively, and primarily provide for separation programs announced in July2003, 2004 and July 20032005 and severance costs associated with the clerical consolidation plan adopted in 1995 upon the Merger. During 2005, BNSF recorded other liabilities of approximately $5 million primarily related to a voluntary severance program for certain union employees. The July 2004 separation program affected approximately 40 employees and resulted in accrued severance costs of approximately $4 million. Reductions related to the July 2004 separation program were substantially completed by December 31, 2004. The July 2003 separation program resulted in accrued severance cost of approximately $12 million, affected approximately 150 employees and was substantially completed in 2003. The 1995 consolidation plan resulted in the elimination of approximately 1,500 permanent positions and was substantially completed during 1999. The liability also includes costs related to the reduction of approximately 40 and 140 material handlers in 2001 and 2000, respectively.
In 2003, and 2002, the Company recorded $1 million and $10 million, respectively, of reversals for certain liabilities associated with the consolidation of clerical functions. These reversals primarily reflect accrued payments related to workforce reductions for positions under collective bargaining agreements where the Company was able to place affected individuals in alternate positions.
OTHER EMPLOYEE SEPARATION COSTS
LiabilitiesAt December 31, 2005 and 2004, other employee separation cost liabilities of $6 million and $11 million, respectively, principally related to certain remaining non-union employee severances resulting from the fourth quarter 2001 workforce reduction and the Merger were $11 million and $15 million at December 31, 2004 and 2003, respectively.Merger. These costs will be paid over the next several years based on deferral elections made by the affected employees. In addition, BNSF recorded other liabilities of approximately $2 millionAlso included in the second quarterother separation cost accrual is an estimate for the remaining payments to be made to other union employees as a result of 2004 primarily related to a voluntary severancerelocation program initiated in 2005 for certain union employees.which a $1 million accrual was recorded. As of December 31, 2004,2005, the remaining liability balance related to this voluntary severance program was insignificant as the program was substantially complete.
During 2001,2004, the Company reduced 360 positions through severance. Duringrecorded a liability of approximately $2 million primarily related to a voluntary severance program for certain union employees. Additionally, during 2003, and 2002, the Company recorded a $2 million reduction to its liability balance and accrued additional expenses of $1 million, respectively, due to changes in certain estimates related to fourth-quarter 2001 reductions.
12. Earnings Per Share
Basic earnings per share is based on the weighted average number of common shares outstanding. Diluted earnings per share is based on basic earnings per share adjusted for the effect of potential common shares outstanding that were dilutive during the period, arising from employee stock awards and incremental shares calculated using the treasury stock method.
Weighted average stock options totaling 0.1 million, 2.0 million and 23.6 million for 2005, 2004 and 26.3 million for 2004, 2003, and 2002, respectively, were not included in the computation of diluted earnings per share, because the options’ exercise price exceeded the average market price of the Company’s stock for those periods.
13. Retirement Plans and Other Post-Employment Benefit Plans
BNSF sponsors a funded, noncontributory qualified BNSF Retirement Plan, which covers substantially all non-union employees, and an unfunded nonqualified BNSF Supplemental Retirement Plan, which covers certain officers and other employees. The benefits under these BNSFpension plans are based on years of credited service and the highest five-year averageconsecutive sixty months of compensation levels.for the last ten years of salaried employment with BNSF. BNSF’s funding policy is to contribute annually not less than the regulatory minimum and not more than the maximum amount deductible for income tax purposes with respect to the funded plan.
Certain salaried employees of BNSF that have met certain age and years of service requirements are eligible for life insurance coverage and medical benefits, and life insuranceincluding prescription drug coverage, during retirement. The retiree medical plan is contributory and provides benefits to retirees, their covered dependents and beneficiaries. Retiree contributions are adjusted annually. The plan also contains fixed deductibles, coinsurance and out-of-pocket limitations. The basic life insurance plan is noncontributory and covers retirees only. Optional life insurance coverage is available for some retirees; however, the retiree is responsible for the full cost. BNSF’s policy is to fund benefits payable under the medical and life insurance plans as they come due. EmployeesGenerally, employees beginning salaried employment with BNSF subsequent to September 22, 1995, are not eligible for medical benefits during retirement.
BNSF’s accumulated post retirement benefit obligation (APBO) and net cost recognized for other post employment benefits (OPEB) reflect the effects of the recent Medicare Prescription Drug, Improvement and Modernization Act of 2003 (Act). The provisions of the Act provide for a federal subsidy for plans that provide prescription drug benefits and meet certain qualifications.
Components of the net cost (benefit) for these plans were as follows (in millions):
| Pension Benefits | Health and Welfare Benefits | Pension Benefits | Health and Welfare Benefits | ||||||||||||||||||||||||||||||||||||||||||||
Year Ended December 31, | 2004 | 2003 | 2002 | 2004 | 2003 | 2002 | 2005 | 2004 | 2003 | 2005 | 2004 | 2003 | |||||||||||||||||||||||||||||||||||
Service cost | $ | 19 | $ | 17 | $ | 15 | $ | 3 | $ | 4 | $ | 6 | $ | 20 | $ | 19 | $ | 17 | $ | 2 | $ | 3 | $ | 4 | |||||||||||||||||||||||
Interest cost | 97 | 100 | 100 | 20 | 22 | 21 | 95 | 97 | 100 | 17 | 20 | 22 | |||||||||||||||||||||||||||||||||||
Expected return on plan assets | (113 | ) | (123 | ) | (127 | ) | — | — | — | (102 | ) | (113 | ) | (123 | ) | — | — | — | |||||||||||||||||||||||||||||
Curtailments/settlements | — | — | — | — | — | — | |||||||||||||||||||||||||||||||||||||||||
Special termination benefits | — | — | 2 | — | — | — | |||||||||||||||||||||||||||||||||||||||||
Actuarial loss | 12 | 3 | 1 | 5 | 8 | 3 | 25 | 12 | 3 | — | 5 | 8 | |||||||||||||||||||||||||||||||||||
Net amortization and deferred amounts | — | — | 2 | (4 | ) | (2 | ) | — | — | — | — | (8 | ) | (4 | ) | (2 | ) | ||||||||||||||||||||||||||||||
Net cost (benefit) recognized | $ | 15 | $ | (3 | ) | $ | (7 | ) | $ | 24 | $ | 32 | $ | 30 | $ | 38 | $ | 15 | $ | (3 | ) | $ | 11 | $ | 24 | $ | 32 | ||||||||||||||||||||
The following table shows the change in benefit obligation based on the September 30 measurement date (in millions):
| Pension Benefits | Health and Welfare Benefits | Pension Benefits | Health and Welfare Benefits | |||||||||||||||||||||||||||||
Change in Benefit Obligation | 2004 | 2003 | 2004 | 2003 | 2005 | 2004 | 2005 | 2004 | ||||||||||||||||||||||||
Benefit obligation at beginning of period | $ | 1,678 | $ | 1,611 | $ | 366 | $ | 363 | $ | 1,710 | $ | 1,678 | $ | 299 | $ | 366 | ||||||||||||||||
Service cost | 19 | 17 | 3 | 4 | 20 | 19 | 2 | 3 | ||||||||||||||||||||||||
Interest cost | 97 | 100 | 20 | 22 | 95 | 97 | 17 | 20 | ||||||||||||||||||||||||
Plan participants’ contributions | — | — | 7 | 6 | — | — | 8 | 7 | ||||||||||||||||||||||||
Amendments | — | — | (28 | ) | (9 | ) | — | — | — | (28 | ) | |||||||||||||||||||||
Actuarial loss (gain) | 41 | 75 | (39 | ) | 7 | 156 | 41 | (1 | ) | (39 | ) | |||||||||||||||||||||
Curtailments/settlements | — | — | — | — | ||||||||||||||||||||||||||||
Special termination benefits | — | — | — | — | ||||||||||||||||||||||||||||
Benefits paid | (125 | ) | (125 | ) | (30 | ) | (27 | ) | (123 | ) | (125 | ) | (30 | ) | (30 | ) | ||||||||||||||||
Benefit obligation at end of period | $ | 1,710 | $ | 1,678 | $ | 299 | $ | 366 | 1,858 | 1,710 | $ | 295 | $ | 299 | ||||||||||||||||||
Component representing future salary increases | (112 | ) | (119 | ) | (105 | ) | (112 | ) | ||||||||||||||||||||||||
Accumulated benefit obligation at end of period | $ | 1,598 | $ | 1,559 | $ | 1,753 | $ | 1,598 | ||||||||||||||||||||||||
Both the BNSF Retirement Plan and the BNSF Supplemental Retirement Plan had an accumulated benefit obligation in excess of plan assets at September 30, 20042005 and 2003.
The following table shows the change in plan assets of the plans based on the September 30 measurement date (in millions):
| Pension Benefits | Health and Welfare Benefits | Pension Benefits | Health and Welfare Benefits | |||||||||||||||||||||||||||||
Change in Plan Assets | 2004 | 2003 | 2004 | 2003 | 2005 | 2004 | 2005 | 2004 | ||||||||||||||||||||||||
Fair value of plan assets at beginning of period | $ | 1,224 | $ | 1,151 | $ | — | $ | — | $ | 1,276 | $ | 1,224 | $ | — | $ | — | ||||||||||||||||
Actual return on plan assets | 153 | 193 | — | — | 176 | 153 | — | — | ||||||||||||||||||||||||
Settlements | — | — | — | — | ||||||||||||||||||||||||||||
Employer contribution | 24 | 5 | 23 | 21 | 18 | 24 | 22 | 23 | ||||||||||||||||||||||||
Plan participants’ contributions | — | — | 7 | 6 | — | — | 8 | 7 | ||||||||||||||||||||||||
Benefits paid | (125 | ) | (125 | ) | (30 | ) | (27 | ) | (123 | ) | (125 | ) | (30 | ) | (30 | ) | ||||||||||||||||
Fair value of plan assets at end of period | $ | 1,276 | $ | 1,224 | $ | — | $ | — | $ | 1,347 | $ | 1,276 | $ | — | $ | — | ||||||||||||||||
The following table shows the reconciliation of the funded status of the plans with amounts recorded in the Consolidated Balance Sheets (in millions):
| Pension Benefits | Health and Welfare Benefits | Pension Benefits | Health and Welfare Benefits | |||||||||||||||||||||||||||||
December 31, | 2004 | 2003 | 2004 | 2003 | 2005 | 2004 | 2005 | 2004 | ||||||||||||||||||||||||
Fair value of plan assets as of September 30 | $ | 1,276 | $ | 1,224 | $ | — | $ | — | $ | 1,347 | $ | 1,276 | $ | — | $ | — | ||||||||||||||||
Benefit obligations as of September 30 | 1,710 | 1,678 | 299 | 366 | 1,858 | 1,710 | 295 | 299 | ||||||||||||||||||||||||
Funded status (plan assets less benefit obligations) | (434 | ) | (454 | ) | (299 | ) | (366 | ) | (511 | ) | (434 | ) | (295 | ) | (299 | ) | ||||||||||||||||
Amounts not recognized: | ||||||||||||||||||||||||||||||||
Unrecognized net loss | 467 | 480 | 66 | 111 | 524 | 467 | 61 | 66 | ||||||||||||||||||||||||
Unrecognized prior service cost | (2 | ) | (2 | ) | (44 | ) | (20 | ) | (2 | ) | (2 | ) | (36 | ) | (44 | ) | ||||||||||||||||
Adjustment for fourth quarter contribution | 4 | — | — | — | 45 | 4 | 5 | — | ||||||||||||||||||||||||
Net amount recognized as of December 31 | $ | 35 | $ | 24 | $ | (277 | ) | $ | (275 | ) | $ | 56 | $ | 35 | $ | (265 | ) | $ | (277 | ) | ||||||||||||
The following table shows the amounts recognized in the Consolidated Balance Sheets (in millions):
| Pension Benefits | Health and Welfare Benefits | Pension Benefits | Health and Welfare Benefits | |||||||||||||||||||||||||||||
December 31, | 2004 | 2003 | 2004 | 2003 | 2005 | 2004 | 2005 | 2004 | ||||||||||||||||||||||||
Prepaid benefit cost | $ | — | $ | — | $ | — | $ | — | ||||||||||||||||||||||||
Accrued benefit cost | (318 | ) | (335 | ) | (277 | ) | (275 | ) | $ | (361 | ) | $ | (318 | ) | $ | (265 | ) | $ | (277 | ) | ||||||||||||
Intangible assets | — | — | — | — | ||||||||||||||||||||||||||||
Accumulated other comprehensive income | 353 | 359 | — | — | 417 | 353 | — | — | ||||||||||||||||||||||||
Net amount recognized | $ | 35 | $ | 24 | $ | (277 | ) | $ | (275 | ) | $ | 56 | $ | 35 | $ | (265 | ) | $ | (277 | ) | ||||||||||||
| Pension Benefits |
Health and Welfare Benefits | |||||||||||||||||||||||||||||||
| Pension Benefits | Health and Welfare Benefits | |||||||||||||||||||||||||||||||
December 31, | 2004 | 2003 | 2004 | 2003 | 2005 | 2004 | 2005 | 2004 | ||||||||||||||||||||||||
Decrease in minimum liability included in other comprehensive income | $ | (6 | ) | $ | (9 | ) | $ | — | $ | — | ||||||||||||||||||||||
Increase (decrease) in minimum liability included in other comprehensive income | $ | 64 | $ | (6 | ) | $ | — | $ | — | |||||||||||||||||||||||
The expected long-term rate of return is the return to be earned,the Company anticipates earning, net of plan expenses, over the period that benefits are paid. It reflects the rate of return on present investments and on expected contributions. In determining the expected long-term rate of return, BNSF considered: 1) forward looking capital market forecasts, 2) historical returns for individual asset classes and 3) the impact of active portfolio management.
The assumptions used in accounting for the BNSF plans were as follows:
Assumptions used to determine net cost (benefit) for fiscal years ended December 31, | Pension Benefits | Health and Welfare Benefits | Pension Benefits | Health and Welfare Benefits | ||||||||||||||||||||||||||||||||
| 2004 | 2003 | 2002 | 2004 | 2003 | 2002 | 2005 | 2004 | 2003 | 2005 | 2004 | 2003 | |||||||||||||||||||||||||
Discount rate | 6.00 | % | 6.50 | % | 7.00 | % | 6.00 | % | 6.50 | % | 7.00 | % | 5.75 | % | 6.00 | % | 6.50 | % | 5.75 | % | 6.00 | % | 6.50 | % | ||||||||||||
Expected long-term rate of return on plan assets | 8.25 | % | 8.50 | % | 8.50 | % | — | — | — | 8.00 | % | 8.25 | % | 8.50 | % | — | — | — | ||||||||||||||||||
Rate of compensation increase | 3.90 | % | 3.90 | % | 4.00 | % | 3.90 | % | 3.90 | % | 4.00 | % | 3.90 | % | 3.90 | % | 3.90 | % | 3.90 | % | 3.90 | % | 3.90 | % | ||||||||||||
Assumptions used to determine benefit obligations at September 30, | Pension Benefits | Health and Welfare Benefits | Pension Benefits | Health and Welfare Benefits | ||||||||||||||||||||
| 2004 | 2003 | 2004 | 2003 | 2005 | 2004 | 2005 | 2004 | |||||||||||||||||
Discount rate | 5.75 | % | 6.00 | % | 5.75 | % | 6.00 | % | 5.25 | % | 5.75 | % | 5.25 | % | 5.75 | % | ||||||||
Rate of compensation increase | 3.90 | % | 3.90 | % | 3.90 | % | 3.90 | % | 3.90 | % | 3.90 | % | 3.90 | % | 3.90 | % | ||||||||
The following table shows the expectedpresents assumed health care rate increase and the future rate and time at which it is expected to remain constant.cost trend rates:
December 31, | 2004 | 2003 | 2002 | 2005 | 2004 | 2003 | ||||||||||||
Assumed health care cost trend rate | 10 | % | 11 | % | 11 | % | ||||||||||||
Assumed health care cost trend rate for next year | 10.50 | % | 10.00 | % | 11.00 | % | ||||||||||||
Rate to which health care cost trend rate is expected to decline and remain | 5 | % | 5 | % | 5 | % | 5.00 | % | 5.00 | % | 5.00 | % | ||||||
Year that the rate reaches the ultimate trend rate | 2010 | 2010 | 2009 | 2012 | 2010 | 2010 | ||||||||||||
Assumed health care cost trend rates have a significant effect on the amounts reported for the health care plans. A one-percentage-point change in assumed health care cost trend rates would have the following effects:
| One Percentage- Point Increase | One Percentage- Point Decrease | One Percentage- Point Increase | One Percentage- Point Decrease | |||||||||||
Effect on total service and interest cost | $ | 3 | $ | (2 | ) | $ | 2 | $ | (2 | ) | ||||
Effect on post retirement benefit obligation | $ | 25 | $ | (21 | ) | $ | 24 | $ | (20 | ) | ||||
The qualified BNSF Retirement Plan asset allocation at September 30, 20042005 and 20032004 and the target allocation for 20042005 by asset category are as follows:
Plan Asset Allocation | Target Allocation | Percentage of Pension Assets at September 30, | Target Allocation | Percentage of Pension Plan Assets at September 30, | ||||||||||||||
| 2004 | 2004 | 2003 | 2005 | 2005 | 2004 | |||||||||||||
Equity Securities | 45–75 | % | 60 | % | 57 | % | 45–75 | % | 64 | % | 60 | % | ||||||
Fixed Income Securities | 25–45 | 33 | 33 | 20–40 | 28 | 33 | ||||||||||||
Real Estate | 0–10 | 7 | 10 | 5–15 | 8 | 7 | ||||||||||||
Other | 0–5 | — | — | |||||||||||||||
Total | 100 | % | 100 | % | 100 | % | 100 | % | 100 | % | ||||||||
The general investment objective of the BNSF Retirement Plan is to grow the Plan assets in relation to the Plan liabilities while prudently managing the risk of a decrease in the Plan’s assets relative to those liabilities. To meet this objective, the Employee Benefits Committee has adopted the above asset allocation ranges. This allows flexibility to accommodate market changes in the asset classes within defined parameters.
In 2005, the
The Company expects to contribute approximately $13contributed $40 million to its qualified defined benefit pension plan.the BNSF Retirement Plan in December 2005. The Company is not required to make any contributions to this plan in 2006. Additionally, the Company expects to make benefit payments in 20052006 of approximately $20$21 million and $5$7 million from its OPEB plan and non-qualified defined benefit plan,plans, respectively. The following table shows expected benefit payments and Medicare Part D subsidy receipts for the next five fiscal years and the aggregate five years thereafter from the defined benefit pension plans and OPEB (in millions):
Fiscal Year | Expected Pension Plan Benefit Paymentsa | Expected OPEB Paymentsb | Expected Pension Plan Benefit Paymentsa | Expected OPEB Payments | Expected Medicare Subsidy | |||||||||||
2005 | $ | 124 | $ | 20 | ||||||||||||
2006 | 123 | 19 | $ | 126 | $ | 21 | $ | (3 | ) | |||||||
2007 | 123 | 19 | 126 | 22 | (3 | ) | ||||||||||
2008 | 124 | 19 | 127 | 23 | (3 | ) | ||||||||||
2009 | 124 | 20 | 129 | 24 | (3 | ) | ||||||||||
2010-2014 | 638 | 98 | ||||||||||||||
2010 | 130 | 24 | (3 | ) | ||||||||||||
2011-2015 | 674 | 131 | (20 | ) | ||||||||||||
| a | Primarily consists of Qualified Defined Benefit Plan payments which are made from the Plan Trust and do not represent an immediate cash outflow to the Company. |
PRESCRIPTION DRUG COVERAGE
BNSF sponsors a postretirement health care benefit plan that provides prescription drug coverage. The recent Medicare Prescription Drug, Improvement and Modernization Act of 2003 (Act) provides for a federal subsidy for plans that provide prescription drug benefits that are actuarially equivalent to Medicare Part D.
BNSF adopted guidance pursuant to FASB Staff Position 106-2,Accounting and Disclosure Requirements Related to the Drug, Improvement and Modernization Act of 2003, as of April 1, 2004. The Company and its actuarial advisors have determined that the prescription drug coverage provided by BNSF’s postretirement health care benefit plan is actuarially equivalent to Medicare Part D, and accordingly, the subsidy will provide some relief for BNSF’s ongoing retiree medical costs.
BNSF measured the effects of the Act on the accumulated post-retirement benefit obligation (APBO) as of January 1, 2004, and as such, the APBO was reduced by $36 million which was accounted for as an actuarial experience gain. Periodic postretirement benefit cost for the year ended December 31, 2004 was reduced by approximately $5 million due to the effects of the Act.
DEFINED CONTRIBUTION PLANS
BNSF sponsors qualified 401(k) plans which cover substantially all employees and a non-qualified defined contribution plan which covers certain officers and other employees. BNSF matches 50 percent of the first six percent of non-union employees’ contributions and matches 25 percent on the first four percent of a limited number of union employees’ contributions, which are subject to certain percentage limits of the employees’ earnings, at each pay period. Non-union employees are eligible to receive an annual discretionary matching contribution of up to 30 percent of the first six percent of their contributions. Employer contributions for all non-union employees are subject to a five-year length of service vesting schedule. BNSF’s 401(k) matching expense was $20 million, $17 million and $16 million in 2005, 2004 and $15 million in 2004, 2003, and 2002, respectively.
OTHER
Under collective bargaining agreements, BNSF participates in multi-employer benefit plans which provide certain post-retirement health care and life insurance benefits for eligible union employees. Insurance premiums paid attributable to retirees, which are generally expensed as incurred, were $43 million, $33 million and $31 million, in 2005, 2004 and $20 million, in 2004, 2003, and 2002, respectively (see Note 11 of the Consolidated Financial Statements for other deferred benefits payable to certain conductors, trainmen and locomotive engineers).
14. Stock Options and Other Incentive Plans
On April 15, 1999, BNSF shareholders approved the BNSF 1999 Stock Incentive Plan and authorized 20 million shares of BNSF common stock to be issued in connection with stock options, restricted stock, restricted stock units and performance stock. On April 18, 2001, April 17, 2002, and April 21, 2004, BNSF shareholders approved the amended BNSF 1999 Stock Incentive Plan, which authorized additional awards not to exceed 29 million, 35 million and 42 million shares, respectively, of BNSF common stock to be issued in connection with stock options, restricted stock, restricted stock units and performance stock. Approximately seventhree million common shares were available for future grant at December 31, 2004.2005.
Additionally, on April 18, 1996, BNSF shareholders approved the non-employee director’s stock plan and authorized 900 thousand900,000 shares of BNSF common stock to be issued in connection with this plan. Approximately 500 thousand500,000 common shares were available for future grant at December 31, 2004.2005.
STOCK OPTIONS
Under BNSF’s stock option plans, options may be granted to directors, officers and salaried employees at the fair market value of the Company’s common stock on the date of grant. Stock option grants awarded after April 2001 generally vest ratably over three years and expire within ten years after the date of grant. Shares issued upon exercise of options may be issued from treasury shares or from authorized but unissued shares.
The Company applies APB Opinion 25 and related interpretations in accounting for its stock option plansoptions (see Note 2 of the Consolidated Financial Statements for the Company’s pro forma net income and earnings per share determined based on the fair value at grant dates consistent with SFAS No. 123).
A summary of the status of the stock option plansoptions as of December 31, 2005, 2004 2003 and 2002,2003, and changes during the years then ended, is presented below (options in thousands):
Year Ended December 31, | 2004 | 2003 | 2002 | 2005 | 2004 | 2003 | ||||||||||||||||||||||||||||||
| Options | Weighted Average Exercise Prices | Options | Weighted Average Exercise Prices | Options | Weighted Average Exercise Prices | Options | Weighted Average Exercise Prices | Options | Weighted Average Exercise Prices | Options | Weighted Average Exercise Prices | |||||||||||||||||||||||||
Balance at beginning of year | 38,320 | $ | 28.72 | 39,323 | $ | 28.31 | 39,839 | $ | 28.02 | 25,122 | $ | 29.42 | 38,320 | $ | 28.72 | 39,323 | $ | 28.31 | ||||||||||||||||||
Granted | 2,547 | 33.20 | 2,957 | 27.88 | 2,867 | 27.76 | 2,676 | $ | 50.08 | 2,547 | $ | 33.20 | 2,957 | $ | 27.88 | |||||||||||||||||||||
Exercised | (15,455 | ) | 28.29 | (3,222 | ) | 22.68 | (2,338 | ) | 21.58 | (9,349 | ) | $ | 29.30 | (15,455 | ) | $ | 28.29 | (3,222 | ) | $ | 22.68 | |||||||||||||||
Cancelled | (290 | ) | 30.09 | (738 | ) | 30.16 | (1,045 | ) | 30.57 | (168 | ) | $ | 35.48 | (290 | ) | $ | 30.09 | (738 | ) | $ | 30.16 | |||||||||||||||
Balance at end of year | 25,122 | $ | 29.42 | 38,320 | $ | 28.72 | 39,323 | $ | 28.31 | 18,281 | $ | 32.45 | 25,122 | $ | 29.42 | 38,320 | $ | 28.72 | ||||||||||||||||||
Options exercisable at year end | 20,164 | $ | 29.18 | 31,465 | $ | 28.83 | 32,068 | $ | 28.30 | 13,718 | $ | 29.75 | 20,164 | $ | 29.18 | 31,465 | $ | 28.83 | ||||||||||||||||||
The following table summarizes information regarding stock options outstanding at December 31, 20042005 (options in thousands):
| Options Outstanding | Options Exercisable | |||||||||||
Range of Exercise Prices | Number Outstanding | Weighted Average Remaining Life | Weighted Average Exercise Prices | Number Exercisable | Weighted Average Exercise Prices | |||||||
$18.32 to $24.83 | 864 | 1.88 Years | $ | 23.72 | 863 | $ | 23.74 | |||||
$25.66 to $28.49 | 7,666 | 6.63 Years | 26.86 | 5,110 | 26.47 | |||||||
$28.76 to $31.00 | 9,241 | 4.31 Years | 29.16 | 9,233 | 29.16 | |||||||
$31.10 to $46.59 | 7,351 | 5.59 Years | $ | 33.00 | 4,958 | $ | 32.97 | |||||
$18.32 to $46.59 | 25,122 | 5.31 Years | $ | 29.42 | 20,164 | $ | 29.18 | |||||
| Options Outstanding | Options Exercisable | |||||||||||
Range of Exercise Prices | Number Outstanding | Weighted Average Remaining Life | Weighted Average Exercise Prices | Number Exercisable | Weighted Average Exercise Prices | |||||||
$24.08 to $27.97 | 5,649 | 5.67 Years | $ | 26.91 | 4,774 | $ | 26.76 | |||||
$28.34 to $29.44 | 5,182 | 3.73 Years | $ | 29.12 | 5,182 | $ | 29.12 | |||||
$29.78 to $34.59 | 4,663 | 5.26 Years | $ | 32.86 | 3,303 | $ | 32.92 | |||||
$34.87 to $71.03 | 2,787 | 7.97 Years | $ | 49.15 | 459 | $ | 45.09 | |||||
$24.08 to $71.03 | 18,281 | 5.37 Years | $ | 32.45 | 13,718 | $ | 29.75 | |||||
OTHER INCENTIVE PLANSPROGRAMS
BNSF has other long-term incentive programs in addition to stock options as shown in the following table:table (shares in thousands):
Other Incentive Plans | Vested | Shares Outstanding as of December 31, 2004 | Shares Granted For Year Ended December 31, | |||||||
| 2004 | 2003 | 2002 | ||||||||
(shares in thousands except for vested) | in years | |||||||||
Restricted shares | ||||||||||
Time-based | 3–5 | 2,047 | 639 | 558 | 999 | |||||
Performance-based | 3 | 558 | 251 | — | 340 | |||||
BNSF Incentive Bonus Stock Programa | 3 | 704 | 227 | 329 | 176 | |||||
BNSF Discounted Stock Purchase Programb | N/A | 48 | 18 | 19 | 12 | |||||
Other Incentive Programs | Generally (in years) | Shares Outstanding as of December 31, 2005 | Shares Granted For Year Ended December 31, | |||||||
| 2005 | 2004 | 2003 | ||||||||
Restricted shares/units: | ||||||||||
Time-based | 3–5 | 1,464 | 346 | 639 | 558 | |||||
Performance-based | 3 | 550 | 316 | 251 | — | |||||
BNSF Incentive Bonus Stock Program | 3 | 1,127 | 601 | 227 | 329 | |||||
BNSF Discounted Stock Purchase Program | N/A | 70 | 33 | 18 | 19 | |||||
Time-based awards are granted to senior managers within BNSF primarily as a retention tool and to encourage ownership in the Company and generally vest over three years and are contingent on continued salaried employment. The weighted-average grant date fair market values of time-based awards granted in 2005, 2004 and 2003 was $49.23, $32.72 and $27.88, respectively.
Performance-based awards are granted to senior managers within BNSF to encourage ownership in the Company and to align management’s interest with those of shareholders. Performance-based awards generally vest over three years and are contingent on the achievement of certain predetermined corporate performance goals (e.g., return on invested capital (ROIC)) and continued salaried employment. The weighted-average grant date fair market values of performance-based awards granted in 2005 and 2004 was $49.21 and $32.72, respectively, with no performance-based awards granted in 2003.
Additionally, related to the 2005 performance-based grant, eligible employees may also earn performance stock that will be granted in 2008 contingent upon achievement of higher ROIC goals and continued salaried employment. The Company has committed to a maximum grant of approximately 316,000 shares.
Certain eligible employees may exchange through the BNSF Incentive Bonus Stock Program (IBSP) the cash payment of their bonus for restricted stock. The grant date fair market values of IBSP awards granted in 2005, 2004 and 2003 was $47.58, $31.97 and $25.52, respectively. In September 2005, the program was amended so that no awards will be granted after 2006.
Salaried employees not eligible to participate in the IBSP may participate in the BNSF Discounted Stock Purchase Program (DSPP) and use their bonus to purchase BNSF common stock at a discount from the market price. These shares immediately vest but are restricted for a three-year period. The grant date fair market values of DSPP awards granted in 2005, 2004 and 2003 was $46.91, $31.84 and $25.38, respectively.
Shares awarded under the plans may not be sold or used as collateral and are generally not transferable by the holder until the shares awarded become free of restrictions. Compensation expense, net of tax, recorded under the BNSF Stock Incentive PlansPrograms in accordance with APB Opinion 25 was $19 million, $11 million and $10 million foris shown in the years ended 2004, 2003 and 2002, respectively.following table (in millions):
| 2005 | 2004 | 2003 | |||||||
Awards vesting based on service conditions | $ | 15 | $ | 12 | $ | 11 | |||
Awards vesting based on performance and service conditions | 8 | 7 | — | ||||||
Total | $ | 23 | $ | 19 | $ | 11 | |||
15. Common Stock and Preferred Capital Stock
COMMON STOCK
BNSF is authorized to issue 600 million shares of common stock, $0.01 par value. At December 31, 2004,2005, there were 377372 million shares of common stock outstanding. Each holder of common stock is entitled to one vote per share in the election of directors and on all matters submitted to a vote of stockholders. Subject to the rights and preferences of any future issuances of preferred stock, each share of common stock is entitled to receive dividends as may be declared by the Board of Directors (the Board) out of funds legally available and to share ratably in all assets available for distribution to stockholders upon dissolution or liquidation. No holder of common stock has any preemptive right to subscribe for any securities of BNSF.
PREFERRED CAPITAL STOCK
At December 31, 2004,2005, BNSF had 50 million shares of Class A Preferred Stock, $0.01 par value and 25 million shares of Preferred Stock, $0.01 par value available for issuance. The Board has the authority to issue such stock in one or more series, to fix the number of shares and to fix the designations and the powers, rights, and qualifications and restrictions of each series. As of December 31, 2004,2005, no Class A Preferred Stock had been issued.
SHARE REPURCHASE PROGRAM
In July 1997, the Board authorized the repurchase of up to 30 million shares of the Company’s common stock from time to time in thethrough open market.market transactions or otherwise. In December 1999, April 2000, September 2000, and January 2003 and December 2005, the Board authorized extensions of the BNSF share repurchase program, adding 30 million shares at each date to the total shares previously authorized bringing BNSF’s share repurchase program to 150180 million shares. During 2005, 2004 2003 and 2002,2003, the Company repurchased approximately 14 million, 10 million 8 million and 138 million shares, respectively, of its common stock at average prices of $54.95 per share, $35.98 per share, $27.25 per share, and $27.85$27.25 per share, respectively. Total repurchases through December 31, 2004,2005, were 134148 million shares at a total average cost of $26.82$29.49 per share, leaving 1632 million shares available for repurchase out of the 150180 million shares presently authorized. Additionally, during 2005, the Company repurchased shares from employees at a cost of $26 million to satisfy tax withholding obligations on the vesting of restricted stock or the exercise of stock options.
In December 2005, BNSF entered into prepaid forward transactions to purchase $600 million of the Company’s common stock. Shares will be delivered upon final settlement in February 2006. The number of shares will be determined based on the volume weighted average price per share through the final purchase date less a discount. There will be a net settlement in shares. This transaction is accounted for in accordance with Emerging Issues Taskforce (EITF) 00-19,Accounting for Derivative Financial Instruments Indexed to, and Potentially Settled in, a Company’s Own Stock, which requires the $600 million prepayment to be recorded as a reduction in equity. At the time that the final settlement is made, the reduction in equity will be reclassified from prepaid forward repurchase of treasury stock to treasury stock. These transactions did not reduce outstanding shares in the fourth quarter and correspondingly had no impact on earnings per share. The Company’s management does not believe that the impacts of the net settlement will be material to the financial statements of the Company.
16. Accounting Pronouncements
STOCK-BASED COMPENSATION
The Financial Accounting Standards Board (FASB)FASB issued SFAS No. 123R,Share-Based Payment, which is effectiveoriginally required implementation for interim or annual reporting periods beginning after June 15, 2005. However, in April 2005, (third quarter 2005the Securities and Exchange Commission adopted a new rule to amend the compliance date to the beginning of the Company’s next fiscal year (January 1, 2006, for the Company). SFAS No. 123R requires the Company to recognize the cost of employee services received in exchange for the Company’s equity instruments. Currently, in accordance with APB Opinion 25, the Company records the intrinsic value of stock based compensation as expense. Accordingly, no compensation expense is currently recognized for fixed stock option plans as the exercise price equals the stock price on the date of grant. Under FASSFAS No. 123R, BNSF will be required to measure compensation expense over the options’ vesting period based on the stock options’ fair value at the date the options are granted. FASSFAS No. 123R allows for the use of the Black-Scholes or a lattice option-pricing model to value such options. The Company has determined that it will use the Black-Scholes option-pricing model to calculate the fair value of its options. Based on a study performed by the Company’s management, the fair values obtained from each of the two pricing models were not substantially different. As allowed by SFAS 123R,Additionally, the Company can elect either Modified Prospective Application, which applies the Statementhas elected to new awards andadopt SFAS No. 123R on a modified awards after the effective date, and to any unvested awards as service is rendered on or after the effective date, or Modified Retrospective Application which can apply the statement to either all prior years for which SFAS 123 was effective or only to prior interim periods in the year of adoption. BNSF is currently evaluating which method of application will be used.prospective basis. Note 2 of the Consolidated Financial Statements illustrates the effects on net income and earnings per share if the Company had adopted SFAS No. 123Accounting for Stock-Based Compensation, using the Black-Scholes option-pricing model.
17. Quarterly Financial Data–Unaudited
Dollars in millions, except per share data | Fourth | Thirda | Second | First | Fourth a | Thirdb | Second | First | ||||||||||||||||
2005 | ||||||||||||||||||||||||
Revenues | $ | 3,550 | $ | 3,317 | $ | 3,138 | $ | 2,982 | ||||||||||||||||
Operating income | $ | 800 | $ | 778 | $ | 710 | $ | 634 | ||||||||||||||||
Net income | $ | 430 | $ | 414 | $ | 366 | $ | 321 | ||||||||||||||||
Basic earnings per share | $ | 1.16 | $ | 1.12 | $ | 0.98 | $ | 0.86 | ||||||||||||||||
Diluted earnings per share | $ | 1.13 | $ | 1.09 | $ | 0.96 | $ | 0.83 | ||||||||||||||||
Dividends declared per share | $ | 0.20 | $ | 0.20 | $ | 0.17 | $ | 0.17 | ||||||||||||||||
Common stock pricec: | ||||||||||||||||||||||||
High | $ | 71.33 | $ | 59.32 | $ | 53.99 | $ | 55.66 | ||||||||||||||||
Low | $ | 56.67 | $ | 47.51 | $ | 46.30 | $ | 45.05 | ||||||||||||||||
| 2004 | ||||||||||||||||||||||||
Revenues | $ | 2,978 | $ | 2,793 | $ | 2,685 | $ | 2,490 | $ | 2,978 | $ | 2,793 | $ | 2,685 | $ | 2,490 | ||||||||
Operating income | $ | 668 | $ | 100 | $ | 508 | $ | 410 | $ | 668 | $ | 100 | $ | 508 | $ | 410 | ||||||||
Net income | $ | 347 | $ | 2 | $ | 249 | $ | 193 | $ | 347 | $ | 2 | $ | 249 | $ | 193 | ||||||||
Basic earnings per share | $ | 0.93 | $ | 0.01 | $ | 0.68 | $ | 0.52 | $ | 0.93 | $ | 0.01 | $ | 0.68 | $ | 0.52 | ||||||||
Diluted earnings per share | $ | 0.91 | $ | 0.01 | $ | 0.67 | $ | 0.52 | $ | 0.91 | $ | 0.01 | $ | 0.67 | $ | 0.52 | ||||||||
Dividends declared per share | $ | 0.17 | $ | 0.17 | $ | 0.15 | $ | 0.15 | $ | 0.17 | $ | 0.17 | $ | 0.15 | $ | 0.15 | ||||||||
Common stock priceb: | ||||||||||||||||||||||||
Common stock pricec: | ||||||||||||||||||||||||
High | $ | 47.80 | $ | 38.39 | $ | 34.87 | $ | 33.16 | $ | 47.80 | $ | 38.39 | $ | 34.87 | $ | 33.16 | ||||||||
Low | $ | 38.54 | $ | 33.97 | $ | 31.44 | $ | 30.02 | $ | 38.54 | $ | 33.97 | $ | 31.44 | $ | 30.02 | ||||||||
2003c | ||||||||||||||||||||||||
Revenues | $ | 2,492 | $ | 2,395 | $ | 2,294 | $ | 2,232 | ||||||||||||||||
Operating income | $ | 477 | $ | 430 | $ | 412 | $ | 346 | ||||||||||||||||
Income before cumulative effect of accounting change | $ | 226 | $ | 203 | $ | 200 | $ | 148 | ||||||||||||||||
Net income | $ | 226 | $ | 203 | $ | 200 | $ | 187c | ||||||||||||||||
Basic earnings per share (before cumulative effect of accounting change) | $ | 0.61 | $ | 0.55 | $ | 0.54 | $ | 0.40 | ||||||||||||||||
Basic earnings per share (after cumulative effect of accounting change) | $ | 0.61 | $ | 0.55 | $ | 0.54 | $ | 0.50 | ||||||||||||||||
Diluted earnings per share (before cumulative effect of accounting change) | $ | 0.61 | $ | 0.55 | $ | 0.54 | $ | 0.40 | ||||||||||||||||
Diluted earnings per share (after cumulative effect of accounting change) | $ | 0.61 | $ | 0.55 | $ | 0.54 | $ | 0.50 | ||||||||||||||||
Dividends declared per share | $ | 0.15 | $ | 0.15 | $ | 0.12 | $ | 0.12 | ||||||||||||||||
Common stock priceb: | ||||||||||||||||||||||||
High | $ | 32.31 | $ | 29.47 | $ | 29.80 | $ | 27.05 | ||||||||||||||||
Low | $ | 27.65 | $ | 26.78 | $ | 24.89 | $ | 23.48 | ||||||||||||||||
| a | 2005 operating income, income before cumulative effect of accounting change and earnings per share include a loss related to an agreement to sell certain line segments to the state of New Mexico in the future of $71 million pre-tax, $44 million net of tax, or $0.12 per diluted and basic share. |
| b | Third-quarter 2004 operating income, net income and earnings per share include a charge for a change in estimate of unasserted asbestos and environmental liabilities of $465 million pre-tax, or $288 million net of tax, and quarterly earnings per share impacts of $0.78 per basic share and $0.76 per diluted share (see Note 10 of the Consolidated Financial Statements). |
| Average of high and low reported daily stock price |
Item 9. Changes in and Disagreements With Accountants on Accounting and Financial Disclosure
None.
Item 9A. Controls and Procedures
Based on their evaluation as of the end of the period covered by this annual report on Form 10-K, BNSF’s principal executive officer and principal financial officer have concluded that BNSF’s disclosure controls and procedures (as defined in Rules 13a-15(e) and 15d-15(e) of the Securities Exchange Act of 1934) are effective to ensure that information required to be disclosed by BNSF in the reports that it files or submits under the Securities Exchange Act of 1934 is recorded, processed, summarized and reported within the time periods specified in Securities and Exchange Commission rules and forms and that such information is accumulated and communicated to BNSF’s management, including its principal executive and principal financial officers, as appropriate to allow timely decisions regarding required disclosure. Additionally, as of the end of the period covered by this report, BNSF’s principal executive officer and principal financial officer have concluded that there have been no changes in BNSF’s internal control over financial reporting that occurred during BNSF’s fourth fiscal quarter that have materially affected, or are reasonably likely to materially affect, BNSF’s internal control over financial reporting.
None.
Item 10. Directors and Executive Officers of the Registrant
Information concerning the directors of BNSF will be provided under the heading “Nominees for Directors” in BNSF’s proxy statement for its 20052006 annual meeting of shareholders which will be filed with the Securities and Exchange Commission no later than 120 days after the end of the fiscal year, and the information under that heading is hereby incorporated by reference.
Information under the heading “Audit Committee” in BNSF’s proxy statement for its 20052006 annual meeting of shareholders, which will be filed with the Securities and Exchange Commission no later than 120 days after the end of the fiscal year, is hereby incorporated by reference into the Form 10-K.
Information concerning the executive officers of BNSF is included in Part I of this Report on Form 10-K.
Information concerning compliance with Section 16(a) of the Securities Exchange Act of 1934 will be under the heading “Section 16(a) Beneficial Ownership Reporting Compliance” in BNSF’s proxy statement for its 20052006 annual meeting of shareholders which will be filed with the Securities and Exchange Commission no later than 120 days after the end of the fiscal year, and the information under that heading is hereby incorporated by reference.
The Company has adopted a Code of Ethics for the Chief Executive Officer and Senior Financial Officers (Code of Ethics) applicable to the Chief Executive Officer, Chief Financial Officer and Controller. A copy of the Code of Ethics is available on the Company’s website at www.bnsf.com under the “Investors Link,” and any waiver from the Code of Ethics will be timely disclosed on the Company’s website as will any amendments to the Code of Ethics.
Item 11. Executive Compensation
Information concerning the compensation of directors and executive officers of BNSF will be provided under the heading “Directors’ Compensation” and under the headings “Summary Compensation Table,” “Stock Option Grants in 2005,2006,” “Aggregated 20042005 Stock Option Exercises and Year-End Option Values,” “Pension Plans,” “Employment Contracts and Other Arrangements,” and “Trust Agreements,” in BNSF’s proxy statement for its 20052006 annual meeting of shareholders which will be filed with the Securities and Exchange Commission no later than 120 days after the end of the fiscal year, and the information under those headings is hereby incorporated by reference.
Item 12. Security Ownership of Certain Beneficial Owners and Management and Related Stockholder Matters
Certain information about BNSF’s equity compensation plans is set forth in the table below (number of shares in thousands) as of December 31, 2004:2005:
Plan Category | Number of shares to be issued upon exercise of outstanding options, warrants and rights | Weighted average exercise price of outstanding options, warrants and rights | Number of shares available for future issuance | Number of shares to be issued upon exercise of outstanding options, warrants and rights | Weighted average exercise price of outstanding options, warrants and rights | Number of shares available for future issuance | |||||||||
Equity compensation plans approved by shareholders | 25,122 | $ | 29.42 | 7,441 | 18,281 | $ | 32.45 | 3,741 | |||||||
Equity compensation plans not approved by shareholders | — | — | 37 | a | |||||||||||
Equity compensation plans not approved by shareholders a | — | — | — | ||||||||||||
Total | 25,122 | $ | 29.42 | 7,478 | 18,281 | $ | 32.45 | 3,741 | |||||||
| a | Effective |
Information concerning the ownership of BNSF equity securities by certain beneficial owners and by management will be provided under the headings “Certain Beneficial Owners” and “Ownership of Management” in BNSF’s proxy statement for its 20052006 annual meeting of shareholders which will be filed with the Securities and Exchange Commission no later than 120 days after the end of the fiscal year, and the information under those headings is hereby incorporated by reference.
Item 13. Certain Relationships and Related Transactions
Information concerning certain relationships and related transactions will be provided under the heading “Certain Relationships” ofin BNSF’s proxy statement for its 20052006 annual meeting of shareholders which will be filed with the Securities and Exchange Commission no later than 120 days after the end of the fiscal year, and the information under that heading is hereby incorporated by reference.
Item 14. Principal Accountant Fees and Services
Information concerning principal accounting fees and services will be provided under the heading “Independent Registered Public Accounting Firm”Auditor Fees” in BNSF’s proxy statement for its 20052006 annual meeting of shareholders which will be filed with the Securities and Exchange Commission no later than 120 days after the end of the fiscal year, and the information under that heading is hereby incorporated by reference.
Item 15. Exhibits and Financial Statement Schedules
(a) The following documents are filed as part of this report:
| 1. | Consolidated Financial Statements– |
Schedules are omitted because they are not required or applicable, or the required information is included in the Consolidated Financial Statements or related notes.
| 2. | Exhibits: |
See Index to Exhibits beginning on page E-1 for a description of the exhibits filed as a part of this Report on Form 10-K.
Pursuant to the requirements of Section 13 or 15(d) of the Securities Exchange Act of 1934, Burlington Northern Santa Fe Corporation has duly caused this report to be signed on its behalf by the undersigned, thereunto duly authorized.
| BURLINGTON NORTHERN SANTA FE CORPORATION | ||||||||
| By: | /s/ Matthew K. Rose | |||||||
Dated: February | Matthew K. Rose | |||||||
| Chairman, President and Chief Executive Officer | ||||||||
Pursuant to the requirements of the Securities Exchange Act of 1934, this report has been signed below by the following persons on behalf of Burlington Northern Santa Fe Corporation and in the capacities and on the date indicated.
SIGNATURE | TITLE | |||
/s/ Matthew K. Rose Matthew K. Rose | Chairman, President and Chief Executive Officer
| |||
/s/ Thomas N. Hund Thomas N. Hund | Executive Vice President and Chief Financial Officer
| |||
/s/ Paul W. Bischler |
(Principal Accounting Officer) | |||
/s/ Alan L. Boeckmann* Alan L. Boeckmann | Director | |||
/s/ Donald G. Cook* Donald G. Cook | Director | |||
/s/ Vilma S. Martinez* Vilma S. Martinez | Director | |||
/s/ Marc F. Racicot* Marc F. Racicot | Director | |||
/s/ Roy S. Roberts* Roy S. Roberts | Director | |||
/s/ Marc J. Shapiro* Marc J. Shapiro | Director | |||
/s/ J.C. Watts, Jr.* J.C. Watts, Jr. | Director | |||
/s/ Robert H. West* Robert H. West | Director | |||
/s/ J. Steven Whisler* J. Steven Whisler | Director | |||
/s/ Edward E. Whitacre Jr.* Edward E. Whitacre, Jr. | Director | |||
| ||||||
| *By: | /s/ Jeffrey R. Moreland | |||||||
Dated: February | Jeffrey R. Moreland | |||||||
| Executive Vice President Law & Government Affairs and Secretary | ||||||||
Burlington Northern Santa Fe Corporation and Subsidiaries – Index to Exhibits
| Exhibit Number | Description | |
| 3.1 | Amended and Restated Certificate of Incorporation of BNSF (amended as of April 21, 1998). Incorporated by reference to Exhibit 3.1 to BNSF’s Report on Form 10-Q for the quarter ended June 30, | |
| 3.2 | By-Laws of Burlington Northern Santa Fe Corporation, as amended and restated, dated | |
| 4.1 | Indenture, dated as of December 1, 1995, between BNSF and The First National Bank of Chicago, as Trustee. Incorporated by reference to Exhibit 4 to BNSF’s Registration Statement on Form S-3 (No. 333-72013). | |
| 4.2 | Form of BNSF’s 6 1/8% Notes Due 2009. Incorporated by reference to Exhibit 4.2 to BNSF’s Report on Form 10-K for the fiscal year ended December 31, | |
| 4.3 | Form of BNSF’s 6 3/4% Debentures Due 2029. Incorporated by reference to Exhibit 4.3 to BNSF’s Report on Form 10-K for the fiscal year ended December 31, | |
| 4.4 | Form of | |
| 4.5 | Form of BNSF’s 7.875% Note Due April 15, 2007. Incorporated by reference to Exhibit 4.5 to BNSF’s Report on Form 10-K for the fiscal year ended December 31, | |
| 4.6 | Form of BNSF’s 8.125% Debenture Due April 15, 2020. Incorporated by reference to Exhibit 4.6 to BNSF’s Report on Form 10-K for the fiscal year ended December 31, | |
| 4.7 | Form of BNSF’s 7.95% Debenture Due August 15, 2030. Incorporated by reference to Exhibit 4.7 to BNSF’s Report on Form 10-K for the fiscal year ended December 31, | |
| 4.8 | Form of BNSF’s 6.75% Note due July 15, 2011. Incorporated by reference to Exhibit 4.1 to BNSF’s Report on Form 10-Q for the quarter ended June 30, 2001. | |
| 4.9 | Officers’ Certificates as to the terms of Form of BNSF’s 5.90% Notes Due July 1, 2012 including the form of the Notes. Incorporated by reference to Exhibit 4.1 to BNSF’s Report on Form 10-Q for the quarter ended June 30, 2002. | |
| 4.10 | Officers’ Certificate of Determination as to the terms of BNSF’s 4.875% Notes Due January 15, 2015, including Exhibit A thereto, the form of the Notes. Incorporated by reference to Exhibit 4.1 to BNSF’s Report on Form 8-K (Date of earliest event reported: November 18, 2004). | |
| 4.11 | Indenture, dated as of December 8, 2005, between BNSF and U.S Bank Trust National Association, as Trustee. Incorporated by reference to Exhibit 4.1 to BNSF’s Registration Statement on Form S-3 ASR (No. 333-130214). | |
| 4.12 | Certificate of Trust of BNSF Funding Trust I, executed and filed by U.S. Bank Trust National Association, Linda Hurt and James Gallegos, as Trustees. Incorporated by reference to Exhibit 4.3 to BNSF’s Registration Statement of Form S-3 (No. 333-130214). | |
| Exhibit Number | Description | ||
| 4.13 | Amended and Restated Declaration of Trust of BNSF Funding Trust I, dated as of December 15, 2005. Incorporated by reference to Exhibit 4.4 to BNSF’s Report on Form 8-K filed December 15, 2005. | ||
| 4.14 | Guarantee Agreement between BNSF and U.S. Bank Trust National Association, as Guarantee Trustee, dated as of December 15, 2005. Incorporated by reference to Exhibit 4.5 to BNSF’s Report on Form 8-K filed December 15, 2005. | ||
| 4.15 | First Supplemental Indenture, dated as of December 15, 2005, between BNSF and U.S. Bank Trust National Association, as Trustee. Incorporated by reference to Exhibit 4.6 to BNSF’s Report on Form 8-K filed December 15, 2005. | ||
| 4.16 | Agreement as to Expenses and Liabilities between BNSF and BNSF Funding Trust I. Incorporated by reference to Exhibit C to Exhibit 4.4 to BNSF’s Report on Form 8-K filed December 15, 2005. | ||
| 4.17 | Trust Preferred Securities Certificate of BNSF Funding Trust I. Incorporated by reference to Exhibit D to Exhibit 4.4 to BNSF’s Report on Form 8-K filed December 15, 2005. | ||
| Certain instruments evidencing long-term indebtedness of BNSF are not being filed as exhibits to this Report because the total amount of securities authorized under any single such instrument does not exceed 10% of BNSF’s total assets. BNSF will furnish copies of any material instruments upon request of the Securities and Exchange Commission. | |||
| Burlington Northern Santa Fe Non-Employee Directors’ Stock Plan as amended February 11, 2005. | |||
| The BNSF Railway Company Incentive Compensation Plan, as amended and restated, effective January 1, 2006. | |||
| 10.3* | Burlington Northern Santa Fe Corporation Deferred Compensation Plan, as amended and restated, effective December 9, 2004. Incorporated by reference to Exhibit 10.1 | ||
| Burlington Northern Inc. Senior Executive Survivor Benefit Plan as of April 1, 1986. Incorporated by reference to Amendment No. 1 to BNI’s Report on Form 10-K for the fiscal year ended December 31, | |||
| Burlington Northern Santa Fe Corporation Senior Management Stock Deferral Plan, as amended and restated effective December 9, 2004. Incorporated by reference to Exhibit 10.4 | |||
| Burlington Northern Santa Fe Long Term Incentive Stock Plan. Incorporated by reference to Exhibit 4(c) to BNSF’s Registration Statement on Form S-8 (File No. 33-63247). | |||
| Burlington Northern Santa Fe Corporation 1990 Directors Stock Option Plan. Incorporated by reference to BNSF’s Registration Statement on Form S-8 (File No. 33-62825). | |||
| Burlington Northern Santa Fe Incentive Bonus Stock Program, as amended and restated | |||
| Burlington Northern Santa Fe Corporation 1992 Stock Option Incentive Plan. Incorporated by reference to BNSF’s Registration Statement on Form S-8 (File No. 33-62839). | |||
| Exhibit Number | Description | ||
| Burlington Northern Santa Fe 1996 Stock Incentive Plan. Incorporated by reference to Appendix B to BNSF’s Proxy Statement dated March 5, | |||
| Burlington Northern Santa Fe Supplemental Retirement Plan, effective October 1, 1996, as amended | |||
| Burlington Northern Santa Fe Estate Enhancement Program, as amended and restated, effective October 1, 1996. Incorporated by reference to Exhibit 10.15 to BNSF’s Report on Form 10-K for the fiscal year ended December 31, | |||
| Form of BNSF Change-in-Control Agreement (applicable to Messrs. Ice, Hund, Moreland, and Lanigan, and two other executive officers). Incorporated by reference to Exhibit 10.17 to BNSF’s Report on Form 10-K for the fiscal year ended December 31, | |||
| Burlington Northern Santa Fe Deferred Compensation Plan for Directors, as amended and restated, effective December 9, 2004. Incorporated by reference to Exhibit 10.5 | |||
| Burlington Northern Santa Fe Corporation Supplemental Investment and Retirement Plan, effective January 1, 1997, as amended | |||
July 21, 2005. | |||
| Burlington Northern Inc. Form of Severance Agreement and amendments through September 18, 1995 (applicable to Mr. Rose). Incorporated by reference to Exhibit 10.21 to BNSF’s Report on Form 10-K for the fiscal year ended December 31, | |||
| Burlington Northern Inc. Director’s Charitable Award Program. Incorporated by reference to Exhibit 10.22 to BNSF’s Report on Form 10-K for the fiscal year ended December 31, | |||
| Burlington Northern Santa Fe Salary Exchange Option Program, as amended and restated, October 1, 2004. Incorporated by reference to Exhibit 10.18 to BNSF’s Report on Form 10-K for the fiscal year ended December 31, 2004. | |||
| Santa Fe Pacific Corporation Supplemental Retirement Plan (Supplemental Plan). Incorporated by reference to Exhibit 10(d) to SFP’s Report on Form 10-K for the fiscal year ended December 31, | |||
| Exhibit Number | Description | ||
| The Burlington Northern and Santa Fe Railway Company Severance Plan as amended and restated October 16, 2001. Incorporated by reference to Exhibit 10.22 to BNSF’s Report on Form 10-K for the fiscal year ended December 31, 2001. | |||
| Burlington Northern Santa Fe 1999 Stock Incentive Plan, as amended and restated, effective | |||
| Benefits Protection Trust Agreement by and between Burlington Northern Santa Fe Corporation and Wachovia Bank, approved by the board of directors February 11, 2005. Incorporated by reference to Exhibit 10.22 of BNSF’s Report on Form 10-K for the fiscal year ended December 31, 2004. | |||
| Burlington Northern Santa Fe Directors’ Retirement Plan. Incorporated by reference to | |||
| Form of indemnification agreement dated as of September 17, 1998 between BNSF and directors. Incorporated by reference to Exhibit 10.37 to BNSF’s Report on Form 10-K for the fiscal year ended December 31, | |||
| Form of indemnification agreement dated as of September 17, 1998 between BNSF and certain officers, including Matthew K. Rose, Thomas N. Hund, Carl R. Ice, John P. Lanigan, Jr., Jeffrey R. Moreland, Dennis R. Johnson, and Peter J. Rickershauser. Incorporated by reference to Exhibit 10.38 to BNSF’s Report on Form 10-K for the fiscal year ended December 31, | |||
| Amendment to Burlington Northern Santa Fe Supplemental Retirement Plan (Matthew K. Rose) dated April 18, 2002. Incorporated by reference to Exhibit 10.2 to BNSF’s Report on Form 10-Q for the period ended June 30, 2002. | |||
| Retirement Benefit Agreement dated April 19, 2002 between BNSF and Matthew K. Rose. Incorporated by reference to Exhibit 10.3 to BNSF’s Report on Form 10-Q for the period ended June 30, 2002. | |||
| |||
| Retirement Benefit Agreement dated January 16, 2003 between BNSF and John P. Lanigan. Incorporated by reference to Exhibit 10.29 to BNSF’s Report on Form 10-K for the year ended December 31, 2003. | |||
| Form of Notice of Grant of Incentive Stock Options and Non-Qualified Stock Options and Award Agreement. Incorporated by reference to Exhibit 99.1 | |||
| Form of Burlington Northern Santa Fe 1999 Stock Incentive Plan Stock Option Award Agreement Terms and Conditions. Incorporated by reference to Exhibit 99.2 | |||
| Form of 1999 Stock Incentive Plan Master Restricted Stock Award Agreement. Incorporated by reference to Exhibit 99.3 | |||
| Form of 1999 Stock Incentive Plan Reload Stock Option Agreement. Incorporated by reference to Exhibit 99.4 | |||
| Form of 1999 Stock Incentive Plan Exchange Option Grant Agreement. Incorporated by reference to Exhibit 99.5 | |||
| Form of 1999 Stock Incentive Plan Senior Management Stock Deferral Plan Award Agreement. Incorporated by reference to Exhibit 99.6 | |||
| Form of 1999 Stock Incentive Plan Individual Stock Award Agreement. Incorporated by reference to Exhibit 99.7 | |||
| Exhibit Number | Description | ||
| Form of Burlington Northern Santa Fe Non-Employee Directors’ Stock Plan Director’s Restricted Stock Unit Award Agreement. Incorporated by reference to Exhibit | |||
| Form of Burlington Northern Santa Fe Non-Employee Directors’ Stock Plan Non-Qualified Stock Option Grant Agreement. Incorporated by reference to Exhibit 99.9 | |||
| Form of 1999 Stock Incentive Plan Incentive Bonus Stock Program Award Agreement. | |||
| Form of Burlington Northern Santa Fe 1999 Stock Incentive Plan Performance Stock Award Agreement. Incorporated by reference to Exhibit 10.4 to BNSF’s Report on Form 8-K dated May 2, 2005. | |||
| 10.40* | Burlington Northern Santa Fe 2005 Deferred Compensation Plan for Non-Employee Directors, effective April 21, 2005. Incorporated by reference to Exhibit 10.1 to BNSF’s Report on Form 8-K dated April 21, 2005. | ||
| 10.41 | Replacement Capital Covenant, dated as of December 15, 2005, by BNSF in favor of and for the benefit of each Covered Debtholder (as defined therein). | ||
| 10.42* | Form of Award Agreement Including Notice of Grant and Master Stock Option Terms and Conditions, dated May 2, 2005 (Incentive Stock Options). Incorporated by reference to Exhibit 10.1 to BNSF’s Report on Form 8-K dated May 2, 2005. | ||
| 10.43* | Form of Award Agreement Including Notice of Grant and Master Stock Option Terms and Conditions, dated May 2, 2005 (Incentive Stock Options and Non-qualified Stock Options). Incorporated by reference to Exhibit 10.2 to BNSF’s Report on Form 8-K dated May 2, 2005. | ||
| 10.44* | Form of Award Agreement Including Notice of Grant and Master Restricted Stock Unit Terms and Conditions, dated May 2, 2005. Incorporated by reference to Exhibit 10.3 to BNSF’s Report on Form 8-K dated May 2, 2005. | ||
| 10.45* | Summary of Non-Employee Director’s Compensation. | ||
| Summary of Executive Officer Compensation. | |||
| 12.1 | Computation of Ratio of Earnings to Fixed Charges. | ||
| 21.1 | Subsidiaries of BNSF. | ||
| 23.1 | Consent of PricewaterhouseCoopers LLP. | ||
| 24.1 | Powers of Attorney. | ||
| 31.1 | Principal Executive Officer’s | ||
| 31.2 | Principal Financial Officer’s | ||
| 32.1 | Certification Pursuant to Rule 13a-14(b) and 18 U.S.C. § 1350 (Section 906 of the Sarbanes-Oxley Act of 2002). | ||
| 99.1 | Certification Pursuant to Section 303A.12 of the New York Stock Exchange Listed Company Manual. | ||
| * | Management contract or compensatory plan or arrangement. | |
E-5