
UNITED STATES
SECURITIES AND EXCHANGE COMMISSION
Washington, D.C. 20549
Form 10-K
FOR ANNUAL AND TRANSITION REPORTS
PURSUANT TO SECTIONS 13 OR 15(d) OF THE
SECURITIES EXCHANGE ACT OF 1934(Mark One)
(Mark One)
| x | ANNUAL REPORT PURSUANT TO SECTION 13 OR 15(d) OF THE SECURITIES EXCHANGE ACT OF 1934 |
For the Fiscal Year Ended December 31, 20042005
or
| ¨ | TRANSITION REPORT PURSUANT TO SECTION 13 OR 15(d) OF THE SECURITIES EXCHANGE ACT OF 1934 |
For the Transition Period From to
Commission File Number 001-31240
Newmont Mining Corporation
(Exact Name of Registrant as Specified in Its Charter)
| Delaware | 84-1611629 | |
(State or Other Jurisdiction Incorporation or Organization) | (I.R.S. Employer
| |
1700 Lincoln Street Denver, Colorado | 80203 | |
| (Address of Principal Executive Offices) | (Zip Code) | |
Registrant’s telephone number, including area code (303) 863-7414
Securities registered pursuant to Section 12(b) of the Act:
Title of Each Class | Name of Each Exchange on Which Registered | |
Common Stock, $1.60 par value | New York Stock Exchange |
Securities registered pursuant to Section 12(g) of the Act:
None
Indicate by check mark if the registrant is a well-known seasoned issuer, as defined in Rule 405 of the Securities Act. Yes x No ¨
Indicate by check mark if the registrant is not required to file reports pursuant to Section 13 or Section 15(d) of the Exchange Act. Yes ¨ No x
Indicate by check mark whether the Registrantregistrant (1) has filed all reports required to be filed by Section 13 or 15(d) of the Securities Exchange Act of 1934 during the preceding 12 months (or for such shorter period that the registrant was required to file such reports), and (2) has been subject to such filing requirements for the past 90 days. Yes x No ¨
Indicate by check mark if disclosure of delinquent filers pursuant to Item 405 of Regulation S-K is not contained herein, and will not be contained, to the best of Registrant’sregistrant’s knowledge, in definitive proxy or information statements incorporated by reference in Part III of this Form 10-K or any amendment to this Form 10-K. ¨
Indicate by check mark whether the registrant is a large accelerated filer, an accelerated filer, or a non-accelerated filer. See definition of “accelerated filer” and “large accelerated filer” in Rule 12b-2 of the Exchange Act.
(Check one): Large accelerated filer x Accelerated filer ¨ Non-accelerated filer ¨
Indicate by check mark whether the Registrantregistrant is an accelerated filera shell company (as defined in Rule 12b-2 of the Exchange Act). Yes x No ¨ No x
StateAs of June 30, 2005, the aggregate market value of the registrant’s voting and non-voting common equity held by non-affiliates computed by reference toof the registrant was $17,126,388,000 based on the closing sale price at whichas reported on the common equity was last sold, or the average bid and asked price of such common equity, as of June 30, 2004: $17,161,160,854.New York Stock Exchange. There were 409,987,107417,383,659 shares of common stock outstanding (and 35,698,48831,145,915 exchangeable shares exchangeable into Newmont Mining Corporation common stock on a one-for-one basis) on March 3, 2005.
February 22, 2006.
DOCUMENTS INCORPORATED BY REFERENCE
Portions of Registrant’s definitive Proxy Statement submitted to the Registrant’s stockholders in connection with our 20052006 Annual Stockholders Meeting to be held on April 27, 2005,25, 2006, are incorporated by reference into Part III of this report.
| Page | ||||||||
| PART I | ||||||||
ITEM 1. | 1 | |||||||
| 1 | ||||||||
| 1 | ||||||||
| 2 | ||||||||
| 3 | ||||||||
| 3 | ||||||||
| 4 | ||||||||
| 6 | ||||||||
| 6 | ||||||||
| 6 | ||||||||
| 7 | ||||||||
| 7 | ||||||||
| 8 | ||||||||
ITEM 1A. | ||||||||
ITEM 2. | 16 | |||||||
| 16 | ||||||||
| 17 | ||||||||
| 17 | ||||||||
ITEM 3. | ||||||||
ITEM 4. | ||||||||
ITEM 4A. | ||||||||
| PART II | ||||||||
ITEM 5. | ||||||||
ITEM 6. | ||||||||
ITEM 7. | MANAGEMENT’S DISCUSSION AND ANALYSIS OF CONSOLIDATED FINANCIAL CONDITION AND RESULTS OF OPERATIONS | 37 | ||||||
| 37 | ||||||||
| 39 | ||||||||
| 40 | ||||||||
| 47 | ||||||||
| 58 | ||||||||
| 76 | ||||||||
| 76 | ||||||||
i
ITEM 7A. | ||||||||
ITEM 8. | ||||||||
ITEM 9. | CHANGES IN AND DISAGREEMENTS WITH ACCOUNTANTS ON ACCOUNTING AND FINANCIAL DISCLOSURE | |||||||
ITEM 9A. | ||||||||
ITEM 9B. | ||||||||
| PART III | ||||||||
ITEM 10. | ||||||||
ITEM 11. | ||||||||
ITEM 12. | SECURITY OWNERSHIP OF CERTAIN BENEFICIAL OWNERS AND MANAGEMENT AND RELATED STOCKHOLDER MATTERS | |||||||
ITEM 13. | ||||||||
ITEM 14. | ||||||||
| PART IV | ||||||||
ITEM 15. | ||||||||
NUSA TENGGARA PARTNERSHIP V.O.F. CONSOLIDATED FINANCIAL STATEMENTS | NT-1 | |||||||
| S-1 | ||||||||
| E-1 | ||||||||
ii
This document (including information incorporated herein by reference) contains “forward-looking statements” within the meaning of Section 27A of the Securities Act of 1933 and Section 21E of the Securities Exchange Act of 1934, which involve a degree of risk and uncertainty due to various factors affecting Newmont Mining Corporation and our affiliates and subsidiaries. For a discussion of some of these factors, see the discussion in Item 1A, Risk Factors, of this report.
| ITEM 1. | BUSINESS (dollars in millions except per share, per ounce and per pound amounts) |
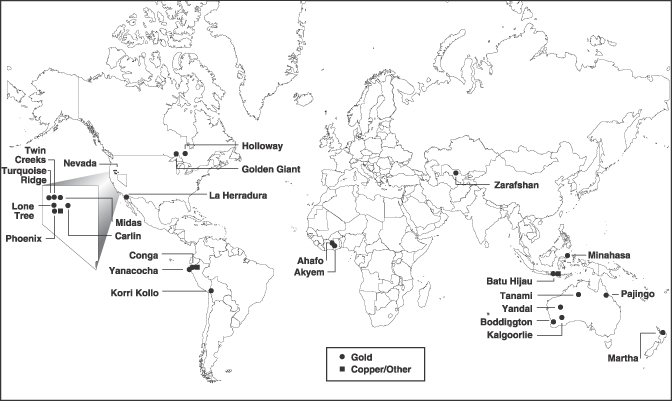
Newmont Mining Corporation is the world’s largestprimarily a gold producer with significant assets or operations in the United States, Australia, Peru, Indonesia, Ghana, Canada, Uzbekistan, Bolivia, New Zealand Ghana and Mexico. As of December 31, 2004,2005, Newmont had proven and probable gold reserves of 92.493.2 million equity ounces and an aggregate land position of approximately 51,50050,600 square miles (133,500(131,100 square kilometers). In 2004, we derived more than 65% of our equity gold sales from politically and economically stable countries, namely the United States, Australia and Canada. Newmont is also engaged in the production of silver, copper, and zinc.
principally through its Batu Hijau operation in Indonesia. Newmont Mining Corporation’s original predecessor corporation was incorporated in 1921 under the laws of Delaware. On February 13, 2002, at a special meeting of the stockholders of Newmont, stockholders approved adoption of an Agreement and Plan of Merger that provided for a restructuring of Newmont to facilitate the February 2002 acquisitions described below and to create a more flexible corporate structure. Newmont merged with an indirect, wholly-owned subsidiary, which resulted in Newmont becoming a wholly-owned subsidiary of a new holding company. The new holding company was renamed Newmont Mining Corporation. There was no impact to the consolidated financial statements of Newmont as a result of this restructuring and former stockholders of Newmont became stockholders of the new holding company. In this report, “Newmont,” the “Company” and “we” refer to Newmont Mining Corporation and/or our affiliates and subsidiaries.
On February 16, 2002, Newmont completed the acquisition of Franco-Nevada Mining Corporation Limited, a Canadian company, pursuant to a Plan of Arrangement. On February 20, 2002, Newmont gained control of Normandy Mining Limited (“Normandy”), an Australian company, through an off-market bid for all of the ordinary shares of Normandy. On February 26, 2002, when Newmont’s off-market bid for Normandy expired, Newmont had a relevantan interest in more than 96% of Normandy’s outstanding shares. Newmont exercised compulsory acquisition rights under Australian law to acquire all of the remaining shares of Normandy in April 2002. The results of
Of Newmont’s revenues in 2005, 2004, and 2003, 24%, 24% and 30%, respectively, were derived from the United States, with the balance derived from operations of Normandyin Peru, Australia, Indonesia, Canada, Mexico, Bolivia, New Zealand and Franco-Nevada have been included in this Annual Report and Newmont’s financial statements from February 16, 2002 forward.
In November 2003, Newmont completed a public offering of 25 million shares of common stock, receiving proceeds of approximately $1.0 billion.
Uzbekistan. For the years ended December 31,2005, 2004 and 2003, 39%, 34% and 2002, Newmont had34%, respectively, of revenues came from Peru; 19%, 22% and 25%, respectively, from Australia; and 8%, 9% and 1%, respectively, from Indonesia. In 2005, 2004 and 2003, 54%, 52% and 54%, respectively, of $4.52 billion, $3.16 billion,the Company’s long-lived assets were located in the United States, with the balance located in Peru, Australia, Indonesia, Ghana, Canada, Mexico, Bolivia, and $2.62 billion, respectively. InUzbekistan. For the years 2005, 2004 and 2003, 11%, 11% and 2002, Newmont had net income applicable to common shares12%, respectively, of $434.5 million, $475.7 millionthe Company’s long-lived assets were located in Peru; 7%, 10% and $154.3 million, respectively.(1)
16%, respectively, were located in Australia; and 17%, 19% and 10%, respectively, were located in Indonesia.
Newmont’s corporate headquarters are in Denver, Colorado, USA. In this report, “Newmont,” the “Company”, “our” and “we” refer to Newmont Mining Corporation and/or our affiliates and subsidiaries. All dollars are in millions, except per share, per ounce, and per pound amounts.
For additional information, see Item 7, Management’s Discussion and Analysis of Consolidated Financial Condition and Results of Operations.
Segment Information, Export Sales, etc.
Newmont predominantly operates in a single industry, namely exploration for and production of gold and copper. Newmont’sgold. Our major operations are in North America, South America,Nevada, Peru, Indonesia and Australia/New Zealand. Newmont also hasZealand and we have two significant development projects in Ghana, West Africa. NewmontGhana. We also hashave a Merchant Banking Segment and an Exploration Segment. See Note 2528 to the Consolidated Financial Statements for information relating to our business segments, our domestic and export sales, and our customers.
Gold
General.Newmont sold 7.0had consolidated sales of 8.6 million equity ounces of gold (6.5 million equity ounces) in 2005, 8.8 million ounces (7.0 million equity ounces) in 2004 7.4and 8.4 million ounces (7.4 million equity ouncesounces) in 2003. For 2005, 2004 and 2003, 85%, 82% and 7.6 million equity ounces in 2002.100%, respectively, of our net revenues were attributable to gold sales. Of our 2005 gold sales, approximately 39% came from Yanacocha, 28% from Nevada, 19% from Australia/New Zealand and 8% from Indonesia. References in this report to “equity ounces” or “equity pounds” mean that portion of gold or base metals respectively, produced, sold or included in proven and probable reserves that is attributable to our ownership or economic interest. For the years ended December 31, 2004, 2003 and 2002, 81%, 98% and 98%, respectively, of Newmont’s revenues were attributable to gold sales.
Approximately 39% of Newmont’s equity gold sales in 2004 and 2003 came from North American operations and 61% came from overseas operations. Of Newmont’s 2004 equity gold sales, approximately 22% came from Yanacocha and 7% from Indonesia. As of December 31, 2004, approximately 46% of our total long-lived assets were related to operations outside North America, with 19% of that total in Indonesia and 11% in Peru.
Most of Newmont’sour revenue comes from the sale of refined gold in the international market. The end product at each of Newmont’sour gold operations, however, is generally doré bars. In certain limited circumstances Newmont sells doré directly to a customer, but generally, because doréDoré is an alloy consisting mostly of gold but also containing silver, copper and other metals, doré bars aremetals. Doré is sent to refiners to produce bullion that meets the required market standard of 99.95% pure gold. Under the terms of refining agreements, the doré bars are refined for a fee, and Newmont’sour share of the refined gold and the separately-recovered silver are credited to Newmont’sour account or delivered to buyers, except in the case of the doré produced from Newmont’sour operation in Uzbekistan. Doré from that operation is refined locally and the refined gold is physically returned to Newmontus for sale in international markets.
Newmont has interests Gold sold from Batu Hijau is contained in two gold refining businesses: a 40% interest in the AGR Matthey joint venture in Australia, which is one of the world’s largest gold refineries and the largest distributor into the Asian market; and a 50% interest in European Gold Refineries SA in Switzerland, which owns 100% of a gold refining business and 66.65% of a gold distribution business.
concentrate.
Gold Uses.Gold has two main categories of use—productuse: fabrication and investment. Fabricated gold has a variety of end uses, including jewelry, electronics, dentistry, industrial and decorative uses, medals, medallions and official coins. Gold investors buy gold bullion, official coins and high-karat jewelry.
Gold Supply. The worldwide supply of gold consists of a combination of new production from mining and the draw-down of existing stocks of bullion and fabricated gold held by governments, financial institutions, industrial organizations and private individuals. In recent years, mine production has accounted for 60% to 70% of the total annual supply of gold.
Gold Price. The following table presents the annual high, low and average afternoon fixing prices for gold over the past ten years, expressed in U.S. dollars per ounce on the London Bullion Market.
Year | High | Low | Average | High | Low | Average | ||||||||||||
1995 | $ | 396 | $ | 372 | $ | 384 | ||||||||||||
1996 | $ | 415 | $ | 367 | $ | 388 | $ | 415 | $ | 367 | $ | 388 | ||||||
1997 | $ | 362 | $ | 283 | $ | 331 | $ | 362 | $ | 283 | $ | 331 | ||||||
1998 | $ | 313 | $ | 273 | $ | 294 | $ | 313 | $ | 273 | $ | 294 | ||||||
1999 | $ | 326 | $ | 253 | $ | 279 | $ | 326 | $ | 253 | $ | 279 | ||||||
2000 | $ | 313 | $ | 264 | $ | 279 | $ | 313 | $ | 264 | $ | 279 | ||||||
2001 | $ | 293 | $ | 256 | $ | 271 | $ | 293 | $ | 256 | $ | 271 | ||||||
2002 | $ | 349 | $ | 278 | $ | 310 | $ | 349 | $ | 278 | $ | 310 | ||||||
2003 | $ | 416 | $ | 320 | $ | 363 | $ | 416 | $ | 320 | $ | 363 | ||||||
2004 | $ | 454 | $ | 375 | $ | 410 | $ | 454 | $ | 375 | $ | 410 | ||||||
2005 (through March 3, 2005) | $ | 435 | $ | 411 | $ | 424 | ||||||||||||
2005 | $ | 536 | $ | 411 | $ | 444 | ||||||||||||
2006 (through February 22, 2006) | $ | 572 | $ | 524 | $ | 552 | ||||||||||||
Source: Kitco and Reuters |
On March 3, 2005,February 22, 2006, the afternoon fixing price for gold on the London Bullion Market was $430.20$553 per ounce and the spot market price of gold on the New York Commodity Exchange was $429.40$553 per ounce.
NewmontWe generally sells itssell our gold or doré at the prevailing market prices during the month in which the gold or doré is delivered to the customer. Newmont recognizesWe recognize revenue from a sale when the price is determinable, the gold or doré has been delivered, the title has been transferred to the customer and collection of the sales price is reasonably assured.
Copper
General. At December 31, 2004,2005, Newmont had a 52.875% economic interest (a 45% ownership interest) in the Batu Hijau mineoperation in Indonesia, which began production in 1999. Production at Batu Hijau is in the form of a copper/gold concentrate that is sold to smelters for smeltingfurther treatment and refining. During 2004,2005, Batu Hijau sold concentrates containing 378.8 million equity pounds of copper and 396,300 equity ounces of gold. The 100% owned Golden Grove operation in Western Australia produces concentrates that contain copper, gold, lead and zinc. Golden Grove sold concentrates containing 43.5572.7 million pounds of payable copper during 2004. Except for hedged commitments (see Note 16 to the Consolidated Financial Statements), the majorityand 720,500 ounces of Newmont’s copper production is sold under long-term contracts at market prices,payable gold. For 2005 and the balance on the spot market. For the years ended December 31, 2004, 200315% and 2002, 19%, 2% and 1%18%, respectively, of Newmont’sour net revenues were attributable to copper sales. During 2005, Newmont sold its Golden Grove copper/zinc operation in Australia.
Copper Uses. Refined copper the final product from the treatment of concentrates, is incorporated into wire and cable products for use in the construction, electric utility, communications and transportation industries. Copper is also used in industrial equipment and machinery, consumer products and a variety of other electrical and electronic applications, and is also used to make brass. Copper substitutes include aluminum, plastics, stainless steel and fiber optics. Refined, or cathode, copper is also an internationally traded commodity.
Copper Supply. The supply of copper consists of a combination of production from mining and recycled scrap material. Copper supply has not kept pace with increasing demand in recent years, resulting in price increases reflected in the chart below.
Copper Price. The price of copper is quoted on the London Metal Exchange in terms of dollars per metric ton of high grade copper. The volatility of the copper market is illustrated by the following table which showspresents the dollar per pound equivalent of the high, low and average prices of high grade copper on the London Metal Exchange in each ofover the lastpast ten years.
Year | High | Low | Average | High | Low | Average | ||||||||||||
1995 | $ | 1.47 | $ | 1.23 | $ | 1.33 | ||||||||||||
1996 | $ | 1.29 | $ | 0.83 | $ | 1.04 | $ | 1.29 | $ | 0.83 | $ | 1.04 | ||||||
1997 | $ | 1.23 | $ | 0.77 | $ | 1.03 | $ | 1.23 | $ | 0.77 | $ | 1.03 | ||||||
1998 | $ | 0.85 | $ | 0.65 | $ | 0.75 | $ | 0.85 | $ | 0.65 | $ | 0.75 | ||||||
1999 | $ | 0.84 | $ | 0.61 | $ | 0.71 | $ | 0.84 | $ | 0.61 | $ | 0.71 | ||||||
2000 | $ | 0.91 | $ | 0.73 | $ | 0.82 | $ | 0.91 | $ | 0.73 | $ | 0.82 | ||||||
2001 | $ | 0.83 | $ | 0.60 | $ | 0.72 | $ | 0.83 | $ | 0.60 | $ | 0.72 | ||||||
2002 | $ | 0.77 | $ | 0.64 | $ | 0.71 | $ | 0.77 | $ | 0.64 | $ | 0.71 | ||||||
2003 | $ | 1.05 | $ | 0.70 | $ | 0.81 | $ | 1.05 | $ | 0.70 | $ | 0.81 | ||||||
2004 | $ | 1.49 | $ | 1.06 | $ | 1.30 | $ | 1.49 | $ | 1.06 | $ | 1.30 | ||||||
2005 (through March 3, 2005) | $ | 1.54 | $ | 1.39 | $ | 1.46 | ||||||||||||
2005 | $ | 2.11 | $ | 1.39 | $ | 1.67 | ||||||||||||
2006 (through February 22, 2006) | $ | 2.33 | $ | 2.06 | $ | 2.20 | ||||||||||||
Source: London Metal Exchange |
On March 3, 2005,February 22, 2006, the closing price of high grade copper was $1.51$2.28 per pound on the London Metal Exchange.
Newmont generally avoids gold hedging. Newmont’sOur philosophy is to provide shareholders with leverage to changes in metal pricesthe gold price by selling itsour gold production at market prices. Newmont has, on a limited basis,We have entered into derivative contracts to protect the selling price for certain anticipated gold and copper production and to manage risks associated with commodities, interest rates and foreign currencies.
At the time of Normandy’s acquisition, three of Normandy’s affiliates had substantial derivative instrument positions. Normandy entered into gold forward sales contracts with fixed and floating gold lease rates, but did not enter into contracts that required margin calls and had no outstanding long-dated sold call options.
Following the acquisition, and in accordance with Newmont’s philosophy regarding gold hedging, the Normandy hedge positions were reduced by approximately 9.6 million ounces from February 16, 2002 to December 31, 2004. Gold forward sales contracts and other “committed hedging obligations” were reduced by 7.5 million ounces by delivering production into the contracts or through early close-outs. Similarly, uncommitted contracts for 2.1 million ounces were either delivered into, were allowed to lapse or were closed out early. As of December 31, 2004, the Normandy hedge positions had been reduced to 324,750 uncommitted ounces with a negative mark-to-market valuation of $9 million.
During the year ended December 31, 2004, Newmont entered into copper option collar contracts.
For additional information, see Hedging in Item 7A, Quantitative and Qualitative Disclosures about Market Risk, and Note 1621 to the Consolidated Financial Statements.
Merchant Banking is a “reportable segment” for financial reporting purposes. Merchant Banking, also referred to as Newmont Capital, manages a Royalty Portfolio,royalty portfolio, an Equity Portfolio, andequity portfolio, a Downstream Gold Refining downstream gold refining
business, and engages in Value Realizationportfolio management activities (managing interests in oil and gas, iron ore and coal properties as well as providing in-house investment banking and advisory services).
Merchant Banking manages Newmont’s Royalty Portfolio.royalty portfolio. Royalties generally offer a natural hedge against lower gold prices by providing free cash flow from a diversified set of assets with limited operating, capital or environmental risk, while retaining upside exposure to further exploration discoveries and reserve expansions. Merchant Banking seeks to grow Newmont’sthe royalty portfolio in a number of different ways, and looks for opportunities to acquire existing royalties from third parties or to create them in connection with transactions. Merchant Banking also identifies current Newmont properties or exploration targets for sale if they are incompatible with our core objectives.non-core in nature. In the case of a sale, Merchant Banking often seeks to retain royalty or other future participation rights in addition to cash or other consideration received in the sale. Through this process, Newmont intends to continue to benefit from any discoveries made by other operators on lands on which we have a
In 2005, our royalty and to obtain revenues from the properties without incurring operating or capital risk.
In 2004, Newmont’s royalty interests and investmentsequity portfolios generated $65.8 million$79 inRoyalty and dividend income. Newmont hasWe have royalty interests in Barrick Gold Corporation’s (“Barrick”) Goldstrike, and Eskay Creek, mines, Placer Dome’s Henty and Bald Mountain mines and Stillwater Mining’s Stillwater and East Boulder palladium-platinum mines, among others. NewmontWe also hashave a significant oil and gas royalty portfolio in western Canada. During the year, new royalties were added through property transactions and asset sales. A land lease program in Nevada is accelerating exploration of non-core lands with Newmont retaining royalties and future participation rights. For additional information regarding Newmont’sour royalty portfolio, see Item 2, Properties, Royalty Properties, below.
As of December 31, 2004,2005, Merchant Banking’s Equity Portfolioequity portfolio had a market value of approximately $0.5 billion.$940. The Equity Portfolioequity portfolio is primarily composed of our investments in Kinross Gold Corporation, Canadian Oil Sands Trust, Shore Gold, Inc., Mirimar Mining Corporation and Gabriel Resources, Ltd.
Merchant Banking also manages our interests in downstream gold refining and distribution businesses (40% interest in AGR Matthey Joint Venture (“AGR”) and 50% interest in European Gold Refineries (“EGR”)). Merchant Banking earned $2.6 million$4 inEquity income (loss) of affiliatesthrough its investments in AGR and EGR in 2004.2005.
Merchant Banking’s Value Realizationportfolio management activities include managing the reserve delineation program on our 100% owned heavy oil sands leases in Alberta, Canada, and advancing our other interests in coal, iron ore and natural gas.
Merchant Banking provides advisory services to Newmont to assist it in managing itsthe portfolio of operating and property interests. The Merchant Banking group helps Newmont maximize net asset value per share and increase cash flow, earnings and reserves by working with Newmont’sthe exploration, operations and finance teams to prioritize near-term goals within longer-term strategies. Merchant Banking is engaged in developing value optimization strategies for operating and non-operating assets, business development activities, potential merger and acquisition analysis and negotiations, monetizing inactive exploration properties, capitalizing on Newmont’s proprietary technology and know-how and acting as an internal resource for other corporate groups to improve and maximize business outcomes. In 2004,2005, Merchant Banking’sBanking provided assistance was provided in the sale of non-core properties, including BronzewingGolden Grove in Australia, PeramaOvacik in GreeceTurkey and Midwest UraniumMezcala in Canada. In addition, Merchant Banking participated in the restructuring of Australian Magnesium Corporation, which eliminated all remaining Newmont obligations.
Mexico.
A key aspect of these advisory services is assisting Newmont in extracting economies of scale with its partners and neighboring mines. Merchant Banking continues to evaluate district optimization opportunities in Nevada, Australia and Canada, covering a broad range of alternatives, including asset exchanges, unitization, joint ventures, partnerships, sales, spinouts and buyouts.
Exploration is a “reportable segment” for financial reporting purposes. Newmont’s exploration group is responsible for all activities, regardless of location, associated with the Company’s world-wide efforts to discover new mineralized material and, if successful, advance such mineralized material into proven and probable reserves.
Exploration work is conducted in areas surrounding our existing mines for the purpose of locating additional deposits and determining mine geology, and in other prospective gold regions globally. Near-mine exploration can result
in the discovery of new gold mineralization, which will receive the economic benefit of existing operating, processing, and administrative infrastructures. Greenfields exploration is where a discovery of new gold mineralization would likely require the investment of new capital to build a separate, stand-alone operation away from any of the Company’s existing infrastructure. Our exploration teams employ state-of-the-art technology, including airborne geophysical data acquisition systems, satellite location devices and field-portable imaging systems, as well as geochemical and geological prospecting methods, to identify prospective targets. NewmontWe spent $192.4 million$147 in 2005, $107 in 2004 $115.2 millionand $76 in 2003 and $88.9 million in 2002 onExploration research and development.
As of December 31, 2004, Newmont2005, we had proven and probable gold reserves of 92.493.2 million equity ounces. As a result of exploration efforts and the assumption of a higher gold price, NewmontWe added 12.49.4 million equity ounces to proven and probable reserves, in 2004, with 11.38.6 million equity ounces of depletion and divestitures and reclassifications during 2005. A reconciliation of the year.
In Nevada, exploration efforts resultedchanges in proven and probable reserves during the past three years is as follows:
| (millions of equity ounces) | 2005 | 2004 | 2003 | ||||||
Opening balance | 92.4 | 91.3 | 86.9 | ||||||
Additions(1)(2) | 9.4 | 12.4 | 15.1 | ||||||
Acquisitions | — | — | 2.3 | ||||||
Depletion | (8.3 | ) | (8.3 | ) | (8.8 | ) | |||
Reclassifications(3) | — | (2.0 | ) | — | |||||
Other divestments | (0.3 | ) | (1.0 | ) | (4.4 | ) | |||
Closing balance | 93.2 | 92.4 | 91.3 | ||||||
| (1) | Additions attributable to the Exploration Segment |
Total additions | 9.4 | 12.4 | 15.1 | ||||||
Previously valued in purchase accounting | (1.2 | ) | (1.9 | ) | (6.5 | ) | |||
Reclassifications(3) | — | (2.0 | ) | — | |||||
| 8.2 | 8.5 | 8.6 | |||||||
| (2) | The impact of the change in gold price on reserve additions was 2.6, 3.8 and 2.8 million equity ounces in 2005, 2004 and 2003, respectively. |
| (3) | Yanacocha reassessed the challenges involved in obtaining required permits for Cerro Quilish, primarily related to increased community concerns. Based upon this reassessment, Yanacocha reclassified 3.9 million ounces (2.0 million equity ounces) from proven and probable reserves to mineralized material not in reserve as of December 31, 2004. |
In Nevada, exploration efforts during 2005 added 2.2 million equity ounces to proven and probable reserves, offset by depletion of 34.02.9 million equity ounces, resulting in total proven and probable reserves in Nevada of 33.3 million equity ounces as of December 31, 2004, after depletion of 3.0 million equity ounces during 2004.
2005.
In Peru, equity gold reserves increased to 16.616.8 million ounces, after depletion of 2.02.4 million ounces and a reclassification of 2.0 million ounces to mineralized material not in reserves at Cerro Quilish.ounces. At Minas Conga, 4.51.6 million equity ounces of gold and 1.10.5 billion equity pounds of copper were added to proven and probable reserves. Minas Conga is a development project that currently consists of two gold-copper porphyry deposits located northeast of the Minera Yanacocha operating area in the provinces of Celendin, Cajamarca and Hualgayoc.
In Australia/New Zealand, the Company depleted 1.9replaced depletion of 1.7 million equity ounces during 2004.2005. Australia/New Zealand reported proven and probable reserves of 14.9 million equity ounces as of December 31, 2005.
At Batu Hijau, the Company depleted 0.4 billion equity pounds of copper and 0.5 million equity ounces of gold during 2005. Batu Hijau had proven and probable reserves of 15.1 million equity ounces at December 31, 2004.
At Batu Hijau, positive mine optimization efforts resulted in proven and probable reserves of 6.36.1 billion equity pounds of copper and 7.26.7 million equity ounces of gold as of December 31, 2004, which approximated 2003 reserves, notwithstanding depletion of approximately 450 million equity pounds of copper and 500,000 equity ounces of gold.2005.
In addition, exploration and mine development efforts in 2004 focused onAt the Ahafo and Akyem projects in Ghana, substantially increasing proven and probable reserves thereincreased by 3.01.6 million and 1.1 million equity ounces, respectively. As of December 31, 2004,2005, the Company reported reserves of 10.612.2 million ounces at Ahafo and 5.46.5 million equity ounces at Akyem.
For additional information, see Item 2, Properties, Proven and Probable Reserves.
Other than operating licenses for our mining and processing facilities, there are no third party patents, licenses or franchises material to Newmont’sour business. In many countries, however, we conduct our mining and exploration activities pursuant to concessions granted by, or under contract with, the host government. These countries include, among others, Australia, Bolivia, Canada, Ghana, Indonesia, Peru, New Zealand, Mexico and Uzbekistan. The concessions and contracts are subject to the political risks associated with foreign operations. See Item 1A, Risk Factors, Risks Related to Newmont Operations, below. For a more detailed description of our Indonesian ContractsContract of Work, see Item 2, Properties, below.
Condition of Physical Assets and Insurance
Our business is capital intensive, requiring ongoing capital investment for the replacement, modernization or expansion of equipment and facilities. For more information, see Item 7, Management’s Discussion and Analysis of Consolidated Financial Condition and Results of Operations, Liquidity and Capital Resources, below.
We maintain insurance policies against property loss and business interruption and insure against risks that are typical in the operation of our business, in amounts that we believe to be reasonable. Such insurance, however, contains exclusions and limitations on coverage, particularly with respect to environmental liability and political risk. There can be no assurance that claims would be paid under such insurance policies in connection with a particular event. See Item 1A, Risk Factors, Risks Related to Newmont Operations, below.
Newmont’s United States mining and exploration activities are subject to various federal and state laws and regulations governing the protection of the environment, including the Clean Air Act; the Clean Water Act; the Comprehensive Environmental Response, Compensation and Liability Act; the Emergency Planning and Community Right-to-Know Act; the Endangered Species Act; the Federal Land Policy and Management Act; the National Environmental Policy Act; the Resource Conservation and Recovery Act; and related state laws. These laws and regulations are continually changing and are generally becoming more restrictive. Newmont’sOur activities outside the United States are also subject to governmental regulations for the protection of the environment. In general, environmental regulations have not had, and are not expected to have, a material adverse impact on Newmont’sour operations or our competitive position.
We conduct our operations so as to protect public health and the environment and believe our operations are in compliance with applicable laws and regulations in all material respects. Each operating Newmont mine has a reclamation plan in place that meets all applicable legal and regulatory requirements. We have made, and expect to make in the future, expenditures to comply with such laws and regulations. We have made estimates of the amount of such expenditures, but cannot precisely predict the amount of such future expenditures. Estimated future reclamation costs are based principally on legal and regulatory requirements. At December 31, 2004, $410.3 million2005, $431 was accrued for reclamation costs relating to currently producing mineral properties.
Newmont isWe are also involved in several matters concerning environmental obligations associated with former, primarily historic, mining activities. Generally, these matters concern developing and implementing remediation plans at the various sites. We believe that the related environmental obligations associated with these sites are
similar in nature with respect to the development of remediation plans, their risk profile and the activities required to meet general environmental standards. Based upon our best estimate of our liability for these matters, $74.9 million$77 was accrued as of December 31, 20042005 for such obligations associated with properties previously owned or operated by Newmontus or our subsidiaries. These amounts are included inOther current liabilities andReclamation andremediation liabilities.Depending upon the ultimate resolution of these matters, we believe that it is reasonably possible that the liability for these matters could be as much as 81%101% greater or 34% lower than the amount accrued as of December 31, 2004.2005. The amounts accrued for these matters are reviewed periodically based upon facts and circumstances available at the time. Changes in estimates are charged to costs and expenses in the period estimates are revised.
For a discussion of the most significant reclamation and remediation activities, see Item 7, Management’s Discussion and Analysis of Consolidated Financial Condition and Results of Operations, and Notes 1513 and 2730 to the Consolidated Financial Statements, below.
There were approximately 14,00015,000 people employed by Newmont and our affiliates worldwide atas of December 31, 2004.
2005.
Certain statements contained in this report (including information incorporated by reference) are “forward-looking statements” within the meaning of Section 27A of the Securities Act of 1933, as amended, and
Section 21E of the Securities Exchange Act of 1934, as amended, and are intended to be covered by the safe harbor provided for under these sections. Our forward-looking statements include, without limitation:
Where we express an expectation or belief as to future events or results, such expectation or belief is expressed in good faith and believed to have a reasonable basis. However, our forward-looking statements are subject to risks, uncertainties, and other factors, which could cause actual results to differ materially from future results expressed, projected or implied by those forward-looking statements. Such risks include, but are not
limited to: the price of gold, copper and copper;other commodities; currency fluctuations; geological and metallurgical assumptions; operating performance of equipment, processes and facilities; labor relations; timing of receipt of necessary governmental permits or approvals; domestic and foreign laws or regulations, particularly relating to the environment and mining; domestic and international economic and political conditions; the ability of Newmont to obtain or maintain necessary financing; and other risks and hazards associated with mining operations. More detailed information regarding these factors is included in Item 1, Business, Item 1A, Risk Factors, and elsewhere throughout this report. Given these uncertainties, readers are cautioned not to place undue reliance on our forward-looking statements.
All subsequent written and oral forward-looking statements attributable to Newmont or to persons acting on its behalf are expressly qualified in their entirety by these cautionary statements. Newmont disclaims any intention or obligation to update publicly any forward-looking statements, whether as a result of new information, future events or otherwise, except as may be required under applicable securities laws.
Newmont maintains an internet web site atwww.newmont.com.www.newmont.com. Newmont makes available, free of charge, through the Investor Information section of the web site, its Annual Reports on Form 10-K, Quarterly Reports on Form 10-Q, Current Reports on Form 8-K, Section 16 filings and all amendments to those reports, as soon as reasonably practicable after such material is electronically filed with the Securities and Exchange Commission. Newmont has provided same day access to such reports through its web site since November 15, 2002. Newmont’s Corporate Governance Guidelines, the charters of key committees of its Board of Directors and its Code of Business Ethics and Conduct are also available on the web site. Any of the foregoing information is available in print to any stockholder who requests it by contacting Newmont’s Investor Relations Department.
The Company filed with the New York Stock Exchange (“NYSE”) on May 24, 2004,26, 2005, the annual certification by its Chief Executive Officer, certifying that, as of the date of the certification, he was not aware of any violation by the Company of the NYSE’s corporate governance listing standards, as required by Section 303A.12(a) of the NYSE Listed Company Manual. The Company has filed the required certifications under Section 302 of the Sarbanes-Oxley Act of 2002 regarding the quality of its public disclosures as Exhibits 31.1 and 31.2 to this report.
| ITEM 1A. | RISK FACTORS (dollars in millions except per share, per ounce and per pound amounts) |
Every investor or potential investor in Newmont should carefully consider the following risks, which have been separated into two groups:
Risks Related to the Mining Industry Generally
A Substantial or Extended Decline in Gold or Copper Prices Would Have a Material Adverse Effect on Newmont
Newmont’s business is dependent on the pricesrealized price of gold and copper, which are affected by numerous factors beyond Newmont’sour control. Factors tending to put downward pressure on the prices of gold and copper include:
Any drop in the pricesrealized price of gold or copper adversely impacts our revenues, profitsnet income and cash flows, particularly in light of our philosophy of avoiding gold hedging. Newmont hasWe have recorded asset write-downs in prior years as a resultduring periods of low gold prices in the past and may experience additional asset impairments as a result of low gold or copper prices in the future.
In addition, sustained low gold or copper prices can:
Also see the discussion in Item 1, Business, Gold or Copper Price.
Gold and Copper Producers Must Continually Obtain Additional Reserves
Gold and copper producers must continually replace reserves depleted by production. Depleted reserves must be replaced by expanding known ore bodies or by locating new deposits in order for producers to maintain production levels over the long term. Exploration is highly speculative in nature, involves many risks and frequently is unproductive. No assurances can be given that any of our new or ongoing exploration programs will result in new mineral producing operations. Once mineralization is discovered, it maywill likely take many years from the initial phases of drillingexploration until production is possible, during which time the economic feasibility of production may change.
Estimates of Proven and Probable Reserves Are Uncertain
��
Estimates of proven and probable reserves are subject to considerable uncertainty. Such estimates are, to a large extent, based on interpretations of geologic data obtained from drill holes and other sampling techniques. Producers use feasibility studies to derive estimates of capital and operating costs based upon anticipated tonnage and grades of ore to be mined and processed, the predicted configuration of the ore body, expected recovery rates of metals from the ore, the costs of comparable facility,facilities, the costs of operating and processing equipment operating costs, and other factors. Actual operating costs and economic returns on projects may differ significantly from original estimates. Further, it may take many years from the initial phase of drillingexploration before production is possible and, during that time, the economic feasibility of exploiting a discovery may change.
Increased Costs Could Affect Profitability
Costs at any particular mining location frequently are subject to variation from one year to the next due to a number of factors, such as changing ore grade, changing metallurgy and revisions to mine plans in response to the physical shape and location of the ore body. In addition, costs are affected by the price of commodities, such as fuel, electricity and electricity. Such commoditieslabor. Commodity costs are at times subject to volatile price movements, including increases that could make production at certain operations less profitable. Reported costs may be affected by changes in accounting standards. A material increase in costs at any significant location could have a significant effect on Newmont’s profitability.
Mining Accidents or Other Adverse Events or Conditions at a Mining Location Could Reduce Our Production Levels
At any of Newmont’s operations, production may fall below historic or estimated levels as a result of mining accidents such as a pit wall failure in an open pit mine, or cave-ins or flooding at underground mines. In addition, production may be unexpectedly reduced at a location if, during the course of mining, unfavorable ground conditions or seismic activity are encountered; ore grades are lower than expected; the physical or metallurgical characteristics of the ore are less amenable to mining or treatment than expected; or our equipment, processes or facilities fail to operate properly or as expected.
Mining Companies Are Subject to Extensive Environmental Laws and Regulations
Newmont’s exploration, mining and processing operations are regulated in all countries in which we operate under various federal, state, provincial and local laws relating to the protection of the environment, which generally include air and water quality, hazardous waste management and reclamation. Delays in obtaining, or failure to obtain, government permits and approvals may adversely impact our operations. The regulatory environment in which Newmont operates could change in ways that would substantially increase costs to achieve compliance, or otherwise could have a material adverse effect on Newmont’s operations or financial position. For a more detailed discussion of potential environmental liabilities, see the discussion in Environmental Matters, Note 2730 to the Consolidated Financial Statements.
Risks Related to Newmont Operations
Our Operations Outside North America and Australia Are Subject to Risks of Doing Business Abroad
Exploration, development and production activities outside of North America and Australia are potentially subject to political and economic risks, including:
Consequently, Newmont’s exploration, development and production activities outside of North America and Australia may be substantially affected by factors beyond Newmont’s control, any of which could materially
adversely affect Newmont’s financial position or results of operations. Furthermore, in the event ofif a dispute arisingarises from such activities, Newmont may be subject to the exclusive jurisdiction of courts outside North America or Australia, which could adversely affect the outcome of a dispute.
Newmont has substantial investments in Indonesia, a nation that since 1997 has undergone financial crises and devaluation of its currency, outbreaks of political and religious violence, changes in national leadership, and the secession of East Timor, one of its former provinces. These factors heighten the risk of abrupt changes in the national policy toward foreign investors, which in turn could result in unilateral modification of concessions or contracts, increased taxation, denial of permits or permit renewals or expropriation of assets. If this were to occur with respect to the Batu Hijau Contract of Work,operation, Newmont’s financial condition and results of operations could be materially adversely affected.
In July 2004, a criminal complaint was filed against P.T. Newmont Minahasa Raya (“PTNMR”),PTNMR, the Newmont subsidiary that operated the Minahasa mine in Indonesia, alleging environmental pollution relating to submarine tailings placement into nearby Buyat Bay. The Indonesian police detained five PTNMR employees during September and October of 2004. The police investigation and the detention of PTNMR’s employees was declared illegal by the South Jakarta District Court in December 2004, but in March 2005, the Indonesian Supreme Court upheld the legality of 2004,the police investigation, and the police have appealed that decisionturned their evidence over to the Indonesian Supreme Court. A civil lawsuit, which waslocal prosecutor. In July 2005, the prosecutor filed by three residents ofan indictment against PTNMR and its President Director, alleging environmental pollution at Buyat Pante, a village located nearBay. After the Minahasa mine, was settled without paymentcourt rejected motions to dismiss the plaintiffsproceeding, the prosecutor called its first witnesses in December 2004. In addition, onOctober 2005. The trial is continuing and is expected to conclude in mid-2006.
On March 9, 2005, the Indonesian Ministry of the Environment reportedly filed a civil lawsuit against PTNMRPT Newmont Minahasa Raya (“PTNMR”) and itsit’s President Director in relation to these allegations.
allegations, seeking in excess of $100 in monetary damages. In October 2005, PTNMR filed an objection to the court’s jurisdiction, contending that the Government previously agreed to resolve any disputes through out-of-court conciliation or arbitration. The Court upheld PTNMR’s objection and dismissed the case in November 2005. The Government filed a notice appeal of this ruling. On February 16, 2006, PTNMR and the Government of the Republic of Indonesia signed an agreement settling the civil lawsuit. Under the terms of the agreement, the Government and PTNMR will nominate members to an independent scientific panel that will develop and implement a ten-year environmental monitoring and assessment program to make a definitive, scientific conclusion regarding the condition of Buyat Bay. PTNMR is required to fund specific remedial measures if, as a result of its mining operations, pollution has occurred. The agreement also provides for enhanced community development programs in North Sulawesi. PTNMR will provide initial funding of $12 to cover the cost of the monitoring and community development programs. Over a ten year period, PTNMR will contribute an additional $18. The funds will be managed by an organization governed by interested stakeholders. Accountability for the funds will be ensured through yearly reports that will be made available to the public. The transparency of the scientific panel’s activities will also be assured through annual reports to the public. The agreement is expected to end the civil lawsuit against PTNMR.
Independent sampling and testing of Buyat Bay water and fish, as well as area residents, conducted by the World Health Organization and the Australian Commonwealth Scientific and Industrial Research Organization,
confirm that PTNMR has not polluted the Buyat Bay environment, and, therefore, has not adversely affected the fish in theBuyat Bay or the health of nearby residents. The Company remains steadfast that it has not caused pollution or health problems and will continue to vigorously defend itself against these allegations. However, Newmont cannot predict the outcome of these actionsthe criminal proceeding or whether additional legal actions may occur. Any of these actionsThis matter could adversely affect our ability to operate in Indonesia.
During the last several years, Minera Yanacocha, of which Newmont owns a 51.35% interest, has been the target of numerous local political protests, including ones that blocked the road between the Yanacocha mine complex and the cityCity of Cajamarca in Peru. During SeptemberIn 2004, individuals fromlocal opposition to the Cajamarca region conducted a sustained blockade of the road in protest of drilling activities at Cerro Quilish one of the ore deposits within theproject became so pronounced that Yanacocha mine complex. Yanacocha suspended alldecided to relinquish its drilling activities at Cerropermit for Quilish and the blockadedeposit was resolved. At the request of Yanacocha, the Cerro Quilish drilling permit was revoked in November 2004. Newmont has reassessed the challenges involved in obtaining required permits for Cerro Quilish primarily related to increased community concerns. Based upon this reassessment, Newmont has reclassified the deposit’s 1.98 million equity gold ounces from proven and probable reserves to mineralizednon-reserve mineralization. In 2005, no material not in reserves as of December 31, 2004.roadblocks or protests
occurred involving Yanacocha. We cannot predict, however, whether thesesuch incidents will continue, nor can werecur in the future, and the recurrence of significant community opposition or protests could adversely affect Minera Yanacocha’s assets and operations in Peru, and could lead to the reclassification of other deposits out of reserves.
Presidential, congressional and regional elections will take place in Peru in 2006, and a new national government will take office in July 2006. We cannot predict the new government’s continuing positions on foreign investment, mining concessions, land tenure, environmental regulation or taxation. The continuation or intensification of protests or aA change in prior governmentalgovernment positions on these issues could adversely affect Yanacocha’s assets and operations in Peru.
During 2005, relations between the Republic of Uzbekistan and the U.S. deteriorated significantly, and in July 2005 the government of Uzbekistan evicted the U.S. military from its base at Karshi-Khanabad, south of Tashkent. A further deterioration of relations between the two countries could adversely affect our ability to operate in Uzbekistan.
Recent violence committed by radical elements in Indonesia and other countries, and the presence of U.S. forces in Iraq and Afghanistan, may increase the risk that operations owned by U.S. companies will be the target of further violence. If any of Newmont’s operations were so targeted it could have an adverse effect on our business.
Our Success May Depend on Our Social and Environmental Performance
Newmont’s ability to operate successfully in communities around the world will likely depend on our ability to develop, operate and close mines in a manner that is consistent with the health and safety of our employees, the protection of the environment, and the creation of long-term economic and social opportunities in the communities in which we operate. Newmont has implemented a management system designed to promote continuous improvement in health and safety, environmental performance and community relations. However, our ability to operate may be adversely impacted by accidents or events detrimental (or perceived to be detrimental) to the health and safety of our employees, the environment or the communities in which we operate.
Remediation Costs for Environmental Liabilities May Exceed the Provisions We Have Made
Newmont has conducted extensive remediation work at two inactive sites in the United States. At one of these sites, remediation requirements have not been finally determined, and, therefore, the final cost cannot be determined. At a third site in the United States, an inactive uranium mine and mill formerly operated by a subsidiary of Newmont, remediation work at the mill is ongoing, but remediation at the mine is subject to dispute and has not yet commenced. The environmental standards that may ultimately be imposed at this site remain uncertain and there is a risk that the costs of remediation may exceed the provision that has been made for such remediation by a material amount.
For a more detailed discussion of potential environmental liabilities, see the discussion in Environmental Matters, Note 30 to the Consolidated Financial Statements.
Whenever a previously unrecognized remediation liability becomes known, or a previously estimated reclamation cost is increased, the amount of that liability orand additional cost canwill be recorded at that time and could materially reduce net income in that period.
The Use of Hedging Instruments May Prevent Gains Being Realized from Subsequent Price Increases
Newmont does not intend to enter into material new gold hedging positions and intends to continue to decrease gold hedge positions over time by opportunistically delivering gold into our existingoutstanding hedge contracts, or
by seeking to eliminate our hedge position when economically attractive. Nonetheless, Newmont currently has gold hedging positions and may, from time-to-time, enter into hedge contracts for copper, other metals or commodities, interest rates or foreign currencies. In 2004, Newmont entered into copper hedging positions covering approximately 459 million pounds of copper. If the gold, copper or other metal price rises above the price at which future production has been committed under these hedge instruments, Newmont will have an
opportunity loss. However, if the gold, copper or other metal price falls below that committed price, Newmont’s revenues will be protected to the extent of such committed production. In addition, we may experience losses if a hedge counterparty defaults under a contract when the contract price exceeds the gold, copper or other metal price.
For a more detailed description of the Newmont hedge positions, see the discussion in Hedging in Item 7A, Quantitative and Qualitative Disclosures About Market Risk, and Note 1621 to the Consolidated Financial Statements.
Currency Fluctuations May Affect Costs
Currency fluctuations may affect the costs that we incur at our operations. Gold is sold throughout the world based principally on the U.S. dollar price, but a portion of Newmont’s operating expenses are incurred in local currencies. The appreciation of non-U.S. dollar currencies against the U.S. dollar can increase the costs of gold production in U.S. dollar terms at mines located outside the United States, making such mines less profitable. The foreign currencies that primarily impact Newmont’s results of operations are the Australian and Canadian dollars.
During 2004,2005, the Australian and Canadian dollars strengthened by an average of 13%5% and 7%, respectively, against the U.S. dollar. This increased U.S. dollar reported operating costsCosts applicable to sales in Australia and Canada by approximately $56.6 million$24 and $4.8 million, respectively.$3, respectively from 2004 to 2005. For additional information, see Item 7, Management’s Discussion and Analysis of Consolidated Financial Condition and Results of Operations, Results of Operations, Foreign Currency Exchange Rates, below. For a more detailed description of how currency exchange rates may affect costs, see discussion in Foreign Currency in Item 7A, Quantitative and Qualitative Disclosures About Market Risk.
Our Level of Indebtedness May Affect Our Business
As of December 31, 2004,2005, Newmont had debt of $1.6 billion,$1,929, as compared to $1.1 billion$1,602 as of December 31, 2003.2004. We expect to spend significant funds on capital expenditures essential to existing operations as well as for acquisitions and new project development. Our level of indebtedness could have important consequences for our operations, including:
Newmont expects to be able to pay principal and interest on our debt by utilizing cash flow from operations, and Newmont’sour ability to meet these payment obligations will depend on our future financial performance, which will be affected by financial, business, economic and other factors. Newmont will not be able to control many of these factors, such as economic conditions in the markets in which Newmont operates. NewmontConsequently, we cannot be certain that our future cash flow from operations will be sufficient to allow us to pay principal and interest on our debt, fund required capital expenditures and meet our other obligations. If cash flow from operations is insufficient, we may be required to refinance all or part of our existing debt, sell assets, utilize existing cash balances, borrow more money or issue additional equity. We cannot be surecertain that we will be able to do soaccomplish any of these measures on commercially reasonable terms, if at all.
Our Interest in the Batu Hijau Mine in Indonesia May Be Reduced Under the Contract of Work
Under the Batu Hijau Contract of Work with the Indonesian government, beginning in 2005 and continuing through 2010, a portion of each foreign shareholders’shareholder’s equity interest in the Batu Hijau project must be offered for sale to
the Indonesian government or to Indonesian nationals. The price at which such interest must be offered for sale to the Indonesian parties is the highest of the then-current replacement cost, the price at which shares of the project company would be accepted for listing on the Jakarta Stock Exchange, or the fair market value of such interest in the project company as a going concern. An Indonesian national currently owns a 20% interest in Batu Hijau, which would require Newmont and requires the Newmont/Sumitomo collectively,partnership to offer a 3% interest to the Indonesian government or to Indonesian nationals in 2006. Pursuant to this provision of the Batu Hijau Contract of Work, it is possible that the ownership interest of the Newmont/Sumitomo partnership in Batu Hijau could be reduced to 49% by the end of 2010.
Costs Estimates and Timing of New Projects Are Uncertain
The capital expenditures and time required to develop new mines or other projects are considerable. Changes in costs or construction schedules can affect project economics. There are a number of factors that can affect costs and construction schedules, including, among others:
Occurrence of Events for Which We Are Not Insured May Affect Our Cash Flow and Overall Profitability
We maintain insurance policies to protect ourselvesthat mitigate against certain risks related to our operations. This insurance is maintained in amounts that we believe to beare reasonable depending upon the circumstances surrounding each identified risk. However, Newmont may elect not to have insurance for certain risks because of the high premiums associated with insuring those risks or for various other reasons; in other cases, insurance may not be available for certain risks. Some concern always exists with respect to investments in parts of the world where civil unrest, war, nationalist movements, political violence or economic crisis are possible. These countries may also pose heightened risks of expropriation of assets, business interruption, increased taxation and a unilateral modification of concessions and contracts. Newmont does not maintain insurance policies against political risk. Occurrence of events for which Newmont is not insured may affect our cash flow and overall profitability.
Our Business Depends on Good Relations with Our Employees
Newmont could experience labor disputes, work stoppages or other disruptions in production that could adversely affect us. AtAs of December 31, 2004,2005, unions represented approximately 20%37% of our worldwide work force. On that date,force: Newmont had 1,0981,243 employees at its Carlin, Nevada operations, 21178 employees in Canada at its Golden Giant operations, 2,7272,822 employees in Indonesia at its Batu Hijau operations, 4142 employees in New Zealand at its Martha operation, 325390 employees in Bolivia at its Kori Kollo operation, 628194 employees at its Australia operations, and 552667 employees in Peru at its Yanacocha operation, working under a collective bargaining agreement or similar labor agreement. Currently there are labor agreements in effect for all of these workers.
Our Earnings Could Be Affected by the Prices of Other Commodities
The earnings of Newmont also could be affected by the prices of other commodities such as fuel and other consumable items, although to a lesser extent than by the price of gold or copper. The prices of these commodities are affected by numerous factors beyond Newmont’s control.
Title to Some of Our Properties May Be Defective or Challenged
Although we have conducted title reviews of our properties, title review does not necessarily preclude third parties from challenging our title. While Newmont believeswe believe that it haswe have satisfactory title to itsour properties, some risk exists that some titles may be defective or subject to challenge. In addition, certain of our Australian properties could be subject to native title or traditional landowner claims, but such claims would not deprive us of the properties. For information regarding native title or traditional landowner claims, see the discussion under the AustraliaAustralia/New Zealand section of Item 2, Properties, below.
We Compete With Other Mining Companies
We compete with other mining companies to attract and retain key executives and other employees with technical skills and experience in the mining industry. We also compete with other mining companies for rights to mine properties containing gold and other minerals. There can be no assurance that Newmont will continue to attract and retain skilled and experienced employees, or to acquire additional rights to mine properties.
Certain Factors Outside of Our Control May Affect Our Ability to Support the Carrying Value of Goodwill
AtAs of December 31, 2004,2005, the carrying value of our goodwill was approximately $3.0 billion$2,879 or 24%21% of our total assets. Such goodwill has been assigned to our Merchant Banking ($1.6 billion)1,562) and Exploration ($1.1 billion)1,126) Segments, and to various mine site reporting units ($0.3 billion in the aggregate)Australia/New Zealand Segment ($191). This goodwill primarily arose in connection with our February 2002 acquisitions of Normandy and Franco-Nevada, and it represents the excess of the aggregate purchase price over the fair value of the identifiable net assets of Normandy and Franco-Nevada. We evaluate, on at least an annual basis, the carrying amount of goodwill to determine whether current events and circumstances indicate that such carrying amount may no longer be recoverable. This evaluation involves a comparison of the estimated fair value of our reporting units to their carrying values.
Based on valuations of the Merchant Banking and Exploration Segments, the Company concluded that the estimated fair values significantly exceeded the respective carrying values as of December 31, 2004.2005. The fair values of the reporting unitsMerchant Banking and Exploration Segments are based in part on certain factors that may be partially or completely outside of our control, such as the investing environment, the discovery of proven and probable reserves, commodity prices and other factors. In addition, certain of the assumptions underlying the December 31, 20042005 Merchant Banking and Exploration valuations may not be easily achieved by the Company, even though such assumptions were based on historical experience and the Company considers such assumptions to be reasonable under the circumstances.
At December 31, 2004, the $1.6 billion carrying value of the Merchant Banking Segment goodwill represented approximately 65% of the carrying value of the total assets of the Merchant Banking Segment. The December 31, 2004 discounted cash flow analysis for the equity portfolio sub-segment of the Merchant Banking Segment assumed: (i) a discount rate of 9%; (ii) a time horizon of ten years; (iii) pre-tax returns on investment ranging from 35% starting in 2005 and gradually declining to 15% in 2012 through 2014; (iv) an initial equity portfolio investment of approximately $0.5 billion; (v) capital infusions of $50 million annually for the next three years; and (vi) a terminal value of approximately $2.2 billion. The December 31, 2004 discounted cash flow analysis for the royalty portfolio sub-segment of the Merchant Banking Segment assumed: (i) a discount rate of 9%; (ii) a time horizon of ten years; (iii) an annual growth rate of 5% in the royalty portfolio; and (iv) a pre-tax rate of return on investment of 13%. The December 31, 2004 discounted cash flow analysis for the portfolio management sub-segment of the Merchant Banking Segment assumed: (i) a discount rate of 9%; (ii) a time horizon of ten years; and (iii) a pre-tax advisory fee of 5% on approximately $0.5 billion of transactions and value-added activities in 2005, with the dollar amount of such transactions and activities increasing by 5% annually thereafter. The December 31, 2004 discounted cash flow analysis for the value realization sub-segment of the Merchant Banking Segment assumed: (i) a discount rate of 9%; (ii) a time horizon of ten years; and (iii) a pre-tax annual return on investments of $4.2 million. The December 31, 2004 discounted cash flow analysis assumed a combined terminal value for the royalty portfolio, portfolio management and downstream gold refining sub-segments of approximately $0.7 billion.
At December 31, 2004, the $1.1 billion carrying value of the Exploration Segment goodwill represented approximately 98% of the carrying value of the total assets of the Exploration Segment. Based on the review of historical additionsAdditions to proven and probable reserves and on management’s expectation of the growth rate and levels of reserve additions that could be expected to continueused in the Company’s valuation models were based on management reviews of historical performance and expectations of future the discounted cash flow model developed to value the Exploration Segment at December 31, 2004 assumed that (i) the Exploration Segment
would be responsible for 11.0 million ounces of additions to proven and probable reserves in 2005; (ii) such additions would increase by 5% annually; and (iii) approximately 9.1%, 8.7%, 8.3% and 7.9% of additions in years 2005, 2006, 2007 and 2008, respectively, would represent ounces that had previously been valued in the Normandy purchase accounting. In addition, the discounted cash flow model for the Exploration Segment assumed, among other matters: (i) a 16-year time horizon, including a seven-year time lapse between additions to proven and probable reserves and the initiation of production and a five-year production period; (ii) a discount rate of 8%; (iii) a terminal value of approximately $5.8 billion; (iv) an average gold price of $375 per ounce during the time horizon; (v) total cash costs per ounce of $230; and (vi) capital costs of $50 per ounce. The Company believes that anyreserve additions. Any model used to value the Exploration Segment will need to take into account the relatively long time horizon required to evaluate the activities of the Exploration Segment. Reserve additions may vary significantly from year to year based on the timing of when proven and probable reserves can be reported under the Securities and Exchange Commission (“SEC”) Industry Guide 7. A period of several years may be required to advance a project from initial discovery to proven and probable reserves.
Based on valuations of various mine site reporting units in the Australia/New Zealand Segment, the Company concluded that the estimated fair values exceeded the respective carrying values as of December 31, 2005. The Company concluded that the estimated fair value of the Nevada Segment did not support the carrying value as of December 31, 2005 and recorded a $41 goodwill impairment charge. In 2004, the Company recorded goodwill and long-lived assets impairment charges of $52 and $6, respectively, relating to the Pajingo reporting unit in the Australia/NewZealand Segment. The Company’s fair value estimates are based on numerous assumptions and it is possible that actual fair value could be significantly different than these estimates, as actual future quantities of recoverable minerals, gold and other commodity prices, production levels, operating costs and capital costs are each subject to significant risks and uncertainties.
In the absence of any mitigating valuation factors, the Company’s failure to achieve one or more of the December 31, 20042005 valuation assumptions willmay over time result in an impairment charge. Accordingly, no assurance can be given that significant non-cash impairment charges will not be recorded in the future due to possible declines in the fair values of our reporting units. For a more detailed description of the estimates and assumptions involved in assessing the recoverability of the carrying value of goodwill, see Item 7, Management’s Discussion and Analysis of Consolidated Financial Condition and Results of Operations, Critical Accounting Policies, below.
Our accounting policies and methods of reporting financial condition, including accounting for goodwill, require certain estimates, assumptions and judgments for which there is no clear authoritative guidance. Management makes such estimates, assumptions and judgments in good faith based on what they believe is the best available information. The Company has received from the SEC two letters, dated December 27, 2005 and February 17, 2006, requesting additional information and additional disclosure regarding accounting for Exploration and Merchant Banking Segment goodwill. The Company is responding to these letters and will continue to work with the SEC to resolve any further issues it raises.
Our Ability to Recognize the Benefits of Deferred Tax Assets is DependantDependent on Future Cash Flows and Taxable Income
The Company recognizes the expected future tax benefit from deferred tax assets when the tax benefit is considered to be more likely than not of being realized. Otherwise, a valuation allowance is applied against deferred tax assets. Assessing the recoverability of deferred tax assets requires management to make significant estimates related to expectations of future taxable income. Estimates of future taxable income are based on forecasted cash flows from operations and the application of existing tax laws in each jurisdiction. To the extent that future cash flows and taxable income differ significantly from estimates, the ability of the Company to realize the deferred tax assets recorded at the balance date could be impacted. Additionally, future changes in tax laws in the jurisdictions in which the Company operates could limit the Company’s ability to obtain the future tax benefits represented by its deferred tax assets recorded at the balance sheet date.assets. At December 31, 2004,2005, the Company recorded $173.6 million and $491.7 million ofCompany’s current and long-term deferred tax assets were $159 and $517, respectively.
Returns for Investments in Pension Plans Are Uncertain
We maintain defined benefit pension plans for our employees, which provide for specified payments after retirement for certain employees. The ability of the pension plans to provide the specified benefits depends on our funding of the plans and returns on investments made by the plans. Returns, if any, on investments are subject to fluctuations based on investment choices and market conditions. A sustained period of low returns or losses on investments could require us to fund the pension plans to a greater extent than anticipated.
| ITEM 2. | PROPERTIES (dollars in millions except per share, per ounce and per pound amounts) |
Gold and Copper Processing Methods
Gold is extracted from naturally-oxidized ores by either heap leaching or milling, depending on the amount of gold contained in the ore and the amenability of the ore to treatment. Higher grade oxide ores are generally processed through mills, where the ore is ground into a fine powder and mixed with water in slurry, which then passes through a cyanide leaching circuit. Lower grade oxide ores are generally processed using heap leaching. Heap leaching consists of stacking crushed or run-of-mine ore on impermeable pads, where a weak cyanide solution is applied to the top surface of the heap to dissolve the gold. In both cases, the gold-bearing solution is then collected and pumped to process facilities to remove the gold by collection on carbon or by zinc precipitation directly from leach solutions.
Gold contained in ores that are not naturally oxidized can be directly milled if the gold is amenable to cyanidization, generally known as free milling sulfide ores. Ores that are not amenable to cyanidization, known as refractory ores, require more costly and complex processing techniques than oxide or free milling ore. Higher-grade refractory ores are processed through either roasters or autoclaves. Roasters heat finely ground ore with air and oxygen to a high temperature, burn off the carbon and oxidize the sulfide minerals that prevent efficient leaching. Autoclaves use heat, oxygen and pressure to oxidize sulfide minerals in the ore.
Some gold-bearing sulfide ores may be processed through a flotation plant or by bio-milling. In flotation, ore is finely ground, turned into slurry, then placed in a tank known as a flotation cell. Chemicals are added to the
slurry causing the gold-containing sulfides to float in air bubbles to the top of the tank, where they can be separated from waste particles that sink to the bottom. The sulfides are removed from the cell and converted into a concentrate that can then be processed in an autoclave or roaster to recover the gold. Bio-milling incorporates patented technology that involves inoculation of suitable crushed ore on a leach pad with naturally occurring bacteria strains, which oxidize the sulfides over a period of time. The ore is then processed through an oxide mill.
At Batu Hijau, mined ore containing copper and gold is crushed to a coarse size at the mine and then transported from the mine via conveyor to a concentrator. The ore is finely ground and then treated by successive stages of flotation, resulting in a concentrate of copper sulfides containing approximately 30% copper. The concentrate is transferred by pipeline to port facilities. At the port, the concentrate is dewatered and stored for later reclaiming and loading onto ships for transport to smelters.
Set forth below is a description of theNewmont’s significant production properties of Newmont and its subsidiaries. Total cash costs and total production costsproperties.Costs applicable to sales for each operation are presented in a table in the next section of this Item 2. Total cash costs and total production costs represent measures of performance that are not calculated in accordance with generally accepted accounting principles (“GAAP”). Management uses these non-GAAP financial measures to analyze the cash generating capacities and performance of Newmont’s mining operations. For a reconciliation of these non-GAAP measures toCosts Applicable to Sales as calculated and presented under GAAP, see Item 2, Properties, Operating Statistics.
North AmericaNevada
Nevada.Newmont has been mining gold in Nevada since 1965. Newmont’s Nevada operations include Carlin, located west of the city of Elko on the geologic feature known as the Carlin Trend, the Twin Creeks mine approximately 15 miles north of Golconda, the Lone Tree Complex near the town of Valmy, and the Midas mine near the town of the same name. Newmont also participates in the Turquoise Ridge joint venture with Placer
Dome,Barrick, which utilizes mill capacity at Twin Creeks. The Phoenix gold/copper project, located 10 miles south of Battle Mountain, is under construction with production expected in mid-2006.by April 2006. The Leeville underground project, located on the Carlin Trend northwest of the Carlin East underground mine, is under construction, with completion scheduled for late 2006.
Gold sales from Newmont’s Nevada operations totaled approximately 2.4 million equity ounces for 2004. Ore was2005 with ore mined from 13 open pit mines and four underground mines in 2004. In 2005, initial production will commence at Leeville on the Carlin Trend, the first shaft accessed mine constructed by Newmont in Nevada. Ore production is expected to begin in late 2005 with an annual production rate of 450,000 to 500,000 ounces. At Phoenix, construction commenced in 2004 for this gold/copper project. Upon completion in mid-2006, 370,000 to 420,000 ounces of gold and 16 to 40 million pounds of copper will be produced annually.
mines. At year-end 2004,2005, Newmont reported 3433.3 million equity ounces of gold reserves in Nevada. These reserves are distributed 80%Nevada, with 83% at open pit mines and 20%17% in underground mines. Process methods assumed over the reserve base are 74%76% refractory and 26%24% oxide. Refractory ores require more complex, higher cost processing methods. Refractory ore treatment facilities generated 66%69% of Nevada’s gold production in 2004,2005, compared with 71%68% in 2003,2004, and 66%72% in 2002. In 2005, the percentage of production from refractory treatment facilities is expected to be approximately 67%. Thereafter, the percentage of production from refractory ores is expected to range between 69%–75%.2003.
Newmont’sThe Nevada operations produce gold from a variety of ore types requiring different processing techniques depending on economic and metallurgical characteristics. To schedule the best use of processing capacity, the Company uses a linear programming model to guide the flow of both mining sequence selection and routing of ore streams to various plants. Higher-grade oxide ores are processed by conventional milling and cyanide leaching at Carlin (Mill 5), Twin Creeks (Juniper) and Lone Tree. Lower-grade material with suitable cyanide solubility is treated on heap leach pads at Carlin, Twin Creeks, Lone Tree and Lone Tree.Phoenix. Higher-grade refractory ores are processed through either a roaster at Carlin (Mill 6) or through autoclaves at Twin Creeks (Sage) and Lone Tree. Lower-grade refractory ores are processed by a flotation plant at Lone Tree and either bio-oxidation/flotation or direct flotation at Mill 5. Ore from the Midas mine is processed by conventional milling and Merrill-Crowe zinc precipitation. Activated carbon from the various leaching circuits is treated to produce gold ore at Carlin and Twin Creeks. Zinc precipitate at Midas is refined on-site.
Mining and the final placement of ore on the leach pads at Lone Tree is scheduled to end in third quarter of 2006. Residual leaching will continue thereafter. Milling of stockpiled ore at Lone Tree is expected to be completed in the first quarter of 2007.
Newmont owns, or controls through long-term mining leases and unpatented mining claims, all of the minerals and surface area within the boundaries of the present Nevada mining operations (except for the Turquoise Ridge and Getchelljoint venture described below). The long-term leases extend for at least the anticipated mine life of those deposits. With respect to a significant portion of the Gold Quarry mine at Carlin, Newmont owns a 10% undivided interest in the mineral rights and leases the remaining 90%, on which Newmont pays a royalty equivalent to 18% of the mineral production. The remainder of the Gold Quarry mineral rights are wholly-owned or controlled by Newmont, in some cases subject to additional royalties. With respect to certain smaller deposits in the Winnemucca Region, Newmont is obligated to pay royalties on production to third parties that vary from 2% to 5% of production.
Newmont has a 25% interest in a joint venture with a subsidiary of Placer Dome Inc.Barrick to operate the Turquoise Ridge and Getchell mines. Newmont has an agreement to provide up to 2,000 tons per day of milling capacity at Newmont’s Twin Creeks facility to the joint venture. Placer DomeBarrick is the operator of the joint venture for mining and ore delivery to process. Gold sales of 40,70052,300 ounces were attributed to Newmont in 2004,2005, based on its 25% ownership interest.
Newmont has an ore sale agreement with Barrick Goldstrike Mines to provide feed to thesome of Barrick’s facilities operated by Barrick on the Carlin Trend. The agreement provides for the sale of whole ore to Barrick. Newmont recognizesrecognized attributed gold sales, net of the sale price, resulting in gold salestreatment charges, of 28,200104,600 ounces in 2004.
Canada. Newmont’s Canadian operations include two underground mines. The Golden Giant mine (100% owned) is located approximately 25 miles (40 kilometers) east of Marathon in Ontario, Canada, and has been in production since 1985. The Holloway mine is located approximately 35 miles (56 kilometers) east of Matheson
in Ontario, and about 400 miles (644 kilometers) northeast of Golden Giant, and has been in production since 1996. The Holloway mine is owned by a joint venture in which Newmont has an 84.65% interest. The remaining 15.35% interest is held by Teddy Bear Valley Mines. In 2004, the Golden Giant mine sold 160,000 equity ounces of gold, and the Holloway mine sold 67,400 equity ounces of gold.
Mexico. Newmont has a 44% interest in the La Herradura mine, which is located in Mexico’s Sonora desert. La Herradura is operated by Industriales Peñoles. The mine is an open pit operation with run-of-mine heap leach recovery. La Herradura sold 68,800 equity ounces of gold in 2004.
2005.
South AmericaYanacocha, Peru
Peru. The properties of Minera Yanacocha S.R.L. (“Yanacocha”) are located approximately 375 miles (604 kilometers) north of Lima and 30 miles (48 kilometers) north of the city of Cajamarca. Yanacocha began production in 1993. Newmont holds a 51.35% interest in Yanacocha. TheYanacocha with the remaining interests are held by Compañia de Minas Buenaventura, S.A.A. (43.65%) and the International Finance Corporation (5%).
Yanacocha has mining rights with respect to a large land position. Yanacocha’s mining rights were acquired through assignments of concessions granted by the Peruvian government to Yanacocha and a related entity. These mining concessions provide for both the right to explore and exploit. However, Yanacocha must first obtain the respective exploration and exploitation permits, which are generally granted in due course. Yanacocha may retain mining concessions indefinitely by paying annual fees and, during exploitation, complying with production obligations or paying assessed fines. Mining concessions are freely assignable or transferable. In 2000, Newmont and Buenaventura consolidated their land holdings in northern Peru, folding them into Yanacocha. The consolidation increased Yanacocha’s land position from 100 to 535 square miles.
The Yanacocha operations contain the Minas Conga deposit, for which a feasibility study was completed in 2004. Yanacocha added 8.73.1 million ounces of gold (4.5(1.6 million equity ounces) and 2.21 billion pounds of copper (1.1 million(0.5 billion equity pounds) to proven and probable reserves at Minas Conga in 2004.
2005.
Yanacocha currently has five separate open pit mines, Carachugo, San José, Maqui Maqui, Cerro Yanacocha and La Quinua. Reclamation and/or backfilling activities in the mining areas of Carachugo, San José and Maqui Maqui are currently underway. Cerro Yanacocha and La Quinua are still active pits. In addition, Yanacocha has four leach pads and three processing facilities. Yanacocha’s gold sales for 20042005 totaled 3.043.3 million ounces (1.56(1.7 million equity ounces).
Cerro Quilish is one of the ore deposits within the Yanacocha complex. In July 2004, Yanacocha received a drilling permit for the Cerro Quilish deposit and commenced drilling activities to further define the deposit. During September 2004, individuals from the Cajamarca region conducted a sustained blockade of the road between the City of Cajamarca and the mine site, in protest of these exploration activities. Yanacocha suspended all drilling activities at Cerro Quilish and the blockade was resolved. At the request of Yanacocha, the Cerro Quilish drilling permit was revoked in November 2004. Yanacocha has reassessed the challenges involved in obtaining required permits for Cerro Quilish primarily related to increased community concerns. Based upon this reassessment, Yanacocha has reclassified 3.9 million ounces (1.98 million equity ounces) of gold from proven and probable reserves to mineralized material not in reserves as of December 31, 2004.
Bolivia. The Kori Kollo open pit mine is on a high plain in northwestern Bolivia near Oruro, on government mining concessions issued to a Bolivian corporation, Empresa Minera Inti Raymi S.A. (“Inti Raymi”), in which Newmont has an 88% interest. The remaining 12% is owned by Mrs. Beatriz Rocabado. Inti Raymi owns and operates the mine. In 2004, the mine sold 21,700 equity ounces of gold. Mining was completed and the mill closed in October 2003. Production has continued from residual leaching. Inti Raymi will begin processing oxide ores on leach pads from the Kori Chaca pit and reprocessing high-grade tailings on a new leach pad in 2005.
Australia/New Zealand
Prior to the acquisition of Normandy, Newmont owned a 50% interest in the Pajingo mine. The remaining 50% interest in Pajingo, and all other Australian and New Zealand properties described in this report, were acquired as part of the acquisition of Normandy in February 2002.
In Australia, mineral exploration and mining titles are granted by the individual states or territories. Mineral titles may also be subject to native title legislation.legislation or, in the Northern Territory, to Aboriginal freehold title legislation that entitles indigenous persons to compensation calculated by reference to the gross value of production. In 1992, the High Court of Australia held that Aboriginal people who have maintained a continuing connection with their land according to their traditions and customs may hold certain rights in respect of the land, such rights commonly referred to as native title. Since the High Court’s decision, Australia has passed legislation providing for the protection of native title and established procedures for Aboriginal people to claim these rights. The fact that native title is claimed with respect to an area, however, does not necessarily mean that native title exists, and disputes may be resolved by the courts.
Generally, under native title legislation, all mining titles granted before January 1, 1994 are valid. Titles granted between January 1, 1994 and December 23, 1996, however, may be subject to invalidation if they were not obtained in compliance with applicable legislative procedures, though subsequent legislation has validated some of these titles. After December 23, 1996, mining titles over areas where native title is claimed to exist became subject to legislative processes that generally give native title claimants the “right to negotiate” with the title applicant for compensation and other conditions. Native title holders do not have a veto over the granting of mining titles, but if agreement cannot be reached, the matter can be referred to the National Native Title Tribunal for decision.
Newmont does not expect that native title claims will have a material adverse effect on any of its operations in Australia. The High Court of Australia determined in an August 2002 decision, which refined and narrowed the scope of native title, that native title does not subsist in minerals in Western Australia and that the rights granted under a mining title would, to the extent inconsistent with asserted native title rights, operate to extinguish those native title rights. Generally, native title is only an issue for Newmont with respect to obtaining new mineral titles or moving from one form of title to another, for example, from an exploration title to a mining title. In these cases, the requirements for negotiation and the possibility of paying compensation may result in delay and increased costs for mining in the affected areas. Similarly, the process of conducting Aboriginal heritage surveys to identify and locate areas or sites of Aboriginal cultural significance can result in additional costs and delay in gaining access to land for exploration and mining-related activities.
In Australia, various ad valorem royalties are paid to state and territorial governments, typically based on a percentage of gross revenues.
Pajingo. The Pajingo mine(100% owned) is an underground mine located approximately 93 miles (150 kilometers) southwest of Townsville, Queensland and 45 miles (72 kilometers) south of the local township of Charters Towers. Prior to the Normandy acquisition, Newmont owned a 50% interest in Pajingo. Following the Normandy acquisition, Newmont owns 100% of Pajingo. In 2004,2005, Pajingo sold 251,400 equity192,000 ounces of gold.
Yandal.Jundee (Yandal). In 2004, theThe Yandal operations consisted of the Bronzewing and Jundee mines(100% owned) are situated approximately 435 miles (700 kilometers) northeast of Perth in Western Australia. In 2003, the operations included Wiluna, Bronzewing and Jundee. Operations at Bronzewing ceased during the second quarter of 2004 and the operations were sold the third quarter of 2004. The operationsWiluna operation was sold 379,300 equityin the fourth quarter of 2003. The Jundee mine is the remaining Yandal operation and sold 341,800 ounces of gold in 2004. Newmont owns a 100% interest in Newmont Yandal Operations Pty Ltd, which owns and operates the Yandal mines and nearby mineral exploration licenses. The Wiluna mine, previously part of the Yandal operations, was sold in December 2003. The Bronzewing mine was sold during the third quarter of 2004.2005.
Tanami. The Tanami operations include The Granites treatment plant and associated mining operations, which are located in the Northern Territory approximately 342 miles (550 kilometers) northwest of Alice Springs, adjacent to the Tanami highway, and the Dead Bullock Soak mining operations, approximately 25 miles (40 kilometers) west of The Granites. The Tanami operations also includeincluded the Groundrush deposit. Mining at the Groundrush open pit was completed in September 2004. Processing of stockpiles will continue throughcontinued into the first
third quarter of 2005. The Tanami operations have been wholly-owned since April 2003, when Newmont acquired the minority interests in Newmont NFM by means of a scheme of arrangement and buy-back offer under Australian law.
interests.
The operations are predominantly focused on the Callie underground mine at Dead Bullock Soak, with mill feed supplemented by production stockpiles from the Dead Bullock Soak open pit and Windy Hill at The Granites. Ore from all of these operations is processed through The Granites plant with the exception of ore from Groundrush, which iswas processed through the Tanami plant. During 2004,2005, the Tanami operations sold 658,000 equity493,700 ounces of gold.
Kalgoorlie. The Kalgoorlie operations comprise the Fimiston open pit (commonly referred to as the Super Pit) and Mt. Charlotte underground mine at Kalgoorlie-Boulder, 373 miles (600 kilometers) east of Perth. The mines are managed by Kalgoorlie Consolidated Gold Mines Pty Ltd for the joint venture owners, Newmont and Barrick, Gold Corporation, each of which holds a 50% interest. The Super Pit is Australia’s largest gold mine in terms of both gold production and total annual mining volume. During 2004,2005, the Kalgoorlie operations sold 468,400409,600 equity ounces of gold.
Martha. The Martha open pit mine is located within the town of Waihi, located approximately 68 miles (110 kilometers) southeast of Auckland, New Zealand. Newmont acquired the minority interests in the Martha mine in April 2003, giving it 100% ownership.2003. During 2004,2005, development commencedcontinued on the Favona underground deposit. Production from the Favona minedeposit is scheduled for 2006.2007. The operation sold 130,500 equity163,400 ounces of gold during 2004.2005. The Martha mine does not currently pay royalties. Under new royalty arrangements, a royaltyhowever, Newmont will apply to the Favona mine. The royalty rate is the greater ofpay 1% of gross revenues from gold and silver sales, or 5% of accounting profit.profit, whichever is greater, at Favona.
Boddington. Boddington is a development project located 81 miles (130 kilometers) southeast of Perth in Western Australia. At December 31, 2005 Boddington iswas owned by Newmont (44.4%), Anglo GoldAngloGold Ashanti Limited (33.3%) and Newcrest Mining Limited (22.2%). An updated feasibility studyIn February 2006, Newmont entered into an agreement to acquire Newcrest’s 22.22% interest in Boddington for A$225 plus applicable stamp duty and similar costs. When the primary ore bodytransaction closes, Newmont’s interest in Boddington will increase to two-thirds. Closing of the transaction is subject to Australian Foreign Investment Review Board, Western Australia Government and other approvals, and is expected to be completed by April 2006. In February 2006, Newmont’s Board of Directors approved the enddevelopment of 2005, and restructuring of current management arrangements is under discussion.
Golden Grove. Golden Grove is located in Western Australia, approximately 217 miles (350 kilometers) north of Perth. The principal products are zinc and copper concentrates. Golden Grove has two underground mines at the Scuddles and Gossan Hill deposits. Golden Grove sold 43.5 million pounds of copper, 114.8 million pounds of zinc and 19,300 ounces of by-product gold during 2004.Boddington project.
Batu Hijau, Indonesia
Newmont operates Batu Hijau, a producer of copper/gold concentrates, in Indonesia. The Minahasa gold operation completed production in 2004.
Batu Hijau. Newmontand has a 45% ownership interest in Batu Hijau. Newmont’s interest istherein, held through a partnership with an affiliate of Sumitomo Corporation. Newmont has a 56.25% interest in the partnership and the Sumitomo affiliate holds the remaining 43.75%. The partnership, in turn, owns 80% of P.T. Newmont Nusa Tenggara (“PTNNT”), the subsidiary that owns Batu Hijau. The remaining 20% interest in PTNNT is a carried interest held by P.T. Pukuafu Indah, an unrelated Indonesian company. Through September 30, 2004, PTNNT recorded cumulative losses and therefore Newmont has historically reported a 56.25% economic interest in Batu Hijau. As a result of higher metal prices, improved operating and financial results, and increased life of mine expectations regarding production, costs and economics, PTNNT’s cumulative losses had been recovered by the fourth quarter of 2004, thereby allowing for the payment of dividends. Under existing shareholder agreements, the Indonesian shareholder will be entitled to receive 6% of any dividends paid by PTNNT until such time as a loan to the IndonesiaIndonesian shareholder is fully repaid (including accrued interest). Newmont, therefore, decreased its reportedeconomic interest in Batu Hijau to 52.875%, effective October 1, 2004, reflecting 56.25% of the 94% of PTNNT’s dividends payable to the Newmont/Sumitomo partnership.
Prior to January 1, 2004, we accounted for our investment in Batu Hijau as an equity investment due to each of PTNNT shareholders’ significant participating rights in Batu Hijau’s business. Newmont has identified the Batu Hijau operation as a variable interest entity because of certain capital structures and contractual relationships. Newmont has alsorelationships, and determined that it is the primary beneficiary of Batu Hijau. Therefore, pursuant to FIN 46R, Newmont began to consolidateconsolidated Batu Hijau effective January 1, 2004. See Note 3 to the Consolidated Financial Statements for more information.
Batu Hijau is located on the island of Sumbawa, approximately 950 miles (1,529 kilometers) east of Jakarta. Batu Hijau is a large porphyry copper/gold deposit which Newmont discovered in 1990. Development and construction activities began in 1997 and start-up took placeoccurred in late 1999. In 2004,2005, copper sales were 378.8572.7 million pounds (302.8 million equity pounds,pounds), while gold sales were 396,300720,500 ounces (381,000 equity ounces.
ounces).
In Indonesia, rights are granted to foreign investors to explore for and to develop mineral resources within defined areas through Contracts of Work entered into with the Indonesian government. In 1986, NewmontPTNNT entered into a Contract of Work with the centralIndonesian government covering Batu Hijau, under which NewmontPTNNT was granted the exclusive right to explore in the contract area, construct any required facilities, extract and process the mineralized materials, and sell and export the minerals produced, subject to certain requirements including Indonesian government approvals and payment of royalties to the government. Under the Contract of Work, PTNNT has the right to continue operating the project for 30 years from operational start-up, or longer if approved by the Indonesian government.
Under the Batu Hijau Contract of Work, beginning in 2005 and continuing through 2010, a portion of the project must be offered for sale to the Indonesian government or to Indonesian nationals, equal to the difference between the following percentages and the percentage of shares already owned by the Indonesian government or Indonesian nationals (if such number is positive): 15%, by the end of the 2005; 23%, by the end of 2006; 30%, by the end of 2007; 37%, by the end of 2008, 44%, by the end of 2009; and 51%, by the end of 2010. The price at which such interest must be offered for sale to the Indonesian parties is the highest of the then-current replacement cost, the price at which shares of the project company would be accepted for listing on the Jakarta Stock Exchange, or the fair market value of such interest as a going concern.
An Indonesian national currently owns a 20% interest in Batu Hijau, which would require Newmont and requires the Newmont/Sumitomo partnership to offer a 3% interest in Batu Hijau to the Indonesian government or to Indonesian nationals in 2006. Pursuant to this provision, it is possible that the ownership interest of the Newmont/Sumitomo partnership in Batu Hijau could be reduced to 49% by the end of 2010.
Other Operations
Minahasa.Canada. Newmont’s Canadian operations include two underground mines. The Golden Giant mine (100% owned) is located approximately 25 miles (40 kilometers) east of Marathon in Ontario, Canada, and has been in production since 1985. Mining operations at Golden Giant were completed in December 2005 with final mill production and gold sales expected in the first quarter of 2006. In 2005, the Golden Giant mine sold 162,000 ounces of gold. The Holloway mine is located approximately 35 miles (56 kilometers) east of Matheson in Ontario, and about 400 miles (644 kilometers) northeast of Golden Giant, and has been in production since 1996. The Holloway mine is 100% owned as of October 2005. At December 31, 2005 the Company classified the Holloway mine as an asset held for sale. Operating results for Holloway have been reclassified to discontinued operations for all periods presented.
Mexico. Newmont has a 44% interest in the La Herradura mine, which is located in Mexico’s Sonora desert. La Herradura is operated by Industriales Peñoles and comprises an open pit operation with run-of-mine heap leach processing. La Herradura sold 80,200 equity ounces of gold in 2005.
Bolivia. The Kori Kollo open pit mine is on a high plain in northwestern Bolivia near Oruro, on government mining concessions issued to a Bolivian corporation, Empresa Minera Inti Raymi S.A. (“Inti Raymi”), in which Newmont has an 88% interest. The remaining 12% is owned by Mrs. Beatriz Rocabado.
Inti Raymi owns and operates the mine. The mill was closed in October 2003 and production continued from residual leaching. In 2005, additional material from the stockpiles and Lla Llagua pit were placed on the existing leach pad and ore from the Kori Chaca pit was processed on a new leach pad. In 2005, the mine sold 83,200 equity ounces of gold.
Minahasa, Indonesia. Newmont owns 80% of Minahasa. TheMinahasa and the remaining 20% interest is a carried interest held by P.T. Tanjung Serapung, an unrelated Indonesian company. Prior to November 2001, 100% of Minahasa’s gold production was attributed to Newmont. As of November 2001, Newmont had recouped a sufficient amount of its investment in Minahasa to entitle the Indonesian shareholder to receive 6% of any dividends distributed after that date. As a result, 94% of Minahasa’s gold production has been attributed to Newmont since November 2001.
Minahasa,is located on the island of Sulawesi, approximately 1,500 miles (2,414 kilometers) northeast of Jakarta, was a Newmont discovery. Production began in 1996 and miningJakarta. Mining was completed in late 2001. The remaining stockpiles were processed by August2001 and gold production was completed in 2004. In 2004, Minahasa sold 70,200 equity ounces of gold. See Note 2730 to the Consolidated Financial Statements for additional information regarding Minahasa.
Central Asia
Zarafshan.Uzbekistan. Newmont has a 50% interest in the Zarafshan-Newmont Joint Venture in Uzbekistan. Ownership of the remaining 50% interest is divided between the State Committee for Geology and Mineral Resources and the Navoi Mining and Metallurgical Combine, each a state entity of Uzbekistan. The joint venture produces gold by crushing and leaching ore from existing stockpiles of low-grade oxide material from the nearby
government-owned Muruntau mine, located in the Kyzylkum Desert. The gold produced by Zarafshan-Newmont is sold in international markets for U.S. dollars. Zarafshan-Newmont sold 210,100122,700 equity ounces of gold in 2004.
2005.
The State Committee and Navoi furnish ore to Zarafshan-Newmont under an ore supply agreement. Under the agreement, the State Committee and Navoi are obligated to deliver 242.5 million tons of ore to Zarafshan- NewmontZarafshan-Newmont from various areas of the stockpiles designated into four different “Zones” under the agreement. As of December 31, 2004,2005, approximately 140.1156 million tons of ore have been delivered, leaving a balance of 102.487 million tons to be delivered from Zone 4. Initially,4 at an average ore from all Zones was to be delivered regardless of the gold price and the price of the ore was dependent on the grade of ore delivered.0.036 per ton. In May 2003, the parties amended the grade and pricing structure of the ore supply agreement with respect to ore to be delivered from Zone 4. Under the May 2003 amendment the parties agreed to a mine plan designed to achieve an average grade of at least 0.036 ounce per ton for ore from Zone 4. The amount paid for this ore is dependent on the average grade of ore and the average gold price during the period in which the ore is processed. In the eventFebruary 2006, Newmont, the State Committee and Navoi reached an agreement to amend the ore supply agreement. This amendment will reduce the average ore from Zone 4 having an average grade less thanto be provided from 0.036 ounce per ton in a given month and the average gold price during such month is less than $320to 0.032 ounce per ounce, the price of such ore will be discounted. At certain combinations of low ore grade and at gold prices less than $320 per ounce, the computed price may result in a credit to Zarafshan-Newmont, which will be offset against free cash distributions or future ore purchase payments due to the State Committee and Navoi.
Ovacik. The Ovacik mine, located in western Turkey 12 miles from the Aegean Sea and 66 miles (106 kilometers) north of the city of Izmir, commenced production in May 2001 and sold 110,000 equity ounces of gold during 2004. Newmont acquired the Ovacik mine in February 2002 as part of the Normandy acquisition. In August 2004, the Ovacik mine suspended operations as a result of a court decision ordering suspension of operating permits pending completion of certain additional permitting requirements and the submission of an updated environmental impact assessment. On March 1, 2005, the Ovacik mine was sold to a subsidiary of Koza Davetiye, a Turkish conglomerate. For additional information, see Item 7, Management’s Discussion and Analysis of Consolidated Financial Condition and Results of Operations, Results of Operations, below.
ton.
AfricaGhana, Development Projects
Newmont has two advanced development projects under construction in Ghana, in West Africa. The Ahafo project, located in the Brong Ahafo Region of Ghana, is 100% owned by Newmont following the acquisition of the remaining 50% of the Ntotoroso property from Moydow Mines International, Inc. in December 2003. CampDevelopment activities during 2005 included engineering, procurement and infrastructure construction has commenced, as well as earth works preparation forof the mill, the tailings facilitymine and the water storage dam.process facilities. Initial development costs at Ahafo are estimated at approximately $440 million,$475, with gold production expected to commence in the second half of 2006. The Ahafo project is anticipated to generateestimated average steady-state annual gold sales of approximately 500,000 to 550,000 ounces with higher productionstarting in the initial years.mid-2006. At December 31, 2004,2005, the Ahafo project had reserves of 10.612.2 million ounces of gold.
At December 31, 2005, Newmont also hasheld an 85% interest in the Akyem project, located in the Eastern Region of Ghana. The remaining 15% was held by Kenbert Mines Limited. In July 2005, Newmont’s Board of Directors approved the development of the Akyem project. Initial development costs are estimated at approximately $500, with gold production expected to commence in the second half of 2008. The Akyem project is anticipated to generate steady-state annual gold sales of approximately 500,000 ounces. At year-end 2005, the Akyem project had 5.46.5 million equity ounces of gold reserves. The remaining 15% interest is held by Kenbert Mines Limited.In January 2006, Newmont is currently updating and optimizing the feasibility study for Akyem with a view to making a development decision by mid-2005.acquired Kenbert’s interest is a carried interest until completion ofin the feasibility update and optimization.
Akyem project.
In December 2003, Ghana’s Parliament unanimously ratified an Investment Agreement between Newmont and the Government of Ghana. The Agreement establishes a fixed fiscal and legal regime, including fixed royalty and tax rates, for the life of any Newmont project in Ghana. Under the Agreement, Newmont will pay corporate income tax at athe Ghana statutory tax rate up(presently 28%) not to exceed 32.5% and fixed gross royalties on gold production of 3.0% (3.6% for any production from forest reserve areas). The Government of Ghana is also entitled to receive 10% of a project’s net cash flow after Newmont has recouped its investment and may acquire up to 20% of a project’s equity at fair market value on or after the 15th anniversary of such project’s commencement of production. The Investment Agreement also contains commitments with respect to job training for local Ghanaians, community development, purchasing of local goods and services and environmental protection.
The following tables detail Newmont’s operating statistics related to gold production and sales.
| Nevada | Other North America | Nevada | Yanacocha, Peru | |||||||||||||||||||||||||||||||||||||||||||||
Year Ended December 31, | 2004 | 2003 | 2002 | 2004 | 2003 | 2002 | 2005 | 2004 | 2003 | 2005 | 2004 | 2003 | ||||||||||||||||||||||||||||||||||||
Tons mined (000 dry short tons): | ||||||||||||||||||||||||||||||||||||||||||||||||
Open pit | 192,821 | 176,254 | 139,985 | 11,557 | 11,696 | 11,774 | 193,565 | 192,821 | 176,254 | 218,933 | 193,407 | 204,889 | ||||||||||||||||||||||||||||||||||||
Underground | 1,574 | 1,733 | 1,538 | 1,001 | 1,191 | 1,621 | 1,727 | 1,683 | 1,733 | N/A | N/A | N/A | ||||||||||||||||||||||||||||||||||||
Tons milled/processed (000): | ||||||||||||||||||||||||||||||||||||||||||||||||
Tons milled/processed (000 dry short tons): | ||||||||||||||||||||||||||||||||||||||||||||||||
Oxide | 4,626 | 2,914 | 5,164 | 1,004 | 1,228 | 1,628 | 5,645 | 4,626 | 2,914 | N/A | N/A | N/A | ||||||||||||||||||||||||||||||||||||
Refractory | 8,984 | 9,129 | 9,201 | N/A | N/A | N/A | 9,925 | 8,984 | 9,129 | N/A | N/A | N/A | ||||||||||||||||||||||||||||||||||||
Leach | 19,297 | 18,376 | 15,027 | 4,149 | 4,035 | 3,981 | 21,660 | 17,356 | 18,376 | 146,645 | 133,514 | 145,275 | ||||||||||||||||||||||||||||||||||||
Average ore grade (oz/ton): | ||||||||||||||||||||||||||||||||||||||||||||||||
Oxide | 0.125 | 0.140 | 0.119 | 0.232 | 0.260 | 0.230 | 0.108 | 0.125 | 0.140 | N/A | N/A | N/A | ||||||||||||||||||||||||||||||||||||
Refractory | 0.199 | 0.219 | 0.224 | N/A | N/A | N/A | 0.185 | 0.199 | 0.219 | N/A | N/A | N/A | ||||||||||||||||||||||||||||||||||||
Leach | 0.027 | 0.028 | 0.031 | 0.026 | 0.026 | 0.026 | 0.024 | 0.029 | 0.028 | 0.028 | 0.025 | 0.027 | ||||||||||||||||||||||||||||||||||||
Average mill recovery rate: | ||||||||||||||||||||||||||||||||||||||||||||||||
Oxide | 79.1 | % | 80.8 | % | 74.4 | % | 94.3 | % | 95.3 | % | 95.0 | % | 75.1 | % | 79.1 | % | 80.8 | % | N/A | N/A | N/A | |||||||||||||||||||||||||||
Refractory | 90.8 | % | 90.6 | % | 88.6 | % | N/A | N/A | N/A | 89.7 | % | 90.8 | % | 90.6 | % | N/A | N/A | N/A | ||||||||||||||||||||||||||||||
| Nevada | Other North America | |||||||||||||||||||||||||||||||||||||||||||||||
Year Ended December 31, | 2004 | 2003 | 2002 | 2004 | 2003 | 2002 | ||||||||||||||||||||||||||||||||||||||||||
Ounces produced (000) | 2,460.4 | 2,560.7 | 2,718.1 | 293.5 | 413.8 | 485.8 | ||||||||||||||||||||||||||||||||||||||||||
Equity ounces produced (000): | ||||||||||||||||||||||||||||||||||||||||||||||||
Ounces produced (000): | ||||||||||||||||||||||||||||||||||||||||||||||||
Oxide | 461.2 | 336.0 | 474.8 | 224.7 | 297.8 | 364.5 | 405.2 | 461.2 | 336.0 | N/A | N/A | N/A | ||||||||||||||||||||||||||||||||||||
Refractory | 1,544.8 | 1,834.2 | 1,805.7 | N/A | N/A | N/A | 1,671.3 | 1,666.7 | 1,834.2 | N/A | N/A | N/A | ||||||||||||||||||||||||||||||||||||
Leach | 332.5 | 390.5 | 437.6 | 68.8 | 116.0 | 121.3 | 357.1 | 332.5 | 390.5 | 3,333.1 | 3,017.3 | 2,851.1 | ||||||||||||||||||||||||||||||||||||
| 2,338.5 | 2,560.7 | 2,718.1 | 293.5 | 413.8 | 485.8 | 2,433.6 | 2,460.4 | 2,560.7 | 3,333.1 | 3,017.3 | 2,851.1 | |||||||||||||||||||||||||||||||||||||
Equity ounces sold (000) | 2,416.0 | 2,490.8 | 2,723.5 | 296.2 | 411.8 | 500.5 | ||||||||||||||||||||||||||||||||||||||||||
Ounces sold (000) | 2,444.1 | 2,538.0 | 2,490.8 | 3,327.5 | 3,039.9 | 2,858.7 | ||||||||||||||||||||||||||||||||||||||||||
Production costs per ounce: | ||||||||||||||||||||||||||||||||||||||||||||||||
Direct mining and production costs | $ | 295 | $ | 248 | $ | 207 | $ | 277 | $ | 221 | $ | 192 | $ | 346 | $ | 297 | $ | 244 | $ | 150 | $ | 144 | $ | 124 | ||||||||||||||||||||||||
Deferred stripping and other costs | (22 | ) | (20 | ) | 11 | (1 | ) | — | (1 | ) | (23 | ) | (22 | ) | (14 | ) | (8 | ) | (6 | ) | (1 | ) | ||||||||||||||||||||||||||
Cash operating costs | 273 | 228 | 218 | 276 | 221 | 191 | ||||||||||||||||||||||||||||||||||||||||||
Royalties and production taxes | 5 | 7 | 7 | 2 | 4 | 2 | 8 | 5 | 7 | 3 | 2 | 2 | ||||||||||||||||||||||||||||||||||||
Total cash costs | 278 | 235 | 225 | 278 | 225 | 193 | ||||||||||||||||||||||||||||||||||||||||||
Reclamation/accretion expense and other | 3 | — | 2 | 2 | 5 | 4 | ||||||||||||||||||||||||||||||||||||||||||
Reclamation/accretion expense | 2 | 2 | 3 | 2 | 2 | 2 | ||||||||||||||||||||||||||||||||||||||||||
Total costs applicable to sales | 281 | 235 | 227 | 280 | 230 | 197 | 333 | 282 | 240 | 147 | 142 | 127 | ||||||||||||||||||||||||||||||||||||
Depreciation, depletion and amortization | 52 | 57 | 44 | 79 | 84 | 73 | 51 | 50 | 55 | 62 | 65 | 56 | ||||||||||||||||||||||||||||||||||||
Total production costs | $ | 333 | $ | 292 | $ | 271 | $ | 359 | $ | 314 | $ | 270 | $ | 384 | $ | 332 | $ | 295 | $ | 209 | $ | 207 | $ | 183 | ||||||||||||||||||||||||
| Yanacocha, Peru | Other South America | |||||||||||||||||||||||||||||||||||||||||||||||
Year Ended December 31, | 2004 | 2003 | 2002 | 2004 | 2003 | 2002 | ||||||||||||||||||||||||||||||||||||||||||
Tons mined (000 dry short tons): | ||||||||||||||||||||||||||||||||||||||||||||||||
Open pit | 193,407 | 204,889 | 203,720 | N/A | 7,638 | 18,676 | ||||||||||||||||||||||||||||||||||||||||||
Tons milled/processed (000): | ||||||||||||||||||||||||||||||||||||||||||||||||
Refractory | N/A | N/A | N/A | N/A | 5,559 | 7,675 | ||||||||||||||||||||||||||||||||||||||||||
Leach | 133,514 | 145,275 | 148,297 | N/A | 3,696 | 6,479 | ||||||||||||||||||||||||||||||||||||||||||
Average ore grade: (oz/ton) | ||||||||||||||||||||||||||||||||||||||||||||||||
Refractory | N/A | N/A | N/A | N/A | 0.036 | 0.047 | ||||||||||||||||||||||||||||||||||||||||||
Leach | 0.025 | 0.027 | 0.023 | N/A | 0.017 | 0.018 | ||||||||||||||||||||||||||||||||||||||||||
Average mill recovery rate: | ||||||||||||||||||||||||||||||||||||||||||||||||
Refractory | N/A | N/A | N/A | N/A | 61.7 | % | 60.7 | % | ||||||||||||||||||||||||||||||||||||||||
| Yanacocha, Peru | Other South America | |||||||||||||||||||||||||||||||||||||||||||||||
Year Ended December 31, | 2004 | 2003 | 2002 | 2004 | 2003 | 2002 | ||||||||||||||||||||||||||||||||||||||||||
Ounces produced (000) | 3,017.3 | 2,851.1 | 2,285.6 | 25.2 | 176.2 | 284.1 | ||||||||||||||||||||||||||||||||||||||||||
Equity ounces produced (000): | ||||||||||||||||||||||||||||||||||||||||||||||||
Refractory | N/A | N/A | N/A | N/A | 112.9 | 195.9 | ||||||||||||||||||||||||||||||||||||||||||
Leach | 1,549.4 | 1,464.1 | 1,173.6 | 22.2 | 42.1 | 54.1 | ||||||||||||||||||||||||||||||||||||||||||
| 1,549.4 | 1,464.1 | 1,173.6 | 22.2 | 155.0 | 250.0 | |||||||||||||||||||||||||||||||||||||||||||
Equity ounces sold (000) | 1,561.0 | 1,467.9 | 1,176.9 | 21.7 | 158.5 | 249.4 | ||||||||||||||||||||||||||||||||||||||||||
Production costs per ounce: | ||||||||||||||||||||||||||||||||||||||||||||||||
Direct mining and production costs | $ | 135 | $ | 118 | $ | 123 | $ | 257 | $ | 197 | $ | 163 | ||||||||||||||||||||||||||||||||||||
Deferred stripping and other costs | (6 | ) | (4 | ) | (2 | ) | (13 | ) | (13 | ) | (7 | ) | ||||||||||||||||||||||||||||||||||||
Cash operating costs | 129 | 114 | 121 | 244 | 184 | 156 | ||||||||||||||||||||||||||||||||||||||||||
Royalties and production taxes | 6 | 6 | 4 | 16 | — | — | ||||||||||||||||||||||||||||||||||||||||||
Total cash costs | 135 | 120 | 125 | 260 | 184 | 156 | ||||||||||||||||||||||||||||||||||||||||||
Reclamation/accretion expense and other | 2 | 2 | 3 | 43 | 13 | 7 | ||||||||||||||||||||||||||||||||||||||||||
Total costs applicable to sales | 137 | 122 | 128 | 303 | 197 | 163 | ||||||||||||||||||||||||||||||||||||||||||
Depreciation, depletion and amortization | 70 | 62 | 57 | 94 | 38 | 48 | ||||||||||||||||||||||||||||||||||||||||||
Total production costs | $ | 207 | $ | 184 | $ | 185 | $ | 397 | $ | 235 | $ | 211 | ||||||||||||||||||||||||||||||||||||
| Australia/New Zealand | Batu Hijau(1) | Australia/New Zealand | Batu Hijau, Indonesia(1) | |||||||||||||||||||||||||||||||||||||||||||||
Year Ended December 31, | 2004 | 2003 | 2002 | 2004 | 2003 | 2002 | 2005 | 2004 | 2003 | 2005 | 2004 | 2003 | ||||||||||||||||||||||||||||||||||||
Tons mined (000 dry short tons): | ||||||||||||||||||||||||||||||||||||||||||||||||
Open pit | 64,083 | 73,468 | 72,387 | 235,455 | 231,073 | 240,484 | 60,691 | 64,083 | 73,468 | 225,838 | 235,455 | 231,073 | ||||||||||||||||||||||||||||||||||||
Underground | 4,806 | 6,744 | 5,631 | N/A | N/A | N/A | 4,023 | 4,806 | 6,744 | N/A | N/A | N/A | ||||||||||||||||||||||||||||||||||||
Tons milled/processed (000): | ||||||||||||||||||||||||||||||||||||||||||||||||
Tons milled/processed (000 dry short tons): | ||||||||||||||||||||||||||||||||||||||||||||||||
Oxide | 9,560 | 11,018 | 9,789 | N/A | N/A | N/A | 8,579 | 9,560 | 11,018 | N/A | N/A | N/A | ||||||||||||||||||||||||||||||||||||
Refractory | 7,142 | 8,071 | 7,056 | 54,243 | 49,819 | 51,754 | 7,314 | 7,142 | 8,071 | 50,210 | 54,243 | 49,819 | ||||||||||||||||||||||||||||||||||||
Average ore grade: (oz/ton) | ||||||||||||||||||||||||||||||||||||||||||||||||
Oxide | 0.150 | 0.151 | 0.153 | N/A | N/A | N/A | 0.147 | 0.150 | 0.151 | N/A | N/A | N/A | ||||||||||||||||||||||||||||||||||||
Refractory | 0.072 | 0.078 | 0.069 | 0.016 | 0.015 | 0.012 | 0.067 | 0.072 | 0.078 | 0.018 | 0.016 | 0.015 | ||||||||||||||||||||||||||||||||||||
Average mill recovery rate: | ||||||||||||||||||||||||||||||||||||||||||||||||
Oxide | 94.4 | % | 94.9 | % | 95.3 | % | N/A | N/A | N/A | 94.0 | % | 94.4 | % | 94.9 | % | N/A | N/A | N/A | ||||||||||||||||||||||||||||||
Refractory | 86.7 | % | 85.1 | % | 82.2 | % | 80.9 | % | 80.9 | % | 79.7 | % | 85.6 | % | 86.7 | % | 85.1 | % | 80.7 | % | 80.9 | % | 80.9 | % | ||||||||||||||||||||||||
Ounces produced (000): | ||||||||||||||||||||||||||||||||||||||||||||||||
Oxide | 1,185.6 | 1,365.5 | 1,671.1 | N/A | N/A | N/A | ||||||||||||||||||||||||||||||||||||||||||
Refractory | 409.4 | 453.2 | 421.2 | 731.8 | 718.8 | 600.8 | ||||||||||||||||||||||||||||||||||||||||||
| 1,595.0 | 1,818.7 | 2,092.3 | 731.8 | 718.8 | 600.8 | |||||||||||||||||||||||||||||||||||||||||||
Ounces sold (000) | 1,600.5 | 1,887.6 | 2,016.7 | 720.5 | 715.2 | N/A | ||||||||||||||||||||||||||||||||||||||||||
Production costs per ounce: | ||||||||||||||||||||||||||||||||||||||||||||||||
Direct mining and production costs | $ | 311 | $ | 259 | $ | 225 | $ | 146 | $ | 110 | $ | N/A | ||||||||||||||||||||||||||||||||||||
Deferred stripping and other costs | (10 | ) | 4 | (2 | ) | (5 | ) | 9 | N/A | |||||||||||||||||||||||||||||||||||||||
Royalties and production taxes | 13 | 14 | 14 | 9 | 8 | N/A | ||||||||||||||||||||||||||||||||||||||||||
Reclamation/accretion expense | 3 | 3 | 2 | 2 | 1 | N/A | ||||||||||||||||||||||||||||||||||||||||||
Total costs applicable to sales | 317 | 280 | 239 | 152 | 128 | N/A | ||||||||||||||||||||||||||||||||||||||||||
Depreciation, depletion and amortization | 74 | 67 | 61 | 47 | 39 | N/A | ||||||||||||||||||||||||||||||||||||||||||
Total production costs | $ | 391 | $ | 347 | $ | 300 | $ | 199 | $ | 167 | $ | N/A | ||||||||||||||||||||||||||||||||||||
| (1) |
|
|
| (2) | Batu Hijau sold 584,700 ounces of gold in 2003 (328,900 equity ounces). Batu Hijau was accounted for by the equity method in 2003. Had Batu Hijau been consolidated in 2003,Costs applicable to sales would have been $119 per ounce andDepreciation, depletion and amortization would have been $55 per ounce. |
| Australia/New Zealand | Batu Hijau(1) | Other Operations | Total Gold | |||||||||||||||||||||||||||||||||||
Year Ended December 31, | 2004 | 2003 | 2002 | 2004 | 2003 | 2002 | 2005 | 2004 | 2003 | 2005 | 2004 | 2003 | ||||||||||||||||||||||||||
Ounces produced (000) | 1,818.7 | 2,092.3 | 1,854.1 | 718.8 | 600.8 | 492.5 | ||||||||||||||||||||||||||||||||
Equity ounces produced (000): | ||||||||||||||||||||||||||||||||||||||
Ounces produced (000): | ||||||||||||||||||||||||||||||||||||||
Oxide | 1,235.8 | 1,547.7 | 1,353.8 | N/A | N/A | N/A | 161.8 | 264.8 | 402.3 | 1,752.6 | 2,091.5 | 2,409.4 | ||||||||||||||||||||||||||
Refractory | 582.9 | 523.7 | 426.2 | 398.5 | 337.9 | 277.0 | N/A | 63.8 | 218.7 | 2,812.5 | 2,902.5 | 2,474.1 | ||||||||||||||||||||||||||
Leach | 301.6 | 299.0 | 391.5 | 3,991.8 | 3,648.8 | 3,633.1 | ||||||||||||||||||||||||||||||||
| 1,818.7 | 2,071.4 | 1,780.0 | 398.5 | 337.9 | 277.0 | 463.4 | 627.6 | 1,012.5 | 8,556.9 | 8,642.8 | 8,516.6 | |||||||||||||||||||||||||||
Equity ounces sold (000) | 1,887.6 | 1,998.1 | 1,792.4 | 396.3 | 328.9 | 278.0 | ||||||||||||||||||||||||||||||||
Ounces sold (000) | 459.4 | 648.2 | 1,011.2 | 8,552.0 | 8,828.9 | 8,377.4 | ||||||||||||||||||||||||||||||||
Production costs per ounce: | ||||||||||||||||||||||||||||||||||||||
Direct mining and production costs | $ | 259 | $ | 227 | $ | 187 | $ | 110 | $ | 140 | $ | 127 | $225 | $215 | $ | 184 | $239 | $214 | $191 | |||||||||||||||||||
Deferred stripping and other costs | (1 | ) | (7 | ) | (8 | ) | 9 | (36 | ) | (14 | ) | (6) | (4) | (2 | ) | (12) | (6) | (5) | ||||||||||||||||||||
Cash operating costs | 258 | 220 | 179 | 119 | 104 | 113 | ||||||||||||||||||||||||||||||||
Royalties and production taxes | 14 | 14 | 10 | 9 | 17 | 9 | 5 | 5 | 4 | 7 | 6 | 7 | ||||||||||||||||||||||||||
Total cash costs | 272 | 234 | 189 | 128 | 121 | 122 | ||||||||||||||||||||||||||||||||
Reclamation/accretion expense and other | 3 | 1 | 5 | 1 | 4 | 3 | ||||||||||||||||||||||||||||||||
Reclamation/accretion expense | 5 | 4 | 3 | 2 | 2 | 2 | ||||||||||||||||||||||||||||||||
Total costs applicable to sales | 275 | 235 | 194 | 129 | 125 | 125 | 229 | 220 | 189 | 236 | 216 | 195 | ||||||||||||||||||||||||||
Depreciation, depletion and amortization | 67 | 60 | 74 | 40 | 54 | 54 | 63 | 73 | 67 | 60 | 60 | 58 | ||||||||||||||||||||||||||
Total production costs | $ | 342 | $ | 295 | $ | 268 | $ | 169 | $ | 179 | $ | 179 | $292 | $293 | $ | 256 | $296 | $276 | $253 | |||||||||||||||||||
| Other Indonesia | Central Asia | |||||||||||||||||||||||||||||||||||||
Year Ended December 31, | 2004 | 2003 | 2002 | 2004 | 2003 | 2002 | ||||||||||||||||||||||||||||||||
Tons mined (000 dry short tons): | ||||||||||||||||||||||||||||||||||||||
Open pit | N/A | N/A | N/A | 4,659 | 5,975 | 4,296 | ||||||||||||||||||||||||||||||||
Tons milled/processed (000): | ||||||||||||||||||||||||||||||||||||||
Oxide | N/A | N/A | N/A | 331 | 533 | 361 | ||||||||||||||||||||||||||||||||
Refractory | 441 | 697 | 717 | N/A | N/A | N/A | ||||||||||||||||||||||||||||||||
Leach | N/A | N/A | N/A | 7,894 | 8,080 | 7,867 | ||||||||||||||||||||||||||||||||
Average ore grade: (oz/ton) | ||||||||||||||||||||||||||||||||||||||
Oxide | N/A | N/A | N/A | 0.320 | 0.343 | 0.364 | ||||||||||||||||||||||||||||||||
Refractory | 0.158 | 0.156 | 0.213 | N/A | N/A | N/A | ||||||||||||||||||||||||||||||||
Leach | N/A | N/A | N/A | 0.042 | 0.043 | 0.053 | ||||||||||||||||||||||||||||||||
Average mill recovery rate: | ||||||||||||||||||||||||||||||||||||||
Oxide | N/A | N/A | N/A | 95.4 | % | 94.3 | % | 92.9 | % | |||||||||||||||||||||||||||||
Refractory | 90.5 | % | 91.0 | % | 90.9 | % | N/A | N/A | N/A | |||||||||||||||||||||||||||||
The following table details operating statistics related to copper production and sales.
| Batu Hijau, Indonesia(1) | ||||||||||||
Year Ended December 31, | 2005 | 2004 | 2003(2) | |||||||||
Tons milled/processed (thousands) | 50,210 | 54,243 | 49,819 | |||||||||
Average copper grade | 0.69 | % | 0.75 | % | 0.72 | % | ||||||
Average copper recovery rate | 86.7 | % | 87.8 | % | 88.6 | % | ||||||
Copper pounds produced (millions) | 596.0 | 716.9 | 634.1 | |||||||||
Copper pounds sold (millions) | 572.7 | 683.3 | N/A | |||||||||
Costs applicable to sales per pound | $ | 0.53 | $ | 0.45 | $ | N/A | ||||||
Total production cost per pound | $ | 0.68 | $ | 0.58 | $ | N/A | ||||||
| (1) |
Year Ended December 31, Ounces produced (000) Equity ounces produced (000): Oxide Refractory Leach Equity ounces sold (000) Production costs per ounce: Direct mining and production costs Deferred stripping and other costs Cash operating costs Royalties and production taxes Total cash costs Reclamation/accretion expense and other Total costs applicable to sales Depreciation, depletion and amortization Total production costs Other Indonesia Central Asia 2004 2003 2002 2004 2003 2002 63.8 99.3 154.1 309.8 391.3 383.2 N/A N/A N/A 104.8 172.6 124.2 59.9 92.3 130.5 N/A N/A N/A N/A 1.0 14.4 205.0 218.7 259.0 59.9 93.3 144.9 309.8 391.3 383.2 70.2 92.2 147.2 320.1 386.3 381.5 $ 248 $ 240 $ 212 $ 168 $ 137 $ 128 3 3 2 (6 ) (3 ) (1 ) 251 243 214 162 134 127 8 6 4 4 5 3 259 249 218 166 139 130 4 5 16 2 3 1 263 254 234 168 142 131 32 78 60 81 62 61 $ 295 $ 332 $ 294 $ 249 $ 204 $ 192
| Total Gold | |||||||||||
Year Ended December 31, | 2004 | 2003 | 2002 | ||||||||
Ounces produced (000) | 8,707.5 | 8,584.7 | 8,165.0 | ||||||||
Equity ounces produced (000): | |||||||||||
Oxide | 2,156.2 | 2,354.1 | 2,317.3 | ||||||||
Refractory | 2,456.4 | 2,563.1 | 2,558.3 | ||||||||
Leach | 2,177.9 | 2,232.4 | 2,060.0 | ||||||||
| 6,790.5 | 7,149.6 | 6,935.6 | |||||||||
Equity ounces sold for per ounce calculations (000) | 6,969.1 | 7,005.6 | 6,971.4 | ||||||||
Golden Grove by-product sales | 19.3 | 13.4 | 13.6 | ||||||||
Equity investments | N/A | 364.6 | 646.7 | ||||||||
Equity ounces sold (000) | 6,988.4 | 7,383.6 | 7,631.7 | ||||||||
Production costs per ounce: | |||||||||||
Direct mining and production costs | $ | 232 | $ | 205 | $ | 181 | |||||
Deferred stripping and other costs | (9 | ) | (10 | ) | 1 | ||||||
Cash operating costs | 223 | 195 | 182 | ||||||||
Royalties and production taxes | 8 | 8 | 7 | ||||||||
Total cash costs | 231 | 203 | 189 | ||||||||
Reclamation/accretion expense and other | 2 | 2 | 3 | ||||||||
Total costs applicable to sales | 233 | 205 | 192 | ||||||||
Depreciation, depletion and amortization | 62 | 61 | 58 | ||||||||
Total production costs | $ | 295 | $ | 266 | $ | 250 | |||||
The following table details Newmont’s operating statistics related to copper and zinc production and sales.
| Batu Hijau(1) | Golden Grove | |||||||||||||||||||||||
Year Ended December 31, | 2004 | 2003 | 2002 | 2004 | 2003 | 2002 | ||||||||||||||||||
Dry tons processed (000) | 54,243 | 49,819 | 51,754 | 1,366 | 1,406 | 1,273 | ||||||||||||||||||
Average copper grade | 0.75 | % | 0.72 | % | 0.72 | % | 3.1 | % | 4.6 | % | 4.7 | % | ||||||||||||
Average copper recovery rate | 87.8 | % | 88.6 | % | 89.0 | % | 88.1 | % | 90.9 | % | 90.7 | % | ||||||||||||
Average zinc grade | N/A | N/A | N/A | 10.4 | % | 12.4 | % | 13.9 | % | |||||||||||||||
Average zinc recovery rate | N/A | N/A | N/A | 88.8 | % | 89.9 | % | 87.7 | % | |||||||||||||||
Copper pounds produced (000) | 716,939 | 634,123 | 657,664 | 40,684 | 57,799 | 60,973 | ||||||||||||||||||
Equity copper pounds produced (000) | 397,510 | 356,694 | 369,936 | 40,684 | 57,799 | 60,973 | ||||||||||||||||||
Equity copper pounds sold (000) | 378,801 | 343,378 | 362,253 | 43,467 | 74,303 | 44,754 | ||||||||||||||||||
Zinc pounds produced (000) | N/A | N/A | N/A | 101,917 | 120,425 | 114,806 | ||||||||||||||||||
Zinc pounds sold (000) | N/A | N/A | N/A | 114,835 | 104,711 | 111,177 | ||||||||||||||||||
Copper cash cost per pound | $ | 0.60 | $ | 0.46 | $ | 0.45 | $ | 0.90 | $ | 0.59 | $ | 0.57 | ||||||||||||
Copper total production cost per pound | $ | 0.74 | $ | 0.60 | $ | 0.58 | $ | 1.23 | $ | 0.79 | $ | 0.86 | ||||||||||||
Zinc cash cost per pound | N/A | N/A | N/A | $ | 0.38 | $ | 0.19 | $ | 0.24 | |||||||||||||||
Zinc total production cost per pound | N/A | N/A | N/A | $ | 0.50 | $ | 0.31 | $ | 0.31 | |||||||||||||||
Reconciliation of Non-GAAP Measures
For all periods presented, total cash costs include charges for mining ore and waste associated with current period production, processing ore through milling and leaching facilities, by-product credits, production taxes, royalties and other cash costs. Certain gold mines produce silver as a by-product. Proceeds from the sale of by-products are reflected as credits to total cash costs. With the exception of Yanacocha and Golden Grove, such by-product sales have not been significant to the economics or profitability of the Company’s mining operations. See Item 7, Management’s Discussion and Analysis of Consolidated Financial Condition and Results of Operations. All of these charges and by-product credits are included inCosts applicable to sales. Charges for reclamation are also included inCosts applicable to sales,but are not included in total cash costs. Reclamation charges are included in total production costs, together with total cash costs andDepreciation, depletion and amortization. A reconciliation of total cash costs toCosts applicable to salesin total and by segment is provided below. Total production costs provide an indication of earnings before interest expense and taxes for Newmont’s share of mining properties, when taking into account the average realized price received for production sold, as this measure combinesCosts applicable to salesplusDepreciation, depletion and amortization,net of minority interest.
Total cash costs per ounce is a measure intended to provide investors with information about the cash generating capacities of these mining operations. Newmont’s management uses this measure for the same purpose and for monitoring the performance of its mining operations. This information differs from measures of performance determined in accordance with GAAP and should not be considered in isolation or as a substitute for measures of performance determined in accordance with GAAP. This measure was developed in conjunction with gold mining companies associated with the Gold Institute, a non-profit industry group no longer in existence, in an effort to provide a level of comparability; however, Newmont’s measures may not be comparable to similarly titled measures of other companies.
Reconciliation ofCosts applicable to sales-Gold to total cash costs and total production costs per ounce (unaudited):
For the Year Ended December 31, 2004 | Nevada | Golden Giant | Holloway | La Herradura | Total North America | Yanacocha | ||||||||||||||||||
| (dollars in millions except per ounce amounts) | ||||||||||||||||||||||||
Costs applicable to sales per financial statements | $ | 716.3 | $ | 47.6 | $ | 24.7 | $ | 10.1 | $ | 798.7 | $ | 432.6 | ||||||||||||
Minority interest | — | — | — | — | — | (218.8 | ) | |||||||||||||||||
Write-downs of stockpiles, ore on leach pads and inventories | — | — | — | — | — | — | ||||||||||||||||||
Reclamation/accretion expense | (5.6 | ) | (0.3 | ) | (0.1 | ) | (0.1 | ) | (6.1 | ) | (3.1 | ) | ||||||||||||
Purchased ore, smelting and refining, and other | (38.4 | ) | 0.2 | 0.1 | — | (38.1 | ) | (0.1 | ) | |||||||||||||||
Total cash costs for per ounce calculation | 672.3 | 47.5 | 24.7 | 10.0 | 754.5 | 210.6 | ||||||||||||||||||
Reclamation/accretion expense and other | 5.6 | 0.3 | 0.1 | 0.1 | 6.1 | 3.1 | ||||||||||||||||||
Depreciation, depletion and amortization | 126.8 | 11.4 | 7.0 | 5.0 | 150.2 | 198.0 | ||||||||||||||||||
Minority interest and other | — | — | — | — | — | (88.8 | ) | |||||||||||||||||
Total production cost for per ounce calculation | $ | 804.7 | $ | 59.2 | $ | 31.8 | $ | 15.1 | $ | 910.8 | $ | 322.9 | ||||||||||||
Equity ounces sold (000) | 2,416.0 | 160.0 | 67.4 | 68.8 | 2,712.2 | 1,561.0 | ||||||||||||||||||
Equity cash cost per ounce sold | $ | 278 | $ | 297 | $ | 367 | $ | 146 | $ | 278 | $ | 135 | ||||||||||||
Equity production cost per ounce sold | $ | 333 | $ | 370 | $ | 473 | $ | 220 | $ | 336 | $ | 207 | ||||||||||||
For the Year Ended December 31, 2004 | Kori Kollo | Total South America | Pajingo | Yandal | Tanami | |||||||||||||||
| (dollars in millions except per ounce amounts) | ||||||||||||||||||||
Costs applicable to sales per financial statements | $ | 9.8 | $ | 442.4 | $ | 59.4 | $ | 105.9 | $ | 194.2 | ||||||||||
Minority interest | (1.2 | ) | (220.0 | ) | — | — | — | |||||||||||||
Write-downs of stockpiles, ore on leach pads and inventories | (2.1 | ) | (2.1 | ) | (1.1 | ) | (0.2 | ) | (8.2 | ) | ||||||||||
Reclamation/accretion expense | (0.9 | ) | (4.0 | ) | (0.3 | ) | (1.7 | ) | (1.2 | ) | ||||||||||
Purchased ore, smelting and refining, and other | — | (0.1 | ) | — | — | — | ||||||||||||||
Total cash costs for per ounce calculation | 5.6 | 216.2 | 58.0 | 104.0 | 184.8 | |||||||||||||||
Reclamation/accretion expense and other | 0.9 | 4.0 | 0.1 | 1.7 | 1.0 | |||||||||||||||
Depreciation, depletion and amortization | 2.3 | 200.3 | 31.4 | 26.8 | 37.9 | |||||||||||||||
Minority interest and other | (0.3 | ) | (89.1 | ) | — | — | — | |||||||||||||
Total production cost for per ounce calculation | $ | 8.5 | $ | 331.4 | $ | 89.5 | $ | 132.5 | $ | 223.7 | ||||||||||
Equity ounces sold (000) | 21.7 | 1,582.7 | 251.4 | 379.3 | 658.0 | |||||||||||||||
Equity cash cost per ounce sold | $ | 260 | $ | 137 | $ | 230 | $ | 274 | $ | 281 | ||||||||||
Equity production cost per ounce sold | $ | 397 | $ | 209 | $ | 356 | $ | 349 | $ | 340 | ||||||||||
For the Year Ended December 31, 2004 Costs applicable to sales per financial statements Minority interest Write-downs of stockpiles, ore on leach pads and inventories Reclamation/accretion expense Purchased ore, smelting and refining, and other Total cash costs for per ounce calculation Reclamation/accretion expense and other Depreciation, depletion and amortization Minority interest and other Total production cost for per ounce calculation Equity ounces sold (000) Equity cash cost per ounce sold Equity production cost per ounce sold Kalgoorlie Martha Total
Australia/NZ Batu Hijau Minahasa Total
Indonesia (dollars in millions except per ounce amounts) $ 140.9 $ 28.1 $ 528.5 $ 91.2 $ 19.8 $ 111.0 — — — (42.1 ) — (42.1 ) — — (9.5 ) — (0.2 ) (0.2 ) (1.7 ) (0.4 ) (5.3 ) (0.5 ) (0.3 ) (0.8 ) — — — 2.1 (1.2 ) 0.9 139.2 27.7 513.7 50.7 18.1 68.8 1.7 0.4 4.9 0.5 0.3 0.8 16.2 13.8 126.1 28.2 2.4 30.6 — — — (12.6 ) (0.1 ) (12.7 ) $ 157.1 $ 41.9 $ 644.7 $ 66.8 $ 20.7 $ 87.5 468.4 130.5 1,887.6 396.3 70.2 466.5 $ 297 $ 212 $ 272 $ 128 $ 259 $ 148 $ 336 $ 320 $ 342 $ 169 $ 295 $ 188
For the Year Ended December 31, 2004 | Zarafshan | Ovacik | Total Central Asia | Total Gold | ||||||||||||
| (dollars in millions except per ounce amounts) | ||||||||||||||||
Costs applicable to sales per financial statements | $ | 32.4 | $ | 22.9 | $ | 55.3 | $ | 1,935.9 | ||||||||
Minority interest | — | — | — | (262.1 | ) | |||||||||||
Write-downs of stockpiles, ore on leach pads and inventories | — | (1.3 | ) | (1.3 | ) | (13.1 | ) | |||||||||
Reclamation/accretion expense | (0.3 | ) | (0.4 | ) | (0.7 | ) | (16.9 | ) | ||||||||
Purchased ore, smelting and refining, and other | (0.1 | ) | — | (0.1 | ) | (37.4 | ) | |||||||||
Total cash costs for per ounce calculation | 32.0 | 21.2 | 53.2 | 1,606.4 | ||||||||||||
Reclamation/accretion expense and other | 0.3 | 0.2 | 0.5 | 16.3 | ||||||||||||
Depreciation, depletion and amortization | 10.3 | 18.6 | 28.9 | 536.1 | ||||||||||||
Minority interest and other | — | (2.9 | ) | (2.9 | ) | (104.7 | ) | |||||||||
Total production cost for per ounce calculation | $ | 42.6 | $ | 37.1 | $ | 79.7 | $ | 2,054.1 | ||||||||
Equity ounces sold (000) | 210.1 | 110.0 | 320.1 | 6,969.1 | ||||||||||||
Equity cash cost per ounce sold | $ | 152 | $ | 193 | $ | 166 | $ | 231 | ||||||||
Equity production cost per ounce sold | $ | 203 | $ | 338 | $ | 249 | $ | 295 | ||||||||
For the Year Ended December 31, 2003 Costs applicable to sales per financial statements Minority interest Write-downs of stockpiles, ore on leach pads and inventories Reclamation/accretion expense Purchased ore, smelting and refining, and other Total cash costs for per ounce calculation Reclamation/accretion expense and other Depreciation, depletion and amortization Minority interest and other Total production cost for per ounce calculation Equity ounces sold (000) Equity cash cost per ounce sold Equity production cost per ounce sold Nevada Golden
Giant Holloway Mesquite La
Herradura Total North
America (dollars in millions except per ounce amounts) $ 597.8 $ 53.4 $ 20.8 $ 9.3 $ 11.1 $ 692.4 — — — — — — (2.9 ) –– — — — (2.9 ) 0.1 (1.3 ) (0.5 ) (0.2 ) (0.1 ) (2.0 ) (32.1 ) — — — — (32.1 ) 562.9 52.1 20.3 9.1 11.0 655.4 (0.1 ) 1.3 0.5 0.2 0.1 2.0 137.7 22.0 5.3 3.9 3.4 172.3 — — — — — — $ 700.5 $ 75.4 $ 26.1 $ 13.2 $ 14.5 $ 829.7 2,490.8 (1) 229.7 65.1 49.2 67.8 2,902.6 (1) $ 235 $ 227 $ 312 $ 184 $ 162 $ 233 $ 292 $ 329 $ 402 $ 267 $ 214 $ 295
For the Year Ended December 31, 2003 | Yanacocha | Kori Kollo | Total South America | Pajingo | Yandal | Tanami | ||||||||||||||||||
| (dollars in millions except per ounce amounts) | ||||||||||||||||||||||||
Costs applicable to sales per financial statements | $ | 362.5 | $ | 35.6 | $ | 398.1 | $ | 42.9 | $ | 158.7 | $ | 148.9 | ||||||||||||
Minority interest | (183.5 | ) | (4.2 | ) | (187.7 | ) | — | — | (4.2 | ) | ||||||||||||||
Write-downs of stockpiles, ore on leach pads and inventories | — | — | — | — | (3.0 | ) | (2.0 | ) | ||||||||||||||||
Reclamation/accretion expense | (3.4 | ) | (2.1 | ) | (5.5 | ) | (0.1 | ) | (1.5 | ) | (1.2 | ) | ||||||||||||
Purchased ore, smelting and refining, and other | –– | — | — | — | — | — | ||||||||||||||||||
Total cash costs for per ounce calculation | 175.6 | 29.3 | 204.9 | 42.8 | 154.2 | 141.5 | ||||||||||||||||||
Reclamation/accretion expense and other | 3.4 | 2.1 | 5.5 | (0.3 | ) | 1.4 | 0.2 | |||||||||||||||||
Depreciation, depletion and amortization | 160.4 | 6.8 | 167.2 | 29.2 | 35.8 | 36.0 | ||||||||||||||||||
Minority interest and other | (70.1 | ) | (0.8 | ) | (70.9 | ) | — | — | (1.0 | ) | ||||||||||||||
Total production cost for per ounce calculation | $ | 269.3 | $ | 37.4 | $ | 306.7 | $ | 71.7 | $ | 191.4 | $ | 176.7 | ||||||||||||
Equity ounces sold (000) | 1,467.9 | 158.5 | 1,626.4 | 330.3 | 565.6 | 588.6 | ||||||||||||||||||
Equity cash cost per ounce sold | $ | 120 | $ | 184 | $ | 126 | $ | 129 | $ | 273 | $ | 240 | ||||||||||||
Equity production cost per ounce sold | $ | 184 | $ | 235 | $ | 189 | $ | 217 | $ | 339 | $ | 300 | ||||||||||||
For the Year Ended December 31, 2003 Costs applicable to sales per financial statements Minority interest Write-downs of stockpiles, ore on leach pads and inventories Reclamation/accretion expense Purchased ore, smelting and reefing, and other Total cash costs for per ounce calculation Reclamation/accretion expense and other Depreciation, depletion and amortization Minority interest and other Total production cost for per ounce calculation Equity ounces sold (000) Equity cash cost per ounce sold Equity production cost per ounce sold Kalgoorlie Martha Total
Australia/NZ Minahasa Zarafshan Ovacik (dollars in millions except per ounce amounts) $ 108.4 $ 24.9 $ 483.8 $ 26.3 $ 32.9 $ 22.3 — (0.3 ) (4.5 ) — — — (1.0 ) (2.6 ) (8.6 ) (1.3 ) — (0.1 ) (0.8 ) (0.4 ) (4.0 ) (0.5 ) (0.7 ) (0.4 ) — — — (1.6 ) — — 106.6 21.6 466.7 22.9 32.2 21.8 0.8 0.2 2.3 0.5 0.7 0.2 9.8 11.5 122.3 7.6 10.1 13.9 — (0.1 ) (1.1 ) (0.5 ) — — $ 117.2 $ 33.2 $ 590.2 $ 30.5 $ 43.0 $ 35.9 404.7 108.9 1,998.1 92.2 218.1 168.2 $ 263 $ 199 $ 234 $ 249 $ 147 $ 129 $ 289 $ 306 $ 295 $ 332 $ 197 $ 213
For the Year Ended December 31, 2003 | Total Central Asia | Total Gold | ||||||
(dollars in millions except per ounce amounts) | ||||||||
Costs applicable to sales per financial statements | $ | 55.2 | $ | 1,655.8 | ||||
Minority interest | — | (192.2 | ) | |||||
Write-downs of stockpiles, ore on leach pads and inventories | (0.1 | ) | (12.9 | ) | ||||
Reclamation/accretion expense | (1.1 | ) | (13.1 | ) | ||||
Purchased ore, smelting and refining, and other | — | (33.7 | ) | |||||
Total cash costs for per ounce calculation | 54.0 | 1,403.9 | ||||||
Reclamation/accretion expense and other | 0.9 | 11.2 | ||||||
Depreciation, depletion and amortization | 24.0 | 493.4 | ||||||
Minority interest and other | — | (72.5 | ) | |||||
Total production cost for per ounce calculation | $ | 78.9 | $ | 1,836.0 | ||||
Equity ounces sold (000) | 386.3 | 7,005.6 | (1) | |||||
Equity cash cost per ounce sold | $ | 139 | $ | 203 | ||||
Equity production cost per ounce sold | $ | 204 | $ | 266 | ||||
For the Year Ended December 31, 2002 Costs applicable to sales per financial statements Minority interest Write-downs of stockpiles, ore on leach pads and inventories Reclamation/accretion expense Non-cash inventory adjustment Purchased ore, smelting and refining, and other Total cash costs for per ounce calculation Reclamation/accretion expense and other Depreciation, depletion and amortization Minority interest and other Total production cost for per ounce calculation Equity ounces sold (000) Equity cash cost per ounce sold Equity production cost per ounce sold For the Year Ended December 31, 2002 Costs applicable to sales per financial statements Minority interest Write-downs of stockpiles, ore on leach pads and inventories Reclamation/accretion expense Non-cash inventory adjustment Purchased ore, smelting and refining, and other Total cash costs for per ounce calculation Reclamation/accretion expense and other Depreciation, depletion and amortization Minority interest and other Total production cost for per ounce calculation Equity ounces sold (000) Equity cash cost per ounce sold Equity production cost per ounce sold Nevada Golden
Giant Holloway Mesquite La
Herradura Total North
America (dollars in millions except per ounce amounts) $ 657.1 $ 57.1 $ 20.4 $ 10.1 $ 11.5 $ 756.2 — — — — — — (37.0 ) (0.3 ) — — — (37.3 ) (7.0 ) (1.7 ) (0.5 ) — (0.2 ) (9.4 ) (1.5 ) — — — — (1.5 ) — — — — — — 611.6 55.1 19.9 10.1 11.3 708.0 8.4 1.6 0.5 — 0.2 10.7 118.2 20.5 6.7 6.3 3.1 154.8 — — — — — — $ 738.2 $ 77.2 $ 27.1 $ 16.4 $ 14.6 $ 873.5 2,723.5 281.5 97.7 57.1 64.2 3,224.0 $ 225 $ 196 $ 204 $ 177 $ 176 $ 220 $ 271 $ 274 $ 277 $ 287 $ 227 $ 271 Yanacocha Kori
Kollo Total South
America Pajingo Yandal Tanami (dollars in millions except per ounce amounts) $ 302.0 $ 46.6 $ 348.6 $ 30.5 $ 136.4 $ 111.5 (151.6 ) (5.6 ) (157.2 ) — — (15.8 ) — (0.5 ) (0.5 ) — (1.6 ) — (3.0 ) (1.6 ) (4.6 ) (1.2 ) (3.2 ) (1.8 ) — — — (1.0 ) (0.1 ) (0.9 ) — — — — — — 147.4 38.9 186.3 28.3 131.5 93.0 3.0 1.6 4.6 1.8 3.1 1.9 121.5 13.8 135.3 20.6 43.5 33.7 (54.6 ) (1.7 ) (56.3 ) — — (4.5 ) $ 217.3 $ 52.6 $ 269.9 $ 50.7 $ 178.1 $ 124.1 1,176.9 249.4 1,426.3 296.4 611.1 452.4 $ 125 $ 156 $ 131 $ 95 $ 215 $ 205 $ 185 $ 211 $ 189 $ 171 $ 292 $ 273
For the Year Ended December 31, 2002 Costs applicable to sales per financial statements Minority interest Write-downs of stockpiles, ore on leach pads and inventories Reclamation/accretion expense Non-cash inventory adjustment Purchased ore, smelting and refining, and other Total cash costs for per ounce calculation Reclamation/accretion expense and other Depreciation, depletion and amortization Minority interest and other Total production cost for per ounce calculation Equity ounces sold (000) Equity cash cost per ounce sold Equity production cost per ounce sold Kalgoorlie Martha Total
Australia/NZ Minahasa Zarafshan Ovacik (dollars in millions except per ounce amounts) $ 85.0 $ 19.6 $ 383.0 $ 41.2 $ 34.0 $ 17.5 — — (15.8 ) — — — — — (1.6 ) (4.6 ) — — (1.7 ) (0.7 ) (8.6 ) (2.4 ) 0.3 (0.7 ) (13.6 ) (2.1 ) (17.7 ) — — (1.5 ) — — — (2.1 ) — — 69.7 16.8 339.3 32.1 34.3 15.3 15.3 2.6 24.7 2.4 (0.3 ) 2.0 9.0 13.9 120.7 9.5 10.3 11.5 — — (4.5 ) (0.6 ) — — $ 94.0 $ 33.3 $ 480.2 $ 43.4 $ 44.3 $ 28.8 324.7 107.8 1,792.4 147.2 255.8 125.7 $ 215 $ 156 $ 189 $ 218 $ 134 $ 122 $ 289 $ 309 $ 268 $ 294 $ 173 $ 229
For the Year Ended December 31, 2002 | Total Central Asia | Total Gold | ||||||
(dollars in millions except per ounce amounts) | ||||||||
Costs applicable to sales per financial statements | $ | 51.5 | $ | 1,580.5 | ||||
Minority interest | — | (173.0 | ) | |||||
Write-downs of stockpiles, ore on leach pads and inventories | — | (44.0 | ) | |||||
Reclamation/accretion expense | (0.4 | ) | (25.4 | ) | ||||
Non-cash inventory adjustment | (1.5 | ) | (20.7 | ) | ||||
Purchased ore, smelting and refining, and other | — | (2.1 | ) | |||||
Total cash costs for per ounce calculation | 49.6 | 1,315.3 | ||||||
Reclamation/accretion expense and other | 1.7 | 44.1 | ||||||
Depreciation, depletion and amortization | 21.8 | 442.1 | ||||||
Minority interest and other | — | (61.4 | ) | |||||
Total production cost for per ounce calculation | $ | 73.1 | $ | 1,740.1 | ||||
Equity ounces sold (000) | 381.5 | 6,971.4 | ||||||
Equity cash cost per ounce sold | $ | 130 | $ | 189 | ||||
Equity production cost per ounce sold | $ | 192 | $ | 250 | ||||
Reconciliation ofCosts applicable to sales-Base Metals to total cash costs per base metal pound (unaudited):
| Batu Hijau | Golden Grove | |||||||||||||||
For the Year Ended December 31, 2004 | Total | Copper | Zinc | |||||||||||||
| (dollars in millions except per ounce amounts) | ||||||||||||||||
Costs applicable to sales per financial statements | $ | 304.7 | $ | 61.8 | $ | 38.7 | $ | 23.1 | ||||||||
Minority Interest | (140.7 | ) | — | — | — | |||||||||||
Reclamation/accretion expense | (1.7 | ) | (0.6 | ) | (0.3 | ) | (0.3 | ) | ||||||||
Write-downs of inventories, stockpiles and ore on leach pads | — | (8.2 | ) | (2.9 | ) | (5.3 | ) | |||||||||
Purchased ore, smelting and refining and other | 66.0 | 29.3 | 3.8 | 25.5 | ||||||||||||
Total cash cost for per pound calculation | 228.3 | 82.3 | 39.3 | 43.0 | ||||||||||||
Reclamation/accretion expense and other | 1.7 | 0.3 | 0.2 | 0.1 | ||||||||||||
Depreciation, depletion and amortization | 89.3 | 28.2 | 14.0 | 14.2 | ||||||||||||
Minority interest and other | (39.9 | ) | — | — | — | |||||||||||
Total production cost for per pound calculation | $ | 279.4 | $ | 110.8 | $ | 53.5 | $ | 57.3 | ||||||||
Equity total pounds sold (000) | 378,801 | N/A | 43,467 | 114,835 | ||||||||||||
Equity total cash cost per pound sold | $ | 0.60 | N/A | $ | 0.90 | $ | 0.38 | |||||||||
Equity total production cost per pound sold | $ | 0.74 | N/A | $ | 1.23 | $ | 0.50 | |||||||||
| Golden Grove | ||||||||||||||||||||||||
| 2003 | 2002 | |||||||||||||||||||||||
For the Year Ended December 31, | Total | Copper | Zinc | Total | Copper | Zinc | ||||||||||||||||||
| (dollars in millions except per ounce amounts) | ||||||||||||||||||||||||
Costs applicable to sales per financial statements | $ | 43.5 | $ | 37.4 | $ | 6.1 | $ | 27.7 | $ | 18.4 | $ | 9.3 | ||||||||||||
Write-downs of stockpiles, ore on leach pads and inventories | (7.2 | ) | (3.9 | ) | (3.3 | ) | (0.4 | ) | (0.3 | ) | (0.1 | ) | ||||||||||||
Purchased concentrate cost | (6.1 | ) | — | (6.1 | ) | — | — | — | ||||||||||||||||
Reclamation/accretion expense | (0.4 | ) | (0.2 | ) | (0.2 | ) | — | — | — | |||||||||||||||
Smelting and refining | 33.5 | 10.6 | 22.9 | 24.7 | 7.5 | 17.2 | ||||||||||||||||||
Total cash costs for per pound calculation | 63.3 | 43.9 | 19.4 | 52.0 | 25.6 | 26.4 | ||||||||||||||||||
Reclamation/accretion expense and other | (1.0 | ) | (0.6 | ) | (0.4 | ) | (1.7 | ) | (1.1 | ) | (0.6 | ) | ||||||||||||
Depreciation, depletion and amortization | 29.1 | 15.7 | 13.4 | 22.9 | 13.9 | 9.0 | ||||||||||||||||||
Total production cost for per pound calculation | $ | 91.4 | $ | 59.0 | $ | 32.4 | $ | 73.2 | $ | 38.4 | $ | 34.8 | ||||||||||||
Equity total pounds sold (000) | N/A | 74,303 | 104,711 | N/A | 44,754 | 111,177 | ||||||||||||||||||
Equity total cash cost per pound sold | N/A | $ | 0.59 | $ | 0.19 | N/A | $ | 0.57 | $ | 0.24 | ||||||||||||||
Equity total production cost per pound sold | N/A | $ | 0.79 | $ | 0.31 | N/A | $ | 0.86 | $ | 0.31 | ||||||||||||||
The following is a description of Newmont’s principal royalty interests, all of which were acquired as a result of the Franco-Nevada acquisition. Newmont’s royalty interests are generally in the form of a net smelter return (“NSR”) royalty, which provides for the payment, either in cash or physical metal (“in kind”) of a specified percentage of production, less certain specified transportation and refining costs. In some cases, Newmont owns a net profit interest (“NPI”) pursuant to which Newmont is entitled to a specified percentage of the net profits, as defined in each case, from a particular mining operation. The majority of NSR royalty revenue and NPI revenue can be received in kind (generally in the form of gold bullion) at the option of Newmont.Newmont’s option. Newmont also has a significant oil and gas royalty portfolio in Western Canada. In 2004,2005, Newmont’sRoyalty and dividend income, net was $65.8 million.$79.
Nevada-Goldstrike. Newmont holds various NSR and NPI royalties at the Goldstrike properties (Betze-Post and Meikle mines) located on the Carlin Trend in northern Nevada. The Betze-Post and Meikle mines are owned and operated by a subsidiary of Barrick Gold Corporation.Barrick. Newmont received $23.2 million$22 in royalty income from the Goldstrike properties in 2004.2005.
The Betze-Post mine is a conventional open pit operation. The Betze-Post property consists of various claim blocks and Newmont’s royalty interest in each claim block is different, ranging from 0% to 4% for the NSRs and 0% to 6% for the NPIs. The Meikle mine is an underground operation comprising the Meikle, Rodeo and Griffin deposits, located one mile north of the Betze-Post mine, with which it shares the Goldstrike processing facilities. Newmont holds a 4% NSR and a 5% NPI over 1,280 acres of the claims that cover most of the Meikle, Rodeo and Griffin deposits. Newmont is not obligated to fund any portion of the cost associated with the Betze-Post or the Meikle mines.
Montana-Stillwater. Newmont holds a 5% NSR royalty on a portion of the Stillwater mine and all of the East Boulder mine, both located near Nye, Montana and owned and operated by Stillwater Mining Company. Newmont received $8.2 million$9 in royalty income from the Stillwater properties in 2004.2005. Stillwater produces palladium, platinum, and associated metals (platinum group metals or PGMs) from a geological formation known as the J-M Reef. Stillwater is the only significant producer of PGMs outside of South Africa and Russia. The J-M Reef is an extensive mineralized zone containing PGMs, which has been traced over a strike length of approximately 28 miles. To date, the majority of production has been from the Stillwater mine, with East Boulder commencing production during 2001. For the year 2004,2005, an average of approximately 81%80% of the total production from the Stillwater mine and 100% of the total production from the East Boulder mine was subject to Newmont’s royalty. Because Newmont’s royalty does not apply to a portion of the Stillwater properties the percentage of future production from the royalty lands will vary from year to year.
Canada-Oil and Gas Interests. Newmont’s oil and gas royalty portfolio covers 1.8 million gross acres of producing and non-producing lands located in western Canada and the Canadian Arctic. The average royalty on these lands is 6%. Newmont received $23.5 million$29 in royalty income from these properties in 2004.2005.
Canadian Oil Sands Trust. In 2004, Newmont purchasedowns a portfolio of marketable equity securities, the major components of which are Canadian Oil Sands Trust, for approximately $199.6 million. Canadian Oil Sands Trust is traded on the Toronto Stock Exchange. As of December 31, 2004, the market value of Newmont’s interest in the trust was approximately $336.9 million.
Gabriel Resources, Ltd. In 2004, Newmont purchased marketable equity securities of Gabriel Resources Ltd., a Canadian mineral exploration company traded on the Toronto Stock Exchange, for approximately $19.2 million.Shore Gold Corporation, Gabriel Resources, Ltd. owns 80% of the Rosia Montana project in Romania. As of December 31, 2004, the market value of Newmont’s interest in Gabriel Resources was approximately $19.4 million.
Kinross Goldand Miramar Mining Corporation. As a result of a combination of Kinross Gold Corporation, Echo Bay Mines Ltd. and TVX Gold Inc. in January 2003, Newmont acquired a 13.8% interest in the restructured Kinross. During the third quarter of 2003, Newmont sold approximately 28 million Kinross shares representing 66% of its investment for total cash proceeds of $224.6 million, and recorded a net loss of $7.4 million. At June 30, 2004, Newmont recognized a $38.5 million impairment charge on its investment in Kinross in(Loss) gain on investments, net for an other-than-temporary decline in value in accordance with SFAS No. 115, “Accounting for Certain Investments in Debt and Equity Securities.” Newmont classified the remaining balance of its investment in Kinross as short-term, available-for-sale marketable securities at December 31, 2004. At December 31, 2004, the The market value of the Kinross investmentportfolio was approximately $101.5 million.
$940 as of December 31, 2005.
Newmont had proven and probable equity gold reserves of 92.493.2 million equity ounces as of December 31, 2004.
2005.
Gold reserves for 20042005 were calculated at a $350,gold price of $400, A$550 or NZD$NZ$650 per ounce, gold price, except at Boddington and Kalgoorlie, where gold reserves were calculated usingat a gold price of A$425 and A$560 per ounce, respectively. Newmont’s 2004ounce. 2005 gold reserves would decline by approximately 7%8%, or 6.07 million ounces, if
calculated at a $325gold price of $375 per ounce gold price.ounce. An increase in the gold price to $375$425 per ounce would increase gold reserves by approximately 6%, or 5.36 million ounces.
ounces, all other assumptions remaining constant.
At year-end 2004, Newmont’s North American equity2005, Nevada proven and probable gold reserves were 35.033.3 million equity ounces. Outside of Nevada, year-end gold reserves were 59.9 million equity ounces, (including 34.0including 14.9 million equity ounces in Nevada). Outside of North America, year-end equity gold reserves were 57.4 million ounces, including 15.1 million ounces in Australia/New Zealand, 16.616.8 million equity ounces in Peru and 16.018.7 million equity ounces in Ghana.
Newmont’s equity copper Copper reserves at year-end 20042005 were 8.99.1 billion equity pounds. Except at Boddington, copperCopper reserves were calculated at a copper price of $0.90$1.00 or A$1.451.43 per pound.
Newmont’s equity zinc reserves at year-end 2004 were 730 million pounds. Zinc reserves were calculated at a price of A$0.62 per pound.
Under Newmont’s current mining plans, all reserves are located on fee property or mining claims or will be depleted during the terms of existing mining licenses or concessions, or where applicable, any assured renewal or extension periods for thesuch licenses or concessions.
Proven and probable reserves are based on extensive drilling, sampling, mine modeling and metallurgical testing from which economic feasibility has been determined. The price sensitivity of reserves depends upon several factors including grade, metallurgical recovery, operating cost, waste-to-ore ratio and ore type. Metallurgical recovery rates vary depending on the metallurgical properties of each deposit and the production process used. The reserve tables below list the average metallurgical recovery rate for each deposit, which takes into account the several different processing methods to be used. The cut-off grade, or lowest grade of mineralized material considered economic to process, varies with material type, metallurgical recoveries and operating costs.
The proven and probable reserve figures presented herein are estimates based on information available at the time of calculation. No assurance can be given that the indicated levels of recovery of gold copper and zinccopper will be realized. Ounces of gold or pounds of copper or zinc in the proven and probable reserves are calculated without regard to any losses during metallurgical treatment. Reserve estimates may require revision based on actual production experience. Market price fluctuations of gold copper and zinc,copper, as well as increased production costs or reduced metallurgical recovery rates, could render proven and probable reserves containing relatively lower grades of mineralization uneconomic to exploit and might result in a reduction of reserves.
Reserves are published once each year and will be recalculated as of December 31, 2005, for the entire Company,2006, taking into account metal prices, divestments and depletion as well as any acquisitions and additions to reserves based on results of exploration, mine optimization and development work performed during 2005.2006.
The following tables detail Newmont’s gold proven and probable reserves(1)reflecting only those reserves owned by Newmont on December 31, 2004 or 2003:2005 and 2004:
| December 31, 2004 | ||||||||||||||||||||||||
| Proven Reserves | Probable Reserves | Proven and Probable Reserves | ||||||||||||||||||||||
Deposits/Districts | Newmont Share (%) | Tonnage(2) (000 tons) | Grade (oz/ton) | Ounces(3) (000) | Tonnage(2) (000 tons) | Grade (oz/ton) | Ounces(3) (000) | Tonnage(2) (000 tons) | Grade (oz/ton) | Ounces(3) (000) | Metallurgical Recovery(3) | |||||||||||||
North America | ||||||||||||||||||||||||
Nevada(4) | ||||||||||||||||||||||||
Carlin Open Pit(5) | 100.00 | % | 16,100 | 0.070 | 1,130 | 185,500 | 0.045 | 8,290 | 201,600 | 0.047 | 9,420 | 74 | % | |||||||||||
Twin Creeks | 100.00 | % | 14,900 | 0.083 | 1,240 | 46,900 | 0.073 | 3,420 | 61,800 | 0.075 | 4,660 | 81 | % | |||||||||||
Lone Tree Complex | 100.00 | % | 2,700 | 0.099 | 270 | 11,300 | 0.054 | 610 | 14,000 | 0.063 | 880 | 81 | % | |||||||||||
Phoenix(6) | 100.00 | % | — | — | — | 248,000 | 0.034 | 8,470 | 248,000 | 0.034 | 8,470 | 80 | % | |||||||||||
Carlin Underground(7) | 100.00 | % | 1,900 | 0.65 | 1,230 | 6,800 | 0.47 | 3,180 | 8,700 | 0.51 | 4,410 | 94 | % | |||||||||||
Midas(8) | 100.00 | % | 700 | 0.68 | 460 | 2,200 | 0.45 | 990 | 2,900 | 0.51 | 1,450 | 96 | % | |||||||||||
Turquoise Ridge(9) | 25.00 | % | 1,100 | 0.61 | 690 | 600 | 0.62 | 360 | 1,700 | 0.61 | 1,050 | 91 | % | |||||||||||
Nevada Stockpiles(10) | 100.00 | % | 26,700 | 0.091 | 2,360 | 4,300 | 0.058 | 250 | 30,300 | 0.086 | 2,610 | 81 | % | |||||||||||
Nevada In-Process(11) | 100.00 | % | 45,700 | 0.021 | 940 | 1,300 | 0.062 | 80 | 47,000 | 0.022 | 1,020 | 65 | % | |||||||||||
| 109,100 | 0.076 | 8,320 | 506,900 | 0.051 | 25,650 | 616,000 | 0.055 | 33,970 | 81 | % | ||||||||||||||
Other North America | ||||||||||||||||||||||||
Golden Giant, Ontario(12) | 100.00 | % | — | — | — | 500 | 0.31 | 160 | 500 | 0.31 | 160 | 96 | % | |||||||||||
Holloway, Ontario(13) | 93.87 | % | 500 | 0.16 | 80 | 900 | 0.19 | 180 | 1,400 | 0.18 | 260 | 94 | % | |||||||||||
La Herradura, Mexico(14) | 44.00 | % | 11,300 | 0.025 | 280 | 11,000 | 0.030 | 330 | 22,300 | 0.027 | 610 | 66 | % | |||||||||||
| 11,800 | 0.030 | 360 | 12,400 | 0.054 | 670 | 24,200 | 0.042 | 1,030 | 78 | % | ||||||||||||||
| 120,900 | 0.072 | 8,680 | 519,300 | 0.051 | 26,320 | 640,200 | 0.055 | 35,000 | 81 | % | ||||||||||||||
South America | ||||||||||||||||||||||||
Yanacocha Open Pits(15) | 51.35 | % | 40,400 | 0.026 | 1,060 | 307,800 | 0.033 | 10,210 | 348,200 | 0.032 | 11,270 | 67 | % | |||||||||||
Yanacocha In-Process(11) | 51.35 | % | 29,000 | 0.028 | 820 | — | — | — | 29,000 | 0.028 | 820 | 77 | % | |||||||||||
Total Yanacocha, Peru | 51.35 | % | 69,400 | 0.027 | 1,880 | 307,800 | 0.033 | 10,210 | 377,200 | 0.032 | 12,090 | 69 | % | |||||||||||
Minas Conga, Peru(16) | 51.35 | % | — | — | — | 190,500 | 0.023 | 4,470 | 190,500 | 0.023 | 4,470 | 75 | % | |||||||||||
Kori Kollo, Bolivia(17) | 88.00 | % | 5,900 | 0.017 | 100 | 16,600 | 0.022 | 370 | 22,500 | 0.021 | 470 | 63 | % | |||||||||||
| 75,300 | 0.026 | 1,980 | 514,900 | 0.029 | 15,050 | 590,200 | 0.029 | 17,030 | 70 | % | ||||||||||||||
Australia/New Zealand | ||||||||||||||||||||||||
Boddington, Western Australia(18) | 44.44 | % | 61,000 | 0.027 | 1,670 | 129,900 | 0.025 | 3,180 | 190,900 | 0.025 | 4,850 | 82 | % | |||||||||||
Golden Grove, Western Australia(19) | 100.00 | % | 2,400 | 0.025 | 60 | 2,100 | 0.069 | 140 | 4,500 | 0.045 | 200 | 62 | % | |||||||||||
Kalgoorlie Open Pits and Underground | 50.00 | % | 35,600 | 0.061 | 2,190 | 39,800 | 0.064 | 2,560 | 75,400 | 0.063 | 4,750 | 87 | % | |||||||||||
Kalgoorlie Stockpiles(10) | 50.00 | % | 12,400 | 0.035 | 430 | — | — | — | 12,400 | 0.035 | 430 | 87 | % | |||||||||||
Total Kalgoorlie, Western Australia(20) | 50.00 | % | 48,000 | 0.055 | 2,620 | 39,800 | 0.064 | 2,560 | 87,800 | 0.059 | 5,180 | 87 | % | |||||||||||
Pajingo, Queensland(21) | 100.00 | % | 200 | 0.47 | 110 | 1,700 | 0.32 | 540 | 1,900 | 0.34 | 650 | 96 | % | |||||||||||
Tanami Underground and Open Pits(22) | 100.00 | % | 4,800 | 0.19 | 890 | 7,300 | 0.14 | 1,060 | 12,100 | 0.16 | 1,950 | 96 | % | |||||||||||
Tanami Stockpiles(10) | 100.00 | % | 1,100 | 0.079 | 90 | 3,000 | 0.037 | 110 | 4,100 | 0.048 | 200 | 95 | % | |||||||||||
Total Tanami, Northern Territory | 100.00 | % | 5,900 | 0.17 | 980 | 10,300 | 0.11 | 1,170 | 16,200 | 0.13 | 2,150 | 95 | % | |||||||||||
Jundee, Western Australia(23) | 100.00 | % | 3,100 | 0.047 | 140 | 5,300 | 0.24 | 1,270 | 8,400 | 0.17 | 1,410 | 93 | % | |||||||||||
Martha, New Zealand(24) | 100.00 | % | — | — | — | 4,400 | 0.15 | 670 | 4,400 | 0.15 | 670 | 90 | % | |||||||||||
| 120,600 | 0.046 | 5,580 | 193,500 | 0.049 | 9,530 | 314,100 | 0.048 | 15,110 | 87 | % | ||||||||||||||
Indonesia | ||||||||||||||||||||||||
Batu Hijau Open Pit(25)(26) | 52.875 | % | 148,600 | 0.013 | 1,910 | 440,100 | 0.011 | 5,000 | 588,700 | 0.012 | 6,910 | 81 | % | |||||||||||
Batu Hijau Stockpiles(10)(26) | 52.875 | % | — | — | — | 86,400 | 0.004 | 300 | 86,400 | 0.004 | 300 | 73 | % | |||||||||||
| 148,600 | 0.013 | 1,910 | 526,500 | 0.010 | 5,300 | 675,100 | 0.011 | 7,210 | 80 | % | ||||||||||||||
Central Asia | ||||||||||||||||||||||||
Ovacik, Turkey(27) | 100.00 | % | 200 | 0.38 | 70 | 200 | 0.15 | 30 | 400 | 0.25 | 100 | 96 | % | |||||||||||
Zarafshan-Newmont, Uzbekistan(28) | 50.00 | % | 53,800 | 0.037 | 1,940 | — | — | — | 53,800 | 0.037 | 1,940 | 57 | % | |||||||||||
| 54,000 | 0.037 | 2,010 | 200 | 0.150 | 30 | 54,200 | 0.038 | 2,040 | 75 | % | ||||||||||||||
Africa | ||||||||||||||||||||||||
Akyem, Ghana(29) | 85.00 | % | — | — | — | 109,400 | 0.049 | 5,410 | 109,400 | 0.049 | 5,410 | 89 | % | |||||||||||
Ahafo, Ghana(30) | 100.00 | % | — | — | — | 156,900 | 0.068 | 10,630 | 156,900 | 0.068 | 10,630 | 88 | % | |||||||||||
| — | — | — | 266,300 | 0.060 | 16,040 | 266,300 | 0.060 | 16,040 | 88 | % | ||||||||||||||
Total Gold | 519,400 | 0.039 | 20,160 | 2,020,700 | 0.036 | 72,270 | 2,540,100 | 0.036 | 92,430 | 81 | % | |||||||||||||
| December 31, 2005 | |||||||||||||||||||||||
| Proven Reserves | Probable Reserves | Proven and Probable Reserves | |||||||||||||||||||||
Deposits/Districts | Newmont Share | Tonnage(2) (000 tons) | Grade (oz/ton) | Ounces(3) (000) | Tonnage(2) (000 tons) | Grade (oz/ton) | Ounces(3) (000) | Tonnage(2) (000 tons) | Grade (oz/ton) | Ounces(3) (000) | Metallurgical Recovery(3) | ||||||||||||
Nevada(4) | |||||||||||||||||||||||
Carlin Open Pit(5) | 100% | 21,000 | 0.072 | 1,520 | 217,300 | 0.041 | 8,810 | 238,300 | 0.043 | 10,330 | 72 | % | |||||||||||
Twin Creeks | 100% | 14,800 | 0.081 | 1,200 | 46,400 | 0.072 | 3,320 | 61,200 | 0.074 | 4,520 | 82 | % | |||||||||||
Lone Tree Complex(6) | 100% | 800 | 0.096 | 70 | 3,200 | 0.076 | 250 | 4,000 | 0.080 | 320 | 80 | % | |||||||||||
Phoenix(7) | 100% | — | — | — | 308,400 | 0.029 | 8,950 | 308,400 | 0.029 | 8,950 | 81 | % | |||||||||||
Carlin Underground(8) | 100% | 1,700 | 0.53 | 900 | 6,000 | 0.47 | 2,850 | 7,700 | 0.49 | 3,750 | 94 | % | |||||||||||
Midas(9) | 100% | 600 | 0.67 | 430 | 900 | 0.52 | 470 | 1,500 | 0.58 | 900 | 95 | % | |||||||||||
Turquoise Ridge(10) | 25% | 1,100 | 0.56 | 620 | 800 | 0.57 | 480 | 1,900 | 0.56 | 1,100 | 90 | % | |||||||||||
Nevada Stockpiles(11) | 100% | 22,600 | 0.089 | 2,010 | 4,800 | 0.053 | 250 | 27,400 | 0.083 | 2,260 | 80 | % | |||||||||||
Nevada In-Process(12) | 100% | 46,800 | 0.021 | 1,000 | 2,100 | 0.067 | 140 | 48,900 | 0.023 | 1,140 | 65 | % | |||||||||||
| 109,400 | 0.071 | 7,750 | 589,900 | 0.043 | 25,520 | 699,300 | 0.048 | 33,270 | 80 | % | |||||||||||||
Yanacocha, Peru | |||||||||||||||||||||||
Yanacocha Open Pits(13) | 51.35% | 30,900 | 0.024 | 740 | 263,600 | 0.034 | 8,960 | 294,500 | 0.033 | 9,700 | 69 | % | |||||||||||
Yanacocha In-Process(12)(13) | 51.35% | 34,700 | 0.028 | 970 | — | — | — | 34,700 | 0.028 | 970 | 70 | % | |||||||||||
Conga(14) | 51.35% | — | — | — | 317,200 | 0.019 | 6,080 | 317,200 | 0.019 | 6,080 | 79 | % | |||||||||||
| 65,600 | 0.026 | 1,710 | 580,800 | 0.026 | 15,040 | 646,400 | 0.026 | 16,750 | 73 | % | |||||||||||||
Australia/New Zealand | |||||||||||||||||||||||
Boddington, Western Australia(15) | 44.44% | 60,600 | 0.029 | 1,780 | 136,800 | 0.025 | 3,380 | 197,400 | 0.026 | 5,160 | 82 | % | |||||||||||
Kalgoorlie Open Pits and Underground | 50% | 32,900 | 0.060 | 1,980 | 39,400 | 0.063 | 2,500 | 72,300 | 0.062 | 4,480 | 88 | % | |||||||||||
Kalgoorlie Stockpiles(11) | 50% | 12,600 | 0.033 | 420 | — | — | — | 12,600 | 0.033 | 420 | 88 | % | |||||||||||
Total Kalgoorlie, Western Australia(16) | 50% | 45,500 | 0.053 | 2,400 | 39,400 | 0.063 | 2,500 | 84,900 | 0.058 | 4,900 | 88 | % | |||||||||||
Pajingo, Queensland(17) | 100% | 400 | 0.41 | 150 | 1,200 | 0.25 | 300 | 1,600 | 0.29 | 450 | 97 | % | |||||||||||
Tanami Underground and Open Pits | 100% | 5,400 | 0.17 | 890 | 8,100 | 0.16 | 1,330 | 13,500 | 0.16 | 2,220 | 95 | % | |||||||||||
Tanami Stockpiles(11) | 100% | 400 | 0.074 | 30 | 2,200 | 0.037 | 80 | 2,600 | 0.043 | 110 | 95 | % | |||||||||||
Total Tanami, Northern Territory(18) | 100% | 5,800 | 0.16 | 920 | 10,300 | 0.14 | 1,410 | 16,100 | 0.15 | 2,330 | 95 | % | |||||||||||
Jundee, Western Australia(19) | 100% | 2,900 | 0.060 | 170 | 3,700 | 0.36 | 1,360 | 6,600 | 0.23 | 1,530 | 93 | % | |||||||||||
Martha, New Zealand(20) | 100% | — | — | — | 3,500 | 0.16 | 570 | 3,500 | 0.16 | 570 | 91 | % | |||||||||||
| 115,200 | 0.047 | 5,420 | 194,900 | 0.049 | 9,520 | 310,100 | 0.048 | 14,940 | 88 | % | |||||||||||||
Batu Hijau, Indonesia | |||||||||||||||||||||||
Batu Hijau Open Pit(21) | 52.875% | 147,600 | 0.012 | 1,770 | 446,500 | 0.010 | 4,540 | 594,100 | 0.011 | 6,310 | 80 | % | |||||||||||
Batu Hijau Stockpiles(11)(21) | 52.875% | — | — | — | 103,900 | 0.003 | 340 | 103,900 | 0.003 | 340 | 69 | % | |||||||||||
| 147,600 | 0.012 | 1,770 | 550,400 | 0.009 | 4,880 | 698,000 | 0.010 | 6,650 | 80 | % | |||||||||||||
Ghana | |||||||||||||||||||||||
Akyem(22) | 85% | — | — | — | 125,100 | 0.052 | 6,510 | 125,100 | 0.052 | 6,510 | 89 | % | |||||||||||
Ahafo(23) | 100% | — | — | — | 156,900 | 0.078 | 12,190 | 156,900 | 0.078 | 12,190 | 88 | % | |||||||||||
| — | — | — | 282,000 | 0.066 | 18,700 | 282,000 | 0.066 | 18,700 | 88 | % | |||||||||||||
Other Operations | |||||||||||||||||||||||
Holloway, Ontario(24) | 100% | 50 | 0.17 | 10 | 100 | 0.20 | 20 | 150 | 0.19 | 30 | 90 | % | |||||||||||
La Herradura, Mexico(25) | 44% | 18,100 | 0.021 | 380 | 16,800 | 0.023 | 390 | 34,900 | 0.022 | 770 | 66 | % | |||||||||||
Kori Kollo, Bolivia(26) | 88% | 12,600 | 0.010 | 120 | 16,200 | 0.019 | 320 | 28,800 | 0.015 | 440 | 63 | % | |||||||||||
Zarafshan-Newmont, Uzbekistan(27) | 50% | 46,700 | 0.036 | 1,690 | — | — | — | 46,700 | 0.036 | 1,690 | 56 | % | |||||||||||
| 77,450 | 0.028 | 2,200 | 33,100 | 0.022 | 730 | 110,550 | 0.027 | 2,930 | 60 | % | |||||||||||||
Total Gold | 515,250 | 0.037 | 18,850 | 2,231,100 | 0.033 | 74,390 | 2,746,350 | 0.034 | 93,240 | 81 | % | ||||||||||||
Deposits/Districts Tonnage(2) (000 tons) Ounces(3) (000) Tonnage(2) (000 tons) Ounces(3) (000) Tonnage(2) (000 tons) Ounces(3) (000) Metallurgical Recovery(3) North America Nevada Carlin Open Pit Twin Creeks Lone Tree Complex Phoenix Carlin Underground Midas(8) Turquoise Ridge(9) Stockpiles and In-Process Other North America Golden Giant, Ontario Holloway, Ontario(13) La Herradura, Mexico South America Yanacocha, Peru Kori Kollo, Bolivia Australia/New Zealand Boddington, Western Australia(18) Golden Grove, Western Australia Kalgoorlie, Western Australia(20) Pajingo, Queensland Tanami, Northern Territory Jundee, Western Australia Bronzewing, Western Australia(31) Martha, New Zealand Indonesia Batu Hijau, Indonesia-Gold(26) Minahasa, Indonesia(32) Central Asia Ovacik, Turkey Perama, Greece(33) Zarafshan-Newmont, Uzbekistan(28) Africa Akyem, Ghana Ahafo, Ghana Total Gold Deposits/Districts Newmont Share Tonnage(2) (000 tons) Grade (oz/ton) Ounces(3) (000) Tonnage(2) (000 tons) Ounces(3) (000) Tonnage(2) (000 tons) Grade (oz/ton) Ounces(3) (000) Nevada Carlin Open Pit Twin Creeks Lone Tree Complex Phoenix Carlin Underground Midas Turquoise Ridge(10) Nevada Stockpiles Nevada In-Process Yanacocha, Peru Yanacocha Open Pits Yanacocha In-Process Conga Australia/New Zealand Boddington, Western Australia(28) Golden Grove, Western Australia(29) Kalgoorlie Open Pits and Underground Kalgoorlie Stockpiles Total Kalgoorlie, Western Australia Pajingo, Queensland Tanami Underground and Open Pits Tanami Stockpiles Total Tanami, Northern Territory Jundee, Western Australia Martha, New Zealand Batu Hijau, Indonesia Batu Hijau Open Pit(21) Batu Hijau Stockpiles(21) Ghana, West Africa Akyem Ahafo Other Operations Golden Giant, Ontario(30) Holloway, Ontario(31) La Herradura, Mexico Kori Kollo, Bolivia Ovacik, Turkey(32) Zarafshan-Newmont, Uzbekistan Total Gold December 31, 2003 Proven Reserves Probable Reserves Proven and Probable Reserves Newmont
Share (%) Grade
(oz/ton) Grade
(oz/ton) Grade
(oz/ton) 100.00 % 17,500 0.052 920 205,300 0.044 8,950 222,800 0.044 9,870 68 % 100.00 % 14,000 0.085 1,190 48,200 0.074 3,580 62,200 0.077 4,770 84 % 100.00 % 3,300 0.092 300 13,000 0.084 1,090 16,300 0.086 1,390 79 % 100.00 % — — — 175,700 0.035 6,150 175,700 0.035 6,150 84 % 100.00 % 2,700 0.67 1,800 6,100 0.50 3,040 8,800 0.55 4,840 94 % 100.00 % 700 0.83 590 2,700 0.51 1,360 3,400 0.58 1,950 97 % 25.00 % 1,500 0.57 850 600 0.62 370 2,100 0.59 1,220 93 % 100.00 % 57,000 0.059 3,350 3,700 0.055 200 60,700 0.059 3,550 80 % 96,700 0.093 9,000 455,300 0.054 24,740 552,000 0.061 33,740 100.00 % — — — 1,100 0.30 330 1,100 0.30 330 96 % 91.50 % 800 0.17 140 1,100 0.20 220 1,900 0.19 360 93 % 44.00 % 11,000 0.029 320 15,000 0.031 460 26,000 0.030 780 68 % 11,800 0.039 460 17,200 0.059 1,010 29,000 0.051 1,470 108,500 0.087 9,460 472,500 0.055 25,750 581,000 0.061 35,210 51.35 % 87,600 0.028 2,450 450,000 0.031 13,830 537,600 0.030 16,280 71 % 88.00 % 3,000 0.012 40 15,000 0.022 330 18,000 0.020 370 66 % 90,600 0.027 2,490 465,000 0.030 14,160 555,600 0.030 16,650 44.44 % 61,000 0.027 1,670 129,900 0.025 3,180 190,900 0.025 4,850 82 % 100.00 % 1,700 0.024 40 1,800 0.045 80 3,500 0.035 120 60 % 50.00 % 37,800 0.054 2,040 59,200 0.065 3,850 97,000 0.061 5,890 86 % 100.00 % 100 0.43 60 2,400 0.32 770 2,500 0.33 830 97 % 100.00 % 6,600 0.18 1,180 13,100 0.12 1,540 19,700 0.14 2,720 96 % 100.00 % 3,100 0.07 210 6,800 0.22 1,490 9,900 0.17 1,700 90 % 100.00 % 300 0.11 30 — — — 300 0.11 30 97 % 100.00 % — — — 5,300 0.14 760 5,300 0.14 760 91 % 110,600 0.047 5,230 218,600 0.053 11,670 329,200 0.051 16,900 52.875 % 227,700 0.012 2,650 387,600 0.011 4,450 615,300 0.012 7,100 80 % 94.00 % 400 0.14 50 — — — 400 0.14 50 90 % 228,100 0.012 2,700 387,600 0.011 4,450 615,700 0.012 7,150 100.00 % 300 0.35 100 200 0.30 70 500 0.33 170 94 % 80.00 % — — — 9,700 0.11 1,050 9,700 0.11 1,050 90 % 50.00 % 61,500 0.037 2,260 — — — 61,500 0.037 2,260 57 % 61,800 0.038 2,360 9,900 0.113 1,120 71,700 0.049 3,480 85.00 % — — — 80,000 0.054 4,280 80,000 0.054 4,280 89 % 100.00 % — — — 108,600 0.070 7,630 108,600 0.070 7,630 89 % — — — 188,600 0.063 11,910 188,600 0.063 11,910 599,600 0.037 22,240 1,742,200 0.040 69,060 2,341,800 0.039 91,300 December 31, 2004 Proven Reserves Probable Reserves Proven and Probable Reserves Grade
(oz/ton) Metallurgical
Recovery(3) 100% 16,100 0.070 1,130 185,500 0.045 8,290 201,600 0.047 9,420 74 % 100% 14,900 0.083 1,240 46,900 0.073 3,420 61,800 0.075 4,660 81 % 100% 2,700 0.099 270 11,300 0.054 610 14,000 0.063 880 81 % 100% — — — 248,000 0.034 8,470 248,000 0.034 8,470 80 % 100% 1,900 0.65 1,230 6,800 0.47 3,180 8,700 0.51 4,410 94 % 100% 700 0.68 460 2,200 0.45 990 2,900 0.51 1,450 96 % 25% 1,100 0.61 690 600 0.62 360 1,700 0.61 1,050 91 % 100% 26,700 0.091 2,360 4,300 0.058 250 30,300 0.086 2,610 81 % 100% 45,700 0.021 940 1,300 0.062 80 47,000 0.022 1,020 65 % 109,800 0.076 8,320 506,900 0.051 25,650 616,000 0.055 33,970 81 % 51.35% 40,400 0.026 1,060 307,800 0.033 10,210 348,200 0.032 11,270 67 % 51.35% 29,000 0.028 820 — — — 29,000 0.028 820 77 % 51.35% — — — 190,500 0.023 4,470 190,500 0.023 4,470 75 % 69,400 0.027 1,880 498,300 0.029 14,680 567,700 0.029 16,560 70 % 44.44% 61,000 0.027 1,670 �� 129,900 0.025 3,180 190,900 0.025 4,850 82 % 100% 2,400 0.025 60 2,100 0.069 140 4,500 0.045 200 62 % 50% 35,600 0.061 2,190 39,800 0.064 2,560 75,400 0.063 4,750 87 % 50% 12,400 0.035 430 — — — 12,400 0.035 430 87 % 50% 48,000 0.055 2,620 39,800 0.064 2,560 87,800 0.059 5,180 87 % 100% 200 0.47 110 1,700 0.32 540 1,900 0.34 650 96 % 100% 4,800 0.19 890 7,300 0.14 1,060 12,100 0.16 1,950 96 % 100% 1,100 0.079 90 3,000 0.037 110 4,100 0.048 200 95 % 100% 5,900 0.17 980 10,300 0.11 1,170 16,200 0.13 2,150 95 % 100% 3,100 0.047 140 5,300 0.24 1,270 8,400 0.17 1,410 93 % 100% — — — 4,400 0.15 670 4,400 0.15 670 90 % 120,600 0.046 5,580 193,500 0.049 9,530 314,100 0.048 15,110 87 % 52.875% 148,600 0.013 1,910 440,100 0.011 5,000 588,700 0.012 6,910 81 % 52.875% — — — 86,400 0.004 300 86,400 0.004 300 73 % 148,600 0.013 1,910 526,500 0.010 5,300 675,100 0.011 7,210 80 % 85% — — — 109,400 0.049 5,410 109,400 0.049 5,410 89 % 100% — — — 156,900 0.068 10,630 156,900 0.068 10,630 88 % — — — 266,300 0.060 16,040 266,300 0.060 16,040 88 % 100% — — — 500 0.31 160 500 0.31 160 96 % 93.87% 500 0.16 80 900 0.19 180 1,400 0.18 260 94 % 44% 11,300 0.025 280 11,000 0.030 330 22,300 0.027 610 66 % 88% 5,900 0.017 100 16,600 0.022 370 22,500 0.021 470 63 % 100% 200 0.38 70 200 0.15 30 400 0.25 100 96 % 50% 53,800 0.037 1,940 — — — 53,800 0.037 1,940 57 % 71,700 0.034 2,470 29,200 0.037 1,070 100,900 0.035 3,540 64 % 520,100 0.039 20,160 2,020,700 0.036 72,270 2,540,100 0.036 92,430 81 %
| (1) | The term “reserve” means that part of a mineral deposit that can be economically and legally extracted or produced at the time of the reserve determination. |
The term “economically,” as used in the definition of reserve, means that profitable extraction or production has been established or analytically demonstrated in a full feasibility study to be viable and justifiable under reasonable investment and market assumptions. |
The term “proven reserves” means reserves for which (a) quantity is computed from dimensions revealed in outcrops, trenches, workings or drill holes; (b) grade and/or quality are computed from the results of detailed sampling; and (c) the sites for inspection, sampling and measurements are spaced so closely and the geologic character is sufficiently defined that size, shape, depth and mineral content of reserves are well established.
The term “probable reserves” means reserves for which quantity and grade are computed from information similar to that used for proven reserves, but the sites for sampling are farther apart or are otherwise less adequately spaced. The degree of assurance, although lower than that for proven reserves, is high enough to assume continuity between points of observation.
Proven and probable reserves were calculated using different cut-off grades. The term “cut-off grade” means the lowest grade of mineralized material that can economically be included in the reserves in a given deposit. Cut-off grades vary between deposits depending upon prevailing economic conditions, mineability of the deposit, amenability of the ore to gold extraction, and type of milling or leaching facilities available.
2005 reserves were calculated at a gold price of $400, A$550 or NZ$650 per ounce unless otherwise noted.
2004 reserves were calculated at a gold price of $350, A$550 or NZ$650 per ounce unless otherwise noted.
| (2) | Tonnages |
| (3) | Ounces or pounds are estimates of metal contained in ore tonnages and |
| (4) | Cut-off grades utilized in |
| (5) | Includes undeveloped reserves at Castle Reef, North Lantern and Emigrant deposits for combined total undeveloped reserves of |
| (6) | The Lone Tree deposit will be mined out in August 2006 based on the current mine plan. Processing of stockpiles and residual leaching will continue after the open pit operation is closed. |
| (7) | Deposit is |
| Includes partially developed reserves at Leeville, which contains |
| (9) | Also contains reserves of 11 million ounces of silver with a metallurgical recovery of 90%. |
| (10) |
| Stockpiles are comprised primarily of material that has been set aside to allow processing of higher grade material in the mills. Stockpiles increase or decrease depending on current mine plans. |
| Reserves include currently undeveloped deposits at Corimayo and Chaquicocha Sur, which contain combined undeveloped reserves of 3 million equity ounces. Cut-off |
| (15) |
| (16) | Reserves based on a gold price of A$560 per ounce. Cut-off grade utilized in 2005 reserves not less than 0.026 ounce per ton. |
| (17) | Cut-off grade utilized in 2005 reserves not less than 0.035 ounce per ton. |
| (18) | Cut-off grade utilized in 2005 reserves not less than 0.031 ounce per ton. |
| (19) |
| (20) |
| Includes |
| Percentage reflects Newmont’s economic interest in remaining reserves. Cut-off grade utilized in 2005 reserves not less than 0.007 ounce per ton. |
| (22) | Deposit is undeveloped. Newmont acquired the remaining 15% interest in January 2006, bringing Newmont’s equity interest to 100% for 2006. Cut-off grade utilized in 2005 reserves not less than 0.012 ounce per ton. |
| (23) | Deposits are partially developed and include undeveloped reserves totaling 5.5 million ounces. Construction of facilities began in November 2004, and production is expected in the second half of 2006. Cut-off grade utilized in 2005 reserves not less than 0.016 ounce per ton. |
| (24) | Newmont’s equity interest increased to 100% in 2005 from 93.87% in 2004 because our joint venture partner elected not to participate in the work program; as a result, its equity interest converted into a net profits interest. Property includes partially developed reserves of 15,000 ounces at the Blacktop deposit. Cut-off grade utilized in 2005 reserves not less than 0.16 ounce per ton. |
| (25) | Cut-off grade utilized in 2005 reserves not less than 0.008 ounce per ton. |
| (26) | Cut-off grade utilized in 2005 reserves not less than 0.009 ounce per ton. |
| (27) |
| (28) |
| (29) |
| (30) |
| (31) |
| (32) |
The following tables detail Newmont’s base metalcopper proven and probable reserves(1) reflecting only those reserves owned by Newmont on December 31, 20042005 or 2003:2004:
| December 31, 2004 | ||||||||||||||||||||||||
| Proven Reserves | Probable Reserves | Proven and Probable Reserves | ||||||||||||||||||||||
Deposits/Districts | Newmont Share (%) | Tonnage(2) (000 tons) | Grade (%) | Millions of Pounds(3) | Tonnage(2) (000 tons) | Grade (%) | Millions of Pounds(3) | Tonnage(2) (000 tons) | Grade (%) | Millions of Pounds(3) | Metallurgical Recovery(3) | |||||||||||||
Copper | ||||||||||||||||||||||||
Phoenix, Nevada(4) | 100.00 | % | — | — | — | 216,700 | 0.15 | 660 | 216,700 | 0.15 | 660 | 67 | % | |||||||||||
Minas Conga, Peru(5) | 51.35 | % | — | — | — | 190,600 | 0.30 | 1,140 | 190,600 | 0.30 | 1,140 | 90 | % | |||||||||||
Batu Hijau(6) | 52.875 | % | 148,700 | 0.50 | 1,480 | 440,200 | 0.47 | 4,120 | 588,900 | 0.48 | 5,600 | 86 | % | |||||||||||
Batu Hijau, Stockpiles(6) | 52.875 | % | — | — | — | 86,500 | 0.38 | 660 | 86,500 | 0.38 | 660 | 80 | % | |||||||||||
Total Batu Hijau, Indonesia | 52.875 | % | 148,700 | 0.50 | 1,480 | 526,700 | 0.45 | 4,780 | 675,400 | 0.46 | 6,260 | 85 | % | |||||||||||
Boddington, Western Australia(7) | 44.44 | % | 61,000 | 0.12 | 140 | 129,700 | 0.13 | 330 | 190,700 | 0.12 | 470 | 84 | % | |||||||||||
Golden Grove, Western Australia | 100.00 | % | 3,100 | 2.91 | 180 | 5,600 | 1.60 | 180 | 8,700 | 2.07 | 360 | 88 | % | |||||||||||
Total Copper | 212,800 | 0.42 | 1,800 | 1,069,300 | 0.33 | 7,090 | 1,282,100 | 0.35 | 8,890 | 84 | % | |||||||||||||
Zinc(8) | ||||||||||||||||||||||||
Golden Grove, Western Australia | 100.00 | % | 900 | 11.8 | 200 | 1,800 | 14.7 | 530 | 2,700 | 13.8 | 730 | 91 | % | |||||||||||
Total Zinc | 900 | 11.8 | 200 | 1,800 | 14.7 | 530 | 2,700 | 13.8 | 730 | 91 | % | |||||||||||||
| December 31, 2003 | ||||||||||||||||||||||||
| Proven Reserves | Probable Reserves | Proven and Probable Reserves | ||||||||||||||||||||||
Deposits/Districts | Newmont Share (%) | Tonnage(2) (000 tons) | Grade (%) | Millions of Pounds(3) | Tonnage(2) (000 tons) | Grade (%) | Millions of Pounds(3) | Tonnage(2) (000 tons) | Grade (%) | Millions of Pounds(3) | Metallurgical Recovery(3) | |||||||||||||
Copper | ||||||||||||||||||||||||
Phoenix, Nevada | 100.00 | % | — | — | — | 159,600 | 0.13 | 420 | 159,600 | 0.13 | 420 | 63 | % | |||||||||||
Batu Hijau, Indonesia | 52.875 | % | 227,700 | 0.52 | 2,350 | 387,600 | 0.51 | 3,940 | 615,300 | 0.51 | 6,290 | 89 | % | |||||||||||
Boddington, Western Australia(7) | 44.44 | % | 61,000 | 0.12 | 140 | 129,700 | 0.13 | 330 | 190,700 | 0.12 | 470 | 84 | % | |||||||||||
Golden Grove, Western Australia | 100.00 | % | 1,900 | 2.6 | 100 | 5,900 | 2.1 | 250 | 7,800 | 2.2 | 350 | 88 | % | |||||||||||
Total Copper | 290,600 | 0.43 | 2,590 | 682,800 | 0.37 | 4,940 | 973,400 | 0.39 | 7,530 | |||||||||||||||
Zinc(8) | ||||||||||||||||||||||||
Golden Grove, Western Australia | 100.00 | % | 600 | 10.8 | 140 | 1,200 | 13.8 | 340 | 1,800 | 12.8 | 480 | 91 | % | |||||||||||
Total Zinc | 600 | 10.8 | 140 | 1,200 | 13.8 | 340 | 1,800 | 12.8 | 480 | |||||||||||||||
| December 31, 2005 | |||||||||||||||||||||||||||
| Proven Reserves | Probable Reserves | Proven and Probable Reserves | |||||||||||||||||||||||||
Deposits/Districts | Newmont Share | Tonnage(2) (000 tons) | Grade (Cu %) | Millions of Pounds(3) | Tonnage(2) (000 tons) | Grade (Cu %) | Millions of Pounds(3) | Tonnage(2) (000 tons) | Grade (Cu %) | Millions of Pounds(3) | Metallurgical Recovery(3) | ||||||||||||||||
Phoenix, Nevada(4) | 100 | % | — | — | — | 309,900 | 0.15 | % | 900 | 309,900 | 0.15 | % | 900 | 67 | % | ||||||||||||
Conga, Peru(5) | 51.35 | % | — | — | — | 317,200 | 0.26 | % | 1,660 | 317,200 | 0.26 | % | 1,660 | 85 | % | ||||||||||||
Batu Hijau(6) | 52.875 | % | 147,600 | 0.47 | % | 1,390 | 446,500 | 0.44 | % | 3,920 | 594,100 | 0.45 | % | 5,310 | 83 | % | |||||||||||
Batu Hijau, Stockpiles(6)(7) | 52.875 | % | — | — | — | 103,900 | 0.36 | % | 750 | 103,900 | 0.36 | % | 750 | 70 | % | ||||||||||||
Total Batu Hijau, Indonesia(6) | 52.875 | % | 147,600 | 0.47 | % | 1,390 | 550,400 | 0.42 | % | 4,670 | 698,000 | 0.43 | % | 6,060 | 81 | % | |||||||||||
Boddington, Western | 44.44 | % | 60,600 | 0.12 | % | 140 | 136,600 | 0.12 | % | 340 | 197,200 | 0.12 | % | 480 | 83 | % | |||||||||||
Total Copper | 208,200 | 0.37 | % | 1,530 | 1,314,100 | 0.29 | % | 7,570 | 1,522,300 | 0.30 | % | 9,100 | 81 | % | |||||||||||||
| December 31, 2004 | |||||||||||||||||||||||||||
| Proven Reserves | Probable Reserves | Proven and Probable Reserves | |||||||||||||||||||||||||
Deposits/Districts | Newmont Share | Tonnage(2) (000 tons) | Grade (Cu %) | Millions of Pounds(3) | Tonnage(2) (000 tons) | Grade (Cu %) | Millions of Pounds(3) | Tonnage(2) (000 tons) | Grade (Cu %) | Millions of Pounds(3) | Metallurgical Recovery(3) | ||||||||||||||||
Phoenix, Nevada | 100 | % | — | — | — | 216,700 | 0.15 | % | 660 | 216,700 | 0.15 | % | 660 | 67 | % | ||||||||||||
Conga, Peru | 51.35 | % | — | — | — | 190,600 | 0.30 | % | 1,140 | 190,600 | 0.30 | % | 1,140 | 90 | % | ||||||||||||
Batu Hijau | 52.875 | % | 148,700 | 0.50 | % | 1,480 | 440,200 | 0.47 | % | 4,120 | 588,900 | 0.48 | % | 5,600 | 86 | % | |||||||||||
Batu Hijau, Stockpiles | 52.875 | % | — | — | — | 86,500 | 0.38 | % | 660 | 86,500 | 0.38 | % | 660 | 80 | % | ||||||||||||
Total Batu Hijau, Indonesia(7) | 52.875 | % | 148,700 | 0.50 | % | 1,480 | 526,700 | 0.45 | % | 4,780 | 675,400 | 0.46 | % | 6,260 | 85 | % | |||||||||||
Boddington, Western | 44.44 | % | 61,000 | 0.12 | % | 140 | 129,700 | 0.13 | % | 330 | 190,700 | 0.12 | % | 470 | 84 | % | |||||||||||
Golden Grove, Western Australia(10) | 100 | % | 3,100 | 2.91 | % | 180 | 5,600 | 1.60 | % | 180 | 8,700 | 2.07 | % | 360 | 88 | % | |||||||||||
Total Copper | 212,800 | 0.42 | % | 1,800 | 1,069,300 | 0.33 | % | 7,090 | 1,282,100 | 0.35 | % | 8,890 | 84 | % | |||||||||||||
| (1) | See footnote (1) to the Gold Proven and Probable |
| (2) | See footnote (2) to the Gold Proven and Probable Reserves |
| (3) | See footnote (3) to the Gold Proven and Probable Reserves |
| (4) | Deposit is |
| (5) |
| (6) | Percentage reflects Newmont’s economic interest in remaining reserves. |
| (7) | Stockpiles are comprised primarily of material that has been set aside to allow processing of higher grade material in the mills. Stockpiles increase or decrease depending on current mine plans. |
| (8) | Deposit is undeveloped. Newmont announced the acquisition of an additional 22.22% equity interest on February 12, 2006, which upon closing will increase Newmont’s equity ownership to 66.67%. |
| (9) |
| (10) | Golden Grove was sold in July 2005. |
The following table details Newmont’s reconciliation of Decemberreconciles year-end 2005 and 2004 gold proven and December 2003 Gold Proven and Probable Reserves:probable equity reserves:
Contained Ounces | |||
| (in millions) | |||
December 31, | |||
Depletion(1) | (8.3 | ) | |
| ( | ) | |
Revisions and Additions | |||
December 31, | |||
| (1) | Reserves mined and processed in |
| (2) | Includes |
| ITEM 3. | LEGAL PROCEEDINGS |
For a discussion of legal proceedings, see Note 2730 to the Consolidated Financial Statements.
ITEM 4. SUBMISSION OF MATTERS TO A VOTE OF SECURITY HOLDERS
| ITEM 4. | SUBMISSION OF MATTERS TO A VOTE OF SECURITY HOLDERS |
No matters were submitted to a vote of security holders, through the solicitation of proxies or otherwise, during the quarter ended December 31, 2004.
ITEM 4A. EXECUTIVE OFFICERS OF THE REGISTRANT2005.
| ITEM 4A. | EXECUTIVE OFFICERS OF THE REGISTRANT |
Newmont’s executive officers as of March 3, 2005February 22, 2006 were:
Name | Age | Office | ||||
Wayne W. Murdy | Chairman and Chief Executive Officer | |||||
Pierre Lassonde | President | |||||
| ||||||
Thomas L. Enos | 54 | Senior Vice President, Operations | ||||
Bruce D. Hansen | Senior Vice President, Operations Services and Development | |||||
Richard T. O’Brien | 51 | Senior Vice President and Chief Financial Officer | ||||
Russell Ball | Vice President and Controller | |||||
| Vice President, | |||||
| 55 | Vice President, Australian and Indonesian Operations | ||||
| Vice President, | |||||
| ||||||
David Harquail | Vice President, Merchant Banking | |||||
| Vice President, | |||||
Thomas P. Mahoney | 50 | Vice President and Treasurer | ||||
| ||||||
Carlos Santa Cruz | Vice President, South American Operations | |||||
William M. Zisch | 48 | Vice President, African and Central Asian | ||||
There are no family relationships by blood, marriage or adoption among any of the above executive officers of Newmont. All executive officers are elected annually by the Board of Directors of Newmont to serve for one year or until his respective successor is elected and qualified. The Arrangement Agreement between Newmont and Franco-Nevada provided that Mr. Lassonde would become the President of Newmont upon our acquisition of Franco-Nevada. There is no arrangement or understanding between any of the above executive officers and any other person pursuant to which he was selected as an executive officer.
Mr. Murdy has been Chairman of the Board of Newmont since January 2002 and Chief Executive Officer thereof since January 2001. Mr. Murdy was President of Newmont from July 1999 to February 2002. He served
as Executive Vice President and Chief Financial Officer from July 1996 to July 1999, and Senior Vice President and Chief Financial Officer from December 1992 to July 1996. Mr. Murdy was elected to the Board of Directors of Newmont in September 1999.
Mr. Lassonde became President of Newmont in February 2002 and was elected a director in March 2002. Previously he served as President and Co-Chief Executive Officer of Franco-Nevada from September 1999 to February 2002 and as President of Franco-Nevada from October 1982 to February 2002. He also served as President and Chief Executive Officer of Euro-Nevada Mining Corporation from 1985 to September 1999, when it amalgamated with Franco-Nevada. He has served as a director of Franco-Nevada since October 1982 and was a director of Normandy Mining Limited from May 2001 to March 2002.
Mr. Banks was elected Senior Vice President and General Counsel in April 2005. Previously, he served as Vice President and General Counsel from May 2001 to April 2005; Secretary from April 2001 to April 2004; and Associate General Counsel from July 1996 to May 2001.
Mr. FranciscoEnos was elected ExecutiveSenior Vice President, Operations, of Newmont in July 1999. HeOctober 2005. Previously, he served as Senior Vice President, International Operations, from May 1997March 2005 to July 1999. Previously, he served asOctober 2005; Vice President, International Operations, from December 2002 to March 2005; Vice President of Newmont and Managing Director of Newmont Indonesia Limited from May 2002 to November 2002; and Vice President, Indonesian Operations from July 19951998 to May 1997.
2002.
Mr. Hansen was elected Senior Vice President, Operations Services and Development in September 2005. Mr. Hansen served as Senior Vice President and Chief Financial Officer from July 1999 to September 2005.
Mr. O’Brien was elected Senior Vice President and Chief Financial Officer of Newmont in July 1999. He served asSeptember 2005. Mr. O’Brien was Executive Vice President Project Developmentand Chief Financial Officer of AGL Resources from May 1997April 2001 to July 1999. Previously, he served as SeniorSeptember 2005 and Vice President Corporate Development of Santa Fe Pacific GoldMirant Corporation from March 2000 to April 1994 to May 1997.
2001.
Mr. Ball was elected Vice President and Controller of Newmont in August 2004. Previously, he served as Group Executive, Investor Relations, May 2002 to August 2004 and Finance Director, Indonesia, from June 2001 to April 2002.
Mr. Banks was elected Vice President and General Counsel of Newmont in May 2001. He served as Secretary from April 2001 to April 2004. He served as Associate General Counsel of Newmont from July 1996 to May 2001.
Mr. Dowd was electednamed Vice President, Australian Operations, of Newmont in January 2006. He previously served as Vice President, Australian Operations, from December 2004 having served asto January 2006; Vice President, Operational Development, Health and Safety sincefrom July 2002. Mr. Dowd served as2002 to December 2004; and Group Executive, Operations of Normandy Mining Limited from May 1999 to July 2002.
Mr. EnosGallagher was electednamed Vice President, InternationalAustralian and Indonesian Operations, of Newmont in December 2002. Previously, he served as Vice President of Newmont and Managing Director of Newmont Indonesia Limited from May 2002 to November 2002.January 2006. He served as Vice President, IndonesianIndonesia Operations, from July 1998 to May 2002. He served as Vice President and General Manager of Newmont’s Carlin operations from May 1996 to July 1998.
Mr. Gallagher was elected Vice President, Indonesian Operations, in April 2004 having served asto January 2006; Managing Director, Newmont Indonesia Limited sincefrom November 2002. He served as2002 to April 2004; General Manager of Newmont’s Batu Hijau operations in Indonesia from April 2001 to November 20022002; and Director of Operations thereof from August 2000 to April 2001. Previously, he served as
Mr. Gutierrez was named Vice President, Operations at Vengold Inc.Tax, in December 2005. Prior to joining Newmont, he was a partner with KPMG LLP from 1993June 2002 to August 2000.
December 2005, serving as the Denver office Tax Managing Partner from September 2003 to December 2005. Prior to that he was a partner with Arthur Andersen LLP, serving as the Denver office managing partner from September 1997 to June 2002.
Mr. Harquail was elected Vice President, Merchant Banking, in April 2004, having served as President and Managing Director of Newmont Capital Limited since May 2002 and Vice President of Newmont since September 2003. Previously, he served as Senior Vice President of Franco-Nevada Mining Corporation Limited from May 1998 to February 2002. Prior to May 1998,
Mr. HarquailHinze was aelected Vice President, of Franco-Nevada.
Mr. Karras hasNorth American Operations, in October 2005. He previously served as Vice President, TaxesGeneral Manager of Newmont since November 1992.
the Minera Yanacocha operations in Peru from April 2003 to October 2005 and managed Newmont’s Minahasa and Martabe projects in Indonesia from January 2001 to December 2002.
Mr. Mahoney was elected Vice President and Treasurer of Newmont in May 2002. He served as Treasurer of Newmont from May 2001 to May 2002. Previously, he served as Assistant Treasurer from March 1997 to May 2001. He served as Assistant Treasurer, International from April 1994 to March 1997.
Mr. Perry has served as Vice President, North American Operations, of Newmont since April 2001. He served as General Manager of Newmont’s Batu Hijau copper and gold mine in Sumbawa, Indonesia from October 1998 to April 2001.
Mr. Santa Cruz has served as Vice President, South American Operations, of Newmont since August 2001. He served as General Manager of Minera Yanacocha S.R.L. from 1997 to 2001.
Mr. Zisch was named Vice President, African and Central Asian Operations, in January 2006. He previously served as Vice President, African Operations from October 2005 to January 2006; Group Executive, African Operations, from October 2003 to October 2005; and Operations Manager of the Minera Yanacocha operations in Peru from January 2001 and as Assistant General Manager thereof from 1995 to 1997.October 2003.
| ITEM 5. | MARKET FOR REGISTRANT’S COMMON EQUITY, RELATED STOCKHOLDER MATTERS AND ISSUER PURCHASE OF EQUITY SECURITIES |
Newmont’s common stock is listed and principally traded on the New York Stock Exchange (under the symbol “NEM”) and is also listed in the form of CHESS Depositary Interests (“CDIs”) (under the symbol “NEM”) on the Australian Stock Exchange (“ASX”). In Australia, Newmont is referred to as “Newmont Mining Corporation ARBN 099 065 997 organized in Delaware with limited liability.” Since July 1, 2002, Newmont CDIs have traded on the ASX as a Foreign Exempt Listing granted by the ASX, which provides an ancillary trading facility to Newmont’s primary listing on NYSE. Newmont Mining Corporation of Canada Limited’s exchangeable shares (“Exchangeable Shares”) are listed on the Toronto Stock Exchange (under the symbol “NMC”). The Exchangeable Shares were issued in connection with the acquisition of Franco-Nevada. The following table sets forth, for the periods indicated, the high and low sales prices per share of Newmont’s common stock as reported on the New York Stock Exchange Composite Tape.
| 2004 | 2003 | |||||||||||
| High | Low | High | Low | |||||||||
First quarter | $ | 49.75 | $ | 41.10 | $ | 30.15 | $ | 24.37 | ||||
Second quarter | $ | 46.75 | $ | 35.41 | $ | 33.89 | $ | 25.15 | ||||
Third quarter | $ | 45.53 | $ | 38.11 | $ | 42.17 | $ | 31.25 | ||||
Fourth quarter | $ | 49.65 | $ | 43.97 | $ | 50.00 | $ | 37.88 | ||||
| 2005 | 2004 | |||||||||||
| High | Low | High | Low | |||||||||
First quarter | $ | 46.24 | $ | 40.40 | $ | 49.75 | $ | 41.10 | ||||
Second quarter | $ | 42.45 | $ | 35.10 | $ | 46.75 | $ | 35.41 | ||||
Third quarter | $ | 48.05 | $ | 36.86 | $ | 45.53 | $ | 38.11 | ||||
Fourth quarter | $ | 53.69 | $ | 42.51 | $ | 49.65 | $ | 43.97 | ||||
On March 3, 2005,February 22, 2006, there were outstanding 409,987,107417,383,659 shares of Newmont’s common stock (including shares represented by CDIs), which were held by approximately 18,91617,493 stockholders of record. A dividend of $0.10 per share of common stock outstanding was declared in each quarter of 2005, for a total of $0.40 during the year. A dividend of $0.05 per share of common stock outstanding was declared in the first quarter of 2004, $0.075 per share of common stock outstanding was declared in the second and third quarters of 2004 and $0.10 per share of common stock outstanding was declared in the fourth quarter of 2004, for a total of $0.30 during the year. A dividend of $0.04 per share of common stock outstanding was declared in each of the first three quarters of 2003, and $0.05 per share of common stock outstanding was declared in the fourth quarter of 2003, for a total of $0.17 during the year.
On March 3, 2005,February 22, 2006, there were outstanding 35,698,48831,145,915 Exchangeable Shares, which were held by 5447 holders of record. The Exchangeable Shares are exchangeable at the option of the holders into Newmont common stock. Holders of Exchangeable Shares are therefore entitled to receive dividends equivalent to those that Newmont declares on its common stock.
The determination of the amount of future dividends will be made by Newmont’s Board of Directors from time to time and will depend on Newmont’s future earnings, capital requirements, financial condition and other relevant factors.
Issuer purchase of equity securities:
Period | (a)Total Number of Shares Purchased | (b)Average Price Paid Per Share | (c)Total Number of Shares Purchased as Part of Publicly Announced Plans or Programs | (d)Maximum Number (or Approximate Dollar Value) of Shares that may yet be Purchased under the Plans or Programs | ||||||
October 1, 2004 through October 31, 2004 | — | — | — | N/A | ||||||
November 1, 2004 through November 30, 2004 | 3,202 | (1) | $ | 39.11 | — | N/A | ||||
December 1, 2004 through December 31, 2004 | — | — | — | N/A | ||||||
Period | (a) Total | (b) Average | (c) Total Number of | (d) Maximum Number (or | ||||||
October 1, 2005 through October 31, 2005 | — | — | — | N/A | ||||||
November 1, 2005 through November 30, 2005 | — | — | — | N/A | ||||||
December 1, 2005 through December 31, 2005 | 2,621 | (1) | $ | 51.33 | — | N/A | ||||
| (1) | Represents shares delivered to the Company from |
| ITEM 6. |
| Years Ended December 31, | ||||||||||||||||||||||||||||||||||||
| 2004(1) | 2003 | 2002 | 2001 | 2000 | Years Ended December 31, | |||||||||||||||||||||||||||||||
| (in millions, except per share) | 2005 | 2004(1) | 2003 | 2002 | 2001 | |||||||||||||||||||||||||||||||
Revenues | $ | 4,524.2 | $ | 3,157.8 | $ | 2,622.2 | $ | 1,666.1 | $ | 1,819.0 | $ | 4,406 | $ | 4,411 | $ | 3,059 | $ | 2,541 | $ | 1,642 | ||||||||||||||||
Income (loss) before cumulative effect of a change in accounting principle, net of preferred stock dividend | $ | 490.5 | $ | 510.2 | $ | 150.4 | $ | (54.1 | ) | $ | (84.6 | ) | ||||||||||||||||||||||||
Net income (loss) applicable to common shares(2) | $ | 443.3 | $ | 475.7 | $ | 154.3 | $ | (54.1 | ) | $ | (97.2 | ) | ||||||||||||||||||||||||
Income (loss) from continuing operations, net of preferred stock dividend | $ | 374 | $ | 453 | $ | 511 | $ | 147 | $ | (52 | ) | |||||||||||||||||||||||||
Net income (loss) applicable to common shares(2)(3) | $ | 322 | $ | 443 | $ | 476 | $ | 154 | $ | (54 | ) | |||||||||||||||||||||||||
Basic income (loss) per common share: | ||||||||||||||||||||||||||||||||||||
Before cumulative effect of a change in accounting principle | $ | 1.11 | $ | 1.24 | $ | 0.40 | $ | (0.28 | ) | $ | (0.45 | ) | ||||||||||||||||||||||||
After cumulative effect of a change in accounting principle | $ | 1.00 | $ | 1.16 | $ | 0.42 | $ | (0.28 | ) | $ | (0.51 | ) | ||||||||||||||||||||||||
From continuing operations | $ | 0.84 | $ | 1.02 | $ | 1.24 | $ | 0.39 | $ | (0.27 | ) | |||||||||||||||||||||||||
Discontinued operations | $ | (0.12 | ) | $ | 0.09 | $ | — | $ | 0.01 | $ | (0.01 | ) | ||||||||||||||||||||||||
Cumulative effect of a change in accounting principle | $ | — | $ | (0.11 | ) | $ | (0.08 | ) | $ | 0.02 | $ | — | ||||||||||||||||||||||||
Net income (loss) per common share, basic | $ | 0.72 | $ | 1.00 | $ | 1.16 | $ | 0.42 | $ | (0.28 | ) | |||||||||||||||||||||||||
Diluted income (loss) per common share: | ||||||||||||||||||||||||||||||||||||
Before cumulative effect of a change in accounting principle | $ | 1.10 | $ | 1.23 | $ | 0.39 | $ | (0.28 | ) | $ | (0.45 | ) | ||||||||||||||||||||||||
After cumulative effect of a change in accounting principle | $ | 0.99 | $ | 1.15 | $ | 0.41 | $ | (0.28 | ) | $ | (0.51 | ) | ||||||||||||||||||||||||
From continuing operations | $ | 0.83 | $ | 1.01 | $ | 1.23 | $ | 0.38 | $ | (0.27 | ) | |||||||||||||||||||||||||
Discontinued operations | $ | (0.11 | ) | $ | 0.09 | $ | — | $ | 0.01 | $ | (0.01 | ) | ||||||||||||||||||||||||
Cumulative effect of a change in accounting principle | $ | — | $ | (0.11 | ) | $ | (0.08 | ) | $ | 0.02 | $ | — | ||||||||||||||||||||||||
Net income (loss) per common share, diluted | $ | 0.72 | $ | 0.99 | $ | 1.15 | $ | 0.41 | $ | (0.28 | ) | |||||||||||||||||||||||||
Dividends declared per common share | $ | 0.30 | $ | 0.17 | $ | 0.12 | $ | 0.12 | $ | 0.12 | $ | 0.40 | $ | 0.30 | $ | 0.17 | $ | 0.12 | $ | 0.12 | ||||||||||||||||
At December 31, | ||||||||||||||||||||||||||||||||||||
| At December 31, | ||||||||||||||||||||||||||||||||||||
Total assets | $ | 12,770.7 | $ | 10,698.2 | $ | 10,147.4 | $ | 4,141.7 | $ | 4,024.2 | $ | 13,992 | $ | 12,776 | $ | 10,698 | $ | 10,147 | $ | 4,142 | ||||||||||||||||
Long-term debt, including current portion | $ | 1,596.7 | $ | 1,077.5 | $ | 1,816.6 | $ | 1,426.9 | $ | 1,354.8 | $ | 1,929 | $ | 1,602 | $ | 1,078 | $ | 1,817 | $ | 1,427 | ||||||||||||||||
Stockholders’ equity | $ | 7,937.7 | $ | 7,384.9 | $ | 5,419.2 | $ | 1,499.8 | $ | 1,540.7 | $ | 8,376 | $ | 7,938 | $ | 7,385 | $ | 5,419 | $ | 1,500 | ||||||||||||||||
| (1) | Effective January 1, 2004, the Company |
| (2) | Net income (loss) includes the cumulative effect of a change in accounting principle related to a net expense for the consolidation of Batu Hijau of |
| (3) | Net income (loss) includes income (loss) from discontinued operations for Golden Grove and |
| ITEM 7. | MANAGEMENT’S DISCUSSION AND ANALYSIS OF CONSOLIDATED FINANCIAL CONDITION AND RESULTS OF OPERATIONS (dollars in millions, except per share, per ounce and per pound amounts) |
The following discussion provides information that management believes is relevant to an assessment and understanding of the consolidated financial condition and results of operations of Newmont Mining Corporation and its subsidiaries (collectively, “Newmont” or the “Company”). References to “A$” refer to Australian currency, “CDN$” to Canadian currency, “CHF” to Swiss currency, “NZD$” to New Zealand currency, “IDR” to Indonesian currency and “U.S.$” or “$” to United States currency.
This discussion addresses matters we consider important for an understanding of our financial condition and results of operations as of and for the three years ended December 31, 2004,2005, as well as our future results. It consists of the following subsections:
“Critical Accounting Policies,” which provides an analysis of the accounting policies we consider critical because of their effect on the reported amounts of assets, liabilities, income and/or expenses in
our consolidated financial statements and/or because they require difficult, subjective or complex judgments by our management;
|
This item should be read in conjunction with our consolidated financial statements and the notes thereto included in this annual report.
Newmont is one of the world’s largest gold producerproducers and is the only gold company included in the S&P 500 Index. We are also engaged in the exploration for and acquisition of gold properties. We have operations in the United States, Australia, Peru, Indonesia, Canada, Uzbekistan, Bolivia, New Zealand and Mexico. We have an advancedtwo development projectprojects in Ghana, which is expected to become our next core operating district. During the last several years we have expanded our global footprint through our exploration efforts and through the acquisition of operating and development assets. We believe that Newmont is positioned to remain a gold industry leader capable of achieving further profitable growth as we discover, acquire and develop new projects.
We face key risks associated with our business. One of the most significant risks is fluctuation in the prices of gold and copper, which are affected by numerous factors beyond our control. Other challenges we face areinclude production cost increases and social and environmental issues. Operating costs at our operations are subject to variation from one year to the next due to a number of factors, such as changing ore grades, metallurgy, and revisions to mine plans and changes in response to the physical shape and location of the ore bodies.accounting principles. At foreign locations, such costs are also influenced by currency fluctuations that may affect our U.S. dollar operating costs. In addition, we must continually replace reserves depleted by production. Depleted reserves must be replaced by expanding known ore bodies, by acquisition or by locating new deposits in order to maintain production levels over the long term.
Summary of Consolidated Financial and Operating Performance
The table below highlights key financial and operating results:
| Years Ended December 31, | |||||||||
| 2004 | 2003 | 2002 | |||||||
Net income applicable to common shares (in millions) | $ | 443.3 | $ | 475.7 | $ | 154.3 | |||
Net income per share, basic | $ | 1.00 | $ | 1.16 | $ | 0.42 | |||
Revenues (in millions) | $ | 4,524.2 | $ | 3,157.8 | $ | 2,622.2 | |||
Equity gold sales (in thousands of ounces) | 6,988.4 | 7,383.6 | 7,631.7 | ||||||
Equity copper sales (in millions of pounds) | 422.3 | 417.7 | 407.0 | ||||||
Average gold price received ($/ounce) | $ | 412 | $ | 366 | $ | 313 | |||
Total cash costs ($/ounce)(1) | $ | 231 | $ | 203 | $ | 189 | |||
Total production costs ($/ounce)(1) | $ | 295 | $ | 266 | $ | 250 | |||
| Years Ended December 31, | |||||||||
| 2005 | 2004 | 2003 | |||||||
Sales—gold, net | $ | 3,734 | $ | 3,625 | $ | 3,059 | |||
Sales—copper, net | $ | 672 | $ | 786 | N/A | ||||
Consolidated gold ounces sold | 8,552.0 | 8,828.9 | 8,377.4 | ||||||
Consolidated copper pounds sold | 572.7 | 683.3 | N/A | ||||||
Average price received(1) | |||||||||
Gold ($/oz) | $ | 441 | $ | 412 | $ | 365 | |||
Copper ($/lb) | $ | 1.45 | $ | 1.33 | N/A | ||||
Costs applicable to sales(2) | |||||||||
Gold ($/oz) | $ | 236 | $ | 216 | $ | 195 | |||
Copper ($/lb) | $ | 0.53 | $ | 0.45 | N/A | ||||
Income from continuing operations | $ | 374 | $ | 453 | $ | 511 | |||
Income from continuing operations per share, basic | $ | 0.84 | $ | 1.02 | $ | 1.24 | |||
| (1) |
| (2) | Excludes depreciation, depletion and amortization. |
Consolidated Financial Performance
IncreasedGold revenues increased 3% in 2005 from 2004 from 2003 primarily resulted from the consolidation of Batu Hijau anddue to higher gold and copper prices, partially offset by lower gold sales. Increased revenues in 2003 from 2002 resulted from higher gold prices. Our equity gold salesGold sold decreased to 7.08.6 million equity ounces in 20042005 from 7.48.8 million equity ounces in 20032004, primarily due to lower production and sales in Nevada and the dispositions of Ovacik and Bronzewing in 2004. Copper revenues decreased 15% in 2005 from 2004 due to lowera 16% decrease in copper pounds sold at Batu Hijau and higher treatment and refining charges, partially offset by a 9% increase in the average grades and at Ovacik due to the suspension of operations in August 2004realized price (see Results of Operations below). Our equity gold sales in 2003 were slightly lower than the 7.6 million ounces in 2002 because of the Company’s divestiture of non-core investments and operations.
During 2004 and 2003, the weakening U.S. dollar and other factors helped strengthen gold prices and as a result, our average realized price per ounce increased from $313 in 2002 to $366 in 2003 and to $412 in 2004. The average realized gold price increases over the last few years were partially offset by higher production costs and lower equityfewer gold ounces sold. During the past three years,same period, Newmont has seen significant increases in the costs of fuel, power and other bulk consumables. In addition, our production costs were affected by increases in foreign currency exchange rates in relation to the U.S. dollar. While a weaker U.S. dollar generally benefits the gold price, which is quoted in U.S. dollars, it also results in higher costs quoted in U.S. dollars at certain of our foreign operations. We experienced appreciation of 5% between 2005 and 2004 and 13% between 2004 and 2003 and 17% between 2003 and 2002 in the average Australian dollar/U.S. dollar exchange rate. Equity gold ounces sold have decreased due to lower grade ores and the sale of non-core mines.
In addition, our financial and operating results for the year ended December 31, 20042005 were impacted by the following:
Liquidity
The Company’s financial position at December 31, 2004 and 2003 was as follows:
| At December 31, | ||||||
| 2004 | 2003 | |||||
| (in millions) | ||||||
Total debt | $ | 1,596.7 | $ | 1,077.5 | ||
Total stockholders’ equity | $ | 7,937.7 | $ | 7,384.9 | ||
Cash and cash equivalents | $ | 782.7 | $ | 1,131.1 | ||
| At December 31, | ||||||
| 2005 | 2004 | |||||
Total debt | $ | 1,929 | $ | 1,602 | ||
Total stockholders’ equity | $ | 8,376 | $ | 7,938 | ||
Cash and cash equivalents | $ | 1,082 | $ | 781 | ||
During 2004,2005 our debt and liquidity positions were affected by the following:
Looking Forward
Certain key factors will affect our future financial and operating results. These include, but are not limited to the following:
| • | Newmont expects 2006 consolidated gold sales of approximately 8 million ounces (approximately 6.25 million equity ounces) atCosts applicable to sales of approximately $280 to $285 per ounce. As a result of lower production from Yanacocha in Peru, planned mine closures in Canada and Nevada and previously announced asset sales, equity gold sales are expected to decline by a further 3% in 2007.Costs applicable to sales are expected to improve as gold sales increase after 2007 with the completion of the Leeville, Phoenix and power plant projects in Nevada, and the Ahafo and Akyem projects in Ghana. |
Consolidation of Batu Hijau
In December 2003, the FASBFinancial Accounting Standards Board (“FASB”) issued FIN 46R, which provides guidance on the identification and reporting for entities over which control is achieved through means other than voting rights. FIN 46R defines such entities as variable interest entities (“VIEs”). Application of this revised interpretation was required in financial statements for companies that have interests in VIEs or potential VIEs, commonly referred to as special-purpose entities, for periods ending after December 31, 2003. Application for all other types of entities was required in financial statements for periods ending after March 15, 2004.
Newmont identified the Nusa Tenggara Partnership (“NTP”) and P.T. Newmont Nusa Tenggara (“PTNNT”) (collectively, “Batu Hijau”) as VIEs because of certain capital structures and contractual relationships (primarily the sharing of the expected residual returns with a party that did not have an equity investment at risk that is considered significant to the total expected residual returns, as well as indications of insufficient equity). Newmont also determined that it is the primary beneficiary of Batu Hijau. Therefore, as of January 1, 2004, the Company has fully consolidated Batu Hijau in its Consolidated Financial Statements. For periods prior to 2004, the investment in Batu Hijau was accounted for using the equity method of accounting.
Upon consolidation of Batu Hijau, effective January 1, 2004, certain adjustments were recorded to the opening balance sheet of PTNNT to conform to Newmont’s accounting policies. These adjustments were recorded to change from units-of-production depreciation of processing plant and mining facilities to straight-line depreciation of such facilities and to change from allocating costs to stockpile inventories based on mining costs per ton to allocating costs based on recoverable pounds of copper equivalent contained in the various categories of stockpiles. The impact of these adjustments were charges of $15.1 million$15 and $32.0 million,$32, respectively, net of income tax expense and minority interest which have been recorded inCumulative effect of a change in accounting principle, net of tax in the 2004 Statements of Consolidated Statement of Income, net of income tax expense and minority interest.Income. The consolidation had a significant impact on the Consolidated Financial Statements.
Mineral Interests
On April 30, 2004, a FASB Staff Position (“FSP”) was issued amending Statement of Financial Accounting Standards (“SFAS”) No. 141 and No. 142 to provide that certain mineral rights are considered tangible assets and that mineral rights should be accounted for based on their substance. The FSP was effective for the first reporting period beginning after April 29, 2004, with early adoption permitted. As a result, Newmont reclassified all of its mineral, royalty and oil and gas interests, with a carrying value of $1,273.0 million,$1,273, from mineral interests and other intangible assets toProperty, plant and mine development, net in its balance sheets and ceased amortization of exploration stage mineral interests effective April 1, 2004. The aggregate amortization expense related to mineral, royalty and oil and gas interests was $110.5 million and $150.1 million for the years ended December 31, 2003 and 2002, respectively.
Reclamation and Remediation (Asset Retirement Obligations)
In August 2001, the FASB issued SFAS No. 143, “Accounting for Asset Retirement Obligations,” which established a uniform methodology for accounting for estimated reclamation and abandonment costs. NewmontThe statement was adopted SFAS No. 143 as required and as a result, on January 1, 2003,Reclamation when the Company recorded the estimated present value of reclamation liabilities and remediation liabilitiesincreased by $120.7 millionthe carrying amount of the related asset, which resulted in a net expense for the fair value of the estimated asset retirement obligations,Other current liabilities increased by $2.3 million,Deferred income tax assets increased by $11.2 million,Property, plant and mine development, net increased by $69.1 million, Minority interest in subsidiaries decreased by $16.2 million,Investments decreased by $8.0 million and a $34.5 million loss was recorded for theCumulativecumulative effect of a change in accounting principle net of tax. In 2002, the pro forma effect would have increased net income by $0.2 million ($0.00 per share) had the accounting change been in effect during the period.
Depreciation, Depletion and Amortization
Newmont changed its accounting policy effective January, 1, 2002, with respect$35. Reclamation costs are allocated toDepreciation, depletion and amortization (“DD&A”)of Property, plant and mine development, netto exclude future estimated development costs expected to be incurred for certain underground operations. In addition, the Company revised its policy such that costs incurred to access specific ore blocks are depreciated, depleted, or amortized expense over the reserves associated withlife of the specific ore area. The cumulative effectrelated assets and are adjusted for changes resulting from the passage of this change in accounting principle through December 31, 2001 increased net income in 2002 by $7.7 million, nettime and revisions to either the timing or amount of tax of $4.1 million, and increased net income per share by $0.02.the original present value estimate.
Listed below are the accounting policies that the Company believes are critical to its financial statements due to the degree of uncertainty regarding the estimates or assumptions involved and the magnitude of the asset, liability, revenue or expense being reported.
Carrying Value of Goodwill
At December 31, 2004 and 2003,2005, the carrying value of the Company’s goodwill was approximately $3.0 billion. Such goodwill$2,879. Goodwill was assigned to the Company’s Merchant Banking (approximately $1.6 billion)($1,562) and Exploration (approximately $1.1 billion)($1,126) Segments and to various mine site reporting units (approximately $300 million in the aggregate)Australia/New Zealand Segment ($191). This goodwill primarily arose in connection with the Company’sour February 15, 2002 acquisitions of Normandy and Franco-Nevada, and it represents the excess of the aggregate purchase price over the fair value of the identifiable net assets of Normandy and Franco-Nevada. The Company’sassets. Our approach to allocating goodwill was to identify those reporting units of the Company that the Companywe believed had contributed to such excess purchase price. The CompanyWe then performed
valuations to measure the incremental increases in the fair values of such reporting units that were attributable to the acquisitions, and that were not already captured in the fair values assigned to such units’ identifiable net assets. In the case of the Merchant Banking and Exploration Segments, these valuations were based on each reporting unit’s potential for future growth, and in the case of the mine site reporting units, the valuation was based on the merger-related synergies that were expected to be realized by each mine site reporting unit.
The Company evaluates,We evaluate, on at least an annual basis, the carrying amount of goodwill to determine whether current events and circumstances indicate that such carrying amount may no longer be recoverable. To accomplish this, we compare the Company compares theestimated fair values of itsthe reporting units to their carrying amounts. If the carrying value of a reporting unit were to exceedexceeds its fair value at the time of the evaluation, the Companywe would compare the implied fair value of the reporting unit’s goodwill to its carrying amount and any shortfall would be charged to income.earnings. Assumptions underlying fair value estimates are subject to risks and uncertainties. Newmont performed its annual impairment tests of goodwill during the fourth quarter of 20042005 and determined that goodwill at one reporting unit, Pajingo,Nevada, was impaired atas of December 31, 2004,2005, as discussed below. A similar assessment by the Company during the fourth quarter of 2004 determined that the Pajingo reporting unit was impaired as of December 31, 2004. To the extent the assumptions used in the Company’s valuation models, laid outdescribed below, for such impairment tests are not achieved in the future, it is reasonably possible that the Company will record charges for impairment of goodwill in future periods. The specific application of the Company’s goodwill impairment policy with respect to the Merchant Banking Segment, Exploration Segment and mine site reporting units is separately discussed below.
Merchant Banking Segment Goodwill
Newmont’s Merchant Banking Segment is comprised of an Equity Portfolio sub-segment,equity portfolio, focused on managing the Company’s portfolio of equity securities, a Royalty Portfolio sub-segment, a Value Realization sub-segment,royalty portfolio, portfolio management activities, providing in-house investment banking and advisory services to the Company, and a Downstream Gold Refining sub-segment. The Merchant Banking Segment did not exist prior to the acquisitions of Normandy and Franco-Nevada in February 2002.
downstream business activities.
At December 31, 2004,2005, the $1.6 billion$1,562 carrying value of the Merchant Banking Segment goodwill represented approximately 65%58% of the carrying value of the total assets of the Merchant Banking Segment. Based on a December 31, 20042005 valuation of the Merchant Banking Segment, the Company concluded that the fair value of the Merchant Banking Segment was significantly in excess of its carrying value at December 31, 2004. 2005.
The December 31, 20042005 discounted cash flow analysis for the Equity Portfolio sub-segment of the Merchant Banking Segment assumed: (i) a discount rate of 9%; (ii) a time horizon of ten years; (iii) pre-tax returns on investment ranging from 35% starting in 20052006 and gradually declining to 15% in 20122013 through 2014;2015; (iv) an initial equity portfolio investment of approximately $0.5 billion;$940; (v) capital infusions of $50 million annually for the next three years; and (vi) a terminal value of approximately $2.2 billion.$3,885. The December 31, 20042005 discounted cash flow
analysis for the Royalty Portfolio sub-segment of the Merchant Banking Segment assumed: (i) a discount rate of 9%; (ii) a time horizon of ten years; (iii) an annual growth rate of 5% in the royalty portfolio;Royalty Portfolio; and (iv) a pre-tax rate of return on investment of 13%. The December 31, 20042005 discounted cash flow analysis for the Value Realization sub-segmentPortfolio Management of the Merchant Banking Segment assumed: (i) a discount rate of 9%; (ii) a time horizon of ten years; and (iii) a pre-tax advisory fee of 5% on approximately $500 million of transactions and value-added activities in 2005,2006, with the dollar amount of such transactions and activities increasing by 5% annually thereafter. The December 31, 20042005 discounted cash flow analysis for the Downstream Gold Refining sub-segmentdownstream business of the Merchant Banking Segment assumed: (i) a discount rate of 9%; (ii) a time horizon of ten years; and (iii) a pre-tax annual return on investmentsinvestment of $4.2 million.15%. The December 31, 20042005 discounted cash flow analysis assumed a combined terminal value for the royalty portfolio, portfolio management and downstream gold refining sub-segmentsbusiness of approximately $0.7 billion.
$707.
For purposes of valuing the Merchant Banking Segment atin the future, fiscal year ends, the Company expects that the valuation model will continue to be reevaluated and enhanced to acknowledgerecognize the evolving activities and objectives of the Merchant Banking Segment. The key drivers of such future valuations are expected to include (i) expected future long-term investment returns, adjusted for Company specific and market driven factors; (ii) expected economic value
to be added by the Merchant Banking Segment in addition to such investment returns; (iii) the level of capital accessible by the Merchant Banking Segment; and (iv) other relevant facts and circumstances. To determine the appropriate returns, investment levels and other assumptions for purposes of this analysis, the Company will (i) review the expected or actual returns from transactions that were initiated and/or completed since the last impairment test; (ii) assess the actual economic valuesvalue added by other Merchant Banking Segment activities since the last impairment test; and (iii) assess the ongoing appropriateness of all assumptions impacting the valuation based on then current conditions and expectations. The Company believes that any model used to value the Merchant Banking Segment will need to take into account the relatively long time horizon required to evaluate the investment returns and other economic value added activities of the Merchant Banking Segment. In the absence of any mitigating valuation factors or “triggering events” (events that would give rise to a requirement to perform an impairment test), which are described below, the Company believes that a sustained period of approximately three years in which the Merchant Banking Segment’s actual investment levels, returns or economic values added fall significantly below those levels necessary to support the carrying value of the Merchant Banking Segment would likely result in a reduction of the value assigned to the Merchant Banking Segment’s growth potential and, in the absence of any offsetting increase in the aggregate fair value of the Merchant Banking Segment’s other net assets, an impairment of the Merchant Banking Segment goodwill.
A high degree of judgment is involved in determining the assumptions and estimates that are used to determine the fair value of the Merchant Banking Segment. Accordingly, no assurance can be given that actual results will not differ significantly from the corresponding assumptions and estimates. If a triggering event were to occur that could reasonably be expected to result in an impairment of the carrying value of the Merchant Banking Segment, the Company would be required to test the goodwill assigned to the Merchant Banking Segment as of the end of the reporting period in which any such event occurred. The Company believes that triggering events with respect to the Merchant Banking Segment could include, but are not limited to: (i) the Company’s partial or complete withdrawal of financial support for the Merchant Banking Segment; (ii) a significant reduction in management’s long-term expectation of the price of gold, given the adverse effect such a development could have on the fair values of the Merchant Banking Segment’s investment and royalty interest portfolios and the Merchant Banking Segment’s prospects for future growth; (iii) the divestiture of a significant portion of the Merchant Banking Segment’s investment portfolio together with management’s determination not to fund the replenishment of such portfolio for the foreseeable future; and (iv) any other event that might adversely affect the ability of the Merchant Banking Segment to consummate transactions that create value for the Company. The Company currently has no plans to withdraw financial support for the Merchant Banking Segment. For a discussion of the results of operations of the Merchant Banking Segment, see Results of Operations, Merchant Banking Segment, below.
Exploration Segment Goodwill
The Exploration Segment is responsible for all activities, regardless of location, associated with the Company’s efforts to discover new mineralized material that willcould ultimately advance into proven and probable reserves. As discussed in greater detail below, when performing its Exploration Segment goodwill impairment testing, the Company only uses historic additions to proven and probable reserves as an indication of the expected future performance of the Exploration Segment. In this regard, once a discovery is made by the Exploration Segment, all subsequent reserve additions (or subtractions) resulting from that original discovery are considered in determining the expected future performance of the Exploration Segment.
Internally generated proven and probable reserve additions are attributed to the Exploration Segment for purposes of determining the Company’s assumptions with respect to the expected future performance of the Exploration Segment only to the extent that such additions are derived from (i) a discovery made by the Company or Normandy;Company; or (ii) a discovery made on previously acquired properties (whether acquired by the Company or by Normandy, prior to its acquisition by the Company) as a result of exploration efforts conducted subsequent to the acquisition date. The assignmentA portion of goodwillthe additions to the Exploration Segment was based on the assumption that, following the acquisition of Normandy, the Exploration Segment would continue Normandy’s historical level of increasing proven and probable reserves during 2003 through new discoveries by combining Normandy’s exploration culture, philosophy, expertise2005 was derived from the conversion of mineralized material that had been assigned values as part of the purchase price allocation process. In addition, the Company expects that a portion of internally generated reserve additions during 2006 and methodologiesthe next several years will also be derived from the conversion of mineralized material which had been assigned values as part of purchase price accounting. To avoid duplication, the reserves which are expected to be derived from this mineralized material in the future are excluded from the reserve additions used in the valuation of the Exploration Segment performed in connection with those of Newmont.the Company’s goodwill impairment tests.
At December 31, 2004,2005, the $1.1 billion$1,126 carrying value of the Exploration Segment goodwill represented approximately 98%99% of the carrying value of the total assets of the Exploration Segment. Based on a December 31, 2004 valuationvaluations of the Exploration Segment at December 31, 2005 and 2004, the Company concluded that substantially all of the fair value of the Exploration Segment, which was significantly in excess of itsthe carrying value, at December 31, 2004. Based onwas derived from the review of historical additionsterminal value. The valuation models included the following:
| As at December 31, | ||||||||
| 2005 | 2004 | |||||||
Assumptions: | ||||||||
Initial year additions to reserves (gold ounces in millions): | ||||||||
Total additions | 9.5 | 11.0 | ||||||
Less: Additions previously valued in purchase accounting | (0.9 | ) | (1.0 | ) | ||||
Additions attributable to the Exploration Segment | 8.6 | 10.0 | ||||||
Annual reserve addition growth rate | 5 | % | 5 | % | ||||
Time horizon (years) | 16 | 16 | ||||||
Time lag between reserve additions and production (years) | 7.1 | 7.2 | ||||||
Production period (years) | 5 | 5 | ||||||
Discount rate | 8 | % | 8 | % | ||||
Price/cost assumptions (per ounce of gold): | ||||||||
Gold price | $ | 450 | $ | 375 | ||||
Operating costs | $ | 264 | $ | 230 | ||||
Capital costs | $ | 56 | $ | 50 | ||||
Finding costs | $ | 13 | $ | 13 | ||||
Terminal value | $ | 7,514 | $ | 5,812 | ||||
Additions to proven and probable reserves and on management’s expectation of the growth rate and levels of reserve additions that could be expected to continueused in the Company’s valuation models were based on management reviews of historical performance and expectations of future the discounted cash flow model developed to value the Exploration Segment at December 31, 2004 assumed that (i) the Exploration Segment would be responsible for 11.0 million ounces of additions to proven and probable reserves in 2005; (ii) such additions would increase by 5% annually; and (iii) approximately 9.1%, 8.7%, 8.3% and 7.9% of additions in years 2005, 2006, 2007 and 2008, respectively, would represent ounces that had previously been valued in the Normandy purchase accounting. In addition, the discounted cash flow model for the Exploration Segment assumed, among other matters: (i) a 16-year time horizon, including a seven-year time lapse between additions to proven and probable reserves and the initiation of production and a five-year production period; (ii) discount rate of 8%; (iii) a terminal value of approximately $5.8 billion; (iv) an average gold price of $375 per ounce during the time horizon; (v) total cash costs per ounce of $230; and (vi) capital costs of $50 per ounce. The Company believes that anyreserve additions. Any model used to value the Exploration Segment will need to take into account the relatively long time horizon required to evaluate the activities of the Exploration Segment. As such, inReserve additions may vary significantly from year to year based on the absencetiming of any mitigating valuation factors, or triggering events which are described below, the Company believes that a sustainedwhen proven and probable reserves can be reported under SEC Industry Guide 7. A period of approximately threeseveral years in which additionsmay be required to advance a project from initial discovery to proven and probable reserves, or the values associated therewith, fall short of those levels that reasonably could be expected to support the carrying value of thereserves.
The Company’s December 31, 2005 Exploration Segment would likely result in a reduction of the value assignedgoodwill valuation model assumed proven and probable reserve additions attributable to the Exploration Segment’s growth potentialsegment of 8.6 million equity ounces in 2006. Actual proven and accordingly, in an impairment ofprobable additions attributable to the Exploration Segment goodwill. The Company believes that triggeringsegment for 2005 and 2004 compared to assumptions used at December 31, 2004 and 2003, respectively, were as follows:
(millions of equity ounces) | Actual | Assumption(1) | Excess (shortfall) | ||||||
2005 | |||||||||
Total additions | 9.4 | 11.0 | (1.6 | ) | |||||
Additions previously valued in purchase accounting | (1.2 | ) | (1.0 | ) | (0.2 | ) | |||
Additions attributable to the Exploration Segment | 8.2 | 10.0 | (1.8 | ) | |||||
2004 | |||||||||
Total additions | 12.4 | 7.9 | 4.5 | ||||||
Additions previously valued in purchase accounting | (1.9 | ) | (5.0 | ) | 3.1 | ||||
Reclassification of Cerro Quilish reserves | (2.0 | ) | — | (2.0 | ) | ||||
Additions attributable to the Exploration Segment | 8.5 | 2.9 | 5.6 | ||||||
| (1) | Additions assumed in the Exploration Segment valuation models for 2005 at December 31, 2004 and for 2004 at December 31, 2003. |
Triggering events with respect to the Exploration Segment could include, but are not limited to: (i) the Company’s partial or complete withdrawal of financial support for the Exploration Segment; (ii) a significantly lower assumed annual reserve addition growth rate; (iii) a significant decrease in the Company’s long-term expectation of the price of gold; (iv) a significant change in the financial markets resulting in a significant increase in the discount rate; and (iii)(v) a significant increase in long-term capitaloperating and operatingcapital cost estimates. The Company currently has no plans to withdraw financial support for the Exploration Segment. For a discussion of the results of operations of the Exploration Segment, see Results of Operations, Exploration Segment, below.
On December 27, 2005 and February 17, 2006, the Company received letters from the Securities and Exchange Commission, Division of Corporate Finance (“Comment Letters”) in regards to the Company’s Form 10-K for the fiscal year ended December 31, 2004. The Comment Letters primarily relate to the Company’s disclosures regarding the Exploration Segment and the valuation model used to estimate the fair value of the Exploration Segment for annual goodwill impairment testing. The Company has made certain additional disclosures in response to the Comment Letters and will continue to respond to any additional issues. The Company continues to believe that the valuation model utilized in assessing the Exploration Segment goodwill is reasonable and consistent with the application of generally accepted accounting principles.
Mine Site Goodwill
The assignment of goodwill to mine site reporting units was based on synergies that were expected to be achieved at each operation. Such synergies are expected to behave been incorporated into the Company’s operations and business plans over time. The amount of goodwill assigned to each segment or reporting unit was based on discounted cash flow analyses that assumed risk-adjusted discount rates over the remaining lives of the applicable mining operations. The Company believes that triggering events with respect to the goodwill assigned to mine site reporting units could include, but are not limited to: (i) a significant decrease in the Company’s long-term gold price assumption; (ii) a decrease in reserves; (iii) a significant reduction in the estimated fair value of mine site exploration potential; and (iii)(iv) any event that might otherwise adversely affect mine site production levels or costs. The Company performed its annual impairment test of mine site goodwill as of December 31, 20042005 and determined that, except in the case of its PajingoNevada reporting unit, (Australia/New
Zealand Segment) the fair value of each mine site reporting unit was in excess of the relevant carrying value at December 31, 2004. At Pajingo,2005. As a result of increased future operating and capital costs at Nevada the Company determined there was an impairment of $41 as of December 31, 2004 as a result of increased future operating costs and lower grade ore.2005. For more information on the discounted cash flows used to value mine site reporting units, see Carrying Value of Long-Lived Assets, below.
Depreciation, Depletion and Amortization
Expenditures for new facilities or equipment and expenditures that extend the useful lives of existing facilities or equipment are capitalized and depreciated using the straight-line method at rates sufficient to depreciate such costs over the estimated future lives of such facilities or equipment. These lives do not exceed the estimated mine life based on proven and probable reserves as the useful lives of these assets are considered to be limited to the life of the relevant mine.
Costs incurred to develop new properties are capitalized as incurred, where it has been determined that the property can be economically developed based on the existence of proven and probable reserves. At the Company’s surface mines, these costs include costs to further delineate the ore body and remove overburden to initially expose the ore body. At the Company’s underground mines, these costs include the cost of building access ways, shaft sinking and access, lateral development, drift development, ramps and infrastructure development. All such costs are amortized using the units-of-production (“UOP”) method over the estimated life of the ore body based on estimated recoverable ounces to be minedproduced from proven and probable reserves.
Major development costs incurred after the commencement of production are amortized using the UOP method based on estimated recoverable ounces to be minedproduced from proven and probable reserves. Depending upon whether the development is expected to benefit the entire remaining ore body, or specific ore blocks or areas only, the UOP basis is either the life of the entire ore body or the life of the specific ore block or area.
The calculation of the UOP rate of amortization, and therefore the annual amortization charge to operations, could be materially impacted to the extent that actual production in the future is different from current forecasts of production based on proven and probable reserves. This would generally occur to the extent that there were significant changes in any of the factors or assumptions used in determining reserves. These factors could include: (i) an expansion of proven and probable reserves through exploration activities; (ii) differences between estimated and actual cash costs of mining, due to differences in grade, metal recovery rates and foreign currency exchange rates; and (iii) differences between actual commodity prices and commodity price assumptions used in the estimation of reserves. Such changes in reserves could similarly impact the useful lives of assets depreciated on a straight-line basis, where those lives are limited to the life of the mine, which in turn is limited to the life of the proven and probable reserves.
The expected useful lives used in depreciation, depletion and amortization calculations are determined based on applicable facts and circumstances, as described above. Significant judgment is involved in the determination of useful lives, and no assurance can be given that actual useful lives will not differ significantly from the useful lives assumed for purpose of depreciation, depletion and amortization calculations.
Carrying Value of Long-Lived Assets
The Company reviews and evaluates its long-lived assets for impairment when events or changes in circumstances indicate the related carrying amounts may not be recoverable. An asset impairment is considered to exist if the total estimated future cash flows on an undiscounted basis are less than the carrying amount of the asset, including goodwill, if any. An impairment loss is measured and recorded based on discounted estimated future cash flows. Future cash flows are estimated based on estimated quantities of recoverable minerals, expected gold and other commodity prices (considering current and historical prices, price trends and related factors), production levels and cash costs of production, capital and reclamation costs, all based on detailed life-of-mine engineering plans. The significant assumptions in determining the future discounted cash flows for each mine site reporting unit at December 31, 2004,2005, apart from production cost and capitalized expenditure
assumptions unique to each operation, included a long-term gold price of $375$450 per ounce and Australian and Canadian dollar exchange rates of $1.43A$1.33 and $1.30,CDN$1.19, respectively per U.S.$1.00.$1.00. The term “recoverable minerals” refers to the estimated amount of gold or other commodities that will be obtained from proven and probable reserves and all related exploration stage mineral interests, except for other mine-related exploration potential and greenfields exploration potential discussed separately below, after taking into account losses during ore processing and treatment. Estimates of recoverable minerals from such exploration stage mineral interests are risk adjusted based on management’s relative confidence in such materials. In estimating future cash flows, assets are grouped at the lowest level for which there are identifiable cash flows that are largely independent of future cash flows from other asset groups. With the exception of other mine-related exploration potential and greenfields exploration potential, all assets at a particular operation are considered together for purposes of estimating future cash flows. In the case of mineral interests associated with other mine-related exploration potential and greenfields exploration potential, cash flows and fair values are individually evaluated based primarily on recent exploration results and recent transactions involving sales of similar properties.
As discussed above under Depreciation, Depletion and Amortization, various factors could impact the Company’s ability to achieve its forecasted production schedules from proven and probable reserves. Additionally, labor and commodity prices, capital expenditure requirements and reclamation costs could differ from the assumptions used in the cash flow models used to assess impairment. The ability to achieve the estimated quantities of recoverable minerals from exploration stage mineral interests involves further risks in addition to those factors applicable to mineral interests where proven and probable reserves have been identified, due to the lower level of confidence that the identified mineralized material cancould ultimately be mined economically. Assets classified as other mine-related exploration potential and greenfields exploration potential have the highest level of risk that the carrying value of the asset can be ultimately realized, due to the still lower level of geological confidence and economic modeling.
During the years ended December 31, 2005, 2004 2003 and 2002,2003, write-downs of long-lived assets were $39.3 million, $35.3 million$43, $39 and $3.7 million,$35, respectively. See Consolidated Financial Results below for further discussion. Material changes to any of these factors or assumptions discussed above could result in future impairment charges.
Deferred Stripping Costs
In general, mining costs are allocated to production costs, stockpiles, ore on leach pads and inventories, and are charged toCosts applicable to sales when gold or copper is sold. However, at certain open pit mines, which have diverse grades and waste-to-ore ratios over the mine life, the Company defers and amortizes certain mining costs on a units-of-production basis over the life of the mine. These mining costs, which are commonly referred to as “deferred stripping” costs, are incurred in mining activities that are normally associated with the removal of waste rock. The deferred stripping accounting method is generally accepted in the mining industry where mining operations have diverse grades and waste-to-ore ratios; however, industry practice does vary. Deferred stripping matches the costs of production with the sale of such production at the Company’s operations where it is employed, by assigning each ounce of gold or pound of copper with an equivalent amount of waste removal cost. If the Company were to expense stripping costs as incurred, there might be greater volatility in the Company’s period-to-period results of operations.
TheIn March 2005, the FASB ratified Emerging Issues Task Force (“EITF”) is discussingIssue No. 04-6, “Accounting for Stripping Costs Incurred during Production in the Mining Industry,” (EITF 04-6) which addresses the accounting for deferred stripping costs but has not yet reached a consensus. The EITF considered the recommendation that stripping costs incurred during the production arephase of a mine development costand refers to these costs as variable production costs that should be capitalizedincluded as an investmenta component of inventory to be recognized in costs applicable to sales in the mine and attributedsame period as the revenue from the sale of inventory. As a result, capitalization of stripping costs is appropriate only to the provenextent product inventory exists at the end of a reporting period and probable reserves benefited in a systematicthe carrying value is less than the net realizable value. Newmont will adopt the provisions of EITF 04-6 on January 1, 2006. The most significant impact of adoption is expected to be the removal of deferred and rational manner. However, the EITF directed the FASB staff to develop additional guidance about what constitutes a systematic and rational manner of attributing the capitalizedadvanced stripping costs to proven and probable reserves benefited. The Company cannot predict whether the deliberations of the EITF will ultimately modify or otherwise result in new accounting standards or interpretations thereof that differ from the balance sheet, net of taxes and minority interests, and reclassifying the balances as a cumulative effect adjustment reducing beginning retained earnings by approximately $75 to $85. Adoption of EITF 04-6 will have no impact on the Company’s current practices.cash position.
Financial Instruments
All financial instruments that meet the definition of a derivative are recorded on the balance sheet at fair market value, with the exception of contracts that qualify for the normal purchases and normal sales exemption. Changes in the fair market value of derivatives recorded on the balance sheet are recorded in the statements of consolidated operations, except for the effective portion of the change in fair market value of derivatives that are designated as a cash flow hedge and qualify for cash flow hedge accounting. The Company’s portfolio of derivatives includes various complex instruments that are linked to gold prices and other factors. Management applies significant judgment in estimating the fair value of instruments that are highly sensitive to assumptions regarding gold and other commodity prices, gold lease rates, market volatilities, foreign currency exchange rates and interest rates. Variations in these factors could materially affect amounts credited or charged to operationsearnings to reflect the changes in fair market value of derivatives. In addition, certain derivative contracts are accounted for as cash flow hedges, whereby the effective portion of changes in fair market value of these instruments are deferred inOther comprehensive income and will be recognized in the statements of consolidated operations when the underlying production designated as the hedged item is sold. All derivative contracts qualifying for hedge accounting are designated against the applicable portion of future production from proven and probable reserves, where management believes the forecasted transaction is probable of occurring. To the extent that management determines that such future production is no longer probable of occurring due to changes in the factors impacting the determination of reserves, as discussed above underDepreciation, depletion and amortization, gains and losses deferred inOther comprehensive incomewould be reclassified to the statements of consolidated operations immediately.
Reclamation and Remediation Obligations (Asset Retirement Obligations)
The Company’s mining and exploration activities are subject to various laws and regulations governing the protection of the environment. In August 2001, the FASB issued SFAS No. 143, “Accounting for Asset Retirement Obligations,” which established a methodology for accounting for estimated reclamation and abandonment costs. The statement was adopted January 1, 2003, when the Company recorded the estimated present value of reclamation liabilities and increased the carrying amount of the related asset, which resulted in a charge to cumulative effect of a change in accounting principle, net of $34.5 million.$35. See Note 3 to the Consolidated Financial Statements. The reclamation costs will be allocated to expense over the life of the related assets and will be adjusted for changes resulting from the passage of time and revisions to either the timing or amount of the original present value estimate. Prior to adoption of SFAS No. 143, estimated future reclamation costs were based principally on legal and regulatory requirements. Such costs related to active mines were accrued and charged over the expected operating lives of the mines using the UOP method based on proven and probable reserves.
Future remediation costs for inactive mines are accrued based on management’s best estimate at the end of each period of the undiscounted costs expected to be incurred at a site.incurred. Such cost estimates include, where applicable, ongoing care, maintenance and monitoring costs. Changes in estimates are reflected in earnings in the period an estimate is revised.
Accounting for reclamation and remediation obligations requires management to make estimates unique to each mining operation of the future costs the Company will incur to complete the reclamation and remediation work required to comply with existing laws and regulations. Actual costs incurred in future periods could differ from amounts estimated. Additionally, future changes to environmental laws and regulations could increase the extent of reclamation and remediation work required to be performed by the Company.required. Any such increases in future costs could materially impact the amounts charged to operationsearnings for reclamation and remediation.
Deferred Tax Assets
The Company recognizes the expected future tax benefit from deferred tax assets when the tax benefit is considered to be more likely than not of being realized. Assessing the recoverability of deferred tax assets requires management to make significant estimates related to expectations of future taxable income.
Estimates of future taxable income are based on forecasted cash flows and the application of existing tax laws in each jurisdiction. Refer above under Carrying Value of Long-Lived Assets for a discussion of the factors that could cause future cash flows to differ from estimates. To the extent that future cash flows and taxable income differ significantly from estimates, the ability of the Company to realize deferred tax assets recorded at the balance sheet date could be impacted. Additionally, future changes in tax laws in the jurisdictions in which the Company operates could limit the Company’s ability to obtain the future tax benefits represented by its deferred tax assets recorded at the reporting date.
Consolidated Financial Results
Sales—gold, netwere $3.7 billion, $3.1 billion and $2.6 billion forincreased 3% in 2005 compared to 2004 due to a 7% increase in the years ended December 31,average realized price, partially offset by a 3% decrease in ounces sold. In 2004, gold sales increased 19% over 2003 and 2002, respectively. The period-to-period changes were primarily due to an increase in the average realized gold price and in 2004, the consolidation of Batu Hijau. The following analysis demonstratesreflects the increase in consolidated gold revenue year over year:revenue:
| Years Ended December 31, | ||||||||||
| 2004 | 2003 | 2002 | ||||||||
Consolidated gold sales (in millions) | $ | 3,653.6 | $ | 3,082.9 | $ | 2,566.9 | ||||
Consolidated gold ounces sold (in thousands) | 8,915.6 | 8,455.9 | 8,217.9 | |||||||
Average realized price per ounce of gold | $ | 412 | $ | 366 | $ | 313 | ||||
Increase (decrease) in consolidated gold sales due to (in millions): | ||||||||||
2004 vs. 2003 | 2003 vs. 2002 | |||||||||
Changes in ounces sold: | ||||||||||
Consolidation of Batu Hijau | $ | 287.7 | $ | N/A | ||||||
Other | (97.1 | ) | 75.8 | |||||||
Change in average realized gold price | 380.1 | 440.2 | ||||||||
| $ | 570.7 | $ | 516.0 | |||||||
| Years Ended December 31, | ||||||||||||
| 2005 | 2004 | 2003 | ||||||||||
Consolidated gold sales, gross | $ | 3,760 | $ | 3,636 | $ | 3,060 | ||||||
Treatment and refining charges | (26 | ) | (11 | ) | $ | (1 | ) | |||||
Consolidated gold sales, net | $ | 3,734 | $ | 3,625 | $ | 3,059 | ||||||
Consolidated gold ounces sold (thousands) | 8,552.0 | 8,828.9 | 8,377.4 | |||||||||
Average realized price per ounce of gold | $ | 441 | $ | 412 | $ | 365 | ||||||
The change in consolidated gold sales is due to:
| 2005 vs. 2004 | 2004 vs. 2003 | |||||||
Changes in consolidated ounces sold | $ | (123 | ) | $ | (96 | ) | ||
Consolidation of Batu Hijau | — | 288 | ||||||
Change in average realized gold price | 247 | 380 | ||||||
Change in treatment and refining charges | (15 | ) | (6 | ) | ||||
| $ | 109 | $ | 566 | |||||
Sales—base metals,copper, net totaled $870.6 million fordecreased 5% in 2005 compared to 2004 due to a 16% decrease in copper pounds sold, partially offset by a 9% increase in the year ended December 31, 2004, and included $785.9 million fromaverage realized copper sales at Batu Hijau and $55.3 million from copper sales and $29.4 million from zinc sales at Golden Grove in Australia, all net of smelting and refining charges.Sales—base metals, net totaled $74.9 million for the year ended December 31, 2003, which included $53.0 million and $21.9 million from copper and zinc sales at Golden Grove, respectively, net of smelting and refining charges.Sales—base metals, net totaled $55.3 million for the year ended December 31, 2002, and included $27.6 million from copper sales and $23.3 million from zinc sales at Golden Grove in Australia, all net of smelting and refining charges, and $4.4 million from cobalt sales. The cobalt operation was sold in 2002.price. The following analysis reflects the increasechanges in consolidated copper revenue year over year:revenue:
| Years Ended December 31, | ||||||||||
| 2004 | 2003 | 2002 | ||||||||
Consolidated copper sales (in millions) | $ | 841.2 | $ | 53.0 | $ | 27.6 | ||||
Consolidated copper pounds sold (in millions) | 726.7 | 74.3 | 44.8 | |||||||
Average realized price per pound of copper | $ | 1.33 | $ | 0.86 | $ | 0.79 | ||||
Increase (decrease) in consolidated copper sales is due to (in millions): | ||||||||||
2004 vs. 2003 | 2003 vs. 2002 | |||||||||
Changes in pounds sold: | ||||||||||
Consolidation of Batu Hijau | $ | 785.9 | $ | N/A | ||||||
Other | (19.6 | ) | 20.2 | |||||||
Change in average realized copper price | 21.9 | 5.2 | ||||||||
| $ | 788.2 | $ | 25.4 | |||||||
| Years Ended December 31, | |||||||||||
| 2005 | 2004 | 2003 | |||||||||
Consolidated copper sales, gross | $ | 833 | $ | 907 | $ | — | |||||
Treatment and refining charges | (161 | ) | (121 | ) | — | ||||||
Consolidated copper sales, net | $ | 672 | $ | 786 | $ | — | |||||
Consolidated copper pounds sold (millions) | 572.7 | 683.3 | — | ||||||||
Average realized price per pound of copper | $ | 1.45 | $ | 1.33 | $ | — | |||||
During 2005, Batu Hijau sold 470 million copper pounds into copper collar contracts at an average price of $1.35 per pound and sold 103 million unhedged copper pounds at and average realized price of $1.90 per pound.
The change in consolidated copper sales is due to:
2005 vs. 2004 | 2004 vs. 2003 | ||||||
Changes in consolidated pounds sold | $ | (146 | ) | $ | — | ||
Consolidation of Batu Hijau | — | 786 | |||||
Change in average realized copper price | 72 | — | |||||
Change in treatment and refining charges | (40 | ) | — | ||||
| $ | (114 | ) | $ | 786 | |||
The following is a summary of net gold and copper sales by operation:
| Years Ended December 31, | ||||||||||
| 2005 | 2004 | 2003 | ||||||||
Gold | ||||||||||
Nevada, USA | $ | 1,053 | $ | 1,037 | $ | 901 | ||||
Yanacocha, Peru | 1,490 | 1,250 | 1,037 | |||||||
Australia/New Zealand: | ||||||||||
Tanami, Australia | 221 | 273 | 220 | |||||||
Kalgoorlie, Australia | 183 | 192 | 147 | |||||||
Jundee, Australia | 154 | 156 | 204 | |||||||
Pajingo, Australia | 87 | 104 | 120 | |||||||
Martha, New Zealand | 73 | 54 | 41 | |||||||
| 718 | 779 | 732 | ||||||||
Batu Hijau, Indonesia | 318 | 288 | — | |||||||
Other Operations: | ||||||||||
Golden Giant, Canada | 73 | 66 | 84 | |||||||
Zarafshan, Uzbekistan | 55 | 85 | 79 | |||||||
Kori Kollo, Bolivia | 44 | 10 | 64 | |||||||
La Herradura, Mexico | 36 | 27 | 25 | |||||||
Ovacik, Turkey | — | 44 | 61 | |||||||
Minahasa, Indonesia | — | 32 | 35 | |||||||
Mesquite, USA | — | — | 17 | |||||||
| 208 | 264 | 365 | ||||||||
Corporate | (53 | ) | 7 | 24 | ||||||
| $ | 3,734 | $ | 3,625 | $ | 3,059 | |||||
Copper | ||||||||||
Batu Hijau, Indonesia | $ | 672 | $ | 786 | $ | — | ||||
TotalCosts applicable to salessales—goldwere $2.3 billion, $1.7 billionincreased 6% in 2005 compared to 2004 due to increased operating costs in Nevada and $1.6 billion for the years ended December 31,at Yanacocha. The 17% increase in 2004 2003 and 2002, respectively, as detailed in the table below. The increase from 2003 to 2004 resulted primarily from the consolidation of Batu Hijau and increased costs in Nevada and Australia/New Zealand.Costs applicable to sales—goldcopper, which includes total cash costs, accretion of reclamationwere $303 and remediation liabilities related to consolidated gold production$305 in 2005 and write-downs of stockpiles, ore on leach pads and inventories increased to $1.9 billion in 2004, from $1.7 billion in 2003 and $1.6 billion in 2002.Costs applicable to sales—base metalswere $367.4 million, $44.3 million and $36.0 millionrespectively. Newmont has seen significant increases in the years ended December 31, 2004, 2003costs of fuel, power and 2002, respectively. The increase from 2003 to 2004 resulted primarily from the consolidation of Batu Hijau.other consumables during these periods. For a complete discussion regarding variations in operations, see Results of Operations below.
The following is a summary ofCosts applicable to sales by operation:
| Years Ended December 31, | ||||||||||
| 2004 | 2003 | 2002 | ||||||||
| (in millions) | ||||||||||
North America: | ||||||||||
Nevada, USA | $ | 716.3 | $ | 597.8 | $ | 657.1 | ||||
Golden Giant, Canada | 47.6 | 53.4 | 57.1 | |||||||
Holloway, Canada | 24.7 | 20.8 | 20.4 | |||||||
Mesquite, California | — | 9.3 | 10.1 | |||||||
La Herradura, Mexico | 10.1 | 11.1 | 11.5 | |||||||
| 798.7 | 692.4 | 756.2 | ||||||||
South America: | ||||||||||
Yanacocha, Peru | 432.6 | 362.5 | 302.0 | |||||||
Kori Kollo, Bolivia | 9.8 | 35.6 | 46.6 | |||||||
| 442.4 | 398.1 | 348.6 | ||||||||
Australia/New Zealand: | ||||||||||
Pajingo, Australia | 59.4 | 42.9 | 30.5 | |||||||
Yandal, Australia | 105.9 | 158.7 | 136.4 | |||||||
Tanami, Australia | 194.2 | 148.9 | 111.5 | |||||||
Kalgoorlie, Australia | 140.9 | 108.4 | 85.0 | |||||||
Martha, New Zealand | 28.1 | 24.9 | 19.6 | |||||||
Golden Grove, Australia | 61.8 | 43.5 | 27.7 | |||||||
| 590.3 | 527.3 | 410.7 | ||||||||
Indonesia: | ||||||||||
Batu Hijau | 395.9 | — | — | |||||||
Minahasa | 19.8 | 26.3 | 41.2 | |||||||
| 415.7 | 26.3 | 41.2 | ||||||||
Central Asia: | ||||||||||
Zarafshan, Uzbekistan | 32.4 | 32.9 | 34.0 | |||||||
Ovacik, Turkey | 22.9 | 22.3 | 17.5 | |||||||
| 55.3 | 55.2 | 51.5 | ||||||||
Africa | — | — | 7.8 | |||||||
Other: | ||||||||||
Merchant Banking | 0.8 | 0.8 | 0.5 | |||||||
Corporate and Other | — | 0.2 | (0.1 | ) | ||||||
| 0.8 | 1.0 | 0.4 | ||||||||
| $ | 2,303.2 | $ | 1,700.3 | $ | 1,616.4 | |||||
Gold Nevada, USA Yanacocha, Peru Australia/New Zealand: Tanami, Australia Kalgoorlie, Australia Jundee, Australia Pajingo, Australia Martha, New Zealand Batu Hijau, Indonesia Other Operations: Golden Giant, Canada Zarafshan, Uzbekistan Kori Kollo, Bolivia La Herradura, Mexico Ovacik, Turkey Minahasa, Indonesia Mesquite, USA Copper Batu Hijau, Indonesia Years Ended December 31, 2005 2004 2003 $ 807 $ 716 $ 598 487 432 362 162 194 149 144 141 108 115 106 159 58 59 43 29 28 25 508 528 484 109 91 — 48 48 53 27 32 33 16 10 36 15 10 11 — 23 22 — 20 26 — — 9 106 143 190 $ 2,017 $ 1,910 $ 1,634 $ 303 $ 305 $ —
Deferred stripping. In general, mining costs are allocated to production costs, stockpiles, ore on leach pads and inventories, and are charged toCosts applicable to sales when gold or copper is sold. However, at certain open pit mines that have diverse grades and waste-to-ore ratios over the mine life, the Company defers and amortizes certain mining costs on a units-of-production basis over the life of the mine. These mining costs, which are commonly referred to as “deferred stripping” costs, are incurred in mining activities that are normally associated with the removal of waste rock. The deferred stripping accounting method is generally accepted in the mining industry where mining operations have diverse grade and waste-to-ore rations; however, industry practice does vary. Deferred stripping matches the costs of production with the sale of such production at the Company’s operations where it is employed, by assigning each ounce of gold with an equivalent amount of waste removal cost. If the Company were to expense stripping costs as incurred, there might be greater volatility in the Company’s period-to-period results of operations. Details of deferred stripping with respect to certain of the Company’s open pit mines are as follows:
| Nevada(4) | La Herradura(5) | |||||||||||
| 2004 | 2003 | 2002 | 2004 | 2003 | 2002 | |||||||
Life-of-mine Assumptions Used as Basis For Deferred Stripping Calculations | ||||||||||||
– Stripping ratio(1) | 126.5 | 125.0 | 125.1 | 149.1 | 146.4 | 141.3 | ||||||
– Average ore grade(2) | 0.051 | 0.049 | 0.073 | 0.034 | 0.030 | 0.031 | ||||||
Actuals for Year | ||||||||||||
– Stripping ratio(1) | 154.3 | 124.9 | 72.2 | 156.1 | 157.4 | 158.5 | ||||||
– Average ore grade(2) | 0.059 | 0.075 | 0.081 | 0.026 | 0.026 | 0.026 | ||||||
Remaining Mine Life (years)(3) | 10 | 9 | 10 | 4 | 5 | 6 | ||||||
| Tanami(6) | Kalgoorlie(7) | |||||||||||
| 2004 | 2003 | 2002 | 2004 | 2003 | 2002 | |||||||
Life-of-mine Assumptions Used as Basis For Deferred Stripping Calculations | ||||||||||||
– Stripping ratio(1) | 82.3 | 48.8 | 68.2 | 110.9 | 114.8 | 111.5 | ||||||
– Average ore grade(2) | 0.160 | 0.160 | 0.113 | 0.061 | 0.065 | 0.065 | ||||||
Actuals for Year | ||||||||||||
– Stripping ratio(1) | 52.3 | 63.5 | 86.4 | 102.9 | 112.2 | 131.0 | ||||||
– Average ore grade(2) | 0.130 | 0.108 | 0.107 | 0.063 | 0.063 | 0.054 | ||||||
Remaining Mine Life (years)(3) | 1 | 1 | 2 | 13 | 13 | 14 | ||||||
| Martha(8) | Ovacik(9) | |||||||||||
| 2004 | 2003 | 2002 | 2004 | 2003 | 2002 | |||||||
Life-of-mine Assumptions Used as Basis For Deferred Stripping Calculations | ||||||||||||
– Stripping ratio(1) | 26.1 | 32.1 | 31.7 | 41.6 | 34.9 | 28.9 | ||||||
– Average ore grade(2) | 0.107 | 0.103 | 0.093 | 0.385 | 0.356 | 0.362 | ||||||
Actuals for Year | ||||||||||||
– Stripping ratio(1) | 31.7 | 29.5 | 36.6 | 57.0 | 40.4 | 32.1 | ||||||
– Average ore grade(2) | 0.091 | 0.089 | 0.100 | 0.298 | 0.374 | 0.358 | ||||||
Remaining Mine Life (years)(3) | 3 | 3 | 4 | 2 | 2 | 3 | ||||||
| Nevada(4) | La Herradura(5) | |||||||||||
| 2005 | 2004 | 2003 | 2005 | 2004 | 2003 | |||||||
Life-of-mine Assumptions Used as Basis For Deferred Stripping Calculations | ||||||||||||
—Stripping ratio(1) | 126.6 | 126.5 | 125.0 | 146.9 | 149.1 | 146.4 | ||||||
—Average ore grade(2) | 0.046 | 0.051 | 0.049 | 0.034 | 0.034 | 0.030 | ||||||
Actuals for Year | ||||||||||||
—Stripping ratio(1) | 139.1 | 154.3 | 124.9 | 193.0 | 156.1 | 157.4 | ||||||
—Average ore grade(2) | 0.053 | 0.059 | 0.075 | 0.029 | 0.026 | 0.026 | ||||||
Remaining Mine Life (years)(3) | 16 | 10 | 9 | 4 | 4 | 5 | ||||||
Life-of-mine Assumptions Used as Basis For Deferred Stripping Calculations —Stripping ratio(1) —Average ore grade(2) Actuals for Year —Stripping ratio(1) —Average ore grade(2) Remaining Mine Life (years)(3) Life-of-mine Assumptions Used as Basis For Deferred Stripping Calculations —Stripping ratio(1) —Average ore grade(2) Actuals for Year —Stripping ratio(1) —Average ore grade(2) Remaining Mine Life (years)(3) Tanami(6) Kalgoorlie(7) 2005 2004 2003 2005 2004 2003 N/A 82.3 48.8 100.1 110.9 114.8 N/A 0.160 0.160 0.061 0.061 0.065 N/A 52.3 63.5 116.3 102.9 112.2 N/A 0.130 0.108 0.062 0.063 0.063 N/A 1 1 12 13 13 Martha(8) Ovacik(9) 2005 2004 2003 2005 2004 2003 18.8 26.1 32.1 N/A 41.6 34.9 0.114 0.107 0.103 N/A 0.385 0.356 12.9 31.7 29.5 N/A 57.0 40.4 0.143 0.091 0.089 N/A 0.298 0.374 1 3 3 N/A 2 2
| ||||||
| ||||||
| ||||||
| ||||||
| ||||||
| ||||||
| ||||||
Life-of-mine Assumptions Used as Basis For Deferred Stripping Calculations —Stripping ratio(1) —Average ore grade(2) Actuals for Year —Stripping ratio(1) —Average ore grade(2) Remaining Mine Life (years)(3) Batu Hijau(10) 2005 2004 2003 0.20 0.22 N/A 4.93 4.63 N/A 0.21 0.16 N/A 4.74 6.22 N/A 13 14 N/A
| (1) | Total tons to be mined in future divided by total ounces of gold or total pounds of copper equivalent to be recovered in future, based on proven and probable reserves. Pounds of copper equivalent equate to copper pounds plus gold ounces converted to copper pounds on an equivalent revenue basis. |
| (2) | Total tons mined divided by total ounces of gold recovered or total pounds of copper equivalent recovered. |
| (3) | Remaining mine life (years) is as of January 1st of the year being presented and is based on the then current life-of-mine plan. |
| (4) | The actual stripping ratio and average ore grade are higher than the life-of-mine. The stripping ratio will increase when operations commence at Phoenix. |
| (5) | The actual stripping ratio |
| mined. La Herradura is included in the Company’s Other North America reportable segment. |
| (6) |
| (7) | The actual stripping ratio |
| (8) | The actual |
| (9) |
| (10) | The actual stripping ratio in 2005 is significantly |
Depreciation, depletion and amortization (DD&A) was $696.5 million, $564.5 milliondecreased 3% in 2005 from 2004, primarily due to the disposition of the Ovacik mine in Turkey and $505.6 millionlower consolidated ounces sold. The 25% increase in 2004 from 2003 and 2002, respectively. The increase in 2004 primarily resulted from the consolidation of Batu Hijau and significant capital expenditures in recent years at Yanacocha. The increase in 2003 was attributable to a decrease in the estimated useful lives of certain assets (primarily in Nevada)Depreciation, depletion and an increase in the depreciable base. DD&Aamortization expense fluctuates as capital expenditures increase or decrease and as production levels increase or decrease. For a complete discussion, see Results of Operations, below. Newmont expects DD&ADepreciation, depletion and amortization to beincrease to approximately $700 million$740 to $730 million$780 in 2005.2006.
The following is a summary ofDepreciation, depletion and amortization by operation:
| Years Ended December 31, | |||||||||
| 2004 | 2003 | 2002 | |||||||
| (in millions) | |||||||||
North America: | |||||||||
Nevada, USA | $ | 126.8 | $ | 137.7 | $ | 118.2 | |||
Golden Giant, Canada | 11.4 | 22.0 | 20.5 | ||||||
Holloway, Canada | 7.0 | 5.3 | 6.7 | ||||||
Mesquite, California | — | 3.9 | 6.3 | ||||||
La Herradura, Mexico | 5.0 | 3.4 | 3.1 | ||||||
| 150.2 | 172.3 | 154.8 | |||||||
South America: | |||||||||
Yanacocha, Peru | 198.0 | 160.4 | 121.5 | ||||||
Kori Kollo, Bolivia | 2.3 | 6.8 | 13.8 | ||||||
| 200.3 | 167.2 | 135.3 | |||||||
Australia/New Zealand: | |||||||||
Pajingo, Australia | 31.4 | 29.2 | 20.6 | ||||||
Yandal, Australia | 26.8 | 35.8 | 43.5 | ||||||
Tanami, Australia | 37.9 | 36.0 | 33.7 | ||||||
Kalgoorlie, Australia | 16.2 | 9.8 | 9.0 | ||||||
Martha, New Zealand | 13.8 | 11.5 | 13.9 | ||||||
Golden Grove, Australia | 28.2 | 29.1 | 22.9 | ||||||
Other, Australia | 4.2 | 5.3 | 3.4 | ||||||
| 158.5 | 156.7 | 147.0 | |||||||
Indonesia: | |||||||||
Batu Hijau | 117.5 | — | — | ||||||
Minahasa | 2.4 | 7.6 | 9.5 | ||||||
Martabe | 0.2 | 0.8 | 0.7 | ||||||
| 120.1 | 8.4 | 10.2 | |||||||
Central Asia: | |||||||||
Zarafshan, Uzbekistan | 10.3 | 10.1 | 10.3 | ||||||
Ovacik, Turkey | 18.6 | 13.9 | 11.5 | ||||||
Other | 0.1 | 0.1 | 0.1 | ||||||
| 29.0 | 24.1 | 21.9 | |||||||
Africa | 0.8 | 1.7 | — | ||||||
Other: | |||||||||
Merchant Banking | 24.3 | 26.5 | 22.6 | ||||||
Corporate and Other | 13.3 | 7.6 | 13.8 | ||||||
| 37.6 | 34.1 | 36.4 | |||||||
| $ | 696.5 | $ | 564.5 | $ | 505.6 | ||||
| Years Ended December 31, | |||||||||
| 2005 | 2004 | 2003 | |||||||
Nevada, USA | $ | 124 | $ | 127 | $ | 138 | |||
Yanacocha, Peru | 205 | 198 | 160 | ||||||
Australia/New Zealand: | |||||||||
Tanami, Australia | 33 | 38 | 36 | ||||||
Kalgoorlie, Australia | 17 | 16 | 10 | ||||||
Jundee, Australia | 27 | 27 | 36 | ||||||
Pajingo, Australia | 25 | 31 | 29 | ||||||
Martha, New Zealand | 16 | 14 | 11 | ||||||
Gold | 118 | 126 | 122 | ||||||
Other | 3 | 4 | 5 | ||||||
| 121 | 130 | 127 | |||||||
Batu Hijau, Indonesia | |||||||||
Gold | 34 | 28 | — | ||||||
Copper | 87 | 90 | — | ||||||
| 121 | 118 | — | |||||||
Other Operations: | |||||||||
Golden Giant, Canada | 11 | 11 | 22 | ||||||
Zarafshan, Uzbekistan | 9 | 10 | 10 | ||||||
Kori Kollo, Bolivia | 4 | 2 | 7 | ||||||
La Herradura, Mexico | 5 | 5 | 3 | ||||||
Ovacik, Turkey | — | 16 | 14 | ||||||
Minahasa, Indonesia | — | 3 | 8 | ||||||
Mesquite, USA | — | — | 4 | ||||||
Gold | 29 | 47 | 68 | ||||||
Other | 3 | 4 | 3 | ||||||
| 32 | 51 | 71 | |||||||
Other: | |||||||||
Merchant Banking | 21 | 24 | 26 | ||||||
Corporate and Other | 20 | 14 | 8 | ||||||
| 41 | 38 | 34 | |||||||
| $ | 644 | $ | 662 | $ | 530 | ||||
Exploration researchwas $147, $107 and developmentwas $192.4 million, $115.2 million$76 for 2005, 2004 and $88.9 million during 2004, 2003, and 2002, respectively. The period-to-period increases reflect increased exploration and related activity in response to higher prevailing gold prices.Advanced projects, research and copper pricesdevelopment were $73, $80 and increased$35 during 2005, 2004 and 2003, respectively, representing spending on advanced projects, feasibility studies and exploration drilling at Martabe, Akyem, Minas CongaAhafo and Ahafo.Conga. Newmont expectsExploration to be approximately $155 to $160 andAdvanced projects, research and developmentexpenses to be approximately $170 million$40 to $200 million$45 in 2005.2006.
General and administrativewas $115.8 million, $130.3 million$134, $116 and $115.3 million$130 for the years ended December 31,2005, 2004 and 2003, respectively. The increase in 2005 from 2004 was attributable to increased salaries, benefits, consulting and 2002, respectively.contracted services. The decrease in 2004 from 2003 resulted from an increase in the allocation of costs incurred by corporate to the individual operations in 2004, partially offset by an increase in consulting fees and costs associated with the Sarbanes-Oxley Act of 2002. The increase in 2003 from 2002 was attributable to increased pension and other employee benefit-related expenses and increased compliance and corporate governance costs.General and administrativeexpense as a percentage of revenues was 2.5%3.0% in 2005, compared to 2.6% in 2004 compared to 4.1%and 4.2% in 2003 and 4.3% in 2002.2003. Newmont expectsGeneral and administrativeexpenses to be approximately $115 million$150 to $125 million$160 in 2005.2006, including $9 in stock option expense under FAS 123R, effective January 1, 2006.
Write-down of goodwill of $51.8 millionwas $41 and $52 for 2005 and 2004, respectively. The 2005 expense was related to the year ended December 31,Nevada segment resulting from anticipated increased future operating and capital costs. The 2004 expense was related to the Pajingo operationreporting unit in Australia as a result ofresulting from anticipated increased future operating costs and lower grade ore.
Write-down of long-lived assets totaled $39.3 million, $35.3 million$43, $39 and $3.7 million$35 for the years ended December 31,2005, 2004 and 2003, respectively. The 2005 write-down primarily related to an advanced exploration project in Indonesia and 2002, respectively.exploration tenements in Australia. The 2004 write-down included $16.3 million$16 related to the Ovacik mine in Turkey. In August 2004, the Ovacik mine temporarily suspended operations as a result of a court decision ordering the suspension of operating permits pending completion of certain additional permitting requirements and the submission of an updated environmental impact assessment. On March 1, 2005, the Ovacik mine was sold to a subsidiary of Koza Davetiye, a Turkish conglomerate. The remainder of the write-down for 2004 was primarily related to exploration tenements in Australia, long-lived asset impairment resulting from a reevaluation of future production and operating costs at Pajingo, and processing facilities at Yanacocha. The 2003 write-down primarily related toincluded a $28.4 million$28 impairment charge at Golden Giant and the mobile fleet at Yanacocha. The impairment charge at Golden Giant resulted from a reevaluation of the life-of-mine plan that eliminated marginal stopes and reflected higher projected life-of-mine operating costs due to a stronger Canadian dollar and higher power and labor costs, which led to reduced proven and probable reserves and increased life-of-mine operating costs. The 2002 write-down related to an impairment charge for exploration stage mineral interests and fixed assets at Kori Kollo.Giant.
For a discussion of the Company’s policy for assessing the carrying value of its goodwill and long-lived assets for impairment, see Critical Accounting Policies, above.
Other expenseexpenses in 2005, 2004 and 2003 was $111, $33 and 2002 were $34.4 million, $49.5 million$50, respectively.
| Years Ended December 31, | ||||||||||
| 2005 | 2004 | 2003 | ||||||||
Reclamation and remediation | $ | 37 | $ | (11 | ) | $ | 33 | |||
Minahasa environmental and “goodwill agreement” (Note 32) | 56 | 7 | — | |||||||
Nevada waste dump slide | 6 | — | — | |||||||
Other | 12 | 37 | 17 | |||||||
| $ | 111 | $ | 33 | $ | 50 | |||||
The 2005 expense included legal and $29.4 million, respectively.other costs incurred in regards to pollution allegations at Minahasa in Indonesia, changes in environmental obligation estimates at other non-operating properties, costs incurred to stabilize material and repair damage to roads and utility lines for a waste dump slide in Nevada and a pension settlement loss. The 2004 expense related to the closure of Minahasa, care and maintenance charges at Ovacik, engineering and permitting expenses for the power plant in Nevada and other miscellaneous expenses. The 2003 expense included additions to reclamation and remediation liabilities related to depleted ore bodies, an accrual for certain environmental obligations, costs associated with the finalization of a de-watering agreement in Nevada, severance costs at the Kori Kollo project in Bolivia, and costs related to compliance and governance implementation activities. The 2002 expenses primarily included integration costs relating to the acquisitions of Normandy
Other income, net in 2005, 2004 and Franco-Nevada2003 was $269, $102 and costs associated with employee severance benefits.$451, respectively, and is summarized as follows:
| Years Ended December 31, | |||||||||||
| 2005 | 2004 | 2003 | |||||||||
Royalty and dividend income, net | $ | 79 | $ | 64 | $ | 56 | |||||
Interest income | 59 | 23 | 11 | ||||||||
Gain on sale of other assets, net | 48 | 28 | 15 | ||||||||
Gain (loss) on investments, net | 54 | (39 | ) | 83 | |||||||
Gain on derivative investments, net | 2 | 2 | 23 | ||||||||
Foreign currency exchange gains | 8 | 7 | 97 | ||||||||
Gain (loss) on QMC debt guarantee | 9 | 11 | (30 | ) | |||||||
Gain on extinguishment of NYOL liabilities, net | — | — | 221 | ||||||||
Loss on extinguishment of debt | — | — | (34 | ) | |||||||
Other | 10 | 6 | 9 | ||||||||
| $ | 269 | $ | 102 | $ | 451 | ||||||
LossRoyalty and dividend income increased each year due to higher gold, oil and gas prices and as a result of distributions received from Canadian Oil Sands Trust, which was acquired during the second and third quarters of 2004.
Interest income increased each year due to increased funds invested and higher investment yields.
The gain on investments, netwas $39.0 million in 2004 andsale of other assets during 2005 was primarily attributable to the sale of the Mezcala gold deposit for a gain of $31. The 2004 gain on sale of other assets primarily resulted from the sale of Perama, Midwest Uranium and Bronzewing. The 2003 gain resulted from the sale of Mesquite and Wiluna.
The gain on investments during 2005 was primarily attributable to the sale of investments in Kinross and Oxiana which resulted in gains of $20 and $25, respectively. The loss on investments during 2004 was attributable to a $39 impairment of our investment in Kinross for an other-than-temporarybased on the continued decline in market value in accordance with SFAS No. 115, “Accounting for Certain Investments in Debt and Equity Securities.”Gain on investments, netwas $83.2 million and $47.1 million for years ended December 31, 2003 and 2002, respectively.of Kinross equity securities. The 2003 gain was primarily related to the exchange of Echo Bay sharesequity securities for Kinross shares. equity securities.
The 2002 gain was primarily related to Newmont’s sale of its investment in Lihir Gold Limited.
Gain (loss) on derivative instruments, net, representing non-cash, mark-to-market gains and losses recognized on ineffective and partially ineffective derivative instruments was $2.4 million, $22.9 million$2, $2 and $(39.8) million$23 for the years ended December 31,2005, 2004 and 2003, and 2002, respectively. 2004 involved a $0.7 million loss due to the ineffectiveness of gold put option cash flow hedges caused by rising gold prices and a $3.1 million gain due to undesignated interest rate swap contracts and the ineffectiveness of interest rate swap
fair value hedges on Newmont bonds. The 2003 gain primarily related to the acquired Normandy gold hedge books and resulted predominantly from a strengthening of the Australian dollar, partially offset by an increase in the U.S. dollar gold price. The loss in 2002 primarily related to the acquired Normandy gold hedge books and resulted from the increase in the U.S. dollar gold price, partially offset by the appreciation of the Australian dollar. The Company substantially eliminated the acquired Normandy hedge books as of December 31, 2003.
Gain on extinguishment of NYOL liabilities, netwas $220.5 million for the year ended December 31, 2003. In 2003, Newmont acquired all of NYOL’s outstanding 8 7/8% Senior Notes due 2008 and all of NYOL’s gold hedge contracts from the relevant counterparties.
Loss on extinguishment of debt was $0.2 million and $33.8 million for years ended December 31, 2004 and 2003, respectively. During 2003, Newmont repurchased $148.0 million of its 8 3/8% debentures, $52.3 million of its 8 5/8% debentures, $80.5 million of Newmont Australia 7 1/2% guaranteed notes, $30.9 million of Newmont Australia 7 5/8% guaranteed notes and 100% of its 6% convertible subordinated debentures for total cash consideration of $445.6 million. See Liquidity and Capital Resources, Financing Activities.
Royalty and dividend incometotaled $65.8 million, $56.3 million and $35.7 million for the years ended December 31, 2004, 2003 and 2002, respectively. The increase from period-to-period was primarily attributable to higher gold and oil and gas prices. 2004 income also increased as a result of distributions received from the Company’s approximate 6.6% interest in Canadian Oil Sands Trust, which was acquired during the second and third quarters of 2004.
Interest income, foreign currency exchange and other income was $76.9 million, $102.2 million and $39.9 million for the years ended December 31, 2004, 2003 and 2002, respectively.
| Years Ended December 31, | ||||||||||
| 2004 | 2003 | 2002 | ||||||||
| (in thousands) | ||||||||||
Interest income | $ | 23,366 | $ | 10,538 | $ | 14,139 | ||||
Foreign currency exchange gain, net | 9,213 | 96,971 | 14,020 | |||||||
Gain on sale of mining and exploration properties | 28,004 | 15,394 | 6,112 | |||||||
Gain (loss) on QMC debt guarantee | 10,616 | (30,000 | ) | — | ||||||
Other | 5,749 | 9,279 | 5,614 | |||||||
| $ | 76,948 | $ | 102,182 | $ | 39,885 | |||||
The increase in interest income in 2004 from 2003 resulted from higher cash balances held in short-term investments.
As of December 31, 2003, the Company converted CDN$499 million of intercompany loans with a subsidiary whose functional currency is the Canadian dollar, to long-term notes, as the Company does not intend to settle these loans in the foreseeable future. As a result, the Company no longer records foreign currency gains and losses in earnings with respect to the converted long-term notes. The year ended December 31, 2003 foreign currency exchange gain included: (i) exchange gains, net of $58.9 million$59 on the Canadian dollar-denominated intercompany loans reflecting a strengthening of the Canadian dollar during the period; (ii) a $27.4 million$27 mark-to-market gain on ineffective foreign currency swaps; (iii) a $19.2 million$19 foreign currency gain on the translation of Newmont Australia Limited’s financial statements to U.S. dollars; and (iv) other foreign currency losses of $8.5 million.$8.
The 2004 gain on sale of mining and exploration properties primarily resulted from the sale of Perama, Midwest Uranium and Bronzewing. The 2003 gain resulted from the sale of Mesquite and Wiluna.
Newmont was the guarantor of an A$71.0 million71 (approximately $53.2 million)$53) amortizing loan facility of QMC Finance Pty Ltd. (“QMC”) which was collateralized by the assets of the Queensland Magnesium Project. Newmont reduced the amount accrued for this contingent obligation by the estimated fair value of the AMCAustralian Magnesium
Corporation assets that would be subrogated to Newmont in the event the guarantee was called, which resulted in a $30.0 million$30 loss during the fourth quarter of 2003. During the fourth quarter of 2004, Newmont Australia Limited (“NAL”), a wholly-owned subsidiary of Newmont entered into a transaction resulting in a loan from NALNewmont to a subsidiary of QMC for A$30.0 million30 (approximately $23.2 million)$23), the release of Newmont from its guarantee obligation and recognition of a $10.6 millionan $11 gain resulting from the release of all previously accrued contingent liabilities. An allowance was provided for 100% of the loan receivable from the QMC entity. In 2005, a gain was recognized for A$12 (approximately $9), resulting from a reduction in the allowance provided on the loan receivable.
Gain on extinguishment of NYOL liabilities, net was $221 in 2003. In 2003, Newmont acquired all of Newmont Yandal Operations Pty Ltd’s (“NYOL”) outstanding 8 7/8% Senior Notes due 2008 and all of NYOL’s gold hedge contracts from the relevant counterparties.
Loss on extinguishment of debt was $34 in 2003. During 2003, Newmont repurchased $148 of its 8 3/8% debentures, $52 of its 8 5/8% debentures, $81 of Newmont Australia 7 1/2% guaranteed notes, $31 of Newmont Australia 7 5/8% guaranteed notes and 100% of its 6% convertible subordinated debentures for total cash consideration of $446. See Liquidity and Capital Resources, Financing Activities.
Interest expense, net of amounts capitalized interestwas $97.6 million, $88.6 million$98, $98 and $129.6 million in$89 for 2005, 2004 2003 and 2002,2003, respectively. Capitalized interest totaled $13.1 million, $8.9 million$39, $13 and $5.2 million$9 in each year, respectively. NetInterest costs increased in 2005 from 2004 due to the issuance of the $600 5 7/8% notes in March 2005. Capitalized interest increased in 2005 due to construction of Leeville and Phoenix in Nevada and Ahafo in Ghana. Interest increased during 2004 as compared to 2003 as a result of the consolidation of Batu Hijau. NetNewmont expectsInterest expense, net of capitalized interest expense declined during 2003 from 2002 primarily due to a decreasebe approximately $95 to $105 in outstanding debt resulting from Newmont’s debt-reduction strategy.2006.
Income tax expense was $275.9 million$314 in 2005, compared to $325 and $212 in 2004 compared to $206.9 million and $19.9 million in 2003, and 2002, respectively. The increase in income tax expense in 2004, compared to 2003, was primarily attributable to $173.6 million higherPre-tax income before minority interest, equity income and impairments of affiliates and cumulative effect of a change in accounting principle(“pre-tax income”). The Company’s effective tax rates were 25.1%29.5%, 22.4%29.2%, and 9.2%22.8% in 2005, 2004 and 2003, and 2002respectively, based on pre-tax income of $1.1 billion, $925.4 million,$1,064 in 2005, $1,111 in 2004 and $216.3 million, respectively.$931 in 2003. The factors that most significantly impact the Company’s effective tax rate are metal prices, percentage depletion and resource allowances, valuation allowances related to deferred tax assets, foreign earnings net of foreign tax credits, earnings attributable to minority interests in subsidiaries and affiliated companies, foreign currency translation gains and losses, changes in tax laws and the impact of certain specific transactions. Most of these factors are sensitive to the average realized price of gold and other metals.
Percentage depletion allowances (tax deductions for depletion that may exceed the Company’s tax basis in its mineral reserves) are available to the Company under the income tax laws of the United States for operations conducted in the United States or through branches and partnerships owned by U.S. subsidiaries included in the Company’s consolidated United States income tax return. The deductions are highly sensitive to the price of gold and other minerals produced by the Company. For 20042005 and prior years, similar types of deductions are available for mining operations in Canada and are referred to as resource allowances. The tax benefits from percentage depletion and resource allowances were $47.1 million, $21.5 million$47, $47 and $34.4 million$21 in 2005, 2004 2003 and 2002,2003, respectively. The increase in 2004 and 2005 compared to the other periods resulted2003 primarily from the inclusion of $13.8 million of additional tax savings from percentage depletion deductions realized when the Company filed its 2003 income tax return. Additional increases in percentage depletion allowances were also realizedis due to an increase in the Company’s average realized gold price.
On October 22, 2004, the President signed into law the American Jobs Creation Act of 2004 (“the Act”). The Act provides a deduction for income from qualified domestic production activities, which will be phased in from 2005 through 2010. In return, the Act also provides for a two-year phase-out of the existing extra-territorial income exclusion (ETI) for foreign sales. The Company expects the net effect of the phase out of the ETI and the phase in of this new deduction to result in a minimal change in the effective tax rate for the phase in years 2005 and 2006, based on current earnings levels. In the longer term, the Company expects that the tax benefit therefrom will result in a decrease of the annual effective tax rate of less than 1 percentage point based on current earnings levels.
Under the guidance in FASB Staff Position No. FAS 109-1,Application of FASB Statement No. 109, “Accounting for Income Taxes,” to the Tax Deduction on Qualified Production Activities Provided by the American Jobs Creation Act of 2004, the deduction will be treated as a “special deduction” as described in FASB Statement No. 109. As such, the special deduction has no effect on deferred tax assets and liabilities existing at
the enactment date. Rather the impact of this deduction will be reported in the period in which the deduction is claimed.
The Company operates in various countries around the world that have tax laws, tax incentives and tax rates that are significantly different than those of the United States. Many of these differences combine to move the Company’s overall effective tax rate higher or lower than the United States statutory rate.rate depending on the mix of income relative to income earned in the United States. The effect of these differences is shown in Note 2119 to the Consolidated Financial Statements as either a foreign rate differential or the effect of foreign earnings, net of credits. Differences in tax rates and other foreign income tax law variations make the Company’s ability to fully utilize all of its available foreign income tax credits on a year-by-year basis highly dependent on the price of the gold and copper produced by the Company and the costs of production, since lower prices or higher costs can result in the Company having insufficient sources of taxable income in the United States to utilize all available foreign tax credits. Such credits have limited carryback and carryforward periods and can only be used to reduce the United States income tax imposed on the Company’s foreign earnings included in its annual United States consolidated income tax return. The effects of foreign earnings, net of allowable credits, were an increase of
income tax expense of $11.0 million$10 and $11 in 2005 and 2004 respectively, and reductionsa reduction of income tax expense of $27.8 million and $16.7 million$28 in 2003 and 2002, respectively.2003. The Company separately stated, in its effective income tax rate reconciliation under “Change in valuation allowance on deferred tax assets” a benefit, income tax expense of $49.1 million$30 in 2005, resulting from the utilizationestablishment of a valuation allowance on foreign tax credit carryforwards for which a valuation allowance previously had been recorded.released in prior periods. This utilizationestablishment of valuation allowance primarily was caused by the realization of higher sources of taxable income, inand therefore higher taxes, outside the United States and lower taxable income inside the United States resulting from thean increase in the Company’s average realized gold price in 2004.operating costs. The effect of different income tax rates in countries where earnings are indefinitely reinvested contributed to an increase in the Company’s income tax expense of $16.3 million$8 and $5.0 million$61 in 20042005 and 20022004 respectively, and a decrease in income tax expense of $13.4 million$11 in 2003.
The tax effect of changes in local country tax laws, as set forth as a separate itemshown in the Company’s effective tax reconciliation in Note 2119 to the Consolidated Financial Statements, resulted in a net tax benefit of $51.4 million$24, $51 and $35.7 million$36 in 2005, 2004 and 2003, respectively. The net tax benefit is primarily related to a change in tax law in Australia that allows the Company to consolidate wholly-owned subsidiaries in that country.
The need to record valuation allowances related to the Company’s deferred tax assets (primarily attributable to net operating losses and tax credits) is principally dependent on the following factors: (i) the extent to which the net operating losses and tax credits can be carried back and yield a tax benefit; (ii) the Company’s long-term estimate of future average realized minerals prices; and (iii) the degree to which many of the tax laws and income tax agreements imposed upon the Company and its subsidiaries around the world tend to create significant tax deductions early in the mining process. These up-front deductions can give rise to net operating losses and credit carryforwards in circumstances where future sources of taxable income may not coincide with available carryforward periods even after taking into account all available tax planning strategies. Furthermore, certain liabilities, accrued for financial reporting purposes, may not be deductible for tax purposes until such liabilities are actually funded which could happen after mining operations have ceased, when sufficient sources of taxable income may not be available. Changes to valuation allowances increased income tax expense by $22 in 2005, and decreased income tax expense by $58.6 million$59 and $85.2 million$85 in 2004 and 2003, respectively, and increased income tax expense in 2002 by $2.5 million.respectively. As noted above, $49.1 million$30 of the valuation allowance recordedaddition in 2005 was a result of re-establishing a valuation allowance that was released in prior periods with respect to the Company’s foreign tax credits was included in the total change in the valuation allowance for 2004. Partially offsetting these reductions in valuation allowances was the need to record valuation allowances for currently arising tax losses incurred by some of the Company’s foreign subsidiaries.
credits.
The Company, for financial reporting purposes, consolidates subsidiaries of which it does not own 100% of the outstanding equity. However, for tax purposes, the Company only is responsible for the income taxes on the portion of the taxable earnings attributable to its ownership interest of each consolidated entity. Such minority interests contributed $7.3 million, $22.2 million$15, $7 and $11.5 million$22 in 2005, 2004 2003 and 2002,2003, respectively, as reductions in the Company’s income tax expense.
The Company’s effective tax in 2004 decreased by $12.7 million$14 and $13 in 2005 and 2004 respectively due to changes in foreign currency exchange rates compared with an increase of $54.4 million$54 in 2003. In 20042005 and 2003,2004, these amounts primarily relate to the Australian tax effect of realized and unrealized translation gains attributable to United States dollar-denominated assets and liabilities and the gold derivatives positions at Newmont Australia Limited whose
functional currency is the United States dollar. Because Newmont intends to indefinitely reinvest earnings from Newmont Australia Limited, no offsetting United States deferred income tax effect can be provided.recorded. The effect in 2005 and 2004 differed from 2003 because of the significant strengthening of the Australian dollar against the United States dollar that took place primarily in 2003.
2003 versus relative weakness of the Australian dollar in 2004 and 2005.
Based on the uncertainty and inherent unpredictability of the factors influencing the Company’s effective tax rate and the sensitivity of such factors to gold and other metals prices as discussed above, Newmont’sthe effective tax rate is expected to be volatile in future periods.
The effective tax rate is expected to be between 30% and 34% in 2006.
Minority interest in income of subsidiarieswas $335.3 million, $173.2 million$380, $335 and $97.4 million$173 for the years ended December 31,2005, 2004 and 2003, respectively. The 2005 increase from 2004 resulted from increased earnings at Yanacocha due to increased gold price and 2002, respectively.
ounces sold, partially offset by an increase in costs (see Results of Operations, South American Operations). The 2004 increase from 2003 resulted from the recording of the minority interest in Batu Hijau which was consolidated in 2004 (see Accounting Changes, above), and increased earnings at Yanacocha due to increased gold price and ounces sold, partially offset by an increase in costs. The 2003 increase from 2002 was primarily a result of increased earnings at Yanacocha, due to higher gold prices, increased gold sales and lower production costs (see Results of Operations, South American Operations).
Equity loss and impairment of Australian Magnesium Corporation(“AMC”) was $119.5 million and $1.8 million for the years ended December 31, 2003 and 2002, respectively. During the year ended December 31, 2003, the Company recorded losses of $119.5 million related to its investment in AMC composed of the following: (i) losses of $0.7 million representing Newmont’s proportionate share of AMC’s 2003 losses; (ii) second quarter 2003 losses resulting from a restructuring agreement of (a) $72.7 million representing the book value of its investment at June 30, 2003; (b) $24.8 million related to a loan receivable from AMC; (c) $10.0 million charge to settle Newmont’s guarantee of the obligation payable by AMC to Ford Motor Credit; (d) $6.6 million related to a contingent credit facility; and (e) $1.1 million related to various other items, offset by a $7.4 million income tax benefit; and (iii) a first quarter 2003 loss for an other-than-temporary decline in value of the investment of approximately $11.0 million. During December 2003, Newmont sold its interest in AMC.
Yanacocha.
Equity income (loss) of affiliates was $2.6 million, $84.4 million and $53.2 million for the years ended December 31, 2004, 2003 and 2002, respectively. The following table indicates equity income (loss) by affiliate:as follows:
| Years Ended December 31, | ||||||||||
| 2004 | 2003 | 2002 | ||||||||
| (in thousands) | ||||||||||
Batu Hijau | $ | — | $ | 82,892 | $ | 42,119 | ||||
TVX Newmont Americas | — | 810 | 9,737 | |||||||
Echo Bay | — | — | (380 | ) | ||||||
European Gold Refineries | 1,224 | — | — | |||||||
AGR Matthey Joint Venture | 1,417 | 725 | 1,675 | |||||||
| $ | 2,641 | $ | 84,427 | $ | 53,151 | |||||
| Years Ended December 31, | |||||||||||
| 2005 | 2004 | 2003 | |||||||||
European Gold Refineries | $ | 6 | $ | 1 | $ | — | |||||
AGR Matthey Joint Venture | (2 | ) | 1 | 1 | |||||||
Batu Hijau(1) | — | — | 83 | ||||||||
Australian Magnesium Corporation(2) | — | — | (119 | ) | |||||||
| $ | 4 | $ | 2 | $ | (35 | ) | |||||
| (1) | Batu Hijau was consolidated effective January 1, 2004. See Accounting Changes, above, for more information. |
| (2) | In December 2003, the Company sold its interest in Australian Magnesium Corporation. |
The decreaseLoss from discontinued operations in 2004 from 2003 primarily2005 resulted from the consolidationclassification of Batu Hijau effective January 1, 2004. See Accounting Changes, above,the Golden Grove copper-zinc operation in Australia and the Holloway gold operation in Canada as discontinued operations. The Company recorded $42 in pre-tax write-downs of long-lived assets and reclassified the income statement results from the historical presentation to discontinued operations in the Consolidated Statements of Income for more information.all periods presented. The 2003 increasegain of $37 in 2004 was primarily due to a tax credit from 2002 relatedan election to Batu Hijau resulted primarily from higher copper prices, increased gold by-product credits and lower smelting and refining costs.
prepare a consolidated tax return in Australia (see Note 25 to the Consolidated Financial Statements).
Newmont recorded charges (benefit) for theCumulative effect of a change in accounting principle, net of taxof $47.1 million, $34.5 millionwas $47 and $(7.7) million$35 for the years ended December 31, 2004 2003 and 2002.2003. The 2004 charge resulted from the consolidation of Batu Hijau to conform Batu Hijau’s accounting policies to Newmont’s accounting policies. The 2003 charge reflects the effect of the adoption of SFAS No. 143, “Accounting for Asset Retirement Obligations,” that changed the method of accounting for the Company’s estimated mine reclamation and abandonment costs. The 2002 benefit related to a change in depreciation,
depletion and amortization ofProperty, plant and mine development, netto exclude future estimated development costs expected to be incurred for certain underground operations. See Accounting Changes, above, for more information.
Other comprehensive income, (loss), net of taxin 2004 primarily2005 included a $123.1 million$282 gain in value of marketable equity securities and a $30.7 million$57 gain on the translation of subsidiaries with non-U.S. dollar functional currencies, offset by losses of $11.1 million$59 related to a minimum pension liability adjustment and $18.9 million$26 for unrealized losses on derivatives designated as cash flow hedges.Other comprehensive income, (loss), net of tax,in 2004 included a $123 gain in value of marketable equity securities and a $31 gain on the translation of subsidiaries with non-U.S. dollar functional currencies, offset by losses of $11 related to a minimum pension liability adjustment and $19 for unrealized losses on derivatives designated as cash flow hedges.Other comprehensive income, net of tax in 2003, primarily included a $68.4 million$68 gain on the effective portion of changes in the fair value of derivative instruments classified as cash flow hedges and a $23.2 million$23 gain on the translation of subsidiaries with non-U.S. dollar functional currencies, partially offset by a loss of $5.0 million related to a decline in value of marketable equity securities.Other comprehensive income (loss), net of tax, in 2002, primarily included losses of $28.7 million related to a minimum pension liability adjustment, $16.7 million for unrealized losses on derivatives designated as cash flow hedges and $12.8 million$5 related to a decline in value of marketable equity securities.
Results of Consolidated Operations
| Equity Ozs. Sold | Total Cash Cost | ||||||||||||||||
| 2004 | 2003 | 2002 | 2004 | 2003 | 2002 | ||||||||||||
| (in thousands) | ($ per equity oz.) | ||||||||||||||||
North America | 2,712.2 | 2,902.6 | 3,224.0 | $ | 278 | $ | 233 | $ | 220 | ||||||||
South America | 1,582.7 | 1,626.4 | 1,426.3 | 137 | 126 | 131 | |||||||||||
Australia/New Zealand | 1,906.9 | 2,011.5 | 1,806.0 | 272 | 234 | 189 | |||||||||||
Indonesia | 466.5 | 421.1 | 425.2 | 148 | 249 | (1) | 218 | (1) | |||||||||
Central Asia | 320.1 | 386.3 | 381.5 | 166 | 139 | 130 | |||||||||||
Other | N/A | 35.7 | 368.7 | N/A | N/A | N/A | |||||||||||
Total/Weighted-Average | 6,988.4 | 7,383.6 | 7,631.7 | $ | 231 | $ | 203 | (1) | $ | 189 | (1) | ||||||
| Gold Ounces or Copper Pounds Sold | Costs Applicable to Sales(1) | Depreciation, Depletion and Amortization | ||||||||||||||||||||||
| 2005 | 2004 | 2003 | 2005 | 2004 | 2003 | 2005 | 2004 | 2003 | ||||||||||||||||
| (ounces in thousands) | ($ per ounce) | ($ per ounce) | ||||||||||||||||||||||
Gold | ||||||||||||||||||||||||
Nevada | 2,444.1 | 2,538.0 | 2,490.8 | $ | 333 | $ | 282 | $ | 240 | $ | 51 | $ | 50 | $ | 55 | |||||||||
Yanacocha(2) (51.35% owned) | 3,327.5 | 3,039.9 | 2,858.7 | 147 | 142 | 127 | 62 | 65 | 56 | |||||||||||||||
Australia/New Zealand | 1,600.5 | 1,887.6 | 2,016.7 | 317 | 280 | 239 | 74 | 67 | 61 | |||||||||||||||
Batu Hijau(2)(3)(4) | 720.5 | 715.2 | — | 152 | 128 | — | 47 | 39 | — | |||||||||||||||
Other(2) | 459.4 | 648.2 | 1,011.2 | 229 | 220 | 189 | 63 | 73 | 67 | |||||||||||||||
Total/Weighted-Average | 8,552.0 | 8,828.9 | 8,377.4 | $ | 236 | $ | 216 | $ | 195 | $ | 60 | $ | 60 | $ | 58 | |||||||||
| (pounds in millions) | ($ per pound) | ($ per pound) | ||||||||||||||||||||||
Copper | ||||||||||||||||||||||||
Batu Hijau(2)(3)(4) | 572.7 | 683.3 | N/A | $ | 0.53 | $ | 0.45 | $ | N/A | $ | 0.15 | $ | 0.13 | $ | N/A | |||||||||
| (1) | Excludes depreciation, depletion and amortization. |
| (2) |
| (3) | Economic interest decreased to 52.875% from 56.25% on October 1, 2004. |
| (4) | Batu Hijau |
Consolidated gold ounces sold decreased 3% in 2005 from 2004 primarily due to:
Disclosure
Consolidated gold ounces sold increased 5% in 2004 from 2003 primarily due to:
Consolidated copper pounds sold decreased 16% in 2005 from 2004 due to provide investors with information about the cash generating capacitiesprocessing of Newmont’s mining operations. Newmont’s management uses this measure forlower grade copper ore at Batu Hijau. Access to ore in the same purpose and for monitoringlower portion of the performance of its gold mining operations. This information differs from measures of performance determined in accordance with generally accepted accounting principles (“GAAP”) and should not be considered in isolation orpit was temporarily restricted as a substitute for measuresresult of performance determined in accordance with GAAP. This measure was developed in conjunction with gold mining companies associated withseveral small pit wall slides during the Gold Institute, a non-profit industry group no longer in existence, in an effort to provide a levelfirst quarter of comparability; however, Newmont’s measures may not be comparable to similarly titled measures of other companies.
2005.
For all periods presented, total cash costs include charges for mining ore and waste associated with current period gold and copper production, processing ore through milling and leaching facilities, by-product credits, production taxes, royalties and other cash costs. Certain gold mines produce silver as a by-product. Proceeds from the sale of by-products are reflected as credits to total cash costs. With the exception of Yanacocha and Golden Grove, such by-product sales have not been significant to the economics or profitability of the Company’s mining operations. All of these charges and by-product credits are included inCosts applicable to sales.Charges for reclamation are also included inCosts applicable to salesbut are not included in total cash costs. Reclamation charges are included in total production costs, together with total cash costs andDepreciation, depletion and amortization.Total production costs provide an indication of earnings before interest expense and taxes for Newmont’s share of per consolidated gold mining properties, when taking into account the average realized price
received for goldounce sold as this measure combinesCosts applicable to salesplusDepreciation, depletion and amortization,net of minority interest. A reconciliation of total cash costs and total production costs toCosts applicable to salesin total and by segment is provided in Item 2, Properties, Operating Statistics.
The Company expects that gold production will range between 6.6 million and 6.8 million equity ouncesincreased 10% in 2005 from 2004 and will range between 6.5 million and 7.0 million equity ounces per year through 2007.
North American Operations
| Equity Ozs. Sold | Total Cash Cost | ||||||||||||||
| 2004 | 2003 | 2002 | 2004 | 2003 | 2002 | ||||||||||
| (in thousands) | ($ per equity oz.) | ||||||||||||||
Nevada | 2,416.0 | 2,490.8 | 2,723.5 | $ | 278 | $ | 235 | $ | 225 | ||||||
Golden Giant | 160.0 | 229.7 | 281.5 | 297 | 227 | 196 | |||||||||
Holloway (84.65% owned) | 67.4 | 65.1 | 97.7 | 367 | 312 | 204 | |||||||||
La Herradura (44% owned) | 68.8 | 67.8 | 64.2 | 146 | 162 | 176 | |||||||||
Mesquite(1) | N/A | 49.2 | 57.1 | N/A | 184 | 177 | |||||||||
Total/Weighted-Average | 2,712.2 | 2,902.6 | 3,224.0 | $ | 278 | $ | 233 | $ | 220 | ||||||
North America sold 7% fewer equity ounces of gold11% in 2004 when compared tofrom 2003, and 10% fewer equity ounces in 2003 compared to 2002, primarily because of lower sales from Nevada and Golden Giant and the sale of Mesquite in November 2003. Total cash costs per equity ounce increased 19% due to the decrease in production caused by lower gradesand increased operating costs in Nevada. In 2003, total cash costsNevada and Australia/New Zealand.Costs applicable to sales per equity ounceconsolidated copper pound increased 6%18% in 2005 from 20022004, primarily due to lowerthe decrease in copper production.
The Company expects consolidated gold sales of approximately 8.0 million ounces in 2006 atCosts applicable to sales of between $280 to $285 per ounce.
Nevada Operations. Gold equity
Nevada gold ounces sold decreased 4% in 2005 from 2004, as a 12% decrease in mill ore grade and sales from inventories in 2004 decreased 3%were partially offset by an 18% increase in mill throughput and a 12% increase in heap leach ore placed. Adverse mill grades were caused by unfavorable ground conditions at underground operations and a labor shortage impacting underground development. Ore placed on the leach pads increased by 12% in 2005 from 2004 due to increased open pit production from Carlin and Twin Creeks.Costs applicable to salesper ounce increased 18%, primarily due to increased labor, diesel and other commodity prices, a decrease in ounces produced and higher underground contract service costs. Experienced miners, particularly underground miners, are in short supply in Nevada and labor rates have increased in line with this shortfall. During the fourth quarter of 2005, Nevada recorded a goodwill impairment charge of $41 as a result of anticipated increased future operating and capital costs.
Gold ounces sold increased 2% in 2004 from 2003 as a 13% increase in mill throughput and sales from inventories partially offset a 9% production decline. Production declines13% decrease in 2004 were due to lowermill ore grade and recoveries, partially offset by increased mill throughput. The increase in throughput was due15% lower heap leach production.Costs applicable to the Gold Quarry expansion and a full year of production from Mill 5, which recommenced operations in June 2003. Total cash costssales per equity ounce increased 18%, primarily due to the processing of lower-grade material, higher contract service costs from contractedfor ore haulage at Carlin, increased tonnage hauled to Twin Creeks and higher diesel, electricity and mine equipment maintenance costs.
In 2003,Consolidated gold equity ounces sold decreased 9% from 2002, primarily duesales for 2006 are expected to a decline in oxide mill production, timing of material placed on leach pads and a build up of inventory. Total cash costs per equity ounce increased 4% over 2002, primarily due to the decrease in ounces sold and higher labor, mine maintenance, electricity, diesel and contract mining costs.
Nevada expects to sellbe approximately 2.6 million equity ounces atCosts applicable to salesof gold in 2005 at total cash costsapproximately $380 per ounce.
The Company has completed the permitting process and received approval from its Board of $285 per equity ounce.
Newmont is in the process of obtaining permitsDirectors for construction and operation of a 203-megawatt200-megawatt coal-fired power plantplant. Construction has commenced and capital costs are expected to be located near Carlin, Nevada. If all of the necessary permits and approvals are obtained and construction commences in 2005, the plant could begin commercial operations in late 2007 or early 2008. Preliminary estimates of capital expendituresapproximately $450. Project completion is targeted for the project are approximately $400 million - $450 million. Operationfirst half of the plant could result in savings of up to $20 in total cash costs per ounce of gold produced by the Nevada operations.
2008.
Non-governmental organizations have brought a series of actions relating to the Nevada operations, as described in more detail in Note 2730 to the Consolidated Financial Statements. While Newmont believes that the legal actions are without merit, unfavorable outcomes could result in additional conditions being imposed on how the Company conductsCompany’s operations, and such conditions could have a material adverse effect on Nevada’s results of operations or financial position.
Yanacocha Operations
Golden Giant, Canada. Gold equityYanacocha gold ounces sold decreased 30%increased 9% in 20042005 from 2003, primarily due to reduced mining faces at this mature mine. Total cash costs per equity ounce increased 31% in 2004, from 2003, primarily from lower production and appreciation of the Canadian dollar compared to the U.S. dollar (see Foreign Currency Exchange Rates, below).
Gold equity ounces sold decreased 18% in 2003 from 2002, primarily due to a 35% decrease12% increase in mill throughput asthe grade of ore placed and a result of reduced mining faces10% increase in the total ore placed, partially offset by a 35% higher ore grade. Total cash coststiming of flows from the leach pads and increased inventory.Costs applicable to sales per equity ounce increased 16% in 2003 from 2002, primarily from lower production volume4% due to increased workers’ participation payments, increased consumption of reagents and appreciation of the Canadian dollar. During 2003, Golden Giant recorded an impairment charge of $28.4 million resulting from a reevaluation of the life-of-mine plan that reduced provenhigher royalties due to increased gold prices. Increased labor and probable reserves.
Gold sales for 2005 are expected to total approximately 160,000 equity ounces at total cashcommodity costs of $305 per equity ounce. Based on the current mine plans, operations are expected to be completed in early 2006.
Holloway, Canada. Total cash costs per equity ounce increased 18% in 2004 from 2003, resulting from higher costs associated with increased manpower, steel, electricity and appreciation of the Canadian dollar compared to the U.S. dollar (see Foreign Currency Exchange Rates, below),were partially offset by a 4% increase in gold equity ounces sold.increased production, related allocation of costs to inventory and increased silver by-product credits.
In 2003, gold equity ounces sold decreased 33% from 2002, primarily due to a 20% decline in mill ore grade compared to 2002. Total cash costs per equity ounce increased 53% as a result of declining production and a strengthening Canadian dollar.
Holloway is expected to sell approximately 85,000 equity ounces in 2005 at total cash costs of $355 per equity ounce. Gold sales are projected to remain at that level in 2006.
La Herradura, Mexico. Gold equity ounces sold increased 1% in 2004 from 2003, primarily due a 3% increase in ore placed on the leach pads. In 2003, gold equity ounces sold increased 6% over 2002, primarily due to capital investments that led to increased mining rates and ore placement on the leach pads.
La Herradura is expected to sell approximately 80,000 equity ounces in 2005 at total cash costs of $150 per equity ounce.
South American Operations
| Equity Ozs. Sold | Total Cash Cost | ||||||||||||||
| 2004 | 2003 | 2002 | 2004 | 2003 | 2002 | ||||||||||
| (in thousands) | ($ per equity oz.) | ||||||||||||||
Yanacocha (51.35% owned) | 1,561.0 | 1,467.9 | 1,176.9 | $ | 135 | $ | 120 | $ | 125 | ||||||
Kori Kollo (88% owned) | 21.7 | 158.5 | 249.4 | 260 | 184 | 156 | |||||||||
Total/Weighted-Average | 1,582.7 | 1,626.4 | 1,426.3 | $ | 137 | $ | 126 | $ | 131 | ||||||
Yanacocha, Peru. Gold equity ounces sold increased 6% in 2004 over 2003, primarily due to increased leach solution processing capacity including greater pumping capacity and additional carbon columns. Total cash costsCosts applicable to sales per equity ounce increased 13%12%, primarily due to an increase in workers’ participation payments resulting from higher taxable income, higher diesel fuel consumption and price, increased consumption of reagents and higher royalties due to increased gold prices. The increases were partially offset by increased silver by-product credits. By-product credits
Consolidated gold sales for 2004, 2003 and 2002 were $24.4 million, $14.2 million and $9.0 million, respectively.
In 2003, gold equity ounces sold increased 25% from 2002, primarily due to increased leach solution processing capacity and an 18% higher ore grade due to a planned mining sequence leading to higher ore grades at the La Quinua and Cerro Yanacocha pits. Total cash costs per equity ounce decreased 4%, primarily due to the
increase in production and increased silver by-product credits, partially offset by higher workers’ participation payments due to higher taxable income, higher diesel fuel costs and higher royalties due to increased gold prices.
Yanacocha is expected to sell approximately 1.5 million equity ounces in 2005 at total cash costs of $135 per equity ounce. Gold equity ounces sold2006 are expected to decline bybe approximately 10% in 2006, after which2.6 million ounces atCosts applicable to sales of approximately $185 per ounce. Consolidated gold equity ounces sold can besales for 2007 through 2010 are expected to decline significantly, unlessaverage approximately 1.75 million ounces atCosts applicable to sales of approximately $255 per ounce, with actual gold sales and costs being determined by, among other factors, further mine plan optimization efforts, the discovery and development of additional oxide deposits, are discovered and developed or feasibility studiesthe development of Conga, currently assumed to develop sulfide deposits are completed.commence production in 2010.
During 2004, Peru enacted legislation to establish a sliding scale mining royalty of up to 3% based on the volume of mine production. The royalty is calculated on revenue from sales of product less certain refining and transportation expenses. While the Peruvian royalty became effective during the second quarter of 2004, it does not apply to those projects that had tax stabilization agreements prior to the adoption of the royalty law. Virtually all of Yanacocha’s current production is derived from projects that were stabilized prior to the enactment of the royalty legislation. However, pending amendment or successful legal challenges to the validity of the royalty legislation, future projects not covered by the tax stabilization agreements could be burdened by this royalty.
Cerro Quilish is onea deposit within the Yanacocha complex. In July 2004, Yanacocha received a drilling permit for the Cerro Quilish deposit and commenced drilling activities to further define the deposit. During September 2004, individuals from the Cajamarca region, where Cerro Quilish is located, conducted a sustained blockade of the road between the City of Cajamarca and the mine site, in protest of these exploration activities. Yanacocha suspended all drilling activities at Cerro Quilish and the blockade was resolved. At the request of Yanacocha, the Cerro Quilish drilling permit was revoked in November 2004. Yanacocha has reassessed the challenges involved in obtaining required permits for Cerro Quilish primarily related to increased community concerns. Based upon this reassessment, Yanacocha has reclassified 3.9 million ounces (1.98(2.0 million equity ounces) of gold from proven and probable reserves to mineralized material not in reserve as of December 31, 2004.
Kori Kollo, Bolivia. Mining was completed and the mill was closed in October 2003. Production has continued from residual leaching. Kori Kollo will begin processing oxide ores on leach pads from the Kori Chaca pit and reprocessing high-grade tailings on a new leach pad in 2005. These projects are expected to produce 85,000 equity ounces in 2005 at total cash costs of $150 per equity ounce.
Australia/New Zealand Operations
Gold | Equity Ozs. Sold | Total Cash Cost | |||||||||||||
| 2004 | 2003 | 2002 | 2004 | 2003 | 2002 | ||||||||||
| (in thousands) | ($ per equity oz.) | ||||||||||||||
Pajingo | 251.4 | 330.3 | 296.4 | $ | 230 | $ | 129 | $ | 95 | ||||||
Yandal | 379.3 | 565.6 | 611.1 | 274 | 273 | 215 | |||||||||
Tanami(1) | 658.0 | 588.6 | 452.4 | 281 | 240 | 205 | |||||||||
Kalgoorlie (50% owned) | 468.4 | 404.7 | 324.7 | 297 | 263 | 215 | |||||||||
Martha(2) | 130.5 | 108.9 | 107.8 | 212 | 199 | 156 | |||||||||
Golden Grove(3) | 19.3 | 13.4 | 13.6 | N/A | N/A | N/A | |||||||||
Total/Weighted-Average | 1,906.9 | 2,011.5 | 1,806.0 | $ | 272 | $ | 234 | $ | 189 | ||||||
Base Metals | Equity Lbs. Sold | Total Cash Cost | |||||||||||||
| 2004 | 2003 | 2002 | 2004 | 2003 | 2002 | ||||||||||
| (in millions) | ($ per equity lb.) | ||||||||||||||
Golden Grove | |||||||||||||||
Copper | 43.5 | 74.3 | 44.8 | $ | 0.90 | $ | 0.59 | $ | 0.57 | ||||||
Zinc | 114.8 | 104.7 | 111.2 | $ | 0.38 | $ | 0.19 | $ | 0.24 | ||||||
| Gold Ounces Sold | Costs Applicable to Sales(1) | Depreciation, Depletion and Amortization | ||||||||||||||||||||||
| 2005 | 2004 | 2003 | 2005 | 2004 | 2003 | 2005 | 2004 | 2003 | ||||||||||||||||
| (in thousands) | ($ per ounce) | ($ per ounce) | ||||||||||||||||||||||
Tanami(2) | 493.7 | 658.0 | 605.9 | $ | 328 | $ | 295 | $ | 246 | $ | 67 | $ | 58 | $ | 59 | |||||||||
Kalgoorlie (50% owned) | 409.6 | 468.4 | 404.7 | 352 | 301 | 268 | 42 | 35 | 24 | |||||||||||||||
Jundee(3) | 341.8 | 379.3 | 565.6 | 335 | 279 | 279 | 80 | 71 | 63 | |||||||||||||||
Pajingo | 192.0 | 251.4 | 330.3 | 301 | $ | 236 | 130 | 130 | 125 | 88 | ||||||||||||||
Martha(4) | 163.4 | 130.5 | 110.2 | 177 | 215 | 226 | 97 | 106 | 105 | |||||||||||||||
Total/Weighted-Average | 1,600.5 | 1,887.6 | 2,016.7 | $ | 317 | $ | 280 | $ | 239 | $ | 74 | $ | 67 | $ | 61 | |||||||||
| (1) | Excludes depreciation, depletion and amortization. |
| (2) | Ownership increased from 85.9% to 100% in April 2003. |
| During 2004 and 2003, Jundee included Bronzewing which ceased mining in the first quarter of 2004 and was sold during the third quarter of 2004. Jundee also included Wiluna until its sale in December 2003. |
| (4) | Ownership increased from 92.28% to 100% in April 2003. |
|
Australia/New Zealand operations for 2002 reflect activity from February 16, 2002 (Normandy acquisition effective date of February 15, 2002) through December 31, 2002 with the exception of Pajingo, which reflects Newmont’s 50% ownership through February 15, 2002 and 100% ownership from February 16, 2002 forward.
Australia/New Zealand operations sold 5%15% fewer equity ounces of gold in 2005 compared to 2004, primarily due to lower grades at Tanami and Kalgoorlie combined with lower throughput at Tanami and Pajingo. In 2004, gold ounces sold decreased 5% compared to 2003, primarily because of lower production from Pajingo and YandalJundee due to the sale of Wiluna in December 2003 and Bronzewing in the third quarter of 2004. InCosts applicable to sales per ounce increased in 2005 from 2004 and in 2004 from 2003 gold equityby 13% and 17%, respectively, primarily due to the decrease in ounces sold, increased 11% compared to 2002, primarily due to a full year of Newmont ownership in 2003 compared to tencommodity costs and one-half months in 2002. Total cash costs per equity ounce increased in 2004 compared to 2003 and in 2003 compared to 2002 by 16% and 24%, respectively, due to appreciation of the Australian and New Zealand dollars compared to the U.S. dollar (see Foreign Currency Exchange Rates, below)dollar. The unfavorable foreign exchange movements increased Australia/New ZealandCosts applicable to sales in 2005 from 2004 by $15 per ounce and in 2004 from 2003 by $30 per ounce.
Tanami, Australia. Gold ounces sold decreased 25% in 2005 from 2004, primarily due to a 16% decline in ore grade from mining lower grade zones of the Callie underground deposit and processing lower grade stockpiles at Groundrush. Mining was completed at Groundrush in 2004 and the lower grade stockpiles were exhausted in the third quarter of 2005.Costs applicable to sales per ounce increased 12%, primarily due to lower gold production, higher maintenance, diesel, power, ground support and surface works costs and appreciation of the Australian dollar.
Gold ounces sold increased 9% in 2004 from 2003, primarily due to a decrease in inventory.Costs applicable to sales per ounce increased 20%, primarily due to appreciation of the Australian dollar, higher royalties due to increased gold prices and additional underground backfill costs.
Consolidated gold sales for 2006 are expected to be approximately 435,000 ounces atCosts applicable to sales of $330 per ounce.
Kalgoorlie, Australia. Gold ounces sold decreased 13% in 2004.2005 from 2004, primarily due to a 7% decrease in ore grade milled and sales from inventories in 2004, partially offset by a 2% increase in tons milled.Costs applicable to sales per ounce increased 17%, primarily due to increased mill throughput, increased diesel, reagent and power costs and appreciation of the Australian dollar.
Gold ounces sold increased 16% in 2004 from 2003, primarily due to a decrease in inventory.Costs applicable to sales per ounce increased 12%, primarily due to appreciation of the Australian dollar, higher amortization of deferred stripping costs, increased diesel prices and higher processing consumables costs.
Consolidated gold sales for 2006 are expected to be approximately 430,000 ounces atCosts applicable to sales of $395 per ounce.
Jundee, Australia. In 2003, the Yandal operations included the Wiluna, Bronzewing and Jundee operations. Operations at Bronzewing ceased during the second quarter of 2004 and Bronzewing was sold the third quarter of 2004 (see Other Investing Activities, below). The Wiluna operation was sold in the fourth quarter of 2003. The Jundee mine is the remaining Yandal operation. Gold ounces sold decreased 10% in 2005 from 2004, due to the cessation of production at Bronzewing, partially offset by higher mill ore grade from Jundee.Costs applicable to sales per ounce increased 21%, primarily due to higher underground contract services, steel, diesel and administration costs and appreciation of the Australian dollar.
Gold ounces sold decreased 33% in 2004 from 2003, primarily due to a 46% decrease in mill throughput after the sale of the Wiluna operation and the cessation of production at Bronzewing, partially offset by an 8% increase in mill ore grade.Costs applicable to sales per ounce remained the same as appreciation of the Australian dollar was offset by production coming mainly from the lower cost Jundee operation.
Consolidated gold sales for 2006 are expected to be approximately 335,000 ounces atCosts applicable to sales of $335 per ounce. Gold ounces sold for 2007 through 2010 are expected to average approximately 296,000 ounces per year.
Pajingo, Australia. Gold equityounces sold decreased 24% in 2005 from 2004, primarily due to a 19% decrease in ore milled as low grade stockpiles which supplemented production in 2004 have been exhausted.Costs applicable to sales per ounce increased 28% due to lower production and appreciation of the Australian dollar.
Gold ounces sold decreased 24% in 2004 from 2003, primarily due to a 33% decline in ore grade and a ground disturbance that delayed mill feed. Total cash costsCosts applicable to sales per equity ounce increased 78%82%, primarily due to the lower ore grade resulting in lower production, increased mine maintenance costs and appreciation of the Australian dollar. During the fourth quarter of 2004, Pajingo recorded goodwill and long-lived assets impairment charges of $51.8 million$52 and $5.8 million,$6, respectively, as a result of anticipated increased future operating costs and lower grade ore.
In 2003,Consolidated gold equity ounces sold increased 11% from 2002, primarily due to a 13% increase in ore grade and a full year of Newmont operations. Total cash costs per equity ounce increased 36%, primarily due to the appreciation of the Australian dollar, increased development activity and increased overhead charges.
Gold sales for 20052006 are expected to be approximately 205,000195,000 ounces at total cash costsCosts applicable to sales of $250$280 per equity ounce. Based on current mine plans, gold equity ounces soldsales are expected to decline each year to approximately 55,000135,000 ounces in 2007 and 60,000 ounces in 2008 as the projectPajingo approaches the end of its life.
Yandal, Australia. Gold equity ounces sold decreased 33% in 2004 from 2003, primarily due to a 46% decrease in mill throughput, partially offset by an 8% increase in mill ore grade. Jundee is the remaining activecurrent mine of the Yandal operations after the sale of the Wiluna operation in December 2003 and the cessation of mining at Bronzewing during the first quarter of 2004. Newmont sold Bronzewing in the third quarter of 2004 (see Other Investing Activities, below). Total cash costs per equity ounce remained the same as the appreciation of the Australian dollar was offset by production coming mainly from the lower cost Jundee operation.life.
Gold equity ounces sold decreased 7% in 2003 from 2002, primarily from a 7% decrease in mill ore grade driven by lower grades at all three sites, partially offset by a full year of Newmont operations in 2003. Total cash costs per equity ounce increased 27%, primarily due to higher operating costs related to increased underground activities at Jundee and Wiluna and the appreciation of the Australian dollar.
Gold sales for 2005 are expected to be approximately 325,000 ounces at total cash costs of $300 per ounce. Sales for 2005 through 2009 are expected to vary between 235,000 and 325,000 equity ounces per year.
Tanami, Australia. Gold equity ounces sold increased 12% in 2004 from 2003, primarily due to a decrease in inventory and the increase in ownership from 85.9% to 100% in April 2003. Total cash costs per equity ounce increased 17%, primarily due to the appreciation of the Australian dollar, higher royalties due to increased gold prices and additional backfill costs underground.
In 2003, gold equity ounces sold increased 30% over 2002, primarily due to a full year of Newmont operations, the April 2003 increase in ownership percentage and a 19% increase in mill throughput. Total cash costs per equity ounce increased 17%, primarily due to the appreciation of the Australian dollar, higher royalties due to higher gold prices, increases in milling costs and higher overhead charges.
Gold sales for 2005 are expected to be approximately 475,000 equity ounces at total cash costs of $295 per ounce.
Kalgoorlie, Australia. Gold equity ounces sold increased 16% in 2004 from 2003, primarily due to a decrease in inventory. Total cash costs per equity ounce increased 13%, primarily due to the appreciation of the Australian dollar, higher amortization of deferred stripping costs, increased diesel fuel prices and higher processing consumables costs.
In 2003, gold equity ounces sold increased 25% from 2002, primarily due to a 15% increase in mill throughput and an 18% increase in mill ore grade, as well as having a full year of Newmont operations. Total cash costs per equity ounce increased 22%, primarily due to the appreciation of the Australian dollar, higher amortization of deferred stripping and an increase in underground mining activity at Mt. Charlotte. The increased costs were partially offset by increased gold equity ounces sold.
Gold sales for 2005 are expected to be approximately 440,000 equity ounces at total cash costs of $335 per equity ounce.
Martha, New Zealand. Gold equity ounces sold increased 20%25% in 2005 from 2004, primarily due to a 37% increase in ore grade due to mine sequencing, partially offset by a 9% decrease in ore milled.Costs applicable to sales per ounce decreased 18%, primarily due to increased production, partially offset by higher processing costs from harder ore and appreciation of the New Zealand dollar.
Gold ounces sold increased 18% in 2004 from 2003, primarily due to a 16% increase in mill ore grade and the increase in ownership from 92.28%grade.Costs applicable to 100% in April 2003. Total cash costssales per equity ounce increased 7%decreased 5%, primarily due to the increase in production, partially offset by appreciation of the New Zealand dollar.
Gold equity ounces sold in 2003 increased by only 1% compared to 2002, despite the fact that 2002 included only ten and one-half months of production. This is attributable to a 13% decline in mill ore grade in 2003, partially offset by an 18% increase in mill throughput. Total cash costs per equity ounce increased 28%, primarily due to the appreciation of the New Zealand dollar, increased milling costs from higher electricity rates, higher consumption of grinding media, an earlier than planned SAG mill liner replacement and higher cyanide and lime consumption.
GoldConsolidated gold sales for 2005 are expected to be approximately 140,000 equity130,000 ounces in 2006 at total cash costsCosts applicable to sales of $225$235 per equity ounce. Gold equity ounces sold are expected to remain relatively constant until 2009.
Golden Grove, Australia. Copper sales decreased by 41% in 2004 from 2003, primarily due lower grade and higher inventory sales in 2003. Zinc sales increased by 10%, primarily due to a 10% increase in ore processed and a decrease in inventory, partially offset by lower grade. Total cash costs per equity pound of copper and zinc increased 53% and 100%, respectively, primarily from lower copper and zinc grades, higher ground support costs and the appreciation of the Australian dollar. In 2003, copper sales increased 66% over 2002, primarily due to the timing of concentrate shipments.
Lead, silver and gold by-product credits at Golden Grove totaled $15.7 million, $15.5 million and $16.0 million during 2004, 2003 and 2002, respectively. As Golden Grove has a poly-metallic ore body, such by-product credits are expected to continue in the future and to vary from period-to-period based on the portions of the ore body being extracted at the time.
Golden Grove is expected to sell approximately 40 to 50 million equity pounds of copper at total cash costs per equity pound of $1.00 to $1.05 and approximately 200 to 220 million equity pounds of zinc at total cash costs per equity pound of $0.30 to $0.35 in 2005.
IndonesianBatu Hijau Operations
| Equity Ozs. Sold | Total Cash Cost | ||||||||||||||||
Gold | 2004 | 2003 | 2002 | 2004 | 2003 | 2002 | |||||||||||
| (in thousands) | ($ per equity oz.) | ||||||||||||||||
Batu Hijau(1)(2) | 396.3 | 328.9 | 278.0 | $ | 128 | $ | 121 | $ | 122 | ||||||||
Minahasa (94% economic interest, 80% owned) | 70.2 | 92.2 | 147.2 | 259 | 249 | 218 | |||||||||||
Total/Weighted-Average | 466.5 | 421.1 | 425.2 | $ | 148 | N/A | (3) | N/A | (3) | ||||||||
| Equity Lbs. Sold | Total Cash Cost | ||||||||||||||||
Copper | 2004 | 2003 | 2002 | 2004 | 2003 | 2002 | |||||||||||
| (in millions) | ($ per equity lb.) | ||||||||||||||||
Batu Hijau(1)(2) | 378.8 | 343.4 | 362.3 | $ | 0.60 | $ | 0.46 | $ | 0.45 | ||||||||
| Gold Ounces or Copper Pounds Sold | Costs Applicable to Sales(1) | Depreciation, Depletion and Amortization | ||||||||||||||||||||
| 2005 | 2004 | 2003 | 2005 | 2004 | 2003 | 2005 | 2004 | 2003 | ||||||||||||||
| (ounces in thousands) | ($ per ounce) | ($ per ounce) | ||||||||||||||||||||
Gold | ||||||||||||||||||||||
Batu Hijau(2)(3)(4) | 720.5 | 715.2 | N/A | $ | 152 | $ | 128 | N/A | $ | 47 | $ | 39 | N/A | |||||||||
| (pounds in millions) | ($ per pound) | ($ per pound) | ||||||||||||||||||||
Copper | ||||||||||||||||||||||
Batu Hijau(2)(3)(4) | 572.7 | 683.3 | N/A | $ | 0.53 | $ | 0.45 | N/A | $ | 0.15 | $ | 0.13 | N/A | |||||||||
| (1) |
| (2) | Consolidated gold ounces or copper pounds sold includes minority interests’ share. |
| (3) |
| Batu Hijau was consolidated as of January 1, 2004. Batu Hijau was accounted for using the equity method in 2003 and, |
Batu Hijau. During 2003, and 2002, Newmont accounted for its 56.25% economic interest (a 45% ownership interest) in Batu Hijau under the equity method of accounting (see Equity Investments, below).accounting. Upon adoption of FIN 46R, Newmont consolidated the operations of Batu Hijau as of January 1, 2004 (see Overview, above). As of October 1, 2004, Batu Hijau’s cumulative losses had been recovered and Batu Hijau began to report positive retained earnings, allowing for the payment of dividends, 6% of which are paid to the minority partner. Accordingly, Newmont began recognizing the minority interests in Batu Hijau at 47.125% (effective 52.875% Newmont share) of Batu Hijau’s earnings and will continue to do so until a loan to the minority interest partner is fully repaid (including accrued interest). See Consolidated Financial Results above for more information.
Under the Batu Hijau Contract of Work, beginning in 2005 and continuing through 2010, a portion of the project must be offered for sale to the Indonesian government or to Indonesian nationals, equal to the difference between the following percentages and the percentage of shares already owned by the Indonesian government or Indonesian nationals (if such number is positive): 15%, by the end of 2005; 23%, by the end of 2006; 30%, by the end of 2007; 37%, by the end of 2008; 44%, by the end of 2009; and 51%, by the end of 2010. The price at which such interest must be offered for sale to the Indonesian parties is the highest of the then-current replacement cost, the price at which shares of the project company would be accepted for listing on the Jakarta Stock Exchange, or the fair market value of such interest in the project company as a going concern.
An Indonesian national currently owns a 20% interest in Batu Hijau, which would require Newmont and requires the Newmont/Sumitomo partnership to offer a 3% interest in Batu Hijau to the Indonesian government or to Indonesian nationals in 2006. Pursuant to this provision, it is possible that the ownership interest of the Newmont/Sumitomo partnership in Batu Hijau could be reduced to 49% by the end of 2010.
Copper sales decreased 16% and gold sales increased 1% in 2005 from 2004. Access to ore in the lower portion of the pit was temporarily restricted as a result of several small pit wall slides during the first quarter of 2005. As a result, the mine plan was revised, resulting in the processing of lower grade stockpiles.Costs applicable to sales per pound of copper increased 18% and per ounce of gold increased 19% primarily as a result of the decrease in copper production, increased fuel, maintenance, consumables, and labor costs.
Copper and gold sales quantities increased 12% and 22% in 2004 from 2003, respectively. The increases were primarily attributable to higher mill throughput reflecting modifications to the crusher circuit in the second half of 2003 and higher ore grades (copper 5%, gold 10%).
Beginning in 2004, Newmont began utilizing co-product accountingConsolidated sales for copper and gold whereby sales and costs applicable to sales are recognized for each product. During 2003 and 2002, Batu Hijau accounted for sales
of gold as a by-product credit to copper production costs. On a co-product basis, copper and gold total cash costs per equity pound of copper and ounce of gold increased 30% and 6%, respectively in 2004, due to higher diesel fuel consumption and price, higher equipment maintenance costs, increased mill throughput and higher insurance costs. In addition, under co-product accounting, copper was allocated a higher percentage of total costs during 2004, compared to 2003, as the average copper price increased (55%) more significantly than did the average gold price (13%) in 2004.
In 2003, equity copper pounds and gold ounces sold decreased 5% and 18%, respectively, from 2002. The decrease in copper sales was primarily attributable to lower mill throughput. Gold equity ounces sold increased 22% due a 25% increase in the gold grade processed. Total equity cash costs on a co-product basis for copper and gold were similar in 2003 and 2002.
Sales for 20052006 are expected to total approximately 330 to 360565 million equity pounds of copper at total cash costsCosts applicable to salesof $0.45 per equity pound of $0.58 to $0.64 and 430,000 equity575,000 ounces of gold at total cash costsCosts applicable to sales of $155 per equity ounce of $145.
Minahasa. Gold equity ounces sold decreased 24%ounce. Copper and gold sales volumes are lower in 2004 from 2003, primarily reflecting2006 as operations move to lower grade oreareas in the next mining phase and the completion of milling on August 30, 2004 resulting in lower mill throughput. Mining activities at Minahasa ceased late in 2001. The remaining stockpiles were processed by August 30, 2004.stripping increases.
In 2003, gold equity ounces sold decreased 37% from 2002, primarily due to a 27% decrease in mill ore grade and a 3% decrease in mill throughput. Total cash costs per equity ounce increased 14%, primarily due to the increased use of consumables, higher diesel fuel prices and a higher level of contracted services, partially offset by lower administrative expenses. See Note 27 to the Consolidated Financial Statements for information regarding legal actions related to Minahasa.
Central AsiaOther Operations
| Equity Ozs. Sold | Total Cash Cost | ||||||||||||||
| 2004 | 2003 | 2002 | 2004 | 2003 | 2002 | ||||||||||
| (in thousands) | ($ per equity oz.) | ||||||||||||||
Zarafshan(1) (50% owned) | 210.1 | 218.1 | 255.8 | $ | 152 | $ | 147 | $ | 134 | ||||||
Ovacik | 110.0 | 168.2 | 125.7 | 193 | 129 | 122 | |||||||||
Total/Weighted-Average | 320.1 | 386.3 | 381.5 | $ | 166 | $ | 139 | $ | 130 | ||||||
| Gold Ounces Sold | Costs Applicable to Sales(1) | Depreciation, Depletion and Amortization | ||||||||||||||||||||||
| 2005 | 2004 | 2003 | 2005 | 2004 | 2003 | 2005 | 2004 | 2003 | ||||||||||||||||
| (in thousands) | ($ per ounce) | ($ per ounce) | ||||||||||||||||||||||
Golden Giant | 162.0 | 160.0 | 229.7 | $ | 296 | $ | 298 | $ | 231 | $ | 67 | $ | 71 | $ | 96 | |||||||||
Zarafshan(2) (50% owned) | 122.7 | 210.1 | 218.1 | 218 | 154 | 151 | 76 | 49 | 46 | |||||||||||||||
Kori Kollo(3) (88% owned) | 94.5 | 24.6 | 180.1 | 167 | 398 | 197 | 40 | 93 | 38 | |||||||||||||||
La Herradura (44% owned) | 80.2 | 68.8 | 67.8 | 184 | 147 | 164 | 63 | 73 | 50 | |||||||||||||||
Ovacik(4) | — | 110.0 | 168.2 | — | 208 | 133 | — | 143 | 82 | |||||||||||||||
Minahasa(3) (94% economic interest, 80% owned) | — | 74.7 | 98.1 | — | 266 | 268 | — | 32 | 78 | |||||||||||||||
Mesquite(4) | — | — | 49.2 | — | — | 196 | — | — | 79 | |||||||||||||||
Total/Weighted-Average | 459.4 | 648.2 | 1,011.2 | $ | 229 | $ | 220 | $ | 189 | $ | 63 | $ | 73 | $ | 67 | |||||||||
| (1) | Excludes depreciation, depletion and amortization. |
| (2) | Joint venture between Newmont and two Uzbekistan government entities, the State Committee for Geology and Mineral Resources (the “State Committee”) and Navoi Mining and Metallurgical Combinat (“Navoi”) |
| (3) | Consolidated gold ounces sold includes minority interests’ share. |
| (4) | Ovacik sold in March 2005 and Mesquite sold in November 2003. |
Golden Giant, Canada. Gold ounces sold remained constant in 2005 compared to 2004. A 12% increase in mill throughput was offset by a 3% decline in ore grade and increased in-process inventory.Costs applicable to sales per ounce remained constant as an increase in milling costs due to increased throughput and appreciation of the Canadian dollar was offset by increased in-process inventory at the end of 2005. The unfavorable change in the foreign exchange rate increasedCosts applicable to sales by $19 per ounce. Mining operations at Golden Giant were completed in December 2005, with final mill production and gold sales expected in the first quarter of 2006.
Gold ounces sold decreased 30% in 2004 from 2003, primarily due to reduced mining faces at this mature mine.Costs applicable to sales per ounce increased 29% in 2004 from 2003, primarily from lower production and appreciation of the Canadian dollar. The unfavorable change in the foreign exchange rate increasedCosts applicable to sales by $19 per consolidated ounce.
Zarafshan, Uzbekistan. Gold equityounces sold decreased 42% in 2005 from 2004 primarily due to 3% fewer tons placed on the leach pads due to unscheduled plant maintenance, and lower gold recoveries associated with a 17% decrease in ore grade and slower flows from the leach pads.Costs applicable to sales per ounce increased 42%, primarily as a result of the decrease in production.
Gold ounces sold decreased 4% in 2004 from 2003 as a result of a 3% decrease in ore grade and a 2% decrease in ore placed on the leach pads. The lower ore grade is expectedCosts applicable to continue during 2005. Total cash costssales per equity ounce increased 3%2% primarily a result of the decrease in gold ounces sold.
Consolidated gold sales for 2006 are expected to be approximately 130,000 ounces atCosts applicable to sales of $260 per ounce.
In
Kori Kollo, Bolivia. The mill was shut down in October 2003, gold equityhowever production continued from residual leaching. Beginning in the third quarter of 2005, additional material from the Kori Kollo pit was placed on the existing leach pad and ore from the Kori Chaca pit was processed on a new leach pad. This resulted in ounces sold nearly quadrupling in 2005 from 2004.Costs applicable to sales per ounce decreased 15%58% from 20022004 to 2005 as a result of the increased production.
Consolidated gold sales for 2006 are expected to be approximately 125,000 ounces atCosts applicable to sales of $220 per ounce.
La Herradura, Mexico. Gold ounces sold increased 17% in 2005 from 2004 primarily due to a 19% decrease12% increase in the ore grade processed, partially offsetand the timing of flows from the leach pads.Costs applicable to sales per ounce increased by 25% primarily due to increased labor, diesel and other commodity prices. Gold ounces sold increased 1% in 2004 from 2003, primarily due a 3% increase in ore placed on the leach pads. Total cash costs per equity ounce increased 10%, primarily due to the decrease in gold equity ounces sold.
Zarafshan-Newmont is expected to sell approximately 150,000 equity ounces in 2005 at total cash costs of $215 per equity ounce. Based on current mine plans,Consolidated gold sales at Zarafshan-Newmontfor 2006 are expected to vary between 150,000 and 180,000 equitybe approximately 85,000 ounces atCosts applicable to sales of $210 per year during the four years after 2005.
ounce.
Ovacik, Turkey. Gold ounces sold decreased 35% in 2004 from 2003, primarily due to a suspension of operations, discussed below, partially offset by reducing ore stockpiles and exhausting circuit inventory. Total cash costs per equity ounce increased 50%, primarily due to the decline in production. In 2003, gold ounces sold increased 34% from 2002, primarily attributable to a 48% increase in mill throughput resulting from a revised
mine plan that incorporated an open pit extension and increased mill efficiencies, partially offset by a 6% decrease in mill ore grade. Total cash costs per equity ounce increased 6% in 2003 from 2002 as the positive impact of increased gold sales was offset by higher processing costs and higher administration costs.
In August 2004,On March 1, 2005, the Ovacik mine was sold to a subsidiary of Koza Davetiye, a Turkish conglomerate. Operations were suspended operationsin August 2004 as a result of a court decision ordering suspension of operating permits pending completion of certain additional permitting requirements and the submission of an updated environmental impact assessment. On March 1, 2005,
Gold ounces sold decreased 35% in 2004 from 2003, primarily due to the Ovacik mine was soldsuspension of operations, partially offset by reducing ore stockpiles and exhausting in-circuit inventory.Costs applicable to a subsidiary of Koza Davetiye, a Turkish conglomerate. Consideration forsales per ounce increased 56%, primarily due to the mine included $20 million paid at closing and various contingent payments that could total as much as $24.5 million if all conditions precedent are met.
decline in production. In the second quarter of 2004, the Company recognized a write-down of $16.3 million$16 related to the long-lived assets at the Ovacik mine. Proven and probable reserves
Minahasa, Indonesia. Mining activities at Minahasa ceased in 2001. Milling of the remaining stockpiles was completed in August 2004. Gold ounces sold decreased 24% in 2004 from 2003, primarily reflecting lower grade ore processed and the carrying valuecompletion of long-lived assets at December 31, 2004 were approximately 100,000 equity ounces and $26.4 million, respectively.
milling. See Note 30 to the Consolidated Financial Statements for information regarding legal actions related to Minahasa.
Other Operations
| Equity Ozs. Sold | ||||
| 2003 | 2002 | |||
| (in thousands) | ||||
TVX Newmont Americas | 14.5 | 183.5 | ||
Echo Bay | 21.2 | 185.2 | ||
| 35.7 | 368.7 | |||
Information related to TVX Newmont Americas and Echo Bay for 2003 reflects activity only from January 1, 2003 to January 31, 2003, when the investments were sold and exchanged as part of the Kinross transaction (see Other Investing Activities). Information for 2002 related to TVX Newmont Americas, which was acquired as a result of the Normandy acquisition on February 15, 2002, reflects activity from February 16, 2002 through December 31, 2002. Information related to Echo Bay for 2002 reflects activity from April 3, 2002 (the date Newmont’s investment was converted from capital debt securities to common shares of Echo Bay) through December 31, 2002.
Merchant Banking
Merchant Banking is a “reportable segment” for financial reporting purposes. Merchant Banking, also referred to as Newmont Capital, manages a Royalty Portfolio,royalty portfolio, an Equity Portfolio, andequity portfolio, a Downstream Gold Refiningdownstream gold refining business, and engages in Value Realizationvalue realization activities (managing interests in oil and gas, iron ore, and coal properties as well as providing in-house investment banking and advisory services).
Merchant Banking manages a Royalty Portfolioroyalty portfolio which includes interests that were acquired as a result of the Franco-Nevada acquisition, as well as royalties created by virtue of its land bank activities (through sale or farm-out). Royalty interests are generally in the form of a net smelter return (“NSR”) royalty that provides for the payment of a specified percentage of production, less certain specified transportation and refining costs. In some cases, Newmont ownsroyalties are a net profit interest (“NPI”) entitling Newmont to a specified percentage of the net profits, as defined in each case, from a particular mining operation.case. The majority of NSR royalty revenue and NPI revenue can be received in cash or in-kind at the option of Newmont. Merchant Banking’s royalty interests and investments generated $65.8 million, $56.3 million and $35.7 million ofRoyalty and dividend income in 2004, 2003 and 2002, respectively. The increase from period-to-period was primarily attributable to steady performance from the gold and platinum group metals royalties coupled with higher gold and oil and gas prices. The 2004 increase also included distributions received from Canadian Oil Sands Trust.
As of December 31, 2004,2005, Merchant Banking’s Equity Portfolioequity portfolio had a market value of approximately $0.5 billion$940 compared to the 20032004 value of approximately $147 million.$507. In addition to aan unrealized gain of approximately $123.1$344 during 2005, Merchant Banking purchased marketable equity securities of Shore Gold, Gabriel Resources and Miramar Mining for approximately $87, $31 and $27, respectively and sold Kinross equity securities for approximately $111. In addition, Merchant Banking sold Oxiana Resources equity securities for $78, of which, the majority were acquired from the sale of Golden Grove. During 2004, in addition to an unrealized gain of
million during 2004,approximately $123, Merchant Banking purchased marketable equity securities of Canadian Oil Sands Trust and Gabriel Resources, Ltd. for approximately $199.6 million$200 and $19.2 million,$19, respectively. On January 31, 2003, Kinross, Gold Corporation (“Kinross”), Echo Bay Mines Ltd. (“Echo Bay”) and TVX Gold Inc. (“TVX Gold”) were combined, and TVX Gold acquired Newmont’s 49.9% interest in the TVX Newmont Americas joint venture. Under the terms of the combination and acquisition and through the efforts of Merchant Banking, Newmont received a 13.8% interest in the restructured Kinross in exchange for its then 45.67% interest in Echo Bay and $180 million for its interest in TVX Newmont Americas. Newmont recognized a pre-tax gain of $84.3 million$84 on the transaction inGain on investments, net during the first quarter of 2003. During the third quarter of 2003, Newmont sold a portion of its Kinross sharesequity securities for total cash proceeds of $224.6 million$225 and recorded a pre-tax loss on sale of $7.4 million.$7. At June 30, 2004, Newmont recognized a $38.5 million$39 impairment of its investment in Kinross for an other-than-temporary decline in value in accordance with SFAS No. 115, “Accounting for Certain Investments in Debt and Equity Securities.” Merchant Banking sold its 9.74% equity holding in marketable securities of Lihir Gold during 2002 for approximately $84 million, resulting in the recognition of a pre-tax gain of approximately $47.3 million.
Merchant Banking’s royalty interests and equity investments generated $79, $64 and $56 ofRoyalty and dividend income, net in 2005, 2004 and 2003, respectively. The increase from period-to-period was primarily attributable to steady performance from the gold and platinum group metals royalties coupled with higher gold and oil and gas prices. The 2005 and 2004 amounts included distributions received from Canadian Oil Sands Trust.Depreciation, depletion and amortization expense related toRoyalty and dividend income, net was $21, $24 and $26 in 2005, 2004 and 2003, respectively.
Merchant Banking also manages the Company’s interests in downstream gold refining and distribution businesses (40% interest in AGR Matthey Joint Venture (“AGR”) and 50% interest in European Gold Refineries (“EGR”))Refineries). Merchant Banking earned $2.6 million, $0.7 million$4, $2, and $1.3 million$1 inEquity income of affiliatesthrough its investments in AGR and EGR in 2005, 2004 and 2003, and 2002, respectively.
Merchant Banking’s Value Realizationvalue realization activities include managing the reserve delineation program on its 100% owned heavy oil sands leases in Alberta, Canada, and advancing its other interests in coal, iron ore and natural gas.
Merchant Banking provides advisory services to Newmont to assist it in managing its portfolio of operating and property interests. In 2005, Merchant Banking provided assistance in the sale of non-core properties including Golden Grove in Australia, Ovacik in Turkey and Mezcala in Mexico. In 2004, Merchant Banking’s assistance was provided in the sale of non-core properties including Bronzewing in Australia, Perama in Greece and Midwest Uranium in Canada. In addition, Merchant Banking participated in the restructuring of Australian Magnesium Corporation eliminating all remaining Newmont obligations (see Other Investing Activities below). In 2003, Merchant Banking advised Newmont on a variety of transactions including the process of extinguishing the majority of the bond and derivative liabilities of NYOL. These transactions gave rise to aGain on extinguishment of NYOL liabilities, net of $220.5 million net of transaction costs,$221 for the year ended December 31, 2003. Total cash payments to extinguish the NYOL bonds and the NYOL derivatives liabilities (including costs) were $202.1 million$202 during the year ended December 31, 2003.
For the years 2005, 2004 and 2003Other Income attributable to the Merchant Banking Segment was as follows:
| Years Ended December 31, | |||||||||||
| 2005 | 2004 | 2003 | |||||||||
Royalty and dividend income | $ | 79 | $ | 64 | $ | 56 | |||||
Gain (loss) on investments | 54 | (39 | ) | 83 | |||||||
Gain on sale of the Mezcala gold deposit | 31 | — | — | ||||||||
Gain on extinguishment of NYOL liabilities, net | — | — | 221 | ||||||||
Gain (loss) on QMC debt Guarantee | 9 | 11 | (30 | ) | |||||||
Loss on extinguishment of debt | — | — | (34 | ) | |||||||
Other | 1 | 5 | — | ||||||||
| $ | 174 | $ | 41 | $ | 296 | ||||||
Exploration
Exploration researchexpense was $147, $107, and development expenditures were $192.4 million, $115.2 million,$76 for 2005, 2004 and $88.9 million for the years ended December 31, 2004, 2003, and 2002, respectively, of which approximately $112.2 million, $81.5 million and $71.3 million, respectively, related to exploration activities managed by therespectively. Exploration Segment. For the years ended December 31, 2004, 2003 and 2002, approximately $53.9 million, $14.8 million, and $3.6 million, respectively, related to advanced projects (feasibility studies and exploration drilling at Martabe, Akyem, Minas Conga and Ahafo), and approximately $26.3 million, $18.9 million and $14.0 million, respectively, related to research, development and other activities not managed by Newmont’s Exploration Segment.
Exploration expendituresexpense in 2004 reflect2005 reflects higher funding of exploration and related activities by Newmont in response to higher prevailing gold prices. Newmont anticipates it will expense between $155 and $160 on exploration activities in 2006.
During 2004,2005, Newmont replaced approximately 11.38.6 million equity gold ounces of depletion and divestitures with 12.49.4 million equity gold ounces of additions to proven and probable reserves. Exploration activities during 2005 succeeded in converting significant new reserves of which approximately 70% were attributable to Exploration. at Carlin open pits (1.9 million gold ounces), Conga (1.6 million equity gold ounces), Ahafo (1.6 million gold ounces), Akyem (1.1 million equity gold ounces), Yanacocha (1.0 million equity gold ounces), Tanami (0.6 million gold ounces) and Phoenix (0.6 million gold ounces).
Exploration activities during 2004 primarily focused on the Minas Conga depositdistrict in Peru and the Phoenix deposit in Nevada. Newmont added 4.5 million equity gold ounces at Minas Conga and 2.3 million equity gold ounces at Phoenix in 2004. Exploration also focused its activities on Newmont’s two projects in Ghana where reserves increased to 10.6by 3.0 million equity gold ounces at
Ahafo and 5.41.1 million equity gold ounces at Akyem as of December 31, 2004, compared to 7.6 million equity gold ounces and 4.3 million equity gold ounces, respectively, at December 31, 2003. in 2004.
Exploration activities during 2003 primarily focused on the Antonio and Corimayo deposits at Yanacocha,Conga district in Peru, various deposits at the Company’s Nevada and Australian operations and the Ahafo and Akyem projects in Ghana. Newmont anticipates it will spend between approximately $170 million and $200 million on exploration activities in 2005.
Foreign Currency Exchange Rates
In addition to its domestic operations in the United States, Newmont has operations in Australia, New Zealand, Peru, Indonesia, Canada, Uzbekistan, Bolivia and other foreign locations. The Company’s foreign operations sell their gold, copper and zinc production based on U.S. dollar metal prices.
Fluctuations in the local currency exchange rates in relation to the U.S. dollar can increase or decrease profit margins and total cash costs per ounce or poundCosts applicable to sales to the extent costs are paid in local currency at foreign operations. Such fluctuations have not had a material impact on the Company’s revenue since gold copper and zinccopper are sold throughout the world principally in U.S. dollars. Approximately 42%37%, 45%40% and 46%42% of Newmont’s total cash costsCosts applicable to sales were paid in local currencies in 2005, 2004 2003 and 2002,2003, respectively. The Company’s total cash costsCosts applicable to sales are most significantly impacted by variations in the Australian dollar/U.S. dollar exchange rate. However, variations in the Australian dollar/U.S. dollar exchange rate historically have been strongly correlated to variations in the U.S. dollar gold price over the long-term. Increases or decreases in costs at Australian locations due to exchange rate changes have therefore tended to be mitigated by changes in sales reported in U.S. dollars at Australian locations in the Company’s Consolidated Financial Statements.locations. No assurance, however, can be given that the Australian dollar/U.S. dollar exchange rate will continue to be strongly correlated to the U.S. dollar gold price in the future.
The following chart demonstrates the impacts on total cash costs and total cash costs per ounce or pound of variationsVariations in the local currency exchange rates in relation to the U.S. dollar at Newmont’s foreign mining operations during each of the years in the three-year period ended December 31, 2004.
Year ended December 31, 2004:
Operation | Percentage change in average local currency exchange rate; appreciation (devaluation) | Increase (decrease) to total cash costs in U.S. dollars (in thousands) | Increase (decrease) to total cash costs per ounce or pound in U.S. dollars | ||||||||
North America: | |||||||||||
Canada | 7 | % | $ | 4,751 | $ | 21 | |||||
Mexico | (5 | )% | $ | (228 | ) | $ | (3 | ) | |||
Yanacocha (Peru) | 2 | % | $ | 1,046 | $ | 1 | |||||
Other South America (Bolivia) | (2 | )% | $ | (65 | ) | $ | (3 | ) | |||
Australia/New Zealand: | |||||||||||
Gold | 13 | % | $ | 56,577 | $ | 30 | |||||
Base Metals | 13 | % | $ | 7,801 | $ | 0.05 | |||||
Batu Hijau (Indonesia) | |||||||||||
Gold | (5 | )% | $ | (695 | ) | $ | (2 | ) | |||
Copper | (5 | )% | $ | (2,161 | ) | $ | (0.01 | ) | |||
Other Indonesia | (5 | )% | $ | (502 | ) | (7 | ) | ||||
Central Asia: | |||||||||||
Uzbekistan | (5 | )% | $ | (356 | ) | $ | (2 | ) | |||
Turkey | 1 | % | $ | 154 | $ | 1 | |||||
Year ended December 31, 2003:
Operation | Percentage change in average local currency exchange rate; appreciation (devaluation) | Increase (decrease) to total cash costs in U.S. dollars (in thousands) | Increase (decrease) U.S. dollars | ||||||||
North America: | |||||||||||
Canada | 11 | % | $ | 7,648 | $ | 26 | |||||
Mexico | (12 | )% | $ | (464 | ) | $ | (7 | ) | |||
Yanacocha (Peru) | 1 | % | $ | 472 | $ | — | |||||
Other South America (Bolivia) | (8 | )% | $ | (1,103 | ) | $ | (7 | ) | |||
Australia/New Zealand: | |||||||||||
Gold | 17 | % | $ | 81,847 | $ | 41 | |||||
Base Metals | 17 | % | $ | 9,051 | $ | 0.05 | |||||
Other Indonesia | 8 | % | $ | 1,015 | 11 | ||||||
Central Asia: | |||||||||||
Uzbekistan | (26 | )% | $ | (1,166 | ) | $ | (5 | ) | |||
Turkey | 5 | % | $ | 881 | $ | 5 | |||||
Year ended December 31, 2002(1):
Operation | Percentage change in average local currency exchange rate; appreciation (devaluation) | Increase (decrease) to total cash costs in U.S. dollars (000) | Increase (decrease) U.S. dollars | ||||||||
North America: | |||||||||||
Canada | (1 | )% | $ | (949 | ) | $ | (3 | ) | |||
Mexico | (4 | )% | $ | (57 | ) | $ | (1 | ) | |||
Yanacocha (Peru) | — | $ | (84 | ) | $ | — | |||||
Other South America (Bolivia) | (8 | )% | $ | (538 | ) | $ | (2 | ) | |||
Australia/New Zealand: | |||||||||||
Gold | 5 | % | $ | 14,850 | $ | 8 | |||||
Base Metals | 5 | % | $ | 2,851 | $ | 0.02 | |||||
Other Indonesia | 6 | % | $ | 278 | $ | 2 | |||||
Central Asia: | |||||||||||
Uzbekistan | (71 | )% | $ | (2,719 | ) | $ | (11 | ) | |||
Turkey | (24 | )% | $ | (3,602 | ) | $ | (29 | ) | |||
The following chart demonstrates the estimated sensitivity of projected total cash costs and cash costs per ounce or poundincreasedCosts applicable to variations of the local currency exchange rates in relation to the U.S. dollarsales approximately $15 in 2005 assuming a 5% appreciation or devaluation of the local currencyfrom 2004 and $57 in relation to the U.S. dollar and assuming that foreign currency denominated cash costs remain the same as 2004 as a percentage of total cash costs at each site:
Operation | +/– change in total cash costs in U.S. dollars (000) | +/– change in in U.S. dollars | ||||
North America: | ||||||
Canada | $ | 3,701 | $ | 15 | ||
Mexico | $ | 225 | $ | 3 | ||
Yanacocha (Peru) | $ | 2,606 | $ | 2 | ||
Other South America (Bolivia) | $ | 600 | $ | 7 | ||
Australia/New Zealand: | ||||||
Gold | $ | 21,701 | $ | 14 | ||
Base Metals | $ | 3,395 | $ | 0.01 | ||
Batu Hijau (Indonesia) | ||||||
Gold | $ | 910 | $ | 2 | ||
Copper | $ | 2,196 | $ | 0.01 | ||
Central Asia: | ||||||
Uzbekistan | $ | 497 | $ | 3 | ||
In addition, the Company’sEquity income of affiliates varied due to increases or decreasesfrom 2003, primarily in costs from changes in the Indonesian Rupiah in relation to the U.S. dollar at Batu Hijau as follows:Australia.
Year ended December 31, | Percentage change in average local currency exchange rate; appreciation (devaluation) | Additional income (loss) included in equity income (loss) in affiliates, net (000) | ||||
2003 | 8% | $ | (2,974 | ) | ||
2002 | 6% | $ | (1,750 | ) | ||
The Company does not believe that foreignForeign currency exchange rates in relation to the U.S. dollar have not had a material impact on itsthe Company’s determination of proven and probable reserves in the past. However, in the event thatif a sustained weakening of the U.S. dollar in relation to the Australian dollar, and/or to other foreign currencies that impact the Company’s cost structure, were not mitigated by offsetting increases in the U.S. dollar gold price or by other factors, the Company believes that the amount of proven and probable reserves in the applicable foreign country could be reduced as certain proven and probable reserves may no longer be economic. The extent of any such reduction would be dependent on a variety of factors including the length of time of any such weakening of the U.S. dollar, and management’s long-term view of the applicable exchange rate. Future reductions of proven and probable reserves would primarily result in
reduced gold copper or zinccopper sales and increased depreciation, depletion and amortization calculated using the units-of-production method and, depending on the level of reduction, could also result in impairments of property, plant and mine development, mineral interests and/or goodwill.
Recent Accounting Pronouncements
In December 2004, the FASB issued SFAS No. 123R, “Share-Based Payment”,Payment,” which revised SFAS No. 123, “Accounting for Stock-Based Compensation” and supersededCompensation.” SFAS No. 123R will supersede APB Opinion 25, “Accounting for
Stock Issued to Employees” and its related implementation guidance.amend SFAS No. 95, “Statement of Cash Flows.” SFAS No. 123R requires measurement and recording to the financial statements of the costs of employee services received in exchange for an award of equity instruments based on the grant-date fair value of the award, recognized over the period during which an employee is required to provide serviceservices in exchange for such award. Newmont will adoptadopted the provisions of SFAS No. 123R on JulyJanuary 1, 20052006, using the modified prospective application. Accordingly, compensation expense will be recognized for all newly granted awards and awards modified, repurchased, or cancelled after JulyJanuary 1, 2005.2006. Compensation costexpense for the unvested portion of awards that are outstanding as of JulyJanuary 1, 2005 will be recognized ratably over the remaining vesting period. The compensation cost for the unvested portion of awards will be2006, based on the fair value at date of grant as calculated for our pro forma disclosure under SFAS No. 123. The effect on net income and earnings per share123, will be recognized ratably over the remaining vesting period. Additionally, SFAS No. 123R requires the benefits of tax deductions different from recognized compensation expense to be reported as a financing cash flow, rather than as an operating cash flow as required under current literature. Compensation expense in the periods following adoption of SFAS No. 123R are expected to be consistent withmay differ from our pro forma disclosure under SFAS No. 123, except that estimated forfeitures will be consideredbased on changes in the calculationfair value of our common stock, changes in the number of options granted or the terms of such options, the treatment of tax benefits and changes in interest rates, volatilities or other factors. At present FAS 123R compensation expense of between $25 and $30 for 2006 is expected.
In March 2005, the SEC staff issued Staff Accounting Bulletin (“SAB”) No. 107, “Share-Based Payment,” which provides guidance on the interaction between SFAS No. 123R and certain SEC rules and regulations, as well as on the valuation of share-based payments. SAB No. 107 provides interpretive guidance related to valuation methods (including assumptions such as expected volatility and expected term), first time adoption of SFAS No. 123R in an interim period, the classification of compensation expense underand disclosures subsequent to adoption of SFAS No. 123R. Additionally,We are currently evaluating the actualimpact of SAB No. 107 on our consolidated financial statements.
In March 2005, the FASB ratified Emerging Issues Task Force Issue No. 04-6, “Accounting for Stripping Costs Incurred during Production in the Mining Industry,” (EITF 04-6) which addresses the accounting for stripping costs incurred during the production phase of a mine and refers to these costs as variable production costs that should be included as a component of inventory to be recognized inCosts applicable to sales in the same period as the revenue from the sale of inventory. As a result, capitalization of stripping costs is appropriate only to the extent product inventory exists at the end of a reporting period and the carrying value is less than the net realizable value. Newmont will adopt the provisions of EITF 04-6 on January 1, 2006. The most significant impact of adoption is expected to be the removal of deferred and advanced stripping costs from the balance sheet, net of taxes and minority interests, and reclassifying the balances as a cumulative effect adjustment reducing beginning retained earnings by approximately $75 to $85. Adoption of EITF 04-6 will have no impact on net income and earnings per share will vary depending upon the number andCompany’s cash position.
In March 2005, the FASB issued Interpretation 47 (“FIN 47”), “Accounting for Conditional Asset Retirement Obligations”—an interpretation of FASB No. 143. FIN 47 clarifies that the term “conditional asset retirement obligation” as used in SFAS No. 143 refers to a legal obligation to perform an asset retirement activity in which the timing and/or method of settlement are conditional on a future event that may or may not be within the control of the entity. The obligation to perform the asset retirement activity is unconditional even though uncertainty exists about the timing and/or method of settlement. FIN 47 requires a liability to be recognized for
the fair value of options granted in 2005 compared to prior years.
a conditional asset retirement obligation if the fair value of the liability can be reasonably estimated. FIN 47 was effective for fiscal years ending after December 15, 2005. The adoption of FIN 47 did not have a material impact on our consolidated financial position, results of operations or cash flows.
In November 2004,May 2005 the FASB issued SFAS No. 151, “Inventory Costs-an amendment154, “Accounting Changes and Error Corrections.” SFAS No. 154 established new standards on accounting for changes in accounting principles. SFAS No. 154 requires all such changes to be accounted for by retrospective application to the financial statements of ARBprior periods unless prescribed otherwise or it is impracticable to do so. SFAS No. 43, Chapter 4,154 is effective for accounting changes and error corrections made in fiscal years beginning after December 15, 2005. Adoption of SFAS No. 154 is not expected to have a material impact on our consolidated financial position, results of operations or cash flows.
In June 2005, the FASB issued Staff Position Paper (“FSP”) 115-1, “The Meaning of Other-Than-Temporary Impairment and its Application to Certain Investments,” which clarifiessuperseding EITF 03-1. FSP 115-1 will replace the accounting for abnormal amounts of idle facility expense, freight, handling costs and wasted material as current period costs. It also requires that allocations of fixed production overheads to the costs of conversion be basedguidance on the normal capacitydetermination of the production facilities. The Statement applieswhether an investment is other-than-temporarily impaired as set forth in EITF 03-1 with references to inventory costs incurred in the first fiscal yearexisting other-than-temporary impairment guidance. FSP 115-1 is effective for reporting periods beginning after JuneDecember 15, 2005. Newmont hasAdoption of FSP 115-1 is not determined theexpected to have a material impact if any, on the Company’sour consolidated financial position, results of operations or results from operations.
A committee of the Emerging Issues Task Force (“EITF”) discussed the accounting for deferred stripping costs but did not reach a consensus in 2004. The Task Force considered the recommendation that stripping costs incurred during production are a mine development cost that should be capitalized as an investment in the mine and attributed to the proven and probable reserves benefited in a systematic and rational manner. However, the Task Force directed the FASB staff to develop additional guidance about what constitutes a systematic and rational manner of attributing the capitalized costs to proven and probable reserves benefited. The Company cannot predict whether the deliberations of the EITF will ultimately modify or otherwise result in new accounting standards or interpretations thereof that differ from the Company’s current practices.
cash flows.
Liquidity and Capital Resources
For 2004,2005,Net cash provided by operating activitiesfrom continuing operations was $1,556.8 million,$1,253, compared to $684.4 million$1,549 and $684.7 million$645 for 2004 and 2003, respectively, and 2002, respectively.Net cash provided by operating activities was significantly impacted by the following key factors:
| Years Ended December 31, | |||||||||||
| 2004 | 2003 | 2002 | |||||||||
Equity gold ounces sold (in thousands) | 6,988.4 | 7,383.6 | 7,631.7 | ||||||||
Average price received per ounce of gold | $ | 412 | $ | 366 | $ | 313 | |||||
Total cash costs per equity ounce of gold sold | $ | 231 | $ | 203 | $ | 189 | |||||
Equity copper pounds sold (in millions) | 422.3 | 417.7 | 407.0 | ||||||||
Average price received per pound of copper | $ | 1.33 | $ | 0.86 | $ | 0.79 | |||||
Exploration, research and development expenditures (in millions) | $ | 192.4 | $ | 115.2 | $ | 88.9 | |||||
(Use) source of cash flow from changes in operating assets and liabilities (in millions) | $ | (89.3 | ) | $ | (231.9 | ) | $ | 13.3 | |||
| Years Ended December 31, | |||||||||
| 2005 | 2004 | 2003 | |||||||
Consolidated gold ounces sold (in thousands) | 8,552.0 | 8,828.9 | 8,377.4 | ||||||
Average price received per ounce of gold(1) | $ | 441 | $ | 412 | $ | 365 | |||
Costs applicable to sales per ounce of gold sold(2) | $ | 236 | $ | 216 | $ | 195 | |||
Consolidated copper pounds sold (in millions) | 572.7 | 683.3 | N/A | ||||||
Average price received per pound of copper(1) | $ | 1.45 | $ | 1.33 | $ | N/A | |||
Costs applicable to sales per pound of copper sold(2) | $ | 0.53 | $ | 0.45 | $ | N/A | |||
| (1) | Before treatment and refining charges. |
| (2) | Excludes depreciation, depletion and amortization. |
CashNet cash provided from continuing operations decreased 10% in 2005 compared to 2004, impacted by 276,900 fewer gold ounces and 110.6 million fewer copper pounds sold. The reduction in sales volume was offset by higher realized prices before treatment and refining charges.Net cash provided from continuing operations was also impacted by the physical delivery of 161,111 ounces under the Prepaid Forward Sales obligation which resulted in the recognition of $48 of non-cash revenue in 2005. Also impacting operating cash flows during 2005 were higher operating costs, as discussed above in Results of Consolidated Operations, and a $189 increase in inventories, stockpiles and ore on leach pads. Operating cash flow from operations during 2004 compared to 2003 was impacted by the consolidation of Batu Hijau effective January 1, 2004, and higher realized gold and copper prices, partially offset by higher costs at virtually all operations and lower ounces sold in Nevada and Canada. Additionally, cash was used in 2004 to reduce operating accounts payable and reclamation liabilities by $64.0 million and $50.7 million, respectively, partially offset by a decrease
in operating trade and accounts receivable of $50.1 million primarily related to copper concentrate sales. Cash used in 2003 for operating assets and liabilities primarily related to $118.8 million used for early settlement of effective derivative instruments and a temporary build up of inventories at 2003 year end that reduced cash flow from operations by $72.8 million.
Investing Activities
Net cash (used in) provided byused in investing activitieswas $(1.4) billion, $(380.0) million$977, $1,432 and $112.1 million$380 in 2005, 2004 and 2003, and 2002, respectively. Newmont’s primary investing activities arerespectively, with Additions to property, plant and mine development,whichof $1,226, $683 and $484 for continuing operations in 2005, 2004 and 2003, respectively. Additionally, approximately $25, $35 and $21 was spent on capital expenditures for the discontinued operations of Golden Grove and Holloway in 2005, 2004 and 2003, respectively.
Additions to Property, Plant and Mine Development
| Years Ended December 31, | |||||||||
| 2005 | 2004 | 2003 | |||||||
Nevada, USA | $ | 479 | $ | 169 | $ | 112 | |||
Yanacocha, Peru | 225 | 232 | 206 | ||||||
Australia/New Zealand: | |||||||||
Pajingo, Australia | 12 | 11 | 15 | ||||||
Yandal, Australia | 25 | 19 | 17 | ||||||
Tanami, Australia | 19 | 18 | 40 | ||||||
Kalgoorlie, Australia | 12 | 27 | 15 | ||||||
Martha, New Zealand | 11 | 7 | 12 | ||||||
Other, Australia | 19 | 7 | 2 | ||||||
| 98 | 89 | 101 | |||||||
Batu Hijau, Indonesia | 65 | 35 | — | ||||||
Ghana, West Africa: | |||||||||
Ahafo, Ghana | 258 | 83 | 13 | ||||||
Akyem, Ghana | 18 | 9 | 8 | ||||||
| 276 | 92 | 21 | |||||||
Other Operations: | |||||||||
Kori Kollo, Bolivia | 22 | 4 | 1 | ||||||
Zarafshan, Uzbekistan | 6 | 9 | 8 | ||||||
La Herradura, Mexico | 2 | 4 | 3 | ||||||
Ovacik, Turkey | — | 9 | 6 | ||||||
Golden Giant, Canada | — | 2 | — | ||||||
| 30 | 28 | 18 | |||||||
Exploration | — | — | 1 | ||||||
Merchant Banking | 4 | 5 | 2 | ||||||
Corporate and Other | 49 | 33 | 23 | ||||||
| $ | 1,226 | $ | 683 | $ | 484 | ||||
Capital expenditures in Nevada during 2005 included $73 for the development of the Leeville underground mine, $43 for the power plant, $226 for the development of the Phoenix project, and other sustaining capital. Yanacocha capital expenditures included $73 for development and leach pad expansions at La Quinua and process facilities, $12 for environmental projects, $30 for mining equipment and $17 for the Conga project and other sustaining capital. Kori Kollo expenditures reflect investment in new leach pads. Australian capital expenditures included $54 for mine development and $22 for facilities. Expenditures at Batu Hijau included $36 for the purchase of additional mining equipment, $6 for tailings line replacement and $23 for other sustaining capital. Capital expenditures at Ahafo were $718.0 million, $504.5 millionprimarily for the engineering, procurement and $300.1 millionconstruction of the mine and process facilities. Corporate expenditures primarily included information technology systems and land.
Capital expenditures for Nevada during 2004 primarily included $52 for the development of the Leeville underground mine, $26 for the development of the Phoenix Project and $21 for the Mill 5 flotation plant expansion. Yanacocha capital expenditures included $79 for mine and leach pad expansions at the La Quinua and other pits, $33 for environmental site and regional water management projects, $46 for mining equipment and $73 related to other ongoing expansion work. Australia/New Zealand capital expenditures primarily included $54 for mine development and reserve definition, $19 for mining equipment previously leased under an operating lease at Kalgoorlie, $10 for facilities and $7 for mobile equipment. Batu Hijau capital expenditures were primarily for mine and plant equipment. Capital expenditures at Ahafo were primarily for the engineering,
procurement and construction of the mine and processing facilities. Akyem capital expenditures were for development activities. Corporate expenditures included $33 primarily for improvements in information technology systems.
During 2003, capital expenditures for Nevada included $60 for Leeville and 2002, respectively. The increase$11 for the development of the Deep Post and Midas underground mines. Yanacocha capital expenditures included $93 for mine and leach pad development, $24 for environmental site and regional water management projects, $30 for mining equipment and $58 related to other ongoing expansion work. Australia/New Zealand capital expenditures included approximately $51 for mine development and reserve definition and $61 for equipment. Capital expenditures at Akyem and Ahafo were for developmental drilling and other development activities. Corporate expenditures included $15 for improvements in information technology systems.
Newmont expects to spend approximately $1,350 to $1,500 on capital expenditures during 2004 was primarily from2006, before the consideration of the acquisition of an additional 22.22% interest in the Boddington project, with approximately 36% in Nevada, 22% at Yanacocha, 14% at Australia/New Zealand, 17% in Ghana and the remainder at other locations. Approximately 58% of the capital budget is allocated to sustaining investments and the remaining portion is allocated to new project development projects at Nevada and Ahafobusiness improvement initiatives.
In February 2006, Newmont entered into an agreement to acquire Newcrest Mining Limited’s 22.22% interest in Boddington. Consideration for the purchase is A$225 before applicable stamp duty and similar costs. When the transaction closes, Newmont’s interest in Boddington will increase to two-thirds. Closing of the transaction is subject to Australian Foreign Investment Review Board and Western Australia Ministry of Mines approval, expected by April 2006. Estimated capital expenditures for 2006 will increase by $47 as well asa result of the consolidationacquisition of Batu Hijau. SeeNewcrest’s interest in Boddington.
Additions to Property, plant and mine developmentOther Investing Activitiesbelow for more information on capital expenditures.
The Company also invested $1.7 billionhad net investing activity of $57, $(821) and $223 related to investments in marketable debt and equity securities, primarily consisting of $1.5 billion for auction rate securities and $199.6 million for the Canadian Oil Sands Trust investment. Additionally, cash proceeds from the sale of marketable debt and equity investments impacted investing cash flow by $899.1 million, primarily consistingin 2005, 2004 and 2003, respectively.
Marketable debt securities. The Company had net purchases of $894.3 million for$nil, $602 and $183 of auction rate marketable debt securities in 2005, 2004 and 2003, respectively. The Company accounts for these investments as short-term available-for-sale marketable debt securities.
Marketable equity securities. During 2005, the Company purchased marketable equity securities of Shore Gold, Gabriel Resources, Miramar and Miramar warrants for approximately $87, $31, $27 and $10, respectively. During 2004, the Company purchased marketable equity securities of Canadian Oil Sands Trust and Gabriel Resources for $200 and $19, respectively. The Company accounts for these investments as long-term available-for-sale marketable equity securities.
Marketable equity securities of Kinross Gold Corporation. In the third quarter of 2005, Newmont sold its remaining 14 million Kinross shares for cash proceeds of $111 and recorded a net gain of $20. During the third quarter of 2003, Newmont sold approximately 28 million Kinross shares for total cash proceeds of $225 and recorded a net loss of $7.
Marketable equity securities of Oxiana Limited. In the third quarter of 2005, Newmont received approximately 82 million shares of Oxiana Limited (as part of the proceeds for the sale of Golden Grove) with a fair value of $61. These shares were sold in the fourth quarter of 2005 for net proceeds of $78 and a pre-tax gain of $19. In the first quarter of 2005, Newmont sold approximately 10 million shares of Oxiana for net proceeds of $8 and a pre-tax gain of $6.
Sale of Golden Grove. In 2005, the Company sold its Golden Grove copper-zinc operation to Oxiana for cash proceeds of approximately $147 plus 82 million shares of Oxiana.
Sale of Mezcala. On March 31, 2005, the Mezcala gold deposit was sold for cash proceeds of $31.
Sale of Ovacik. On March 1, 2005, the Ovacik operation, located in western Turkey, was sold to a subsidiary of Koza Davetiye, a listed Turkish conglomerate. Consideration included $20 at closing, $10 during the fourth quarter of 2005 and various deferred payments that could total as much as $15.
Sale of Bronzewing. During the third quarter of 2004, Newmont sold assets associated with the closed Bronzewing mine, including certain mining tenements and plant and equipment. In exchange for the assets, the buyer made installment payments in 2005 totaling $3 and assumed all of the reclamation and closure liabilities. Under the agreement, Newmont is entitled to a 1% net smelter return royalty on all future metal production from the property.
Sale of Midwest Uranium. In December 2004, Newmont sold its 20.7% interest in the Midwest Uranium Joint Venture for $10 in cash and marketable equity securities valued at $2.
Perama. In December 2004, two wholly-owned subsidiaries of Newmont completed a sale of their combined 80% interest in Thracean Gold Mining S.A. (“TGM”), which owns the Perama Hill Project located in northeastern Greece to Frontier Pacific Mining Corporation (“Frontier”). The remaining 20% of TGM was held by S&B Industrial Minerals S.A. (“S&B”), which also sold its interest to Frontier in the same transaction. On April 5, 2004, Frontier paid an initial non-refundable deposit of $1 (Newmont’s share was $0.8) and on December 16, 2004, the transaction closed and Frontier paid an additional $11 (Newmont’s share was $9).
Martabe. Newmont acquired its 90% interest in P.T. Newmont Horas Nauli (“PTNHN”), which owns the Martabe project, as part of the auction process. Normandy acquisition in February 2002. In March 2004, the Company signed an agreement to acquire the remaining 10% interest in PTNHN. An initial 5% interest was acquired during the fourth quarter of 2004 and the remaining 5% interest is expected to be purchased in 2006. The purchase price for the 10% interest is $8. The Martabe project is categorized as an asset available for sale.
Australian Magnesium Corporation (“AMC”). During 2004, Newmont entered into an agreement relating to a loan and loan guarantee involving AMC and certain of its subsidiaries. The agreement resulted in the release of Newmont from its guarantee obligation and the release of all previously accrued and contingent liabilities. This transaction resulted in an $11 gain after providing a A$30 ($23) subordinated loan to a subsidiary of QMC. An allowance was provided for 100% of the loan receivable. During 2005, the Company reduced the valuation allowance resulting in a gain of $9.
Pension Funding. Newmont is currently planning to contribute at a minimum, $30, to its retirement benefit programs in 2006 fromNet cash provided by operating activities. For additional discussion see Item 7A, Qualitative Disclosure About Market Risk, Pension and Other Benefit Plans, below, and Note 10 to the Consolidated Financial Statements.
Also impacting cash flows from investing activities for the year ended December 31, 2004 wasis the recognitionconsolidation of $82.2 millionBatu Hijau, effective January 1, 2004, which resulted in the recording of approximately $82 of Batu Hijau’s cash balances in the Company’s balance sheet at January 1, 2004. In 2003 and 2002, the Company engaged in significant acquisition and disposition activity related to the acquisitions of Normandy and Franco-Nevada and the subsequent disposition of investments acquired as part of those acquisitions. The year 2003 included $180.0 million in proceeds from the sale of TVX Newmont Americas and $232.2 million from the sale of Kinross Gold Corporation and other marketable securities; partially offset by $189.4 million investments in marketable debt and equity securities, primarily related to auction rate securities and investments in affiliates of $70.1 million. Additionally, during 2003, $57.6 million was used for the early settlement of ineffective derivative instruments and $11.2 million was used to acquire the Newmont NFM minority interests. Cash from investing activities in 2002 included $404.4 million of proceeds from the sale of marketable securities, $84.0 million of proceeds from the sale of investments and $50.8 million of proceeds from the settlement of cross currency swaps, offset by $90.3 million of net cash consideration for the acquisitions of Normandy and Franco-Nevada. See Investingbalances.
Financing Activities below.
Net cash provided by (used in) provided by financing activitieswas $(475.2) million$38 in 2005, compared to $(475) and $401 in 2004 comparedand 2003, respectively. Proceeds received during 2005 were primarily from the issuance of 30-year 5 7/8% Notes for net proceeds of $582 during March 2005. The proceeds will be used to $400.7 millionfund capital investments, including a 200 megawatt power plant in Nevada, and $(558.9) millionfor general corporate purposes.
Effective January 1, 2004, the Company included Batu Hijau in its Consolidated Financial Statements, increasing debt by $849 to approximately $1,926. During 2004, the Company received proceeds from debt of $56 and made $254 in repayments of debt.
NYOL Debt and Derivatives Liability Extinguishments
During May 2003, Newmont, through an indirect, wholly-owned subsidiary, Yandal Bond Company Limited (“YBCL”), acquired all of NYOL’s outstanding 8 7/8% Senior Notes due 2008 and 2002, respectively. Financing activitiesall of NYOL’s gold hedge contracts from the relevant counterparties. This transaction gave rise to aGain on extinguishment of NYOL liabilities, net of $221, net of transaction costs, for the year ended December 31, 2004 primarily consisted2003. Total cash payments to extinguish the NYOL liabilities (including costs) was $202 during the year ended December 31, 2003.
Other Debt Extinguishments
During 2003, Newmont extinguished the following debt instruments: $148 of $253.7 millionits 8 3/8% debentures resulting in aLoss on extinguishment of debt repayments offset by proceedsof $11; $52 of its 8 5/8% debentures resulting in aLoss on extinguishment of debtof $12; $31 of its 7 5/8% guaranteed notes resulting in aLoss on extinguishment of debt of $4; $81 of its 7 1/2% guaranteed notes resulting in a Loss on extinguishment of debt $6; and $100 in aggregate principal of its 6% convertible subordinated debentures.
Corporate Revolving Credit Facilities
Through July 29, 2004, the Company had three uncollateralized revolving credit facilities with a consortium of banks: a $200 U.S. dollar-denominated revolving credit facility with an initial term of 364 days that was permitted to be extended annually to no later than October 2006; a $400 multi-currency revolving credit facility that matured in October 2006 and provided for borrowing in U.S., Canadian and Australian dollars, and which also contained a letter of credit sub-facility; and a $150 multi-currency revolving credit facility that was to mature in May 2005 and provided for borrowing in U.S. and Australian dollars. Interest rates and facility fees varied based on the credit ratings of the Company’s senior, uncollateralized, long-term debt. Borrowings under the facilities bore interest at a rate per annum equa1 to either the LIBOR plus a margin ranging from debt0.45% to 1.25% or the greater of the federal funds rate plus 0.5% or the lead bank’s prime rate plus a margin ranging from 0% to 0.25%. Facility fees were accrued at a rate per annum ranging from 0.10% to 0.40% of the commitment.
Effective July 30, 2004, the Company entered into a new uncollateralized $1,250 revolving credit facility with a syndicate of commercial banks. This revolving credit facility replaced the three existing revolving credit facilities which were cancelled upon the effectiveness of the new facility. The facility provides for borrowings in U.S. dollars and stock issuances totaling $55.9 millioncontains a letter of credit sub-facility. In July 2005, the Company amended its revolving credit facility, extending the final maturity one year, to July 28, 2010. In addition, certain adjustments to pricing and $77.5 million, respectively.structure were also made. Interest rates and facility fees vary based on the credit ratings of the Company’s senior, uncollateralized, long-term debt. Borrowings under the facilities bear interest at a rate per annum equal to either LIBOR plus a margin ranging from 0.22% to 1.00% or the greater of the federal funds rate plus 0.5% or the lead bank’s prime. Facility fees accrue at a rate per annum ranging from 0.080% to 0.250% of the aggregate commitments. The Company also pays a utilization fee of 0.10% on the amount of revolving credit loans and letters of credit outstanding under the facility for each day on which the sum of such loans and letters of credit exceed 50% of the commitments under the facility. At December 31, 2005, the facility fees were 0.09% of the commitment. There was $275 outstanding under the letter of credit sub-facility as of December 31, 2005.
Prepaid Forward Sales Contract
Under the prepaid forward gold sales contract (the “Prepaid Forward”) and forward gold purchase contract (the “Forward Purchase”) the Company is obligated to sell 322,222 ounces of gold, to be delivered in June of 2006 and 2007 in annual installments of 161,111 ounces and to deliver 17,951 ounces of gold in June and December of 2006 and June of 2007. The Forward Purchase provides for purchases of 17,951 ounces of gold on each delivery date under the Prepaid Forward at an average of $344 per ounce in 2006 and $354 per ounce in 2007.
The Company may also be entitled to receive additional proceeds in connection with the annual deliveries of 161,111 ounces, to be determined at each delivery date based on the excess, if any, of the then market price for gold (up to a maximum of $380 per ounce) over $300 per ounce. During June 2005, 161,111 ounces were delivered in connection with the first annual delivery, resulting in a non-cash reduction in debt of $48. Remaining scheduled repayments are $48 in 2006 and 2007. Using relevant future market conditions and financial models, the estimated negative fair value of these contracts was approximately $159 and $205 at December 31, 2005 and 2004, respectively.
Debt Covenants
Certain of Newmont’s current debt facilities contain various common public debt covenants and default provisions including payment defaults, limitation on liens, limitation on sales and leaseback agreements and merger restrictions. These debt instruments include the 5 7/8% notes, Newmont Australia 7 5/8% notes, 8 5/8% debentures, and sale-leaseback of the refractory ore treatment plant. None of the aforementioned public debt instruments contain financial ratio covenants or credit rating provisions that could create liquidity issues for the Company.
In addition to the covenants noted above, the revolving credit facility contains financial ratio covenants requiring the Company to maintain a net debt (total debt net of cash) to EBITDA (Earnings before interest expense, income taxes, depreciation and amortization) ratio of less than or equal to 4.0 and a net debt to total capitalization ratio (ratio of net debt to total capitalization, which includes owner’s equity retained earnings and fixed assets) of less than or equal to 62.5%. Furthermore, the revolving credit facility contains covenants limiting the sale of all or substantially all of the Company’s assets and a negative pledge on certain assets.
Certain of the Company’s project debt facilities contain various common project debt covenants and default provisions including limitations on dividends subject to certain debt service cover ratios, limitations on sales of assets, negative pledges on certain assets, change of control provisions and limitations of additional permitted debt.
At December 31, 2005, the Company and its subsidiaries were in compliance with all debt covenants and default provisions.
Scheduled Debt Payments
During the year ended December 31, 2005, the Company made scheduled cash debt repayments of $218 and a scheduled non-cash debt repayment of $48 for the Prepaid Forward.
Scheduled minimum debt repayments are $196 in 2006, $162 in 2007, $232 in 2008, $114 in 2009, $113 in 2010 and $1,112 thereafter. Newmont expects to be able to fund maturities of its debt fromNet cash provided by operating activities and existing cash balances.
Shelf Registration Statement
In January 2004, Newmont filed with the Securities and Exchange Commission a shelf registration statement on Form S-3 which enables it to issue debt and equity securities from time-to-time having an aggregate offering price up to $1,000. Newmont also filed a shelf registration statement on Form S-4 which enables it to issue, from time-to-time in connection with acquisitions of businesses, properties or assets, common stock and common stock warrants having an aggregate offering price of $200. These registration statements were declared effective on February 4, 2004.
Common Stock Offering
During November 2003, Newmont completed an equity offering for 25 million shares of its common stock under its then existing shelf registration statement filed with the Securities and Exchange Commission. The proceeds of approximately $1,027 from this offering were used $236.9 millionfor general corporate purposes. This was the only public offering during the last three years.
Dividends
The Company paid dividends of $0.40 per common share during 2005, $0.30 per common share during 2004, and $0.17 per common share during 2003. Additionally, Newmont Mining Corporation of Canada Limited, a subsidiary of the Company, paid dividends of CDN$0.49, CDN$0.38 and CDN$0.25 during 2005, 2004 and 2003, respectively. On February 24, 2006, the Company declared a regular quarterly dividend of $0.10 per share, payable March 29, 2006 to payholders of record at the close of business on March 8, 2006. The total paid to common stockholders was $179, $133 and $71 for 2005, 2004 and 2003, respectively.
The Company also paid dividends of $186, $237 and $146 to minority interests during 2005, 2004 compared to $146.0 million and $28.8 million in 2003, and 2002, respectively. The increase in dividends paid to minority interests was due to the consolidation of Batu Hijau, which had minority interest dividends of approximately $100.7 million during 2004. Additionally, $133.3 million was used to pay dividends to common stockholders during 2004, which increased to $0.30 per common share in 2004 from $0.17 per common share in 2003. The increase in cash from financing activities in 2003 was primarily related to approximately $1.0 billion in proceeds from the issuance of 25 million shares of the Company’s common stock, proceeds of $492.8 million from borrowings under the Company’s credit facilities, $162.5 million of proceeds from the issuance of common stock on the exercise of Franco-Nevada Class B warrants and $96.8 million of proceeds from the issuance of common stock related to stock compensation plans, partially offset by $1.2 billion of debt repayments and $70.8 million of cash paid for dividends on common and preferred stock. Financing activities in 2002 included repayments of approximately $1.0 billion of debt partially offset by draw-downs on the Company’s credit facilities of $493.4 million. See Financing Activities, below.
Contractual Obligations
Newmont’s contractual obligations at December 31, 20042005 are summarized as follows:
| Payments Due by Period | Payments Due by Period | |||||||||||||||||||||||||||||
Contractual Obligations | Total | Less than 1 Year | 1-3 Years | 3-5 Years | More than 5 Years | Total | Less than 1 Year | 1-3 Years | 3-5 Years | More than 5 Years | ||||||||||||||||||||
| (unaudited, in millions) | ||||||||||||||||||||||||||||||
Debt(1) | $ | 1,791.7 | $ | 398.7 | $ | 768.9 | $ | 243.4 | $ | 380.7 | $ | 2,974 | $ | 282 | $ | 680 | $ | 475 | $ | 1,537 | ||||||||||
Capital lease obligations(1) | 394.4 | 32.6 | 110.6 | 76.4 | 174.8 | 362 | 37 | 106 | 68 | 151 | ||||||||||||||||||||
Remediation and reclamation obligations(2) | 749.9 | 65.7 | 190.5 | 90.4 | 403.3 | 788 | 66 | 133 | 70 | 519 | ||||||||||||||||||||
Other long-term liabilities(3) | 122.2 | 17.9 | 40.2 | 21.7 | 42.4 | |||||||||||||||||||||||||
Employee-related benefits(3) | 386 | 76 | 126 | 35 | 149 | |||||||||||||||||||||||||
Operating leases | 24.4 | 4.2 | 11.2 | 5.7 | 3.3 | 21 | 4 | 11 | 5 | 1 | ||||||||||||||||||||
Minimum royalty payments | 27.5 | 10.2 | 6.9 | — | 10.4 | 134 | 6 | 54 | 22 | 52 | ||||||||||||||||||||
Purchase obligations(4) | 203.0 | 158.3 | 27.8 | 11.9 | 5.0 | 429 | 150 | 211 | 52 | 16 | ||||||||||||||||||||
Other(5) | 121.8 | 106.8 | 7.1 | 2.1 | 5.8 | 344 | 163 | 149 | 14 | 18 | ||||||||||||||||||||
| $ | 3,434.9 | $ | 794.4 | $ | 1,163.2 | $ | 451.6 | $ | 1,025.7 | $ | 5,438 | $ | 784 | $ | 1,470 | $ | 741 | $ | 2,443 | |||||||||||
| (1) | Amounts represent principal and estimated interest payments assuming no early extinguishment. |
| (2) | Mining operations are subject to extensive environmental regulations in the jurisdictions in which they operate. Pursuant to environmental regulations, the Company is required to close its operations and reclaim and remediate the lands that operations have disturbed. The estimated undiscounted cash outflows of these remediation and reclamation obligations are reflected here. For more information regarding remediation and reclamation liabilities, see Note |
| (3) | Contractual obligations for |
| (4) | Purchase obligations are not recorded in the Consolidated Financial Statements. Purchase obligations represent contractual obligations for purchase of power, materials and supplies, consumables, inventories and capital projects. |
| (5) | Other contractual obligations that are not reflected in the Company’s Consolidated Financial Statements include labor and service contracts. Payments related to derivative contracts cannot be reasonably estimated given variable market conditions. See Note 21 to the Consolidated Financial Statements. |
Off-Balance Sheet Arrangements
The Company has the following off-balance sheet arrangements: operating leases as disclosed in the above table and $357.2 million$386 of outstanding letters of credit, surety bonds and bank guarantees (see Note 119 to the Consolidated Financial Statements). NewmontThere is also provides an undrawn contingent sponsor support line of credit to Batu Hijau of $65, million.of which Newmont’s pro rata share is $37.
Batu Hijau has sales agreements to sell copper concentrates as follows (in thousandsmillions of metric tons): 930 in 2005; 685pounds) 1,614 in 2006; 6501,362 in 2007; 6251,378 in 20082008; 1,389 in 2009; 1,389 in 2010 and 2009; and 2,7254,167 thereafter. For information regarding these copper sales agreements, see Item 7A, Quantitative and Qualitative Disclosures about Market Risk-Hedging, Provisional Copper and Gold Sales, below.
Future Cash FlowsOther Investing Activities
The Company expectshad net investing activity of $57, $(821) and $223 related to useinvestments in and proceeds from the sale of marketable debt and equity investments in 2005, 2004 and 2003, respectively.
Marketable debt securities. The Company had net purchases of $nil, $602 and $183 of auction rate marketable debt securities in 2005, 2004 and 2003, respectively. The Company accounts for these investments as short-term available-for-sale marketable debt securities.
Marketable equity securities. During 2005, the Company purchased marketable equity securities of Shore Gold, Gabriel Resources, Miramar and Miramar warrants for approximately $87, $31, $27 and $10, respectively. During 2004, the Company purchased marketable equity securities of Canadian Oil Sands Trust and Gabriel Resources for $200 and $19, respectively. The Company accounts for these investments as long-term available-for-sale marketable equity securities.
Marketable equity securities of Kinross Gold Corporation. In the third quarter of 2005, Newmont sold its remaining 14 million Kinross shares for cash proceeds of $111 and recorded a net gain of $20. During the third quarter of 2003, Newmont sold approximately 28 million Kinross shares for capital expenditures (see Investing Activities, below),total cash proceeds of $225 and recorded a net loss of $7.
Marketable equity securities of Oxiana Limited. In the third quarter of 2005, Newmont received approximately 82 million shares of Oxiana Limited (as part of the proceeds for the sale of Golden Grove) with a fair value of $61. These shares were sold in the fourth quarter of 2005 for net proceeds of $78 and a pre-tax gain of $19. In the first quarter of 2005, Newmont sold approximately 10 million shares of Oxiana for net proceeds of $8 and a pre-tax gain of $6.
Sale of Golden Grove. In 2005, the Company sold its Golden Grove copper-zinc operation to fund the Exploration and Merchant Banking Segments (see ResultsOxiana for cash proceeds of Operations, above) and to service debt. For information on the Company’s long-term debt, capital lease obligations and operating leases, see Note 11 to theapproximately $147 plus 82 million shares of Oxiana.
Consolidated Financial Statements.Sale of Mezcala. On March 31, 2005, the Mezcala gold deposit was sold for cash proceeds of $31.
Sale of Ovacik. On March 1, 2005, the Ovacik operation, located in western Turkey, was sold to a subsidiary of Koza Davetiye, a listed Turkish conglomerate. Consideration included $20 at closing, $10 during the fourth quarter of 2005 and various deferred payments that could total as much as $15.
Sale of Bronzewing. During the third quarter of 2004, Newmont believes it willsold assets associated with the closed Bronzewing mine, including certain mining tenements and plant and equipment. In exchange for the assets, the buyer made installment payments in 2005 totaling $3 and assumed all of the reclamation and closure liabilities. Under the agreement, Newmont is entitled to a 1% net smelter return royalty on all future metal production from the property.
Sale of Midwest Uranium. In December 2004, Newmont sold its 20.7% interest in the Midwest Uranium Joint Venture for $10 in cash and marketable equity securities valued at $2.
Perama. In December 2004, two wholly-owned subsidiaries of Newmont completed a sale of their combined 80% interest in Thracean Gold Mining S.A. (“TGM”), which owns the Perama Hill Project located in northeastern Greece to Frontier Pacific Mining Corporation (“Frontier”). The remaining 20% of TGM was held by S&B Industrial Minerals S.A. (“S&B”), which also sold its interest to Frontier in the same transaction. On April 5, 2004, Frontier paid an initial non-refundable deposit of $1 (Newmont’s share was $0.8) and on December 16, 2004, the transaction closed and Frontier paid an additional $11 (Newmont’s share was $9).
Martabe. Newmont acquired its 90% interest in P.T. Newmont Horas Nauli (“PTNHN”), which owns the Martabe project, as part of the Normandy acquisition in February 2002. In March 2004, the Company signed an agreement to acquire the remaining 10% interest in PTNHN. An initial 5% interest was acquired during the fourth quarter of 2004 and the remaining 5% interest is expected to be ablepurchased in 2006. The purchase price for the 10% interest is $8. The Martabe project is categorized as an asset available for sale.
Australian Magnesium Corporation (“AMC”). During 2004, Newmont entered into an agreement relating to funda loan and loan guarantee involving AMC and certain of its subsidiaries. The agreement resulted in the release of Newmont from its guarantee obligation and the release of all existing obligationspreviously accrued and contingent liabilities. This transaction resulted in an $11 gain after providing a A$30 ($23) subordinated loan to a subsidiary of QMC. An allowance was provided for 100% of the loan receivable. During 2005, the Company reduced the valuation allowance resulting in a gain of $9.
Pension Funding. Newmont is currently planning to contribute at a minimum, $30, to its retirement benefit programs in 2006 from eitherNet cash provided by operating activities or. For additional discussion see Item 7A, Qualitative Disclosure About Market Risk, Pension and Other Benefit Plans, below, and Note 10 to the Consolidated Financial Statements.
Also impacting cash and marketable debt securities on hand. Subject to any significant adverse changesflows from investing activities for the year ended December 31, 2004 is the consolidation of Batu Hijau, effective January 1, 2004, which resulted in the recording of approximately $82 of Batu Hijau’s cash balances.
Financing Activities
Net cash provided by (used in) financing activitieswas $38 in 2005, compared to $(475) and $401 in 2004 and 2003, respectively. Proceeds received during 2005 were primarily from the issuance of 30-year 5 7/8% Notes for net proceeds of $582 during March 2005. The proceeds will be used to fund capital investments, including a 200 megawatt power plant in Nevada, and for general corporate purposes.
Effective January 1, 2004, the Company included Batu Hijau in its Consolidated Financial Statements, increasing debt by $849 to approximately $1,926. During 2004, the Company received proceeds from debt of $56 and made $254 in repayments of debt.
NYOL Debt and Derivatives Liability Extinguishments
During May 2003, Newmont, through an indirect, wholly-owned subsidiary, Yandal Bond Company Limited (“YBCL”), acquired all of NYOL’s outstanding 8 7/8% Senior Notes due 2008 and all of NYOL’s gold hedge contracts from the relevant counterparties. This transaction gave rise to aGain on extinguishment of NYOL liabilities, net of $221, net of transaction costs, for the year ended December 31, 2003. Total cash payments to extinguish the NYOL liabilities (including costs) was $202 during the year ended December 31, 2003.
Other Debt Extinguishments
During 2003, Newmont extinguished the following debt instruments: $148 of its 8 3/8% debentures resulting in aLoss on extinguishment of debtof $11; $52 of its 8 5/8% debentures resulting in aLoss on extinguishment of debtof $12; $31 of its 7 5/8% guaranteed notes resulting in aLoss on extinguishment of debt of $4; $81 of its 7 1/2% guaranteed notes resulting in a Loss on extinguishment of debt $6; and $100 in aggregate principal of its 6% convertible subordinated debentures.
Corporate Revolving Credit Facilities
Through July 29, 2004, the Company had three uncollateralized revolving credit facilities with a consortium of banks: a $200 U.S. dollar-denominated revolving credit facility with an initial term of 364 days that was permitted to be extended annually to no later than October 2006; a $400 multi-currency revolving credit facility that matured in October 2006 and provided for borrowing in U.S., Canadian and Australian dollars, and which also contained a letter of credit sub-facility; and a $150 multi-currency revolving credit facility that was to mature in May 2005 and provided for borrowing in U.S. and Australian dollars. Interest rates and facility fees varied based on the credit ratings of the Company’s senior, uncollateralized, long-term viewdebt. Borrowings under the facilities bore interest at a rate per annum equa1 to either the LIBOR plus a margin ranging from 0.45% to 1.25% or the greater of the federal funds rate plus 0.5% or the lead bank’s prime rate plus a margin ranging from 0% to 0.25%. Facility fees were accrued at a rate per annum ranging from 0.10% to 0.40% of the commitment.
Effective July 30, 2004, the Company entered into a new uncollateralized $1,250 revolving credit facility with a syndicate of commercial banks. This revolving credit facility replaced the three existing revolving credit facilities which were cancelled upon the effectiveness of the new facility. The facility provides for borrowings in U.S. dollars and contains a letter of credit sub-facility. In July 2005, the Company amended its revolving credit facility, extending the final maturity one year, to July 28, 2010. In addition, certain adjustments to pricing and structure were also made. Interest rates and facility fees vary based on the credit ratings of the Company’s senior, uncollateralized, long-term debt. Borrowings under the facilities bear interest at a rate per annum equal to either LIBOR plus a margin ranging from 0.22% to 1.00% or the greater of the federal funds rate plus 0.5% or the lead bank’s prime. Facility fees accrue at a rate per annum ranging from 0.080% to 0.250% of the aggregate commitments. The Company also pays a utilization fee of 0.10% on the amount of revolving credit loans and letters of credit outstanding under the facility for each day on which the sum of such loans and letters of credit exceed 50% of the commitments under the facility. At December 31, 2005, the facility fees were 0.09% of the commitment. There was $275 outstanding under the letter of credit sub-facility as of December 31, 2005.
Prepaid Forward Sales Contract
Under the prepaid forward gold sales contract (the “Prepaid Forward”) and forward gold purchase contract (the “Forward Purchase”) the Company is obligated to sell 322,222 ounces of gold, to be delivered in June of 2006 and copper prices,2007 in annual installments of 161,111 ounces and to deliver 17,951 ounces of gold in June and December of 2006 and June of 2007. The Forward Purchase provides for purchases of 17,951 ounces of gold on each delivery date under the Prepaid Forward at an average of $344 per ounce in 2006 and $354 per ounce in 2007.
The Company may also be entitled to receive additional proceeds in connection with the annual deliveries of 161,111 ounces, to be determined at each delivery date based on the excess, if any, of the then market price for gold (up to a maximum of $380 per ounce) over $300 per ounce. During June 2005, 161,111 ounces were delivered in connection with the first annual delivery, resulting in a non-cash reduction in debt of $48. Remaining scheduled repayments are $48 in 2006 and 2007. Using relevant future market conditions and financial models, the estimated negative fair value of these contracts was approximately $159 and $205 at December 31, 2005 and 2004, respectively.
Debt Covenants
Certain of Newmont’s current debt facilities contain various common public debt covenants and default provisions including payment defaults, limitation on liens, limitation on sales and leaseback agreements and merger restrictions. These debt instruments include the 5 7/8% notes, Newmont Australia 7 5/8% notes, 8 5/8% debentures, and sale-leaseback of the refractory ore treatment plant. None of the aforementioned public debt instruments contain financial ratio covenants or credit rating provisions that could create liquidity issues for the Company.
In addition to the covenants noted above, the revolving credit facility contains financial ratio covenants requiring the Company has bothto maintain a net debt (total debt net of cash) to EBITDA (Earnings before interest expense, income taxes, depreciation and amortization) ratio of less than or equal to 4.0 and a net debt to total capitalization ratio (ratio of net debt to total capitalization, which includes owner’s equity retained earnings and fixed assets) of less than or equal to 62.5%. Furthermore, the abilityrevolving credit facility contains covenants limiting the sale of all or substantially all of the Company’s assets and intentiona negative pledge on certain assets.
Certain of the Company’s project debt facilities contain various common project debt covenants and default provisions including limitations on dividends subject to certain debt service cover ratios, limitations on sales of assets, negative pledges on certain assets, change of control provisions and limitations of additional permitted debt.
At December 31, 2005, the Company and its subsidiaries were in compliance with all debt covenants and default provisions.
Scheduled Debt Payments
During the year ended December 31, 2005, the Company made scheduled cash debt repayments of $218 and a scheduled non-cash debt repayment of $48 for the Prepaid Forward.
Scheduled minimum debt repayments are $196 in 2006, $162 in 2007, $232 in 2008, $114 in 2009, $113 in 2010 and $1,112 thereafter. Newmont expects to be able to fund maturities of its debt fromNet cash provided by operating activities and existing cash balances.
Shelf Registration Statement
In January 2004, Newmont filed with the exploration expendituresSecurities and Merchant Banking investments thatExchange Commission a shelf registration statement on Form S-3 which enables it to issue debt and equity securities from time-to-time having an aggregate offering price up to $1,000. Newmont also filed a shelf registration statement on Form S-4 which enables it to issue, from time-to-time in connection with acquisitions of businesses, properties or assets, common stock and common stock warrants having an aggregate offering price of $200. These registration statements were assumed indeclared effective on February 4, 2004.
Common Stock Offering
During November 2003, Newmont completed an equity offering for 25 million shares of its common stock under its then existing shelf registration statement filed with the valuations performed to allocate goodwill toSecurities and Exchange Commission. The proceeds of approximately $1,027 from this offering were used for general corporate purposes. This was the Explorationonly public offering during the last three years.
Dividends
The Company paid dividends of $0.40 per common share during 2005, $0.30 per common share during 2004, and Merchant Banking Segments as part$0.17 per common share during 2003. Additionally, Newmont Mining Corporation of Canada Limited, a subsidiary of the purchase accountingCompany, paid dividends of CDN$0.49, CDN$0.38 and CDN$0.25 during 2005, 2004 and 2003, respectively. On February 24, 2006, the Company declared a regular quarterly dividend of $0.10 per share, payable March 29, 2006 to holders of record at the close of business on March 8, 2006. The total paid to common stockholders was $179, $133 and $71 for the acquisitions of Normandy2005, 2004 and Franco-Nevada (see Critical Accounting Policies, above). 2003, respectively.
The Company believes it will be ablealso paid dividends of $186, $237 and $146 to raise fundsminority interests during 2005, 2004 and 2003, respectively.
Contractual Obligations
Newmont’s contractual obligations at December 31, 2005 are summarized as needed in the future as opportunities for expansion arise.follows:
| Payments Due by Period | |||||||||||||||
Contractual Obligations | Total | Less than 1 Year | 1-3 Years | 3-5 Years | More than 5 Years | ||||||||||
Debt(1) | $ | 2,974 | $ | 282 | $ | 680 | $ | 475 | $ | 1,537 | |||||
Capital lease obligations(1) | 362 | 37 | 106 | 68 | 151 | ||||||||||
Remediation and reclamation obligations(2) | 788 | 66 | 133 | 70 | 519 | ||||||||||
Employee-related benefits(3) | 386 | 76 | 126 | 35 | 149 | ||||||||||
Operating leases | 21 | 4 | 11 | 5 | 1 | ||||||||||
Minimum royalty payments | 134 | 6 | 54 | 22 | 52 | ||||||||||
Purchase obligations(4) | 429 | 150 | 211 | 52 | 16 | ||||||||||
Other(5) | 344 | 163 | 149 | 14 | 18 | ||||||||||
| $ | 5,438 | $ | 784 | $ | 1,470 | $ | 741 | $ | 2,443 | ||||||
| (1) | Amounts represent principal and estimated interest payments assuming no early extinguishment. |
| (2) | Mining operations are subject to extensive environmental regulations in the jurisdictions in which they operate. Pursuant to environmental regulations, the Company is required to close its operations and reclaim and remediate the lands that operations have disturbed. The estimated undiscounted cash outflows of these remediation and reclamation obligations are reflected here. For more information regarding remediation and reclamation liabilities, see Note 13 to the Consolidated Financial Statements. |
| (3) | Contractual obligations forEmployee-related benefits include severance, pension funding and other benefit plans. Pension plan funding beyond 2010 cannot be reasonably estimated given variable market conditions and actuarial assumptions and are not included. |
| (4) | Purchase obligations are not recorded in the Consolidated Financial Statements. Purchase obligations represent contractual obligations for purchase of power, materials and supplies, consumables, inventories and capital projects. |
| (5) | Other contractual obligations that are not reflected in the Company’s Consolidated Financial Statements include labor and service contracts. Payments related to derivative contracts cannot be reasonably estimated given variable market conditions. See Note 21 to the Consolidated Financial Statements. |
Newmont’s cash flows are expected to be impacted by variations in the spot price of gold and copper. Off-Balance Sheet Arrangements
The Company has a seriesthe following off-balance sheet arrangements: operating leases as disclosed in the above table and $386 of price-capped goldoutstanding letters of credit, surety bonds and bank guarantees (see Note 9 to the Consolidated Financial Statements). There is also an undrawn contingent sponsor support line of credit to Batu Hijau of $65, of which Newmont’s pro rata share is $37.
Batu Hijau has sales contracts under which it will realize the loweragreements to sell copper concentrates as follows (in millions of the spot price on the delivery date or the capped price ranging from $350 per ouncepounds) 1,614 in 2005 to $392 per ounce2006; 1,362 in 2011. The Company also has copper collar contracts for 580.9 million pounds of copper under which it will realize a minimum2007; 1,378 in 2008; 1,389 in 2009; 1,389 in 2010 and maximum price of $1.10 and $1.30 per pound, respectively, in 2005 through 2007.4,167 thereafter. For information on the sensitivity of Newmont’sNet cash provided by operating activities to metal prices,regarding these copper sales agreements, see Item 7A, Quantitative and Qualitative Disclosures about Market Risk.
Cash flows are also expected to be impacted by variations in foreign currency exchange rates in relation to the U.S. dollar, particularly with respect to the Australian dollar. For information concerning the sensitivity of the Company’s cash costs to changes in foreign currency exchange rates, see Results of Operations, Foreign Currency Exchange Rates, above. The Company has entered into Australian dollar net zero-cost collar contracts under which it will purchase Australian dollars at a minimum average floor price of $0.568Risk-Hedging, Provisional Copper and average maximum cap price of $0.783 per Australian dollar in 2005 and 2006. For information on the sensitivity of Newmont’sNet cash provided to operating activities to foreign currency exchange rates, see Item 7A, Quantitative and Qualitative Disclosures about Market Risk.
Based on Newmont’s production profile for the next three years and proven and probable reserves at December 31, 2004, without considering future additions to such reserves, Newmont expects that equity ounces sold in 2005, 2006 and 2007 will be between 6.5 and 7.0 million equity ounces. The Company does not anticipate that reasonably expected variations in gold or copper sales alone will influence its ability to pay its debt and other obligations over that period.
Gold Sales, below.
Additions to Property, Plant and Mine Development
| Years Ended December 31, | |||||||||
| 2004 | 2003 | 2002 | |||||||
| (in millions) | |||||||||
North America: | |||||||||
Nevada, USA | $ | 168.7 | $ | 111.9 | $ | 54.6 | |||
Golden Giant, Canada | 1.8 | 0.3 | 6.6 | ||||||
Holloway, Canada | 5.2 | 2.8 | 1.2 | ||||||
La Herradura, Mexico | 4.3 | 2.7 | 1.4 | ||||||
| 180.0 | 117.7 | 63.8 | |||||||
South America: | |||||||||
Yanacocha, Peru | 231.9 | 205.7 | 146.2 | ||||||
Kori Kollo, Bolivia | 4.4 | 0.9 | 0.6 | ||||||
| 236.3 | 206.6 | 146.8 | |||||||
Australia/New Zealand: | |||||||||
Pajingo, Australia | 11.0 | 15.1 | 10.2 | ||||||
Yandal, Australia | 19.5 | 17.4 | 20.7 | ||||||
Tanami, Australia | 18.2 | 39.7 | 10.5 | ||||||
Kalgoorlie, Australia | 27.2 | 14.9 | 8.6 | ||||||
Martha, New Zealand | 6.6 | 12.3 | 5.3 | ||||||
Golden Grove, Australia | 30.1 | 17.5 | 10.7 | ||||||
Other, Australia | 6.9 | 2.3 | 2.8 | ||||||
| 119.5 | 119.2 | 68.8 | |||||||
Indonesia: | |||||||||
Batu Hijau | 34.6 | N/A | N/A | ||||||
Central Asia: | |||||||||
Zarafshan, Uzbekistan | 9.3 | 7.7 | 3.9 | ||||||
Ovacik, Turkey | 8.5 | 6.5 | 4.0 | ||||||
| 17.8 | 14.2 | 7.9 | |||||||
Africa: | |||||||||
Akyem, Ghana | 8.9 | 7.8 | — | ||||||
Ahafo, Ghana | 83.4 | 12.9 | — | ||||||
| 92.3 | 20.7 | — | |||||||
Corporate and Other | 37.5 | 26.1 | 12.8 | ||||||
| $ | 718.0 | $ | 504.5 | $ | 300.1 | ||||
Capital expenditures for North American operations during 2004 primarily included $51.6 million for the development of the Leeville underground mine, $26.2 million for the development of the Phoenix Project and $20.9 million for the Mill 5 flotation plant expansion. South American capital expenditures were primarily at Yanacocha, with approximately $79.4 million for mine and leach pad expansions at the La Quinua and Yanacocha pits, $33.4 million for environmental site and regional water management projects, $46.0 million for mining equipment and $73.1 million related to other ongoing expansion work. Australia/New Zealand capital expenditures primarily included $54.0 million for mine development and reserve definition, $19.0 million for mining equipment previously leased under an operating lease at Kalgoorlie, $10.1 million for facilities and $6.6 million for mobile equipment. Batu Hijau capital expenditures were primarily for mine and plant equipment.
Capital expenditures at Ahafo were primarily for the engineering, procurement and construction of the mine and processing facilities. Akyem capital expenditures were for development activities. Corporate expenditures included $32.9 million primarily for improvements in information technology systems.
During 2003, capital expenditures for North American operations included $60.4 million for Leeville and $11.3 million for the development of the Deep Post and Midas underground mines. South American capital expenditures were primarily at Yanacocha, with approximately $93.2 million for mine and leach pad development, $24.4 million for environmental site and regional water management projects, $30.3 million for mining equipment and $57.8 million related to other ongoing expansion work. Australia/New Zealand capital expenditures included approximately $50.8 million for mine development and reserve definition and $61.2 million for equipment. Capital expenditures at Akyem and Ahafo were for developmental drilling and other development activities. Corporate expenditures included $15.1 million for improvements in information technology systems.
In 2002, capital expenditures in North America included deferred mine development of $15.3 million, primarily for the Deep Post and Midas mines, $16.4 million for development of Leeville and optimization of the Phoenix project, $5.1 million for the Lone Tree Tailings Dam expansion and other replacement capital. South America capital expenditures related primarily to Yanacocha for leach pad expansions of $69.2 million, mine development of $16.7 million, environmental expenditures of $14.3 million, carbon columns and refinery of $12.9 million and other replacement capital. Australia/New Zealand capital expenditures included approximately $26.0 million for mine development and $3.6 million for haul truck purchases at Kalgoorlie.
Newmont expects to spend approximately $1.0 to $1.3 billion on capital expenditures during 2005, with approximately 37% for North American operations, 21% for South American operations, 9% for Australia/New Zealand operations, 23% for the Ghanaian projects and the remainder at other locations. Approximately 36% of the capital budget is allocated to sustaining investments and the remaining portion is allocated to financing new project development and business improvement initiatives. New projects are being developed in Nevada-Phoenix and Leeville. Phoenix is expected to commence gold production mid-2006 and as of the 2004 year-end had proven and probable gold reserves of 8.5 million equity ounces. Total capital expenditures for Phoenix are projected to be $236 million, of which $37.1 million had been expended as of December 31, 2004. Leeville is expected to produce approximately 4.0 million ounces of gold commencing at the end of 2005. Total capital expenditures for Leeville are projected to be $220 million, of which $128.1 million had been expended as of December 31, 2004. Total capital expenditures for the power plant are projected to be approximately $400-$450 million, of which approximately $90 million is expected in 2005.
In South America, Newmont expects to spend approximately $285 million on capital expenditures in 2005. Yanacocha is expected to spend approximately $265 million primarily on mine equipment, leach pad expansions and processing facilities. Kori Kollo is expected to spend approximately $20 million on leach pads and construction of the Kori Chaca project.
Newmont has two advanced projects in Ghana, the Ahafo and Akyem projects. The Ahafo project is located in the Brong Ahafo Region of Ghana and is 100% owned by Newmont. Total development costs for Ahafo are estimated to be approximately $440 million of which approximately $100 million had been expended as of December 31, 2004. Initial production of approximately 170,000 equity ounces is expected in 2006 and proven and probable gold reserves as of the 2004 year-end were 10.6 million equity ounces, an increase of approximately 40% from 2003. Newmont has an 85% interest in the Akyem project located in the Eastern Region of Ghana. At year-end, the Akyem project had 5.4 million equity ounces of proven and probable gold reserves, an increase of approximately 25% from 2003. Newmont is currently updating and optimizing the feasibility study for Akyem with a view to making a development decision in the middle of 2005.
Other Investing Activities
The Company had net investing activity of $57, $(821) and $223 related to investments in and proceeds from the sale of marketable debt and equity investments in 2005, 2004 and 2003, respectively.
Marketable debt securities. The Company had net purchases of $601.5 million$nil, $602 and $183.0 million$183 of auction rate marketable debt securities during the years ended December 31,in 2005, 2004 and 2003, respectively. The Company accounts for thethese investments as short-term available-for-sale marketable debt securities.
Marketable equity securities. During 2005, the year ended December 31,Company purchased marketable equity securities of Shore Gold, Gabriel Resources, Miramar and Miramar warrants for approximately $87, $31, $27 and $10, respectively. During 2004, the Company purchased marketable equity securities of Canadian Oil Sands Trust and Gabriel Resources Ltd. for approximately $199.6 million$200 and $19.2 million,$19, respectively. The Company accounts for thethese investments as long-term available-for-sale marketable equity securities.
Marketable equity securities of Kinross Gold Corporation. In the third quarter of 2005, Newmont sold its remaining 14 million Kinross shares for cash proceeds of $111 and recorded a net gain of $20. During the third quarter of 2003, Newmont sold approximately 28 million Kinross shares for total cash proceeds of $225 and recorded a net loss of $7.
Marketable equity securities of Oxiana Limited. In the third quarter of 2005, Newmont received approximately 82 million shares of Oxiana Limited (as part of the proceeds for the sale of Golden Grove) with a fair value of $61. These shares were sold in the fourth quarter of 2005 for net proceeds of $78 and a pre-tax gain of $19. In the first quarter of 2005, Newmont sold approximately 10 million shares of Oxiana for net proceeds of $8 and a pre-tax gain of $6.
Sale of Golden Grove. In 2005, the Company sold its Golden Grove copper-zinc operation to Oxiana for cash proceeds of approximately $147 plus 82 million shares of Oxiana.
Sale of Mezcala. On March 31, 2005, the Mezcala gold deposit was sold for cash proceeds of $31.
Sale of Ovacik. On March 1, 2005, Newmont sold the Ovacik mine,operation, located in western Turkey, was sold to a subsidiary of Koza Davetiye, a listed Turkish conglomerate. Consideration for the mine included $20 million paid at closing, $10 during the fourth quarter of 2005 and various contingentdeferred payments that could total as much as $24.5 million if all conditions precedent are met.$15.
Sale of Bronzewing. During the third quarter of 2004, Newmont sold assets associated with the closed Bronzewing mine, including certain mining tenements and plant and equipment. In exchange for the assets, the buyer has agreed to makemade installment payments through Marchin 2005 totaling A$9 million (approximately $6.2 million), of which approximately A$4.0 million ($2.9 million) had been received as of December 31, 2004,$3 and to assumeassumed all of the reclamation and closure liabilities. Under the agreement, Newmont is entitled to a 1% net smelter return royalty on all future metal production from the property.
Sale of Midwest Uranium. In December 2004, a wholly-owned subsidiary of Newmont sold its 20.7% interest in the Midwest Uranium Joint Venture for proceeds of $10.3 million$10 in cash and marketable equity securities valued at $2.1 million.$2.
Perama. In December 2004, two wholly-owned subsidiaries of Newmont completed a sale of their combined 80% interest in Thracean Gold Mining S.A. (“TGM”), which owns the Perama Hill Project located in northeastern Greece to Frontier Pacific Mining Corporation (“Frontier”). The remaining 20% of TGM was held by S&B Industrial Minerals S.A. (“S&B”), which also sold its interest to Frontier in the same transaction. On April 5, 2004, Frontier paid an initial non-refundable deposit of $1.0 million$1 (Newmont’s share was $0.8 million)$0.8) and on December 16, 2004, the transaction closed and Frontier paid an additional $11.0 million$11 (Newmont’s share was $8.8 million)$9).
Martabe. Newmont acquired its 90% interest in P.T. Newmont Horas Nauli (“PTNHN”), which owns the Martabe project, as part of the Normandy acquisition in February 2002. In March 2004, the Company signed an agreement to acquire the remaining 10% interest in PTNHN from P.T. Austindo Nusantara Jaya and South Seas Resources Pty., Ltd.PTNHN. An initial 5% interest was acquired during the fourth quarter of 2004 and the remaining 5% interest is expected to be purchased on exercise of an option in 2005.2006. The purchase price for the 10% interest is $7.5 million.$8. The Martabe project is categorized as an asset available for sale.
Australian Magnesium Corporation.Corporation (“AMC”). During 2004, Newmont Australia Limited, a wholly-owned subsidiary of Newmont entered into an agreement relating to a loan and loan guarantee involving Australian Magnesium CorporationAMC and certain of its subsidiaries. The agreement resulted in the release of Newmont from its guarantee obligation and the release of all previously accrued and contingent liabilities. This transaction resulted in a $10.6 millionan $11 gain after providing a A$30.0 million (approximately $23.2 million)30 ($23) subordinated loan to a subsidiary of QMC. An allowance was provided for 100% of the loan receivable fromreceivable. During 2005, the QMC entity.Company reduced the valuation allowance resulting in a gain of $9.
Pension Funding. Newmont expectsis currently planning to fund approximately $10.0 million intocontribute at a minimum, $30, to its pension plansretirement benefit programs in 20052006 fromNet cash provided by operating activities. For additional discussion see Item 7A, Qualitative Disclosure About Market Risk, Pension and Other Benefit Plans, below, and Note 1210 to the Consolidated Financial Statements.
Also impacting cash flows from investing activities for the year ended December 31, 2004 is the consolidation of Batu Hijau, effective January 1, 2004, which resulted in the recording of approximately $82 of Batu Hijau’s cash balances.
Net cash provided by (used in) financing activitieswas $38 in 2005, compared to $(475) and $401 in 2004 and 2003, respectively. Proceeds received during 2005 were primarily from the issuance of 30-year 5 7/8% Notes for net proceeds of $582 during March 2005. The proceeds will be used to fund capital investments, including a 200 megawatt power plant in Nevada, and for general corporate purposes.
Effective January 1, 2004, the Company included Batu Hijau in its Consolidated Financial Statements, increasing debt by $848.6 million$849 to approximately $1.9 billion.$1,926. During 2004, the Company received proceeds from debt of $55.9 million$56 and made $253.7 million$254 in repayments of debt.
In 2002, debt increased $913.7 million related to debt assumed as part of the acquisition of Normandy, which was subsequently reduced through 2003 as the Company focused on an overall strategy to reduce debt. The Company reduced principal by approximately $700 million for early extinguishments and $600 million for scheduled payments since December 31, 2001.
During November 2003, Newmont completed an equity offering for 25.0 million shares of its common stock and received proceeds of approximately $1.0 billion. This was the only public offering during the last three years.
NYOL Debt and Derivatives Liability Extinguishments
During May 2003, Newmont, through an indirect, wholly-owned subsidiary, Yandal Bond Company Limited (“YBCL”), acquired all of NYOL’s outstanding 8 7/8% Senior Notes due 2008 and all of NYOL’s gold hedge contracts from the relevant counterparties. This transaction gave rise to aGain on extinguishment of NYOL liabilities, net of $220.5 million,$221, net of transaction costs, for the year ended December 31, 2003. Total cash payments to extinguish the NYOL liabilities (including costs) was $202.1 million$202 during the year ended December 31, 2003.
Other Debt Extinguishments
During 2003, Newmont extinguished the following debt instruments: $148 million of its 8 3/8% debentures resulting in aLoss on extinguishment of debtof $11.2 million; $52.3 million$11; $52 of its 8 5/8% debentures resulting in aLoss on extinguishment of debtof $11.6 million; $30.9 million$12; $31 of its 7 5/8% guaranteed notes resulting in aLoss on extinguishment of debt of $4.4 million; $80.5 million$4; $81 of its 7 1/2% guaranteed notes resulting in a Loss on extinguishment of debt $6.4 million;$6; and $100 million in aggregate principal of its 6% convertible subordinated debentures resulting in aLoss on extinguishment of debt of $0.2 million.debentures.
Corporate Revolving Credit Facilities
Through July 29, 2004, the Company had three uncollateralized revolving credit facilities with a consortium of banks: a $200 million U.S. dollar-denominated revolving credit facility with an initial term of 364 days that was permitted to be extended annually to no later than October 2006; a $400 million multi-currency revolving credit facility that matured in October 2006 and provided for borrowing in U.S., Canadian and Australian dollars, and which also contained a letter of credit sub-facility; and a $150 million multi-currency revolving credit facility that was to mature in May 2005 and provided for borrowing in U.S. and Australian dollars. Interest rates and facility fees varied based on the credit ratings of the Company’s senior, uncollateralized, long-term debt. Borrowings under the facilities bore interest at a rate per annum equalequa1 to either the LIBOR plus a margin ranging from 0.45% to 1.25% or the greater of the federal funds rate plus 0.5% or the lead bank’s prime rate plus a margin ranging from 0% to 0.25%. Facility fees were accrued at a rate per annum ranging from 0.10% to 0.40% of the commitment.
Effective July 30, 2004, the Company entered into a new uncollateralized $1.25 billion$1,250 revolving credit facility with a syndicate of commercial banks. This new revolving credit facility replaced the three existing revolving credit facilities which were cancelled upon the effectiveness of the new facility. The new facility provides for borrowings in U.S. dollars and contains a letter of credit sub-facility. The newIn July 2005, the Company amended its revolving credit facility, maturesextending the final maturity one year, to July 30, 2009.28, 2010. In addition, certain adjustments to pricing and structure were also made. Interest rates and facility fees vary based on the credit ratings of the Company’s senior,
uncollateralized, long-term debt. Borrowings under the facilities bear interest at a rate per annum equal to either LIBOR plus a margin ranging from 0.285%0.22% to 1.150%1.00% or the greater of the federal funds rate plus 0.5% or the lead bank’s prime rate plus, in each case, a margin ranging from 0% to 0.150%.prime. Facility fees accrue at a rate per annum ranging from 0.090%0.080% to 0.350%0.250% of the aggregate commitments. The Company also pays a utilization fee of 0.125%0.10% on the amount of revolving credit loans and letters of credit outstanding under the facility for each day on which the sum of such loans and letters of credit exceed 50% of the commitments under the facility. Letters of credit issued under the prior credit facilities’ letter of credit sub-facility were transferred to and remain outstanding under the new facility’s letter of credit sub-facility. At December 31, 2004,2005, the facility fees were 0.125%0.09% of the commitment. There was $357.2 million$275 outstanding under the letter of credit sub-facility as of December 31, 2004.
2005.
Prepaid Forward Sales Contract
In July 1999,Under the Company entered into a prepaid forward gold sales contract (the “Prepaid Forward”) and a forward gold purchase contract (the “Forward Purchase”). Under the Prepaid Forward, the Company agreedis obligated to sell 483,333322,222 ounces of gold, to be delivered in June of each of 2005, 2006 and 2007 in annual installments of 161,111 ounces (the “Annual Delivery Requirements”).and to deliver 17,951 ounces of gold in June and December of 2006 and June of 2007. The Company also agreedForward Purchase provides for purchases of 17,951 ounces of gold on each delivery date under the Prepaid Forward to deliver semi-annually 17,951 ouncesat an average of gold, from June 2000 through June 2007 (the “Semi-Annual Delivery Requirements”) for a total gold delivery obligation over the life of the Prepaid Forward of 752,598 ounces. At the time the Prepaid Forward was entered into, the Company received net proceeds of $137.2 million ($145.0 million of gross proceeds before transaction costs of $653,000$344 per ounce in 2006 and the purchase of a $7.1 million surety bond to guarantee delivery of the Annual Delivery Requirements). $354 per ounce in 2007.
The Company may also be entitled to receive additional proceeds in the future in connection with the annual deliveries of 161,111 ounces, to be determined at each delivery date based on the excess, if any, of the then market price for gold (up to a maximum of $380 per ounce) over $300 per ounce.
At the time the Company entered into the Prepaid Forward, it also entered into the Forward Purchase, During June 2005, 161,111 ounces were delivered in connection with the same counterparty, to hedge the price risk with respect to the Semi-Annual Delivery Requirements. The Forward Purchase provides for semi-annual purchasesfirst annual delivery, resulting in a non-cash reduction in debt of 17,951 ounces of gold on each semi-annual delivery date under the Prepaid Forward at prices increasing from $263 per ounce in 2000 to $354 per ounce in 2007. On each semi-annual delivery date, the ounces purchased under the Forward Purchase are delivered in satisfaction of the Company’s delivery requirements under the Prepaid Forward. The transaction has been accounted for as a single borrowing of $145 million, with interest accruing, based on an effective interest rate recognized over the full term of the borrowing. Scheduled$48. Remaining scheduled repayments are $48.3 million$48 in each of years 2005, 2006 and 2007. Using relevant future market conditions and financial models, the estimated negative fair value of these contracts was approximately $204.5 million$159 and $208.7 million$205 at December 31, 20042005 and 2003,2004, respectively.
Debt Covenants
Certain of Newmont’s current debt facilities contain various common public debt covenants and default provisions including payment defaults, limitation on liens, limitation on sales and leaseback agreements and merger restrictions. These debt instruments include the medium-term5 7/8% notes, 8Newmont Australia 7 5/8% debentures,notes, 8 35/8% debentures, and sale-leaseback of the refractory ore treatment plant. None of the aforementioned public debt instruments contain financial ratio covenants or credit rating provisions that could create liquidity issues for the Company.
In addition to the covenants noted above, the Company’s new revolving credit facility contains financial ratio covenants requiring the Company to maintain a net debt (total debt net of cash) to EBITDA (Earnings before interest expense, income taxes, depreciation and amortization) ratio of less than or equal to 4.0 and a net debt to total capitalization ratio (ratio of net debt to total capitalization, which includes owner’s equity retained earnings and fixed assets) of less than or equal to 62.5%. Furthermore, the revolving credit facility contains covenants limiting the sale of all or substantially all of the Company’s assets and a negative pledge on certain assets.
Certain of the Company’s project debt facilities contain various common project debt covenants and default provisions including limitations on dividends subject to certain debt service cover ratios, limitations on sales of assets, negative pledges on certain assets, change of control provisions and limitations of additional permitted debt.
At December 31, 2004,2005, the Company and its subsidiaries were in compliance with all debt covenants and default provisions in all material respects.
provisions.
Scheduled Debt Payments
During the year ended December 31, 2005, the Company made scheduled cash debt repayments of $218 and a scheduled non-cash debt repayment of $48 for the Prepaid Forward.
Scheduled minimum debt repayments are $285.5 million in 2005, $169.5 million$196 in 2006, $162.4 million$162 in 2007, $236.5 million$232 in 2008, $122.4 million$114 in 2009, $113 in 2010 and $620.4 million$1,112 thereafter. Newmont expects to be able to fund maturities of its debt fromNet cash provided by operating activities and existing cash balances.
Shelf Registration Statement
In January 2004, Newmont filed with the Securities and Exchange Commission a new shelf registration statement on Form S-3 which enables it to issue debt and equity securities from time-to-time having an aggregate offering price up to $1.0 billion.$1,000. Newmont also filed a shelf registration statement on Form S-4 which enables it to issue, from time-to-time in connection with future acquisitions of businesses, properties or assets, common stock and common stock warrants having an aggregate offering price of $200 million.$200. These registration statements were declared effective on February 4, 2004.
Common Stock Offering
During November 2003, Newmont completed an equity offering for 25 million shares of its common stock under its then existing shelf registration statement filed with the Securities and Exchange Commission. The proceeds of approximately $1.0 billion$1,027 from this offering are beingwere used for general corporate purposes. This was the only public offering during the last three years.
Dividends
The Company paid dividends of $0.40 per common share during 2005, $0.30 per common share during 2004, and $0.17 per common share during 2003. Additionally, Newmont Mining Corporation of Canada Limited, a subsidiary of the Company, paid dividends of CDN$0.49, CDN$0.38 and CDN$0.25 during 2005, 2004 and 2003, and $0.12 per common share in 2002.respectively. On February 2, 2005,24, 2006, the Company declared a regular quarterly dividend of $0.10 per share, payable March 24, 200529, 2006 to holders of record at the close of business on March 3, 2005.8, 2006. The total paid to common stockholders was $179, $133 and $71 for 2005, 2004 and 2003, respectively.
The Company also paid dividends of $186, $237 and $146 to minority interests during 2005, 2004 and 2003, respectively.
Redemption of Convertible Preferred Convertible StockContractual Obligations
Newmont’s contractual obligations at December 31, 2005 are summarized as follows:
| Payments Due by Period | |||||||||||||||
Contractual Obligations | Total | Less than 1 Year | 1-3 Years | 3-5 Years | More than 5 Years | ||||||||||
Debt(1) | $ | 2,974 | $ | 282 | $ | 680 | $ | 475 | $ | 1,537 | |||||
Capital lease obligations(1) | 362 | 37 | 106 | 68 | 151 | ||||||||||
Remediation and reclamation obligations(2) | 788 | 66 | 133 | 70 | 519 | ||||||||||
Employee-related benefits(3) | 386 | 76 | 126 | 35 | 149 | ||||||||||
Operating leases | 21 | 4 | 11 | 5 | 1 | ||||||||||
Minimum royalty payments | 134 | 6 | 54 | 22 | 52 | ||||||||||
Purchase obligations(4) | 429 | 150 | 211 | 52 | 16 | ||||||||||
Other(5) | 344 | 163 | 149 | 14 | 18 | ||||||||||
| $ | 5,438 | $ | 784 | $ | 1,470 | $ | 741 | $ | 2,443 | ||||||
| (1) | Amounts represent principal and estimated interest payments assuming no early extinguishment. |
| (2) | Mining operations are subject to extensive environmental regulations in the jurisdictions in which they operate. Pursuant to environmental regulations, the Company is required to close its operations and reclaim and remediate the lands that operations have disturbed. The estimated undiscounted cash outflows of these remediation and reclamation obligations are reflected here. For more information regarding remediation and reclamation liabilities, see Note 13 to the Consolidated Financial Statements. |
| (3) | Contractual obligations forEmployee-related benefits include severance, pension funding and other benefit plans. Pension plan funding beyond 2010 cannot be reasonably estimated given variable market conditions and actuarial assumptions and are not included. |
| (4) | Purchase obligations are not recorded in the Consolidated Financial Statements. Purchase obligations represent contractual obligations for purchase of power, materials and supplies, consumables, inventories and capital projects. |
| (5) | Other contractual obligations that are not reflected in the Company’s Consolidated Financial Statements include labor and service contracts. Payments related to derivative contracts cannot be reasonably estimated given variable market conditions. See Note 21 to the Consolidated Financial Statements. |
Off-Balance Sheet Arrangements
The Company has the following off-balance sheet arrangements: operating leases as disclosed in the above table and $386 of outstanding letters of credit, surety bonds and bank guarantees (see Note 9 to the Consolidated Financial Statements). There is also an undrawn contingent sponsor support line of credit to Batu Hijau of $65, of which Newmont’s pro rata share is $37.
Batu Hijau has sales agreements to sell copper concentrates as follows (in millions of pounds) 1,614 in 2006; 1,362 in 2007; 1,378 in 2008; 1,389 in 2009; 1,389 in 2010 and 4,167 thereafter. For information regarding these copper sales agreements, see Item 7A, Quantitative and Qualitative Disclosures about Market Risk-Hedging, Provisional Copper and Gold Sales, below.
Future Cash Flows
The Company expects to use cash for capital expenditures (see Investing Activities, below), to fund the Exploration and Merchant Banking Segments (see Results of Operations, above) and to service debt. For information on the Company’s long-term debt, capital lease obligations and operating leases, see Note 9 to the Consolidated Financial Statements. Newmont believes it will be able to fund all existing obligations from eitherNet cash provided by operating activities or cash and marketable debt securities on hand. Subject to any significant adverse changes in the Company’s long-term view of gold and copper prices, the Company has both the ability and intention to fund fromNet cash provided by operating activities, the exploration expenditures and Merchant Banking investments that were assumed in the goodwill valuations to support the Exploration and Merchant Banking Segments. The Company believes it will be able to raise funds as needed in the future as opportunities for expansion arise.
Cash flows are expected to be impacted by variations in the realized spot price of gold and copper. The Company has a series of price-capped gold sales contracts under which it will realize the lower of the spot price on the delivery date or the capped price ranging from $384 per ounce in 2008, $381 per ounce in 2009 to $392 per ounce in 2011. The Company also has copper collar contracts for 490 million pounds under which it will realize a minimum and maximum price of $1.10 and $1.35 per pound, respectively, in 2006 and $1.10 and $1.40 per pound, respectively, in 2007. For information on the sensitivity of Newmont’sNet cash provided by operating activities to metal prices, see Item 7A, Quantitative and Qualitative Disclosures about Market Risk.
Cash flows are also expected to be impacted by variations in foreign currency exchange rates in relation to the U.S. dollar, particularly with respect to the Australian dollar. For information concerning the sensitivity of the Company’sCosts applicable to sales to changes in foreign currency exchange rates, see Results of Operations, Foreign Currency Exchange Rates, above. The Company has entered into Australian dollar net zero-cost collar contracts under which it will purchase Australian dollars at a minimum average floor price of $0.55 and average maximum cap price of $0.80 per Australian dollar in 2006. For information on the sensitivity of Newmont’sNet cash provided to operating activities to foreign currency exchange rates, see Item 7A, Quantitative and Qualitative Disclosures about Market Risk.
Based on Newmont’s production profile for the next three years and proven and probable reserves at December 31, 2005, without considering future additions to such reserves, Newmont expects that consolidated gold ounces sold will be between 7.8 and 8.2 million ounces in 2006 and will be between 7.2 and 7.6 million ounces in 2007. The Company does not anticipate that reasonably expected variations in gold or copper sales alone will influence its ability to pay its debt and other obligations over that period.
On December 19, 2005, Yanacocha filed with the Peruvian securities regulatory authority (CONASEV), for its review and approval, a prospectus to register a $200 bond program in the Peruvian public market. When approved, the registration would make the bond program available for Yanacocha to make up to $200 in issuances over a two-year period. Yanacocha may also consider obtaining funds from other sources, including commercial banks. Any funds generated from the bond program or other debt facilities may be used by Yanacocha for capital expenditures and its general corporate purposes.
In April 2002,January 2006, the International Finance Corporation approved $125 in project financing for the Ahafo project. The financing is subject to satisfactory final documentation and syndication to commercial banks. The Company expects to close and drawdown on the facility prior to mid-year.
In February 2006, Newmont announcedentered into an agreement to acquire Newcrest Mining Limited’s 22.22% interest in Boddington. Consideration for the redemption of all issuedpurchase is A$225 before applicable stamp duty and outstanding shares of its $3.25 cumulative convertible preferred stock as of May 15, 2002. Pursuantsimilar costs. When the transaction closes, Newmont’s interest in Boddington will increase to the termstwo-thirds. Closing of the cumulative convertible preferred stock, Newmont paid a redemption pricetransaction is subject to Australian Foreign Investment Review Board and Western Australia Ministry of $50.325 per share, plus $0.8125 per share for accrued dividends at the redemption date. In settlement of the total redemption price of $51.1375 per preferred share, Newmont issued each holder of record 1.19187 shares of its common stock and cash for any remaining fractional interests. The Company paid $3.7 million in preferred stock dividends in 2002.
Mines approval, expected by April 2006.
The Company’s mining and exploration activities are subject to various federal and state laws and regulations governing the protection of the environment. These laws and regulations are continually changing and are generally becoming more restrictive. The Company conducts its operations so as to protect the public health and environment and believes its operations are in compliance with applicable laws and regulations in all material respects. The Company has made, and expects to make in the future, expenditures to comply with such laws and regulations, but cannot predict the full amount of such future expenditures. Estimated future
reclamation costs are based principally on legal and regulatory requirements. At December 31, 2005 and 2004, $431 and 2003, $410.3 million and $361.0 million,$396, respectively, were accrued for reclamation costs relating to currently producing mineral properties. The increaseproperties, of which $53 is classified as current liabilities expected to be spent in 2004 is primarily attributable to the consolidation of Batu Hijau (see Accounting Changes above).
2006.
In addition, the Company is involved in several matters concerning environmental obligations associated with former mining activities. Generally, these matters concern developing and implementing remediation plans at the various sites involved. The Company believes that the related environmental obligations associated with these sites are similar in nature with respect to the development of remediation plans, their risk profile and the compliance required to meet general environmental standards. Based upon the Company’s best estimate of its liability for these matters, $74.9 million$77 and $58.6 million$75 were accrued for such obligations at December 31, 20042005 and 2003,2004, respectively. Depending upon the ultimate resolution of these matters, the Company believes that it is reasonably possible that the liability for these matters could be as much as 81%101% greater or 34% lower than the amount accrued at December 31, 2004.2005. The amounts accrued for these matters are reviewed periodically based upon facts and circumstances available at the time. Changes in estimates are charged toOther expenses in the period estimates are revised.
Newmont spent $19.6 million, $18.7 million,$14, $20 and $14.6 million$19 in 2005, 2004, 2003, and 2002,2003, respectively, for environmental obligations related to former, primarily historic, mining activities, and expectshas classified $10 as a current liability expected to spend between $18 million and $20 millionbe spent in 2005.2006. Expenditures for 2005 and 2004 related primarily to legacy Normandy properties in Australia, the McCoy/Cove property in central Nevada and the Dawn mill site near Ford, Washington. Expenditures for 2003 related primarily to the Dawn mill site and the McCoy/Cove property. Expenditures for 2002 relate primarily to the Dawn mill site and the Resurrection site near Leadville, Colorado.
Included in capital expenditures were $43.1 million, $25.7 million$35, $43 and $14.3 million$26 in 2005, 2004 2003 and 2002,2003, respectively, to comply with environmental regulations. Expenditures of between $30 million and $35 million are$40 and anticipated in 2005.2006. Ongoing costs to comply with environmental regulations have not been a significant component of cash operating costs.
Costs applicable to sales.
For more information on the Company’s reclamation and remediation liabilities, see Note 1513 to the Consolidated Financial Statements.
The foregoing discussion and analysis, as well as certain information contained elsewhere in this Annual Report, contain “forward-looking statements” within the meaning of Section 27A of the Securities Act of 1933, as amended, and Section 21E of the Securities Exchange Act of 1934, as amended, and are intended to be covered by the safe harbor created thereby. See the discussion in Forward-Looking Statements in Item 1, Business.
ITEM 7A. QUANTITATIVE AND QUALITATIVE DISCLOSURES ABOUT MARKET RISK
| ITEM 7A. | QUANTITATIVE AND QUALITATIVE DISCLOSURES ABOUT MARKET RISK (dollars in millions except per share, per ounce and per pound amounts) |
Changes in the market price of gold and copper significantly affect Newmont’s profitability and cash flow. Gold prices can fluctuate widely due to numerous factors, such as demand; forward selling by producers; central bank sales, purchases and lending; investor sentiment; the strength of the U.S. dollar and global mine production levels. Changes in the market price of copper also affect Newmont’s profitability and cash flow from its investment in the Batu Hijau mine in Indonesia and its Golden Grove mine in Australia. Copper is traded on established international exchanges and copper prices generally reflect market supply and demand, but can also be influenced by speculative trading in the commodity or by currency exchange rates.
Changes in the foreign currency exchange rates in relation to the U.S. dollar may affect Newmont’s profitability and cash flow. Foreign currency exchange rates can fluctuate widely due to numerous factors, such as supply and demand for foreign and U.S. currencies and U.S. and foreign country economic conditions. In addition to its operations in the United States, Newmont has operations in Australia, Peru, Indonesia, Canada, Uzbekistan, Bolivia, New Zealand and Mexico. The Company’s non-U.S. operations sell their metal production based on a U.S. dollar gold price. Fluctuations in the local currency exchange rates in relation to the U.S. dollar can increase or decrease profit margins and total cash costs per ounce to the extent costs are paid in local currency at foreign operations. Since the Company’s February 15, 2002 acquisition of Normandy, the Australian dollar/U.S. dollar exchange rate has had the greatest impact on the Company’s total cash costs, as measured in U.S. dollars. However, variations in the Australian dollar/U.S. dollar exchange rate have historically been strongly correlated to variations in the U.S. dollar gold price over the long-term. Increases or decreases in costs at Australian gold operations due to exchange rate changes have therefore tended to be mitigated by changes in sales reported in U.S. dollars for such locations. No assurance can be given that the Australian dollar/U.S. dollar exchange rate will continue to be strongly correlated to the U.S. dollar gold price in the future, or that short-term changes in the Australian dollar/U.S. dollar exchange rate will not have an impact on the Company’s profitability and cash flow. Newmont does not believe that foreignForeign currency exchange rates in relation to the U.S. dollar have not had a material impact on itsNewmont’s determination of proven and probable reserves in the past. However, in the event thatif a sustained weakening of the U.S. dollar in relation to the Australian dollar, and/or to other foreign currencies that impact the Company’s cost structure, were not mitigated by offsetting increases in the U.S. dollar gold price or by other factors, the Company believes that profitability, cash flows and the amount of proven and probable reserves in the applicable foreign country could be reduced. The extent of any such reduction would be dependent on a variety of factors including the length of time of any such weakening of the U.S. dollar, and management’s long-term view of the applicable exchange rate. For information concerning the sensitivity of the Company’s cash costs to changes in foreign currency exchange rates, see Item 7, Management’s Discussion and Analysis of Consolidated Results of Operations and Financial Condition—ResultsCondition-Results of Operations—ForeignOperations-Foreign Currency Exchange Rates,” above.
Newmont generally avoids hedging.hedging its gold production. Newmont’s philosophy is to provide shareholders with leverage to changes to gold prices by selling its gold production at market prices. Newmont has, on a limited basis, entered into derivative contracts to protect the selling price for certain anticipated gold and copper production and to manage risks associated with sales contracts, commodities, interest rates, and foreign currency. Newmont is not required to place collateral with respect to commodity instrumentsderivative contracts and there are no margin calls associated with such contracts. During the year ended December 31, 2004,2005, Newmont entered into copper option collar contracts, U.S.$/IDR forward purchase contracts and Australian dollar net zero-cost option collar contracts and $/IDR forward purchase contracts. Approximately 459As of December 31, 2005, approximately 360 million pounds of copper are hedged by the copper option collar contracts, which have been designated as cash flow hedges of forecasted copper sales, and as such, changes in the fair value related to the effective portion of the hedges have been recorded inAccumulated other comprehensive income. The remainderApproximately 130 million pounds of the copper option collar contracts are currently undesignated and are accounted for on a mark-to-market basis currently through earnings. The U.S.$/$/IDR forward purchase contracts and Australian
dollar net zero-cost option collar contracts have been designated as cash flow hedges of future IDR and Australian dollar expenditures, respectively, and as such, changes in the market value have been recorded inAccumulated other comprehensive income.
For the years ended December 31,2005, 2004 and 2003, net gains of $2, $2 and 2002, a net gain of $2.3 million, $28.3 million and a net loss of $18.3 million,$28, respectively, were included inNet incomefor the ineffective portion of derivative instruments designated as cash flow hedges and a net loss of zero million, $5.4 million and a net loss of $21.5 million, respectively,$5 for 2003, for the change in fair value of gold commodity contracts that do not qualify as hedges (included inGain (loss) on derivative instruments, net). The amount to be reclassified fromAccumulated other comprehensive income (loss),net of taxto income for derivative instruments during the next 12 months is a gain
of approximately $6 million.$41. The maximum period over which hedged forecasted transactions are expected to occur is 76 years.
Certain hedge positions were eliminated in connection with the Voluntary Administration of Newmont Yandal Operations Pty Ltd. (see Note 30 to the Consolidated Financial Statements for discussion of legal matters). This gave rise to a gain of $107, net of transaction costs for 2003 (see Note 18 to the Consolidation Financial Statements).
| Expected Maturity Date or Transaction Date | Fair Value | |||||||||||||||||||||||||
| 2005 | 2006 | 2007 | 2008 | 2009 | Thereafter | Total/ Average | At December 31, 2004 | At December 31, 2003 | ||||||||||||||||||
| U.S.$ (in thousands) | ||||||||||||||||||||||||||
Gold Put Option Contracts (U.S.$ Denominated): | ||||||||||||||||||||||||||
Ounces (thousands) | 205 | 100 | 20 | — | — | — | 325 | $ | (8,910 | ) | $ | (11,758 | ) | |||||||||||||
Average price | $ | 292 | $ | 338 | $ | 397 | — | — | — | $ | 313 | |||||||||||||||
Silver Forward Contracts (U.S.$ Denominated): | ||||||||||||||||||||||||||
Ounces (thousands) | 1,200 | 50 | — | — | — | — | 1,250 | $ | (1,077 | ) | $ | (1,000 | ) | |||||||||||||
Average price | $ | 6.01 | $ | 6.50 | — | — | — | — | $ | 6.03 | ||||||||||||||||
Copper Collar Contracts (U.S.$ Denominated): | ||||||||||||||||||||||||||
Pounds (millions) | 465.7 | 110.8 | 4.4 | — | — | — | 580.9 | $ | (60,598 | )(1) | N/A | |||||||||||||||
Average cap price | $ | 1.30 | $ | 1.30 | $ | 1.30 | — | — | — | $ | 1.30 | |||||||||||||||
Average floor price | $ | 1.10 | $ | 1.10 | $ | 1.10 | — | — | — | $ | 1.10 | |||||||||||||||
Diesel Forward Purchase Contracts (U.S.$ Denominated): | ||||||||||||||||||||||||||
Barrels (thousands) | 40 | — | — | — | — | — | 40 | $ | 802 | (1) | $ | 599 | ||||||||||||||
Average price | $ | 27.19 | — | — | — | — | — | $ | 27.19 | |||||||||||||||||
U.S.$/IDR Forward Purchase Contracts: | ||||||||||||||||||||||||||
U.S.$ (millions) | 75.7 | — | — | — | — | — | 75.7 | $ | (447 | ) | N/A | |||||||||||||||
Average rate (IDR/U.S.$) | 9,384 | — | — | — | — | — | 9,384 | |||||||||||||||||||
Australian Dollar Zero-Cost Collar Contracts: | ||||||||||||||||||||||||||
U.S.$ (millions) | $ | 281.4 | $ | 134.6 | — | — | — | — | $ | 416.0 | $ | 13,438 | N/A | |||||||||||||
Average cap price (U.S.$ per A$1) | $ | 0.775 | $ | 0.800 | — | — | — | — | $ | 0.783 | ||||||||||||||||
Average floor price (U.S.$ per A$1) | $ | 0.577 | $ | 0.547 | — | — | — | — | $ | 0.568 | ||||||||||||||||
| Expected Maturity Date | Fair Value | ||||||||||||||||
| 2006 | 2007 | Total/ Average | At December 31, 2005 | At December 31, 2004 | |||||||||||||
Gold Put Option Contracts: | |||||||||||||||||
Ounces (thousands) | 100 | 20 | 120 | $ | (3 | ) | $ | (9 | ) | ||||||||
Average price | $ | 338 | $ | 397 | $ | 348 | |||||||||||
Silver Forward Contracts: | |||||||||||||||||
Ounces (thousands) | 50 | — | 50 | $ | –– | $ | (1 | ) | |||||||||
Average price | $ | 6.50 | — | $ | 6.50 | ||||||||||||
Copper Collar Contracts(3): | |||||||||||||||||
Pounds (millions) | 406 | 84 | 490 | $ | (261 | )(1) | $ | (61 | )(2) | ||||||||
Average cap price | $ | 1.35 | $ | 1.40 | $ | 1.36 | |||||||||||
Average floor price | $ | 1.10 | $ | 1.10 | $ | 1.10 | |||||||||||
$/IDR Forward Purchase Contracts: | |||||||||||||||||
$ (millions) | 71 | — | 71 | $ | –– | $ | –– | ||||||||||
Average rate (IDR/$) | 10,405 | — | 10,405 | ||||||||||||||
Australian Dollar Collar Contracts: | |||||||||||||||||
$ (millions) | $ | 135 | — | $ | 135 | $ | –– | $ | 13 | ||||||||
Average cap price ($ per A$1) | $ | 0.80 | — | $ | 0.80 | ||||||||||||
Average floor price ($ per A$1) | $ | 0.55 | — | $ | 0.55 | ||||||||||||
| (1) | The fair value does not include amounts payable ($ |
| (2) | The fair value does not include amounts payable ($ |
Australian Dollar Forward Contracts
The Company had no Australian dollar forward contracts outstanding as of December 31, 2004, although a position did exist as of December 31, 2003. These positions were closed during July 2004. The fair value of these contracts as of December 31, 2003 was positive $7.7 million.
Provisional Copper and Gold Sales
ForThe Company’s sales based on a provisional sales price contain an embedded derivative that is required to be separated from the years endedhost contract for accounting purposes. The host contract is the receivable from the sale of the concentrates at the forward London Metal Exchange price at the time of sale. The embedded derivative, which does not qualify for hedge accounting, is marked to market through earnings each period prior to final settlement. At December 31, 2005 and 2004, 2003respectively, the Company had embedded copper derivatives on 223 million pounds and 2002,226 million pounds, recorded at an average price of $2.01 and $1.44 per pound, respectively.
For 2005 and 2004, Batu Hijau recorded the following gross revenues before smeltingtreatment and refining charges, of $324.8 million, $95.7 million and $65.7 million for base metals, respectively, and $28.5 million, zero and zero for gold, respectively, which were subject to final pricing adjustments. The
average realized price adjustment for base metals was 13.77%, 5.07% and 1.98% for the years endedadjustments at December 31, 2005 and 2004, 2003 and 2002, respectively, and 0.86%, 1.13% and 0.83% for gold for the same periods.as follows:
| At December 31, | ||||||
| 2005 | 2004 | |||||
Gross revenue subject to final price adjustments | ||||||
Copper | $ | 447 | $ | 325 | ||
Gold | $ | 19 | $ | 29 | ||
The average final price adjustments realized were as follows:
Years Ended December 31, | ||||||
| 2005 | 2004 | |||||
Average final price adjustments | ||||||
Copper | 12.1 | % | 13.8 | % | ||
Gold | 1.4 | % | 0.9 | % | ||
Price-Capped Sales Contracts
In 2001, Newmont entered into transactions that closed out certain call options. The options were replaced withCompany has a series of forwardprice-capped gold sales contracts requiring physical delivery of the same quantity of gold over slightly extended future periods. Under the terms of the contracts, Newmontunder which it will realize the lower of the spot price on the delivery date or the capped price ranging from $350$384 per ounce in 20052008, $381 per ounce in 2009 to $392 per ounce in 2011. The initial fair value of the forward sales contracts of $53.8 million$54 was recorded asDeferred revenue from sale of future production and will be included in sales revenue as delivery occursoccurs. Newmont delivered 500,000 ounces in 2005 through 2011. Asat the capped price of December 31, 2004, the current portion$350 per ounce and recognized deferred revenue of $7.0 million has been reclassified toOther current liabilities.$14 per ounce. The forward sales contracts are accounted for as normal sales contracts under SFAS No. 133 “Accounting for Derivative Instruments and Hedging Activities” and SFAS No. 138 “Accounting for Certain Derivative Instruments and Certain Hedging Activities-an Amendment to SFAS No. 133.”
Newmont had the following price-capped forward sales contracts outstanding at December 31, 2004:2005:
Expected Maturity Date or Transaction Date | Total/ Average | ||||||||||||||||||
Price-capped sales contracts: | 2005 | 2006 | 2007 | 2008 | 2009 | Thereafter | |||||||||||||
| (U.S.$ Denominated) | |||||||||||||||||||
Ounces (thousands) | 500 | — | — | 1,000 | 600 | 250 | 2,350 | ||||||||||||
Average price | $ | 350 | — | — | $ | 384 | $ | 381 | $ | 392 | $ | 377 | |||||||
| Expected Maturity Date | ||||||||||||||
Price-capped forward sales contracts: | 2008 | 2009 | 2010 | 2011 | Total/ Average | |||||||||
Ounces (thousands) | 1,000 | 600 | — | 250 | 1,850 | |||||||||
Average price | $ | 384 | $ | 381 | — | $ | 392 | $ | 384 | |||||
Interest Rate Swap Contracts
In 2001, Newmont entered into contracts to hedge a portion of the interest rate risk exposure on a portion of its $275 million 8 5/8% debentures and its $200 million 8 3/8% debentures. The Company receives fixed-rate interest payments at 8.625% or 8.375% and pays floating-rate interest amounts based on periodic London Interbank Offered Rate (“LIBOR”) settings plus a spread, ranging from 2.60% to 4.25%. The notional principal amount of these transactions was $200 million at December 31, 2004. Effective April 1, 2004, the Company redesignated $150 million of these contracts as new fair value hedges against portions of the 8 5/8% notes and 8 3/8% debentures. The remaining $50 million of these contracts have not been designated and changes in their fair value are recorded currently in income. Half of these contracts expire in July 2005 and half expire in May 2011. These transactions resulted in a reduction in interest expense of $5.5 million, $6.9 million$3, $6 and $5.9 million$7 for the years ended December 31, 2005, 2004 and 2003, and 2002, respectively. The remaining swap contracts are designated as a hedge against $100 principal of the 8 5/8% debentures. The fair value of the ineffective portions accounted for as derivative assets were $3.7 millioninterest rate swaps was $2 and $5.2 million$9 at December 31, 20042005 and 2003, respectively, and the fair value of the effective portions accounted for as fair value hedges were $5.0 million and $7.7 million at December 31, 2004, and 2003, respectively.
Newmont has both fixed and variable rate debt. Without considering the specialized $145 million$97Prepaid Forward Sales Obligation, 48%78% and 94%66% of debt was fixed and 52%22% and 6%34% was variable at December 31, 20042005 and 2003,2004, respectively. The Company has managed some of its fixed rate debt exposure by entering into interest rate
swaps (see Interest Rate Swap Contracts above). The Company’s fixed rate debt exposure at December 31, 20042005 and 20032004 is summarized as follows:
| 2004 | 2003 | |||||
| (in millions) | ||||||
Carrying value of fixed rate debt(1) | $ | 414 | $ | 569 | ||
Fair value of fixed rate debt(1) | $ | 463 | $ | 639 | ||
Pro forma fair value sensitivity of fixed rate debt of a +/–10 basis point interest rate change(2) | $ | +/–1.4 | $ | +/–2.2 | ||
Carrying value of fixed rate debt(1) Fair value of fixed rate debt(1) Pro forma fair value sensitivity of fixed rate debt of a +/–10 basis point interest rate change(2) 2005 2004 $ 935 $ 414 $ 960 $ 463 $ +/–9.1 $ +/–1.4
| (1) | Excludes specialized and hybrid debt instruments for which it is not practicable to estimate fair values and pro forma fair values or sensitivities. These instruments include the Sale-Leaseback of the Refractory Ore Treatment Plant, Prepaid Forward Sales Obligation, PTNNT project financing facility, PTNNT partner loan and certain capital leases. The estimated fair value quoted above may or may not reflect the actual trading value of these instruments. |
| (2) | The pro forma information assumes a +/–10 basis point change in market interest rates at December 31 of each year, and reflects the corresponding estimated change in the fair value of fixed rate debt outstanding at that date under that assumption. Actual changes in the timing and amount of interest rate variations may differ from the above assumptions. |
Pension and Other Benefit Plans
Pension and other benefit plancosts can be impacted by actual results that differ from assumptions selected. These differences are reflected in financial results over future periods. Actual returns (losses) on pension assets were $19.3 million, $29.4 million$18, $19 and $(11.1) million$29 in 2005, 2004 2003 and 2002,2003, respectively, compared to expected returns of $13.5 million, $12.1 million$21, $14 and $14.4 million$12 for the same periods. If the difference between expected returns and actual results related to plan assets, combined with the gains or losses resulting from the projected benefit obligation, fall outside certain limits, the difference will be amortized into future earnings on a straight-line basis over the average remaining working life of the participants (currently 13.813.7 years). The following table provides details of the pension plans asset mix at December 31, 2004:2005:
Asset Class | Actual Mix | Target Mix | Expected Rate of Return | Standard Deviation or Volatility | ||||||||
U.S. equity investments | 46 | % | 45 | % | 8.8 | % | 19.3 | % | ||||
International equity investments | 21 | % | 20 | % | 10.0 | % | 26.2 | % | ||||
Fixed income investments | 33 | % | 35 | % | 6.5 | % | 7.1 | % | ||||
| 9.2 | % | 10.5 | % |
Asset Class | Actual Mix | Target Mix | Expected Rate of Return | Standard Deviation or Volatility | ||||||||
U.S. equity investments | 44 | % | 45 | % | 9.5 | % | 18.5 | % | ||||
International equity investments | 22 | % | 20 | % | 9.6 | % | 18.4 | % | ||||
Fixed income investments | 34 | % | 35 | % | 10.8 | % | 22.1 | % | ||||
| 8.5 | % | 12.5 | % |
The pension plan employs threeseveral independent investment firms which invest the assets of the plan in certain approved funds that correspond to the specific asset classes andwith associated target allocations designated by the pension fund investment committee of the Company.allocations. Depending upon actual sector performance, the assets in the plan are periodically rebalanced to match the established target levels for the asset classes. This rebalancing may be accomplished through actual transfer of funds between asset classes and managers, or through targeted cash contributions and/or distributions. The goal of the pension fund investment program is to achieve expected rates of return consistent with the investment risk associated with the approved investment portfolio. The investment performance of the plan and that of the individual investment firms is measured against recognized market indices. This performance is monitored by an investment committee comprised of members of the Company’s management, which in turn, is advised by an independent investment consultant. The performance of the plan is reviewed annually with the audit committeeAudit Committee of the Company’s board of directors.
Contributions to the pension plans were $37.5 million, $22.4 million$12, $38 and $12.3 million in 2004, 2003 and 2002, respectively. Funding$22 in 2005, 2004 and 2003, respectively. The Company is expectedcurrently planning to contribute at a minimum, $30, to its retirement benefit programs in 2006. However, during the course of the year, consideration may be approximately $10.0 million.given to making additional contributions toward the Company’s retirement benefit programs depending on various factors, including changes to regulations governing the funding of pensions, the Company’s business and operating environment and forecasted cash flows.
ITEM 8. FINANCIAL STATEMENTS AND SUPPLEMENTARY DATA
| ITEM 8. | FINANCIAL STATEMENTS AND SUPPLEMENTARY DATA |
MANAGEMENT’S REPORT ON INTERNAL CONTROL OVER FINANCIAL REPORTING
The management of the Company is responsible for establishing and maintaining adequate internal control over financial reporting. The Securities and Exchange Act of 1934 defines internal control over financial reporting in Rule 13a-15(f) and 15d-15(f) as a process designed by, or under the supervision of, the company’s principal executive and principal financial officers and effected by the company’s board of directors, management and other personnel, to provide reasonable assurance regarding the reliability of financial reporting
and the preparation of financial statements for external purposes in accordance with generally accepted accounting principles and includes those policies and procedures that:
Because of its inherent limitations, internal control over financial reporting may not prevent or detect misstatements. Also, projections of any evaluation of effectiveness to future periods are subject to risk that controls may become inadequate because of changes in conditions, or that the degree of compliance with the policies or procedures may deteriorate.
The Company’s management assessed the effectiveness of the Company’s internal control over financial reporting as of December 31, 2004.2005. In making this assessment, the Company’s management used the criteria set forth by the Committee of Sponsoring Organizations of the Treadway Commission (COSO) inInternal Control-Integrated Framework.
Based upon its assessment, management concluded that, as of December 31, 2004,2005, the Company’s internal control over financial reporting is effective based upon those criteria.
Management’s assessment of the effectiveness of the Company’s internal control over financial reporting as at December 31, 20042005 has been audited by PricewaterhouseCoopers LLP, an independent registered public accounting firm, as stated in their report which appears herein.
REPORT OF INDEPENDENT REGISTERED PUBLIC ACCOUNTING FIRM
To the Board of Directors and Shareholders of Newmont Mining Corporation:
We have completed an integrated auditaudits of Newmont Mining Corporation’s 2005 and 2004 consolidated financial statements and of its internal control over financial reporting as of December 31, 20042005 and auditsan audit of its 2003 and 2002 consolidated financial statements in accordance with the standards of the Public Company Accounting Oversight Board (United States). Our opinions, based on our audits, are presented below.
Consolidated financial statements
In our opinion, the accompanying consolidated financialbalance sheets and the related consolidated statements of income, shareholders’ equity and cash flows present fairly, in all material respects, the financial position of Newmont Mining Corporation and its subsidiaries at December 31, 20042005 and 2003,2004, and the results of their operations and their cash flows for each of the three years in the period ended December 31, 20042005 in conformity with accounting principles generally accepted in the United States of America. These financial statements are the responsibility of the Company’s management. Our responsibility is to express an opinion on these financial statements based on our audits. We conducted our audits of these statements in accordance with the standards of the Public Company Accounting Oversight Board (United States). Those standards require that we plan and perform the audit to obtain reasonable assurance about whether the financial statements are free of material misstatement. An audit of financial statements includes examining, on a test basis, evidence supporting the amounts and disclosures in the financial statements, assessing the accounting principles used and significant estimates made by management, and evaluating the overall financial statement presentation. We believe that our audits provide a reasonable basis for our opinion.
As discussed in Note 3 to the consolidated financial statements, the Company changed its methods of (i) accounting for an investment following the adoption of FIN 46-R effective January 1, 2004; and (ii) accounting for asset retirement obligations effective January 1, 2003; and (iii) accounting for depreciation, depletion and mine development, effective January 1, 2002.
2003.
Internal control over financial reporting
Also, in our opinion, management’s assessment, included in Management’s Report on Internal Control Over Financial Reporting appearing under Item 8, that the Company maintained effective internal control over financial reporting as of December 31, 20042005 based on criteria established inInternal Control—Integrated Framework issued by the Committee of Sponsoring Organizations of the Treadway Commission (COSO), is fairly stated, in all material respects, based on those criteria. Furthermore, in our opinion, the Company maintained, in all material respects, effective internal control over financial reporting as of December 31, 2004,2005, based on criteria established inInternal Control—Integrated Framework issued by the COSO. The Company’s management is responsible for maintaining effective internal control over financial reporting and for its assessment of the effectiveness of internal control over financial reporting.reporting based on our audit. Our responsibility is to express opinions on management’s assessment and on the effectiveness of the Company’s internal control over financial reporting based on our audit. We conducted our audit of internal control over financial reporting in accordance with the standards of the Public Company Accounting Oversight Board (United States). Those standards require that we plan and perform the audit to obtain reasonable assurance about whether effective internal control over financial reporting was maintained in all material respects. An audit of internal control over financial reporting includes obtaining an understanding of internal control over financial reporting, evaluating management’s assessment, testing and evaluating the design and operating effectiveness of internal control, and performing such other procedures as we consider necessary in the circumstances. We believe that our audit provides a reasonable basis for our opinions.
A company’s internal control over financial reporting is a process designed to provide reasonable assurance regarding the reliability of financial reporting and the preparation of financial statements for external purposes in
accordance with generally accepted accounting principles. A company’s internal control over financial reporting
includes those policies and procedures that (i) pertain to the maintenance of records that, in reasonable detail, accurately and fairly reflect the transactions and dispositions of the assets of the company; (ii) provide reasonable assurance that transactions are recorded as necessary to permit preparation of financial statements in accordance with generally accepted accounting principles, and that receipts and expenditures of the company are being made only in accordance with authorizations of management and directors of the company; and (iii) provide reasonable assurance regarding prevention or timely detection of unauthorized acquisition, use, or disposition of the company’s assets that could have a material effect on the financial statements.
Because of its inherent limitations, internal control over financial reporting may not prevent or detect misstatements. Also, projections of any evaluation of effectiveness to future periods are subject to the risk that controls may become inadequate because of changes in conditions, or that the degree of compliance with the policies or procedures may deteriorate.
PricewaterhouseCoopers LLP
Denver, Colorado
March 15, 2005February 24, 2006
STATEMENTS OF CONSOLIDATED INCOME
| Years Ended December 31, | ||||||||||||
| 2004 | 2003 | 2002 | ||||||||||
| (in thousands, except per share) | ||||||||||||
Revenues | ||||||||||||
Sales—gold, net | $ | 3,653,563 | $ | 3,082,936 | $ | 2,566,833 | ||||||
Sales—base metals, net | 870,622 | 74,820 | 55,321 | |||||||||
| 4,524,185 | 3,157,756 | 2,622,154 | ||||||||||
Costs and expenses | ||||||||||||
Costs applicable to sales (exclusive of depreciation, depletion and amortization shown separately below) | ||||||||||||
Gold | 1,935,863 | 1,655,989 | 1,580,347 | |||||||||
Base metals | 367,367 | 44,273 | 36,040 | |||||||||
Depreciation, depletion and amortization | 696,522 | 564,481 | 505,598 | |||||||||
Exploration, research and development | 192,409 | 115,238 | 88,886 | |||||||||
General and administrative | 115,848 | 130,292 | 115,252 | |||||||||
Write-down of goodwill (Note 10) | 51,750 | — | — | |||||||||
Write-down of long-lived assets (Note 19) | 39,265 | 35,260 | 3,652 | |||||||||
Other | 34,433 | 49,506 | 29,372 | |||||||||
| 3,433,457 | 2,595,039 | 2,359,147 | ||||||||||
Other income (expense) | ||||||||||||
(Loss) gain on investments, net (Note 4) | (39,019 | ) | 83,166 | 47,086 | ||||||||
Gain (loss) on derivative instruments, net (Note 16) | 2,356 | 22,876 | (39,805 | ) | ||||||||
Gain on extinguishment of NYOL liabilities, net | — | 220,537 | — | |||||||||
Loss on extinguishment of debt | (222 | ) | (33,832 | ) | — | |||||||
Royalty and dividend income | 65,824 | 56,319 | 35,718 | |||||||||
Interest income, foreign currency exchange and other income (Note 20) | 76,948 | 102,182 | 39,885 | |||||||||
Interest expense, net of capitalized interest of $13,058, $8,945 and $5,226, respectively | (97,610 | ) | (88,579 | ) | (129,565 | ) | ||||||
| 8,277 | 362,669 | (46,681 | ) | |||||||||
Pre-tax income before minority interest, equity income and impairment of affiliates and cumulative effect of a change in accounting principle | 1,099,005 | 925,386 | 216,326 | |||||||||
Income tax expense (Note 21) | (275,882 | ) | (206,950 | ) | (19,900 | ) | ||||||
Minority interest in income of subsidiaries | (335,299 | ) | (173,178 | ) | (97,442 | ) | ||||||
Equity loss and impairment of Australian Magnesium Corporation (Note 9) | — | (119,485 | ) | (1,775 | ) | |||||||
Equity income of affiliates (Note 9) | 2,641 | 84,427 | 53,151 | |||||||||
Income before cumulative effect of a change in accounting principle | 490,465 | 510,200 | 150,360 | |||||||||
Cumulative effect of a change in accounting principle, net of tax of $25,382, $11,188 and $(4,147), respectively (Note 3) | (47,138 | ) | (34,533 | ) | 7,701 | |||||||
Net income | 443,327 | 475,667 | 158,061 | |||||||||
Preferred stock dividends | — | — | (3,738 | ) | ||||||||
Net income applicable to common shares | $ | 443,327 | $ | 475,667 | $ | 154,323 | ||||||
Income before cumulative effect of a change in accounting principle per common share, basic | $ | 1.11 | $ | 1.24 | $ | 0.40 | ||||||
Cumulative effect of a change in accounting principle per common share, basic | (0.11 | ) | (0.08 | ) | 0.02 | |||||||
Net income per common share, basic | $ | 1.00 | $ | 1.16 | $ | 0.42 | ||||||
Income before cumulative effect of a change in accounting principle per common share, diluted | $ | 1.10 | $ | 1.23 | $ | 0.39 | ||||||
Cumulative effect of a change in accounting principle per common share, diluted | (0.11 | ) | (0.08 | ) | 0.02 | |||||||
Net income per common share, diluted | $ | 0.99 | $ | 1.15 | $ | 0.41 | ||||||
Basic weighted-average common shares outstanding | 443,463 | 410,600 | 370,940 | |||||||||
Diluted weighted-average common shares outstanding | 446,511 | 413,723 | 372,975 | |||||||||
| Years Ended December 31, | ||||||||||||
| 2005 | 2004 | 2003 | ||||||||||
| (in millions, except per share) | ||||||||||||
Revenues | ||||||||||||
Sales—gold, net | $ | 3,734 | $ | 3,625 | $ | 3,059 | ||||||
Sales—copper, net | 672 | 786 | — | |||||||||
| 4,406 | 4,411 | 3,059 | ||||||||||
Costs and expenses | ||||||||||||
Costs applicable to sales (exclusive of depreciation, depletion and amortization shown separately below) | ||||||||||||
Gold | 2,017 | 1,910 | 1,634 | |||||||||
Copper | 303 | 305 | — | |||||||||
Depreciation, depletion and amortization | 644 | 662 | 530 | |||||||||
Exploration | 147 | 107 | 76 | |||||||||
Advanced projects, research and development | 73 | 80 | 35 | |||||||||
General and administrative | 134 | 116 | 130 | |||||||||
Write-down of goodwill (Note 8) | 41 | 52 | — | |||||||||
Write-down of long-lived assets (Note 16) | 43 | 39 | 35 | |||||||||
Other expense (Note 17) | 111 | 33 | 50 | |||||||||
| 3,513 | 3,304 | 2,490 | ||||||||||
Other income (expense) | ||||||||||||
Other income, net (Note 18) | 269 | 102 | 451 | |||||||||
Interest expense, net of capitalized interest of $39, $13 and $9, respectively | (98 | ) | (98 | ) | (89 | ) | ||||||
| 171 | 4 | 362 | ||||||||||
Income from continuing operations before income tax, minority interest and equity income (loss) of affiliates | 1,064 | 1,111 | 931 | |||||||||
Income tax expense (Note 19) | (314 | ) | (325 | ) | (212 | ) | ||||||
Minority interest in income of subsidiaries | (380 | ) | (335 | ) | (173 | ) | ||||||
Equity income (loss) of affiliates (Note 20) | 4 | 2 | (35 | ) | ||||||||
Income from continuing operations | 374 | 453 | 511 | |||||||||
(Loss) income from discontinued operations (Note 25) | (52 | ) | 37 | — | ||||||||
Cumulative effect of a change in accounting principle, net of tax of $25 in 2004 and $11 in 2003 (Note 3) | — | (47 | ) | (35 | ) | |||||||
Net income | $ | 322 | $ | 443 | $ | 476 | ||||||
Income from continuing operations per common share, basic | $ | 0.84 | $ | 1.02 | $ | 1.24 | ||||||
(Loss) income from discontinued operations per common share, basic | (0.12 | ) | $ | 0.09 | — | |||||||
Cumulative effect of a change in accounting principle per common share, basic | — | (0.11 | ) | (0.08 | ) | |||||||
Net income per common share, basic | $ | 0.72 | $ | 1.00 | $ | 1.16 | ||||||
Income from continuing operations per common share, diluted | $ | 0.83 | $ | 1.01 | $ | 1.23 | ||||||
(Loss) income from discontinued operations per common share, diluted | (0.11 | ) | 0.09 | — | ||||||||
Cumulative effect of a change in accounting principle per common share, diluted | — | (0.11 | ) | (0.08 | ) | |||||||
Net income per common share, diluted | $ | 0.72 | $ | 0.99 | $ | 1.15 | ||||||
Basic weighted-average common shares outstanding | 446 | 443 | 411 | |||||||||
Diluted weighted-average common shares outstanding | 449 | 447 | 414 | |||||||||
Cash dividends declared per common share | $ | 0.40 | $ | 0.30 | $ | 0.17 | ||||||
The accompanying notes are an integral part of these consolidated financial statements.
CONSOLIDATED BALANCE SHEETS
| At December 31, | ||||||
| 2005 | 2004 | |||||
| (in millions) | ||||||
| ASSETS | ||||||
Cash and cash equivalents | $ | 1,082 | $ | 781 | ||
Marketable securities and other short-term investments (Note 4) | 817 | 943 | ||||
Trade receivables | 94 | 77 | ||||
Accounts receivable | 136 | 130 | ||||
Inventories (Note 5) | 320 | 244 | ||||
Stockpiles and ore on leach pads (Note 6) | 255 | 230 | ||||
Deferred stripping costs (Note 23) | 78 | 44 | ||||
Deferred income tax assets (Note 19) | 159 | 173 | ||||
Other current assets | 95 | 71 | ||||
Current assets | 3,036 | 2,693 | ||||
Property, plant and mine development, net (Note 7) | 5,645 | 5,136 | ||||
Investments (Note 4) | 955 | 386 | ||||
Long-term stockpiles and ore on leach pads (Note 6) | 603 | 525 | ||||
Deferred stripping costs (Note 23) | 100 | 80 | ||||
Deferred income tax assets (Note 19) | 517 | 494 | ||||
Other long-term assets | 183 | 184 | ||||
Goodwill (Note 8) | 2,879 | 2,994 | ||||
Assets of operations held for sale (Note 25) | 74 | 284 | ||||
Total assets | $ | 13,992 | $ | 12,776 | ||
| LIABILITIES | ||||||
Current portion of long-term debt (Note 9) | $ | 196 | $ | 286 | ||
Accounts payable | 232 | 222 | ||||
Employee-related benefits (Note 10) | 176 | 129 | ||||
Derivative instruments | 270 | 71 | ||||
Other current liabilities (Note 12) | 476 | 375 | ||||
Current liabilities | 1,350 | 1,083 | ||||
Long-term debt (Note 9) | 1,733 | 1,316 | ||||
Reclamation and remediation liabilities (Note 13) | 445 | 418 | ||||
Deferred income tax liabilities (Note 19) | 449 | 460 | ||||
Employee-related benefits (Note 10) | 273 | 244 | ||||
Other long-term liabilities (Note 12) | 414 | 487 | ||||
Liabilities of operations held for sale (Note 25) | 21 | 55 | ||||
Total liabilities | 4,685 | 4,063 | ||||
Commitments and contingencies (Note 30) | ||||||
Minority interest in subsidiaries | 931 | 775 | ||||
| STOCKHOLDERS’ EQUITY | ||||||
Common stock—$1.60 par value; | ||||||
Authorized—750 million shares Issued and outstanding— | ||||||
Common: 417 million and 410 million shares issued, less 234,000 and 201,000 treasury shares, respectively | 666 | 656 | ||||
Exchangeable: 56 million shares issued, less 25 million and 20 million redeemed shares, respectively | ||||||
Additional paid-in capital | 6,578 | 6,524 | ||||
Accumulated other comprehensive income (Note 15) | 378 | 147 | ||||
Retained earnings | 754 | 611 | ||||
Total stockholders’ equity | 8,376 | 7,938 | ||||
Total liabilities and stockholders’ equity | $ | 13,992 | $ | 12,776 | ||
The accompanying notes are an integral part of these consolidated financial statements.
STATEMENTS OF CONSOLIDATED CHANGES IN STOCKHOLDERS’ EQUITY
| Common Stock | Additional Paid-In Capital | Accumulated Other Comprehensive Income (Loss) | Retained Earnings (Deficit) | ||||||||||||||
| Shares | Amount | ||||||||||||||||
| (in millions) | |||||||||||||||||
Balance at December 31, 2002 | 402 | $ | 565 | $ | 5,038 | $ | (64 | ) | $ | (120 | ) | ||||||
Shares issued under retirement savings plans | — | — | 8 | — | — | ||||||||||||
Shares issued under stock compensation plans | 4 | 7 | 116 | — | — | ||||||||||||
Shares issued for the exercise of Class B warrants | 6 | 9 | 165 | — | — | ||||||||||||
Common shares issued for acquisitions | 5 | 8 | 127 | — | — | ||||||||||||
Shares issued in exchange for exchangeable shares | — | 9 | (9 | ) | — | — | |||||||||||
Equity offering | 25 | 40 | 987 | — | — | ||||||||||||
Net income | — | — | — | — | 476 | ||||||||||||
Common stock dividends | — | — | (16 | ) | — | (55 | ) | ||||||||||
Dilution of AMC ownership | — | — | 7 | — | — | ||||||||||||
Unrealized loss on marketable equity securities | — | — | — | (5 | ) | — | |||||||||||
Foreign currency translation adjustments | — | — | — | 23 | — | ||||||||||||
Minimum pension liability adjustments | — | — | — | — | — | ||||||||||||
Change in fair value of cash flow hedge instruments | — | — | — | 69 | — | ||||||||||||
Balance at December 31, 2003 | 442 | $ | 638 | $ | 6,423 | $ | 23 | $ | 301 | ||||||||
Shares issued under retirement savings plans | — | — | 8 | — | — | ||||||||||||
Shares issued under stock compensation plans | 4 | 6 | 105 | — | — | ||||||||||||
Net income | — | — | — | — | 443 | ||||||||||||
Common stock dividends | — | — | — | — | (133 | ) | |||||||||||
Shares issued in exchange for exchangeable shares | — | 12 | (12 | ) | — | — | |||||||||||
Unrealized gain on marketable equity securities | — | — | — | 123 | — | ||||||||||||
Foreign currency translation adjustments | — | — | — | 31 | — | ||||||||||||
Minimum pension liability adjustments | — | — | — | (11 | ) | — | |||||||||||
Changes in fair value of cash flow hedge instruments | — | — | — | (19 | ) | — | |||||||||||
Balance at December 31, 2004 | 446 | $ | 656 | $ | 6,524 | $ | 147 | $ | 611 | ||||||||
Shares issued under retirement savings plans | — | — | 9 | — | — | ||||||||||||
Shares issued under stock compensation plans | 2 | 3 | 52 | — | — | ||||||||||||
Net income | — | — | — | — | 322 | ||||||||||||
Common stock dividends | — | — | — | — | (179 | ) | |||||||||||
Shares issued in exchange for exchangeable shares | — | 7 | (7 | ) | — | — | |||||||||||
Unrealized gain on marketable equity securities | — | — | — | 282 | — | ||||||||||||
Foreign currency translation adjustments | — | — | — | 26 | — | ||||||||||||
Minimum pension liability adjustments | — | — | — | (18 | ) | — | |||||||||||
Changes in fair value of cash flow hedge instruments | — | — | — | (59 | ) | — | |||||||||||
Balance at December 31, 2005 | 448 | $ | 666 | $ | 6,578 | $ | 378 | $ | 754 | ||||||||
The accompanying notes are an integral part of these consolidated financial statements.
STATEMENTS OF CONSOLIDATED CASH FLOWS
| Years Ended December 31, | ||||||||||||
| 2005 | 2004 | 2003 | ||||||||||
| (in millions) | ||||||||||||
Operating activities: | ||||||||||||
Net income | $ | 322 | $ | 443 | $ | 476 | ||||||
Adjustments to reconcile net income to net cash provided from operating activities: | ||||||||||||
Depreciation, depletion and amortization | 644 | 662 | 530 | |||||||||
Minority interest expense | 380 | 335 | 173 | |||||||||
Loss (income) from discontinued operations | 52 | (37 | ) | — | ||||||||
Revenue from prepaid forward sales obligation | (48 | ) | — | — | ||||||||
Accretion of accumulated reclamation obligations | 27 | 25 | 23 | |||||||||
Amortization of deferred stripping costs, net | (56 | ) | 4 | (36 | ) | |||||||
Deferred income taxes | (12 | ) | 74 | (31 | ) | |||||||
Write-down of inventories, stockpiles and ore on leach pads | 13 | 25 | 18 | |||||||||
Write-down of long-lived assets | 43 | 39 | 35 | |||||||||
Write-down of goodwill | 41 | 52 | — | |||||||||
Cumulative effect of change in accounting principle, net | — | 47 | 35 | |||||||||
(Gain) loss on investments, net | (54 | ) | 39 | (83 | ) | |||||||
Gain on extinguishment of NYOL liabilities, net | — | — | (221 | ) | ||||||||
(Gain) loss on guarantee of QMC debt | (9 | ) | (11 | ) | 30 | |||||||
Gain on asset sales, net | (48 | ) | (28 | ) | (15 | ) | ||||||
Hedge loss, net | 99 | 10 | — | |||||||||
Other operating adjustments | 56 | (23 | ) | (53 | ) | |||||||
Decrease (Increase) in operating assets: | ||||||||||||
Trade and accounts receivable | (65 | ) | (6 | ) | 5 | |||||||
Inventories, stockpiles and ore on leach pads | (189 | ) | (15 | ) | (73 | ) | ||||||
Other assets | (32 | ) | (1 | ) | (5 | ) | ||||||
Increase (Decrease) in operating liabilities: | ||||||||||||
Accounts payable and other accrued liabilities | 137 | (37 | ) | (23 | ) | |||||||
Early settlement of derivative instruments classified as cash flow hedges | — | — | (119 | ) | ||||||||
Reclamation liabilities | (48 | ) | (48 | ) | (21 | ) | ||||||
Net cash provided from continuing operations | 1,253 | 1,549 | 645 | |||||||||
Net cash (used in) provided from discontinued operations | (10 | ) | 8 | 39 | ||||||||
Net cash from operations | 1,243 | 1,557 | 684 | |||||||||
Investing activities: | ||||||||||||
Additions to property, plant and mine development | (1,226 | ) | (683 | ) | (484 | ) | ||||||
Additions to property, plant and mine development of discontinued operations | (25 | ) | (35 | ) | (21 | ) | ||||||
Investments in marketable debt and equity securities | (3,301 | ) | (1,720 | ) | (189 | ) | ||||||
Proceeds from sale of marketable debt and equity securities | 3,358 | 899 | 412 | |||||||||
Proceeds from sale of discontinued operations | 147 | — | — | |||||||||
Cash recorded upon consolidation of Batu Hijau | — | 82 | — | |||||||||
Proceeds from sale of assets | 79 | 51 | 6 | |||||||||
Early settlement of ineffective derivative instruments | — | 8 | (58 | ) | ||||||||
Investments in affiliates | — | — | (70 | ) | ||||||||
Other investing | (9 | ) | (34 | ) | 24 | |||||||
Net cash used in investing activities | (977 | ) | (1,432 | ) | (380 | ) | ||||||
Financing activities: | ||||||||||||
Proceeds from debt, net | 583 | 56 | 493 | |||||||||
Repayments of debt | (218 | ) | (254 | ) | (1,162 | ) | ||||||
Dividends paid to common stockholders | (179 | ) | (133 | ) | (71 | ) | ||||||
Dividends paid to minority interests | (186 | ) | (237 | ) | (146 | ) | ||||||
Proceeds from stock issuance | 43 | 78 | 1,287 | |||||||||
Change in restricted cash and other | (5 | ) | 15 | — | ||||||||
Net cash provided from (used in) financing activities | 38 | (475 | ) | 401 | ||||||||
Effect of exchange rate changes on cash | (3 | ) | 2 | 24 | ||||||||
Net change in cash and cash equivalents | 301 | (348 | ) | 729 | ||||||||
Cash and cash equivalents at beginning of year | 781 | 1,129 | 400 | |||||||||
Cash and cash equivalents at end of year | $ | 1,082 | $ | 781 | $ | 1,129 | ||||||
See Note 26 for supplemental cash flow information.
The accompanying notes are an integral part of these consolidated financial statements.
CONSOLIDATED BALANCE SHEETS
| At December 31, | ||||||
| 2004 | 2003 | |||||
| (in thousands) | ||||||
ASSETS | ||||||
Cash and cash equivalents | $ | 782,706 | $ | 1,131,072 | ||
Marketable securities and other short-term investments (Note 4) | 943,162 | 457,543 | ||||
Trade receivables | 79,516 | 20,055 | ||||
Accounts receivable | 130,961 | 70,631 | ||||
Inventories (Note 5) | 264,374 | 225,719 | ||||
Stockpiles and ore on leach pads (Note 6) | 231,626 | 248,625 | ||||
Deferred stripping costs (Note 7) | 44,545 | 60,086 | ||||
Deferred income tax assets (Note 21) | 173,588 | 45,034 | ||||
Other current assets | 70,671 | 100,280 | ||||
Current assets | 2,721,149 | 2,359,045 | ||||
Property, plant and mine development, net (Note 8) | 5,360,892 | 3,715,457 | ||||
Investments (Note 9) | 386,173 | 733,977 | ||||
Long-term stockpiles and ore on leach pads (Note 6) | 524,831 | 305,810 | ||||
Deferred stripping costs (Note 7) | 79,753 | 30,293 | ||||
Deferred income tax assets (Note 21) | 491,708 | 404,020 | ||||
Other long-term assets | 180,247 | 106,995 | ||||
Goodwill (Note 10) | 3,025,935 | 3,042,557 | ||||
Total assets | $ | 12,770,688 | $ | 10,698,154 | ||
LIABILITIES | �� | |||||
Current portion of long-term debt (Note 11) | $ | 285,477 | $ | 190,866 | ||
Accounts payable | 230,976 | 163,164 | ||||
Employee-related benefits (Note 12) | 134,524 | 136,301 | ||||
Other current liabilities (Note 14) | 450,028 | 352,202 | ||||
Current liabilities | 1,101,005 | 842,533 | ||||
Long-term debt (Note 11) | 1,311,260 | 886,633 | ||||
Reclamation and remediation liabilities (Note 15) | 431,500 | 362,283 | ||||
Deferred revenue from sale of future production (Note 16) | 46,841 | 53,841 | ||||
Deferred income tax liabilities (Note 21) | 476,134 | 272,603 | ||||
Employee-related benefits (Note 12) | 249,754 | 253,726 | ||||
Advanced stripping costs (Note 7) | 102,831 | — | ||||
Other long-term liabilities | 338,643 | 295,082 | ||||
Total liabilities | 4,057,968 | 2,966,701 | ||||
Commitments and contingencies (Note 27) | ||||||
Minority interest in subsidiaries | 775,060 | 346,518 | ||||
STOCKHOLDERS’ EQUITY | ||||||
Common stock—$1.60 par value; Authorized—750 million shares Issued and outstanding— | ||||||
Common: 409.9 million and 398.7 million shares issued, less 201,000 and 105,000 treasury shares, respectively | 655,759 | 638,046 | ||||
Exchangeable: 55.9 million shares issued, less 20.0 million and 12.7 million redeemed shares, respectively | ||||||
Additional paid-in capital | 6,524,412 | 6,423,278 | ||||
Accumulated other comprehensive income (Note 18) | 146,677 | 22,827 | ||||
Retained earnings | 610,812 | 300,784 | ||||
Total stockholders’ equity | 7,937,660 | 7,384,935 | ||||
Total liabilities and stockholders’ equity | $ | 12,770,688 | $ | 10,698,154 | ||
The accompanying notes are an integral part of these consolidated financial statements.
STATEMENTS OF CONSOLIDATED CHANGES IN STOCKHOLDERS’ EQUITY
| Convertible Preferred Amount | Common Stock | Additional Paid-In Capital | Accumulated Other Comprehensive Income (Loss) | Retained Earnings (Deficit) | |||||||||||||||||
| Shares | Amount | ||||||||||||||||||||
| (in thousands) | |||||||||||||||||||||
Balance at December 31, 2001 | $ | 11,500 | 196,165 | $ | 313,881 | $ | 1,458,369 | $ | (9,448 | ) | $ | (274,536 | ) | ||||||||
Redemption of convertible preferred stock | (11,500 | ) | 4,413 | 7,060 | 6,306 | — | — | ||||||||||||||
Shares issued under retirement savings plans | — | 291 | 465 | 7,132 | — | — | |||||||||||||||
Shares issued under stock compensation plans | — | 4,117 | 6,522 | 64,032 | — | — | |||||||||||||||
Common shares issued for acquisitions | — | 141,166 | 225,867 | 2,456,630 | — | — | |||||||||||||||
Exchangeable shares issued for acquisitions | — | 55,874 | — | 1,061,730 | — | — | |||||||||||||||
Options and warrants assumed for acquisitions | — | — | — | 43,606 | — | — | |||||||||||||||
Shares issued in exchange for exchangeable shares | — | — | 11,224 | (11,224 | ) | — | — | ||||||||||||||
Net income | — | — | — | — | — | 158,061 | |||||||||||||||
Common stock dividends | — | — | — | (48,113 | ) | — | — | ||||||||||||||
Preferred stock dividends | — | — | — | — | — | (3,738 | ) | ||||||||||||||
Unrealized loss on marketable equity securities | — | — | — | — | (12,824 | ) | — | ||||||||||||||
Foreign currency translation adjustments | — | — | — | — | 3,622 | — | |||||||||||||||
Minimum pension liability adjustments | — | — | — | — | (28,655 | ) | — | ||||||||||||||
Changes in fair value of cash flow hedge instruments | — | — | — | — | (16,721 | ) | — | ||||||||||||||
Balance at December 31, 2002 | — | 402,026 | 565,019 | 5,038,468 | (64,026 | ) | (120,213 | ) | |||||||||||||
Shares issued under retirement savings plans | — | 241 | 386 | 7,809 | — | — | |||||||||||||||
Shares issued under stock compensation plans | — | 4,094 | 6,829 | 115,893 | — | — | |||||||||||||||
Shares issued for the exercise of Class B warrants | — | 5,253 | 8,405 | 165,192 | — | — | |||||||||||||||
Common shares issued for acquisitions | — | 5,238 | 8,380 | 126,583 | — | — | |||||||||||||||
Shares issued in exchange for exchangeable shares | — | — | 9,027 | (9,027 | ) | — | — | ||||||||||||||
Equity offering | — | 25,000 | 40,000 | 987,442 | — | — | |||||||||||||||
Net income | — | — | — | — | — | 475,667 | |||||||||||||||
Common stock dividends | — | — | — | (16,089 | ) | — | (54,670 | ) | |||||||||||||
Dilution of AMC ownership | — | — | — | 7,007 | — | — | |||||||||||||||
Unrealized loss on marketable equity securities | — | — | — | — | (5,044 | ) | — | ||||||||||||||
Foreign currency translation adjustments | — | — | — | — | 23,183 | — | |||||||||||||||
Minimum pension liability adjustments | — | — | — | — | 350 | — | |||||||||||||||
Change in fair value of cash flow hedge instruments | — | — | — | — | 68,364 | — | |||||||||||||||
Balance at December 31, 2003 | $ | — | 441,852 | $ | 638,046 | $ | 6,423,278 | $ | 22,827 | $ | 300,784 | ||||||||||
Shares issued under retirement savings plans | — | 205 | 328 | 8,411 | — | — | |||||||||||||||
Shares issued under stock compensation plans | — | 3,510 | 5,615 | 104,493 | — | — | |||||||||||||||
Net income | — | — | — | — | — | 443,327 | |||||||||||||||
Common stock dividends | — | — | — | — | — | (133,299 | ) | ||||||||||||||
Shares issued in exchange for exchangeable shares | — | — | 11,770 | (11,770 | ) | — | — | ||||||||||||||
Unrealized gain on marketable equity securities | — | — | — | — | 123,077 | — | |||||||||||||||
Foreign currency translation adjustments | — | — | — | — | 30,726 | — | |||||||||||||||
Minimum pension liability adjustments | — | — | — | — | (11,066 | ) | — | ||||||||||||||
Changes in fair value of cash flow hedge instruments | — | — | — | — | (18,887 | ) | — | ||||||||||||||
Balance at December 31, 2004 | $ | — | 445,567 | $ | 655,759 | $ | 6,524,412 | $ | 146,677 | $ | 610,812 | ||||||||||
The accompanying notes are an integral part of these consolidated financial statements.
STATEMENTS OF CONSOLIDATED CASH FLOWS
| Years Ended December 31, | ||||||||||||
| 2004 | 2003 | 2002 | ||||||||||
| (in thousands) | ||||||||||||
Operating activities: | ||||||||||||
Net income | $ | 443,327 | $ | 475,667 | $ | 158,061 | ||||||
Adjustments to reconcile net income to net cash provided by operating activities: | ||||||||||||
Depreciation, depletion and amortization | 696,522 | 564,481 | 505,598 | |||||||||
Accretion of accumulated reclamation obligations | 25,535 | 22,610 | — | |||||||||
Amortization of deferred stripping costs, net | 4,093 | (36,497 | ) | 37,195 | ||||||||
Deferred income taxes | 24,787 | (36,183 | ) | (100,290 | ) | |||||||
Foreign currency exchange gain | (9,213 | ) | (96,971 | ) | (14,020 | ) | ||||||
Minority interest expense | 335,299 | 173,178 | 97,442 | |||||||||
Equity loss (income) and impairment of affiliates, net of dividends | (930 | ) | 42,467 | (35,595 | ) | |||||||
Write-down of inventories, stockpiles and ore on leach pads | 32,786 | 24,945 | 44,439 | |||||||||
Write-down of long-lived assets | 39,265 | 35,260 | 3,652 | |||||||||
Write-down of goodwill | 51,750 | — | — | |||||||||
Cumulative effect of change in accounting principle, net | 47,138 | 34,533 | (7,701 | ) | ||||||||
Loss (gain) on investments, net | 39,019 | (83,166 | ) | (47,086 | ) | |||||||
(Gain) loss on derivative instruments, net | (2,356 | ) | (22,876 | ) | 39,805 | |||||||
Gain on extinguishment of NYOL liabilities, net | — | (220,537 | ) | — | ||||||||
(Gain) loss on guarantee of QMC debt | (10,616 | ) | 30,000 | — | ||||||||
Loss on extinguishment of debt | 222 | 33,832 | — | |||||||||
Gain on asset sales, net | (28,004 | ) | (15,394 | ) | (10,104 | ) | ||||||
Other operating adjustments | (58,814 | ) | (9,079 | ) | — | |||||||
(Increase) decrease in operating assets: | ||||||||||||
Accounts receivable | 68,990 | 5,859 | 24,867 | |||||||||
Inventories, stockpiles and ore on leach pads | (23,257 | ) | (72,828 | ) | (9,546 | ) | ||||||
Other assets | (1,372 | ) | (5,052 | ) | 52,383 | |||||||
Increase (decrease) in operating liabilities: | ||||||||||||
Accounts payable and other accrued liabilities | (69,722 | ) | (19,096 | ) | (44,630 | ) | ||||||
Early settlement of derivative instruments classified as cash flow hedges | — | (118,776 | ) | (11,857 | ) | |||||||
Reclamation liabilities | (47,697 | ) | (21,990 | ) | 2,048 | |||||||
Net cash provided by operating activities | 1,556,752 | 684,387 | 684,661 | |||||||||
Investing activities: | ||||||||||||
Additions to property, plant and mine development | (717,961 | ) | (504,535 | ) | (300,057 | ) | ||||||
Investments in marketable debt and equity securities | (1,719,995 | ) | (189,355 | ) | — | |||||||
Proceeds from sale of marketable debt and equity securities | 899,130 | 232,190 | 404,447 | |||||||||
Cash recorded upon consolidation of Batu Hijau | 82,203 | — | — | |||||||||
Proceeds from sale of assets | 51,200 | 5,610 | 28,148 | |||||||||
Early settlement of ineffective derivative instruments | 7,775 | (57,556 | ) | (21,056 | ) | |||||||
Funding of QMC loan receivable | (23,163 | ) | — | — | ||||||||
Proceeds from sale of investments | — | 180,000 | 86,656 | |||||||||
Investments in affiliates | — | (70,072 | ) | — | ||||||||
Cash consideration for acquisitions | — | (11,195 | ) | (461,717 | ) | |||||||
Cash received from acquisitions, net of transaction costs | — | — | 371,417 | |||||||||
Other | (11,406 | ) | 34,899 | 4,272 | ||||||||
Net cash (used in) provided by investing activities | (1,432,217 | ) | (380,014 | ) | 112,110 | |||||||
Financing activities: | ||||||||||||
Proceeds from debt | 55,921 | 492,841 | 493,371 | |||||||||
Repayments of debt | (253,711 | ) | (1,162,167 | ) | (1,040,807 | ) | ||||||
Dividends paid on common and preferred stock | (133,300 | ) | (70,759 | ) | (49,982 | ) | ||||||
Dividends paid to minority interests | (236,917 | ) | (145,950 | ) | (28,844 | ) | ||||||
Proceeds from stock issuance | 77,531 | 1,286,751 | 67,346 | |||||||||
Change in restricted cash and other | 15,260 | — | (3 | ) | ||||||||
Net cash (used in) provided by financing activities | (475,216 | ) | 400,716 | (558,919 | ) | |||||||
Effect of exchange rate changes on cash | 2,315 | 24,300 | 14,400 | |||||||||
Net change in cash and cash equivalents | (348,366 | ) | 729,389 | 252,252 | ||||||||
Cash and cash equivalents at beginning of year | 1,131,072 | 401,683 | 149,431 | |||||||||
Cash and cash equivalents at end of year | $ | 782,706 | $ | 1,131,072 | $ | 401,683 | ||||||
See Note 23 for supplemental cash flow information.
The accompanying notes are an integral part of these consolidated financial statements.
NOTES TO CONSOLIDATED FINANCIAL STATEMENTS
(dollars in millions, except per share, per ounce and per pound amounts)
NOTE 1 THE COMPANY
Newmont Mining Corporation and its affiliates and subsidiaries (collectively, “Newmont” or the “Company”) predominantly operates in a single industry, namely, exploration for and production of gold and copper.
gold.
The Company’s sales result from operations in the United States, Australia, Peru, Indonesia, Canada, Uzbekistan, Turkey, Bolivia, New Zealand and Mexico. The cash flow and profitability of the Company’s operations are significantly affected by the market price of gold, and to a lesser extent, copper. These commodity pricesThe price of gold and copper can fluctuate widely and are affected by numerous factors beyond the Company’s control.
References to “A$” refers to Australian currency, “CDN$” to Canadian currency, “CHF” to Swiss currency, “NZD$” to New Zealand currency, “IDR” to Indonesian currency, and “$” or “U.S.$” to United States currency.
NOTE 2 SUMMARY OF SIGNIFICANT ACCOUNTING POLICIES
Use of Estimates
The Company’s Consolidated Financial Statements have been prepared in accordance with accounting principles generally accepted in the United States of America. The preparation of the Company’s Consolidated Financial Statements requires the Company to make estimates and assumptions that affect the reported amounts of assets and liabilities and the related disclosure of contingent assets and liabilities at the date of the Consolidated Financial Statements and the reported amounts of revenues and expenses during the reporting period. The more significant areas requiring the use of management estimates and assumptions relate to mineral reserves that are the basis for future cash flow estimates and units-of-production depreciation, depletion and amortization calculations; environmental, reclamation and closure obligations; estimates of recoverable gold and other minerals in stockpile and leach pad inventories; asset impairments (including impairments of goodwill, long-lived assets and investments); write-downs of inventory to net realizable value; post employment, post retirement and other employee benefit liabilities; valuation allowances for deferred tax assets; reserves for contingencies and litigation; and the fair value and accounting treatment of financial instruments. The Company bases its estimates on historical experience and on various other assumptions that are believed to be reasonable under the circumstances. Accordingly, actual results may differ significantly from these estimates under different assumptions or conditions.
Principles of Consolidation
The Consolidated Financial Statements include the accounts of Newmont Mining Corporation and more-than-50%-owned subsidiaries that it controls and entities over which control is achieved through means other than voting rights (see Note 3). The Company also includes its pro-rata share of assets, liabilities and operations for unincorporated joint ventures in which it has an interest. All significant intercompany balances and transactions have been eliminated. The functional currency for the majority of the Company’s operations, including the Australian operations, is the U.S. dollar. The functional currency of the Canadian operations is the Canadian dollar.
Cash and Cash Equivalents
Cash and cash equivalents consist of all cash balances and highly liquid investments with an original maturity of three months or less. Because of the short maturity of these investments, the carrying amounts
NEWMONT MINING CORPORATION
NOTES TO CONSOLIDATED FINANCIAL STATEMENTS—(Continued)
approximate their fair value. Cash and cash equivalents are invested in United States Treasury bills and high-quality commercial paper. Restricted cash is excluded from cash and cash equivalents and is included in other current and long-term assets.
NEWMONT MINING CORPORATION
At December 31, 2004, the Company included restricted cash of $1.4 millionNOTES TO CONSOLIDATED FINANCIAL STATEMENTS—(Continued)
(dollars in millions, except per share, per ounce and $66.3 million inOther current assets andOther long-term assets, respectively, primarily related to the Batu Hijau project financing facility. At December 31, 2003, the Company included restricted cash of $16.7 million and $7.2 million inOther current assets andOther long-term assets,respectively, primarily relating to project financings for Yanacocha.per pound amounts)
Investments
Management determines the appropriate classification of its investments in equity securities at the time of purchase and reevaluates such determinations at each reporting date. Investments in incorporated entities in which the Company’s ownership is greater than 20% and less than 50%, or which the Company does not control through majority ownership or means other than voting rights, are accounted for by the equity method and are included in long-term assets. The Company periodically reviews and accounts for its equity methodsecurity investments in accordance with Financial Accounting Standards Board (“FASB”) Statement of Financial Accounting Standards (“SFAS”) No. 115, “Accounting for Certain Investments in Debt and Equity Securities.” Additional information concerning the Company’s equity method and security investments is included in Note 9.
4.
The Company accounts for its investments in auction rate securities in accordance with SFAS No. 115 and its policy regarding cash equivalents.115. Specifically, when the underlying security of an auction rate security has a stated or contractual maturity date in excess of 90 days, regardless of the frequency of the interest rate reset date, the security is classified as an available-for-sale marketable debt security.
Stockpiles, Ore on Leach Pads and Inventories
As described below, costs that are incurred in or benefit the productive process are accumulated as stockpiles, ore on leach pads and inventories. Stockpiles, ore on leach pads and inventories are carried at the lower of average cost or net realizable value. Net realizable value represents the estimated future sales price of the product based on prevailingcurrent and long-term metals prices, less the estimated costs to complete production and bring the product to sale. Write-downs of stockpiles, ore on leach pads and inventories, resulting from net realizable value impairments, are reported as a component ofCosts applicable to sales. The current portion of stockpiles, ore on leach pads and inventories is determined based on the expected amounts to be processed within the next 12 months. Stockpiles, ore on leach pads and inventories not expected to be processed within the next 12 months are classified as long-term. The major classifications are as follows:
Stockpiles
Stockpiles represent ore that has been mined and is available for further processing. Stockpiles are measured by estimating the number of tons added and removed from the stockpile, the number of contained ounces or pounds (based on assay data) and the estimated metallurgical recovery rates (based on the expected processing method). Stockpile ore tonnages are verified by periodic surveys. Costs are allocated to a stockpilestockpiles based on relative values of material stockpiled and processed using current mining costs incurred up to the point of stockpiling the ore, including applicable overhead, depreciation, depletion and amortization relating to mining operations, and removed at each stockpile’s average cost per recoverable unit.
Ore on Leach Pads
The recovery of gold from certain gold oxide ores is achieved through the heap leaching process. Under this method, oxide ore is placed on leach pads where it is treated with a chemical solution, which dissolves the gold
NEWMONT MINING CORPORATION
NOTES TO CONSOLIDATED FINANCIAL STATEMENTS—(Continued)
contained in the ore. The resulting “pregnant” solution is further processed in a plant where the gold is recovered. For accounting purposes, costs are added to ore on leach pads based on current mining costs, including applicable depreciation, depletion and amortization relating to mining operations. Costs are removed from ore on leach pads as ounces are recovered based on the average cost per estimated recoverable ounce of gold on the leach pad.
The estimates of recoverable gold on the leach pads are calculated from the quantities of ore placed on the leach pads (measured tons added to the leach pads), the grade of ore placed on the leach pads (based on assay
NEWMONT MINING CORPORATION
NOTES TO CONSOLIDATED FINANCIAL STATEMENTS—(Continued)
(dollars in millions, except per share, per ounce and per pound amounts)
data) and a recovery percentage (based on ore type). In general, leach pads recover approximately 50% to 95% of the recoverable ounces in the first year of leaching, declining each year thereafter until the leaching process is complete.
Although the quantities of recoverable gold placed on the leach pads are reconciled by comparing the grades of ore placed on pads to the quantities of gold actually recovered (metallurgical balancing), the nature of the leaching process inherently limits the ability to precisely monitor inventory levels. As a result, the metallurgical balancing process is constantly monitored and estimates are refined based on actual results over time. Historically, the Company’s operating results have not been materially impacted by variations between the estimated and actual recoverable quantities of gold on its leach pads. At December 31, 20042005 and 2003,2004, the weighted-average cost per recoverable ounce of gold on leach pads was $142$133 and $136$142 per ounce (unaudited), respectively. Variations between actual and estimated quantities resulting from changes in assumptions and estimates that do not result in write-downs to net realizable value are accounted for on a prospective basis.
The ultimate recovery of gold from a leach pad will not be known until the leaching process is concluded.complete. Based on current mine plans, the Company expects to place the last ton of ore on its current leach pads at dates ranging from 20072006 to 20212017 (unaudited). Including the estimated time required for residual leaching, rinsing and reclamation activities, the Company expects that its leaching operations will terminate within approximately six years (unaudited) following the date that the last ton of ore is placed on the leach pad.
The current portion of ore on leach pads is determined based on estimates of the quantities of gold at the balance sheet date that is expected to be recovered during the next 12 months.
In-process Inventory
In-process inventories represent materials that are currently in the process of being converted to a saleable product. Conversion processes vary depending on the nature of the ore and the specific mining operation,processing facility, but include mill in-circuit, leach in-circuit, flotation and column cells, and carbon in-pulp inventories. In-process material is measured based on assays of the material fed into the process and the projected recoveries of the respective plants. In-process inventories are valued at the average cost of the material fed into the process attributable to the source material coming from the mines, stockpiles and/or leach pads plus the in-process conversion costs, including applicable depreciation relating to the process facilities incurred to that point in the process.
Precious Metals Inventory
Precious metals inventories include gold doré and/or gold bullion. Precious metals that are received as in-kind payments of royalties are valued at fair value on the date title is transferred to the Company. Precious metals that result from the Company’s mining and processing activities are valued at the average cost of the respective in-process inventories incurred prior to the refining process, plus applicable refining costs.
NEWMONT MINING CORPORATION
NOTES TO CONSOLIDATED FINANCIAL STATEMENTS—(Continued)
Concentrate Inventory
Concentrate inventories represent saleable copper zinc and lead concentrate available for shipment. The Company values concentrate inventory at the average cost, including an allocable portion of mill support costs and mill depreciation. Costs are added and removed to the concentrate inventory based on tons of concentrate.concentrate and are valued at the lower of average cost or net realizable value.
NEWMONT MINING CORPORATION
NOTES TO CONSOLIDATED FINANCIAL STATEMENTS—(Continued)
(dollars in millions, except per share, per ounce and per pound amounts)
Materials and Supplies
Materials and supplies are valued at the lower of average cost or net realizable value. Cost includes applicable taxes and freight.
Property, Plant and Mine Development
Expenditures for new facilities or equipment and expenditures that extend the useful lives of existing facilities or equipment are capitalized and depreciated using the straight-line method at rates sufficient to depreciate such costs over the estimated productive lives, which do not exceed the related estimated mine lives, of such facilities based on proven and probable reserves.
Mineral exploration costs are expensed as incurred. When it has been determined that a mineral property can be economically developed as a result of establishing proven and probable reserves, costs incurred prospectively to develop the property are capitalized as incurred and are amortized using the units-of-production (“UOP”) method over the estimated life of the ore body based on estimated recoverable ounces or pounds mined fromin proven and probable reserves. At the Company’s surface mines, these costs include costs to further delineate the ore body and remove overburden to initially expose the ore body. At the Company’s underground mines, these costs include the cost of building access ways, shaft sinking and access, lateral development, drift development, ramps and infrastructure development.
Major development costs incurred after the commencement of production are amortized using the UOP method based on estimated recoverable ounces or pounds mined fromin proven and probable reserves. To the extent that these costs benefit the entire ore body, they are amortized over the estimated life of the ore body. Costs incurred to access specific ore blocks or areas that only provide benefit over the life of that area are amortized over the estimated life of that specific ore block or area.
Interest expense allocable to the cost of developing mining properties and to constructing new facilities is capitalized until assets are ready for their intended use.
Mineral Interests
Mineral interests include acquired mineral rights and royalty interests in production, development and exploration stage properties. The amount capitalized related to a mineral or royalty interest represents its fair value at the time it was acquired, either as an individual asset purchase or as a part of a business combination.
Mineral Rights
Newmont’s mineral interests relate to production, development or exploration stage properties. The value of such assets is primarily driven by the nature and amount of mineralized material believed to be contained in such properties. Production stage mineral interests represent interests in operating properties that contain proven and probable reserves. Development stage mineral interests represent interests in properties under development that contain proven and probable reserves. Exploration stage mineral interests represent interests in properties that are
NEWMONT MINING CORPORATION
NOTES TO CONSOLIDATED FINANCIAL STATEMENTS—(Continued)
believed to potentially contain mineralized material consisting of (i) other mineralized material such as inferred material within pits; measured, indicated and inferred material with insufficient drill spacing to qualify as proven and probable reserves; and inferred material in close proximity to proven and probable reserves; (ii) around-mine exploration potential such as inferred material not immediately adjacent to existing reserves and mineralization but located within the immediate mine area; (iii) other mine-related exploration potential that is not part of measured, indicated or inferred material and is comprised mainly of material outside of the immediate mine area; or (iv) greenfields exploration potential that is not associated with any other production, development or
NEWMONT MINING CORPORATION
NOTES TO CONSOLIDATED FINANCIAL STATEMENTS—(Continued)
(dollars in millions, except per share, per ounce and per pound amounts)
exploration stage property, as described above. The Company’s mineral rights generally are enforceable regardless of whether proven and probable reserves have been established. In certain limited situations, the nature of a mineral right changes from an exploration right to a mining right upon the establishment of proven and probable reserves. The Company has the ability and intent to renew mineral rightsinterests where the existing term is not sufficient to recover all identified and valued proven and probable reserves and/or undeveloped mineralized material.
Royalty Interests
Newmont’s royalty interests are generally in the form of a net smelter return (“NSR”) royalty, which provides for the payment either in cash or physical metal (“in-kind”) of a specified percentage of production less certain specified transportation and refining costs. In some cases, Newmont owns a netNet profit interestinterests (“NPI”) are those pursuant to which Newmont is entitled to a specified percentage of the net profits, as defined in each case, from a particular mining operation.case. The majority of NSR royalty revenue and NPI revenue can be received in-kind (generally in the form of gold bullion) at the option of Newmont. As detailed further in Note 8,7, the Company owns royalty interests in production, development and exploration stage properties.
Asset Impairment
Long-lived Assets
The Company reviews and evaluates its long-lived assets for impairment when events or changes in circumstances indicate that the related carrying amounts may not be recoverable. An impairment is considered to exist if the total estimated future cash flows on an undiscounted basis are less than the carrying amount of the assets, including goodwill, if any. An impairment loss is measured and recorded based on discounted estimated future cash flows. Future cash flows are estimated based on quantities of recoverable minerals, expected gold and other commodity prices (considering current and historical prices, price trends and related factors), production levels and cashoperating costs of production and capital, all based on life-of-mine plans. The term “recoverable minerals” refers to the estimated amount of gold and other minerals that will be obtained from proven and probable reserves and all related exploration stage mineral interests (except for other mine-related exploration potential and greenfields exploration potential discussed separately below) after taking into account losses during ore processing and treatment. Estimates of recoverable minerals from such related exploration stage mineral interests will be risk adjusted based on management’s relative confidence in such materials. In estimating future cash flows, assets are grouped at the lowest level for which there are identifiable cash flows that are largely independent of cash flows from other asset groups. With the exception of other mine-related exploration potential and greenfields exploration potential, all assets at an operating segment are considered together for purposes of estimating future cash flows. In the case of mineral interests associated with other mine-related exploration potential and greenfields exploration potential, cash flows and fair values are individually evaluated based primarily on recent exploration results and recent transactions involving sales of similar properties, if any. Assumptions underlyingThe Company’s estimates of future cash flowflows are based on numerous assumptions and it is possible that actual future cash flows will be significantly different than the estimates, as actual future quantities of recoverable minerals, gold and other commodity prices, production levels and operating costs of production and capital are each subject to significant risks and uncertainties.
NEWMONT MINING CORPORATION
NOTES TO CONSOLIDATED FINANCIAL STATEMENTS—(Continued)
Goodwill
The Company evaluates, on at least an annual basis, the carrying amount of goodwill to determine whether current events and circumstances indicate that such carrying amount may no longer be recoverable. To accomplish this, the Company compares the estimated fair value of its reporting units to their carrying amounts. If the carrying value of a reporting unit exceeds its estimated fair value, the Company compares the implied fair
NEWMONT MINING CORPORATION
NOTES TO CONSOLIDATED FINANCIAL STATEMENTS—(Continued)
(dollars in millions, except per share, per ounce and per pound amounts)
value of the reporting unit’s goodwill to its carrying amount, and any excess of the carrying value over the fair value is charged to operations. Assumptions underlyingearnings. The Company’s fair value estimates are based on numerous assumptions and it is possible that actual fair value will be significantly different than the estimates, as actual future quantities of recoverable minerals, gold and other commodity prices, production levels and operating costs of production and capital are each subject to significant risks and uncertainties.
Revenue Recognition
Newmont recognizes revenue,Revenue is recognized, net of smelting and refiningtreatment charges, from a sale when the price is determinable, the product has been delivered, the title has been transferred to the customer and collection of the sales price is reasonably assured. Revenues from silver and other by-product sales are credited toCosts applicable to sales as a by-product credit. Royalty revenue received in-kind (generally in the form of gold bullion) is recognized based on the fair value on the date that title is transferred to the Company.
Concentrate sales are initially recorded based on 100% of the provisional sales prices. Until final settlement occurs, adjustments to the provisional sales prices are made to take into account metal pricethe mark-to-market based on the forward prices for the estimated month of settlement. For changes based upon the month-end spot price andin metal quantities upon receipt of the finalnew information and assay, and weight certificates, if different from the initial certificates. The Company marks to market its provisional sales based on the forward price for the estimated month of settlement.quantities are adjusted as well. The principal risks associated with recognition of sales on a provisional basis include metal price fluctuations between the date initially recorded and the date of final settlement. In the event ofIf a significant decline in metal prices occurs between the provisional pricing date and the final settlement-pricing period,settlement-date, it is reasonably possible that the Company could be required to return a portion of the sales proceeds received based on the provisional invoice.
The Company’s sales based on a provisional sales price contain an embedded derivative that is required to be separated from the host contract for accounting purposes. The host contract is the receivable from the sale of the concentrates at the forward London Metal Exchange price at the time of sale. The embedded derivative, which does not qualify for hedge accounting, is marked to market through earnings each period prior to final settlement. At December 31, 2004 and 2003, respectively, the Company had consolidated embedded copper derivatives on 226 million pounds and 91.5 million pounds, recorded at an average price of $1.44 and $1.04 per pound, respectively.
Deferred Stripping Costs
In general, mining costs are allocated to production costs, stockpiles, ore on leach pads and inventories, and are charged toCosts applicable to sales when gold or copper is sold. However, at certain open pit mines with diverse grades and waste-to-ore ratios over the mine life, the Company defers and amortizes certain mining costs on a UOP basis over the life of the mine. These mining costs, which are commonly referred to as “deferred stripping” costs, are incurred in mining activities that are normally associated with the removal of waste rock. The deferred stripping accounting method is generally accepted in the mining industry where mining operations have diverse grades and waste-to-ore ratios; however, industry practice does vary. Deferred stripping matches the costs of production with the sale of such production at the Company’s operations where it is employed, by assigning each ounce of gold or pound of copper with an equivalent amount of waste removal cost. If the Company were to expense stripping costs as incurred, there could be greater volatility in the Company’s period-to-period results of operations.
NEWMONT MINING CORPORATION
NOTES TO CONSOLIDATED FINANCIAL STATEMENTS—(Continued)
Deferred stripping costs are charged toCosts applicable to sales as gold and copper is produced and sold using the UOP method based on estimated recoverable ounces of proven and probable gold and copper reserves, using a stripping ratio calculated as the ratio of total tons to be moved to total proven and probable ore reserves, which results in the recognition of the costs of waste removal activities over the life of the mine as gold and copper is produced (see Note 6)23). The application of the deferred stripping accounting method generally results
NEWMONT MINING CORPORATION
NOTES TO CONSOLIDATED FINANCIAL STATEMENTS—(Continued)
(dollars in millions, except per share, per ounce and per pound amounts)
in an asset on theConsolidated Balance Sheets (Deferred stripping costs), although a liability arises on theConsolidated Balance Sheets (Advanced stripping costs) if the actual stripping ratio incurred to date is less than the expected waste-to-ore ratio over the life of the mine.
The average remaining life of the open pit mine operations where the Company defers mining costs is between six and seven years, which represents the average time period over which the deferred stripping costs will be amortized. The amortization of deferred stripping costs is reflected in the income statement over the remaining life of the open pit mine operations so that no unamortized balance remains at mine closure. The Company reviews and evaluates its deferred stripping costs for impairment when events or circumstances indicate that the related carrying amounts may not be recoverable.
Reclamation and Remediation Costs (Asset Retirement Obligations)
In August 2001, the FASB issued Statement of Financial Accounting Standards (“SFAS”) No. 143, “Accounting for Asset Retirement Obligations,” which established a uniform methodology for accounting for estimated reclamation and abandonment costs. The statement was adopted January 1, 2003, when the Company recorded the estimated present value of reclamation liabilities and increased the carrying amount of the related asset, which resulted in a net expense for the cumulative effect of a change in accounting principle of $34.5 million$35 (see Note 3)13). Reclamation costs are allocated to expense over the life of the related assets and are periodically adjusted forto reflect changes in the estimated present value resulting from the passage of time and revisions to the estimates of either the timing or amount of the original present value estimate.
Prior to adoption of SFAS No. 143, estimated future reclamation costs were based principally on legal and regulatory requirements. Such costs related to active mines are accrued and charged over the expected operating lives of the mines using the UOP method based on proven and probable reserves.
abandonment costs.
Future remediation costs for inactive mines are accrued based on management’s best estimate at the end of each period of the undiscounted costs expected to be incurred at a site. Such cost estimates included,include, where applicable, ongoing care, maintenance and monitoring costs. Changes in estimates at inactive mines are reflected in earnings in the period an estimate is revised.
Income and Mining Taxes
The Company accounts for income taxes using the liability method, recognizing certain temporary differences between the financial reporting basis of the Company’s liabilities and assets and the related income tax basis for such liabilities and assets. This method generates either a net deferred income tax liability or net deferred income tax asset for the Company, as measured by the statutory tax rates in effect. The Company derives its deferred income tax charge or benefit by recording the change in either the net deferred income tax liability or net deferred income tax asset balance for the year. Mining taxes represent Canadian provincial taxes levied on mining operations and are classified as income taxes, as such taxes are based on a percentage of mining profits. With respect to the earnings that the Company derives from the operations of its consolidated subsidiaries, in those situations where the earnings are indefinitely reinvested, no deferred taxes have been provided on the unremitted earnings (including the excess of the carrying value of the net equity of such entities for financial reporting purposes over the tax basis of such equity) of these consolidated companies.
NEWMONT MINING CORPORATION
NOTES TO CONSOLIDATED FINANCIAL STATEMENTS—(Continued)
The Company’s deferred income tax assets include certain future tax benefits. The Company records a valuation allowance against any portion of those deferred income tax assets when it believes, based on the weight of available evidence, it is more likely than not that some portion or all of the deferred income tax asset will not be realized.
Foreign Currency
The functional currency for the majority of the Company’s operations, including the Australian operations, is the U.S. dollar. All monetary assets and liabilities where the functional currency is the U.S. dollar are
NEWMONT MINING CORPORATION
NOTES TO CONSOLIDATED FINANCIAL STATEMENTS—(Continued)
(dollars in millions, except per share, per ounce and per pound amounts)
translated at current exchange rates and the resulting adjustments are included inInterestOther income, foreign currency exchange and other incomenet. The functional currency of the Canadian operations is the Canadian dollar. All monetary assets and liabilities recorded in functional currencies other than U.S. dollars are translated at current exchange rates. Therates and the resulting adjustments are charged or credited directly toAccumulated other comprehensive income (loss) (“OCI”) inStockholders’ equity. Revenues and expenses in foreign currencies are translated at the weighted-average exchange rates for the period. All realized and unrealized transaction gains and losses are included in income inInterest income, foreign currency exchange and other income.
Sales Contracts, Commodity and Derivative Instruments
Derivative contracts qualifying as normal purchases and sales are accounted for under deferral accounting. Gains and losses arising from a change in the fair value of a contract before the contract’s designated delivery date are not recorded and the contract price is recognized inSalesSales—gold, net following settlement of the contract by physical delivery of production to the counterparty at contract maturity.
The fair value of derivative contracts qualifying as cash flow hedges are reflected as assets or liabilities in the balance sheet. To the extent these hedges are effective in offsetting forecasted cash flows from the sale of production or outflows related to by-product credits or production costs (the “effective portion”), changes in fair value are deferred in OCI. Amounts deferred in OCI are reclassified toSales or toCosts applicable to sales, as applicable, when the hedged transaction has occurred. The ineffective portion of the change in the fair value of the derivative is recorded inGain (loss) on derivative instruments, netOther income in each period.
When derivative contracts qualifying as cash flow hedges are settled, accelerated or restructured before the maturity date of the contracts, the accumulated OCI at the settlement date is deferred and reclassified toSalesSales—gold, net when the originally designated hedged transaction occurs.
The fair values of derivative contracts qualifying as fair value hedges are reflected as assets or liabilities in the balance sheet. Changes in fair value are recorded in income in each period, consistent with recording changes to the mark-to-market value of the underlying hedged asset or liability in income. Changes in the mark-to-market value of the effective portion of interest rate swaps utilized by the Company to reduceswap a portion of its fixed rate interest rate risksrisk to floating rate risk are recognized as a component ofInterest expense, net of capitalized interest.
The fair value of all derivative contracts that do not qualify as hedges are reflected as assets or liabilities, with the change in fair value recorded inGain (loss) on derivative instruments,Other income, net, except for changes in fair value of foreign currency exchange contracts, which are recorded inInterest income, foreign currency exchange and other income.
NEWMONT MINING CORPORATION
NOTES TO CONSOLIDATED FINANCIAL STATEMENTS—(Continued)
(dollars in millions, except per share, per ounce and per pound amounts)
Stock Option Expense
The Company applies the intrinsic value method in accordance with Accounting Principles BoardAPB Opinion No. 25, “Accounting for Stock Issued to Employees,” and related interpretations in accounting for stock options. Accordingly, because stock option exercise prices equal the market value on the date of grant, no compensation cost has beenexpense is currently recognized for its stock options.option grants. Had compensation costexpense for the options been determinedrecognized based on market value at grant dates as prescribed by SFAS No. 123 “Accounting for Stock-Based Compensation” (see Recent Accounting Pronouncements),123R, the Company’s net income and net income per common share would have been the pro forma amounts indicated below (unaudited, in millions, except per share).below:
| Years Ended December 31, | ||||||||||||
| 2004 | 2003 | 2002 | ||||||||||
Net income applicable to common shares | ||||||||||||
As reported | $ | 443.3 | $ | 475.7 | $ | 154.3 | ||||||
SFAS No. 123 expense, net of tax | (14.8 | ) | (15.3 | ) | (9.8 | ) | ||||||
Pro forma | $ | 428.5 | $ | 460.4 | $ | 144.5 | ||||||
Net income per common share, basic | ||||||||||||
As reported | $ | 1.00 | $ | 1.16 | $ | 0.42 | ||||||
SFAS No. 123 expense, net of tax | (0.03 | ) | (0.04 | ) | (0.03 | ) | ||||||
Pro forma | $ | 0.97 | $ | 1.12 | $ | 0.39 | ||||||
Net income per common share, diluted | ||||||||||||
As reported | $ | 0.99 | $ | 1.15 | $ | 0.41 | ||||||
SFAS No. 123 expense, net of tax | (0.03 | ) | (0.04 | ) | (0.03 | ) | ||||||
Pro forma | $ | 0.96 | $ | 1.11 | $ | 0.38 | ||||||
| Years Ended December 31, | ||||||||||||
| 2005 | 2004 | 2003 | ||||||||||
Net income, as reported | $ | 322 | $ | 443 | $ | 476 | ||||||
Less: Compensation expense determined under the fair value method, net of tax | (19 | ) | (15 | ) | (15 | ) | ||||||
Pro forma net income | $ | 303 | $ | 428 | $ | 461 | ||||||
Net income per common share, basic: | ||||||||||||
As reported | $ | 0.72 | $ | 1.00 | $ | 1.16 | ||||||
Pro forma net income | $ | 0.68 | $ | 0.97 | $ | 1.12 | ||||||
Net income per common share, diluted: | ||||||||||||
As reported | $ | 0.72 | $ | 0.99 | $ | 1.15 | ||||||
Pro forma net income | $ | 0.68 | $ | 0.96 | $ | 1.11 | ||||||
The Company recognized $15, $15 and $18 of non-cash compensation expense in 2005, 2004 and 2003, respectively, related to deferred and restricted stock awards granted.
For purposes of determining the pro forma amounts, the fair value of each option grant was estimated on the date of the grant using the Black-Scholes option-pricing model with the following assumptions for 2005, 2004 2003 and 2002,2003, respectively: weighted-average risk-free interest rates of 3.4%4.2%, 3.7%3.4% and 3.4%3.7%; dividend yields of 0.8%1.0%, 0.5%0.8% and 0.5%; expected lives of four years, eightfour years and nineeight years; and volatility of 41%38%, 44%41% and 51%44%.
Earnings Per Common Share
Basic and diluted earnings per share are presented forNet income and if applicable, forIncome before the cumulative effect of a change in accounting principlefrom continuing operations. Basic earnings per share is computed by dividingNet income orIncome from continuing operations by the weighted-average number of outstanding common shares for the period, including the exchangeable shares (see Note 17)14). Diluted earnings per share reflects the potential dilution that could occur if securities or other contracts that may require the issuance of common shares in the future were converted. Diluted earnings per share is computed by increasing the weighted-average number of outstanding common shares to include the additional common shares that would be outstanding after conversion and adjusting net income for changes that would result from the conversion. Only those securities or other contracts that result in a reduction in earnings per share are included in the calculation.
Comprehensive Income (Loss)
In addition toNet income, Comprehensive income (loss)includes all changes in equity during a period, such as adjustments to minimum pension liabilities, foreign currency translation adjustments, the effective portion of
NEWMONT MINING CORPORATION
NOTES TO CONSOLIDATED FINANCIAL STATEMENTS—(Continued)
changes in fair value of derivative instruments that qualify as cash flow hedges and cumulative unrecognized changes in fair value of marketable securities available-for-sale or other investments, except those resulting from investments by and distributions to owners.
NEWMONT MINING CORPORATION
NOTES TO CONSOLIDATED FINANCIAL STATEMENTS—(Continued)
(dollars in millions, except per share, per ounce and per pound amounts)
Reclassifications
Certain amounts in prior years have been reclassified to conform to the 2005 presentation. The most significant reclassifications were to reclassify the balance sheet amounts and the income statement results from the historical presentation toAssets andLiabilities of operations held for sale on the Consolidated Balance Sheets and to(Loss) income from discontinued operations in the Consolidated Statements of Income for all periods presented. The Consolidated Statements of Cash Flows have been reclassified for assets held for sale and discontinued operations for all periods presented.
Recent Accounting Pronouncements
Stock Based Compensation
In December 2004, the FASB issued SFAS No. 123R, “Share-Based Payment”,Payment,” which revised SFAS No. 123, “Accounting for Stock-Based Compensation” and supersededCompensation.” SFAS No. 123R will supersede APB Opinion 25, “Accounting for Stock Issued to Employees” and its related implementation guidance.amends SFAS No. 95, “Statement of Cash Flows.” SFAS No. 123R requires measurement and recording to the financial statements of the costs of employee services received in exchange for an award of equity instruments based on the grant-date fair value of the award, recognized over the period during which an employee is required to provide services in exchange for such award. Newmont will adopt the provisions of SFAS No. 123R on JulyJanuary 1, 2005,2006, using the modified prospective application. Accordingly, compensation expense will be recognized for all newly granted awards and awards modified, repurchased, or cancelled after JulyJanuary 1, 2005.2006. Compensation costexpense for the unvested portion of awards that are outstanding as of JulyJanuary 1, 2005 will be recognized ratably over the remaining vesting period. The compensation cost for the unvested portion of awards will be2006, based on the fair value at date of grant as calculated for our pro forma disclosure under SFAS No. 123. The effect on net income and earnings per share123, will be recognized ratably over the remaining vesting period. Additionally, SFAS No. 123R requires that any tax benefits, arising from compensation deductions that are different than recognized compensation expense, to be reported as a financing cash flow, rather than as an operating cash flow as required under current literature. Compensation expense in the periods following adoption of SFAS No. 123R are expected to be consistent withmay differ from our pro forma disclosure under SFAS No. 123, except that estimated forfeitures will be consideredbased on changes in the calculationfair value of our common stock, changes in the number of options granted or the terms of such options, the treatment of tax benefits and changes in interest rates or other factors. At present stock based compensation expense of $25 to $30 for 2006 is expected.
In March 2005, the SEC staff issued Staff Accounting Bulletin (“SAB”) No. 107, “Share-Based Payment,” which provides guidance on the interaction between SFAS No. 123R and certain SEC rules and regulations, as well as on the valuation of share-based payments. SAB No. 107 provides interpretive guidance related to valuation methods (including assumptions such as expected volatility and expected term), first time adoption of SFAS No. 123R in an interim period, the classification of compensation expense underand disclosures subsequent to adoption of SFAS No. 123R. Additionally,We are currently evaluating the actual effectimpact of SAB No. 107 on net incomeour consolidated financial statements.
Deferred Stripping Costs
At some of the Company’s mining operations, deferred stripping costs are charged toCosts applicable to sales as gold or copper is produced and earnings per share will vary depending uponsold using the numberunits of production method based on estimated recoverable quantities of proven and fair valueprobable gold or copper reserves, using a stripping ratio calculated as the ratio of options grantedtotal tons to be moved to total proven and probable ore reserves, which results in 2005 compared to prior years.
In November 2004, the FASB issued SFAS No. 151, “Inventory Costs-an amendmentrecognition of ARB No. 43, Chapter 4,” which clarifies the accounting for abnormal amounts of idle facility expense, freight, handling costs and wasted material as current period costs. It also requires that allocations of fixed production overheads to the costs of conversion be based onwaste removal activities over the normal capacitylife of the production facilities.mine as gold or copper is produced. The Statement applies to inventory costs incurred in the first fiscal year beginning after June 15, 2005. Newmont has not determined the impact, if any, on the Company’s financial position or results from operations.
A committeeapplication of the Emerging Issues Task Force (“EITF”) discussed the accounting for deferred stripping costs but did not reachaccounting method generally results in an asset (deferred stripping costs), although a consensus in 2004.liability (advanced stripping costs) will arise if the actual stripping ratio incurred to date is less than the expected stripping ratio over the life of the mine. The Task Force considered the recommendation thatAdvanced stripping costs incurred during production are a mine development cost that should be capitalized as an investment in the mine and attributed primarily pertain to the proven and probable reserves benefited in a systematic and rational manner. However, the Task Force directed the FASB staff to develop additional guidance about what constitutes a systematic and rational manner of attributing the capitalized costs to proven and probable reserves benefited. The Company cannot predict whether the deliberations of the EITF will ultimately modify or otherwise result in new accounting standards or interpretations thereof that differ from the Company’s current practices.
Reclassifications
Certain amounts in prior years have been reclassified to conform to the 2004 presentation. The most significant reclassifications were as follows:
Auction Rate Securities in the Consolidated Balance Sheet and Statement of Consolidated Cash Flows
As of December 31, 2003, the Company reclassified auction rate securities having a stated or contractual maturity date for the underlying security in excess of 90 days in its Consolidated Balance Sheet toMarketable securities and other short-term investments fromCash and cash equivalents. The impact of this reclassificationBatu Hijau operation.
NEWMONT MINING CORPORATION
NOTES TO CONSOLIDATED FINANCIAL STATEMENTS—(Continued)
was to increaseMarketable securities(dollars in millions, except per share, per ounce and other short-term investments by $183.0 million and reduceCash and cash equivalents by an equivalent amount. For the year ended December 31, 2003, the Company reflected the purchases and sales of such securities in investing cash flows in its Statement of Consolidated Cash Flows, which increasedNet cash used in investing activities by $183.0 million. Previously, the Company had classified these types of securities as cash equivalents.per pound amounts)
Deferred Income Taxes
Deferred income taxesIn March 2005, the FASB ratified Emerging Issues Task Force Issue No. 04-6, “Accounting for Stripping Costs Incurred during Production in the Mining Industry,” (EITF 04-6) which addresses the accounting for stripping costs incurred during the production phase of a mine and refers to these costs as variable production costs that should be included as a component of inventory to be recognized inCosts applicable to sales in the same period as the revenue from the sale of inventory. As a result, capitalization of stripping costs is appropriate only to the extent product inventory exists at the end of a reporting period. Newmont will adopt the provisions of EITF 04-6 on January 1, 2006. The most significant impact of adoption will be recording the deferred and advanced stripping costs on Newmont’s balance sheet, at December 31, 2003 have been reclassified to reflect netting currentDeferred income tax assets against currentDeferred income tax liabilitiesnet of taxes and netting non-currentDeferred income tax assets against non-currentDeferred income tax liabilities within tax jurisdictions. The effects of the reclassifications were to reduce current and non-currentDeferred income tax assets by $28.6 million and $348.4 million, respectively, and reduce the current and non-currentDeferred income tax liabilities by $16.5 million and $360.5 million, respectively.
Dividends Paid to Minority Interests in the Statement of Consolidated Cash Flows
For the years ended December 31, 2003 and 2002, the Company reclassified dividends paid to minority interests, as a financing activity. Previously, these dividends were recordedcumulative effect adjustment reducing 2006 beginning retained earnings by $75 to $85. Adoption of EITF 04-6 will have no impact on the Company’s cash position.
Asset Retirement Obligations
In March 2005, the FASB issued Interpretation 47 (“FIN 47”), “Accounting for Conditional Asset Retirement Obligations”—an interpretation of FASB No. 143. FIN 47 clarifies that the term “conditional asset retirement obligation” as used in SFAS No. 143 refers to a reductionlegal obligation to perform an asset retirement activity in which the timing and/or method ofMinority interest expense, which settlement are conditional on a future event that may or may not be within the control of the entity. The obligation to perform the asset retirement activity is an adjustmentunconditional even though uncertainty exists about the timing and/or method of settlement. FIN 47 requires a liability to reconcile net incomebe recognized for the fair value of a conditional asset retirement obligation if the fair value of the liability can be reasonably estimated. FIN 47 was effective for fiscal years ending after December 15, 2005. The adoption of FIN 47 did not have a material impact on our consolidated financial position, results of operations or cash flows.
Accounting Changes and Error Corrections
In May 2005 the FASB issued SFAS No. 154, “Accounting Changes and Error Corrections.” SFAS No. 154 established new standards on accounting for changes in accounting principles. SFAS No. 154 requires all such changes to net cash providedbe accounted for by operating activities. The impactretrospective application to the Statementfinancial statements of Consolidated Cash Flowsprior periods unless it is impracticable to do so. SFAS No. 154 is effective for theaccounting changes and error corrections made in fiscal years endedbeginning after December 31, 2003 and 2002 was15, 2005. Adoption of SFAS No. 154 is not expected to increaseNetcash provided by operating activities by $146.0 million and $28.8 million, respectively, withhave a corresponding increase toNetmaterial impact on our consolidated financial position, results of operations or cash used in financing activitiesflows.
Other-Than-Temporary Impairment. This reclassification did not impact the amounts reported as cash and cash equivalents.
In June 2005, the FASB issued FASB Staff Position Paper (“FSP”) 115-1, “The Meaning of Other-Than-Temporary Impairment and its Application to Certain Investments,” superseding EITF 03-1. FSP 115-1 will replace the accounting guidance on the determination of whether an investment is other-than-temporarily impaired as set forth in EITF 03-1 with references to existing other-than-temporary impairment guidance. FSP 115-1 is effective for reporting periods beginning after December 15, 2005. Adoption of FSP 115-1 is not expected to have a material impact on our consolidated financial position, results of operations or cash flows.
NOTE 3 ACCOUNTING CHANGES
Consolidation of Batu Hijau
In December 2003, the FASB issued FIN 46R, which provides guidance on the identification and reporting for entities over which control is achieved through means other than voting rights. FIN 46R defines such entities as variable interest entities (“VIEs”). Application of this revised interpretation was required in financial
NEWMONT MINING CORPORATION
NOTES TO CONSOLIDATED FINANCIAL STATEMENTS—(Continued)
(dollars in millions, except per share, per ounce and per pound amounts)
statements for companies that have interests in VIEs or potential VIEs commonly referred to as special-purpose entities for periods ending after December 31, 2003. Application for all other types of entities was required in financial statements for periods ending after March 15, 2004.
Newmont completed its evaluation of the impact of FIN 46R for VIEs in which the Company has an interest, which were created before December 31, 2003 and that are not considered to be special-purpose entities. Newmont identified the Nusa Tenggara Partnership (“NTP”) and P.T. Newmont Nusa Tenggara (“PTNNT”) (collectively, “Batu Hijau”) as VIEs because of certain capital structures and contractual relationships (primarily the sharing of the expected residual returns with a party that did not have an equity investment at risk that is considered significant to the total expected residual returns, as well as indications of insufficient equity, as defined by FIN 46R)equity). Newmont also determined that it is the primary beneficiary of Batu Hijau. Therefore, as of January 1, 2004, the Company has fully consolidated Batu Hijau in its Consolidated Financial Statements. Previously,For periods prior to 2004, the Company accounted for its investment in Batu Hijau was accounted for using the equity method of accounting.
Upon consolidation of Batu Hijau, effective January 1, 2004, certain adjustments were recorded to the opening balance sheet of PTNNT to conform to Newmont’s accounting policies. These adjustments were recorded to change from units-of-production depreciation of processing plant and mining facilities to straight-line depreciation of such facilities and to change from allocating costs to stockpile inventories based on mining costs per ton to allocating costs based on recoverable pounds of copper equivalent contained in the various categories
NEWMONT MINING CORPORATION
NOTES TO CONSOLIDATED FINANCIAL STATEMENTS—(Continued)
of stockpiles. The impact of these adjustments were charges of $15.1 million$15 and $32.0 million,$32, respectively, net of income tax expense and minority interest which have been recorded inCumulative effect of a change in accounting principle, net of tax in the 2004 Statement of Consolidated Income. The consolidation had a significant impact on the Consolidated Financial Statements.
Mineral Interests
On April 30, 2004, a FASB Staff Position (“FSP”) was issued amending Statement of Financial Accounting Standards (“SFAS”) No. 141 and No. 142 to provide that certain mineral rights are considered tangible assets and that mineral rights should be accounted for based on their substance. The FSP was effective for the first reporting period beginning after April 29, 2004, with early adoption permitted. As a result, Newmont reclassified all of its mineral, royalty and oil and gas interests, with a carrying value of $1,273, from mineral interests and other intangible assets toProperty, plant and mine development, net in its balance sheets and ceased amortization of exploration stage mineral interests effective April 1, 2004.
Reclamation and Remediation (Asset Retirement Obligations)
In August 2001, the FASB issued SFAS No. 143, “Accounting for Asset Retirement Obligations,” which established a uniform methodology for accounting for estimated reclamation and abandonment costs. The statement was adopted on January 1, 2003. See Note 15 for complete disclosure2003, when the Company recorded the estimated present value of reclamation liabilities and increased the carrying amount of the impact of adopting SFAS No. 143.
Depreciation, Depletion and Amortization
In 2002, Newmont changed its accounting policy with respect toDepreciation, depletion and amortization (“DD&A”) ofProperty, plant and mine development,related asset, which resulted in a net to exclude future estimated development costs expected to be incurred expense for certain underground operations. In addition, the Company further revised its policy such that costs incurred to access specific ore blocks or areas are depreciated, depleted or amortized over the reserves associated with the specific ore area. The cumulative effect of thisa change through December 31, 2001 increased net incomein accounting principle of $35. Reclamation costs are allocated to expense over the life of the related assets and are adjusted for 2002 by $7.7 million, netchanges resulting from the passage of taxtime and revisions to either the timing or amount of $4.1 million and increased net income by $0.02 per share.
NOTE 4 MARKETABLE SECURITIES AND OTHER SHORT-TERM INVESTMENTS
| At December 31, | ||||||
| 2004 | 2003 | |||||
| (in thousands) | ||||||
Marketable debt securities | $ | 784,475 | $ | 182,950 | ||
Kinross Gold Corporation | 101,458 | 115,302 | ||||
Newmont Australia infrastructure bonds (Note 13) | — | 127,674 | ||||
Other | 57,229 | 31,617 | ||||
| $ | 943,162 | $ | 457,543 | |||
(Losses) gains on investments for the years ended December 31, 2004, 2003 and 2002 were as follows:
| Years Ended December 31, | ||||||||||||
| 2004 | 2003 | 2002 | ||||||||||
| (in thousands) | ||||||||||||
Impairment of Kinross marketable equity securities | $ | (38,501 | ) | $ | — | $ | — | |||||
Loss on sale of Kinross marketable equity securities | — | (7,418 | ) | — | ||||||||
Gain on exchange of Echo Bay shares for Kinross marketable equity securities | — | 84,337 | — | |||||||||
Gain on sale of Lihir Gold marketable equity securities | — | — | 47,298 | |||||||||
Gain (loss) on sale of other marketable securities | (518 | ) | 6,247 | (212 | ) | |||||||
(Loss) gain on investments, net | $ | (39,019 | ) | $ | 83,166 | $ | 47,086 | |||||
Marketable Debt Securities
Newmont has invested a portion of its available cash balances in auction rate securities. The interest rates on these securities are reset periodically, and they trade as short-term, highly liquid investments. However, theoriginal present value estimate.
NEWMONT MINING CORPORATION
NOTES TO CONSOLIDATED FINANCIAL STATEMENTS—(Continued)
(dollars in millions, except per share, per ounce and per pound amounts)
securities are not considered a cash equivalent due to their underlying “stated” or “contractual” long-term maturity. As of December 31,
NOTE 4 INVESTMENTS
| At December 31, 2005 | ||||||||||||
| Cost/Equity Basis | Unrealized | Fair/Equity Value | ||||||||||
| Gain | Loss | |||||||||||
Current: | ||||||||||||
Marketable Debt Securities: | ||||||||||||
Auction rate securities | $ | 785 | $ | — | $ | — | $ | 785 | ||||
Marketable Equity Securities: | ||||||||||||
Other | 11 | 12 | — | 23 | ||||||||
Other investments, at cost | 9 | — | — | 9 | ||||||||
| $ | 805 | $ | 12 | $ | — | $ | 817 | |||||
Long-term: | ||||||||||||
Marketable Equity Securities: | ||||||||||||
Canadian Oil Sands Trust | $ | 240 | $ | 410 | $ | — | $ | 650 | ||||
Gabriel Resources, Ltd. | 53 | 29 | — | 82 | ||||||||
Shore Gold, Inc. | 89 | 22 | — | 111 | ||||||||
Miramar Mining Corporation | 27 | 19 | — | 46 | ||||||||
Other | 20 | 8 | — | 28 | ||||||||
| 429 | 488 | — | 917 | |||||||||
Other investments, at cost | 10 | — | — | 10 | ||||||||
Investment in Affiliates: | ||||||||||||
European Gold Refineries (Note 20) | 15 | — | — | 15 | ||||||||
AGR Matthey Joint Venture (Note 20) | 13 | — | — | 13 | ||||||||
| 28 | — | — | 28 | |||||||||
| $ | 467 | $ | 488 | $ | — | $ | 955 | |||||
NEWMONT MINING CORPORATION
NOTES TO CONSOLIDATED FINANCIAL STATEMENTS—(Continued)
(dollars in millions, except per share, per ounce and per pound amounts)
| At December 31, 2004 | ||||||||||||
Cost/Equity | Unrealized | Fair/Equity | ||||||||||
| Gain | Loss | |||||||||||
Current: | ||||||||||||
Marketable Debt Securities: | ||||||||||||
Auction rate securities | $ | 784 | $ | — | $ | — | $ | 784 | ||||
Marketable Equity Securities: | ||||||||||||
Kinross Gold Corporation | 80 | 21 | — | 101 | ||||||||
Other | 25 | 20 | — | 45 | ||||||||
| 105 | 41 | — | 146 | |||||||||
Other investments, at cost | 13 | — | — | 13 | ||||||||
| $ | 902 | $ | 41 | $ | — | $ | 943 | |||||
Long-term: | ||||||||||||
Marketable Equity Securities: | ||||||||||||
Canadian Oil Sands Trust | $ | 225 | $ | 112 | $ | — | $ | 337 | ||||
Gabriel Resources, Ltd. | 17 | 2 | — | 19 | ||||||||
Other | 4 | 1 | — | 5 | ||||||||
| 246 | 115 | — | 361 | |||||||||
Investment in Affiliates: | ||||||||||||
European Gold Refineries (Note 20) | 13 | — | — | 13 | ||||||||
AGR Matthey Joint Venture (Note 20) | 12 | — | — | 12 | ||||||||
| 25 | — | — | 25 | |||||||||
| $ | 271 | $ | 115 | $ | — | $ | 386 | |||||
Realized gain (loss) on investments, net for 2005, 2004 and 2003 Newmont had $784.5 million and $183.0 million, respectively, invested in auction rate securities, which approximated their market value. For the years ended December 31, 2004 and 2003, the Company recorded interest income of $8.9 million and $0.1 million related to auction rate securities. The maturity dates for these securities range from 10 years to 40 years.were as follows:
| Years Ended December 31, | |||||||||||
| 2005 | 2004 | 2003 | |||||||||
Gain (loss) on sale of Kinross | $ | 20 | $ | — | $ | (7 | ) | ||||
Impairment of Kinross | — | (39 | ) | — | |||||||
Gain on sale of Oxiana | 25 | — | — | ||||||||
Gain on exchange of Echo Bay for Kinross | — | — | 84 | ||||||||
Gain on sale of other securities | 9 | — | 6 | ||||||||
Gain (loss) on investments, net | $ | 54 | $ | (39 | ) | $ | 83 | ||||
Marketable Securities of Kinross Gold Corporation
On January 31, 2003, Kinross Gold Corporation (“Kinross”), Echo Bay Mines Ltd. (“Echo Bay”) and TVX Gold Inc. (“TVX Gold”) were combined, and TVX Gold acquired Newmont’s 49.9% interest in the TVX Newmont Americas joint venture. Under the terms of the combination and acquisition, Newmont received a 13.8% interest in the restructured Kinross in exchange for its then 45.67% interest in Echo Bay and cash proceeds of $180 million for its interest in TVX Newmont Americas. Newmont recognized a pre-tax gain of $84.3 million$84 on the transaction inGain on investments, net in theStatement of Consolidated Income.this transaction. During the third quarter of 2003, Newmont sold approximately 28 million Kinross shares representing approximately 66% of its investment in Kinross for total cash proceeds of $224.6 million$225 and recorded a net loss of $7.4 million.$7. At June 30, 2004, the fair value of the Kinross investment was $79.6 million and Newmont recognized a $38.5 million$39 impairment of its investment in Kinross for
NEWMONT MINING CORPORATION
NOTES TO CONSOLIDATED FINANCIAL STATEMENTS—(Continued)
(dollars in millions, except per share, per ounce and per pound amounts)
an other-than-temporary decline in value in accordance with SFAS No. 115, “Accounting for Certain Investments in Debt and Equity Securities.” TheDuring the third quarter of 2005, Newmont sold its remaining balance is classified as an available-for-sale marketable security at December 31, 2004.
14 million Kinross shares for cash proceeds of $111 and recorded a gain of $20.
Marketable Securities of Lihir GoldOxiana Limited
On April 12, 2002,In the first quarter of 2005, Newmont sold its equity holdingapproximately 10 million shares of Oxiana Limited (“Oxiana”) and recognized a pre-tax gain of $6. In the third quarter of 2005, Newmont received approximately 82 million shares of Oxiana (with a fair value of $61), as part of the proceeds for the sale of Golden Grove (see Note 25). These shares were sold in Lihir Goldthe fourth quarter of 2005 for approximately $84 million.
a pre-tax gain of $19.
NOTE 5 INVENTORIES
| At December 31, | ||||||
| 2004 | 2003 | |||||
| (in thousands) | ||||||
In-process | $ | 61,451 | $ | 53,079 | ||
Concentrate | 14,108 | 10,959 | ||||
Precious metals | 5,616 | 52,875 | ||||
Materials, supplies and other | 183,199 | 108,806 | ||||
| $ | 264,374 | $ | 225,719 | |||
| At December 31, | ||||||
| 2005 | 2004 | |||||
In-process | $ | 73 | $ | 58 | ||
Concentrate | 3 | 3 | ||||
Precious metals | 5 | 6 | ||||
Materials, supplies and other | 239 | 177 | ||||
| $ | 320 | $ | 244 | |||
The Company recorded aggregate write-downs of $19.8 million, $15.2 million$nil, $12 and $8.2 million$9 for the years ended December 31,2005, 2004 2003 and 2002,2003, respectively, to reduce the carrying value of inventories to net realizable value. Write-downs in 2004 were related to Golden Grove, Tanami and Pajingo and in 2003 primarily related to Golden Grove, Yanacocha, Minahasa, Zarafshan and Martha. Write-downs in 2002 primarily related to Nevada and Minahasa. Inventory write-downs are classified as components ofCosts applicable to sales.
NEWMONT MINING CORPORATION
NOTES TO CONSOLIDATED FINANCIAL STATEMENTS—(Continued)
NOTE 6 STOCKPILES AND ORE ON LEACH PADS
| At December 31, | ||||||||||||
| 2004 | 2003 | At December 31, | ||||||||||
| (in thousands) | 2005 | 2004 | ||||||||||
Current: | ||||||||||||
Stockpiles | $ | 112,328 | $ | 83,113 | $ | 129 | $ | 111 | ||||
Ore on leach pads | 119,298 | 165,512 | 126 | 119 | ||||||||
| $ | 231,626 | $ | 248,625 | $ | 255 | $ | 230 | |||||
Long-term: | ||||||||||||
Stockpiles | $ | 394,305 | $ | 177,524 | $ | 404 | $ | 394 | ||||
Ore on leach pads | 130,526 | 128,286 | 199 | 131 | ||||||||
| $ | 524,831 | $ | 305,810 | $ | 603 | $ | 525 | |||||
The Company recorded aggregate write-downs of $10.4 million, $7.5 million$10, $10 and $33.1 million$8 for the years ended December 31,2005, 2004 2003 and 2002,2003, respectively, to reduce the carrying value of stockpiles to net realizable value. The Company also recorded aggregateStockpile write-downs of $2.6 million, $2.2 millionin 2005 were largely related to Nevada, Jundee and $3.1 million for the years ended December 31, 2004, 2003 and 2002, respectively, to reduce the carrying value of ore on leach pads to net realizable value.Tanami. Stockpile write-downs in 2004 were largely related to Tanami and Ovacik. Stockpile write-downs in 2003 primarily related to Tanami, YandalJundee and Martha. The 2002 stockpileCompany also recorded aggregate write-downs primarily relatedof $3 and $2 for 2004 and 2003, respectively, to Nevada.reduce the carrying value of ore
NEWMONT MINING CORPORATION
NOTES TO CONSOLIDATED FINANCIAL STATEMENTS—(Continued)
(dollars in millions, except per share, per ounce and per pound amounts)
on leach pads to net realizable value. Ore on leach pads write-downs in 2004 were primarily for Kori Kollo and in 2003 and 2002 related to Nevada. Stockpile and ore on leach pads write-downs are classified as components ofCosts applicable to sales.
NOTE 7 DEFERRED STRIPPING COSTS
Movements in the deferred stripping costs balance were as follows:
| Years Ended December 31, | ||||||||||||
| 2004 | 2003 | 2002 | ||||||||||
| (in thousands) | ||||||||||||
Opening balance | $ | 90,379 | $ | 55,387 | $ | 91,631 | ||||||
Consolidation of Batu Hijau | (67,285 | ) | — | — | ||||||||
Additions | 148,219 | 166,052 | 65,371 | |||||||||
Amortization | (152,313 | ) | (131,060 | ) | (101,615 | ) | ||||||
Closing balance | $ | 19,000 | $ | 90,379 | $ | 55,387 | ||||||
NEWMONT MINING CORPORATION
NOTES TO CONSOLIDATED FINANCIAL STATEMENTS—(Continued)
The deferred and advanced stripping balances are presented in the consolidated balance sheet as follows:
| At December 31, | ||||||
| 2004 | 2003 | |||||
| (in thousands) | ||||||
Assets: | ||||||
Current | $ | 44,545 | $ | 60,086 | ||
Long-term | 79,753 | 30,293 | ||||
| 124,298 | 90,379 | |||||
Liabilities: | ||||||
Current (See Note 14) | 2,467 | — | ||||
Long-term | 102,831 | — | ||||
| 105,298 | — | |||||
Deferred stripping, net | $ | 19,000 | $ | 90,379 | ||
At some of the Company’s mining operations, deferred stripping costs are charged toCosts applicable to sales as gold or copper is produced and sold using the units of production method based on estimated recoverable quantities of proven and probable gold or copper reserves, using a stripping ratio calculated as the ratio of total tons to be moved to total proven and probable ore reserves, which results in the recognition of the costs of waste removal activities over the life of the mine as gold or copper is produced. The application of the deferred stripping accounting method generally results in an asset on the Consolidated Balance Sheets (Deferred stripping costs), although a liability (Advanced stripping costs) will arise if the actual stripping ratio incurred to date is less than the expected stripping ratio over the life of the mine. TheAdvanced stripping costs at December 31, 2004 pertain to Batu Hijau.
The EITF is discussing the accounting for deferred stripping costs incurred during production but has not yet reached a consensus. The EITF considered the recommendation that stripping costs incurred during production are a mine development cost that should be capitalized as an investment in the mine and attributed to the proven and probable reserves benefited in a systematic and rational manner. However, the EITF directed the FASB staff to develop additional guidance about what constitutes a systematic and rational manner of attributing the capitalized costs to proven and probable reserves benefited.
See Notes 2 and 28 for additional information concerning deferred stripping.
NEWMONT MINING CORPORATION
NOTES TO CONSOLIDATED FINANCIAL STATEMENTS—(Continued)
NOTE 8 PROPERTY, PLANT AND MINE DEVELOPMENT
| At December 31, 2004 | At December 31, 2003 | |||||||||||||||||||||
| Depreciable Life | Cost | Accumulated Depreciation and Depletion | Net Book Value | Cost | Accumulated Depreciation and Depletion | Net Book Value | ||||||||||||||||
| (in years) | (in thousands) | |||||||||||||||||||||
Land | — | $ | 80,363 | $ | — | $ | 80,363 | $ | 72,000 | $ | — | $ | 72,000 | |||||||||
Buildings and equipment | 1–20 | 6,414,906 | (3,434,887 | ) | 2,980,019 | 4,207,531 | (2,659,685 | ) | 1,547,846 | |||||||||||||
Mine development | 1–15 | 1,561,636 | (917,647 | ) | 643,989 | 1,242,383 | (721,670 | ) | 520,713 | |||||||||||||
Mineral interests | 1–20 | 1,758,931 | (534,293 | ) | 1,224,638 | 1,798,196 | (430,723 | ) | 1,367,473 | |||||||||||||
Asset retirement cost | 1–20 | 194,890 | (112,329 | ) | 82,561 | 121,588 | (85,295 | ) | 36,293 | |||||||||||||
Construction-in-progress | — | 349,322 | — | 349,322 | 171,132 | — | 171,132 | |||||||||||||||
Total | $ | 10,360,048 | $ | (4,999,156 | ) | $ | 5,360,892 | $ | 7,612,830 | $ | (3,897,373 | ) | $ | 3,715,457 | ||||||||
Leased assets included above in property, plant and mine development | 2–10 | $ | 357,588 | $ | (189,250 | ) | $ | 168,338 | $ | 354,378 | $ | (167,183 | ) | $ | 187,195 | |||||||
| At December 31, 2004 | At December 31, 2003 | |||||||||||||||||||||
Mineral Interests | Amortization Period | Gross Carrying Value | Accumulated Amortization | Net Book Value | Gross Carrying Value | Accumulated Amortization | Net Book Value | |||||||||||||||
| (in years) | (in thousands) | |||||||||||||||||||||
Working interests: | ||||||||||||||||||||||
Production stage | 1–20 | $ | 826,267 | $ | (444,271 | ) | $ | 381,996 | $ | 793,812 | $ | (363,933 | ) | $ | 429,879 | |||||||
Development stage | — | 235,411 | (174 | ) | 235,237 | 213,801 | — | 213,801 | ||||||||||||||
Exploration stage | — | 366,439 | (17,266 | ) | 349,173 | 459,660 | (17,283 | ) | 442,377 | |||||||||||||
| 1,428,117 | (461,711 | ) | 966,406 | 1,467,273 | (381,216 | ) | 1,086,057 | |||||||||||||||
Royalties: | ||||||||||||||||||||||
Production stage | 1–20 | 227,173 | (50,207 | ) | 176,966 | 233,793 | (35,365 | ) | 198,428 | |||||||||||||
Development stage | — | 9,483 | (216 | ) | 9,267 | 8,824 | (128 | ) | 8,696 | |||||||||||||
Exploration stage | — | 4,876 | (896 | ) | 3,980 | 5,134 | (935 | ) | 4,199 | |||||||||||||
| 241,532 | (51,319 | ) | 190,213 | 247,751 | (36,428 | ) | 211,323 | |||||||||||||||
Oil and gas: | ||||||||||||||||||||||
Producing property | 10 | 73,699 | (21,263 | ) | 52,436 | 68,689 | (13,079 | ) | 55,610 | |||||||||||||
Exploration stage | — | 15,583 | — | 15,583 | 14,483 | — | 14,483 | |||||||||||||||
| 89,282 | (21,263 | ) | 68,019 | 83,172 | (13,079 | ) | 70,093 | |||||||||||||||
| $ | 1,758,931 | $ | (534,293 | ) | $ | 1,224,638 | $ | 1,798,196 | $ | (430,723 | ) | $ | 1,367,473 | |||||||||
| At December 31, 2005 | At December 31, 2004 | |||||||||||||||||||||
| Depreciable Life | Cost | Accumulated and Depletion | Net Book Value | Cost | Accumulated and Depletion | Net Book Value | ||||||||||||||||
| (in years) | ||||||||||||||||||||||
Land | — | $ | 82 | $ | — | $ | 82 | $ | 80 | $ | — | $ | 80 | |||||||||
Buildings and equipment | 1–25 | 6,606 | (3,791 | ) | 2,815 | 6,325 | (3,381 | ) | 2,944 | |||||||||||||
Mine development | 1–20 | 1,740 | (916 | ) | 824 | 1,456 | (852 | ) | 604 | |||||||||||||
Mineral interests | 1–25 | 1,474 | (560 | ) | 914 | 1,581 | (496 | ) | 1,085 | |||||||||||||
Asset retirement cost | 1–25 | 213 | (121 | ) | 92 | 190 | (111 | ) | 79 | |||||||||||||
Construction-in-progress | — | 918 | — | 918 | 344 | — | 344 | |||||||||||||||
| $ | 11,033 | $ | (5,388 | ) | $ | 5,645 | $ | 9,976 | $ | (4,840 | ) | $ | 5,136 | |||||||||
Leased assets included above in property, plant and mine development | 2–10 | $ | 387 | $ | (231 | ) | $ | 156 | $ | 357 | $ | (189 | ) | $ | 168 | |||||||
At December 31, 2005 | At December 31, 2004 | |||||||||||||
Mineral Interests | Amortization Period | Gross Carrying Value | Accumulated Amortization | Net Book | Gross Carrying | Accumulated Amortization | Net Book | |||||||
| (in years) | ||||||||||||||
Working interests: | ||||||||||||||
Production stage | 1–25 | $744 | $(455) | $289 | $740 | $(410) | $330 | |||||||
Development stage | — | 252 | — | 252 | 235 | — | 235 | |||||||
Exploration stage | — | 144 | (11) | 133 | 275 | (14) | 261 | |||||||
| 1,140 | (466) | 674 | 1,250 | (424) | 826 | |||||||||
Royalties: | ||||||||||||||
Production stage | 1–25 | 227 | (64) | 163 | 227 | (50) | 177 | |||||||
Development stage | — | 9 | — | 9 | 9 | — | 9 | |||||||
Exploration stage | — | 5 | (1) | 4 | 5 | (1) | 4 | |||||||
| 241 | (65) | 176 | 241 | (51) | 190 | |||||||||
Oil and gas: | ||||||||||||||
Producing property | 10 | 76 | (29) | 47 | 74 | (21) | 53 | |||||||
Exploration stage | — | 17 | — | 17 | 16 | — | 16 | |||||||
| 93 | (29) | 64 | 90 | (21) | 69 | |||||||||
| $1,474 | $(560) | $914 | $1,581 | $(496) | $1,085 | |||||||||
In 2004, the FASB issued a FASB Staff Position (“FSP”) amending SFAS No. 141 and SFAS No. 142 to provide that certain mineral use rights are considered tangible assets and that mineral use rights should be accounted for based
NEWMONT MINING CORPORATION
NOTES TO CONSOLIDATED FINANCIAL STATEMENTS—(Continued)
(dollars in millions, except per share, per ounce and per pound amounts)
on their substance. As a result, Newmont has reclassified all of its mineral, royalty and oil and gas interests fromMineral interests and other intangible assets toProperty, plant and mine development, net in its balance sheets and ceased amortization on exploration stage mineral interests prior to the commencement of production effective April 1, 2004.
NOTE 8 GOODWILL
The carrying amount of goodwill by reporting unit as of December 31, 2005 and 2004 and changes in the carrying amount of goodwill are summarized in the following table:
| Nevada | Australia/ New Zealand | Exploration | Merchant Banking | Consolidated | ||||||||||||||||
Balance at January 1, 2004 | $ | 41 | $ | 247 | $ | 1,129 | $ | 1,593 | $ | 3,010 | ||||||||||
Change in estimate of pre-acquisition tax contingencies | — | (4 | ) | — | 40 | 36 | ||||||||||||||
Pajingo impairment charge | — | (52 | ) | — | — | (52 | ) | |||||||||||||
Balance at December 31, 2004 | 41 | 191 | 1,129 | 1,633 | 2,994 | |||||||||||||||
Change in estimate of pre-acquisition tax contingencies | — | — | (3 | ) | (71 | ) | (74 | ) | ||||||||||||
Nevada impairment charge | (41 | ) | — | — | — | (41 | ) | |||||||||||||
Balance at December 31, 2005 | $ | — | $ | 191 | $ | 1,126 | $ | 1,562 | $ | 2,879 | ||||||||||
During 2005, annual testing for impairment pursuant to SFAS No. 142 (comparison of implied goodwill value to carrying value) resulted in an impairment charge against goodwill for the Nevada Segment of $41. The impairment resulted from a reevaluation of future production and operating costs that indicated higher future operating and capital costs. The Company also adjusted the tax basis of certain assets originally recorded as part of the purchase price allocation for the acquisition of Normandy. The adjustment to goodwill in the Merchant Banking Segment reflects the resolution of certain tax contingencies established as part of the purchase price allocation relating to the acquisition of Franco-Nevada.
During 2004, annual testing for impairment pursuant to SFAS No. 142 (comparison of implied goodwill value to carrying value) resulted in an impairment charge against goodwill for the Pajingo operation (Australia/New Zealand Segment) of $52. The impairment resulted from a reevaluation of future production and operating costs that indicated lower grade material and higher future operating costs. The Company also adjusted valuation allowances, originally recorded as part of the purchase price allocation for the acquisitions of Normandy and Franco-Nevada, for deferred tax assets related to capital loss carry-forwards in the Australia/New Zealand Segment for the Tanami operation and in the Merchant Banking Segment.
NEWMONT MINING CORPORATION
NOTES TO CONSOLIDATED FINANCIAL STATEMENTS—(Continued)
(dollars in millions, except per share, per ounce and per pound amounts)
NOTE 9 INVESTMENTS AND EQUITY INCOME OF AFFILIATESDEBT
| At December 31, | ||||||||||||
| 2005 | 2004 | |||||||||||
| Current | Non-Current | Current | Non-Current | |||||||||
Sale-leaseback of refractory ore treatment plant | $ | 19 | $ | 256 | $ | 13 | $ | 274 | ||||
5 7/8% notes, net of discount | — | 597 | — | — | ||||||||
8 3/8% debentures, net of discount | — | — | 50 | — | ||||||||
8 5/8% debentures, net of discount | — | 218 | — | 219 | ||||||||
Newmont Australia 7 5/8% guaranteed notes, net of premium | — | 120 | — | 120 | ||||||||
Newmont Australia 7 1/2% guaranteed notes, net of premium | — | — | 20 | — | ||||||||
Prepaid forward sales obligation | 48 | 48 | 48 | 97 | ||||||||
PTNNT project financing facility | 87 | 479 | 87 | 566 | ||||||||
PTNNT sponsor loans | 39 | — | 53 | — | ||||||||
Project financings, capital leases and other | 3 | 15 | 15 | 40 | ||||||||
| $ | 196 | $ | 1,733 | $ | 286 | $ | 1,316 | |||||
Scheduled minimum debt repayments are $196 in 2006, $162 in 2007, $232 in 2008, $114 in 2009, $113 in 2010, and $1,112 thereafter.
Sale-Leaseback of Refractory Ore Treatment Plant
In September 1994, the Company entered into a sale and leaseback agreement for its refractory ore treatment plant located in Carlin, Nevada. The lease term is 21 years and aggregate future minimum lease payments, which include interest, were $371 and $401 at December 31, 2005 and 2004, respectively. Future minimum lease payments are $36 in the years 2006 through 2008, $37 in 2009, $36 in 2010 and $190 thereafter. The lease includes purchase options during and at the end of the lease at predetermined prices. The interest rate on this sale-leaseback transaction is 6.36%. In connection with this transaction, the Company entered into certain interest rate hedging contracts that were settled for a gain of $11, which is recognized as a reduction of interest expense over the term of the lease. Including this gain, the effective interest rate on the borrowing is 6.15%. The related asset is specialized, therefore it is not practicable to estimate the fair value of this debt.
5 7/8% Notes
During March 2005, Newmont issued uncollateralized notes with a principal amount of $600 due April 2035 bearing an interest rate of 5 7/8%. Interest on the notes is paid semi-annually in April and October. Using prevailing interest rates on similar instruments, the estimated fair value of these notes was $588 at December 31, 2005. The foregoing fair value estimate was prepared by an independent third party and may or may not reflect the actual trading value of this debt.
8 3/8% Debentures
Uncollateralized debentures bearing an annual interest rate of 8.375% Senior Debentures due 2005 in an aggregate principal amount of $50 were outstanding at December 31, 2004. These debentures matured during 2005.
NEWMONT MINING CORPORATION
NOTES TO CONSOLIDATED FINANCIAL STATEMENTS—(Continued)
(dollars in millions, except per share, per ounce and per pound amounts)
Investments:8 5/8% Debentures
In May 2001, Newmont issued uncollateralized debentures with a principal amount of $275 due May 2011 bearing an annual interest rate of 8.625%. During the first quarter of 2003, the Company repurchased $52 of these debentures resulting inOther expense of $12. The calculation of the Other expenseincluded the proportional write-off of capitalized debt issue costs, discounts and the mark-to-market of the underlying debt resulting from fair value hedge accounting (seeInterest Rate Swaps below). Interest on the remaining outstanding balance is payable semi-annually in May and November and the debentures are redeemable prior to maturity under certain conditions. The costs related to the issuance of the debentures were capitalized and the remaining balance is amortized to interest expense over the term of the debentures. The interest rate swap discussed below is considered a fair value hedge applicable to this debt and is therefore marked-to-market. Using prevailing interest rates on similar instruments, the estimated fair value of these debentures was $251 and $272 at December 31, 2005, and 2004, respectively. The foregoing fair value estimate was prepared by an independent third party and may or may not reflect the actual trading value of this debt.
Newmont Australia 7 5/8% Notes
In July 1998, Normandy Finance Limited (“NFL”) a subsidiary of Normandy Australia Limited, now Newmont Australia Limited (“NAL”) issued $150 of ten year 7 5/8% notes guaranteed by NAL. In conjunction with the Normandy acquisition, NFL and NAL were acquired by Newmont in February 2002. Interest on the notes is paid semi-annually in arrears in January and July. The notes were recorded at their fair values at February 15, 2002 as part of the purchase accounting for the acquisition of Normandy. During the first quarter of 2003, the Company repurchased $31 of these notes resulting inOther expenseof $4. The estimated fair value of these notes approximates the carrying value at December 31, 2005 and 2004. The foregoing fair value estimate was prepared by an independent third party and may or may not reflect the actual trading value of this debt.
Prepaid Forward Sales Contract
Under the prepaid forward gold sales contract (the “Prepaid Forward”) and forward gold purchase contract (the “Forward Purchase”) the Company is obligated to sell 322,222 ounces of gold, to be delivered in June of 2006 and 2007 in annual installments of 161,111 ounces and to deliver 17,951 ounces of gold in June and December 2006 as well as June 2007. The Forward Purchase provides for purchases of 17,951 ounces of gold on each delivery date under the Prepaid Forward at an average of $344 per ounce in 2006 and $354 per ounce in 2007.
The Company may also be entitled to receive additional proceeds in connection with the annual deliveries of 161,111 ounces, to be determined at each delivery date based on the excess, if any, of the then market price for gold (up to a maximum of $380 per ounce) over $300 per ounce. During June 2005, 161,111 ounces were delivered in connection with the first annual delivery, resulting in a non-cash reduction in debt of $48. Remaining scheduled repayments are $48 in 2006 and 2007. Using relevant future market conditions and financial models, the estimated negative fair value of these contracts was approximately $159 and $205 at December 31, 2005 and 2004, respectively.
Interest Rate Swaps
In 2001, Newmont entered into contracts to hedge the interest rate risk exposure on a portion of its $275 8 5/8% debentures and its $200 8 3/8% debentures. The Company receives fixed-rate interest payments at 8.625% or 8.375% and pays floating-rate interest amounts based on periodic London Interbank Offered Rate (“LIBOR”) settings plus a spread, ranging from 2.60% to 4.25%. See Note 21. The remaining swap contracts are designated as a hedge against $100 principal of the 8 5/8% debentures.
NEWMONT MINING CORPORATION
NOTES TO CONSOLIDATED FINANCIAL STATEMENTS—(Continued)
(dollars in millions, except per share, per ounce and per pound amounts)
| At December 31, | ||||||
| 2004 | 2003 | |||||
| (in thousands) | ||||||
Canadian Oil Sands Trust | $ | 336,901 | $ | — | ||
Gabriel Resources Ltd. | 19,434 | — | ||||
European Gold Refineries | 12,663 | 11,907 | ||||
AGR Matthey Joint Venture | 12,027 | 12,321 | ||||
Batu Hijau | — | 709,749 | ||||
Other | 5,148 | — | ||||
| $ | 386,173 | $ | 733,977 | |||
PTNNT Sponsor Loans
PTNNT has shareholder subordinated loan agreements (“Sponsor Loans”) with Newmont Indonesia Limited (“NIL”), a wholly-owned subsidiary of Newmont, and Nusa Tenggara Mining Corporation (“NTMC”), an affiliate of Sumitomo Corporation, with substantially the same terms for each shareholder. Total principal outstanding under these Sponsor Loans was approximately $89 and $121 as of December 31, 2005 and 2004, respectively. Of these amounts, 43.75% or approximately $39 and $53 at December 31, 2005 and 2004, respectively, was due to NTMC, an unrelated third-party, and is non-recourse to Newmont, with the remainder payable to a subsidiary consolidated by Newmont. Payments of $14 and $56 were made to NTMC during 2005 and 2004, respectively. Borrowings under the Sponsor Loans are guaranteed by Nusa Tenggara Partnership (“NTP”) and are payable on demand, subject to the Senior Debt subordination terms. Through December 31, 2003, the interest rate was based on the annual Singapore InterBank Offering Rate (“SIBOR”) and the interest rate on any unpaid interest was based on the annual SIBOR rate plus 1%. Effective January 1, 2004, the Sponsor Loans were amended such that the annual interest rates are based on SIBOR rate plus 3% for principal and SIBOR rate plus 4% for any unpaid accrued interest. The weighted average interest rate and the rate at December 31, 2005 and 2004 were 6.3% and 7.6%, respectively. The fair market value cannot be practicably determined due to the lack of available market information for this type of debt.
Newmont and NTMC provide a contingent support line of credit to PTNNT. No funding was required in 2005. Available additional support from NTP’s partners was $65, of which Newmont’s pro-rata share was $37, at December 31, 2005.
Project Financings
PTNNT Project Financing Facility
On May 9, 2002, P.T. Newmont Nusa Tenggara (“PTNNT”) completed a restructuring of its project financing facility, with a syndicate of banks. The scheduled repayments of this debt are semi-annual installments of $43 through November 2010 and $22 from May 2011 through November 2013. Amounts outstanding under the project financing were $566 and $653 at December 31, 2005 and 2004.
The project financing facility is non-recourse to Newmont and substantially all of Batu Hijau’s assets are pledged as collateral. The carrying value of the property, plant and mine development was $1,449 and $1,519 at December 31, 2005 and 2004, respectively. Under the terms of the project financing facility, PTNNT maintains an escrow account for the next interest and principal installment due. Such amount totaled $62 and $58 at December 31, 2005 and 2004, respectively, and was included inOther long-term assets. The facility contains certain covenants that limit indebtedness and restricted payments to partners, among others. In addition, PTNNT must maintain certain financial ratios. At December 31, 2005, PTNNT was in compliance with these covenants.
The interest rate is based on blended fixed and floating rates and at market rates on December 31, 2005, the weighted average interest rate approximated the London InterBank Offering Rate (“LIBOR”) plus 2.1%. The weighted average interest rates were 5.7%, 5.1% and 4.7% during 2005, 2004 and 2003, respectively, and the interest rates were 6.5% and 5.2% at December 31, 2005 and 2004, respectively. The fair market value cannot be practicably determined due to the lack of available market information for this type of debt.
Yanacocha
$100 Credit Facility. In December 1999, Yanacocha entered into a $100 credit facility (a $20 A Tranche and an $80 B Tranche) with the International Finance Corporation (“IFC”). At December 31, 2004, $30 was outstanding in total with $10 outstanding under the A Tranche and $20 outstanding under the B Tranche. The A
NEWMONT MINING CORPORATION
NOTES TO CONSOLIDATED FINANCIAL STATEMENTS—(Continued)
(dollars in millions, except per share, per ounce and per pound amounts)
Tranche had a five-year revolving availability period and converted into a five-year term loan in December 2004. The B Tranche had a three-year revolving availability period that converted to a four-year term loan in December 2002. Initial drawdowns under the loan were used for development of the La Quinua project; however, the loan accommodated repayments during the revolving availability period and subsequent borrowings were used for other purposes. Interest applicable to the A Tranche was based on LIBOR plus 2.375%. Interest applicable to the B Tranche was based on LIBOR plus 2.5%. Certain Yanacocha assets collaterized the loans. In December 2005, Yanacocha prepaid both Tranches of the loan.
$50 Credit Facility. In June 2004, Yanacocha amended its $40 line of credit with Banco de Credito del Peru to extend the term of the facility to June 2007, reduce the applicable interest rate and increase the facility to $50. The interest rate is LIBOR plus 0.65% through June 2005 and LIBOR plus 2% thereafter. The interest rate under the previous agreement was LIBOR plus 0.75% through June 2004. There was no outstanding balance at December 31, 2005 and 2004. During 2004, Yanacocha borrowed $36 and repaid $36 of the total line of credit. During 2005, no amounts were borrowed under this revolving line of credit.
$20 Credit Facility. In June 2005, the $20 credit facility with BBVA Banco Continental expired and was not renewed. There was no outstanding balance at December 31, 2005 and 2004. No amounts were borrowed under this revolving line of credit during either year.
Proposed Financing. On December 19, 2005, Yanacocha filed with the Peruvian securities regulatory authority (CONASEV), for its review and approval, a prospectus to register a $200 bond program in the Peruvian public market. When approved, the registration would make the bond program available for Yanacocha to make up to $200 in issuances over a two-year period. Yanacocha also intends to obtain funds from other sources, including commercial banks. Any funds generated from the bond program or other debt facilities may be used by Yanacocha for capital expenditures and its general corporate purposes.
Zarafshan—Newmont
In December 2000, Zarafshan-Newmont entered into a $30 loan with the European Bank for Reconstruction and Development (“EBRD”), of which $15 was Newmont’s share, primarily for capital expansion. Newmont’s portion of the outstanding amount on this loan was $11 and $11 at December 31, 2005 and 2004, respectively. The interest rate is based on the three-month LIBOR plus 3.25%. The interest rate was 7.4% and 5.3% at December 31, 2005 and 2004 and the weighted-average interest rate was 6.2% and 4.6% for 2005 and 2004, respectively. Using prevailing interest rates on similar instruments, the estimated fair value of this debt approximated the carrying value at December 31, 2005 and 2004. In July 2004, Zarafshan-Newmont entered into a supplemental agreement with the EBRD that provided for the loan facility to be repaid in 13 semi-annual payments, beginning July 2004 and ending July 2010. In addition, the minimum balance of the escrow account requirement was increased to $4 to ensure the timely payments of principal and interest.
The assets of Zarafshan-Newmont (with carrying values of approximately $222 and $206 at December 31, 2005 and 2004, respectively), collateralize the loan. In addition, the Company has guaranteed 50% of the loan and the Uzbek partners have guaranteed the other 50%. Under the terms of the EBRD facility, certain payments, including payment of any distribution of capital or disbursement of funds not directly related to expenses of the project, are not permitted unless certain conditions and financial ratios are met.
Corporate Revolving Credit Facilities
Effective July 30, 2004, the Company entered into a new uncollateralized $1,250 revolving credit facility with a syndicate of commercial banks. This revolving credit facility replaced the three existing revolving credit
NEWMONT MINING CORPORATION
NOTES TO CONSOLIDATED FINANCIAL STATEMENTS—(Continued)
(dollars in millions, except per share, per ounce and per pound amounts)
facilities which were cancelled upon the effectiveness of the new facility. The facility provides for borrowings in U.S. dollars and contains a letter of credit sub-facility. In July 2005, the Company amended its revolving credit facility, extending the final maturity one year, to July 28, 2010. In addition, certain adjustments to pricing and structure were also made. Interest rates and facility fees vary based on the credit ratings of the Company’s senior, uncollateralized, long-term debt. Borrowings under the facilities bear interest at a rate per annum equal to either LIBOR plus a margin ranging from 0.22% to 1.00% or the greater of the federal funds rate plus 0.5% or the lead bank’s prime. Facility fees accrue at a rate per annum ranging from 0.080% to 0.250% of the aggregate commitments. The Company also pays a utilization fee of 0.10% on the amount of revolving credit loans and letters of credit outstanding under the facility for each day on which the sum of such loans and letters of credit exceed 50% of the commitments under the facility. At December 31, 2005, the facility fees were 0.09% of the commitment. There was $275 outstanding under the letter of credit sub-facility as of December 31, 2005.
Debt Covenants
Certain of Newmont’s current debt facilities contain various common public debt covenants and default provisions including payment defaults, limitation on liens, limitation on sales and leaseback agreements and merger restrictions. These debt instruments include the 5 7/8% notes, Newmont Australia 7 5/8% notes, 8 5/8% debentures, and sale-leaseback of the refractory ore treatment plant. None of the aforementioned public debt instruments contain financial ratio covenants or credit rating provisions that could create liquidity issues for the Company.
In addition to the covenants noted above, the revolving credit facility contains financial ratio covenants requiring the Company to maintain a net debt to EBITDA (earnings before interest expense, income taxes, depreciation and amortization) ratio of less than or equal to 4.0 and a net debt (total debt net of cash) to total capitalization ratio of less than or equal to 62.5%. Furthermore, the corporate revolving credit facility contains covenants limiting the sale of all or substantially all of the Company’s assets, certain change of control provisions and a negative pledge on certain assets.
Certain of the Company’s project debt facilities contain various common project debt covenants and default provisions including limitations on dividends subject to certain debt service cover ratios, limitations on sales of assets, negative pledges on certain assets, change of control provisions and limitations of additional permitted debt.
At December 31, 2005, the Company and its related entities were in compliance with all debt covenants and default provisions.
NOTE 10 EMPLOYEE-RELATED BENEFITS
| At December 31, | ||||||
| 2005 | 2004 | |||||
Current: | ||||||
Employee pension benefits | $ | 30 | $ | 7 | ||
Accrued payroll and withholding taxes | 81 | 82 | ||||
Workers’ participation | 40 | 29 | ||||
Accrued severance | 3 | 5 | ||||
Other employee-related payables | 22 | 6 | ||||
| $ | 176 | $ | 129 | |||
| �� | ||||||
NEWMONT MINING CORPORATION
NOTES TO CONSOLIDATED FINANCIAL STATEMENTS—(Continued)
(dollars in millions, except per share, per ounce and per pound amounts)
| At December 31, | ||||||
| 2005 | 2004 | |||||
Long-term: | ||||||
Employee pension benefits | $ | 96 | $ | 72 | ||
Other post-retirement benefit plans | 94 | 88 | ||||
Workers’ participation | 19 | 23 | ||||
Accrued severance | 27 | 26 | ||||
Other employee-related payables | 37 | 35 | ||||
| $ | 273 | $ | 244 | |||
Pension Plans
The Company’s pension plans include: (1) two qualified non-contributory defined benefit plans (for salaried employees and substantially all domestic hourly union employees); (2) one non-qualified plan (for salaried employees whose benefits under the qualified plan are limited by federal legislation); (3) two qualified plans for salaried and hourly Canadian employees and (4) a non-qualified international plan (for select employees who are not eligible to participate in the U.S.-based plans because of citizenship). The vesting period for plans identified in (1) and (2) is five years of service. These plans’ benefit formulas are based on an employee’s years of credited service and either (i) such employee’s highest consecutive five years average pay (salaried plan) or (ii) a flat dollar amount adjusted by a service-weighted multiplier (hourly plan). The Canadian plan provides for full vesting of benefits upon remittance and the benefit formula is based on a percentage of annual pay. The international retirement plan’s basic and savings accounts have a graded vesting schedule and are fully vested after four years of service. The international retirement plan’s supplemental account is vested after attaining age 55 with 10 years of service or attaining age 62. The plan’s benefit formula is based on a percentage of compensation as defined in the plan document.
Pension costs are determined annually by independent actuaries and pension contributions to the qualified plans are made based on funding standards established under the Employee Retirement Income Security Act of 1974.
Other Benefit Plans
The Company provides defined medical and life insurance benefits to selected qualified U.S. and Canadian retirees (generally salaried employees and to a limited extent their eligible dependents). In general, participants become eligible for these benefits upon retirement directly from the Company if they are at least 55 years old and, for U.S. employees, the combination of their age and years of service with the Company equals 75 or more. This benefit is not provided to employees who joined the Company after January 1, 2003.
Defined medical benefits cover most of the reasonable and customary charges for hospital, surgical, diagnostic and physician services and prescription drugs. Life insurance benefits are based on a percentage of final base annual salary and decline over time after retirement commences. The majority of the costs of these medical and life insurance benefits are paid by the Company. In 2003, the Company began a strategy to more equitably share costs with retirees; by 2008, 75% of retiree medical coverage cost will be paid by the Company. Qualified retirees that become eligible after January 1, 2003 may be required to contribute additional amounts to the medical coverage.
NEWMONT MINING CORPORATION
NOTES TO CONSOLIDATED FINANCIAL STATEMENTS—(Continued)
(dollars in millions, except per share, per ounce and per pound amounts)
The following tables provide a reconciliation of changes in the plans’ benefit obligations and assets’ fair values for the two-year period ended December 31, 2005, and a statement of the funded status as of December 31, 2005 and 2004:
| Pension Benefits | Other Benefits | |||||||||||||||
| 2005 | 2004 | 2005 | 2004 | |||||||||||||
Change in Benefit Obligation: | ||||||||||||||||
Benefit obligation at beginning of year | $ | 337 | $ | 289 | $ | 82 | $ | 69 | ||||||||
Service cost-benefits earned during the year | 13 | 11 | 5 | 3 | ||||||||||||
Interest cost | 19 | 18 | 5 | 4 | ||||||||||||
Amendments | 5 | 1 | — | — | ||||||||||||
Actuarial loss (gain) | 43 | 30 | (3 | ) | 8 | |||||||||||
Foreign currency exchange loss | — | — | — | — | ||||||||||||
Settlement payments | 4 | — | — | — | ||||||||||||
Benefits paid | (19 | ) | (12 | ) | (3 | ) | (2 | ) | ||||||||
Benefit obligation at end of year | $ | 402 | $ | 337 | $ | 86 | $ | 82 | ||||||||
Accumulated Benefit Obligation | $ | 354 | $ | 296 | N/A | N/A | ||||||||||
Change in Fair Value of Assets: | ||||||||||||||||
Fair value of assets at beginning of year | $ | 217 | $ | 172 | $ | — | $ | — | ||||||||
Actual return on plan assets | 17 | 19 | — | — | ||||||||||||
Employer contributions | 12 | 38 | 3 | 2 | ||||||||||||
Foreign currency exchange gain | — | — | — | — | ||||||||||||
Settlement payments | — | — | — | — | ||||||||||||
Benefits paid | (19 | ) | (12 | ) | (3 | ) | (2 | ) | ||||||||
Fair value of assets at end of year | $ | 227 | $ | 217 | $ | — | $ | — | ||||||||
Under funded status | $ | (175 | ) | $ | (120 | ) | $ | (86 | ) | $ | (82 | ) | ||||
Unrecognized prior service cost | 12 | 8 | (7 | ) | (8 | ) | ||||||||||
Unrecognized net loss (gain) | 139 | 104 | (1 | ) | 2 | |||||||||||
Unrecognized net asset | — | — | — | — | ||||||||||||
Accrued cost | $ | (24 | ) | $ | (8 | ) | $ | (94 | ) | $ | (88 | ) | ||||
The Company’s qualified pension plans are funded with cash contributions in compliance with Internal Revenue Service (“IRS”) rules and regulations. The Company’s non-qualified and other benefit plans are currently not funded, but exist as general corporate obligations. The information contained in the above tables indicates the combined funded status of qualified and non-qualified plans, in accordance with accounting pronouncements. Assumptions used for IRS purposes differ from those used for accounting purposes. The funded status shown above compares the projected benefit obligation (“PBO”) of all plans, which is an actuarial present value of obligations that takes into account assumptions as to future compensation levels of plan participants, to the fair value of the assets held in trust for the qualified plans. Accounting pronouncements also prescribe a computation for the plans’ accumulated benefit obligation (“ABO”), which is an actuarial present value of benefits (whether vested or nonvested) attributed to employees based on employee service and compensation prior to the end of the period presented. The Company is currently planning to contribute at a minimum, $30, to its retirement benefit programs in 2006. However, during the course of the year, consideration may be given to making additional contributions toward the Company’s retirement benefit programs depending on various factors, including changes to regulations governing the funding of pensions, the Company’s business and operating environment and forecasted cash flows.
NEWMONT MINING CORPORATION
NOTES TO CONSOLIDATED FINANCIAL STATEMENTS—(Continued)
(dollars in millions, except per share, per ounce and per pound amounts)
The following plans have an ABO in excess of the market value of plan assets:
| 2005 | 2004 | |||||||||||||||||
| PBO | ABO | Market value of plan assets | PBO | ABO | Market value of plan assets | |||||||||||||
Qualified plan—salaried employees | $ | 309 | $ | 266 | $ | 197 | $ | 268 | $ | 231 | $ | 187 | ||||||
Non-qualified plan—salaried employees | 45 | 42 | — | 30 | 27 | — | ||||||||||||
Qualified plan—hourly employees | 40 | 39 | 26 | 33 | 33 | 23 | ||||||||||||
Non-qualified plan—international | 7 | 6 | — | 5 | 4 | — | ||||||||||||
Qualified and non-qualified plans—Canadian | 1 | 1 | 4 | 1 | 1 | 7 | ||||||||||||
| $ | 402 | $ | 354 | $ | 227 | $ | 337 | $ | 296 | $ | 217 | |||||||
The following table provides the net amounts recognized in the consolidated balance sheets as of December 31:
| Pension Benefits | Other Benefits | |||||||||||||||
| 2005 | 2004 | 2005 | 2004 | |||||||||||||
Accrued benefit cost | $ | (126 | ) | $ | (79 | ) | $ | (94 | ) | $ | (88 | ) | ||||
Intangible asset | 12 | 8 | — | — | ||||||||||||
Accumulated other comprehensive income | 90 | 63 | — | — | ||||||||||||
| $ | (24 | ) | $ | (8 | ) | $ | (94 | ) | $ | (88 | ) | |||||
In 2004, an adjustment was required to reflect an increased liability of $3 for the hourly pension plans. This was the result of a one-time, one-year increase to benefits applicable to participants with a specified combination of age and years of service. In 2004, an adjustment was required to reflect a decreased liability of $2 for the non-qualified plans. This was the result of a change to the components of eligible compensation.
The following table provides the components of the net periodic pension benefit cost for the years ended December 31:
| Pension Benefits | Other Benefits | |||||||||||||||||||||||
| 2005 | 2004 | 2003 | 2005 | 2004 | 2003 | |||||||||||||||||||
Service cost | $ | 13 | $ | 11 | $ | 9 | $ | 5 | $ | 3 | $ | 3 | ||||||||||||
Interest cost | 19 | 18 | 17 | 5 | 4 | 4 | ||||||||||||||||||
Expected return on plan assets | (15 | ) | (13 | ) | (12 | ) | — | — | — | |||||||||||||||
Amortization of prior service cost | 1 | 1 | 1 | (1 | ) | (1 | ) | — | ||||||||||||||||
Amortization of loss (gain) | 6 | 4 | 2 | — | — | (1 | ) | |||||||||||||||||
Settlements | 4 | — | — | — | — | — | ||||||||||||||||||
| $ | 28 | $ | 21 | $ | 17 | $ | 9 | $ | 6 | $ | 6 | |||||||||||||
For the pension plans, prior-service costs are amortized on a straight-line basis over the average remaining service period of active participants. Gains and losses in excess of 10% of the greater of the benefit obligation or the market-related value of assets are amortized over the average remaining service period of active participants. Pension and postretirement benefits are accrued during an employee’s service to the Company.
NEWMONT MINING CORPORATION
NOTES TO CONSOLIDATED FINANCIAL STATEMENTS—(Continued)
(dollars in millions, except per share, per ounce and per pound amounts)
Significant assumptions were as follows:
| Pension Benefits | Other Benefits | |||||||||||
| As of December 31, | As of December 31, | |||||||||||
| 2005 | 2004 | 2005 | 2004 | |||||||||
Weighted-average assumptions used in measuring the Company’s benefit obligation: | ||||||||||||
Discount rate | 5.75 | % | 5.75 | % | 5.75 | % | 5.75 | % | ||||
Rate of compensation increase | 4.00 | % | 4.00 | % | 4.00 | % | 4.00 | % | ||||
| Pension Benefits | Other Benefits | |||||||||||||||||
| Years Ended December 31, | Years Ended December 31, | |||||||||||||||||
| 2005 | 2004 | 2003 | 2005 | 2004 | 2003 | |||||||||||||
Weighted-average assumptions used in measuring the net periodic pension benefit cost: | ||||||||||||||||||
Discount long-term rate | 5.75 | % | 6.25 | % | 6.75 | % | 5.75 | % | 6.25 | % | 6.75 | % | ||||||
Expected return on plan assets | 8.00 | % | 8.00 | % | 8.00 | % | N/A | N/A | N/A | |||||||||
Rate of compensation increase | 4.00 | % | 4.00 | % | 4.00 | % | 4.00 | % | 4.00 | % | 4.00 | % | ||||||
The 2003-2005 decision to use 8% as the expected long-term return on plan assets was based on an analysis of the actual plan asset returns over multiple time horizons and review of assumptions used by other U.S. corporations with defined benefit plans of similar size and investment strategy. The average actual return on plan assets during the 17 years ended December 31, 2005 approximated 10%.
The pension plan employs several independent investment firms which invest the assets of the plan in certain approved funds that correspond to specific asset classes with associated target allocations. Depending upon actual sector performance, the assets in the plan are periodically rebalanced to match the established target levels for the asset classes. The goal of the pension fund investment program is to achieve expected rates of return consistent with the investment risk associated with the approved investment portfolio. The investment performance of the plan and that of the individual investment firms is measured against recognized market indices. This performance is monitored by an investment committee comprised of members of the Company’s management, which is advised by an independent investment consultant. The performance of the plan is reviewed annually with the Audit Committee of the Company’s board of directors. The following is a summary of the target asset allocations for 2005 and the actual asset allocation for 2005.
| Target | Actual at December 31, 2005 | |||||
Asset Allocation | ||||||
U.S. equity investments | 45 | % | 44 | % | ||
International equity investments | 20 | % | 22 | % | ||
Fixed income investments | 35 | % | 34 | % |
NEWMONT MINING CORPORATION
NOTES TO CONSOLIDATED FINANCIAL STATEMENTS—(Continued)
(dollars in millions, except per share, per ounce and per pound amounts)
The assumed health care cost trend rate to measure the expected cost of benefits was 11% for 2006, 10% for 2007, 9% for 2008, 8% for 2009, 7% for 2010, 6% for 2011 and 5% each year thereafter. Assumed health care cost trend rates have a significant effect on amounts reported for the health care plans. A one-percentage-point change in assumed health care cost trend rates would have the following effects:
One-percentage- point Increase | One-percentage- point Decrease | ||||||
Effect on total of service and interest cost components of net periodic postretirement health care benefit cost | $ | 2 | $ | (1 | ) | ||
Effect on the health care component of the accumulated postretirement benefit obligation | $ | 14 | $ | (11 | ) | ||
Cash flows
Benefit payments expected to be paid to plan participants are as follows:
| Pension Benefits | Other Benefit Plans | |||||
2006 | $ | 13 | $ | 3 | ||
2007 | 32 | 3 | ||||
2008 | 14 | 3 | ||||
2009 | 18 | 3 | ||||
2010 | 21 | 4 | ||||
2011 through 2015 | 116 | 22 | ||||
| $ | 214 | $ | 38 | |||
Savings Plans
The Company has two qualified defined contribution savings plans, one that covers salaried and non-union hourly employees and one that covers substantially all hourly union employees. In addition, the Company has one non-qualified supplemental savings plan for salaried employees whose benefits under the qualified plan are limited by federal regulations. When an employee meets eligibility requirements, the Company matches 100% of employee contributions of up to 6% and 5% of base salary for the salaried (including non-union hourly employees) and hourly plans, respectively. Matching contributions are made with Newmont stock; however, no holding restrictions are placed on such contributions, which totaled $10 in 2005, $9 in 2004 and $8 in 2003.
NOTE 11 STOCK OPTIONS
Employee Stock Options
The Company currently maintains the 2005 Stock Incentive Plan (“Stock Plan”), approved by stockholders on April 27, 2005, for executives and eligible employees. Under this Stock Plan, options to purchase shares of stock can be granted with exercise prices not less than at 100% of fair market value of the underlying stock at the date of grant. Fair market value of a share of common stock as of the grant date is the average of the high and low sales prices for a share of the Company’s common stock on the New York Stock Exchange. The Company also maintains prior stock plans, but no longer grants awards under these plans. Options granted under the Company’s stock plans vest over periods ranging from two to four years and are exercisable over a period of time not to exceed 10 years from grant date. At December 31, 2005, 18,963,560 shares were available for future grants under the Company’s 2005 Stock Incentive Plan.
NEWMONT MINING CORPORATION
NOTES TO CONSOLIDATED FINANCIAL STATEMENTS—(Continued)
(dollars in millions, except per share, per ounce and per pound amounts)
The following table summarizes annual activity for all stock options for each of the three years ended December 31:
| 2005 | 2004 | 2003 | |||||||||||||||||||
| Number of Shares | Weighted Average Exercise Price | Number of Shares | Weighted Average Exercise Price | Number of Shares | Weighted Average Exercise Price | ||||||||||||||||
Outstanding at beginning of year | 9,209,914 | $ | 34.11 | 10,629,449 | $ | 30.02 | 13,108,428 | $ | 27.43 | ||||||||||||
Granted | 2,002,638 | $ | 41.67 | 2,030,722 | $ | 43.16 | 2,014,600 | $ | 39.92 | ||||||||||||
Exercised | (1,517,601 | ) | $ | 44.40 | (3,053,688 | ) | $ | 24.80 | (4,025,689 | ) | $ | 24.25 | |||||||||
Forfeited and expired | (261,282 | ) | $ | 49.40 | (396,569 | ) | $ | 47.77 | (467,890 | ) | $ | 41.38 | |||||||||
Outstanding at end of year | 9,433,669 | $ | 35.90 | 9,209,914 | $ | 34.11 | 10,629,449 | $ | 30.02 | ||||||||||||
Options exercisable at year end | 5,920,180 | $ | 32.58 | 5,577,335 | $ | 30.51 | 7,245,460 | $ | 28.05 | ||||||||||||
Weighted-average fair value of options granted during the year | $ | 14.39 | $ | 14.05 | $ | 17.66 | |||||||||||||||
The following table summarizes information about stock options outstanding at December 31, 2005, with exercise prices equal to the fair market value on the date of grant with no restrictions on exercisability after vesting:
| Options Outstanding | Options Exercisable | |||||||||||
Range of Exercise Prices | Number Outstanding | Weighted- average Remaining Contractual Life (in years) | Weighted- average Exercise Price | Number Exercisable | Weighted Average Exercise Price | |||||||
$0 to $20 | 1,617,656 | 3.4 | $ | 18.58 | 1,617,656 | $ | 18.58 | |||||
$20 to $30 | 2,319,789 | 5.9 | $ | 25.98 | 2,000,581 | $ | 25.80 | |||||
$30 to $40 | 1,252,885 | 7.9 | $ | 37.47 | 226,732 | $ | 34.87 | |||||
$40 to $50 | 3,758,594 | 8.7 | $ | 45.47 | 1,590,466 | $ | 46.76 | |||||
$50+ | 484,745 | 0.8 | $ | 60.77 | 484,745 | $ | 60.77 | |||||
| 9,433,669 | 6.6 | $ | 35.90 | 5,920,180 | $ | 32.58 | ||||||
The Company’s U.S. income taxes payable have been reduced, and additional paid in capital increased, for the tax benefits associated with the exercise of employee stock options. The Company is entitled to a deduction equal to the excess of the fair market value of the stock issued at the date of exercise over the amount received from the employee (the option exercise price). These tax benefits were credited directly to shareholders’ equity as additional paid in capital and amounted to $nil for 2005, $18 for 2004, and $19 for 2003.
Other Stock-Based Compensation
The Company grants restricted stock to certain employees. Shares of restricted stock are granted upon achievement of certain financial and operating thresholds at fair market value on the grant date. Prior to vesting, these shares of restricted stock are subject to certain restrictions related to ownership and transferability. Holders of restricted stock entitle the holder to vote the shares and to receive any dividends declared on the shares. In 2005, 2004, and 2003, 155,061, 285,155, and 170,019 shares of restricted stock, respectively, were granted and issued, of which 147,861 and 168,320 shares remained unvested at December 31, 2005 for the 2005 and 2004 grants, respectively. The weighted-average fair market value of the stock grants issued were $45, $42, and $26 in
NEWMONT MINING CORPORATION
NOTES TO CONSOLIDATED FINANCIAL STATEMENTS—(Continued)
(dollars in millions, except per share, per ounce and per pound amounts)
2005, 2004, and 2003, respectively. Compensation expense recorded for restricted stock was $9, $8, and $13 in 2005, 2004 and 2003, respectively. The shares of restricted stock vest in three equal increments over three years.
Restricted stock units also are granted, upon achievement of certain financial and operating thresholds, to employees in certain foreign jurisdictions. In 2005, the Company granted 27,386 restricted stock units at the weighted-average fair market value of $44.57 per underlying share of the Company’s common stock. In 2004, the Company granted 18,788 restricted stock units at the weighted-average fair market value of $42.04 per underlying share of the Company’s common stock. Compensation expense recorded for the foreign jurisdiction restricted stock units was $1 in both 2005 and 2004. These restricted stock units vest in three equal increments over three years. Upon vesting, the employee is entitled to receive for each restricted stock unit one share of the Company’s common stock.
The Company grants deferred stock awards to certain other employees. The deferred stock awards vest over periods between two to three years. In 2005, 2004 and 2003, the Company granted deferred stock awards in respect of 164,975, 158,219, and 174,795 shares of the Company’s common stock, respectively, at weighted-average fair market values of $40.92, $42.99, and $36.76 per share, respectively. At December 31, 2005 and 2004, 159,620 and 314,109 deferred stock awards, respectively, remained unvested. Compensation expense recorded for deferred stock awards was $5, $6, and $5 in 2005, 2004 and 2003, respectively. Upon vesting, the employee is entitled to receive the number of shares of the Company’s common stock specified in the deferred stock award.
NOTE 12 OTHER LIABILITIES
| At December 31, | ||||||
| 2005 | 2004 | |||||
Other current liabilities: | ||||||
Accrued capital expenditures | $ | 80 | $ | 58 | ||
Income and mining taxes | 77 | 57 | ||||
Reclamation and remediation costs | 63 | 53 | ||||
Accrued operating costs | 82 | 60 | ||||
Royalties | 26 | 41 | ||||
Interest | 42 | 37 | ||||
Taxes other than income and mining | 18 | 15 | ||||
Deferred revenue | 17 | 11 | ||||
Advanced stripping costs | 14 | 2 | ||||
Deferred income tax liabilities | 5 | 10 | ||||
Other | 52 | 31 | ||||
| $ | 476 | $ | 375 | |||
Other long-term liabilities: | ||||||
Income taxes | $ | 220 | $ | 306 | ||
Deferred stripping | 93 | 103 | ||||
Deferred revenue from the sale of future product | 47 | 47 | ||||
Derivative instruments | 30 | 7 | ||||
Other | 24 | 24 | ||||
| $ | 414 | $ | 487 | |||
NEWMONT MINING CORPORATION
NOTES TO CONSOLIDATED FINANCIAL STATEMENTS—(Continued)
(dollars in millions, except per share, per ounce and per pound amounts)
Equity LossNOTE 13 RECLAMATION AND REMEDIATION (ASSET RETIREMENT OBLIGATIONS)
The Company’s mining and Impairmentexploration activities are subject to various federal and state laws and regulations governing the protection of Australian Magnesium Corporation:the environment. These laws and regulations are continually changing and are generally becoming more restrictive. The Company conducts its operations so as to protect the public health and environment and believes its operations are in compliance with applicable laws and regulations in all material respects. The Company has made, and expects to make in the future, expenditures to comply with such laws and regulations, but cannot predict the full amount of such future expenditures. Estimated future reclamation costs are based principally on legal and regulatory requirements.
At December 31, 2005 and 2004, $431 and $396, respectively, were accrued for reclamation obligations relating to currently or recently producing mineral properties. In addition, the Company is involved in several matters concerning environmental obligations associated with former, primarily historic, mining activities. Generally, these matters concern developing and implementing remediation plans at the various sites involved. At December 31, 2005 and 2004, $77 and $75, respectively, were accrued for such obligations. These amounts are also included inReclamation and remediation liabilities.
The following is a reconciliation of the total liability for reclamation and remediation:
| Years Ended December 31, | |||||||||||
| 2004 | 2003 | 2002 | |||||||||
| (in thousands) | |||||||||||
Australian Magnesium Corporation | $ | — | $ | (119,485 | ) | $ | (1,775 | ) | |||
Balance January 1, 2004 | $ | 409 | ||
Impact of Batu Hijau consolidation | 47 | |||
Additions, change in estimates and other | 35 | |||
Liabilities settled | (45 | ) | ||
Accretion expense | 25 | |||
Balance December 31, 2004 | 471 | |||
Additions, change in estimates and other | 65 | |||
Liabilities settled | (47 | ) | ||
Disposition of liability | (8 | ) | ||
Accretion expense | 27 | |||
Balance December 31, 2005 | $ | 508 | ||
The current portions ofReclamation and remediation liabilities of $63 and $53 at December 31, 2005 and 2004, respectively, are included inOther current liabilities.
The Company recorded $34, $13 and $19 of reclamation expense for 2005, 2004 and 2003, respectively, for properties associated with former mining activities.
Equity IncomeNOTE 14 STOCKHOLDERS’ EQUITY AND EARNINGS PER SHARE
Newmont Common Stock
In January 2004, Newmont filed a shelf registration statement on Form S-3 under which it can issue debt and equity securities from time-to-time having an aggregate offering price of Affiliates:up to $1,000. Newmont also filed a shelf registration statement on Form S-4 under which it can issue, from time-to-time in connection with future acquisitions of businesses, properties or assets, common stock and common stock warrants having an aggregate offering price up to $200. These registration statements were declared effective on February 4, 2004.
NEWMONT MINING CORPORATION
| Years Ended December 31, | ||||||||||
| 2004 | 2003 | 2002 | ||||||||
| (in thousands) | ||||||||||
Batu Hijau | $ | — | $ | 82,892 | $ | 42,119 | ||||
TVX Newmont Americas | — | 810 | 9,737 | |||||||
Echo Bay | — | — | (380 | ) | ||||||
European Gold Refineries | 1,224 | — | — | |||||||
AGR Matthey Joint Venture | 1,417 | 725 | 1,675 | |||||||
| $ | 2,641 | $ | 84,427 | $ | 53,151 | |||||
NOTES TO CONSOLIDATED FINANCIAL STATEMENTS—(Continued)
Marketable Equity Securities(dollars in millions, except per share, per ounce and per pound amounts)
During November 2003, Newmont completed an equity offering of 25 million shares of common stock under its existing shelf registration statement filed with the Securities and Exchange Commission. The net proceeds of approximately $986 from this offering were used for general corporate purposes.
During April and December 2003, Newmont issued approximately 4.4 million shares of common stock in connection with the Newmont NFM Scheme of Arrangement (see Note 22) and 0.8 million shares of common stock in connection with the acquisition of Moydow’s interest in the Ntotoroso property, respectively.
The Company paid common stock dividends of $0.40 per share during 2005, $0.30 per share during 2004 and $0.17 per share during 2003.
Treasury Shares
Treasury stock is acquired by the Company when certain restricted stock (see Note 11) vests. At vesting, a participant has a tax liability and, pursuant to the participant’s award agreement, may elect withholding of restricted stock in full or partial satisfaction of such tax obligation, but only to the extent that such restricted stock has become fully vested. The withheld stock is accounted for as treasury stock and carried at the par value of the related common stock.
Exchangeable Shares
In connection with the acquisition of Franco-Nevada in February 2002, certain holders of Franco-Nevada common stock received 0.8 of an exchangeable share of Newmont Mining Corporation of Canada Limited (formerly Franco-Nevada) for each share of common stock held. These exchangeable shares are convertible, at the option of the holder, into shares of Newmont common stock on a one-for-one basis, and entitle holders to dividends and other rights economically equivalent to holders of Newmont common stock. At December 31, 2005 and 2004, the value of these no-par shares was included inAdditional paid-in capital.
Warrants
Newmont Mining Corporation of Canada Limited (“NMCCL”) had 2.2 million Class A warrants outstanding that expired during September 2003. Each Class A warrant, plus CDN$200, was exchangeable for 3.2 shares of Newmont common stock. None of the Class A warrants were exercised before expiration. NMCCL also had 2.1 million Class B warrants with an expiration date in November 2003. Each Class B warrant, plus CDN$100 per warrant, was exchangeable for 2.464 shares of Newmont common stock. Of the total Class B warrants, 99.9% were exercised before expiration.
Earnings per Share
The difference between the basic weighted-average common shares outstanding and the diluted weighted-average common shares outstanding for 2005, 2004 and 2003 was due to the assumed conversion of employee stock options. Employee stock options with exercise prices greater than the average market price were excluded from the December 31, 2005, 2004 and 2003 diluted weighted-average common shares because the effect would have been anti-dilutive.
NEWMONT MINING CORPORATION
NOTES TO CONSOLIDATED FINANCIAL STATEMENTS—(Continued)
(dollars in millions, except per share, per ounce and per pound amounts)
NOTE 15 COMPREHENSIVE INCOME
| Years Ended December 31, | ||||||||||||
| 2005 | 2004 | 2003 | ||||||||||
Comprehensive income: | ||||||||||||
Net income | $ | 322 | $ | 443 | $ | 476 | ||||||
Other comprehensive income: | ||||||||||||
Unrealized gain (loss) on marketable equity securities, net of tax of $(61), $(32) and $2, respectively | 282 | 123 | (5 | ) | ||||||||
Foreign currency translation adjustments | 26 | 31 | 23 | |||||||||
Minimum pension liability adjustments, net of tax of $10 in 2005 and $6 in 2004 | (18 | ) | (11 | ) | — | |||||||
Changes in fair value of cash flow hedge instruments, net of tax of $30, $8 and $(27), respectively | (59 | ) | (19 | ) | 68 | |||||||
| 231 | 124 | 86 | ||||||||||
Comprehensive income | $ | 553 | $ | 567 | $ | 562 | ||||||
| At December 31, | ||||||||
| 2005 | 2004 | |||||||
Accumulated other comprehensive income: | ||||||||
Unrealized gain on marketable equity securities, net of tax of $(94) and $(32), respectively | $ | 406 | $ | 124 | ||||
Foreign currency translation adjustments | 57 | 31 | ||||||
Minimum pension liability adjustments, net of tax of $32 and $22, respectively | (59 | ) | (41 | ) | ||||
Changes in fair value of cash flow hedge instruments, net of tax of $18 and $(13), respectively | (26 | ) | 33 | |||||
Accumulated other comprehensive income | $ | 378 | $ | 147 | ||||
During 2005, 2004 and 2003, the Company reclassified approximately $2, $9 and $17 of gains related to the cash flow hedge instruments fromAccumulated other comprehensive income toRevenues to reflect maturities of such instruments.
NOTE 16 WRITE-DOWN OF LONG-LIVED ASSETS
Write-down of long-lived assets totaled $43, $39 and $35 for 2005, 2004 and 2003, respectively. The 2005 write-down primarily related to write-downs of an advanced exploration project in Indonesia and exploration tenements in Australia. The 2004 write-down included $16 related to the Ovacik mine in Turkey. The remainder of the write-down for 2004 was related to exploration tenements in Australia, long-lived asset impairment resulting from a reevaluation of future production and operating costs at Pajingo, and processing facilities at Yanacocha. The 2003 write-down was related to a $28 impairment charge at Golden Giant.
NEWMONT MINING CORPORATION
NOTES TO CONSOLIDATED FINANCIAL STATEMENTS—(Continued)
(dollars in millions, except per share, per ounce and per pound amounts)
NOTE 17 OTHER EXPENSE
| Years Ended December 31, | ||||||||||
| 2005 | 2004 | 2003 | ||||||||
Reclamation and remediation | $ | 37 | $ | (11 | ) | $ | 33 | |||
Minahasa environmental and Buyat Bay civil suit (Note 32) | 56 | 7 | — | |||||||
Nevada waste dump slide | 6 | — | — | |||||||
Other | 12 | 37 | 17 | |||||||
| $ | 111 | $ | 33 | $ | 50 | |||||
NOTE 18 OTHER INCOME, NET
| Years Ended December 31, | |||||||||||
| 2005 | 2004 | 2003 | |||||||||
Royalty and dividend income, net | $ | 79 | $ | 64 | $ | 56 | |||||
Interest income | 59 | 23 | 11 | ||||||||
Gain on sale of other assets, net | 48 | 28 | 15 | ||||||||
Gain (loss) on investments, net (Note 4) | 54 | (39 | ) | 83 | |||||||
Gain on derivative investments, net | 2 | 2 | 23 | ||||||||
Foreign currency exchange gains | 8 | 7 | 97 | ||||||||
Gain (loss) on QMC debt guarantee | 9 | 11 | (30 | ) | |||||||
Gain on extinguishment of NYOL liabilities, net | — | — | 221 | ||||||||
Loss on extinguishment of debt | — | — | (34 | ) | |||||||
Other | 10 | 6 | 9 | ||||||||
| $ | 269 | $ | 102 | $ | 451 | ||||||
Gain on Sale of Other Assets, Net
On March 31, 2005, the Mezcala gold deposit was sold for cash proceeds of $31 and the Company recorded a pre-tax gain of $31.
Foreign Currency Exchange Gains
As of December 31, 2003, the Company converted CDN$499 of the Canadian dollar-denominated intercompany loans to long-term notes, as the Company does not intend to settle these loans in the foreseeable future. As a result, the Company no longer records foreign currency gains and losses in earnings with respect to the converted long-term notes.
Gain on Extinguishment of NYOL liabilities, Net
During 2003, Newmont, through an indirect, wholly-owned subsidiary, Yandal Bond Company Limited (“YBCL”), made an offer to acquire all of NYOL’s outstanding 8 7/8% Senior Notes due 2008. Those Notes were subsequently extinguished in connection with the Voluntary Administration of NYOL. Certain of Normandy’s hedge positions were also eliminated with the Voluntary Administration of NYOL. These transactions gave rise to a gain of $114 to extinguish the NYOL bonds and $107 to extinguish the NYOL derivatives liability, net of transaction costs for the year ended December 31, 2003.
NEWMONT MINING CORPORATION
NOTES TO CONSOLIDATED FINANCIAL STATEMENTS—(Continued)
(dollars in millions, except per share, per ounce and per pound amounts)
NOTE 19 INCOME TAXES
The Company’sIncome tax expense consisted of:
| Years Ended December 31, | ||||||||||||
| 2005 | 2004 | 2003 | ||||||||||
Current: | ||||||||||||
United States | $ | (22 | ) | $ | (10 | ) | $ | (15 | ) | |||
Foreign | (303 | ) | (241 | ) | (228 | ) | ||||||
| (325 | ) | (251 | ) | (243 | ) | |||||||
Deferred: | ||||||||||||
United States | 9 | 61 | 49 | |||||||||
Foreign | 2 | (135 | ) | (18 | ) | |||||||
| 11 | (74 | ) | 31 | |||||||||
| $ | (314 | ) | $ | (325 | ) | $ | (212 | ) | ||||
The Company’sPre-tax income (loss) before minority interest, equity income and impairment of affiliates and cumulative effect of a change in accounting principleconsisted of:
| Years Ended December 31, | |||||||||
| 2005 | 2004 | 2003 | |||||||
United States | $ | (68 | ) | $ | 183 | $287 | |||
Foreign | 1,132 | 928 | 644 | ||||||
| $ | 1,064 | $ | 1,111 | $931 | |||||
NEWMONT MINING CORPORATION
NOTES TO CONSOLIDATED FINANCIAL STATEMENTS—(Continued)
(dollars in millions, except per share, per ounce and per pound amounts)
The Company’s income tax expense differed from the amounts computed by applying the United States statutory corporate income tax rate for the following reasons:
Years Ended December 31, | ||||||||||||
| 2005 | 2004 | 2003 | ||||||||||
Pre-tax income before minority interest, equity income and impairment of affiliates and cumulative effect of change in accounting principle | $ | 1,064 | $ | 1,111 | $ | 931 | ||||||
United States statutory corporate income tax rate | 35 | % | 35 | % | 35 | % | ||||||
Income tax expense computed at United States statutory corporate income tax rate | (372 | ) | (389 | ) | (326 | ) | ||||||
Reconciling items: | ||||||||||||
Percentage depletion and Canadian Resource Allowance | 47 | 47 | 21 | |||||||||
Change in valuation allowance on deferred tax assets | (22 | ) | 58 | 85 | ||||||||
Effect of foreign earnings, net of allowable credits | (10 | ) | (11 | ) | 28 | |||||||
U.S. tax effect of minority interest attributable to non-U.S. investees | 15 | 7 | 22 | |||||||||
Rate differential for foreign earnings indefinitely reinvested | (8 | ) | (61 | ) | 11 | |||||||
Resolution of tax issues associated with prior years | 12 | — | — | |||||||||
Foreign currency translation of monetary assets | 14 | 13 | (54 | ) | ||||||||
Tax effect of changes in tax laws | 24 | 51 | 36 | |||||||||
Tax effect of impairment of goodwill | (14 | ) | (17 | ) | — | |||||||
Non-U.S. tax effect attributable to the extinguishment of debt | — | — | (36 | ) | ||||||||
Non-U.S. tax effect attributable to capital gains | — | (9 | ) | — | ||||||||
Other | — | (14 | ) | 1 | ||||||||
Income tax expense | $ | (314 | ) | $ | (325 | ) | $ | (212 | ) | |||
NEWMONT MINING CORPORATION
NOTES TO CONSOLIDATED FINANCIAL STATEMENTS—(Continued)
(dollars in millions, except per share, per ounce and per pound amounts)
Components of the Company’s deferred income tax assets (liabilities) are as follows:
Years Ended December 31, | ||||
2005 | 2004 | |||
Deferred income tax assets: | ||||
Exploration costs | $55 | $49 | ||
Depreciation | 69 | — | ||
Net operating losses and tax credits | 720 | 621 | ||
Retiree benefit and vacation accrual costs | 101 | 89 | ||
Remediation and reclamation costs | 101 | 111 | ||
Derivative instruments | 26 | — | ||
Unrealized losses on investments | — | 54 | ||
Other | 116 | 71 | ||
| 1,188 | 995 | |||
Valuation allowances | (523) | (376) | ||
| 665 | 619 | |||
Deferred income tax liabilities: | ||||
Net undistributed earnings of subsidiaries | (49) | (91) | ||
Unrealized gain on investments | (77) | — | ||
Depletable and amortizable costs associated with mineral rights | (310) | (160) | ||
Depreciation | — | (4) | ||
Derivative instruments | — | (13) | ||
Capitalized mining costs | — | (125) | ||
Foreign currency exchange | (23) | (41) | ||
Capitalized interest | — | (6) | ||
| (459) | (440) | |||
Net deferred income tax assets | $206 | $179 | ||
Net deferred income tax assets consist of:
| Years Ended December 31, | ||||||||
| 2005 | 2004 | |||||||
Current deferred income tax assets | $ | 159 | $ | 173 | ||||
Long-term deferred income tax assets | 519 | 492 | ||||||
Current deferred income tax liabilities | (5 | ) | (10 | ) | ||||
Long-term deferred income tax liabilities | (467 | ) | (476 | ) | ||||
| $ | 206 | $ | 179 | |||||
NEWMONT MINING CORPORATION
NOTES TO CONSOLIDATED FINANCIAL STATEMENTS—(Continued)
(dollars in millions, except per share, per ounce and per pound amounts)
These balances include net deferred income tax assets that have been reclassified toAssets andLiabilities of operations held for sale of:
Years Ended December 31, | ||||||||
| 2005 | 2004 | |||||||
Current deferred income tax assets | $ | — | $ | — | ||||
Long-term deferred income tax assets | 2 | (2 | ) | |||||
Current deferred income tax liabilities | — | — | ||||||
Long-term deferred income tax liabilities | (18 | ) | (16 | ) | ||||
| $ | (16 | ) | $ | (18 | ) | |||
Newmont intends to indefinitely reinvest earnings from certain foreign operations. Accordingly, U.S. and non-U.S. income and withholding taxes for which deferred taxes might otherwise be required, have not been provided on a cumulative amount of temporary differences (including, for this purpose, any difference between the tax basis in the stock of a consolidated subsidiary and the amount of the subsidiary’s net equity determined for financial reporting purposes) related to investments in foreign subsidiaries of approximately $1,013 and $819 at December 31, 2005 and 2004, respectively. The additional U.S. and non-U.S. income and withholding tax that would arise on the reversal of the temporary differences could be offset in part, by tax credits. Because the determination of the amount of available tax credits and the limitations imposed on the annual utilization of such credits are subject to a highly complex series of calculations and expense allocations, it is impractical to estimate the amount of net income and withholding tax that might be payable if a reversal of temporary differences occurred.
On October 22, 2004, the President signed the American Jobs Creation Act of 2004 (“the Act”). The Act creates a temporary incentive for U.S. corporations to repatriate accumulated income earned abroad by providing an 85 percent dividends received deduction for certain dividends from controlled foreign corporations. The deduction is subject to a number of limitations. During September 2005, the Company completed its assessment of the repatriation provision and did not repatriate any funds under the above provisions of the Act.
As of December 31, 2005 and December 31, 2004, the Company purchased marketable equity securitieshad (i) $949 and $915 of Canadian Oil Sands Trustnet operating loss carryforwards, respectively; and Gabriel Resources, Ltd.(ii) $155 and $156 of tax credit carryforwards, respectively. Of the amounts of net operating loss carryforwards, $74 and $101, respectively, are attributable to acquired mining operations conducted in the United States and will begin expiring in 2013 if not utilized before then. As of December 31, 2005 and 2004, $618 and 608, respectively, of net operating loss carryforwards are attributable to acquired mining operations in Australia for approximately $199.6 millionwhich current tax law provides no expiration period. The remaining net operating losses available are attributable to acquired entities and $19.2 million, respectively. have various temporal and other limitations that may restrict the ultimate realization of the tax benefits of such tax attributes.
Tax credit carryforwards for 2005 and 2004 of $147 and $121 consist of foreign tax credits available in the United States; substantially all such credits not utilized will expire at the end of 2011. Other credit carryforwards at the end of 2005 and 2004 in the amounts of $8 and $35, respectively, represent alternative minimum tax credits attributable to the Company’s U.S. operations for which the current tax law provides no period of expiration.
The Company accountsincreased the valuation allowance related to deferred tax assets by $147 during 2005. The increase resulted primarily from the recording of additional capital losses in Australia now available to the
NEWMONT MINING CORPORATION
NOTES TO CONSOLIDATED FINANCIAL STATEMENTS—(Continued)
(dollars in millions, except per share, per ounce and per pound amounts)
Company as a result of Australia’s new consolidations regulations. The Company has placed a full valuation allowance on these capital losses because of a lack of sufficient positive evidence to support the future realization of these deferred tax assets. The remaining increase in valuation allowance is primarily attributable to foreign tax credits and tax losses at the Company’s non-U.S. subsidiaries. These allowances are required due to the uncertainty of utilizing the foreign tax credits during the prescribed carryforward period as a result of certain limitations under U.S. tax law and the lack of sufficient positive evidence concerning the ability of the non-U.S. subsidiaries to generate sufficient taxable income to realize the tax loss carryforwards. Of the total $523 and $376 valuation allowance recorded as of December 31, 2005 and 2004, $89 in 2005 and $92 in 2004 are attributable to deferred tax assets for which any subsequently recognized tax benefits will be allocated to reduce goodwill related to the acquisition of Normandy.
The breakdown of the Company’s net deferred tax assets between the United States and foreign taxing jurisdictions is as follows:
| Years Ended December 31, | ||||||||
| 2005 | 2004 | |||||||
United States | $ | 479 | $ | 454 | ||||
Foreign | (273 | ) | (275 | ) | ||||
| $ | 206 | $ | 179 | |||||
NOTE 20 EQUITY INCOME (LOSS) OF AFFILIATES
| Years Ended December 31, | |||||||||||
| 2005 | 2004 | 2003 | |||||||||
European Gold Refineries | $ | 6 | $ | 1 | $ | — | |||||
AGR Matthey Joint Venture | (2 | ) | 1 | 1 | |||||||
Batu Hijau | — | — | 83 | ||||||||
Australian Magnesium Corporation | — | — | (119 | ) | |||||||
| $ | 4 | $ | 2 | $ | (35 | ) | |||||
European Gold Refineries
During December 2003, Newmont acquired a 50% interest in a joint venture, European Gold Refineries SA (“EGR”), with unrelated Swiss residents holding the remaining 50%. Simultaneously, EGR purchased 100% of Valcambi SA (“Valcambi”), a gold refining business, and 66.65% of Finorafa SA (“Finorafa”), a gold distribution business. Newmont has no guarantees related to this investment.
Valcambi is a London Gold Delivery precious metals refiner and manufacturer of semi-finished products for the investmentsSwiss luxury watch industry, and Finorafa is the second largest distributor and financier of gold products in the Italian market.
AGR Matthey Joint Venture
Newmont holds a 40% interest in a joint venture known as available-for-sale.AGR Matthey Joint Venture (“AGR”), with Johnson Matthey (Australia) Ltd. and the West Australian Mint holding the remaining interests. Newmont has no
NEWMONT MINING CORPORATION
NOTES TO CONSOLIDATED FINANCIAL STATEMENTS—(Continued)
(dollars in millions, except per share, per ounce and per pound amounts)
guarantees related to this investment. Newmont received dividends of $nil, $2 and $2 during 2005, 2004 and 2003, respectively, from its interests in AGR. See also Note 24 for details of related party transactions between Newmont and AGR.
Batu HijauAGR Matthey Joint Venture
Effective January 1, 2004, Newmont consolidated Batu Hijau (see Note 3). Forholds a 40% interest in a joint venture known as AGR Matthey Joint Venture (“AGR”), with Johnson Matthey (Australia) Ltd. and the years ended December 31, 2003 and 2002,West Australian Mint holding the Company accounted for its investment in Batu Hijau using the equity method of accounting.
Equity income in Batu Hijau was $82.9 million for the year ended December 31, 2003 (based on 56.25% of Batu Hijau’s net income equal to $56.7 million, plus $6.8 million for the elimination of intercompany interest,remaining interests. Newmont has no
NEWMONT MINING CORPORATION
NOTES TO CONSOLIDATED FINANCIAL STATEMENTS—(Continued)
$9.7 million of intercompany management fees, the cumulative effect of $8.0 million related to the adoption of SFAS No. 143,(dollars in millions, except per share, per ounce and other adjustments of $1.7 million). The equity income in Batu Hijau was $42.1 million in 2002 (based on 56.25% of Batu Hijau’s net income equal to $19.3 million plus $8.5 million for the elimination of intercompany interest, $10.5 million for intercompany management fees, and $3.8 million for other items).
Following is summarized financial information for NTP based on accounting principles generally accepted in the United States of America. The results of operations and assets and liabilities of NTP are not reflected in the Company’s Consolidated Financial Statements. As described above, the Company accounted for NTP as an equity investment during 2003 and 2002.
| Years Ended December 31, | ||||||
| 2003 | 2002 | |||||
| (in thousands) | ||||||
Copper revenues, net of smelting and refining costs | $ | 424,673 | $ | 359,686 | ||
Gold revenues, net of smelting and refining costs | $ | 206,450 | $ | 149,845 | ||
Gross profit(1) | $ | 230,192 | $ | 117,343 | ||
Income before cumulative effect of a change in accounting principle | $ | 115,012 | $ | 35,477 | ||
Net income | $ | 100,794 | $ | 35,477 | ||
| At December 31, 2003 | |||
| (in thousands) | |||
Current assets | $ | 324,958 | |
Property, plant and mine development, net | $ | 1,761,473 | |
Other assets | $ | 372,070 | |
Debt and related interest to partners and affiliates | $ | 258,182 | |
Other current liabilities | $ | 206,132 | |
Debt—third parties (including current portion) | $ | 739,812 | |
Other liabilities | $ | 176,649 | |
TVX Newmont Americas and Echo Bay Mines Ltd.per pound amounts)
On January 31, 2003, Kinross, Echo Bay and TVX Gold were combined. Under the terms of the combination and acquisition, Newmont received a 13.8% interest in the restructured Kinross in exchange for its then 45.67% interest in Echo Bay and received cash proceeds of $180 million for its interest in TVX Newmont Americas. Newmont recorded a pre-tax gain on the transactions of $84.3 million (see Note 4).
Australian Magnesium Corporation
At December 31, 2002, Newmont’s interest in Australian Magnesium Corporation (“AMC”) was composed of a 22.8% equity and voting interest and a loan receivable in the amount of A$38 million (approximately $20.1 million) including interest.
During the year ended December 31, 2003, the Company recorded losses of $119.5 million related to its investment in AMC composed of the following: (i) 2003 losses of $0.07 million representing Newmont’s proportionate share of AMC’s 2003 losses; (ii) second quarter of 2003 losses resulting from a restructuring agreement of (a) $72.7 million representing the book value of its investment at June 30, 2003; (b) $24.8 million for a loan receivable from AMC; (c) $10 million charge to settle Newmont’s guarantee of the obligation payable
NEWMONT MINING CORPORATION
NOTES TO CONSOLIDATED FINANCIAL STATEMENTS—(Continued)
by AMC to Ford Motor Credit; (d) $6.6 million related to a contingent credit facility; and (e) $1.1 million related to various other items, offset by a $7.4 million income tax benefit; and (iii) a first quarter of 2003 loss for an other-than-temporary decline in value of the investment of approximately $11.0 million.
During the fourth quarter of 2003, Newmont sold its entire interest in AMC for a nominal amount to Deutsche Bank AG (“Deutsche Bank”) and to Magtrust Pty Ltd (“Magtrust”), a company owned and controlled by the directors of AMC. As a result of these transactions, Deutsche Bank and Magtrust acquired interests in AMC of approximately 6.8% and 19.9%, respectively. As part of the sales agreement, Deutsche Bank agreed to pay Newmont 90% of the sales proceeds received from any sale of the AMC shares. During the year ended December 31, 2004, Deutsche Bank sold all the shares of AMC subject to the sales agreement, which resulted in A$2.8 million (approximately $2.0 million) in proceeds payable to Newmont, which was recorded in Gain on investments, net. See Note 20 for discussion regarding the release of Newmont from its guarantee obligation.
European Gold Refineries
During December 2003, Newmont acquired a 50% interest in a joint venture, European Gold Refineries SA (“EGR”), with unrelated Swiss residents holding the remaining 50%. Simultaneously, EGR purchased 100% of Valcambi SA (“Valcambi”), a gold refining business, and 66.65% of Finorafa SA (“Finorafa”), a gold distribution business.
Valcambi is a London Gold Delivery precious metals refiner and manufacturer of semi-finished products for the Swiss luxury watch industry, and Finorafa is the second largest distributor and financier of gold products in the Italian market.
The formation of EGR resulted in joint management by Newmont and the Swiss residents and required approximately CHF30.0 million ($23.8 million) in funding, which was contributed pro-rata by each partner in equal portions of debt and equity, of which Newmont’s share was CHF15.0 million ($11.9 million). Newmont accounts for its investment in EGR using the equity method of accounting. Newmont has no guarantees related to this investment. Newmont received dividends of $nil, $2 and $2 during 2005, 2004 and 2003, respectively, from its interests in AGR. See also Note 24 for details of related party transactions between Newmont and AGR.
AGR Matthey Joint VenturePTNNT Project Financing Facility
On May 9, 2002, P.T. Newmont Nusa Tenggara (“PTNNT”) completed a restructuring of its project financing facility, with a syndicate of banks. The scheduled repayments of this debt are semi-annual installments of $43 through November 2010 and $22 from May 2011 through November 2013. Amounts outstanding under the project financing were $566 and $653 at December 31, 2005 and 2004.
PriorThe project financing facility is non-recourse to Newmont and substantially all of Batu Hijau’s assets are pledged as collateral. The carrying value of the property, plant and mine development was $1,449 and $1,519 at December 31, 2005 and 2004, respectively. Under the terms of the project financing facility, PTNNT maintains an escrow account for the next interest and principal installment due. Such amount totaled $62 and $58 at December 31, 2005 and 2004, respectively, and was included inOther long-term assets. The facility contains certain covenants that limit indebtedness and restricted payments to partners, among others. In addition, PTNNT must maintain certain financial ratios. At December 31, 2005, PTNNT was in compliance with these covenants.
The interest rate is based on blended fixed and floating rates and at market rates on December 31, 2005, the weighted average interest rate approximated the London InterBank Offering Rate (“LIBOR”) plus 2.1%. The weighted average interest rates were 5.7%, 5.1% and 4.7% during 2005, 2004 and 2003, respectively, and the interest rates were 6.5% and 5.2% at December 31, 2005 and 2004, respectively. The fair market value cannot be practicably determined due to the fourth quarter 2002, Newmont heldlack of available market information for this type of debt.
Yanacocha
$100 Credit Facility. In December 1999, Yanacocha entered into a 50% interest in Australian Gold Refineries (“Old AGR”), a joint venture$100 credit facility (a $20 A Tranche and an $80 B Tranche) with the West Australian Mint. In October 2002, NewmontInternational Finance Corporation (“IFC”). At December 31, 2004, $30 was outstanding in total with $10 outstanding under the A Tranche and $20 outstanding under the West Australian Mint combined their respective interests in Old AGR with Johnson Matthey (Australia) Ltd. to create a new joint venture known as AGR Matthey Joint Venture (“AGR”), in which Newmont now holds a 40% interest. Newmont has no guarantees related to this investment. Newmont received dividends of $1.7 million, $2.1 million and $0.9 million during 2004, 2003 and 2002, respectively, from its interests in AGR and Old AGR. See also Note 22 for details of transactions between Newmont and AGR.
Turquoise Ridge
In December 2003, Newmont formed a joint venture with a subsidiary of Placer Dome Inc. (“Placer Dome”) under which Newmont acquired a 25% interest in the Turquoise Ridge and Getchell mines, in return for providing up to 2,000 tons per day of milling capacity at Newmont’s Twin Creeks facility in Nevada and the extinguishment of the 2% Net Smelter Return royalty payable by Placer Dome as it relates to the joint venture’s property. Placer Dome operates the joint venture.B Tranche. The carrying amount of the extinguished royalty was approximately $8.2 million at the date of closing.A
NEWMONT MINING CORPORATION
NOTES TO CONSOLIDATED FINANCIAL STATEMENTS—(Continued)
Newmont NFM Limited Scheme of Arrangement(dollars in millions, except per share, per ounce and per pound amounts)
On April 2, 2003,Tranche had a five-year revolving availability period and converted into a five-year term loan in December 2004. The B Tranche had a three-year revolving availability period that converted to a four-year term loan in December 2002. Initial drawdowns under the shareholders of Normandy NFM Limited (an Australian corporation trading at that time as “Newmont NFM” on the Australian Stock Exchange or “ASX”) voted to approve a proposed scheme of arrangement under which Newmont NFM would become an indirect, wholly-owned subsidiary of Newmont Mining Corporation, through the acquisitionloan were used for development of the remaining minority interest of Newmont NFM. UnderLa Quinua project; however, the termsloan accommodated repayments during the revolving availability period and subsequent borrowings were used for other purposes. Interest applicable to the A Tranche was based on LIBOR plus 2.375%. Interest applicable to the B Tranche was based on LIBOR plus 2.5%. Certain Yanacocha assets collaterized the loans. In December 2005, Yanacocha prepaid both Tranches of the scheme, Newmont NFM shareholders could electloan.
$50 Credit Facility. In June 2004, Yanacocha amended its $40 line of credit with Banco de Credito del Peru to receive 4.40 ASX listed Newmont Mining Corporation CHESS Depositary Interests (“CDIs”), with each CDI equivalent to 0.1 Newmont Mining Corporation share of common stock. As an alternative to receiving Newmont Mining Corporation CDIs, shareholders could sell their Newmont NFM shares back to Newmont NFM under a concurrent buy-back offer of A$16.50 per Newmont NFM share. On April 29, 2003, Newmont Mining Corporation issued 4,437,506 shares of common stock to the CHESS Depository Nominees Pty Ltd, and in turn, 44,375,060 CDIs were issued to former Newmont NFM shareholders. The market value of the newly issued Newmont Mining Corporation shares was approximately $105 million. The market value of the issued equity securities, together with the cash consideration paid to those shareholders who elected to accept the buy-back offer of approximately $10 million (including transaction costs), resulted in a total purchase price of approximately $115 million. The transaction was accounted for as a purchase of minority interest in accordance with SFAS No. 141 in the second quarter of 2003 and gave rise to goodwill of $93.3 million.
Normandy and Franco-Nevada
On February 16, 2002, pursuant to a Canadian Plan of Arrangement, Newmont acquired 100% of Franco-Nevada Mining Corporation Limited (“Franco-Nevada”) in a stock-for-stock transaction in which Franco-Nevada common stockholders received 0.8 of a share of Newmont common stock, or 0.8 of a Canadian exchangeable share (exchangeable for Newmont common shares), for each common share of Franco-Nevada. The exchangeable shares are substantially equivalent to Newmont common shares. On February 20, 2002, Newmont obtained control of Normandy Mining Limited (“Normandy”) through a tender offer for all of the ordinary shares of Normandy. For accounting purposes, the effective date of the Normandy acquisition was the close of business on February 15, 2002, when Newmont received an irrevocable tender from shareholders for more than 50% of the outstanding shares of Normandy. Accordingly, the results of operations of Normandy and Franco-Nevada have been included in the accompanying Consolidated Financial Statements from February 16, 2002 forward. On February 26, 2002, when the tender offer for Normandy expired, Newmont controlled more than 96% of Normandy’s outstanding shares. Newmont exercised its rights to acquire the remaining shares of Normandy in April 2002. Consideration paid for Normandy included 3.85 shares of Newmont common stock for every 100 ordinary shares of Normandy (including ordinary shares represented by American depository receipts) plus A$0.50 per Normandy share, or the U.S. dollar equivalent of that amount for Normandy stockholders outside Australia. Following the acquisitions, Normandy was renamed Newmont Australia Limited and Franco-Nevada was renamed Newmont Mining Corporation of Canada Limited.
The purchase price for these acquisitions totaled $4.3 billion, comprised of 197.0 million Newmont shares (or share equivalents), $461.7 million in cash and approximately $90.3 million of direct costs. The acquisitions were accounted for using the purchase method of accounting whereby identifiable assets acquired and liabilities assumed were recorded at their fair market values as of the date of acquisition. The excess of the purchase price over such fair value was recorded as goodwill and, in accordance with SFAS No. 142, was assigned to specific reporting units. The acquisitions resulted in approximately $3.0 billion of goodwill, primarily related to the merchant banking business, exploration programs and expertise, and expected synergies.
NEWMONT MINING CORPORATION
NOTES TO CONSOLIDATED FINANCIAL STATEMENTS—(Continued)
The carrying amount of goodwill by reporting unit as of December 31, 2004 and 2003 and changes in the carrying amount of goodwill are summarized in the following table (in millions):
| Nevada | Australia/ New Zealand | Exploration | Merchant Banking | Consolidated | ||||||||||||||
Balance at January 1, 2003 | $ | 40.9 | $ | 229.2 | $ | 1,129.5 | $ | 1,625.0 | $ | 3,024.6 | ||||||||
Purchase price allocation for Newmont NFM Scheme of Arrangement | — | 93.3 | — | — | 93.3 | |||||||||||||
Reversal of valuation allowances for acquired deferred tax assets | — | (43.8 | ) | — | — | (43.8 | ) | |||||||||||
Change in estimate of pre-acquisition tax contingency and other … | — | — | — | (31.5 | ) | (35.1 | ) | |||||||||||
Balance at December 31, 2003 | 40.9 | 278.7 | 1,129.5 | 1,593.5 | 3,042.6 | |||||||||||||
Change in estimate of pre-acquisition tax contingency … | — | (4.8 | ) | — | 39.9 | 35.1 | ||||||||||||
Pajingo impairment charge | — | (51.8 | ) | — | — | (51.8 | ) | |||||||||||
Balance at December 31, 2004 | $ | 40.9 | $ | 222.1 | $ | 1,129.5 | $ | 1,633.4 | $ | 3,025.9 | ||||||||
During the year ended December 31, 2004, annual testing for impairment pursuant to SFAS No. 142 (comparison of implied goodwill value to carrying value) resulted in a charge against goodwill for the Pajingo operation (Australia/New Zealand segment) of $51.8 million. The impairment resulted from a reevaluation of future production and operating costs that indicated lower grade material and higher future operating costs. The Company also adjusted valuation allowances, originally recorded as part of the purchase price allocation for the acquisitions of Normandy and Franco-Nevada, for deferred tax assets related to capital loss carry-forwards in the Australia/New Zealand Segment for the Tanami operation and in the Merchant Banking Segment.
During the year ended December 31, 2003, the Company allocated $45.8 million and $47.5 million of goodwill arising from the Newmont NFM Scheme of Arrangement to the Tanami and Martha operations in the Australia/New Zealand Segment, respectively, based on synergies that were expected to be realized at each mine site reporting unit. The Company also reversed valuation allowances for deferred tax assets related to capital loss carry-forwards in Australia due to capital gains generated by the sale of its interest in TVX Newmont Americas, the loss of tax attributes from the extinguishment of NYOL bonds (Note 11), and tax benefits arising from the completion of the Newmont NFM Scheme of Arrangement. The valuation allowances were originally recorded as part of the purchase price allocation for the acquisitions of Normandy and Franco-Nevada and were therefore reversed against goodwill. In addition, during the year ended December 31, 2003, the Company revised its estimate for probable loss relating to a pre-acquisition tax contingency accrual that was originally recorded as part of the purchase price allocation for the acquisition of Normandy and Franco-Nevada.
NEWMONT MINING CORPORATION
NOTES TO CONSOLIDATED FINANCIAL STATEMENTS—(Continued)
NOTE 11 DEBT
| At December 31, | |||||||||||||||
| 2004 | 2003 | ||||||||||||||
| Current | Non-Current | Current | Non-Current | ||||||||||||
| (in thousands) | |||||||||||||||
Sale-leaseback of refractory ore treatment plant | $ | 12,677 | $ | 274,080 | $ | 11,665 | $ | 285,314 | |||||||
8 3/8% debentures, net of discount | 50,371 | — | — | 52,882 | |||||||||||
8 5/8% debentures, net of discount | — | 223,767 | — | 228,141 | |||||||||||
Newmont Australia 7 5/8% guaranteed notes, net of premium | — | 120,492 | — | 120,881 | |||||||||||
Newmont Australia 7 1/2% guaranteed notes, net of premium | 19,577 | — | — | 19,708 | |||||||||||
Medium-term notes | — | — | 17,000 | — | |||||||||||
Newmont Australia infrastructure bonds | — | — | 130,228 | — | |||||||||||
Prepaid forward sales obligation | 48,333 | 96,667 | — | 145,000 | |||||||||||
Interest rate swaps | (336 | ) | (4,708 | ) | — | (7,717 | ) | ||||||||
PTNNT project financing facility | 86,729 | 566,353 | — | — | |||||||||||
PTNNT partner loan | 52,795 | — | — | — | |||||||||||
Project financings, capital leases and other | 15,331 | 34,608 | 31,973 | 42,424 | |||||||||||
| $ | 285,477 | $ | 1,311,260 | $ | 190,866 | $ | 886,633 | ||||||||
Scheduled minimum debt repayments are $285.5 million in 2005, $169.5 million in 2006, $162.4 million in 2007, $236.5 million in 2008, $122.4 million in 2009, and $620.4 million thereafter.
Sale-Leaseback of the Refractory Ore Treatment Plant
In September 1994, the Company entered into a sale and leaseback agreement for its refractory ore treatment plant located in Carlin, Nevada. The transaction was accounted for as debt and the cost of the refractory ore treatment plant was recorded as a depreciable asset. The lease term is 21 years and aggregate future minimum lease payments, which include interest, were $400.6 million and $430.3 million at December 31, 2004 and 2003, respectively. Future minimum lease payments are $29.7 million in 2005, $35.5 million in 2006, $36.3 million in the years 2007 through 2009 and $226.1 million thereafter. The lease includes purchase options during and at the end of the lease at predetermined prices. The interest rate on this sale-leaseback transaction is 6.36%. In connection with this transaction, the Company entered into certain interest rate hedging contracts that were settled for a gain of $11.0 million, which is recognized as a reduction of interest expense overextend the term of the lease. Including this gain,facility to June 2007, reduce the effectiveapplicable interest rate onand increase the borrowing is 6.15%. The related asset is specialized, therefore it is not practicablefacility to estimate the fair value of this debt.
8 3/8% Debentures
Uncollateralized debentures bearing an annual interest rate of 8.375% Senior Debentures due 2005 in an aggregate principal amount of $200 million were outstanding at January 1, 2003. During the first quarter of 2003, the Company repurchased $23.0 million of these debentures resulting in aLoss on extinguishment of debtof $2.6 million. Subsequently on October 10, 2003, Newmont announced that its wholly-owned subsidiary, Newmont USA Limited, had initiated a tender offer for any and all of its 8 3/8% Debentures totaling $177.0 million of principal. The offer expired on November 7, 2003. The purchase price for each $1,000 principal amount of the Senior Debentures was $1,103.8, plus accrued but unpaid interest up to, but not
NEWMONT MINING CORPORATION
NOTES TO CONSOLIDATED FINANCIAL STATEMENTS—(Continued)
including, the settlement date. Holders who validly tendered (and did not withdraw) their Senior Debentures on October 24, 2003 received an early tender fee of $10.00 per $1,000 principal amount payable upon consummation of the offer included in the purchase price. Holders who validly tendered after the October 24, 2003 deadline but before the expiration date received the purchase price, but not the $10.00 early tender fee, upon consummation of the offer. As of the expiration date, approximately $125.0 million of the $177.0 million of principal had been tendered resulting in aLoss on extinguishment of debtof $8.6 million. At December 31, 2003, $148.0 million of total principal had been repurchased. The calculation of the Loss on extinguishment of debtincluded the proportional write-off of capitalized debt issue costs, discounts and the mark-to-market of the underlying debt resulting from fair value hedge accounting (seeInterest Rate Swaps below). Interest on the remaining outstanding balance is payable semi-annually in January and July. The costs related to the issuance of the debentures were capitalized and the remaining portion is amortized to interest expense over the term of the debentures.$50. The interest rate swap discussed below is consideredLIBOR plus 0.65% through June 2005 and LIBOR plus 2% thereafter. The interest rate under the previous agreement was LIBOR plus 0.75% through June 2004. There was no outstanding balance at December 31, 2005 and 2004. During 2004, Yanacocha borrowed $36 and repaid $36 of the total line of credit. During 2005, no amounts were borrowed under this revolving line of credit.
$20 Credit Facility. In June 2005, the $20 credit facility with BBVA Banco Continental expired and was not renewed. There was no outstanding balance at December 31, 2005 and 2004. No amounts were borrowed under this revolving line of credit during either year.
Proposed Financing. On December 19, 2005, Yanacocha filed with the Peruvian securities regulatory authority (CONASEV), for its review and approval, a fair value hedge applicableprospectus to register a $200 bond program in the Peruvian public market. When approved, the registration would make the bond program available for Yanacocha to make up to $200 in issuances over a two-year period. Yanacocha also intends to obtain funds from other sources, including commercial banks. Any funds generated from the bond program or other debt facilities may be used by Yanacocha for capital expenditures and its general corporate purposes.
Zarafshan—Newmont
In December 2000, Zarafshan-Newmont entered into a $30 loan with the European Bank for Reconstruction and Development (“EBRD”), of which $15 was Newmont’s share, primarily for capital expansion. Newmont’s portion of the outstanding amount on this debtloan was $11 and $11 at December 31, 2005 and 2004, respectively. The interest rate is therefore marked-to-market.based on the three-month LIBOR plus 3.25%. The interest rate was 7.4% and 5.3% at December 31, 2005 and 2004 and the weighted-average interest rate was 6.2% and 4.6% for 2005 and 2004, respectively. Using prevailing interest rates on similar instruments, the estimated fair value of these debentures was approximately $51.8 million and $56.6 millionthis debt approximated the carrying value at December 31, 2005 and 2004. In July 2004, Zarafshan-Newmont entered into a supplemental agreement with the EBRD that provided for the loan facility to be repaid in 13 semi-annual payments, beginning July 2004 and 2003, respectively. ending July 2010. In addition, the minimum balance of the escrow account requirement was increased to $4 to ensure the timely payments of principal and interest.
The foregoing fair value estimate was prepared by an independent third partyassets of Zarafshan-Newmont (with carrying values of approximately $222 and may$206 at December 31, 2005 and 2004, respectively), collateralize the loan. In addition, the Company has guaranteed 50% of the loan and the Uzbek partners have guaranteed the other 50%. Under the terms of the EBRD facility, certain payments, including payment of any distribution of capital or maydisbursement of funds not reflectdirectly related to expenses of the actual trading valueproject, are not permitted unless certain conditions and financial ratios are met.
Corporate Revolving Credit Facilities
Effective July 30, 2004, the Company entered into a new uncollateralized $1,250 revolving credit facility with a syndicate of this instrument.commercial banks. This revolving credit facility replaced the three existing revolving credit
NEWMONT MINING CORPORATION
NOTES TO CONSOLIDATED FINANCIAL STATEMENTS—(Continued)
(dollars in millions, except per share, per ounce and per pound amounts)
facilities which were cancelled upon the effectiveness of the new facility. The facility provides for borrowings in U.S. dollars and contains a letter of credit sub-facility. In July 2005, the Company amended its revolving credit facility, extending the final maturity one year, to July 28, 2010. In addition, certain adjustments to pricing and structure were also made. Interest rates and facility fees vary based on the credit ratings of the Company’s senior, uncollateralized, long-term debt. Borrowings under the facilities bear interest at a rate per annum equal to either LIBOR plus a margin ranging from 0.22% to 1.00% or the greater of the federal funds rate plus 0.5% or the lead bank’s prime. Facility fees accrue at a rate per annum ranging from 0.080% to 0.250% of the aggregate commitments. The Company also pays a utilization fee of 0.10% on the amount of revolving credit loans and letters of credit outstanding under the facility for each day on which the sum of such loans and letters of credit exceed 50% of the commitments under the facility. At December 31, 2005, the facility fees were 0.09% of the commitment. There was $275 outstanding under the letter of credit sub-facility as of December 31, 2005.
8Debt Covenants
Certain of Newmont’s current debt facilities contain various common public debt covenants and default provisions including payment defaults, limitation on liens, limitation on sales and leaseback agreements and merger restrictions. These debt instruments include the 5 57/8% Debentures
In May 2001, Newmont issued uncollateralized debentures with a principal amount of $275.0 million due May 2011 bearing an annual interest rate of 8.625%. During the first quarter of 2003, the Company repurchased $52.3 million of these debentures resulting in aLoss on extinguishment of debtof $11.6 million. The calculation of the Loss on extinguishment of debtincluded the proportional write-off of capitalized debt issue costs, discounts and the mark-to-market of the underlying debt resulting from fair value hedge accounting (seeInterest Rate Swaps below). Interest on the remaining outstanding balance is payable semi-annually in May and November and the debentures are redeemable prior to maturity under certain conditions. The costs related to the issuance of the debentures were capitalized and the remaining balance is amortized to interest expense over the term of the debentures. The interest rate swap discussed below is considered a fair value hedge applicable to this debt and is therefore marked-to-market. Using prevailing interest rates on similar instruments, the estimated fair value of these debentures was $271.5 million and $275.7 million at December 31, 2004, and 2003, respectively. The foregoing fair value estimate was prepared by an independent third party and may or may not reflect the actual trading value of this instrument.
notes, Newmont Australia 7 5/8% Notes
In July 1998, Normandy Finance Limited (“NFL”) a subsidiary of Normandy Australia Limited, now Newmont Australia Limited (“NAL”) issued $150.0 million of ten year 7 5/8% notes, guaranteed by NAL. In conjunction with the Normandy acquisition, NFL and NAL were acquired by Newmont in February 2002. Interest on the notes is paid semi-annually in arrears in January and July. The notes were recorded at their fair values at February 15, 2002 as part of the purchase accounting for the acquisition of Normandy. During the first quarter of 2003, the Company repurchased $30.9 million of these notes resulting in aLoss on extinguishment of debt of $4.4 million. The estimated fair value of these notes approximates the carrying value at December 31, 2004 and was $137.3 million at December 31, 2003. The foregoing fair value estimate was prepared by an independent third party and may or may not reflect the actual trading value of this instrument.8
Newmont Australia 7 1/2% Notes
In July 1998, NFL issued $100.0 million of seven year 7 1/2% notes guaranteed by NAL. The notes were recorded at their fair values at February 15, 2002 as part of the purchase accounting for the acquisition of Normandy. During 2003, the Company repurchased $80.5 million of these notes resulting in a Loss on
NEWMONT MINING CORPORATION
NOTES TO CONSOLIDATED FINANCIAL STATEMENTS—(Continued)
extinguishment of debt of $6.4 million. Interest on the notes is paid semi-annually in arrears in January and July. The estimated fair value of these notes approximated carrying value at December 31, 2004 and was $21.0 million at December 31, 2003.
Medium-Term Notes
Uncollateralized notes with a principal amount of $17.0 million maturing on various dates in 2004 were outstanding at December 31, 2003. The annual weighted interest rate was 7.92% during the year ended December 31, 2003. Interest was payable semi-annually in March and September and the notes were not redeemable prior to maturity.
Newmont Australia Infrastructure Bonds
In June 1996, NP Finance Limited and GPS Finance Limited, wholly-owned subsidiaries of NAL, issued A$111.9 million (approximately $83.9 million) and A$21.9 million (approximately $16.4 million), respectively, of 7.906%, fifteen-year bonds at a premium to fund certain gas pipeline and power station projects. The bonds were issued at a premium due to unique tax-related benefits available to the bondholders and the issuer under Australian tax regulations. Interest was accrued and capitalized semi-annually in arrears in June and December of each year. Concurrently, with the issue of the Infrastructure Bonds described above, GMK Investments Pty Ltd (“GMKI”), a wholly-owned subsidiary of NAL, entered into an offsetting transaction, making payments to Deutsche Bank Aktiengesellschaft (“DBA”) equal to the face value of the bonds in return for DBA agreeing to purchase the bonds from each holder of the bonds in June 2004 and to sell those bonds to GMKI for a nominal amount at that time. The receivable from DBA also accrued interest receivable at 7.906% and such interest is capitalized semi-annually in arrears in June and December of each year. In June 2004, DBA purchased the infrastructure bonds issued by GPS Finance Limited and transferred such bonds to GMKI. The forward purchase arrangement with DBA relating to the bonds issued by NP Finance was extended to June 2011 because certain tax-related benefits were still available to the bondholders. Subsequently, GMKI assigned its right to the forward purchase asset relating to the bonds issued by NP Finance to Newmont Pipelines Pty Ltd (“Newmont Pipelines”), a wholly-owned subsidiary of NAL, which then sold both NP Finance and Newmont Pipelines to a third party for cash consideration of A$4.5 million. The June 2004 transactions described above resulted in the full extinguishment of both the infrastructure bonds obligation and asset, and Newmont recognized a gain on extinguishment of $4.7 million during the year ended December 31, 2004 inInterest income, foreign currency exchange and other income.
Prepaid Forward Transaction
In July 1999, the Company entered into a prepaid forward gold sales contract (the “Prepaid Forward”) and a forward gold purchase contract (the “Forward Purchase”). Under the Prepaid Forward, the Company agreed to sell 483,333 ounces of gold, to be delivered in June of each of 2005, 2006 and 2007 in annual installments of 161,111 ounces (the “Annual Delivery Requirements”). The Company also agreed under the Prepaid Forward to deliver semi-annually 17,951 ounces of gold, beginning June 2000 through June 2007 (the “Semi-Annual Delivery Requirements”) for a total gold delivery obligation over the life of the Prepaid Forward of 752,598 ounces. At the time the Prepaid Forward was entered into, the Company received net proceeds of $137.2 million ($145.0 million of gross proceeds before transaction costs of $653,000 and the purchase of a $7.1 million surety bond to guarantee delivery of the Annual Delivery Requirements). The Company may also be entitled to receive additional proceeds in the future in connection with the annual deliveries of 161,111 ounces, to be determined at each delivery date based on the excess, if any, of the then market price for gold (up to a maximum of $380 per ounce) over $300 per ounce.
NEWMONT MINING CORPORATION
NOTES TO CONSOLIDATED FINANCIAL STATEMENTS—(Continued)
At the time the Company entered into the Prepaid Forward, it also entered into the Forward Purchase, with the same counterparty, to hedge the price risk with respect to the Semi-Annual Delivery Requirements. The Forward Purchase provides for semi-annual purchases of 17,951 ounces of gold on each semi-annual delivery date under the Prepaid Forward at prices increasing from $263 per ounce in 2000 to $354 per ounce in 2007. On each semi-annual delivery date, the ounces purchased under the Forward Purchase were delivered in satisfaction of the Company’s delivery requirements under the Prepaid Forward. The transaction has been accounted for as a single borrowing of $145 million, with interest accruing, based on an effective interest rate recognized over the full term of the borrowing. Scheduled repayments are $48.3 million in each of the years 2005, 2006 and 2007. Using relevant future market conditions and financial models, the estimated negative fair value of these contracts was approximately $204.5 million and $208.7 million at December 31, 2004 and 2003, respectively.
Interest Rate Swaps
During the last half of 2001, the Company entered into contracts to hedge the interest rate risk exposure on portions of its $275.0 million 8 5/8% debentures, and sale-leaseback of the refractory ore treatment plant. None of the aforementioned public debt instruments contain financial ratio covenants or credit rating provisions that could create liquidity issues for the Company.
In addition to the covenants noted above, the revolving credit facility contains financial ratio covenants requiring the Company to maintain a net debt to EBITDA (earnings before interest expense, income taxes, depreciation and amortization) ratio of less than or equal to 4.0 and a net debt (total debt net of cash) to total capitalization ratio of less than or equal to 62.5%. Furthermore, the corporate revolving credit facility contains covenants limiting the sale of all or substantially all of the Company’s assets, certain change of control provisions and a negative pledge on certain assets.
Certain of the Company’s project debt facilities contain various common project debt covenants and default provisions including limitations on dividends subject to certain debt service cover ratios, limitations on sales of assets, negative pledges on certain assets, change of control provisions and limitations of additional permitted debt.
At December 31, 2005, the Company and its $200related entities were in compliance with all debt covenants and default provisions.
NOTE 10 EMPLOYEE-RELATED BENEFITS
| At December 31, | ||||||
| 2005 | 2004 | |||||
Current: | ||||||
Employee pension benefits | $ | 30 | $ | 7 | ||
Accrued payroll and withholding taxes | 81 | 82 | ||||
Workers’ participation | 40 | 29 | ||||
Accrued severance | 3 | 5 | ||||
Other employee-related payables | 22 | 6 | ||||
| $ | 176 | $ | 129 | |||
| �� | ||||||
NEWMONT MINING CORPORATION
NOTES TO CONSOLIDATED FINANCIAL STATEMENTS—(Continued)
(dollars in millions, except per share, per ounce and per pound amounts)
| At December 31, | ||||||
| 2005 | 2004 | |||||
Long-term: | ||||||
Employee pension benefits | $ | 96 | $ | 72 | ||
Other post-retirement benefit plans | 94 | 88 | ||||
Workers’ participation | 19 | 23 | ||||
Accrued severance | 27 | 26 | ||||
Other employee-related payables | 37 | 35 | ||||
| $ | 273 | $ | 244 | |||
Pension Plans
The Company’s pension plans include: (1) two qualified non-contributory defined benefit plans (for salaried employees and substantially all domestic hourly union employees); (2) one non-qualified plan (for salaried employees whose benefits under the qualified plan are limited by federal legislation); (3) two qualified plans for salaried and hourly Canadian employees and (4) a non-qualified international plan (for select employees who are not eligible to participate in the U.S.-based plans because of citizenship). The vesting period for plans identified in (1) and (2) is five years of service. These plans’ benefit formulas are based on an employee’s years of credited service and either (i) such employee’s highest consecutive five years average pay (salaried plan) or (ii) a flat dollar amount adjusted by a service-weighted multiplier (hourly plan). The Canadian plan provides for full vesting of benefits upon remittance and the benefit formula is based on a percentage of annual pay. The international retirement plan’s basic and savings accounts have a graded vesting schedule and are fully vested after four years of service. The international retirement plan’s supplemental account is vested after attaining age 55 with 10 years of service or attaining age 62. The plan’s benefit formula is based on a percentage of compensation as defined in the plan document.
Pension costs are determined annually by independent actuaries and pension contributions to the qualified plans are made based on funding standards established under the Employee Retirement Income Security Act of 1974.
Other Benefit Plans
The Company provides defined medical and life insurance benefits to selected qualified U.S. and Canadian retirees (generally salaried employees and to a limited extent their eligible dependents). In general, participants become eligible for these benefits upon retirement directly from the Company if they are at least 55 years old and, for U.S. employees, the combination of their age and years of service with the Company equals 75 or more. This benefit is not provided to employees who joined the Company after January 1, 2003.
Defined medical benefits cover most of the reasonable and customary charges for hospital, surgical, diagnostic and physician services and prescription drugs. Life insurance benefits are based on a percentage of final base annual salary and decline over time after retirement commences. The majority of the costs of these medical and life insurance benefits are paid by the Company. In 2003, the Company began a strategy to more equitably share costs with retirees; by 2008, 75% of retiree medical coverage cost will be paid by the Company. Qualified retirees that become eligible after January 1, 2003 may be required to contribute additional amounts to the medical coverage.
NEWMONT MINING CORPORATION
NOTES TO CONSOLIDATED FINANCIAL STATEMENTS—(Continued)
(dollars in millions, except per share, per ounce and per pound amounts)
The following tables provide a reconciliation of changes in the plans’ benefit obligations and assets’ fair values for the two-year period ended December 31, 2005, and a statement of the funded status as of December 31, 2005 and 2004:
| Pension Benefits | Other Benefits | |||||||||||||||
| 2005 | 2004 | 2005 | 2004 | |||||||||||||
Change in Benefit Obligation: | ||||||||||||||||
Benefit obligation at beginning of year | $ | 337 | $ | 289 | $ | 82 | $ | 69 | ||||||||
Service cost-benefits earned during the year | 13 | 11 | 5 | 3 | ||||||||||||
Interest cost | 19 | 18 | 5 | 4 | ||||||||||||
Amendments | 5 | 1 | — | — | ||||||||||||
Actuarial loss (gain) | 43 | 30 | (3 | ) | 8 | |||||||||||
Foreign currency exchange loss | — | — | — | — | ||||||||||||
Settlement payments | 4 | — | — | — | ||||||||||||
Benefits paid | (19 | ) | (12 | ) | (3 | ) | (2 | ) | ||||||||
Benefit obligation at end of year | $ | 402 | $ | 337 | $ | 86 | $ | 82 | ||||||||
Accumulated Benefit Obligation | $ | 354 | $ | 296 | N/A | N/A | ||||||||||
Change in Fair Value of Assets: | ||||||||||||||||
Fair value of assets at beginning of year | $ | 217 | $ | 172 | $ | — | $ | — | ||||||||
Actual return on plan assets | 17 | 19 | — | — | ||||||||||||
Employer contributions | 12 | 38 | 3 | 2 | ||||||||||||
Foreign currency exchange gain | — | — | — | — | ||||||||||||
Settlement payments | — | — | — | — | ||||||||||||
Benefits paid | (19 | ) | (12 | ) | (3 | ) | (2 | ) | ||||||||
Fair value of assets at end of year | $ | 227 | $ | 217 | $ | — | $ | — | ||||||||
Under funded status | $ | (175 | ) | $ | (120 | ) | $ | (86 | ) | $ | (82 | ) | ||||
Unrecognized prior service cost | 12 | 8 | (7 | ) | (8 | ) | ||||||||||
Unrecognized net loss (gain) | 139 | 104 | (1 | ) | 2 | |||||||||||
Unrecognized net asset | — | — | — | — | ||||||||||||
Accrued cost | $ | (24 | ) | $ | (8 | ) | $ | (94 | ) | $ | (88 | ) | ||||
The Company’s qualified pension plans are funded with cash contributions in compliance with Internal Revenue Service (“IRS”) rules and regulations. The Company’s non-qualified and other benefit plans are currently not funded, but exist as general corporate obligations. The information contained in the above tables indicates the combined funded status of qualified and non-qualified plans, in accordance with accounting pronouncements. Assumptions used for IRS purposes differ from those used for accounting purposes. The funded status shown above compares the projected benefit obligation (“PBO”) of all plans, which is an actuarial present value of obligations that takes into account assumptions as to future compensation levels of plan participants, to the fair value of the assets held in trust for the qualified plans. Accounting pronouncements also prescribe a computation for the plans’ accumulated benefit obligation (“ABO”), which is an actuarial present value of benefits (whether vested or nonvested) attributed to employees based on employee service and compensation prior to the end of the period presented. The Company is currently planning to contribute at a minimum, $30, to its retirement benefit programs in 2006. However, during the course of the year, consideration may be given to making additional contributions toward the Company’s retirement benefit programs depending on various factors, including changes to regulations governing the funding of pensions, the Company’s business and operating environment and forecasted cash flows.
NEWMONT MINING CORPORATION
NOTES TO CONSOLIDATED FINANCIAL STATEMENTS—(Continued)
(dollars in millions, except per share, per ounce and per pound amounts)
The following plans have an ABO in excess of the market value of plan assets:
| 2005 | 2004 | |||||||||||||||||
| PBO | ABO | Market value of plan assets | PBO | ABO | Market value of plan assets | |||||||||||||
Qualified plan—salaried employees | $ | 309 | $ | 266 | $ | 197 | $ | 268 | $ | 231 | $ | 187 | ||||||
Non-qualified plan—salaried employees | 45 | 42 | — | 30 | 27 | — | ||||||||||||
Qualified plan—hourly employees | 40 | 39 | 26 | 33 | 33 | 23 | ||||||||||||
Non-qualified plan—international | 7 | 6 | — | 5 | 4 | — | ||||||||||||
Qualified and non-qualified plans—Canadian | 1 | 1 | 4 | 1 | 1 | 7 | ||||||||||||
| $ | 402 | $ | 354 | $ | 227 | $ | 337 | $ | 296 | $ | 217 | |||||||
The following table provides the net amounts recognized in the consolidated balance sheets as of December 31:
| Pension Benefits | Other Benefits | |||||||||||||||
| 2005 | 2004 | 2005 | 2004 | |||||||||||||
Accrued benefit cost | $ | (126 | ) | $ | (79 | ) | $ | (94 | ) | $ | (88 | ) | ||||
Intangible asset | 12 | 8 | — | — | ||||||||||||
Accumulated other comprehensive income | 90 | 63 | — | — | ||||||||||||
| $ | (24 | ) | $ | (8 | ) | $ | (94 | ) | $ | (88 | ) | |||||
In 2004, an adjustment was required to reflect an increased liability of $3 for the hourly pension plans. This was the result of a one-time, one-year increase to benefits applicable to participants with a specified combination of age and years of service. In 2004, an adjustment was required to reflect a decreased liability of $2 for the non-qualified plans. This was the result of a change to the components of eligible compensation.
The following table provides the components of the net periodic pension benefit cost for the years ended December 31:
| Pension Benefits | Other Benefits | |||||||||||||||||||||||
| 2005 | 2004 | 2003 | 2005 | 2004 | 2003 | |||||||||||||||||||
Service cost | $ | 13 | $ | 11 | $ | 9 | $ | 5 | $ | 3 | $ | 3 | ||||||||||||
Interest cost | 19 | 18 | 17 | 5 | 4 | 4 | ||||||||||||||||||
Expected return on plan assets | (15 | ) | (13 | ) | (12 | ) | — | — | — | |||||||||||||||
Amortization of prior service cost | 1 | 1 | 1 | (1 | ) | (1 | ) | — | ||||||||||||||||
Amortization of loss (gain) | 6 | 4 | 2 | — | — | (1 | ) | |||||||||||||||||
Settlements | 4 | — | — | — | — | — | ||||||||||||||||||
| $ | 28 | $ | 21 | $ | 17 | $ | 9 | $ | 6 | $ | 6 | |||||||||||||
For the pension plans, prior-service costs are amortized on a straight-line basis over the average remaining service period of active participants. Gains and losses in excess of 10% of the greater of the benefit obligation or the market-related value of assets are amortized over the average remaining service period of active participants. Pension and postretirement benefits are accrued during an employee’s service to the Company.
NEWMONT MINING CORPORATION
NOTES TO CONSOLIDATED FINANCIAL STATEMENTS—(Continued)
(dollars in millions, except per share, per ounce and per pound amounts)
Significant assumptions were as follows:
| Pension Benefits | Other Benefits | |||||||||||
| As of December 31, | As of December 31, | |||||||||||
| 2005 | 2004 | 2005 | 2004 | |||||||||
Weighted-average assumptions used in measuring the Company’s benefit obligation: | ||||||||||||
Discount rate | 5.75 | % | 5.75 | % | 5.75 | % | 5.75 | % | ||||
Rate of compensation increase | 4.00 | % | 4.00 | % | 4.00 | % | 4.00 | % | ||||
| Pension Benefits | Other Benefits | |||||||||||||||||
| Years Ended December 31, | Years Ended December 31, | |||||||||||||||||
| 2005 | 2004 | 2003 | 2005 | 2004 | 2003 | |||||||||||||
Weighted-average assumptions used in measuring the net periodic pension benefit cost: | ||||||||||||||||||
Discount long-term rate | 5.75 | % | 6.25 | % | 6.75 | % | 5.75 | % | 6.25 | % | 6.75 | % | ||||||
Expected return on plan assets | 8.00 | % | 8.00 | % | 8.00 | % | N/A | N/A | N/A | |||||||||
Rate of compensation increase | 4.00 | % | 4.00 | % | 4.00 | % | 4.00 | % | 4.00 | % | 4.00 | % | ||||||
The 2003-2005 decision to use 8% as the expected long-term return on plan assets was based on an analysis of the actual plan asset returns over multiple time horizons and review of assumptions used by other U.S. corporations with defined benefit plans of similar size and investment strategy. The average actual return on plan assets during the 17 years ended December 31, 2005 approximated 10%.
The pension plan employs several independent investment firms which invest the assets of the plan in certain approved funds that correspond to specific asset classes with associated target allocations. Depending upon actual sector performance, the assets in the plan are periodically rebalanced to match the established target levels for the asset classes. The goal of the pension fund investment program is to achieve expected rates of return consistent with the investment risk associated with the approved investment portfolio. The investment performance of the plan and that of the individual investment firms is measured against recognized market indices. This performance is monitored by an investment committee comprised of members of the Company’s management, which is advised by an independent investment consultant. The performance of the plan is reviewed annually with the Audit Committee of the Company’s board of directors. The following is a summary of the target asset allocations for 2005 and the actual asset allocation for 2005.
| Target | Actual at December 31, 2005 | |||||
Asset Allocation | ||||||
U.S. equity investments | 45 | % | 44 | % | ||
International equity investments | 20 | % | 22 | % | ||
Fixed income investments | 35 | % | 34 | % |
NEWMONT MINING CORPORATION
NOTES TO CONSOLIDATED FINANCIAL STATEMENTS—(Continued)
(dollars in millions, except per share, per ounce and per pound amounts)
The assumed health care cost trend rate to measure the expected cost of benefits was 11% for 2006, 10% for 2007, 9% for 2008, 8% for 2009, 7% for 2010, 6% for 2011 and 5% each year thereafter. Assumed health care cost trend rates have a significant effect on amounts reported for the health care plans. A one-percentage-point change in assumed health care cost trend rates would have the following effects:
One-percentage- point Increase | One-percentage- point Decrease | ||||||
Effect on total of service and interest cost components of net periodic postretirement health care benefit cost | $ | 2 | $ | (1 | ) | ||
Effect on the health care component of the accumulated postretirement benefit obligation | $ | 14 | $ | (11 | ) | ||
Cash flows
Benefit payments expected to be paid to plan participants are as follows:
| Pension Benefits | Other Benefit Plans | |||||
2006 | $ | 13 | $ | 3 | ||
2007 | 32 | 3 | ||||
2008 | 14 | 3 | ||||
2009 | 18 | 3 | ||||
2010 | 21 | 4 | ||||
2011 through 2015 | 116 | 22 | ||||
| $ | 214 | $ | 38 | |||
Savings Plans
The Company has two qualified defined contribution savings plans, one that covers salaried and non-union hourly employees and one that covers substantially all hourly union employees. In addition, the Company has one non-qualified supplemental savings plan for salaried employees whose benefits under the qualified plan are limited by federal regulations. When an employee meets eligibility requirements, the Company matches 100% of employee contributions of up to 6% and 5% of base salary for the salaried (including non-union hourly employees) and hourly plans, respectively. Matching contributions are made with Newmont stock; however, no holding restrictions are placed on such contributions, which totaled $10 in 2005, $9 in 2004 and $8 in 2003.
NOTE 11 STOCK OPTIONS
Employee Stock Options
The Company currently maintains the 2005 Stock Incentive Plan (“Stock Plan”), approved by stockholders on April 27, 2005, for executives and eligible employees. Under this Stock Plan, options to purchase shares of stock can be granted with exercise prices not less than at 100% of fair market value of the underlying stock at the date of grant. Fair market value of a share of common stock as of the grant date is the average of the high and low sales prices for a share of the Company’s common stock on the New York Stock Exchange. The Company also maintains prior stock plans, but no longer grants awards under these plans. Options granted under the Company’s stock plans vest over periods ranging from two to four years and are exercisable over a period of time not to exceed 10 years from grant date. At December 31, 2005, 18,963,560 shares were available for future grants under the Company’s 2005 Stock Incentive Plan.
NEWMONT MINING CORPORATION
NOTES TO CONSOLIDATED FINANCIAL STATEMENTS—(Continued)
(dollars in millions, except per share, per ounce and per pound amounts)
The following table summarizes annual activity for all stock options for each of the three years ended December 31:
| 2005 | 2004 | 2003 | |||||||||||||||||||
| Number of Shares | Weighted Average Exercise Price | Number of Shares | Weighted Average Exercise Price | Number of Shares | Weighted Average Exercise Price | ||||||||||||||||
Outstanding at beginning of year | 9,209,914 | $ | 34.11 | 10,629,449 | $ | 30.02 | 13,108,428 | $ | 27.43 | ||||||||||||
Granted | 2,002,638 | $ | 41.67 | 2,030,722 | $ | 43.16 | 2,014,600 | $ | 39.92 | ||||||||||||
Exercised | (1,517,601 | ) | $ | 44.40 | (3,053,688 | ) | $ | 24.80 | (4,025,689 | ) | $ | 24.25 | |||||||||
Forfeited and expired | (261,282 | ) | $ | 49.40 | (396,569 | ) | $ | 47.77 | (467,890 | ) | $ | 41.38 | |||||||||
Outstanding at end of year | 9,433,669 | $ | 35.90 | 9,209,914 | $ | 34.11 | 10,629,449 | $ | 30.02 | ||||||||||||
Options exercisable at year end | 5,920,180 | $ | 32.58 | 5,577,335 | $ | 30.51 | 7,245,460 | $ | 28.05 | ||||||||||||
Weighted-average fair value of options granted during the year | $ | 14.39 | $ | 14.05 | $ | 17.66 | |||||||||||||||
The following table summarizes information about stock options outstanding at December 31, 2005, with exercise prices equal to the fair market value on the date of grant with no restrictions on exercisability after vesting:
| Options Outstanding | Options Exercisable | |||||||||||
Range of Exercise Prices | Number Outstanding | Weighted- average Remaining Contractual Life (in years) | Weighted- average Exercise Price | Number Exercisable | Weighted Average Exercise Price | |||||||
$0 to $20 | 1,617,656 | 3.4 | $ | 18.58 | 1,617,656 | $ | 18.58 | |||||
$20 to $30 | 2,319,789 | 5.9 | $ | 25.98 | 2,000,581 | $ | 25.80 | |||||
$30 to $40 | 1,252,885 | 7.9 | $ | 37.47 | 226,732 | $ | 34.87 | |||||
$40 to $50 | 3,758,594 | 8.7 | $ | 45.47 | 1,590,466 | $ | 46.76 | |||||
$50+ | 484,745 | 0.8 | $ | 60.77 | 484,745 | $ | 60.77 | |||||
| 9,433,669 | 6.6 | $ | 35.90 | 5,920,180 | $ | 32.58 | ||||||
The Company’s U.S. income taxes payable have been reduced, and additional paid in capital increased, for the tax benefits associated with the exercise of employee stock options. The Company is entitled to a deduction equal to the excess of the fair market value of the stock issued at the date of exercise over the amount received from the employee (the option exercise price). These tax benefits were credited directly to shareholders’ equity as additional paid in capital and amounted to $nil for 2005, $18 for 2004, and $19 for 2003.
Other Stock-Based Compensation
The Company grants restricted stock to certain employees. Shares of restricted stock are granted upon achievement of certain financial and operating thresholds at fair market value on the grant date. Prior to vesting, these shares of restricted stock are subject to certain restrictions related to ownership and transferability. Holders of restricted stock entitle the holder to vote the shares and to receive any dividends declared on the shares. In 2005, 2004, and 2003, 155,061, 285,155, and 170,019 shares of restricted stock, respectively, were granted and issued, of which 147,861 and 168,320 shares remained unvested at December 31, 2005 for the 2005 and 2004 grants, respectively. The weighted-average fair market value of the stock grants issued were $45, $42, and $26 in
NEWMONT MINING CORPORATION
NOTES TO CONSOLIDATED FINANCIAL STATEMENTS—(Continued)
(dollars in millions, except per share, per ounce and per pound amounts)
2005, 2004, and 2003, respectively. Compensation expense recorded for restricted stock was $9, $8, and $13 in 2005, 2004 and 2003, respectively. The shares of restricted stock vest in three equal increments over three years.
Restricted stock units also are granted, upon achievement of certain financial and operating thresholds, to employees in certain foreign jurisdictions. In 2005, the Company granted 27,386 restricted stock units at the weighted-average fair market value of $44.57 per underlying share of the Company’s common stock. In 2004, the Company granted 18,788 restricted stock units at the weighted-average fair market value of $42.04 per underlying share of the Company’s common stock. Compensation expense recorded for the foreign jurisdiction restricted stock units was $1 in both 2005 and 2004. These restricted stock units vest in three equal increments over three years. Upon vesting, the employee is entitled to receive for each restricted stock unit one share of the Company’s common stock.
The Company grants deferred stock awards to certain other employees. The deferred stock awards vest over periods between two to three years. In 2005, 2004 and 2003, the Company granted deferred stock awards in respect of 164,975, 158,219, and 174,795 shares of the Company’s common stock, respectively, at weighted-average fair market values of $40.92, $42.99, and $36.76 per share, respectively. At December 31, 2005 and 2004, 159,620 and 314,109 deferred stock awards, respectively, remained unvested. Compensation expense recorded for deferred stock awards was $5, $6, and $5 in 2005, 2004 and 2003, respectively. Upon vesting, the employee is entitled to receive the number of shares of the Company’s common stock specified in the deferred stock award.
NOTE 12 OTHER LIABILITIES
| At December 31, | ||||||
| 2005 | 2004 | |||||
Other current liabilities: | ||||||
Accrued capital expenditures | $ | 80 | $ | 58 | ||
Income and mining taxes | 77 | 57 | ||||
Reclamation and remediation costs | 63 | 53 | ||||
Accrued operating costs | 82 | 60 | ||||
Royalties | 26 | 41 | ||||
Interest | 42 | 37 | ||||
Taxes other than income and mining | 18 | 15 | ||||
Deferred revenue | 17 | 11 | ||||
Advanced stripping costs | 14 | 2 | ||||
Deferred income tax liabilities | 5 | 10 | ||||
Other | 52 | 31 | ||||
| $ | 476 | $ | 375 | |||
Other long-term liabilities: | ||||||
Income taxes | $ | 220 | $ | 306 | ||
Deferred stripping | 93 | 103 | ||||
Deferred revenue from the sale of future product | 47 | 47 | ||||
Derivative instruments | 30 | 7 | ||||
Other | 24 | 24 | ||||
| $ | 414 | $ | 487 | |||
NEWMONT MINING CORPORATION
NOTES TO CONSOLIDATED FINANCIAL STATEMENTS—(Continued)
(dollars in millions, except per share, per ounce and per pound amounts)
NOTE 13 RECLAMATION AND REMEDIATION (ASSET RETIREMENT OBLIGATIONS)
The Company’s mining and exploration activities are subject to various federal and state laws and regulations governing the protection of the environment. These laws and regulations are continually changing and are generally becoming more restrictive. The Company conducts its operations so as to protect the public health and environment and believes its operations are in compliance with applicable laws and regulations in all material respects. The Company has made, and expects to make in the future, expenditures to comply with such laws and regulations, but cannot predict the full amount of such future expenditures. Estimated future reclamation costs are based principally on legal and regulatory requirements.
At December 31, 2005 and 2004, $431 and $396, respectively, were accrued for reclamation obligations relating to currently or recently producing mineral properties. In addition, the Company is involved in several matters concerning environmental obligations associated with former, primarily historic, mining activities. Generally, these matters concern developing and implementing remediation plans at the various sites involved. At December 31, 2005 and 2004, $77 and $75, respectively, were accrued for such obligations. These amounts are also included inReclamation and remediation liabilities.
The following is a reconciliation of the total liability for reclamation and remediation:
Balance January 1, 2004 | $ | 409 | ||
Impact of Batu Hijau consolidation | 47 | |||
Additions, change in estimates and other | 35 | |||
Liabilities settled | (45 | ) | ||
Accretion expense | 25 | |||
Balance December 31, 2004 | 471 | |||
Additions, change in estimates and other | 65 | |||
Liabilities settled | (47 | ) | ||
Disposition of liability | (8 | ) | ||
Accretion expense | 27 | |||
Balance December 31, 2005 | $ | 508 | ||
The current portions ofReclamation and remediation liabilities of $63 and $53 at December 31, 2005 and 2004, respectively, are included inOther current liabilities.
The Company recorded $34, $13 and $19 of reclamation expense for 2005, 2004 and 2003, respectively, for properties associated with former mining activities.
NOTE 14 STOCKHOLDERS’ EQUITY AND EARNINGS PER SHARE
Newmont Common Stock
In January 2004, Newmont filed a shelf registration statement on Form S-3 under which it can issue debt and equity securities from time-to-time having an aggregate offering price of up to $1,000. Newmont also filed a shelf registration statement on Form S-4 under which it can issue, from time-to-time in connection with future acquisitions of businesses, properties or assets, common stock and common stock warrants having an aggregate offering price up to $200. These registration statements were declared effective on February 4, 2004.
NEWMONT MINING CORPORATION
NOTES TO CONSOLIDATED FINANCIAL STATEMENTS—(Continued)
(dollars in millions, except per share, per ounce and per pound amounts)
During November 2003, Newmont completed an equity offering of 25 million shares of common stock under its existing shelf registration statement filed with the Securities and Exchange Commission. The net proceeds of approximately $986 from this offering were used for general corporate purposes.
During April and December 2003, Newmont issued approximately 4.4 million shares of common stock in connection with the Newmont NFM Scheme of Arrangement (see Note 22) and 0.8 million shares of common stock in connection with the acquisition of Moydow’s interest in the Ntotoroso property, respectively.
The Company paid common stock dividends of $0.40 per share during 2005, $0.30 per share during 2004 and $0.17 per share during 2003.
Treasury Shares
Treasury stock is acquired by the Company when certain restricted stock (see Note 11) vests. At vesting, a participant has a tax liability and, pursuant to the participant’s award agreement, may elect withholding of restricted stock in full or partial satisfaction of such tax obligation, but only to the extent that such restricted stock has become fully vested. The withheld stock is accounted for as treasury stock and carried at the par value of the related common stock.
Exchangeable Shares
In connection with the acquisition of Franco-Nevada in February 2002, certain holders of Franco-Nevada common stock received 0.8 of an exchangeable share of Newmont Mining Corporation of Canada Limited (formerly Franco-Nevada) for each share of common stock held. These exchangeable shares are convertible, at the option of the holder, into shares of Newmont common stock on a one-for-one basis, and entitle holders to dividends and other rights economically equivalent to holders of Newmont common stock. At December 31, 2005 and 2004, the value of these no-par shares was included inAdditional paid-in capital.
Warrants
Newmont Mining Corporation of Canada Limited (“NMCCL”) had 2.2 million Class A warrants outstanding that expired during September 2003. Each Class A warrant, plus CDN$200, was exchangeable for 3.2 shares of Newmont common stock. None of the Class A warrants were exercised before expiration. NMCCL also had 2.1 million Class B warrants with an expiration date in November 2003. Each Class B warrant, plus CDN$100 per warrant, was exchangeable for 2.464 shares of Newmont common stock. Of the total Class B warrants, 99.9% were exercised before expiration.
Earnings per Share
The difference between the basic weighted-average common shares outstanding and the diluted weighted-average common shares outstanding for 2005, 2004 and 2003 was due to the assumed conversion of employee stock options. Employee stock options with exercise prices greater than the average market price were excluded from the December 31, 2005, 2004 and 2003 diluted weighted-average common shares because the effect would have been anti-dilutive.
NEWMONT MINING CORPORATION
NOTES TO CONSOLIDATED FINANCIAL STATEMENTS—(Continued)
(dollars in millions, except per share, per ounce and per pound amounts)
NOTE 15 COMPREHENSIVE INCOME
| Years Ended December 31, | ||||||||||||
| 2005 | 2004 | 2003 | ||||||||||
Comprehensive income: | ||||||||||||
Net income | $ | 322 | $ | 443 | $ | 476 | ||||||
Other comprehensive income: | ||||||||||||
Unrealized gain (loss) on marketable equity securities, net of tax of $(61), $(32) and $2, respectively | 282 | 123 | (5 | ) | ||||||||
Foreign currency translation adjustments | 26 | 31 | 23 | |||||||||
Minimum pension liability adjustments, net of tax of $10 in 2005 and $6 in 2004 | (18 | ) | (11 | ) | — | |||||||
Changes in fair value of cash flow hedge instruments, net of tax of $30, $8 and $(27), respectively | (59 | ) | (19 | ) | 68 | |||||||
| 231 | 124 | 86 | ||||||||||
Comprehensive income | $ | 553 | $ | 567 | $ | 562 | ||||||
| At December 31, | ||||||||
| 2005 | 2004 | |||||||
Accumulated other comprehensive income: | ||||||||
Unrealized gain on marketable equity securities, net of tax of $(94) and $(32), respectively | $ | 406 | $ | 124 | ||||
Foreign currency translation adjustments | 57 | 31 | ||||||
Minimum pension liability adjustments, net of tax of $32 and $22, respectively | (59 | ) | (41 | ) | ||||
Changes in fair value of cash flow hedge instruments, net of tax of $18 and $(13), respectively | (26 | ) | 33 | |||||
Accumulated other comprehensive income | $ | 378 | $ | 147 | ||||
During 2005, 2004 and 2003, the Company reclassified approximately $2, $9 and $17 of gains related to the cash flow hedge instruments fromAccumulated other comprehensive income toRevenues to reflect maturities of such instruments.
NOTE 16 WRITE-DOWN OF LONG-LIVED ASSETS
Write-down of long-lived assets totaled $43, $39 and $35 for 2005, 2004 and 2003, respectively. The 2005 write-down primarily related to write-downs of an advanced exploration project in Indonesia and exploration tenements in Australia. The 2004 write-down included $16 related to the Ovacik mine in Turkey. The remainder of the write-down for 2004 was related to exploration tenements in Australia, long-lived asset impairment resulting from a reevaluation of future production and operating costs at Pajingo, and processing facilities at Yanacocha. The 2003 write-down was related to a $28 impairment charge at Golden Giant.
NEWMONT MINING CORPORATION
NOTES TO CONSOLIDATED FINANCIAL STATEMENTS—(Continued)
(dollars in millions, except per share, per ounce and per pound amounts)
NOTE 17 OTHER EXPENSE
| Years Ended December 31, | ||||||||||
| 2005 | 2004 | 2003 | ||||||||
Reclamation and remediation | $ | 37 | $ | (11 | ) | $ | 33 | |||
Minahasa environmental and Buyat Bay civil suit (Note 32) | 56 | 7 | — | |||||||
Nevada waste dump slide | 6 | — | — | |||||||
Other | 12 | 37 | 17 | |||||||
| $ | 111 | $ | 33 | $ | 50 | |||||
NOTE 18 OTHER INCOME, NET
| Years Ended December 31, | |||||||||||
| 2005 | 2004 | 2003 | |||||||||
Royalty and dividend income, net | $ | 79 | $ | 64 | $ | 56 | |||||
Interest income | 59 | 23 | 11 | ||||||||
Gain on sale of other assets, net | 48 | 28 | 15 | ||||||||
Gain (loss) on investments, net (Note 4) | 54 | (39 | ) | 83 | |||||||
Gain on derivative investments, net | 2 | 2 | 23 | ||||||||
Foreign currency exchange gains | 8 | 7 | 97 | ||||||||
Gain (loss) on QMC debt guarantee | 9 | 11 | (30 | ) | |||||||
Gain on extinguishment of NYOL liabilities, net | — | — | 221 | ||||||||
Loss on extinguishment of debt | — | — | (34 | ) | |||||||
Other | 10 | 6 | 9 | ||||||||
| $ | 269 | $ | 102 | $ | 451 | ||||||
Gain on Sale of Other Assets, Net
On March 31, 2005, the Mezcala gold deposit was sold for cash proceeds of $31 and the Company recorded a pre-tax gain of $31.
Foreign Currency Exchange Gains
As of December 31, 2003, the Company converted CDN$499 of the Canadian dollar-denominated intercompany loans to long-term notes, as the Company does not intend to settle these loans in the foreseeable future. As a result, the Company no longer records foreign currency gains and losses in earnings with respect to the converted long-term notes.
Gain on Extinguishment of NYOL liabilities, Net
During 2003, Newmont, through an indirect, wholly-owned subsidiary, Yandal Bond Company Limited (“YBCL”), made an offer to acquire all of NYOL’s outstanding 8 37/8% debentures. Senior Notes due 2008. Those Notes were subsequently extinguished in connection with the Voluntary Administration of NYOL. Certain of Normandy’s hedge positions were also eliminated with the Voluntary Administration of NYOL. These transactions gave rise to a gain of $114 to extinguish the NYOL bonds and $107 to extinguish the NYOL derivatives liability, net of transaction costs for the year ended December 31, 2003.
NEWMONT MINING CORPORATION
NOTES TO CONSOLIDATED FINANCIAL STATEMENTS—(Continued)
(dollars in millions, except per share, per ounce and per pound amounts)
NOTE 19 INCOME TAXES
The Company receives fixed-rateCompany’sIncome tax expense consisted of:
| Years Ended December 31, | ||||||||||||
| 2005 | 2004 | 2003 | ||||||||||
Current: | ||||||||||||
United States | $ | (22 | ) | $ | (10 | ) | $ | (15 | ) | |||
Foreign | (303 | ) | (241 | ) | (228 | ) | ||||||
| (325 | ) | (251 | ) | (243 | ) | |||||||
Deferred: | ||||||||||||
United States | 9 | 61 | 49 | |||||||||
Foreign | 2 | (135 | ) | (18 | ) | |||||||
| 11 | (74 | ) | 31 | |||||||||
| $ | (314 | ) | $ | (325 | ) | $ | (212 | ) | ||||
The Company’sPre-tax income (loss) before minority interest, payments at 8 5/8% or 8 3/8%equity income and pays floating-rate interestimpairment of affiliates and cumulative effect of a change in accounting principleconsisted of:
| Years Ended December 31, | |||||||||
| 2005 | 2004 | 2003 | |||||||
United States | $ | (68 | ) | $ | 183 | $287 | |||
Foreign | 1,132 | 928 | 644 | ||||||
| $ | 1,064 | $ | 1,111 | $931 | |||||
NEWMONT MINING CORPORATION
NOTES TO CONSOLIDATED FINANCIAL STATEMENTS—(Continued)
(dollars in millions, except per share, per ounce and per pound amounts)
The Company’s income tax expense differed from the amounts basedcomputed by applying the United States statutory corporate income tax rate for the following reasons:
Years Ended December 31, | ||||||||||||
| 2005 | 2004 | 2003 | ||||||||||
Pre-tax income before minority interest, equity income and impairment of affiliates and cumulative effect of change in accounting principle | $ | 1,064 | $ | 1,111 | $ | 931 | ||||||
United States statutory corporate income tax rate | 35 | % | 35 | % | 35 | % | ||||||
Income tax expense computed at United States statutory corporate income tax rate | (372 | ) | (389 | ) | (326 | ) | ||||||
Reconciling items: | ||||||||||||
Percentage depletion and Canadian Resource Allowance | 47 | 47 | 21 | |||||||||
Change in valuation allowance on deferred tax assets | (22 | ) | 58 | 85 | ||||||||
Effect of foreign earnings, net of allowable credits | (10 | ) | (11 | ) | 28 | |||||||
U.S. tax effect of minority interest attributable to non-U.S. investees | 15 | 7 | 22 | |||||||||
Rate differential for foreign earnings indefinitely reinvested | (8 | ) | (61 | ) | 11 | |||||||
Resolution of tax issues associated with prior years | 12 | — | — | |||||||||
Foreign currency translation of monetary assets | 14 | 13 | (54 | ) | ||||||||
Tax effect of changes in tax laws | 24 | 51 | 36 | |||||||||
Tax effect of impairment of goodwill | (14 | ) | (17 | ) | — | |||||||
Non-U.S. tax effect attributable to the extinguishment of debt | — | — | (36 | ) | ||||||||
Non-U.S. tax effect attributable to capital gains | — | (9 | ) | — | ||||||||
Other | — | (14 | ) | 1 | ||||||||
Income tax expense | $ | (314 | ) | $ | (325 | ) | $ | (212 | ) | |||
NEWMONT MINING CORPORATION
NOTES TO CONSOLIDATED FINANCIAL STATEMENTS—(Continued)
(dollars in millions, except per share, per ounce and per pound amounts)
Components of the Company’s deferred income tax assets (liabilities) are as follows:
Years Ended December 31, | ||||
2005 | 2004 | |||
Deferred income tax assets: | ||||
Exploration costs | $55 | $49 | ||
Depreciation | 69 | — | ||
Net operating losses and tax credits | 720 | 621 | ||
Retiree benefit and vacation accrual costs | 101 | 89 | ||
Remediation and reclamation costs | 101 | 111 | ||
Derivative instruments | 26 | — | ||
Unrealized losses on investments | — | 54 | ||
Other | 116 | 71 | ||
| 1,188 | 995 | |||
Valuation allowances | (523) | (376) | ||
| 665 | 619 | |||
Deferred income tax liabilities: | ||||
Net undistributed earnings of subsidiaries | (49) | (91) | ||
Unrealized gain on investments | (77) | — | ||
Depletable and amortizable costs associated with mineral rights | (310) | (160) | ||
Depreciation | — | (4) | ||
Derivative instruments | — | (13) | ||
Capitalized mining costs | — | (125) | ||
Foreign currency exchange | (23) | (41) | ||
Capitalized interest | — | (6) | ||
| (459) | (440) | |||
Net deferred income tax assets | $206 | $179 | ||
Net deferred income tax assets consist of:
| Years Ended December 31, | ||||||||
| 2005 | 2004 | |||||||
Current deferred income tax assets | $ | 159 | $ | 173 | ||||
Long-term deferred income tax assets | 519 | 492 | ||||||
Current deferred income tax liabilities | (5 | ) | (10 | ) | ||||
Long-term deferred income tax liabilities | (467 | ) | (476 | ) | ||||
| $ | 206 | $ | 179 | |||||
NEWMONT MINING CORPORATION
NOTES TO CONSOLIDATED FINANCIAL STATEMENTS—(Continued)
(dollars in millions, except per share, per ounce and per pound amounts)
These balances include net deferred income tax assets that have been reclassified toAssets andLiabilities of operations held for sale of:
Years Ended December 31, | ||||||||
| 2005 | 2004 | |||||||
Current deferred income tax assets | $ | — | $ | — | ||||
Long-term deferred income tax assets | 2 | (2 | ) | |||||
Current deferred income tax liabilities | — | — | ||||||
Long-term deferred income tax liabilities | (18 | ) | (16 | ) | ||||
| $ | (16 | ) | $ | (18 | ) | |||
Newmont intends to indefinitely reinvest earnings from certain foreign operations. Accordingly, U.S. and non-U.S. income and withholding taxes for which deferred taxes might otherwise be required, have not been provided on periodic London Interbank Offered Rate (“LIBOR”) settings plus a spread, ranging from 2.60% to 4.25%. The notional principalcumulative amount of these transactions was $200 milliontemporary differences (including, for this purpose, any difference between the tax basis in the stock of a consolidated subsidiary and the amount of the subsidiary’s net equity determined for financial reporting purposes) related to investments in foreign subsidiaries of approximately $1,013 and $819 at December 31, 2004. Effective April 1,2005 and 2004, respectively. The additional U.S. and non-U.S. income and withholding tax that would arise on the reversal of the temporary differences could be offset in part, by tax credits. Because the determination of the amount of available tax credits and the limitations imposed on the annual utilization of such credits are subject to a highly complex series of calculations and expense allocations, it is impractical to estimate the amount of net income and withholding tax that might be payable if a reversal of temporary differences occurred.
On October 22, 2004, the President signed the American Jobs Creation Act of 2004 (“the Act”). The Act creates a temporary incentive for U.S. corporations to repatriate accumulated income earned abroad by providing an 85 percent dividends received deduction for certain dividends from controlled foreign corporations. The deduction is subject to a number of limitations. During September 2005, the Company completed its assessment of the repatriation provision and did not repatriate any funds under the above provisions of the Act.
As of December 31, 2005 and December 31, 2004, the Company redesignated $150 millionhad (i) $949 and $915 of these contracts as new fair value hedges against portionsnet operating loss carryforwards, respectively; and (ii) $155 and $156 of tax credit carryforwards, respectively. Of the amounts of net operating loss carryforwards, $74 and $101, respectively, are attributable to acquired mining operations conducted in the United States and will begin expiring in 2013 if not utilized before then. As of December 31, 2005 and 2004, $618 and 608, respectively, of net operating loss carryforwards are attributable to acquired mining operations in Australia for which current tax law provides no expiration period. The remaining net operating losses available are attributable to acquired entities and have various temporal and other limitations that may restrict the ultimate realization of the 8 5/8% notes and the 8 3/8% debentures. The remaining $50 milliontax benefits of these contracts have not been designated and changes in their fair value are recorded currently in income. Half of these contracts expire in Julysuch tax attributes.
Tax credit carryforwards for 2005 and half2004 of $147 and $121 consist of foreign tax credits available in the United States; substantially all such credits not utilized will expire at the end of 2011. Other credit carryforwards at the end of 2005 and 2004 in May 2011. See Note 16.the amounts of $8 and $35, respectively, represent alternative minimum tax credits attributable to the Company’s U.S. operations for which the current tax law provides no period of expiration.
The Company increased the valuation allowance related to deferred tax assets by $147 during 2005. The increase resulted primarily from the recording of additional capital losses in Australia now available to the
NEWMONT MINING CORPORATION
NOTES TO CONSOLIDATED FINANCIAL STATEMENTS—(Continued)
(dollars in millions, except per share, per ounce and per pound amounts)
Company as a result of Australia’s new consolidations regulations. The Company has placed a full valuation allowance on these capital losses because of a lack of sufficient positive evidence to support the future realization of these deferred tax assets. The remaining increase in valuation allowance is primarily attributable to foreign tax credits and tax losses at the Company’s non-U.S. subsidiaries. These allowances are required due to the uncertainty of utilizing the foreign tax credits during the prescribed carryforward period as a result of certain limitations under U.S. tax law and the lack of sufficient positive evidence concerning the ability of the non-U.S. subsidiaries to generate sufficient taxable income to realize the tax loss carryforwards. Of the total $523 and $376 valuation allowance recorded as of December 31, 2005 and 2004, $89 in 2005 and $92 in 2004 are attributable to deferred tax assets for which any subsequently recognized tax benefits will be allocated to reduce goodwill related to the acquisition of Normandy.
The breakdown of the Company’s net deferred tax assets between the United States and foreign taxing jurisdictions is as follows:
| Years Ended December 31, | ||||||||
| 2005 | 2004 | |||||||
United States | $ | 479 | $ | 454 | ||||
Foreign | (273 | ) | (275 | ) | ||||
| $ | 206 | $ | 179 | |||||
NOTE 20 EQUITY INCOME (LOSS) OF AFFILIATES
| Years Ended December 31, | |||||||||||
| 2005 | 2004 | 2003 | |||||||||
European Gold Refineries | $ | 6 | $ | 1 | $ | — | |||||
AGR Matthey Joint Venture | (2 | ) | 1 | 1 | |||||||
Batu Hijau | — | — | 83 | ||||||||
Australian Magnesium Corporation | — | — | (119 | ) | |||||||
| $ | 4 | $ | 2 | $ | (35 | ) | |||||
European Gold Refineries
During December 2003, Newmont acquired a 50% interest in a joint venture, European Gold Refineries SA (“EGR”), with unrelated Swiss residents holding the remaining 50%. Simultaneously, EGR purchased 100% of Valcambi SA (“Valcambi”), a gold refining business, and 66.65% of Finorafa SA (“Finorafa”), a gold distribution business. Newmont has no guarantees related to this investment.
Valcambi is a London Gold Delivery precious metals refiner and manufacturer of semi-finished products for the Swiss luxury watch industry, and Finorafa is the second largest distributor and financier of gold products in the Italian market.
PTNNT Project Financing FacilityOn May 9, 2002, P.T. Newmont Nusa Tenggara (“PTNNT”) completed a restructuring of its project financing facility, (Senior Debt), which is non-recourse to Newmont.with a syndicate of banks. The scheduled repayments of this debt are semi-annual installments of $43.4$43 through November 2010 and $22.1 million$22 from May 2011 through November 2013. PTNNT deferred $86.8 million of principal payments in 2002 as provided for by the restructured facility. The deferred principal was completely repaid during 2003 and all scheduled 2003 and 2004 payments were made. Amounts outstanding under the project financing were $653.1 million$566 and $653 at December 31, 2005 and 2004.
The project financing facility is non-recourse to Newmont and substantially all of Batu Hijau’s assets are pledged as collateral. The carrying value of the property, plant and mine development was $1,518.6 million$1,449 and $1,519 at December 31, 2004.2005 and 2004, respectively. Under the terms of the project financing facility, PTNNT maintains an escrow account for the next interest and principal installment due. Such amount totaled $58.3 million$62 and $58 at December 31, 2005 and 2004, respectively, and was included inOther long-term assets. The facility contains certain covenants that limit indebtedness and restricted payments to partners, among others. In addition, PTNNT must maintain certain financial ratios. At December 31, 2004,2005, PTNNT was in compliance with these covenants.
The interest rate wasis based on blended fixed and floating rates and at current market rates on December 31, 2004,2005, the weighted average interest rate approximated the London InterBank Offering Rate (“LIBOR”) plus 2.3%2.1%. The weighted average interest rates were 5.1%5.7%, 5.1% and 4.7% during 2005, 2004 and 5.0% during 2004, 2003, and 2002, respectively, and the interest rates were 5.2%6.5% and 4.7%5.2% at December 31, 20042005 and 2003,2004, respectively. The fair market value cannot be practicably determined due to the lack of available market information for this type of debt.
NEWMONT MINING CORPORATION
NOTES TO CONSOLIDATED FINANCIAL STATEMENTS—(Continued)
PTNNT Partner Loans
PTNNT has shareholder subordinated loan agreements (“Sponsor Loans”) with Newmont Indonesia Limited (“NIL”), a wholly-owned subsidiary of Newmont, and Nusa Tenggara Mining Corporation (“NTMC”) with substantially the same terms for each shareholder. Total principal outstanding under these Sponsor Loans was approximately $120.7 million and $248.6 million as of December 31, 2004 and 2003, respectively. Of this amount, 43.75% or approximately $52.8 million and $108.8 million at December 31, 2004 and 2003, respectively, was due to NTMC, an unrelated third-party, and is non-recourse to Newmont, with the remainder payable to a subsidiary consolidated by Newmont. Payments of $56.0 million were made to NTMC during 2004. Borrowings under the Sponsor Loans are guaranteed by NTP and are payable on demand, subject to the Senior Debt subordination terms. Through December 31, 2003, the interest rate was based on the annual Singapore InterBank Offering Rate (“SIBOR”) and the interest rate on any unpaid interest was based on the annual SIBOR rate plus 1%. Effective January 1, 2004, the Sponsor Loans were amended such that the annual interest rates are based on SIBOR rate plus 3% for principal and SIBOR rate plus 4% for any unpaid accrued interest. The weighted average interest rate and the rate at December 31, 2004 were 4.5% and 5.7%, respectively. The fair market value cannot be practicably determined due to the lack of available market information for this type of debt.
Newmont and its partner provide a contingent support line of credit to PTNNT. No funding was required in 2004. Available additional support from NTP’s partners was $65.0 million, of which Newmont’s pro-rata share was $36.6 million, at December 31, 2004.
NYOL 8 7/8% Notes
During May 2003, Newmont, through an indirect, wholly-owned subsidiary, Yandal Bond Company Limited (“YBCL”), made an offer to acquire all of NYOL’s outstanding 8 7/8% Senior Notes due 2008. These Notes were subsequently extinguished in connection with the Voluntary Administration of NYOL.
This transaction gave rise to againof $114.0 million, net of transaction costs, for the year ended December 31, 2003. Total cash payments to extinguish the NYOL bonds (including costs) was $98.5 million during the year ended December 31, 2003.
Project Financings
Yanacocha
$100 million Credit Facility. In December 1999, Yanacocha entered into a $100.0 million$100 credit facility (a $20 million A Tranche and an $80 million B Tranche) with the International Finance Corporation (“IFC”). At December 31, 2004, $30 million was outstanding in total with $10 million outstanding under the A Tranche and $20 million outstanding under the B Tranche. The A
NEWMONT MINING CORPORATION
NOTES TO CONSOLIDATED FINANCIAL STATEMENTS—(Continued)
(dollars in millions, except per share, per ounce and per pound amounts)
Tranche had a five-year revolving availability period and converted into a five-year term loan in December 2004. The B Tranche had a three-year revolving availability period that converted to a four-year term loan in December 2002. Initial drawdowns under the loan were used for development of the La Quinua project; however, the loan accommodated repayments during the revolving availability period and subsequent borrowings were used for other purposes. Interest applicable to the A Tranche iswas based on LIBOR plus 2.375%. Interest applicable to the B Tranche iswas based on LIBOR plus 2.5%. Certain Yanacocha assets collaterizecollaterized the loans.
The A Tranche interest rate was 4.9% and 3.5% at In December 31, 2004 and 2003, respectively. The weighted-average rate was 3.8% and 4.3% for 2004 and 2003, respectively. The B Tranche interest rate was
NEWMONT MINING CORPORATION
NOTES TO CONSOLIDATED FINANCIAL STATEMENTS—(Continued)
5.0% and 3.4% at December 31, 2004 and 2003, respectively. The weighted-average rate was 4.0% and 3.7% for 2004 and 2003, respectively. The outstanding amount under this credit line was $30.0 million and $40.0 million at December 31, 2004 and 2003, respectively. Using prevailing interest rates on similar instruments,2005, Yanacocha prepaid both Tranches of the estimated fair value of this debt approximated the carrying value at December 31, 2004 and 2003.
loan.
$50 million Credit Facility. In June 2004, Yanacocha amended its $40 million line of credit with Banco de Credito del Peru to extend the term of the facility to June 2007, reduce the applicable interest rate and increase the facility to $50 million.$50. The interest rate is LIBOR plus 0.65% through June 2005 and LIBOR plus 2% thereafter. The interest rate under the previous agreement was LIBOR plus 0.75% through June 2004. The weighted-average interest rate was 2.8% for 2002. During 2004, Yanacocha borrowed $35.5 million and repaid $35.5 million of the total line of credit. There were no outstanding amounts under this credit line at December 31, 2004 and 2003.
Trust Certificates. Yanacocha issued debt in 1999 through the sale of $100.0 million 8.4% Series A Trust Certificates to various institutional investors. In June 2004, the Trust Certificates were paid in full. At December 31, 2003, $16.0 million was outstanding under the financing. Interest on the Certificates was fixed at 8.4% and repayments occurred quarterly through June 2004. The Certificates were collateralized by certain of Yanacocha assets, certain restricted funds and also were specifically collateralized by future gold sales, through a trust agreement with the Bank of New York.
$20 million Credit Facility. In June 2004, Yanacocha entered into a $20 million credit facility with BBV Banco Continental that expires in June 2005. The interest rate is LIBOR plus 0.7%. There was no outstanding balance at December 31, 2005 and 2004. During 2004, Yanacocha borrowed $36 and repaid $36 of the yeartotal line of credit. During 2005, no amounts were borrowed under this revolving line of credit.
All Yanacocha debt is non-recourse to$20 Credit Facility. In June 2005, the Company$20 credit facility with BBVA Banco Continental expired and the $100 million Credit Facility is collateralized by substantially all of Yanacocha’s operating property, plant and mine development; see above for specific collateral on the Trust Certificates. The carrying value of the property, plant and mine development was $851.9 million and $762.7 millionnot renewed. There was no outstanding balance at December 31, 20042005 and 2003, respectively. Under2004. No amounts were borrowed under this revolving line of credit during either year.
Proposed Financing. On December 19, 2005, Yanacocha filed with the terms ofPeruvian securities regulatory authority (CONASEV), for its review and approval, a prospectus to register a $200 bond program in the Trust Certificates loan,Peruvian public market. When approved, the registration would make the bond program available for Yanacocha maintained an escrow accountto make up to $200 in issuances over a two-year period. Yanacocha also intends to obtain funds from other sources, including commercial banks. Any funds generated from the bond program or other debt facilities may be used by Yanacocha for the next interestcapital expenditures and principal installment due. Such amount totaled $16.7 million as of December 31, 2003. The escrow account amount was included inOther current assets.its general corporate purposes.
Zarafshan-NewmontZarafshan—Newmont
In December 2000, Zarafshan-Newmont entered into a $30.0 million$30 loan with the European Bank for Reconstruction and Development (“EBRD”), of which $15.0 million$15 was Newmont’s share, primarily for capital expansion. Newmont’s portion of the outstanding amount on this loan was $11.0 million$11 and $13.1 million$11 at December 31, 20042005 and 2003,2004, respectively. The interest rate is based on the three-month LIBOR plus 3.25%. The interest rate was 5.3%7.4% and 4.4%5.3% at December 31, 20042005 and 20032004 and the weighted-average interest rate was 6.2% and 4.6% for 2005 and 4.7% for 2004, and 2003, respectively. Using prevailing interest rates on similar instruments, the estimated fair value of this debt approximated the carrying value at December 31, 20042005 and 2003.2004. In July 2004, Zarafshan-Newmont entered into a supplemental agreement with the EBRD that provided for the loan facility to be repaid in 13 semi-annual payments, beginning July 2004 and ending July 2010, the first five to be made at $0.5 million and the remainder at $2.5 million.2010. In addition, the minimum balance of the escrow account requirement was increased to $3.75 million$4 to ensure the timely payments of principal and interest.
The assets of Zarafshan-Newmont collateralized the loan (with carrying values of approximately $205.7 million$222 and $193.7 million$206 at December 31, 2005 and 2004, and 2003, respectively)., collateralize the loan. In addition, the Company has
NEWMONT MINING CORPORATION
NOTES TO CONSOLIDATED FINANCIAL STATEMENTS—(Continued)
guaranteed 50% of the loansloan and the Uzbek partners have guaranteed the other 50%. Under the terms of the EBRD facility, certain payments, including payment of any distribution of capital or disbursement of funds not directly related to expenses of the project, are not permitted unless certain conditions and financial ratios are met.
Corporate Revolving Credit Facilities
Through July 29, 2004, the Company had three uncollateralized revolving credit facilities with a consortium of banks: a $200 million U.S. dollar-denominated revolving credit facility with an initial term of 364 days that was permitted to be extended annually to no later than October 2006; a $400 million multi-currency revolving credit facility that matured in October 2006 and provided for borrowing in U.S., Canadian and Australian dollars, and which also contained a letter of credit sub-facility; and a $150 million multi-currency revolving credit facility that was to mature in May 2005 and provided for borrowing in U.S. and Australian dollars. Interest rates and facility fees varied based on the credit ratings of the Company’s senior, uncollateralized, long-term debt. Borrowings under the facilities bore interest at a rate per annum equal to either the LIBOR plus a margin ranging from 0.45% to 1.25% or the greater of the federal funds rate plus 0.5% or the lead bank’s prime rate plus a margin ranging from 0% to 0.25%. Facility fees were accrued at a rate per annum ranging from 0.10% to 0.40% of the commitment.
Effective July 30, 2004, the Company entered into a new uncollateralized $1.25 billion$1,250 revolving credit facility with a syndicate of commercial banks. This new revolving credit facility replaced the three existing revolving credit
NEWMONT MINING CORPORATION
NOTES TO CONSOLIDATED FINANCIAL STATEMENTS—(Continued)
(dollars in millions, except per share, per ounce and per pound amounts)
facilities which were cancelled upon the effectiveness of the new facility. The new facility provides for borrowings in U.S. dollars and contains a letter of credit sub-facility. The newIn July 2005, the Company amended its revolving credit facility, maturesextending the final maturity one year, to July 30, 2009.28, 2010. In addition, certain adjustments to pricing and structure were also made. Interest rates and facility fees vary based on the credit ratings of the Company’s senior, uncollateralized, long-term debt. Borrowings under the facilities bear interest at a rate per annum equal to either LIBOR plus a margin ranging from 0.285%0.22% to 1.150%1.00% or the greater of the federal funds rate plus 0.5% or the lead bank’s prime rate plus, in each case, a margin ranging from 0% to 0.150%.prime. Facility fees accrue at a rate per annum ranging from 0.090%0.080% to 0.350%0.250% of the aggregate commitments. The Company also pays a utilization fee of 0.125%0.10% on the amount of revolving credit loans and letters of credit outstanding under the facility for each day on which the sum of such loans and letters of credit exceed 50% of the commitments under the facility. Letters of credit issued under the prior credit facilities’ letter of credit sub-facility were transferred to and remain outstanding under the new facility’s letter of credit sub-facility. At December 31, 2004,2005, the facility fees were 0.125%0.09% of the commitment. There was $187.1 million$275 outstanding under the letter of credit sub-facility as of December 31, 2004.
2005.
Debt Covenants
Certain of Newmont’s current debt facilities contain various common public debt covenants and default provisions including payment defaults, limitation on liens, limitation on sales and leaseback agreements and merger restrictions. These debt instruments include the medium term5 7/8% notes, Newmont Australia 7 5/8% notes, 8 5/8% debentures, 8 3/8% debentures and the sale-leaseback of the refractory ore treatment plant. None of the aforementioned public debt instruments contain financial ratio covenants or credit rating provisions that could be anticipated to create liquidity issues for the Company.
In addition to the covenants noted above, the corporate revolving credit facility contains financial ratio covenants requiring the Company to maintain a net debt to EBITDA (earnings before interest expense, income taxes, depreciation and amortization) ratio of less than or equal to 4.0 and a net debt (total debt net of cash) to total capitalization ratio of less than or equal to 62.5%. Furthermore, the corporate revolving credit facility contains covenants limiting the sale of all or substantially all of the Company’s assets, certain change of control provisions and a negative pledge on certain assets.
NEWMONT MINING CORPORATION
NOTES TO CONSOLIDATED FINANCIAL STATEMENTS—(Continued)
Certain of the Company’s project debt facilities contain various common project debt covenants and default provisions including limitations on dividends subject to certain debt service cover ratios, limitations on sales of assets, negative pledges on certain assets, change of control provisions and limitations of additional permitted debt.
At December 31, 2004,2005, the Company and its subsidiariesrelated entities were in compliance with all debt covenants and default provisions in all material respects.
provisions.
NOTE 12 EMPLOYEE PENSION AND OTHER BENEFIT PLANS10 EMPLOYEE-RELATED BENEFITS
| At December 31, | ||||||
| 2005 | 2004 | |||||
Current: | ||||||
Employee pension benefits | $ | 30 | $ | 7 | ||
Accrued payroll and withholding taxes | 81 | 82 | ||||
Workers’ participation | 40 | 29 | ||||
Accrued severance | 3 | 5 | ||||
Other employee-related payables | 22 | 6 | ||||
| $ | 176 | $ | 129 | |||
| �� | ||||||
NEWMONT MINING CORPORATION
NOTES TO CONSOLIDATED FINANCIAL STATEMENTS—(Continued)
(dollars in millions, except per share, per ounce and per pound amounts)
| At December 31, | ||||||
| 2005 | 2004 | |||||
Long-term: | ||||||
Employee pension benefits | $ | 96 | $ | 72 | ||
Other post-retirement benefit plans | 94 | 88 | ||||
Workers’ participation | 19 | 23 | ||||
Accrued severance | 27 | 26 | ||||
Other employee-related payables | 37 | 35 | ||||
| $ | 273 | $ | 244 | |||
Pension Plans
The Company’s pension plans include: (1) two qualified non-contributory defined benefit plans (for salaried employees and substantially all domestic hourly union employees); (2) one non-qualified plan (for salaried employees whose benefits under the qualified plan are limited by federal legislation); (3) two qualified plans for salaried and hourly Canadian employees and (4) a non-qualified international plan (for select employees who are not eligible to participate in the U.S.-based plans because of citizenship). The vesting period for plans identified in (1) and (2) is five years of service. These plans’ benefit formulas are based on an employee’s years of credited service and either (i) such employee’s highest consecutive five years average pay (salaried plan) or (ii) a flat dollar amount adjusted by a service-weighted multiplier (hourly plan). The Canadian plans are fully vestedplan provides for full vesting of benefits upon remittance and the benefit formula is based on a percentage of annual pay. The international retirement plan’s basic and savings accounts have a graded vesting schedule and are fully vested after four years of service. The international retirement plan’s supplemental account is vested after attaining age 55 with 10 years of service or attaining age 62. The plan’s benefit formula is based on a percentage of compensation as defined in the plan document.
Pension costs are determined annually by independent actuaries and pension contributions to the qualified plans are made based on funding standards established under the Employee Retirement Income Security Act of 1974.
Other Benefit Plans
The Company provides defined medical benefits to qualified retirees (and to their eligible dependents) who were salaried employees and defined life insurance benefits to selected qualified U.S. and Canadian retirees who were(generally salaried employees.employees and to a limited extent their eligible dependents). In general, participants become eligible for these benefits upon retirement directly from the Company if they are at least 55 years old and, for U.S. employees, the combination of their age and years of service with the Company equals 75 or more. This benefit is no longernot provided to employees who joined the Company after January 1, 2003. The Company provides defined medical benefits to retirees (and their eligible dependents) who were Canadian salaried employees at the Golden Giant, Holloway and the closed Silidor mines, or Canadian hourly employees at the Holloway and the closed Silidor mines, and defined benefit life insurance benefits to retirees who were Canadian salaried and hourly employees at the Golden Giant and Holloway mines. Employees become eligible for these benefits upon retirement from the Company on or after age 55. Retirees receive medical benefits until they reach age 65.
Defined medical benefits cover most of the reasonable and customary charges for hospital, surgical, diagnostic and physician services and prescription drugs. Life insurance benefits are based on a percentage of final base annual salary and decline over time after retirement commences. The majority of the costs of these medical and life insurance benefits are paid by the Company. In 2003, the Company began a strategy to more equitably share costs with retirees; by 2008, 75% of retiree medical coverage cost will be paid by the Company. Qualified retirees that become eligible after January 1, 2003 may be required to contribute additional amounts to the medical coverage.
NEWMONT MINING CORPORATION
NOTES TO CONSOLIDATED FINANCIAL STATEMENTS—(Continued)
(dollars in millions, except per share, per ounce and per pound amounts)
The following tables provide a reconciliation of changes in the plans’ benefit obligations and assets’ fair values for the two-year period ended December 31, 2004,2005, and a statement of the funded status as of December 31, 20042005 and 2003 (in thousands):2004:
| Pension Benefits | Other Benefits | |||||||||||||||
| 2004 | 2003 | 2004 | 2003 | |||||||||||||
Change in Benefit Obligation: | ||||||||||||||||
Benefit obligation at beginning of year | $ | 289,034 | $ | 251,430 | $ | 69,094 | $ | 69,013 | ||||||||
Service cost-benefits earned during the year | 11,142 | 9,389 | 3,337 | 2,981 | ||||||||||||
Interest cost | 17,659 | 16,520 | 3,893 | 3,752 | ||||||||||||
Amendments | 1,377 | — | — | (10,243 | ) | |||||||||||
Actuarial loss | 29,616 | 24,220 | 7,842 | 5,762 | ||||||||||||
Foreign currency exchange loss | 77 | 179 | 168 | 332 | ||||||||||||
Settlement payments | — | — | — | — | ||||||||||||
Benefits paid | (11,999 | ) | (12,704 | ) | (2,194 | ) | (2,503 | ) | ||||||||
Benefit obligation at end of year | $ | 336,906 | $ | 289,034 | $ | 82,140 | $ | 69,094 | ||||||||
Accumulated Benefit Obligation | $ | 295,773 | $ | 250,962 | N/A | N/A | ||||||||||
Change in Fair Value of Assets: | ||||||||||||||||
Fair value of assets at beginning of year | $ | 171,665 | $ | 131,267 | $ | — | $ | — | ||||||||
Actual return (loss) on plan assets | 19,258 | 29,365 | — | — | ||||||||||||
Employer contributions | 37,504 | 22,390 | 2,194 | 2,503 | ||||||||||||
Foreign currency exchange gain | 445 | 1,347 | — | — | ||||||||||||
Settlement payments | — | — | — | — | ||||||||||||
Benefits paid | (11,999 | ) | (12,704 | ) | (2,194 | ) | (2,503 | ) | ||||||||
Fair value of assets at end of year | $ | 216,873 | $ | 171,665 | $ | — | $ | — | ||||||||
Funded status | $ | (120,033 | ) | $ | (117,369 | ) | $ | (82,140 | ) | $ | (69,094 | ) | ||||
Unrecognized prior service cost | 8,384 | 7,791 | (8,034 | ) | (8,595 | ) | ||||||||||
Unrecognized net loss (gain) | 104,006 | 84,663 | 1,700 | (6,531 | ) | |||||||||||
Unrecognized net asset | (18 | ) | (24 | ) | — | — | ||||||||||
Accrued cost | $ | (7,661 | ) | $ | (24,939 | ) | $ | (88,474 | ) | $ | (84,220 | ) | ||||
| Pension Benefits | Other Benefits | |||||||||||||||
| 2005 | 2004 | 2005 | 2004 | |||||||||||||
Change in Benefit Obligation: | ||||||||||||||||
Benefit obligation at beginning of year | $ | 337 | $ | 289 | $ | 82 | $ | 69 | ||||||||
Service cost-benefits earned during the year | 13 | 11 | 5 | 3 | ||||||||||||
Interest cost | 19 | 18 | 5 | 4 | ||||||||||||
Amendments | 5 | 1 | — | — | ||||||||||||
Actuarial loss (gain) | 43 | 30 | (3 | ) | 8 | |||||||||||
Foreign currency exchange loss | — | — | — | — | ||||||||||||
Settlement payments | 4 | — | — | — | ||||||||||||
Benefits paid | (19 | ) | (12 | ) | (3 | ) | (2 | ) | ||||||||
Benefit obligation at end of year | $ | 402 | $ | 337 | $ | 86 | $ | 82 | ||||||||
Accumulated Benefit Obligation | $ | 354 | $ | 296 | N/A | N/A | ||||||||||
Change in Fair Value of Assets: | ||||||||||||||||
Fair value of assets at beginning of year | $ | 217 | $ | 172 | $ | — | $ | — | ||||||||
Actual return on plan assets | 17 | 19 | — | — | ||||||||||||
Employer contributions | 12 | 38 | 3 | 2 | ||||||||||||
Foreign currency exchange gain | — | — | — | — | ||||||||||||
Settlement payments | — | — | — | — | ||||||||||||
Benefits paid | (19 | ) | (12 | ) | (3 | ) | (2 | ) | ||||||||
Fair value of assets at end of year | $ | 227 | $ | 217 | $ | — | $ | — | ||||||||
Under funded status | $ | (175 | ) | $ | (120 | ) | $ | (86 | ) | $ | (82 | ) | ||||
Unrecognized prior service cost | 12 | 8 | (7 | ) | (8 | ) | ||||||||||
Unrecognized net loss (gain) | 139 | 104 | (1 | ) | 2 | |||||||||||
Unrecognized net asset | — | — | — | — | ||||||||||||
Accrued cost | $ | (24 | ) | $ | (8 | ) | $ | (94 | ) | $ | (88 | ) | ||||
The Company’s qualified pension plans are funded with cash contributions in compliance with Internal Revenue Service (“IRS”) rules and regulations. The Company’s non-qualified and other benefit plans are currently not funded, but exist as general corporate obligations. The information contained in the above tables indicates the combined funded status of qualified and non-qualified plans, in accordance with accounting pronouncements. Assumptions used for IRS purposes differ from those used for accounting purposes. The funded status shown above compares the projected benefit obligation (“PBO”) of all plans, which is an actuarial present value of obligations that takes into account assumptions as to future compensation levels of plan participants, to the fair value of the assets held in trust for the qualified plans. Accounting pronouncements also prescribe a computation for the plans’ accumulated benefit obligation (“ABO”), which is an actuarial present value of benefits (whether vested or nonvested) attributed to employees based on employee service and compensation prior to the end of the period presented. The Company expectsis currently planning to contribute approximately $10.0 millionat a minimum, $30, to its retirement benefit programs in 2006. However, during 2005.the course of the year, consideration may be given to making additional contributions toward the Company’s retirement benefit programs depending on various factors, including changes to regulations governing the funding of pensions, the Company’s business and operating environment and forecasted cash flows.
NEWMONT MINING CORPORATION
NOTES TO CONSOLIDATED FINANCIAL STATEMENTS—(Continued)
(dollars in millions, except per share, per ounce and per pound amounts)
The following plans have an ABO in excess of the market value of plan assets (in millions):assets:
| 2004 | 2003 | |||||||||||||||||
| PBO | ABO | Market value of plan assets | PBO | ABO | Market value of plan assets | |||||||||||||
Qualified plan—salaried employees | $ | 267.9 | $ | 231.2 | $ | 187.3 | $ | 230.0 | $ | 199.2 | $ | 146.3 | ||||||
Non-qualified plan—salaried employees | $ | 30.0 | $ | 27.2 | — | $ | 30.2 | $ | 23.8 | — | ||||||||
Qualified plan—hourly employees | $ | 33.3 | $ | 32.3 | $ | 23.1 | $ | 24.7 | $ | 23.9 | $ | 18.1 | ||||||
Non-qualified plan—international | $ | 4.6 | $ | 4.0 | — | $ | 3.2 | $ | 3.1 | — | ||||||||
| 2005 | 2004 | |||||||||||||||||
| PBO | ABO | Market value of plan assets | PBO | ABO | Market value of plan assets | |||||||||||||
Qualified plan—salaried employees | $ | 309 | $ | 266 | $ | 197 | $ | 268 | $ | 231 | $ | 187 | ||||||
Non-qualified plan—salaried employees | 45 | 42 | — | 30 | 27 | — | ||||||||||||
Qualified plan—hourly employees | 40 | 39 | 26 | 33 | 33 | 23 | ||||||||||||
Non-qualified plan—international | 7 | 6 | — | 5 | 4 | — | ||||||||||||
Qualified and non-qualified plans—Canadian | 1 | 1 | 4 | 1 | 1 | 7 | ||||||||||||
| $ | 402 | $ | 354 | $ | 227 | $ | 337 | $ | 296 | $ | 217 | |||||||
The following table provides the net amounts recognized in the consolidated balance sheets as of December 31:
| Pension Benefits | Other Benefits | |||||||||||||||
| 2004 | 2003 | 2004 | 2003 | |||||||||||||
| (in thousands) | (in thousands) | |||||||||||||||
Amounts recognized in the consolidated balance sheets: | ||||||||||||||||
Accrued benefit cost | $ | (78,898 | ) | $ | (79,295 | ) | $ | (88,474 | ) | $ | (84,220 | ) | ||||
Intangible asset | 8,384 | 7,791 | — | — | ||||||||||||
Accumulated other comprehensive income | 62,853 | 46,565 | — | — | ||||||||||||
Net amount recognized | $ | (7,661 | ) | $ | (24,939 | ) | $ | (88,474 | ) | $ | (84,220 | ) | ||||
| Pension Benefits | Other Benefits | |||||||||||||||
| 2005 | 2004 | 2005 | 2004 | |||||||||||||
Accrued benefit cost | $ | (126 | ) | $ | (79 | ) | $ | (94 | ) | $ | (88 | ) | ||||
Intangible asset | 12 | 8 | — | — | ||||||||||||
Accumulated other comprehensive income | 90 | 63 | — | — | ||||||||||||
| $ | (24 | ) | $ | (8 | ) | $ | (94 | ) | $ | (88 | ) | |||||
In 2004, an adjustment was required to reflect an increased liability of $3.3 million$3 for the hourly pension plans. This was the result of a one-time, one-year increase to benefits applicable to participants with a specified combination of age and years of service. In 2004, an adjustment was required to reflect a decreased liability of $1.9 million$2 for the non-qualified plans. This was the result of a change to the components of eligible compensation.
In accordance with the provisions of SFAS No. 87, “Employers’ Accounting for Pensions,” an adjustment was required to reflect a minimum liability for the non-qualified pension plan in 2003 and 2002, one of the qualified salary plans in 2003 and 2002, and one of the hourly pension plans and the international plan in 2003 and 2002. As a result of such adjustment, an intangible asset was recorded, and (to the extent the minimum liability adjustment exceeded the unrecognized net transition liability), gains (losses) were recorded inOther comprehensive income (loss),net of tax of $0.4 million and $(28.7) million (net of related deferred income tax benefits) for the years ended December 31, 2003 and 2002, respectively.
NEWMONT MINING CORPORATION
NOTES TO CONSOLIDATED FINANCIAL STATEMENTS—(Continued)
The following table provides the components of the net periodic pension benefit cost for the indicated fiscal years:years ended December 31:
| Pension Benefits | Other Benefits | |||||||||||||||||||||||
| 2004 | 2003 | 2002 | 2004 | 2003 | 2002 | |||||||||||||||||||
| (in thousands) | (in thousands) | |||||||||||||||||||||||
Components of net periodic pension benefit cost: | ||||||||||||||||||||||||
Service cost | $ | 11,142 | $ | 9,389 | $ | 8,307 | $ | 3,337 | $ | 2,981 | $ | 2,720 | ||||||||||||
Interest cost | 17,659 | 16,520 | 15,845 | 3,893 | 3,752 | 4,161 | ||||||||||||||||||
Expected return on plan assets | (13,501 | ) | (12,062 | ) | (14,427 | ) | — | — | — | |||||||||||||||
Amortization of prior service cost | 785 | 844 | 1,042 | (561 | ) | (431 | ) | 3,222 | ||||||||||||||||
Amortization of loss (gain) | 4,376 | 2,285 | 627 | (405 | ) | (797 | ) | (927 | ) | |||||||||||||||
Amortization of net obligation (asset) | 48 | (6 | ) | (90 | ) | — | — | — | ||||||||||||||||
Settlements | — | — | 2,135 | — | — | — | ||||||||||||||||||
Benefit enhancement for early retirement | 69 | — | — | — | — | — | ||||||||||||||||||
Total net periodic pension benefit cost | $ | 20,578 | $ | 16,970 | $ | 13,439 | $ | 6,264 | $ | 5,505 | $ | 9,176 | ||||||||||||
| Pension Benefits | Other Benefits | |||||||||||||||||||||||
| 2005 | 2004 | 2003 | 2005 | 2004 | 2003 | |||||||||||||||||||
Service cost | $ | 13 | $ | 11 | $ | 9 | $ | 5 | $ | 3 | $ | 3 | ||||||||||||
Interest cost | 19 | 18 | 17 | 5 | 4 | 4 | ||||||||||||||||||
Expected return on plan assets | (15 | ) | (13 | ) | (12 | ) | — | — | — | |||||||||||||||
Amortization of prior service cost | 1 | 1 | 1 | (1 | ) | (1 | ) | — | ||||||||||||||||
Amortization of loss (gain) | 6 | 4 | 2 | — | — | (1 | ) | |||||||||||||||||
Settlements | 4 | — | — | — | — | — | ||||||||||||||||||
| $ | 28 | $ | 21 | $ | 17 | $ | 9 | $ | 6 | $ | 6 | |||||||||||||
For the pension plans, prior-service costs are amortized on a straight-line basis over the average remaining service period of active participants. Gains and losses in excess of 10% of the greater of the benefit obligation or the market-related value of assets are amortized over the average remaining service period of active participants. Pension and postretirement benefits are accrued during an employee’s service to the Company.
During 2003, amendments were made to the post-retirement medical plan resulting in a $10.2 million reduction to the obligation at December 31, 2003. Newmont has adopted a five-year strategy that will increase retirees’ monthly contributions for Plan coverage. The goal is to provide a competitive and equitable Retiree Medical Plan in which Newmont will bear the majority of the cost. To meet this objective, retirees must pay a higher percentage of the cost of their coverage than they currently do. However, the plan is to phase in this change over a period of five years so that retirees’ total monthly contributions cover 25% of the Plan’s costs by the year 2008. In addition, the monthly contributions paid by future retirees who are salaried employees who were under age 50 on January 1, 2003 and who have an adjusted hire date before January 1, 2003 will vary depending upon their years of service at the time of their retirement from Newmont. Employees hired after January 1, 2003 will no longer be eligible for post-retirement medical benefits.
Significant assumptions as of December 31 were as follows:
| Pension Benefits | Other Benefits | |||||||||||
| 2004 | 2003 | 2004 | 2003 | |||||||||
Weighted-average assumptions used in measuring the Company’s benefit obligation: | ||||||||||||
Discount rate | 5.75 | % | 6.25 | % | 5.75 | % | 6.25 | % | ||||
Rate of compensation increase | 4.00 | % | 4.00 | % | 4.00 | % | 4.00 | % | ||||
| Pension Benefits | Other Benefits | |||||||||||||||||
| 2004 | 2003 | 2002 | 2004 | 2003 | 2002 | |||||||||||||
Weighted-average assumptions used in measuring the net periodic pension benefit cost: | ||||||||||||||||||
Discount rate | 6.25 | % | 6.75 | % | 7.25 | % | 6.25 | % | 6.75 | % | 7.25 | % | ||||||
Expected return on plan assets | 8.00 | % | 8.00 | % | 9.25 | % | N/A | N/A | N/A | |||||||||
Rate of compensation increase | 4.00 | % | 4.00 | % | 4.00 | % | 4.00 | % | 4.00 | % | 4.00 | % | ||||||
NEWMONT MINING CORPORATION
NOTES TO CONSOLIDATED FINANCIAL STATEMENTS—(Continued)
(dollars in millions, except per share, per ounce and per pound amounts)
In 2003, Newmont made a
Significant assumptions were as follows:
| Pension Benefits | Other Benefits | |||||||||||
| As of December 31, | As of December 31, | |||||||||||
| 2005 | 2004 | 2005 | 2004 | |||||||||
Weighted-average assumptions used in measuring the Company’s benefit obligation: | ||||||||||||
Discount rate | 5.75 | % | 5.75 | % | 5.75 | % | 5.75 | % | ||||
Rate of compensation increase | 4.00 | % | 4.00 | % | 4.00 | % | 4.00 | % | ||||
| Pension Benefits | Other Benefits | |||||||||||||||||
| Years Ended December 31, | Years Ended December 31, | |||||||||||||||||
| 2005 | 2004 | 2003 | 2005 | 2004 | 2003 | |||||||||||||
Weighted-average assumptions used in measuring the net periodic pension benefit cost: | ||||||||||||||||||
Discount long-term rate | 5.75 | % | 6.25 | % | 6.75 | % | 5.75 | % | 6.25 | % | 6.75 | % | ||||||
Expected return on plan assets | 8.00 | % | 8.00 | % | 8.00 | % | N/A | N/A | N/A | |||||||||
Rate of compensation increase | 4.00 | % | 4.00 | % | 4.00 | % | 4.00 | % | 4.00 | % | 4.00 | % | ||||||
The 2003-2005 decision to use 8% as the expected long-term return on plan assets for fiscal year 2003 and continued to use 8% for 2004 and 2005. This decision was based on an analysis of the actual plan asset returns over multiple time horizons and review of assumptions used by other U.S. corporations with defined benefit plans of similar size and investment strategy as Newmont.strategy. The average actual return on plan assets during the 1617 years ended December 31, 20042005 approximated 10%.
The pension plan employs twoseveral independent multi-product investment firms which invest the assets of the plan in certain approved funds that correspond to the specific asset classes andwith associated target allocations designated by the board of directors of the Company.allocations. Depending upon actual sector performance, the assets in the plan are periodically rebalanced to match the established target levels for the asset classes. This rebalancing may be accomplished through actual transfer of funds between asset classes and managers, or through targeted cash contributions and/or distributions. The goal of the pension fund investment program is to achieve expected rates of return consistent with the investment risk associated with the approved investment portfolio. The investment performance of the plan and that of the individual investment firms is measured against recognized market indices. This performance is monitored by an investment committee comprised of members of the Company’s management, which is advised by an independent investment consultant. The performance of the plan is reviewed annually with the Audit Committee of the Company’s board of directors. The following is a summary of the target asset allocations for 20042005 and the actual asset allocation for 2004.2005.
| Target | Actual at December 31, 2005 | |||||||||||
Asset Allocation | Target | Actual at December 31, 2004 | ||||||||||
U.S. equity investments | 45 | % | 46 | % | 45 | % | 44 | % | ||||
International equity investments | 20 | % | 21 | % | 20 | % | 22 | % | ||||
Fixed income investments | 35 | % | 33 | % | 35 | % | 34 | % | ||||
NEWMONT MINING CORPORATION
NOTES TO CONSOLIDATED FINANCIAL STATEMENTS—(Continued)
(dollars in millions, except per share, per ounce and per pound amounts)
The assumed health care cost trend rate to measure the expected cost of benefits was 12% for 2005, 11% for 2006, 10% for 2007, 9% for 2008, 8% for 2009, 7% for 2010, 6% for 2011 and 5% each year thereafter. Assumed health care cost trend rates have a significant effect on amounts reported for the health care plans. A 1%one-percentage-point change in assumed health care cost trend rates would have the following effects (in thousands):effects:
| 1% Increase | 1% Decrease | One-percentage- point Increase | One-percentage- point Decrease | |||||||||||
Effect on total of service and interest cost components of net periodic postretirement health care benefit cost | $ | 1,900 | $ | (1,500 | ) | $ | 2 | $ | (1 | ) | ||||
Effect on the health care component of the accumulated postretirement benefit obligation | $ | 15,400 | $ | (12,000 | ) | $ | 14 | $ | (11 | ) | ||||
Cash flows
Benefit payments expected to be paid to plan participants are as follows:
| Pension Benefits | Other Benefit Plans | |||||
2006 | $ | 13 | $ | 3 | ||
2007 | 32 | 3 | ||||
2008 | 14 | 3 | ||||
2009 | 18 | 3 | ||||
2010 | 21 | 4 | ||||
2011 through 2015 | 116 | 22 | ||||
| $ | 214 | $ | 38 | |||
Savings Plans
The Company has two qualified defined contribution savings plans, one that covers salaried and non-union hourly employees and one that covers substantially all hourly union employees. In addition, the Company has one non-qualified supplemental savings plan for salaried employees whose benefits under the qualified plan are limited by federal regulations. When an employee meets eligibility requirements, the Company matches 100% of employee contributions of up to 6% and 5% of base salary for the salaried (including non-union hourly employees) and hourly plans, respectively. Matching contributions are made with Newmont stock; however, no holding restrictions are placed on such contributions, which totaled $8.7 million$10 in 2005, $9 in 2004 and $8.2 million$8 in 2003 and 2002.
NEWMONT MINING CORPORATION
NOTES TO CONSOLIDATED FINANCIAL STATEMENTS—(Continued)
Cash flows
The Company expects to contribute approximately $10 million to its pension plans in 2005. Benefit payments expected to be paid to plan participants are as follows (in millions):
Pension Benefits | Other Benefit Plans | |||||
2005 | $ | 12.4 | $ | 2.8 | ||
2006 | 12.6 | 2.9 | ||||
2007 | 13.3 | 3.0 | ||||
2008 | 13.9 | 3.3 | ||||
2009 | 15.1 | 3.7 | ||||
2010 through 2014 | 91.9 | 27.0 | ||||
| $ | 159.2 | $ | 42.7 | |||
2003.
NOTE 1311 STOCK OPTIONS
Employee Stock Options
The Company currently maintains stock option plansthe 2005 Stock Incentive Plan (“Stock Plan”), approved by stockholders on April 27, 2005, for executives and eligible employees. Under the Company’s stock option plans,this Stock Plan, options to purchase shares of stock can be granted with exercise prices equal to or greaternot less than theat 100% of fair market value of the underlying stock at the date of grant. Fair market value of a share of common stock as of the grant date is the average of the high and low sales prices for a share of the Company’s common stock on the New York Stock Exchange. The optionsCompany also maintains prior stock plans, but no longer grants awards under these plans. Options granted under the Company’s stock plans vest over periods ranging from two to four years and are exercisable over periodsa period of uptime not to ten years. In addition, the Company has a non-employee directors stock plan (the “Directors Plan”) under which non-employee directors were, before 2003, entitled to receive stock options in lieu of other compensation.exceed 10 years from grant date. At December 31, 2004, 12,737,7362005, 18,963,560 shares were available for future grants under the Company’s employee stock plans2005 Stock Incentive Plan.
NEWMONT MINING CORPORATION
NOTES TO CONSOLIDATED FINANCIAL STATEMENTS—(Continued)
(dollars in millions, except per share, per ounce and the Directors Plan. In conjunction with the Directors Plan, 5,592 options were issued and outstanding at December 31, 2004.per pound amounts)
The following table summarizes annual activity for all stock options for each of the three years ended December 31:
| 2004 | 2003 | 2002 | |||||||||||||||||||
| Number of Shares | Weighted Average Exercise Price | Number of Shares | Weighted Average Exercise Price | Number of Shares | Weighted Average Exercise Price | ||||||||||||||||
Outstanding at beginning of year | 10,629,449 | $ | 30.02 | 13,108,428 | $ | 27.43 | 12,314,157 | $ | 27.92 | ||||||||||||
Options assumed from Franco-Nevada | — | $ | — | — | $ | — | 3,215,536 | $ | 16.76 | ||||||||||||
Granted | 2,030,722 | $ | 43.16 | 2,014,600 | $ | 39.92 | 1,798,224 | $ | 26.44 | ||||||||||||
Exercised | (3,053,688 | ) | $ | 24.80 | (4,025,689 | ) | $ | 24.25 | (3,797,332 | ) | $ | 17.73 | |||||||||
Forfeited and expired | (396,569 | ) | $ | 47.77 | (467,890 | ) | $ | 41.38 | (422,157 | ) | $ | 33.62 | |||||||||
Outstanding at end of year | 9,209,914 | $ | 34.11 | 10,629,449 | $ | 30.02 | 13,108,428 | $ | 27.43 | ||||||||||||
Options exercisable at year end | 5,577,335 | $ | 30.51 | 7,245,460 | $ | 28.05 | 10,213,935 | $ | 27.79 | ||||||||||||
Weighted-average fair value of options granted during the year | $ | 14.05 | $ | 17.66 | $ | 12.66 | |||||||||||||||
NEWMONT MINING CORPORATION
NOTES TO CONSOLIDATED FINANCIAL STATEMENTS—(Continued)
| 2005 | 2004 | 2003 | |||||||||||||||||||
| Number of Shares | Weighted Average Exercise Price | Number of Shares | Weighted Average Exercise Price | Number of Shares | Weighted Average Exercise Price | ||||||||||||||||
Outstanding at beginning of year | 9,209,914 | $ | 34.11 | 10,629,449 | $ | 30.02 | 13,108,428 | $ | 27.43 | ||||||||||||
Granted | 2,002,638 | $ | 41.67 | 2,030,722 | $ | 43.16 | 2,014,600 | $ | 39.92 | ||||||||||||
Exercised | (1,517,601 | ) | $ | 44.40 | (3,053,688 | ) | $ | 24.80 | (4,025,689 | ) | $ | 24.25 | |||||||||
Forfeited and expired | (261,282 | ) | $ | 49.40 | (396,569 | ) | $ | 47.77 | (467,890 | ) | $ | 41.38 | |||||||||
Outstanding at end of year | 9,433,669 | $ | 35.90 | 9,209,914 | $ | 34.11 | 10,629,449 | $ | 30.02 | ||||||||||||
Options exercisable at year end | 5,920,180 | $ | 32.58 | 5,577,335 | $ | 30.51 | 7,245,460 | $ | 28.05 | ||||||||||||
Weighted-average fair value of options granted during the year | $ | 14.39 | $ | 14.05 | $ | 17.66 | |||||||||||||||
The following table summarizes information about stock options outstanding at December 31, 2004,2005, with exercise prices equal to the fair market value on the date of grant with no restrictions on exercisability after vesting:
| Options Outstanding | Options Exercisable | |||||||||||
Range of Exercise Prices | Number Outstanding | Weighted- average Remaining Contractual Life (in years) | Weighted- average Exercise Price | Number Exercisable | Weighted Average Exercise Price | |||||||
$10 to $20 | 1,779,976 | 4.3 | $ | 18.47 | 1,779,976 | $ | 18.47 | |||||
$20 to $24 | 1,319,505 | 6.7 | $ | 23.05 | 1,009,871 | $ | 22.95 | |||||
$25 to $29 | 1,737,511 | 6.9 | $ | 28.05 | 1,012,427 | $ | 27.90 | |||||
$30 to $49 | 3,787,943 | 7.9 | $ | 43.87 | 1,190,649 | $ | 42.01 | |||||
$49 to $108 | 584,979 | 1.7 | $ | 61.36 | 584,412 | $ | 61.37 | |||||
$10 to $108 | 9,209,914 | 6.5 | $ | 34.11 | 5,577,335 | $ | 30.51 | |||||
| Options Outstanding | Options Exercisable | |||||||||||
Range of Exercise Prices | Number Outstanding | Weighted- average Remaining Contractual Life (in years) | Weighted- average Exercise Price | Number Exercisable | Weighted Average Exercise Price | |||||||
$0 to $20 | 1,617,656 | 3.4 | $ | 18.58 | 1,617,656 | $ | 18.58 | |||||
$20 to $30 | 2,319,789 | 5.9 | $ | 25.98 | 2,000,581 | $ | 25.80 | |||||
$30 to $40 | 1,252,885 | 7.9 | $ | 37.47 | 226,732 | $ | 34.87 | |||||
$40 to $50 | 3,758,594 | 8.7 | $ | 45.47 | 1,590,466 | $ | 46.76 | |||||
$50+ | 484,745 | 0.8 | $ | 60.77 | 484,745 | $ | 60.77 | |||||
| 9,433,669 | 6.6 | $ | 35.90 | 5,920,180 | $ | 32.58 | ||||||
The Company’s U.S. income taxes payable have been reduced, and the deferred tax assetsadditional paid in capital increased, for the tax benefits associated with the exercise of employee stock options. The Company is entitled to a deduction equal to the excess of the fair market value of the stock issued at the date of exercise over the amount received from the employee (the option exercise price). These tax benefits were credited directly to shareholders’ equity as additional paid in capital and amounted to $19.6 million$nil for 2005, $18 for 2004, $18.3 millionand $19 for 2003, and zero for 2002.2003.
Other Stock-Based Compensation
The Company grants restricted stock to certain employees. Shares of restricted stock are granted upon achievement of certain financial and operating thresholds at fair market value on the grant date. Prior to vesting, these shares of restricted stock are subject to certain restrictions related to ownership and transferability. Holders of restricted stock entitle the holder to vote the shares and to receive any dividends declared on the shares. In 2005, 2004, and 2003, 155,061, 285,155, and 2002, 285,155, 170,019 and 180,368 shares of restricted stock, respectively, were granted and issued, of which 351,944147,861 and 242,116168,320 shares remained unvested at December 31, 2005 for the 2005 and 2004 and 2003,grants, respectively. The weighted-average fair market value of the stock grants issued were $42.04, $25.65,$45, $42, and $21.67$26 in
NEWMONT MINING CORPORATION
NOTES TO CONSOLIDATED FINANCIAL STATEMENTS—(Continued)
(dollars in millions, except per share, per ounce and per pound amounts)
2005, 2004, 2003, and 2002,2003, respectively. Compensation expense recorded for these grants of restricted stock was $7.8 million, $13.1 million,$9, $8, and $6.0 million$13 in 2005, 2004 and 2003, and 2002, respectively. With the exception of shares granted in 2002, which vested in two equal increments over two years, theThe shares of restricted stock vest in three equal increments over three years.
Restricted stock units also are granted, upon achievement of certain financial and operating thresholds, to employees in certain foreign jurisdictions. In 2005, the Company granted 27,386 restricted stock units at the weighted-average fair market value of $44.57 per underlying share of the Company’s common stock. In 2004, the Company granted 18,788 restricted stock units at the weighted-average fair market value of $42.04 of theper underlying sharesshare of the Company’s common stock. Compensation expense recorded for these grants ofthe foreign jurisdiction restricted stock units was $0.8 million$1 in both 2005 and 2004. These restricted stock units vest in three equal increments over three years. Upon vesting, the employee is entitled to receive for each restricted stock unit one share of the Company’s common stock.
The Company grants deferred stock awards to certain other employees. The deferred stock awards vest afterover periods between two to three years. In 2005, 2004 2003 and 2002,2003, the Company granted deferred stock awards in respect of 164,975, 158,219, 174,795, and 187,836174,795 shares of the Company’s common stock, respectively, at weighted-average fair market values of $40.92, $42.99, $36.76, and $26.07$36.76 per share, respectively. At December 31, 2005 and 2004, 159,620 and 2003, 314,109 and 340,060
NEWMONT MINING CORPORATION
NOTES TO CONSOLIDATED FINANCIAL STATEMENTS—(Continued)
deferred stock awards, respectively, remained unvested. Compensation expense recorded for these grants of deferred stock awards was $6.0 million, $4.8 million,$5, $6, and $3.2 million$5 in 2005, 2004 2003 and 2002,2003, respectively. Upon vesting, the employee is entitled to receive the number of shares of the Company’s common stock specified in the deferred stock award.
NOTE 1412 OTHER CURRENT LIABILITIES
| At December 31, | At December 31, | |||||||||||
| 2004 | 2003 | 2005 | 2004 | |||||||||
| (in thousands) | ||||||||||||
Derivative instruments | $ | 71,326 | $ | 6,074 | ||||||||
Other current liabilities: | ||||||||||||
Accrued capital expenditures | 60,079 | 25,780 | $ | 80 | $ | 58 | ||||||
Income and mining taxes | 56,541 | 116,520 | 77 | 57 | ||||||||
Reclamation and remediation | 53,726 | 57,350 | ||||||||||
Reclamation and remediation costs | 63 | 53 | ||||||||||
Accrued operating costs | 51,616 | 36,325 | 82 | 60 | ||||||||
Royalties | 42,144 | 25,701 | 26 | 41 | ||||||||
Interest | 37,011 | 32,345 | 42 | 37 | ||||||||
Utilities | 15,697 | 8,360 | ||||||||||
Taxes other than income and mining | 15,443 | 10,861 | 18 | 15 | ||||||||
Deferred revenue | 17 | 11 | ||||||||||
Advanced stripping costs | 14 | 2 | ||||||||||
Deferred income tax liabilities | 10,184 | 1,696 | 5 | 10 | ||||||||
Advanced stripping costs | 2,467 | — | ||||||||||
Guarantee of QMC debt | — | 30,000 | ||||||||||
Other | 33,794 | 1,190 | 52 | 31 | ||||||||
| $ | 450,028 | $ | 352,202 | $ | 476 | $ | 375 | |||||
Other long-term liabilities: | ||||||||||||
Income taxes | $ | 220 | $ | 306 | ||||||||
Deferred stripping | 93 | 103 | ||||||||||
Deferred revenue from the sale of future product | 47 | 47 | ||||||||||
Derivative instruments | 30 | 7 | ||||||||||
Other | 24 | 24 | ||||||||||
| $ | 414 | $ | 487 | |||||||||
NEWMONT MINING CORPORATION
NOTES TO CONSOLIDATED FINANCIAL STATEMENTS—(Continued)
(dollars in millions, except per share, per ounce and per pound amounts)
NOTE 1513 RECLAMATION AND REMEDIATION (ASSET RETIREMENT OBLIGATIONS)
The Company’s mining and exploration activities are subject to various federal and state laws and regulations governing the protection of the environment. These laws and regulations are continually changing and are generally becoming more restrictive. The Company conducts its operations so as to protect the public health and environment and believes its operations are in compliance with applicable laws and regulations in all material respects. The Company has made, and expects to make in the future, expenditures to comply with such laws and regulations, but cannot predict the full amount of such future expenditures. Estimated future reclamation costs are based principally on legal and regulatory requirements.
At December 31, 2005 and 2004, $431 and 2003, $410.3 million and $361.0 million,$396, respectively, were accrued for reclamation obligations relating to currently or recently producing mineral properties. In addition, the Company is involved in several matters concerning environmental obligations associated with former, primarily historic, mining activities. Generally, these matters concern developing and implementing remediation plans at the various sites involved. At December 31, 2005 and 2004, $77 and 2003, $74.9 million and $58.6 million,$75, respectively, were accrued for such obligations. These amounts are also included inReclamation and remediation liabilities.
NEWMONT MINING CORPORATION
NOTES TO CONSOLIDATED FINANCIAL STATEMENTS—(Continued)
The following is a reconciliation of the total liability for reclamation and remediation (in thousands):remediation:
Balance January 1, 2003 | $ | 302,229 | ||
Impact of adoption of SFAS No. 143 | 120,707 | |||
Additions, change in estimates and other | 10,949 | |||
Liabilities settled | (36,862 | ) | ||
Accretion expense | 22,610 | |||
Balance December 31, 2003 | 419,633 | |||
Impact of Batu Hijau consolidation | 47,492 | |||
Additions, change in estimates and other | 38,199 | |||
Liabilities settled | (45,633 | ) | ||
Accretion expense | 25,535 | |||
Balance December 31, 2004 | $ | 485,226 | ||
Balance January 1, 2004 | $ | 409 | ||
Impact of Batu Hijau consolidation | 47 | |||
Additions, change in estimates and other | 35 | |||
Liabilities settled | (45 | ) | ||
Accretion expense | 25 | |||
Balance December 31, 2004 | 471 | |||
Additions, change in estimates and other | 65 | |||
Liabilities settled | (47 | ) | ||
Disposition of liability | (8 | ) | ||
Accretion expense | 27 | |||
Balance December 31, 2005 | $ | 508 | ||
The current portions ofReclamation and remediation liabilities of $53.7 million$63 and $57.4 million$53 at December 31, 20042005 and 2003,2004, respectively, are included inOther current liabilities.
The Company recorded $12.7 million, $19.2 million$34, $13 and $5.2 million$19 of reclamation expense during the years ended December 31, 2004, 2003 and 2002, respectively, for non-operating properties.
On January 1, 2003, Newmont adopted SFAS No. 143, “Accounting for Asset Retirement Obligations,” which established a uniform methodology for accounting for estimated reclamation and abandonment costs. As a result,Reclamation and remediation liabilities increased by $120.7 million for the fair value of the estimated asset retirement obligations,Other current liabilities increased by $2.3 million,Deferred income tax assets increased by $11.2 million,Property, plant and mine development, net increased by $69.1 million, Minority interest in subsidiaries decreased by $16.2 million,Investments decreased by $8.0 million and a $34.5 million loss was recorded for theCumulative effect of a change in accounting principle, net of tax. In 2002, the pro forma effect would have increasedNet income by $0.2 million ($0.00 per common share, basic) had the accounting change been in effect during the period.
NOTE 16 SALES CONTRACTS, COMMODITY AND FINANCIAL INSTRUMENTS
Newmont generally avoids gold hedging. Newmont’s philosophy is to provide shareholders with leverage to gold prices by selling its gold production at market prices. Newmont has, on a limited basis, entered into derivative contracts to protect the selling price for certain anticipated gold and copper production and to manage risks associated with sales contracts, commodities, interest rates, and foreign currency. Newmont is not required to place collateral with respect to commodity instruments and there are no margin calls associated with such contracts. During the year ended December 31, 2004, Newmont entered into copper net zero-cost option collar contracts, U.S.$/IDR forward purchase contracts and Australian dollar net zero-cost option collar contracts. Approximately 459 million pounds of copper are hedged by the copper option collar contracts, which have been designated as cash flow hedges of forecasted copper sales, and as such, changes in the fair value related to the effective portion of the hedges have been recorded inAccumulated other comprehensive income. The remainder of the copper option collar contracts are currently undesignated and are accounted for on a mark-to-market basis currently through earnings. The U.S.$/IDR forward purchase contracts and Australian dollar net zero-cost option collar contracts have been designated as cash flow hedges of future IDR and Australian dollar expenditures, respectively, and as such, changes in the market value have been recorded inAccumulated other comprehensive income.
NEWMONT MINING CORPORATION
NOTES TO CONSOLIDATED FINANCIAL STATEMENTS—(Continued)
For the years ended December 31, 2004, 2003 and 2002, net gains of $2.3 million and $28.3 million and a net loss of $18.3 million, respectively, were included inNet income (loss)for the ineffective portion of derivative instruments designated as cash flow hedges and a net loss of $0.0 million, $5.4 million and $21.5 million, respectively, for the change in fair value of gold commodity contracts that do not qualify as hedges (included inGain (loss) on derivative instruments, net). The amount to be reclassified fromAccumulated other comprehensive income (loss),net of taxto income for derivative instruments during the next 12 months is a gain of approximately $6.0 million. The maximum period over which hedged forecasted transactions are expected to occur is 7 years.
At the time of Normandy’s acquisition, three of Normandy’s affiliates had substantial derivative instrument positions. Normandy entered into gold forward sales contracts with fixed and floating gold lease rates, but did not enter into contracts that required margin calls and had no outstanding long-dated sold call options. Following the acquisition, and in accordance with Newmont’s philosophy regarding gold hedging, the Normandy hedge positions were reduced by approximately 9.6 million ounces from February 16, 2002 to December 31, 2004. Gold forward sales contracts and other “committed hedging obligations” were reduced by 7.5 million ounces by delivering production into the contracts or through early close-outs. Similarly, uncommitted contracts for 2.1 million ounces were either delivered into, were allowed to lapse or were closed out early. Thus, as of December 31, 2004, the Normandy hedge positions have been reduced to 324,750 uncommitted ounces with a negative mark-to-market valuation of $9 million.
Certain of Normandy’s hedge positions were eliminated in connection with the Voluntary Administration of Newmont Yandal Operations Pty Ltd. See Note 27 for discussion of legal matters.
This transaction gave rise to a gain of $106.5 million, net of transaction costs, for the year ended December 31, 2003. Total cash payments to extinguish the derivatives liability (including costs) was $103.6 million during the year ended December 31, 2003.
NEWMONT MINING CORPORATION
NOTES TO CONSOLIDATED FINANCIAL STATEMENTS—(Continued)
| Expected Maturity Date or Transaction Date | Fair Value | |||||||||||||||||||||||||
| 2005 | 2006 | 2007 | 2008 | 2009 | Thereafter | Total/ Average | At December 31, 2004 | At December 31, 2003 | ||||||||||||||||||
| U.S.$ (000) | ||||||||||||||||||||||||||
Gold Put Option Contracts (U.S.$ Denominated): | ||||||||||||||||||||||||||
Ounces (thousands) | 205 | 100 | 20 | — | — | — | 325 | $ | (8,910 | ) | $ | (11,758 | ) | |||||||||||||
Average price | $ | 292 | $ | 338 | $ | 397 | — | — | — | $ | 313 | |||||||||||||||
Silver Forward Contracts (U.S.$ Denominated): | ||||||||||||||||||||||||||
Ounces (thousands) | 1,200 | 50 | — | — | — | — | 1,250 | $ | (1,077 | ) | $ | (1,000 | ) | |||||||||||||
Average price | $ | 6.01 | $ | 6.50 | — | — | — | — | $ | 6.03 | ||||||||||||||||
Copper Collar Contracts (U.S.$ Denominated): | ||||||||||||||||||||||||||
Pounds (millions) | 465.7 | 110.8 | 4.4 | — | — | — | 580.9 | $ | (60,598 | )(1) | N/A | |||||||||||||||
Average cap price | $ | 1.30 | $ | 1.30 | $ | 1.30 | — | — | — | $ | 1.30 | |||||||||||||||
Average floor price | $ | 1.10 | $ | 1.10 | $ | 1.10 | — | — | — | $ | 1.10 | |||||||||||||||
Diesel Forward Purchase Contracts (U.S.$ Denominated): | ||||||||||||||||||||||||||
Barrels (thousands) | 40 | — | — | — | — | — | 40 | $ | 802 | (1) | $ | 637 | ||||||||||||||
Average price | $ | 27.19 | — | — | — | — | — | $ | 27.19 | |||||||||||||||||
U.S.$/IDR Forward Purchase Contracts: | ||||||||||||||||||||||||||
U.S.$ (millions) | 75.7 | — | — | — | — | — | 75.7 | $ | (447 | ) | N/A | |||||||||||||||
Average rate (IDR/U.S.$) | 9,384 | — | — | — | — | — | 9,384 | |||||||||||||||||||
Australian Dollar Zero-Cost Collar Contracts: | ||||||||||||||||||||||||||
U.S.$ (millions) | $ | 281.4 | $ | 134.6 | — | — | — | — | $ | 416.0 | $ | 13,438 | N/A | |||||||||||||
Average cap price (U.S.$ per A$1) | $ | 0.775 | $ | 0.800 | — | — | — | — | $ | 0.783 | ||||||||||||||||
Average floor price (U.S.$ per A$1) | $ | 0.577 | $ | 0.547 | — | — | — | — | $ | 0.568 | ||||||||||||||||
Australian Dollar Forward Contracts
The Company had no Australian dollar forward contracts outstanding as of December 31, 2004, although a position did exist as of December 31, 2003. These positions were closed during July 2004. The fair value of these contracts as of December 31, 2003 was positive $7.7 million.
Provisional Copper and Gold Sales
For the years ended December 31, 2004, 2003 and 2002, Batu Hijau recorded gross revenues, before smelting and refining charges, of $324.8 million, $95.7 million and $65.7 million for base metals, respectively,
NEWMONT MINING CORPORATION
NOTES TO CONSOLIDATED FINANCIAL STATEMENTS—(Continued)
and $28.5 million, zero and zero for gold, respectively, which were subject to final pricing adjustments. The average realized price adjustment for base metals was 13.77%, 5.07% and 1.98% for the years ended December 31, 2004, 2003 and 2002, respectively, and 0.86%, 1.13% and 0.83% for gold for the same periods.
Price-Capped Sales Contracts
In 2001, Newmont entered into transactions that closed out certain call options. The options were replaced with a series of forward sales contracts requiring physical delivery of the same quantity of gold over slightly extended future periods. Under the terms of the contracts, Newmont will realize the lower of the spot price on the delivery date or the capped price ranging from $350 per ounce in 2005, to $392 per ounce in 2011. The initial fair value of the forward sales contracts of $53.8 million was recorded asDeferred revenue from sale of future production and will be included in sales revenue as delivery occurs in 2005 through 2011. As of December 31, 2004, the current portion of $7.0 million has been reclassified toOther current liabilities. The forward sales contracts are accounted for as normal sales contracts under SFAS No. 133 “Accounting for Derivative Instruments and Hedging Activities” and SFAS No. 138 “Accounting for Certain Derivative Instruments and Certain Hedging Activities-an Amendment to SFAS No. 133.”
Newmont had the following price-capped forward sales contracts outstanding at December 31, 2004:
Expected Maturity Date or Transaction Date | Thereafter | Total/ Average | |||||||||||||||||
Price-capped sales contracts: | 2005 | 2006 | 2007 | 2008 | 2009 | ||||||||||||||
| (U.S.$ Denominated) | |||||||||||||||||||
Ounces (thousands) | 500 | — | — | 1,000 | 600 | 250 | 2,350 | ||||||||||||
Average price | $ | 350 | — | — | $ | 384 | $ | 381 | $ | 392 | $ | 377 | |||||||
Interest Rate Swap Contracts
In 2001, Newmont entered into contracts to hedge the interest rate risk exposure on a portion of its $275 million 8 5/8% debentures and its $200 million 8 3/8% debentures (see Note 11). These transactions resulted in a reduction in interest expense of $5.5 million, $6.9 million and $5.9 million for the years ended December 31, 2004, 2003 and 2002, respectively. The fair value of the ineffective portions accounted for as derivative assets were $3.7 million and $5.2 million at December 31, 2004 and 2003, respectively, and the fair value of the effective portions accounted for as fair value hedges were $5.0 million and $7.7 million at December 31, 2004 and 2003, respectively.
properties associated with former mining activities.
NOTE 1714 STOCKHOLDERS’ EQUITY AND EARNINGS PER SHARE
Newmont Common Stock
In January 2004, Newmont filed a new shelf registration statement on Form S-3 under which it can issue debt and equity securities from time-to-time having an aggregate offering price of up to $1.0 billion.$1,000. Newmont also filed a shelf registration statement on Form S-4 under which it can issue, from time-to-time in connection with future acquisitions of businesses, properties or assets, common stock and common stock warrants having an aggregate offering price of $200 million.up to $200. These registration statements were declared effective on February 4, 2004.
NEWMONT MINING CORPORATION
NOTES TO CONSOLIDATED FINANCIAL STATEMENTS—(Continued)
(dollars in millions, except per share, per ounce and per pound amounts)
During November 2003, Newmont completed an equity offering of 25 million shares of common stock under its existing shelf registration statement filed with the Securities and Exchange Commission. The net proceeds of approximately $1.0 billion$986 from this offering are beingwere used for general corporate purposes.
NEWMONT MINING CORPORATION
NOTES TO CONSOLIDATED FINANCIAL STATEMENTS—(Continued)
During April and December 2003, Newmont issued approximately 4.4 million shares of common stock in connection with the Newmont NFM Scheme of Arrangement (see Note 22) and 0.8 million shares of common stock in connection with the acquisition of Moydow’s interest in the Ntotoroso property, respectively. During February 2002, Newmont issued 110.5 million shares of common stock (or exchangeable shares) for the acquisition of Franco-Nevada and 86.5 million shares plus cash for the acquisition of Normandy.
The Company paid common stock dividends of $0.40 per share during 2005, $0.30 per common share of Newmont stock during 2004 and $0.17 per common share during 2003 and $0.12 per common share in 2002.
2003.
Treasury Shares
Treasury stock is acquired by the Company when certain restricted stock (see Note 13)11) vests. At vesting, a participant has a tax liability and, pursuant to the participant’s award agreement, may elect withholding of restricted stock in full or partial satisfaction of such tax obligation, but only to the extent that such restricted stock has become fully vested. The withheld stock is accounted for as treasury stock and carried at the par value of the related common stock.
Exchangeable Shares
In connection with the acquisition of Franco-Nevada in February 2002, certain holders of Franco-Nevada common stock received 0.8 of an exchangeable share of Newmont Mining Corporation of Canada Limited (formerly Franco-Nevada) for each share of common stock held. These exchangeable shares are convertible, at the option of the holder, into shares of Newmont common stock on a one-for-one basis, and entitledentitle holders to dividends and other rights economically equivalent to holders of Newmont common stock. At December 31, 20042005 and 2003,2004, the value of these no-par shares was included inAdditional paid-in capital.
Cumulative Convertible Preferred Stock
In April 2002, Newmont announced the redemption of all issued and outstanding shares of its $3.25 cumulative preferred stock as of May 15, 2002. Pursuant to the terms of the cumulative convertible preferred stock, Newmont paid a redemption price of $50.325 per share, plus $0.8125 per share for accrued dividends at the redemption date. In settlement of the total redemption price of $51.1375 per preferred share, Newmont issued each holder of record 1.19187 shares of its common stock and cash for any remaining fractional interests. The Company paid preferred stock dividends during 2002 of $3.7 million. At December 31, 2004, 5 million shares were authorized with a $5.00 par value. There were no shares issued and outstanding.
Warrants
Newmont Mining Corporation of Canada Limited (“NMCCL”) had 2.2 million Class A warrants outstanding that expired during September 2003. Each Class A warrant, plus CDN$200, was exchangeable for 3.2 shares of Newmont common stock. None of the Class A warrants were exercised before expiration. NMCCL also had 2.1 million Class B warrants with an expiration date in November 2003. Each Class B warrant, plus CDN$100 per warrant, was exchangeable for 2.464 shares of Newmont common stock. Of the total Class B warrants, 99.9% were exercised before expiration.
Earnings per Share
The difference between the basic weighted-average common shares outstanding and the diluted weighted-average common shares outstanding for each of the years ended December 31,2005, 2004 2003 and 20022003 was due to
NEWMONT MINING CORPORATION
NOTES TO CONSOLIDATED FINANCIAL STATEMENTS—(Continued)
the assumed conversion of employee stock options. Employee stock options with exercise prices greater than the average market price were excluded from the December 31, 2005, 2004 2003 and 20022003 diluted weighted-average common shares because the effect would have been anti-dilutive.
NEWMONT MINING CORPORATION
NOTES TO CONSOLIDATED FINANCIAL STATEMENTS—(Continued)
(dollars in millions, except per share, per ounce and per pound amounts)
NOTE 18 STATEMENT OF15 COMPREHENSIVE INCOME
| Years Ended December 31, | ||||||||||||||||||||||||
| 2004 | 2003 | 2002 | Years Ended December 31, | |||||||||||||||||||||
| (in thousands) | 2005 | 2004 | 2003 | |||||||||||||||||||||
Comprehensive income: | ||||||||||||||||||||||||
Net income | $ | 443,327 | $ | 475,667 | $ | 158,061 | $ | 322 | $ | 443 | $ | 476 | ||||||||||||
Other comprehensive income (loss): | ||||||||||||||||||||||||
Unrealized gain (loss) on marketable equity securities, net of tax of $(31,856), $1,572 and $9,426, respectively | 123,077 | (5,044 | ) | (12,824 | ) | |||||||||||||||||||
Other comprehensive income: | ||||||||||||||||||||||||
Unrealized gain (loss) on marketable equity securities, net of tax of $(61), $(32) and $2, respectively | 282 | 123 | (5 | ) | ||||||||||||||||||||
Foreign currency translation adjustments | 30,726 | 23,182 | 3,622 | 26 | 31 | 23 | ||||||||||||||||||
Minimum pension liability adjustments, net of tax of $5,969, $(189) and $15,429, respectively | (11,066 | ) | 350 | (28,655 | ) | |||||||||||||||||||
Changes in fair value of cash flow hedge instruments, net of tax of $8,393, $(26,650) and $8,176, respectively | (18,887 | ) | 68,365 | (16,721 | ) | |||||||||||||||||||
Minimum pension liability adjustments, net of tax of $10 in 2005 and $6 in 2004 | (18 | ) | (11 | ) | — | |||||||||||||||||||
Changes in fair value of cash flow hedge instruments, net of tax of $30, $8 and $(27), respectively | (59 | ) | (19 | ) | 68 | |||||||||||||||||||
| 123,850 | 86,853 | (54,578 | ) | 231 | 124 | 86 | ||||||||||||||||||
Comprehensive income | $ | 567,177 | $ | 562,520 | $ | 103,483 | $ | 553 | $ | 567 | $ | 562 | ||||||||||||
| At December 31, | ||||||||
| 2004 | 2003 | |||||||
| (in thousands) | ||||||||
Accumulated other comprehensive income: | ||||||||
Unrealized gain on marketable equity securities, net of tax of $(31,718) and $(138), respectively | $ | 123,544 | $ | 467 | ||||
Foreign currency translation adjustments | 30,879 | 153 | ||||||
Minimum pension liability adjustments, net of tax of $22,260 and $16,291, respectively | (41,340 | ) | (30,274 | ) | ||||
Changes in fair value of cash flow hedge instruments, net of tax of $(12,882) and $(21,275), respectively | 33,594 | 52,481 | ||||||
Accumulated other comprehensive income | $ | 146,677 | $ | 22,827 | ||||
| At December 31, | ||||||||
| 2005 | 2004 | |||||||
Accumulated other comprehensive income: | ||||||||
Unrealized gain on marketable equity securities, net of tax of $(94) and $(32), respectively | $ | 406 | $ | 124 | ||||
Foreign currency translation adjustments | 57 | 31 | ||||||
Minimum pension liability adjustments, net of tax of $32 and $22, respectively | (59 | ) | (41 | ) | ||||
Changes in fair value of cash flow hedge instruments, net of tax of $18 and $(13), respectively | (26 | ) | 33 | |||||
Accumulated other comprehensive income | $ | 378 | $ | 147 | ||||
During 2005, 2004 2003 and 2002,2003, the Company reclassified approximately $8.5 million, $16.9 million$2, $9 and $1.9 million$17 of gains related to the cash flow hedge instruments fromAccumulated other comprehensive income toRevenues to reflect maturities of such instruments.
NOTE 1916 WRITE-DOWN OF LONG-LIVED ASSETS
Write-down of long-lived assets totaled $39.3 million, $35.3 million$43, $39 and $3.7 million during the years ended December 31,$35 for 2005, 2004 and 2003, respectively. The 2005 write-down primarily related to write-downs of an advanced exploration project in Indonesia and 2002, respectively.exploration tenements in Australia. The 2004 write-down included $16.3 million$16 related to the long-lived assets at the Ovacik mine in Turkey. In August 2004, the Ovacik mine suspended operations as a result of a court decision ordering the suspension of operating permits pending completion of certain additional permitting requirements and the submission of an updated environmental impact assessment. On March 1, 2005,
NEWMONT MINING CORPORATION
NOTES TO CONSOLIDATED FINANCIAL STATEMENTS—(Continued)
the Ovacik mine was sold to a subsidiary of Koza Davetiye, a Turkish conglomerate. The remainder of the write-down recorded duringfor 2004 was primarily related to exploration tenements in Australia, long-lived asset impairment resulting from a reevaluation of future production and operating costs at Pajingo, and processing facilities at Yanacocha. The 2003 write-down primarilywas related to a $28.4 million$28 impairment charge at Golden GiantGiant.
NEWMONT MINING CORPORATION
NOTES TO CONSOLIDATED FINANCIAL STATEMENTS—(Continued)
(dollars in millions, except per share, per ounce and the mobile fleet at Yanacocha. The impairment charge at Golden Giant resulted from a reevaluation of the life-of-mine plan which eliminated marginal stopes and reflected higher projected life-of-mine operating costs that led to reduced proven and probable reserves and increased life-of-mine operating costs. The 2002 write-down related to an impairment charge for exploration stage mineral interests and fixed assets at Kori Kollo.per pound amounts)
NOTE 20 INTEREST INCOME, FOREIGN CURRENCY EXCHANGE AND17 OTHER INCOMEEXPENSE
| Years Ended December 31, | ||||||||||
| 2004 | 2003 | 2002 | ||||||||
| (in thousands) | ||||||||||
Interest income | $ | 23,366 | $ | 10,538 | $ | 14,139 | ||||
Foreign currency exchange gain, net | 9,213 | 96,971 | 14,020 | |||||||
Gain on sale of mining and exploration properties | 28,004 | 15,394 | 6,112 | |||||||
Gain (loss) on QMC debt guarantee | 10,616 | (30,000 | ) | — | ||||||
Other | 5,749 | 9,279 | 5,614 | |||||||
| $ | 76,948 | $ | 102,182 | $ | 39,885 | |||||
| Years Ended December 31, | ||||||||||
| 2005 | 2004 | 2003 | ||||||||
Reclamation and remediation | $ | 37 | $ | (11 | ) | $ | 33 | |||
Minahasa environmental and Buyat Bay civil suit (Note 32) | 56 | 7 | — | |||||||
Nevada waste dump slide | 6 | — | — | |||||||
Other | 12 | 37 | 17 | |||||||
| $ | 111 | $ | 33 | $ | 50 | |||||
NOTE 18 OTHER INCOME, NET
| Years Ended December 31, | |||||||||||
| 2005 | 2004 | 2003 | |||||||||
Royalty and dividend income, net | $ | 79 | $ | 64 | $ | 56 | |||||
Interest income | 59 | 23 | 11 | ||||||||
Gain on sale of other assets, net | 48 | 28 | 15 | ||||||||
Gain (loss) on investments, net (Note 4) | 54 | (39 | ) | 83 | |||||||
Gain on derivative investments, net | 2 | 2 | 23 | ||||||||
Foreign currency exchange gains | 8 | 7 | 97 | ||||||||
Gain (loss) on QMC debt guarantee | 9 | 11 | (30 | ) | |||||||
Gain on extinguishment of NYOL liabilities, net | — | — | 221 | ||||||||
Loss on extinguishment of debt | — | — | (34 | ) | |||||||
Other | 10 | 6 | 9 | ||||||||
| $ | 269 | $ | 102 | $ | 451 | ||||||
Gain on Sale of Other Assets, Net
On March 31, 2005, the Mezcala gold deposit was sold for cash proceeds of $31 and the Company recorded a pre-tax gain of $31.
Foreign Currency Exchange Gains
As of December 31, 2003, the Company converted CDN$499 million of the Canadian dollar-denominated intercompany loans to long-term notes, as the Company does not intend to settle these loans in the foreseeable future. As a result, the Company no longer records foreign currency gains and losses in earnings with respect to the converted long-term notes.
Gain on Extinguishment of NYOL liabilities, Net
Newmont was the guarantor of an A$71.0 million (approximately $50.7 million) amortizing loan facility of an AMC subsidiary, QMC Finance Pty Ltd (“QMC”). The QMC loan facility, which is collateralized by the assets of AMC subsidiaries being used in the Queensland Magnesium (“QMAG”) project, expires in November 2006. During 2003, Newmont, recordedthrough an indirect, wholly-owned subsidiary, Yandal Bond Company Limited (“YBCL”), made an offer to acquire all of NYOL’s outstanding 8 7/8% Senior Notes due 2008. Those Notes were subsequently extinguished in connection with the Voluntary Administration of NYOL. Certain of Normandy’s hedge positions were also eliminated with the Voluntary Administration of NYOL. These transactions gave rise to a $30.0 million chargegain of $114 to extinguish the NYOL bonds and established a corresponding reserve inOther current liabilities (Note 14),$107 to extinguish the NYOL derivatives liability, net of transaction costs for the expected loss associated with its guarantee of QMC’s debt. In 2004, Newmont Australia Limited (“NAL”), a wholly-owned subsidiary of Newmont, entered into a transaction resulting in a loan from NAL to a subsidiary of QMC for A$30.0 million (approximately $23.2 million), the release of Newmont from its guarantee obligation and recognition of a $10.6 million gain resulting from the release of all previously accrued contingent liabilities. An allowance was provided for 100% of the loan receivable from the QMC entity. See Note 9 for discussion regarding Newmont’s interest in AMC.year ended December 31, 2003.
NEWMONT MINING CORPORATION
NOTES TO CONSOLIDATED FINANCIAL STATEMENTS—(Continued)
(dollars in millions, except per share, per ounce and per pound amounts)
NOTE 2119 INCOME TAXES
The Company’sIncome tax expense consisted of:
| Years Ended December 31, | ||||||||||||
| 2004 | 2003 | 2002 | ||||||||||
| (in thousands) | ||||||||||||
Current: | ||||||||||||
United States | $ | (9,970 | ) | $ | (14,800 | ) | $ | (9,866 | ) | |||
Foreign | (241,125 | ) | (228,333 | ) | (110,324 | ) | ||||||
| (251,095 | ) | (243,133 | ) | (120,190 | ) | |||||||
Deferred: | ||||||||||||
United States | 60,738 | 49,004 | 92,060 | |||||||||
Foreign | (85,525 | ) | (12,821 | ) | 8,230 | |||||||
| (24,787 | ) | 36,183 | 100,290 | |||||||||
| $ | (275,882 | ) | $ | (206,950 | ) | $ | (19,900 | ) | ||||
| Years Ended December 31, | ||||||||||||
| 2005 | 2004 | 2003 | ||||||||||
Current: | ||||||||||||
United States | $ | (22 | ) | $ | (10 | ) | $ | (15 | ) | |||
Foreign | (303 | ) | (241 | ) | (228 | ) | ||||||
| (325 | ) | (251 | ) | (243 | ) | |||||||
Deferred: | ||||||||||||
United States | 9 | 61 | 49 | |||||||||
Foreign | 2 | (135 | ) | (18 | ) | |||||||
| 11 | (74 | ) | 31 | |||||||||
| $ | (314 | ) | $ | (325 | ) | $ | (212 | ) | ||||
The Company’sPre-tax income (loss) before minority interest, equity income and impairment of affiliates and cumulative effect of a change in accounting principleconsisted of:
| Years Ended December 31, | |||||||||||||||||||
| 2004 | 2003 | 2002 | Years Ended December 31, | ||||||||||||||||
| (in thousands) | 2005 | 2004 | 2003 | ||||||||||||||||
United States | $ | 183,418 | $ | 286,853 | $ | (186,281 | ) | $ | (68 | ) | $ | 183 | $287 | ||||||
Foreign | 915,587 | 638,533 | 402,607 | 1,132 | 928 | 644 | |||||||||||||
| $ | 1,099,005 | $ | 925,386 | $ | 216,326 | $ | 1,064 | $ | 1,111 | $931 | |||||||||
NEWMONT MINING CORPORATION
NOTES TO CONSOLIDATED FINANCIAL STATEMENTS—(Continued)
(dollars in millions, except per share, per ounce and per pound amounts)
The Company’s income tax expense differed from the amounts computed by applying the United States statutory corporate income tax rate for the following reasons:
| Years Ended December 31, | ||||||||||||||||||||||||
| 2004 | 2003 | 2002 | Years Ended December 31, | |||||||||||||||||||||
| (in thousands) | 2005 | 2004 | 2003 | |||||||||||||||||||||
Pre-tax income before minority interest, equity income and impairment of affiliates and cumulative effect of change in accounting principle | $ | 1,099,005 | $ | 925,386 | $ | 216,326 | $ | 1,064 | $ | 1,111 | $ | 931 | ||||||||||||
United States statutory corporate income tax rate | 35 | % | 35 | % | 35 | % | 35 | % | 35 | % | 35 | % | ||||||||||||
Income tax expense computed at United States statutory corporate income tax rate | (384,652 | ) | (323,885 | ) | (75,714 | ) | (372 | ) | (389 | ) | (326 | ) | ||||||||||||
Reconciling items: | ||||||||||||||||||||||||
Percentage depletion and Canadian Resource Allowance | 47,066 | 21,540 | 34,352 | 47 | 47 | 21 | ||||||||||||||||||
Change in valuation allowance on deferred tax assets | 58,637 | 85,220 | (2,506 | ) | (22 | ) | 58 | 85 | ||||||||||||||||
Effect of foreign earnings, net of allowable credits | (11,044 | ) | 27,766 | 16,728 | (10 | ) | (11 | ) | 28 | |||||||||||||||
U.S. tax effect of minority interest attributable to non-U.S. investees | 7,258 | 22,208 | 11,494 | 15 | 7 | 22 | ||||||||||||||||||
Rate differential for foreign earnings indefinitely reinvested | (16,256 | ) | 13,438 | (4,994 | ) | (8 | ) | (61 | ) | 11 | ||||||||||||||
Resolution of tax issues associated with prior years | — | — | 10,198 | 12 | — | — | ||||||||||||||||||
Foreign currency translation of monetary assets | 12,692 | (54,445 | ) | (9,294 | ) | 14 | 13 | (54 | ) | |||||||||||||||
Tax effect of changes in tax laws | 51,388 | 35,695 | — | 24 | 51 | 36 | ||||||||||||||||||
Tax effect of impairment of goodwill | (17,389 | ) | — | — | (14 | ) | (17 | ) | — | |||||||||||||||
Non-U.S. tax effect attributable to the extinguishment of debt | — | (35,629 | ) | — | — | — | (36 | ) | ||||||||||||||||
Non-U.S. tax effect attributable to capital gains | (9,159 | ) | — | — | — | (9 | ) | — | ||||||||||||||||
Other | (14,423 | ) | 1,142 | (164 | ) | — | (14 | ) | 1 | |||||||||||||||
Income tax expense | $ | (275,882 | ) | $ | (206,950 | ) | $ | (19,900 | ) | $ | (314 | ) | $ | (325 | ) | $ | (212 | ) | ||||||
NEWMONT MINING CORPORATION
NOTES TO CONSOLIDATED FINANCIAL STATEMENTS—(Continued)
(dollars in millions, except per share, per ounce and per pound amounts)
Components of the Company’s consolidated deferred income tax assets (liabilities) are as follows:
| Years Ended December 31, | ||||||||
| 2004 | 2003 | |||||||
| (in thousands) | ||||||||
Deferred tax assets: | ||||||||
Exploration costs | $ | 49,128 | 69,039 | |||||
Depreciation | — | 70,419 | ||||||
Net operating losses and tax credits | 621,089 | 388,796 | ||||||
Retiree benefit and vacation accrual costs | 89,598 | 83,995 | ||||||
Remediation and reclamation costs | 110,800 | 81,204 | ||||||
Derivative instruments | — | 18,649 | ||||||
Unrealized losses on investments | 53,830 | — | ||||||
Other | 70,853 | 26,191 | ||||||
| 995,298 | 738,293 | |||||||
Valuation allowance for deferred tax assets | (376,246 | ) | (230,298 | ) | ||||
Deferred tax assets, net of valuation allowance | 619,052 | 507,995 | ||||||
Deferred tax liabilities: | ||||||||
Net undistributed earnings of subsidiaries | (91,304 | ) | (32,615 | ) | ||||
Unrealized gain on investments | — | (64,037 | ) | |||||
Depletable and amortizable costs associated with mineral rights | (159,740 | ) | (113,416 | ) | ||||
Depreciation | (4,355 | ) | — | |||||
Derivative instruments | (13,060 | ) | — | |||||
Capitalized mining costs | (125,002 | ) | (91,244 | ) | ||||
Foreign currency exchange | (40,484 | ) | (10,066 | ) | ||||
Capitalized interest | (6,129 | ) | (21,862 | ) | ||||
Deferred tax liabilities | (440,074 | ) | (333,240 | ) | ||||
Net deferred tax assets | $ | 178,978 | $ | 174,755 | ||||
Years Ended December 31, | ||||
2005 | 2004 | |||
Deferred income tax assets: | ||||
Exploration costs | $55 | $49 | ||
Depreciation | 69 | — | ||
Net operating losses and tax credits | 720 | 621 | ||
Retiree benefit and vacation accrual costs | 101 | 89 | ||
Remediation and reclamation costs | 101 | 111 | ||
Derivative instruments | 26 | — | ||
Unrealized losses on investments | — | 54 | ||
Other | 116 | 71 | ||
| 1,188 | 995 | |||
Valuation allowances | (523) | (376) | ||
| 665 | 619 | |||
Deferred income tax liabilities: | ||||
Net undistributed earnings of subsidiaries | (49) | (91) | ||
Unrealized gain on investments | (77) | — | ||
Depletable and amortizable costs associated with mineral rights | (310) | (160) | ||
Depreciation | — | (4) | ||
Derivative instruments | — | (13) | ||
Capitalized mining costs | — | (125) | ||
Foreign currency exchange | (23) | (41) | ||
Capitalized interest | — | (6) | ||
| (459) | (440) | |||
Net deferred income tax assets | $206 | $179 | ||
Net deferred income tax assets consist of:
| Years Ended December 31, | ||||||||
| 2004 | 2003 | |||||||
| (in thousands) | ||||||||
Current deferred tax assets | $ | 173,588 | $ | 45,034 | ||||
Long-term deferred tax assets | 491,708 | 404,020 | ||||||
Current deferred tax liabilities | (10,184 | ) | (1,696 | ) | ||||
Long-term deferred tax liabilities | (476,134 | ) | (272,603 | ) | ||||
Net deferred tax assets | $ | 178,978 | $ | 174,755 | ||||
| Years Ended December 31, | ||||||||
| 2005 | 2004 | |||||||
Current deferred income tax assets | $ | 159 | $ | 173 | ||||
Long-term deferred income tax assets | 519 | 492 | ||||||
Current deferred income tax liabilities | (5 | ) | (10 | ) | ||||
Long-term deferred income tax liabilities | (467 | ) | (476 | ) | ||||
| $ | 206 | $ | 179 | |||||
NEWMONT MINING CORPORATION
NOTES TO CONSOLIDATED FINANCIAL STATEMENTS—(Continued)
(dollars in millions, except per share, per ounce and per pound amounts)
These balances include net deferred income tax assets that have been reclassified toAssets andLiabilities of operations held for sale of:
Years Ended December 31, | ||||||||
| 2005 | 2004 | |||||||
Current deferred income tax assets | $ | — | $ | — | ||||
Long-term deferred income tax assets | 2 | (2 | ) | |||||
Current deferred income tax liabilities | — | — | ||||||
Long-term deferred income tax liabilities | (18 | ) | (16 | ) | ||||
| $ | (16 | ) | $ | (18 | ) | |||
Newmont intends to indefinitely reinvest earnings from certain foreign operations. Accordingly, U.S. and non-U.S. income and withholding taxes for which deferred taxes might otherwise be required, have not been provided on a cumulative amount of temporary differences (including, for this purpose, any difference between the tax basis in the stock of a consolidated subsidiary and the amount of the subsidiary’s net equity determined for financial reporting purposes) related to investments in foreign subsidiaries of approximately $819 million$1,013 and $840 million$819 at December 31, 20042005 and 2003,2004, respectively. The additional U.S. and non-U.S. income and
NEWMONT MINING CORPORATION
NOTES TO CONSOLIDATED FINANCIAL STATEMENTS—(Continued)
withholding tax that would arise on the reversal of the temporary differences could be offset in part, by tax credits. Because the determination of the amount of available tax credits and the limitations imposed on the annual utilization of such credits are subject to a highly complex series of calculations and expense allocations, it is impractical to estimate the amount of net income and withholding tax that might be payable.
payable if a reversal of temporary differences occurred.
On October 22, 2004, the President signed the American Jobs Creation Act of 2004 (“the Act”). The Act creates a temporary incentive for U.S. corporations to repatriate accumulated income earned abroad by providing an 85 percent dividends received deduction for certain dividends from controlled foreign corporations. The deduction is subject to a number of limitations. TheDuring September 2005, the Company has not completed its evaluationassessment of whether,the repatriation provision and to what extent, we mightdid not repatriate foreign earnings that have not yet been subject to U.S. income taxation. Based on our analysis to date, it is not reasonable to estimate what amount, if any may be repatriated orfunds under the potential tax liabilities associated with these repatriations. The Company expects to be in a position to finalize its assessment by September 2005.
above provisions of the Act.
As of December 31, 20042005 and December 31, 2003,2004, the Company had (i) $914.5 million$949 and $889.5 million$915 of net operating loss carryforwards, respectively; and (ii) $155.6 million$155 and $111.7 million$156 of tax credit carryforwards, respectively. Of the amounts of net operating loss carryforwards, $100.9 million$74 and $127.1 million,$101, respectively, are attributable to acquired mining operations conducted in the United States and will begin expiring in 2013 if not utilized before then. As of December 31, 2005 and 2004, another $608.1 million$618 and 608, respectively, of net operating lossesloss carryforwards are attributable to acquired mining operations in Australia for which current tax law provides no expiration period. The remaining net operating losses available are attributable to acquired entities and have various temporal and other limitations that may restrict the ultimate realization of the tax benefits of such tax attributes.
Tax credit carryforwards for 2005 and 2004 of $147 and 2003 of $120.9 million and $85.3 million$121 consist of foreign tax credits available in the United States; substantially all such credits not utilized in the interim period will expire at the end of 2011. Other credit carryforwards at the end of 20042005 and 20032004 in the amounts of $34.8 million$8 and $26.4 million,$35, respectively, represent alternative minimum tax credits attributable to the Company’s U.S. operations for which the current tax law provides no period of expiration.
The Company increased the valuation allowance related to deferred tax assets by $145.9 million$147 during 2004.2005. The increase resulted primarily from the recording of additional capital losses in Australia now available to the
NEWMONT MINING CORPORATION
NOTES TO CONSOLIDATED FINANCIAL STATEMENTS—(Continued)
(dollars in millions, except per share, per ounce and per pound amounts)
Company as a result of theAustralia’s new consolidations regulations. The Company has placed a full valuation allowance on these capital losses because of a lack of sufficient positive evidence to support the future realization of these deferred tax assets. ThisThe remaining increase was partially offset by a reduction in the valuation allowance of $58.3 million resulting primarily from the reversal of valuation allowances associated with U.S. foreign tax credits. The remaining valuation allowance is primarily attributable to foreign tax credits and tax losses at the Company’s non-U.S. subsidiaries, whichsubsidiaries. These allowances are required due to the uncertainty of utilizing the foreign tax credits during the prescribed carryforward period fromas a result of certain limitations under U.S. tax law and the lack of sufficient positive evidence concerning the ability of the non-U.S. subsidiaries to generate sufficient taxable income to realize the tax loss carryforwards, respectively.carryforwards. Of the abovetotal $523 and $376 valuation allowance recorded as of December 31, 2005 and 2004, $89 in 2005 and 2003, $91.7 million and $81.3 million, respectively, is$92 in 2004 are attributable to deferred tax assets for which any subsequently recognized tax benefits will be allocated to reduce goodwill related to the acquisition of Normandy.
NEWMONT MINING CORPORATION
NOTES TO CONSOLIDATED FINANCIAL STATEMENTS—(Continued)
The breakdown of the Company’s net deferred tax assets between the United States and foreign taxing jurisdictions is as follows:
Years Ended December 31, | ||||||||
| 2004 | 2003 | |||||||
| (in thousands) | ||||||||
United States | $ | 454,124 | $ | 399,990 | ||||
Foreign | (275,146 | ) | (225,235 | ) | ||||
Deferred tax assets, net | $ | 178,978 | $ | 174,755 | ||||
| Years Ended December 31, | ||||||||
| 2005 | 2004 | |||||||
United States | $ | 479 | $ | 454 | ||||
Foreign | (273 | ) | (275 | ) | ||||
| $ | 206 | $ | 179 | |||||
NOTE 22 RELATED PARTY TRANSACTIONS20 EQUITY INCOME (LOSS) OF AFFILIATES
| Years Ended December 31, | |||||||||||
| 2005 | 2004 | 2003 | |||||||||
European Gold Refineries | $ | 6 | $ | 1 | $ | — | |||||
AGR Matthey Joint Venture | (2 | ) | 1 | 1 | |||||||
Batu Hijau | — | — | 83 | ||||||||
Australian Magnesium Corporation | — | — | (119 | ) | |||||||
| $ | 4 | $ | 2 | $ | (35 | ) | |||||
European Gold Refineries
During 2004,December 2003, Newmont conductedacquired a 50% interest in a joint venture, European Gold Refineries SA (“EGR”), with unrelated Swiss residents holding the remaining 50%. Simultaneously, EGR purchased 100% of Valcambi SA (“Valcambi”), a gold refining business, with and 66.65% of Finorafa SA (“Finorafa”), a gold distribution business. Newmont has no guarantees related to this investment.
Valcambi is a London Gold Delivery precious metals refiner and manufacturer of semi-finished products for the Swiss luxury watch industry, and Finorafa is the second largest distributor and financier of gold products in the Italian market.
AGR in which Matthey Joint Venture
Newmont holds a 40% interest. Gold sales tointerest in a joint venture known as AGR totaled $31.7 million, $33.1 millionMatthey Joint Venture (“AGR”), with Johnson Matthey (Australia) Ltd. and $47.9 million during the years ended December 31, 2004, 2003West Australian Mint holding the remaining interests. Newmont has no
NEWMONT MINING CORPORATION
NOTES TO CONSOLIDATED FINANCIAL STATEMENTS—(Continued)
(dollars in millions, except per share, per ounce and 2002, respectively. See Note 9 for a discussion of Newmont’s investment in AGR.per pound amounts)
Duringguarantees related to this investment. Newmont received dividends of $nil, $2 and $2 during 2005, 2004 and 2003, respectively, from its interests in AGR. See also Note 24 for details of related party transactions between Newmont and 2002, Newmont was entitled to a “Technology and Know-How” royalty from the AGR.
Batu Hijau operation of $8.7 million and $9.1 million, respectively. The amount payable to Newmont as of December 31, 2003 was $64.5 million. Royalty payments could not be made during the deferral period of certain Batu Hijau third party debt. The deferred payments were fully paid in November 2003.
Effective January 1, 2004, Newmont consolidated Batu Hijau (see Note 3). For the year ended December 31, 2003, the Company accounted for its investment in Batu Hijau using the equity method of accounting.
Equity income in Batu Hijau was $83 for the year ended December 31, 2003 (based on 56.25% of Batu Hijau’s net income equal to $57, plus $7 for the elimination of intercompany interest, $10 of intercompany management fees, the cumulative effect of $8 related to the adoption of SFAS No. 143, and other adjustments of $2).
The following is summarized 2003 financial information for Batu Hijau based on accounting principles generally accepted in the United States of America. The results of operations and assets and liabilities of Batu Hijau are not reflected in the Company’s 2003 Consolidated Financial Statements. As described above, the Company accounted for Batu Hijau as an equity investment during 2003.
Year Ended December 31, 2003 | |||
Copper revenues, net of treatment and refining costs | $ | 425 | |
Gold revenues, net of treatment and refining costs | $ | 206 | |
Gross profit(1) | $ | 230 | |
Income before cumulative effect of a change in accounting principle | $ | 115 | |
Net income | $ | 101 | |
| (1) | Gross profit representsRevenues, net of treatment and refining costs,less Costs applicable to sales andDepreciation, depletion and amortization. |
Australian Magnesium Corporation
During 2003, the Company sold its entire interest in Australian Magnesium Corporation (“AMC”) for a nominal amount and recorded a loss of $119 related to its investment in AMC.
NOTE 21 SALES CONTRACTS, COMMODITY AND FINANCIAL INSTRUMENTS
Newmont generally avoids gold hedging. Newmont’s philosophy is to provide shareholders with leverage to gold prices by selling its gold production at market prices. Newmont has entered into derivative contracts to protect the selling price for certain anticipated gold and copper production and to manage risks associated with sales contracts, commodities, interest rates, and foreign currency. Newmont is not required to place collateral with respect to commodity instruments and there are no margin calls associated with such contracts. During 2005, Newmont entered into copper net zero-cost option collar contracts and $/IDR forward purchase contracts. As of December 31, 2005 approximately 360 million pounds of copper are hedged by the copper option collar contracts, which have been designated as cash flow hedges of forecasted copper sales, and as such, changes in the fair value related to the effective portion of the hedges have been recorded inAccumulated other comprehensive income. Approximately 130 million pounds of the copper option collar contracts are accounted for on a mark-to-market basis currently through earnings. The $/IDR forward purchase contracts and Australian dollar net
NEWMONT MINING CORPORATION
NOTES TO CONSOLIDATED FINANCIAL STATEMENTS—(Continued)
(dollars in millions, except per share, per ounce and per pound amounts)
zero-cost option collar contracts have been designated as cash flow hedges of future IDR and Australian dollar expenditures, respectively, and as such, changes in the market value have been recorded inAccumulated other comprehensive income.
For 2005, 2004 and 2003, net gains of $2, $2 and $28, respectively, were included inNet incomefor the ineffective portion of derivative instruments designated as cash flow hedges and a net loss of $5 for 2003 for the change in fair value of gold commodity contracts that do not qualify as hedges (included inGain (loss) on derivative instruments, net). The amount to be reclassified fromAccumulated other comprehensive income (loss),net of taxto income for derivative instruments during the next 12 months is a loss of approximately $41. The maximum period over which hedged forecasted transactions are expected to occur is 6 years.
Certain hedge positions were eliminated in connection with the Voluntary Administration of Newmont Yandal Operations Pty Ltd. See Note 30 for discussion of legal matters. This transaction gave rise to a gain of $107, net of transaction costs, for 2003 (see Note 18).
| Expected Maturity Date | Fair Value | ||||||||||||||||
| 2006 | 2007 | Total/ Average | At December 31, 2005 | At December 31, 2004 | |||||||||||||
Gold Put Option Contracts: | |||||||||||||||||
Ounces (thousands) | 100 | 20 | 120 | $ | (3 | ) | $ | (9 | ) | ||||||||
Average price | $ | 338 | $ | 397 | $ | 348 | |||||||||||
Silver Forward Contracts: | |||||||||||||||||
Ounces (thousands) | 50 | — | 50 | $ | — | $ | (1 | ) | |||||||||
Average price | $ | 6.50 | — | $ | 6.50 | ||||||||||||
Copper Collar Contracts(3): | |||||||||||||||||
Pounds (millions) | 406 | 84 | 490 | $ | (261 | )(1) | $ | (61 | )(2) | ||||||||
Average cap price | $ | 1.35 | $ | 1.40 | $ | 1.36 | |||||||||||
Average floor price | $ | 1.10 | $ | 1.10 | $ | 1.10 | |||||||||||
$/IDR Forward Purchase Contracts: | |||||||||||||||||
$ (millions) | 71 | — | 71 | $ | — | $ | — | ||||||||||
Average rate (IDR/$) | 10,405 | — | 10,405 | ||||||||||||||
Australian Dollar Collar Contracts: | |||||||||||||||||
$ (millions) | $ | 135 | — | $ | 135 | $ | — | $ | 13 | ||||||||
Average cap price ($ per A$1) | $ | 0.80 | — | $ | 0.80 | ||||||||||||
Average floor price ($ per A$1) | $ | 0.55 | — | $ | 0.55 | ||||||||||||
| (1) | The fair value does not include amounts payable ($36) on derivative contracts that have been closed out in December 2005 with the net settlement due and paid in January 2006. |
| (2) | The fair value does not include amounts payable ($7) on derivative contracts that had been closed out in December 2004 with the net settlement due and paid in January 2005. |
| (3) | 56.25% guaranteed by Newmont. |
Provisional Copper and Gold Sales
The Company’s sales based on a provisional sales price contain an embedded derivative that is required to be separated from the host contract for accounting purposes. The host contract is the receivable from the sale of the concentrates at the forward London Metal Exchange price at the time of sale. The embedded derivative, which does not qualify for hedge accounting, is marked to market through earnings each period prior to final
NEWMONT MINING CORPORATION
NOTES TO CONSOLIDATED FINANCIAL STATEMENTS—(Continued)
(dollars in millions, except per share, per ounce and per pound amounts)
settlement. At December 31, 2005 and 2004, respectively, the Company had consolidated embedded copper derivatives on 223 million pounds and 226 million pounds, recorded at an average price of $2.01 and $1.44 per pound, respectively.
For 2005 and 2004, Batu Hijau recorded the following gross revenues before treatment and refining charges, which were subject to final price adjustments at December 31, 2005 and 2004, as follows:
| At December 31, | ||||||
| 2005 | 2004 | |||||
Gross revenue subject to final price adjustments | ||||||
Copper | $ | 447 | $ | 325 | ||
Gold | $ | 19 | $ | 29 | ||
The average final price adjustments realized were as follows:
| Years Ended December 31, | ||||||
| 2005 | 2004 | |||||
Average final price adjustments | ||||||
Copper | 12.1 | % | 13.8 | % | ||
Gold | 1.4 | % | 0.9 | % | ||
Price-Capped Forward Sales Contracts
The Company has a series of price-capped gold sales contracts under which it will realize the lower of the spot price on the delivery date or the capped price ranging from $384 per ounce in 2008, $381 per ounce in 2009 to $392 per ounce in 2011. The initial fair value of the forward sales contracts of $54 was recorded asDeferred revenue from sale of future production and will be included in sales revenue as delivery occurs. Newmont delivered 500,000 ounces in 2005 at the capped price of $350 per ounce and recognized deferred revenue of $14 per ounce. The forward sales contracts are accounted for as normal sales contracts under SFAS No. 133 “Accounting for Derivative Instruments and Hedging Activities” and SFAS No. 138 “Accounting for Certain Derivative Instruments and Certain Hedging Activities-an Amendment to SFAS No. 133.”
Newmont had the following price-capped forward sales contracts outstanding at December 31, 2005:
| Expected Maturity Date | ||||||||||||
Price-capped forward sales contracts: | 2008 | 2009 | 2011 | Total/ Average | ||||||||
Ounces (thousands) | 1,000 | 600 | 250 | 1,850 | ||||||||
Average price | $ | 384 | $ | 381 | $ | 392 | $ | 384 | ||||
Interest Rate Swap Contracts
In 2001, Newmont entered into contracts to hedge the interest rate risk exposure on a portion of its $275 8 5/8% debentures and its $200 8 3/8% debentures. The Company receives fixed-rate interest payments at 8.625% or 8.375% and pays floating-rate interest amounts based on periodic London Interbank Offered Rate (“LIBOR”) settings plus a spread, ranging from 2.60% to 4.25%. These transactions resulted in a reduction in interest expense of $3, $6 and $7 for 2005, 2004 and 2003, respectively. The remaining swap contracts are designated as a hedge against $100 principal of the 8 5/8% debentures. The fair value of the interest rate swaps was $2 and $9 at December 31, 2005 and 2004, respectively.
NEWMONT MINING CORPORATION
NOTES TO CONSOLIDATED FINANCIAL STATEMENTS—(Continued)
(dollars in millions, except per share, per ounce and per pound amounts)
NOTE 22 ACQUISITIONS AND MERGERS
Newmont NFM Limited Scheme of Arrangement
On April 2, 2003, the shareholders of Normandy NFM Limited (an Australian corporation trading at that time as “Newmont NFM” on the Australian Stock Exchange or “ASX”) voted to approve a proposed scheme of arrangement under which Newmont NFM would become an indirect, wholly-owned subsidiary of Newmont Mining Corporation, through the acquisition of the remaining minority interest of Newmont NFM. Under the terms of the scheme, Newmont NFM shareholders could elect to receive 4.40 ASX listed Newmont Mining Corporation CHESS Depositary Interests (“CDIs”), with each CDI equivalent to 0.1 Newmont Mining Corporation share of common stock. As an alternative to receiving Newmont Mining Corporation CDIs, shareholders could sell their Newmont NFM shares back to Newmont NFM under a concurrent buy-back offer of A$16.50 per Newmont NFM share. On April 29, 2003, Newmont Mining Corporation issued 4,437,506 shares of common stock to the CHESS Depository Nominees Pty Ltd, and in turn, 44,375,060 CDIs were issued to former Newmont NFM shareholders. The market value of the newly issued Newmont Mining Corporation shares was approximately $105. The market value of the issued equity securities, together with the cash consideration paid to those shareholders who elected to accept the buy-back offer of approximately $10 (including transaction costs), resulted in a total purchase price of approximately $115. The transaction was accounted for as a purchase of minority interest in accordance with SFAS No. 141 in the second quarter of 2003 and gave rise to goodwill of $93.
NOTE 23 DEFERRED STRIPPING COSTS
Movements in the deferred stripping costs balance were as follows:
| Years Ended December 31, | ||||||||||||
| 2005 | 2004 | 2003 | ||||||||||
Opening balance | $ | 19 | $ | 90 | $ | 55 | ||||||
Consolidation of Batu Hijau | — | (67 | ) | — | ||||||||
Disposition of Ovacik | (4 | ) | — | — | ||||||||
Additions | 160 | 148 | 166 | |||||||||
Amortization | (104 | ) | (152 | ) | (131 | ) | ||||||
Closing balance | $ | 71 | $ | 19 | $ | 90 | ||||||
The deferred and advanced stripping balances are presented in the balance sheet as follows:
| At December 31, | ||||||
| 2005 | 2004 | |||||
Assets: | ||||||
Current | $ | 78 | $ | 44 | ||
Long-term | 100 | 80 | ||||
| 178 | 124 | |||||
Liabilities: | ||||||
Current (Note 12) | 14 | 2 | ||||
Long-term (Note 12) | 93 | 103 | ||||
| 107 | 105 | |||||
Deferred stripping, net | $ | 71 | $ | 19 | ||
NEWMONT MINING CORPORATION
NOTES TO CONSOLIDATED FINANCIAL STATEMENTS—(Continued)
(dollars in millions, except per share, per ounce and per pound amounts)
At some of the Company’s mining operations, deferred stripping costs are charged toCosts applicable to sales as gold or copper is produced and sold using the units of production method based on estimated recoverable quantities of proven and probable gold or copper reserves, using a stripping ratio calculated as the ratio of total tons to be moved to total proven and probable ore reserves, which results in the recognition of the costs of waste removal activities over the life of the mine as gold or copper is produced. The application of the deferred stripping accounting method generally results in an asset on the Consolidated Balance Sheets (Deferred stripping costs), although a liability (Advanced stripping costs) will arise if the actual stripping ratio incurred to date is less than the expected stripping ratio over the life of the mine. TheAdvanced stripping costs at December 31, 2005 and 2004 pertain to Batu Hijau.
See Notes 2 and 31 for additional information concerning deferred stripping.
NOTE 24 RELATED PARTY TRANSACTIONS
Newmont conducted business in 2004 and 2003 with AGR, in which Newmont holds a 40% interest. Minahasa gold sales to AGR totaled $32 and $33 for 2004 and 2003, respectively. See Note 20 for a discussion of Newmont’s investment in AGR.
During 2003, Newmont was entitled to a Technology and Know-How royalty from the Batu Hijau operation of $9. Effective January 1, 2004, Technology and Know-How royalties are eliminated in consolidation.
NOTE 25 DISCONTINUED OPERATIONS AND ASSETS HELD FOR SALE
During June 2005, Newmont announced the pending sale of its Golden Grove copper-zinc operation in Western Australia to Oxiana Limited (“Oxiana”) for proceeds including cash of A$190 and approximately 82 million Oxiana shares. The sale was completed on July 26, 2005 and Newmont realized a $6 pre-tax gain on closing.
During the fourth quarter of 2005, Newmont committed to plans to divest Holloway in Canada and an advanced exploration project in Indonesia. Based upon Newmont’s commitment and the initial interest shown by potential purchasers, Newmont expects the sales to be completed in 2006.
Newmont has accounted for the imminent dispositions in accordance with SFAS No. 144 “Accounting for the Impairment or Disposal of Long-Lived Assets.” The pre-tax loss from impairment of $42 in discontinued operations was comprised of a $39 impairment of Golden Grove in the second quarter of 2005 and a $3 impairment of Holloway in the fourth quarter.
NEWMONT MINING CORPORATION
NOTES TO CONSOLIDATED FINANCIAL STATEMENTS—(Continued)
(dollars in millions, except per share, per ounce and per pound amounts)
The following table details selected financial information included in the(Loss) income from discontinued operations in the consolidated statements of income:
| Years Ended December 31 | ||||||||||||
| 2005 | 2004 | 2003 | ||||||||||
Sales—gold, net | $ | 30 | $ | 28 | $ | 24 | ||||||
Sales—base metals, net | 38 | 85 | 75 | |||||||||
| $ | 68 | $ | 113 | $ | 99 | |||||||
Loss from operations | $ | (32 | ) | $ | (12 | ) | $ | (5 | ) | |||
Loss from impairment | (42 | ) | — | — | ||||||||
Gain on sale of operation | 6 | — | — | |||||||||
Pre-tax loss | (68 | ) | (12 | ) | (5 | ) | ||||||
Income tax benefit | 16 | 49 | 5 | |||||||||
(Loss) income from discontinued operations | $ | (52 | ) | $ | 37 | $ | — | |||||
The major classes ofAssets andLiabilities of operations held for sale in the consolidated balance sheets are as follows:
| At December 31 | ||||||
| 2005 | 2004 | |||||
Assets: | ||||||
Accounts receivable | $ | 1 | $ | 3 | ||
Inventories | 5 | 20 | ||||
Stockpiles and ore on leach pads | — | 2 | ||||
Property, plant and mine development | 65 | 225 | ||||
Goodwill | — | 32 | ||||
Other assets | 3 | 2 | ||||
| $ | 74 | $ | 284 | |||
Liabilities: | ||||||
Accounts payable | $ | 2 | $ | 9 | ||
Reclamation and remediation | 3 | 14 | ||||
Other liabilities | 16 | 32 | ||||
| $ | 21 | $ | 55 | |||
NOTE 26 SUPPLEMENTAL CASH FLOW INFORMATION
Net cash provided by operating activities included the following:following uses of cash:
| Years Ended December 31, | ||||||||||||||||||
| 2004 | 2003 | 2002 | Years Ended December 31, | |||||||||||||||
| (in thousands) | 2005 | 2004 | 2003 | |||||||||||||||
Income taxes, net of refunds | $ | 278,400 | $ | 194,297 | $ | 86,816 | $ | 296 | $ | 278 | $ | 194 | ||||||
Interest, net of amounts capitalized | $ | 92,100 | $ | 123,166 | $ | 137,706 | $ | 84 | $ | 92 | $ | 123 | ||||||
Non-cash settlement of prepaid forward sales obligation | $ | 48 | $ | — | $ | — | ||||||||||||
Non-cash extinguishment of infrastructure bonds | $ | — | $ | 124 | $ | — | ||||||||||||
NEWMONT MINING CORPORATION
NOTES TO CONSOLIDATED FINANCIAL STATEMENTS—(Continued)
(dollars in millions, except per share, per ounce and per pound amounts)
Capital Leases
In 2005, 2004 2003 and 2002,2003, Newmont entered into certain leases that resulted in non-cash increases to Property, plant and mine development, netand Long-term debt of $7.0 million, $2.9 million$1, $7 and $6.1 million,$3, respectively.
Change in Accounting Policy
Effective January 1, 2004 the Batu Hijau investment was fully consolidated (see Note 3). This resulted in the recognition of $82.2 million of Batu Hijau’s cash balances in the Company’s consolidated balance sheet.
Acquisitions
During 2003, the Company completed the acquisition of the remaining minority interest of Newmont NFM. Newmont Mining Corporation issued 4,437,506 common shares to the CHESS Depository Nominees Pty Ltd,
NEWMONT MINING CORPORATION
NOTES TO CONSOLIDATED FINANCIAL STATEMENTS—(Continued)
and in turn, 44,375,060 CDIs were issued to former Newmont NFM shareholders with a value of approximately $105 million. The market value of the issued shares, together with cash consideration of approximately $10 million (including transaction costs), gave rise to a total purchase price of approximately $115 million.
During 2002, the Company acquired 100% of Franco-Nevada and Normandy in exchange for 197 million shares of Newmont stock, the assumption of $2,575.4 million in liabilities, including $913.7 million in debt, and other cash and equity consideration. The fair value of the assets acquired was $6,922.7 million, including goodwill of $3,024.6 million.
Compensation Plans
The Company issued shares of common stock under various employee compensation plans resulting in non-cash increases to stockholders’ equity. See Notes 12 and 13 for additional information concerning compensation plans.
Newmont Australia Infrastructure Bonds
In June 2004, the Company extinguished the $124.1 million Newmont Australia infrastructure bonds obligation and asset (See Note 11).
NOTE 2427 OPERATING LEASE COMMITMENTS
The Company leases certain assets, such as equipment and facilities, under operating leases expiring at various dates through 2011.2012. Future minimum annual lease payments under these leases as of December 31, 20042005 are as follows (in millions):
2005 | $ | 4.2 | |
2006 | 3.8 | ||
2007 | 3.9 | ||
2008 | 3.5 | ||
2009 | 3.1 | ||
Thereafter | 5.9 | ||
| $ | 24.4 | ||
$3 to $4 in each of the next five years totaling $21. Rent expense for the years ended December 31,2005, 2004 and 2003 was $12, $13 and 2002 was $12.5 million, $10.4 million and $9.1 million,$10, respectively.
NOTE 2528 SEGMENT AND RELATED INFORMATION
Newmont predominantly operates in a single industry, namely exploration for and production of gold and copper.gold. Newmont’s major operations are in North America, South America, Indonesiainclude Nevada, Yanacocha, Batu Hijau and Australia/New Zealand. Newmont also has an Exploration Segment and a Merchant Banking Segment.
The Exploration Segment is responsible for all activities, regardless of location, associated with the Company’s efforts to discover new mineralized material that will advance into proven and probable reserves.
Merchant Banking activities include the development of value optimization strategies for operating and non- operating assets, managing the equity investment portfolio, business development activities related to potential
NEWMONT MINING CORPORATION
NOTES TO CONSOLIDATED FINANCIAL STATEMENTS—(Continued)
merger and acquisition analysis and negotiations, managing and building the royalty business, managing the investments in the down-stream gold refining and distribution business, mobilizing and monetizing inactive exploration properties, capitalizing on Newmont’s proprietary technology know-how and acting as an internal resource for other corporate divisions to improve and maximize business outcomes. For segment reporting purposes, the Merchant Banking Segment is considered to be a separate operating segment because it engages in activities from which it earns revenues and incurs expenses and its operating results are regularly and separately reviewed by the Chief Operating Decision Maker.
The Company identifies its reportable segments as those consolidated mining operations or functional groups that represent more than 10% of the combined revenue, profit or loss or total assets of all reported operating segments. Consolidated mining operations or functional groups not meeting this threshold are aggregated at the applicable geographic or corporate level for segment reporting purposes. Earnings from operations do not reflect general corporate expenses, interest (except project-specific interest) or income taxes (except for equity investments). Intercompany revenue and expense amounts have been eliminated within each segment in order to report on the basis that management uses internally for evaluating segment performance.
During the year ended December 31, 2004,2005, Newmont made certain reclassifications in its segment reporting presentation for the years ended December 31,2004 and 2003 and 2002 to conform to changes in presentation reflected in internal management reporting.
The primary reclassifications relate to grouping the operating segments into new regions and eliminating the presentation of certain segments on a stand-alone basis as these segments no longer qualify as reportable segments per the requirements of SFAS No. 131, “Disclosures about Segments of an Enterprise and Related Information.” Newmont’s segments have been presented for the years ended December 31,2005, 2004 2003 and 20022003 as follows:
NEWMONT MINING CORPORATION
NOTES TO CONSOLIDATED FINANCIAL STATEMENTS—(Continued)
(dollars in millions, except per share, per ounce and per pound amounts)
Financial information relating to Newmont’s segments is as follows:
Year Ended December 31, 2005
| Nevada | Yanacocha | Australia/ New Zealand | Batu Hijau | Other Operations | Total Operations | ||||||||||||||||||
Sales, net: | |||||||||||||||||||||||
Gold | $ | 1,053 | $ | 1,490 | $ | 718 | $ | 318 | $ | 208 | $ | 3,787 | |||||||||||
Copper | $ | — | $ | — | $ | — | $ | 672 | $ | — | $ | 672 | |||||||||||
Cost applicable to sales: | |||||||||||||||||||||||
Gold | $ | 807 | $ | 487 | $ | 508 | $ | 109 | $ | 106 | $ | 2,017 | |||||||||||
Copper | $ | — | $ | — | $ | — | $ | 303 | $ | — | $ | 303 | |||||||||||
Depreciation, depletion and amortization: | |||||||||||||||||||||||
Gold | $ | 124 | $ | 205 | $ | 118 | $ | 34 | $ | 29 | $ | 510 | |||||||||||
Copper | $ | — | $ | — | $ | — | $ | 87 | $ | — | $ | 87 | |||||||||||
Other | $ | — | $ | — | $ | 3 | $ | — | $ | 3 | $ | 6 | |||||||||||
Exploration | $ | 17 | $ | 6 | $ | 19 | $ | — | $ | 14 | $ | 56 | |||||||||||
Advanced projects, research and development | $ | — | $ | 8 | $ | — | $ | 2 | $ | 27 | $ | 37 | |||||||||||
Write-down of goodwill | $ | 41 | $ | — | $ | — | $ | — | $ | — | $ | 41 | |||||||||||
Write-down of long-lived assets | $ | — | $ | — | $ | 2 | $ | — | $ | 38 | $ | 40 | |||||||||||
Other income | $ | 8 | $ | 9 | $ | 7 | $ | 7 | $ | 6 | $ | 37 | |||||||||||
Interest expense, net | $ | — | $ | 1 | $ | — | $ | 43 | $ | 1 | $ | 45 | |||||||||||
Pre-tax income (loss) before minority interest and equity income of affiliates | $ | 44 | $ | 793 | $ | 62 | $ | 419 | $ | (12 | ) | $ | 1,306 | ||||||||||
Equity income of affiliates | $ | — | $ | — | $ | — | $ | — | $ | — | $ | — | |||||||||||
Amortization of deferred (advanced) stripping, net | $ | (47 | ) | $ | — | $ | (7 | ) | $ | 1 | $ | (3 | ) | $ | (56 | ) | |||||||
Capital expenditures | $ | 479 | $ | 225 | $ | 98 | $ | 65 | $ | 306 | $ | 1,173 | |||||||||||
Deferred stripping | $ | 149 | $ | — | $ | 19 | $ | (107 | ) | $ | 10 | $ | 71 | ||||||||||
Goodwill | $ | — | $ | — | $ | 191 | $ | — | $ | — | $ | 191 | |||||||||||
Total assets | $ | 2,073 | $ | 1,575 | $ | 1,060 | $ | 2,251 | $ | 893 | $ | 7,852 | |||||||||||
NEWMONT MINING CORPORATION
NOTES TO CONSOLIDATED FINANCIAL STATEMENTS—(Continued)
(dollars in millions, except per share, per ounce and per pound amounts)
| Total Operations | Exploration | Merchant Banking | Corporate Other | Consolidated | |||||||||||||||
Sales, net: | |||||||||||||||||||
Gold | $ | 3,787 | $ | — | $ | — | $ | (53 | ) | $ | 3,734 | ||||||||
Copper | $ | 672 | $ | — | $ | — | $ | — | $ | 672 | |||||||||
Cost applicable to sales: | |||||||||||||||||||
Gold | $ | 2,017 | $ | — | $ | — | $ | — | $ | 2,017 | |||||||||
Copper | $ | 303 | $ | — | $ | — | $ | — | $ | 303 | |||||||||
Depreciation, depletion and amortization: | |||||||||||||||||||
Gold | $ | 510 | $ | — | $ | — | $ | — | $ | 510 | |||||||||
Copper | $ | 87 | $ | — | $ | — | $ | — | $ | 87 | |||||||||
Other | $ | 6 | $ | — | $ | 21 | $ | 20 | $ | 47 | |||||||||
Exploration | $ | 56 | $ | 91 | $ | — | $ | — | $ | 147 | |||||||||
Advanced projects, research and development | $ | 37 | $ | — | $ | 16 | $ | 20 | $ | 73 | |||||||||
Write-down of goodwill | $ | 41 | $ | — | $ | — | $ | — | $ | 41 | |||||||||
Write-down of long-lived assets | $ | 40 | $ | — | $ | — | $ | 3 | $ | 43 | |||||||||
Other income | $ | 37 | $ | — | $ | 174 | $ | 58 | $ | 269 | |||||||||
Interest expense, net | $ | 45 | $ | — | $ | — | $ | 53 | $ | 98 | |||||||||
Pre-tax income (loss) before minority interest and equity income of affiliates | $ | 1,306 | $ | (91 | ) | $ | 136 | $ | (287 | ) | $ | 1,064 | |||||||
Equity income of affiliates | $ | — | $ | — | $ | 4 | $ | — | $ | 4 | |||||||||
Amortization of deferred (advanced) stripping, net | $ | (56 | ) | $ | — | $ | — | $ | — | $ | (56 | ) | |||||||
Capital expenditures | $ | 1,173 | $ | — | $ | 4 | $ | 49 | $ | 1,226 | |||||||||
Deferred stripping | $ | 71 | $ | — | $ | — | $ | — | $ | 71 | |||||||||
Goodwill | $ | 191 | $ | 1,126 | $ | 1,562 | $ | — | $ | 2,879 | |||||||||
Total assets from continuing operations | $ | 7,852 | $ | 1,131 | $ | 2,675 | $ | 2,260 | $ | 13,918 | |||||||||
Assets held for sale | $ | 74 | |||||||||||||||||
Total assets | $ | 13,992 | |||||||||||||||||
NEWMONT MINING CORPORATION
NOTES TO CONSOLIDATED FINANCIAL STATEMENTS—(Continued)
(dollars in millions, except per share, per ounce and per pound amounts)
Year Ended December 31, 2004
(in millions)
| Nevada | Other North America | Yanacocha | Other South America | Australia/ New Zealand | Batu Hijau | Other Indonesia | ||||||||||||||||||||
Sales, net | $ | 1,036.9 | $ | 120.2 | $ | 1,249.9 | $ | 10.1 | $ | 864.3 | $ | 1,073.5 | $ | 31.7 | ||||||||||||
Royalty and dividend income | $ | — | $ | — | $ | — | $ | — | $ | — | $ | — | $ | — | ||||||||||||
Gain (loss) on investments, net | $ | — | $ | — | $ | — | $ | — | $ | — | $ | — | $ | — | ||||||||||||
Gain (loss) on debt extinguishments and derivatives | $ | — | $ | — | $ | — | $ | — | $ | — | $ | — | $ | — | ||||||||||||
Interest income | $ | — | $ | 0.1 | $ | 0.8 | $ | — | $ | 1.3 | $ | 3.5 | $ | — | ||||||||||||
Interest expense | $ | 0.1 | $ | — | $ | 1.1 | $ | — | $ | 0.3 | $ | 43.4 | $ | — | ||||||||||||
Exploration, research and development | $ | 20.2 | $ | — | $ | 19.3 | $ | 2.3 | $ | 19.4 | $ | — | $ | 9.1 | ||||||||||||
Depreciation, depletion and amortization | $ | 126.8 | $ | 23.4 | $ | 198.0 | $ | 2.3 | $ | 158.5 | $ | 117.5 | $ | 2.6 | ||||||||||||
Pre-tax income (loss) before minority interest and equity income of affiliates | $ | 185.4 | $ | 18.7 | $ | 595.1 | $ | (7.5 | ) | $ | 38.0 | $ | 524.6 | $ | (15.1 | ) | ||||||||||
Equity income of affiliates | $ | — | $ | — | $ | — | $ | — | $ | — | $ | — | $ | — | ||||||||||||
Cumulative effect of a change in accounting principle, net of tax | $ | — | $ | — | $ | — | $ | — | $ | — | $ | (83.8 | ) | $ | — | |||||||||||
Amortization of deferred (advanced) stripping, net | $ | (39.2 | ) | $ | (0.4 | ) | $ | — | $ | — | $ | 7.6 | $ | 38.0 | $ | — | ||||||||||
Write-down of goodwill | $ | — | $ | — | $ | — | $ | — | $ | 51.8 | $ | — | $ | — | ||||||||||||
Write-down of long-lived assets | $ | — | $ | — | $ | 4.2 | $ | — | $ | 14.0 | $ | — | $ | — | ||||||||||||
Capital expenditures | $ | 168.7 | $ | 11.3 | $ | 231.9 | $ | 4.4 | $ | 119.5 | $ | 34.6 | $ | — | ||||||||||||
Deferred (advanced) stripping | $ | 101.5 | $ | 7.1 | $ | — | $ | — | $ | 12.1 | $ | (105.3 | ) | $ | — | |||||||||||
Total assets | $ | 1,613.6 | $ | 110.4 | $ | 1,201.2 | $ | 17.2 | $ | 1,317.3 | $ | 2,133.5 | $ | 96.8 | ||||||||||||
| Central Asia | Africa | Exploration | Merchant Banking | Corporate and Other | Consolidated | |||||||||||||||||||
Sales, net | $ | 129.5 | $ | — | $ | — | $ | — | $ | 8.1 | $ | 4,524.2 | ||||||||||||
Royalty and dividend income | $ | — | $ | — | $ | — | $ | 65.8 | $ | — | $ | 65.8 | ||||||||||||
Gain (loss) on investments, net | $ | — | $ | — | $ | — | $ | (39.0 | ) | $ | — | $ | (39.0 | ) | ||||||||||
Gain (loss) on debt extinguishments and derivatives | $ | — | $ | — | $ | — | $ | (0.2 | ) | $ | 2.3 | $ | 2.1 | |||||||||||
Interest income | $ | 0.1 | $ | — | $ | — | $ | 0.7 | $ | 16.9 | $ | 23.4 | ||||||||||||
Interest expense | $ | 0.6 | $ | — | $ | — | $ | — | $ | 52.1 | $ | 97.6 | ||||||||||||
Exploration, research and development | $ | 3.1 | $ | 16.5 | $ | 73.8 | $ | 6.4 | $ | 22.3 | $ | 192.4 | ||||||||||||
Depreciation, depletion and amortization | $ | 29.0 | $ | 0.8 | $ | 3.2 | $ | 24.3 | $ | 10.1 | $ | 696.5 | ||||||||||||
Pre-tax income (loss) before minority interest and equity income of affiliates | $ | 18.6 | $ | (21.6 | ) | $ | (74.2 | ) | $ | 7.3 | $ | (170.3 | ) | $ | 1,099.0 | |||||||||
Equity income of affiliates | $ | — | $ | — | $ | — | $ | 2.6 | $ | — | $ | 2.6 | ||||||||||||
Cumulative effect of a change in accounting principle, net of tax | $ | — | $ | — | $ | — | $ | — | $ | 36.7 | $ | (47.1 | ) | |||||||||||
Amortization of deferred (advanced) stripping, net | $ | (1.9 | ) | $ | — | $ | — | $ | — | $ | — | $ | 4.1 | |||||||||||
Write-down of goodwill | $ | — | $ | — | $ | — | $ | — | $ | — | $ | 51.8 | ||||||||||||
Write-down of long-lived assets | $ | 17.7 | $ | — | $ | 0.1 | $ | 1.0 | $ | 2.3 | $ | 39.3 | ||||||||||||
Capital expenditures | $ | 17.8 | $ | 92.3 | $ | 0.3 | $ | 4.6 | $ | 32.6 | $ | 718.0 | ||||||||||||
Deferred (advanced) stripping | $ | 3.6 | $ | — | $ | — | $ | — | $ | — | $ | 19.0 | ||||||||||||
Total assets | $ | 156.2 | $ | 352.6 | $ | 1,147.1 | $ | 2,514.3 | $ | 2,110.5 | $ | 12,770.7 | ||||||||||||
| Nevada | Yanacocha | Australia/ New Zealand | Batu Hijau | Other Operations | Total Operations | |||||||||||||||||
Sales, net: | ||||||||||||||||||||||
Gold | $ | 1,037 | $ | 1,250 | $ | 779 | $ | 288 | $ | 264 | $ | 3,618 | ||||||||||
Copper | $ | — | $ | — | $ | — | $ | 786 | $ | — | $ | 786 | ||||||||||
Cost applicable to sales: | ||||||||||||||||||||||
Gold | $ | 716 | $ | 432 | $ | 528 | $ | 91 | $ | 143 | $ | 1,910 | ||||||||||
Copper | $ | — | $ | — | $ | — | $ | 305 | $ | — | $ | 305 | ||||||||||
Depreciation, depletion and amortization: | ||||||||||||||||||||||
Gold | �� | $ | 127 | $ | 198 | $ | 126 | $ | 28 | $ | 47 | $ | 526 | |||||||||
Copper | $ | — | $ | — | $ | — | $ | 90 | $ | — | $ | 90 | ||||||||||
Other | $ | — | $ | — | $ | 4 | $ | — | $ | 4 | $ | 8 | ||||||||||
Exploration | $ | 14 | $ | 4 | $ | 15 | $ | — | $ | 1 | $ | 34 | ||||||||||
Advanced projects, research and development | $ | 6 | $ | 16 | $ | — | $ | — | $ | 29 | $ | 51 | ||||||||||
Write-down of goodwill | $ | — | $ | — | $ | 52 | $ | — | $ | — | $ | 52 | ||||||||||
Write-down of long-lived assets | $ | — | $ | 4 | $ | 14 | $ | — | $ | 18 | $ | 36 | ||||||||||
Other income | $ | 7 | $ | 4 | $ | 18 | $ | 3 | $ | — | $ | 32 | ||||||||||
Interest expense, net | $ | — | $ | 1 | $ | — | $ | 43 | $ | 1 | $ | 45 | ||||||||||
Pre-tax income (loss) before minority interest and equity income of affiliates | $ | 185 | $ | 597 | $ | 49 | $ | 524 | $ | (2 | ) | $ | 1,353 | |||||||||
Equity income of affiliates | $ | — | $ | — | $ | — | $ | — | $ | — | $ | — | ||||||||||
Cumulative effect of a change in accounting principle, net of tax | $ | — | $ | — | $ | — | $ | (84 | ) | $ | — | $ | (84 | ) | ||||||||
Amortization of deferred (advanced) stripping, net | $ | (39 | ) | $ | — | $ | 8 | $ | 38 | $ | (3 | ) | $ | 4 | ||||||||
Capital expenditures | $ | 169 | $ | 232 | $ | 89 | $ | 35 | $ | 120 | $ | 645 | ||||||||||
Deferred stripping | $ | 101 | $ | — | $ | 12 | $ | (105 | ) | $ | 11 | $ | 19 | |||||||||
Goodwill | $ | 41 | $ | — | $ | 191 | $ | — | $ | — | $ | 232 | ||||||||||
Total assets from continuing operations | $ | 1,614 | $ | 1,201 | $ | 1,066 | $ | 2,134 | $ | 700 | $ | 6,715 | ||||||||||
NEWMONT MINING CORPORATION
NOTES TO CONSOLIDATED FINANCIAL STATEMENTS—(Continued)
(dollars in millions, except per share, per ounce and per pound amounts)
| Total Operations | Exploration | Merchant Banking | Corporate and Other | Consolidated | |||||||||||||||
Sales, net: | |||||||||||||||||||
Gold | $ | 3,618 | $ | — | $ | — | $ | 7 | $ | 3,625 | |||||||||
Copper | $ | 786 | $ | — | $ | — | $ | — | $ | 786 | |||||||||
Cost applicable to sales: | |||||||||||||||||||
Gold | $ | 1,910 | $ | — | $ | — | $ | — | $ | 1,910 | |||||||||
Copper | $ | 305 | $ | — | $ | — | $ | — | $ | 305 | |||||||||
Depreciation, depletion and amortization: | |||||||||||||||||||
Gold | $ | 526 | $ | — | $ | — | $ | — | $ | 526 | |||||||||
Copper | $ | 90 | $ | — | $ | — | $ | — | $ | 90 | |||||||||
Other | $ | 8 | $ | — | $ | 24 | $ | 14 | $ | 46 | |||||||||
Exploration | $ | 34 | $ | 73 | $ | — | $ | — | $ | 107 | |||||||||
Advanced projects, research and development | $ | 51 | $ | — | $ | 7 | $ | 22 | $ | 80 | |||||||||
Write-down of goodwill | $ | 52 | $ | — | $ | — | $ | — | $ | 52 | |||||||||
Write-down of long-lived assets | $ | 36 | $ | — | $ | 1 | $ | 2 | $ | 39 | |||||||||
Other income | $ | 32 | $ | — | $ | 41 | $ | 29 | $ | 102 | |||||||||
Interest expense, net | $ | 45 | $ | — | $ | — | $ | 53 | $ | 98 | |||||||||
Pre-tax income (loss) before minority interest and equity income of affiliates | $ | 1,353 | $ | (74 | ) | $ | 6 | $ | (174 | ) | $ | 1,111 | |||||||
Equity income of affiliates | $ | — | $ | — | $ | 2 | $ | — | $ | 2 | |||||||||
Cumulative effect of a change in accounting principle, net of tax | $ | (84 | ) | $ | — | $ | — | $ | 37 | $ | (47 | ) | |||||||
Amortization of deferred (advanced) stripping, net | $ | 4 | $ | — | $ | — | $ | — | $ | 4 | |||||||||
Capital expenditures | $ | 645 | $ | — | $ | 5 | $ | 33 | $ | 683 | |||||||||
Deferred stripping | $ | 19 | $ | — | $ | — | $ | — | $ | 19 | |||||||||
Goodwill | $ | 232 | $ | 1,129 | $ | 1,633 | $ | — | $ | 2,994 | |||||||||
Total assets from continuing operations | $ | 6,715 | $ | 1,147 | $ | 2,514 | $ | 2,116 | $ | 12,492 | |||||||||
Assets held for sale | $ | 284 | |||||||||||||||||
Total assets | $ | 12,776 | |||||||||||||||||
NEWMONT MINING CORPORATION
NOTES TO CONSOLIDATED FINANCIAL STATEMENTS—(Continued)
(dollars in millions, except per share, per ounce and per pound amounts)
Year Ended December 31, 2003
(in millions)
| Nevada | Other America | Yanacocha | Other South America | Australia/ New Zealand | ||||||||||||||||
Sales, net | $ | 901.3 | $ | 150.1 | $ | 1,036.4 | $ | 64.1 | $ | 807.4 | ||||||||||
Royalty and dividend income | $ | — | $ | — | $ | — | $ | — | $ | — | ||||||||||
Gain on investment, net | $ | — | $ | — | $ | — | $ | — | $ | — | ||||||||||
Gain on extinguishment of debt and derivatives liability, net | $ | — | $ | — | $ | — | $ | — | $ | — | ||||||||||
Interest income | $ | — | $ | 0.1 | $ | 0.9 | $ | — | $ | 5.2 | ||||||||||
Interest expense | $ | 0.1 | $ | — | $ | 2.6 | $ | — | $ | — | ||||||||||
Exploration, research and development | $ | 17.0 | $ | 0.2 | $ | 12.8 | $ | — | $ | 16.6 | ||||||||||
Depreciation, depletion and amortization | $ | 137.7 | $ | 34.6 | $ | 160.4 | $ | 6.8 | $ | 156.7 | ||||||||||
Pre-tax income (loss) before minority interest, equity income (loss) and impairment of affiliates and cumulative effect of a change in accounting principle | $ | 150.5 | $ | (7.4 | ) | $ | 476.4 | $ | 13.8 | $ | 57.0 | |||||||||
Equity loss and impairment of Australian Magnesium Corporation | $ | — | $ | — | $ | — | $ | — | $ | — | ||||||||||
Equity income of affiliates | $ | — | $ | — | $ | — | $ | — | $ | 0.8 | ||||||||||
Cumulative effect of a change in accounting principle, net of tax | $ | (14.4 | ) | $ | (3.4 | ) | $ | (32.4 | ) | $ | (0.2 | ) | $ | (3.4 | ) | |||||
Amortization of deferred stripping, net | $ | (25.0 | ) | $ | (0.3 | ) | $ | — | $ | — | $ | (10.6 | ) | |||||||
Write down of long-lived assets | $ | — | $ | 28.4 | $ | 0.3 | $ | — | $ | 2.2 | ||||||||||
Capital expenditures | $ | 111.9 | $ | 5.8 | $ | 205.7 | $ | 0.9 | $ | 119.2 | ||||||||||
Deferred stripping costs | $ | 62.3 | $ | 6.7 | $ | — | $ | — | $ | 19.7 | ||||||||||
Total assets | $ | 1,490.8 | $ | 103.6 | $ | 1,204.1 | $ | 19.7 | $ | 1,682.4 | ||||||||||
| Nevada | Yanacocha | Australia/ New Zealand | Batu Hijau | Other Operations | Total Operations | ||||||||||||||||||
Sales, net: | |||||||||||||||||||||||
Gold | $ | 901 | $ | 1,037 | $ | 732 | $ | — | $ | 365 | $ | 3,035 | |||||||||||
Copper | $ | — | $ | — | $ | — | $ | — | $ | — | $ | — | |||||||||||
Cost applicable to sales: | |||||||||||||||||||||||
Gold | $ | 598 | $ | 362 | $ | 484 | $ | — | $ | 190 | $ | 1,634 | |||||||||||
Copper | $ | — | $ | — | $ | — | $ | — | $ | — | $ | — | |||||||||||
Depreciation, depletion and amortization: | |||||||||||||||||||||||
Gold | $ | 138 | $ | 160 | $ | 122 | $ | — | $ | 68 | $ | 488 | |||||||||||
Copper | $ | — | $ | — | $ | — | $ | — | $ | — | $ | — | |||||||||||
Other | $ | — | $ | — | $ | 5 | $ | — | $ | 3 | $ | 8 | |||||||||||
Exploration | $ | 17 | $ | 13 | $ | 13 | $ | — | $ | 1 | $ | 44 | |||||||||||
Advanced projects, research and development | $ | — | $ | — | $ | — | $ | — | $ | 16 | $ | 16 | |||||||||||
Write-down of long-lived assets | $ | — | $ | — | $ | 2 | $ | — | $ | 28 | $ | 30 | |||||||||||
Other income | $ | 2 | $ | — | $ | 16 | $ | — | $ | — | $ | 18 | |||||||||||
Interest expense, net | $ | — | $ | 3 | $ | — | $ | — | $ | 1 | $ | 4 | |||||||||||
Pre-tax income (loss) before minority interest and equity income of affiliates | $ | 150 | $ | 476 | $ | 60 | $ | — | $ | 47 | $ | 733 | |||||||||||
Equity income (loss) of affiliates | $ | — | $ | — | $ | 1 | $ | — | $ | — | $ | 1 | |||||||||||
Cumulative effect of a change in accounting principle, net of tax | $ | (14 | ) | $ | (33 | ) | $ | (3 | ) | $ | — | $ | (9 | ) | $ | (59 | ) | ||||||
Amortization of deferred (advanced) stripping, net | $ | (25 | ) | $ | — | $ | (11 | ) | $ | — | $ | (1 | ) | $ | (37 | ) | |||||||
Capital expenditures | $ | 112 | $ | 206 | $ | 101 | $ | — | $ | 39 | $ | 458 | |||||||||||
Deferred stripping | $ | 62 | $ | — | $ | 19 | $ | — | $ | 9 | $ | 90 | |||||||||||
Goodwill | $ | 41 | $ | — | $ | 247 | $ | — | $ | — | $ | 288 | |||||||||||
Total assets from continuing operations | $ | 1,491 | $ | 1,204 | $ | 1,327 | $ | — | $ | 606 | $ | 4,628 | |||||||||||
NEWMONT MINING CORPORATION
NOTES TO CONSOLIDATED FINANCIAL STATEMENTS—(Continued)
| Indonesia | Central Asia | Africa | Exploration | Merchant Banking | Corporate and Other | Consolidated | |||||||||||||||||||||
Sales, net | $ | 35.0 | $ | 139.9 | $ | — | $ | — | $ | — | $ | 23.6 | $ | 3,157.8 | |||||||||||||
Royalty and dividend income | $ | — | $ | — | $ | — | $ | — | $ | 56.3 | $ | — | $ | 56.3 | |||||||||||||
Gain on investments, net | $ | — | $ | — | $ | — | $ | — | $ | 83.2 | $ | — | $ | 83.2 | |||||||||||||
Gain on extinguishment of debt and derivatives liability, net | $ | — | $ | — | $ | — | $ | — | $ | 186.7 | $ | — | $ | 186.7 | |||||||||||||
Interest income | $ | — | $ | 0.1 | $ | — | $ | — | $ | 0.2 | $ | 4.0 | $ | 10.5 | |||||||||||||
Interest expense | $ | — | $ | 0.7 | $ | — | $ | — | $ | 0.9 | $ | 84.3 | $ | 88.6 | |||||||||||||
Exploration, research and development | $ | 7.2 | $ | 2.3 | $ | 7.7 | $ | 32.4 | $ | 7.3 | $ | 11.7 | $ | 115.2 | |||||||||||||
Depreciation, depletion and amortization | $ | 8.4 | $ | 24.1 | $ | 1.7 | $ | 3.3 | $ | 26.5 | $ | 4.3 | $ | 564.5 | |||||||||||||
Pre-tax income (loss) before minority interest, equity income (loss) and impairment of affiliates and cumulative effect of a change in accounting principle | $ | (9.5 | ) | $ | 56.6 | $ | (9.7 | ) | $ | (35.9 | ) | $ | 301.3 | $ | (67.7 | ) | $ | 925.4 | |||||||||
Equity loss and impairment of Australian Magnesium Corporation | $ | — | $ | — | $ | — | $ | — | $ | — | $ | (119.5 | ) | $ | (119.5 | ) | |||||||||||
Equity income of affiliates | $ | — | $ | — | $ | — | $ | — | $ | 0.7 | $ | 82.9 | $ | 84.4 | |||||||||||||
Cumulative effect of a change in accounting principle, net of tax | $ | (3.4 | ) | $ | (0.8 | ) | $ | — | $ | — | $ | — | $ | 23.5 | $ | (34.5 | ) | ||||||||||
Amortization of deferred stripping, net | $ | — | $ | (1.1 | ) | $ | — | $ | — | $ | — | $ | — | $ | (37.0 | ) | |||||||||||
Write-down of long-lived assets | $ | — | $ | — | $ | — | $ | 0.2 | $ | 1.7 | $ | 2.5 | $ | 35.3 | |||||||||||||
Capital expenditures | $ | — | $ | 14.2 | $ | 20.7 | $ | 0.6 | $ | 1.6 | $ | 23.9 | $ | 504.5 | |||||||||||||
Deferred stripping costs | $ | — | $ | 1.7 | $ | — | $ | — | $ | — | $ | — | $ | 90.4 | |||||||||||||
Total assets | $ | 23.3 | $ | 188.3 | $ | 216.7 | $ | 1,183.0 | $ | 2,091.4 | $ | 2,494.9 | $ | 10,698.2 | |||||||||||||
NEWMONT MINING CORPORATION(dollars in millions, except per share, per ounce and per pound amounts)
NOTES TO CONSOLIDATED FINANCIAL STATEMENTS—(Continued)
Year Ended December 31, 2002
(in millions)
| Nevada | Other America | Yanacocha | Other South America | Australia/ New Zealand | |||||||||||||
Sales, net | $ | 848.2 | $ | 156.3 | $ | 713.4 | $ | 87.7 | $ | 638.7 | |||||||
Royalty and dividend income | $ | — | $ | — | $ | — | $ | — | $ | — | |||||||
Gain on investment, net | $ | — | $ | — | $ | — | $ | — | $ | — | |||||||
Interest income | $ | — | $ | 0.1 | $ | 0.4 | $ | — | $ | 11.2 | |||||||
Interest expense | $ | 0.2 | $ | — | $ | 8.9 | $ | 0.2 | $ | 0.2 | |||||||
Exploration, research and development | $ | 15.5 | $ | — | $ | 11.1 | $ | 0.7 | $ | 12.2 | |||||||
Depreciation, depletion and amortization | $ | 118.2 | $ | 36.6 | $ | 121.5 | $ | 13.8 | $ | 147.0 | |||||||
Pre-tax income (loss) before minority interest, equity income (loss) and impairment of affiliates and cumulative effect of a change in accounting principle | $ | 49.8 | $ | 18.5 | $ | 266.8 | $ | 24.3 | $ | 57.9 | |||||||
Equity loss and impairment of Australian Magnesium Corporation | $ | — | $ | — | $ | — | $ | — | $ | — | |||||||
Equity income of affiliates | $ | — | $ | — | $ | — | $ | — | $ | 9.7 | |||||||
Cumulative effect of a change in accounting principle, net of tax | $ | 1.5 | $ | 10.9 | $ | — | $ | — | $ | (0.6 | ) | ||||||
Amortization of deferred stripping, net | $ | 48.8 | $ | (0.9 | ) | $ | — | $ | — | $ | (10.3 | ) | |||||
Write down of long-lived assets | $ | — | $ | — | $ | — | $ | 0.5 | $ | 3.2 | |||||||
Capital expenditures | $ | 54.6 | $ | 9.2 | $ | 146.2 | $ | 0.6 | $ | 68.8 | |||||||
Deferred stripping costs | $ | 37.4 | $ | 6.3 | $ | — | $ | — | $ | 11.7 | |||||||
Total assets | $ | 1,474.7 | $ | 140.5 | $ | 1,126.9 | $ | 34.6 | $ | 1,859.7 | |||||||
NEWMONT MINING CORPORATION
NOTES TO CONSOLIDATED FINANCIAL STATEMENTS—(Continued)
| Indonesia | Central Asia | Africa | Exploration | Merchant Banking | Corporate and Other | Consolidated | |||||||||||||||||||||
Sales, net | $ | 47.9 | $ | 119.0 | $ | 4.4 | $ | — | $ | — | $ | 6.6 | $ | 2,622.2 | |||||||||||||
Royalty and dividend income | $ | — | $ | — | $ | — | $ | — | $ | 35.7 | $ | — | $ | 35.7 | |||||||||||||
Gain on investments, net | $ | — | $ | — | $ | — | $ | — | $ | 47.1 | $ | — | $ | 47.1 | |||||||||||||
Interest income | $ | — | $ | 0.1 | $ | — | $ | — | $ | 1.3 | $ | 1.0 | $ | 14.1 | |||||||||||||
Interest expense | $ | — | $ | 0.8 | $ | — | $ | — | $ | — | $ | 119.3 | $ | 129.6 | |||||||||||||
Exploration, research and development | $ | 3.5 | $ | 1.8 | $ | 4.9 | $ | 25.1 | $ | 1.3 | $ | 12.8 | $ | 88.9 | |||||||||||||
Depreciation, depletion and amortization | $ | 10.2 | $ | 21.9 | $ | — | $ | 7.7 | $ | 22.6 | $ | 6.1 | $ | 505.6 | |||||||||||||
Pre-tax income (loss) before minority interest, equity income (loss) and impairment of affiliates and cumulative effect of a change in accounting principle | $ | (3.9 | ) | $ | 43.0 | $ | (8.3 | ) | $ | (32.8 | ) | $ | 63.1 | $ | (262.1 | ) | $ | 216.3 | |||||||||
Equity loss and impairment of Australian Magnesium Corporation | $ | — | $ | — | $ | — | $ | — | $ | — | $ | (1.8 | ) | $ | (1.8 | ) | |||||||||||
Equity income of affiliates | $ | — | $ | — | $ | — | $ | — | $ | 1.3 | $ | 42.2 | $ | 53.2 | |||||||||||||
Cumulative effect of a change in accounting principle, net of tax | $ | — | $ | — | $ | — | $ | — | $ | — | $ | (4.1 | ) | $ | 7.7 | ||||||||||||
Amortization of deferred stripping, net | $ | — | $ | (0.4 | ) | $ | — | $ | — | $ | — | $ | — | $ | 37.2 | ||||||||||||
Write-down of long-lived assets | $ | — | $ | — | $ | — | $ | — | $ | — | $ | — | $ | 3.7 | |||||||||||||
Capital expenditures | $ | — | $ | 7.9 | $ | — | $ | — | $ | 1.1 | $ | 11.7 | $ | 300.1 | |||||||||||||
Deferred stripping costs | $ | — | $ | — | $ | — | $ | — | $ | — | $ | — | $ | 55.4 | |||||||||||||
Total assets | $ | 110.0 | $ | 176.9 | $ | 145.3 | $ | 1,168.9 | $ | 2,240.0 | $ | 1,250.1 | $ | 9,727.6 | |||||||||||||
NEWMONT MINING CORPORATION
NOTES TO CONSOLIDATED FINANCIAL STATEMENTS—(Continued)
| Total Operations | Exploration | Merchant Banking | Corporate and Other | Consolidated | |||||||||||||||
Sales, net: | |||||||||||||||||||
Gold | $ | 3,035 | $ | — | $ | — | $ | 24 | $ | 3,059 | |||||||||
Copper | $ | — | $ | — | $ | — | $ | — | $ | — | |||||||||
Cost applicable to sales: | |||||||||||||||||||
Gold | $ | 1,634 | $ | — | $ | — | $ | — | $ | 1,634 | |||||||||
Copper | $ | — | $ | — | $ | — | $ | — | $ | — | |||||||||
Depreciation, depletion and amortization: | |||||||||||||||||||
Gold | $ | 488 | $ | — | $ | — | $ | — | $ | 488 | |||||||||
Copper | $ | — | $ | — | $ | — | $ | — | $ | — | |||||||||
Other | $ | 8 | $ | — | $ | 26 | $ | 8 | $ | 42 | |||||||||
Exploration | $ | 44 | $ | 32 | $ | — | $ | — | $ | 76 | |||||||||
Advanced projects, research and development | $ | 16 | $ | — | $ | 7 | $ | 12 | $ | 35 | |||||||||
Write-down of long-lived assets | $ | 30 | $ | — | $ | 2 | $ | 3 | $ | 35 | |||||||||
Other income | $ | 18 | $ | — | $ | 296 | $ | 137 | $ | 451 | |||||||||
Interest expense, net | $ | 4 | $ | — | $ | 1 | $ | 84 | $ | 89 | |||||||||
Pre-tax income (loss) before minority interest and equity income of affiliates | $ | 733 | $ | (36 | ) | $ | 301 | $ | (67 | ) | $ | 931 | |||||||
Equity income (loss) of affiliates | $ | 1 | $ | — | $ | — | $ | (36 | ) | $ | (35 | ) | |||||||
Cumulative effect of a change in accounting principle, net of tax | $ | (59 | ) | $ | — | $ | — | $ | 24 | $ | (35 | ) | |||||||
Amortization of deferred (advanced) stripping, net | $ | (37 | ) | $ | — | $ | — | $ | — | $ | (37 | ) | |||||||
Capital expenditures | $ | 458 | $ | 1 | $ | 2 | $ | 23 | $ | 484 | |||||||||
Deferred stripping | $ | 90 | $ | — | $ | — | $ | — | $ | 90 | |||||||||
Goodwill | $ | 288 | $ | 1,129 | $ | 1,593 | $ | — | $ | 3,010 | |||||||||
Total assets from continuing operations | $ | 4,628 | $ | 1,183 | $ | 2,091 | $ | 2,495 | $ | 10,397 | |||||||||
Assets held for sale | $ | 301 | |||||||||||||||||
Total assets | $ | 10,698 | |||||||||||||||||
Revenues from export and domestic sales were as follows:
| Years Ended December 31, | ||||||||||||||||||
| 2004 | 2003 | 2002 | Years Ended December 31, | |||||||||||||||
| (in millions) | 2005 | 2004 | 2003 | |||||||||||||||
Europe | $ | 3,706.1 | $ | 2,910.7 | $ | 2,398.2 | $ | 3,486 | $ | 3,684 | $ | 2,911 | ||||||
India | 277 | 22 | — | |||||||||||||||
Japan | 331.9 | 16.1 | 21.3 | 267 | 312 | — | ||||||||||||
Korea | 175.8 | 9.9 | 5.5 | 172 | 168 | — | ||||||||||||
United States | 96.8 | 4.5 | 0.9 | — | 97 | 5 | ||||||||||||
Other | 213.6 | 216.6 | 196.3 | 204 | 128 | 143 | ||||||||||||
| $ | 4,524.2 | $ | 3,157.8 | $ | 2,622.2 | $ | 4,406 | $ | 4,411 | $ | 3,059 | |||||||
NEWMONT MINING CORPORATION
NOTES TO CONSOLIDATED FINANCIAL STATEMENTS—(Continued)
(dollars in millions, except per share, per ounce and per pound amounts)
Long-lived assets, excluding deferred tax assets, in the United States and other countries are as follows:
| At December 31, | ||||||||||||||||||
| 2004 | 2003 | 2002 | At December 31, | |||||||||||||||
| (in millions) | 2005 | 2004 | 2003 | |||||||||||||||
United States(1) | $ | 4,999.2 | $ | 4,275.1 | $ | 4,345.5 | $ | 5,605 | $ | 5,023 | $ | 4,275 | ||||||
Australia | 925.0 | 1,256.4 | 1,477.8 | 700 | 925 | 1,256 | ||||||||||||
Canada | 157.0 | 158.7 | 400.9 | 316 | 157 | 159 | ||||||||||||
Indonesia | 1,857.9 | 798.9 | 705.0 | 1,808 | 1,858 | 799 | ||||||||||||
Peru | 1,007.5 | 920.5 | 866.0 | 1,110 | 1,008 | 920 | ||||||||||||
Other | 618.2 | 527.7 | 477.5 | 900 | 618 | 528 | ||||||||||||
| $ | 9,564.8 | $ | 7,937.3 | $ | 8,272.7 | $ | 10,439 | $ | 9,589 | $ | 7,937 | |||||||
| (1) | Goodwill allocated to Exploration and Merchant Banking (see Note |
The Company is not economically dependent on a limited number of customers for the sale of its product because gold can be sold through numerous gold market traders worldwide. In 2005, sales to one customer, Bank of Nova Scotia, totaled approximately $1,214 or 28% of total sales. In 2004, sales to two customers, Bank of Nova Scotia and Barclays, each totaled approximately $1.1 billion$1,056 and $1,137, respectively, or 25% of total sales.sales, each. In 2003, and 2002, sales to one customer, Bank of Nova Scotia, totaled approximately $1.5 billion and $1.2 billion$1,455 or 46%48% of total sales.
NEWMONT MINING CORPORATION
NOTES TO CONSOLIDATED FINANCIAL STATEMENTS—(Continued)
(dollars in millions, except per share, per ounce and per pound amounts)
NOTE 2629 CONSOLIDATING FINANCIAL STATEMENTS
The following Consolidating Financial Statements are presented to satisfy disclosure requirements of Rule 3-10(e) of Regulation S-X resulting from the inclusion of Newmont USA Limited (“Newmont USA”), a wholly-owned subsidiary of Newmont Mining Corporation, as a co-registrant with Newmont Mining Corporation on a shelf registration statement on Form S-3 filed under the Securities Act of 1933 under which securities of Newmont Mining Corporation (including debt securities which may be guaranteed by Newmont USA) may be issued from time to time (the “Shelf Registration Statement”). To the extent Newmont Mining Corporation issues debt securities under the Shelf Registration Statement, it is expected that Newmont USA will provide a guarantee of that debt. In accordance with Rule 3-10(e) of Regulation S-X, Newmont USA, as the subsidiary guarantor, is 100% owned by Newmont Mining Corporation, the guarantee will be full and unconditional, and it is not expected that any other subsidiary of Newmont Mining Corporation will guarantee any security issued under the Shelf Registration Statement. There are no significant restrictions on the ability of Newmont USA to obtain funds from its subsidiaries by dividend or loan.
Consolidating Statement of Operations | Newmont Mining Corporation | Newmont USA | Other Subsidiaries | Eliminations | Newmont Mining Corporation Consolidated | |||||||||||||||
| (in millions) | ||||||||||||||||||||
For the Year Ended December 31, 2004 | ||||||||||||||||||||
Revenues | ||||||||||||||||||||
Sales—gold, net | $ | — | $ | 2,874.2 | $ | 779.4 | $ | — | $ | 3,653.6 | ||||||||||
Sales—base metals, net | — | 785.9 | 84.7 | — | 870.6 | |||||||||||||||
| — | 3,660.1 | 864.1 | — | 4,524.2 | ||||||||||||||||
Costs and expenses | ||||||||||||||||||||
Costs applicable to sales (exclusive of depreciation, depletion and amortization shown separately below) | ||||||||||||||||||||
Gold | — | 1,414.8 | 532.7 | (11.6 | ) | 1,935.9 | ||||||||||||||
Base metals | — | 304.7 | 62.7 | — | 367.4 | |||||||||||||||
Depreciation, depletion and amortization | — | 505.3 | 191.2 | — | 696.5 | |||||||||||||||
Exploration, research and development | — | 117.7 | 74.7 | — | 192.4 | |||||||||||||||
General and administrative | — | 96.3 | 10.4 | 9.1 | 115.8 | |||||||||||||||
Write-down of goodwill | — | 52.8 | (1.0 | ) | — | 51.8 | ||||||||||||||
Write-down of long-lived assets | — | 5.2 | 34.1 | — | 39.3 | |||||||||||||||
Other | (0.3 | ) | (0.3 | ) | 35.0 | — | 34.4 | |||||||||||||
| (0.3 | ) | 2,496.5 | 939.8 | (2.5 | ) | 3,433.5 | ||||||||||||||
Operating income (loss) | 0.3 | 1,163.6 | (75.7 | ) | 2.5 | 1,090.7 | ||||||||||||||
Other income (expense) | ||||||||||||||||||||
Gain on investments, net | — | (2.3 | ) | (36.7 | ) | — | (39.0 | ) | ||||||||||||
Gain (loss) on derivative instruments, net | — | 3.1 | (0.7 | ) | — | 2.4 | ||||||||||||||
Loss on extinguishment of debt | — | (0.2 | ) | — | — | (0.2 | ) | |||||||||||||
Royalty and dividend income | 0.4 | 1.1 | 64.5 | (0.2 | ) | 65.8 | ||||||||||||||
Interest and other income (loss)—intercompany | 105.8 | 44.7 | 2.6 | (153.1 | ) | — | ||||||||||||||
Interest income, foreign currency exchange and other income | 5.7 | 24.7 | 47.5 | (1.0 | ) | 76.9 | ||||||||||||||
Interest expense—intercompany | (7.5 | ) | (0.1 | ) | (145.5 | ) | 153.1 | — | ||||||||||||
Interest expense, net of capitalized interest | (2.7 | ) | (84.8 | ) | (10.1 | ) | — | (97.6 | ) | |||||||||||
| 101.7 | (13.8 | ) | (78.4 | ) | (1.2 | ) | 8.3 | |||||||||||||
Pre-tax (loss) income before minority interest, equity income (loss) and impairment of affiliates and cumulative effect of a change in accounting principle | 102.0 | 1,149.8 | (154.1 | ) | 1.3 | 1,099.0 | ||||||||||||||
Income tax benefit (expense) | (0.1 | ) | (314.9 | ) | 39.1 | — | (275.9 | ) | ||||||||||||
Minority interest in (income) loss of affiliates | — | (338.8 | ) | (10.7 | ) | 14.2 | (335.3 | ) | ||||||||||||
Equity income of affiliates | 332.6 | (0.8 | ) | 94.7 | (423.9 | ) | 2.6 | |||||||||||||
Income (loss) before cumulative effect of a change in accounting principle | 434.5 | 495.3 | (31.0 | ) | (408.4 | ) | 490.4 | |||||||||||||
Cumulative effect of a change in accounting principle, net of tax of $(4.1) | — | (47.1 | ) | — | — | (47.1 | ) | |||||||||||||
Net income (loss) | $ | 434.5 | $ | 448.2 | $ | (31.0 | ) | $ | (408.4 | ) | $ | 443.3 | ||||||||
| For the Year Ended December 31, 2005 | ||||||||||||||||||||
Condensed Consolidating Statement of Income | Newmont Mining Corporation | Newmont USA | Other Subsidiaries | Eliminations | Newmont Mining Corporation Consolidated | |||||||||||||||
Revenues | ||||||||||||||||||||
Sales—gold, net | $ | — | $ | 3,059 | $ | 675 | $ | — | $ | 3,734 | ||||||||||
Sales—copper, net | — | 672 | — | — | 672 | |||||||||||||||
| — | 3,731 | 675 | — | 4,406 | ||||||||||||||||
Costs and expenses | ||||||||||||||||||||
Costs applicable to sales (exclusive of depreciation, depletion and amortization shown separately below) | ||||||||||||||||||||
Gold | — | 1,539 | 485 | (7 | ) | 2,017 | ||||||||||||||
Copper | — | 303 | — | — | 303 | |||||||||||||||
Depreciation, depletion and amortization | — | 507 | 137 | — | 644 | |||||||||||||||
Exploration | — | 99 | 48 | — | 147 | |||||||||||||||
Advanced projects, research and development | — | 29 | 44 | — | 73 | |||||||||||||||
General and administrative | — | 123 | 7 | 4 | 134 | |||||||||||||||
Write-down of goodwill | — | 41 | — | — | 41 | |||||||||||||||
Write-down of long-lived assets | — | 2 | 41 | — | 43 | |||||||||||||||
Other | — | 100 | 11 | — | 111 | |||||||||||||||
| — | 2,743 | 773 | (3 | ) | 3,513 | |||||||||||||||
Other income (expense) | ||||||||||||||||||||
Other income | 10 | 95 | 164 | — | 269 | |||||||||||||||
Interest income—intercompany | 118 | 45 | 1 | (164 | ) | — | ||||||||||||||
Interest expense—intercompany | (7 | ) | — | (157 | ) | 164 | — | |||||||||||||
Interest expense, net | (30 | ) | (58 | ) | (10 | ) | — | (98 | ) | |||||||||||
| 91 | 82 | (2 | ) | — | 171 | |||||||||||||||
Income (loss) from continuing operations before taxes, minority interest and equity income of affiliates | 91 | 1,070 | (100 | ) | 3 | 1,064 | ||||||||||||||
Income tax (expense) benefit | (12 | ) | (401 | ) | 99 | — | (314 | ) | ||||||||||||
Minority interest in income of subsidiaries | — | (384 | ) | (4 | ) | 8 | (380 | ) | ||||||||||||
Equity income of affiliates | 243 | (2 | ) | 66 | (303 | ) | 4 | |||||||||||||
Income from continuing operations | 322 | 283 | 61 | (292 | ) | 374 | ||||||||||||||
Loss from discontinued operations | — | (18 | ) | (34 | ) | — | (52 | ) | ||||||||||||
Net income (loss) | $ | 322 | $ | 265 | $ | 27 | $ | (292 | ) | $ | 322 | |||||||||
NEWMONT MINING CORPORATION
NOTES TO CONSOLIDATED FINANCIAL STATEMENTS—(Continued)
(dollars in millions, except per share, per ounce and per pound amounts)
Consolidating Statement of Operations | Newmont Mining Corporation | Newmont USA | Other Subsidiaries | Eliminations | Newmont Mining Corporation Consolidated | |||||||||||||||
| (in millions) | ||||||||||||||||||||
For the Year Ended December 31, 2003 | ||||||||||||||||||||
Revenues | ||||||||||||||||||||
Sales—gold, net | $ | — | $ | 2,326.3 | $ | 756.6 | $ | — | $ | 3,082.9 | ||||||||||
Sales—base metals, net | — | — | 74.9 | — | 74.9 | |||||||||||||||
| — | 2,326.3 | 831.5 | — | 3,157.8 | ||||||||||||||||
Costs and expenses | ||||||||||||||||||||
Costs applicable to sales (exclusive of depreciation, depletion and amortization shown separately below) | ||||||||||||||||||||
Gold | — | 1,173.4 | 483.9 | (1.3 | ) | 1,656.0 | ||||||||||||||
Base metals | — | — | 44.3 | — | 44.3 | |||||||||||||||
Depreciation, depletion and amortization | — | 376.7 | 187.8 | — | 564.5 | |||||||||||||||
Exploration, research and development | — | 61.0 | 54.2 | — | 115.2 | |||||||||||||||
General and administrative | — | 102.3 | 27.9 | 0.1 | 130.3 | |||||||||||||||
Write-down of long-lived assets | — | 31.4 | 3.9 | — | 35.3 | |||||||||||||||
Other | (0.2 | ) | 41.1 | 8.6 | — | 49.5 | ||||||||||||||
| (0.2 | ) | 1,785.9 | 810.6 | (1.2 | ) | 2,595.1 | ||||||||||||||
Other income (expense) | ||||||||||||||||||||
Gain on investments, net | 1.3 | (7.6 | ) | 89.5 | — | 83.2 | ||||||||||||||
Gain (loss) on derivative instruments, net | — | 69.5 | 30.0 | (76.6 | ) | 22.9 | ||||||||||||||
Gain on extinguishment of NYOL liabilities, net | — | — | 30.0 | 190.5 | 220.5 | |||||||||||||||
Loss on extinguishment of debt | — | (23.0 | ) | (10.8 | ) | — | (33.8 | ) | ||||||||||||
Loss on guarantee of QMC debt | — | — | (30.0 | ) | — | (30.0 | ) | |||||||||||||
Royalty and dividend income | — | 0.3 | 57.2 | (1.2 | ) | 56.3 | ||||||||||||||
Interest and other income—intercompany | 28.6 | 25.1 | 10.1 | (63.8 | ) | — | ||||||||||||||
Interest, foreign currency exchange and other income | 73.4 | 51.2 | 7.6 | — | 132.2 | |||||||||||||||
Interest expense—intercompany | 6.8 | (10.0 | ) | (60.6 | ) | 63.8 | — | |||||||||||||
Interest, net of capitalized interest | (2.8 | ) | (65.2 | ) | (20.6 | ) | — | (88.6 | ) | |||||||||||
| 107.3 | 40.3 | 102.4 | 112.7 | 362.7 | ||||||||||||||||
Pre-tax income before minority interest, equity income (loss) and impairment of affiliates and cumulative effect of a change in accounting principle | 107.5 | 580.7 | 123.3 | 113.9 | 925.4 | |||||||||||||||
Income tax (expense) benefit | (37.6 | ) | (64.2 | ) | (130.5 | ) | 25.4 | (206.9 | ) | |||||||||||
Minority interest in (income) loss of affiliates | — | (176.4 | ) | 29.6 | (26.4 | ) | (173.2 | ) | ||||||||||||
Equity loss and impairment of Australian Magnesium Corporation | — | — | (119.5 | ) | — | (119.5 | ) | |||||||||||||
Equity income of affiliates | 405.8 | 82.9 | 571.5 | (975.8 | ) | 84.4 | ||||||||||||||
Income before cumulative effect of a change in accounting principle | 475.7 | 423.0 | 474.4 | (862.9 | ) | 510.2 | ||||||||||||||
Cumulative effect of a change in accounting principle, net of tax of $11.1 | — | (31.5 | ) | (3.0 | ) | — | (34.5 | ) | ||||||||||||
Net income applicable to common shares | $ | 475.7 | $ | 391.5 | $ | 471.4 | $ | (862.9 | ) | $ | 475.7 | |||||||||
| For the Year Ended December 31, 2004 | ||||||||||||||||||||
Condensed Consolidating Statement of Income | Newmont Mining Corporation | Newmont USA | Other Subsidiaries | Eliminations | Newmont Mining Corporation Consolidated | |||||||||||||||
Revenues | ||||||||||||||||||||
Sales—gold, net | $ | — | $ | 2,846 | $ | 779 | $ | — | $ | 3,625 | ||||||||||
Sales—copper, net | — | 786 | — | — | 786 | |||||||||||||||
| — | 3,632 | 779 | — | 4,411 | ||||||||||||||||
Costs and expenses | ||||||||||||||||||||
Costs applicable to sales (exclusive of depreciation, depletion and amortization shown separately below) | ||||||||||||||||||||
Gold | — | 1,390 | 532 | (12 | ) | 1,910 | ||||||||||||||
Copper | — | 305 | — | — | 305 | |||||||||||||||
Depreciation, depletion and amortization | — | 498 | 164 | — | 662 | |||||||||||||||
Exploration | — | 72 | 35 | — | 107 | |||||||||||||||
Advanced projects, research and development | — | 46 | 34 | — | 80 | |||||||||||||||
General and administrative | — | 96 | 11 | 9 | 116 | |||||||||||||||
Write-down of goodwill | — | 53 | (1 | ) | — | 52 | ||||||||||||||
Write-down of long-lived assets | — | 5 | 34 | — | 39 | |||||||||||||||
Other | — | (1 | ) | 34 | — | 33 | ||||||||||||||
| — | 2,464 | 843 | (3 | ) | 3,304 | |||||||||||||||
Other income (expense) | ||||||||||||||||||||
Other income | 6 | 26 | 72 | (2 | ) | 102 | ||||||||||||||
Interest income—intercompany | 106 | 45 | 2 | (153 | ) | — | ||||||||||||||
Interest expense—intercompany | (7 | ) | — | (146 | ) | 153 | — | |||||||||||||
Interest expense, net | (3 | ) | (85 | ) | (10 | ) | — | (98 | ) | |||||||||||
| 102 | (14 | ) | (82 | ) | (2 | ) | 4 | |||||||||||||
Income (loss) from continuing operations before taxes, minority interest and equity income of affiliates | 102 | 1,154 | (146 | ) | 1 | 1,111 | ||||||||||||||
Income tax (expense) benefit | — | (317 | ) | (8 | ) | — | (325 | ) | ||||||||||||
Minority interest in income of subsidiaries | — | (339 | ) | (10 | ) | 14 | (335 | ) | ||||||||||||
Equity income of affiliates | 333 | (1 | ) | 94 | (424 | ) | 2 | |||||||||||||
Income from continuing operations | 435 | 497 | (70 | ) | (409 | ) | 453 | |||||||||||||
Loss from discontinued operations | — | (2 | ) | 39 | — | 37 | ||||||||||||||
Cumulative effect | — | (47 | ) | — | — | (47 | ) | |||||||||||||
Net income (loss) | $ | 435 | $ | 448 | $ | (31 | ) | $ | (409 | ) | $ | 443 | ||||||||
NEWMONT MINING CORPORATION
NOTES TO CONSOLIDATED FINANCIAL STATEMENTS—(Continued)
(dollars in millions, except per share, per ounce and per pound amounts)
Consolidating Statement of Operations | Newmont Mining Corporation | Newmont USA | Other Subsidiaries | Eliminations | Newmont Mining Corporation Consolidated | |||||||||||||||
| (in millions) | ||||||||||||||||||||
For the Year Ended December 31, 2002 | ||||||||||||||||||||
Revenues | ||||||||||||||||||||
Sales—gold, net | $ | — | $ | 1,981.9 | $ | 585.0 | $ | — | $ | 2,566.9 | ||||||||||
Sales—base metals, net | — | — | 55.3 | — | 55.3 | |||||||||||||||
| — | 1,981.9 | 640.3 | — | 2,622.2 | ||||||||||||||||
Costs and expenses | ||||||||||||||||||||
Costs applicable to sales (exclusive of depreciation, depletion and amortization shown separately below) | ||||||||||||||||||||
Gold | — | 1,199.7 | 385.5 | (4.9 | ) | 1,580.3 | ||||||||||||||
Base metals | — | — | 36.0 | — | 36.0 | |||||||||||||||
Depreciation, depletion and amortization | — | 324.8 | 180.8 | — | 505.6 | |||||||||||||||
Exploration, research and development | — | 52.2 | 36.7 | — | 88.9 | |||||||||||||||
General and administrative | — | 78.1 | 36.8 | 0.4 | 115.3 | |||||||||||||||
Write-down of long-lived assets | — | 0.5 | 3.2 | — | 3.7 | |||||||||||||||
Other | — | 25.9 | 3.5 | — | 29.4 | |||||||||||||||
| — | 1,681.2 | 682.5 | (4.5 | ) | 2,359.2 | |||||||||||||||
Other income (expense) | ||||||||||||||||||||
Gain on investments, net | — | 47.1 | — | — | 47.1 | |||||||||||||||
Gain (loss) on derivative instruments, net | — | 1.9 | (41.7 | ) | — | (39.8 | ) | |||||||||||||
Royalty and dividend income | — | 0.6 | 39.5 | (4.4 | ) | 35.7 | ||||||||||||||
Interest and other income (loss)—intercompany | 14.6 | 14.4 | 30.5 | (59.5 | ) | — | ||||||||||||||
Interest income, foreign currency exchange and other income | 3.3 | 18.8 | 17.8 | — | 39.9 | |||||||||||||||
Interest expense—intercompany | (18.1 | ) | (10.4 | ) | (21.9 | ) | 50.4 | — | ||||||||||||
Interest expense, net of capitalized interest | (1.4 | ) | (86.3 | ) | (41.9 | ) | — | (129.6 | ) | |||||||||||
| (1.6 | ) | (13.9 | ) | (17.7 | ) | (13.5 | ) | (46.7 | ) | |||||||||||
Pre-tax (loss) income before minority interest, equity income (loss) and impairment of affiliates and cumulative effect of a change in accounting principle | (1.6 | ) | 286.8 | (59.9 | ) | (9.0 | ) | 216.3 | ||||||||||||
Income tax benefit (expense) | 0.6 | (20.6 | ) | 0.1 | — | (19.9 | ) | |||||||||||||
Minority interest in (income) loss of affiliates | — | (100.1 | ) | 11.2 | (8.6 | ) | (97.5 | ) | ||||||||||||
Equity loss and impairment of Australian Magnesium Corporation | — | — | (1.8 | ) | — | (1.8 | ) | |||||||||||||
Equity income of affiliates | 159.0 | 42.1 | 253.7 | (401.6 | ) | 53.2 | ||||||||||||||
Income before cumulative effect of a change in accounting principle | 158.0 | 208.2 | 203.3 | (419.2 | ) | 150.3 | ||||||||||||||
Cumulative effect of a change in accounting principle, net of tax of $(4.1) | — | 7.7 | — | — | 7.7 | |||||||||||||||
Net income | 158.0 | 215.9 | 203.3 | (419.2 | ) | 158.0 | ||||||||||||||
Preferred stock dividends | (3.7 | ) | — | — | — | (3.7 | ) | |||||||||||||
Net income applicable to common shares | $ | 154.3 | $ | 215.9 | $ | 203.3 | $ | (419.2 | ) | $ | 154.3 | |||||||||
| For the Year Ended December 31, 2003 | ||||||||||||||||||||
Condensed Consolidating Statement of Income | Newmont Mining Corporation | Newmont USA | Other Subsidiaries | Eliminations | Newmont Mining Corporation Consolidated | |||||||||||||||
Revenues | ||||||||||||||||||||
Sales—gold, net | $ | — | $ | 2,302 | $ | 757 | $ | — | $ | 3,059 | ||||||||||
Costs and expenses | ||||||||||||||||||||
Costs applicable to sales (exclusive of depreciation, depletion and amortization shown separately below) | ||||||||||||||||||||
Gold | — | 1,152 | 483 | (1 | ) | 1,634 | ||||||||||||||
Depreciation, depletion and amortization | — | 372 | 158 | — | 530 | |||||||||||||||
Exploration | — | 47 | 29 | — | 76 | |||||||||||||||
Advanced projects, research and development | — | 14 | 21 | — | 35 | |||||||||||||||
General and administrative | — | 102 | 28 | — | 130 | |||||||||||||||
Write-down of goodwill | — | — | — | — | — | |||||||||||||||
Write-down of long-lived assets | — | 31 | 4 | — | 35 | |||||||||||||||
Other | — | 41 | 9 | — | 50 | |||||||||||||||
| — | 1,759 | 732 | (1 | ) | 2,490 | |||||||||||||||
Other income (expense) | ||||||||||||||||||||
Other income | 75 | 90 | 173 | 113 | 451 | |||||||||||||||
Interest income—intercompany | 29 | 25 | 10 | (64 | ) | — | ||||||||||||||
Interest expense—intercompany | 7 | (10 | ) | (61 | ) | 64 | — | |||||||||||||
Interest expense, net | (3 | ) | (65 | ) | (21 | ) | — | (89 | ) | |||||||||||
| 108 | 40 | 101 | 113 | 362 | ||||||||||||||||
Income (loss) from continuing operations before taxes, minority interest and equity income of affiliates | 108 | 583 | 126 | 114 | 931 | |||||||||||||||
Income tax (expense) benefit | (38 | ) | (65 | ) | (134 | ) | 25 | (212 | ) | |||||||||||
Minority interest in income of subsidiaries | — | (176 | ) | 29 | (26 | ) | (173 | ) | ||||||||||||
Equity loss AMC | — | — | (120 | ) | — | (120 | ) | |||||||||||||
Equity income of affiliates | 406 | 83 | 572 | (976 | ) | 85 | ||||||||||||||
Income from continuing operations | 476 | 425 | 473 | (863 | ) | 511 | ||||||||||||||
Loss from discontinued operations | — | — | — | — | — | |||||||||||||||
Cumulative effect | — | (32 | ) | (3 | ) | — | (35 | ) | ||||||||||||
Net income (loss) | $ | 476 | $ | 393 | $ | 470 | $ | (863 | ) | $ | 476 | |||||||||
NEWMONT MINING CORPORATION
NOTES TO CONSOLIDATED FINANCIAL STATEMENTS—(Continued)
(dollars in millions, except per share, per ounce and per pound amounts)
| At December 31, 2004 | ||||||||||||||||||
Consolidating Balance Sheets | Newmont Mining Corporation | Newmont USA | Other Subsidiaries | Eliminations | Newmont Mining Corporation Consolidated | |||||||||||||
| (in millions) | ||||||||||||||||||
Assets | ||||||||||||||||||
Cash and cash equivalents | $ | 0.5 | $ | 690.3 | $ | 91.9 | $ | — | $ | 782.7 | ||||||||
Marketable securities and other short-term investments | — | 790.0 | 153.2 | — | 943.2 | |||||||||||||
Trade receivables | — | 73.5 | 6.0 | — | 79.5 | |||||||||||||
Accounts receivable | 1,262.5 | 448.6 | 455.6 | (2,035.7 | ) | 131.0 | ||||||||||||
Inventories | — | 213.1 | 51.3 | — | 264.4 | |||||||||||||
Stockpiles and ore on leach pads | — | 200.5 | 31.1 | — | 231.6 | |||||||||||||
Deferred stripping costs | — | 33.7 | 10.8 | — | 44.5 | |||||||||||||
Deferred income tax assets | — | 166.5 | 7.1 | — | 173.6 | |||||||||||||
Other current assets | 3.7 | 47.9 | 19.0 | — | 70.6 | |||||||||||||
Current assets | 1,266.7 | 2,664.1 | 826.0 | (2,035.7 | ) | 2,721.1 | ||||||||||||
Property, plant and mine development, net | (2.8 | ) | 3,786.0 | 1,577.7 | — | 5,360.9 | ||||||||||||
Investments | — | 0.9 | 385.3 | — | 386.2 | |||||||||||||
Investments in subsidiaries | 4,573.9 | 1.4 | 3,581.6 | (8,156.9 | ) | — | ||||||||||||
Deferred stripping costs | — | 75.0 | 4.8 | — | 79.8 | |||||||||||||
Long-term stockpiles and ore on leach pads | — | 481.6 | 43.2 | — | 524.8 | |||||||||||||
Deferred income tax assets | 6.8 | 425.2 | 59.7 | — | 491.7 | |||||||||||||
Other long-term assets | 1,766.8 | 652.2 | 99.8 | (2,338.5 | ) | 180.3 | ||||||||||||
Goodwill | — | 40.9 | 2,985.0 | — | 3,025.9 | |||||||||||||
Total assets | $ | 7,611.4 | $ | 8,127.3 | $ | 9,563.1 | $ | (12,531.1 | ) | $ | 12,770.7 | |||||||
Liabilities | ||||||||||||||||||
Current portion of long-term debt | $ | — | $ | 264.3 | $ | 21.2 | $ | — | $ | 285.5 | ||||||||
Accounts payable | 44.4 | 1,559.7 | 663.1 | (2,036.2 | ) | 231.0 | ||||||||||||
Employee-related benefits | — | 107.2 | 27.3 | — | 134.5 | |||||||||||||
Other current liabilities | 27.2 | 287.8 | 131.7 | 3.3 | 450.0 | |||||||||||||
Current liabilities | 71.6 | 2,219.0 | 843.3 | (2,032.9 | ) | 1,101.0 | ||||||||||||
Long-term debt | — | 1,185.9 | 125.4 | — | 1,311.3 | |||||||||||||
Reclamation and remediation liabilities | — | 293.8 | 137.7 | — | 431.5 | |||||||||||||
Deferred revenue from sale of future production | — | 46.8 | — | — | 46.8 | |||||||||||||
Deferred income tax liabilities | 52.2 | 223.6 | 174.9 | 25.4 | 476.1 | |||||||||||||
Employee-related benefits | — | 224.2 | 25.6 | — | 249.8 | |||||||||||||
Advanced stripping costs | — | 102.8 | — | — | 102.8 | |||||||||||||
Other long-term liabilities | 247.1 | 85.5 | 2,509.2 | (2,503.2 | ) | 338.6 | ||||||||||||
Total liabilities | 370.9 | 4,381.6 | 3,816.1 | (4,510.7 | ) | 4,057.9 | ||||||||||||
Minority interest in subsidiaries | — | 811.4 | 323.1 | (359.4 | ) | 775.1 | ||||||||||||
Stockholders’ equity | ||||||||||||||||||
Preferred stock | — | — | 60.7 | (60.7 | ) | — | ||||||||||||
Common stock | 655.8 | — | — | — | 655.8 | |||||||||||||
Additional paid-in capital | 5,836.4 | 2,217.7 | 4,847.2 | (6,376.9 | ) | 6,524.4 | ||||||||||||
Accumulated other comprehensive income (loss) | 146.7 | (64.9 | ) | 37.6 | 27.3 | 146.7 | ||||||||||||
Retained earnings | 601.6 | 781.5 | 478.4 | (1,250.7 | ) | 610.8 | ||||||||||||
Total stockholders’ equity | 7,240.5 | 2,934.3 | 5,423.9 | (7,661.0 | ) | 7,937.7 | ||||||||||||
Total liabilities and stockholders’ equity | $ | 7,611.4 | $ | 8,127.3 | $ | 9,563.1 | $ | (12,531.1 | ) | $ | 12,770.7 | |||||||
| At December 31, 2005 | ||||||||||||||||||
Condensed Consolidating Balance Sheets | Newmont Mining Corporation | Newmont USA | Other Subsidiaries | Eliminations | Newmont Mining Corporation Consolidated | |||||||||||||
Assets | ||||||||||||||||||
Cash and cash equivalents | $ | 1 | $ | 979 | $ | 102 | $ | — | $ | 1,082 | ||||||||
Marketable securities and other short-term investments | — | 794 | 23 | — | 817 | |||||||||||||
Trade receivables | — | 93 | 1 | — | 94 | |||||||||||||
Accounts receivable | 1,733 | 264 | 557 | (2,418 | ) | 136 | ||||||||||||
Inventories | — | 278 | 42 | — | 320 | |||||||||||||
Stockpiles and ore on leach pads | — | 228 | 27 | — | 255 | |||||||||||||
Other current assets | 3 | 284 | 45 | — | 332 | |||||||||||||
Current assets | 1,737 | 2,920 | 797 | (2,418 | ) | 3,036 | ||||||||||||
Property, plant and mine development, net | (11 | ) | 4,142 | 1,514 | — | 5,645 | ||||||||||||
Investments | — | 198 | 757 | — | 955 | |||||||||||||
Investments in subsidiaries | 5,180 | — | 4,076 | (9,256 | ) | — | ||||||||||||
Long-term stockpiles and ore on leach pads | — | 566 | 37 | — | 603 | |||||||||||||
Deferred income tax assets | 12 | 409 | 96 | — | 517 | |||||||||||||
Other long-term assets | 1,646 | 1,056 | 269 | (2,690 | ) | 283 | ||||||||||||
Goodwill | — | — | 2,879 | — | 2,879 | |||||||||||||
Assets of operations held for sale | — | 25 | 51 | — | 74 | |||||||||||||
Total assets | $ | 8,564 | $ | 9,316 | $ | 10,476 | $ | (14,364 | ) | $ | 13,992 | |||||||
Liabilities | ||||||||||||||||||
Current portion of long-term debt | $ | — | $ | 195 | $ | 1 | $ | — | $ | 196 | ||||||||
Accounts payable | 50 | 2,170 | 397 | (2,385 | ) | 232 | ||||||||||||
Employee related benefits | — | 152 | 24 | — | 176 | |||||||||||||
Derivative instruments | — | 267 | 3 | — | 270 | |||||||||||||
Other current liabilities | 38 | 300 | 143 | (5 | ) | 476 | ||||||||||||
Current liabilities | 88 | 3,084 | 568 | (2,390 | ) | 1,350 | ||||||||||||
Long-term debt | 597 | 1,012 | 124 | — | 1,733 | |||||||||||||
Reclamation and remediation liabilities | — | 333 | 112 | — | 445 | |||||||||||||
Deferred income tax liabilities | 52 | 232 | 165 | — | 449 | |||||||||||||
Employee-related benefits | — | 252 | 21 | — | 273 | |||||||||||||
Other long-term liabilities | 247 | 245 | 2,550 | (2,628 | ) | 414 | ||||||||||||
Liabilities of operations held for sale | — | 1 | 20 | — | 21 | |||||||||||||
Total liabilities | 984 | 5,159 | 3,560 | (5,018 | ) | 4,685 | ||||||||||||
Minority interest in subsidiaries | — | 971 | 326 | (366 | ) | 931 | ||||||||||||
Stockholders’ equity | ||||||||||||||||||
Preferred stock | — | — | 61 | (61 | ) | — | ||||||||||||
Common stock | 666 | — | — | — | 666 | |||||||||||||
Additional paid-in capital | 5,782 | 2,220 | 5,077 | (6,501 | ) | 6,578 | ||||||||||||
Accumulated other comprehensive income (loss) | 378 | (78 | ) | 229 | (151 | ) | 378 | |||||||||||
Retained earnings | 754 | 1,044 | 1,223 | (2,267 | ) | 754 | ||||||||||||
Total stockholders’ equity | 7,580 | 3,186 | 6,590 | (8,980 | ) | 8,376 | ||||||||||||
Total liabilities and stockholders’ equity | $ | 8,564 | $ | 9,316 | $ | 10,476 | $ | (14,364 | ) | $ | 13,992 | |||||||
NEWMONT MINING CORPORATION
NOTES TO CONSOLIDATED FINANCIAL STATEMENTS—(Continued)
(dollars in millions, except per share, per ounce and per pound amounts)
| At December 31, 2003 | |||||||||||||||||||
Consolidating Balance Sheets | Newmont Mining Corporation | Newmont USA | Other Subsidiaries | Eliminations | Newmont Mining Corporation Consolidated | ||||||||||||||
| (in millions) | |||||||||||||||||||
Assets | |||||||||||||||||||
Cash and cash equivalents | $ | — | $ | 1,028.3 | $ | 102.8 | $ | — | $ | 1,131.1 | |||||||||
Marketable securities and other short-term investments | — | 186.0 | 271.5 | — | 457.5 | ||||||||||||||
Trade receivables | — | 6.4 | 13.7 | — | 20.1 | ||||||||||||||
Accounts receivable | 1,791.0 | 328.4 | 310.6 | (2,359.4 | ) | 70.6 | |||||||||||||
Inventories | — | 156.0 | 69.7 | — | 225.7 | ||||||||||||||
Stockpiles and ore on leach pads | — | 210.8 | 37.8 | — | 248.6 | ||||||||||||||
Deferred stripping costs | — | 41.0 | 19.1 | — | 60.1 | ||||||||||||||
Deferred income tax assets | — | 43.5 | 1.5 | — | 45.0 | ||||||||||||||
Other current assets | (122.9 | ) | 53.0 | (81.0 | ) | 251.2 | 100.3 | ||||||||||||
Current assets | 1,668.1 | 2,053.4 | 745.7 | (2,108.2 | ) | 2,359.0 | |||||||||||||
Property, plant and mine development, net | — | 2,146.4 | 1,569.1 | — | 3,715.5 | ||||||||||||||
Investments | — | 709.7 | 892.8 | (868.5 | ) | 734.0 | |||||||||||||
Investments in subsidiaries | 4,154.1 | — | 2,608.7 | (6,762.8 | ) | — | |||||||||||||
Deferred stripping costs | — | 28.0 | 2.3 | — | 30.3 | ||||||||||||||
Long-term stockpiles and ore on leach pads | — | 284.3 | 21.5 | — | 305.8 | ||||||||||||||
Deferred income tax assets | 6.8 | 364.7 | 32.5 | — | 404.0 | ||||||||||||||
Other long-term assets | 1,313.6 | 586.9 | 232.8 | (2,026.3 | ) | 107.0 | |||||||||||||
Goodwill | — | 93.7 | 2,948.9 | — | 3,042.6 | ||||||||||||||
Total assets | $ | 7,142.6 | $ | 6,267.1 | $ | 9,054.3 | $ | (11,765.8 | ) | $ | 10,698.2 | ||||||||
Liabilities | |||||||||||||||||||
Current portion of long-term debt | $ | — | $ | 59.9 | $ | 131.0 | $ | — | $ | 190.9 | |||||||||
Accounts payable | 129.5 | 1,643.0 | 756.4 | (2,365.7 | ) | 163.2 | |||||||||||||
Employee-related benefits | — | 107.7 | 28.6 | — | 136.3 | ||||||||||||||
Other current liabilities | 27.2 | 224.9 | 101.3 | (1.3 | ) | 352.1 | |||||||||||||
Current liabilities | 156.7 | 2,035.5 | 1,017.3 | (2,367.0 | ) | 842.5 | |||||||||||||
Long-term debt | — | 745.5 | 141.1 | — | 886.6 | ||||||||||||||
Reclamation and remediation liabilities | — | 238.2 | 124.1 | — | 362.3 | ||||||||||||||
Deferred revenue from sale of future production | — | 53.8 | — | — | 53.8 | ||||||||||||||
Deferred income tax liabilities | 43.0 | — | 204.2 | 25.4 | 272.6 | ||||||||||||||
Employee-related benefits | — | 221.2 | 32.5 | — | 253.7 | ||||||||||||||
Other long-term liabilities | 372.2 | 102.0 | 1,703.7 | (1,882.6 | ) | 295.3 | |||||||||||||
Total liabilities | 571.9 | 3,396.2 | 3,222.9 | (4,224.2 | ) | 2,966.8 | |||||||||||||
Minority interest in subsidiaries | — | 377.1 | 307.7 | (338.3 | ) | 346.5 | |||||||||||||
Stockholders’ equity | |||||||||||||||||||
Preferred stock | — | — | 60.7 | (60.7 | ) | — | |||||||||||||
Common stock | 638.0 | — | 32.4 | (32.4 | ) | 638.0 | |||||||||||||
Additional paid-in capital | 5,603.4 | 2,206.2 | 4,705.9 | (6,092.2 | ) | 6,423.3 | |||||||||||||
Accumulated other comprehensive income (loss) | 22.8 | (43.1 | ) | 13.5 | 29.6 | 22.8 | |||||||||||||
Retained earnings | 306.5 | 330.7 | 711.2 | (1,047.6 | ) | 300.8 | |||||||||||||
Total stockholders’ equity | 6,570.7 | 2,493.8 | 5,523.7 | (7,203.3 | ) | 7,384.9 | |||||||||||||
Total liabilities and stockholders’ equity | $ | 7,142.6 | $ | 6,267.1 | $ | 9,054.3 | $ | (11,765.8 | ) | $ | 10,698.2 | ||||||||
| At December 31, 2004 | ||||||||||||||||||
Condensed Consolidating Balance Sheets | Newmont Mining Corporation | Newmont USA | Other Subsidiaries | Eliminations | Newmont Mining Corporation Consolidated | |||||||||||||
Assets | ||||||||||||||||||
Cash and cash equivalents | $ | 1 | $ | 690 | $ | 90 | $ | — | $ | 781 | ||||||||
Marketable securities and other short-term investments | — | 790 | 153 | — | 943 | |||||||||||||
Trade receivables | — | 73 | 4 | — | 77 | |||||||||||||
Accounts receivable | 1,262 | 449 | 455 | (2,036 | ) | 130 | ||||||||||||
Inventories | — | 208 | 36 | — | 244 | |||||||||||||
Stockpiles and ore on leach pads | — | 201 | 29 | — | 230 | |||||||||||||
Other current assets | 4 | 248 | 36 | — | 288 | |||||||||||||
Current assets | 1,267 | 2,659 | 803 | (2,036 | ) | 2,693 | ||||||||||||
Property, plant and mine development, net | (3 | ) | 3,757 | 1,382 | — | 5,136 | ||||||||||||
Investments | — | 1 | 385 | — | 386 | |||||||||||||
Investments in subsidiaries | 4,574 | 1 | 3,582 | (8,157 | ) | — | ||||||||||||
Long-term stockpiles and ore on leach pads | — | 482 | 43 | — | 525 | |||||||||||||
Deferred income tax assets | 7 | 427 | 60 | — | 494 | |||||||||||||
Other long-term assets | 1,767 | 731 | 104 | (2,338 | ) | 264 | ||||||||||||
Goodwill | — | 41 | 2,953 | — | 2,994 | |||||||||||||
Assets of operations held for sale | — | 33 | 251 | — | 284 | |||||||||||||
Total assets | $ | 7,612 | $ | 8,132 | $ | 9,563 | $ | (12,531 | ) | $ | 12,776 | |||||||
Liabilities | ||||||||||||||||||
Current portion of long-term debt | $ | — | $ | 265 | $ | 21 | $ | — | $ | 286 | ||||||||
Accounts payable | 44 | 1,558 | 656 | (2,036 | ) | 222 | ||||||||||||
Employee related benefits | — | 106 | 23 | — | 129 | |||||||||||||
Derivative instruments | — | 65 | 6 | — | 71 | |||||||||||||
Other current liabilities and deferred revenue | 28 | 222 | 122 | 3 | 375 | |||||||||||||
Current liabilities | 72 | 2,216 | 828 | (2,033 | ) | 1,083 | ||||||||||||
Long-term debt | — | 1,191 | 125 | — | 1,316 | |||||||||||||
Reclamation and remediation liabilities | — | 291 | 127 | — | 418 | |||||||||||||
Deferred income tax liabilities | 52 | 224 | 159 | 25 | 460 | |||||||||||||
Employee-related benefits | — | 223 | 21 | — | 244 | |||||||||||||
Other long-term liabilities and deferred revenue | 247 | 233 | 2,510 | (2,503 | ) | 487 | ||||||||||||
Liabilities of operations held for sale | — | 9 | 46 | — | 55 | |||||||||||||
Total liabilities | 371 | 4,387 | 3,816 | (4,511 | ) | 4,063 | ||||||||||||
Minority interest in subsidiaries | — | 811 | 323 | (359 | ) | 775 | ||||||||||||
Stockholders’ equity | ||||||||||||||||||
Preferred stock | — | — | 61 | (61 | ) | — | ||||||||||||
Common stock | 656 | — | — | — | 656 | |||||||||||||
Additional paid-in capital | 5,827 | 2,218 | 4,856 | (6,377 | ) | 6,524 | ||||||||||||
Accumulated other comprehensive income (loss) | 147 | (65 | ) | 38 | 27 | 147 | ||||||||||||
Retained earnings | 611 | 781 | 469 | (1,250 | ) | 611 | ||||||||||||
Total stockholders’ equity | 7,241 | 2,934 | 5,424 | (7,661 | ) | 7,938 | ||||||||||||
Total liabilities and stockholders’ equity | $ | 7,612 | $ | 8,132 | $ | 9,563 | $ | (12,531 | ) | $ | 12,776 | |||||||
NEWMONT MINING CORPORATION
NOTES TO CONSOLIDATED FINANCIAL STATEMENTS—(Continued)
(dollars in millions, except per share, per ounce and per pound amounts)
Statement of Consolidating Cash Flows | Newmont Mining Corporation | Newmont USA | Other Subsidiaries | Eliminations | Newmont Mining Corporation Consolidated | |||||||||||||||
| (in millions) | ||||||||||||||||||||
Year Ended December 31, 2004 | ||||||||||||||||||||
Operating activities: | ||||||||||||||||||||
Net income | $ | 434.5 | $ | 448.2 | $ | (31.0 | ) | $ | (408.4 | ) | $ | 443.3 | ||||||||
Adjustments to reconcile net income to net cash provided by operating activities | (331.2 | ) | 1,021.3 | 86.7 | 409.7 | 1,186.5 | ||||||||||||||
Increase (decrease) in operating assets and liabilities | — | (143.8 | ) | 72.1 | (1.3 | ) | (73.0 | ) | ||||||||||||
Net cash provided by operating activities | 103.3 | 1,325.7 | 127.8 | — | 1,556.8 | |||||||||||||||
Investing activities: | ||||||||||||||||||||
Additions to property, plant and mine development | — | (501.4 | ) | (216.6 | ) | — | (718.0 | ) | ||||||||||||
Investment in marketable debt and equity securities | (39.9 | ) | (1,496.7 | ) | (183.4 | ) | — | (1,720.0 | ) | |||||||||||
Cash recorded upon consolidation of Batu Hijau | — | 82.2 | — | — | 82.2 | |||||||||||||||
Proceeds from sale of investments and other | — | 912.6 | 10.9 | — | 923.5 | |||||||||||||||
Net cash used in investing activities | (39.9 | ) | (1,003.3 | ) | (389.1 | ) | — | (1,432.3 | ) | |||||||||||
Financing activities: | ||||||||||||||||||||
Net (repayments) borrowings | (16.4 | ) | (440.3 | ) | 258.9 | — | (197.8 | ) | ||||||||||||
Dividends paid on common and preferred stock | (121.7 | ) | — | (11.6 | ) | — | (133.3 | ) | ||||||||||||
Dividends paid to minority interests | — | (236.9 | ) | — | — | (236.9 | ) | |||||||||||||
Proceeds from stock issuance | 77.5 | — | — | — | 77.5 | |||||||||||||||
Change in restricted cash and other | (2.3 | ) | 17.8 | (0.2 | ) | — | 15.3 | |||||||||||||
Net cash (used in) provided by financing activities | (62.9 | ) | (659.4 | ) | 247.1 | — | (475.2 | ) | ||||||||||||
Effect of exchange rate changes on cash | — | (1.0 | ) | 3.3 | — | 2.3 | ||||||||||||||
Net change in cash and cash equivalents | 0.5 | (338.0 | ) | (10.9 | ) | — | (348.4 | ) | ||||||||||||
Cash and cash equivalents at beginning of year | — | 1,028.3 | 102.8 | — | 1,131.1 | |||||||||||||||
Cash and cash equivalents at end of year | $ | 0.5 | $ | 690.3 | $ | 91.9 | $ | — | $ | 782.7 | ||||||||||
Statement of Consolidating Cash Flows | Newmont Mining Corporation | Newmont USA | Other Subsidiaries | Eliminations | Newmont Mining Corporation Consolidated | |||||||||||||||
Year Ended December 31, 2005 | ||||||||||||||||||||
Operating activities: | ||||||||||||||||||||
Net income | $ | 322 | $ | 265 | $ | 27 | $ | (292 | ) | $ | 322 | |||||||||
Adjustments to reconcile net income to net cash provided by operating activities | (253 | ) | 1,102 | (13 | ) | 292 | 1,128 | |||||||||||||
Increase (decrease) in operating assets and liabilities | 8 | (180 | ) | (25 | ) | — | (197 | ) | ||||||||||||
Net cash provided from continuing operations | 77 | 1,187 | (11 | ) | — | 1,253 | ||||||||||||||
Net cash provided from (used in) discontinued operations | — | (14 | ) | 4 | — | (10 | ) | |||||||||||||
Net cash from operations | 77 | 1,173 | (7 | ) | — | 1,243 | ||||||||||||||
Investing activities: | ||||||||||||||||||||
Additions to property, plant and mine development | — | (854 | ) | (372 | ) | — | (1,226 | ) | ||||||||||||
Additions to property, plant and mine development of discontinued operations | — | (4 | ) | (21 | ) | — | (25 | ) | ||||||||||||
Investment in marketable debt and equity securities | (3,146 | ) | (155 | ) | — | (3,301 | ) | |||||||||||||
Proceeds from sale of marketable debt and equity securities | 3,145 | 213 | — | 3,358 | ||||||||||||||||
Proceeds from sale of discontinued operation | — | 147 | — | 147 | ||||||||||||||||
Investments in affiliates | (49 | ) | — | — | 49 | — | ||||||||||||||
Proceeds from sale of assets and other | — | 38 | 32 | — | 70 | |||||||||||||||
Net cash (used in) provided from investing activities | (49 | ) | (821 | ) | (156 | ) | 49 | (977 | ) | |||||||||||
Financing activities: | ||||||||||||||||||||
Net borrowings | 98 | 126 | 141 | — | 365 | |||||||||||||||
Dividends paid to common stockholders | (169 | ) | — | (10 | ) | — | (179 | ) | ||||||||||||
Dividends paid to minority interests | — | (186 | ) | — | — | (186 | ) | |||||||||||||
Proceeds from stock issuance | 43 | — | 49 | (49 | ) | 43 | ||||||||||||||
Change in restricted cash and other | — | — | (5 | ) | — | (5 | ) | |||||||||||||
Net cash (used in) provided from financing activities | (28 | ) | (60 | ) | 175 | (49 | ) | 38 | ||||||||||||
Effect of exchange rate changes on cash | — | (3 | ) | — | — | (3 | ) | |||||||||||||
Net change in cash and cash equivalents | — | 289 | 12 | — | 301 | |||||||||||||||
Cash and cash equivalents at beginning of year | 1 | 690 | 90 | — | 781 | |||||||||||||||
Cash and cash equivalents at end of year | $ | 1 | $ | 979 | $ | 102 | $ | — | $ | 1,082 | ||||||||||
NEWMONT MINING CORPORATION
NOTES TO CONSOLIDATED FINANCIAL STATEMENTS—(Continued)
(dollars in millions, except per share, per ounce and per pound amounts)
Statement of Consolidating Cash Flows | Newmont Mining Corporation | Newmont USA | Other Subsidiaries | Eliminations | Newmont Mining Corporation Consolidated | |||||||||||||||
| (in millions) | ||||||||||||||||||||
Year Ended December 31, 2003 | ||||||||||||||||||||
Operating activities: | ||||||||||||||||||||
Net income | $ | 475.7 | $ | 391.5 | $ | 471.4 | $ | (862.9 | ) | $ | 475.7 | |||||||||
Adjustments to reconcile net income to net cash provided by operating activities | (480.6 | ) | 382.2 | (323.9 | ) | 862.9 | 440.6 | |||||||||||||
Increase (decrease) in operating assets and liabilities | 19.3 | (11.7 | ) | (239.5 | ) | — | (231.9 | ) | ||||||||||||
Net cash provided by (used in) operating activities | 14.4 | 762.0 | (92.0 | ) | — | 684.4 | ||||||||||||||
Investing activities: | ||||||||||||||||||||
Additions to property, plant and mine development | — | (365.4 | ) | (139.1 | ) | — | (504.5 | ) | ||||||||||||
Investments in marketable debt and equity securities | — | (182.9 | ) | (6.4 | ) | — | (189.3 | ) | ||||||||||||
Receipts from joint ventures and affiliates, net | — | 39.3 | — | — | 39.3 | |||||||||||||||
Investment in affiliates | — | — | (70.1 | ) | — | (70.1 | ) | |||||||||||||
Early settlement of ineffective derivative instruments | — | — | (57.5 | ) | — | (57.5 | ) | |||||||||||||
Proceeds from sale of TVX Newmont Americas | — | — | 180.0 | — | 180.0 | |||||||||||||||
Proceeds from sale of investments and other | 0.6 | (2.0 | ) | 223.5 | — | 222.1 | ||||||||||||||
Net cash provided by (used in) investing activities | 0.6 | (511.0 | ) | 130.4 | — | (380.0 | ) | |||||||||||||
Financing activities: | ||||||||||||||||||||
Net (repayments) borrowings | (1,238.8 | ) | 756.8 | (187.4 | ) | — | (669.4 | ) | ||||||||||||
Dividends paid on common and preferred stock | (63.0 | ) | — | (7.7 | ) | — | (70.7 | ) | ||||||||||||
Dividends paid to minority interests | — | (146.0 | ) | — | — | (146.0 | ) | |||||||||||||
Proceeds from stock issuance and other | 1,286.8 | — | — | — | 1,286.8 | |||||||||||||||
Net cash (used in) provided by financing activities | (15.0 | ) | 610.8 | (195.1 | ) | — | 400.7 | |||||||||||||
Effect of exchange rate changes on cash | — | 1.4 | 22.9 | — | 24.3 | |||||||||||||||
Net change in cash and cash equivalents | — | 863.2 | (133.8 | ) | — | 729.4 | ||||||||||||||
Cash and cash equivalents at beginning of year | — | 165.1 | 236.6 | — | 401.7 | |||||||||||||||
Cash and cash equivalents at end of year | $ | — | $ | 1,028.3 | $ | 102.8 | $ | — | $ | 1,131.1 | ||||||||||
Statement of Consolidating Cash Flows | Newmont Mining Corporation | Newmont USA | Other Subsidiaries | Eliminations | Newmont Mining Corporation Consolidated | |||||||||||||||
Year Ended December 31, 2004 | ||||||||||||||||||||
Operating activities: | ||||||||||||||||||||
Net income (loss) | $ | 435 | $ | 448 | $ | (31 | ) | $ | (409 | ) | $ | 443 | ||||||||
Adjustments to reconcile net income to net cash provided by operating activities | (332 | ) | 1,074 | 61 | 410 | 1,213 | ||||||||||||||
Change in operating assets and liabilities | — | (200 | ) | 94 | (1 | ) | (107 | ) | ||||||||||||
Net cash provided from operating activities | 103 | 1,322 | 124 | — | 1,549 | |||||||||||||||
Net cash from discontinued operations | — | 3 | 5 | — | 8 | |||||||||||||||
Net cash from operations | 103 | 1,325 | 129 | — | 1,557 | |||||||||||||||
Investing activities: | ||||||||||||||||||||
Additions to property, plant and mine development | — | (496 | ) | (187 | ) | — | (683 | ) | ||||||||||||
Additions to property, plant and mine development of discontinued operations | — | (5 | ) | (30 | ) | — | (35 | ) | ||||||||||||
Investments in marketable debt and equity securities | (40 | ) | (1,497 | ) | (183 | ) | — | (1,720 | ) | |||||||||||
Proceeds from sale of marketable debt and equity securities | — | 899 | — | — | 899 | |||||||||||||||
Cash recorded upon consolidation of Batu Hijau | — | 82 | — | — | 82 | |||||||||||||||
Investment in affiliates | — | — | — | — | ||||||||||||||||
Proceeds from sale of assets and other | — | 14 | 11 | — | 25 | |||||||||||||||
Net cash (used in) provided by investing activities | (40 | ) | (1,003 | ) | (389 | ) | — | (1,432 | ) | |||||||||||
Financing activities: | ||||||||||||||||||||
Net borrowings | (16 | ) | (440 | ) | 258 | — | (198 | ) | ||||||||||||
Dividends paid to common stockholders | (122 | ) | — | (11 | ) | — | (133 | ) | ||||||||||||
Dividends paid to minority interests | — | (237 | ) | — | — | (237 | ) | |||||||||||||
Proceeds from stock issuance | 78 | — | — | — | 78 | |||||||||||||||
Change in restricted cash and other | (2 | ) | 18 | (1 | ) | — | 15 | |||||||||||||
Net cash (used in) provided from financing activities | (62 | ) | (659 | ) | 246 | — | (475 | ) | ||||||||||||
Effect of exchange rate changes on cash | — | (1 | ) | 3 | — | 2 | ||||||||||||||
Net change in cash and cash equivalents | 1 | (338 | ) | (11 | ) | — | (348 | ) | ||||||||||||
Cash and cash equivalents at beginning of year | — | 1,028 | 101 | — | 1,129 | |||||||||||||||
Cash and cash equivalents at end of year | $ | 1 | $ | 690 | $ | 90 | $ | — | $ | 781 | ||||||||||
NEWMONT MINING CORPORATION
NOTES TO CONSOLIDATED FINANCIAL STATEMENTS—(Continued)
Statement of Consolidating Cash Flows | Newmont Mining Corporation | Newmont USA | Other Subsidiaries | Eliminations | Newmont Mining Corporation Consolidated | |||||||||||||||
| (in millions) | ||||||||||||||||||||
Year Ended December 31, 2002 | ||||||||||||||||||||
Operating activities: | ||||||||||||||||||||
Net income (loss) | $ | 158.0 | $ | 215.9 | $ | 203.3 | $ | (419.2 | ) | $ | 158.0 | |||||||||
Adjustments to reconcile net income (loss) to net cash provided by operating activities | (165.6 | ) | 396.2 | (84.2 | ) | 367.0 | 513.4 | |||||||||||||
Increase (decrease) in operating assets and liabilities | 108.9 | 28.4 | (136.4 | ) | 12.4 | 13.3 | ||||||||||||||
Net cash provided by (used in) operating activities | 101.3 | 640.5 | (17.3 | ) | (39.8 | ) | 684.7 | |||||||||||||
Investing activities: | ||||||||||||||||||||
Additions to property, plant and mine development | — | (231.7 | ) | (68.3 | ) | — | (300.0 | ) | ||||||||||||
Proceeds from settlement of cross currency swaps | — | — | 50.8 | — | 50.8 | |||||||||||||||
Settlement of derivative instruments | — | — | (21.1 | ) | — | (21.1 | ) | |||||||||||||
Advances to joint ventures and affiliates | — | (24.8 | ) | — | — | (24.8 | ) | |||||||||||||
Cash consideration for Normandy shares | — | — | (461.7 | ) | — | (461.7 | ) | |||||||||||||
Cash received from acquisitions, net of transaction costs | — | (39.8 | ) | 371.4 | 39.8 | 371.4 | ||||||||||||||
Proceeds from sale of investments and other | — | 95.6 | 401.9 | — | 497.5 | |||||||||||||||
Net cash (used in) provided by investing activities | — | (200.7 | ) | 273.0 | 39.8 | 112.1 | ||||||||||||||
Financing activities: | ||||||||||||||||||||
Net repayments | (121.5 | ) | (398.9 | ) | (27.0 | ) | — | (547.4 | ) | |||||||||||
Dividends paid on common and preferred stock | (43.5 | ) | — | (6.5 | ) | — | (50.0 | ) | ||||||||||||
Dividends paid to minority interests | — | (28.8 | ) | — | — | (28.8 | ) | |||||||||||||
Proceeds from stock issuances | 63.7 | 3.6 | — | — | 67.3 | |||||||||||||||
Net cash used in financing activities | (101.3 | ) | (424.1 | ) | (33.5 | ) | — | (558.9 | ) | |||||||||||
Effect of exchange rate changes on cash | — | — | 14.4 | — | 14.4 | |||||||||||||||
Net change in cash and cash equivalents | — | 15.7 | 236.6 | — | 252.3 | |||||||||||||||
Cash and cash equivalents at beginning of year | — | 149.4 | — | — | 149.4 | |||||||||||||||
Cash and cash equivalents at end of year | $ | — | $ | 165.1 | $ | 236.6 | $ | — | $ | 401.7 | ||||||||||
NEWMONT MINING CORPORATION(dollars in millions, except per share, per ounce and per pound amounts)
NOTES TO CONSOLIDATED FINANCIAL STATEMENTS—(Continued)
Statement of Consolidating Cash Flows | Newmont Mining Corporation | Newmont USA | Other Subsidiaries | Eliminations | Newmont Mining Corporation Consolidated | |||||||||||||||
Year Ended December 31, 2003 | ||||||||||||||||||||
Operating activities: | ||||||||||||||||||||
Net income (loss) | $ | 476 | $ | 392 | $ | 471 | $ | (863 | ) | $ | 476 | |||||||||
Adjustments to reconcile net income to net cash provided by operating activities | (481 | ) | 379 | (356 | ) | 863 | 405 | |||||||||||||
Change in operating assets and liabilities | 19 | (15 | ) | (240 | ) | — | (236 | ) | ||||||||||||
Net cash provided from operating activities | 14 | 756 | (125 | ) | — | 645 | ||||||||||||||
Net cash from discontinued operations | — | 6 | 33 | — | 39 | |||||||||||||||
Net cash from operations | 14 | 762 | (92 | ) | — | 684 | ||||||||||||||
Investing activities: | ||||||||||||||||||||
Additions to property, plant and mine development | — | (363 | ) | (121 | ) | — | (484 | ) | ||||||||||||
Additions to property, plant and mine development of discontinued operations | — | (3 | ) | (18 | ) | — | (21 | ) | ||||||||||||
Investments in marketable debt and equity securities | — | (183 | ) | (6 | ) | — | (189 | ) | ||||||||||||
Proceeds from sale of marketable debt and equity securities | — | — | 412 | — | 412 | |||||||||||||||
Investment in affiliates | — | — | (70 | ) | — | (70 | ) | |||||||||||||
Proceeds from sale of assets and other | 1 | 38 | (67 | ) | — | (28 | ) | |||||||||||||
Net cash (used in) provided from investing activities | 1 | (511 | ) | 130 | — | (380 | ) | |||||||||||||
Financing activities: | ||||||||||||||||||||
Net borrowings | (1,239 | ) | 757 | (187 | ) | — | (669 | ) | ||||||||||||
Dividends paid to common stockholders | (63 | ) | — | (8 | ) | — | (71 | ) | ||||||||||||
Dividends paid to minority interests | — | (146 | ) | — | — | (146 | ) | |||||||||||||
Proceeds from stock issuance | 1,287 | — | — | — | 1,287 | |||||||||||||||
Net cash (used in) provided from financing activities | (15 | ) | 611 | (195 | ) | — | 401 | |||||||||||||
Effect of exchange rate changes on cash | — | 1 | 23 | — | 24 | |||||||||||||||
Net change in cash and cash equivalents | — | 863 | (134 | ) | — | 729 | ||||||||||||||
Cash and cash equivalents at beginning of year | — | 165 | 235 | — | 400 | |||||||||||||||
Cash and cash equivalents at end of year | $ | — | $ | 1,028 | $ | 101 | $ | — | $ | 1,129 | ||||||||||
NOTE 2730 COMMITMENTS AND CONTINGENCIES
General
The Company follows SFAS No. 5, “Accounting for Contingencies,” in determining its accruals and disclosures with respect to loss contingencies. Accordingly, estimated losses from loss contingencies are accrued by a charge to income when information available prior to issuance of the financial statements indicates that it is probable (greater than a 75% probability) that an asset had been impaired or a liability had been incurred and the amount of the loss can be
NEWMONT MINING CORPORATION
NOTES TO CONSOLIDATED FINANCIAL STATEMENTS—(Continued)
(dollars in millions, except per share, per ounce and per pound amounts)
reasonably estimated. Legal expenses associated with the contingency are expensed as incurred. If a loss contingency is not probable or reasonably estimable, disclosure of the loss contingency is made in the financial statements when it is at least reasonably possible that a material loss may be incurred.
Operating Segments
The Company’s operating segments are identified in Note 25.28. Except as noted in this paragraph, all of the Company’s commitments and contingencies specifically described in this Note 2730 relate to the Corporate and Other reportable segment. The Nevada Operations matters under Newmont USA Limited relate to the Nevada reportable segment. The PT Newmont Minahasa Raya matters relate to the Other IndonesiaOperations reportable segment. The Yanacocha matters relate to the Yanacocha reportable segment. The Newmont Yandal Operations Pty Limited and the Newmont Australia Limited matters relate to the Australia/New Zealand reportable segment.
Environmental Matters
The Company’s mining and exploration activities are subject to various laws and regulations governing the protection of the environment. These laws and regulations are continually changing and are generally becoming more restrictive. The Company conducts its operations so as to protect the public health and environment and believes its operations are in compliance with applicable laws and regulations in all material respects. The Company has made, and expects to make in the future, expenditures to comply with such laws and regulations, but cannot predict the full amount of such future expenditures.
Estimated future reclamation costs are based principally on legal and regulatory requirements. At December 31, 2005 and December 31, 2004, $431 and 2003, $410.3 million and $361.0 million,$396, respectively, were accrued for reclamation costs relating to currently producing mineral properties, of which $63 and $53 are classified as current liabilities expected to be spent in accordance with SFAS No. 143, “Accounting for Asset Retirement Obligations.”2006. See Note 15.
12.
In addition, the Company is involved in several matters concerning environmental obligations associated with former mining activities. Generally, these matters concern developing and implementing remediation plans at the various sites involved. The Company believes that the related environmental obligations associated with these sites are similar in nature with respect to the development of remediation plans, their risk profile and the compliance required to meet general environmental standards. Based upon the Company’s best estimate of its liability for these matters, $74.9 million$77 and $58.6 million$75 were accrued for such obligations at December 31, 20042005 and 2003,December 31, 2004, respectively. These amounts are included inOther current liabilities and deferred revenueand Reclamation and remediation liabilities. Depending upon the ultimate resolution of these matters, the Company believes that it is reasonably possible that the liability for these matters could be as much as 81%101% greater or 34% lower than the amount accrued at December 31, 2004.2005. The amounts accrued for these matters are reviewed periodically based upon facts and circumstances available at the time. Changes in estimates are recorded inCosts and expenses, Other in the period estimates are revised.
NEWMONT MINING CORPORATION
NOTES TO CONSOLIDATED FINANCIAL STATEMENTS—(Continued)
Details about certain of the more significant matters involved are discussed below.
Dawn Mining Company LLC (“Dawn”)—51% Newmont Owned
Midnite Mine Site. Dawn previously leased an open pit uranium mine, currently inactive, on the Spokane Indian Reservation in the State of Washington. The mine site is subject to regulation by agencies of the U.S. Department of Interior (the Bureau of Indian Affairs and the Bureau of Land Management), as well as the United States Environmental Protection Agency (“EPA”).
NEWMONT MINING CORPORATION
NOTES TO CONSOLIDATED FINANCIAL STATEMENTS—(Continued)
(dollars in millions, except per share, per ounce and per pound amounts)
In 1991, Dawn’s mining lease at the mine was terminated. As a result, Dawn was required to file a formal mine closure and reclamation plan. The Department of Interior commenced an analysis of Dawn’s proposed plan and alternate closure and reclamation plans for the mine. Work on this analysis has been suspended indefinitely. In mid-2000, the mine was included on the National Priorities List under the Comprehensive Environmental Response, Compensation and Liability Act (“CERCLA”). In March 2003, the EPA notified Dawn and Newmont that it had thus far expended $11.5 million$12 on the remedial investigation/feasibility studyRemedial Investigation/Feasibility Study under CERCLA.
CERCLA (“RI/FS”). In October 2005, the EPA issued the RI/FS on this property in which it indicated a preferred remedy estimated to cost approximately $150. Newmont and Dawn filed comments on the RI/FS with the EPA in January 2006.
On January 28, 2005, the EPA filed a lawsuit against Dawn and Newmont under CERCLA in the U.S. District Court for the Eastern District of Washington. The EPA has asserted that Dawn and Newmont are liable for reclamation or remediation work and costs at the mine. Dawn does not have sufficient funds to pay for the reclamation plan it proposed or for any alternate plan, or for any additional remediation work or costs at the mine. Newmont intends to vigorously contest any claims as to its liability.
Newmont cannot reasonably predict the likelihood or outcome of this lawsuit or any other action against Dawn or Newmont arising from this matter.
Dawn Mill Site. Dawn also owns a uranium mill site facility, located on private land near Ford, Washington, which is subject to state and federal regulation. In late 1999, Dawn sought and later received state approval for a revised mill closure plan that expedites the reclamation process at the mill.site. The currently approved plan for the millsite is guaranteed by Newmont.
Idarado Mining Company (“Idarado”)—80.1% Newmont Owned
In July 1992, Newmont and Idarado signed a consent decree with the State of Colorado (“State”), which was agreed to by the U.S. District Court of Colorado, to settle a lawsuit brought by the State under CERCLA.
Idarado agreed in the consent decree to undertake specified remediation work at its former mining site in the Telluride/Ouray area of Colorado. Remediation work at this property is substantially complete. If the remediation does not achieve specific performance objectives defined in the consent decree, the State may require Idarado to implement supplemental activities at the site, also as defined in the consent decree. Idarado and Newmont obtained a $5.8 million$6 reclamation bond to secure their potential obligations under the consent decree. In addition, Idarado settled natural resources damages and past and future response costs, and agreed to habitat enhancement work under the consent decree. All of this work is substantially complete.
Newmont Capital Limited—100% Newmont Owned
In February 1999, the EPA placed the Lava Cap mine site in Nevada County, California on the National Priorities List under CERCLA. The EPA then initiated a remedial investigation/feasibility study under CERCLA to determine environmental conditions and remediation options at the site.
NEWMONT MINING CORPORATION
NOTES TO CONSOLIDATED FINANCIAL STATEMENTS—(Continued)
Newmont Capital, formerly known as Franco-Nevada Mining Corporation, Inc., owned the property for approximately three years from 1984 to 1986 but never mined or conducted exploration at the site. The EPA asserts that Newmont Capital is responsible for clean up costs incurred at the site. Newmont Capital and the EPA have entered into an agreement tolling the statute of limitations until December 31, 20052006 to facilitate settlement negotiations with respect to potential claims under CERCLA. Based on Newmont Capital’s limited involvement
NEWMONT MINING CORPORATION
NOTES TO CONSOLIDATED FINANCIAL STATEMENTS—(Continued)
(dollars in millions, except per share, per ounce and per pound amounts)
at Lava Cap, it does not believe it has any liability for environmental conditions at the site, and intends to vigorously defend any formal claims by the EPA. Newmont cannot reasonably predict the likelihood or outcome of any future action arising from this matter.
Newmont USA Limited—100% Newmont Owned
Pinal Creek. Newmont is a defendant in a lawsuit brought on November 5, 1991 in U.S. District Court in Arizona by the Pinal Creek Group, alleging that the company and others are responsible for some portion of costs incurred to address groundwater contamination emanating from copper mining operations located in the area of Globe and Miami, Arizona. Two former subsidiaries of Newmont, Pinto Valley Copper Corporation and Magma Copper Company (now known as BHP Copper Inc.), owned some of the mines in the area between 1983 and 1987. The court has dismissed plaintiffs’ claims seeking to hold Newmont liable for the acts or omissions of its former subsidiaries. Based on information presently available, Newmont believes it has strong defenses to plaintiffs’ remaining claims, including, without limitation, that Newmont’s agents did not participate in any pollution causing activities; that Newmont’s liabilities, if any, were contractually transferred to one of the plaintiffs; that portions of plaintiffs’ claimed damages are not recoverable; and that Newmont’s equitable share of liability, if any, would be immaterial. While Newmont has denied liability and is vigorously defending these claims, we cannot reasonably predict the final outcome of this lawsuit.
Nevada Operations. On November 19, 2002, Great Basin Mine Watch and the Mineral Policy Center (Appellants) filed suit in U.S. District Court in Nevada against the Department of the Interior and the Bureau of Land Management (BLM), challenging and seeking to enjoin the BLM’s July 2002 Record of Decision approving the company’sCompany’s amended Plan of Operations covering the Gold Quarry South Layback Project, and the BLM’s September 2002 Record of Decision approving a new Plan of Operations for the Leeville Mine. Appellants sought a declaration that the BLM’s decisions were unlawful and an injunction prohibiting Newmont’s approved activities. Newmont intervened in this action on behalf of the government defendants and filed an answer denying all of Appellants’ claims. In March 2004, the Court granted summary judgment in favor of the government and Newmont on all claims, thus ending the U.S. District Court proceedings. In June 2004, Appellants appealed the U.S. District Court’s decision to the U.S. Ninth Circuit Court of Appeals. While Newmont believes that this appeal is without merit, an unfavorable outcome could result in additional conditions on operations that could have a material adverse effect on the Company’s financial position or results of operations.
On October 16, 2002, Great Basin Mine Watch filed an appeal with the Nevada State Environmental Commission, challenging the Nevada Division of Environmental Protection’s (NDEP) renewal of the Clean Water Act discharge permit for Newmont’s Gold Quarry Mine. This permit governs the conditions under which Newmont may discharge mine-dewatering water in connection with its ongoing mining operations. Great Basin Mine Watch alleges that the terms of the renewed permit violate the Clean Water Act and Nevada water quality laws. Newmont intervened in this action on behalf of the NDEP. A hearing before the Nevada State Environmental Commission was held in June 2003 in Elko, Nevada. At the end of the hearing, the Commission ruled in favor of NDEP on all claims and affirmed NDEP’s renewal of the Clean Water Act discharge permit. Great Basin Mine Watch appealed this decision in the Nevada District Court in Carson City, Nevada. In September 2004, the Nevada District Court ruled in favor of NDEP on most issues but ruled in favor of Great Basin Mine Watch with respect to certain proposed permit amendments. Newmont and NDEP filed an appeal
NEWMONT MINING CORPORATION
NOTES TO CONSOLIDATED FINANCIAL STATEMENTS—(Continued)
with the Nevada Supreme Court, seeking to uphold these proposed amendments. The Nevada District Court stayed its decision pending this appeal and Gold Quarry continues to operate under its renewednew permit. While Newmont believes Great Basin Mine Watch’s position is without merit, it cannot reasonably predict the final outcome of this appeal, and an unfavorable outcome could result in additional conditions on operations that could have a material adverse effect on the company’s financial position or results of operations.
NEWMONT MINING CORPORATION
NOTES TO CONSOLIDATED FINANCIAL STATEMENTS—(Continued)
(dollars in millions, except per share, per ounce and per pound amounts)
On December 4, 2002, Great Basin Mine Watch filed an appeal with the Nevada State Environmental Commission challenging NDEP’s November 2002 decision renewing a water pollution control permit for Newmont’s Lone Tree Mine. This appeal alleges that NDEP’s renewal violated various procedural and substantive requirements under Nevada’s water quality laws. Newmont has intervened in this appeal. A hearing before the Nevada State Environmental Commission was held in February 2003 in Carson City, Nevada. At the close of the hearing, the Commission ruled in favor of NDEP on all claims, and affirmed NDEP’s renewal of the permit. Great Basin Mine Watch appealed this decision in the Nevada District Court in Carson City. At a hearing in June 2004, the judge ruled in favor of NDEP on all claims, and affirmed NDEP’s renewal of the permit. Great Basin Mine Watch filed an appeal of this decision with the Nevada Supreme Court. While Newmont believes that this appeal is without merit, an unfavorable outcome could result in additional conditionsCourt, and on operations that could have a material adverse effect onFebruary 15, 2006, the company’s financial position or results of operations.
On March 19, 2004, Great Basin Mine Watch andSupreme Court affirmed the Western Shoshone Defense Project (Appellants) filed an administrative appealruling of the Record of Decision approving the Phoenix Project Plan of Operations. Appellants sought to vacate the Record of Decision and have the BLM reconsider the decision. Newmont has interveneddistrict court in support of the Record of Decision. An administrative ruling affirmed the Phoenix Record of Decision. The BLM updated the amounts it required Newmont to place in a reclamation trust fund, and Newmont agreed to this amount.
all respects. This matter is now closed.
Grass Valley. On February 3, 2004, the City of Grass Valley, California brought suit against Newmont under CERCLA in the U.S. District Court for the Northern District of California. This matter involves an abandoned mine adit on property previously owned by a predecessor of Newmont and currently owned by the City of Grass Valley. The complaint alleges that the adit is discharging metals-bearing water into a stream on the property, in concentrations in excess of current EPA drinking water standards. Newmont cannot reasonably predict the likely outcome of this matter.
Gray Eagle Mine Site. By letter dated September 3, 2002, the EPA notified Newmont that the EPA had expended $2.6 million$3 in response costs to address environmental conditions associated with a historic tailings pile located at the Grey Eagle Mine site near Happy Camp, California, and requested that Newmont pay those costs. The EPA has identified four potentially responsible parties, including Newmont. Newmont does not believe it has any liability for environmental conditions at the Grey Eagle Mine site, and intends to vigorously defend any formal claims by the EPA. Newmont cannot reasonably predict the likelihood or outcome of any future action against it arising from this matter.
PT Newmont Minahasa Raya—Raya (“PTNMR”)—80% Newmont Owned
In July 2004, a criminal complaint was filed against PT Newmont Minahasa Raya (“PTNMR”),PTNMR, the Newmont subsidiary that operated the Minahasa mine in Indonesia, alleging environmental pollution relating to submarine tailings placement into nearby Buyat Bay. The Indonesian police detained five PTNMR employees during September and October of 2004. The police investigation and the detention of PTNMR’s employees was
NEWMONT MINING CORPORATION
NOTES TO CONSOLIDATED FINANCIAL STATEMENTS—(Continued)
declared illegal by the South Jakarta District Court in December 2004, but in March 2005, the Indonesian Supreme Court upheld the legality of the police investigation, and the police have appealed that decisionturned their evidence over to the Indonesian Supreme Court. A civil lawsuit, which waslocal prosecutor. In July 2005, the prosecutor filed by three residents ofan indictment against PTNMR and its President Director, alleging environmental pollution at Buyat Pante, a village located nearBay. After the Minahasa mine, was settled without paymentcourt rejected motions to dismiss the plaintiffsproceeding, the prosecutor called its first witnesses in December 2004. In addition, onOctober 2005. The trial is continuing and is expected to conclude in mid-2006.
On March 9, 2005, the Indonesian Ministry of the Environment reportedly filed a civil lawsuit against PTNMR and its President Director in relation to these allegations, seeking substantialin excess of $100 in monetary damages. In October 2005, PTNMR filed an objection to the court’s jurisdiction, contending that the Government previously agreed to resolve any disputes through out-of-court conciliation or arbitration. The Court upheld PTNMR’s objection and dismissed the case in November 2005. The Government filed a notice of appeal of this ruling. On February 16, 2006, PTNMR and the Government of the Republic of Indonesia signed an agreement settling the civil lawsuit. Under the terms of the agreement, the Government and PTNMR will nominate members to an independent scientific panel that will develop and implement a ten-year environmental monitoring and assessment program to make a definitive, scientific conclusion regarding the condition of Buyat Bay. PTNMR is required to fund specific remedial measures if, as a result of its mining operations, pollution has occurred. The
NEWMONT MINING CORPORATION
NOTES TO CONSOLIDATED FINANCIAL STATEMENTS—(Continued)
(dollars in millions, except per share, per ounce and per pound amounts)
agreement also provides for enhanced community development programs in North Sulawesi. PTNMR will provide initial funding of $12 to cover the cost of the monitoring and community development programs. Over a ten year period, PTNMR will contribute an additional $18. The funds will be managed by an organization governed by interested stakeholders. Accountability for the fund will be ensured through yearly reports that will be made available to the public. The transparency of the scientific panel’s activities will also be assured through annual reports to the public. The agreement is expected to end the civil lawsuit against PTNMR.
Independent sampling and testing of Buyat Bay water and fish, as well as area residents, conducted by the World Health Organization and the Australian Commonwealth Scientific and Industrial Research Organization, confirm that PTNMR has not polluted the Buyat Bay environment, and, therefore, has not adversely affected the fish in theBuyat Bay or the health of nearby residents. The Company remains steadfast that it has not caused pollution or health problems and will continue to vigorously defend itself against these allegations. However, Newmont cannot predict the outcome of these actionsthe criminal proceeding or whether additional legal actions may occur. Any of these actionsThis matter could adversely affect our ability to operate in Indonesia.
Resurrection Mining Company (“Resurrection”)—100% Newmont Owned
Newmont, Resurrection and other defendants were named in lawsuits filed by the State of Colorado under CERCLA in 1983, which were subsequently consolidated with a lawsuit filed by EPA in 1986. These proceedings sought to compel the defendants to remediate the impacts of pre-existing, historic mining activities near Leadville, Colorado, which date back to the mid-1800s, and which the government agencies claim were causing substantial environmental problems in the area.
In 1988 and 1989, the EPA issued administrative orders with respect to one area on the site and the defendants have collectively implemented those orders by constructing a water treatment plant, which was placed in operation in early 1992. Remaining remedial work for this area consists of water treatment plant operation and continuing environmental monitoring and maintenance activities. Newmont and Resurrection are currently responsible for 50% of these costs, but their share of such costs could increase in the event other defendants become unable to pay their share of such costs.
On August 9, 2005, ASARCO LLC, the party responsible for the other 50% of these costs, filed for Chapter 11 bankruptcy in the United States Bankruptcy Court for the Southern District of Texas. The company is evaluating the effect that the ASARCO bankruptcy could have on its obligations.
The parties also have entered into a consent decree with respect to the remaining areas at the site, which apportions liabilities and responsibilities for these areas. The EPA has approved remedial actions for selected components of Resurrection’s portion of the site, which were initiated in 1995. The EPA has not yet selected the final remedy for the site. Accordingly, NewmontResurrection cannot yet determine the full extent or cost of its share of the remedial action that will be required. The government agencies may also seek to recover for damages to natural resources. In March 1999, the parties entered into a Memorandum of Understanding (“MOU”) to facilitate the settlement of natural resources damages claims under CERCLA for the upper Arkansas River Basin. In January 2004, an MOU report was issued that evaluated the extent of natural resource damages and possible restoration activities that might be required, which Resurrection and other parties could potentially be required to fund. This report should provide a framework for resolving remaining issues at the site.
Other Legal Matters
Minera Yanacocha—51.35% Newmont Owned
Choropampa. In June 2000, a transport contractor of Yanacocha spilled approximately 151 kilograms of elemental mercury near the town of Choropampa, Peru, which is located 53 miles (85 kilometers) southwest of
NEWMONT MINING CORPORATION
NOTES TO CONSOLIDATED FINANCIAL STATEMENTS—(Continued)
(dollars in millions, except per share, per ounce and per pound amounts)
the Yanacocha mine. Elemental mercury is a by-product of gold mining and was sold to a Lima firm for use in medical instruments and industrial applications. A comprehensive health and environmental remediation program was undertaken by Yanacocha in response to the incident. In August 2000, Yanacocha paid under protest a fine
NEWMONT MINING CORPORATION
NOTES TO CONSOLIDATED FINANCIAL STATEMENTS—(Continued)
of 1,740,000 Peruvian soles (approximately $500,000)$0.5) to the Peruvian government. Yanacocha has entered into settlement agreements with a number of individuals impacted by the incident. In addition, it has entered into agreements with three of the communities impacted by this incident to provide a variety of public works asAs compensation for the disruption and inconvenience caused by the incident. As a result of this incident Yanacocha has incurred approximately $18.7 millionentered into agreements with and provided a variety of expenditures.public works in the three communities impacted by this incident. Yanacocha cannot predict the likelihood of additional expenditures related to this matter.
Yanacocha, various wholly-owned subsidiaries of Newmont, and other defendants have been named in lawsuits filed by over 1,000 Peruvian citizens in Denver District Court for the State of Colorado. These actions seek compensatory and punitive damages based on claims associated with the elemental mercury spill incident. In February 2005, Yanacocha and the various Newmont defendants answered the complaint in the Denver District Court.
Additional lawsuits relating to the Choropampa incident were filed against Yanacocha in two of the local courts of Cajamarca, Peru, in May 2002 by over 900 Peruvian citizens. A significant number of the plaintiffs in these lawsuits previously have entered into settlement agreements with Yanacocha. In December 2003, theYanacocha prior to filing such claims. The Superior Court inof Cajamarca has granted a resolutionresolutions upholding the validity of certain challenged settlement agreements. This ruling has beenThe Plaintiffs have appealed these rulings to the PeruvianPeru’s Supreme Court.
Court, where they remain pending. In 2005, Yanacocha entered into settlement agreements with approximately 350 additional plaintiffs.
Neither Newmont nor Yanacocha can reasonably predict the final outcome of any of the above-described lawsuits.
Cerro Quilish. Yanacocha was involved in a dispute with the Provincial Municipality of Cajamarca regarding the authority of that governmental body to regulate the development of the Cerro Quilish ore deposit. Cerro Quilish is located in the same watershed in which the City of Cajamaraca is located. The Municipality enacted an ordinance declaring Cerro Quilish and its watershed to be a reserve and naturally protected area. Yanacocha challenged this ordinance on the grounds that, under Peruvian law, local governments lack authority to create such areas. The Peruvian Constitutional Tribunal heard the case in early 2003 and ruled on April 7, 2003. The ruling established that Yanacocha’s rights were not impacted by the ordinance and Yanacocha should complete a full environmental impact study prior to initiating any development at Cerro Quilish, and adopt mitigation measures necessary to protect the quality and quantity of the water supply of the City of Cajamarca. In July 2004, Yanacocha received a drilling permit authorizing additional exploration of the Cerro Quilish deposit. During September 2004, individuals from the Cajamarca region conducted a sustained blockade of the road between the City of Cajamarca and the mine site, in protest of these exploration activities. Yanacocha suspended all drilling activities at Cerro Quilish and the blockade was resolved. In November 2004, in recognition of community concerns, Yanacocha requested and received the revocation of its Cerro Quilish drilling permit.
Minas Conga. Yanacocha is involved in a dispute with the Provincial Municipality of Celendin regarding the authority of that governmental body to regulate the development of the Minas Conga ore deposit. In the fourth quarter of 2004, the Municipality of Celendin enacted a similaran ordinance to that enacted by the
NEWMONT MINING CORPORATION
NOTES TO CONSOLIDATED FINANCIAL STATEMENTS—(Continued)
Municipality of Cajamarca with regard to Cerro Quilish, as described above, declaring the area around Minas Conga to be a mining-free reserve and naturally protected area. As in the Cerro Quilish case, Yanacocha has challenged this ordinance on the grounds that, under Peruvian law, local governments lack authority to create such areas and deny the rights granted by Yanacocha’s mining concessions. Based on thelegal precedent established by thePeru’s Constitutional Tribunal’s treatment of the Quilish ordinance,Tribunal, it is reasonable to believe that a similar findingYanacocha’s mining rights will be made as toupheld.
Minera Yanacocha has carefully evaluated the social issues and dynamics of the communities in and around the area of Conga. Yanacocha has engaged in extensive community and external affairs efforts at this early stage of the Conga project. It is Yanacocha’s current assessment that a significant percentage of the population in the communities immediately surrounding the Conga area support the project and oppose the Celendin ordinance.
Yanacocha will continue to engage actively with these communities during the process of permitting the project, and will expand its outreach efforts to communities in the surrounding region. It will continually monitor and evaluate conditions in the area and any resulting impact on Yanacocha’s ability to successfully permit and develop the Conga deposit.
Newmont Australia Limited—Limited (“Normandy”)—100% Newmont Owned
In February 1999, Normandy Mining Limited (“Normandy,” now(now known as Newmont Australia Limited) sold certain subsidiary companies in a transaction that resulted in net cash proceeds of A$663 million.663. The sale did not give rise to any tax liability to Normandy because of the tax basis that Normandy had in the shares of the subsidiaries and the capital losses available to offset the net gain realized on the sale. This transaction is currently the subject of a
NEWMONT MINING CORPORATION
NOTES TO CONSOLIDATED FINANCIAL STATEMENTS—(Continued)
(dollars in millions, except per share, per ounce and per pound amounts)
review by the Australian Taxation Office (“ATO”). The ATO has sought documents from Newmont Australia Limited, the buyer of the subsidiaries and other parties. In December 2003, the ATO issued two draft position papers with respect to its current view of certain proposed tax adjustments required for two of Newmont Australia Limited’s wholly-owned Australian subsidiaries that participated in the transaction. The Company continues to believe that Normandy’s tax treatment was in accordance with the provisions of the relevant tax laws and intends to vigorously defend its position. Newmont Australia Limited cannot reasonably predict what future action the ATO may take in relation to this matter.
Newmont USA Limited—100% Newmont OwnedMining Corporation
On June 8, 2005, UFCW Local 880—Retail Food Employers Joint Pension Fund filed a putative class action in the federal district court in Colorado purportedly on behalf of purchasers of Newmont Mining Corporation (“Newmont”) publicly traded securities between July 28, 2004 and April 26, 2005. The action names Newmont, Wayne W. Murdy, Pierre Lassonde and Bruce D. Hansen as defendants. Substantially similar purported class actions were filed in the same court on June 15, 2005 by John S. Chapman and on June 20, 2005 by Zoe Myerson. Each of these complaints alleges, among other things, that Newmont and the individual defendants violated certain antifraud provisions of the federal securities laws by failing to disclose alleged operating deficiencies. The complaints seek unspecified monetary damages and other relief. In October, 2005, the court consolidated these cases. While Newmont and its officers who are named defendants deny the claims made and intend to vigorously defend against the claims, we cannot reasonably predict the final outcome of these cases.
On February 2, 2002,June 14, 2005, June 30, 2005 and July 1, 2005, purported derivative actions were filed, on behalf of Newmont, by Doris Staehr, Frank J. Donio and Jack G. Blaz, respectively, in the federal district court in Colorado against certain of Newmont’s current and former directors and officers. Each action alleges that certain of these defendants breached their fiduciary duties by engaging in insider trading and misappropriation of information, and that all defendants breached their fiduciary duties and engaged in conduct that constituted abuse of control, gross mismanagement, waste of corporate assets and unjust enrichment in connection with, among other things, failing to disclose alleged operating deficiencies and failing to prevent alleged violations of environmental laws in Indonesia. The plaintiffs seek, on behalf of Newmont, among other remedies, all damages sustained by the Company as a French citizen filedresult of the allegedly improper conduct. In November 2005, the court consolidated these cases and in December 2005 the court appointed a complaintlead plaintiff. While Newmont and its officers and directors who are named defendants deny the claims made and intend to vigorously defend against the Company and certain of its subsidiaries and former officers, Compañia de Minas Buenaventura, S.A.A. (“Buenaventura”), one of Buenaventura’s subsidiaries, and other individuals, in U.S. District Court in Denver. The plaintiff alleges that he had an arrangement with Normandy, under which his fee was dependent onclaims, we cannot reasonably predict the final outcome of these cases.
In a related development, on January 13, 2006, a purported Newmont shareholder sent to the Yanacocha shareholder dispute (which involvedBoard of Directors a lawsuit by Newmont and Buenaventura in Peruletter demanding the Company take action against the Bureau de Recherches Géologiques et Minières, the geological and mining bureau of the French government (the “BRGM”) and Normandy to enforce preemptive rights under the Minera Yanacocha by-laws, after the BRGM announced its intention to transfer its shares in Yanacocha to a company controlled by Normandy; this shareholder dispute was resolved in 2000 pursuant to a comprehensive settlement agreement among the parties). The February 2002 lawsuit alleged that the defendants violated the federal Racketeer Influenced Corrupt Organization Act (“RICO”) by corrupting the Peruvian Supreme Court in 1998 in order to prevail in the Yanacocha shareholder dispute. The suit seeks damages of not less than $25 million plus interest (which could be subjectpurported derivative actions with respect to trebling), as well as unspecified punitive damages. In January 2004, the court granted the defendants’ motion to dismiss; the plaintiff appealed this decision in February 2004. During the summer of 2002, the Peruvian attorney general’s office commenced an inquiry into certain of the allegations madematters alleged in the February 2002 lawsuit described above. In July 2003,derivative complaints. The Board has taken the Peruvian attorney general’s office announced that its investigation had concluded without finding any evidence of improper conduct in relation to the outcome of the Yanacocha shareholder dispute. Further, in February 2003, Newmont received a subpoena from the U.S. Department of Justice requiring the production of documents related to Newmont’s activities relating to the shareholder dispute described above from 1994 through 1999. In October 2004, Newmont was notified that the Department of Justice has closed its inquiry into this matter.
demand under consideration.
Newmont Yandal Operations Pty Ltd—Ltd (“NYOL”)—100% Newmont Owned
On September 3, 2003, J. Aron & Co. commenced proceedings in the Supreme Court of New South Wales (Australia) against Newmont Yandal Operations Pty Ltd (“NYOL”),NYOL, its subsidiaries and the administrator in
NEWMONT MINING CORPORATION
NOTES TO CONSOLIDATED FINANCIAL STATEMENTS—(Continued)
relation to the completed voluntary administration of the NYOL group. J. Aron & Co., an NYOL creditor, initially sought injunctive relief that was denied by the court on September 8, 2003. On October 30, 2003, J. Aron & Co. filed a statement of claim alleging various deficiencies in the implementation of the voluntary administration process and seeking damages and other relief against NYOL and other parties. Newmont cannot reasonably predict the final outcome of this lawsuit.
NEWMONT MINING CORPORATION
NOTES TO CONSOLIDATED FINANCIAL STATEMENTS—(Continued)
(dollars in millions, except per share, per ounce and per pound amounts)
Income Taxes
The Company operates in numerous countries around the world and accordingly it is subject to, and pays annual income taxes under, the various income tax regimes in the countries in which it operates. Some of these tax regimes are defined by contractual agreements with the local government, butand others are defined by the general corporate income tax laws of the country. The Company has historically filed, and continues to file, all required income tax returns and to pay the taxes reasonably determined to be due. The tax rules and regulations in many countries are highly complex and subject to interpretation. From time to time the Company is subject to a review of its historic income tax filings and in connection with such reviews, disputes can arise with the taxing authorities over the interpretation or application of certain rules to the Company’s business conducted within the country involved. AsRelated to these disputes, as of December 31, 20042005 and December 31, 2003,2004, the Company has accrued income taxes (and related interest and penalties, if applicable) in the amount of $305.6 million$220 and $244.8 million,$306, respectively, classified inOther long-term liabilities.liabilities and deferred revenue.This amountThese amounts represents what the Company believes will be the probable outcome of such disputes for all tax years for which additional income taxes can be assessed. The amounts accrued for these disputes are reviewed periodically based upon facts and circumstances available at the time.
Other Commitments and Contingencies
In a 1993 asset exchange, a wholly-owned subsidiary transferred a coal lease under which the subsidiary had collected advance royalty payments totaling $484 million.$484. From 1994 to 2018, remaining advance payments under the lease to the transferee total $390 million. In the event of$390. If title failure as stated in the lease occurs, this subsidiary has a primary obligation to refund previously collected payments and has a secondary obligation to refund any of the $390 million collected by the transferee, if the transferee fails to meet its refund obligation. The subsidiary has title insurance on the leased coal deposits of $240 million covering the secondary obligation. The Company and the subsidiary regard the circumstances entitling the lessee to a refund as remote.
The Company has minimum royalty obligations on one of its producing mines in Nevada for the life of the mine. Amounts paid as a minimum royalty (where production royalties are less than the minimum obligation) in any year are recoverable in future years when the minimum royalty obligation is exceeded. Although the minimum royalty requirement may not be met in a particular year, the Company expects that over the mine life, gold production will be sufficient to meet the minimum royalty requirements. Minimum royalty payments payable are $9.0 million for 2005, nil$4 for 2006, $5.4 million$20 for 2007, $18 for 2008 and $10.4 million$89 thereafter.
As part of its ongoing business and operations, the Company and its affiliates are required to provide surety bonds, bank letters of credit and bank guarantees as financial support for various purposes, including environmental reclamation, exploration permitting, workers compensation programs and other general corporate purposes. At December 31, 20042005 and December 31, 2003,2004, there were $357.2 million$386 and $202.9 million,$357, respectively, of outstanding letters of credit, surety bonds and bank guarantees (excluding the surety bond supporting the prepaid forward transaction described in Note 11)9). The surety bonds, letters of credit and bank guarantees reflect fair value as a condition of their underlying purpose and are subject to fees competitively determined in the market place. The obligations associated with these instruments are generally related to performance requirements that the Company addresses through its ongoing operations. As the specific
NEWMONT MINING CORPORATION
NOTES TO CONSOLIDATED FINANCIAL STATEMENTS—(Continued)
requirements are met, the beneficiary of the associated instrument cancels and/or returns the instrument to the issuing entity. Certain of these instruments are associated with operating sites with long-lived assets and will remain outstanding until closure. Generally, bonding requirements associated with environmental regulation are becoming more restrictive. In addition, the surety markets for certain types of environmental bonding used by the Company have become increasingly constrained. The Company, however, believes it is in compliance with all applicable bonding obligations and will be able to satisfy future bonding requirements, through existing or alternative means, as they arise.
NEWMONT MINING CORPORATION
NOTES TO CONSOLIDATED FINANCIAL STATEMENTS—(Continued)
(dollars in millions, except per share, per ounce and per pound amounts)
Under the Batu Hijau Contract of Work with the Indonesian government, beginning in 2005, and continuing through 2010, a portion of each foreign shareholders’ equity interest in the project must be offered for sale to the Indonesian government or to Indonesian nationals. The price at which such interest must be offered for sale to the Indonesian parties is the highest of the then-current replacement cost, the price at which shares of the project company would be accepted for listing on the Jakarta Stock Exchange, or the fair market value of such interest in the project company as a going concern. An Indonesian national currently owns a 20% equity interest in Batu Hijau, which would require Newmont and requires the Newmont/Sumitomo collectively,partnership to offer a 3% interest to the Indonesian government or to Indonesian nationals in 2006. Pursuant to this provision of the Batu Hijau Contract of Work, it is possible that the ownership interest of the Newmont/Sumitomo partnership in Batu Hijau could be reduced to 49% by the end of 2010.
Newmont is from time to time involved in various legal proceedings related to its business. Except in the above-described proceedings, management does not believe that adverse decisions in any pending or threatened proceeding or that amounts that may be required to be paid by reason thereof will have a material adverse effect on the Company’s financial condition or results of operations.
NOTE 2831 UNAUDITED SUPPLEMENTARY DATA
Deferred Stripping Costs
In general, mining costs are allocated to production costs, stockpiles, ore on leach pads and inventories, and are charged toCosts applicable to sales as incurred.when gold or copper is sold. However, at somecertain open pit mines whichthat have diverse grades and waste-to-ore ratios over the mine life, the Company defers and amortizes certain mining costs on a units-of-production basis over the life of the mine. These mining costs, which are commonly referred to as “deferred stripping” costs, are incurred in mining activities that are normally associated with the removal of waste rock. The deferred stripping accounting method is generally accepted in the mining industry where mining operations have diverse gradesgrade and waste-to-ore ratios;rations; however, industry practice does vary. Deferred stripping matches the costs of production with the sale of such production at the Company’s operations where it is employed, by assigning each ounce of gold or pound of copper with an equivalent amount of waste removal cost. If the Company were to expense stripping costs as incurred, there might be greater volatility in the Company’s period-to-period results of operations. Details of deferred stripping with respect to certain of the Company’s open pit mines are as follows:
See Notes 2 and 723 for additional information concerning deferred stripping.
NEWMONT MINING CORPORATION
NOTES TO CONSOLIDATED FINANCIAL STATEMENTS—(Continued)
Details of deferred stripping with respect to certain of the Company’s open pit mines are as follows (unaudited):
| Nevada(4) | La Herradura(5) | |||||||||||
| 2004 | 2003 | 2002 | 2004 | 2003 | 2002 | |||||||
Life-of-mine Assumptions Used as Basis For Deferred Stripping Calculations | ||||||||||||
– Stripping ratio(1) | 126.5 | 125.0 | 125.1 | 149.1 | 146.4 | 141.3 | ||||||
– Average ore grade(2) | 0.051 | 0.049 | 0.073 | 0.034 | 0.030 | 0.031 | ||||||
Actuals for Year | ||||||||||||
– Stripping ratio(1) | 154.3 | 124.9 | 72.2 | 156.1 | 157.4 | 158.5 | ||||||
– Average ore grade(2) | 0.059 | 0.075 | 0.081 | 0.026 | 0.026 | 0.026 | ||||||
Remaining Mine Life (years)(3) | 10 | 9 | 10 | 4 | 5 | 6 | ||||||
| Tanami(6) | Kalgoorlie(7) | |||||||||||
| 2004 | 2003 | 2002 | 2004 | 2003 | 2002 | |||||||
Life-of-mine Assumptions Used as Basis For Deferred Stripping Calculations | ||||||||||||
– Stripping ratio(1) | 82.3 | 48.8 | 68.2 | 110.9 | 114.8 | 111.5 | ||||||
– Average ore grade(2) | 0.160 | 0.160 | 0.113 | 0.061 | 0.065 | 0.065 | ||||||
Actuals for Year | ||||||||||||
– Stripping ratio(1) | 52.3 | 63.5 | 86.4 | 102.9 | 112.2 | 131.0 | ||||||
– Average ore grade(2) | 0.130 | 0.108 | 0.107 | 0.063 | 0.063 | 0.054 | ||||||
Remaining Mine Life (years)(3) | 1 | 1 | 2 | 13 | 13 | 14 | ||||||
| Martha(8) | Ovacik(9) | |||||||||||
| 2004 | 2003 | 2002 | 2004 | 2003 | 2002 | |||||||
Life-of-mine Assumptions Used as Basis For Deferred Stripping Calculations | ||||||||||||
– Stripping ratio(1) | 26.1 | 32.1 | 31.7 | 41.6 | 34.9 | 28.9 | ||||||
– Average ore grade(2) | 0.107 | 0.103 | 0.093 | 0.385 | 0.356 | 0.362 | ||||||
Actuals for Year | ||||||||||||
– Stripping ratio(1) | 31.7 | 29.5 | 36.6 | 57.0 | 40.4 | 32.1 | ||||||
– Average ore grade(2) | 0.091 | 0.089 | 0.100 | 0.298 | 0.374 | 0.358 | ||||||
Remaining Mine Life (years)(3) | 3 | 3 | 4 | 2 | 2 | 3 | ||||||
| Nevada(4) | La Herradura(5) | |||||||||||
| 2005 | 2004 | 2003 | 2005 | 2004 | 2003 | |||||||
Life-of-mine Assumptions Used as Basis For Deferred Stripping Calculations | ||||||||||||
–Stripping ratio(1) | 126.6 | 126.5 | 125.0 | 146.9 | 149.1 | 146.4 | ||||||
–Average ore grade(2) | 0.046 | 0.051 | 0.049 | 0.034 | 0.034 | 0.030 | ||||||
Actuals for Year | ||||||||||||
–Stripping ratio(1) | 139.1 | 154.3 | 124.9 | 193.0 | 156.1 | 157.4 | ||||||
–Average ore grade(2) | 0.053 | 0.059 | 0.075 | 0.029 | 0.026 | 0.026 | ||||||
Remaining Mine Life (years)(3) | 16 | 10 | 9 | 4 | 4 | 5 | ||||||
NEWMONT MINING CORPORATION
NOTES TO CONSOLIDATED FINANCIAL STATEMENTS—(Continued)
(dollars in millions, except per share, per ounce and per pound amounts)
| ||||||
| ||||||
| ||||||
| ||||||
| ||||||
| ||||||
| ||||||
| Tanami(6) | Kalgoorlie(7) | |||||||||||
| 2005 | 2004 | 2003 | 2005 | 2004 | 2003 | |||||||
Life-of-mine Assumptions Used as Basis For Deferred Stripping Calculations | ||||||||||||
—Stripping ratio(1) | N/A | 82.3 | 48.8 | 100.1 | 110.9 | 114.8 | ||||||
—Average ore grade(2) | N/A | 0.160 | 0.160 | 0.061 | 0.061 | 0.065 | ||||||
Actuals for Year | ||||||||||||
—Stripping ratio(1) | N/A | 52.3 | 63.5 | 116.3 | 102.9 | 112.2 | ||||||
—Average ore grade(2) | N/A | 0.130 | 0.108 | 0.062 | 0.063 | 0.063 | ||||||
Remaining Mine Life (years)(3) | N/A | 1 | 1 | 12 | 13 | 13 | ||||||
| Martha(8) | Ovacik(9) | |||||||||||
| 2005 | 2004 | 2003 | 2005 | 2004 | 2003 | |||||||
Life-of-mine Assumptions Used as Basis For Deferred Stripping Calculations | ||||||||||||
—Stripping ratio(1) | 18.8 | 26.1 | 32.1 | N/A | 41.6 | 34.9 | ||||||
—Average ore grade(2) | 0.114 | 0.107 | 0.103 | N/A | 0.385 | 0.356 | ||||||
Actuals for Year | ||||||||||||
—Stripping ratio(1) | 12.9 | 31.7 | 29.5 | N/A | 57.0 | 40.4 | ||||||
—Average ore grade(2) | 0.143 | 0.091 | 0.089 | N/A | 0.298 | 0.374 | ||||||
Remaining Mine Life (years)(3) | 1 | 3 | 3 | N/A | 2 | 2 | ||||||
| Batu Hijau(10) | ||||||
| 2005 | 2004 | 2003 | ||||
Life-of-mine Assumptions Used as Basis For Deferred Stripping Calculations | ||||||
—Stripping ratio(1) | 0.20 | 0.22 | N/A | |||
—Average ore grade(2) | 4.93 | 4.63 | N/A | |||
Actuals for Year | ||||||
—Stripping ratio(1) | 0.21 | 0.16 | N/A | |||
—Average ore grade(2) | 4.74 | 6.22 | N/A | |||
Remaining Mine Life (years)(3) | 13 | 14 | N/A | |||
| (1) | Total tons to be mined in future divided by total ounces of gold or total pounds of copper equivalent to be recovered in future, based on proven and probable reserves. Pounds of copper equivalent equate to copper pounds plus gold ounces converted to copper pounds on an equivalent revenue basis. |
NEWMONT MINING CORPORATION
NOTES TO CONSOLIDATED FINANCIAL STATEMENTS—(Continued)
| (2) | Total tons mined divided by total ounces of gold recovered or total pounds of copper equivalent recovered. |
| (3) | Remaining mine life (years) is as of January 1st of the year being presented and is based on the then current life-of-mine plan. |
| (4) | The actual stripping ratio and average ore grade are higher than the life-of-mine. The stripping ratio will increase when operations commence at Phoenix. |
| (5) | The actual stripping ratio |
| mined. La Herradura is included in the Company’s Other |
| (6) |
| (7) | The actual stripping ratio |
| (8) | The actual |
NEWMONT MINING CORPORATION
NOTES TO CONSOLIDATED FINANCIAL STATEMENTS—(Continued)
(dollars in millions, except per share, per ounce and per pound amounts)
| (9) | Ovacik suspended mine operations in August 2004 and was sold in March 2005. Ovacik was included in the Other Operations reportable segment. |
| (10) | The actual stripping ratio in 2005 is significantly higher than the prior year, primarily a result of the lower average ore grade. The average ore grade in 2005 was impacted as several small pit wall failures limited access to high-grade ore in the bottom of the pit during the first quarter. |
Quarterly Data
The following is a summary of selected quarterly financial information (unaudited and(unaudited):
| 2005 | ||||||||||||||||
| Three Months Ended | ||||||||||||||||
| March 31 | June 30 | September 30 | December 31 | |||||||||||||
Revenues | $ | 945 | $ | 998 | $ | 1,158 | $ | 1,305 | ||||||||
Gross profit(1) | $ | 245 | $ | 292 | $ | 407 | $ | 498 | ||||||||
Income from continuing operations | $ | 85 | $ | 88 | $ | 128 | $ | 73 | ||||||||
Loss from discontinued operations | $ | (1 | ) | $ | (38 | ) | $ | (2 | ) | $ | (11 | ) | ||||
Net income applicable to common shares | $ | 84 | $ | 50 | $ | 126 | $ | 62 | ||||||||
Income from continuing operations, per common share, basic | $ | 0.19 | $ | 0.20 | $ | 0.29 | $ | 0.16 | ||||||||
Loss from discontinued operations, per common share, basic | $ | — | $ | (0.09 | ) | $ | (0.01 | ) | $ | (0.02 | ) | |||||
Net income per common share, basic | $ | 0.19 | $ | 0.11 | $ | 0.28 | $ | 0.14 | ||||||||
Income from continuing operations, per common share, diluted | $ | 0.19 | $ | 0.19 | $ | 0.29 | $ | 0.16 | ||||||||
(Loss) income from discontinued operations, per common share, diluted | $ | — | $ | (0.08 | ) | $ | (0.01 | ) | $ | (0.02 | ) | |||||
Net income per common share, diluted | $ | 0.19 | $ | 0.11 | $ | 0.28 | $ | 0.14 | ||||||||
Basic weighted-average shares outstanding | 446 | 446 | 446 | 447 | ||||||||||||
Diluted weighted-average shares outstanding | 448 | 449 | 449 | 450 | ||||||||||||
Dividends declared per common share | $ | 0.10 | $ | 0.10 | $ | 0.10 | $ | 0.10 | ||||||||
Closing price of common stock | $ | 42.25 | $ | 39.03 | $ | 47.17 | $ | 53.40 | ||||||||
NEWMONT MINING CORPORATION
NOTES TO CONSOLIDATED FINANCIAL STATEMENTS—(Continued)
(dollars in millions, except per share, per ounce and per pound amounts):
| 2004 | 2004 | |||||||||||||||||||||||||||
| Three Months Ended | Three Months Ended | |||||||||||||||||||||||||||
| March 31, | June 30, | September 30, | December 31, | March 31 | June 30 | September 30 | December 31 | |||||||||||||||||||||
Revenues | $ | 1,122.3 | (1) | $ | 1,009.1 | $ | 1,162.7 | $ | 1,230.0 | $ | 1,098 | $ | 976 | $ | 1,139 | $ | 1,198 | |||||||||||
Gross profit(2) | $ | 365.7 | (1) | $ | 278.4 | $ | 412.1 | $ | 468.2 | |||||||||||||||||||
Income before cumulative effect of a change in accounting principle | $ | 133.8 | $ | 37.5 | $ | 128.7 | $ | 190.4 | ||||||||||||||||||||
Gross profit(1) | $ | 364 | $ | 284 | $ | 414 | $ | 471 | ||||||||||||||||||||
Income from continuing operations | $ | 130 | $ | 42 | $ | 131 | $ | 150 | ||||||||||||||||||||
(Loss) income from discontinued operations | $ | 4 | $ | (5 | ) | $ | (2 | ) | $ | 40 | ||||||||||||||||||
Cumulative effect of a change in accounting principle, net of tax | $ | (47 | ) | $ | — | $ | — | $ | — | |||||||||||||||||||
Net income applicable to common shares | $ | 86.7 | $ | 37.5 | $ | 128.7 | $ | 190.4 | $ | 87 | $ | 37 | $ | 129 | $ | 190 | ||||||||||||
Income before cumulative effect of a change in accounting principle, per common share, basic and diluted | $ | 0.30 | $ | 0.08 | $ | 0.29 | $ | 0.43 | ||||||||||||||||||||
Net income per common share, basic and diluted | $ | 0.20 | $ | 0.08 | $ | 0.29 | $ | 0.43 | ||||||||||||||||||||
Income from continuing operations, per common share, basic | $ | 0.29 | $ | 0.09 | $ | 0.30 | $ | 0.34 | ||||||||||||||||||||
(Loss) income from discontinued operations, per common share, basic | $ | 0.01 | $ | (0.01 | ) | $ | — | $ | 0.09 | |||||||||||||||||||
Cumulative effect of a change in accounting principle, net of tax, per common share, basic | $ | (0.11 | ) | $ | — | $ | — | $ | — | |||||||||||||||||||
Net income per common share, basic | $ | 0.19 | $ | 0.08 | $ | 0.30 | $ | 0.43 | ||||||||||||||||||||
Income from continuing operations, per common share, diluted | $ | 0.29 | $ | 0.09 | $ | 0.30 | $ | 0.33 | ||||||||||||||||||||
(Loss) income from discontinued operations, per common share, diluted | $ | 0.01 | $ | (0.01 | ) | $ | — | $ | 0.09 | |||||||||||||||||||
Cumulative effect of a change in accounting principle, net of tax, per common share, diluted | $ | (0.11 | ) | $ | — | $ | — | $ | — | |||||||||||||||||||
Net income per common share, diluted | $ | 0.19 | $ | 0.08 | $ | 0.30 | $ | 0.42 | ||||||||||||||||||||
Basic weighted-average shares outstanding | 442.5 | 443.1 | 443.5 | 444.6 | 443 | 443 | 444 | 445 | ||||||||||||||||||||
Diluted weighted-average shares outstanding | 446.6 | 446.3 | 447.1 | 448.0 | 447 | 446 | 447 | 448 | ||||||||||||||||||||
Dividends declared per common share | $ | 0.05 | $ | 0.075 | $ | 0.075 | $ | 0.10 | $ | 0.05 | $ | 0.075 | $ | 0.075 | $ | 0.10 | ||||||||||||
Closing price of common stock | $ | 46.63 | $ | 38.76 | $ | 45.53 | $ | 44.41 | $ | 46.63 | $ | 38.76 | $ | 45.53 | $ | 44.41 | ||||||||||||
| 2003 | ||||||||||||||||||||||||||||
| Three Months Ended | ||||||||||||||||||||||||||||
| March 31, | June 30, | September 30, | December 31, | |||||||||||||||||||||||||
Revenues | $ | 734.0 | (1) | $ | 736.8 | $ | 881.2 | $ | 805.8 | |||||||||||||||||||
Gross profit(2) | $ | 189.0 | (1) | $ | 165.2 | $ | 268.4 | $ | 270.4 | |||||||||||||||||||
Income before cumulative effect of a change in accounting principle | $ | 151.8 | $ | 90.8 | $ | 114.4 | $ | 153.1 | ||||||||||||||||||||
Net income applicable to common shares | $ | 117.3 | $ | 90.8 | $ | 114.4 | $ | 153.1 | ||||||||||||||||||||
Income before cumulative effect of a change in accounting principle, per common share, basic and diluted | $ | 0.38 | $ | 0.22 | $ | 0.28 | $ | 0.36 | ||||||||||||||||||||
Net income per common share, basic and diluted | $ | 0.29 | $ | 0.22 | $ | 0.28 | $ | 0.36 | ||||||||||||||||||||
Basic weighted-average shares outstanding | 401.9 | 405.4 | 408.4 | 426.5 | ||||||||||||||||||||||||
Diluted weighted-average shares outstanding | 404.2 | 408.2 | 412.9 | 430.9 | ||||||||||||||||||||||||
Dividends declared per common share | $ | 0.04 | $ | 0.04 | $ | 0.04 | $ | 0.05 | ||||||||||||||||||||
Closing price of common stock | $ | 26.15 | $ | 32.46 | $ | 39.09 | $ | 48.61 | ||||||||||||||||||||
| (1) |
| Revenues lessCosts applicable to sales |
Significant after-tax adjustments were as follows:
The significant fourthFourth quarter adjustments2005: (i) $41 ($0.09 per share, basic) goodwill impairment charge at Nevada; (ii) a $26 ($0.06 per share, basic) non-cash write-own of long-lived assets; (iii) an $18 ($0.04 per share, basic) charge for 2004 werelitigation costs and settlement provision; (iv) a $16 ($0.03 per share, basic) reclamation estimate charge; (v) an $11 ($0.02 per share, basic) net gain on the sale of Oxiana shares; and (vi) a $6 ($0.01 per share, basic) net gain adjustment to the QMC loan receivable valuation allowance;
Third quarter 2005: (i) $25 ($0.06 per share, basic) gain on the sale of the Kinross Gold Corporation stock; and (ii) a $15 ($0.03 per share, basic) expense for environmental litigation and reclamation costs at Minahasa in Indonesia;
Second quarter 2005: $30 ($0.07 per share, basic) impairment at Golden Grove in Australia;
First quarter 2005: (i) $20 ($0.04 per share, basic) gain on the sale of the Mezcala property in Mexico; and (ii) a $19 ($0.04 per share, basic) net tax benefit from changes in Australian tax law;
NEWMONT MINING CORPORATION
NOTES TO CONSOLIDATED FINANCIAL STATEMENTS—(Continued)
(dollars in millions, except per share, per ounce and per pound amounts)
Fourth quarter 2004: (i) $52 million ($0.12 per share, basic) after-tax goodwill impairment charge at Pajingo; (ii) a $9 million ($0.02 per share, basic) non-cash after-tax writedown of long-lived assets; (iii) an $16 million ($0.04 per share, basic) non-cash after-tax reclamation estimate gain; (iv) a $3 million ($0.01 per share, basic) non-cash after-tax net gain on the disposition of Perama and QMC; and (v) a $71 million ($0.16 per share, basic) net tax benefit resulting from the release of tax valuation allowances, tax true-ups and the filing of a consolidated tax return in Australia. Significant fourth
Second quarter adjustments for 2003 were2004: (i) $30 million$32 ($0.07 per share, basic) after-tax loss onnon-cash charge for an other-than-temporary decline in the Company’s investment in Kinross Gold Corporation; and (ii) a guarantee of QMC debt; (ii) $18 million$16 ($0.04 per share, basic) after-tax impairment chargenon-cash write-down of long-lived assets at Golden GiantOvacik in Canada; and (iii) $72 millionTurkey;
First quarter 2004: $47 ($0.170.10 per share, basic) tax benefit fromnon-cash charge to recognize the releasecumulative effect of valuation allowances.
NEWMONT MINING CORPORATION
NOTES TO CONSOLIDATED FINANCIAL STATEMENTS—(Continued)
a change in accounting principle to reflect conforming accounting policies upon consolidation of Batu Hijau.
NOTE 2932 SUBSEQUENT EVENTS
In January 2006, Newmont acquired Kenbert Mining’s 15% interest in the Akyem project, bringing Newmont’s interest to 100%.
In January 2006, the International Finance Corporation approved $125 in project financing for the Ahafo project. The financing is subject to satisfactory final documentation and syndication to commercial banks. The Company expects to close and draw down on the facility prior to mid-year.
On March 1, 2005,February 15, 2006, Newmont soldentered into an agreement to acquire Newcrest Mining Limited’s 22.22% interest in the Ovacik mine, locatedBoddington Project in western Turkey, to a subsidiary of Koza Davetiye, a listed Turkish conglomerate.Western Australia. Consideration for the mine included $20 million paid at closing,purchase is A$225 plus applicable stamp duty and various contingent payments that could total as much as $24.5 million if all conditions precedent are met.
similar costs. When the transaction closes, Newmont’s interest in Boddington will increase to two-thirds. Closing of the transaction is subject to Australian Foreign Investment Review Board and Western Australia Ministry of Mines approval, which is expected by April 2006.
On March 3, 2005, Newmont Mining CorporationFebruary 16, 2006, PTNMR and the Government of Canada Limited agreedthe Republic of Indonesia signed an agreement settling a civil lawsuit brought by the Republic of Indonesia. Under the terms of the agreement, the Government and PTNMR will nominate members to purchase 9.9%an independent scientific panel that will develop and implement a ten-year environmental monitoring and assessment program to make a definitive, scientific conclusion regarding the condition of Shore Gold Inc.,Buyat Bay. PTNMR is required to fund specific remedial measures if, as a company trading onresult of its mining operations, pollution has occurred. The agreement also provides for enhanced community development programs in North Sulawesi. PTNMR will provide initial funding of $12 to cover the Toronto Venture Exchange as SGF.cost of the monitoring and community development programs. Over a ten year period, PTNMR will contribute an additional $18. The purchase priceCompany has accrued $24, representing the present value of these obligations at December 31, 2005. The funds will be managed by an organization governed by interested stakeholders. Accountability for the fund will be ensured through yearly reports that will be made available to the public. The transparency of the scientific panel’s activities will also be assured through annual reports to the public. The agreement is expected to beend the civil lawsuit against PTNMR.
On February 27, 2006, Newmont announced that it will proceed with the development of the Boddington Project in Western Australia with AngloGold Ashanti Limited (“AngloGold”). AngloGold has also approved Boddington’s development. Construction of the range of CDN $49-51 million. ClosingBoddington Project is expected to occur on or about March 22, 2005.cost Newmont approximately $900 to $1,000, with initial production expected in late 2008. The project has a current estimated mine life of more than 15 years, with Newmont’s share of annual production expected to be approximately 700,000 ounces for the first five years of production and average approximately 600,000 ounces over the life of the project.
| ITEM 9. | CHANGES IN AND DISAGREEMENTS WITH ACCOUNTANTS ON ACCOUNTING AND FINANCIAL DISCLOSURE |
NoneNone.
ITEM 9A. CONTROLS AND PROCEDURES
| ITEM 9A. | CONTROLS AND PROCEDURES |
During the fiscal period covered by this report, the Company’s management, with the participation of the Chief Executive Officer and Chief Financial Officer of the Company, carried out an evaluation of the effectiveness of the design and operation of the Company’s disclosure controls and procedures (as defined in Rules 13a-15(e) and 15d-15(e) of the Securities Exchange Act of 1934, as amended (the “Exchange Act”)). Based on such evaluation, the Company’s Chief Executive Officer and Chief Financial Officer have concluded that, as of the end of the period covered by this report, the Company’s disclosure controls and procedures are effective to ensure that information required to be disclosed by the Company in reports that it files or submits under the Exchange Act is recorded, processed, summarized and reported within the required time periods.
There has been no change in the Company’s internal control over financial reporting during the most recent fiscal quarter that has materially affected, or that is reasonably likely to materially affect, the Company’s internal control over financial reporting.
Management’s report on internal control over financial reporting is included in Item 8 of this annual report on Form 10-K.
| ITEM 9B. | OTHER INFORMATION |
None.
ITEM 10. DIRECTORS AND EXECUTIVE OFFICERS OF THE REGISTRANT
| ITEM 10. | DIRECTORS AND EXECUTIVE OFFICERS OF THE REGISTRANT |
Information concerning Newmont’s directors, Audit Committee Financial Experts, Compliance with Section 16(a) of the Exchange Act and Code of Ethics is contained in Newmont’s definitive Proxy Statement, filed pursuant to Regulation 14A promulgated under the Securities Exchange Act of 1934 for the 20052006 Annual Meeting of Stockholders and is incorporated herein by reference. Information concerning Newmont’s executive officers is set forth under Item 4A of this report.
ITEM 11. EXECUTIVE COMPENSATION
| ITEM 11. | EXECUTIVE COMPENSATION |
Information concerning this item is contained in Newmont’s definitive Proxy Statement, filed pursuant to Regulation 14A promulgated under the Securities Exchange Act of 1934 for the 20052006 Annual Meeting of Stockholders and is incorporated herein by reference.
| ITEM 12. | SECURITY OWNERSHIP OF CERTAIN BENEFICIAL OWNERS AND MANAGEMENT AND RELATED STOCKHOLDER MATTERS |
Information concerning this item is contained in Newmont’s definitive Proxy Statement, filed pursuant to Regulation 14A promulgated under the Securities Exchange Act of 1934 for the 2006 Annual Meeting of Stockholders and incorporated herein by reference.
Equity Compensation Plan Information
The following table sets forth as of December 31, 2005 information regarding Newmont’s Common Stock that may be issued under Newmont’s equity compensation plans:
Plan Category | Number of Securities to be (a)(1) | Weighted-average exercise price of outstanding options, warrants and rights (b) | Number of securities plans (excluding securities (c) | ||||||
Equity compensation plans approved by security holders(2) | 7,885,782 | (3) | $ | 36.28 | 18,963,560 | (4) | |||
Equity compensation plans not approved by security holders | 1,314,068 | (5) | $ | 23.21 | -0- | ||||
TOTAL | 9,199,850 | $ | 32.76 | 18,963,560 | |||||
| (1) | Shares of restricted stock granted under the 1999 Employees Stock Plan and 2005 Stock Incentive Plan are not listed in the table because such shares are currently issued and outstanding. The shares of restricted stock vest over three or more years and transfer restrictions expire upon vesting. Holders of shares of restricted stock are entitled to vote the shares and to receive any dividends declared on the shares. The weighted average exercise price does not take these awards into account. |
Director stock units awarded under the 2005 Stock Incentive Plan are listed in the table. Non-employee directors receive director stock units unless an election to receive common stock is made prior to the year in which the award is made. Holders of director stock units are not entitled to vote the underlying shares or to receive any dividends declared on the shares. Upon the retirement of the non-employee director, and the holder of director stock units is entitled to receive one share of Newmont common stock for each director stock unit.
Restricted stock units awarded under the 1999 Employees Stock Plan are listed in the table. Restricted stock units are awarded to employees in certain foreign jurisdictions. Prior to vesting, a holder of restricted stock
units does not have the right to vote the underlying shares or receive any dividends. The restricted stock units vest in three equal increments over three years. Upon vesting, the holder of restricted stock units is entitled to receive one share of Newmont common stock for each restricted stock unit. No additional grants or awards will be made under this plan.
| (2) | Newmont’s 2005 Stock Incentive Plan was approved by the stockholders on April 27, 2005. A maximum of 20,000,000 shares of Newmont’s Common Stock were authorized to be issued under this plan. Out of this maximum number of shares, no more than 10,000,000 shares may be awarded as restricted stock or other stock-based awards and no more than 1,000,000 shares may be awarded as non-employee director stock awards. |
| (3) | This number includes stock issuable upon vesting of outstanding stock awards and deferred stock awards, and director stock awards, granted under the 2005 Stock Incentive Plan of 1,009,816 shares and 12,672 director stock units, respectively. This number also includes 6,857,702 shares and 5,592 shares issuable upon vesting of outstanding stock awards and deferred stock awards granted under the 1996 Employees Stock Plan and stock awards under the 2000 Non-Employee Director Stock Plan, respectively. No additional stock awards will be made under the 1996 Employees Stock Plan and the 2000 Non-Employee Director Stock Plan. |
Upon the vesting of a deferred stock award, the holder is entitled to the issuance of the number of shares of common stock specified in the award, less applicable taxes, without the payment of any consideration by the employee.
This number does not include 593,281 shares of common stock issuable upon exercise of outstanding options granted under certain equity plans assumed by Newmont in acquisitions. The weighted average exercise price of outstanding options granted under the assumed plans as of December 31, 2005 was $35.93. Newmont cannot grant any additional options or awards under these assumed plans.
| (4) | Securities remaining available for future issuance under the 2005 Stock Incentive Plan. No additional grants or awards will be made under the 1996 Employees Stock Plan, 1999 Employees Stock Plan and 2000 Non-Employee Director Stock Plan. |
| (5) | Shares of common stock issuable upon exercise of outstanding options granted under the 1999 Employees Stock Plan. No additional grants or awards will be made under this plan. |
| ITEM 13. | CERTAIN RELATIONSHIPS AND RELATED TRANSACTIONS |
Information concerning this item is contained in Newmont’s definitive Proxy Statement, filed pursuant to Regulation 14A promulgated under the Securities Exchange Act of 1934 for the 20052006 Annual Meeting of Stockholders and incorporated herein by reference.
ITEM 13. CERTAIN RELATIONSHIPS AND RELATED TRANSACTIONS
| ITEM 14. | PRINCIPAL ACCOUNTANT FEES AND SERVICES |
Information concerning this item is contained in Newmont’s definitive Proxy Statement, filed pursuant to Regulation 14A promulgated under the Securities Exchange Act of 1934 for the 2005 Annual Meeting of Stockholders and incorporated herein by reference.
ITEM 14. PRINCIPAL ACCOUNTANT FEES AND SERVICES
Information concerning this item is contained in Newmont’s definitive Proxy Statement, filed pursuant to Regulation 14A promulgated under the Securities Exchange Act of 1934 for the 20052006 Annual Meeting of Stockholders and incorporated herein by reference.
ITEM 15. EXHIBITS AND FINANCIAL STATEMENT SCHEDULES
| ITEM 15. | EXHIBITS AND FINANCIAL STATEMENT SCHEDULES |
The following documents are filed as a part of this report:
The Consolidated Financial Statements, together with the report thereon of PricewaterhouseCoopers LLP dated March 15, 2005,February 24, 2006, are included as part of Item 8, Financial Statements and Supplementary Data, commencing on page 9581 above.
| Page | ||
Financial Statement Schedules
| Page | ||
Financial Statements of Nusa Tenggara Partnership V.O.F. | ||
| NT-1 | ||
Statements of Consolidated Operations and Comprehensive Income (Loss) | NT-2 | |
| NT-3 | ||
| NT-4 | ||
| NT-5 | ||
| NT-6 |
Exhibits
Reference is made to theExhibit Index beginning on page E-1 hereof.
REPORT OF INDEPENDENT ACCOUNTANTS
To the Board of Directors and the Partners of Nusa Tenggara Partnership V.O.F.:
In our opinion, the accompanying consolidated balance sheetssheet and the related statements of consolidated operations and comprehensive income (loss), changes in partners’ equity and of cash flows, present fairly, in all material respects, the financial position of Nusa Tenggara Partnership V.O.F. (a Dutch General Partnership) and its subsidiary at December 31, 2003 and 2002 and the results of their operations and their cash flows for each of the three years in the periodyear ended December 31, 2003 in conformity with accounting principles generally accepted in the United States of America. These financial statements are the responsibility of the Partnership’s management; our responsibility is to express an opinion on these financial statements based on our audits. We conducted our audits of these statements in accordance with auditing standards generally accepted in the United States of America, which require that we plan and perform the audit to obtain reasonable assurance about whether the financial statements are free of material misstatement. An audit includes examining, on a test basis, evidence supporting the amounts and disclosures in the financial statements, assessing the accounting principles used and significant estimates made by management, and evaluating the overall financial statement presentation. We believe that our audits provide a reasonable basis for our opinion.
As explained in Notes 2 and 11 to the consolidated financial statements, the Partnership changed its method of accounting for asset retirement obligations on January 1, 2003.
As explained in Note 2 to the consolidated financial statements, the Partnership changed its method of accounting for derivative instruments and hedging activities on January 1, 2001.
/s/ PRICEWATERHOUSECOOPERS LLP |
| PricewaterhouseCoopers LLP |
Denver, Colorado
February 27, 2004
NT-1
NUSA TENGGARA PARTNERSHIP V.O.F.
STATEMENTS OF CONSOLIDATED OPERATIONS AND COMPREHENSIVE INCOME (LOSS)
(Amounts in thousands of United States dollars)
| Years Ended December 31, | ||||||||||||
| 2003 | 2002 | Year Ended December 31, 2003 | ||||||||||
Revenues | ||||||||||||
Concentrate sales | ||||||||||||
Contained copper | $ | 522,718 | $ | 463,413 | $ | 522,718 | ||||||
Third-party smelting and refining costs | (98,045 | ) | (103,727 | ) | ||||||||
Third-party treatment and refining costs | (98,045 | ) | ||||||||||
| 424,673 | 359,686 | 424,673 | ||||||||||
Costs and expenses | ||||||||||||
Production costs (exclusive of depreciation, depletion and amortization shown separately below) | 68,564 | 117,286 | 68,564 | |||||||||
Depreciation, depletion and amortization | 125,917 | 125,057 | 125,917 | |||||||||
Exploration | 1,455 | 225 | 1,455 | |||||||||
Other | 33 | 15 | 33 | |||||||||
| 195,969 | 242,583 | 195,969 | ||||||||||
Other income (expense) | ||||||||||||
Interest income and other | 2,811 | 2,731 | 2,811 | |||||||||
Interest expense | (49,424 | ) | (59,415 | ) | (49,424 | ) | ||||||
| (46,613 | ) | (56,684 | ) | (46,613 | ) | |||||||
Pre-tax income before cumulative effect of a change in accounting principle | 182,091 | 60,419 | 182,091 | |||||||||
Income tax expense | (67,079 | ) | (24,942 | ) | (67,079 | ) | ||||||
Income before cumulative effect of a change in accounting principle | 115,012 | 35,477 | 115,012 | |||||||||
Cumulative effect of a change in accounting principle, net of tax of U.S.$1.4 million in 2003 | (14,218 | ) | — | |||||||||
Cumulative effect of a change in accounting principle, net of tax of U.S.$1.4 million | (14,218 | ) | ||||||||||
Net income | $ | 100,794 | $ | 35,477 | $ | 100,794 | ||||||
Other comprehensive (loss) income | (3,490 | ) | 2,995 | (3,490 | ) | |||||||
Comprehensive income | $ | 97,304 | $ | 38,472 | $ | 97,304 | ||||||
NT-2
NUSA TENGGARA PARTNERSHIP V.O.F.
CONSOLIDATED BALANCE SHEETS
(Amounts in thousands of United States dollars)
| At December 31, | |||||||
| 2003 | 2002 | ||||||
| ASSETS | |||||||
Cash and cash equivalents | $ | 82,232 | $ | 113,417 | |||
Accounts receivable from affiliates | 318 | 4,006 | |||||
Metal sales receivables | 54,601 | 55,354 | |||||
Value added taxes receivable | 4,279 | 13,899 | |||||
Receivable—Advance NIL | 17,856 | — | |||||
Receivable—Advance NTMC | 13,888 | — | |||||
Inventories | 82,757 | 90,774 | |||||
Stockpiles | 2,195 | 2,041 | |||||
Deferred income tax assets | 50,792 | 3,355 | |||||
Senior debt reserve account | — | 22,169 | |||||
Other | 16,040 | 8,095 | |||||
Current assets | 324,958 | 313,110 | |||||
Stockpiles | 287,220 | 196,811 | |||||
Property, plant and mine development, net | 1,585,124 | 1,658,912 | |||||
Intangible mineral interests, net | 176,349 | 188,294 | |||||
Senior debt reserve account | 60,939 | — | |||||
Debt issuance costs | 22,874 | 29,472 | |||||
Deferred income tax assets | — | 54,667 | |||||
Other | 1,037 | 1,183 | |||||
Total assets | $ | 2,458,501 | $ | 2,442,449 | |||
| LIABILITIES | |||||||
Current portion of long-term debt | $ | 86,730 | $ | 92,516 | |||
Related party debt and interest | 258,182 | 259,793 | |||||
Accounts payable and accrued expenses | 86,331 | 78,290 | |||||
Accounts payable—affiliates (see Notes 8 and 16) | 115,522 | 3,717 | |||||
Taxes payable | 4,279 | 2,975 | |||||
Deferred stripping costs | — | 18,135 | |||||
Current liabilities | 551,044 | 455,426 | |||||
Long-term debt | 653,082 | 843,255 | |||||
Reclamation and remediation liabilities | 47,492 | 13,330 | |||||
Provision for retirement benefit | 3,321 | 2,270 | |||||
Deferred income taxes | 55,931 | — | |||||
Deferred stripping costs | 69,905 | 48,613 | |||||
Accounts payable—affiliates (see Notes 8 and 16) | — | 99,133 | |||||
Total liabilities | 1,380,775 | 1,462,027 | |||||
Commitments and contingencies (see Notes 2, 15, 16 and 17) | |||||||
| PARTNERS’ EQUITY | |||||||
Capital account—Newmont Indonesia Limited (“NIL”) | 607,816 | 551,119 | |||||
Capital account—Nusa Tenggara Mining Corporation (“NTMC”) | 472,745 | 428,648 | |||||
Accumulated other comprehensive (loss) income | (2,835 | ) | 655 | ||||
Total partners’ equity | 1,077,726 | 980,422 | |||||
Total liabilities and partners’ equity | $ | 2,458,501 | $ | 2,442,449 | |||
| At December 31, 2003 | ||||
| ASSETS | ||||
Cash and cash equivalents | $ | 82,232 | ||
Accounts receivable from affiliates | 318 | |||
Metal sales receivables | 54,601 | |||
Value added taxes receivable | 4,279 | |||
Receivable—Advance NIL | 17,856 | |||
Receivable—Advance NTMC | 13,888 | |||
Inventories | 82,757 | |||
Stockpiles | 2,195 | |||
Deferred income tax assets | 50,792 | |||
Other | 16,040 | |||
Current assets | 324,958 | |||
Stockpiles | 287,220 | |||
Property, plant and mine development, net | 1,585,124 | |||
Intangible mineral interests, net | 176,349 | |||
Senior debt reserve account | 60,939 | |||
Debt issuance costs | 22,874 | |||
Other | 1,037 | |||
Total assets | $ | 2,458,501 | ||
| LIABILITIES | ||||
Current portion of long-term debt | $ | 86,730 | ||
Related party debt and interest | 258,182 | |||
Accounts payable and accrued expenses | 86,331 | |||
Accounts payable—affiliates (see Notes 8 and 16) | 115,522 | |||
Taxes payable | 4,279 | |||
Current liabilities | 551,044 | |||
Long-term debt | 653,082 | |||
Reclamation and remediation liabilities | 47,492 | |||
Provision for retirement benefit | 3,321 | |||
Deferred income taxes | 55,931 | |||
Deferred stripping costs | 69,905 | |||
Total liabilities | 1,380,775 | |||
Commitments and contingencies (see Notes 2, 15, 16 and 17) | ||||
| PARTNERS’ EQUITY | ||||
Capital account—Newmont Indonesia Limited (“NIL”) | 607,816 | |||
Capital account—Nusa Tenggara Mining Corporation (“NTMC”) | 472,745 | |||
Accumulated other comprehensive (loss) income | (2,835 | ) | ||
Total partners’ equity | 1,077,726 | |||
Total liabilities and partners’ equity | $ | 2,458,501 | ||
The accompanying notes are an integral part of these financial statements.
NT-3
NUSA TENGGARA PARTNERSHIP V.O.F.
STATEMENTS OF CONSOLIDATED CHANGES IN PARTNERS’ EQUITY
(Amounts in thousands of United States dollars)
NIL 56.25% | NTMC 43.75% | Accumulated Other Comprehensive (Loss) Income | Total | |||||||||||
Balance at December 31, 2001 | $ | 506,413 | $ | 393,877 | $ | (2,340 | ) | $ | 897,950 | |||||
Cash contributions | 24,750 | 19,250 | — | 44,000 | ||||||||||
Net income | 19,956 | 15,521 | — | 35,477 | ||||||||||
Other comprehensive income | — | — | 2,995 | 2,995 | ||||||||||
Balance at December 31, 2002 | 551,119 | 428,648 | 655 | 980,422 | ||||||||||
Net income | 56,697 | 44,097 | — | 100,794 | ||||||||||
Other comprehensive loss | — | — | (3,490 | ) | (3,490 | ) | ||||||||
Balance at December 31, 2003 | $ | 607,816 | $ | 472,745 | $ | (2,835 | ) | $ | 1,077,726 | |||||
| NIL 56.25% | NTMC 43.75% | Accumulated Other Comprehensive (Loss) Income | Total | |||||||||||
Balance at December 31, 2002 | 551,119 | 428,648 | 655 | 980,422 | ||||||||||
Net income | 56,697 | 44,097 | — | 100,794 | ||||||||||
Other comprehensive loss | — | — | (3,490 | ) | (3,490 | ) | ||||||||
Balance at December 31, 2003 | $ | 607,816 | $ | 472,745 | $ | (2,835 | ) | $ | 1,077,726 | |||||
The accompanying notes are an integral part of these financial statements.
NT-4
NUSA TENGGARA PARTNERSHIP V.O.F.
STATEMENTS OF CONSOLIDATED CASH FLOW
(Amounts in thousands of United States dollars)
| Years Ended December 31, | ||||||||
| 2003 | 2002 | |||||||
Operating activities: | ||||||||
Net income | $ | 100,794 | $ | 35,477 | ||||
Adjustments to reconcile net income (loss) to net cash provided by operating activities: | ||||||||
Depreciation, depletion and amortization | 125,917 | 125,057 | ||||||
Accretion of accumulated reclamation obligations | 6,388 | — | ||||||
Loss on disposal of fixed assets | 174 | 210 | ||||||
Amortization of deferred stripping costs, net | 3,157 | (8,570 | ) | |||||
Amortization of debt issuance costs | 6,598 | 6,793 | ||||||
Write-down of stockpiles and inventories | 2,539 | 904 | ||||||
Cumulative effect of change in accounting principle, net of tax | 14,218 | — | ||||||
Deferred income tax expense | 66,443 | 24,121 | ||||||
(Increase) decrease in operating assets: | ||||||||
Accounts and other receivables | 14,061 | (16,028 | ) | |||||
Stockpiles and inventories | (75,014 | ) | (39,390 | ) | ||||
Other assets | (7,796 | ) | (2,730 | ) | ||||
Increase (decrease) in operating liabilities: | ||||||||
Accounts payable and accrued expenses | 12,717 | (21,135 | ) | |||||
Other liabilities | 744 | 19,223 | ||||||
Net cash provided by operating activities | 270,940 | 123,932 | ||||||
Investing activities: | ||||||||
Additions to property, plant and mine development | (35,652 | ) | (39,080 | ) | ||||
Net cash used in investing activities | (35,652 | ) | (39,080 | ) | ||||
Financing activities: | ||||||||
Equity contributions from Newmont Indonesia Limited | — | 24,750 | ||||||
Equity contributions from Nusa Tenggara Mining Corporation | — | 19,250 | ||||||
Repayments of long-term debt | (195,959 | ) | — | |||||
Senior debt reserve account | (38,770 | ) | (22,619 | ) | ||||
Advance to Newmont Indonesia Limited | (17,856 | ) | — | |||||
Advance to Nusa Tenggara Mining Corporation | (13,888 | ) | — | |||||
Net cash (used in) provided by financing activities | (266,473 | ) | 21,381 | |||||
Net (decrease) increase in cash and cash equivalents | (31,185 | ) | 106,233 | |||||
Cash and cash equivalents at beginning of year | 113,417 | 7,184 | ||||||
Cash and cash equivalents at end of year | $ | 82,232 | $ | 113,417 | ||||
Year Ended December 31, 2003 | ||||
Operating activities: | ||||
Net income | $ | 100,794 | ||
Adjustments to reconcile net income to net cash provided by operating activities: | ||||
Depreciation, depletion and amortization | 125,917 | |||
Accretion of accumulated reclamation obligations | 6,388 | |||
Loss on disposal of fixed assets | 174 | |||
Amortization of deferred stripping costs, net | 3,157 | |||
Amortization of debt issuance costs | 6,598 | |||
Write-down of stockpiles and inventories | 2,539 | |||
Cumulative effect of change in accounting principle, net of tax | 14,218 | |||
Deferred income tax expense | 66,443 | |||
(Increase) decrease in operating assets: | ||||
Accounts and other receivables | 14,061 | |||
Stockpiles and inventories | (75,014 | ) | ||
Other assets | (7,796 | ) | ||
Increase in operating liabilities: | ||||
Accounts payable and accrued expenses | 12,717 | |||
Other liabilities | 744 | |||
Net cash provided by operating activities | 270,940 | |||
Investing activities: | ||||
Additions to property, plant and mine development | (35,652 | ) | ||
Net cash used in investing activities | (35,652 | ) | ||
Financing activities: | ||||
Repayments of long-term debt | (195,959 | ) | ||
Senior debt reserve account | (38,770 | ) | ||
Advance to Newmont Indonesia Limited | (17,856 | ) | ||
Advance to Nusa Tenggara Mining Corporation | (13,888 | ) | ||
Net cash used in financing activities | (266,473 | ) | ||
Net decrease in cash and cash equivalents | (31,185 | ) | ||
Cash and cash equivalents at beginning of year | 113,417 | |||
Cash and cash equivalents at end of year | $ | 82,232 | ||
The accompanying notes are an integral part of these financial statements.
NT-5
NUSA TENGGARA PARTNERSHIP V.O.F.
NOTES TO CONSOLIDATED FINANCIAL STATEMENTS
NOTE 1 GENERAL
Nusa Tenggara Partnership V.O.F. (“NTP” or the “Partnership”) is a general partnership organized under the laws of The Netherlands. Newmont Indonesia Limited (“NIL”), a Delaware, U.S.A. corporation and subsidiary of Newmont Mining Corporation (“Newmont”), also a Delaware, U.S.A. corporation, has a 56.25% economic interest in NTP, and Nusa Tenggara Mining Corporation (“NTMC”), a Japanese corporation jointly owned by Sumitomo Corporation (“Sumitomo”) (74.3%), Sumitomo Metal Mining Co., Ltd. (14.3%), Mitsubishi Materials Corporation (7.1%) and Furukawa Co., Ltd. (4.3%) has a 43.75% economic interest in NTP. Both Newmont and Sumitomo have significant participating rights in the NTP business and unanimous approval is needed for various NTP decisions. NTP maintains its accounting records in U.S. dollars (“USD” or “U.S.$”).
NTP was formed to develop and mine the Batu Hijau copper/gold deposit located in Sumbawa, Nusa Tenggara Barat, Indonesia. Proven and probable reserves totaled 11.9 billion (unaudited) and 11.0 billion (unaudited) pounds of copper and 13.4 million (unaudited) and 12.3 million (unaudited) ounces of gold at December 31, 2003 and 2002, respectively.2003. Operations commenced in the fourth quarter of 1999, with initial sales of concentrate in December 1999. Copper sales totaled 610.4 million and 644.0 million pounds and gold sales totaled 584,672 ounces and 494,214 ounces for 2003 and 2002, respectively.2003. The cost for the initial development of the open pit mine, mill and infrastructure, including employee housing, a port, electrical generation facilities, interest during construction and working capital was approximately U.S.$1.83 billion. Based on proven and probable reserves at December 31, 2003, mining will be completed in approximately 14 years and processing of stockpiles will be completed in approximately 27 years.
NTP holds an 80% interest in P.T. Newmont Nusa Tenggara (“PTNNT”), an Indonesian corporation that holds the Contract of Work (“COW”) issued by the Indonesian government, granting PTNNT sole rights to develop the Batu Hijau mine. The remaining 20% interest in PTNNT is held by P.T. Pukuafu Indah (“PTPI”), an unrelated Indonesian company. PTPI’s interest is a “carried interest” such that at the request of PTPI, NTP funds PTPI’s share of capital contributions to PTNNT. Contributions made on behalf of PTPI are recoverable by NTP from 70% of PTPI’s share of future dividends from PTNNT (see Note 12).
Exploration work is being performed on other parts of the COW that are outside the Batu Hijau mine area.
Under the COW, a portion of PTNNT not already owned by Indonesian nationals must be offered for sale to the Indonesian government or to Indonesian nationals at the higher of replacement cost value, Jakarta stock exchange share value or fair market value as a going concern. Based on the current holding of PTNNT shares by an Indonesian national, the first year in which such an offer of shares would need to be made is 2006. The effect of this provision could potentially reduce NIL and NTMC ownership to 49% by 2010.
Substantially all Partnership transactions relate to its 80% interest in PTNNT. Certain NTP and PTNNT actions and transactions require unanimous approval of NTP partners.
Copper and gold mining requires the use of specialized facilities and technology. PTNNT relies heavily on such facilities to reach and maintain its production levels. Also, the cash flow and profitability of PTNNT’s operations are significantly affected by market prices of copper and gold. Such commodity prices fluctuate widely and are affected by numerous factors beyond PTNNT’s control.
Over the past seven years, Indonesia has experienced significant fluctuations of its currency, the Rupiah. The country also faces political and social challenges. NTP’s cost and debt structure is primarily U.S. dollar-denominated. To the extent that there are fluctuations in the Rupiah, its devaluation is generally economically neutral or beneficial to NTP since local salaries and supply contracts will decrease against the U.S. dollar. Excluding certain tax receivables described in Note 2, PTNNT activities have not been materially affected by the economic, social and political situation in Indonesia, primarily because they are located in a remote location.
NT-6
NUSA TENGGARA PARTNERSHIP V.O.F.
NOTES TO CONSOLIDATED FINANCIAL STATEMENTS—(Continued)
NOTE 2 SUMMARY OF SIGNIFICANT ACCOUNTING POLICIES
Use of Estimates
NTP’s Consolidated Financial Statements have been prepared in accordance with accounting principles generally accepted in the United States of America. The preparation of the NTP’s Consolidated Financial Statements requires NTP to make estimates and assumptions that affect the reported amounts of assets and liabilities and the related disclosure of contingent assets and liabilities at the date of the Consolidated Financial Statements and the reported amounts of revenues and expenses during the reporting period. The most significant areas requiring the use of management estimates and assumptions relate to mineral reserves that are the basis for future cash flow estimates and units-of-production (“UOP”) depreciation, depletion and amortization calculations; environmental, reclamation and closure obligations; estimates of recoverable copper and gold in stockpiles; asset impairments (including impairments of long-lived assets); write-downs of inventory to net realizable value; post-employment, postretirement and other employee benefit liabilities; valuation allowances for deferred tax assets; reserves for contingencies and litigation; and the fair value and accounting treatment of financial instruments. NTP bases its estimates on NTP’s historical experience and on various other assumptions that are believed to be reasonable under the circumstances. Accordingly, actual results may differ significantly from these estimates under different assumptions or conditions.
Principles of Consolidation
The financial statements reflect the consolidated financial position and the results of operations of NTP and PTNNT. To date, PTNNT has recorded cumulative losses. Therefore, NTP has recorded 100% of PTNNT’s income and losses. NTP loaned PTPI the funds required to purchase its original 20% interest in PTNNT. In accordance with the PTPI loan agreement, PTPI has pledged 70% of its 20% share of future PTNNT dividends to repay its loan to NTP, including dividends. Once PTNNT’s cumulative losses are recovered, which is expected to occur in 2004, NTP will recognize its 80% share of PTNNT’s earnings plus 70% of PTPI earnings for an effective 94% share of PTNNT’s earnings until the PTPI loan is repaid. All significant intercompany balances and transactions have been eliminated.
As described in Note 1, PTPI owns a 20% carried interest in PTNNT. PTNNT’s total paid-in capital was U.S.$683.4 million at December 31, 2003 and 2002.2003. PTPI’s share of such capital was funded with loans from NIL and NTMC, through NTP, and totaled U.S.$136.7 million at December 31, 2003 and 2002.2003. These loans are subject to interest at the six-month SIBOR rate plus 2%. PTPI agreed to assign 70% of its rights to dividends from PTNNT to repay such loans, including interest, pursuant to an Acknowledgement of Indebtedness and Assignment of Dividends agreement with NIL. Interest accrued under these loans is fully covered by an allowance until recoverability of such interest is determined.
In January 2003, the FASB issued FASB Interpretation No. 46 (“FIN 46”), “Consolidation of Variable Interest Entities,” which provides guidance on the identification and reporting for entities over which control is achieved through means other than voting rights. FIN 46 defines such entities as variable interest entities (“VIEs”). A FASB Staff Position issued in October 2003 deferred the effective date of FIN 46 to the first interim or annual period ending after December 15, 2003 for entities created before February 1, 2003 if certain criteria are met. Subsequently, during December 2003, the FASB issued FIN 46R which replaces the original interpretation. Application of this revised interpretation is required in financial statements for companies that have interests in VIEs or potential VIEs commonly referred to as special-purpose entities for periods ending after December 15, 2003. Application for all other types of entities iswas required in financial statements for periods ending after March 15, 2004.
As of December 31, 2003, NTP did not have an interest in any special purpose entity.
NT-7
NUSA TENGGARA PARTNERSHIP V.O.F.
NOTES TO CONSOLIDATED FINANCIAL STATEMENTS—(Continued)
NTP is currently evaluatingevaluated the impact FIN 46R will have on its financial statements for any VIE created before December 31, 2003. NTP has identified PTNNT as a VIE because of certain capital structures and contractual relationships. In addition, NTP has identified Newmont as the primary beneficiary of PTNNT. As a result, effective January 1, 2004 on adoption of FIN 46R, NTP will no longer consolidate PTNNT and will account for its interest in PTNNT using the equity method.
Foreign Currency Transactions and Balances
The USD is the functional currency of NTP. Transactions in other currencies are recorded in USD based on exchange rates prevailing at the time of such transactions. Monetary assets and liabilities denominated in other currencies are translated into USD at exchange rates prevailing at the balance sheet dates, and any resulting gains or losses are reflected in current earnings.
Cash and Cash Equivalents
Cash and cash equivalents consist of all cash balances and highly liquid investments with an original maturity of three months or less. Because of the short maturity of these investments, the carrying amounts approximate their fair value. Cash and cash equivalents are primarily invested in money market accounts.
Taxes Receivable
Value added taxes (“VAT”) are paid on the PTNNT’s purchases of goods and services. VAT paid during each month is fully refundable without restriction. VAT payments and refunds are local currency transactions and consequently, are subject to fluctuations in the exchange rate between the local currency and the USD. Provisions are made to adjust the value of the VAT receivable to its estimated recoverable value as of the balance sheet date.
Stockpiles and inventories
In general, costs that are incurred in or benefit the productive process are inventoried. Stockpiles and inventories are carried at the lower of average cost or net realizable value. The current portion of stockpiles and inventories are determined based on the expected amounts to be processed within the next 12 months. Stockpiles and inventories not expected to be processed within the next twelve months are classified as long-term. The major classifications are as follows:
Stockpiles and Ore at Crusher
Stockpiles represent coarse ore that has been extracted from the mine and is available for further processing. Stockpiles are measured by estimating the number of tons (via truck counts and/or in-pit surveys of the ore before stockpiling) added and removed from the stockpile, the number of contained pounds of copper equivalent (based on assay data) and the recovery percentage (based on estimated mill recovery). Stockpile tonnages are verified by periodic surveys. Stockpiles are valued based on mining costs incurred up to the point of stockpiling the ore, including applicable depreciation and amortization relating to mining operations. Costs are added to a stockpile based on the current mining cost per ton including applicable depreciation and removed at the average cost per recoverable pound of copper equivalent in the stockpile.
Concentrate Inventory
Concentrate inventories represent saleable copper concentrate available for shipment. PTNNT values concentrate inventory at the average cost, including an allocable portion of mill support costs and mill depreciation. Costs are added and removed to the concentrate inventory based on tons of concentrate.
NT-8
NUSA TENGGARA PARTNERSHIP V.O.F.
NOTES TO CONSOLIDATED FINANCIAL STATEMENTS—(Continued)
Materials and Supplies
Materials and supplies are valued at the lower of average cost or net realizable value. Cost includes applicable taxes and freight.
Property, Plant and Mine Development
Property, plant and mine development are stated at cost less accumulated depreciation, depletion and amortization. Expenditures for new facilities or expenditures that extend the useful lives of existing facilities are capitalized and depreciated over the estimated productive lives of the facilities. Depreciation for mining and milling life-of-mine assets is determined using the UOP method based on proven and probable reserves. Other assets are depreciated on a straight-line basis over the estimated productive lives, ranging from 3 to 20 years, but do not exceed mine life based on proven and probable reserves.
Mineral exploration costs are expensed as incurred. When it has been determined that a mineral property can be economically developed as a result of establishing proven and probable reserves, costs incurred prospectively to develop the property are capitalized as incurred and are amortized using the UOP depreciation method based on the estimated recoverable pounds of copper equivalent mined from proven and probable reserves. These costs include costs to further delineate the ore body and remove overburden to initially expose the ore body during the development stage of the project. To the extent that these costs benefit the entire ore body, they are depreciated on a UOP basis over the estimated life of the ore body based on proven and probable reserves. Costs incurred to access specific ore blocks or areas that only provide benefit of access to that area are depreciated over the proven and probable reserves of the specific ore area.
Interest expense allocated to the cost of developing mining properties and to constructing new facilities is capitalized until assets are ready for their intended use.
Gains or losses from normal sales or retirements of assets are included in other income.
Intangible Mineral Interests
The excess of the agreed fair value of the assets contributed to NTP when it was initially funded over the historical cost basis was recorded as mineral interests (previously classified as “deferred mineral rights”). Such costs are amortized by the UOP method based on proven and probable reserves.
In June 2001, the Financial Accounting Standards Board (“FASB”) issued Statement of Financial Accounting Standards (“SFAS”) No. 142, “Goodwill and Other Intangible Assets”. Upon adoption as required on January 1, 2002, NTP reclassified $202.8 million, net of mineral interests from Property, plant and mine development to a separate line item,Intangible mineral interests, net on theConsolidated Balance Sheets.
The Emerging Issues Task Force (“EITF”) formed a committee to evaluate certain mining industry accounting issues, including issues arising from the application of SFAS No. 141, “Business Combinations” and SFAS No. 142 to business combinations within the mining industry, accounting for goodwill and other intangibles and the capitalization of costs after the commencement of production, including deferred stripping. The issues to be discussed also include whether mineral interests conveyed by leases represent tangible or intangible assets and the amortization of such assets. NTP believes that its accounting for its mineral interests conveyed by leases is in accordance with generally accepted accounting principles. However, NTP cannot predict whether the deliberations of the EITF will ultimately modify or otherwise result in new accounting standards or interpretations thereof that differ from NTP’s current practices.
NT-9
NUSA TENGGARA PARTNERSHIP V.O.F.
NOTES TO CONSOLIDATED FINANCIAL STATEMENTS—(Continued)
Asset Impairment
NTP reviews and evaluates its long-lived assets for impairment when events or changes in circumstances indicate that the related carrying amounts may not be recoverable. An impairment is considered to exist if the total estimated future cash flows on an undiscounted basis are less than the carrying amount of the asset. An impairment loss is measured and recorded based on discounted estimated future cash flows. Future cash flows are estimated based on quantities of recoverable minerals, expected copper and gold commodity prices (considering current and historical prices, price trends and related factors), production levels, cash costs of production and capital, all based on detailed engineering life-of-mine plans. The term “recoverable minerals” refers to the estimated amount of copper and gold that will be obtained from proven and probable reserves after taking into account losses during ore processing and treatment. In estimating future cash flows, assets are grouped at the lowest level for which there are identifiable cash flows that are largely independent of cash flows from other asset groups. All assets at an operating segment are considered together for purposes of estimating future cash flows. Assumptions underlying future cash flow estimates are subject to risks and uncertainties.
Debt Issuance Costs
Costs incurred to arrange and refinance the third party debt for development of PTNNT’s Batu Hijau mine, including financial advisory fees, legal fees, loan origination and commitment fees, and accounting and tax advisory services, among others, were capitalized as deferred debt issuance costs. Such costs are amortized over the term of the loan which started at the beginning of commercial production using the effective interest method. Amortization of debt issuance costs is included as a component of interest expense.
Revenue Recognition
The Batu Hijau operation produces a metal concentrate, which contains payable copper and gold and minor values of payable silver. PTNNT has entered into long-term contracts for the sale of these metal concentrates with highly reputable refiners in Japan, Korea (“Non-European Refiners”) and Europe (“European Refiners”). In accordance with the contracts, title to the concentrates and the risk of loss are passed to the buyer when the concentrates are moved over the vessel’s rail at the port (loading port for Non-European Refiners and unloading port for European Refiners). The contract terms provide that 90% of a provisional sales price, which is calculated in accordance with terms specified in the individual contracts based on an initial assay and weight certificate, is collected within three business days after the concentrates arrive at the smelter (“final delivery”). Factors entering into the calculation of the provisional sales price are (i) metals prices, pursuant to the terms of related contracts, calculated using quoted London Metals Exchange (“LME”) prices for the second calendar week prior to shipment; and (ii) treatment and refining charges. The balance of the sales price is received at final settlement and is based on final assays and weights, and final metal prices during the respective metal quotational periods. For the majority of shipments, the quotational period for copper is the average LME price in the third month following the month of final delivery and the quotational period for gold and silver is the average LME price in the month of shipment. Final delivery to Non-European and European refiners takes approximately 14 days and 30 days, respectively. The majority of the Batu Hijau concentrates are shipped to Non-European refiners. Accordingly, the time between initial recording of revenue and final settlement averages approximately three and one-half months but could be as long as four months.
In accordance with U.S. Securities and Exchange Commission Staff Accounting Bulletin No. 101 (“SAB 101”), certain conditions must be met prior to recognizing revenue. These conditions are: persuasive evidence of a contract exists; delivery has occurred; the price is fixed or determinable; and collectability of the sales price is reasonably assured. In accordance with SAB 101, PTNNT recognizes metal sales revenues following: (i) the passage of title after the loading or unloading of the concentrates; (ii) issuance of an initial assay and weight
NT-10
NUSA TENGGARA PARTNERSHIP V.O.F.
NOTES TO CONSOLIDATED FINANCIAL STATEMENTS—(Continued)
certificate; and (iii) issuance of a provisional invoice. At this point in time, the sales price is determinable since it is based on defined contract terms, initial assays are available, and it can be reasonably estimated by reference to published price indices on actively and freely traded commodity exchanges. Additionally, there is no significant uncertainty as to collectability given that all of the refiners are of high-credit quality and that 90% of the provisional price is paid within three business days of final delivery at the refiner.
Concentrate sales are initially recorded based on 100% of the provisional sales prices. Until final settlement occurs, adjustments to the provisional sales prices are made to take into account metal price changes, based upon the month-end spot price and metal quantities upon receipt of the final assay and weight certificates, if different from the initial certificate. Effective January 1, 2002, PTNNT changed its methodology to mark-to-market its provisional sales based on the forward price for the estimated month of settlement. The principal risks associated with recognition of sales on a provisional basis include metal price fluctuations between the date recorded and the date of final settlement. In addition, in the event of a significant decline in metal prices between the provisional pricing date and the final settlement-pricing period, it is reasonably possible that PTNNT would be required to return a portion of the sales proceeds received based on the provisional invoice. For the yearsyear ended December 31, 2003 and 2002, PTNNT had recorded revenues of U.S.$95.7 million, and U.S.$65.7 million, respectively, which were subject to final pricing adjustments. The average price adjustment for copper was 5.07% and 1.98% for the yearsyear ended December 31, 2003 and 2002, respectively.2003. The average price adjustment for gold was 1.13% and 0.83% for the yearsyear ended December 31, 2003 and 2002, respectively.
2003.
PTNNT’s sales based on a provisional sales price contain an embedded derivative which is required to be separated from the host contract for accounting purposes. The host contract is the receivable from the sale of the concentrates at the forward LME price at the time of sale. The embedded derivative, which does not qualify for hedge accounting, is marked to market through earnings each period prior to final settlement. At December 31, 2003, and 2002, PTNNT had consolidated embedded copper derivatives on 91.5 million and 93.5 million pounds recorded at an average price of U.S.$1.04 and U.S.$0.70 per pound, respectively.pound. A one-cent movement in the average price used for these derivatives would have an approximate U.S.$0.6 million impact on PTNNT’s net income for each of the yearsyear ended December 31, 2003 and 2002.
2003.
Sales of gold and silver by-products for the yearsyear ended December 31, 2003 and 2002 were U.S.$217.3 million and U.S.$159.2 million, respectively.million. Revenue from the sale of gold and silver by-products is credited to production costs in the determination of net income for each period presented. These by-product commodities represented 51% and 44% of revenues and reduced production costs by 76% and 58% for the yearsyear ended December 31, 2003 and 2002, respectively.2003. Gold and silver revenues, which are recorded as by-product credits, are significant to the economics of the Batu Hijau operation.
Deferred Stripping
In general, mining costs are charged toProduction costsas incurred. However, PTNNT defers and amortizes certain mining costs on a UOP basis over the life of the mine. These mining costs, which are commonly referred to as “deferred stripping” costs, are incurred in mining activities that are normally associated with the removal of waste rock. The deferred stripping accounting method is generally accepted in the mining industry where mining operations have diverse grades and waste-to-ore ratios; however, industry practice does vary. Deferred stripping matches the costs of production with the sale of such production by assigning each recoverable pound of copper equivalent with an equivalent amount of waste removal cost. If PTNNT were to expense stripping costs as incurred, there may be greater volatility in NTP’s period-to-period results of operations.
NT-11
NUSA TENGGARA PARTNERSHIP V.O.F.
NOTES TO CONSOLIDATED FINANCIAL STATEMENTS—(Continued)
Deferred stripping costs are charged toProduction costsas copper concentrate is produced and sold using the UOP method based on estimated proven and probable reserves. NTP uses a stripping ratio based on total tons to be moved to equivalent pound of copper expected to be recovered over the life of the mine. Deferred stripping results in the recognition of the costs of waste removal activities over the life of the mine as copper concentrate is
NT-11
NUSA TENGGARA PARTNERSHIP V.O.F.
NOTES TO CONSOLIDATED FINANCIAL STATEMENTS—(Continued)
produced. The application of the accounting for deferred stripping costs and the resulting differences in timing between costs deferred and amortization generally results in an asset on theConsolidated Balance Sheets (Deferred stripping costs), although a liability will arise if the actual stripping ratio incurred to date is less than the expected waste to ore ratio over the life of the mine. PTNNT’s deferred stripping balance is currently in a liability position.
The estimated remaining life as of December 31, 2003, of the Batu Hijau pit is 14 years, which represents the time period over which the deferred stripping cost balance will be amortized. The amortization of deferred stripping costs is reflected in the income statement over the remaining life of the operations so that no unamortized balance remains at mine closure. PTNNT’s cash flows are reviewed regularly, and at least annually, for the purpose of assessing whether any write-downs to the deferred stripping cost balances are required.
NTP has classified these costs asDeferred stripping costs on theConsolidated Balance Sheets. The total deferred stripping liability as of December 31, 2003 and 2002 was U.S.$69.9 million and U.S.$66.7 million, respectively.million. Additions (deductions) to deferred stripping costs are included as a component ofMovement of deferred stripping costs, net inOperating activities in theStatements of Consolidated Cash Flow. Net additions (deductions) to the deferred stripping costs liability for the yearsyear ended December 31, 2003 and 2002 were U.S.$3.2 million and U.S.$(8.6) million, respectively.million.
Reclamation Costs (Asset Retirement Obligations)
In August 2001, the FASB issued Statement of Financial Accounting Standards (“SFAS”) No. 143 “Accounting for Asset Retirement Obligations,” which established a uniform methodology for accounting for estimated reclamation and abandonment costs. The statement was adopted January 1, 2003, when NTP recorded the estimated present value of reclamation liabilities (“asset retirement obligation “ or “ARO”) and increased the carrying amount of the related asset (“asset retirement cost” or “ARC”), which resulted in a cumulative effect of a change in accounting principle of U.S.$14.2 million. See Note 11. The ARC will be allocated to expense over the life of the related assets and will be adjusted for changes resulting from the passage of time and revisions to either the timing or amount of the original present value estimate.
Prior to adoption of SFAS No. 143, estimated future reclamation costs were based principally on legal and regulatory requirements. Such costs were accrued and charged over the expected operating life of the Batu Hijau operations using the UOP method based on proven and probable reserves.
Income Taxes
PTNNT accounts for income taxes using the liability method, recognizing certain temporary differences between the financial reporting basis of its assets and liabilities and the related income tax basis of such assets and liabilities. This method generates a net deferred income tax asset or net deferred income tax liability as of the end of the year, as measured by the statutory tax rates in effect as enacted. PTNNT derives its deferred income tax benefit or charge by recording the change in the net deferred income tax asset or net deferred income tax liability balance for the year.
PTNNT’s deferred income tax assets include certain future tax benefits. PTNNT records a valuation allowance against any portion of those deferred income tax assets that it believes, based on the weight of available evidence, it is more likely than not that some portion or all of the deferred income tax asset will not be realized.
NT-12
NUSA TENGGARA PARTNERSHIP V.O.F.
NOTES TO CONSOLIDATED FINANCIAL STATEMENTS—(Continued)
NTP is not subject to income taxes. The taxable income or loss of the Partnership, which may vary substantially from income or loss reported for financial reporting purposes, is passed through to NTP partners. NTP is subject to withholding taxes on certain payments made from Indonesia. Such withholding taxes are included inIncome tax expense.
NT-12
NUSA TENGGARA PARTNERSHIP V.O.F.
NOTES TO CONSOLIDATED FINANCIAL STATEMENTS—(Continued)
Derivative Instruments
PTNNT does not acquire, hold or issue financial instruments for trading or speculative purposes. Financial instruments are used to manage certain market risks resulting from fluctuations in commodity prices (mainly copper and diesel fuel) and foreign currency exchange rates. Copper is an internationally traded commodity, and its prices are effectively determined by the LME. On a limited basis, PTNNT hedges sales commitments by entering into copper swap contracts. Swap contracts are settled at the LME average monthly price in accordance with the terms of the contracts. PTNNT has also put in place derivative instruments with respect to a portion of its planned future diesel purchases and the Indonesia Rupiah.
Comprehensive (Loss) Income
In addition to net income, comprehensive (loss) income includes all changes in equity during a period, except those resulting from investments by and distributions to owners. The U.S.$3.5 millionOther comprehensive loss in 2003 and the U.S.$3.0 millionOther comprehensive income in 2002 represents the change in the fair value of derivative instruments that qualify as cash flow hedges.
NOTE 3 INITIAL FUNDING OF THE PARTNERSHIP
The Partnership agreement, executed on July 2, 1996, provided for initial contributions from its partners. The date of such contributions (referred to as the “Initial Funding Date”) was June 10, 1997. NIL contributed its 80% interest in PTNNT in exchange for a 56.25% interest in NTP. NIL also contributed rights to its shareholder loan receivable of U.S.$77.2 million and a PTPI loan receivable of U.S.$2.2 million. The agreed upon value of NIL’s initial contributions was U.S.$306.2 million. NTMC contributed approximately U.S.$239.3 million of subsequent cash contributions, as defined in the Partnership agreement, in exchange for a 43.75% interest in NTP. NTMC and NIL have contributed proportionately 43.75% and 56.25%, respectively, after NTMC’s cash contributions of U.S.$239.3 million.
PTNNT’s losses up to the Initial Funding Date of U.S.$41.4 million were allocated to the capital accounts of NIL and NTMC in proportion to their respective Partnership interests.
NOTE 4 STOCKPILES AND INVENTORIES
| At December 31, | |||||||||
| 2003 | 2002 | At December 31, 2003 | |||||||
| (in thousands of U.S.$) | (in thousands of U.S.$) | ||||||||
Current: | |||||||||
Stockpiles and ore at crusher | $ | 1,967 | $ | 2,041 | $ | 1,967 | |||
Concentrate inventory | 228 | — | 228 | ||||||
Materials and supplies | 82,757 | 90,774 | 82,757 | ||||||
Total current stockpiles and inventories | $ | 84,952 | $ | 92,815 | $ | 84,952 | |||
Non-Current: | |||||||||
Stockpiles | $ | 287,220 | $ | 196,811 | $ | 287,220 | |||
NT-13
NUSA TENGGARA PARTNERSHIP V.O.F.
NOTES TO CONSOLIDATED FINANCIAL STATEMENTS—(Continued)
Non-current stockpiles increased from U.S.$196.8 million at December 31, 2002 to U.S.$287.2 million at December 31, 2003. The increase in non-current stockpiles relates to ore tons that were mined in 2003 and were placed in stockpiles for future processing. At Batu Hijau, the mining rate in 2003 exceeded the processing rate during the period. The resulting ore stockpiles are expected to be processed in future years in accordance with the life-of-mine plan.
NOTE 5 PROPERTY, PLANT AND MINE DEVELOPMENT
| At December 31, | ||||||||
| 2003 | 2002 | |||||||
| (in thousands of U.S.$) | ||||||||
Machinery and equipment | $ | 1,422,551 | $ | 1,362,036 | ||||
Buildings and infrastructure | 445,463 | 443,533 | ||||||
Mine development | 157,641 | 157,641 | ||||||
Construction-in-progress | 12,180 | 40,127 | ||||||
Asset retirement cost | 24,980 | — | ||||||
| 2,062,815 | 2,003,337 | |||||||
Accumulated depreciation, depletion and amortization | (477,691 | ) | (344,425 | ) | ||||
Property, plant and mine development—net | $ | 1,585,124 | $ | 1,658,912 | ||||
| At December 31, 2003 | ||||
| (in thousands of U.S.$) | ||||
Machinery and equipment | $ | 1,422,551 | ||
Buildings and infrastructure | 445,463 | |||
Mine development | 157,641 | |||
Construction-in-progress | 12,180 | |||
Asset retirement cost | 24,980 | |||
| 2,062,815 | ||||
Accumulated depreciation, depletion and amortization | (477,691 | ) | ||
Property, plant and mine development—net | $ | 1,585,124 | ||
NOTE 6 INTANGIBLE MINERAL INTERESTS
| At December 31, | ||||||||
| 2003 | 2002 | |||||||
| (in thousands of U.S.$) | ||||||||
Intangible mineral interests | $ | 219,508 | $ | 219,509 | ||||
Accumulated amortization | (43,159 | ) | (31,215 | ) | ||||
Intangible mineral interests—net | $ | 176,349 | $ | 188,294 | ||||
| At December 31, 2003 | ||||
| (in thousands of U.S.$) | ||||
Intangible mineral interests | $ | 219,508 | ||
Accumulated amortization | (43,159 | ) | ||
Intangible mineral interests—net | $ | 176,349 | ||
These intangible mineral interests are amortized over proven and probable reserves, have no residual value and a weighted average life of 27 years. Total amortization expense for the yearsyear ended December 31, 2003 and 2002 was U.S.$11.9 million and U.S.$14.5 million, respectively.million. The estimated aggregate amortization expenses through 2008 are as follows (based on the current mine plan):
Year ended December 31, | Amount | ||
| (in millions) | |||
2004 | $ | 14.0 | |
2005 | 11.3 | ||
2006 | 9.6 | ||
2007 | 11.9 | ||
2008 | 9.2 | ||
NT-14
NUSA TENGGARA PARTNERSHIP V.O.F.
NOTES TO CONSOLIDATED FINANCIAL STATEMENTS—(Continued)
Year ended December 31, | Amount | ||
| (in millions) | |||
2004 | $ | 14.0 | |
2005 | 11.3 | ||
2006 | 9.6 | ||
2007 | 11.9 | ||
2008 | 9.2 | ||
NOTE 7 DEFERRED STRIPPING
Movements in the deferred stripping costs liability balance were as follows:
| Years Ended December 31, | ||||||||||||
| 2003 | 2002 | Year Ended December 31, 2003 | ||||||||||
| (in thousands of U.S.$) | (in thousands of U.S.$) | |||||||||||
Opening balance | $ | 66,748 | $ | 75,318 | $ | 66,748 | ||||||
Amortization | (9,857 | ) | (12,096 | ) | (9,857 | ) | ||||||
Additions | 13,014 | 3,526 | 13,014 | |||||||||
Closing balance | $ | 69,905 | $ | 66,748 | $ | 69,905 | ||||||
NT-14
NUSA TENGGARA PARTNERSHIP V.O.F.
NOTES TO CONSOLIDATED FINANCIAL STATEMENTS—(Continued)
NOTE 8 ACCOUNTS PAYABLE—AFFILIATES
Details of accounts payable—affiliates were as follows:
| At December 31, | ||||||
| 2003 | 2002 | |||||
| (in thousands of U.S.$) | ||||||
Long term: | ||||||
Technology and Know-How Agreement Royalties—NTL | $ | — | $ | 55,762 | ||
Technology and Know-How Agreement Royalties—Sumitomo | — | 43,371 | ||||
| — | 99,133 | |||||
Short term: | ||||||
Technology and Know-How Agreement Royalties—NTL | 64,436 | — | ||||
Technology and Know-How Agreement Royalties—Sumitomo | 50,117 | — | ||||
Consulting Services Agreement—NISL | 329 | 2,694 | ||||
Payroll Agency Agreements—NIIL and NGELP | 640 | 722 | ||||
Consulting Services Agreement—NPN | — | 301 | ||||
| 115,522 | 3,717 | |||||
Total | $ | 115,522 | $ | 102,850 | ||
| At December 31, 2003 | |||
| (in thousands U.S.$) | |||
Long term: | |||
Technology and Know-How Agreement Royalties—NTL | $ | — | |
Technology and Know-How Agreement Royalties—Sumitomo | — | ||
| — | |||
Short term: | |||
Technology and Know-How Agreement Royalties—NTL | 64,436 | ||
Technology and Know-How Agreement Royalties—Sumitomo | 50,117 | ||
Consulting Services Agreement—NISL | 329 | ||
Payroll Agency Agreements—NIIL and NGELP | 640 | ||
Consulting Services Agreement—NPN | — | ||
| 115,522 | |||
Total | $ | 115,522 | |
Following repayment of principal amounts previously deferred under the Senior Debt (see Note 10) during 2003, the accounts payable-affiliates amounts were reclassified from long-term to short-term.
NOTE 9 INCOME TAXES
NTP’s Indonesian income tax expense consisted of:
| Years Ended December 31, | ||||||||
| 2003 | 2002 | |||||||
| (in thousands of U.S.$) | ||||||||
Current | $ | (636 | ) | $ | (821 | ) | ||
Deferred | (66,443 | ) | (24,121 | ) | ||||
Total expense | $ | (67,079 | ) | $ | (24,942 | ) | ||
NT-15
NUSA TENGGARA PARTNERSHIP V.O.F.
NOTES TO CONSOLIDATED FINANCIAL STATEMENTS—(Continued)
| Year Ended December 31, 2003 | ||||
| (in thousands of U.S.$) | ||||
Current | $ | (636 | ) | |
Deferred | (66,443 | ) | ||
Total expense | $ | (67,079 | ) | |
NTP’s income tax expense differed from the amounts computed by applying the COW corporate income tax statutory rate for PTNNT for the following reasons:
| Years Ended December 31, | ||||||||||||
| 2003 | 2002 | Year Ended December 31, 2003 | ||||||||||
| (in thousands of U.S.$) | (in thousands of U.S.$) | |||||||||||
Indonesian corporate income tax benefit at COW rate | $ | (63,732 | ) | $ | (21,147 | ) | $ | (63,732 | ) | |||
Interest expense to partners | 2,788 | 4,385 | 2,788 | |||||||||
Valuation allowance on deferred tax assets | 170 | (906 | ) | 170 | ||||||||
Amortization of capitalized interest & mineral interests | (2,761 | ) | (3,701 | ) | (2,761 | ) | ||||||
Other | (2,908 | ) | (2,752 | ) | (2,908 | ) | ||||||
Income tax expense | (66,443 | ) | (24,121 | ) | (66,443 | ) | ||||||
Income withholding tax | (636 | ) | (821 | ) | (636 | ) | ||||||
Total expense | $ | (67,079 | ) | $ | (24,942 | ) | $ | (67,079 | ) | |||
NT-15
NUSA TENGGARA PARTNERSHIP V.O.F.
NOTES TO CONSOLIDATED FINANCIAL STATEMENTS—(Continued)
Other comprehensive income (loss) for the yearsyear ended December 31, 2003 and 2002 is net of U.S.$(1.9)1.9 million benefit and U.S.$1.6 million expense, respectively, of deferred income taxes which is not reflected above.
Components of NTP’s net deferred income tax assets (liabilities) are as follows:
| At December 31, | ||||||||
| 2003 | 2002 | |||||||
| (in thousands of U.S.$) | ||||||||
Deferred tax assets: | ||||||||
Net operating loss carry-forwards | $ | 249,562 | $ | 289,512 | ||||
Deferred stripping costs | 24,467 | 23,362 | ||||||
Reclamation | 13,598 | 4,526 | ||||||
Provision for retirement benefit | 1,162 | 795 | ||||||
Inventories | 19,080 | 10,485 | ||||||
Other | 1,526 | — | ||||||
Gross deferred tax assets: | 309,395 | 328,680 | ||||||
Valuation allowance for deferred tax assets | (3,164 | ) | (3,334 | ) | ||||
Net deferred tax assets | 306,231 | 325,346 | ||||||
Deferred tax liabilities: | ||||||||
Depreciation | (311,370 | ) | (266,971 | ) | ||||
Other | — | (353 | ) | |||||
Deferred tax liabilities | (311,370 | ) | (267,324 | ) | ||||
Net deferred tax (liabilities) assets | $ | (5,139 | ) | $ | 58,022 | |||
NT-16
NUSA TENGGARA PARTNERSHIP V.O.F.
NOTES TO CONSOLIDATED FINANCIAL STATEMENTS—(Continued)
| At December 31, 2003 | ||||
| (in thousands of U.S.$) | ||||
Deferred tax assets: | ||||
Net operating loss carry-forwards | $ | 249,562 | ||
Deferred stripping costs | 24,467 | |||
Reclamation | 13,598 | |||
Provision for retirement benefit | 1,162 | |||
Inventories | 19,080 | |||
Other | 1,526 | |||
Gross deferred tax assets: | 309,395 | |||
Valuation allowance for deferred tax assets | (3,164 | ) | ||
Net deferred tax assets | 306,231 | |||
Deferred tax liabilities: | ||||
Depreciation | (311,370 | ) | ||
Deferred tax liabilities | (311,370 | ) | ||
Net deferred tax (liabilities) assets | $ | (5,139 | ) | |
Primarily based on estimates of future sources of taxable income, NTP believes that it, more likely than not, will utilize U.S.$306.2 million of the U.S.$309.4 million of deferred income tax assets at December 31, 2003.
| At December 31, | |||||||
| 2003 | 2002 | ||||||
| (in thousands of U.S.$) | |||||||
Net deferred tax assets (liabilities): | |||||||
Current | $ | 50,792 | $ | 3,355 | |||
Non-current | (55,931 | ) | 54,667 | ||||
Net deferred tax (liabilities) assets | $ | (5,139 | ) | $ | 58,022 | ||
| At December 31, 2003 | ||||
| (in thousands of U.S.$) | ||||
Net deferred tax assets (liabilities): | ||||
Current | $ | 50,792 | ||
Non-current | (55,931 | ) | ||
Net deferred tax (liabilities) assets | $ | (5,139 | ) | |
The net operating fiscal loss (income) carry-forward amount and the expiration year are as follows:
Tax year ended December 31, | Year of expiration | Amount | Year of expiration | Amount | ||||||||
| (in millions of U.S.$) | (in millions of U.S.$) | |||||||||||
2000 | 2008 | $ | 451.1 | 2008 | $ | 451.1 | ||||||
2001 | 2009 | 274.5 | 2009 | 274.5 | ||||||||
2002 | 2010 | 108.6 | 2010 | 108.6 | ||||||||
2003 | N/A | (121.2 | ) | N/A | (121.2 | ) | ||||||
Net operating fiscal loss carry-forward | $ | 713.0 | $ | 713.0 | ||||||||
NT-16
NUSA TENGGARA PARTNERSHIP V.O.F.
NOTES TO CONSOLIDATED FINANCIAL STATEMENTS—(Continued)
NOTE 10 DEBT
Senior Debt
On July 30, 1997, PTNNT entered into a U.S.$1.0 billion project financing facility for the Batu Hijau project (“Senior Debt”) which falls under the Common Security Agreement (“CSA”) between the senior lenders and PTNNT. U.S.$739.8 million and U.S.$913.3 million was outstanding as of December 31, 2003 and 2002, respectively.2003. The Senior Debt is comprised of commitments from three export-credit agencies. The completion tests associated with this debt were satisfied during the fourth quarter of 2000 making the Senior Debt non-recourse to Newmont and Sumitomo. The assets of PTNNT are pledged for the debt. The fair market value cannot be practicably determined due to the lack of available market information for this type of debt.
Repayments of borrowings under the Senior Debt are in semi-annual installments from May 2001 through November 2013. The facility as amended in May 2002 provided PTNNT with the ability to defer up to U.S.$173.5 million in principal payments scheduled for 2002 and 2003. Installments due in 2002 amounting to U.S.$86.8 million were deferred at December 31, 2002. Certain restrictions on paying Restricted Payments and Technology and Know-How fees applied while deferred amounts were outstanding. As a result of improved commodity prices and lower costs, the deferred principal was completely repaid and brought up to date in 2003. The amounts repaid were U.S.$130.2 million and U.S.$43.4 million in May 2003 and November 2003, respectively.
The interest rate is based on blended fixed and floating rates, and at current market rates on December 31, 2003, the weighted average interest rate would approximate the London InterBank Offering Rate (“LIBOR”) plus 3.47%. The weighted average interest rates were 4.7% and 5.0% during 2003 and 2002, respectively, and the interest rates were 4.7% and 4.7% at December 31, 2003 and 2002, respectively.
NT-17
NUSA TENGGARA PARTNERSHIP V.O.F.
NOTES TO CONSOLIDATED FINANCIAL STATEMENTS—(Continued)
The Chase Manhattan Bank (“Chase”) portion of the Senior Debt was refinanced in May 2001. U.S.$403.75 million was borrowed from Export-Import Bank of the United States (“US Exim”) and the Chase tranche of the Senior Debt was repaid in full.
Scheduled minimum annual long-term third party debt repayments are U.S.$86.7million, through 2008 each year. U.S.$306.1 million is due thereafter.
Debt Covenants
Senior Debt covenants, conditions, warranties and representations include among others:
Limitation on Indebtedness—PTNNT shall not incur any indebtedness, other than the U.S.$1 billion Senior Debt, except for “Permitted Indebtedness,” which includes the unsecured debt from a commercial bank loan facility (see below), subordinated debt from NTP, sponsor loans and second sponsor loans discussed below, unsecured working capital debt with maturity not in excess of one year and not exceeding U.S.$35.0 million, and other indebtedness with aggregate principal not to exceed U.S.$5.0 million at any one time.
Restricted Payments—Restricted Payments include dividends or return of capital and payment of principal and interest on subordinated loans to NTP, its partners or their affiliates. Restricted Payments can be made provided certain conditions, financial covenants and financial ratios are met, which are as follows: Senior Debt reserve fully funded for next payment; no event of default; funding for 30 days operating costs in collateral accounts; and no event of political force majeure.
Restricted payments in the amount of U.S.$60.5 million were made in fourth quarter 2003 to repay the Commercial Bank Loan (see Commercial Bank Loan below) of U.S.$22.5 million, U.S.$36.6 million of Subordinated loan interest and U.S.$1.4 million, of exploration expense.
NT-17
NUSA TENGGARA PARTNERSHIP V.O.F.
NOTES TO CONSOLIDATED FINANCIAL STATEMENTS—(Continued)
Commercial Bank Loan
On May 14, 2001, PTNNT borrowed U.S.$22.5 million from a commercial bank to fund a credit financing fee for the Senior Debt transaction with US Exim as described above. This borrowing is unsecured and was due in May 2005. The interest rate was based on the semi-annual LIBOR rate, and the weighted average interest rate was approximately LIBOR plus 2%. The weighted average interest rates were 2.9% and 4.0% during 2003 and 2002, respectively and at December 31, 2002, the interest rate was 3.4%.2.9% during 2003. The loan was repaid in November 2003.
Loans and Accrued Interest To Partners
In 1999, PTNNT entered into separate shareholder subordinated loan agreements with NIL and NTMC (“Sponsor Loans”) under which U.S.$195.6 million of principal was outstanding at December 31, 2003 and 2002.2003. U.S.$9.5 million and U.S.$8.9 million of accrued interest related to the Sponsor Loans was outstanding at December 31, 2003 and 2002, respectively.2003. U.S.$20.8 million of the accrued interest was converted to Partners’ equity during 2001. Borrowings under Sponsor Loans are guaranteed by NTP and are payable on demand, subject to Senior Debt subordination terms. The interest rate is based on the annual Singapore InterBank Offering Rate (“SIBOR”) and the interest rate on any unpaid interest is based on the annual SIBOR rate plus 1%. The weighted average interest ratesrate during 2003 and 2002 werewas 1.4% and 2.1%, respectively, and at December 31, 2003 and 2002 werewas 1.3% and 1.5%, respectively.. Payments of Sponsor Loan principal and interest are Restricted Payments under provisions of the Senior Debt.
NT-18
NUSA TENGGARA PARTNERSHIP V.O.F.
NOTES TO CONSOLIDATED FINANCIAL STATEMENTS—(Continued)
On January 5, 2000, PTNNT entered into separate shareholder subordinated loan agreements (“Second Sponsor Loans”) with NIL and NTMC under which U.S.$53 million of principal was outstanding at December 31, 2003 and 2002.2003. U.S.$0.1 million and U.S.$2.3 million interest related to the Second Sponsor Loans was outstanding at December 31, 2003 and 2002, respectively.2003. U.S.$4.5 million of the accrued interest was converted to Partners’ equity during 2001. The terms of the Second Sponsor Loans are similar to the Sponsor Loans described above where (i) borrowings are guaranteed by NTP and are payable on demand, subject to Senior Debt subordination terms; (ii) interest rates are based on the annual SIBOR rate for principal and the annual SIBOR rate plus 1% for unpaid accrued interest; and (iii) loan repayments and interest are Restricted Payments under provisions of the Senior Debt. The weighted-average interest ratesrate during 2003 and 2002 werewas 1.4% and 2.1%, and at December 31, 2003 and 2002, the interest rates werewas 1.3% and 1.5%, respectively.
.
Effective January 1, 2004, PTNNT entered into Amendments 1 and 2 (“Amendments”) to the shareholder subordinated loan agreements (Sponsor Loans and Second Sponsor Loans) with NIL and NTMC. Under the terms of the Amendments annual interest rates are to be based on SIBOR rate plus 3% for principal and SIBOR rate plus 4% for any unpaid accrued interest.
On July 15, 2002, PTNNT entered into a working capital loan agreement with Newmont and Sumitomo Corporation Capital Asia Pty Ltd. The U.S.$35 million loan facility is available through July 14, 2005. Repayments of principal and interest are not considered Restricted Payments under the terms of the Senior Debt discussed above. The loan is available for one-, two-, or three-month periods at the option of PTNNT. The interest rate is based on the three-month SIBOR plus 2%. However, if any principal amount is not paid by the due date, the interest rate is based on the three-month SIBOR plus 4%. The loan balance at December 31, 2003 and 2002 was zero.
NOTE 11 RECLAMATION AND REMEDIATION (ASSET RETIREMENT OBLIGATIONS)
NTP’s mining and exploration activities are subject to various Indonesian laws and regulations governing the protection of the environment. These laws and regulations are continually changing and are generally becoming more restrictive. NTP conducts its operations so as to protect the public health and environment and believes its operations are in compliance with all applicable laws and regulations. NTP has made, and expects to
NT-18
NUSA TENGGARA PARTNERSHIP V.O.F.
NOTES TO CONSOLIDATED FINANCIAL STATEMENTS—(Continued)
make in the future, expenditures to comply with such laws and regulations, but cannot predict the amount of such future expenditures. Estimated future reclamation costs are based principally on legal and regulatory requirements.
The following is a reconciliation of the total liability for asset retirement obligations (in thousands of U.S.$):
Balance December 31, 2002 | $ | 13,330 | ||
Impact of adoption of SFAS No. 143 | 72,822 | |||
Liabilities settled | (2,626 | ) | ||
Revisions | (42,422 | ) | ||
Accretion expense | 6,388 | |||
Balance December 31, 2003 | $ | 47,492 | ||
Balance December 31, 2002 | $ | 13,330 | ||
Impact of adoption of SFAS No. 143 | 72,822 | |||
Liabilities settled | (2,626 | ) | ||
Revisions | (42,422 | ) | ||
Accretion expense | 6,388 | |||
Balance December 31, 2003 | $ | 47,492 | ||
The asset retirement obligation was adjusted for a study of the final Batu Hijau reclamation cost estimate (“2003 study”), which was completed during the fourth quarter of 2003. The major change in the 2003 Study from prior estimates of Batu Hijau reclamation estimates was the optimization of the cost estimate related to the treatment of water at the site after completion of operations.
NT-19
NUSA TENGGARA PARTNERSHIP V.O.F.
NOTES TO CONSOLIDATED FINANCIAL STATEMENTS—(Continued)
On a pro forma basis, the liabilities for asset retirement obligations would have been U.S.$79.7 million and U.S.$86.2 million at January 1, 2002 and December 31, 2002, respectively, if SFAS No. 143 had been applied at the beginning of 2002.
The table below presents the impact of the accounting change for year ended December 31, 2003 and the pro forma effect for the years ended December 31, 2002 as if the change had been in effect for those periods (in thousands of U.S.$):
| Years Ended December 31, | ||||||||
| 2003 (impact) | 2002 (pro forma) | |||||||
(Decrease) increase to net income (loss) | ||||||||
Production costs | $ | 1,392 | $ | 1,953 | ||||
Depreciation, depletion, and amortization | (5,045 | ) | (5,363 | ) | ||||
Income tax benefit | 1,279 | 1,194 | ||||||
Net decrease in income (loss) before cumulative effect of a change in accounting principle | $ | (2,374 | ) | $ | (2,216 | ) | ||
The table below presents pro forma income (loss) before cumulative effect of a change in accounting principle for years ended December 31, 2002 as if the Company had adopted the SFAS No. 143 as of January 1 (in thousands of U.S.$):
| 2002 | ||||
| Income before cumulative effect of a change in accounting principle | ||||
As reported | $ | 35,477 | ||
Change in accounting method SFAS No. 143 | (2,216 | ) | ||
Pro forma | $ | 33,261 | ||
| Year Ended December 31, 2003 | ||||
(Decrease) increase to net income (loss) | ||||
Production costs | $ | 1,392 | ||
Depreciation, depletion, and amortization | (5,045 | ) | ||
Income tax benefit | 1,279 | |||
Net decrease in income (loss) before cumulative effect of a change in accounting principle | $ | (2,374 | ) | |
NOTE 12 STATEMENT OF COMPREHENSIVE INCOME (LOSS)
| Years Ended December 31, | |||||||
| 2003 | 2002 | ||||||
| (in thousands of U.S.$) | |||||||
Net income (loss) | $ | 100,794 | $ | 35,477 | |||
Other comprehensive income (loss): | |||||||
Changes in fair value of cash flow hedge instruments, net of tax of $(1,879) and $1,613, respectively | (3,490 | ) | 2,995 | ||||
Total other comprehensive (loss) income | (3,490 | ) | 2,995 | ||||
Comprehensive income (loss) | $ | 97,304 | $ | 38,472 | |||
NT-20
NUSA TENGGARA PARTNERSHIP V.O.F.
NOTES TO CONSOLIDATED FINANCIAL STATEMENTS—(Continued)
| Year Ended December 31, 2003 | ||||
| (in thousands U.S.$) | ||||
Net income | $ | 100,794 | ||
Other comprehensive income (loss): | ||||
Changes in fair value of cash flow hedge instruments, net of tax of $(1,879) | (3,490 | ) | ||
Comprehensive income | $ | 97,304 | ||
NOTE 13 MAJOR CUSTOMERS AND EXPORT SALES
PTNNT sells its concentrates primarily pursuant to long-term sales agreements. As a percentage of concentrate sales (copper sales net of smeltingtreatment and refining charges), 96% of concentrate sales were pursuant to such contracts during 2003. Three of these agreements each accounted for more than 10% of sales in 2003 at
NT-19
NUSA TENGGARA PARTNERSHIP V.O.F.
NOTES TO CONSOLIDATED FINANCIAL STATEMENTS—(Continued)
U.S.$60.3 million, U.S.$55.3 million and U.S.$53.2 million, respectively, and together accounted for 39% of concentrate sales. As a percentage of concentrate sales, 97% were pursuant to such long-term sales agreements during 2002, of which three agreements each accounted for more than 10% of sales in 2002 at U.S.$55.5 million, U.S.$51.8 million and U.S.$50.9 million, respectively, and together accounted for 44% of concentrate sales. Concentrate sales were made to three related parties during 2003 and 2002 and the associated metal sales receivables at December 31, 2003 and 2002 as follows:
| Years Ended December 31, | |||||||||
| 2003 | 2002 | Year Ended December 31, 2003 | |||||||
| (in thousands of U.S.$) | (in thousands U.S.$) | ||||||||
Concentrate sales | |||||||||
Sumitomo Metal Mining Co., Ltd. | $ | 31,890 | $ | 34,358 | $ | 31,890 | |||
Mitsubishi Materials Corporation | 55,265 | 55,537 | 55,265 | ||||||
Furukawa Co., Ltd. | 20,791 | 18,025 | 20,791 | ||||||
| $ | 107,946 | $ | 107,920 | $ | 107,946 | ||||
| At December 31, | |||||||||
| 2003 | 2002 | ||||||||
| (in thousands of U.S.$) | |||||||||
Associated metals sale receivables | |||||||||
Sumitomo Metal Mining Co., Ltd. | $ | 4,079 | $ | 15,663 | |||||
Mitsubishi Materials Corporation | 7,276 | 4,994 | |||||||
Furukawa Co., Ltd. | 6,085 | 885 | |||||||
| $ | 17,440 | $ | 21,542 | ||||||
NOTE 14 SUPPLEMENTAL CASH FLOW INFORMATION
Excluded from the consolidated statements of cash flows were the effects of non-cash transactions wherein PTNNT purchases spare parts inventory, but defers payment until such inventory is used. The amount so purchased was U.S.$26.3 million at December 31, 2003 and U.S.$30.3 million at December 31, 2002.
Third party interest paid totaled U.S.$40.6 million and U.S.$47.4 million in 2003 and 2002, respectively.
U.S.$5.0 million of interest was paid to NIL and NTMC in 2003.
Taxes paid, consisting of withholding taxes on interest earned, were U.S.$0.8 million and U.S.$2.0 million in 2003 and 2002, respectively.
In December 2003, cash distributions of $17.9 million and $13.9 million were made to NIL and NTMC, respectively.
NT-21
NUSA TENGGARA PARTNERSHIP V.O.F.
NOTES TO CONSOLIDATED FINANCIAL STATEMENTS—(Continued)
| At December 31, 2003 | |||
| (in thousands U.S.$) | |||
Associated metals sale receivables | |||
Sumitomo Metal Mining Co., Ltd. | $ | 4,079 | |
Mitsubishi Materials Corporation | 7,276 | ||
Furukawa Co., Ltd. | 6,085 | ||
| $ | 17,440 | ||
NOTE 15 OTHER SIGNIFICANT AGREEMENTS
Technology and Know-How Agreements
On July 2, 1996, PTNNT entered into a Technology and Know-How Agreement with Newmont Technologies Limited (“NTL”), a subsidiary of Newmont, whereby NTL agreed to provide proprietary information, technology, know-how and related intellectual property rights. Under the terms of this agreement, PTNNT pays NTL a royalty of 1.6875% of the preceding month’s aggregate capital expenditures determined in accordance with U.S. GAAP, and U.S.$3.9375 per ounce of gold equivalent produced by PTNNT.
A similar Technology and Know-How Agreement was executed with Sumitomo Corporation on the same date, providing a royalty of 1.3125% of aggregate capital expenditures and U.S.$3.0625 per ounce of gold equivalent produced.
Charges under these agreements totaled U.S.$15.5 million and U.S.$16.2 million during 2003 and 2002, respectively.2003. The associated liabilities at December 31, 2003 and 2002 wereof U.S.$114.6 million and U.S.$99.1 million, respectively, and werewas included inAccounts payable—affiliates (Note 8).
Consulting Services Agreements
In July 1996, PTNNT entered into a Consulting Services Agreement with Newmont International Services Limited (“NISL”), a subsidiary of Newmont, whereby NISL agreed to provide certain support; advisory and consulting services related to general project engineering, control and development; procurement advice and implementation; contract negotiation support; general construction advice and support; operations management support; tax and legal planning; general and administrative services; and management and business support services. NISL provides these services primarily outside of the Republic of Indonesia. Under the terms of this agreement, PTNNT reimburses NISL for its actual payroll costs, including related employee benefits, incurred to provide these services, other out-of-pocket costs, and an administrative fee. Charges totaled U.S.$11.7 million in 2003 and U.S.$3.8 million in 2002, andAccounts payable—affiliates included U.S.$0.3 million and U.S.$2.7 million at December 31, 2003 and 2002, respectively (see Note 8).
NT-20
NUSA TENGGARA PARTNERSHIP V.O.F.
NOTES TO CONSOLIDATED FINANCIAL STATEMENTS—(Continued)
PTNNT has a similar Consulting Services Agreement with NTMC. Pursuant to this agreement, charges totaled U.S.$0.7 million in 2003 and U.S.$0.6 million in 2002.2003. There were noAccounts payable—affiliates at December 31, 2003 and 2002.2003.
In June 1999, PTNNT entered into a Consulting Services Agreement with Newmont Pacific Nusantara (“NPN”), a subsidiary of Newmont, whereby NPN agreed to provide legal, tax, government relations and public relations support. NPN provides these services primarily in the Republic of Indonesia. Under the terms of this agreement, PTNNT reimburses NPN for its actual payroll costs, including related employee benefits, incurred to provide these services, other out-of-pocket costs, and an administrative fee. Charges totaled U.S.$2.0 million and U.S.$2.4 million in 2003 and 2002, respectively.Accounts payable—affiliates included U.S.$0 million and U.S.$0.3 million at December 31, 2003, and 2002, respectively for this agreement (see Note 8).
2003.
Payroll Agency Agreements
PTNNT entered into Payroll Agency Agreements with Newmont Indonesia Investment Limited (“NIIL”) and Newmont Global Employment Limited Partnership (“NGELP”), wholly-owned subsidiaries of Newmont, whereby NIIL and NGELP agreed to act as agents of PTNNT to handle personnel, payroll and benefits management of non-Indonesian employees assigned to work for PTNNT in Indonesia. NIIL manages expatriates from the U.S. and NGELP manages expatriates from countries other than the U.S.
NT-22
NUSA TENGGARA PARTNERSHIP V.O.F.
NOTES TO CONSOLIDATED FINANCIAL STATEMENTS—(Continued)
Under the terms of these agreements, PTNNT reimburses the agents for salaries, related employee benefits and other reasonable expenses and pays a fee of U.S.$20 for each salary payment made. Agency payments totaled U.S.$11.9 million in 2003, and U.S.$12.9 million in 2002, andAccounts payable—affiliates included U.S.$0.6 million and U.S.$0.7 million at December 31, 2003 and 2002, respectively (see Note 8).
Maintenance and Repair Cost Agreements
During 1999, PTNNT entered into a long-term Maintenance and Repair Cost agreements (“MARC”) with P.T. Trakindo Utama (“Trakindo”), an unrelated Indonesian company, to provide maintenance on PTNNT’s Caterpillar equipment at a fixed cost per operating hour. Under the terms of the MARC agreements, Trakindo will provide all normal “wear and tear” parts and labor necessary to perform maintenance and repairs on such equipment. Inception-to-date contract expenditures charged for such services were U.S.$119.6 million with the future value of the contracts amounting to U.S.$190.7 million. The contracts are effective through December 31, 2007. Either party can cancel the contracts with one year’s written notice.
NOTE 16 HEDGING PROGRAMS
PTNNT entered into a series of copper hedging transactions which have been classified as cash flow hedges. The contracts comprise a forward sale at a fixed price and a spot purchase at the average spot price for the delivery month. The physical commodity is sold at the average spot price for the delivery month.
PTNNT had the following copper forward sales contracts outstanding at December 31, 2003:
| Expected Maturity Date or Transaction Date | Fair Value | |||||||||||||||||||||||||
Copper Forward Contracts: | 2004 | 2005 | 2006 | 2007 | 2008 | Thereafter | Total/ Average | December 31, 2003 | December 31, 2002 | |||||||||||||||||
| (U.S.$ Denominated) | (in thousands of U.S.$) | |||||||||||||||||||||||||
Tonnes | 4,000 | — | — | — | — | — | 4,000 | (4,999 | ) | 404 | ||||||||||||||||
Average price | $ | 1,833 | $ | — | $ | — | $ | — | $ | — | $ | — | $ | 1,833 | ||||||||||||
| Expected Maturity Date or Transaction Date | Fair Value December 31, 2003 | |||||||||||||||||||||||
Copper Forward Contracts: | 2004 | 2005 | 2006 | 2007 | 2008 | Thereafter | Total/ Average | |||||||||||||||||
| (U.S.$ Denominated) | (in thousands of U.S.$) | |||||||||||||||||||||||
Tonnes | 4,000 | — | — | — | — | — | 4,000 | (4,999 | ) | |||||||||||||||
Average price | $ | 1,833 | $ | — | $ | — | $ | — | $ | — | $ | — | $ | 1,833 | ||||||||||
PTNNT also entered into diesel hedging contracts which have been designated as cash flow hedges. The contracts comprise a forward purchase at a fixed price and a spot sale at the average spot price for the delivery month.
NT-21
NUSA TENGGARA PARTNERSHIP V.O.F.
NOTES TO CONSOLIDATED FINANCIAL STATEMENTS—(Continued)
PTNNT had the following diesel forward purchase contracts outstanding at December 31, 2003:
| Expected Maturity Date or Transaction Date | Fair Value | ||||||||||||||||||||||||
Diesel Forward Contracts: | 2004 | 2005 | 2006 | 2007 | 2008 | Thereafter | Total/ Average | December 31, 2003 | December 31, 2002 | ||||||||||||||||
| (U.S.$ Denominated) | (in thousands of U.S.$) | ||||||||||||||||||||||||
Barrels (‘000) | 120 | 40 | — | — | — | — | 160 | 637 | 604 | ||||||||||||||||
Average price | $ | 28.1 | $ | 27.2 | $ | — | $ | — | $ | — | $ | — | $ | 27.9 | |||||||||||
| Expected Maturity Date or Transaction Date | Fair Value December 31, 2003 | ||||||||||||||||||||||
Diesel Forward Contracts: | 2004 | 2005 | 2006 | 2007 | 2008 | Thereafter | Total/ Average | ||||||||||||||||
| (U.S.$ Denominated) | (in thousands of U.S.$) | ||||||||||||||||||||||
Barrels (‘000) | 120 | 40 | — | — | — | — | 160 | 637 | |||||||||||||||
Average price | $ | 28.1 | $ | 27.2 | $ | — | $ | — | $ | — | $ | — | $ | 27.9 | |||||||||
PTNNT also entered into Indonesian Rupiah hedging contracts which have been designated as cash flow hedges. The contracts comprise a forward purchase at a fixed price and a spot sale at the average price for the delivery month.
NT-23
NUSA TENGGARA PARTNERSHIP V.O.F.
NOTES TO CONSOLIDATED FINANCIAL STATEMENTS—(Continued)
PTNNT had the following Indonesian Rupiah forward purchase contracts outstanding at December 31, 2003:
| Expected Maturity Date or Transaction Date | Fair Value | |||||||||||||||||||
Rupiah Forward Contracts: | 2004 | 2005 | 2006 | 2007 | 2008 | Thereafter | Total/ Average | December 31, 2003 | December 31, 2002 | |||||||||||
| (U.S.$ Denominated) | (in thousands of U.S.$) | |||||||||||||||||||
U.S.$ (in millions) | $ | 7.7 | — | — | — | — | — | $ | 7.7 | — | N/A | |||||||||
Average price (Rp) | 9,024 | — | — | — | — | — | 9,024 | |||||||||||||
| Expected Maturity Date or Transaction Date | Fair Value December 31, 2003 | |||||||||||||||||
Rupiah Forward Contracts: | 2004 | 2005 | 2006 | 2007 | 2008 | Thereafter | Total/ Average | |||||||||||
| (U.S.$ Denominated) | (in thousands U.S.$) | |||||||||||||||||
U.S.$ (in millions) | $ | 7.7 | — | — | — | — | — | $ | 7.7 | — | ||||||||
Average price (Rp) | 9,024 | — | — | — | — | — | 9,024 | |||||||||||
The outstanding hedging contracts are valued at current market value at the end of each period. The resulting income (loss) from these contracts at December 31, 2003 and 2002 waswere tax effected at 35% and the net amount is recorded inOther comprehensive income (loss). TheOther Comprehensive income (loss) will be transferred toNet income (loss) as these contracts are settled.
NOTE 17 COMMITMENTS AND CONTINGENCIES
NTP is from time to time involved in various legal proceedings of a character normally incident to its business. It does not believe that adverse decisions in any pending or threatened proceedings or that any amounts it may be required to pay by reason thereof will have a material adverse effect on its financial condition or results of operations.
NOTE 18 UNAUDITED SUPPLEMENTARY DATA
In general, mining costs are charged toProduction costsas incurred. However, PTNNT defers and amortizes certain mining costs on a UOP basis over the life of the mine. These mining costs, which are commonly referred to as “deferred stripping” costs are incurred in mining activities that are normally associated with the removal of waste rock. The deferred stripping accounting method is generally accepted in the mining industry where mining operations have diverse grades and waste to ore ratios; however, industry practice does vary. Deferred stripping matches the costs of production with the sale of such production by assigning each recoverable pound of copper equivalent with an equivalent amount of waste removal cost. If PTNNT were to expense stripping costs as incurred, there might be greater volatility in NTP’s period-to-period results of operations. See additional discussion of deferred stripping in Note 2 to NTP’s financial statements.
NT-22
NUSA TENGGARA PARTNERSHIP V.O.F.
NOTES TO CONSOLIDATED FINANCIAL STATEMENTS—(Continued)
Details of deferred stripping with respect to Batu Hijau are as follows (unaudited):
| 2003 | 2002 | |||
Life-of-mine Assumptions Used as Basis For Deferred Stripping Calculations | ||||
—Stripping ratio (1) | 0.19 | 0.21 | ||
—Average ore grade (pounds of copper equivalent per ton) | 5.19 | 4.81 | ||
Actuals for Year | ||||
—Stripping ratio (2) | 0.19 | 0.25 | ||
—Average ore grade (pounds of copper equivalent per ton) | 5.40 | 4.01 | ||
Remaining Mine Life (years) | 14 | 13 |
| 2003 |
Life-of-mine Assumptions Used as Basis For Deferred Stripping Calculations | |||
—Stripping ratio(1) | 0.19 | ||
—Average ore grade (pounds of copper equivalent per ton) | 5.19 | ||
Actuals for Year | |||
—Stripping ratio(2) | 0.19 | ||
—Average ore grade (pounds of copper equivalent per ton) | 5.40 | ||
Remaining Mine Life (years) | 14 |
| (1) | Ratio based on total tons to be mined in future to total pounds of copper and ounces of gold to be recovered in future. |
| (2) | Ratio based on total tons mined to total pounds of copper and ounces of gold recovered. |
NT-24NT-23
Pursuant to the requirements of Section 13 or 15(d) of the Securities Exchange Act of 1934, the registrant has duly caused this Annual Report on Form 10-K to be signed on its behalf by the undersigned, thereunto duly authorized.
NEWMONT MINING CORPORATION
NEWMONT MINING CORPORATION | ||
By: | /s/ BRITT D. BANKS | |
Britt D. Banks Senior Vice President and General Counsel | ||
March 15, 2005
2, 2006
Pursuant to the requirements of the Securities Exchange Act of 1934, this report has been signed below by the following persons on behalf of the registrant and in the capacities indicated on March 15, 2005.2, 2006.
Signature | Title | |
* Wayne W. Murdy | Chairman of the Board and Chief Executive Officer | |
*
| Senior Vice President and Chief Financial Officer | |
* Russell Ball | Vice President and Controller | |
Glen A. Barton* | Director | |
Vincent A. Calarco* | Director | |
| Director | |
| Director | |
| Director | |
| Director | |
| Director | |
| Director | |
| Director | |
| Director | |
| Director | |
| Seymour Schulich* | Director | |
| James V. Taranik* | Director | |
*By: | /s/ BRITT D. BANKS | |
Britt D. Banks Attorney-in-Fact | ||
Exhibit Number | Description | |
| 1 | —Underwriting Agreement, dated as of March 17, 2005, among Registrant, Newmont USA Limited, Citigroup Capital Markets Inc. and J.P. Morgan Securities Inc. Incorporated by reference to Exhibit 1.1 to Registrant’s Form 8-K filed with the Securities and Exchange Commission on March 22, 2005. | |
| 2(a) | —Arrangement Agreement, dated as of November 14, 2001, by and between Franco-Nevada Mining Corporation Limited and Newmont Mining Corporation (now known as “Newmont USA Limited”). Incorporated by reference to Exhibit 2.1 to the | |
| 2(b) | —Deeds of Undertaking, dated as of November 14, 2001, November 14, 2001, and December 10, 2001, by and between Newmont Mining Corporation (now known as “Newmont USA Limited”) and Normandy Mining Limited. Incorporated by reference to Exhibit 2.2 to | |
| 2(c) | —Agreement and Plan of Merger, dated as of January 8, 2002, by and among Newmont Mining Corporation (now known as “Newmont USA Limited”), the | |
| 3(a) | —Certificate of Incorporation of | |
| 3(b) | —Certificate of | |
| 3(c) | —Certificate of | |
| 3(d) |
| |
—Certificate of Designations of $3.25 Convertible Preferred Stock of | ||
| |
| |
| ||
—By-laws of the | ||
| ||
| 4(a) | — | |
| ||
| 4(b) | —Form of 5.875% Note due 2035 issued pursuant to Indenture, dated as of March 22, 2005, among Registrant, Newmont USA Limited and Citibank, N.A. Incorporated by reference to Exhibit 4.2 to Registrant’s Form 8-K filed with the Securities and Exchange Commission on March 22, 2005. | |
Exhibit Number | Description | |
| 4(c) |
| |
| ||
—Pass Through Trust Agreement dated as of July 15, 1994, between Newmont Gold Company (now known as “Newmont USA Limited”) and The First National Bank of Chicago relating to the Pass Through Certificates, Series 1994-A1. (The front cover of this Exhibit indicates the material differences between such Exhibit and the substantially similar (except for price-related information) Pass-Through Agreement between Newmont Gold Company (now known as “Newmont USA Limited”) and The First National Bank of Chicago relating to the Pass-Through Certificates, Series 1994-A2.) Incorporated by reference to Exhibit 4.1 to Newmont Gold Company’s Quarterly Report on Form 10-Q for the quarter ended September 30, 1994. | ||
| | —Lease dated as of September 30, 1994, between Newmont Gold Company (now known as “Newmont USA Limited”) and Shawmut Bank Connecticut, National Association relating to Trust No. 1 and a 75% undivided interest in Newmont Gold Company’s refractory gold ore treatment facility. (The front cover of this Exhibit indicates the material differences between such Exhibit and the substantially similar (except for price-related information) entered into on the same date relating to the remaining 25% undivided interest in the facility.) Incorporated by reference to Exhibit 4.2 to Newmont Gold Company’s Quarterly Report on Form 10-Q for the quarter ended September 30, 1994. | |
| | —Trust Indenture and Security Agreement dated as of July 15, 1994, between Shawmut Bank Connecticut, National Association and The First National Bank of Chicago relating to Trust No. 1 and a 75% undivided interest in Newmont Gold Company’s (now known as “Newmont USA Limited”) refractory gold ore treatment facility. (The front cover of this Exhibit indicates the material differences between such Exhibit and the substantially similar (except for price-related information) entered into on the same date relating to the remaining 25% undivided interest in the facility.) Incorporated by reference to Exhibit 4.3 to Newmont Gold Company’s Quarterly Report on Form 10-Q for the quarter ended September 30, 1994. | |
| | —See footnote (1). | |
| 10(a) | —Savings Equalization Plan, amended and restated, of Newmont USA Limited, a wholly owned subsidiary of the Registrant, effective January 1, 2005 and dated July 12, 2005. Incorporated by reference to Exhibit 10.1 of Registrant’s Form 8-K filed with the Securities and Exchange Commission on July 18, 2005. | |
| 10(b) | —Pension Equalization Plan, amended and restated, of Newmont USA Limited, a wholly owned subsidiary of the Registrant, effective January 1, 2005 and dated July 12, 2005. Incorporated by referenced to Exhibit 10.2 of Registrant’s Form 8-K filed with the Securities and Exchange Commission on July 18, 2005. | |
| 10(c) | —1992 Key Employees Stock Plan as amended as of October 25, 1993. Incorporated by reference to Exhibit 10(p) to Newmont Mining Corporation’s Annual Report on Form 10-K for the year ended December 31, 1993. | |
| ||
—1996 Employees Stock Plan amended and restated effective as of March 17, 1999. Incorporated by reference to Exhibit 10(d) to Newmont Mining Corporation’s Annual Report on Form 10-K for the year ended December 31, 1998. | ||
—1999 Employees Stock Plan. Incorporated by reference to Exhibit 10(e) to Newmont Mining Corporation’s Annual Report on Form 10-K for the year ended December 31, 1998. | ||
| 10(f) | —2005 Stock Incentive Plan, amended and restated effective October 26, 2005. Incorporated by reference to Exhibit 10.1 of Registrant’s Form 8-K filed with the Securities and Exchange Commission on October 31, 2005. | |
Exhibit Number | Description | |
—Form of Award Agreement used for Executive Officers to | ||
—Form of Award Agreement used for Executive Officers to grant stock options pursuant to Registrant’s 1999 Employees Stock Plan. Incorporated herein by reference to Exhibit 10.1 of Registrant’s Form 8-K filed with the Securities and Exchange Commission on March 2, 2005. | ||
| 10(i) | —Form of Award Agreement used for Executive Officers to grant restricted stock pursuant to Registrant’s 1999 Employees Stock Plan. Incorporated herein by reference to Exhibit 10.1 of Registrant’s Form 8-K filed with the Securities and Exchange Commission on March 2, 2005. | |
| 10(j) | —Form of Award Agreement used for Executive Officers to grant restricted stock units pursuant to Registrant’s 1999 Employees Stock Plan. Incorporated herein by reference to Exhibit 10.2 of Registrant’s Form 8-K filed with the Securities and Exchange Commission on March 2, 2005. | |
| 10(k) | —Form of Award Agreement used for Executive Officers to grant stock options pursuant to Registrant’s 2005 Stock Incentive Plan. Incorporated herein by reference to Exhibit 10.2 of Registrant’s Form 8-K filed with the Securities and Exchange Commission on October 26, 2005. | |
| 10(l) | —Form of Award Agreement used for Executive Officers to grant restricted stock pursuant to Registrant’s 2005 Stock Incentive Plan. Incorporated herein by reference to Exhibit 10.3 of Registrant’s Form 8-K filed with the Securities and Exchange Commission on October 26, 2005. | |
| 10(m) | —Form of Award Agreement used for non-employee directors to grant director stock units pursuant to the 2005 Stock Incentive Plan. Incorporated herein by reference to Exhibit 10.1 of Registrant’s Form 8-K filed with the Securities and Exchange Commission on June 17, 2005. | |
| 10(n) | —Annual Incentive Compensation Payroll Practice of the Registrant, amended and restated effective January 1, | |
—Employee Performance Incentive Compensation Payroll Practice of Registrant, amended and restated effective January 1, 2004. Incorporated herein by reference to Exhibit 10(f) to Registrant’s Annual Report on Form 10-K for the period December 31, 2004, filed | ||
—Newmont Mining Corporation Intermediate Term Incentive Compensation Plan (Amended and Restated Generally Effective as of January 1, 2002). Incorporated by reference to Exhibit 10(l) to Newmont Mining Corporation’s Annual Report on Form 10-K for the year ended December 31, 2002. | ||
—Amended and Restated Officers’ Death Benefit Plan effective January 1, 2004 of Newmont USA Limited, a wholly owned subsidiary of Registrant. Incorporated herein by reference to Exhibit 10.1 to Registrant’s Form 8-K filed with the Securities and Exchange Commission on December 22, 2004. | ||
—Amended and Restated Executive Change of Control Plan effective January 1, 2004 of Newmont USA Limited, a wholly owned subsidiary of Registrant. Incorporated herein by reference to Exhibit 10.2 of Registrant’s Form 8-K filed with the Securities and Exchange Commission on December 22, 2004. | ||
—Newmont Mining Corporation 2000 Non-Employee Directors Stock Plan, as Amended and Restated as of May 17, 2000. Incorporated by reference to Exhibit 10 to Newmont Mining Corporation’s Quarterly Report on Form 10-Q for the quarter ended September 30, 2000. | ||
Exhibit Number | Description | |
—Agreement dated September 15, 1999, among Newmont Mining Corporation, Newmont Gold Company and Bruce D. Hansen. Incorporated by reference to Exhibit 10(a) to Newmont Mining Corporation’s Quarterly Report on Form 10-Q for the quarter ended September 30, 1999. | ||
—Amendment to Employment Agreement | ||
—Agreement dated February 1, 1999, among Newmont Mining Corporation, Newmont Gold Company and certain executive officers. Incorporated by reference to Exhibit 10(b) to Newmont Mining Corporation’s Quarterly Report on Form 10-Q for the quarter ended March 31, 1999. | ||
—Letter Agreement dated May 6, 1993, between Newmont Gold Company and Wayne W. Murdy. Incorporated by reference to Exhibit 10 to Newmont Gold Company’s Quarterly Report on Form 10-Q for the quarter ended March 31, 1993. | ||
—Letter Agreement dated March 23, 2001, between Wayne W. Murdy and Newmont Mining Corporation. Incorporated by reference as Exhibit 10(v) to Newmont Mining Corporation’s Annual Report on Form 10-K for the year ended December 31, 2000. | ||
| ||
— | ||
| ||
—Employment Agreement effective, as of February 16, 2002, between Newmont Global Employment Limited Partnership and Pierre Lassonde. Incorporated by reference to Exhibit 10(a) to Newmont Mining Corporation’s Quarterly Report on Form 10-Q for period ended June 30, 2002, filed August 14, 2002. | ||
—Amendment of Employment Agreement effective, as of February 16, 2004, between Newmont Global Employment Limited Partnership and Pierre Lassonde. Incorporated by reference to Exhibit 10(q) to Newmont Mining Corporation’s Annual Report on Form 10-K for the year ended December 31, 2003. | ||
—Amendment to Employment Agreement effective July 28, 2005 between Newmont Mining Corporation and Pierre Lassonde. Incorporated by reference to Exhibit 10.3 to Registrant’s Quarterly Report on Form 10-Q for the period June 30, 2005, filed with the Securities and Exchange Commission on August 1, 2005. | ||
| 10(cc) | —Consulting Agreement effective as of April 1, 2002, between Newmont Capital Limited and Seymour Schulich. Incorporated by reference as Exhibit 10(x) to Newmont Mining Corporation’s Annual Report on Form 10-K for the year ended December 31, 2002. | |
—Amendment to Consulting Agreement effective as of April 1, 2005 and dated December 7, 2004, between Newmont Capital Limited and Seymour Schulich. Incorporated by reference as Exhibit 99.1 to Registrant’s Form 8-K filed with the Securities and Exchange Commission on December 13, 2004. | ||
| 10(ee) | —Amendment No. 2 to Consulting Agreement effective July 28, 2005, between Newmont Capital Limited and Seymour Schulich. Incorporated by reference to Exhibit 10.5 to Registrant’s Form 10-Q for the period June 30, 2005, filed with the Securities and Exchange Commission on August 1, 2005. | |
Exhibit Number | Description | |
—Amendment to Consulting Agreement dated October 31, 2005, and effective as of April 26, 2006, between Newmont Capital Limited and Seymour Schulich. Incorporated by reference as Exhibit 10.5 to Registrant’s Form 8-K filed with the Securities and Exchange Commission on October 31, 2005. | ||
| 10(gg) | —Employment Agreement dated September 9, 2005 between Newmont USA Limited and David H. Francisco. Incorporated by reference as Exhibit 10.1 to Registrant’s Form 8-K filed with the Securities and Exchange Commission on September 9, 2005. | |
| 10(hh) | —Credit Agreement dated as of July 30, | |
—Canadian Oil Sands Trust (“COST”) Agreement as of May 10, 2004 between Pierre Lassonde and Newmont Mining | ||
—Canadian Oil Sands Trust (“COST”) Agreement as of May 10, 2004 between Seymour Schulich and Newmont Mining | ||
—Summary of Non-Employee Director Compensation and | ||
—Summary of Executive Compensation, filed herewith. | ||
— | ||
| ||
| ||
| ||
| ||
| 12.1 | —Statement re Computation of Ratio of Earnings to Fixed Charges and Preferred Dividends, filed herewith. | |
| 12.2 | —Statement re Computation of Ratio of Earnings to Fixed Charges, filed herewith. | |
| ||
| 21 | —Subsidiaries of Newmont Mining Corporation, filed herewith. | |
| 23.1 | —Consent of PricewaterhouseCoopers LLP, filed herewith. | |
| 24 | —Power of Attorney, filed herewith. | |
| 31.1 | —Certification Pursuant to Rule 13A-14 or 15D-14 of the Securities Exchange Act of 1934, as adopted pursuant to Section 302 of the Sarbanes-Oxley Act of 2002 signed by the Principal Executive Officer, filed herewith. | |
Exhibit Number | Description | |
| 31.2 | —Certification Pursuant to Rule 13A-14 or 15D-14 of the Securities Exchange Act of 1934, as adopted pursuant to Section 302 of the Sarbanes-Oxley Act of 2002 signed by the Principal Financial Officer, filed herewith. | |
| 32.1 | —Statement Required by 18 U.S.C. Section 1350, as Adopted Pursuant to Section 906 of the Sarbanes-Oxley Act of 2002 signed by Principal Executive Officer, furnished herewith. | |
| 32.2 | —Statement Required by 18 U.S.C. Section 1350, as Adopted Pursuant to Section 906 of the Sarbanes-Oxley Act of 2002 signed by Chief Financial Officer, furnished herewith. | |
| (1) | In reliance upon Item 601(b)(4)(iii) of Regulation S-K, various instruments defining the rights of holders of long-term debt of the Newmont Mining Corporation are not being filed herewith because the total of securities authorized under each such instrument does not exceed 10% of the total assets of Newmont Mining Corporation. Newmont Mining Corporation hereby agrees to furnish a copy of any such instrument to the Commission upon request. |
E-5E-6