the mix of all our services sold during a period;
our success in marketing and market acceptance of our services by our existing customers and by new customers;
changes in marketing expenses related to promoting and distributing our services;
customer renewal rates and turnover of customers of our services;
continued development of our direct and indirect distribution channels for our information and security services, and communications services (including our mobile content services), both in the U.S.United States and abroad;
changes in the level of spending for information technology-related products and services by enterprise customers;
Our operating expenses may increase. If an increase in our expenses is not accompanied by a corresponding increase in our revenues, our operating results will suffer, particularly as revenues from some of our services are recognized ratably over the term of the service, rather than immediately when the customer pays for them, unlike our sales and marketing expenditures, which are expensed in full when incurred.
Due to all of the above factors, our revenues and operating results are difficult to forecast. Therefore, we believe that period-to-period comparisons of our operating results will not necessarily be meaningful, and you should not rely upon them as an indication of future performance. Also, operating results may fall below our expectations and the expectations of securities analysts or investors in one or more future periods. If this were to occur, the market price of our common stock would likely decline.
Our operating results may be adversely affected by the uncertain geopolitical environment and unfavorable economic and market conditions.
Adverse economic conditions worldwide have contributed to downturns in the telecommunications and technology industries in the past and could impact our business in the future, resulting in:
reduced demand for our services as a result of a decrease in information technology and telecommunications spending by our customers;
increased price competition for our products and services; and
higher overhead costs as a percentage of revenues.
Recent political turmoil in many parts of the world, including terrorist and military actions, may continue to put pressure on global economic conditions. If the economic and market conditions in the United States and globally do not continue to improve, or if they deteriorate, we may experience material adverse impacts on our business, operating results, and financial condition as a consequence of the above factors or otherwise.
Our limited operating history under our currentdiversified business structure may result in significant fluctuations of our financial results.
We completed several acquisitions between 2000 and 2003, including our acquisitionsMany of Network Solutions, Illuminet Holdings and H.O. Systems. In February 2004 and June 2004, respectively,the companies we completed our acquisitions of Guardent, Inc. and Jamba!. In November 2003, we sold our Network Solutions domain name registrar business. Network Solutions, Illuminet Holdings, H.O. Systems and Jamba!have acquired during the past 7 years operated in different businesses from our then-current business. Therefore,Although we have only a limited operating historyplan on which to base an evaluationdivesting many of these businesses, until our consolidated business and prospects. Ourdivestiture plan is complete, our success will depend on many factors, many of which are not entirely under our control, including, but not limited to, the following:
the extent to which digital certificates and domain names are used for electronic commerce or communications;
the perceived security of electronic commerce and communications over the Internet and other IP networks;
the perceived security of our services, technology, infrastructure and practices;
the loss of customers through industry consolidation or customer decisions to deploy in-house or competitor technology and services; and
our continued ability to maintain our current, and enter into additional, strategic relationships.
To address these risks we must, among other things:things, continue to:
successfully market our services to new and existing customers;
attract, integrate, train, retain and motivate qualified personnel;
respond to competitive developments;
successfully introduce new services; and
successfully introduce enhancements to our services to address new technologies and standards and changing market conditions.
We have faced difficulties assimilating, and may incur costs associated with, acquisitions.not realize the benefits we are seeking from our investments in the Jamba joint ventures as a result of lower than predicted operating results, larger funding requirements or lower cash distributions or otherwise.
We made several acquisitionshave a 49% equity interest in two joint ventures related to our former Jamba business. We will recognize our proportionate share of the income or losses of these joint ventures in our consolidated statements of operations. We do not have control over the budget, day-to-day management or many of the other operating expenditures of the joint ventures, and therefore, we cannot predict with certainty the extent of the impact on our financial statements of these joint ventures for any particular period. Accordingly, our share of the income or losses of these joint ventures could materially affect our results of operations in future periods.
The joint venture agreements contain provisions requiring minimum cash distributions to the members. However, these provisions are subject to conditions and limitations, and therefore, we cannot assure you that we will ever receive cash distributions from these joint ventures. If the joint ventures require capital to fund their operations, we could be required to make capital contributions or loans to the joint ventures. The business operated by the U.S. joint venture is a newer business and therefore it may be more likely to require additional funding, although we cannot assure you that the Netherlands joint venture will not require additional funding as well. Additionally, we could be required to pay additional amounts to the joint ventures if it is later determined that we breached any of the representations or warranties in the last five yearsformation agreement for the joint ventures.
The value of our investment in these joint ventures is subject to general economic, technological and market trends, as well as to the operating and financial decisions of the management team of the joint venture, all of which are outside of our control. In addition, these joint ventures may not gain the expected number of customers and/or generate the expected level of revenues, and consequently, we may never receive any cash distributions from these joint ventures, and in fact, they may require additional funding, any of which could diminish the value of or dilute our investment. Our investments in these joint ventures may not provide the economic returns we are seeking and may pursue additional acquisitionsnot increase in value above the future.minimum amounts at which we can require Fox or News Corporation to buy our shares from us. We have experienced difficulty in,cannot assure you that the commercial agreements, including the Gateway Services Agreement, will provide us any benefit. It is also possible that Fox and News Corporation could purchase our shares from us in the future, may face difficulties, integratingprior to the personnel, products,
technologies or operations of companies we acquire. Assimilating acquired businesses involves a number of other risks, including, but not limited to:
If we are unable to successfully address any of these risks for future acquisitions, our business could be harmed.investment.
Additionally, there is riskWe also entered into various other commercial relationships with the joint ventures; however, we cannot assure you that we may incur additional expenses associated with an impairment of a portion of goodwill andwill derive significant revenues from these other intangible assets due to changes in market conditions for acquisitions. Under generally accepted accounting principles, we are required to evaluate goodwill for impairment on an annual basis and to evaluate other intangible assets as events or circumstances indicate that such assets may be impaired. These evaluations could result in further impairments of goodwill or other intangible assets.relationships.
The expansion of ourOur international operations subjectssubject our business to additional economic risks that could have an adverse impact on our revenues and business.
International revenues accounted for approximately 28%As of our total revenues for the year ended December 31, 2004. As a result of our acquisition of Jamba!,2007, we expect that international revenues will increase in absolute monetary termshad approximately 1,200 employees outside the United States, including Europe, Asia, Australia, and as a percentage of revenues. We intend to expand our international operations and international sales and marketing activities. For example, we expect to expand our operations and marketing activities throughout Asia, Europe, India, Latin America and South America. With our Jamba! acquisition, we have facilities and nearly 500 employees in Germany.the Americas. Expansion into these international markets has required and will continue to require significant management attention and resources. We may also need to tailor some of our other services for a particular market and to enter into international distribution and operating relationships. We have limited experience in localizing our services and in developing international distribution or operating relationships. We may not succeed in expanding our services into international markets. Failure to do so could harm our business. Moreover, local laws and customs in many countries differ significantly from those in the United States. In many foreign countries, particularly in those with developing economies, it is common for others to engage in business practices that are prohibited by our internal policies and procedures or United States regulations applicable to us. There can be no assurance that all of our employees, contractors and agents will not take actions in violations of them. Violations of laws or key control policies by our employees, contractors or agents could result in financial reporting problems, fines, penalties, or prohibition on the
harmimportation or exportation of our products and could have a material adverse effect on our business. In addition, there are risks inherent in doing business on an international basis, including, among others:
competition with foreign companies or other domestic companies entering the foreign markets in which we operate;
differing and uncertain regulatory requirements;
legal uncertainty regarding liability and compliance with foreign laws;
export and import restrictions on cryptographic technology and products incorporating that technology;
tariffs and other trade barriers and restrictions;
difficulties in staffing and managing foreign operations;
longer sales and payment cycles;
problems in collecting accounts receivable;
currency fluctuations, as all of our international revenues from VeriSign Japan, K.K. and VeriSign Australia Limited and our wholly-owned subsidiaries inEurope, South Africa, Japan, South America and Europe, including Germany,Australia are not denominated in U.S. Dollars;
potential problems associated with adapting our mobile content services to technical conditions existing in different countries;
the necessity of developing foreign language portals and products for our mobile content services;
difficulty of authenticating customer information for digital certificates payment services and other purposes;
political instability;
failure of foreign laws to protect our U.S. proprietary rights adequately;
more stringent privacy policies in foreign countries;
additional vulnerability from terrorist groups targeting AmericanU.S. interests abroad;
seasonal reductions in business activity; and
potentially adverse tax consequences.
Governmental regulation and the application of existing laws may slow business growth, increase our costs of doing business and create potential liability.
Application of new and existing laws and regulations to the Internet and wireless communications industry can be unclear. The costs of complying or failure to comply with these laws and regulations could limit our ability to operate in our markets, expose us to compliance costs and substantial liability and result in costly and time-consuming litigation.
Foreign, federal or state laws could have an adverse impact on our business. For example, recent laws include those designed to restrict the on-line distribution of certain materials deemed harmful to children and impose additional restrictions or obligations for on-line services when dealing with minors. Such legislation may impose significant additional costs on our business or subject us to additional liabilities.
Due to the nature of the Internet, it is possible that the governments of other states and foreign countries might attempt to regulate Internet transmissions or prosecute us for violations of their laws. We might unintentionally violate such laws, such laws may be modified and new laws may be enacted in the future. Any such developments could increase the costs of regulatory compliance for us, force us to change our business practices or otherwise materially harm our business.
We have identified a material weakness in our internal controls over financial reporting that could cause investors to lose confidence in the reliability of our financial statements and result in a decrease in the value of our securities.
Our management has identified a material weakness in our internal control over financial reporting as of December 31, 2007, arising from internal control deficiencies in our stock administration policies and practices, as discussed in Part II, Item 9A, “Controls and Procedures.” In addition, due to the identification of a material weakness in internal control over financial reporting, our Chief Executive Officer and Chief Financial Officer concluded that, as of December 31, 2007, and the date of this report, our disclosure controls and procedures were not effective.
We will continue to evaluate, upgrade and enhance our internal controls. Because of inherent limitations, our internal control over financial reporting may not prevent or detect misstatements, errors or omissions, and any projections of any evaluation of effectiveness of internal controls to future periods are subject to the risk that controls may become inadequate because of changes in conditions or that the degree of compliance with our policies or procedures may deteriorate. We cannot be certain in future periods that other control deficiencies that may constitute one or more “significant deficiencies” (as defined by the relevant auditing standards) or material weaknesses in our internal control over financial reporting will not be identified. If we fail to maintain the adequacy of our internal controls, including any failure to implement or difficulty in implementing required new or improved controls, our business and results of operations could be harmed, the results of operations we report could be subject to adjustments, we could fail to be able to provide reasonable assurance as to our financial results or the effectiveness of our internal controls or meet our reporting obligations and there could be a material adverse effect on the price of our securities.
We have expended significant resources in connection with our efforts to comply with the requirements of the Sarbanes-Oxley Act. In future periods, we will likely continue to expend substantial amounts in connection with these compliance efforts and with ongoing evaluation of, and improvements and enhancements to, our internal control over financial reporting. These expenditures may make it difficult for us to control or reduce the growth of our general and administrative and other expenses, which could adversely affect our results of operations and the price of our securities.
Issues arising from our agreements with ICANN and the DOC could harm our registry business.
The U.S. DOC has adopted a plan for the phased transition of the DOC’s responsibilities for the domain name system to ICANN. As part of this transition, as the exclusive registry of domain names within the.comand.netgTLDs, we have entered into agreements with ICANN and with the DOC.
We face risks from the transition of the DOC’s responsibilities for the domain name system to ICANN, including the following:
| • | ICANN could adopt or promote policies, procedures or programs that are unfavorable to us as the registry operator of the.com and.net gTLDs or that are inconsistent with our current or future plans; |
| • | the DOC or ICANN could terminate our agreements to be the registry for the.comor.netgTLDs under the circumstances described elsewhere in this report; |
| • | if the.comand/or.netRegistry Agreements are terminated, it could have a material adverse impact on our business; |
| • | the renewal of the.com Registry Agreement is not approved by the DOC; |
the DOC’s or ICANN’s interpretation of provisions of our agreements with either of them could differ from ours;
the DOC could revoke its recognition of ICANN, as a result of which the DOC could take the place of ICANN for purposes of our agreements with ICANN, and could take actions that are harmful to us and could disrupt current or future business plans;
the U.S. Government could refuse to transfer certain responsibilities for domain name system administration to ICANN due to security, stability or other reasons, resulting in fragmentation or other instability in domain name system administration; and
our registry business could face legal or other challenges resulting from our activities or the activities of registrars and registrants.
Challenges to ongoing privatization of Internet administration could harm our domain name registry business.
Risks we face from challenges by third parties, including governmental authorities in the United States and other countries, to our role in the ongoing privatization of the Internet include:
legal, regulatory or other challenges could be brought, including challenges to the agreements governing our relationship with the DOC or ICANN, or to the legal authority underlying the roles and actions of the DOC, ICANN or us;
the U.S. Congress could take action that is unfavorable to us;
ICANN could fail to maintain its role, potentially resulting in instability in domain name system administration; and
some governments and governmental authorities outside the United States have in the past disagreed with, and may in the future disagree with, the actions, policies or programs of ICANN, the U.S. Government and us relating to the domain name system. These foreign governments or governmental authorities may take actions or adopt policies or programs that are harmful to our business.
As a result of these and other risks, it may be difficult for us to introduce new services in our domain name registry business and we could also be subject to additional restrictions on how this business is conducted.
We rely on third parties who maintain and control root zone servers and route Internet communications.
We currently administer and operate only two of the thirteen root zone servers. The others are administered and operated by independent operators on a non-regulated basis. Because of the importance to the functioning of the Internet of these root zone servers, our registry services business could be harmed if these independent operators fail to maintain these servers properly or abandon these servers, which would place additional capacity demands on the two root zone servers we operate.
Further, our registry services business could be harmed if any of these volunteer operators fail to include or provide accessibility to the data that it maintains in the root zone servers that it controls. In the event and to the extent that ICANN is authorized to set policy with regard to an authoritative root server system, as provided in our registry agreement with ICANN, it is required to ensure that the authoritative root will point to the top-level domain zone servers designated by us. If ICANN does not do this, our business could be harmed.
Undetected or unknown defects in our services could harm our business and future operating results.
Services as complex as those we offer or develop frequently contain undetected defects or errors. Despite testing, defects or errors may occur in our existing or new services, which could result in loss of or delay in revenues, loss of market share, failure to achieve market acceptance, diversion of development resources, injury to our reputation, tort or warranty claims, increased insurance costs or increased service and warranty costs, any of which could harm our business. The performance of our services could have unforeseen or unknown adverse effects on the networks over which they are delivered as well as on third-party applications and services that utilize our services, which could result in legal claims against us, harming our business. Furthermore, we often provide implementation, customization, consulting and other technical services in connection with the implementation and ongoing maintenance of our services, which typically involves working with sophisticated
software, computing and communications systems. Our failure or inability to manage pastmeet customer expectations in a timely manner could also result in loss of or delay in revenues, loss of market share, failure to achieve market acceptance, injury to our reputation and future growthincreased costs.
If we encounter system interruptions, we could be exposed to liability and our reputation and business could suffer.
We depend on the uninterrupted operation of our various systems, secure data centers and other computer and communication networks. Our systems and operations are vulnerable to damage or interruption from:
power loss, transmission cable cuts and other telecommunications failures;
damage or interruption caused by fire, earthquake, and other natural disasters;
computer viruses or software defects; and
physical or electronic break-ins, sabotage, intentional acts of vandalism, terrorist attacks and other events beyond our control.
Most of our systems are located at, and most of our customer information is stored in, our facilities in Mountain View, California and Kawasaki, Japan, both of which are susceptible to earthquakes; Providence, Rhode Island; Dulles, Virginia; Lacey, Washington; Overland Park, Kansas, Melbourne, Australia and Berlin, Hamburg and Verl, Germany. Any damage or failure that causes interruptions in any of these facilities or our other computer and communications systems could materially harm our business. Although we carry insurance for property damage and business interruption, we do not carry insurance or financial reserves for interruptions or potential losses arising from earthquakes or terrorism.
In addition, our ability to issue digital certificates, our domain name registry services and other of our services depend on the efficient operation of the Internet connections from customers to our secure data centers and from our customers to the shared registration system. These connections depend upon the efficient operation of Internet service providers and Internet backbone service providers, all of which have had periodic operational problems or experienced outages in the past.
A failure in the operation of our domain name zone servers, the domain name root servers, or other events could result in the deletion of one or more domain names from the Internet for a period of time. A failure in the operation of our shared registration system could result in the inability of one or more other registrars to register and maintain domain names for a period of time. A failure in the operation or update of the master database that we maintain could result in the deletion of one or more top-level domains from the Internet and the discontinuation of second-level domain names in those top-level domains for a period of time. Any of these problems or outages could decrease customer satisfaction, which could harm our business.
If we experience security breaches, we could be exposed to liability and our reputation and business could suffer.
We retain certain confidential customer information in our secure data centers and various registration systems. It is critical to our business strategy that our facilities and infrastructure remain secure and are perceived by the marketplace to be secure. Our domain name registry operations also depend on our ability to maintain our computer and telecommunications equipment in effective working order and to reasonably protect our systems against interruption, and potentially depend on protection by other registrars in the shared registration system. The root zone servers and top-level domain name zone servers that we operate are critical hardware to our registry services operations. Therefore, we may have to expend significant time and money to maintain or increase the security of our facilities and infrastructure.
Despite our security measures, our infrastructure may be vulnerable to physical break-ins, computer viruses, attacks by hackers or similar disruptive problems. It is possible that we may have to expend additional financial
and other resources to address such problems. Any physical or electronic break-in or other security breach or compromise of the information stored at our secure data centers and domain name registration systems may jeopardize the security of information stored on our premises or in the computer systems and networks of our customers. In such an event, we could face significant liability and customers could be reluctant to use our services. Such an occurrence could also result in adverse publicity and therefore adversely affect the market’s perception of the security of electronic commerce and communications over IP networks as well as of the security or reliability of our services.
The reliance of our network connectivity and interoperability services and content services on third-party communications infrastructure, hardware and software exposes us to a variety of risks we cannot control.
The success of our network connectivity and interoperability services and content services depends on our network infrastructure, including the capacity leased from telecommunications suppliers. In particular, we rely on AT&T, Sprint and other telecommunications providers for leased long-haul and local loop transmission capacity. These companies provide the dedicated links that connect our network components to each other and to our customers. Our business also depends upon the capacity, reliability and security of the infrastructure owned by third parties that is used to connect telephone calls. Specifically, we currently lease capacity from regional providers on four of the fourteen mated pairs of SS7 signal transfer points that comprise our network.
We have no control over the operation, quality or maintenance of a significant portion of that infrastructure or whether or not those third parties will upgrade or improve their equipment. We depend on these companies to maintain the operational integrity of our connections. If one or more of these companies is unable or unwilling to supply or expand its levels of service to us in the future, our operations could be severely interrupted. In addition, rapid changes in the telecommunications industry have led to the merging of many companies. These mergers may cause the availability, pricing and quality of the services we use to vary and could cause the length of time it takes to deliver the services that we use to increase significantly.
Our signaling and SS7 services rely on links, equipment and software provided to us from our vendors, the most important of which are gateway equipment and software from Tekelec and Agilent Technologies, Inc. We cannot assure you that we will be able to continue to purchase equipment from these vendors on acceptable terms, if at all. If we are unable to maintain current purchasing terms or ensure product availability with these vendors, we may lose customers and experience an increase in costs in seeking alternative suppliers of products and services.
We rely on our intellectual property, and any failure by us to protect, or any misappropriation of, our intellectual property could harm our business.
Between December 31, 1995Our success depends on our internally developed technologies, patents and December 31, 2004,other intellectual property. Despite our precautions, it may be possible for a third party to copy or otherwise obtain and use our trade secrets or other forms of our intellectual property without authorization. Furthermore, the laws of foreign countries may not protect our proprietary rights in those countries to the same extent U.S. law protects these rights in the United States. In addition, it is possible that others may independently develop substantially equivalent intellectual property. If we grew from 26do not effectively protect our intellectual property, our business could suffer. Additionally, we have filed patent applications with respect to approximately 3,200 employees.certain of our technology in the U.S. Patent and Trademark Office and patent offices outside the United States. Patents may not be awarded with respect to these applications and even if such patents are awarded, such patents may not provide us with sufficient protection of our intellectual property. In the future, we may have to resort to litigation to enforce our intellectual property rights, to protect our trade secrets or to determine the validity and scope of the proprietary rights of others. This was achieved through internaltype of litigation, regardless of its outcome, could result in substantial costs and diversion of management and technical resources.
We also license third-party technology that is used in our products and services to perform key functions. These third-party technology licenses may not continue to be available to us on commercially reasonable terms
or at all. Our business could suffer if we lost the rights to use these technologies. Additionally, another party could claim that the licensed software infringes a patent or other proprietary right. Litigation between the licensor and a third-party or between us and a third-party could lead to royalty obligations for which we are not indemnified or for which indemnification is insufficient, or we may not be able to obtain any additional license on commercially reasonable terms or at all. The loss of, or our inability to obtain or maintain, any of these technology licenses could delay the introduction of our Internet infrastructure services until equivalent technology, if available, is identified, licensed and integrated. This could harm our business.
We could become subject to claims of infringement of intellectual property of others, which could be costly to defend and which could harm our business.
Claims relating to infringement of intellectual property of others or other similar claims have been made against us in the past and could be made against us in the future. In addition, we provide links to news content as part of our real-time publisher service. It is possible that we could become subject to additional claims for infringement of the intellectual property of third parties. Any claims, with or without merit, could be time-consuming, result in costly litigation and diversion of technical and management personnel, cause delays or require us to develop non-infringing technology or enter into royalty or licensing agreements. Royalty or licensing agreements, if required, may not be available on acceptable terms or at all. If a successful claim of infringement were made against us, we could be required to pay damages or have portions of our business enjoined. If we could not develop non-infringing technology or license the infringed or similar technology on a timely and cost-effective basis, our business could be harmed.
In addition, legal standards relating to the validity, enforceability, and scope of protection of intellectual property rights in Internet-related businesses are uncertain and still evolving. Because of the growth as well as acquisitions. During this time period, we opened new sales officesof the Internet and significantly expanded ourInternet-related businesses, patent applications are continuously and simultaneously being filed in connection with Internet-related technology. There are a significant number of U.S. and non-U.S. operations. To successfully manage past growthforeign patents and any future growth,patent applications in our areas of interest, and we will needbelieve that there has been, and is likely to continue to implementbe, significant litigation in the industry regarding patent and other intellectual property rights.
We must establish and maintain strategic and other relationships.
One of our significant business strategies has been to enter into strategic or other similar collaborative relationships in order to reach a larger customer base than we could reach through our direct sales and marketing efforts. We may need to enter into additional managementrelationships to execute our business plan. We may not be able to enter into additional, or maintain our existing, strategic relationships on commercially reasonable terms. If we fail to enter into additional relationships, we would have to devote substantially more resources to the distribution, sale and marketing of our information systems,and security services than we would otherwise. Our success in obtaining results from these relationships will depend both on the ultimate success of the other parties to these relationships and on the ability of these parties to market our services successfully.
Furthermore, our ability to achieve future growth will also depend on our ability to continue to establish direct seller channels and to develop multiple distribution channels. Failure of one or more of our strategic relationships to result in the development and maintenance of a market for our operating, administrative, financial and accounting systems and controls and maintain close coordination among our executive, engineering, accounting, finance, marketing, sales and operations organizations. Any failure to manage growth effectivelyservices could harm our business. If we are unable to maintain our relationships or to enter into additional relationships, this could harm our business.
We depend on key personnel to manage our business effectively and may not be successful in attracting and retaining such personnel.
We depend on the performance of our senior management team and other key employees. Our success also depends on our ability to attract, integrate, train, retain and motivate these individuals and additional highly skilled technical and sales and marketing personnel, both in the United States and abroad. In addition, our
stringent hiring practices for some of our key personnel, which consist of background checks into prospective employees’ criminal and financial histories, further limit the number of qualified persons for these positions.
We have no employment agreements with any of our key executives that prevent them from leaving VeriSign at any time. In addition, we do not maintain key person life insurance for any of our officers or key employees. The loss of the services of any of our senior management team or other key employees or failure to attract, integrate, train, retain and motivate additional key employees could harm our business.
Compliance with rules and regulations concerning corporate governance is costly and could harm our business.
Ongoing compliance with the corporate governance requirements of the Sarbanes-Oxley Act and the NASDAQ Stock Market has increased the scope, complexity and cost of our corporate governance, reporting and disclosure practices, and our compliance efforts have required significant management attention. It is more difficult and more expensive for us to obtain director and officer liability insurance, and we have been required to accept reduced coverage and incur substantially higher costs to obtain the reduced level of coverage. Further, our board members, chief executive officer and chief financial officer face an increased risk of personal liability in connection with the performance of their duties. As a result, we may have difficulty attracting and retaining qualified board members and executive officers, which could harm our business.
We have anti-takeover protections that may delay or prevent a change in control that could benefit our stockholders.
Our amended and restated Certificate of Incorporation and Bylaws contain provisions that could make it more difficult for a third-party to acquire us without the consent of our Board of Directors. These provisions include:
our stockholders may take action only at a meeting and not by written consent;
our board must be given advance notice regarding stockholder-sponsored proposals for consideration at annual meetings and for stockholder nominations for the election of directors;
| • | vacancies on our board may be filled until the next annual meeting of stockholdersonly by majority vote of the directors then in office; and |
special meetings of our stockholders may be called only by the chief executive officer, the president or the board, and not by our stockholders.
VeriSign has also adopted a stockholder rights plan that may discourage, delay or prevent a change of control and make any future unsolicited acquisition attempt more difficult. Under the rights plan:
The rights will become exercisable only upon the occurrence of certain events specified in the plan, including the acquisition of 20% of VeriSign’s outstanding common stock by a person or group.
Each right entitles the holder, other than an “acquiring person,” to acquire shares of VeriSign’s common stock at a 50% discount to the then-prevailing market price.
VeriSign’s Board of Directors may redeem outstanding rights at any time prior to a person becoming an “acquiring person,” at a price of $0.001 per right. Prior to such time, the terms of the rights may be amended by VeriSign’s Board of Directors without the approval of the holders of the rights.
Changes in, or interpretations of, tax rules and regulations may adversely affect our effective tax rates.
We are subject to income taxes in both the United States and numerous foreign jurisdictions. Significant judgment is required in determining our worldwide provision for income taxes. In the ordinary course of our business, there are many transactions and calculations where the ultimate tax determination is uncertain. We are
subject to audit by various tax authorities. Although we believe our tax estimates are reasonable, the final determination of tax audits and any related litigation could be materially different than that which is reflected in historical income tax provisions and accruals. Should additional taxes be assessed as a result of an audit or litigation, an adverse effect on our income tax provision and net income in the period or periods for which that determination is made could result.
Risks relating to the competitive environment in which we operate
The business environment is highly competitive and, if we do not compete effectively, we may suffer price reductions, reduced gross margins and loss of market share.
Competition in Information and Security Services. Our information and security services are targeted at the rapidly evolving market for Internet security services, including network security, authentication validation and secure payment services,validation, which enable secure electronic commerce and communications over wireline and wireless IP networks. The market for information and security services is intensely competitive, subject to rapid change and significantly affected by new product and service introductions and other market activities of industry participants.
Principal competitors generally fall within one of the following categories: (1) companies such as RSA, Security, Inc. (“RSA”)the security division of EMC, and Entrust Technologies, which offer software applications and related digital certificate products that customers operate themselves; (2) companies such as Geo Trust and Digital Signature Trust Company (a subsidiary of Identrus) that primarily offer digital certificate and certification authority, or CA, relatedauthority-related services; and (3) companies focused on providing a bundled offering of products and services; and (4) companies offering competing SSL certificate and other security services, such as BeTrusted.including GoDaddy and other domain name registrars. We also experience competition from a number of smaller companies, and we believe that our primary long-term competitors may not yet have entered the market. Furthermore, Netscape and Microsoft have introduced software products that enable the issuance and management of digital certificates, and we believe that other companies could introduce similar products.
In addition, browser companies that embed our interface technologies or otherwise feature them as a provider of digital certificate products and services in their Web browsers or on their Web sites could also promote our competitors or charge us substantial fees for promotions in the future.
We face competition in our payment services business from companies such as CyberSource, Authorize.Net (a division of Lightbridge) and First Data Corporation among others.
Competition in Managed Security ServicesServices. . Consulting companies or professional services groups of other companies with Internet expertise are current or potential competitors to our managed security services. These companies include large systems integrators and consulting firms, such as Accenture, formerly Andersen Consulting, IBM Global Services, Getronics and Lucent NetCare. We also compete with security product companies that offer managed security services in addition to other security services, such as Symantec and ISS, as well as a number of providers such as Ubizen and RedSirenBT Counterpane that offer managed security services exclusively.services. Telecommunications providers, such as MCI which recently acquired NetSec,Verizon Business, a provider of managed security services, are also potential competitors. In addition, we compete with some companies that have developed products that automate the management of IP addresses and name maps throughout enterprise-wide intranets, and with companies with internally developed systems integration efforts.
Competition in Real-Time Publisher Services. We face competition from various smaller companies providing similar services.
Competition in Digital Brand Management Services. We face competition from companies providing services similar to some of our Digital Brand Management Services. In the monitoring services, registration and domain name asset management area of our business, our competition comes primarily from ICANN accredited registrars and various smaller companies providing similar services.
Competition in Communications Services. The market for communications services is extremely competitive and subject to significant pricing pressure. Competition in this area arises from two primary sources.
Incumbent carriers provide competing in-house services in their respective regions. In addition, we face direct competition on a nationwide basis from national, unregulated companies, including Syniverse Technologies, Telcordia, NeuStar and other carriers such as Southern New England Telephone Diversified Group, a unit of SBC Communications.AT&T. Furthermore, customers are increasingly likely to deploy internally developed communications technologies and services which may reduce the demand for technologies and services from third party providers, such as VeriSign, and further increase competitive pricing pressures.
Competition in Commerce Services. Our wireless billing and payment services are also are subject to competition from providers such as Comverse, Amdocs, Convergys Corporation and Boston Communications Group, Amdocs, and Convergys Corporation.Group. We are also aware of major Internet service providers, software developers and smaller entrepreneurial companies that are or may in the future be focusing significant resources on developing and marketing products and services that may compete directly with ours. Furthermore, customers are increasingly likely to deploy internally developed communications technologies and services which may reduce the demand for technologies and services from third partythird-party providers such as VeriSign and further increase competitive pricing pressures.
Competition in Mobile Content Services. The market for mobile content services is extremely competitive. Competitors include developers of content and entertainment products and services in a variety of domestic and international markets, such as Infospace, Itouch, Wisdom Entertainment, Arvato mobile, Monstermob, and Buongiorno/Vitaminic.Motricity. This business also faces competition from mobile network operators such as Cingular, Verizon Wireless, Sprint Nextel Corporation, T-Mobile, Vodafone, O2, Orange, E-Plus and Telefónica, as well as Internet portal operators such as Yahoo!, AOL, T-Online and Google. Additional competitors are handset manufacturers such as Nokia and software providers such as Microsoft.Microsoft and Apple. As the market for wireless data, including information and entertainment and information productsdata, matures, new categories of competitors, such as mobile phone companies, broadcasters, music publishers, other content providers or others may beginhave begun to develop competing products or services.
Competition in RegistryNaming Services. ICANN has introduced several registry service providers for new gTLDs that directly compete with the services we provide for the.com and .net gTLDs, as well as with the
ccTLDs offered by us. The gTLDs.biz and.info were launched in 2001 and the gTLDs.name, .pro, .aero, .museum and.coop were launched in 2002 and 2003. Domain names registrations and other services within these gTLDs are available through ICANN accredited registrars. In addition, we currentlyWe face competition in the domain name registry space from the over 240other gTLD and ccTLD registry operators who compete directlyregistries that are competing for the business of entities and individuals that are seeking to establish a Web presence.presence, including registries offering services related to the.info, .org, .mobi, .biz, .name, .pro, .aero, .museum and .coop gTLDs and registries offering services related to ccTLDs. There are currently 16 gTLD registries and over 240 ccTLD registries.
We also face competition from service providers that offer outsourced domain name registration, resolutions and other DNS services to organizations that require a reliable and scalable infrastructure. Among the competitors are UltraDNS, NeuLevel, Affilias, Register.com Afilias, Register.comand Tucows.com.
Competition in Digital Brand Management Services. We face competition from companies providing services similar to some of our Digital Brand Management Services. In the monitoring services, registration and domain name asset management area of our business, our competition comes primarily from ICANN accredited registrars and various smaller companies providing similar services.
Several of our current and potential competitors have longer operating histories and significantly greater financial, technical, marketing and other resources than we do and therefore may be able to respond more quickly than we can to new or changing opportunities, technologies, standards and customer requirements. Many of these competitors also have broader and more established distribution channels that may be used to deliver competing products or services directly to customers through bundling or other means. If such competitors were to bundle competing products or services for their customers, the demand for our products and services might be substantially reduced and the ability to distribute our products successfully and the utilization of our services would be substantially diminished. New technologies and the expansion of existing technologies may increase the competitive pressure.
New technologies and the expansion of existing technologies may increase competitive pressure. We cannot assure you that competing technologies developed by others or the emergence of new industry standards will not adversely affect our competitive position or render our security services or technologies noncompetitive or obsolete. In addition, our markets are characterized by announcements of collaborative relationships involving our competitors. The existence or announcement of any such relationships could adversely affect our ability to attract and retain customers. As a result of the foregoing and other factors, we may not be able to compete effectively with current or future competitors, and competitive pressures that we face could materially harm our business.
Our inability to react to changes in our industry and successfully introduce new products and services could harm our business.
The Internet and communications network services industry are characterized by rapid technological change and frequent new product and service announcements which require us continually to improve the performance, features and reliability of our services, particularly in response to competitive offerings. In order to remain competitive and retain our market share, we must continually improve our access technology and software, support the latest transmission technologies, and adapt our products and services to changing market conditions and customer preferences.
We cannot assure you that we will be able to adapt to these challenges or respond successfully or in a cost-effective way to adequately meet them. Our failure to do so would adversely affect our ability to compete and retain customers or market share.
Risks related to our divestiture plan
We may face difficulties and incur costs associated with our divestiture plan and our financial condition, results of operations or cash flows could be adversely affected.
Transitioning disposed businesses involves a number of risks, including, but not limited to difficulties separating operations, services, products and personnel; the potential impairment of relationships with our existing customers; the disruption of our business and the potential loss of key employees.
For example, our divestiture plan will require a substantial amount of management, administrative and operational resources. These demands may distract our employees from the day-to-day operation of VeriSign’s core businesses.
There is also risk that we may incur additional charges associated with an impairment of a portion of goodwill and other intangible assets due to changes in market conditions for acquisitions and dispositions. Under generally accepted accounting principles, we are required to evaluate goodwill for impairment on an annual basis, and to re-evaluate goodwill and to evaluate other intangible assets as events or circumstances indicate that such assets may be impaired. Further, we are likely to incur income statement charges to complete the divestiture plan, which could be material.
If we are unable to successfully address any of these risks for future dispositions, our financial condition, results of operations or cash flows could be adversely affected.
We may be unable to achieve some or all of the benefits that we expect will result from the divestiture plan and such benefits may be delayed or not occur at all.
We may not be able to achieve the full strategic and financial benefits we expect from the divestiture of VeriSign’s non-core businesses from our portfolio. For example, we may encounter difficulties identifying buyers for certain businesses or be unable to sell businesses identified for divestiture, and there can be no assurance that analysts and investors will place greater value on VeriSign following the divestiture plan than the value placed on us pre-divestiture.
In addition, there is no guarantee that the planned divestitures will occur or will not be significantly delayed. Completion of the plan of divestiture is subject to a number of factors, including:
business, political and economic conditions in the United States and in other countries in which the Company currently operates;
governmental regulations and policies, actions and approvals of regulatory bodies;
the operating performance of the Company; and
identification of buyers and negotiation of sale agreements.
We may be adversely affected under certain covenants in our bank credit facility.
Our bank credit agreement contains a negative covenant that limits our ability to sell assets and freely deploy the proceeds we receive from such sales, subject to exceptions based on the size and timing of the sales. Therefore, depending on the size and timing of any dispositions that we decide to pursue as part of our divestiture plan, we may find it necessary to seek an amendment to our credit agreement or to structure the sales in a manner that complies with the covenant but that is potentially less favorable to the Company than would otherwise be the case. There can be no guarantee that we will be successful in obtaining any such amendment on acceptable terms or at all or be able to structure potential dispositions accordingly.
We may continue to be responsible for a portion of our contingent and other corporate liabilities following the divestiture of certain businesses.
It is possible that under the agreements reached with buyers for businesses divested under the plan, we may remain liable for certain contingent and corporate liabilities. There is a possibility that we will incur costs and expenses associated with the management of these contingent and other corporate liabilities. These contingent and other corporate liabilities could potentially relate to consolidated securities litigation, as well as actions brought by third parties as a result of the divestiture plan. Where responsibility for such liabilities is to be shared with the buyer, it is possible that the buyer or another party may be in default for payments for which they are responsible, obligating us to pay amounts in excess of our agreed-upon share of the assumed obligations.
Completion of the divestiture plan may restrict our ability to compete in certain market sectors.
It is possible that under the agreements reached with buyers for businesses divested under the plan, we will be restricted from competing, either directly or indirectly, with those businesses or from entering certain market sectors for a defined period of time pursuant to negotiated non-compete arrangements.
Risks related to our securities
We have a considerable number of common shares subject to future issuance.
As of December 31, 2007, we had one billion authorized common shares, of which 222.8 million shares were outstanding. In addition approximately, 46.6 million common shares were reserved for issuance pursuant to employee stock option and employee stock purchase plans (“Equity Plans”), and approximately 36.4 million shares were reserved for issuance upon conversion or repurchase of the 3.25% junior subordinated convertible debentures due 2037. The availability of substantial amounts of our common stock resulting from the exercise or settlement of equity awards outstanding under our Equity Plans or the conversion or repurchase of debentures using common stock, which would be dilutive to existing security holders, could adversely affect the prevailing market price of our common stock and could impair our ability to raise additional capital through the sale of equity securities.
We have not historically maintained substantial levels of indebtedness, and our financial condition and results of operations could be adversely affected if we do not effectively manage our liabilities.
As a result of the sale of the $1.25 billion principal amount of 3.25% junior subordinated convertible debentures, we have a substantially greater amount of long term debt than we have maintained in the past. In addition to the debentures, we have a revolving credit facility with a borrowing capacity of $500 million. While we currently have no outstanding borrowings under our credit facility, its availability allows us immediate access
to working capital if we identify opportunities for the use of this cash. Our maintenance of substantial levels of
debt could adversely affect our flexibility to take advantage of corporate opportunities and could adversely affect our financial condition and results of operations.
We may not have the ability to repurchase the debentures in cash upon the occurrence of a fundamental change, or to pay cash upon the conversion of debentures, as required by the indenture governing the 3.25% junior subordinated convertible debentures.
Holders of our outstanding 3.25% junior subordinated convertible debentures will have the right to require us to repurchase the debentures upon the occurrence of a fundamental change as defined in the Indenture dated as of August 20, 2007 (the “Indenture”). Although we currently have the intent and the ability to settle the principal amount of the convertible debentures in cash as required under the Indenture, we may not have sufficient funds to repurchase the debentures in cash or to make the required repayment at such time or have the ability to arrange necessary financing on acceptable terms. In addition, upon conversion of the debentures, we will be required to make cash payments to the holders of the debentures equal to the lesser of the principal amount of the debentures being converted and the conversion value of those debentures. Such payments could be significant, and we may not have sufficient funds to make them at such time.
A fundamental change may also constitute an event of default or prepayment under, or result in the acceleration of the maturity of, our then-existing indebtedness. Our ability to repurchase the debentures in cash or make any other required payments may be limited by law or the terms of other agreements relating to our indebtedness outstanding at the time. Our failure to repurchase the debentures or pay cash in respect of conversions when required would result in an event of default with respect to the debentures.
While we currently have the intent and ability to settle the principal in cash, if we conclude that we no longer have the ability, in the future, we will be required to change our accounting policy for earnings per share from the treasury stock method to the if-converted method.
There may be potential new accounting pronouncements or regulatory rulings which may have an impact on our future financial condition and results of operations.
There may be potential new accounting pronouncements or regulatory rulings, which may have an impact on our future financial condition and results of operations. For example, in August 2007, the Financial Accounting Standards Board (“FASB”) issued for comment, the proposed FASB Staff Position (“FSP”) No. APB 14-a (“FSP APB 14-a”), “Accounting for Convertible Debt Instruments that May be Settled in Cash upon Conversion (Including Partial Cash Settlement),” that would significantly affect the accounting for convertible debt. Our 3.25% convertible debentures due 2037 would be affected by this proposed FSP. The proposed FSP would require the issuer to separately account for the liability and equity components of the instrument in a manner that reflects the issuer’s economic interest cost. Further, the proposed FSP would require bifurcation of a component of the debt, classification of that component as equity, and then accretion of the resulting discount on the debt to result in the “economic interest cost” being reflected in the consolidated statement of income. In applying this FSP, the FASB emphasized that the FSP would be applied to the terms of the instruments as they existed for the time periods they existed, therefore, the application of the FSP would be applied retrospectively to all periods presented. If the FSP is approved, it is expected to be effective for fiscal years beginning after December 15, 2007, and will require retrospective application. The Company would be required to implement the proposed standard during the first quarter of 2008, which begins on January 1, 2008. Although FSP APB 14-a would have no impact on our actual past or future cash flows, it would require us to record a significant amount of non-cash interest expense as the debt discount is amortized. In addition, if our convertible debt is redeemed or converted prior to maturity, any unamortized debt discount would result in a loss on extinguishment. As a result, there could be a material adverse impact on our results of operations and earnings per share. These impacts could adversely affect the trading price of our common stock and in turn negatively impact the trading price of the debentures.
See Note 10, “Junior Subordinated Convertible Debentures,” of our Notes to Consolidated Financial Statements for further information.
Certain other risks
Our communications services business depends in part on the acceptance of our SS7 network and the telecommunications market’sindustry’s continuing use of SS7 technology.
Our future growth in our communications services business depends, in part, on the commercial success and reliability of our SS7 network. Our SS7 network is a vital component of our intelligent network services which hadand has been a significant source of revenues for our Communications Services Group. Our communications services business will suffer if our target customers do not use our SS7 network. Our future financial performance will also depend on the successful development, introduction and customer acceptance of new and enhanced SS7-based services. We are not certain that our target customers will choose our particular SS7 network solution or continue to use our SS7 network. In the future, we may not be successful in marketing our SS7 network or any new or enhanced services.
The inability of our customers to successfully implement our signaling and network services with their existing systems could adversely affect our business.
Significant technical challenges exist in our signaling and network services business because many of our customers:
purchase and implement SS7 network services in phases;
integrate our SS7 network with a number of legacy systems, third-party software applications and engineering tools.
Customer implementation currently requires participation by our order management and our engineering and operations groups, each of which has limited resources. Some customers may also require us to develop costly customized features or capabilities, which increaseincreases our costs and consumeconsumes a disproportionate share of our limited customer service and support resources. Also, we typically charge one-time flat rate fees for initially connecting a customer to our SS7 network and a monthly recurring flat rate fee after the connection is established. If new or existing customers have difficulty deploying our products or require significant amounts of our engineering service support, we may experience reduced operating margins. Our customers’ ability to deploy our network services to their own customers and integrate them successfully within their systems depends on our customers’ capabilities and the complexity involved. Difficulty in deploying those services could reduce our operating margins due to increased customer support and could cause potential delays in recognizing revenues until the services are implemented.
Our failure to achieve or sustain market acceptance of our communications services at desired pricing levels and industry consolidation could adversely impact our revenues and cash flow.
The telecommunications industry is characterized by significant price competition. Competition and industry consolidation in our communications services could result in significant pricing pressure and an erosion in our market share. Pricing pressure from competition could cause large reductions in the selling price of our services. For example, our competitors may provide customers with reduced communications costs for Internet access or private network services, reducing the overall cost of services and significantly increasing pricing pressures on us. We would need to offset the effects of any price reductions by increasing the number of our customers, generating higher revenues from enhanced services or reducing our costs, and we may not be able to do so successfully. We believe that the business of providing network connectivity and related network services will see increased consolidation in the future. Consolidation could decrease selling prices and increase competition in these industries, which could erode our market share, revenues and operating margins in our Communications Services Group. Consolidation in the telecommunications industry has led to the merging of many companies, including Price Communications, a customer of our Communications Services Group, and there have been recent announcements of proposed mergers involving other of our customers, including AT&T Wireless, MCI and Nextel. Our business could be harmed if these mergers result in the loss of customers by our Communications Services Group. Furthermore, customers may choose to deploy internally developed communications technologies and services thereby reducing the demand for technologies and services we offer which could harm our business.
Our mobile content services business depends on agreements with many different third parties, including wireless carriers, and content providers. If these agreements are terminated or not renewed, this business could be harmed.
Our mobile content services business depends on our ability to enter into and maintain agreements with many different third parties including:
These agreements are typically for a short term, or are otherwise terminable upon short notice, and in the case of agreements with carriers, other mobile phone service providers and content developers, are non-exclusive. If these third parties reduce their commitment to us, terminate their agreements with us or enter into
similar agreements with our competitors, the results of operations of our Communications Services Group could be materially harmed. For example, because we depend on wireless carriers to bill customers for our services, a loss of any of these relationships could prevent us from billing and receiving revenues from customers. This business could also be harmed if we are unable to enter into additional agreements with third parties on commercially reasonable terms.
Our mobile content services business is dependent on third parties offering attractive content and technology on acceptable terms.
Only some of our mobile content services are developed internally. We also receive content, such as ring tones, games and logos from third parties. If the market for mobile entertainment and information continues to develop positively, content providers might try to raise their prices. Some providers insist on charging fixed fees for their content regardless of revenues, so if we fail to achieve anticipated revenues, we would achieve lower margins for our mobile content services. There is no assurance that we will be able to timely purchase content having the requisite quality in the future and on commercially reasonable terms. Should we be unable to acquire attractive content from third parties and on acceptable terms, this could adversely affect our mobile content services business.
Our customer subscription agreements for our mobile content services are typically cancelable and our business could be harmed if significant numbers of customers cancel or fail to renew.
Our mobile content services are typically sold as fixed monthly subscriptions. Our customers for these services may cancel their subscriptions for our service at the end of each monthly service period and in fact, many customers each month elect to do so. We have limited historical data with respect to rates of customer subscription renewals, so we cannot accurately predict customer renewal rates. Our customers’ renewal rates may decline or fluctuate as a result of a number of factors, including their dissatisfaction with the service, pricing pressure, changes in preferences and trends, competitive services or other reasons. If our customers cancel or fail to renew their subscriptions for this service, our revenue could decline and our mobile content services business will suffer.
Our business depends on the continued growth of the Internet and adoption and continued use of IP networks.
Our future success depends, in part, on continued growth in the use of the Internet and IP networks. If the use of and interest in the Internet and IP networks does not grow, our business would be harmed. To date, many businesses and consumers have been deterred from utilizing the Internet and IP networks for a number of reasons, including, but not limited to:
The widespread acceptance of the Internet and IP networks will require a broad acceptance of new methods of conducting business and exchanging information. Organizations that already have invested substantial resources in other methods of conducting business may be reluctant to adopt new methods. Also, individuals with established patterns of purchasing goods and services and effecting payments may be reluctant to change.
A number of states, as well as the U.S. Congress, have been considering various initiatives that could permit sales and use taxes on Internet sales. If any of these initiatives are adopted, it could substantially impair the growth of electronic commerce and therefore hinder the growth in the use of the Internet and IP networks, which could harm our business.
Many of our target markets are evolving, and if these markets fail to develop or if our products and services are not widely accepted in these markets, our business could suffer.
We target our security services at the market for trusted and secure electronic commerce and communications over IP and other networks. As a result of our acquisition of Jamba!, our Communications Services Group is also targeting the consumer market for mobile content services. Our Naming and Directory Services business unit is developing managed services designed to work with the EPCglobal Network and radio frequency identification, or RFID, technology. These are rapidly evolving markets that may not continue to grow. Even if these markets grow, our services may not be widely accepted. Accordingly, the demand for our services is very uncertain. The factors that may affect the level of market acceptance and, consequently, our services include the following:
If the market for electronic commerce and communications over IP and other networks does not grow or these services are not widely accepted in the market, our business would be materially harmed.
Our inability to react to changes in our industry and successfully introduce new products and services could harm our business.
The emerging nature of the Internet, mobile content, digital certificate, domain name registration and payment services markets, and their rapid evolution, require us continually to improve the performance, features and reliability of our services, particularly in response to competitive offerings. In particular, the market for entertainment and information is characterized by changing technology, developing industry standards, changing customer preferences and trends (which also vary from country to country), and the constant introduction of new products and services. In order to remain competitive, we must continually improve our access technology and software, support the latest transmission technologies, and adapt our products and services to changing market conditions and customer preferences. When entertainment products are placed on the market, it is difficult to predict whether they will become popular.
The communications network services industry is also characterized by rapid technological change and frequent new product and service announcements. Significant technological changes could make our technologies obsolete and other changes in our markets, particularly mobile content, could result in some of our other products and services losing market share. Accordingly, we must continually improve the responsiveness, reliability and features of our services and develop new features, services and applications to meet changing
customer needs in our target markets. For example, we sell our SS7 network services primarily to traditional telecommunications companies that rely on traditional voice networks. Many emerging companies are providing convergent Internet protocol-based network services. Our future success could also depend upon our ability to provide products and services to these Internet protocol-based telephony providers, particularly if IP-based telephony becomes widely accepted. We cannot assure that we will be able to adapt to these challenges or respond successfully or in a cost-effective way to adequately meet them. Our failure to do so would adversely affect our ability to compete and retain customers or market share.
New products and services developed or introduced by us may not result in any significant revenues.
We must commit significant resources to develop new products and services before knowing whether our investments will result in products and services the market will accept. The success of new products and services depends on several factors, including proper new definition and timely completion, introduction and market acceptance. For example, our selection in January 2004 by EPCglobal, a not-for-profit standards organization, to operate the Object Naming Service as the root directory for the EPCglobal Network, may not increase our revenues in the foreseeable future. There can be no assurance that we will successfully identify new product and service opportunities, develop and bring new products and services to market in a timely manner, or achieve market acceptance of our products and services, or that products, services and technologies developed by others will not render our products, services or technologies obsolete or noncompetitive. Our inability to successfully market new products and services may harm our business.
Issues arising from our agreements with ICANN and the Department of Commerce could harm our registry business.
The Department of Commerce, or DOC, has adopted a plan for a phased transition of the DOC’s responsibilities for the domain name system to the Internet Corporation for Assigned Names and Numbers, or ICANN. As part of this transition, our registry agreement with ICANN was replaced by three new agreements on May 25, 2001, one for.com, one for.net and one for.org. The term of the.com registry agreement extends until November 10, 2007 with a 4-year renewal option. The term of the.net registry agreement extends until June 30, 2005. Currently the.net registry services are in a competitive bidding process by ICANN. We submitted a bid along with four other bidders. The selection of the next .net registry operator is scheduled to be made in March 2005. The.org registry agreement terminated on December 31, 2002, and the.org registry services were transitioned to a new registry operator selected by ICANN during 2003. We face risks from this transition to ICANN, which include the following:
On August 27, 2004, we filed a lawsuit against ICANN in the Superior Court of the State of California County of Los Angeles. The lawsuit alleges that ICANN overstepped its contractual authority and improperly attempted to regulate our business in violation of ICANN’s charter and its agreements with us. We cannot predict the affect this lawsuit will have on our relationship with ICANN.
Challenges to ongoing privatization of Internet administration could harm our domain name registry business.
Risks we face from challenges by third parties, including other domestic and foreign governmental authorities, to our role in the ongoing privatization of the Internet include:
As a result of these challenges, it may be difficult for us to introduce new services in our domain name registry business and we could also be subject to additional restrictions on how this business is conducted.
If we encounter system interruptions, we could be exposed to liability and our reputation and business could suffer.
We depend on the uninterrupted operation of our various systems, secure data centers and other computer and communication networks. Our systems and operations are vulnerable to damage or interruption from:
Most of our systems are located at, and most of our customer information is stored in, our facilities in Mountain View, California and Kawasaki, Japan, both of which are susceptible to earthquakes, Providence, Rhode Island; Dulles, Virginia; Lacey, Washington; Overland Park, Kansas, Melbourne, Australia and Berlin, Hamburg and Verl, Germany. Any damage or failure that causes interruptions in any of these facilities or our other computer and communications systems could materially harm our business.
In addition, our ability to issue digital certificates, our domain name registry services and other of our services depend on the efficient operation of the Internet connections from customers to our secure data centers and from our customers to the shared registration system. These connections depend upon the efficient operation of Internet service providers and Internet backbone service providers, all of which have had periodic operational problems or experienced outages in the past.
A failure in the operation of our domain name zone servers, the domain name root servers, or other events could result in the deletion of one or more domain names from the Internet for a period of time. A failure in the operation of our shared registration system could result in the inability of one or more other registrars to register and maintain domain names for a period of time. A failure in the operation or update of the master database that we maintain could result in the deletion of one or more top-level domains from the Internet and the discontinuation of second-level domain names in those top-level domains for a period of time. Any of these problems or outages could decrease customer satisfaction, which could harm our business.
If we experience security breaches, we could be exposed to liability and our reputation and business could suffer.
We retain certain confidential customer information in our secure data centers and various registration systems. It is critical to our business strategy that our facilities and infrastructure remain secure and are perceived by the marketplace to be secure. Our domain name registry operations also depend on our ability to maintain our computer and telecommunications equipment in effective working order and to reasonably protect our systems against interruption, and potentially depend on protection by other registrars in the shared registration system. The root zone servers and top-level domain name zone servers that we operate are critical hardware to our registry services operations. Therefore, we may have to expend significant time and money to maintain or increase the security of our facilities and infrastructure.
Despite our security measures, our infrastructure may be vulnerable to physical break-ins, computer viruses, and attacks by hackers or similar disruptive problems. It is possible that we may have to expend additional financial and other resources to address such problems. Any physical or electronic break-in or other security breach or compromise of the information stored at our secure data centers and domain name registration systems may jeopardize the security of information stored on our premises or in the computer systems and networks of our customers. In such an event, we could face significant liability and customers could be reluctant to use our services. Such an occurrence could also result in adverse publicity and therefore, adversely affect the market’s perception of the security of electronic commerce and communications over IP networks as well as of the security or reliability of our services.
The reliance of our network connectivity and interoperability services and mobile content services on third-party communications infrastructure, hardware and software exposes us to a variety of risks we cannot control.
The success of our network connectivity and interoperability services and mobile content services depends on our network infrastructure, including the capacity leased from telecommunications suppliers. In particular, we rely on AT&T, MCI, Sprint and other telecommunications providers for leased long-haul and local loop transmission capacity. These companies provide the dedicated links that connect our network components to each other and to our customers. Our business also depends upon the capacity, reliability and security of the infrastructure owned by third parties that is used to connect telephone calls. Specifically, we currently lease capacity from regional providers on six of the 16 mated pairs of SS7 signal transfer points that comprise our network.
We have no control over the operation, quality or maintenance of a significant portion of that infrastructure or whether or not those third parties will upgrade or improve their equipment. We depend on these companies to maintain the operational integrity of our connections. If one or more of these companies is unable or unwilling to supply or expand its levels of service to us in the future, our operations could be severely interrupted. In addition, rapid changes in the telecommunications industry have led to the merging of many companies. These mergers may cause the availability, pricing and quality of the services we use to vary and could cause the length of time it takes to deliver the services that we use to increase significantly.
Our signaling and SS7 services rely on links, equipment and software provided to us from our vendors, the most important of which are gateway equipment and software from Tekelec and Agilent Technologies, Inc. We
cannot assure you that we will be able to continue to purchase equipment from these vendors on acceptable terms, if at all. If we are unable to maintain current purchasing terms or ensure product availability with these vendors, we may lose customers and experience an increase in costs in seeking alternative suppliers of products and services.
Capacity limits on our technology and network hardware and software may be difficult to project and we may not be able to expand and upgrade our systems to meet increased use.
If traffic from our telecommunication and mobile content customers through our network increases, we will need to expand and upgrade our technology and network hardware and software. We may not be able to expand and upgrade, in a timely manner, our systems and network hardware and software capabilities to accommodate increased traffic on our network. If we do not appropriately expand and upgrade our systems and network hardware and software, we may lose customers and revenues.
We rely on third parties who maintain and control root zone servers and route Internet communications.
We currently administer and operate only two of the 13 root zone servers. The others are administered and operated by independent operators on a volunteer basis. Because of the importance to the functioning of the Internet of these root zone servers, our registry services business could be harmed if these volunteer operators fail to maintain these servers properly or abandon these servers, which would place additional capacity demands on the two root zone servers we operate.
Further, our registry services business could be harmed if any of these volunteer operators fail to include or provide accessibility to the data that it maintains in the root zone servers that it controls. In the event and to the extent that ICANN is authorized to set policy with regard to an authoritative root server system, as provided in our registry agreement with ICANN, it is required to ensure that the authoritative root will point to the top-level domain zone servers designated by us. If ICANN does not do this, our business could be harmed.
Undetected or unknown defects in our services could harm our business and future operating results.
Services as complex as those we offer or develop frequently contain undetected defects or errors. Despite testing, defects or errors may occur in our existing or new services, which could result in loss of or delay in revenues, loss of market share, failure to achieve market acceptance, diversion of development resources, injury to our reputation, tort or warranty claims, increased insurance costs or increased service and warranty costs, any of which could harm our business. The performance of our services could have unforeseen or unknown adverse effects on the networks over which they are delivered as well as on third-party applications and services that utilize our services, which could result in legal claims against us, harming our business. Furthermore, we often provide implementation, customization, consulting and other technical services in connection with the implementation and ongoing maintenance of our services, which typically involves working with sophisticated software, computing and communications systems. Our failure or inability to meet customer expectations in a timely manner could also result in loss of or delay in revenues, loss of market share, failure to achieve market acceptance, injury to our reputation and increased costs.
Services offered by our Internet Services Group rely on public key cryptography technology that may compromise our system’s security.
Services offered by our Internet Services Group depend on public key cryptography technology. With public key cryptography technology, a user is given a public key and a private key, both of which are required to perform encryption and decryption operations. The security afforded by this technology depends on the integrity of a user’s private key and that it is not lost, stolen or otherwise compromised. The integrity of private keys also depends in part on the application of specific mathematical principles known as “factoring.” This integrity is predicated on the assumption that the factoring of large numbers into their prime number components is difficult.
Should an easy factoring method be developed, the security of encryption products utilizing public key cryptography technology would be reduced or eliminated. Furthermore, any significant advance in techniques for attacking cryptographic systems could also render some or all of our existing PKI services obsolete or unmarketable. If improved techniques for attacking cryptographic systems were ever developed, we would likely have to reissue digital certificates to some or all of our customers, which could damage our reputation and brand or otherwise harm our business. In the past there have been public announcements of the successful attack upon cryptographic keys of certain kinds and lengths and of the potential misappropriation of private keys and other activation data. This type of publicity could also hurt the public perception as to the safety of the public key cryptography technology included in our digital certificates. This negative public perception could harm our business.
Some ofOur content services business depends on agreements with many different third parties, including wireless carriers and content providers. If these agreements are terminated or not renewed, or are amended to require us to change the way our securitycontent services have lengthy sales and implementation cycles.are offered to customers, our business could be harmed.
We marketOur content services business depends on our ability to enter into and maintain agreements with many of our security services directly to large companies and government agencies and we market our communications services to large telecommunication carriers. The sale and implementation of our services to these entities typically involves a lengthy education process and a significant technical evaluation and commitment of capitaldifferent third parties including wireless carriers and other resources. This processmobile phone service providers, upon which this business is also subjecthighly dependent for billing its customers.
These agreements are typically for a short term, or are otherwise terminable upon short notice, and in the case of agreements with carriers, other mobile phone service providers and content developers, are non-exclusive. If these third parties reduce their commitment to the risk of delays associatedus, terminate their agreements with customers’ internal budgeting and other procedures for approving large capital expenditures, deploying new technologies within their networks and testing and accepting new technologies that affect key operations. As a result, the sales and implementation cycles associatedus or enter into similar agreements with certain of our competitors, our content services can be lengthy, potentially lasting from three to nine months. Our quarterly and annual operating resultsbusiness could be materially harmed if orders forecasted for a specific customer for a particular quarter are not realized.harmed.
Failure of VeriSign Affiliates to follow our security and trust practices or to maintain the privacy or security of confidential customer information could have an adverse impact on our revenues and business.
We have licensed to VeriSign Affiliates our Processing Center platform, which is designed to replicate our own secure data centers and allows the affiliateVeriSign Affiliate to offer back-end processing of PKI services for enterprises. The VeriSign Processing Center platform provides a VeriSign Affiliate with the knowledge and technology to offer PKI services similar to those offered by us. It is critical to our business strategy that the facilities and infrastructure used in issuing and marketing digital certificates remain secure and we are perceived by the marketplace to be secure. Although we provide the VeriSign Affiliate with training in security and trust practices, network management and customer service and support, these practices are performed by the affiliate and are outside of our control. Any failure of a VeriSign Affiliate to maintain the privacy or security of confidential customer information could result in negative publicity and therefore adversely affect the market’s perception of the security of our services as well as the security of electronic commerce and communication over IP networks generally.
We rely on our intellectual property, and any failure by us to protect, or any misappropriationMany of our intellectual property could harmtarget markets are evolving, and if these markets fail to develop or if our business.
Our success depends on our internally developed technologies, patentsproducts and other intellectual property. Despite our precautions, it may be possible for a third party to copy or otherwise obtain and use our trade secrets or other forms of our intellectual property without authorization. Furthermore, the laws of foreign countries mayservices are not protect our proprietary rightswidely accepted in those countries to the same extent U.S. law protects these rights in the United States. In addition, it is possible that others may independently develop substantially equivalent intellectual property. If we do not effectively protect our intellectual property,markets, our business could suffer. In the future, we may have to resort to litigation to enforce our intellectual property rights, to protect our trade secrets or to determine the validity and scope of the proprietary rights of others. This type of litigation, regardless of its outcome, could result in substantial costs and diversion of management and technical resources.
We also license third-partytarget our information and security services at the market for trusted and secure electronic commerce and communications over IP and other networks. Our Naming Services business unit is developing managed services designed to work with the EPCglobal Network and RFID, technology, that is used in our products andpoint-of-sale data services to perform key functions.and
real-time publisher services. These third-party technology licensesare rapidly evolving markets that may not continue to be available to us on commercially reasonable terms
or at all. Our business could suffergrow. Even if we lost the rights to use these technologies. A third-party could claim that the licensed software infringes a patent or other proprietary right. Litigation between the licensor and a third-party or between us and a third-party could lead to royalty obligations for which we are not indemnified or for which indemnification is insufficient, or wemarkets grow, our services may not be able to obtain any additional license on commercially reasonable terms or at all.widely accepted. Accordingly, the demand for our services is very uncertain. The lossfactors that may affect market acceptance of or our inability to obtain or maintain, anyservices include the following:
market acceptance of these technology licenses could delay products and services based upon technologies other than those we use;
public perception of the security of our technologies and of IP and other networks;
the introduction and consumer acceptance of ournew generations of mobile handsets;
demand for supply chain information services, including acceptance of RFID technology, the EPCglobal Network and point-of-sale data services;
the ability of the Internet infrastructure services until equivalent technology, if available, is identified, licensedto accommodate increased levels of usage; and integrated. This could harm our business.
government regulations affecting electronic commerce and communications over IP networks.
We could become subject to claims of infringement of intellectual property of others, which could be costly to defendIf the market for electronic commerce and which could harm our business.
Claims relating to infringement of intellectual property of otherscommunications over IP and other networks does not grow or other similar claims have been made against usthese services are not widely accepted in the past and could be made against us in the future. In addition, we use content such as music, games and logos, as part of our mobile content services. It is possible that we could become subject to additional claims for infringement of the intellectual property of third parties. Any claims, with or without merit, could be time-consuming, result in costly litigation and diversion of technical and management personnel, cause delays or require us to develop non-infringing technology or enter into royalty or licensing agreements. Royalty or licensing agreements, if required, may not be available on acceptable terms or at all. If a successful claim of infringement were made against us, we could be required to pay damages or have portions ofmarket, our business enjoined. If we could not develop non-infringing technology or license the infringed or similar technology on a timely and cost-effective basis, our business couldwould be materially harmed.
| ITEM 1B. | UNRESOLVED STAFF COMMENTS |
In addition, legal standards relating to the validity, enforceability, and scope of protection of intellectual property rights in Internet-related businesses are uncertain and still evolving. Because of the growth of the Internet and Internet-related businesses, patent applications are continuously and simultaneously being filed in connection with Internet-related technology. There are a significant number of U.S. and foreign patents and patent applications in our areas of interest, and we believe that there has been, and is likely to continue to be, significant litigation in the industry regarding patent and other intellectual property rights. For example, we had complaints filed against us in February 2001, September 2001 and June 2003 alleging patent infringement.
None.
We must establish and maintain strategic and other relationships.
One of our significant business strategies has been to enter into strategic or other similar collaborative relationships in order to reach a larger customer base than we could reach through our direct sales and marketing efforts. We may need to enter into additional relationships to execute our business plan. We may not be able to enter into additional, or maintain our existing, strategic relationships on commercially reasonable terms. If we fail to enter into additional relationships, we would have to devote substantially more resources to the distribution, sale and marketing of our security services and communications services than we would otherwise.
Our success in obtaining results from these relationships will depend both on the ultimate success of the other parties to these relationships and on the ability of these parties to market our services successfully.
Furthermore, our ability to achieve future growth will also depend on our ability to continue to establish direct seller channels and to develop multiple distribution channels. Failure of one or more of our strategic relationships to result in the development and maintenance of a market for our services could harm our business. If we are unable to maintain our relationships or to enter into additional relationships, this could harm our business.
Principal and interest on the Network Solutions note may never be repaid.
As consideration for our sale of our Network Solutions domain name registrar business on November 25, 2003, we received a $40 million senior subordinated note from Network Solutions that matures over five years
from the date of the closing of the sale. The note is subordinated to a term loan made by the senior lender to the Network Solutions business in the principal amount of $40 million as of the closing date. In addition to the promissory note, we also hold a 15% interest in the Network Solutions business. We may never be repaid for the amount owed under the promissory note and we may never realize any value from our membership interest.
Compliance with new rules and regulations concerning corporate governance is costly and could harm our business.
The Sarbanes-Oxley Act, which was signed into law in July 2002, mandates, among other things, that companies adopt new corporate governance measures and imposes comprehensive reporting and disclosure requirements, sets stricter independence and financial expertise standards for audit committee members and imposes increased civil and criminal penalties for companies, their chief executive officers and chief financial officers and directors for securities law violations. For example, Section 404 of the Sarbanes-Oxley Act requires companies to do a comprehensive and costly evaluation of their internal controls. In addition, the Nasdaq Stock Market has adopted additional comprehensive rules and regulations relating to corporate governance. These laws, rules and regulations have increased the scope, complexity and cost of our corporate governance, reporting and disclosure practices, and our compliance efforts have required significant management attention. It has become more difficult and more expensive for us to obtain director and officer liability insurance, and we have been required to accept reduced coverage and incur substantially higher costs to obtain the reduced level of coverage. Further, our board members, chief executive officer and chief financial officer could face an increased risk of personal liability in connection with the performance of their duties. As a result, we may have difficulty attracting and retaining qualified board members and executive officers, which could harm our business.
We depend on key personnel to manage our business effectively and may not be successful in attracting and retaining such personnel.
We depend on the performance of our senior management team and other key employees. Our success also depends on our ability to attract, integrate, train, retain and motivate these individuals and additional highly skilled technical and sales and marketing personnel, both in the U.S. and abroad. In addition, our stringent hiring practices for some of our key personnel, which consist of background checks into prospective employees’ criminal and financial histories, further limit the number of qualified persons for these positions.
We have no employment agreements with any of our key executives that prevent them from leaving VeriSign at any time. In addition, we do not maintain key person life insurance for any of our officers or key employees. The loss of the services of any of our senior management team or other key employees or failure to attract, integrate, train, retain and motivate additional key employees could harm our business.
New and proposed regulations related to equity compensation will adversely affect our operating results and negatively impact our ability to attract and retain key personnel.
Since our inception, we have used stock options and other long-term equity incentives as a fundamental component of our employee compensation packages. We believe that stock options and other long-term equity incentives directly motivate our employees to maximize long-term stockholder value and, through the use of vesting, encourage employees to remain with VeriSign. The Financial Accounting Standards Board (“FASB”) recently issued Statement of Financial Accounting Standards (“SFAS”) No. 123R, “Share-Based Payment,” which supercedes SFAS No. 123,“Accounting for Stock-Based Compensation,”that will require us to record a charge to earnings for employee stock option grants beginning in the third quarter of 2005. This change will have a material, negative impact on our reported earnings. Recording a charge for employee stock options and the employee stock purchase plan under SFAS No. 123 would have increased after tax charges by approximately $136.8 million, $215.9 million and $221.8 million for the years ended December 31, 2004, 2003 and 2002, respectively. In addition, new regulations adopted by the Nasdaq Stock Market requiring stockholder approval for stock option plans could make it more difficult for us to grant options to employees in the future. To the
extent that new policies or regulations make it more difficult or expensive to grant options to employees, we may incur increased cash compensation costs or find it difficult to attract, retain and motivate employees, either of which could materially harm our business.
We have anti-takeover protections that may delay or prevent a change in control that could benefit our stockholders.
Our amended and restated certificate of incorporation and bylaws contain provisions that could make it more difficult for a third-party to acquire us without the consent of our board of directors. These provisions include:
VeriSign has also adopted a stockholder rights plan that may discourage, delay or prevent a change of control and make any future unsolicited acquisition attempt more difficult. Under the rights plan:
| ITEM 2. | PROPERTIES |
VeriSign’s principalcorporate headquarters are located in Mountain View, California. We have administrative, sales, marketing, research and development and operations facilities are located in Mountain View, California, Overland Park, Kansas, Providence, Rhode Island, Dulles, Virginia, Lacey, Washington, Berlin, Germany, Tokyo, Japanthe United States, Central America, South America, Europe, Asia, Australia and Geneva, Switzerland.Africa. We own approximately 512,000 square feet of space, which includes our headquarters complex in Mountain View, California. This complex includes five buildings withCalifornia and facilities in Savannah, Georgia, Lacey, Washington and New Castle, Delaware. As of December 31, 2007, we leased approximately 954,000 square feet of space, primarily in the United States and to a combined area of approximately 395,000 square feet. We also own our communications services facility in Lacey, Washington. The remainder of our significantlesser extent, Europe and the Asia Pacific. Our facilities are leased under lease agreements that expire at various dates through 2014.2017. We believe that our existing facilities are well maintained and in good operating condition, and are sufficient for our needs for the foreseeable future.
VeriSign also leases other space for sales and support, and training offices in various locations throughout the United States. Internationally, we lease space in a number of locations, including Buenos Aires, Argentina; Woluwe-St. Pierre, Belgium; Sao Paulo, Brazil; Bangalore, India; Kawasaki, Japan; Oslo, Norway; Durbanville, South Africa; and Malmo, Sweden.
Major Locations | Approximate Square Footage | Use | ||
United States: | ||||
Mountain View, California (owned) | Corporate Headquarters; Internet Services Group; and Communications Services Group | |||
Dulles, Virginia | Internet Services Group; and Corporate Services | |||
New Castle, Delaware (owned) | 105,000 | Internet Services Group; and Communication Services Group | ||
Lacey, Washington (owned) | 67,000 | Communications Services Group | ||
| Communications Services Group | |||
| ||||
Europe: | ||||
Geneva, Switzerland | 17,000 | Corporate European Headquarters; and Internet Services Group | ||
Asia: | ||||
| ||||
| ||||
Japan | VeriSign Japan K.K. Corporate Headquarters | |||
We believeare committed to vacate properties, in the U.S and internationally, according to our 2002, 2003 and 2007 restructuring plans (“Plans”). At December 31, 2007, on a worldwide basis related to our Plans, we had an aggregate of approximately 92,000 square feet that was vacant and approximately 26,000 square feet that was being subleased to third parties. See Note 5, “Restructuring, Impairments and Other Charges (Reversals), Net,” of our current facilities are sufficientNotes to Consolidated Financial Statements for further information about our needs for the foreseeable future.restructuring plans.
| ITEM 3. | LEGAL PROCEEDINGS |
As of February 28, 2005, VeriSign and NS Holding, Inc. (formerly Network Solutions, Inc.), were defendants in two active lawsuits involving customer contractual disputes over domain name registrations and related services. VeriSign completed the sale of its Network Solutions registrar business to Pivotal Private Equity on November 25, 2003. VeriSign retained liabilities, if any, associated with the lawsuits referenced above.
On February 2, 2001, Leon Stambler filed a complaint against VeriSign in the United States District Court for the District of Delaware. Mr. Stambler alleged that VeriSign, and RSA Security, Inc., infringed various claims of his patents, U.S. Patent Nos. 5,793,302, 5,974,148 and 5,936,541. Mr. Stambler sought a judgment declaring that the defendants had infringed the asserted claims of the patents-in-suit, an injunction, damages for the alleged infringement, treble damages for alleged willful infringement, and attorney fees and costs. One defendant, Omnisky, Inc., subsequently declared bankruptcy and Mr. Stambler settled the case against three other defendants: Openwave Systems, Inc., Certicom Corp. and First Data Corporation before trial. The trial began on February 24 and concluded with a jury verdict on March 7, 2003. On March 7, 2003, the jury returned a unanimous verdict for RSA Security Inc. and VeriSign and against Mr. Stambler on the four remaining patent claims in suit. The court had ruled earlier in the case on two other claims, also finding in favor of VeriSign and RSA Security, Inc. On April 17, 2003, the Court entered final judgment for defendants VeriSign and RSA Security and against Mr. Stambler on all of his claims of patent infringement. On May 16, 2003, Mr. Stambler
filed alternative motions with the trial court, seeking to overturn the judgment and obtain either judgment in his favor or a new trial. The District Court denied Mr. Stambler’s motions. Mr. Stambler appealed the trial court’s final judgment against him as to claim 34 of U.S. patent 5,793,302 to the U.S. Court of Appeals for the Federal Circuit. The appeal was denied on February 11, 2005.
On September 7, 2001, NetMoneyIN, an Arizona corporation, filed a complaint styled as a First Amended Complaint alleging patent infringement against VeriSign and several other previously-named defendants in the United States District Court for the District of Arizona asserting infringement of U.S. patent Nos. 5,822,737 and 5,963,917. NetMoneyIN filed a second amended complaint on October 15, 2002, alleging infringement by VeriSign and several other defendants of a third U. S. patent (No. 6,381,584) in addition to the two patents previously asserted. The second amended complaint dropped some of the originally-named defendants and added others. On August 27, 2003, NetMoneyIN filed a third amended complaint alleging direct infringement of the same three patents by VeriSign and several other previously-named defendants. In this complaint, NetMoneyIN dropped its claim of active inducement of infringement by VeriSign. Some of the other current defendants include IBM, BA Merchant Services, Wells Fargo Bank, Cardservice International, InfoSpace, E-Commerce Exchange and Paymentech. VeriSign filed an answer denying any infringement and asserting that the three asserted patents are invalid and later filed an amended answer asserting, in addition, that the asserted patents are unenforceable due to inequitable conduct before the U.S. Patent and Trademark Office.certain patents. The complaint allegesalleged that VeriSign’s Payflow payment products and services directly infringe certain claims of NetMoneyIN’s three patents and requestsrequested the Court to enter judgment in favor of NetMoneyIN, a permanent injunction against the defendants’ alleged infringing activities, an order requiring defendants to provide an accounting for NetMoneyIN’s damages, to pay NetMoneyIN such damages and three times that amount for any willful infringers, and an order awarding NetMoneyIN attorney fees and costs. NetMoneyIN has recently droppedwithdrawn its allegations of infringement of one of the ‘584patents and the Court has dismissed with prejudice all claims of infringement of such patent. Also,In its ruling on the original lead counselclaim construction issues, the Court found some of the claims asserted against VeriSign to be valid. NetMoneyIN may file an appeal after a final judgment seeking to overturn this ruling. Only one claim remains in the case. On July 13, 2007, the Court issued an order granting summary judgment in favor of VeriSign based on the Court’s finding that such claim is invalid, and denying all other pending dispositive motions. On August 29, 2007, Plaintiff filed a Notice of Appeal. On September 19, 2007, the U.S. Court of Appeals for NetMoneyIN has withdrawnthe Federal Circuit docketed the appeal. While we cannot predict the outcome of this lawsuit, we believe that the allegations are without merit.
On February 14, 2005, Southeast Texas Medical Associates, LLP filed a putative class action lawsuit in the Superior Court of California, alleging violations of the unfair competition laws, breach of express warranty and unjust enrichment relating to our Secure Site Pro SSL certificates. The complaint is brought on behalf of a class of persons who purchased the Secure Site Pro certificate from February 2001 to present. On April 17, 2006, the case,class was certified and NetMoneyIN has hired new counsel.class notice was issued on May 21, 2007. VeriSign disputes these claims. While we cannot predict the outcome of this matter, we believe that the allegations are without merit.
On June 30, 2003, IDNApril 11, 2005, Prism Technologies, LLC filed a complaint alleging patent infringement against VeriSign in the U.S. District Court for the District of Delaware alleging that VeriSign’s “Go Secure” suite of application and related hardware and software products and its Unified Authentication solution and related hardware and software products, including the VeriSign Identity Protection (“VIP”) product” infringe U.S. Patent No. 6,516,416, entitled “Subscription Access System for Use With an Untrusted Network.” Prism Technologies seeks judgment in favor of Prism Technologies, a permanent injunction from infringement, damages in an amount not less than a reasonable royalty, attorneys’ fees and costs. On April 2, 2007, the Court issued a ruling from the Markman claim construction hearing. On April 13, 2007, the Court granted Defendants’ Motion for Leave to File Amended Answers and Counterclaims to add an inequitable conduct defense. On April 23, 2007, on the basis of the Markman claim construction ruling, the Court entered a stipulated Final Judgment of Non-Infringement, dismissing all claims and counterclaims in the case. On April 27, 2007, Plaintiff filed a Notice of Appeal. On February 5, 2008, the U.S. Court of Appeals for the Federal Circuit affirmed the district court's claim construction ruling and dismissal in our favor.
On June 26, 2006, we received a grand jury subpoena from the U.S. Attorney for the Northern District of California requesting documents relating to our stock option grants and practices. We also received an informal inquiry from the Securities and Exchange Commission (“SEC”) requesting documents related to VeriSign’s stock option grants and practices. On February 9, 2007, we received a formal order of investigation from the SEC. On October 29, 2007, the SEC issued a letter to us stating that the investigation had been terminated with no enforcement action recommended to the Commission.
On July 6, 2006, a stockholder derivative complaint (Parnes v. Bidzos, et al., and VeriSign) was filed against the Company, as a nominal defendant, and certain of its current and former directors and executive officers related to certain historical stock option grants. The complaint seeks unspecified damages on behalf of VeriSign, constructive trust and other equitable relief. Two other derivative actions were filed, one in United States District Court for the Northern District of California asserting infringement of U.S. patent no. 6,182,148 B1. IDN Technologies filed an amended complaint(Port Authority v. Bidzos, et al., and VeriSign), and one in state court (Port Authority v. Bidzos, et al., and VeriSign) on August 6, 2003, alleging infringement of the same patent but adding an additional VeriSign service. VeriSign responded by filing a counterclaim for declaratory relief and an answer denying any infringement and asserting that the patent is invalid. On September 24, 2004, the court ruled in favor of VeriSign on all Markman issues. On January 18, 2005, the court granted VeriSign’s motion for summary judgment. Entry of judgment in favor of VeriSign on all claims is expected to occur in the near future. Plaintiff has stated its intention to appeal such judgment.
Beginning in May of 2002, several class action complaints were filed against VeriSign and certain of its current and former officers and directors in the United States District Court for the Northern District of California. These actions were consolidated under the heading In re VeriSign, Inc. Securities Litigation, Case No. C-02-2270 JW(HRL), on July 26, 2002. The consolidated action seeks unspecified damages for alleged violations of Sections 10(b) and 20(a) of the Securities Exchange Act of 1934, and Rule 10b-5 promulgated thereunder, on behalf of a class of persons who purchased VeriSign stock from January 25, 2001 through April 25, 2002. An amended consolidated complaint was filed on November 8, 2002. On April 14, 2003, the court granted in part and denied in part the defendants’ motion to dismiss the amended and consolidated complaint. On May 5, 2004, plaintiffs filed a second amended complaint that is substantially identical to the amended consolidated complaint except that it purports to add a claim under Sections 11 and 15 of the Securities Act of 1933 on behalf of a subclass of persons who acquired shares of VeriSign pursuant to the registration statement and prospectus filed October 10, 2001 and amended October 26, 2001 for the acquisition of Illuminet Holdings, Inc. by VeriSign.
Parallel derivative actions have also been filed against certain of VeriSign’s current and former officers and directors in state courts in California and Delaware. VeriSign is2006. We are named as a nominal defendant in these actions.
Several The federal actions have been consolidated and plaintiffs filed a consolidated complaint on November 20, 2006. Motions to dismiss the consolidated federal court complaint were heard on May 23, 2007. Those motions were granted on September 14, 2007. Motions to stay the state court action are pending. On May 15, 2007, a putative class action (Mykityshyn v. Bidzos, et al., and VeriSign) was filed in Superior Court for the State of these derivative actions were filed inCalifornia, Santa Clara County Superior Courtnaming the Company and certain current and former officers and directors, alleging false representations and disclosure failures regarding certain historical stock option grants. The plaintiff purports to represent all individuals who owned our common stock between April 3, 2002, and August 9, 2006. The complaint seeks rescission of California,amendments to the 1998 and these actions have since been consolidated2006 Option Plans and the cancellation of shares added to the 1998 Option Plan. The complaint also seeks to enjoin defendants from granting any stock options and from allowing the exercise of any currently outstanding options granted under the heading In re VeriSign, Inc. Derivative Litigation, Case No. CV 807719.
1998 and 2006 Option Plans. The consolidated derivative actioncomplaint seeks an unspecified amount of compensatory damages, for alleged breaches of fiduciary dutycosts and violations of the California Corporations Code. Defendants’ demurrer to these claims was granted with leave to amend on February 4, 2003. Plaintiffs have indicated their intention to file an amended complaint. Another derivative actionattorneys fees. The identical case was filed in state court under a separate name (Pace. v. Bidzos, et al., and VeriSign) on June 19, 2007, and on October 3, 2007 (Mehdian v. Bidzos, et al.). On December 3, 2007, a consolidated complaint was filed in Superior Court for the CourtState of Chancery New Castle County, Delaware, Case No. 19700-NC, alleging similar breaches of fiduciary duty. Defendants’ motion to dismiss these claims was granted by the Court of Chancery with prejudice on September 30, 2003.
California, Santa Clara County. VeriSign and the individual defendants dispute all of these claims.
On November 7, 2006, a judgment was entered against VeriSign was named asby an Italian trial court in the matter of Penco v. VeriSign, Inc., for Euro 5.8 million plus fees arising from a defendant in four lawsuits filed since September 18, 2003, relating to VeriSign’s Site Finder service. Two of these lawsuits werelawsuit brought by alleged competitors of VeriSign. The remaining suits, one class action suit and one representative suit,a former consultant who claimed to be owed commissions. We were filedgranted a stay on behalf of consumers and commercial Internet users. VeriSign filed motions to dismiss bothexecution of the alleged competitor lawsuits. In one of those competitor lawsuits,judgment. We have appealed the plaintiff did not oppose VeriSign’s motion to dismisslower court’s ruling on the original complaint and subsequently filed an amended complaint, which VeriSign also moved to dismiss. The courts have ruled on VeriSign’s motions in these two competitor cases by granting the motions in part and denying them in part. In both competitor lawsuits, after VeriSign responded to the complaint and before substantive discovery was exchanged, the plaintiffs agreed to dismiss their cases without prejudice in return for confidentiality agreements and no monetary payment. VeriSign also moved to dismiss the amended complaints filed in the class actionmerits and the representative action. In response to VeriSign’s motions to dismiss,hearing on the plaintiffs voluntarily dismissedappeal is scheduled in May 2008. We believe the class action and representative actionclaims are without prejudice to refiling. Dismissals have been entered by the courts in both cases.merit.
On August 27, 2004, weNovember 30, 2006, Freedom Wireless, Inc. filed a lawsuitcomplaint against ICANN in the Superior Court of the State of California Los Angeles County. The lawsuit alleges that ICANN breached its .com Registry Agreement with VeriSign, including, without limitation, by overstepping its contractual authority and improperly attempting to regulate our business. The complaint seeks, among other things, specific performance of the .com Registry Agreement, an injunction prohibiting ICANN from improperly regulating VeriSign and monetary damages. On November 12, 2004, ICANN filed an answer denying VeriSign’s claims and a cross-complaint against VeriSign for declaratory relief and breach of the .com Registry Agreement,other defendants alleging that VeriSign’s introduction of newwe infringe certain patents by making, using, selling or supplying products, methods or services breached the .com Agreement. ICANN seeks a declaration from the court that it has acted in compliance with the parties’ contractual obligations with regardrelating to the .com registry; that VeriSign has breached the parties’ agreement through VeriSign’s actions with respectsupplying prepaid wireless telephone services to among other things, SiteFinder; and that ICANN has the right to terminate the .com registry agreement if VeriSign offers “Registry Services” without ICANN’s approval, including among others SiteFinder. On December 28, 2004,telecommunications companies. VeriSign filed an answer denyingto the claimscomplaint on January 25, 2007. The lawsuit is pending in ICANN’s cross-complaint and a cross-complaint against ICANNthe United States District Court for breachthe Eastern District of contract, violation of the unfair competition laws, and declaratory relief, alleging, among other things, that ICANN’s accreditation of “thread” registrars is improper and causes direct injury to VeriSign. On February 14, 2005, ICANN filed an answer to VeriSign’s cross-complaint denying VeriSign’s allegations. WeTexas. While we cannot predict the outcome of this lawsuit ormatter, VeriSign believes that the affect it will have on our relationship with ICANN.allegations are without merit and intends to vigorously defend against them.
On or about November 12, 2004, ICANNJanuary 31, 2007, VeriSign and News Corporation finalized a joint venture giving News Corporation a controlling interest in VeriSign’s wholly owned Jamba subsidiary. Accordingly, effective January 31, 2007, VeriSign transferred to the joint venture direction and control of all litigation, described in prior reports filed with the SEC, relating to Jamba! GmbH and Jamster International Sarl.
On May 31, 2007, plaintiffs Karen Herbert, et al., on behalf of themselves and a nationwide class of consumers, filed a Request for Arbitration before the International Chamber of Commerce International Court of Arbitration (the “ICC”)complaint against VeriSign, Inc., m-Qube, Inc., and other defendants alleging that defendants collectively operate an illegal lottery under the laws of multiple states by allowing viewers of the NBC television show “Deal or No Deal” to incur premium text message charges in order to participate in an interactive television promotion called “Lucky Case Game.” The lawsuit is pending in the United States District Court for the Central District of California, Western Division. On June 5, 2007, plaintiffs Cheryl Bentley, et al., on behalf of themselves and a nationwide class of consumers, filed a complaint against VeriSign, violated its .net Registry Agreement with ICANN when, amongInc., m-Qube, Inc., and other things,defendants alleging that defendants collectively operate an illegal lottery under the laws of multiple states by allowing viewers of the NBC television show “The Apprentice” to incur premium text message charges in order to participate in an interactive television promotion called “Get Rich With Trump.” The lawsuit is pending in the United States District Court for the Central District of California, Western Division. On June 7, 2007, plaintiffs Michael and Michele Hardin, on behalf of themselves and a nationwide class of consumers, filed a complaint against VeriSign, operatedInc. and
other defendants alleging that defendants collectively operate various “gambling games” in violation of Georgia state law. Plaintiffs allege that interactive television promotions contained in various broadcasts, including NBC’s “Deal or No Deal,” wrongly permit participants to incur premium text message charges in order to participate in the SiteFinder servicepromotions to win a prize. The lawsuit is pending in the United States District Court for the Northern District of Georgia, Gainesville Division. While we cannot predict the outcome of any of these matters, we believe that the allegations in each of them are without ICANN approval. ICANN seeksmerit and intend to vigorously defend against them.
On October 9, 2007, the Associated Press (“AP”) filed a declarationcomplaint in federal court in New York against Moreover Technologies, Inc. and VeriSign, Inc. for copyright and trademark infringement and other claims arising from the ICC that it has acted in compliance with the parties’ contractual obligations with regard to the .net registry; that VeriSign has breached the parties’ agreement through VeriSign’s actions with respect to, among other things, SiteFinder;Real Time Publishing business. The complaint seeks unspecified compensatory, punitive and that ICANN has the right to terminate the .net registry agreement if VeriSign offers “Registry Services” without ICANN’s approval, including among others SiteFinder. ICANN also seekstreble damages and a declaration that, in evaluating VeriSign’s bid to become the “successor” registry
operator for the .net top level domain after the term of the current agreement expires on or about June 30, 2005, ICANN is entitled to consider VeriSign’s alleged breaches of the existing .net agreement. Wepermanent injunction. While we cannot predict the outcome of this action ormatter, we intend to vigorously defend against the affect this lawsuit will have on our relationship with ICANN.claims.
On January 18, 2005, we filed a request for arbitration before the ICC against ICANN regarding the currently-pending process by which ICANN is soliciting and reviewing bids from companies, including VeriSign, to become the “successor” registry operator for the.net top level domain after the current registry agreement expires on or about June 30, 2005. VeriSign alleges that the “request for proposal” (“RFP”) process constitutes a breach of the current .net registry agreement because, among other things, the RFP process fails to constitute an open and transparent process by which ICANN can reasonably select the best qualified successor to operate the .net registry and does not constitute a valid “consensus policy” as defined in the current .net agreement. ICANN has not yet responded to our arbitration request. We cannot predict the outcome of this action or the affect this action will have on our relationship with ICANN.
VeriSign isare involved in various other investigations, claims and lawsuits arising in the normal conduct of itsour business, none of which, in our opinion will harm itshave a material effect on our business. VeriSignWe cannot assure you that itwe will prevail in any litigation. Regardless of the outcome, any litigation may require VeriSignus to incur significant litigation expense and may result in significant diversion of management attention.
| ITEM 4. | SUBMISSION OF MATTERS TO A VOTE OF SECURITY HOLDERS |
No matters were submitted to a vote of security holders during the quarter ended December 31, 2004.2007.
EXECUTIVE OFFICERS OF THE REGISTRANT
The following table sets forth certain information regarding theour executive officers of VeriSign as of February 28, 2005:January 31, 2008:
Name | Age | Position | ||
| President, Chief Executive Officer and | |||
| 45 | Chief Financial Officer | ||
| 53 | Senior Vice President | ||
| 47 | Executive Vice President, | ||
|
| |||
|
| |||
|
| |||
|
| |||
|
| |||
| Senior Vice President, General Counsel and Secretary | |||
Anne-Marie Law | 40 | Senior Vice President, Global Human Resources | ||
Russell S. Lewis | 53 | Senior Vice President, Strategic Development | ||
Kevin A. Werner | 47 | Senior Vice President, Corporate Development and Strategy |
Stratton D. SclavosWilliam A. Roper, Jr. has served as President and Chief Executive Officer since May 2007 and has served as a director of VeriSign since November 2003. From April 2000 through May 2007, he joined VeriSign in July 1995. In December 2001, he was named Chairman of the Board of Directors. From October 1993 to June 1995, he was Vice President, Worldwide Marketing and Sales of Taligent, Inc., a software development company that was a joint venture among Apple Computer, Inc., IBM and Hewlett-Packard. From May 1992 to September 1993, Mr. Sclavos wasserved as Corporate Executive Vice President of Worldwide SalesScience Applications International Corporation (“SAIC”), a diversified technology services company, and Business Development of GO Corporation, a pen-based computer company. Priorhas previously served as SAIC’s Senior Vice President from 1990 to that time, he served in various sales1999, Chief Financial Officer from 1990 to 2000, and marketing capacities for MIPS Computer Systems, Inc. and Megatest Corporation.Executive Vice President from 1999 to 2000. Mr. Sclavos serves as a director of Juniper Networks, Inc., Intuit, Inc. and Salesforce.com, Inc. Mr. SclavosRoper holds a B.S.B.A. degree in Electrical and Computer EngineeringMathematics from the University of CaliforniaMississippi and graduate degrees from Southwestern Graduate School of Banking at Davis.Southern Methodist University and Stanford University, Financial Management Program.
Dana L. EvanAlbert E. Clementhas served as Executive Vice President of Finance and Administration and Chief Financial Officer since January 1, 2001. From June 1996 until December 31, 2000 sheJuly 2007. He served as Senior Vice President, of Finance,
and Administration and Chief Financial Officer of VeriSign. From 1988Controller from January 2001 to June 1996, Ms. Evan worked2007. From January to December 2000, he served as a financial consultantController of Network Solutions, which was acquired by VeriSign in the capacity of chief financial officer, vice president of finance or corporate controller for various public and private companies and partnerships, including VeriSign from November 1995 to June 1996.2000. Prior to 1988, she was employed by KPMG LLP, most recently as ajoining Network Solutions, Mr. Clement held senior manager. Ms. Evanfinancial positions at BroadPoint Communications and MCI from 1996 to 2000. Prior to that, Mr. Clement spent twelve years in various capacities at PricewaterhouseCoopers LLP. He is a certified public accountant and holds a B.S. degree in Commerce with a concentration in Accounting and FinanceBachelor of Accountancy from Santa ClaraGeorge Washington University.
Quentin P. GallivanGrant L. Clarkhas served as ExecutiveSenior Vice President Worldwide Sales and ServicesChief Administrative Officer since April 1999.October 2007. From October 1997 to April 1999, heJanuary 2004 until joining VeriSign, Mr. Clark served as Vice Presidentsenior vice president and chief deputy counsel of Worldwide Sales of VeriSign.SAIC, Inc., a diversified information technology services company. From April 1996 to October 1997,November 1999 until January 2004, he was Vice President for Asia Pacificsenior vice president and Latin Americageneral counsel of Netscape,Telcordia Technologies, a software company. Prior to that time,SAIC subsidiary. Mr. Clark holds a B.A. degree in English from 1983 to March 1996, Mr. Gallivan was with General Electric Information Services, an electronic commerce services company, in several general management roles most recently as Vice President, SalesFramingham State College and Services for the Americas.a J.D. degree from Suffolk Law School.
Vernon L. Irvin has served as Executive Vice President of Communications Services since June 2003. Prior to joining VeriSign, Mr. Irvin served as Executive Vice President of American Management Systems, Inc. (AMS), a business and IT consulting firm, since February 2002. From May 1999 until February 2002, Mr. Irvin served as a founding manager and president of BT Ignite, the broadband and Internet services business of British Telecommunications PLC. Mr. Irvin holds a B.S. degree in Information Systems from the University of Cincinnati in Ohio.
Robert J. KorzeniewskiJohn M. Donovanhas served as Executive Vice President, CorporateSales, Operations, Customer Care and BusinessProduct Development since joiningNovember 2006 when VeriSign upon its acquisition of Network Solutions in June 2000.acquired inCode Telecom Group, Inc., a wireless consulting company. He served as Chief FinancialExecutive Officer and Chairman of Network Solutionsthe Board of Directors of inCode from March 1996November 2000 to June 2000.November 2006. Prior to joining Network Solutions,inCode, Mr. KorzeniewskiDonovan was with Deloitte Consulting from 1994 to 2000, where he was a partner from 1997 to 2000 and held various senior financial positions at Science Application International Company from 1987 to March 1996.the position of Americas Industry Practice Director for Telecom. Mr. KorzeniewskiDonovan serves as a director of Talk AmericaNII Holdings, Inc. and Kintera, Inc. Mr. Korzeniewski is a certified public accountant andDonovan holds a B.S. degree in Business AdministrationElectrical Engineering from Salem State College.the University of Notre Dame and an MBA degree in Finance from the University of Minnesota.
Judy Lin has served as Executive Vice President and General Manager, Security Services since January 2003. Since joining VeriSign in February 1996, Ms. Lin has served in a variety of management positions from Director of Core Technology to Vice President of Product Development. Prior to joining VeriSign, Ms. Lin served in a variety of software development and management roles at Taligent, Apple Computer and Hewlett-Packard. Ms. Lin holds dual B.A. degrees in Computer Science and European History from the University of California, Berkeley.
Aristotle BaloghRichard H. Goshorn has served as Senior Vice President, OperationsGeneral Counsel and InfrastructureSecretary since June 2007. From October 2004 to May 2002. From 1999 to 2002, Mr. Balogh2007, he served as General Counsel for Akin Gump Strauss Hauer & Feld, LLP, a law firm. From 2002 to 2003, Mr. Goshorn was Corporate Vice President, General Counsel and Secretary of Engineering at VeriSign and Network Solutions. PriorActerna Corporation, a public communications test equipment company. From 1991 to that,2001 he held a variety of senior executive legal positions at Network Solutions. Prior to joining Network Solutions in 1998,with London-based Cable and Wireless PLC, a telecommunications company, including the position of Senior Vice President and General Counsel, Cable & Wireless Global. Mr. Balogh held a variety of senior engineer and management roles at SRA Corporation, UPS’s Roadnet Technologies, and Westinghouse Electric Corporation. Mr. BaloghGoshorn holds a B.S.B.A. degree in Electrical EngineeringEconomics from The College of Wooster and Computer Science and an M.S.E.a J.D. degree in Electrical and Computer Engineering from the WhitingDuke University’s School of Engineering at Johns Hopkins University.Law.
Mark McLaughlinAnne-Marie Lawhas served as Senior Vice President, andGlobal Human Resources since August 2007. From May 2007 to July 2007, she served as Vice President, Global Human Resources. From 1999 to April 2007, Ms. Law served in a variety of senior capacities within the human resources department of Xilinx, Inc, a provider of programmable solutions. Ms. Law holds a B.A. degree in Art History from Leicester University in the United Kingdom.
Russell S. Lewishas served as Senior Vice President, Strategic Development since January 2005. From February 2002 to December 2004, he served as General Manager, Naming and Directory Services since January 2005. From November 2003 through December 2004, Mr. McLaughlin wasand from March 2000 to February 2002, he served as Senior Vice President, and Deputy General Manager of Naming and Directory Services. From 2002 to 2003,Corporate Development. Since August 1999, he has served as Vice President Corporateof Lewis Capital Group, LLC, an investment firm. Mr. Lewis serves as a director of Delta Petroleum Corporation. Mr. Lewis holds an M.B.A. degree with a concentration in finance and marketing from Harvard School of Business Development and from 2000 to 2001 he was Vice President, General Manager of VeriSign Payment Services. Prior to joining VeriSign, Mr. McLaughlin was the Vice President, Business Development of Signio, an internet payment company acquired by VeriSign in February 2000. Mr. McLaughlin holds a B.S.B.A. degree in Political ScienceEconomics from the U.S. Military Academy at West Point and a J.D. degree from the Seattle University School of Law.Haverford College.
James M. UlamKevin A. Wernerhas served as Senior Vice President, Corporate Development and General CounselStrategy since October 2001, and as Vice President and General Counsel sinceSeptember 2007. From February 2004 until joining VeriSign, upon its acquisitionMr. Werner served as senior vice president, director of Network Solutions in Junestrategic development activities of SAIC, Inc., a diversified information technology services company. From April 2000 and as Secretary of VeriSign since November 2000. From October 1996 to June 2000, he served in a variety of positions for Network Solutions, including Corporate Counsel and Assistant General Counsel. Prior to joining Network Solutions,until January 2004, he was president and managing director of SAIC Venture Capital Corporation, a Contracts Attorney for Science Application International Company from April 1995 until October 1996. Prior to that he was in the private practice of law at Wells, Moore, Stubblefield and Neeld from March 1994 to March 1995 and at Ott & Purdy from March 1992 until March 1994.SAIC subsidiary. Mr. UlamWerner holds a B.S.B.A. degree in Business AdministrationPolitical Science from theGeorge Washington University of Maryland and a J.D. degree from the Mississippi College School of Law.Harvard Law School.
| ITEM 5. | MARKET FOR REGISTRANT’S COMMON EQUITY, RELATED |
Price Range of Common Stock
VeriSign’sOur common stock is traded on the Nasdaq NationalNASDAQ Global Select Market under the symbol “VRSN.” The following table sets forth, for the periods indicated, the high and low sales prices per share for our common stock as reported by the Nasdaq NationalNASDAQ Global Select Market:
| Price Range | Price Range | |||||||||||
| High | Low | High | Low | |||||||||
Year ended December 31, 2005: | ||||||||||||
First Quarter (through February 28, 2005) | $ | 33.67 | $ | 24.48 | ||||||||
Year ended December 31, 2004: | ||||||||||||
Year ending December 31, 2008: | ||||||||||||
First Quarter (through February 28, 2008) | $ | 38.06 | $ | 30.14 | ||||||||
Year ended December 31, 2007: | ||||||||||||
Fourth Quarter | $ | 36.09 | $ | 19.99 | $ | 41.96 | $ | 31.52 | ||||
Third Quarter | 20.00 | 16.21 | 34.68 | 27.77 | ||||||||
Second Quarter | 19.96 | 15.22 | 32.12 | 24.83 | ||||||||
First Quarter | 21.09 | 14.94 | 26.78 | 22.92 | ||||||||
Year ended December 31, 2003: | ||||||||||||
Year ended December 31, 2006: | ||||||||||||
Fourth Quarter | $ | 17.55 | $ | 13.15 | $ | 26.77 | $ | 19.90 | ||||
Third Quarter | 16.80 | 11.52 | 23.27 | 15.95 | ||||||||
Second Quarter | 16.20 | 8.59 | 25.45 | 20.91 | ||||||||
First Quarter | 11.21 | 6.55 | 25.00 | 20.75 | ||||||||
On February 28, 2005,January 31, 2008, there were 997809 holders of record of our common stockstock; although we believe there are in excess of 100,000approximately 150,000 beneficial owners since many brokers and other institutions hold our stock on behalf of stockholders. On February 28, 2005,2008, the reported last sale price of our common stock was $27.42$36.00 per share as reported by the Nasdaq NationalNASDAQ Global Select Market. Information on our equity compensation plans may be found in the section captioned “Equity Compensation Plan Information” appearing in the definitive Proxy Statement to be delivered to stockholders in connection with the 2005 Annual Meeting of Stockholders which information is incorporated herein by reference.
The market price of our common stock has been and is likely to continue to be highly volatile and significantly affected by factors such as:
general market and economic conditions and market conditions affecting technology and Internet stocks generally;
announcements of technological innovations, acquisitions or investments by us or our competitors;
developments in Internet governance; and
industry conditions and trends.
The market price of our common stock also has been and is likely to continue to be significantly affected by expectations of analysts and investors. Reports and statements of analysts do not necessarily reflect our views. The fact thatTo the extent we have in the past met or exceeded analyst or investor expectations in the past does not necessarily mean that we will be able to do so in the future.
In the past, securities class action lawsuits have often followed periods of volatility in the market price of a particular company’s securities. This type of litigation could result in substantial costs and a diversion of our management’s attention and resources.
We have never declared or paid any cash dividends on our common stock or other securities and we do not anticipate paying cash dividends in the foreseeable future. We currently intend to retain our earnings, if any, for future growth. Information regarding our equity compensation plans may be found in Part III, Items 11 and 12, of this Form 10-K. See Note 11, “Stockholders’ Equity,” of our Notes to Consolidated Financial Statements for further information regarding our equity compensation plans.
Share Repurchases
ISSUER PURCHASES OF EQUITY SECURITIESTo facilitate the stock repurchase program, designed to return value to the stockholders and minimize dilution from stock issuances, we repurchase shares in the open market and from time to time enter into structured stock repurchase agreements with third parties.
Period | Total Number of Shares Purchased | Average Price Paid per Share | Total Number of Shares Purchased as Part of Publicly Announced Plans or Programs | Approximate Dollar Value of Shares That May Yet Be Purchased Under the Plans or Programs | ||||||
October 1–31, 2004 | — | — | — | $ | 245.6 million | |||||
November 1–30, 2004 | 170,000 | $ | 31.21 | 170,000 | 240.2 million | |||||
December 1–31, 2004 | 2,220,200 | 32.89 | 2,220,200 | 167.2 million | ||||||
Total | 2,390,200 | $ | 32.77 | 2,390,200 | ||||||
On April 26, 2001, VeriSignJanuary 31, 2008, our Board of Directors authorized a stock repurchase program (“2008 stock repurchase program”) having an aggregate purchase price of up to $600 million of our common stock.
On February 8, 2008, we announced that we entered into an Accelerated Share Repurchase (“ASR”) agreement to repurchase $600 million of our common stock under the 2008 stock repurchase program and announced an intent to repurchase up to an additional $200 million in open market transactions under the stock repurchase program the Board of Directors authorized in 2006 (“2006 stock repurchase program”). We paid $600 million to a financial institution in exchange for a number of shares, which will be determined, subject to a cap, based on market prices during the term of the ASR agreement. Through February 28, 2008 we received 15.1 million shares under the ASR agreement. We expect to complete the ASR by the end of the third quarter of 2008, although in certain circumstances the completion date may be shortened or extended.
On August 7, 2007, our Board of Directors authorized the use of the net proceeds from the issuance of the convertible debentures as described in Note 10, “Junior Subordinated Convertible Debentures,” of our Notes to Consolidated Financial Statements in Item 15 of this Form 10-K, to repurchase shares of our common stock in addition to the 2006 stock repurchase program.
In August 2007, we used the proceeds from the issuance of the convertible debentures to repurchase 12.2 million shares of our common stock for an aggregate cost of approximately $350 million. Additionally, we entered into a $200 million Guaranteed Share Repurchase (“GSR”) agreement and a $600 million ASR agreement with two independent financial institutions. Under the terms of the GSR agreement, we received approximately 6.3 million shares of our common stock. Under the terms of the ASR agreement we received approximately 19.5 million shares, of which 12.9 million were settled during the third quarter of 2007 and 6.6 million were settled in the fourth quarter. These agreements have been accounted for under Emerging Issues Task Force Issue (“EITF”) No. 99-7, “Accounting for an Accelerated Share Repurchase Program,” and EITF No. 00-19, “Accounting for Derivative Financial Instruments Indexed to, and Potentially Settled in, a Company’s Own Stock.”
| Total Number of Shares Purchased (1) | Average Price Paid per Share | Total Number of Shares Purchased as Part of Publicly Announced Plans or Programs | Approximate Dollar Value of Shares That May Yet Be Purchased Under the Plans or Programs (2) | |||||||
October 1 – 31, 2007 | 5,440,000 | $ | 30.70 | 5,440,000 | $ | 984.7 million | ||||
November 1 – 30, 2007 | 800,572 | 30.70 | 800,572 | 984.7 million | ||||||
December 1 – 31, 2007 | 400,286 | $ | 30.70 | 400,286 | $ | 984.7 million | ||||
| 6,640,858 | 6,640,858 | |||||||||
| (1) | These shares purchased represent shares from the August 2007 ASR agreement that were settled during the fourth quarter of 2007. |
| (2) | This amount represents the remaining value of the 2006 stock repurchase program at December 31, 2007. |
In 2006, the Board of Directors authorized the 2006 stock repurchase ofprogram with no expiration date to repurchase up to $350.0$1.0 billion of our common stock. In January and February of 2008, we repurchased 13.3 million shares of our common stock under the 2006 stock repurchase program for an aggregate cost of $451.9 million. In 2007, we did not repurchase any shares under the 2006 stock repurchase program. In 2006, we repurchased approximately 0.7 million shares under the 2006 stock repurchase program for an aggregate cost of
$15.3 million. As of February 28, 2008, we have approximately $532.7 million available under the 2006 stock repurchase program.
In 2005, the Board of Directors authorized a stock repurchase program (“2005 stock repurchase program”) to repurchase up to $500 million of our common stock. In 2006, we repurchased approximately 5.7 million shares under the Company’s2005 stock repurchase program for an aggregate cost of approximately $119.7 million. In 2005, we repurchased approximately 16.5 million shares under the 2005 stock repurchase program for an aggregate cost of approximately $380.3 million. This stock repurchase program was completed in the second quarter of 2006.
In 2001, the Board of Directors authorized a stock repurchase program (“2001 stock repurchase program”) to repurchase up to $350 million of our common stock. In 2005, we repurchased approximately 6.3 million shares under the 2001 stock repurchase program for an aggregate cost of approximately $167 million. This stock repurchase program was completed in the third quarter of 2005.
From the inception of the stock repurchase program in 2001 to February 28, 2008, we have repurchased approximately 101.7 million shares of our common stock for cashan aggregate cost of approximately $3.1 billion.
Performance Graph
The information contained in open market, negotiatedthe Performance Graph shall not be deemed to be “soliciting material” or block transactions.
The following graph compares the cumulative total stockholder return on our common stock, the Nasdaq Composite Index, and the S&P 500 Information Technology Index. The graph assumes that $100 was invested in our common stock, the Nasdaq Composite Index and the S&P 500 Information Technology Index on December 31, 2002, and calculates the return quarterly through December 31, 2007. The stock price performance on the following graph is not necessarily indicative of future stock price performance.
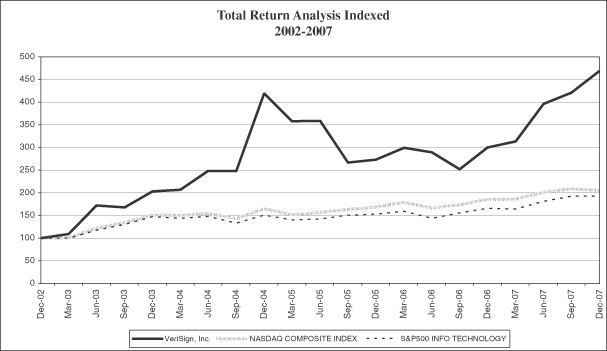
| 12/31/2002 | 12/31/2003 | 12/31/2004 | 12/31/2005 | 12/30/2006 | 12/29/2007 | |||||||||||||
VeriSign, Inc. | $ | 100 | $ | 203 | $ | 419 | $ | 273 | $ | 300 | $ | 469 | ||||||
Nasdaq Composite Index | $ | 100 | $ | 151 | $ | 165 | $ | 168 | $ | 186 | $ | 205 | ||||||
S&P 500 Information Technology Index | $ | 100 | $ | 147 | $ | 151 | $ | 152 | $ | 165 | $ | 192 | ||||||
| ITEM 6. | SELECTED FINANCIAL DATA |
The following table sets forth selected consolidated financial data are derived from our consolidated financial statements. This dataas of and for the last five fiscal years. The information set forth below is not necessarily indicative of results of future operations, and should be read in conjunction with the consolidated financial statements and notes thereto, and with Item 7, Management’s“Management’s Discussion and Analysis of Financial Condition and Results of Operations. Operations,” and the Consolidated Financial Statements and related notes thereto included in Item 15 of this Form 10-K, to fully understand factors that may affect the comparability of the information presented below.
We have made severalcompleted a number of acquisitions over the last five years, eachsince 2005 as described in Note 3, “Business Combinations,” of which was accounted for as a purchase transaction. Accordingly, theour Notes to Consolidated Financial Statements in Item 15 of this Form 10-K. The results of the acquired companies’ operations are included in our consolidated financial statementsConsolidated Financial Statements from their respective dates of acquisition.
We completedaccount for discontinued operations in accordance with SFAS 144, and accordingly, we have reclassified the saleselected financial data for all periods presented to reflect our discontinued operations as described in Note 4, “Discontinued Operations,” of our Network Solutions domain name registrar businessNotes to Consolidated Financial Statements in November 2003. The resultsItem 15 of Network Solutions’ operations are included in our consolidated financial statements through November 25, 2003, the closing date of sale.this Form 10-K.
| Years Ended December 31, | |||||||||||||||||||
| 2004 | 2003 | 2002 | 2001 | 2000 | |||||||||||||||
| (In thousands, except per share data) | |||||||||||||||||||
Consolidated Statement of Operations Data: | |||||||||||||||||||
Revenues | $ | 1,166,455 | $ | 1,054,780 | $ | 1,221,668 | $ | 983,564 | $ | 474,766 | |||||||||
Net income (loss) (1) | 186,225 | (259,879 | ) | (4,961,297 | ) | (13,355,952 | ) | (3,115,474 | ) | ||||||||||
Basic net income (loss) per share (1) | 0.74 | (1.08 | ) | (20.97 | ) | (65.64 | ) | (19.57 | ) | ||||||||||
Diluted net income (loss) per share (1) | 0.72 | (1.08 | ) | (20.97 | ) | (65.64 | ) | (19.57 | ) | ||||||||||
Consolidated Balance Sheet Data: | |||||||||||||||||||
Total assets (1) | 2,592,874 | 2,100,538 | 2,391,318 | 7,537,508 | 19,195,222 | ||||||||||||||
Other long-term liabilities (2) | 6,815 | 8,978 | 16,544 | 16,881 | — | ||||||||||||||
Stockholders’ equity (1) | 1,691,997 | 1,383,653 | 1,579,425 | 6,506,074 | 18,470,608 | ||||||||||||||
Selected Consolidated Statements of Operations Data:(in millions, except per share data)
| Year Ended December 31, | |||||||||||||||||
| 2007 (1) | 2006 (2) | 2005 (3) | 2004 | 2003 (4) | |||||||||||||
Continuing Operations: | |||||||||||||||||
Revenues | $ | 1,496 | $ | 1,563 | $ | 1,605 | $ | 1,117 | $ | 1,017 | |||||||
Operating (loss) income | $ | (222 | ) | $ | 91 | $ | 215 | $ | 73 | $ | (241 | ) | |||||
Net (loss) income | $ | (145 | ) | $ | 374 | $ | 162 | $ | 134 | $ | (294 | ) | |||||
Net (loss) income from continuing operations per share: | |||||||||||||||||
Basic | $ | (0.61 | ) | $ | 1.53 | $ | 0.63 | $ | 0.53 | $ | (1.23 | ) | |||||
Diluted | $ | (0.61 | ) | $ | 1.51 | $ | 0.62 | $ | 0.52 | $ | (1.23 | ) | |||||
Discontinued Operations: | |||||||||||||||||
Revenues | $ | 12 | $ | 12 | $ | 60 | $ | 51 | $ | 38 | |||||||
Net income | $ | 5 | $ | 5 | $ | 267 | $ | 19 | $ | 7 | |||||||
Net income from discontinued operations per share: | |||||||||||||||||
Basic | $ | 0.02 | $ | 0.02 | $ | 1.04 | $ | 0.08 | $ | 0.03 | |||||||
Diluted | $ | 0.02 | $ | 0.02 | $ | 1.01 | $ | 0.08 | $ | 0.03 | |||||||
Consolidated Total: | |||||||||||||||||
Net (loss) income | $ | (140 | ) | $ | 379 | $ | 429 | $ | 153 | $ | (287 | ) | |||||
Net (loss) income per share: | |||||||||||||||||
Basic | $ | (0.59 | ) | $ | 1.55 | $ | 1.67 | $ | 0.61 | $ | (1.20 | ) | |||||
Diluted | $ | (0.59 | ) | $ | 1.53 | $ | 1.63 | $ | 0.60 | $ | (1.20 | ) | |||||
| (1) |
| (2) |
| (3) | Net income for 2005 includes a gain on sale of discontinued operations of $250.6 million, net of tax. |
| (4) | Operating loss includes a $335.2 million in charges relating to the impairment of goodwill and the |
Consolidated Balance Sheet Data:(in millions)
| As of December 31, | |||||||||||||||
| 2007 | 2006 | 2005 | 2004 | 2003 | |||||||||||
Total assets | $ | 4,023 | $ | 3,974 | $ | 3,181 | $ | 2,599 | $ | 2,102 | |||||
Convertible debentures | 1,265 | — | — | — | — | ||||||||||
Stockholders’ equity | 1,528 | 2,377 | 2,023 | 1,691 | 1,377 | ||||||||||
| ITEM 7. | MANAGEMENT’S DISCUSSION AND ANALYSIS OF FINANCIAL CONDITION AND RESULTS OF OPERATIONS |
FORWARD-LOOKING STATEMENTS
Except for historical information, this Report contains forward-looking statements within the meaning of Section 27A of the Securities Act of 1933 and Section 21E of the Securities Exchange Act of 1934. These forward-looking statements involve risks and uncertainties, including, among other things, statements regarding our anticipated costs and expenses and revenue mix. Forward-looking statements include, among others, those statements including the words “expects,” “anticipates,” “intends,” “believes” and similar language. Our actual results may differ significantly from those projected in the forward-looking statements. Factors that might cause or contribute to such differences include, but are not limited to, those discussed in Item 1 “Business—Factors That May Affect Future Results of Operations.1A “Risk Factors.” You should carefully review the risks described in other documents we file from time to time with the Securities and Exchange Commission, including the Quarterly Reports on Form 10-Q or Current Reports on Form 8-K that we filefiled in 2005.2007. You are cautioned not to place undue reliance on the forward-looking statements, which speak only as of the date of this Annual Report on Form 10-K. We undertake no obligation to publicly release any revisions to the forward-looking statements or reflect events or circumstances after the date of this document.
Business Overview
VeriSign, Inc. is a leading provider of intelligentWe operate infrastructure services that enable people and businesses to find, connect, secure,protect billions of interactions every day across the world’s voice, video and transact across complexdata networks. We offer a variety of Internet and communications-related services, which are marketed through Web site sales, direct field sales, channel sales, telesales, and member organizations in our global networks. In 2004, ouraffiliate network.
Our business consistedconsists of two reportable segments: the Internet Services Group and the Communications Services Group. PriorThe Internet Services Group consists of the Information and Security Services business and the Naming Services business. The Information and Security Services business provides products and services that protect online and network interactions, enabling companies to 2004, ourmanage reputational, operational and compliance risks. The Naming Services business included an additional reportable segment,is the Network Solutionsauthoritative directory provider of all.com, .net, .cc, and .tv domain name registrar business, which was sold in November 2003.names. The Communications Services Group provides communications services, such as connectivity and interoperability services and intelligent database services; commerce services, such as billing and operational support system services, and mobile commerce services; and content services, such as digital content and messaging services.
Improving economic conditions during 2004In late 2007, we announced a change to our business strategy to be more tightly aligned with our core competencies, which is providing highly scaleable, reliable and secure Internet infrastructure services to customers around the world. The strategy calls for divesture of a number of non-core businesses in our portfolio, such as communications, billing and commerce, content delivery, messaging and enterprise security services. By divesting these non-core businesses, additional resources should be available to invest in the U.S., Europecore businesses that will remain: Naming Services, SSL Certificate Services, and Japan ledIdentity and Authentication services. We face a number of risks associated with our plan to improved customer spendingdivest ourselves of several non-core businesses. The operations of these businesses will be classified as discontinued operations when all criteria of Statement of Financial Accounting Standards (“SFAS”) No. 144 (“SFAS 144”),“Accounting for the Impairment or Disposal of Long Lived Assets,” are met. All of such criteria were not met as of December 31, 2007. As a result of these divestitures in each of our principal business segments leading2008, we would expect revenues, operating expenses and operating income from continuing operations to growthdecrease in revenuesabsolute dollars and deferred revenues. IT spending for security services and e-commerce activity in our principal geographic markets accelerated as the year progressed and we saw continued growth in domain name registrations and domain name renewals, with active domain names ending in .com and .net increasing by 26% during 2004. Spending for our services by telecommunications customersexpect a reduction in the United States also increased during the year, and Jamba!, our European-based providernumber of mobile content services to telecommunications carriers and customers that was acquired in June 2004, contributed approximately $180.8 million of revenues during 2004. In the U.S., the Communications Services Group’s results were adversely affected as the pace of consolidations in the domestic telecommunications sector quickened during the year.employees.
We derive the majority of our revenues and cash flows fromEffective January 1, 2007, we adopted a relatively small number of products and services sold primarily in the United States, Europe and Japan. Infunctional business structure that realigned the Internet Services Group more than 83% of the revenues during 2004 were derived from the sale of web certificates, payment services, managed authentication and security services and registry services. In the Communications Services Group 82% of the revenues were derived from the sale of calling nameto deliver products and services billing services, SS7 connectivity, signalingon an integrated basis through two main functional units: Sales and Consulting Services and Products and Marketing. The Sales and Consulting Services group is aligned by vertical industry and combines our multiple sales functions, in-market consulting services, and mobile content services during the same period.business development teams. The Products and Marketing group combines our product
For
management, product development, marketing and customer support functions, as well as a new innovation team chartered with looking at longer term product line synergies and emerging market trends. With our decision to divest all non-core business lines, the Communications Services Group, we expect growth in mobile content services revenues, particularly in new markets such as the U.S., offset somewhat by a decline in connectivity, clearing and settlement, and billing-related revenuesbusinesses identified for sale have retained (or are in the first quarter with a return to moderate growth in such revenues expected in the second quarter. Consolidations in the telecommunications sectorprocess of developing) separate sales, consulting, product marketing and pricing pressuresother capabilities that would have the potential to adversely impact the Communicationsotherwise been delivered through our Sales and Consulting Services Group’s results. For the Internet Services Group, we expect continued growth in the levels of IT spending for security services by our customers in the U.S., Europe and JapanProducts and growth in global e-commerce activity that we believe will result in revenue and deferred revenue growth for 2005.
Network Solutions Sale
On November 25, 2003, we completed the sale of our Network Solutions domain name registrar business to Pivotal Private Equity, although we retained a 15% interest in the business. We will not recognize any revenue from the Network Solutions business in the future, other than revenues that may be recognized in connection with registry or other services we may provide to Network Solutions as a customer.Marketing organizations.
VeriSign Japan K.K.2007 Business Highlights
On November 22, 2004,Total revenues from our Internet Services Group increased $158.2 million, primarily due to continued growth in our Naming Services and Information and Security Services businesses. Total revenues from our Communications Services Group decreased $224.9 million, primarily due to a decline in revenues that resulted from the divestiture of our majority ownership interest in our Jamba business unit in January 2007.
| • | We saw a 24% increase in 2007 in active domain names for.com and.net under management. The increase is primarily due to increased demand for new domain names and high renewal rates for existing domain names. |
We saw a 16% increase in 2007 in our installed base of SSL certificates. The growth is driven by increased demand for our VeriSign, GeoTrust and thawte branded certificates.
In January 2007, we sold 18,000 ordinary shares of our Tokyo-based, majority owned consolidated subsidiary, VeriSign Japan K.K. (“VeriSign Japan”), representing approximately 7%51% of our ownership interest in our Jamba subsidiary to Fox Entertainment (“Fox”), a subsidiary of News Corporation, for approximately $78$192.4 million in cash. Our total net gain from the divestiture was approximately $68.2 million. After giving effect
In August 2007, we issued $1.25 billion principal amount of 3.25% junior subordinated convertible debentures due August 15, 2037, to an initial purchaser in a private offering. We received net proceeds of $1.22 billion after deduction of issuance costs of $25.8 million.
We used the sale, we continueproceeds from the issuance of the convertible debentures to own a majority stake in VeriSign Japan equal torepurchase approximately 54%38.0 million shares of VeriSign Japan’s total shares outstanding. our common stock for an aggregate cost of approximately $1.15 billion.
In the fourth quarter of 2003, VeriSign Japan, completed2007, we recorded an initial public offeringimpairment charge of its common stock. Approximately $37.4$182.2 million, was raised by VeriSign Japan from the initial public offering$62.6 million and through subsequent stock option exercises during the fourth quarter of 2003. VeriSign Japan’s shares began trading on the Tokyo Stock Exchange (“TSE”) on November 19, 2003 under the company code 3722.$4.3 million for goodwill, other intangible assets and property and equipment, respectively, related to our Content Services business reporting unit.
Acquisitions
In October 2004, we acquired the 49% minority interestWe did not make any acquisitions in Jamba! Switzerland for approximately $0.8 million in cash. Jamba! Switzerland is now a wholly-owned subsidiary.fiscal 2007.
In June 2004,2006, we completed our acquisition of Jamba!paid approximately $633.3 million to acquire the following companies:inCode Telecom Group, Inc., a privately held consulting firm for the wireless industry in November 2006;GeoTrust, Inc., a privately-held provider of digital certificates and identity verification solutions in September 2006; m-Qube, Inc., a privately-held mobile channel enabler that helps companies develop, deliver and bill for mobile content, services. We paid approximately $266 million for all the outstanding shares of capital stock of Jamba!, of which approximately $178 million wasapplications and messaging services in cash and the remainder in VeriSign common stock. Also in June 2004, we acquired the 49% minority interest in VeriSign Australia for approximately $4.6 million in VeriSign common stock. VeriSign Australia is now a wholly-owned subsidiary.
In April 2004, we completed our acquisition of the SSL certificate business from EuroTrust A/S, our Nordic region Affiliate program member, for approximately $8.5 million in cash.
In March 2004, we completed our acquisition of the assets of Unimobile, a provider of mobile messaging solutions for carriers and enterprises, for approximately $5 million in cash.
In February 2004, we completed our acquisition of Guardent, Inc., a privately held provider of managed security services. We paid approximately $135 million for all the outstanding shares of capital stock of Guardent, of which approximately $65 million was in cash and the remainder in VeriSign common stock.
In October 2003, we completed our acquisition of UNC-Embratel, the clearinghouse division of Embratel, for approximately $16 million. UNC-Embratel provides call record tracking, clearing and settlement services for a majority of the mobile and fixed telecommunications carriers in Brazil.
In February 2002, we completed our acquisition of H.O. Systems, Inc.May 2006;Kontiki, Inc., a provider of billingbroadband content services in March 2006; 3united Mobile Solutions ag, a provider of wireless application services in February 2006;CallVision, Inc.,a privately-held provider of online analysis applications for mobile communications customers in January 2006; and customer care solutions to wireless carriers. Weother acquisitions that were not material on a individual basis or in the aggregate.
In 2005, we paid approximately $350$436.4 million to acquire the following companies:Retail Solutions International, Inc., a privately-held provider of operational point-of-sale data to the retail industry in cashOctober 2005;Moreover Technologies, Inc., a privately-held wholesale aggregator of real-time internet content in October 2005;siteRock K.K.,a Japan based privately-held remote network monitoring and outage managing handling firm in October 2005;iDefense, Inc., a privately-held provider of detailed intelligence on network-based threats, vulnerabilities and malicious code July 2005;LightSurf Technologies, Inc., a privately-held provider of multimedia messaging and interoperability solutions for all of the outstanding stock of H.O. Systems.wireless market in April 2005; and another acquisition that was not material on an individual basis.
We accountedaccount for all of our significant acquisitions as business combinations using the purchase method of accounting in 2004, 2003 and 2002 as purchase business combinations.accordance with SFAS No. 141, “Business Combinations.” Accordingly, the acquired companies’ revenues, costs and expenses have been included in our results of operations beginning with their dates of acquisition. Additionally, the results of operations of the Network Solutions domain name registrar business have been excluded from our consolidated results of operations since we finalized the sale of the business on November 25, 2003. As a result of our sale of the Network Solutions domain name registrar businessacquisitions in 20032006 and our acquisitions during 2004, 2003 and 2002, comparisons of2005, revenues, costs and expenses for the year ended December 31, 2004 to the years ended December 31, 2003,2007, 2006, and 20022005 may not be relevant, ascomparable.
See Note 3, “Business Combinations,” of our Notes to Consolidated Financial Statements for further information regarding our business acquisitions over the businesses represented in the consolidated financial statements were not equivalent.
Subsequent eventsJoint Ventures
On January 10, 2005,31, 2007, we announced thatentered into two joint venture agreements with Fox, a subsidiary of News Corporation, to provide mobile entertainment to consumers on a global basis. Fox paid VeriSign approximately $192.4 million in cash for a 51% ownership interest in Jamba and we had executedpaid Fox approximately $4.9 million in cash for its contribution of Fox Mobile Entertainment assets. As a definitive agreementresult, Fox owns a 51% interest and VeriSign owns a 49% interest in the joint ventures. We recognized a gain of approximately $68.2 million upon the divestiture of our majority ownership interest in Jamba and recorded our interests in the joint ventures as Investments in unconsolidated entities as of December 31, 2007. During the third quarter of 2007, we invested $17.2 million in the joint ventures pursuant to acquire LightSurf Technologies, Inc. (“LightSurf”).capital calls approved by the board of managers of the joint ventures. The purpose of the capital calls was to fund the ongoing business and working capital needs of the joint ventures. Under the terms of the agreement,joint venture agreements, we have agreed to issueinvest an additional amount of approximately $15.6 million in the two joint ventures. In 2007, we provided a working capital loan of $15.0 million under a promissory note to the joint ventures. This loan is outstanding as of December 31, 2007, and is included in Other assets.
In connection with the joint ventures, VeriSign and Fox entered into various put and call agreements. We calculated the initial fair value of our written call options to be $10.9 million using the Black-Scholes option-pricing model. We recorded the fair value of the call options within other long-term liabilities, and will mark-to-market the call options at each reporting period. For the year ended December 31, 2007, we recorded an unrealized gain of $10.9 million, on joint venture call options within Other income, net.
See Note 2, “Joint Ventures,” of our Notes to Consolidated Financial Statements for further information regarding our joint ventures.
Discontinued Operations
We account for discontinued operations when all criteria of SFAS 144 are met. Accordingly, we have reclassified the financial data for all periods presented to reflect the following discontinued operations:
Jamba Service business
In September 2007, we sold our wholly-owned Jamba Service GmbH subsidiary (“Jamba Service”), which marketed insurance and extended service warranties to consumers for mobile electronic equipment and products, for approximately $12.8 million in cash and recorded a net gain of $1.4 million. Jamba Service operations were recorded through August 31, 2007. Jamba Service was part of the Communications Services Group segment.
Payment Gateway business
On November 18, 2005, we completed the sale of certain assets related to our Payment Gateway business to PayPal, Inc. and PayPal International Limited for $370 million in cash. The Payment Gateway business was part of the Internet Services Group.
Subsequent Events
In January and February of 2008, we repurchased 13.3 million shares of our common stock under the 2006 stock repurchase program for an aggregate cost of $451.9 million. As of February 28, we have approximately $532.7 million available under the 2006 stock repurchase program.
On January 31, 2008, our Board of Directors authorized a stock repurchase program (“2008 stock repurchase program”) having an aggregate purchase price of up to $600 million of our common stock.
On February 8, 2008, we announced that we entered into an Accelerated Share Repurchase (“ASR”) agreement to repurchase $600 million of our common stock under the 2008 stock repurchase program and announced an intent to repurchase up to an additional $200 million in open market transactions under the 2006 stock repurchase program. We paid $600 million to a valuefinancial institution in exchange for a number of approximately $270 million for allshares, which will be determined, subject to a cap, based on market prices during the term of the outstanding capital stock, warrants and vested options of LightSurf andASR agreement. Through February 28, 2008 we received 15.1 million shares under the ASR agreement. We expect to pay certain transaction-related expenses of LightSurf. In addition, we will assume all unvested stock options of LightSurf. LightSurf is a leading privately held provider of multimedia messaging and interoperability solutions forcomplete the wireless market. The transaction is subject to certain closing conditions, including the issuance of a permit from the California Department of Corporations. The transaction is anticipated to closeASR by the end of the firstthird quarter of 2005.2008, although in certain circumstances the completion date may be shortened or extended.
InOn February 20, 2008, our Board of Directors approved the first quartersale of 2005, we completed a settlement of litigation with a telecommunications carrier, resolving disputes over certain tariff charges for SS7 traffic that we passed through to telecommunications carriers who purchased our SS7 services. Under the settlement, the carrier refunded and/or credited certain amounts to us and we refunded and/or credited certain amounts to our customers. As a resultDigital Brand Management Services business unit, one of the settlement, webusinesses within the Internet Services Group. In accordance with SFAS 144, the associated assets and liabilities of this business will record a reduction in cost of revenues of approximately $5 millionbe classified as held for sale and its operations will be reported as discontinued operations in the first quarter of 2005.2008.
Critical accounting policiesAccounting Policies and significant management estimatesSignificant Management Estimates
The discussion and analysis of our financial condition and results of operations are based upon our consolidated financial statements,Consolidated Financial Statements, which have been prepared in accordance with U.S. generally accepted accounting principles. The preparation of these financial statements requires management to make estimates and judgments that affect the reported amounts of assets, liabilities, revenues and expenses, and related disclosures of contingent assets and liabilities. On an ongoing basis, management evaluates its estimates, including those related to revenue recognition, allowance for doubtful accounts, goodwill, long-lived assets, restructuring royalty liabilities,liability, contingent convertible debt, stock-based compensation and deferredincome taxes. Management bases its estimates on historical experience and on various assumptions that are believed to be reasonable under the circumstances, the results of which form the basis for making judgments about the carrying values of assets and liabilities that are not readily available from other sources. Actual results may differ from these estimates under different assumptions or conditions.
We believe the following critical accounting policies have the most significant impact on our judgment and estimates used in preparing our consolidated financial statements:
Revenue recognition
We recognize revenuerevenues in accordance with current generally accepted accounting principles. Revenue recognition requirements are complex rules which require us to make judgments and estimates. In applying our revenue recognition policy, we must determine which portions of our revenue are recognized currently and which portions must be deferred. In order to determine current and deferred revenue, we make judgments and estimates with regard to the products and services to be provided. Our assumptions and judgments regarding products and services could differ from actual events.
Revenues from our consulting services are recognized using either the percentage-of-completion method or on a time-and-materialstime and materials basis as workthe services are performed, or for fixed price consulting as services are performed, completed and accepted. In some cases, fixed price consulting is performed. Percentage-of-completionmeasured using the proportional performance method of accounting. Proportional performance is based upon the ratio of hours incurred to total hours estimated to be incurred for the project. We
have a history of accurately estimating project status and the hours required to complete projects. If different conditions were to prevail such that accurate estimates could not be made, then the use of the completed contract method would be required and all revenue and costs would be deferred until the project was completed. Revenues from time-and-materials are recognized as services are performed.
In June 2006, the FASB issued EITF No. 06-3 (“EITF 06-3”), “How Taxes Collected from Customers and Remitted to Governmental Authorities Should Be Presented in the Income Statement.” EITF 06-3 provides guidance on an entity’s disclosure of its accounting policy regarding the gross or net presentation of certain taxes and provides that if taxes included in gross revenues are significant, a company should disclose the amount of such taxes for each period for which an income statement is presented (i.e., both interim and annual periods). Taxes within the scope of EITF 06-3 are those that are imposed on and concurrent with a specific revenue-producing transaction. We record transaction-based taxes on a net basis. These taxes are recorded as current liabilities until remitted to the relevant government authority.
Allowance for doubtful accounts
We maintain allowances for doubtful accounts for estimated losses resulting from the inability of our customers to make required payments. We regularly review the adequacy of our accounts receivable allowance after considering the size of the accounts receivable balance, each customer’s expected ability to pay and our collection history with each customer. We review significant invoices that are past due to determine if an
allowance is appropriate based on the risk category using the factors described above. In addition, we maintain a general reserve for certain invoices by applying a percentage based on the age category. We also monitor our accounts receivable for concentration to any one customer, industry or geographic region. We require all acquired companies to adopt our credit policies. The allowance for doubtful accounts represents our best estimate, but changes in circumstances relating to accounts receivable may result in a requirement for additional allowances in the future. As of December 31, 2004,2007, the allowance for doubtful accounts represented approximately 5%3% of total accounts receivable, or approximately $11.5$6.3 million. A change of 1%100 basis points in our estimate would amount to approximately $2.1 million.
The following table shows a comparison of our bad debt expense:
| 2007 | 2006 | 2005 | ||||||||
Provision for doubtful accounts | $ | 850 | $ | (1,165 | ) | $ | 1,041 | |||
Valuation of long-livedgoodwill and other intangible assets including goodwill
Our long-livedGoodwill represents the excess of costs over fair value of net assets consistof businesses acquired. Goodwill and other intangible assets acquired in a business combination and determined to have an indefinite useful life are not amortized, but instead tested for impairment at least annually in accordance with the provisions of SFAS No. 142 (“SFAS 142”), “Goodwill and Other Intangible Assets.” In accordance with SFAS 142, such goodwill and other intangible assets may also be tested for impairment between annual tests in the presence of impairment indicators such as: (a) a significant adverse change in legal factors or in the business climate; (b) an adverse action or assessment by a regulator; (c) unanticipated competition; (d) loss of key personnel; (e) a more-likely-than-not expectation of sale or disposal of a reporting unit or a significant portion thereof; (f) testing for recoverability under SFAS 144 of a significant asset group within a reporting unit; (g) recognition of a goodwill impairment loss in the financial statements of a subsidiary that is a component of a reporting unit.
We performed our annual impairment tests as of June 30, 2007, 2006 and 2005. The fair value of our reporting units is determined using either the income or the market valuation approach or a combination thereof. Under the income approach, the fair value of the reporting unit is based on the present value of estimated future cash flows that the reporting unit is expected to generate over its remaining life. Under the market approach, the value of the reporting unit is based on an analysis that compares the value of the reporting unit to values of publicly traded companies in similar lines of business. In the application of the income and market valuation approaches, we are required to make estimates of future operating trends and judgments on discount rates and other variables. Actual
future results related to assumed variables could differ from these estimates. There were no impairment charges for goodwill from the annual impairment tests conducted as of June 30, 2007, 2006 and 2005.
At December 31, 2007, we performed an additional impairment test primarily as a result of our decision to divest our non-core businesses. As a result of the impairment test, we recorded an impairment charge of $182.2 million, $62.6 million and $4.3 million for goodwill, other intangible assets and property and equipment. We review, at least annually, goodwill resulting from purchaseequipment, respectively, related to our Content Services business combinations for impairment in accordance with Statement of Financial Accounting Standards (“SFAS”) No. 142, “Goodwillreporting unit. See Note 7, “Goodwill and Other Intangible Assets.Assets,” of our Notes to Consolidated Financial Statements for further information.
The process of evaluating the potential impairment of goodwill is highly subjective and requires significant judgment at many points during the analysis. In estimating the fair value of the businesses with recognized goodwill for the purposes of its annual or periodic analyses, the Company makes estimates and judgments about the future cash flows of these businesses. Although the Company’s cash flow forecasts are based on assumptions that are consistent with the plans and estimates it is using to manage the underlying businesses, there is significant judgment in determining the cash flows attributable to these businesses over their estimated remaining useful lives. The Company also considers its market capitalization on the date it performs the analysis.
As the Company divests its non-core businesses, it may incur further charges for impairment of goodwill in the future if the net book value of its reporting units exceeds the estimated fair value. Any additional future impairment charges could adversely affect the Company’s earnings.
Valuation of long-lived assets”
Our long-lived assets consist primarily of property and equipment and purchased intangible assets subject to amortization. We review long-lived assets including certain identifiable intangibles, for impairment whenever events or changes in circumstances indicate that we will not be able to recover the asset’s carrying amount in accordance with SFAS No. 144, “Accounting for the Impairment or Disposal of Long-Lived Assets.”144. Such events or circumstances include, but are not limited to, a significant decrease in the fair value of the underlying business or asset, a significant decrease in the benefits realized from the acquired business, difficulty and delays in integrating the business or a significant change in the operations of the acquired business or use of an asset.
Recoverability of long-lived assets other than goodwill is measured by comparison of the carrying amount of an asset to estimated undiscounted cash flows expected to be generated by the asset. If the carrying amount of an asset exceeds its estimated future cash flows, an impairment charge is recognized by the amount by which the carrying amount of the asset exceeds its fair value.
Goodwill and other intangible assets, net of accumulated amortization, totaled approximately $969.2 million at December 31, 2004, which was comprised of $725.4 million of goodwill and $243.8 million of other intangible assets. Other intangible assets include customer relationships, technology in place, carrier relationships, non-compete agreements, trade names, and customer lists. Factors we consider important which could trigger an impairment review include, but are not limited to, significant under-performance relative to expected historical or projected future operating results, significant changes in the manner of our use of our acquired assets or the strategy for our overall business or significant negative economic trends. If this evaluation indicates that the value of an intangible asset may be impaired, an assessment of the recoverability of the net carrying value of the asset over its remaining useful life is made. If this assessment indicates that an intangible asset is not recoverable, based on the estimated undiscounted future cash flows or other comparable market valuations, of the entity or technology acquired over the remaining amortization period, the net carrying value of the related intangible asset will be reduced to fair value and the remaining amortization period may be adjusted. Any such impairment charge could be significant and could have a material adverse effect on our reported financial statements. It is our policy to engage third party valuation consultants to assist us in the measurement of the fair value of our long-lived intangible assets including goodwill.
Restructuring and Other Chargescharges
In November 2003, we initiated aWe record restructuring plancharges related to workforce reduction in accordance with SFAS No. 112 (“SFAS 112”),“Employers’ Accounting for Postemployment Benefits an amendment of FASB Statements No. 5 and 43,” since benefits are provided pursuant to a severance plan which uses a standard formula of paying benefits based upon tenure with the saleCompany. The accounting for such restructuring charges meets the four requirements of SFAS 112 which are: (i) our Network Solutions businessobligation relating to employees’ rights to receive compensation for future absences is attributable to employees’ services already rendered; (ii) the obligation relates to rights that vest or accumulate; (iii) payment of the compensation is probable; and (iv) the realignment of other business units. In April 2002, we initiated plansamount can be reasonably estimated.
We record restructuring charges related to restructure our operations to fully rationalize, integrate and align our resources. Both plans resulted in reductions in workforce, abandonment of excess facilities disposal of property and equipment and other charges. We expect theseexit costs in accordance with SFAS No. 146 (“SFAS 146”), “Accounting for Costs Associated with Exit or Disposal Activities.”SFAS 146 requires that a liability for costs associated with an exit or disposal activity be measured and recognized initially at fair value only when the liability is incurred. Excess facilities restructuring plans to be completed in 2014 upon the expiration of our lease obligations for abandoned facilities. Restructuring charges take into account the fair value of lease obligations of the abandoned space, including the potential for sublease income. Estimating the amount of sublease income requires management to make estimates for the space that will be rented, the rate per square foot that might be received and the vacancy period of each property. These estimates could differ materially from actual amounts due to changes in the real estate markets in which the properties are located, such as the supply of
office space and prevailing lease rates. Changing market conditions by location and considerable work with third-party leasing companies require us to periodically review each lease and change our estimates on a prospective basis, as necessary. During 2004, we recorded net restructuring reversals of approximately $1.3 million related to excess facilities as a result of reductions in lease obligations. Such estimates will likely be revised in the future. If sublease rates continue to change in these markets, or if it takes longer than expected to sublease these facilities, the actual lease expense could exceed this estimate by an additional $32.6 million over the next ten years relating to our restructuring plans.
Provision for royalty liabilities for intellectual property rights
Certain of our mobile content services utilize intellectual property owned or held under license by others. Where we have not yet entered into a license agreement with a holder, we record a provision for royalty payments that we estimate will be due once a license agreement is concluded. We estimate the royalty payments based on the prevailing royalty rate for the type of intellectual property being utilized. Our estimates could differ materially from the actual royalties to be paid under any definitive license agreements that may be reached due to changes in the market for such intellectual property, such as a change in demand for a particular type of content, in which case we would record a royalty expense materially different than our estimate.
Income TaxesContingent convertible debentures
We account for our contingent convertible debentures and related provisions in accordance with the provisions of EITF No. 98-5, “Accounting for Convertible Securities with Beneficial Conversion Features orContingently Adjustable Conversion Ratios,” EITF No. 00-27, “Application of Issue No. 98-5 to Certain Convertible Instruments,” EITF No. 00-19, “Accounting for Derivative Financial Instruments Indexed to, andPotentially Settled in, a Company’s Own Stock,” and EITF No. 01-6, “The Meaning of ‘Indexed to a Company’sOwn Stock’,”EITF No. 04-08 (“EITF 04-08”), “The Effect of Contingently Convertible Debt on Diluted Earnings Per Share” and EITF 90-19, “Convertible Bonds with Issuer Option to Settle for Cash upon Conversion.” We also evaluate the instruments in accordance with SFAS No. 133 (“SFAS 133”), “Accounting for Derivative Instruments and Hedging Activities,” which requires bifurcation of embedded derivative instruments and measurement of fair value for accounting purposes. EITF 04-08 requires us to include the dilutive effect of the shares of our common stock issuable upon conversion of the outstanding convertible debentures in our diluted income per share calculation regardless of whether the market price trigger or other contingent conversion feature has been met. We apply the treasury stock method as we have the intent and the current ability to settle the principal amount of the convertible debentures in cash. This method results in incremental dilutive shares when the average fair value of our common stock for a reporting period exceeds the initial conversion price per share of $34.37.
We consider the embedded features related to the contingent interest payments, over-allotment option, and our ability to make specific types of distributions (e.g., extraordinary dividends) to qualify as derivatives, and bundle them as a compound embedded derivative under SFAS 133. The fair value of the derivative at the date of issuance of the debentures is accounted for as a discount on the debentures. The over-allotment feature which was revalued on the date of exercise is accounted for as a premium on the debentures. The debt discount and the debt premium are being accreted to the face value of the debentures as interest expense, net, over the maturity period of the debentures. Any change in the fair value of this embedded derivative is recognized as an unrealized gain or loss in Other income, net.
We account for our investments in joint ventures as equity method investments, based on our ability to exert significant influence but not control over the joint ventures. VeriSign records its investments at the amount of capital contributed plus its percentage interest in the joint ventures’ earnings or loss. We regularly review the operating and financial results based on information provided by these joint ventures, and determine the fair values of these investments based on a valuation performed using the income approach and the market approach. If it is determined that an other-than-temporary decline exists in the fair values of these investments, we write down the investments to their fair value and record the related impairments in earnings from unconsolidated entities.
Stock-based compensation
Effective January 1, 2006, we adopted the provisions of SFAS No. 123R (“SFAS 123R”), “Share-Based Payment.” SFAS 123R replaced SFAS No. 123 (“SFAS 123”), “Accounting for Stock-Based Compensation,” and superseded Accounting Principles Board Opinion No. 25 (“APB 25”), “Accounting for Stock Issued to Employees.” We elected the modified prospective application method, under which prior periods are not revised for comparative purposes. The valuation provisions of SFAS 123R apply to new grants and to grants that were outstanding as of the effective date and are subsequently modified. For stock-based awards granted on or after January 1, 2006, we will amortize stock-based compensation expense on a straight-line basis over the requisite service period, which is the vesting period. Estimated compensation for grants that were outstanding as of the effective date will be recognized over the remaining service period using the compensation costs estimated for the SFAS 123 pro forma disclosures.
We currently use the Black-Scholes option pricing model to determine the fair value of stock options and employee stock purchase plan shares. The determination of the fair value of stock-based awards on the date of grant using an option-pricing model is affected by our stock price as well as assumptions regarding a number of complex and subjective variables. These variables include our expected stock price volatility over the term of the awards, actual and projected employee stock option exercise behaviors, risk-free interest rate and expected dividends.
We estimate the expected term of options granted based on observed and expected time to post-vesting exercise and/or cancellations. Expected volatility is based on the combination of historical volatility of our common stock over the period commensurate with the expected life of the options and the mean historical implied volatility from traded options. We base the risk-free interest rate that we use in the option pricing model on U.S. Treasury zero-coupon issues with remaining terms similar to the expected term on the options. We do not anticipate paying any cash dividends in the foreseeable future and therefore use an expected dividend yield of zero in the option pricing model. We are required to estimate forfeitures at the time of grant and revise those estimates in subsequent periods if actual forfeitures differ from those estimates. We use historical data to estimate pre-vesting option forfeitures and record stock-based compensation expense only for those awards that are expected to vest. All stock-based awards are amortized on a straight-line basis over the requisite service periods of the awards, which are generally the vesting periods.
We use the Monte-Carlo simulation option-pricing model to determine the fair value of market-based awards. The Monte-Carlo simulation option-pricing model takes into account the same input assumptions as the Black-Scholes model; however, it also further incorporates into the fair-value determination, the possibility that the market condition may not be satisfied and the impact of the possible differing stock price paths. Compensation costs related to awards with a market-based condition will be recognized regardless of whether the market condition is satisfied, provided that the requisite service has been provided. The stock-based compensation expense for market-based awards is recognized on a straight-line basis over the requisite service period for each such award.
If factors change and we employ different assumptions for estimating stock-based compensation expense in future periods or if we decide to use a different valuation model, the future periods may differ significantly from what we have recorded in the current period and could materially affect our operating income, net income and net income per share.
See Note 13, “Stock-Based Compensation,” of our Notes to Consolidated Financial Statements for further information regarding the SFAS 123R disclosures.
Income taxes under
We adopted FASB Interpretation Number 48 (“FIN 48”), “Accounting for Uncertainty in Income Taxes—an interpretation of FASB Statement No. 109,”on January 1, 2007. FIN 48 is an interpretation of SFAS No. 109, “Accounting for Income Taxes,”” which involves and it seeks to reduce the evaluationdiversity in practice associated with certain aspects of measurement and recognition in accounting for income taxes. FIN 48 prescribes a recognition threshold and measurement attribute for the financial statement recognition and measurement of a numbertax position that an entity takes or expects to take in a tax return. Additionally, FIN 48 provides guidance on de-recognition, classification, interest and penalties, accounting in interim periods, disclosures, and transition. Under FIN 48, an entity may only recognize or continue to recognize tax positions that meet a “more likely than not” threshold. In accordance with our accounting policy, we recognize accrued interest and penalties related to unrecognized tax benefits as a component of factors concerning the realizabilityincome tax expense. The cumulative effect of our deferred tax assets. In concluding thatadopting FIN 48 was a valuation allowance is required to be applied to certaindecrease in income taxes payable of $9.3 million, an increase in long-term deferred tax assets of $26.2 million, and a decrease in the January 1, 2007, accumulated deficit balance of $35.5 million. Included in this amount is an adjustment made by the Company to increase accumulated deficit by $2.5 million in the fourth quarter of 2007. At the adoption date of January 1, 2007, we considered such factors as our historyhad an unrecognized tax benefit for income taxes associated with uncertain tax positions of operating losses, our uncertainty as to the projected long-term operating results, and the nature$45.0 million. As of December 31, 2007, this amount was $41.4 million.
See Note 14, “Income Taxes,” of our deferred tax assets. Although our operating plans assume taxableNotes to Consolidated Financial Statements for further information regarding the adoption of FIN 48.
Discontinued Operations
In accordance with SFAS 144, we report businesses or asset groups as discontinued operations when the operations and operating income in future periods, our evaluation of allcash flows of the business or asset group have been or will be eliminated, when we will not have any continuing involvement with the business or asset group after the disposal transaction, and when we have met the following additional six criteria:
Management with the authority to do so, commits to a plan to sell the business or asset group;
The business or asset group is available evidence in assessingfor immediate sale;
An active program to sell the realizabilitybusiness or asset group has been initiated;
The sale of the deferred tax assets indicated that such plans were not considered sufficient to overcome the available negative evidence. business or asset group is probable within one year;
The possible future reversalmarketed sales value of the valuation allowancebusiness or asset group is reasonable in relation to its current fair value; and
It is unlikely that the plan to sell the business or asset group will result in future income statement benefit to the extent the valuation allowance was applied to deferred taxbe significantly altered or withdrawn.
We did not have any assets generated through ongoing operations. To the extent the valuation allowance relates to deferred tax assets generated through stock compensation deductions, the possible future reversalheld for sale as of such valuation allowance will result in a credit to additional paid-in capital and will not result in future income statement benefit.
Results of Operations
The following table sets forth selected information regarding our results of operations as a percentage of revenues:
| Year Ended December 31, | |||||||||
| 2007 | 2006 | 2005 | |||||||
Revenues | 100 | % | 100 | % | 100 | % | |||
Costs and expenses | |||||||||
Cost of revenues | 40 | 37 | 32 | ||||||
Sales and marketing | 18 | 24 | 30 | ||||||
Research and development | 11 | 8 | 6 | ||||||
General and administrative | 18 | 16 | 11 | ||||||
Restructuring, impairments and other charges (reversals), net | 7 | — | 1 | ||||||
Impairment of goodwill | 12 | — | — | ||||||
Amortization of other intangible assets | 8 | 8 | 6 | ||||||
Acquired in-process research and development | — | 1 | — | ||||||
Total costs and expenses | 114 | 94 | 86 | ||||||
Operating (loss) income | (14 | ) | 6 | 14 | |||||
Other (loss) income, net | 6 | 3 | 3 | ||||||
(Loss) income from continuing operations before income taxes, earnings from unconsolidated entities and minority interest | (8 | ) | 9 | 17 | |||||
Income tax (expense) benefit | (1 | ) | 16 | (6 | ) | ||||
Loss from unconsolidated entities, net of tax | — | — | — | ||||||
Minority interest, net of tax | — | — | — | ||||||
Net (loss) income from continuing operations | (9 | ) | 25 | 11 | |||||
Net income from discontinued operations, net of tax | — | — | — | ||||||
Gain on sale of discontinued operations, net of tax | — | — | 16 | ||||||
Net (loss) income | (9 | )% | 25 | % | 27 | % | |||
Revenues by Segment
In 2004,2007, 2006 and 2005, we had two reportable segments: the Internet Services Group and the Communications Services Group. In 2003, we had three reportable segments: the Internet Services Group, the Communications Services Group and Network Solutions. As a result of our sale of the Network Solutions domain name registrar business on November 25, 2003, we do not recognize revenues from this segment other than revenues that may be recognized in connection with registry or other services we may provide to Network Solutions as a customer. A comparison of revenues for the years ended December 31, 2004, 2003 and 2002from continuing operations is presented below.below:
| 2004 | % Change | 2003 | % Change | 2002 | 2007 | % Change | 2006 | % Change | 2005 | |||||||||||||||||||||
| (Dollars in thousands) | (Dollars in thousands) | |||||||||||||||||||||||||||||
Internet Services Group | $ | 564,148 | 29 | % | $ | 436,216 | (17 | )% | $ | 524,765 | $ | 916,984 | 21 | % | $ | 758,763 | 20 | % | $ | 633,784 | ||||||||||
Communications Services Group | 602,307 | 48 | % | 406,745 | 5 | % | 385,734 | 579,305 | (28 | )% | 804,235 | (17 | )% | 970,793 | ||||||||||||||||
Network Solutions | — | (100 | )% | 211,819 | (32 | )% | 311,169 | |||||||||||||||||||||||
Total revenues | $ | 1,166,455 | 11 | % | $ | 1,054,780 | (14 | )% | $ | 1,221,668 | $ | 1,496,289 | (4 | )% | $ | 1,562,998 | (3 | )% | $ | 1,604,577 | ||||||||||
Total revenues increased approximately $111.7 million in 2004, as compared to 2003, due to revenue increases in both our Internet Services Group and Communications Services Group, partially offset by the loss of revenues as a result of the sale of our Network Solutions domain name registrar business in November 2003. Total revenues decreased approximately $166.9 million in 2003, as compared to 2002, due to decreases in both our Internet Services Group and Network Solutions, partially offset by an increase in revenues in our Communications Services Group.
Internet Services Group(ISG)
Internet Services Group revenues increased approximately $127.9 million in 2004, as2007 compared to 2003, primarily due to increases in2006: Revenues from our ISG increased by approximately $158.2 million. Our Naming and Directory Services and Security Services revenues of approximately $65.1 million and $62.8 million, respectively. Naming and Directory Services revenues increased as$91.9 million due to a result of recognizing revenues from Network Solutions, that were previously eliminated prior to the sale of this business. In addition, we experienced an24% increase in the number of active domain names ending in.com and.net under management. The growth in.com and.netdomain names was driven by continued global Internet adoption and strong renewal rates of existing domains. Our Information and Security Services revenuerevenues increased $55.7 million primarily due to a $43.9 million increase in SSL Certificate services revenues that was the result of a 16% increase in the installed base of SSL certificates and recognizing a full year of revenues from the GeoTrust acquisition in late 2006. Additional increases in our Information and Security Services revenues were primarily due to increases in our VeriSign Identity Protection services and our United Authentication services that was the result of an increase in demand for secure real-time validation capabilities.
2006 compared to 2005: Revenues from our ISG increased by approximately $125.0 million. Our Naming Services revenues increased $69.4 million due to a 30% increase in the number of active domain names ending in.com and.net under management. Our Information and Security Services revenues increased $55.6 million primarily due to a $29.3 million increase in SSL certificate revenues that was the result of a 65% increase in the installed base of SSL certificates, an $11.9 million increase in our managed security services and security consulting revenues, and a $14.4 million increase in other information services revenuesrevenues. The 65% increase in the installed base of $18.5 millionSSL certificates was primarily attributabledue to the 259,000 additional certificates acquired as a result of the acquisition of GuardentGeoTrust in February 2004 and increases in Web site digital certificate revenue and secure payments services revenueSeptember of $22.3 million and $10.2 million, respectively.
Internet Services Group revenues decreased approximately $88.5 million in 2003 compared to 2002 due to a decline in Security Services revenues2006. Excluding the GeoTrust transaction, the installed base of approximately $123.0 million resulting from the discontinuation of third party product sales and related consulting and support services and a decline in revenues from VeriSign Affiliates of $19.0 million. The decreases in revenues were partially offset by an increase in revenues of $10.1 million from our secure payments services, an increase in Web site digital certificate revenue of $23.5 million and an increase in Naming and Directory Services revenues of $20.8 million.SSL certificates would have increased 12% year-over-year.
The following table compares active domain names ending in.com and.net managed by our Naming and DirectoryInformation Services business and the approximate installed base of Web site digitalSSL certificates in our commerce site services business and the approximate number of active online merchants in our secured payments services business as of the end of each year presented:
| December 31, 2004 | % Change | December 31, 2003 | % Change | December 31, 2002 | ||||||||
Active domain names ending in .com and .net | 38.4 million | 26 | % | 30.4 million | 18 | % | 25.8 million | |||||
Installed base of Web site digital certificates | 455,000 | 18 | % | 384,000 | (2 | )% | 392,000 | |||||
Active online merchants | 127,000 | 25 | % | 102,000 | 23 | % | 83,000 |
| December 31, 2007 | % Change | December 31, 2006 | % Change | December 31, 2005 | ||||||||
Active domain names ending in.comand .net | 80.4 million | 24 | % | 65.0 million | 30 | % | 50.0 million | |||||
Installed base of SSL certificates | 938,000 | 16 | % | 807,000 | 65 | % | 489,000 |
We expect InternetCommunications Services Group revenues will continue to grow in 2005 as demand for our Naming and Directory Services and Security Services is expected to grow.(CSG)
Communications Services Group
Communications Services Group revenues increased approximately $195.6 million in 2004, as2007 compared to 2003,2006: Revenues from our CSG decreased approximately $224.9 million, primarily due to ana decrease in revenues directly related to the divestiture of our majority ownership interest in our Jamba business unit in January 2007. In 2007, we recognized one month of Jamba revenues totaling $23.8 million and in 2006 we recognized twelve months of Jamba revenues totaling $285.4 million. Our Commerce and Communications Services revenues decreased by $41.0 million primarily due to a $21.4 million decrease in commerce and billing services revenues and a $19.6 million decrease in communication services revenues. The decrease in revenues from commerce and billing services was primarily due to a $20.6 million decline in payment service revenues and the decrease in revenues from communications services was primarily due to
declines in revenues from connectivity and signaling services and intelligent data base services that resulted from continued industry consolidation among telecommunication companies and pricing pressures. These declines were offset by a $44.9 million increase in mobile contentprofessional communications consulting services revenues of $180.8 million attributablewhich was primarily due to our acquisition of Jamba!inCode in June 2004. In addition, intelligent database servicesDecember 2006, and a $32.4 million increase in Content Services revenues increased approximately $15.0 millionwhich was primarily due to increases in calling name (CNAM) and local and wireless number portability revenues. Applications services revenues increased $3.5 million due to increases in messaging services traffic. Billing and payment services revenues declined $8.8 million primarily due to pricing reductions for these services and loss of customers due to consolidation in the telecommunications industry. Clearing and settlement services increased $5.3 million primarily from increases in revenues from VeriSign Brazil reflecting the inclusion ofrecognizing a full year of revenues from this subsidiary that was acquired in October 2003.2007 for acquisitions in 2006.
2006 compared to 2005: Revenues from our CSG decreased approximately $166.6 million primarily due to a decrease in our Content Services revenues, which includes our digital content, messaging and mobile delivery services, of $159.4 million. The decrease in content services revenues was primarily due to a $237.7 million decrease in revenues from Jamba, partially offset by a $26.0 million increase in messaging services revenues and a $46.2 million increase in revenues as a result of 2006 acquisitions. The decline in our Content Services business was primarily attributable to increased pricing pressure and a decline in the number of subscribers. Our Commerce and Communications Services Group revenues increased approximately $21.0decreased by $7.8 million in 2003, as compared to 2002, as2005. The decrease in revenues was primarily due to a $13.4 million decrease in clearing and settlement services and a $6.7 million decrease in connectivity and database services. These declines were primarily due to industry consolidation and pricing pressures. These declines were partially offset by $6.4 million increase in revenues from billing and payment services, which was primarily due to the result of an increase in clearing and settlement services revenues of $18.2 million and an increase in network connectivity and interoperability revenues of $1.0 million. These increases were partially offset by a decline in CNAM revenues of $2.2 million.
The following table compares the approximate number of annual database queries and communications services customers as of the end of each year presented:
| December 31, 2004 | % Change | December 31, 2003 | % Change | December 31, 2002 | ||||||||
Annual database queries | 47.3 billion | 44 | % | 32.8 billion | 13 | % | 28.9 billion | |||||
Communications services customers (1) | 1,275 | 8 | % | 1,177 | 14 | % | 1,035 |
We expect Communications Services Group revenues will increasesubscribers. Revenues in 2005 principally2006 include $57.8 million in additional revenue as a result of growthacquisitions in mobile content and applications revenues.2006.
Network Solutions
We completed the sale of our Network Solutions domain name registrar business on November 25, 2003 and recognized no revenues from this segment in 2004. We will not recognize any revenue from the Network Solutions business in the future, other than revenues that may be recognized in connection with registry or other services we may provide to Network Solutions as a customer. Network Solutions revenues declined $99.4 million in 2003 compared to 2002 principally due to weaker demand for new domain name registrations and a decline in total domain names under management. Active domain names under management were approximately 8.2 million names as of November 25, 2003, the date we sold Network Solutions, compared to 9.3 million at December 31, 2002. In addition, the revenue decline reflects the completion of the sale of the Network Solutions domain name registrar business on November 25, 2003 which resulted in 329 days of consolidated revenues for 2003 compared to a full year in 2002.
Revenues by Geographic Region
Our revenues are broken out into three geographic regions consisting of the Americas, EMEA and APAC. The following table showspresents a comparison of our continuing revenues by geographic region for each year presented:region:
| 2004 | 2003 | 2002 | |||||||
| (In thousands) | |||||||||
Americas: | |||||||||
United States | $ | 843,604 | $ | 941,913 | $ | 1,115,731 | |||
Other (1) | 19,734 | 13,080 | 6,343 | ||||||
Total Americas | 863,338 | 954,993 | 1,122,074 | ||||||
EMEA (2) | 237,310 | 48,217 | 54,345 | ||||||
APAC (3) | 65,807 | 51,570 | 45,249 | ||||||
Total revenues | $ | 1,166,455 | $ | 1,054,780 | $ | 1,221,668 | |||
| Year Ended December 31, | |||||||||
| 2007 | 2006 | 2005 | |||||||
| (In thousands) | |||||||||
Americas: | |||||||||
United States | $ | 1,248,071 | $ | 1,104,594 | $ | 1,012,448 | |||
Other (1) | 34,028 | 40,119 | 25,214 | ||||||
Total Americas | 1,282,099 | 1,144,713 | 1,037,662 | ||||||
EMEA (2) | 116,899 | 300,635 | 468,308 | ||||||
APAC (3) | 97,291 | 117,650 | 98,607 | ||||||
Total revenues | $ | 1,496,289 | $ | 1,562,998 | $ | 1,604,577 | |||
| (1) | Canada and Latin America |
| (2) | Europe, the Middle East and Africa (“EMEA”) |
| (3) | Australia, Japan and Asia Pacific (“APAC”) |
2007 compared to 2006: Revenues decreased $91.7increased approximately $137.4 million in the Americas region in 2004 as compared to 2003 primarily as a result of the saleincrease in domain names ending in.com and.netunder management coupled with an increase in the installed base of Network Solutions in November 2003.SSL certificates. Revenues in our EMEA region increased $189.1decreased approximately $183.7 million in the same period primarily due to the acquisitiondivestiture of Jamba!our majority ownership interest of our Jamba business unit. Revenues in June 2004, which contributedour APAC region decreased approximately $180.8$20.4 million primarily due to the divestiture of our majority ownership interest in our Jamba business unit in the region, offset by an increase in security services revenues in both Japan and Australia.
2006 compared to 2005: Revenues increased approximately $107.1 million in 2004. In addition, increasesthe Americas region primarily as a result of the increase in domain names ending in.com and.netunder management coupled with an increase in the installed base of SSL certificates. Revenues in our web certificate and managed PKI sales in EMEA also contributed to the increase, partially offset by decreases in our VeriSign Affiliate revenue as we continued to moveregion decreased approximately $167.7 million primarily due to a direct distribution model through international subsidiariesdecrease in certain larger European markets.revenues from Jamba business unit in the region. The increase in APAC revenues of $14.2approximately $19.0 million in 2004 as compared to 2003 was primarily relatedattributed to increased enterprise security salesrevenues in both the Japan and Australian markets, partially offset by a decreaseAustralia and increased managed security services revenue in VeriSign Affiliate revenue.Japan.
Revenues decreased $167.1 million
We primarily operate in the Americas regionUnited States, Europe, Japan, Australia, Latin America, South Africa and India. In general, revenues are attributed to the country in 2003 as comparedwhich the contract originated. However, revenues from all digital certificates issued from the Mountain View, California facility and domain names issued from the Dulles, Virginia facility are attributed to 2002 primarily as a resultthe United States because it is impracticable to determine the country of the discontinuation of third party product sales and the related support services in the fourth quarter of 2002. The decrease in EMEA revenues of $6.1 million in 2003 compared to 2002 is primarily related to a decrease in VeriSign Affiliate revenue partially offset by increases in web certificate and managed PKI revenues. The increase in APAC revenues of $6.3 million in 2003 compared to 2002 is primarily related to an increase in enterprise security sales in both the Japan and Australian markets, partially offset by a decrease in VeriSign Affiliate revenue.
We expect international revenues will increase in absolute dollars and as a percentage of revenues in 2005.origin.
Costs and Expenses
Operating costs and expenses decreased by $248.3 million, or 19%, to $1,034.7 million during fiscal 2004 compared with the prior year. This was primarily due to a decrease in the charges we incurred for the amortization and impairment of other intangible assets related to our acquisitions. Amortization and impairment charges totaled approximately $79.4 million in 2004 compared to $335.5 million in 2003. Additionally, there were decreases in restructuring and other charges of $49.9 million, offset by increases of $58.2 million in sales and marketing expenses and $11.5 million in research and development expenses in 2004 compared to 2003.
We restructured our business in April of 2002 and again in November of 2003. As a result of these restructurings, and as a result of the sale of our Network Solutions business, we have experienced a significant reduction in overall costs in 2004 compared to 2003.
The following table shows a comparison of our employee headcount by function as of the end of each year presented:
| December 31, 2004 | % Change | December 31, 2003 | % Change | December 31, 2002 | ||||||||
Employee headcount: | ||||||||||||
Cost of revenues | 1,500 | 32 | % | 1,136 | (24 | )% | 1,500 | |||||
Sales and marketing | 708 | 28 | % | 552 | (20 | )% | 693 | |||||
Research and development | 430 | 60 | % | 269 | (32 | )% | 398 | |||||
General and administrative | 568 | 11 | % | 514 | (15 | )% | 602 | |||||
Total | 3,206 | 30 | % | 2,471 | (23 | )% | 3,193 | |||||
Excluding the effects of any future acquisitions or dispositions, we expect our employee headcount to increase in 2005 across all business units and corporate services. As a result of our acquisition of Guardent and Jamba! we added approximately 700 employees to our overall headcount, primarily in the cost of revenues function. The sale of our Network Solutions business in November 2003 resulted in a headcount reduction of 577 employees, primarily in the cost of revenues function.
Cost of revenuesRevenues
Cost of revenues consistsconsist primarily of content licensing costs, carrier costs for our SS7 and IP-based networks, costs related to providing digital certificate enrollment and issuance services, paymentbilling services, operational costs for the domain name registration business, customer support and training, consulting and development services, operational costs related to the management and monitoring of our clients’ network security infrastructures, content licensinglabor costs carrier costs for our SS7to provide security and IP-based networkscommunications consulting, and costs of facilities and computer equipment used in these activities.
A comparison of cost of revenues for the years ended December 31, 2004, 2003 and 2002 is presented below.below:
| 2004 | % Change | 2003 | % Change | 2002 | ||||||||||||||
| (Dollars in thousands) | ||||||||||||||||||
Cost of revenues | $ | 444,759 | (0.3 | )% | $ | 446,207 | (22 | )% | $ | 571,367 | ||||||||
Percentage of revenues | 38 | % | 42 | % | 47 | % | ||||||||||||
| 2007 | % Change | 2006 | % Change | 2005 | |||||||||||
| (Dollars in thousands) | |||||||||||||||
Cost of revenues | $ | 596,517 | 4 | % | $ | 574,762 | 13 | % | $ | 508,509 | |||||
2007 compared to 2006:Cost of revenues decreasedincreased approximately $1.4$21.8 million in 2004, as compared to 2003, primarily due to recognizing a decreasefull year of $69.5expenses for the acquisition of inCode in November 2006, partially offset by a reduction of expenses due to the divestiture of our majority ownership interest of our Jamba business unit in January 2007. Salary and employee benefits increased by $20.2 million, primarily due to company-wide merit pay increases in base pay and recognizing a full year of salary expenses that was a result of the acquisition of inCode, GeoTrust and m-Qube during the latter half of 2006. Stock-based compensation expense increased approximately $5.0 million primarily due to an increase in the issuances of restricted stock to employees and a modification expense pertaining to our employee stock purchase plan that allowed employees to increase their contribution withholding percentages in 2007. Depreciation expense increased approximately $8.1 million primarily due to an increase in capitalized projects placed into service and telecommunication expenses increased by $10.7 million primarily due to additional bandwidth costs needed to support our 2006 acquisitions. Expenses related primarily to redeployed employees of $11.5 million were included in cost of revenues from the general and administrative expenses category due to the realignment of business divisions as a result of the sale of the Network Solutions domain name registrar business, which was offset by increases attributable to the acquisitions of Jamba! and Guardent of $49.8 million and $15.3 million, respectively.
Cost of revenues decreased $125.2 million in 2003, as compared to 2002 primarily due to our transition out of the third-party product reseller and the third-party product training businesses. This transition accounted for a decrease of approximately $105.9 million. Also, compensation costs decreased approximately $9.6 million in 2003, as compared to 2002, due to a reduction in employee headcount related to our2007 restructuring plans announced in 2002 and 2003, while contract and professional services fees declined approximately $12.0 million in 2003, as compared to 2002, due primarily to the discontinuation of certain outsourced customer service centers for our Network Solutions registrar business.
As a percentage of revenues,plan. Direct cost of revenues decreased during 2004 asby $23.0 million primarily due to a discontinuance of product lines and a reduction in spending that was a result of management’s strategy to reduce costs. Contract and professional services decreased by approximately $13.3 million primarily due to reduction in third party costs associated with our acquisitions.
2006 compared to 20032005: Cost of revenues increased approximately $66.3 million primarily due to the salebusiness acquisitions completed during 2006 and a full year of expenses for the Network Solutions business which was a business with higheracquisitions completed in 2005. Salary and employee benefit costs of revenue as a percentage of revenue than our other two business segments.
We anticipate that our overall cost of revenues will increase in 2005, but that our overall cost of revenues as a percentage of revenues will stay flat or decrease modestly in 2005increased approximately $38.4 million primarily due to greater cost efficiencies from our current businessesa 30% increase in headcount primarily related to completed business acquisitions in 2006, merit increases and recently acquired businesses, particularly mobile content services.
Sales and marketingMarketing
Sales and marketing expenses consist primarily of costs related to sales, marketing and policy activities. These expenses include salaries, sales commissions, sales operations and other personnel-related expenses, travel and related expenses, trade shows, costs of lead generation, costs of computer and communications equipment
and support services, facilities costs, consulting fees and costs of marketing programs, such as Internet,internet, television, radio, print and direct mail advertising costs.
A comparison of sales and marketing expenses for the years ended December 31, 2004, 2003 and 2002 is presented below.below:
| 2004 | % Change | 2003 | % Change | 2002 | ||||||||||||||
| (Dollars in thousands) | ||||||||||||||||||
Sales and marketing | $ | 253,480 | 30 | % | $ | 195,330 | (21 | )% | $ | 248,170 | ||||||||
Percentage of revenues | 22 | % | 19 | % | 20 | % | ||||||||||||
| 2007 | % Change | 2006 | % Change | 2005 | |||||||||||
| (Dollars in thousands) | |||||||||||||||
Sales and marketing | $ | 276,632 | (27 | )% | $ | 376,508 | (21 | )% | $ | 477,752 | |||||
Sales and marketing expenses increased approximately $58.2 million in 2004 as2007 compared to 2003, primarily due to our acquisitions of Jamba! and Guardent, which had sales and marketing expenses of $80.5 million and $8.8 million, respectively, that were partially offset by a decrease of $38.3 million in sales and marketing expenses due to the sale of our Network Solutions domain name registrar business. Additionally, we experienced an increase of approximately $7.1 million in advertising and marketing costs during this period primarily as a result of increased corporate brand advertising.
2006:Sales and marketing expenses decreased approximately $52.8$99.9 million in 2003 compared to 2002primarily due to a reductiondecrease of approximately $120.3 million in advertising and marketing spendingexpense that was primarily due to the result of management’s cost reduction efforts and the divestiture of our majority ownership interest in our Jamba business in January 2007. Salary and employee benefits increased approximately $14.0 million primarily due to recognizing a full year of expense for headcount from our acquisitions of inCode, GeoTrust and m-Qube during the later half of 2006, partially offset by a reduction of employees due to the 2007 restructuring plan and the divestiture of our majority ownership interest in Jamba. Stock-based compensation expense increased approximately $5.9 million primarily due to an increase in the issuances of restricted stock to employees and a reductionmodification expense pertaining to our employee stock purchase plan that allowed employees to increase their contribution withholding percentages in labor2007. Expenses related primarily to redeployed employees of $3.1 million were included in sales and benefit costs. Advertisingmarketing from the general and administrative expense category due to the realignment of business divisions as a result of the 2007 restructuring plan.
2006 compared to 2005: Sales and marketing expenses decreased approximately $22.5$101.2 million in 2003primarily due to a significant reduction in Network Solutions marketing campaigns during 2003. Labor and benefits costs decreaseddecrease of approximately $19.8$144.7 million in 2003 relatedadvertising and marketing expense that was primarily due to a reduction inthe result of significant marketing cutbacks for our content services business. Salary and employee headcount associated with our restructuring plans. Additionally, contract and professional services expenses decreasedbenefits increased approximately $6.6$14.8 million due to an overall reductiona 30% increase in sales and marketing service contractsheadcount primarily related to the business acquisitions completed in 2003. Travel expenses decreased approximately $1.8 million in 2003 due to reduced employee headcount2006, and an overall decreaseincrease in international travelbonus and commission payments. Stock compensation expense increased $15.0 million as a result of safety concerns stemming from health and terrorism alerts.
As a percentagethe adoption of revenues, sales and marketing expensesSFAS 123R. Travel expense increased in 2004 compared to 2003approximately $5.5 million primarily due to thean increase in advertisingheadcount related to our business acquisitions in 2006. Contract and marketing spending in 2004 compared to 2003 as described above.
We expect increases in overall sales and marketing expenses in absolute dollars andprofessional services increased approximately $4.1 million as a percentageresult of revenues as we continuepolicy efforts directly related to expand in our domestic and international markets for our mobile content services, along with our continuing efforts in marketing new products such as Unified Authentication and related services, and increases in our spending for corporate brand advertising.the renewal of the ICANN agreement.
Research and developmentDevelopment
Research and development expenses consist primarily of costs related to research and development personnel, including salaries and other personnel-related expenses, consulting fees and the costs of facilities, computer and communications equipment and support services used in service and technology development.
A comparison of research and development expenses for the years ended December 31, 2004, 2003 and 2002 is presented below.
| 2004 | % Change | 2003 | % Change | 2002 | ||||||||||||||
| (Dollars in thousands) | ||||||||||||||||||
Research and development | $ | 67,346 | 21 | % | $ | 55,806 | 15 | % | $ | 48,353 | ||||||||
Percentage of revenues | 6 | % | 5 | % | 4 | % | ||||||||||||
Research and development expenses increased $11.5 million in 2004 as compared to 2003 primarily due to our acquisitions of Guardent and Jamba!. Research and development spending attributable to these acquired entities was $3.4 million and $3.5 million, respectively. The sale of our Network Solutions business had no material effect on our research and development expense. Additionally, we experienced an increase of approximately $4.1 million in increased costs associated with contract and professional services to support new and existing research and development efforts.
Research and development expenses increased slightly in 2003 compared to 2002. The increase of approximately $7.5 million was primarily a result of increased spending of approximately $3.6 million in the Communications Services Group. Additionally, our naming and directory services had increased equipment, software and depreciation expenses related to the development of new products and services of approximately $2.0 million.
As a percentage of revenues, research and development expenses increased due to the increase in overall spending in 2004 compared to 2003 as described above.
We believe that rapidcontinued development of new and enhanced services and technologies are necessary to maintain our leadership position in the marketplace. Accordingly, we intend to continue to recruit experienced research and development personnel both domestically and internationally and to make other investments in research and development. As a result, we expect
A comparison of research and development is presented below:
| 2007 | % Change | 2006 | % Change | 2005 | |||||||||||
| (Dollars in thousands) | |||||||||||||||
Research and development | $ | 160,186 | 24 | % | $ | 129,256 | 35 | % | $ | 95,572 | |||||
2007 compared to 2006: Research and development expenses increased approximately $30.9 million primarily due to recognizing a full year of expenses for the acquisitions of inCode, GeoTrust and m-Qube during
the latter half of 2006, partially offset by a reduction of expenses due to the divestiture of our majority ownership interest in Jamba in January 2007. Salary and employee benefit costs increased $19.7 million primarily due to merit pay increases and additional headcount expense related to the acquisitions in 2006. Stock-based compensation expense increased approximately $4.0 million primarily due to an increase in the issuances of restricted stock to employees and a modification expense pertaining to our employee stock purchase plan that allowed employees to increase modestlytheir contribution withholding percentages in absolute dollars2007. Expenses related primarily to redeployed employees of $12.3 million were included in research and decreasedevelopment from the general and administrative expense category due to the realignment of business divisions as a percentageresult of revenuesthe 2007 restructuring plan. Contract and professional services decreased by $8.1 million primarily due to a decrease in 2005.the use of external consultants for research and development projects in 2007.
2006 compared to 2005: Research and development expenses increased approximately $33.7 million primarily due to additional expenses from the business acquisitions completed during 2006 and a full year of expenses for the completed business acquisitions in fiscal 2005. Salary and employee benefit costs increased $17.6 million due to a 28% increase in headcount. Occupancy-related costs increased due to an increase in infrastructure and assets placed in service in 2006. Stock compensation expense increased $9.1 million as a result of the adoption of SFAS 123R. Other increases were primarily related to costs associated with the depreciation and maintenance of equipment and software.
General and administrativeAdministrative
General and administrative expenses consist primarily of salaries and other personnel-related expenses for our executive, administrative, legal, finance, information technology and human resources personnel, facilities, computer and communications equipment, management information systems, support services, professional services fees, certain tax and license fees and bad debt expense.facility related expenses.
A comparison of general and administrative expenses for the years ended December 31, 2004, 2003 and 2002 is presented below.below:
| 2004 | % Change | 2003 | % Change | 2002 | ||||||||||||||
| (Dollars in thousands) | ||||||||||||||||||
General and administrative | $ | 164,922 | (2 | )% | $ | 168,380 | (2 | )% | $ | 172,123 | ||||||||
Percentage of revenues | 14 | % | 16 | % | 14 | % | ||||||||||||
| 2007 | % Change | 2006 | % Change | 2005 | |||||||||||
| (Dollars in thousands) | |||||||||||||||
General and administrative | $ | 276,130 | 8 | % | $ | 256,592 | 43 | % | $ | 179,294 | |||||
2007 compared to 2006: General and administrative expenses decreasedincreased approximately $3.5$19.5 million primarily due to a recognizing a full year of expenses for the acquisitions of inCode, GeoTrust and m-Qube during the latter half of 2006, partially offset by a reduction of expenses due to the divestiture of our majority ownership interest in Jamba. Salary and benefit expenses increased $18.3 million primarily due to severance charges in connection with the separation agreements entered into with our former chief executive officer and former chief financial officer, merit pay increases, and additional expenses related to the acquisitions in late 2006. Stock-based compensation expense increased approximately $7.6 million primarily due to an increase in the issuances of restricted stock to employees and a modification expense pertaining to our employee stock purchase plan that allowed employees to increase their contribution withholding percentages in 2007. Legal expense increased by $14.6 million primarily due to $24.8 million in 2004litigation accruals, partially offset by a decrease in legal expenses, which were higher in 2006 due to increased activity associated with the stock option investigation. These increases were primarily offset by a decrease in expenses related primarily to redeployed employees of $26.9 million in general and administrative due to the realignment of business divisions as a result of the 2007 restructuring plan.
2006 compared to 2003. Overall general2005: General and administrative expenses increased from the acquisition of Guardent, Inc. and Jamba! in the amounts of $4.2approximately $77.3 million and $16.5 million, respectively, but was offset by a decrease of $9.8 million in overall expenses due to the sale of our Network Solutions business.
Excluding the effects of the acquisitions of Guardent and Jamba! and the sale of our Network Solutions business, the overall decrease in general and administrative costs in 2004 as compared to 2003 was $14.4 million. This was primarily due to a reduction in costs from prior restructuring effortsan increase of approximately $20.8$20.3 million along with other efficiencies from cost reduction efforts of $6.5 millionin salary and employee benefit costs that was caused by a decrease39% increase in our bad debtheadcount and merit increases across all business units. Stock compensation expense of approximately $5.4 million. These decreases were partially offset by increases in legal expenses of approximately $10.9increased $38.6 million as a result of costs associated with litigation, and increases inthe adoption of SFAS 123R. Expenses related to contract and professional services ofincreased approximately $7.4 million primarily due to expenses related to Sarbanes-Oxley compliance.
General and administrative expenses decreased approximately $3.7 million in 2003 compared to 2002 due to a decrease in bad debt expense of approximately $36.7 million due to increased focus on collection activities,
partially offset by increases in legal expenses of approximately $7.4 million as a result of defending various lawsuits, particularly lawsuits related to the Network Solutions business, and contract and professional services of approximately $6.1$13.4 million primarily due to the development of a companywide strategic planning methodology, taxlegal and consulting services and increased expenses related to Sarbanes-Oxley compliance. Additionally, depreciation increased $5.9 million as a result of capital expenditures to upgrade our business systems and labor and benefits increased approximately $5.8 million due to higher benefit costs. Also, we incurred increased occupancy expenses of approximately $2.1 million in 2003 duerelating to the expansion of a facility in Virginia and increases in business insurance, licenses and property taxes of $3.7 million.stock option investigation.
We anticipate that generalRestructuring, Impairments and administrative expenses in 2005 will increase in absolute dollars but decrease as a percentage of overall revenues. We expect that costs associated with Sarbanes-Oxley compliance to decrease slightly during the year and we anticipate to further leverage our general and administrative costs as a result of higher overall revenues.Other Charges (Reversals), Net
The following table shows a comparison of our bad debt expense and our days sales outstanding (“DSO”) for 2004, 2003 and 2002:
| 2004 | Change | 2003 | Change | 2002 | ||||||
| (Dollars in thousands) | ||||||||||
Bad debt expense | $689 | (89)% | $6,055 | (86)% | $42,712 | |||||
DSO | 43 days | 4 days | 39 days | (33) days | 72 days | |||||
DSO increased in 2004 as compared to 2003 primarily as a result of our acquisition of Jamba! in June 2004. We expect that DSO will be in the range of 40 to 50 days throughout 2005.
Restructuring and Other Charges
Below ispresents a comparison of the restructuring, impairments and other charges under the 2003 and 2002 restructuring plans for the years ended December 31, 2004, 2003, and 2002:(reversals), net:
| 2004 | 2003 | 2002 | ||||||||
| (In thousands) | ||||||||||
2003 Restructuring Plan charges | $ | 25,045 | $ | 54,152 | $ | — | ||||
2002 Restructuring Plan charges | (265 | ) | 20,481 | 88,574 | ||||||
Total restructuring and other charges | $ | 24,780 | $ | 74,633 | $ | 88,574 | ||||
| Year Ended December 31, | ||||||||||||
| 2007 | 2006 | 2005 | ||||||||||
| (In thousands) | ||||||||||||
2007 restructuring plan charges | $ | 29,615 | $ | — | $ | — | ||||||
2002 and 2003 restructuring reversals, net | (175 | ) | (6,420 | ) | (3,744 | ) | ||||||
Total restructuring charges (reversals), net | 29,440 | (6,420 | ) | (3,744 | ) | |||||||
Impairments and other charges | 80,670 | 1,949 | 22,447 | |||||||||
Total restructuring, impairments and other charges (reversals), net | $ | 110,110 | $ | (4,471 | ) | $ | 18,703 | |||||
The changes in restructuring, impairments and other charges (reversals), net, are primarily due to the timing of our restructuring initiatives.
2007 Restructuring Plan: In January 2007, we initiated a restructuring plan to execute a company-wide reorganization replacing our previous business unit structure with a new combined worldwide sales and services team, and an integrated development and products organization. The restructuring plan included workforce reductions, abandonment of excess facilities and other charges.
2002 and 2003 Restructuring PlanPlans: . In November 2003, we announcedinitiated a restructuring initiativeplan related to the sale of our Network Solutions business and the realignment of other business units and recorded restructuring and other charges of approximately $54.2 million.units. In 2004, property and equipment that was disposed of or abandoned in 2004, but not related to the sale of the Network Solutions business, resulted in a net charge of approximately $20.3 million and consisted primarily of obsolete telecommunications computer software and other equipment. We also recorded restructuring charges of $2.7 million related to non-cancelable lease costs for excess facilities, $1.1 million related to workforce reduction charges and $1.0 million for exit costs.
2002 Restructuring Plan. InApril 2002, we announced plansinitiated a plan to restructure our operations to rationalize, integrate and align resources and recorded approximately $88.6 million of restructuring and other charges. In 2003, we recorded otherresources. All remaining charges of $9.2 million relatedrelating to the write-off of certain computer software. We also recorded restructuring charges of $8.7 million related to non-cancelable lease costs for excess facilities, $1.5 million related to workforce reduction charges2002 and $1.0 million of exit costs.
Amortization and impairment of goodwill and other intangible assets2003 plans will be incurred by 2008.
Below is a comparison of our amortization and impairment of goodwillImpairments and other intangible assets for the years ended December 31, 2004, 2003, and 2002:
| 2004 | 2003 | 2002 | |||||||
| (In thousands) | |||||||||
Impairment of goodwill | $ | — | $ | 81,885 | $ | 4,387,009 | |||
Impairment of other intangible assets | — | 71,534 | 223,844 | ||||||
Amortization of other intangible assets | 79,440 | 182,086 | 283,861 | ||||||
Total amortization and impairment of goodwill and other intangible assets | $ | 79,440 | $ | 335,505 | $ | 4,894,714 | |||
SFAS No. 142 requires that purchased goodwill and certain indefinite-lived intangibles be tested for impairment on at least an annual basis. SFAS No. 144 requires that long-lived assets, including intangible assets with finite lives, be reviewed for impairment whenever events or circumstances indicate that there has been a decline in the fair value of an asset.
There was no impairment charge for goodwill and other intangible assets from the annual impairment test conducted in June 2004.
The annual impairment test conducted in June 2003 resulted incharges: During 2007, we recognized an impairment charge to goodwill andof $62.6 million for other intangible assets of $123.2 million during the second quarter of 2003. VeriSign recorded an additional impairment of goodwill of $30.2 million in the third quarter of 2003Content Services business reporting unit as a result of VeriSign entering into an agreement to sell its Network Solutions business. The event triggered an evaluationthe impairment test conducted as required by SFAS 142 and SFAS 144 as of the carrying value of the goodwill assigned to Network Solutions. After considering the sales price of the assets and liabilities to be sold and the expenses associated with the divestiture, VeriSign determined that the carrying value exceeded the implied fair value of Network Solutions’ goodwill. Total impairment of goodwill and other intangible assets as allocated to the Company’s operating segments for the year ended December 31, 2003 are as follows:
Internet Services | Communications Services Group | Network Solutions | Total Segments | |||||||||
| (In thousands) | ||||||||||||
Impairment of goodwill | $ | 18,697 | $ | 20,034 | $ | 43,154 | $ | 81,885 | ||||
Impairment of other intangible assets: | ||||||||||||
Technology in place | — | 27,499 | — | 27,499 | ||||||||
Customer lists | — | 44,035 | — | 44,035 | ||||||||
Total impairment of other intangible assets | — | 71,534 | — | 71,534 | ||||||||
Total impairment of goodwill and other intangible assets | $ | 18,697 | $ | 91,568 | $ | 43,154 | $ | 153,419 | ||||
The impairment charge to goodwill and other intangible assets from the annual impairment test resulted in2007. During 2007, we wrote-off an impairment in 2002 as follows:
| Internet Services Group | Communications Services Group | Network Solutions | Total | |||||||||
| (In thousands) | ||||||||||||
Goodwill | $ | 1,740,256 | $ | 794,866 | $ | 1,851,887 | $ | 4,387,009 | ||||
Impairment of other intangible assets: | ||||||||||||
Customer relationships | 3,297 | 24,294 | — | 27,591 | ||||||||
Technology in place | 256 | 40,693 | — | 40,949 | ||||||||
Trade name | — | 3,205 | — | 3,205 | ||||||||
Contracts with ICANN and customer lists | — | 23,092 | 129,007 | 152,099 | ||||||||
Total impairment of other intangible assets | 3,553 | 91,284 | 129,007 | 223,844 | ||||||||
Total impairment of goodwill and other intangible assets | $ | 1,743,809 | $ | 886,150 | $ | 1,980,894 | $ | 4,610,853 | ||||
Amortization of other intangible assets decreased approximately $102.6 million in 2004 compared to 2003, and decreased approximately $101.8 million in 2003 compared to 2002 as other intangible assets related to prior acquisitions became fully amortized. We acquired approximately $83.9additional $4.8 million of other intangible assets primarily related to a significant change in connection with our Jamba! acquisition in June 2004. As a result,the operations of an asset group. During 2006, we expect amortizationwrote off approximately $2.0 million of other intangible assets specifically related to increase to approximately $90abandoned technology acquired for a specific customer. Other charges comprised of excess and obsolete property and equipment that were impaired, disposed of or abandoned.
Other charges comprised of excess and obsolete property and equipment that were impaired, disposed of or abandoned. During 2007, we recognized an impairment charge of $4.3 million in 2005, includingfor property and equipment, net, of the impactContent Services business reporting unit as a result of all acquisitions throughthe impairment test conducted as required by SFAS 144 as of December 31, 2004,2007. During 2007, we recorded additional other charges of approximately $9.0 million, primarily for the abandonment of obsolete property and assuming no other future acquisitions orequipment and impairment charges.specifically related to a significant change in the operations of an asset group. During 2005, we recorded an impairment of approximately $22.4 million relating to the abandonment of the development efforts related to an internally developed software project.
See NotesNote 1, “Description of Business and 7 inSummary of Significant Accounting Policies,” and Note 5, “Restructuring, Impairments and Other Charges (Reversals), Net,” of our Notes to Consolidated Financial Statements for further information.
Impairment of Goodwill
At December 31, 2007, we recorded an impairment charge of $182.2 million relating to our Content Services business reporting unit, as a result of our decision to divest our non-core businesses. See Note 7, “Goodwill and Other income (expense),Intangible Assets,” of our Notes to Consolidated Financial Statements for further information.
Amortization of Other Intangible Assets
The following table presents a comparison of our amortization of other intangible assets:
| Year Ended December 31, | |||||||||
| 2007 | 2006 | 2005 | |||||||
| (In thousands) | |||||||||
Amortization of other intangible assets | $ | 116,064 | $ | 122,767 | $ | 101,638 | |||
2007 compared to 2006: Amortization of other intangible assets decreased approximately $6.7 million primarily due to the other intangible assets sold as part of the Jamba divestiture and other intangible assets becoming fully amortized. These decreases were offset by a full year of amortization related to other intangible assets acquired in 2006.
2006 compared to 2005: Amortization of other intangible assets increased approximately $21.1 million primarily due to a full year of amortization related to other intangible assets acquired in 2005 and new intangible assets acquired in 2006. Other intangible amortization expense as a result of business acquired in 2006 was approximately $29.1 million.
Our anticipated 2008 amortization expense is expected to be approximately $37.3 million. This amount should decrease as we dispose of our existing business units with net other intangible assets. This amount may increase if we acquire any additional companies with other intangible assets.
See Note 7, “Goodwill and Other Intangible Assets,” of our Notes to Consolidated Financial Statements for further information.
Acquired In-process Research and Development
In 2007, we did not write-off any in-process research and development (“IPR&D”). During 2006, we wrote-off approximately $16.7 million of IPR&D acquired in the CallVision, Kontiki, m-Qube and GeoTrust transactions. During 2005, we wrote off $7.7 million of IPR&D acquired in the purchase of LightSurf Technologies, iDefense, Moreover and Retail Solutions International. At the date of each acquisition, the projects associated with the IPR&D efforts had not yet reached technological feasibility and the research and development in process had no alternative future uses. Accordingly, these amounts were charged to expense on the respective acquisition date of each of the acquired companies.
Other Income, Net
Other income, (expense), net, consists primarily of interest income earned on our cash, cash equivalents, and short-term and long-term investments, interest expense related to our borrowings, gains and losses on the sale or impairment of equity investments, gains and losses on divestiture of businesses, unrealized gains and losses on joint venture call options, realized and unrealized gains and losses on embedded derivative, and the net effect of foreign currency transaction gains and losses.
A comparisonThe following table presents the components of total other income, (expense) for the years ended December 31, 2004, 2003 and 2002 is presented below.net:
| 2004 | % Change | 2003 | % Change | 2002 | ||||||||||||||
| (Dollars in thousands) | ||||||||||||||||||
Total other income (expense), net | $ | 82,077 | 1,092 | % | $ | (8,276 | ) | (94 | )% | $ | (149,289 | ) | ||||||
Percentage of revenues | 7 | % | (1 | )% | (12 | )% | ||||||||||||
| Year Ended December 31, | |||||||||||
| 2007 | 2006 | 2005 | |||||||||
| (In thousands) | |||||||||||
Interest income | $ | 47,348 | $ | 27,222 | $ | 29,924 | |||||
Interest expense | (18,266 | ) | (7,838 | ) | — | ||||||
Net (loss) gain on sale of investments | (1,787 | ) | 21,258 | 11,310 | |||||||
Net gain on divestiture of businesses | 71,216 | — | — | ||||||||
Unrealized gain on joint venture call options | 10,925 | — | — | ||||||||
Realized and unrealized loss on embedded derivative | (15,301 | ) | — | — | |||||||
Other, net | (376 | ) | 2,001 | 10,740 | |||||||
Total other income, net | $ | 93,759 | $ | 42,643 | $ | 51,974 | |||||
Total other2007 compared to 2006: Other income, net, increased approximately $51.1 million in 2004 consisted2007. Interest income increased approximately $20.1 million primarily as a result of higher cash balances throughout the year. Interest expense increased approximately $10.4 million primarily due to interest expense related to our convertible debentures issued in August 2007. We recognized a gain of approximately $68.2 million upon the divestiture of our majority ownership interest in our Jamba business unit. We recorded $10.9 million of unrealized gain on the joint venture call options and $15.3 million of realized and unrealized losses on the embedded derivative associated with our convertible debentures. Due to the fact that we are required to mark-to-market the fair value of these call options and the embedded derivative at each reporting period, such revaluations could result in further gains or losses. Other activity during 2007 included a $1.8 million net interest income and other items of $17.7 million, a net gain fromloss on the sale of a portion of the company’s holdings in VeriSign Japan and other investments of $79.8 million, partially offset by a net impairment of investments totaling $12.6 million, and a net loss$3.0 million gain on foreign currency transactionsthe divestiture of $2.9 million. In the first and third quarter of 2004, we determined the decline in value of certain non-public equity investments was other-than-temporary and we recognized the net impairment losses totaling $12.6 million described above.a business unit.
Total other2006 compared to 2005: Other income, net, decreased approximately $9.3 million primarily due to $7.8 million in interest expense netrelated to our outstanding balance from our credit facility in 2003 consisted2006. We recorded a $21.7 million gain on sale of our remaining equity ownership interest in Network Solutions in 2006. Interest income decreased $2.7 million, primarily as a result of a decrease in our short-term investment balances. Other, net impairment of investments totaling $16.5decreased approximately $8.7 million partially offset by net interest income of $7.7primarily due to a $6.0 million and a gain on foreign currency transactions of $1.8 million. In the first quarter of 2003, we determined the declinerecorded in value of certain non-public equity investments was other-than-temporary and we recognized net impairment losses totaling $16.5 million.
Income tax expenseTax Expense
In the years ended December 31, 2004, 20032007, 2006, and 2002,2005, we recorded income tax expense from continuing operations of $27.6$11.1 million, or 12.9%-8.7% of pretax loss, income tax benefit of $243.6 million, or 182.5% of pretax income, $23.4and income tax expense of $101.0 million, or (9.9)%37.7% of pretax loss, and $10.4 million, or (0.2)% of pretax loss,income, respectively.
Our effective tax rates differrate in 2007 differs from 2006 primarily because of the 2007 impairment to goodwill which is nondeductible for tax purposes, the 2006 reduction in our valuation allowance, and the implementation in 2006 of a global business structure. Our effective tax rate in 2007 also differs from 2006 because we were granted relief from the Internal Revenue Service (“IRS”) in 2006 for an uncertainty regarding a tax benefit resulting from a prior divestiture. As a result, we benefited income tax expense of $113.4 million in 2006.
Prior to 2006, we provided a tax valuation allowance on our United States (“U.S.”) federal statutory rateand state deferred tax assets based on our evaluation that realizability of 35%such assets was not “more likely than not” as required by generally accepted accounting principles. We continuously evaluated additional facts representing positive and negative evidence in the determination of the realizability of the deferred tax assets. Such deferred tax assets consisted primarily due to state taxes, acquisition-related expenses, the realization of domestic net operating loss capital loss,carryforwards, temporary differences on tax-deductible goodwill and research credit carryforwards,intangible assets, and the impact of foreign operations.
temporary differences on deferred revenue. In assessing the realizability of deferred tax assets, management considers whether it is more likely than not that some portion or all of deferred tax assets will not be realized. The realization of deferred tax assets is2006, based on several factors, including the Company’sadditional evidence regarding our past earnings, and the scheduling of deferred tax liabilities and projected future taxable income from operating activities. Management does not believeactivities, we determined that it iswas more likely than not that the deferred tax assets relating to U.S. federal and state operations are realizable. The amountwould be
realized. Accordingly, we released our valuation allowance of the$236.4 million from our deferred tax asset considered realizable, however, could be increasedassets resulting in the near future if the Company exhibits sufficient positive evidence in future periods that demonstrate the continuation of its trend in projected earnings is achievable. If the valuation allowance relatinga benefit to deferred tax assets were released as of December 31, 2004, approximately $240.7 million would be credited to theexpense in its statement of operations, $268.6 million would be credited to additional paid-in capital, and $5.4 million would be credited to goodwill. Management wouldoperations.
We continue to apply a valuation allowanceassess the future realization of $33.4 million to thenet U.S. deferred tax asset for capital loss carryforwards,assets and $48.9 million to the deferred tax asset relating to the write-down of investments, due to the limited carryover life of such tax attributes. Management does not believe that it is more likely than not that $11.2 millionforecasted income, tax effects of deferred tax liabilities and projected future taxable income from operating activities will be sufficient to support future realization of net U.S. deferred tax assets.
We continue to apply a valuation allowance on certain deferred tax assets which we do not believe are more likely than not that they would be realized. We continue to apply a valuation allowance on the deferred tax assets relating to certain foreign operations are realizable; therefore, a valuation allowance is appliedcapital loss carryforwards and to book impairments of investments, due to the deferredlimited carryforward period and character of such tax asset. On the remaining foreign operations, management believes it is more likely than not thatattributes. The amount of deferred tax assets willwhich continues to be realized; accordingly,subject to a valuation allowance was not applied on these assets.$53.3 million and $51.9 million as of December 31, 2007 and December 31, 2006, respectively.
As of December 31, 2004,2007, we had U.S. federal net operating loss carryforwards of approximately $697.9 million,and state net operating loss carryforwards of approximately $555.9$520.9 million and $136.3 million, respectively, including federal and state net operating loss carryforwards of $520.9 million and $130.4 million, respectively, related to the settlement of employee stock awards. When recognized pursuant to the implementation guidance in SFAS 123R, these net operating losses will result in a benefit to additional paid-in capital. As of December 31, 2007, we had foreign net operating loss carryforwards of approximately $49.0$27.0 million.
If we are not able to use them, the U.S. federal net operating loss carryforwards will expire in 20102020 through 20232026 and the state net operating loss carryforwards will expire in 20052008 through 2023. Foreign2027. Most of our foreign net operating loss carryforwards willdo not expire, but could be subject to future restrictions based on various dates. Wechanges in the business or ownership of the foreign subsidiary.
As of December 31, 2007 we had U.S. federal and state research and experimentation tax credits available for federal income tax purposesfuture years of approximately $18.6$37.9 million available for carryoverand $22.1 million, respectively. Of the $37.9 million federal research credit carry forward, $7.9 million will be recognized as a benefit to future years, and for state income tax purposes of approximately $13.9 million available for carryover to future years.paid-in capital when utilized. The federal research and experimentation tax credits will expire, if not utilized, in 20102011 through 2024. State2027. Most state research and experimentation tax credits carry forward indefinitely until utilized.
The Tax Reform Act of 1986 imposes substantial restrictions on the utilization of net operating losses and tax credits in the event of a corporation’s ownership change, as defined in the Internal Revenue Code. OurWe experienced cumulative changes in ownership of greater than 50 percent in 2003 and 2002. These changes in ownership resulted in the imposition of an annual limitation on our ability to utilize certain U.S. federal and state net operating loss carryforwards mayof $232.9 million and $116.5 million, respectively. Losses not utilized due to these limitations can be limited as a resultcarried forward, but are subject to the expiration dates described above.
Deferred income taxes have not been provided on the undistributed earnings of foreign subsidiaries. The amount of such ownership changes.earnings at December 31, 2007, was $259.5 million, principally from VeriSign Japan KK and VeriSign Switzerland SA. These earnings have been permanently reinvested and VeriSign does not plan to initiate any action that would precipitate the payment of income taxes thereon. It is not practicable to estimate the amount of additional tax that might be payable on the undistributed foreign earnings.
We are currently under examination by the IRS and the California Franchise Tax Board for the years ended December 31, 2004 and December 31, 2005. We are also under examination by numerous state taxing jurisdictions. Because we use historic net operating loss carryforwards and other tax attributes to offset our taxable income in current and future years, such attributes can be adjusted by the IRS and other taxing authorities until the statute closes on the year in which such attribute was utilized.
Loss from Unconsolidated Entities, Net of Tax
Loss from unconsolidated entities, net of tax, represents the net loss recognized from the joint ventures entered into with Fox, as described in Note 2, “Joint Ventures,” of our Notes to Consolidated Financial Statements. We recorded a loss, net of tax, of approximately $2.0 million in 2007.
Minority Interest, Net of Tax
Minority interest, net of tax represents the portion of net income belonging to minority shareholders of our consolidated subsidiaries.
The following table presents a comparison of minority interest, net of tax:
| Year Ended December 31, | ||||||||||||
| 2007 | 2006 | 2005 | ||||||||||
| (In thousands) | ||||||||||||
Minority interest, net of tax | $ | (3,840 | ) | $ | (2,875 | ) | $ | (4,702 | ) | |||
2007 compared to 2006: Minority interest, net of tax, increased primarily from an increase in net income from our VeriSign Japan subsidiary primarily due to an increase in security services revenues.
2006 compared to 2005: Minority interest, net of tax, decreased primarily from decreased net income from our VeriSign Japan subsidiary primarily due to a decrease in the installed base of SSL certificates and a decrease in demand for managed security services in Japan.
Liquidity and Capital Resources
| As of December 31, | |||||||||||||||||
| 2004 | 2003 | 2002 | 2007 | 2006 | |||||||||||||
| (In thousands) | (In thousands) | ||||||||||||||||
Cash and cash equivalents | $ | 330,641 | $ | 301,593 | $ | 254,505 | $ | 1,376,722 | $ | 478,749 | |||||||
Short-term investments | 406,784 | 422,093 | 130,963 | 1,011 | 198,656 | ||||||||||||
Subtotal | $ | 737,425 | $ | 723,686 | $ | 385,468 | 1,377,733 | 677,405 | |||||||||
Restricted cash | 51,518 | 18,371 | 18,436 | ||||||||||||||
Restricted cash and investments | 46,936 | 49,437 | |||||||||||||||
Total | $ | 788,943 | $ | 742,057 | $ | 403,904 | $ | 1,424,669 | $ | 726,842 | |||||||
Working capital | $ | 306,528 | $ | 325,522 | $ | (62,719 | ) | ||||||||||
Working capital from continuing operations | $ | 803,431 | $ | (38,973 | ) | ||||||||||||
At December 31, 2004,2007, our principal source of liquidity was $737.4 million$1.4 billion of cash and cash equivalents and short-term investments, consisting principally of commercial paper, medium term investment-grade corporate notes, corporate bonds and notes, U.S. government and agency securities and money market funds.
Working capital increased $369.2In January 2007, we entered into two joint venture agreements with Fox to provide mobile entertainment to consumers on a global basis. Under the terms of the agreements, Fox owns a 51% interest and VeriSign owns a 49% interest in the joint ventures. Fox paid VeriSign approximately $192.4 million overin cash for the periods presented primarilydivestiture of 51% of our ownership interest in Jamba and we paid Fox approximately $4.9 million in cash for its contribution of Fox Mobile Entertainment assets.
In August 2007, we issued $1.25 billion principal amount of 3.25% convertible debentures due 2037, to an increaseinitial purchaser in cash, cash equivalents and short-term investmentsa private offering. We received net proceeds of $352.0 million primarily from$1.22 billion after deduction of issuance costs of $25.8 million. Concurrently with the issuance of the convertible debentures, the Board of Directors of VeriSign authorized the use of the net cash provided by operating activities.
Net cash provided by operating activities was $365.3 million in 2004, $358.4 million in 2003 and $240.1 million in 2002. The increase in both 2004 and 2003 was primarily due to an overall increase in net income after adjustments for non-cash items such as amortization and the impairment of goodwill and other intangible assets, and depreciation of property and equipment. Additionally, cash flows from operating activities increased in 2004 due to an increase in deferred revenues of $69.3 million, an increase in accounts payable and accrued liabilities of $44.9 million, partially offset by an increase in accounts receivable of $65.8 million. In 2003, an increase in accounts payable of $38.1 million, a decrease in accounts receivable of $28.0 million, an increase in deferred revenue of $25.5 million and a decrease in prepaid expenses and other current assets of $12.8 million after accounting for the sale of our Network Solutions business contributed to the increase in net cash provided by operating activities. In 2002, a substantial decrease in accounts receivable partially offset by a decrease in deferred revenue, and accounts payable and accrued liabilities contributed to the increase in net cash provided by operating activities as compared to 2001.
Net cash used in investing activities was $284.9 million in 2004, primarily as a result of $246.4 million used for our acquisitions and $15.9 million used for net purchases of investments. In addition, we used approximately $92.5 million for purchases of property and equipment, partially offset by $78.3 million in proceeds from the saleissuance of stock in our VeriSign Japan subsidiary.
Net cash used in investing activities was $368.6 million in 2003, primarily as a result of $292.8 million used for net purchases of investments, $108.0 million for purchases of property and equipment, and $16.1 million for our acquisitions. These purchases were partially offset by proceeds of $57.6 million of cash received from the sale of our Network Solutions subsidiary in November 2003.
Net cash used in investing activities was $297.6 million in 2002, primarily as a result of $348.6 million used for acquisitions with an additional $53.6 million used in acquisition related costs. We also used $176.2 million for purchases of property and equipment. These purchases were partially offset by net proceeds of $276.4 million from maturities and sales of short and long-term investments.
Net cash used in financing activities was $54.5 million in 2004 and net cash provided by financing activities was $55.9 million in 2003 and $20.3 million in 2002. In 2004, $113.3 million was usedconvertible debentures to repurchase shares of our common stock in addition to the previously approved 2006 stock repurchase program.
During the second half of 2007, we divested certain businesses for $19.2 million in cash and $3.8 million in preferred stock of one of the acquiring companies, and recorded a net gain of $4.4 million.
During the second half of 2007, we used the proceeds from the issuance of the convertible debentures to repurchase 12.2 million shares of our common stock for an aggregate cost of approximately $350 million. Additionally, we entered into a $200 million Guaranteed Share Repurchase (“GSR”) agreement and a $600 million ASR agreement with two independent financial institutions. Under the terms of the GSR agreement, we received approximately 6.3 million shares of our common stock. Under the terms of the ASR agreement, we received approximately 19.5 million shares.
In January and February of 2008, we repurchased 13.3 million shares of our common stock under the 2006 stock repurchase program for an aggregate cost of $451.4 million. As of February 28, we have approximately $532.7 million available under the 2006 stock repurchase program.
On January 31, 2008, our Board of Directors authorized the 2008 stock repurchase program having an aggregate purchase price of up to $600 million of our common stock.
On February 8, 2008, we announced that we entered into an ASR agreement to repurchase $600 million of our common stock under the 2008 stock repurchase program and announced an intent to repurchase up to an additional $200 million in open market transactions under an existingthe 2006 stock repurchase program. TheseWe paid $600 million to a financial institution in exchange for a number of shares, which will be determined, subject to a cap, based on market prices during the term of the ASR agreement. Through February 28, 2008 we received 15.1 million shares under the ASR agreement. We expect to complete the repurchases by the end of the third quarter of 2008, although in certain circumstances the completion date may be shortened or extended.
As a result of the Company's decision to divest its non-core businesses, we expect cash flows from investing activities to increase in 2008, as and when proceeds are received from the sale of those businesses. We continue to expect positive cash flows from operating activities as our core businesses generate the majority of our cash flows from operations.
In summary, our cash flows were as follows:
| Year Ended December 31, | |||||||||||
| 2007 | 2006 | 2005 | |||||||||
| (In thousands) | |||||||||||
Net cash provided by operating activities | $ | 470,460 | $ | 474,779 | $ | 481,122 | |||||
Net cash provided by (used in) investing activities | 212,085 | (562,396 | ) | 143,596 | |||||||
Net cash provided by (used in) financing activities | 188,671 | 110,735 | (469,513 | ) | |||||||
Effect of exchange rate changes on cash and cash equivalents | 3,721 | 6 | (7,186 | ) | |||||||
Net increase in cash and cash equivalents | $ | 874,937 | $ | 23,124 | $ | 148,019 | |||||
Net cash provided by operating activities
Our largest source of operating cash flows is cash collections from our customers. Our primary uses of cash from operating activities are for personnel related expenditures, and other general operating expenses, as well as payments related to taxes and facilities.
2007 compared to 2006: Net cash provided by operating activities decreased primarily due to $139.5 million in net loss adjusted for non-cash items and changes in operating assets and liabilities. The non-cash items contributing to the increase primarily included an increase in restructuring, impairments and other charges (reversals), net, primarily associated with our 2007 restructuring plan, an increase in stock-based compensation expense primarily due to acceleration of stock options and awards related to the separation of our former Chief Executive Officer, a charge for impairment of goodwill, realized and unrealized losses on our embedded
derivative associated with our issuance of convertible debentures and a change in deferred income taxes primarily due to a release of the valuation allowance on deferred tax assets in 2006. The non-cash items partially offsetting the increase included gain from our divestiture of our majority ownership interest in Jamba, gains from the divestitures of certain other business units and an unrealized gain on joint venture call options. The changes in operating assets and liabilities were primarily due to timing of receipts, purchases and payments.
2006 compared to 2005: Net cash provided by operating activities decreased primarily due to a decrease in net income adjusted for non-cash items and changes in operating assets and liabilities. The non-cash items contributing to the decrease included a change in deferred income taxes primarily due to a release of the valuation allowance on deferred tax assets, partially offset by $62.4 millionan increase in stock-based compensation expense as a result of the adoption of SFAS 123R. The changes in operating assets and liabilities were primarily due to timing of receipts, purchases and payments.
Net cash provided by the(used in) investing activities
The changes in cash flows from investing activities primarily relate to business combinations, divestiture of businesses, timing of purchases, maturities and sales of investments, purchases of property and equipment, investments in unconsolidated entities and long-term note receivable.
2007 compared to 2006: Net cash provided by investing activities increased primarily due to proceeds received on divestiture of our majority ownership interest in Jamba and certain other businesses, partially offset by a decrease in cash spent on business combinations and for purchases of investments and a decrease in cash received from maturities and sales of investments.
2006 compared to 2005: Net cash used in investing activities increased primarily due to an increase in cash spent on business combinations and for purchases of investments, partially offset by an increase in cash received from maturities and sales of investments.
Net cash provided by (used in) financing activities
The changes in cash flows from financing activities primarily relate to borrowings and payments under debt obligations, as well as stock repurchase and stock option exercise activities.
2007 compared to 2006: Net cash provided by financing activities increased primarily due to proceeds received from issuance of convertible debentures and an increase in proceeds received from the issuance of common stock from stock option exercises and employee stock purchase plan purchases. In 2003, $37.4 million of cash was provided as a result of VeriSign Japan’s initial public offering of common stock in the fourth quarter of 2003 and through subsequent option exercises. Additionally, in 2003, $31.7 million was provided by common stock issuances as a result of stock option exercises and proceeds from the employee stock purchase planpurchases, partially offset by $13.2 millionan increase in cash spent for thestock repurchase activities and repayment of short-term debt and other long-term obligations. In 2002, cash was provided primarily from common stock issuances inunder the amount of $20.7 million as a result of stock option exercises and proceeds from the employee stock purchase plan.Credit Facility.
The following table shows our budgeted capital property and equipment expenditures in 2005 and our actual expenditures in 2004, 2003 and 2002:
| 2005 Budgeted | 2004 Actual | 2003 Actual | 2002 Actual | |||||||||
| (In thousands) | ||||||||||||
Capital property and equipment expenditures | $ | 110,000 | $ | 92,532 | $ | 108,034 | $ | 176,233 | ||||
Our planned capital property and equipment expenditures for 2005 are anticipated2006 compared to be approximately $110 million and will2005: Net cash provided by financing activities increased primarily be for computer and communications equipment and computer software within all areasdue to proceeds received from draw-down of the Company. Our most significant expenditures will be focused on productivity, cost improvementCredit Facility, partially offset by a decrease in cash spent for stock repurchase activities and market development initiatives for repayment of short-term debt under the Internet Services Group and the Communications Services Group. Other capital property and equipment expenditures will be for productivity and cost improvement initiatives for corporate services.Credit Facility.
The following table summarizes our significant contractual obligations at December 31, 2004, and the effect such obligations are expected to have on our liquidity and cash flows in future periods:
| Payments due by period | |||||||||||||||
| Total | Less than 1 year | 1–3 years | 3–5 years | More than 5 years | |||||||||||
Contractual obligations | (In thousands) | ||||||||||||||
Operating lease obligations, net of sublease income | $ | 106,494 | $ | 23,537 | $ | 31,639 | $ | 21,435 | $ | 29,883 | |||||
Purchase obligations | 128,450 | 30,458 | 69,700 | 28,292 | — | ||||||||||
Other long-term liabilities | 8,400 | 2,200 | 4,200 | 2,000 | — | ||||||||||
Total | $ | 243,344 | $ | 56,195 | $ | 105,539 | $ | 51,727 | $ | 29,883 | |||||
As of December 31, 2004, we had commitments under non-cancelable operating leases for our facilities for various terms through 2014. See Note 14 of Notes to Consolidated Financial Statements.
Future operating lease payments2007, restricted cash and investments primarily include payments related to leases on excess facilities included in VeriSign’s restructuring plans. The restructuring liability is included on the balance sheet as accrued restructuring costs. Amounts related to the lease terminations due to the abandonment of excess facilities will be paid over the respective lease terms, the longest of which extends through 2014. If sublease rates continue to decrease in these markets, or if it takes longer than expected to sublease these facilities, the actual lease expense could exceed this estimate by an additional $32.6 million over the next ten years relating to our restructuring plans. Cash payments totaling approximately $60.5$45.0 million related to the abandonment of excess facilities will be paid over the next ten years. See Note 4 of Notes to Consolidated Financial Statements. Cost savings resulting froma trust established during 2004 for our restructuring plans, not including other cost savings efforts, were estimated to have been approximately $15 to $20 million in 2004director and are estimated to be approximately $25 to $30 million in 2005.officer liability self-insurance coverage.
In November 1999,As of December 31, 2007, we entered into an agreement for the management and administration of the Tuvalu Internet top-level domain,“.tv” with the Government of Tuvalu for payments of future royalties which will amount to $8.4 million through 2008.
We have pledged a portion of our short-term investmentsapproximately $2.5 million as collateral for standby letters of credit that guarantee certain of our contractual obligations, primarily relating to our real estate lease agreements. We haveagreements, the longest of which is expected to mature in 2014. Of the $2.5 million pledged approximately $6.5 million pursuant to such agreements classified as restricted cash on the accompanying balance sheet as of December 31, 2004. In addition, we established a trust during the first quarter of 2004 in the amount of $45.02007, approximately $2.0 million is classified as short-term restricted cash on our balance sheet for our director and officer liability self-insurance coverage.is included in cash and cash equivalents. In January 2008, the collateral associated with stand-by letters of credit was released.
In 2001, our Board2006, we entered into a credit agreement with a syndicate of Directors authorizedbanks and other financial institutions related to a $500.0 million senior unsecured revolving credit facility (the “Facility”), under which VeriSign, or certain
designated subsidiaries may be borrowers. As of December 31, 2007, there were no outstanding borrowings under the use of up to $350 million to repurchase sharesFacility. Any future borrowings under the Facility will be used for working capital, capital expenditures, permitted acquisitions and repurchases of our common stock on the open market, or in negotiated or block trades. During 2003 and 2002, no shares were repurchased, however, during 2004, we repurchased approximately 4.4 million shares at an aggregate cost of approximately $113 million. At December 31, 2004, approximately $167 million remained available for future repurchases under this program.
VeriSign entered into a five-year agreement with Bank of America effective June 1, 2000 to provide a $15 million unsecured capital expenditure loan facility. The loan was paid in full on December 16, 2003.
In October 2001, we filed a shelf registration statement with the Securities and Exchange Commission to offer an indeterminate number of shares of common stock that may be issued at various times and at indeterminate prices, with a total public offering price not to exceed $750 million. To date, no shares have been issued under this registration statement.other lawful corporate purposes.
We believe our existing cash and cash equivalents, and short-term investments and operating cash flows, willtogether with funds generated from operations should be sufficient to meet our working capital, and capital expenditure requirements and to service our debt for at least the next 12 months. Acquisitions orOur philosophy regarding the maintenance of a balance sheet with a large component of cash, cash equivalents and short-term investments reflects our views on potential future capital requirements relating to be funded with cash may require us to raise additional funds through public or private financing, strategic relationships or other arrangements. This additional funding, if needed, might not be available on terms attractive to us, or at all. Failure to raise capital when needed could materially harm our business. If we raise additional funds through the issuance of equity securities, the percentageexpansion of our stock owned bybusinesses, acquisitions, and share repurchases. We regularly assess our then-current stockholders will be reduced. Furthermore, these equity securities might have rights, preferences or privileges senior to thosecash management approach and activities in view of our common stock.current and potential future needs.
Recently Issued Accounting PronouncementsProperty and Equipment Expenditures
The following table shows our planned property and equipment expenditures for 2008 and our actual expenditures in 2007, 2006 and 2005:
| 2008 Planned | 2007 Actual | 2006 Actual | 2005 Actual | |||||||||
| (In thousands) | ||||||||||||
Property and equipment expenditures | $ | 160,000 | $ | 168,400 | $ | 141,700 | $ | 140,499 | ||||
Our planned property and equipment expenditures for 2008 are anticipated to be approximately $160.0 million and will primarily be focused on productivity, cost improvement and market development initiatives for the Internet Services Group.
InContractual Obligations
The following table summarizes our significant non-cancelable contractual obligations at December 2004, the Financial Accounting Standards Board (“FASB”) issued Statement of Financial Accounting Standards (“SFAS”) No. 123R, “Share-Based Payment,” which requires the measurement of all employee share-based payments to employees, including grants of employee stock options, using a fair-value-based method31, 2007, and the recordingeffect such obligations are expected to have on our liquidity and cash flows in future periods:
| Payments due by period | |||||||||||||||
| Total | 2008 | 2009–2010 | 2011–2012 | Thereafter | |||||||||||
| (In thousands) | |||||||||||||||
Contractual obligations | |||||||||||||||
Operating lease obligations | $ | 115,734 | $ | 26,135 | $ | 40,972 | $ | 24,343 | $ | 24,284 | |||||
Purchase obligations | 52,132 | 39,577 | 12,002 | 553 | — | ||||||||||
ICANN agreement | 57,000 | 10,000 | 24,000 | 23,000 | — | ||||||||||
Junior subordinated convertible debentures—principal and interest | 2,468,186 | 40,061 | 81,250 | 81,250 | 2,265,625 | ||||||||||
Total | $ | 2,693,052 | $ | 115,773 | $ | 158,224 | $ | 129,146 | $ | 2,289,909 | |||||
As of such expense inDecember 31, 2007, we had commitments under non-cancelable operating leases for our consolidated statements of operations. The accounting provisions of SFAS 123R are effectivefacilities for reporting periods beginning after Junevarious terms through 2017. See Note 15, 2005. We are required to adopt SFAS 123R in the third quarter of 2005. The pro forma disclosures previously permitted under SFAS 123 no longer will be an alternative to financial statement recognition. See “Stock Compensation Plans“Commitments and Unearned Compensation” in Note 1Contingencies”, of our Notes to Consolidated Financial StatementsStatements.
We enter into certain purchase obligations with various vendors. Our significant purchase obligations primarily consist of firm commitments with telecommunication carriers and other service providers. We do not have any significant purchase obligations beyond 2010.
In 2006, we entered into a contractual agreement with ICANN to be the sole registry operator for further information regardingdomain names in the pro forma net income (loss).com top-level domain through November 30, 2012. Under the new agreement, we paid ICANN fixed registry level fees of $10.0 million during 2007. Beginning in 2009, the agreement provides for contingent payments upon meeting certain criteria based on growth in annual domain name registrations that could amount to an additional $20.5 million through the end of the contract.
In August 2007, we issued $1.25 billion principal amount of 3.25% debentures due 2037. We will pay cash interest at an annual rate of 3.25% payable semiannually on February 15 and net income (loss) per share amounts, for 2002 through 2004, as if we had used a fair-value-based method similarAugust 15 of each year until maturity. See Note 10, “Junior Subordinated Debentures,” of our Notes to the methods required under SFAS 123R to measure compensation expense for employee stock incentive awards. Although we have not yet determined whether the adoption of SFAS 123R will result in amounts that are similar to the current pro forma disclosures under SFAS 123, we are evaluating the requirements under SFAS 123R and expect the adoption to have a significant adverse impact on our consolidated statements of operations and net income per share.Consolidated Financial Statements.
Recently Issued Accounting Pronouncements
In December 2004,2007, the FASB issued FASB Staff Position No. FAS 109-1SFAS No 160 (“FAS 109-1”SFAS 160”), “ApplicationNon-controlling Interests in Consolidated Financial Statements, an amendment of Accounting Research Bulletin No. 51,” which requires all entities to report minority interests in subsidiaries as equity in the consolidated financial statements, and requires that transactions between entities and non-controlling interests be treated as equity. SFAS 160 is effective for fiscal years beginning on or after December 15, 2008, and will be applied prospectively. We are currently evaluating the effect of SFAS 160, and the impact it will have on our financial position and results of operations.
In December 2007, the FASB Statementissued SFAS No. 109141(R) (“SFAS 141R”), “Accounting for Income Taxes,Business Combinations,” to the Tax Deduction on Qualified Production Activities Provided by the American Jobs Creation Act of 2004.” The AJCA introduces a special 9% tax deduction on qualified production activities. FAS 109-1 clarifies that this tax deduction should bewhich will significantly change how business acquisitions are accounted for and will impact financial statements both on the acquisition date and in subsequent periods. Some of the changes, such as the accounting for contingent consideration, will introduce more volatility into earnings, and may impact a special tax deductioncompany's acquisition strategy. SFAS 141R is effective for fiscal years beginning on or after December 15, 2008, and will be applied prospectively. We are currently evaluating the effect of SFAS 141R, and the impact it will have on our financial position and results of operations.
In February 2007, the FASB issued SFAS No. 159 (“SFAS 159”), “The Fair Value Option for Financial Assets or Financial Liabilities,” which provides companies with an option to report selected financial assets and liabilities at fair value. The objective is to reduce both complexity in accordance withaccounting for financial instruments and the volatility in earnings caused by measuring related assets and liabilities differently. SFAS 109. Pursuant159 also establishes presentation and disclosure requirements designed to facilitate comparisons between companies that choose different measurement attributes for similar types of assets and liabilities. SFAS 159 is effective as of the AJCA, we will not be able to claim this tax benefit untilbeginning of an entity’s first fiscal year beginning after November 15, 2007. Early adoption is permitted as of the beginning of the previous fiscal year provided that the entity makes that choice in the first quarter120 days of that fiscal 2006.year and also elects to apply the provisions of SFAS No. 157 (“SFAS 157”), “Fair Value Measurements.” We do not expect the adoption of these new tax provisionsSFAS 159 to have a material impact on our consolidated financial position and results of operations or cash flows.operations.
In December 2004,September 2006, the FASB issued SFAS 157, which defines fair value, establishes guidelines for measuring fair value and expands disclosures regarding fair value measurements. SFAS 157 does not require any new fair value measurements but rather eliminates inconsistencies in guidance found in various prior accounting pronouncements. SFAS 157 is effective for fiscal years beginning after November 15, 2007. On February 12, 2008, the FASB Staff Position No. FAS 109-2 (“FAS 109-2”),issued FSP SFAS 157-2, “AccountingEffective Date of FASB Statement No 157,” which defers the effective date for adoption of fair value measurements for nonfinancial assets and Disclosure Guidance for the Foreign Earnings Repatriation Provision within the American Jobs Creations Act of 2004.” The AJCA introduces a limited time 85% dividends received deduction on the repatriation of certain foreign earningsliabilities to a U.S. taxpayer (repatriation provision), provided certain criteria are met. FAS 109-2 provides accounting and disclosure guidance for the repatriation provision.fiscal years beginning after November 15, 2008. We do not expect the adoption of these new tax provisionsSFAS 157 to have a material impact on our consolidated financial position and results of operations or cash flows.operations.
In March 2004, the FASB issued EITF Issue No. 03-1 (“EITF 03-1”), “The Meaning of Other-Than-Temporary Impairment and Its Application to Certain Investments” which provided new guidance for assessing impairment losses on investments. Additionally, EITF 03-1 includes new disclosure requirements for investments that are deemed to be temporarily impaired. In September 2004, the FASB delayed the accounting provisions of EITF 03-1; however the disclosure requirements remain effective for annual periods ending after June 15, 2004.
We do not expect the adoption of EITF 03-1 will have a material impact on our consolidated financial position, results of operations or cash flows.
| ITEM 7A. | QUANTITATIVE AND QUALITATIVE DISCLOSURES ABOUT MARKET RISK |
Equity investments
We invest in debt and equity securities of technology companies for investment purposes. In most instances, we invest in the equity and debt securities of private companies for which there is no public market, and therefore, carry a high level of risk. These companies are typically in the early stage of development and are expected to incur substantial losses in the near-term. Therefore, these companies may never become publicly traded. Even if they do, an active trading market for their securities may never develop and we may never realize any return on these investments. In 2004, 2003 and 2002, we determined the decline in value of certain public and non-public equity investments was other-than-temporary and we recognized net impairment losses totaling $8.2 million, $16.5 million, and $162.5 million, respectively. Due to the inherent risk associated with some of our investments, and in light of current stock market conditions, we may incur future losses on the sale or impairment of our investments.
Interest rate sensitivity
The primary objective of our cashshort-term investment management activities is to preserve principal with the additional goals of maintaining appropriate liquidity and driving after-tax returns. Some of the securities that we have invested in may be subject to interest rate risk. This means that a change in prevailing interest rates may cause the principal amount of the investment to fluctuate. For example, if we hold a security that was issued with a fixed interest rate at the then-prevailing rate and the prevailing interest rate later rises, the principal amount ofWe manage our investment will probably decline in value. To minimize interest rate risk we maintain ourby maintaining an investment portfolio generally consisting of cash equivalentsdebt instruments of high credit quality and short-term investmentsrelatively short maturities. We invest in a variety of securities, including commercial paper, medium-term notes, corporate bonds and notes, U.S. government and agency securities and money market funds. In general, money market funds are not considered to be subject to interest rate risk because the interest paid on such funds fluctuates with the prevailing interest rate. As of December 31, 2004, 38% of2007, our cash investments matureand cash equivalents consisted primarily of money market funds and we did not have any fixed income marketable securities.
Notwithstanding our efforts to manage interest rate risks, there can be no assurance that we will be adequately protected against risks associated with interest rate fluctuations. At any time, a sharp change in less than one year. If market interest rates were to increase immediately and uniformly by 10 percent from levels at December 31, 2004, this would not materially changecould have a significant impact on the fair market value of our investment portfolio.
The following table presents the amounts of our cash equivalents and short-term investments that are subject to interest rate risk by range of expected maturity and weighted-average interest rates as of December 31, 2004. This table does not include money market funds because those funds are not subject to interest rate risk.
| Maturing in | Total | Estimated Fair Value | ||||||||||||||||
| Six Months or Less | Six Months to One Year | More than One Year | ||||||||||||||||
| (Dollars in thousands) | ||||||||||||||||||
Included in cash and cash equivalents | $ | 50,190 | $ | — | $ | — | $ | 50,190 | $ | 50,190 | ||||||||
Weighted-average interest rate | 2.13 | % | — | — | ||||||||||||||
Included in short-term investments | $ | 141,537 | $ | 26,475 | $ | 242,849 | $ | 410,861 | $ | 406,784 | ||||||||
Weighted-average interest rate | 3.36 | % | 4.30 | % | 3.35 | % | ||||||||||||
Included in restricted cash | $ | — | $ | — | $ | 51,518 | $ | 51,518 | $ | 51,518 | ||||||||
Weighted-average interest rate | — | — | 1.69 | % | ||||||||||||||
Foreign exchange risk management
We conduct business throughout the world and transact in multiple foreign currencies. As we continue to expand our international operations we are increasingly exposed to currency exchange rate risks. In the fourth quarter of 2003, we initiated a foreign currency risk management program designed to mitigate foreign exchange
risks associated with the monetary assets and liabilities of our operations that are denominated in non-functional currencies. The primary objective of this hedging program is to minimize the gains and losses resulting from fluctuations in exchange rates. We do not enter into foreign currency transactions for trading or speculative purposes, nor do we hedge foreign currency exposures in a manner that entirely offsets the effects of changes in exchange rates. The program may entail the use of forward or option contracts and in each case these contracts are limited to a duration of less than 12 months.
At December 31, 2004,2007, we held forward contracts in notional amounts totaling approximately $54.5$50.9 million to mitigate the impact of exchange rate fluctuations associated with certain foreign currencies. All hedgeforward contracts are recorded at fair market value. We attempt to limit our exposure to credit risk by executing foreign exchange contracts with high-quality financial institutions.
Market risk management
The fair market value of the junior subordinated convertible debentures (the “Debentures”) issued by the Company and due August 2037, is subject to interest rate risk and market risk due to the convertible feature of the Debentures. Generally, the fair market value of fixed interest rate debt will increase as interest rates fall and decrease as interest rates rise. The fair market value of the Debentures will also increase as the market price of our stock increases and decrease as the market price falls. The interest and market value changes affect the fair market value of the Debentures but do not impact our financial position, cash flows or results of operations. As of December 31, 2007, the fair value of the Debentures was approximately $1.6 billion, based on quoted market prices.
| ITEM 8. | FINANCIAL STATEMENTS AND SUPPLEMENTARY DATA |
Financial Statements
VeriSign’s financial statements required by this item are set forth as a separate section of this Form 10-K. See Item 15 (a)1 for a listing of financial statements provided in the section titled “Financial Statements.”
SupplementalSupplementary Data (Unaudited)
The following tables set forth unaudited supplementary quarterly supplementaryfinancial data for the two-yeartwo year period ended December 31, 2004:2007. In management’s opinion, the unaudited data has been prepared on the same basis as the audited information and includes all adjustments (consisting only of normal recurring adjustments) necessary for a fair presentation of the data for the periods presented.
| 2004 | ||||||||||||||||||||
| First Quarter (2) | Second Quarter (3) | Third Quarter (4) | Fourth Quarter (5) | Year Ended December 31 | ||||||||||||||||
| (In thousands, except per share data) | ||||||||||||||||||||
Revenues | $ | 229,113 | $ | 256,045 | $ | 325,311 | $ | 355,986 | $ | 1,166,455 | ||||||||||
Total costs and expenses | 214,215 | 217,527 | 292,875 | 310,110 | 1,034,727 | |||||||||||||||
Operating income | 14,898 | 38,518 | 32,436 | 45,876 | 131,728 | |||||||||||||||
Net income | 9,070 | 21,945 | 40,398 | 114,812 | 186,225 | |||||||||||||||
Basic net income per share (1) | 0.04 | 0.09 | 0.16 | 0.45 | 0.74 | |||||||||||||||
Diluted net income per share (1) | 0.04 | 0.09 | 0.16 | 0.43 | 0.72 | |||||||||||||||
| 2003 | ||||||||||||||||||||
| First Quarter (6) | Second Quarter (7) | Third Quarter (8) | Fourth Quarter (9) | Year Ended December 31 | ||||||||||||||||
| (In thousands, except per share data) | ||||||||||||||||||||
Revenues | $ | 269,758 | $ | 265,299 | $ | 268,123 | $ | 251,600 | $ | 1,054,780 | ||||||||||
Total costs and expenses | 304,448 | 409,654 | 297,038 | 271,890 | 1,283,030 | |||||||||||||||
Operating loss | (34,690 | ) | (144,355 | ) | (28,915 | ) | (20,290 | ) | (228,250 | ) | ||||||||||
Net loss | (53,436 | ) | (142,850 | ) | (31,303 | ) | (32,290 | ) | (259,879 | ) | ||||||||||
Basic net loss per share (1) | (0.22 | ) | (0.60 | ) | (0.13 | ) | (0.13 | ) | (1.08 | ) | ||||||||||
Diluted net loss per share (1) | (0.22 | ) | (0.60 | ) | (0.13 | ) | (0.13 | ) | (1.08 | ) | ||||||||||
All previously reported quarters have been adjusted to show the discontinued operations of our dispositions. Previously filed annual reports on Form 10-K and quarterly reports on Form 10-Q affected by the dispositions have not been amended and should not be relied upon.
| 2007 | |||||||||||||||||||
| First Quarter (2) | Second Quarter | Third Quarter | Fourth Quarter (2) (3) (4) | Year Ended December 31 | |||||||||||||||
| (In thousands, except per share data) | |||||||||||||||||||
Continuing operations: | |||||||||||||||||||
Revenues | $ | 373,049 | $ | 363,217 | $ | 373,587 | $ | 386,436 | $ | 1,496,289 | |||||||||
Costs and expenses | 385,140 | 369,970 | 345,665 | 617,015 | 1,717,790 | ||||||||||||||
Operating (loss) income | (12,091 | ) | (6,753 | ) | 27,922 | (230,579 | ) | (221,501 | ) | ||||||||||
Net income (loss) | 60,413 | (5,682 | ) | 16,379 | (215,790 | ) | (144,680 | ) | |||||||||||
Net income (loss) per share: (1) | |||||||||||||||||||
Basic | $ | 0.24 | $ | (0.02 | ) | $ | 0.07 | $ | (0.97 | ) | $ | (0.61 | ) | ||||||
Diluted | $ | 0.24 | $ | (0.02 | ) | $ | 0.07 | $ | (0.97 | ) | $ | (0.61 | ) | ||||||
Discontinued operations: | |||||||||||||||||||
Revenues | $ | 4,396 | $ | 4,407 | $ | 3,065 | $ | — | $ | 11,868 | |||||||||
Costs and expenses | 2,529 | 2,979 | 1,255 | — | 6,763 | ||||||||||||||
Operating income | 1,867 | 1,428 | 1,810 | — | 5,105 | ||||||||||||||
Net income | 1,340 | 965 | 2,625 | 248 | 5,178 | ||||||||||||||
Net income per share: (1) | |||||||||||||||||||
Basic | $ | 0.01 | $ | — | $ | 0.01 | $ | — | $ | 0.02 | |||||||||
Diluted | $ | 0.01 | $ | — | $ | 0.01 | $ | — | $ | 0.02 | |||||||||
Total: | |||||||||||||||||||
Net income (loss) | $ | 61,753 | $ | (4,717 | ) | $ | 19,004 | $ | (215,542 | ) | $ | (139,502 | ) | ||||||
Net income (loss) per share: (1) | |||||||||||||||||||
Basic | $ | 0.25 | $ | (0.02 | ) | $ | 0.08 | $ | (0.97 | ) | $ | (0.59 | ) | ||||||
Diluted | $ | 0.25 | $ | (0.02 | ) | $ | 0.08 | $ | (0.97 | ) | $ | (0.59 | ) | ||||||
Continuing operations: Revenues Costs and expenses Operating income Net income (loss) Net income (loss) per share: (1) Basic Diluted Discontinued operations: Revenues Costs and expenses Operating income Net income Net income per share: (1) Basic Diluted Total: Net income (loss) Net income (loss) per share: (1) Basic Diluted 2006 First
Quarter (5) Second
Quarter (6) Third
Quarter Fourth
Quarter Year Ended
December 31 (In thousands, except per share data) $ 370,109 �� $ 387,832 $ 396,418 $ 408,639 $ 1,562,998 358,600 357,670 372,514 383,330 1,472,114 11,509 30,162 23,904 25,309 90,884 15,368 375,886 14,015 (30,969 ) 374,300 $ 0.06 $ 1.54 $ 0.06 $ (0.13 ) $ 1.53 $ 0.06 $ 1.52 $ 0.06 $ (0.13 ) $ 1.51 $ 2,660 $ 2,938 $ 2,975 $ 3,589 $ 12,162 1,490 1,754 1,218 1,719 6,181 1,170 1,184 1,757 1,870 5,981 1,118 901 1,259 1,437 4,715 $ 0.01 $ — $ — $ 0.01 $ 0.02 $ 0.01 $ — $ — $ 0.01 $ 0.02 $ 16,486 $ 376,787 $ 15,274 $ (29,532 ) $ 379,015 $ 0.07 $ 1.54 $ 0.06 $ (0.12 ) $ 1.55 $ 0.07 $ 1.52 $ 0.06 $ (0.12 ) $ 1.53
| (1) | Net income (loss) per share is computed independently for each of the quarters represented in accordance with |
| (2) |
| (3) |
| (4) |
| (5) |
| (6) |
Our quarterly revenues and operating results are difficult to forecast. Therefore, we believe that period-to-period comparisons of our operating results will not necessarily be meaningful, and should not be relied upon as an indication of future performance. Also, operating results may fall below our expectations and the expectations of securities analysts or investors in one or more future quarters. If this were to occur, the market price of our common stock would likely decline. For more information regarding the quarterly fluctuation of our revenues and operating results, see the section captioned “Business—Factors That May Affect Future Results of Operations—Item 1A, “Risk Factors—Our operating results may fluctuate and our future revenues and profitability are uncertain.”
| ITEM 9. | CHANGES IN AND DISAGREEMENTS WITH ACCOUNTANTS ON ACCOUNTING AND FINANCIAL DISCLOSURE |
None.
| ITEM 9A. | CONTROLS AND PROCEDURES |
Conclusions Regardinga. Evaluation of Disclosure Controls and Procedures
Under the supervision andOur management, with the participation of our management, including our Chief Executive Officer and Chief Financial Officer, we conducted an evaluation ofevaluated the effectiveness of the design and operation of our disclosure controls and procedures (as defined in Rules 13a-15(e) and 15d-15(e) under the Securities Exchange Act of 1934). Based on this evaluation, our chief executive officer and chief financial officer,1934, as amended (“Exchange Act”) as of December 31, 2004, concluded2007. We determined that our disclosure controls and procedures (as defined in Rules 13a-15(e) and 15d-15(e) under the Securities Exchange Act of 1934) arewere not effective to ensure that information required to be disclosed by us in this report wasthe reports we file or submit under the Exchange Act is recorded, processed, summarized and reported within the time periods specified in Securities and Exchange Commissionthe rules and forms forof the SEC because of the material weakness in our internal control over financial reporting discussed below. Notwithstanding the material weakness discussed below, our management, based upon the substantial work performed during the preparation of this report.report, has concluded that information included in this Form 10-K is recorded, processed, summarized and reported, within the time periods specified in the SEC’s rules and forms and that information we are required to disclose in this Form 10-K under the Exchange Act was accumulated and communicated to our management, including the Chief Executive Officer and Chief Financial Officer, to allow timely decisions regarding required disclosure.
b. Management’s Report on Internal Control Overover Financial Reporting
Our management is responsible for establishing and maintaining adequate internal control over financial reporting (asas defined in Rules 13a-15(f) and 15d-15(f) under the Securities Exchange Act of 1934, as amended).Act. Under the supervision and with the participation of our management, including our Chief Executive Officer and Chief Financial Officer, we conducted an evaluation of the effectiveness of our internal control over financial reporting based onas of December 31, 2007 using the frameworkcriteria established inInternal Control—Integrated Frameworkissued by the Committee of Sponsoring Organizations of the Treadway Commission.Commission (COSO).
A material weakness is a deficiency, or combination of deficiencies, in internal control over financial reporting, such that there is a reasonable possibility that a material misstatement of the Company’s annual or interim financial statements will not be prevented or detected on a timely basis. Based on our evaluation under the COSO framework, management identified a material weakness in our internal control over financial reporting as of December 31, 2007 arising from the following control deficiencies in the Company’s stock administration policies and practices:
Lack of effective coordination and communication among the Human Resources Department, Accounting Department and Legal Department in connection with the administration of equity-based grants.
Lack of consistent, complete, and timely reconciliation of certain grants from our stock administration database to our financial reporting systems.
Accordingly, we concluded that the control deficiencies resulted in a reasonable possibility that a material misstatement of the annual or interim financial statements will not be prevented or detected on a timely basis by the company’s internal controls.
As a result of the material weakness described above, management has concluded that the Company did not maintain effective internal control over financial reporting as of December 31, 2007 based on criteria established inInternal Control—Integrated Framework, our management concluded that our internal control over financial issued by COSO.
reporting was effective as of December 31, 2004. Our management’s assessment ofKPMG LLP, an independent registered public accounting firm, has issued a report concerning the effectiveness of our internal control over financial reporting as of December 31, 2004 has been audited by KPMG LLP, an independent registered public accounting firm, as stated2007. See “Report of Independent Registered Public Accounting Firm” in their report that is included herein.Item 15 of this Form 10-K.
c. Changes in Internal Control Overover Financial Reporting
2008 Remediation Plan
Subsequent to December 31, 2007, our Board of Directors approved additional internal control policies and procedures intended to remediate the material weakness described above. As of the date of this filing, management is in the process of implementing the following corrective actions:
Transition the Stock Administration team from the human resources department to the Accounting Department to facilitate collaboration between the Stock Administration team and the Accounting Department.
Improve the coordination and communication among the human resources, accounting and legal departments to identify, in advance, accounting and reporting issues relating to equity-based awards, and to ensure that those awards are properly accounted and reported in accordance with U.S. generally accepted accounting principles.
Develop and implement reconciliations to ensure critical stock administration data fields in our stock administration database are accurately and completely reflected in our financial reporting systems.
There was no change in our internal control over financial reporting (as such term is defined in Rules 13a-15(f) and 15d-15(f) under the Exchange Act) during the period covered by this reportthree months ended December 31, 2007 that has materially affected, or is reasonably likely to materially affect, ourthe Company’s internal control over financial reporting.
Our management, including our chief executive officerd. Inherent Limitations of Disclosure Controls and chief financial officer, does not expect that our disclosure controls and procedures orInternal Control Over Financial Reporting
Because of its inherent limitations, our internal controls willcontrol over financial reporting may not prevent all error and allmaterial errors or fraud. A control system, no matter how well conceived and operated, can provide only reasonable, not absolute, assurance that the objectives of the control system are met. Further,The continued effectiveness of our internal control over financial reporting is subject to risks, including that the designcontrols may become inadequate because of a control system must reflectchanges in conditions or that the fact that there are resource constraints, and the benefitsdegree of controls must be considered relative to their costs. Because of the inherent limitations in all control systems, no evaluation of controls can provide absolute assurance that all control issues and instances of fraud, if any, within VeriSign have been detected.compliance with our policies or procedures may deteriorate.
| ITEM 9B. | OTHER INFORMATION |
None.
| ITEM 10. | DIRECTORS, |
Information regarding executive officers may be found in the section captioned “Executive Officers of the Registrant” (Part I, Item 4A)I) of this Annual Report on Form 10-K. Information regarding our directors, Code of Ethics and compliance with Section 16(a) of the Securities Exchange Act of 1934 and certain other corporate governance matters may be found in the sections captioned “Proposal No. 1—Election of Directors,” “Code of Ethics” and “Section 16(a) Beneficial Ownership Reporting Compliance, respectively, appearing in the definitive Proxy Statement to be delivered to stockholders in connection withfor the 20052008 Annual Meeting of Stockholders. This informationStockholders and is incorporated herein by reference. The definitive Proxy Statement will be filed with the Commission within 120 days after the end of the fiscal year covered by this Annual Report on Form 10-K pursuant to Regulation 14A under the Securities Exchange Act of 1934, as amended.
We have adopted a code of ethics that applies to our principal executive officer, principal financial officer and other senior accounting officers. The “Code of Ethics for the Chief Executive Officer and Senior Financial Officers” is located on our websiteWeb site atwww.verisign.com/verisign-inc/vrsn-investors/index.htmlhttp://investor.verisign.com/documentdisplay.cfm?DocumentID=549.
We intend to satisfy the disclosure requirement under Item 105.05 of Form 8-K regarding any amendment to, or waiver from, a provision of this code of ethics by posting such information on our website,Web site, at the address and location specified above.
| ITEM 11. | EXECUTIVE COMPENSATION |
InformationCompensation Discussion and Analysis
Summary
2007 was a year of transition for us. We are in the process of implementing a new business strategy that will allow us to focus on expanding our core businesses, such as web certificates and the Internet naming registry, and developing closely aligned growth opportunities, such as identity protection services. At the same time, we will be divesting a number of peripheral businesses in our portfolio such as communications, billing and commerce. We experienced significant turnover in our executive ranks in 2007, including in our Chief Executive Officer and Chief Financial Officer positions. In connection with this transition, our executive compensation program went through a number of changes in 2007, including refinement of the performance metrics we use to measure our annual performance as a Company and a change in the mix of long-term equity awards granted.
The ultimate goal of our executive compensation program remains to create long-term value for our stockholders. Toward this goal, we have designed our compensation programs for our executives to reward them for sustained financial and operating performance and leadership excellence, to align their interests with those of our stockholders and to encourage them to remain with us into the future.
In the sections below, we describe our executive compensation program for 2007, including:
The principles on which our executive compensation program was based.
The process by which the Compensation Committee established and reviewed the executive compensation program.
The elements that made up our executive compensation program, as well as detailed information on each individual element.
For 2007, our named executive officers were:
1. William A. Roper, Jr., President, Chief Executive Officer and Director
2. Albert E. Clement, Chief Financial Officer
3. John M. Donovan, Executive Vice President, Sales, Operations, Customer Care and Product Development
4. Aristotle N. Balogh, former Executive Vice President and Chief Technology Officer
5. Robert J. Korzeniewski, former Executive Vice President, Corporate Development
Messrs. Korzeniewski and Balogh terminated their employment on December 31, 2007 and January 8, 2008, respectively. In addition, a number of our senior executives left the Company during 2007, including the following who are also considered to be named executive officers for 2007:
1. Stratton D. Sclavos, former Chairman of the Board, President, and Chief Executive Officer
2. Dana L. Evan, former Executive Vice President, Finance and Administration and Chief Financial Officer
3. Mark D. McLaughlin, former Executive Vice President, Product & Marketing
Executive Compensation
Compensation Goals and Philosophy
As stated above, the goal of our executive compensation program is to create long-term value for our stockholders. In order to achieve this goal, our executive compensation program seeks to attract and retain highly talented executives, motivate them to achieve our business objectives and contribute to our long-term success.
Our executive officer compensation program is designed with the following principles in mind:
Performance: a significant portion of each executive officer’s total compensation should depend on the achievement of corporate objectives and the creation of stockholder value. Compensation should be directly linked to measurable corporate and individual performance, and provide incentives for superior performance that will drive demonstrable business impact.
Alignment: compensation should closely align the interests of our executive officers with the long-term interests of our stockholders.
Retention: compensation should be competitive with that offered by other leading high technology companies we view as competitors for the employment of talented executives.
The Process for Setting Compensation
Role of the Compensation Committee: The Compensation Committee of our Board of Directors (“Committee”) is ultimately responsible for the oversight of our compensation and benefit programs, and sets the policies governing compensation of our executive officers and our other employees. As part of this process, the Committee annually reviews and approves all elements of our executive compensation program, including the annual incentive bonus program and long-term incentive compensation programs for our non-officer employees.
Compensation decisions are made by the Committee after reviewing the performance of the Company and each executive’s performance during the year against established goals, current compensation arrangements, market trends, and the compensation history of the executive officer relative to the other executives.
Role of Management: The CEO annually reviews the performance of each executive officer (other than the CEO whose performance is reviewed by the Chairman and the Committee) and makes a recommendation regarding the salary, incentive bonus and long-term incentive compensation for each executive officer (other than himself) based on his assessment of the performance of each individual. The CEO also takes an active part in the discussions at Committee meetings at which the compensation of executives who report to him directly, including the named executive officers is discussed. All decisions regarding the CEO’s compensation are made by the Committee in executive session, without the CEO present.
Role of Compensation Consultant: Compensia Inc., a recognized, management consulting firm (“Compensia”) served as independent consultant to the Compensation Committee during the first half of 2007 to
assist it in evaluating and analyzing the Company’s executive compensation program, principles and objectives, as well as the specific compensation and benefit design recommendations presented by the Company’s executive management.
In May 2007, the Committee engaged Frederick W. Cook & Co. (“FW Cook”) to serve as its independent compensation consultant. FW Cook reports directly to the Committee and assists in evaluating and analyzing our executive compensation program, principles and objectives, as well as the specific compensation and benefit design recommendations presented by our executive management. FW Cook does not perform any other services for us other than its consulting services to the Committee.
Benchmarking: We use a benchmarking process to help determine base salary, annual incentive bonus and long-term incentive compensation targets for our executive officers. We undertake an annual study of competitive compensation practices for executive officers at certain high technology companies that we view as our peers or as competitors for talent.
The Committee targets total cash compensation (base salary and annual incentive bonus) for each named executive officer at a percentile between the 50th and 75th percentile of the compensation peer group. Long-term incentive compensation is targeted at the 75th percentile of the compensation peer group. Adjustments to total compensation are made based on the executive’s individual performance in the prior year relative to his peers, the executive’s future potential with us, and the scope of the executive’s responsibilities and experience. The Compensation Committee believes that setting base salary, bonus and long-term incentive compensation targets at these levels is necessary in order to effectively attract, retain and motivate talented executives. Other elements of compensation, including health and welfare benefits, and severance and change in control payments and benefits are reviewed periodically by the Compensation Committee to ensure that our total compensation is competitive based on data obtained from various sources at the time of the review.
Our compensation peer group is principally made up of publicly-traded companies in the high technology sector that are either business competitors and/or with which we compete for executive talent. The peer group is comparable to us with regard to labor market competition, market capitalization, revenue and number of employees. The peer group is reviewed annually and adjustments are made as necessary to ensure the group continues to appropriately reflect the competitive market for key talent and includes companies similar to us in scope and complexity.
The Committee determined that the compensation peer group for 2007 would consist of the following fifteen companies: Adobe Systems Inc., Akamai Technologies Inc., Autodesk, BEA Systems Inc., BMC Software, Inc., Business Objects S.A., Cadence Design Systems Inc., Citrix Systems Inc., Convergys Corporation, Electronic Arts Inc., Intuit Inc., Juniper Networks Inc., McAfee, Inc., Network Appliance Inc., and Symantec Corp.
Range of Revenues and Market Cap for 2007 Peer Group
| Most Recent Four Quarters Revenue (in millions) | 12/31/2007 Market Cap (in millions) | |||||
75th Percentile | $ | 2,997.1 | $ | 12,743.7 | ||
Median | $ | 2,070.2 | $ | 7,210.7 | ||
25th Percentile | $ | 1,498.6 | $ | 5,985.8 | ||
VeriSign | $ | 1,496.3 | $ | 8,480.5 | ||
Equity Award Practices: Except for equity awards made in connection with new hires and promotions, equity awards to executive officers and other employees are generally made annually on the date of the Compensation Committee meeting held in August each year. The Committee must approve all new hire and promotion grants to Section 16 executive officers.
Elements of Compensation Program
Base Salary: Base salary is the primary fixed component of our compensation program, and is intended to provide a guaranteed level of annual income to our executives. We believe that offering a competitive annual base salary that is not subject to risk for performance is vital in attracting and retaining our executives.
Base salaries of our executive officers are determined annually. Actual base salary levels are established based upon each executive officer’s job responsibilities and experience, individual contributions and future potential, with reference to base salary levels of executives at other high technology companies we view as our peers. As described above, we target a percentile above the median as determined by a benchmarking analysis in setting the total cash compensation (base salary and annual incentive bonus) for each executive officer. However, the Compensation Committee is mindful of the effects that any changes to base salary can have on other elements of our compensation program such as target bonus amounts and potential severance payments, and carefully considers these factors when setting or changing executive base salaries.
During the course of 2007, the Committee approved base salary adjustments for several of our senior executive officers, including some of the named executive officers. The adjustments were made after the Committee reviewed competitive benchmark data provided by Compensia and by FW Cook and recommendations from the CEO regarding each executive’s individual performance. The Committee determined that the resulting salary levels were between the competitive median and 75th percentile.
Name | Title | 1/1/07 Salary Rate | 12/31/07 Salary Rate | |||||
William A. Roper, Jr. | President, Chief Executive Officer and Director | n/a | $ | 750,000 | ||||
Albert Clement | Chief Financial Officer | $ | 290,000 | $ | 375,000 | |||
John M. Donovan | EVP, Sales, Operations, Customer Care and Product Development | $ | 450,000 | $ | 450,000 | |||
Aristotle Balogh | former EVP and Chief Technology Officer | $ | 336,000 | $ | 360,000 | |||
Robert J. Korzeniewski | former EVP, Corporate Development | $ | 367,500 | $ | 375,000 | |||
The salary rate for Mr. Roper reflects his base salary when he was hired as VeriSign’s President, Chief Executive Officer and Director on May 27, 2007. Mr. Clement received a base salary increase on January 27, 2007 bringing his salary from $290,000 to $305,000. On July 12, 2007, Mr. Clement was appointed to the position of Chief Financial Officer and his salary was increased upon his promotion to $375,000. Messrs. Balogh and Korzeniewski received increases to base salaries effective May 1, 2007. Mr. Donovan’s base salary reflects his salary rate when he was hired on December 1, 2006 and there were no other increases to his salary in 2007.
Annual Incentive Bonus: We have established the VeriSign Performance Plan (“VPP”), an annual cash bonus plan that is designed to reward members of the executive team and other employees for their contributions in helping us achieve financial, operating, and other goals. The plan provides participants with the opportunity to earn an annual cash bonus based on our performance compared against pre-established financial, individual, or strategic goals. Target bonus levels for our executive officers are established in part by reference to bonus levels of executives at other high technology companies we view as our peers as determined by our benchmarking analysis.
In 2007, the performance measures for the VPP were consolidated Company operating income and operating cash flow, as adjusted, with each goal being equally weighted. The adjusted measures exclude the following items which are included under GAAP operating income: amortization of intangible assets, impairment of goodwill, acquired in-process research and development, stock-based compensation, former CEO severance, non-recurring costs and settlements, restructuring, impairments and other charges (reversals), net gain or loss on
the sale or impairment of investments, gain or loss on the sale of a subsidiary, unrealized gain on Jamba JV call option, realized and unrealized gains and losses on embedded derivative, and stock option investigation costs. These goals represented a change from the previous year, when revenues and as adjusted operating income were used. The Committee changed the goals for 2007 because of the changes in our strategic plan in 2007, as the Committee believed that changing the revenue goal to operating cash flow goal, as adjusted, would be a more appropriate performance measure for the Company. The goals for 2007 were reviewed by the Compensation Committee in February and May of 2007. However, due to a strategic review of business operations, the Compensation Committee deferred final approval of the metrics and goals for 2007 until approved in November 2007.
For the 2007 VPP bonuses, the Committee established target levels of performance for each metric, equal to $450 million for operating cash flow and $354 million for operating income. Actual funding for payouts was determined by the Company’s average achievement as a percent of target for the two goals. No payments would be provided for achievement at or below 80% of target, while achievement at or above 120% of the target goals could result in payment of 150% of each executive’s target bonus. For 2007, the Committee determined that the Company achieved 103% of the operating cash flow target and 93% of the operating income target for a combined average result of 98% of target. This achievement of 98% of the targeted performance resulted in the bonus funded at 90% of targeted dollars, based on the schedule, approved by the Committee.
Bonus targets for the named executive officers are set at 60% of base salary except for Mr. Roper whose bonus target is set at 100% of base salary. Bonuses to executives are pro-rated from date of hire or from assignment to executive officer position, or as in the case of former executives, per their severance arrangement. At the Compensation Committee meeting held on February 19, 2008, the Committee approved bonus payments to named executive officers for the following amounts: Mr. Roper, $405,000; Mr. Clement, $134,000; Mr. Donovan, $243,000; Mr. Balogh, $116,640; Mr. Korzeniewski, $121,500; Ms. Evan, $117,936; and Mr. McLaughlin, $145,800. In determining the final payments, the Committee took into account the performance results of the VPP and assessment of the individual performance of each of the executives.
Discretionary Bonus: In 2007, a special discretionary bonus plan was implemented to reward certain employees for work in connection with the Company’s restatement of its financial statements for the years ended December 31, 2005 and 2004 which was completed in July 2007. Payments under the special discretionary bonus plan were made in two parts, based on successful completion of project milestones. Mr. Clement participated in this special discretionary bonus plan and received bonus payments of $60,444 and $40,206 on May 25, 2007 and July 20, 2007, respectively.
Long-term Incentive Compensation: Equity-based grants are an important element of our total compensation program and are designed to support our pay-for-performance philosophy by providing a direct link between employee rewards and increased stockholder value. Long-term incentive award amounts are established based upon each executive officer’s job responsibilities and experience, individual contributions and future potential, with reference to long-term incentive award levels of executives at our peers as determined by our benchmarking analysis.
For 2007, long-term incentive compensation was targeted at the 75th percentile of the compensation peer group; however, a number of other factors were also considered including the individual’s expected contribution to our future success, the individual’s past performance, and the number of unvested stock options and restricted stock units held by the individual.
The Committee approved a change in award value mix for equity awards granted to Vice Presidents and executives, including the named executive officers in 2007. 50% of the total award value was granted in the form of non-qualified stock options and 50% of the total award value was granted in the form of Performance Restricted Stock Units (“Performance RSUs”). In prior years, the mix was 75% stock options and 25% time-vesting RSUs. This change to emphasize restricted stock units over stock options was made to provide additional retention value for senior leaders due to the changes occurring in the Company during 2007.
Stock options were granted with an exercise price equal to fair market value at the date of grant and typically vest over a four-year period with 25% of the option shares vesting on the first anniversary of the grant and the remaining option shares vesting ratably each quarter thereafter until fully vested.
The Committee awarded Performance RSUs to certain senior officers in 2007, including the named executive officers. 100% of the target number of Performance RSUs awarded to each executive will vest on the third anniversary of grant if during any sixty (60) consecutive trading days prior to the third anniversary of the date of grant the average closing price of the Company’s common stock equals or exceeds a stock price target of $39.78, as reported by the Nasdaq Global Select Market. If we do not achieve the stock price target by the third anniversary of grant, 50% of the target number of Performance RSUs will vest on the fourth anniversary of the date of grant, and the remaining 50% of Performance RSUs will be forfeited. Vesting in all cases is subject to the recipient’s continued employment with the Company.
Stock options and restricted stock units were granted on August 7, 2007 at the regularly scheduled Compensation Committee meeting. The grant price for stock options was $29.63 which was the closing selling price per share of VeriSign’s common stock on the NASDAQ Global Select Market on August 7, 2007. The below table details the equity grants awarded to named executive officers, excluding Mr. Roper whose equity grants are discussed in the section titled CEO Compensation.
Name | Title | Number of Stock Options Granted August 7, 2007 | Number of Performance Restricted Stock Units Granted August 7, 2007 | |||
Albert E. Clement | Chief Financial Officer | 70,494 | 49,506 | |||
John M. Donovan | Executive Vice President, Sales, Operations, Customer Care and Product Development | 88,118 | 61,882 | |||
Aristotle N. Balogh | former Executive Vice President and Chief Technology Officer | 70,494 | 49,506 | |||
Robert J. Korzeniewski | former Executive Vice President, Corporate Development | 56,395 | 38,605 | |||
Mark D. McLaughlin | former Executive Vice President, Product & Marketing | 88,118 | 61,882 |
At its meeting held on February 19, 2008, the Committee approved a grant of 10,000 restricted stock units to Mr. Clement. This was a discretionary retentive grant award acknowledging Mr. Clement’s role in the transformation of the company in 2008 and beyond. One-third of this grant will vest two years from anniversary date of grant, one-third will vest on the third anniversary from date of grant and one-third will vest on the fourth anniversary from date of grant.
The Committee believes that both stock options and Performance RSUs accomplish our goal of linking executive compensation to increases in stockholder value. Stock options only have value to the recipient if the Company’s share price increases from the date of grant. In addition, the performance-restricted stock units provide immediate retention value to our executives while still maintaining a strong incentive to increase the Company’s share price.
CEO Compensation:Mr. Roper was hired as the Company’s new Chief Executive Officer on May 27, 2007. His new-hire base salary was established at $750,000 per year. For 2007, Mr. Roper was eligible for the VPP bonus at a target of 100% of his base salary, pro-rated from his date of hire. His maximum bonus potential is no greater than 200% of base salary. Mr. Roper’s base salary and bonus target were positioned at the median of our competitive peer group.
The long-term incentive component of Mr. Roper’s new-hire compensation package consisted of both stock options and restricted stock units. He received a new-hire sign-on non-qualified stock option to acquire 158,227
shares of VeriSign’s common stock. This sign-on option vests in equal installments on each quarterly anniversary date of grant of the sign-on option over the three years from the date of grant, provided that Mr. Roper remains continually employed by VeriSign at all times during the relevant quarter. Mr. Roper also received a new-hire sign-on restricted stock unit (“RSU”) Award with respect to this item110,375 shares of VeriSign’s common stock. The sign-on RSU award vests in equal installments on each quarterly anniversary of the date of grant of the sign-on RSU award over three years from date of grant provided he remain continuously employed by VeriSign at all times during the relevant quarter.
Mr. Roper also received a non-qualified stock option award to acquire 210,970 shares of VeriSign’s common stock. The option vests in equal installments on each quarterly anniversary of the date of grant of the first-year option over the three years from the date of grant.
A Performance RSU award with respect to 88,300 shares was also granted to Mr. Roper. This Performance RSU shall vest upon meeting the terms described above for Performance RSUs.
Mr. Roper’s sign-on and equity awards were granted on August 7, 2007. His stock option awards were granted at an exercise price of $29.63 per share, which represents the closing selling price per share of VeriSign’s common stock on the NASDAQ Global Select Market on the grant date. The sign-on grant amounts were established as a buy-out of previously forfeited equity compensation from Mr. Roper’s prior employer. His other equity grants were established at the market median of our peer group.
Benefits: Executive officers, like other employees, participate in a number of benefit programs designed to enable us to attract and retain employees in a competitive marketplace. We provide executive officers the same health and welfare benefits provided generally to all other employees, at the same general premium rates charged to such employees, with the exception of the Group Voluntary Universal Life insurance benefit. The benefits include medical, dental and vision insurance and other health benefits, fitness club reimbursement up to $390 per year, paid time off, an employee stock purchase plan, and a qualified 401(k) salary deferral plan. The Group Voluntary Universal Life insurance benefit is open to all U.S.-based employees with an annual salary of $110,000 or greater, and provides two times salary in basic life insurance as well as the opportunity to purchase additional life insurance.
Other than those benefits described above, we provide no additional or supplemental benefits, such as a company automobile, club memberships, deferred compensation programs, or retirement benefits, to our executive officers.
Total Compensation: We believe we are fulfilling our compensation objectives and rewarding executive officers in a manner that is consistent with our pay-for-performance philosophy. Executive compensation is tied directly to our performance and is structured to ensure that there is an appropriate balance between our long-term and short-term performance, and also provides a balance between our operational performance and stockholder return. For the named executive officers as of the end of 2007, the aggregate total compensation mix represented 10% base salaries, 5% bonus and 85% long-term incentives.
Share Ownership Guidelines
In addition to aligning interests between executives and stockholders through stock options and restricted stock units, the Board of Directors adopted a stock ownership policy that requires executive officers to own shares of VeriSign common stock. Executive officers are required to own VeriSign common stock in an amount not less than three times their annual base salary (calculated using the executive’s 2005 base salary for individuals who were executive officer at the time of the policy’s adoption or, for officers appointed after the policy’s adoption, the executive’s initial base salary at the time the individual was appointed as an executive officer). Company stock that counts toward satisfaction of these stock ownership guidelines includes: shares owned outright by the officer and his or her immediate family members who share the same household, whether
held individually or jointly; restricted stock where restrictions have lapsed; shares acquired and held upon stock option exercises; and shares obtained through open market purchases. Shares held in trust may also be included, subject to the approval of the Chairman of the Board of Directors. Each executive officer has five years from the later of the date of the adoption of the requirement or of the individual becoming an executive officer, to attain the minimum level of ownership. The stock ownership policy is included in VeriSign’s Corporate Governance Principles which can be found on our website athttp://investor.verisign.com/governance.cfm.
Because we grant stock-based incentive in order to align the interests of its employees with those of its stockholders, our Securities Trading Policy forbids executive officers and other employees from buying or selling derivative securities related to VeriSign common stock, such as puts or calls on VeriSign common stock, as derivative securities may diminish the alignment that we are trying to foster. Company-issued stock options and restricted stock units are not transferable during the executive officer’s life, other than certain gifts to family members (or trusts, partnerships, etc, that benefit family members).
Severance Agreements
We do not have a formal severance program for our executive officers, all of whom are at-will employees. We generally do not enter into employment agreements with our executive officers and employment offers generally do not provide for severance or other benefits following termination.
Change in Control Severance Agreements
In August 2007, we entered into Change in Control Severance Agreements with our Section 16 officers, including the named executive officers. The agreements provide for certain severance benefits in the event an executive’s employment is terminated in connection with a change in control of the Company. All of the agreements are “double trigger” agreements meaning that executives will only be eligible for benefits under the agreements if both i) a change in control of the Company occurs and ii) within twenty-four months of the change in control the executive’s employment is terminated by the Company without cause (or by the executive for good reason) in connection with the change in control. The Committee believes that the change in control severance agreements are necessary to attract and retain highly qualified executives and to neutralize the personal interests of our executives in light of any potential beneficial corporate transaction. The Compensation Committee determined the Change in Control Severance Agreements were reasonable when compared to competitive peer group practice.
Separation Agreements with Former Executives
The employment of several of our senior executives was terminated employment with us in 2007, and we entered into separation agreements with some of these executives. The separation agreements generally provide for severance payments and in some cases, equity award vesting acceleration and extension of post-termination exercise periods. Detailed descriptions of these separation agreements and related severance payments can be found in the narrative that follows and section captioned “Executive Compensation” appearingtitled Grants of Plan-Based Awards for Fiscal 2007.
Retirement of Former Executive
On December 31, 2007, Mr. Korzeniewski retired from the Company. Mr. Korzeniewski is eligible to receive up to his full target bonus for 2007 of $225,000 subject to the approval of the Compensation Committee of the Board of Directors and pursuant to the terms of the 2007 VPP. At its meeting on February 19, 2008 the Compensation Committee approved a bonus of $121,500 for Mr. Korzeniewski based on individual performance and the performance of the Company in fiscal year 2007, pursuant to the terms of the 2007 VPP.
Tax Treatment of Executive Compensation
In determining the amount and form of compensation paid each year to its executive officers, we take into account the tax treatment of such compensation.
Section 162(m) of the Internal Revenue Code of 1986, as amended, limits the federal income tax deduction for compensation paid to each named executive officer, other than the Company’s chief financial officer, to $1,000,000 per year for public companies, unless the compensation is performance-based. Our executive compensation is structured to maximize the amount of compensation expense that is deductible by the Company when, in its judgment, it is appropriate and in the definitive Proxy Statementinterest of the Company and its stockholders. The deductibility of an executive officer’s compensation can depend upon the timing of the executive officer’s vesting or exercise of previously granted rights, as well as other factors beyond the Company’s control. Therefore an executive officer’s compensation is not necessarily limited to that which is deductible under Section 162(m). The Committee may approve payment of compensation that exceeds the deductibility limitation under Section 162(m) in order to meet compensation objectives or if it determines that doing so is otherwise in the interest of our stockholders. Certain Restricted Stock Units awarded in 2007 are not performance based and therefore not exempt from the limitation of deductibility under 162(m).
Report of the Compensation Committee
The information contained in this report shall not be deemed to be delivered“soliciting material” or “filed” with the SEC or subject to stockholdersthe liabilities of Section 18 of the Securities Exchange Act of 1934, as amended (the “Exchange Act”), except to the extent that we specifically incorporate it by reference into a document filed under the Securities Act of 1933, as amended (the “Securities Act”) or the Exchange Act.
The Compensation Committee has reviewed and discussed with management the Compensation Discussion and Analysis included in this Annual Report on Form 10-K. Based on the review and discussions, the Compensation Committee recommended to the Board, and the Board has approved, that the Compensation Discussion and Analysis be included in this Annual Report on Form 10-K.
| This report is submitted by the Compensation Committee |
Louis A. Simpson (Chairperson) |
| Timothy Tomlinson |
Compensation Committee Interlocks and Insider Participation
The members of the Compensation Committee are Louis A. Simpson and Timothy Tomlinson. During fiscal 2007, D. James Bidzos, Michelle Guthrie and Edward A. Mueller also served on the Compensation Committee. All of the members of the Compensation Committee during 2007 were independent directors, and none of the members of the Compensation Committee during 2007 were employees or officers or former officers of VeriSign, with the exception of Mr. Bidzos who served as Chief Executive Officer of the Company from April 1995 until July 1995 and resigned from the Compensation Committee on February 19, 2008. Edward A. Mueller served on the Compensation Committee until his resignation from the Board of Directors on August 15, 2007. Michelle Guthrie served on the Compensation Committee until her resignation from the Compensation Committee on January 30, 2008. No executive officer of VeriSign has served on the compensation committee (or other board committee performing equivalent functions or, in the absence of any such committee, the entire board of directors) or the board of directors of another entity, one of whose executive officers served as a member of the Compensation Committee of VeriSign during fiscal 2007; no executive officer of VeriSign has served on the compensation committee (or other board committee performing equivalent functions or, in the absence of any such committee, the entire board of directors) of another entity, one of whose executive officers served as a member of the Board of Directors of VeriSign during fiscal 2007.
Summary Compensation Table
The following table sets forth certain summary information concerning the compensation received by our chief executive officer and chief financial officer as of the end of fiscal 2007, the three other most highly compensated executive officers as of the end of fiscal 2007, our former principal executive officer and former principal financial officer who served the Company for a portion of fiscal 2007, as well as one individual who would have been among the three most highly compensated executive officers for fiscal 2007 but for the fact that the individual was not serving as an executive officer at the end of fiscal 2007. We refer to these executive officers and former executive officers as our Named Executive Officers.
SUMMARY COMPENSATION TABLE
Named Executive Officer | Year | Salary (1) | Bonus (2) | Stock Awards (3) | Option Awards (3) | Non-Equity Incentive Plan Compensation (4) | All Other Compensation (5) | Total | |||||||||||||||||||
William A. Roper, Jr. (6) | 2007 | $ | 421,154 | $ | — | $ | 744,064 | $ | 585,463 | $ | 405,000 | $ | 117,169 | $ | 2,272,850 | ||||||||||||
President and Chief Executive Officer | |||||||||||||||||||||||||||
Albert E. Clement (7) | 2007 | 333,423 | 101,610 | (8) | 231,356 | 424,811 | 134,000 | 20,084 | 1,245,284 | ||||||||||||||||||
Chief Financial Officer | |||||||||||||||||||||||||||
John M. Donovan | 2007 | 440,526 | — | 365,208 | 721,116 | 243,000 | 1,379,949 | 3,149,799 | |||||||||||||||||||
Executive Vice President, Sales, Operations, Customer Care and Product Development | 2006 | 37,500 | 24,000 | (9) | 8,244 | 43,360 | — | 5,000,038 | (10) | 5,113,142 | |||||||||||||||||
Aristotle N. Balogh (11) | 2007 | 351,138 | 269 | 288,332 | 312,541 | 116,640 | 7,876 | 1,076,796 | |||||||||||||||||||
Former Executive Vice President, Chief Technology Officer | |||||||||||||||||||||||||||
Robert J. Korzeniewski (12) | 2007 | 363,577 | 33,290 | (13) | 228,518 | 281,027 | 121,500 | 8,016 | 1,035,928 | ||||||||||||||||||
Former Executive Vice President, Corporate Development | 2006 | 364,875 | — | 52,263 | 411,347 | 220,500 | 8,220 | 1,057,205 | |||||||||||||||||||
Stratton D. Sclavos (14) | 2007 | 512,183 | 2,813 | 5,733,695 | (15) | 10,240,351 | (15) | — | 10,472,626 | 26,961,668 | |||||||||||||||||
Former Chairman of the Board, President and Chief Executive Officer | 2006 | 932,130 | — | 1,259,903 | 4,633,381 | — | 7,633 | 6,833,047 | |||||||||||||||||||
Dana L. Evan (16) | 2007 | 272,675 | 33,447 | (17) | 212,183 | (18) | 887,604 | (18) | 117,936 | 765,221 | 2,289,066 | ||||||||||||||||
Former Executive Vice President, Finance and Administration and Chief Financial Officer | 2006 | 417,000 | — | 61,596 | 409,957 | 252,000 | 7,857 | 1,148,410 | |||||||||||||||||||
Mark D. McLaughlin (19) | 2007 | 431,308 | 1,008 | 284,359 | (20) | 820,445 | (20) | 145,800 | 249,881 | 1,932,801 | |||||||||||||||||
Former Executive Vice President, Products and Marketing | 2006 | 323,982 | — | 70,689 | 579,435 | 252,000 | 7,624 | 1,233,730 | |||||||||||||||||||
| (1) | Includes, where applicable, amounts electively deferred by each Named Executive Officer under our 401(k) Plan. |
| (2) | Unless otherwise indicated, represents interest paid on contribution refunded to the Named Executive Officer in February 2007 as a participant in the Company’s 1998 Employee Stock Purchase Plan. |
| (3) | Stock Awards consist of restricted stock units (RSUs) and performance-based RSUs. Amounts shown represent compensation expense recognized in fiscal 2007 for financial statement reporting purposes for the applicable awards granted in fiscal 2007 and in prior years pursuant to the Statement of Financial Accounting Standards No. 123(R) (“FAS 123R”), disregarding the estimate of forfeitures related to service-based vesting conditions. The assumptions used to calculate the value of awards for fiscal 2007 are set forth in Note 13, “Stock-Based Compensation”, of our Notes to Consolidated Financial Statements in this Annual Report on Form 10-K, and the assumptions used to calculate the value of awards in prior years are set forth in the Notes to Consolidated Financial Statements in the Annual Reports on Form 10-K for the corresponding years. |
| (4) | Amounts shown are for non-equity incentive plan compensation earned during the year indicated, but paid in the following year. |
| (5) | Except as indicated in the All Other Compensation Table below, amounts in “All Other Compensation” for fiscal 2007 include, where applicable, matching contributions made by the Company to the VeriSign 401(k) Plan, health club fee reimbursements, term life insurance payments and certain other compensation not required to be identified under the SEC rules. |
| (6) | Mr. Roper was appointed President and Chief Executive Officer of the Company on May 27, 2007. |
| (7) | Mr. Clement was appointed Chief Accounting Officer of the Company on July 5, 2007 and appointed Chief Financial Officer of the Company on July 12, 2007. |
| (8) | Includes discretionary bonus of $100,740 paid in fiscal 2007. |
| (9) | Bonus paid for services performed as Chief Executive Officer of inCode Telecom Group, Inc. (“inCode”) during fiscal 2006. |
| (10) | Management retention payment pursuant to the terms of the inCode Management Retention Plan. |
| (11) | Mr. Balogh resigned from the Company on January 8, 2008. |
| (12) | Mr. Korzeniewski retired from the Company on December 31, 2007. |
| (13) | Includes $32,187 to compensate Mr. Korzeniewski in connection with his election as of December 31, 2006 to adjust the exercise price of certain stock options subject to Section 409A of the Internal Revenue Code of 1986, as amended (“409A Affected Options”). |
| (14) | Mr. Sclavos resigned from the Company on May 27, 2007. |
| (15) | Does not include an estimated compensation expense of $1,145,119 for stock awards and $2,337,278 for option awards recognized previously with respect to forfeited equity awards. |
| (16) | Ms. Evan resigned from the Company on July 10, 2007. |
| (17) | Includes $32,187 to compensate Ms. Evan in connection with her election as of December 31, 2006 to adjust the exercise price of her 409A Affected Options. |
| (18) | Does not include an estimated compensation expense of $49,447 for stock awards and $135,981 for option awards recognized previously with respect to forfeited equity awards. |
| (19) | Mr. McLaughlin resigned from the Company on December 1, 2007. |
| (20) | Does not include an estimated compensation expense of $54,303 for stock awards, $54,467 for option awards and $291 in employee stock purchase plan contributions recognized previously with respect to forfeited equity awards and plan contributions. |
ALL OTHER COMPENSATION TABLE
Named Executive Officer | Year | Gross-Ups or Other Amounts for Payment of Taxes | Severance Payments | Relocation Expense Reimbursement | Non-Employee Director Retainer Fees | |||||||||||||
William A. Roper, Jr. | 2007 | $ | — | $ | — | $ | — | $ | 114,952 | (A) | ||||||||
Albert E. Clement | 2007 | 12,501 | (B) | — | — | — | ||||||||||||
John M. Donovan | 2007 | — | — | 1,372,172 | (C) | — | ||||||||||||
Aristotle N. Balogh | 2007 | — | — | — | — | |||||||||||||
Robert J. Korzeniewski | 2007 | — | — | — | — | |||||||||||||
Stratton D. Sclavos | 2007 | — | 10,465,415 | (D) | — | — | ||||||||||||
Dana L. Evan | 2007 | — | 754,632 | (E) | — | — | ||||||||||||
Mark D. McLaughlin | 2007 | 11,110 | (F) | 228,670 | (G) | — | — | |||||||||||
| (A) | Includes cash compensation of $58,250 for services as a non-employee director from January 1, 2007 to May 26, 2007. Also includes an estimated compensation expense of $56,702 recognized in fiscal 2007 for financial statement reporting purposes for the applicable awards granted in fiscal 2007 and in prior years pursuant to FAS 123R, disregarding expenses previously recognized with respect to forfeited awards. See “Compensation of Directors” elsewhere in this report for information regarding the compensation of non-employee directors. |
| (B) | Payment (on a fully grossed-up basis) for the estimated amount of tax and interest incurred as a result of the exercise in fiscal 2006 of certain 409A Affected Options. |
| (C) | Reimbursement of relocation expenses in connection with Mr. Donovan’s relocation to California. |
| (D) | Payments paid or accrued pursuant to the terms of Mr. Sclavos’ Consulting and Separation Agreement dated July 9, 2007 (“Sclavos Agreement”), the material terms of which are summarized in the narrative disclosure below “Grants of Plan-Based Awards Table for Fiscal 2007” elsewhere in this report. |
| (E) | Payments paid or accrued pursuant to the terms of the Severance and General Release Agreement dated August 22, 2007 (“Evan Agreement”), the material terms of which are summarized in the narrative disclosure below “Grants of Plan-Based Awards Table for Fiscal 2007” elsewhere in this report. |
| (F) | Payment (on a fully grossed-up basis) for the estimated amount of tax and interest incurred as a result of the exercise in fiscal 2006 of certain 409A Affected Options. |
| (G) | Payments paid or accrued pursuant to the terms of Mr. McLaughlin’s Separation and General Release Agreement dated November 28, 2007 (“McLaughlin Agreement”), the material terms of which are summarized in the narrative disclosure below “Grants of Plan-Based Awards Table for Fiscal 2007” elsewhere in this report. |
Grants of Plan-Based Awards for Fiscal 2007
The following table shows all plan-based awards granted to the Named Executive Officers during fiscal 2007.
GRANTS OF PLAN-BASED AWARDS FOR FISCAL 2007 (1)
Named Executive Officer | Grant Date | Estimated Future Payouts Under Non-Equity Incentive Plan Awards ($) | Estimated Future Payouts Under Equity Incentive Plan Awards (#) | All Other Stock Awards: Number of Shares of Stock or Units (#) | All Other Option Awards: Number of Securities Underlying Options (#) | Exercise or Base Price of Option Awards ($/Sh) | Grant Date Fair Value of Stock and Option Awards ($) | |||||||||||||||
| Threshold | Target | Maximum | Threshold | Target | Maximum | |||||||||||||||||
William A. Roper, Jr. | 08/07/2007 | — | — | — | — | — | — | — | 158,227 | 29.63 | 1,674,801 | |||||||||||
| 08/07/2007 | — | — | — | — | — | — | — | 210,970 | 29.63 | 2,233,075 | ||||||||||||
| 08/07/2007 | — | — | — | — | — | — | 110,375 | — | — | 3,270,411 | ||||||||||||
| 08/07/2007 | — | — | — | 44,150 | 88,300 | 88,300 | — | — | — | — | ||||||||||||
| — | 750,000 | 1,500,000 | — | — | — | — | — | — | — | |||||||||||||
Albert E. Clement (2) | 08/07/2007 | — | — | — | — | — | — | — | 70,494 | 29.63 | 746,165 | |||||||||||
| 08/07/2007 | — | — | — | 24,753 | 49,506 | 49,506 | — | — | — | — | ||||||||||||
| — | 225,000 | 337,500 | — | — | — | — | — | — | — | |||||||||||||
John M. Donovan | 08/07/2007 | — | — | — | — | — | — | — | 88,118 | 29.63 | 932,711 | |||||||||||
| 08/07/2007 | — | — | — | 30,941 | 61,882 | 61,882 | — | — | — | — | ||||||||||||
| — | 270,000 | 405,000 | — | — | — | — | — | — | — | |||||||||||||
Aristotle N. Balogh (3) | 08/07/2007 | — | — | — | — | — | — | — | 70,494 | 29.63 | 746,165 | |||||||||||
| 08/07/2007 | — | — | — | 24,753 | 49,506 | 49,506 | — | — | — | — | ||||||||||||
| — | 216,000 | 324,000 | — | — | — | — | — | — | — | |||||||||||||
Robert J. Korzeniewski (4) | 08/07/2007 | — | — | — | — | — | — | — | 56,395 | 29.63 | 596,930 | |||||||||||
| 08/07/2007 | — | — | — | 19,302 | 38,605 | 38,605 | — | — | — | — | ||||||||||||
| — | 225,000 | 337,500 | — | — | — | — | — | — | — | |||||||||||||
Stratton D. Sclavos (5) | — | — | — | — | — | — | — | — | — | — | ||||||||||||
Dana L. Evan (6) | — | 131,040 | — | — | — | — | — | — | — | — | ||||||||||||
Mark D. McLaughlin (7) | 08/07/2007 | — | — | — | — | — | — | — | 88,118 | 29.63 | 932,711 | |||||||||||
| 08/07/2007 | — | — | — | 30,941 | 61,882 | 61,882 | — | — | — | — | ||||||||||||
| — | 270,000 | — | — | — | — | — | — | — | — | |||||||||||||
| (1) | Named Executive Officers are entitled to receive an annual cash bonus and long-term incentive plan compensation as described in “Compensation Discussion and Analysis” elsewhere in this report. |
| (2) | Effective November 8, 2007, Mr. Clement elected to adjust the exercise price of a 409A Affected Option to purchase an aggregate of 63,000 shares of VeriSign common stock from $17.36 to $19.82 and the exercise price of a 409A Affected Option to purchase 3,369 shares of VeriSign common stock from $12.88 to $14.93. In accordance with FAS 123R, there was no incremental fair value assigned to the 409A Affected Options as a result of these elections. |
| (3) | Mr. Balogh resigned from the Company on January 8, 2008. |
| (4) | Mr. Korzeniewski retired from the Company on December 31, 2007. |
| (5) | Mr. Sclavos resigned from the Company on May 27, 2007. |
| (6) | Ms. Evan resigned from the Company on July 10, 2007. |
| (7) | Mr. McLaughlin resigned from the Company on December 1, 2007. |
The Company generally does not enter into employment agreements with its executive officers each of whom may be terminated at any time at the discretion of the Board of Directors. On November 29, 2007, the Company entered into an employment agreement with William A. Roper, Jr., President and Chief Executive Officer of the Company. During 2007, the Company entered into change-in-control agreements with each of its executive officers, including the Named Executive Officers. The material terms of Mr. Roper’s employment agreement and the change-in-control agreements are described in “Potential Payments Upon Termination or Change-in-Control” elsewhere in this report.
Stock options are granted at an exercise price not less than 100% of the fair market value of VeriSign’s common stock on the date of grant and have a term of not greater than 10 years from the date of grant. Stock options generally vest as to 25% of the granted option on the first anniversary of the date of grant and ratably thereafter over the following 12 quarters. Stock options granted to Mr. Roper on August 7, 2007 vest ratably over 3 years from the date of grant; if Mr. Roper is terminated without cause (as defined in his employment agreement), the vesting of certain of these stock options will be immediately accelerated. A restricted stock unit (“RSU”) is an award covering a number of shares of VeriSign common stock that may be settled in cash or by issuance of those shares, which may consist of restricted stock. RSUs, other than performance-based RSUs, generally vest in four installments with 25% of the granted RSUs vesting on each anniversary of the date of grant over four years. RSUs granted to Mr. Roper on August 7, 2007, other than performance-based RSUs, vest ratably over 3 years from the date of grant; if Mr. Roper is terminated without cause (as defined in his employment agreement), the vesting of certain of these RSUs will be immediately accelerated.
The Compensation Committee granted performance-based RSUs to certain executive officers of the Company, including the Named Executive Officers, on August 7, 2007. Such performance-based RSUs vest as to 100% of the granted RSUs on the third anniversary of the date of grant if the designated VeriSign stock price target is achieved at any time during the 36-month period beginning on the date of grant and the executive officer is an employee of the Company on such date. The stock price target is deemed to have been attained if during any 60 consecutive trading days prior to the third anniversary of the date of grant the average closing price of the Company’s stock equals or exceeds $39.78. If by the third anniversary of the date of grant the stock price target has not been attained, 50% of the RSUs will vest on the fourth anniversary of the date of grant provided the recipient is an employee of VeriSign at that time and the remaining 50% of the RSUs will be forfeited.
Severance Arrangement with Mr. Sclavos. On July 9, 2007, VeriSign entered into a Consulting and Separation Agreement with Mr. Sclavos in connection with his resignation (the “Sclavos Separation Agreement”). Pursuant to the 2005 Annual Meetingterms of Stockholders. This informationthe Sclavos Separation Agreement, Mr. Sclavos provides consulting services to the Company for a one-year period at the rate of $5,000 per month and is incorporated herein by reference.prohibited from engaging in certain competitive activities or soliciting customers of the Company during such period. The Company paid Mr. Sclavos a severance payment in the amount of $1,969,380 and will make an additional severance payment to Mr. Sclavos in the amount of $1,969,380 on June 15, 2008, subject to his compliance with the terms of the agreement. In the event of a change-in-control of the Company, all severance payments will accelerate and become immediately due and payable.
The Company accelerated all of Mr. Sclavos’ outstanding options to purchase shares of the Company’s common stock and restricted stock units that were scheduled to vest within twenty-four (24) months after his resignation. Accordingly, vesting for restricted stock units with respect to approximately 156,000 shares of the Company's common stock and the following stock options were accelerated:
Grant Date | Exercise Price | Number of Shares Accelerated | |||
10/29/2003 | $ | 15.87 | 86,340 | ||
11/01/2005 | 23.46 | 192,650 | |||
08/01/2006 | 17.94 | 400,813 | |||
Total: | 679,803 | ||||
On May 31, 2007, in anticipation of entering into the Sclavos Separation Agreement, the Company paid Mr. Sclavos severance in the amount of $1,031,580 and $115,422 for all unpaid wages and unused paid time off accrued through his resignation date.
The Company also paid Mr. Sclavos $5,459,430 in connection with an option to purchase 300,000 shares of the Company’s common stock that was previously granted to Mr. Sclavos but was erroneously deleted from the Company’s records.
Severance Arrangement with Ms. Evan. On August 22, 2007, VeriSign entered into a Severance and General Release Agreement (the “Evan Severance Agreement”) with Dana L. Evan, former Executive Vice President, Finance and Administration and Chief Financial Officer in connection with her resignation on July 10, 2007. Pursuant to the terms of the Evan Severance Agreement, VeriSign paid Ms. Evan $60,000 for consulting services provided by Ms. Evan from July 11, 2007 to December 31, 2007. Ms. Evan received a severance payment in the amount of $450,240 and will also receive a severance payment in the amount of $221,760 to be paid on the one year anniversary of her resignation date, provided that Ms. Evan is in full compliance of her obligations under the Evan Severance Agreement. Ms. Evan was paid her full target bonus for 2006 in the amount of $252,000 and will be paid her pro rated target bonus for 2007 (to be paid when VeriSign pays bonuses for 2007 to its employees), provided that Ms. Evan is in full compliance of her obligations under the Evan Severance Agreement. Ms. Evan also received (i) an acceleration of vesting of 49,343 shares subject to outstanding stock options with a weighted average exercise price of approximately $17.43 per share; (ii) an acceleration of vesting with respect to 4,950 shares subject to restricted stock units; and (iii) payments equal to 18 months of COBRA and life insurance premiums. In addition, Ms. Evan has agreed to execute a release in favor of VeriSign and to not solicit VeriSign’s employees, consultants and employees for 12 months after her resignation date, and be bound by a non-competition obligation for 12 months after her resignation date.
Severance Arrangement with Mr. McLaughlin. Effective December 8, 2007, VeriSign entered into a Separation and General Release Agreement with Mark D. McLaughlin, former Executive Vice President, Products and Marketing (the “McLaughlin Separation Agreement”) in connection with his resignation on December 1, 2007. Pursuant to the terms of the McLaughlin Separation Agreement, Mr. McLaughlin has agreed to provide consulting services to VeriSign from December 2, 2007 to December 1, 2008 and VeriSign will pay Mr. McLaughlin $5,000 per month for such services. Mr. McLaughlin received acceleration of vesting of 19,811 shares subject to outstanding stock options with a weighted average exercise price of approximately $22.54 per share and will be eligible to receive up to his full target bonus for 2007 of $270,000 (to be paid when VeriSign pays bonuses for 2007 to its employees), provided that Mr. McLaughlin is in full compliance of his obligations under the McLaughlin Separation Agreement and otherwise subject to the terms of the 2007 VeriSign Performance Plan. In 2007, VeriSign paid Mr. McLaughlin $234,941 to compensate him for his election as of December 31, 2006 to increase the exercise price of certain of VeriSign stock options (“Affected Options”) in order to avoid unfavorable tax consequences under Section 409A of the Internal Revenue Code (the “Code”) as well as to reimburse him (on a fully grossed-up basis) for the estimated amount of tax owed in connection with his exercise in 2006 of certain Affected Options. In addition, Mr. McLaughlin has executed a release in favor of VeriSign and agreed not to solicit VeriSign’s employees, consultants and employees for 12 months after his resignation date.
Retirement of Mr. Korzeniewski. On December 31, 2007, Mr. Korzeniewski retired from the Company. Mr. Korzeniewski will be eligible to receive up to his full target bonus for 2007 of $225,000 (to be paid when VeriSign pays bonuses for 2007 to its employees), subject to the approval of the Compensation Committee of the Board of Directors and pursuant to the terms of the 2007 VeriSign Performance Plan.
Severance Arrangement with Mr. Balogh. In January 2008, VeriSign entered into a Separation and General Release Agreement (the “Balogh Separation Agreement”) with Aristotle Balogh, former Executive Vice President, Chief Technology Officer, in connection with his resignation on January 8, 2008. Pursuant to the terms of the Balogh Separation Agreement, Mr. Balogh will be eligible to receive a 2007 bonus up to his full target bonus for 2007 of $216,000 (to be paid when VeriSign pays bonuses for 2007 to its employees), provided that Mr. Balogh is in full compliance of his obligations under the Balogh Separation Agreement and otherwise subject to the terms of the 2007 VeriSign Performance Plan.
Please refer to “Compensation Discussion and Analysis” elsewhere in this report for more information concerning our compensation practices and policies for executive officers.
Outstanding Equity Awards at 2007 Fiscal Year-End
The following table shows all outstanding equity awards held by the Named Executive Officers at the end of fiscal 2007.
OUTSTANDING EQUITY AWARDS AT 2007 FISCAL YEAR-END
| Option Awards | Stock Awards | ||||||||||||||||||||||
Named Executive Officer | Number of Securities Underlying Unexercised Option Exercisable (1) | Number of Securities Underlying Unexercised Option Unexercisable | Option Exercise Price | Option Expiration Date | Number of Shares or Units of Stock That Have Not Vested | Market Value of Shares or Units of Stock That Have Not Vested (2) | Equity Incentive Plan Awards: Number of Unearned Shares, Units or Other Rights That Have Not Vested | Equity Incentive Plan Awards Market or Payout Value of Unearned Shares, Units or Other Rights That Have Not Vested (2) | |||||||||||||||
William A. Roper, Jr. | 25,000 | — | $ | 15.41 | 11/21/2013 | — | $ | — | — | $ | — | ||||||||||||
| 12,500 | — | 31.71 | 11/22/2014 | — | — | — | — | ||||||||||||||||
| 6,250 | 6,250 | (3) | 23.28 | 11/21/2015 | — | — | — | — | |||||||||||||||
| 5,500 | 12,100 | (4) | 17.94 | 8/1/2013 | — | — | — | — | |||||||||||||||
| 13,186 | 145,041 | (5) | 29.63 | 8/7/2017 | — | — | — | — | |||||||||||||||
| 17,581 | 193,389 | (5) | 29.63 | 8/7/2017 | — | — | — | — | |||||||||||||||
| — | — | — | — | 4,575 | (6) | 172,066 | — | — | |||||||||||||||
| — | — | — | — | 101,177 | (7) | 3,805,267 | — | — | |||||||||||||||
| — | — | — | — | — | — | 88,300 | (8) | 3,320,963 | |||||||||||||||
Albert E. Clement | 25,000 | — | 13.79 | 2/21/2009 | — | — | — | — | |||||||||||||||
| 8,125 | — | 12.88 | 9/26/2010 | — | — | — | — | ||||||||||||||||
| 13,063 | 9,937 | (9) | 19.82 | 8/31/2011 | — | — | — | — | |||||||||||||||
| 8,125 | 1,875 | (9) | 19.82 | 8/31/2011 | — | — | — | — | |||||||||||||||
| 47,700 | — | 26.40 | 8/2/2012 | — | — | — | — | ||||||||||||||||
| 11,250 | — | 26.40 | 8/2/2012 | — | — | — | — | ||||||||||||||||
| 2,656 | 27,844 | (4) | 17.94 | 8/1/2013 | — | — | — | — | |||||||||||||||
| 2,531 | 5,569 | (4) | 17.94 | 8/1/2013 | — | — | — | — | |||||||||||||||
| — | 70,494 | (10) | 29.63 | 8/7/2014 | — | — | — | — | |||||||||||||||
| — | — | — | — | 875 | (11) | 32,909 | — | — | |||||||||||||||
| — | — | — | — | 3,710 | (11) | 139,533 | — | — | |||||||||||||||
| — | — | — | — | 675 | (6) | 25,387 | — | — | |||||||||||||||
| — | — | — | — | 3,375 | (6) | 126,934 | — | — | |||||||||||||||
| — | — | — | — | — | — | 49,506 | (8) | 1,861,921 | |||||||||||||||
John M. Donovan | 663 | 6,625 | (12) | 5.1808 | (13) | 10/29/2013 | — | — | — | — | |||||||||||||
| 25,000 | 150,000 | (14) | 25.34 | 12/12/2013 | — | — | — | — | |||||||||||||||
| — | 88,118 | (10) | 29.63 | 8/7/2014 | — | — | — | — | |||||||||||||||
| — | — | — | — | 18,750 | (15) | 705,188 | — | — | |||||||||||||||
| — | — | — | — | — | — | 61,882 | (8) | $ | 2,327,382 | ||||||||||||||
Aristotle N. Balogh | 22,500 | — | 26.53 | 11/3/2011 | — | — | — | — | |||||||||||||||
| 39,375 | — | 26.40 | 8/2/2012 | — | — | — | — | ||||||||||||||||
| — | 49,500 | (4) | 17.94 | 8/1/2013 | — | — | — | — | |||||||||||||||
| — | 25,000 | (16) | 22.30 | 5/16/2013 | — | — | — | — | |||||||||||||||
| — | 70,494 | (10) | 29.63 | 8/7/2014 | — | — | — | — | |||||||||||||||
| — | — | — | — | 7,000 | (11) | 263,270 | — | — | |||||||||||||||
| — | — | — | — | 3,150 | (17) | 118,472 | — | — | |||||||||||||||
| — | — | — | — | 6,000 | (6) | 225,660 | — | — | |||||||||||||||
| — | — | — | — | — | — | 49,506 | (8) | $ | 1,861,921 | ||||||||||||||
Robert J. Korzeniewski | 1,458 | — | 42.2600 | 3/15/2008 | — | — | — | — | |||||||||||||||
| 11,250 | — | 38.3000 | 9/6/2008 | — | — | — | — | ||||||||||||||||
| 28,125 | — | 26.5300 | 11/3/2011 | — | — | — | — | ||||||||||||||||
| 39,375 | — | 26.4000 | 8/2/2012 | — | — | — | — | ||||||||||||||||
Stratton D. Sclavos | — | — | — | — | — | — | — | — | |||||||||||||||
Dana L. Evan | 38,333 | — | 42.2600 | 3/15/2008 | — | — | — | — | |||||||||||||||
| 1,667 | — | 42.2600 | 3/15/2008 | — | — | — | — | ||||||||||||||||
| 33,750 | — | 26.5300 | 11/3/2011 | — | — | — | — | ||||||||||||||||
| 47,250 | — | 26.4000 | 8/2/2012 | — | — | — | — | ||||||||||||||||
Mark D. McLaughlin | 6,250 | — | 33.3800 | 12/17/2011 | — | — | — | — | |||||||||||||||
| 33,750 | — | 26.4000 | 8/2/2012 | — | — | — | — | ||||||||||||||||
| (1) | On December 29, 2005, VeriSign's Board of Directors approved the acceleration of vesting of unvested stock options with an exercise price per share in excess of $24.99. Such acceleration was accompanied by restrictions that prohibit the sale of any shares acquired upon the exercise of such stock options prior to the date such stock options would have originally vested had the optionee been employed on such date (whether or not the optionee is actually an employee at that time). All vesting terms assume continued employment with VeriSign through full vesting of the respective option or restricted stock unit award. |
| (2) | The market value is calculated by multiplying the number of shares by the closing price of our common stock on December 31, 2007 which was $37.61. |
| (3) | The option was granted 11/21/2005. The option became exercisable as to 6.25% of the grant on 02/21/2006 and vests quarterly thereafter at the rate of 6.25% until fully vested. |
| (4) | The option was granted 08/01/2006. The option became exercisable as to 25% of the grant on 08/01/2007 and vests quarterly thereafter at the rate of 6.25% until fully vested. |
| (5) | The option was granted 08/07/2007. The option became exercisable as to 8 1/3% of the grant on 11/07/2007 and vests quarterly thereafter at the rate of 8 1/3% until fully vested. |
| (6) | An award of RSUs was granted on 08/01/2006. The RSUs vest as to 25% of the total award on each anniversary of the date of grant until fully vested. |
| (7) | An award of RSUs was granted on 08/07/2007. The RSUs vest as to 8 1/3% of the total award quarterly from the date of grant until fully vested. |
| (8) | An award of performance-based RSUs was granted on 08/07/2007. If specified performance criteria are achieved, 100% of the grant will vest on the third anniversary of the date of grant. If specified performance criteria are not achieved, 50% of the grant will vest on the fourth anniversary of the date of grant and the remaining 50% of the grant will be forfeited. |
| (9) | The option was granted 08/31/2004. The option became exercisable as to 25% of the grant on 08/31/2005 and vests quarterly thereafter at the rate of 6.25% until fully vested. |
| (10) | The option was granted 08/07/2007. The option will become exercisable as to 25% of the grant on 08/07/2008 and will vest quarterly thereafter at the rate of 6.25% until fully vested. |
| (11) | An award of RSUs was granted on 08/02/2005. The RSUs vest ratably over four years as to 10% of the total award on the first, 20% on the second, 30% on the third and 40% on the fourth anniversary of the date of grant until fully vested. |
| (12) | The option was granted 11/30/2006. The option became exercisable as to 662 shares on 12/29/2006 and vests monthly thereafter until fully vested on 10/29/2008. |
| (13) | Stock option received in connection with VeriSign’s acquisition of inCode on November 30, 2006. |
| (14) | The option was granted 12/12/2006. The option became exercisable as to 25% of the grant on 12/12/2007 and vests quarterly thereafter at the rate of 6.25% until fully vested. |
| (15) | An award of RSUs was granted on 12/12/2006. The RSUs vest as to 25% of the total award on each anniversary of the date of grant until fully vested. |
| (16) | The option was granted 05/16/2006. The option became exercisable as to 25% of the grant on 05/16/2007 and vests quarterly thereafter at the rate of 6.25% until fully vested. |
| (17) | An award of RSUs was granted on 05/16/2006. The RSUs vest as to 25% of the total award on each anniversary of the date of grant until fully vested. |
Option Exercises and Stock Vested for Fiscal 2007
The following table shows all stock options exercised and the value realized upon exercise, and all stock awards vested and the value realized upon vesting, by our Named Executive Officers during 2007.
OPTION EXERCISES AND STOCK VESTED FOR FISCAL 2007
| Option Awards | Stock Awards | |||||||||
Named Executive Officer | Number of Shares Acquired on Exercise | Value Realized on Exercise | Number of Shares Acquired on Vesting | Value Realized on Vesting | ||||||
William A. Roper, Jr. | — | $ | — | 10,723 | $ | 349,616 | ||||
Albert E. Clement | 107,931 | 2,178,721 | 2,660 | 76,801 | ||||||
John M. Donovan | 34,231 | 627,649 | 6,250 | 233,625 | ||||||
Aristotle N. Balogh | 177,479 | 1,918,580 | 5,050 | 143,273 | ||||||
Robert J. Korzeniewski | 474,792 | 5,592,252 | 4,000 | 115,500 | ||||||
Stratton D. Sclavos | 2,628,668 | 31,472,774 | 157,889 | 38,356 | ||||||
Dana L. Evan | 528,843 | 4,944,311 | 4,950 | 160,529 | ||||||
Mark D. McLaughlin | 293,873 | 4,042,771 | 5,550 | 157,628 | ||||||
Potential Payments Upon Termination or Change-in-Control
The Company has no formal severance program for its Named Executive Officers, each of whom may be terminated at any time at the discretion of the Board of Directors. During 2007, the Company entered into change-in-control agreements with each of its executive officers, including the Named Executive Officers, pursuant to a policy adopted by the Compensation Committee on August 7, 2007 (the “Policy”). Under the Policy, an executive officer of the Company is entitled to receive severance benefits if, within the twenty-four months following a “change-in-control” (or under certain circumstances, preceding a “change-in-control”), the executive officer’s employment is terminated by VeriSign without “cause” or is voluntarily terminated by the executive officer for “good reason.”
Under the Policy, “change-in-control” means:
(a) any “person” (as such term is used in Sections 13(d) and 14(d) of the Securities Exchange Act of 1934, as amended (the “Exchange Act”)), other than a trustee or other fiduciary holding securities of the Company under an employee benefit plan of the Company or its subsidiaries, becomes the “beneficial owner” (as defined in Rule 13d-3 promulgated under the Exchange Act), directly or indirectly (excluding, for purposes of this Section 4.5, securities acquired directly from the Company), of securities of the Company representing at least thirty percent (30%) of (A) the then-outstanding shares of common stock of the Company or (B) the combined voting power of the Company’s then-outstanding securities;
(b) the consummation of a merger or consolidation, or series of related transactions, which results in the voting securities of the Company outstanding immediately prior thereto failing to continue to represent (either by remaining outstanding or by being converted into voting securities of the surviving entity), directly or indirectly, at least fifty (50%) percent of the combined voting power of the voting securities of the Company or such surviving entity outstanding immediately after such merger or consolidation;
(c) a change in the composition of the Board occurring within a 24-month period, as a result of which fewer than a majority of the directors are incumbent directors;
(d) the sale or disposition of all or substantially all of the Company’s assets (or consummation of any transaction, or series of related transactions, having similar effect); or
(e) stockholder approval of the dissolution or liquidation of the Company.
Under the Policy, “cause” means:
(a) an executive’s willful and continued failure to substantially perform the executive’s duties after written notice providing the executive with ninety (90) days from the date of the executive’s receipt of such notice in which to cure;
(b) conviction of (or plea of guilty or no contest to) the executive for a felony involving moral turpitude;
(c) an executive’s willful misconduct or gross negligence resulting in material harm to the Company; or
(d) an executive’s willful violation of the Company’s policies resulting in material harm to the Company.
Under the Policy, “good reason” means:
(a) a change in the executive’s authority, duties or responsibilities that is inconsistent in any material and adverse respect from the executive’s authority, duties and responsibilities immediately preceding the change-in-control;
(b) a reduction in the executive’s base salary compared to the executive’s base salary immediately preceding the change-in-control, except for an across-the-board reduction of not more than ten percent (10%) of base salary applicable to all senior executives of the Company;
(c) a reduction in the executive’s bonus opportunity of five percent (5%) or more from the executive’s bonus opportunity immediately preceding the change-in-control, except for an across-the-board reduction applicable to all senior executives of the Company;
(d) a failure to provide the executive with long-term incentive opportunities that in the aggregate are at least comparable to the long-term incentives provided to other senior executives at the Company;
(e) a reduction of at least 5% in aggregate benefits that the executive is entitled to receive under all employee benefit plans of the Company following a change-in-control compared to the aggregate benefits the executive was eligible to receive under all employee benefit plans maintained by the Company immediately preceding the change-in-control; or
(f) a requirement that the executive be based at any office location more than 40 miles from the executive’s primary office location immediately preceding the change-in-control, if such relocation increases the executive’s commute by more than ten (10) miles from the executive’s principal residence immediately preceding the change-in-control; or
(g) the failure of the Company to obtain the assumption of the agreement from any successor as provided in the agreement.
If such events occur and the executive officer timely delivers a general release agreement, the Policy provides that VeriSign will make the following payments to the executive officer (except to the extent that such payments are subject to a six month delay if required by the Internal Revenue Code Section 409A deferred compensation rules):
the pro rata target bonus for the year in which the executive officer was terminated;
a specified multiple of the executive officer’s annual base salary plus an average of the executive officer’s annual bonus amount for the last three full fiscal years prior to a change-in-control; the applicable multiples are 200% of the annual base salary and bonus for the chief executive officer and 100% of the annual base salary and bonus for other executive officer participants; and
continued health benefits for the executive officer and the executive officer’s eligible dependents for a number of years equal to the severance multiple, provided that such coverage of health benefits will cease if the executive officer becomes eligible for comparable benefits from a new employer.
The Policy has an initial term of two years and will automatically renew for one-year periods thereafter unless the Board of Directors terminates the Policy at least 90 days before the end of the then-current term.
On August 24, 2007, the Compensation Committee adopted and approved a form of Change-in-Control and Retention Agreement to be entered into with VeriSign’s executive officers (the “CIC Agreement”) and a form of Change-in-Control and Retention Agreement to be entered into with VeriSign’s Chief Executive Officer, William A. Roper, Jr. (the “CEO Agreement”). On November 29, 2007, Mr. Roper and the Company entered into the CEO Agreement effective as of May 27, 2007. The terms and conditions of the CIC Agreement and CEO Agreement are materially consistent with the Policy, with the additional provisions described below.
In addition to the terms and conditions approved as part of the Policy, the CIC Agreement also contains the following provisions:
immediate acceleration of vesting of all of the executive officer’s unvested stock options and restricted stock units if there is a termination of such officer’s employment within twenty-four months after a change-in-control (as defined in the Policy) by VeriSign without “cause” (as defined in the Policy) or by
the officer for “good reason” (as defined in the Policy) (or up to six months before a change-in-control if the officer is terminated at the request of a third party in contemplation of a change-in-control and the change-in-control is effective within six months of the termination date); however, if the consideration to be received by stockholders of the Company in connection with the change-in-control consists of substantially all cash or if the stock options and restricted stock units held by the executive officer are not assumed in the change-in-control, then all of the executive officer’s then-unvested and outstanding stock options and restricted stock units shall vest immediately prior to the change-in-control regardless of whether or not there is a termination of employment in connection therewith; |
to the extent any payments are characterized as a parachute payment within the meaning of Section 4999 of the Internal Revenue Code of 1986, as amended (the “Code”), and such characterization would subject the executive officer to a federal excise tax due to that characterization, the executive officer may elect to be paid in full or in such lesser amount as would result in the executive officer’s receipt, on an after-tax basis, of the greatest amount of termination and other benefits, after taking into account applicable federal, state and local taxes, including the excise tax under Section 4999 of the Code;
an initial term of two years and automatic renewal for one-year periods thereafter unless the Board of Directors terminates the CIC Agreement at least 90 days before the end of the then-current term; provided that such termination shall not be effective until the later of the last day of the initial two-year term or twelve months from termination following a change-in-control; and
the executive officer is prohibited from soliciting employees of VeriSign or competing against VeriSign for a period of 12 months.
Under the terms of the CEO Agreement, upon the triggering events described above, Mr. Roper will be entitled to receive severance benefits of:
any earned but unpaid salary and bonus;
the pro rata target bonus for the year in which he was terminated;
twenty-four months salary and bonus;
twenty-four months continued health benefits;
immediate acceleration of vesting of all unvested stock options and restricted stock units described under “CIC Agreement” above; and
a Section 280G of the Code excise tax gross-up payment to the extent any payments to Mr. Roper are characterized as parachute payments within the meaning of Section 4999 of the Code, provided that any such gross-up payment will only be made if the total parachute payment exceeds the applicable threshold amount by at least 10%.
The CEO Agreement has the same initial term and renewal and non-solicitation/non-competition provisions as described under “CIC Agreement” above.
The following table shows the value of additional stock options and RSUs that would have vested for our Named Executive Officers as of December 31, 2007, as well as the additional cash compensation payable under the acceleration scenarios described above, if any. The value of stock options is based on the difference between the exercise price of all accelerated options and the market value of our common stock as of December 31, 2007 which was $37.61.
Change-in-Control Benefit Estimates as of December 31, 2007
| Value of Accelerated Cash Compensation Benefits ($) (1) | Value of Accelerated Stock Awards ($) | Value of Accelerated Option Awards ($) | ||||||||||||
Named Executive Officer | Change-in- Control Only | Change-in-Control plus Qualifying Termination | Change-in- Control Only | Change-in-Control plus Qualifying Termination | Change-in- Control Only | Change-in-Control plus Qualifying Termination | ||||||||
William A. Roper, Jr. | — | 7,232,559 | (2) | — | 7,298,296 | — | 3,028,241 | |||||||
Albert E. Clement | — | 745,906 | — | 2,186,683 | — | 1,429,911 | ||||||||
John M. Donovan | — | 1,055,678 | — | 3,032,570 | — | 2,758,525 | ||||||||
Aristotle N. Balogh | — | 790,929 | — | 2,469,322 | — | 1,918,957 | ||||||||
Robert J. Korzeniewski | — | 849,825 | — | 1,940,864 | — | 1,423,697 | ||||||||
Stratton D. Sclavos | 1,969,380 | (3) | 1,969,380 | (3) | — | — | — | — | ||||||
Dana L. Evan | — | — | — | — | — | — | ||||||||
Mark D. McLaughlin | — | — | — | — | — | — | ||||||||
| (1) | To the extent any payments made as a result of the change-in-control constitute deferred compensation subject to Section 409A of the Code, such payments will not be made until six months after separation from service. |
| (2) | Pursuant to the terms of Mr. Roper’s Change-in-Control and Retention Agreement, includes fully grossed-up payment of $3,705,979 for the amount of estimated tax and interest incurred. |
| (3) | Sclavos Agreement provides for acceleration of all payments outstanding upon any change-in-control of the Company. Amount represents second installment severance payment due to be paid June 15, 2008. |
COMPENSATION OF DIRECTORS
This section provides information regarding the compensation policies for non-employee directors and amounts paid and securities awarded to these directors in 2007. William A. Roper, Jr., a director, was appointed President and Chief Executive Office of VeriSign on May 27, 2007. As an employee of the Company, Mr. Roper no longer participates in the compensation program for non-employee directors. Mr. Roper has been compensated as an executive officer of the Company since May 27, 2007 and his compensation both as a non-employee director and an employee is described in “Executive Compensation” elsewhere in this report.
Non-Employee Director Meeting Fees and Retainer Information
During 2007, cash fees earned by non-employee directors were as follows:
Annual retainer for non-employee directors | $ | 40,000 | |
Additional annual retainer for Chairman of the Board | $ | 100,000 | |
Additional annual retainer for Audit Committee members | $ | 20,000 | |
Additional annual retainer for Compensation Committee members | $ | 20,000 | |
Additional annual retainer for Nominating and Corporate Governance Committee members | $ | 10,000 | |
Additional annual retainer for Audit Committee Chairman | $ | 10,000 | |
Additional annual retainer for Compensation Committee Chairman | $ | 10,000 | |
Additional annual retainer for Nominating and Corporate Governance Committee Chairman | $ | 5,000 |
Non-employee directors are reimbursed for their expenses in attending meetings.
On August 7, 2007, the Compensation Committee met to consider the cash and equity-based compensation to be paid to non-employee directors. The Compensation Committee reviewed competitive market data prepared
by Frederick W. Cook & Co. (“FW Cook”) for the same comparator group used to benchmark executive compensation and certain available information for other boards and reviewed the board compensation practices of these companies. Following this review and consideration of the recommendations made by FW Cook, the Compensation Committee determined that grants equal to $200,000 worth of annual equity awards split evenly between stock options and RSUs were in the best interest of VeriSign and its shareholders. With input from FW Cook, members of the Company’s management and other directors of the Company, the Compensation Committee also approved an increase in the amount of the annual retainer payable to non-employee directors from $37,500 to $40,000. In addition, after consideration of materials and recommendations from FW Cook, the Compensation Committee approved effective as of May 27, 2007, an additional annual retainer of $100,000 for the non-executive Chairman of the Board. Previously, the non-executive Chairman of the Board did not receive separate compensation for this position.
Non-Employee Director Compensation Table for Fiscal 2007
The following table sets forth a summary of compensation information for our non-employee directors as of December 31, 2007.
Non-Employee Director Compensation for Fiscal 2007
Non-Employee Director Name | Fees Earned or Paid in Cash | Stock Awards (1) | Option Awards (1) | All Other Compensation | Total | |||||||||||||
D. James Bidzos (2) | $ | 93,738 | $ | 79,239 | $ | 130,417 | $ | 9,656 | (3) | $ | 313,050 | |||||||
William L. Chenevich (4) | 66,048 | 79,239 | 130,573 | 99,959 | (5) | 375,819 | ||||||||||||
Michelle Guthrie (6) | 62,499 | 79,239 | 199,201 | — | 340,939 | |||||||||||||
Scott G. Kriens (7) | 54,499 | 79,239 | 144,768 | — | 278,506 | |||||||||||||
Roger H. Moore (8) | 55,598 | 79,239 | 150,441 | — | 285,278 | |||||||||||||
Edward A. Mueller (9) | 91,819 | 19,856 | (10) | 79,208 | (10) | — | 190,883 | |||||||||||
John D. Roach (11) | 30,452 | 51,912 | 50,414 | — | 82,364 | |||||||||||||
Louis A. Simpson (12) | 74,499 | 79,239 | 146,341 | — | 300,079 | |||||||||||||
Timothy Tomlinson (13) | 9,891 | 21,628 | 20,140 | — | 51,659 | |||||||||||||
| (1) | Stock Awards consist solely of RSUs. Amounts shown represent compensation expense recognized in fiscal 2007 for financial statement reporting purposes for the applicable awards granted in fiscal 2007 and in prior years pursuant to FAS 123R, disregarding expenses previously recognized with respect to forfeited awards. The grant date fair value of each Stock Award granted on August 7, 2007 was $130,816. The grant date fair value of the Stock Award granted on November 6, 2007 to Mr. Tomlinson was $144,680. The grant date fair value for each Option Award granted to non-employee directors on August 7, 2007 was $312,537. The grant date fair value for the Option Award granted on November 6, 2007 to Mr. Tomlinson was $345,658. The assumptions used to calculate the value of awards for fiscal 2007 are set forth in Note 13, “Stock-Based Compensation”, of our Notes to Consolidated Financial Statements in this Annual Report on Form 10-K, and the assumptions used to calculate awards in prior years are set forth in the Notes to Consolidated Financial Statements in the Annual Reports on Form 10-K for the corresponding years. |
| (2) | As of December 31, 2007, Mr. Bidzos held 7,886 RSUs and outstanding options to purchase 114,398 shares of the Company’s common stock. |
| (3) | Payment in connection with Mr. Bidzos’ election as of December 31, 2006 to adjust the exercise price of his 409A Affected Options. |
| (4) | As of December 31, 2007, Mr. Chenevich held 7,886 RSUs and outstanding options to purchase 101,898 shares of the Company’s common stock. |
| (5) | Payment (on a fully grossed-up basis) for estimated taxes and interest in connection with certain 409A Affected Options. |
| (6) | As of December 31, 2007, Ms. Guthrie held 7,886 RSUs and outstanding options to purchase 78,148 shares of the Company’s common stock. |
| (7) | As of December 31, 2007, Mr. Kriens held 7,886 RSUs and outstanding options to purchase 115,648 shares of the Company’s common stock. |
| (8) | As of December 31, 2007, Mr. Moore held 7,886 RSUs and outstanding options to purchase 103,148 shares of the Company’s common stock. |
| (9) | Mr. Mueller resigned as a director on August 15, 2007. As of December 31, 2007, Mr. Mueller held no RSUs and outstanding options to purchase 9,375 shares of the Company’s common stock. |
| (10) | Does not include an estimated compensation expense of $59,383 for stock awards and $82,655 for stock option awards recognized previously with respect to forfeited equity awards. |
| (11) | As of December 31, 2007, Mr. Roach held 3,311 RSUs and outstanding options to purchase 10,548 shares of the Company’s common stock. |
| (12) | As of December 31, 2007, Mr. Simpson held 7,886 RSUs and outstanding options to purchase 78,148 shares of the Company’s common stock. |
| (13) | As of December 31, 2007, Mr. Tomlinson held 4,415 RSUs and outstanding options to purchase 10,548 shares of the Company’s common stock. |
Stock options are granted at an exercise price not less than 100% of the fair market value of VeriSign’s common stock on the date of grant and have a term of not greater than 10 years from the date of grant. Stock options and RSUs granted to non-employee directors in 2007 vest in quarterly installments over one year from the date of grant. Directors are permitted to exercise vested stock options for up to three years following the termination of their Board service. The Compensation Committee may authorize grants with different vesting schedules in the future. The vesting of equity awards for all non-employee directors accelerates as to 100% of any unvested equity awards upon certain changes-in-control as set for in the 2006 Equity Incentive Plan and the 1998 Directors Stock Option Plan.
| ITEM 12. | SECURITY OWNERSHIP OF CERTAIN BENEFICIAL OWNERS AND MANAGEMENT AND RELATED STOCKHOLDER MATTERS |
Information with respect to this item may be found in the sections captioned “Security Ownership of Certain Beneficial Owners and Management” and “Equity Compensation Plan Information” appearing in the definitive Proxy Statement to be delivered to stockholders in connection withfor the 20052008 Annual Meeting of Stockholders. This informationStockholders and is incorporated herein by reference. The definitive Proxy Statement will be filed with the Commission within 120 days after the end of the fiscal year covered by this Annual Report on Form 10-K pursuant to Regulation 14A under the Securities Exchange Act of 1934, as amended.
| ITEM 13. | CERTAIN RELATIONSHIPS AND RELATED TRANSACTIONS, AND DIRECTOR INDEPENDENCE |
InformationPOLICIES AND PROCEDURES WITH RESPECT TO TRANSACTIONS WITH RELATED PERSONS
In May 2007, VeriSign’s Audit Committee approved aPolicy for Entering into Transactions with respectRelated Persons (the “Policy”) which sets forth the requirements for review, approval or ratification of transactions between VeriSign and “related persons,” as such term is defined under Item 404 of Regulation S-K.
Pursuant to this itemthe terms of the Policy, the Audit Committee shall review, approve or ratify the terms of any transaction, arrangement or relationship or series of similar transactions, arrangements or relationships (including any indebtedness or guarantee of indebtedness) in which (i) VeriSign was or is to be a participant and (ii) a related person has or will have a direct or indirect interest,except transactions entered into at arms length and in the ordinary course of business where the aggregate value of the transaction is less than $120,000 (“Related Party Transaction”). In determining whether to approve or ratify a Related Party Transaction, the Audit Committee will take into account, among other factors it deems appropriate, whether the Related Party Transaction terms are no less favorable than terms generally available to an unaffiliated third-party under the same or similar circumstances and the materiality of the related person’s direct or indirect interest in the transaction.
Prior approval of the Audit Committee shall be required for the following Related Party Transactions:
| • | Any Related Party Transaction where a related person enters into an agreement or arrangement directly with VeriSign;provided, however, certain agreements or arrangements between VeriSign and a related person concerning employment and any compensation solely resulting from the employment or concerning compensation as a member of the Board of Directors that have, in each case, been entered into or approved in accordance with policies of VeriSign shall not be subject to prior approval of the Audit Committee. |
| • | Any Related Party Transaction involving an indirect material interest of a related person where the terms of the agreement or arrangement are not negotiated on an arms length basis or where the Related Party Transaction is not a transaction in the ordinary course of business;provided,further, that the Audit Committee shall have the sole discretion in determining whether an indirect interest of a related person is material. |
Any Related Party Transaction where the total contract value exceeds $1 million.
On a quarterly basis, the Audit Committee shall review and, if determined by the Audit Committee to be appropriate, ratify any Related Party Transaction not requiring prior approval of the Audit Committee pursuant to the Policy.
In the event VeriSign proposes to enter into a transaction with a related person who is a member of the Audit Committee or an immediate family member of a member of the Audit Committee, prior approval by a majority of the disinterested members of the Board of Directors shall be required and no such member of the Audit Committee for which he or she or an immediate family member is a related person shall participate in any discussion or approval of such transaction, except to provide all material information concerning the Related Party Transaction.
The following Related Party Transactions shall be deemed to be pre-approved by the Audit Committee, even if the aggregate amount involved exceeds $120,000:
| • | Payment of compensation to officers in connection with their employment with VeriSign;provided that, such compensation has been approved in accordance with policies of VeriSign. |
| • | Remuneration to directors in connection with their service as a member of the Board of Directors;provided that, such remuneration has been approved in accordance with policies of VeriSign. |
Reimbursement of expenses incurred in exercising duties as an officer or director of VeriSign provided such reimbursement has been approved in accordance with policies of VeriSign.
Any transaction with another company at which a related person’s only relationship is an employee (other than an executive officer), director or beneficial owner of less than 10% of that company’s shares, if the aggregate amount involved does not exceed $1,000,000.
Any transaction with a related person involving services as a bank depositary of funds, transfer agent, registrar, trustee under a trust indenture, or similar services.
Any transaction involving a related person where the rates or charges involved are determined by competitive bids.
Any transaction where the related person’s interest arises solely from the ownership of VeriSign’ common stock and all holders of VeriSign’s common stock received the same benefit on a pro rata basis (e.g., dividends).
There are no transactions required to be reported under Item 404(a) of Regulation S-K where the Policy did not require review, approval or ratification, or where the Policy was not followed since the Policy was adopted.
CERTAIN RELATIONSHIPS AND RELATED TRANSACTIONS
Since January 1, 2007, there has not been, nor is there currently proposed, any transaction or series of similar transactions to which we or any of our subsidiaries was or is to be a party in which the amount involved exceeded or will exceed $120,000 and in which any director, executive officer or beneficial holder of more than 5% of the common stock of VeriSign or any member of the immediate family of any of the foregoing persons had or will have a direct or indirect material interest other than the transactions described below.
Severance Arrangement with Mr. Sclavos. Stratton D. Sclavos was President, Chief Executive Officer and Chairman of the Board of Directors until his resignation on May 27, 2007.On July 9, 2007, VeriSign entered into a Consulting and Separation Agreement with Mr. Sclavos in connection with his resignation (the “Sclavos Separation Agreement”). Further information regarding the Sclavos Separation Agreement may be found in Part III, Item 11, “Executive Compensation,” of this Form 10-K.
Reimbursement Payments to Mr. Sclavos for Use of Airplane. On February 10, 2004, the section captioned “Certain Relationships and Related Transactions” appearingCompensation Committee approved a policy for the reimbursement of certain expenses incurred by Mr. Sclavos in the definitive Proxy Statementoperation of his private airplane when used for VeriSign business. Under this policy, as amended December 17, 2004, Mr. Sclavos was reimbursed $2,900 per flight hour up to $650,000 per year. During 2007, we reimbursed Mr. Sclavos approximately $393,268 under this policy. All amounts reimbursed to Mr. Sclavos were approved by the Compensation Committee.
Severance Arrangement with Ms. Evan. On August 22, 2007, VeriSign entered into a Severance and General Release Agreement (the “Evan Severance Agreement”) with Dana L. Evan, former Executive Vice President, Finance and Administration and Chief Financial Officer in connection with her resignation on July 10, 2007. Further information regarding the Evan Separation Agreement may be found in Part III, Item 11, “Executive Compensation,” of this Form 10-K.
Severance Arrangement with Mr. Balogh. In January 2008, VeriSign entered into a Separation and General Release Agreement (the “Balogh Separation Agreement”) with Aristotle Balogh, former Executive Vice President, Chief Technology Officer, in connection with his resignation on January 8, 2008. Further information regarding the Balogh Separation Agreement may be found in Part III, Item 11, “Executive Compensation,” of this Form 10-K.
Severance Arrangement with Ms. Lin. On February 16, 2007, VeriSign entered into a Severance Agreement (the “Lin Severance Agreement”) with Judy Lin, former Executive Vice President and General Manager, Security Services, pursuant to which the Company agreed to pay Ms. Lin a severance payment in the total amount of $571,200, of which $382,704 was paid in 2007, and the balance is payable on the one year anniversary of the termination of her employment, subject to Ms. Lin’s compliance with non-solicitation and non-competition provisions of the Lin Severance Agreement. In March 2007, VeriSign also paid Ms. Lin $214,200, representing her bonus for services performed for VeriSign in 2006. VeriSign also made payments to Ms. Lin for her COBRA and life insurance premiums and provided certain administrative and other support as set forth in the Lin Severance Agreement. Upon termination of Ms. Lin’s employment with VeriSign, VeriSign accelerated vesting of 19,719 of Ms. Lin’s then unvested stock options to purchase shares of VeriSign common stock for which the fair market value is greater than the exercise price of her employment on the termination date. Also upon termination of Ms. Lin’s employment, VeriSign accelerated vesting of 4,250 of her then unvested restricted stock units of VeriSign common stock.
Severance Arrangement with Mr. McCowan. On July 28, 2007, VeriSign entered into a severance agreement (the “McCowan Severance Agreement”) with Rodney A. McCowan, former Senior Vice President, Human Resources, in connection with his resignation on June 30, 2007. Pursuant to the terms of the McCowan Severance Agreement, Mr. McCowan received a severance payment in the amount of $241,200 and will receive an additional severance payment in the amount of $118,800 to be deliveredpaid on the one year anniversary of his resignation date, provided that Mr. McCowan is in full compliance of his obligations under the McCowan Severance Agreement. Mr. McCowan will be paid his pro rated target bonus for 2007 (to be paid when VeriSign pays bonuses for 2007 to stockholdersits employees), provided that Mr. McCowan is in full compliance of his obligations under the McCowan Severance Agreement. Mr. McCowan also receives payments equal to 12 months of COBRA and life insurance premiums. In addition, VeriSign released Mr. McCowan from repaying any portion of his $50,000 signing bonus that he received after joining the Company. Mr. McCowan has executed a release in favor of VeriSign and agreed to not solicit VeriSign’s employees, consultants and employees for 12 months after his resignation date, and be bound by a non-competition obligation for 12 months after his resignation date.
Severance Arrangement with Mr. McLaughlin. Effective December 8, 2007, VeriSign entered into a Separation and General Release Agreement with Mark D. McLaughlin, former Executive Vice President, Products and Marketing (the “McLaughlin Separation Agreement”) in connection with his resignation on December 1, 2007. Further information regarding the McLaughlin Separation Agreement may be found in Part III, Item 11, “Executive Compensation,” of this Form 10-K.
Payments to Mr. Donovan. In 2007, John Donovan received a bonus payment of $24,000 in connection with his service as Chief Executive Officer of inCode during 2006. In addition, Mr. Donovan’s offer of employment provides for reimbursement of relocation expenses up to $1,500,000 in connection with his relocation to California. In February 2007, we reimbursed Mr. Donovan $1,372,172 in connection with his relocation. Mr. Donovan is our Executive Vice President, Sales, Operations, Customer Care and Product Development.
Consulting Agreement with Mr. Moore. On December 11, 2007, the Compensation Committee of the Board of Directors authorized the Company to enter into a consulting agreement on the following terms with Roger H. Moore, a member of our Board of Directors, for the provision of certain consulting services in connection with the 2005 Annual Meetingplanned disposition of Stockholders. This information is incorporated herein by reference.VeriSign’s Communications Services Group:
A consulting fee of $30,000 per month to manage the daily operations of the Communications Services business;
A minimum success fee of $300,000 if the sale of the Communications Services business is consummated before December 31, 2008, payable either: (i) at the closing if the buyer of the Communications Services business does not offer Mr. Moore an acceptable position with the buyer; or (ii) six months after closing if the buyer offers Mr. Moore an acceptable position with the buyer;
An additional success fee of up to $600,000 based on receipt by VeriSign of proceeds from the sale of the Communications Services business within the valuation range set by investment bankers retained by VeriSign, which additional success fee will be apportioned on a pro rata basis between the low end and high end of the valuation range so set; and
Other terms and conditions customary for such an agreement.
Transactions with Arbinet-Thexchange, Inc. We have entered into agreements with Arbinet-Thexchange, Inc. (“Arbinet”) pursuant to which we provide various communications-related services to Arbinet. Roger H. Moore is a member of our Board of Directors and was Arbinet’s interim Chief Executive Officer from June 2007 through November 2007. Since January 1, 2007, the value of such transactions was approximately $260,000. We have also entered into agreements pursuant to which we purchase various products and services from Arbinet; since January 1, 2007, the value of such transactions did not exceed $120,000.
Transactions with Juniper Networks. We have entered into agreements with Juniper Networks, Inc. (“Juniper Networks”) pursuant to which we purchase various products and services from Juniper Networks. Scott G. Kriens is a member of our Board of Directors and the President, Chief Executive Officer and Chairman of the Board of Juniper Networks, Inc. In 2007, the value of such transactions was approximately $1.0 million and consisted primarily of the purchase of equipment, software and services. We also entered into agreements with Juniper Networks pursuant to which we provided various services to Juniper Networks; since January 1, 2007, the value of such transactions did not exceed $120,000.
Transactions with T. Rowe Price Associates, Inc. T. Rowe Price Associates, Inc. (“T. Rowe Price”) is the beneficial owner of more than five percent of VeriSign’s voting securities. T. Rowe Price Trust Company, an affiliate of T. Rowe Price, manages VeriSign’s employee 401(k) plan for which since January 1, 2007 VeriSign has paid T. Rowe Price less than $50,000. Participants in VeriSign’s 401(k) plan invest in mutual funds managed by affiliates of T. Rowe Price and as shareholders of the mutual funds pay management and other fees to the mutual funds as disclosed in the mutual fund prospectuses. We also entered into agreements with T. Rowe Price pursuant to which we provide various services to T. Rowe Price; since January 1, 2007, the value of such transactions did not exceed $120,000.
Transactions with U.S. Bancorp. William L. Chenevich is a director and Chairman of the Audit Committee of our Board of Directors and the Vice Chairman of Technology and Operations of U.S. Bancorp. We have entered into agreements with U.S. Bancorp and certain of its affiliates (“U.S. Bank”) pursuant to which we provide professional consulting, managed security and other services to U.S. Bank. Since January 1, 2007, the value of such transactions was approximately $2.0 million. We have also entered into agreements pursuant to which we purchase various products and services from U.S. Bank; since January 1, 2007, the value of such transactions did not exceed $120,000. U.S. Bank is also a lender under a $500 million senior unsecured revolving credit facility (the “Credit Facility”), under which VeriSign, or certain designated subsidiaries may be borrowers. The Credit Facility is described in Note 9, “Credit Facility,” of the Notes to Consolidated Financial Statements in this Form 10-K. Since January 1, 2007, the portion of interest and fees paid by us under the Facility attributable to U.S. Bank was approximately $240,000. In addition, U.S. Bank National Association, a subsidiary of U.S. Bancorp, an affiliate of U.S. Bank, is the trustee of the Indenture dated as of August 20, 2007 between the Company and U.S. Bank National Association for the Company’s 3.25% junior subordinated convertible debentures due August 15, 2037.
Transactions with Qwest Communications International, Inc. Edward A. Mueller was Chairman of our Board of Directors until his resignation on August 15, 2007 and is the Chief Executive Officer and Chairman of
the Board of Qwest Communications International, Inc. (“Qwest”). We have entered into agreements with Qwest pursuant to which we provide various communications services to Qwest. Since January 1,2007, the value of such transactions was approximately $9.8 million. We have also entered into agreements pursuant to which we purchase various communications related products and services from Qwest. Since January 1, 2007, the value of such transactions was approximately $3.8 million.
Director and Officer Indemnification Agreements. We have entered into indemnity agreements with certain of our executive officers and directors which provide, among other things, that we will indemnify such officers and directors, under the circumstances and to the extent provided for in the agreements, for expenses, damages, judgments, fines and settlements he or she may be required to pay in actions or proceedings which he or she is or may be made a party to by reason of his or her position as a director, officer or other agent of VeriSign, and otherwise to the full extent permitted under Delaware law and our bylaws.
Officer Change-in-Control Arrangements. On August 7, 2007, the Compensation Committee adopted a policy (the“Policy”) pursuant to which executive officers of the Company receive certain benefits upon a change-in-control of the Company. On August 24, 2007, the Compensation Committee adopted and approved a form of Change-in-Control and Retention Agreement to be entered into with VeriSign’s executive officers (the “CIC Agreement”) and a form of Change-in-Control and Retention Agreement to be entered into with VeriSign’s Chief Executive Officer, William A. Roper, Jr. (the “CEO Agreement”). Further information regarding the Policy, the CIC Agreement and the CEO Agreement may be found in Part III, Item 11, “Executive Compensation,” of this Form 10-K.
Acceleration of Equity Award Vesting in the Event of a Change-in-Control for Non-Employee Directors and Certain Senior Vice Presidents. The vesting of equity awards for all non-employee directors accelerates as to 100% of any unvested equity awards upon certain changes-in-control as set forth in the 2006 Equity Incentive Plan. Pursuant to a policy adopted by the Board of Directors in 2001, the vesting of stock options for officers at the level of senior vice president who are not executive officers accelerates as to 50% of any shares subject to stock options that are then unvested
Independence of Directors
As required under The NASDAQ Stock Market’s listing standards, a majority of the members of our Board must qualify as “independent,” as affirmatively determined by the Board. The Board consults with our legal counsel to ensure that the Board’s determinations are consistent with all relevant securities and other laws and regulations regarding the definition of “independent,” including those set forth in pertinent listing standards of NASDAQ.
Consistent with these considerations, after review of all relevant transactions and relationships between each director, or any of his or her family members, and VeriSign, our executive officers and our independent registered public accounting firm, the Board has affirmatively determined that the majority of our Board is comprised of independent directors. Our independent directors are: Mr. Bidzos, Mr. Chenevich, Ms. Cote, Mr. Kriens, Mr. Roach, Mr. Simpson, and Mr. Tomlinson. Each director who serves on the Audit Committee, the Compensation Committee and the Nominating and Corporate Governance Committee is an independent director.
| ITEM 14. | PRINCIPAL |
Information with respect to this item may be found in the section captioned “Principal Accountant Fees and Services” appearing in the definitive Proxy Statement to be delivered to stockholders in connection withfor the 20052008 Annual Meeting of Stockholders. This informationStockholders and is incorporated herein by reference. The definitive Proxy Statement will be filed with the Commission within 120 days after the end of the fiscal year covered by this Annual Report on Form 10-K pursuant to Regulation 14A under the Securities Exchange Act of 1934, as amended.
| ITEM 15. | EXHIBITS AND FINANCIAL STATEMENT SCHEDULES |
(a) Documents filed as part of this report
| • | Consolidated Balance Sheets as of December 31, 2007 and 2006 |
| • | Consolidated Statements of Operations for the Years Ended December 31, 2007, 2006 and 2005 |
| • | Consolidated Statements of Stockholders’ Equity for the Years Ended December 31, 2007, 2006 and 2005 |
| • |
| • | Consolidated Statements of Cash Flows for the Years Ended December 31, 2007, 2006 and 2005 |
| • |
Financial statement schedules
Financial statement schedules are omitted because the information called for is not required or is shown either in the consolidated financial statements or the notes thereto.
| 3. | Exhibits |
(a) Index to Exhibits
Exhibit Number | Exhibit Description | Incorporated by Reference | Filed Herewith | |||||||
| Form | Date | Number | ||||||||
| 2.01 | Agreement and Plan of Merger dated as of March 6, 2000, by and among the Registrant, Nickel Acquisition Corporation and Network Solutions, Inc. | 8-K | 3/8/00 | 2.1 | ||||||
| 2.02 | Agreement and Plan of Merger dated September 23, 2001, by and among the Registrant, Illinois Acquisition Corporation and Illuminet Holdings, Inc. | S-4 | 10/10/01 | 4.03 | ||||||
| 2.03 | Purchase Agreement dated as of October 14, 2003, as amended, among the Registrant and the parties indicated therein | 8-K | 12/10/03 | 2.1 | ||||||
| 2.04 | Sale and Purchase Agreement Regarding the Sale and Purchase of All Shares In Jamba! AG dated May 23, 2004 between the Registrant and certain other named individuals | X | ||||||||
| 3.01 | Third Amended and Restated Certificate of Incorporation of the Registrant | S-1 | 1/29/98 | 3.02 | ||||||
| 3.02 | Certificate of Amendment of Third Amended and Restated Certificate of Incorporation of the Registrant dated May 27, 1999 | S-8 | 7/15/99 | 4.03 | ||||||
Exhibit Number | Exhibit Description | Incorporated by Reference | Filed Herewith | |||||||
| Form | Date | Number | ||||||||
| 2.01 | Agreement and Plan of Merger dated as of March 6, 2000, by and among the Registrant, Nickel Acquisition Corporation and Network Solutions, Inc. | 8-K | 3/8/00 | 2.1 | ||||||
| 2.02 | Agreement and Plan of Merger dated September 23, 2001, by and among the Registrant, Illinois Acquisition Corporation and Illuminet Holdings, Inc. | S-4 | 10/10/01 | 4.03 | ||||||
| 2.03 | Purchase Agreement dated as of October 14, 2003, as amended, among the Registrant and the parties indicated therein | 8-K | 12/10/03 | 2.1 | ||||||
| 2.04 | Sale and Purchase Agreement Regarding the Sale and Purchase of All Shares In Jamba! AG dated May 23, 2004 between the Registrant and certain other named individuals | 10-K | 3/16/05 | 2.04 | ||||||
| 2.05 | Asset Purchase Agreement dated October 10, 2005, as amended, among the Registrant, eBay, Inc. and the other parties thereto | 8-K | 11/23/05 | 2.1 | ||||||
| 3.01 | Fourth Amended and Restated Certificate of Incorporation of the Registrant | S-1 | 11/5/07 | 3.01 | ||||||
| 3.02 | Third Amended and Restated Bylaws of the Registrant | 8-K | 2/25/08 | 3.01 | ||||||
Exhibit Number Exhibit Description Filed Herewith Incorporated by Reference Form Date Number 3.03 Certificate of Amendment of Third Amended and Restated Certificate of Incorporation of the Registrant dated June 8, 2000 S-8 6/14/00 4.03 3.04 Amended and Restated Bylaws of Registrant, effective December 18, 2002 10-Q 5/14/03 3.1 4.01 Rights Agreement dated as of September 27, 2002, between the Registrant and Mellon Investor Services LLC, as Rights Agent, which includes as Exhibit A the Form of Certificate of Designations of Series A Junior Participating Preferred Stock, as Exhibit B the Summary of Stock Purchase Rights and as Exhibit C the Form of Rights Certificate 8-A 9/30/02 4.01 4.02 Amendment to Rights Agreement dated as of February 11, 2003, between the Registrant and Mellon Investor Services LLC, as Rights Agent 8-A/A 3/19/03 4.02 10.01 Form of Revised Indemnification Agreement entered into by the Registrant with each of its directors and executive officers 10-K 3/31/03 10.02 10.02 Registrant’s 1995 Stock Option Plan, as amended through 8/6/96 S-1 1/29/98 10.06 10.03 Registrant’s 1997 Stock Option Plan S-1 1/29/98 10.07 10.04 Registrant’s 1998 Equity Incentive Plan, as amended through 2/8/05 X 10.05 Form of 1998 Equity Incentive Plan Restricted Stock Purchase Agreement 10-Q 11/14/03 10.1 10.06 Form of 1998 Equity Incentive Plan Restricted Stock Unit Agreement X 10.07 Registrant’s 1998 Directors Stock Option Plan, as amended through 5/22/03, and form of stock option agreement S-8 6/23/03 4.02 10.08 Summary of Director’s Compensation Benefits, effective 7/1/04 X 10.09 Registrant’s 1998 Employee Stock Purchase Plan, as amended through 10/22/03 S-8 8/4/04 4.01 10.10 Registrant’s 2001 Stock Incentive Plan, as amended through 11/22/02 10-K 3/31/03 10.08 10.11 Assignment Agreement, dated as of April 18, 1995 between the Registrant and RSA Data Security, Inc. S-1 1/29/98 10.15 10.12 BSAFE/TIPEM OEM Master License Agreement, dated as of April 18, 1995, between the Registrant and RSA Data Security, Inc., as amended S-1 1/29/98 10.16 10.13 Amendment Number Two to BSAFE/TIPEM OEM Master License Agreement dated as of December 31, 1998 between the Registrant and RSA Data Security, Inc. S-1 1/5/99 10.31 10.14 Non-Compete and Non-Solicitation Agreement, dated April 18, 1995, between the Registrant and RSA Security, Inc. S-1 1/29/98 10.17
Exhibit Number | Exhibit Description | Incorporated by Reference | Filed Herewith | |||||||
| Form | Date | Number | ||||||||
| 4.01 | Rights Agreement dated as of September 27, 2002, between the Registrant and Mellon Investor Services LLC, as Rights Agent, which includes as Exhibit A the Form of Certificate of Designations of Series A Junior Participating Preferred Stock, as Exhibit B the Summary of Stock Purchase Rights and as Exhibit C the Form of Rights Certificate | 8-A | 9/30/02 | 4.01 | ||||||
| 4.02 | Amendment to Rights Agreement dated as of February 11, 2003, between the Registrant and Mellon Investor Services LLC, as Rights Agent | 8-A/A | 3/19/03 | 4.02 | ||||||
| 4.03 | Indenture dated as of August 20, 2007 between the Registrant and U.S. Bank National Association | 8-K/A | 9/6/07 | 4.1 | ||||||
| 4.04 | Registration Rights Agreement dated as of August 20, 2007 between the Registrant and J.P. Morgan Securities, Inc. | 8-K/A | 9/6/07 | 4.2 | ||||||
| 10.01 | Form of Revised Indemnification Agreement entered into by the Registrant with each of its directors and executive officers | 10-K | 3/31/03 | 10.02 | ||||||
| 10.02 | Registrant’s 1995 Stock Option Plan, as amended through August 6, 1996 | S-1 | 1/29/98 | 10.06 | ||||||
| 10.03 | Registrant’s 1997 Stock Option Plan | S-1 | 1/29/98 | 10.07 | ||||||
| 10.04 | Registrant’s 1998 Equity Incentive Plan, as amended through February 8, 2005 | 10-K | 3/16/05 | 10.04 | ||||||
| 10.05 | Form of 1998 Equity Incentive Plan Restricted Stock Purchase Agreement | 10-Q | 11/14/03 | 10.1 | ||||||
| 10.06 | Form of 1998 Equity Incentive Plan Restricted Stock Unit Agreement | 10-K | 3/16/05 | 10.06 | ||||||
| 10.07 | 409A Options Election Form and related documentation | 8-K | 1/4/07 | 99.01 | ||||||
| 10.08 | Registrant’s 1998 Directors Stock Option Plan, as amended through May 22, 2003, and form of stock option agreement | S-8 | 6/23/03 | 4.02 | ||||||
| 10.09 | Registrant’s 1998 Employee Stock Purchase Plan, as amended through January 30, 2007 | 10-Q | 7/16/07 | 10.01 | ||||||
| 10.10 | Registrant’s 2001 Stock Incentive Plan, as amended through November 22, 2002 | 10-K | 3/31/03 | 10.08 | ||||||
| 10.11 | Registrant’s 2006 Equity Incentive Plan, as adopted May 26, 2006 | 10-Q | 7/12/07 | 10.02 | ||||||
| 10.12 | Registrant’s 2006 Equity Incentive Plan, form of Stock Option Agreement | 10-Q | 7/12/07 | 10.03 | ||||||
| 10.13 | Registrant’s 2006 Equity Incentive Plan, form of Directors Nonqualified Stock Option Grant | 10-Q | 8/9/07 | 10.01 | ||||||
| 10.14 | Nonqualified Registrant’s 2006 Equity Incentive Plan, amended form of Nonqualified Directors Stock Option Grant | S-1 | 11/5/07 | 10.15 | ||||||
| 10.15 | Registrant’s 2006 Equity Incentive Plan, form of Employee Restricted Stock Unit Agreement | 10-Q | 7/12/07 | 10.04 | ||||||
Exhibit Number Exhibit Description Filed Herewith Exhibit Number Exhibit Description Incorporated by Reference Form Date Number 10.15* Microsoft/VeriSign Certificate Technology Preferred Provider Agreement, effective as of May 1, 1997, between the Registrant and Microsoft Corporation S-1 1/29/98 10.18 10.16* Master Development and License Agreement, dated as of September 30, 1997, between the Registrant and Security Dynamics Technologies, Inc. S-1 1/29/98 10.19 10.17 Amendment Number One to Master Development and License Agreement dated as of December 31, 1998 between the Registrant and Security Dynamics Technologies, Inc. S-1 1/5/99 10.30 10.18 Employment Offer Letter Agreement between the Registrant and Stratton Sclavos dated as of June 12, 1995, as amended October 4, 1995 S-1 1/29/98 10.28 10.19 Employment Offer Letter from the Registrant to Vernon Irvin dated May 22, 2003 10-Q 8/14/03 10.1 10.20 Severance Agreement between the Registrant and Terry Kremian dated June 6, 2003 10-Q 8/14/03 10.2 10.21 Transaction Bonus and Retention Agreement between the Registrant and W. G. Champion Mitchell dated May 20, 2003 10-K 3/15/04 10.23 10.22 .com Registry Agreement between VeriSign and ICANN 8-K 6/1/01 99.3 10.23 .net Registry Agreement between VeriSign and ICANN 8-K 6/1/01 99.4 10.24 .org Registry Agreement between VeriSign and ICANN 8-K 6/1/01 99.5 10.25 Amendment No. 24 to Cooperative Agreement #NCR 92-18742 between the DOC and Network Solutions, Inc. 8-K 6/1/01 99.6 10.26 Deed of Lease between TST Waterview I, L.L.C. and the Registrant dated as of July 19, 2001 10-Q 11/14/01 10.01 21.01 Subsidiaries of the Registrant X 23.01 Consent of Registered Independent Public Accounting Firm X 31.01 Certification of President, Chief Executive Officer and Chairman of the Board pursuant to Exchange Act Rule 13a-14(a) X 31.02 Certification of Executive Vice President of Finance and Administration and Chief Financial Officer pursuant to Exchange Act Rule 13a-14(a) X 32.01 Certification of President, Chief Executive Officer and Chairman of the Board pursuant to Exchange Act Rule 13a-14(b) and Section 1350 of Chapter 63 of Title 18 of the United States Code (18 U.S.C. 1350)** X 32.02 Certification of Executive Vice President of Finance and Administration and Chief Financial Officer pursuant to Exchange Act Rule 13a-14(b) and Section 1350 of Chapter 63 of Title 18 of the United States Code (18 U.S.C. 1350)** X Incorporated by Reference Filed
Herewith Form Date Number 10.16 Registrant’s 2006 Equity Incentive Plan, form of Non-Employee Director Restricted Stock Unit Agreement 10-Q 7/12/07 10.05 10.17 Registrant’s 2006 Equity Incentive Plan, form of Performance-Based Restricted Stock Unit Agreement 8-K 8/30/07 99.1 10.18 Registrant’s 2007 Employee Stock Purchase Plan, as adopted August 30, 2007 S-1 11/5/07 10.19 10.19 Assignment Agreement, dated as of April 18, 1995 between the Registrant and RSA Data Security, Inc. S-1 1/29/98 10.15 10.20 BSAFE/TIPEM OEM Master License Agreement, dated as of April 18, 1995, between the Registrant and RSA Data Security, Inc., as amended S-1 1/29/98 10.16 10.21 Amendment Number Two to BSAFE/TIPEM OEM Master License Agreement dated as of December 31, 1998 between the Registrant and RSA Data Security, Inc. S-1 1/5/99 10.31 10.22 Non-Compete and Non-Solicitation Agreement, dated April 18, 1995, between the Registrant and RSA Security, Inc. S-1 1/29/98 10.17 10.23 Microsoft/VeriSign Certificate Technology Preferred Provider Agreement, effective as of May 1, 1997, between the Registrant and Microsoft Corporation* S-1 1/29/98 10.18 10.24 Master Development and License Agreement, dated as of September 30, 1997, between the Registrant and Security Dynamics Technologies, Inc.* S-1 1/29/98 10.19 10.25 Amendment Number One to Master Development and License Agreement dated as of December 31, 1998 between the Registrant and Security Dynamics Technologies, Inc. S-1 1/5/99 10.30 10.26 Transition Services and General Release Agreement between the Registrant and James M. Ulam dated May 18, 2006 10-Q 7/12/07 10.01 10.27 Amended and Restated Transition Services and General Release Agreement between the Registrant and James M. Ulam dated September 27, 2006 10-Q 7/12/07 10.01 10.28 Severance Agreement between the Registrant and Vernon Irvin dated October 31, 2006 8-K 11/6/06 99.01 10.29 Agreement between the Registrant and Judy Lin dated February 16, 2007 10-Q 7/16/07 10.02 10.30 Consulting and Separation Agreement between the Registrant and Stratton D. Sclavos effective July 9, 2007 10-Q 8/9/07 10.03 10.31 Severance and General Release Agreement between the Registrant and Rodney A. McCowan dated July 9, 2007 10-Q 8/9/07 10.04 10.32 Severance and General Release Agreement between the Registrant and Dana L. Evan dated July 27, 2007 S-1 11/5/07 10.33 10.33 Separation and General Release Agreement between the Registrant and Mark D. McLaughlin dated November 28, 2007 X
Exhibit Number | Exhibit Description | Incorporated by Reference | Filed Herewith | |||||||
| Form | Date | Number | ||||||||
| 10.34 | Employment Offer Letter between the Registrant and John M. Donovan dated November 20, 2006 | 10-K | 7/12/07 | 10.25 | ||||||
| 10.35 | Employment Offer Letter between the Registrant and Richard H. Goshorn dated April 25, 2007 | 10-Q | 8/9/07 | 10.02 | ||||||
| 10.36 | Employment Offer Letter between the Registrant and Anne-Marie Law dated May 2, 2007 | S-1 | 11/5/07 | 10.36 | ||||||
| 10.37 | Employment Offer Letter between the Registrant and Kevin A. Werner dated September 20, 2007 | S-1 | 11/5/07 | 10.37 | ||||||
| 10.38 | Employment Offer Letter between the Registrant and Grant L. Clark dated September 20, 2007 | S-1 | 11/5/07 | 10.38 | ||||||
| 10.39 | Employment Agreement between the Registrant and William A. Roper, Jr. dated November 26, 2007 with effect on May 27, 2007 | X | ||||||||
| 10.40 | 2006 .com Registry Agreement between VeriSign and ICANN, effective March 1, 2006 | 10-K | 7/12/07 | 10.26 | ||||||
| 10.41 | Amendment No. Thirty (30) to Cooperative Agreement - Special Awards Conditions NCR-92-18742, between VeriSign and U.S. Department of Commerce managers | 10-K | 7/12/07 | 10.27 | ||||||
| 10.42 | Deed of Lease between TST Waterview I, L.L.C. and the Registrant, dated as of July 19, 2001 | 10-Q | 11/14/01 | 10.01 | ||||||
| 10.43 | Confirmation of Accelerated Purchase of Equity Securities dated August 14, 2007 between the Registrant and J P Morgan Securities, Inc. † | S-1 | 11/5/07 | 10.44 | ||||||
| 10.44 | Credit Agreement dated as of June 7, 2006 among Registrant and certain of its subsidiaries, the Designated Borrowers named therein, Bank of America, N.A., as Administrative Agent, Swing Line Lender and L/C Issuer, the other lenders party thereto, Citibank, N.A., as Syndication Agent, JP Morgan Chase Bank, N.A., KeyBank National Association and U.S. Bank National Association, as Co-Documentation Agents, and Banc of America Securities LLC and Citigroup Global Markets, Inc., as joint lead arrangers and joint book running managers | 8-K | 6/7/06 | 10.1 | ||||||
| 10.45 | Amendment Agreement dated September 17, 2007 by and among Registrant, the several financial institutions thereto and Bank of America, N.A., as Administrative Agent, L/C Issuer and Swing Line Lender | 8-K | 9/21/07 | 99.1 | ||||||
| 10.46 | Subsidiary Guaranty dated June 7, 2006, made by the subsidiaries of Registrant named therein in favor of the Lenders party to the Credit Agreement, the L/C Issuer, the Swing Line Lender and Bank of America, N.A., as Administrative Agent | 8-K | 6/7/06 | 10.1 | ||||||
Exhibit Number Exhibit Description Incorporated by Reference Filed
Herewith Form Date Number 10.47 Company Guaranty dated June 7, 2006, made by Registrant, in favor of the Lenders party to the Credit Agreement and Bank of America, N.A., as Administrative Agent 8-K 6/7/06 10.1 10.48 Limited Liability Company Agreement by and among Fox US Mobile Holdings, Inc., News Corporation, VeriSign U.S. Holdings, Inc. and US Mobile Holdings, LLC, dated January 31, 2007* 10-Q 7/16/07 10.03 10.49 Form of Change-in-Control and Retention Agreement for Executive Officers 8-K 8/30/07 99.2 10.50 Form of Change-in-Control and Retention Agreement for Chief Executive Officer 8-K 8/30/07 99.3 21.01 Subsidiaries of the Registrant X 23.01 Consent of Registered Independent Public Accounting Firm X 24.01 Powers of Attorney (Included on Page 101 as part of the signature pages hereto) X 25.01 Statement of Eligibility of Trustee on Form T-1 with respect to the Indenture dated as of August 20, 2007 S-1 11/5/07 25.01 31.01 Certification of President and Chief Executive Officer pursuant to Exchange Act Rule 13a-14(a) X 31.02 Certification of Chief Financial Officer pursuant to Exchange Act Rule 13a-14(a) X 32.01 Certification of President and Chief Executive Officer pursuant to Exchange Act Rule 13a-14(b) and Section 1350 of Chapter 63 of Title 18 of the United States Code (18 U.S.C. 1350)** X 32.02 Certification of Chief Financial Officer pursuant to Exchange Act Rule 13a-14(b) and Section 1350 of Chapter 63 of Title 18 of the United States Code (18 U.S.C. 1350)** X
| † | Certain portions of this exhibit have been omitted and have been filed separately with the SEC pursuant to a request for confidential treatment under Rule 24b-2 as promulgated under the Securities Exchange Act of 1934. |
| * | Confidential treatment was received with respect to certain portions of this agreement. Such portions were omitted and filed separately with the Securities and Exchange Commission. |
| ** | As contemplated by SEC Release No. 33-8212, these exhibits are furnished with this Annual Report on Form 10-K and are not deemed filed with the Securities and Exchange Commission and are not incorporated by reference in any filing of VeriSign, Inc. under the Securities Act of 1933 or the Securities Act of 1934, whether made before or after the date hereof and irrespective of any general incorporation language in such filings. |
Pursuant to the requirements of Section 13 or 15(d) of the Securities Exchange Act of 1934, the registrant has duly caused this report to be signed on its behalf by the undersigned, thereunto duly authorized, in the City of Mountain View, State of California, on the 15th29th day of March 2005.February 2008.
V | ||
By | /s/ W | |
President and Chief Executive Officer | ||
KNOW ALL PERSONS BY THESE PRESENTS that each individual whose signature appears below constitutes and appoints Stratton D. Sclavos, Dana L. EvanWilliam A. Roper Jr., Albert E. Clement and James M. Ulam,Richard H. Goshorn, and each of them, his or her true lawful attorneys-in-fact and agents, with full power of substitution, for him or her and in his or her name, place and stead, in any and all capacities, to sign any and all amendments to this Annual Report on Form 10-K and to file the same, with all exhibits thereto and all documents in connection therewith, with the Securities and Exchange Commission, granted unto said attorneys-in-fact and agents, and each of them, full power and authority to do and perform each and every act and thing requisite and necessary to be done in and about the premises, as fully to all intents and purposes as he or she might or could do in person, hereby ratifying and confirming all that said attorneys-in-fact and agents or any of them, or his, her or their substitute or substitutes, may lawfully do or cause to be done by virtue hereof.
In accordance with the requirements of the Securities Exchange Act of 1934, this report has been signed by the following persons on behalf of the registrant and in the capacities indicated on the 15th29th day of March 2005:February 2008.
Signature | Title | |
/s/
| President, Chief Executive Officer and | |
/s/
|
| |
/s/ D. JAMES BIDZOS D. James Bidzos |
| |
/s/ WILLIAM L. CHENEVICH William L. Chenevich | Director | |
/s/ K
| Director | |
/s/ SCOTT G. KRIENS Scott G. Kriens |
| |
| Director | |
/s/ ROGER H. MOORE Roger H. Moore | Director | |
/s/
| Director | |
/s/
| Director | |
/s/ TIMOTHY TOMLINSON Timothy Tomlinson | Director | |
As required under Item 8—Financial Statements and Supplementary Data, the consolidated financial statements of VeriSign are provided in this separate section. The consolidated financial statements included in this section are as follows:
REPORT OF INDEPENDENT REGISTERED PUBLIC ACCOUNTING FIRM
The Board of Directors and Stockholders
VeriSign, Inc.:
We have audited management’s assessment, included in the accompanying Management’s Report on Internal Control Over Financial Reporting appearing under Item 9A, that VeriSign, Inc. and subsidiaries’s (the Company) maintained effectiveCompany’s) internal control over financial reporting as of December 31, 2004,2007, based on the criteria established inInternal Control—Integrated Frameworkissued by the Committee of Sponsoring Organizations of the Treadway Commission (COSO). The Company’sVeriSign, Inc’s management is responsible for maintaining effective internal control over financial reporting and for its assessment of the effectiveness of internal control over financial reporting. Ourreporting, included in the accompanying Management’s Report on Internal Control over Financial Reporting (Item 9A.b).Our responsibility is to express an opinion on management’s assessment and an opinion on the effectiveness of the Company’s internal control over financial reporting based on our audit.
We conducted our audit in accordance with the standards of the Public Company Accounting Oversight Board (United States). Those standards require that we plan and perform the audit to obtain reasonable assurance about whether effective internal control over financial reporting was maintained in all material respects. Our audit included obtaining an understanding of internal control over financial reporting, evaluating management’s assessment,assessing the risk that a material weakness exists, and testing and evaluating the design and operating effectiveness of internal control andbased on the assessed risk. Our audit also included performing such other procedures as we considered necessary in the circumstances. We believe that our audit provides a reasonable basis for our opinion.
A company’s internal control over financial reporting is a process designed to provide reasonable assurance regarding the reliability of financial reporting and the preparation of financial statements for external purposes in accordance with generally accepted accounting principles. A company’s internal control over financial reporting includes those policies and procedures that (1) pertain to the maintenance of records that, in reasonable detail, accurately and fairly reflect the transactions and dispositions of the assets of the company; (2) provide reasonable assurance that transactions are recorded as necessary to permit preparation of financial statements in accordance with generally accepted accounting principles, and that receipts and expenditures of the company are being made only in accordance with authorizations of management and directors of the company; and (3) provide reasonable assurance regarding prevention or timely detection of unauthorized acquisition, use, or disposition of the company’s assets that could have a material effect on the financial statements.
Because of its inherent limitations, internal control over financial reporting may not prevent or detect misstatements. Also, projections of any evaluation of effectiveness to future periods are subject to the risk that controls may become inadequate because of changes in conditions, or that the degree of compliance with the policies or procedures may deteriorate.
In our opinion, management’s assessment that the Company maintained effectiveA material weakness is a deficiency, or a combination of deficiencies, in internal control over financial reporting, as of December 31, 2004,such that there is fairly stated, in alla reasonable possibility that a material respects, based on the criteria established inInternal Control—Integrated Frameworkissued by the Committee of Sponsoring Organizationsmisstatement of the Treadway Commission (COSO). Also,company’s annual or interim financial statements will not be prevented or detected on a timely basis. A material weakness related to the Company’s stock administration policies and practices has been identified and included in our opinion, VeriSign, Inc. maintained, in all material respects, effective internal control over financial reporting as of December 31, 2004, based on the criteria established inInternal Control—Integrated Frameworkissued by the Committee of Sponsoring Organizations of the Treadway Commission (COSO).management’s assessment.
We also have audited, in accordance with the standards of the Public Company Accounting Oversight Board (United States), the consolidated balanceconsolidatedbalance sheets of VeriSign, Inc. and subsidiaries as of December 31, 20042007 and 2003,2006, and the related consolidated statements of operations, stockholders’ equity and comprehensive (loss) income, (loss) and cash flows for each of the years in the three-year period ended December 31, 2004,2007. This material weakness was considered in determining the nature, timing, and extent of audit tests applied in our audit of the 2007 consolidated financial statements, and this report does not affect our report dated March 15, 2005February 29, 2008, which expressed an unqualified opinion on those consolidated financial statements.statements.
In our opinion, because of the effect of the aforementioned material weakness on the achievement of the objectives of the control criteria, Verisign, Inc. has not maintained effective internal control over financial reporting as of December 31, 2007, based on criteria established inInternal Control—Integrated Framework issued by the Committee of Sponsoring Organizations of the Treadway Commission.
/s/ KPMG LLP
Mountain View, California
March 15, 2005February 29, 2008
REPORT OF INDEPENDENT REGISTERED PUBLIC ACCOUNTING FIRM
The Board of Directors and Stockholders
VeriSign, Inc.:
We have audited the accompanying consolidated balance sheets of VeriSign, Inc. and subsidiaries (the Company) as of December 31, 20042007 and 2003,2006, and the related consolidated statements of operations, stockholders’ equity, comprehensive (loss) income, (loss) and cash flows for each of the years in the three-year period ended December 31, 2004.2007. These consolidated financial statements are the responsibility of the Company’s management. Our responsibility is to express an opinion on these consolidated financial statements based on our audits.
We conducted our audits in accordance with the standards of the Public Company Accounting Oversight Board (United States). Those standards require that we plan and perform the audit to obtain reasonable assurance about whether the financial statements are free of material misstatement. An audit includes examining, on a test basis, evidence supporting the amounts and disclosures in the financial statements. An audit also includes assessing the accounting principles used and significant estimates made by management, as well as evaluating the overall financial statement presentation. We believe that our audits provide a reasonable basis for our opinion.
In our opinion, the consolidated financial statements referred to above present fairly, in all material respects, the financial position of VeriSign, Inc. and subsidiaries as of December 31, 20042007 and 2003,2006, and the results of their operations and their cash flows for each of the years in the three-year period ended December 31, 2004,2007, in conformity with U.S. generally accepted accounting principles.
As discussed in Note 1 to the consolidated financial statements, the Company adopted the provisions of Statement of Financial Accounting Standards No. 123 (revised 2004),Share-Based Payment and FASB Interpretation No. 48 (“FIN 48”),Accounting for Uncertainty in Income Taxes—an interpretation of FASB Statement No. 109,effective January 1, 2006, and January 1, 2007, respectively.
We also have audited, in accordance with the standards of the Public Company Accounting Oversight Board (United States), the effectiveness of theVeriSign, Inc’s internal control over financial reporting of VeriSign, Inc. and subsidiaries as of December 31, 2004,2007, based on the criteria established inInternal Control – Control—Integrated Frameworkissued by the Committee of Sponsoring Organizations of the Treadway Commission (COSO), and our report dated March 15, 2005February 29, 2008 expressed an unqualifiedadverse opinion on management’s assessmentthe effectiveness of and the effective operation of,Company’s internal control over financial reporting.
/s/ KPMG LLP
Mountain View, California
March 15, 2005February 29, 2008
VERISIGN, INC. AND SUBSIDIARIES
CONSOLIDATED BALANCE SHEETS
(In thousands, except share data)
| December 31, | ||||||||||||||||
| December 31, | 2007 | 2006 | ||||||||||||||
A S S E T S | 2004 | 2003 | ||||||||||||||
Current assets: | ||||||||||||||||
Cash and cash equivalents | $ | 330,641 | $ | 301,593 | $ | 1,376,722 | $ | 478,749 | ||||||||
Short-term investments | 406,784 | 422,093 | 1,011 | 198,656 | ||||||||||||
Accounts receivable, net of allowance for doubtful accounts of $11,450 in 2004 and $13,993 in 2003 | 198,317 | 100,120 | ||||||||||||||
Accounts receivable, net of allowance for doubtful accounts of $6,329 in 2007 and $8,083 in 2006 | 208,799 | 241,570 | ||||||||||||||
Prepaid expenses and other current assets | 51,324 | 45,935 | 116,961 | 294,955 | ||||||||||||
Deferred tax assets | 19,057 | 10,987 | 46,080 | 81,773 | ||||||||||||
Current assets of discontinued operations | — | 36,661 | ||||||||||||||
Total current assets | 1,006,123 | 880,728 | 1,749,573 | 1,332,364 | ||||||||||||
Property and equipment, net | 512,621 | 520,219 | 621,917 | 605,292 | ||||||||||||
Goodwill | 725,427 | 401,371 | 1,082,420 | 1,442,493 | ||||||||||||
Other intangible assets, net | 243,838 | 216,665 | 121,792 | 333,430 | ||||||||||||
Restricted cash | 51,518 | 18,371 | ||||||||||||||
Long-term note receivable | 39,956 | 34,009 | ||||||||||||||
Long-term investments | 6,809 | 21,749 | ||||||||||||||
Other assets, net | 6,582 | 7,426 | ||||||||||||||
Restricted cash and investments | 46,936 | 49,437 | ||||||||||||||
Long-term deferred tax assets | 230,695 | 179,023 | ||||||||||||||
Other assets | 59,952 | 25,214 | ||||||||||||||
Investments in unconsolidated entities | 109,828 | — | ||||||||||||||
Long-term assets of discontinued operations | — | 7,000 | ||||||||||||||
Total long-term assets | 1,586,751 | 1,219,810 | 2,273,540 | 2,641,889 | ||||||||||||
Total assets | $ | 2,592,874 | $ | 2,100,538 | $ | 4,023,113 | $ | 3,974,253 | ||||||||
L I A B I L I T I E S A N D S T O C K H O L D E R S’ E Q U I T Y | ||||||||||||||||
Current liabilities: | ||||||||||||||||
Accounts payable and accrued liabilities | $ | 382,025 | $ | 291,392 | $ | 388,562 | $ | 681,996 | ||||||||
Accrued restructuring costs | 11,696 | 18,331 | 2,878 | 3,818 | ||||||||||||
Deferred revenue | 305,874 | 245,483 | ||||||||||||||
Deferred revenues | 552,070 | 448,414 | ||||||||||||||
Short-term debt | — | 199,000 | ||||||||||||||
Deferred tax liabilities | 2,632 | 1,448 | ||||||||||||||
Current liabilities of discontinued operations | — | 24,601 | ||||||||||||||
Total current liabilities | 699,595 | 555,206 | 946,142 | 1,359,277 | ||||||||||||
Long-term deferred revenue | 107,595 | 93,311 | ||||||||||||||
Long-term deferred revenues | 186,719 | 159,439 | ||||||||||||||
Long-term accrued restructuring costs | 19,276 | 30,240 | 1,473 | 937 | ||||||||||||
Convertible debentures | 1,265,296 | — | ||||||||||||||
Long-term tax liability | 37,607 | — | ||||||||||||||
Long-term deferred tax liabilities | 2,985 | 24,849 | ||||||||||||||
Other long-term liabilities | 6,815 | 8,978 | 541 | 5,175 | ||||||||||||
Deferred tax liabilities | 31,319 | 321 | ||||||||||||||
Total long-term liabilities | 165,005 | 132,850 | 1,494,621 | 190,400 | ||||||||||||
Total liabilities | 864,600 | 688,056 | 2,440,763 | 1,549,677 | ||||||||||||
Commitments and contingencies | ||||||||||||||||
Minority interest in subsidiaries | 36,277 | 28,829 | 54,485 | 47,716 | ||||||||||||
Commitments and contingencies | ||||||||||||||||
Stockholders’ equity: | ||||||||||||||||
Preferred stock—par value $.001 per share Authorized shares: 5,000,000 Issued and outstanding shares: none | — | — | — | — | ||||||||||||
Common stock—par value $.001 per share Authorized shares: 1,000,000,000 Issued and outstanding shares: 253,341,383, excluding 6,164,017 shares held in treasury, at December 31, 2004; 241,829,274, excluding 1,690,000 shares held in treasury, at December 31, 2003 | 253 | 242 | ||||||||||||||
Common stock—par value $.001 per share Authorized shares: 1,000,000,000 Issued and outstanding shares: 222,849,348 excluding 73,720,953 held in treasury, at December 31, 2007 and 243,844,122, excluding 35,471,662 held in treasury, at December 31, 2006 | 297 | 279 | ||||||||||||||
Additional paid-in capital | 23,253,111 | 23,128,095 | 22,559,045 | 23,314,476 | ||||||||||||
Unearned compensation | (6,127 | ) | (2,628 | ) | ||||||||||||
Accumulated deficit | (21,553,829 | ) | (21,740,054 | ) | (21,033,452 | ) | (20,929,497 | ) | ||||||||
Accumulated other comprehensive loss | (1,411 | ) | (2,002 | ) | ||||||||||||
Accumulated other comprehensive income (loss) | 1,975 | (8,398 | ) | |||||||||||||
Total stockholders’ equity | 1,691,997 | 1,383,653 | 1,527,865 | 2,376,860 | ||||||||||||
Total liabilities and stockholders’ equity | $ | 2,592,874 | �� | $ | 2,100,538 | $ | 4,023,113 | $ | 3,974,253 | |||||||
See accompanying notesNotes to consolidated financial statements.Consolidated Financial Statements.
VERISIGN, INC. AND SUBSIDIARIES
CONSOLIDATED STATEMENTS OF OPERATIONS
(In thousands, except per share data)
| Year Ended December 31, | ||||||||||||
| 2004 | 2003 | 2002 | ||||||||||
Revenues | $ | 1,166,455 | $ | 1,054,780 | $ | 1,221,668 | ||||||
Costs and expenses: | ||||||||||||
Cost of revenues | 444,759 | 446,207 | 571,367 | |||||||||
Sales and marketing | 253,480 | 195,330 | 248,170 | |||||||||
Research and development | 67,346 | 55,806 | 48,353 | |||||||||
General and administrative | 164,922 | 168,380 | 172,123 | |||||||||
Restructuring and other charges | 24,780 | 74,633 | 88,574 | |||||||||
Impairment of goodwill | — | 81,885 | 4,387,009 | |||||||||
Impairment of other intangible assets | — | 71,534 | 223,844 | |||||||||
Amortization of other intangible assets | 79,440 | 182,086 | 283,861 | |||||||||
Sale of business and litigation settlements | — | 7,169 | — | |||||||||
Total costs and expenses | 1,034,727 | 1,283,030 | 6,023,301 | |||||||||
Operating income (loss) | 131,728 | (228,250 | ) | (4,801,633 | ) | |||||||
Other income (expense), net: | ||||||||||||
Gain on sale of VeriSign Japan stock | 74,925 | — | — | |||||||||
Interest and investment income (loss) | 10,151 | (8,830 | ) | (148,946 | ) | |||||||
Other income (expense), net | (2,999 | ) | 554 | (343 | ) | |||||||
Total other income (expense), net | 82,077 | (8,276 | ) | (149,289 | ) | |||||||
Income (loss) before income taxes | 213,805 | (236,526 | ) | (4,950,922 | ) | |||||||
Income tax expense | 27,580 | 23,353 | 10,375 | |||||||||
Net income (loss) | $ | 186,225 | $ | (259,879 | ) | $ | (4,961,297 | ) | ||||
Net income (loss) per share: | ||||||||||||
Basic | $ | 0.74 | $ | (1.08 | ) | $ | (20.97 | ) | ||||
Diluted | $ | 0.72 | $ | (1.08 | ) | $ | (20.97 | ) | ||||
Shares used in per share computation: | ||||||||||||
Basic | 250,564 | 239,780 | 236,552 | |||||||||
Diluted | 257,992 | 239,780 | 236,552 | |||||||||
| Year Ended December 31, | ||||||||||||
| 2007 | 2006 | 2005 | ||||||||||
Revenues | $ | 1,496,289 | $ | 1,562,998 | $ | 1,604,577 | ||||||
Costs and expenses | ||||||||||||
Cost of revenues | 596,517 | 574,762 | 508,509 | |||||||||
Sales and marketing | 276,632 | 376,508 | 477,752 | |||||||||
Research and development | 160,186 | 129,256 | 95,572 | |||||||||
General and administrative | 276,130 | 256,592 | 179,294 | |||||||||
Restructuring, impairments and other charges (reversals), net | 110,110 | (4,471 | ) | 18,703 | ||||||||
Impairment of goodwill | 182,151 | — | — | |||||||||
Amortization of other intangible assets | 116,064 | 122,767 | 101,638 | |||||||||
Acquired in-process research and development | — | 16,700 | 7,670 | |||||||||
Total costs and expenses | 1,717,790 | 1,472,114 | 1,389,138 | |||||||||
Operating (loss) income | (221,501 | ) | 90,884 | 215,439 | ||||||||
Other income, net | 93,759 | 42,643 | 51,974 | |||||||||
(Loss) income from continuing operations before income taxes, loss from unconsolidated entities and minority interest | (127,742 | ) | 133,527 | 267,413 | ||||||||
Income tax (expense) benefit | (11,080 | ) | 243,648 | (100,786 | ) | |||||||
Loss from unconsolidated entities, net of tax | (2,018 | ) | — | — | ||||||||
Minority interest, net of tax | (3,840 | ) | (2,875 | ) | (4,702 | ) | ||||||
Net (loss) income from continuing operations | (144,680 | ) | 374,300 | 161,925 | ||||||||
Net income from discontinued operations, net of tax | 3,821 | 4,715 | 16,480 | |||||||||
Gain on sale of discontinued operations, net of tax | 1,357 | — | 250,573 | |||||||||
Net (loss) income | $ | (139,502 | ) | $ | 379,015 | $ | 428,978 | |||||
Basic net (loss) income per share from: | ||||||||||||
Continuing operations | $ | (0.61 | ) | $ | 1.53 | $ | 0.63 | |||||
Discontinued operations | 0.02 | 0.02 | 0.06 | |||||||||
Gain on sale of discontinued operations | — | — | 0.98 | |||||||||
Net (loss) income | $ | (0.59 | ) | $ | 1.55 | $ | 1.67 | |||||
Diluted net (loss) income per share from: | ||||||||||||
Continuing operations | $ | (0.61 | ) | $ | 1.51 | $ | 0.62 | |||||
Discontinued operations | 0.02 | 0.02 | 0.06 | |||||||||
Gain on sale of discontinued operations | — | — | 0.95 | |||||||||
Net (loss) income | $ | (0.59 | ) | $ | 1.53 | $ | 1.63 | |||||
Shares used in per share computation: | ||||||||||||
Basic | 237,707 | 244,421 | 257,368 | |||||||||
Diluted | 237,707 | 247,073 | 263,689 | |||||||||
See accompanying notesNotes to consolidated financial statements.Consolidated Financial Statements.
VERISIGN, INC. AND SUBSIDIARIES
CONSOLIDATED STATEMENTS OF STOCKHOLDERS’ EQUITY
(In thousands, except share data)thousands)
| Year Ended December 31, | ||||||||||||
| 2004 | 2003 | 2002 | ||||||||||
Common stock: | ||||||||||||
Balance, beginning of year: | ||||||||||||
241,829,274 shares at January 1, 2004 | ||||||||||||
237,510,063 shares at January 1, 2003 | ||||||||||||
234,358,114 shares at January 1, 2002 | $ | 242 | $ | 238 | $ | 234 | ||||||
Issuance of common stock for business combinations: | ||||||||||||
9,282,349 shares in 2004 | 9 | — | — | |||||||||
Issuance of common stock under employee stock purchase plan: | ||||||||||||
2,312,572 shares in 2004 | ||||||||||||
1,997,230 shares in 2003 | ||||||||||||
645,595 shares in 2002 | 2 | 2 | 1 | |||||||||
Exercise of common stock options: | ||||||||||||
4,391,205 shares in 2004 | ||||||||||||
2,321,981 shares in 2003 | ||||||||||||
2,506,354 shares in 2002 | 4 | 2 | 3 | |||||||||
Repurchase of common stock: | ||||||||||||
4,474,017 shares in 2004 | (4 | ) | — | — | ||||||||
Balance, end of year: | ||||||||||||
253,341,383 shares at December 31, 2004 | ||||||||||||
241,829,274 shares at December 31, 2003 | ||||||||||||
237,510,063 shares at December 31, 2002 | 253 | 242 | 238 | |||||||||
Additional paid-in capital: | ||||||||||||
Balance, beginning of year | 23,128,095 | 23,072,212 | 23,051,546 | |||||||||
Issuance of common stock and common stock options for business combinations | 165,632 | — | — | |||||||||
Issuance of common stock under employee stock purchase plan | 13,961 | 10,658 | 7,546 | |||||||||
Income tax benefit from exercise of employee stock options | 4,748 | 5,004 | — | |||||||||
Exercise of common stock options | 49,756 | 21,018 | 13,120 | |||||||||
Gain on issuance of consolidated subsidiary stock | — | 17,272 | — | |||||||||
Issuance of restricted stock | 4,172 | 1,931 | — | |||||||||
Repurchase of common stock | (113,253 | ) | — | — | ||||||||
Balance, end of year | 23,253,111 | 23,128,095 | 23,072,212 | |||||||||
Notes receivable from stockholders: | ||||||||||||
Balance, beginning of year | — | — | (252 | ) | ||||||||
Write-off of notes receivable | — | — | 252 | |||||||||
Balance, end of year | — | — | — | |||||||||
Unearned compensation: | ||||||||||||
Balance, beginning of year | (2,628 | ) | (8,086 | ) | (27,042 | ) | ||||||
Unearned compensation resulting from business combinations | (2,463 | ) | — | — | ||||||||
Issuance of restricted stock | (4,172 | ) | (1,931 | ) | — | |||||||
Amortization of unearned compensation | 3,136 | 7,389 | 18,956 | |||||||||
Balance, end of year | (6,127 | ) | (2,628 | ) | (8,086 | ) | ||||||
Accumulated deficit: | ||||||||||||
Balance, beginning of year | (21,740,054 | ) | (21,480,175 | ) | (16,518,878 | ) | ||||||
Net income (loss) | 186,225 | (259,879 | ) | (4,961,297 | ) | |||||||
Balance, end of year | (21,553,829 | ) | (21,740,054 | ) | (21,480,175 | ) | ||||||
Accumulated other comprehensive income (loss): | ||||||||||||
Balance, beginning of year | (2,002 | ) | (4,764 | ) | 466 | |||||||
Translation adjustments | 4,104 | 1,454 | (1,689 | ) | ||||||||
Change in unrealized gain (loss) on investments, net of tax | (3,513 | ) | 1,308 | (3,541 | ) | |||||||
Balance, end of year | (1,411 | ) | (2,002 | ) | (4,764 | ) | ||||||
Total stockholders’ equity | $ | 1,691,997 | $ | 1,383,653 | $ | 1,579,425 | ||||||
| Year Ended December 31, | ||||||||||||
| 2007 | 2006 | 2005 | ||||||||||
Common stock: | ||||||||||||
Balance, beginning of year | $ | 279 | $ | 275 | $ | 259 | ||||||
Issuance of common stock for business combinations | — | — | 9 | |||||||||
Issuance of common stock under stock plans | 18 | 4 | 7 | |||||||||
Balance, end of year | 297 | 279 | 275 | |||||||||
Additional paid-in capital: | ||||||||||||
Balance, beginning of year | 23,314,476 | 23,368,431 | 23,452,919 | |||||||||
Reclassification of unearned compensation upon adoption of SFAS 123R | — | (24,199 | ) | — | ||||||||
Issuance of common stock for business combinations | — | — | 288,402 | |||||||||
Common stock issued under stock plans | 306,958 | 51,536 | 80,447 | |||||||||
Issuance of stock-based compensation awards, net of variable accounting adjustments | — | — | (22,411 | ) | ||||||||
Stock-based compensation expense and other | 85,460 | 67,896 | — | |||||||||
Tax benefit (expense) associated with stock options | 8,642 | (14,188 | ) | 117,704 | ||||||||
Repurchase of common stock | (1,156,491 | ) | (135,000 | ) | (548,630 | ) | ||||||
Balance, end of year | 22,559,045 | 23,314,476 | 23,368,431 | |||||||||
Unearned compensation: | ||||||||||||
Balance, beginning of year | — | (24,199 | ) | (23,549 | ) | |||||||
Reclassification of unearned compensation upon adoption of SFAS 123R | — | 24,199 | — | |||||||||
Issuance of stock-based compensation awards | — | — | 9,938 | |||||||||
Stock-based compensation expense | — | — | (10,588 | ) | ||||||||
Balance, end of year | — | — | (24,199 | ) | ||||||||
Accumulated deficit: | ||||||||||||
Balance, beginning of year, as previously reported | (20,929,497 | ) | (21,308,512 | ) | (21,737,490 | ) | ||||||
Cumulative adjustment to beginning balance upon adoption of FIN 48 | 35,547 | — | — | |||||||||
Balance, beginning of year, as adjusted upon adoption of FIN 48 | (20,893,950 | ) | (21,308,512 | ) | (21,737,490 | ) | ||||||
Net (loss) income | (139,502 | ) | 379,015 | 428,978 | ||||||||
Balance, end of year | (21,033,452 | ) | (20,929,497 | ) | (21,308,512 | ) | ||||||
Accumulated other comprehensive income (loss): | ||||||||||||
Balance, beginning of year | (8,398 | ) | (12,553 | ) | (1,411 | ) | ||||||
Foreign currency translation adjustments | 8,101 | 776 | (7,988 | ) | ||||||||
Change in unrealized gain (loss) on investments, net of tax | 2,272 | 3,379 | (3,154 | ) | ||||||||
Balance, end of year | 1,975 | (8,398 | ) | (12,553 | ) | |||||||
Total stockholders’ equity | $ | 1,527,865 | $ | 2,376,860 | $ | 2,023,442 | ||||||
| Number of Outstanding Shares | ||||||||||||
| 2007 | 2006 | 2005 | ||||||||||
Balance, beginning of year | 243,844 | 246,419 | 253,341 | |||||||||
Issuance of common stock for business combinations | — | — | 9,083 | |||||||||
Issuance of common stock under stock plans | 17,254 | 3,915 | 6,812 | |||||||||
Repurchase of common stock | (38,249 | ) | (6,490 | ) | (22,817 | ) | ||||||
Balance, end of year | 222,849 | 243,844 | 246,419 | |||||||||
See accompanying notesNotes to consolidated financial statements.Consolidated Financial Statements.
VERISIGN, INC. AND SUBSIDIARIES
CONSOLIDATED STATEMENTS OF COMPREHENSIVE (LOSS) INCOME (LOSS)
(In thousands)
| Year Ended December 31, | ||||||||||||
| 2004 | 2003 | 2002 | ||||||||||
Net income (loss) | $ | 186,225 | $ | (259,879 | ) | $ | (4,961,297 | ) | ||||
Other comprehensive income: | ||||||||||||
Unrealized (loss) gain on investments, net of tax | (3,462 | ) | 1,307 | (847 | ) | |||||||
Reclassification adjustment for (gains) losses included in net income | (51 | ) | 1 | (2,694 | ) | |||||||
Translation adjustments | 4,104 | 1,454 | (1,689 | ) | ||||||||
Net gain (loss) recognized in other comprehensive income | 591 | 2,762 | (5,230 | ) | ||||||||
Comprehensive income (loss) | $ | 186,816 | $ | (257,117 | ) | $ | (4,966,527 | ) | ||||
| Year Ended December 31, | |||||||||||
| 2007 | 2006 | 2005 | |||||||||
Net (loss) income | $ | (139,502 | ) | $ | 379,015 | $ | 428,978 | ||||
Other comprehensive income (loss), net of tax: | |||||||||||
Foreign currency translation adjustments | 8,101 | 776 | (7,988 | ) | |||||||
Unrealized gain (loss) on investments | 2,272 | 3,379 | (3,154 | ) | |||||||
Other comprehensive income (loss) | 10,373 | 4,155 | (11,142 | ) | |||||||
Comprehensive (loss) income | $ | (129,129 | ) | $ | 383,170 | $ | 417,836 | ||||
See accompanying notesNotes to consolidated financial statements.Consolidated Financial Statements.
VERISIGN, INC. AND SUBSIDIARIES
CONSOLIDATED STATEMENTS OF CASH FLOWS
(In thousands)
| Year Ended December 31, | ||||||||||||
| 2004 | 2003 | 2002 | ||||||||||
Cash flows from operating activities: | ||||||||||||
Net income (loss) | $ | 186,225 | $ | (259,879 | ) | $ | (4,961,297 | ) | ||||
Adjustments to reconcile net income (loss) to net cash provided by operating activities: | ||||||||||||
Depreciation and amortization of property and equipment | 85,641 | 114,475 | 105,482 | |||||||||
Amortization and impairment of other intangible assets and goodwill | 79,440 | 335,505 | 4,894,714 | |||||||||
Provision for doubtful accounts | 689 | 6,055 | 42,712 | |||||||||
Non-cash restructuring and other charges | 19,954 | 27,634 | 41,868 | |||||||||
Reciprocal transactions for purchases of property and equipment | — | — | (6,375 | ) | ||||||||
Net loss on sale and impairment of investments | 8,200 | 16,541 | 162,469 | |||||||||
Gain on sale of VeriSign Japan stock | (74,925 | ) | — | — | ||||||||
Minority interest in net income of consolidated subsidiary | 2,618 | 474 | 416 | |||||||||
Tax benefit associated with stock options | 4,748 | 5,004 | — | |||||||||
Deferred income taxes | (8,390 | ) | 3,321 | 10,375 | ||||||||
Amortization of unearned compensation | 3,136 | 7,390 | 18,956 | |||||||||
Loss on disposal of property and equipment | — | 388 | 2,220 | |||||||||
Gain on sale of business | — | (2,862 | ) | — | ||||||||
Changes in operating assets and liabilities: | ||||||||||||
Accounts receivable | (65,822 | ) | 27,950 | 158,757 | ||||||||
Prepaid expenses and other current assets | 9,596 | 12,753 | (34,295 | ) | ||||||||
Accounts payable and accrued liabilities | 44,911 | 38,147 | (48,587 | ) | ||||||||
Deferred revenue | 69,317 | 25,544 | (147,324 | ) | ||||||||
Net cash provided by operating activities | 365,338 | 358,440 | 240,091 | |||||||||
Cash flows from investing activities: | ||||||||||||
Purchases of investments | (1,083,203 | ) | (627,278 | ) | (161,102 | ) | ||||||
Proceeds from maturities and sales of investments | 1,067,258 | 334,472 | 437,460 | |||||||||
Purchases of property and equipment | (92,532 | ) | (108,034 | ) | (176,233 | ) | ||||||
Proceeds from sale of VeriSign Japan stock | 78,317 | — | — | |||||||||
Proceeds from sale of business | — | 57,621 | — | |||||||||
Cash paid for business combinations, net of cash acquired | (246,356 | ) | (16,052 | ) | (348,643 | ) | ||||||
Merger related costs | (7,420 | ) | (5,120 | ) | (53,554 | ) | ||||||
Other assets | (927 | ) | (4,171 | ) | 4,448 | |||||||
Net cash used in investing activities | (284,863 | ) | (368,562 | ) | (297,624 | ) | ||||||
Cash flows from financing activities: | ||||||||||||
Proceeds from issuance of common stock from option exercises and employee stock purchase plan | 62,426 | 31,680 | 20,670 | |||||||||
Repurchase of common stock | (113,257 | ) | — | — | ||||||||
Proceeds from sale of consolidated subsidiary stock | 850 | 37,403 | 268 | |||||||||
Repayment of debt | (4,491 | ) | (13,199 | ) | (615 | ) | ||||||
Net cash (used in) provided by financing activities | (54,472 | ) | 55,884 | 20,323 | ||||||||
Effect of exchange rate changes | 3,045 | 1,326 | (1,689 | ) | ||||||||
Net (decrease) increase in cash and cash equivalents | 29,048 | 47,088 | (38,899 | ) | ||||||||
Cash and cash equivalents at beginning of year | 301,593 | 254,505 | 293,404 | |||||||||
Cash and cash equivalents at end of year | $ | 330,641 | $ | 301,593 | $ | 254,505 | ||||||
Supplemental cash flow disclosures: | ||||||||||||
Noncash investing and financing activities: | ||||||||||||
Issuance of common stock for business combinations | $ | 165,641 | $ | — | $ | — | ||||||
Unrealized gain (loss) on investments, net of tax | $ | (3,513 | ) | $ | 1,308 | $ | (3,541 | ) | ||||
Cash paid for income taxes | $ | 26,497 | $ | 12,304 | $ | 23,011 | ||||||
| Year Ended December 31, | ||||||||||||
| 2007 | 2006 | 2005 | ||||||||||
Cash flows from operating activities: | ||||||||||||
Net (loss) income | $ | (139,502 | ) | $ | 379,015 | $ | 428,978 | |||||
Adjustments to reconcile net (loss) income to net cash provided by operating activities: | ||||||||||||
Gain on divestiture of businesses | (71,216 | ) | — | — | ||||||||
Gain on divestiture of discontinued operations | (1,357 | ) | — | (250,573 | ) | |||||||
Unrealized gain on joint venture call options | (10,925 | ) | — | — | ||||||||
Realized and unrealized loss on embedded derivative | 15,301 | — | — | |||||||||
Depreciation of property and equipment | 114,539 | 108,349 | 89,309 | |||||||||
Amortization of other intangible assets | 116,064 | 122,767 | 101,638 | |||||||||
Amortization of debt issuance costs | 902 | 413 | — | |||||||||
Acquired in-process research and development | — | 16,700 | 7,670 | |||||||||
Provision for doubtful accounts | 850 | (1,165 | ) | 1,041 | ||||||||
Stock-based compensation and other | 85,250 | 66,285 | (10,588 | ) | ||||||||
Restructuring, impairments and other charges (reversals), net | 110,110 | (4,471 | ) | 18,703 | ||||||||
Impairment of goodwill | 182,151 | — | — | |||||||||
Net loss (gain) on sale of investments | 1,787 | (21,258 | ) | (11,310 | ) | |||||||
Loss from unconsolidated entities, net of tax | 2,018 | — | — | |||||||||
Minority interest, net of tax | 3,840 | 2,875 | 4,702 | |||||||||
Income tax associated with stock options | 6,189 | (7,833 | ) | 51,964 | ||||||||
Excess tax benefit associated with stock options | (12,607 | ) | — | — | ||||||||
Deferred income taxes | (11,042 | ) | (227,194 | ) | (8,313 | ) | ||||||
Loss on disposal of property and equipment | — | — | 186 | |||||||||
Changes in operating assets and liabilities, excluding effects of acquisitions: | ||||||||||||
Accounts receivable | (104,338 | ) | 61,263 | (22,665 | ) | |||||||
Prepaid expenses and other current assets | 133,522 | (109,421 | ) | (69,277 | ) | |||||||
Accounts payable and accrued liabilities | (76,719 | ) | (15,384 | ) | 75,498 | |||||||
Deferred revenues | 125,643 | 103,838 | 74,159 | |||||||||
Net cash provided by operating activities | 470,460 | 474,779 | 481,122 | |||||||||
Cash flows from investing activities: | ||||||||||||
Purchases of investments | (311 | ) | (541,569 | ) | (276,869 | ) | ||||||
Proceeds from maturities and sales of investments | 206,707 | 716,250 | 313,845 | |||||||||
Purchases of property and equipment | (152,237 | ) | (181,611 | ) | (110,834 | ) | ||||||
Cash paid for business combinations, net of cash acquired | — | (604,795 | ) | (161,334 | ) | |||||||
Proceeds received on divestiture of businesses, net of cash contributed | 159,023 | — | — | |||||||||
Investments in unconsolidated entities | (17,150 | ) | — | — | ||||||||
Proceeds received on divestiture of discontinued operations | 12,779 | — | 367,222 | |||||||||
Proceeds received on long term note receivable | — | 47,786 | 15,990 | |||||||||
Other assets | 3,274 | 1,543 | (4,424 | ) | ||||||||
Net cash provided by (used in) investing activities | 212,085 | (562,396 | ) | 143,596 | ||||||||
Cash flows from financing activities: | ||||||||||||
Proceeds from issuance of common stock from option exercises and employee stock purchase plan | 306,976 | 51,540 | 80,454 | |||||||||
Change in net assets of subsidiary and other | 332 | 1,448 | 863 | |||||||||
Repurchase of common stock | (1,156,491 | ) | (135,000 | ) | (548,630 | ) | ||||||
Proceeds from draw-down of credit facility, net of issuance costs | — | 295,619 | — | |||||||||
Repayment of short-term debt | (199,000 | ) | (100,000 | ) | — | |||||||
Proceeds from issuance of convertible debentures, net of issuance costs | 1,224,247 | — | — | |||||||||
Excess tax benefit associated with stock options | 12,607 | — | — | |||||||||
Repayment of long-term liabilities | — | (2,872 | ) | (2,200 | ) | |||||||
Net cash provided by (used in) financing activities | 188,671 | 110,735 | (469,513 | ) | ||||||||
Effect of exchange rate changes on cash and cash equivalents | 3,721 | 6 | (7,186 | ) | ||||||||
Net increase in cash and cash equivalents | 874,937 | 23,124 | 148,019 | |||||||||
Cash and cash equivalents at beginning of year | 501,785 | 478,660 | 330,641 | |||||||||
Cash and cash equivalents at end of year | 1,376,722 | 501,784 | 478,660 | |||||||||
Cash and cash equivalents of discontinued operations at end of year | — | (23,035 | ) | (11,732 | ) | |||||||
Cash and cash equivalents of continuing operations at end of year | $ | 1,376,722 | $ | 478,749 | $ | 466,928 | ||||||
Supplemental cash flow disclosures: | ||||||||||||
Cash paid for interest | $ | 1,453 | $ | 6,360 | $ | — | ||||||
Cash paid for income taxes, net of refunds received | $ | 21,300 | $ | 51,660 | $ | 26,440 | ||||||
Preferred stock received as consideration for divestiture of business | $ | 3,750 | $ | — | $ | — | ||||||
Note receivable from divested business | $ | 15,000 | $ | — | $ | — | ||||||
See accompanying notesNotes to consolidated financial statements.Consolidated Financial Statements.
VERISIGN, INC. AND SUBSIDIARIES
NOTES TO CONSOLIDATED FINANCIAL STATEMENTS
DECEMBER 31, 2004, 20032007, 2006 AND 20022005
| Note 1. Description |
Description of Business
VeriSign Inc. (“VeriSign” or “the Company”), a Delaware corporation, is a leading provider ofoperates intelligent infrastructure services that enable people and businesses to find, connect, secure,protect billions of interactions every day across the world’s voice, video and transact across complex globaldata networks. Through the Company’s Internet Services Group and Communications Services Group, VeriSignThe Company offers a variety of internetInternet and communications-related services, including internet security services, namingthose which are marketed through Web site sales, direct field sales, channel sales, telesales, and directory services, network connectivity and interoperability services, intelligent database services, mobile content and application services, clearing and settlement services, and billing and payment services. VeriSign markets its products and services through its direct sales force, telesales operations, member organizations in its global affiliate network, value-added resellers, service providers, and its Web sites.network.
VeriSign is currently organized intoThe Company’s business consists of two reportable segments: the Internet Services Group and the Communications Services Group. The Internet Services Group consists of the Information and Security Services business and the Naming and Directory Services business. The Information and Security Services business provides products and services that enable enterprisesprotect online and service providersnetwork interactions, enabling companies to establishmanage reputational, operational and deliver secure Internet-based services to customers, and thecompliance risks. The Naming and Directory Services business acts asis the exclusive registryauthoritative directory provider of all.com, ..net, .cc, and .tvdomain names in the.comand .netgeneric top-level domains, or gTLDs, and certain country code top-level domains, or ccTLDs.names. The Communications Services Group provides networkcommunications services, such as connectivity and interoperability services and intelligent data base services, mobile content and application services, and billing and payment services to telecommunications carriers and other users. During 2003, VeriSign derived its revenues from three reportable segments, the two described above, and the Network Solutions business segment, through which VeriSign provided domain name registration, and value addeddatabase services; commerce services, such as billing and operational support system services, and mobile commerce services; and content services, such as digital content and messaging services.
In late 2007, VeriSign announced a change to its business email, websites, hostingstrategy to be more tightly-aligned with its core competencies, which is to provide highly scaleable, reliable and other web presencesecure Internet infrastructure services to customers around the world. The strategy calls for divesture of a number of non-core businesses in our portfolio, such as communications, billing and commerce, content delivery, messaging and enterprise security services. Effective November 25, 2003, VeriSign completedBy divesting these non-core businesses, additional resources should be available to invest in the salecore businesses that will remain: Naming Services, Secure Socket Layer (“SSL”) Certificate Services, and Identity and Authentication services. The operations of its Network Solutions business to Pivotal Private Equity and realigned itsthese businesses will be classified as discontinued operations intowhen all criteria of Financial Accounting Standards Board (“FASB”) Statement of Financial Accounting Standards (“SFAS”) No. 144 (“SFAS 144”),“Accounting for the Internet Services Group and the Communications Services Group.Impairment or Disposal of Long Lived Assets.” are met. All of such criteria were not met as of December 31, 2007.
PrinciplesBasis of ConsolidationPresentation
The accompanying consolidated financial statements include the accounts of VeriSign and its subsidiaries after the elimination of intercompany accounts and transactions. On June 17, 2004, VeriSign acquired the 49% minority interest in VeriSign Australia Limited, which is now a wholly-owned subsidiary. As of December 31, 2004,2007, VeriSign owned approximately 54% of the outstanding shares of capital stock of its consolidated subsidiary, VeriSign Japan K.K. The minority interest’s proportionate share of income or loss is included in other income (expense)minority interest in the consolidated statementstatements of operations. Changes in VeriSign’s proportionate share of the net assets of VeriSign Japan K.K. resulting from sales of capital stock by the subsidiary are accounted for as equity transactions. Investments in entities in which the Company can exercise significant influence, but does not own a majority equity interest or otherwise control, are accounted for using the equity method and are included as investments in unconsolidated entities on the consolidated balance sheets.
Reclassifications
VeriSign records its discontinued operations in accordance with SFAS 144. Accordingly, the Consolidated Financial Statements have been reclassified for all periods presented to reflect discontinued operations. Unless noted otherwise, discussions in the Notes to Consolidated Financial Statements pertain to continuing operations.
VERISIGN, INC. AND SUBSIDIARIES
NOTES TO CONSOLIDATED FINANCIAL STATEMENTS—(Continued)
DECEMBER 31, 2007, 2006 AND 2005
Non-trade receivables as of December 31, 2006, amounting to $77.8 million have been reclassified from accounts receivable, net, to prepaid expenses and other current assets to conform to current period presentation. Such reclassification does not have any effect on net income as previously reported.
Use of Estimates
The discussion and analysis of VeriSign’s financial conditionposition and results of operations are based upon its consolidated financial statements, which have been prepared in accordance with accounting principlesU.S. generally accepted in the United States.accounting principles. The preparation of these financial statements requires management to make estimates and judgments that affect the reported amounts of assets, liabilities, revenues and expenses, and related disclosures of contingent assets and liabilities. On an ongoing basis, management evaluates its estimates, including those related to revenue recognition, allowance for doubtful accounts, long-lived assets, restructuring, stock-based compensation, royalty liabilities, deferred taxes, the mark-to-market valuation of our embedded derivatives associated with the convertible debt and deferred taxes.the call options associated with the investments in unconsolidated entities. Management bases its estimates on historical experience and on various other assumptions that are believed to be reasonable under the circumstances, the results of which form the basis
VERISIGN, INC. AND SUBSIDIARIES
NOTES TO CONSOLIDATED FINANCIAL STATEMENTS—(Continued)
DECEMBER 31, 2004, 2003 AND 2002
for making judgments about the carrying values of assets and liabilities. Actual results may differ from these estimates under different assumptions or conditions.
Significant Accounting Policies
Cash and Cash Equivalents
VeriSign considers all highly liquid investments with original maturities of three months or less at the date of acquisition to be cash equivalents. Cash and cash equivalents include money market funds, commercial paper and various deposit accounts.
Short-Term Investments
AllHighly liquid investments with original maturities greater than three months and with maturities less than one year from the balance sheet date are considered short-term investments. Short-term investments also include market auction preferred securities that have reauction periods of 90 days or less but whose underlying agreements have original maturities of more than 90 days. Investments with maturities greater than one year from the balance sheet date are considered long-term investments.
VeriSign invests in debt and equity securities of companies for business and investment purposes. Investments in public companies are classified as “available-for-sale” and are included in short-term investments in the consolidated financial statements. These investments are carried at fair value based on quoted market prices. VeriSign reviews its investments in publicly traded companies on a regular basis to determine if any security has experienced an other-than-temporary decline in its fair value. VeriSign considers the investee company’s cash position, earnings and revenue outlook, stock price performance over the past six months, liquidity and management, among other factors, in its review. If it is determined that an other-than-temporary decline in fair value exists in a marketable equity security, VeriSign records an investment loss in its consolidated statement of operations.
Fair Value of Financial Instruments
The fair value of VeriSign’s cash equivalents, and short-term investments, accounts receivable, long-termrestricted cash and investments, accounts payable and long-termshort-term debt approximates the carrying amount, which is the amount for which the instrument could be exchanged in a current transaction between willing parties. As of December 31, 2007, the fair value of VeriSign’s convertible debentures was approximately $1.6 billion, based on quoted market prices.
Investments in Unconsolidated Entities
VeriSign accounts for its investments in joint ventures as equity method investments, based on its ability to exert significant influence over but not control over the joint ventures. VeriSign records its investments at the amount of capital contributed plus its percentage interest in the joint ventures’ earnings or loss. VeriSign regularly reviews the assumptions underlying the operating and financial results based on information provided by these joint ventures, and determines the fair values of these investments based on a valuation performed using
VERISIGN, INC. AND SUBSIDIARIES
NOTES TO CONSOLIDATED FINANCIAL STATEMENTS—(Continued)
DECEMBER 31, 2007, 2006 AND 2005
the income approach and the market approach. If it is determined that an other-than-temporary decline exists in the fair values of these investments, VeriSign writes down the investments to their fair value and records the related impairments in earnings from unconsolidated entities.
Long-Term Investments
Investments in non-public companies where VeriSign owns less than 20% of the voting stock and has no indicators of significant influence are included in long-term investmentsOther assets in the consolidated balance sheets and are accounted for under the cost method. For these non-quoted investments, VeriSign regularly reviews the assumptions underlying the operating performance and cash flow forecasts based on information requested fromprovided by these privately held companies. This information may be more limited, may not be as timely, and may be less accurate than information available from publicly traded companies. Assessing each investment’s carrying value requires significant judgment by management. Generally, if cash balances are insufficient to sustain the investee’s operations for a six-month period and there are no currentanticipated prospects of future funding for the investee, VeriSign considers the decline in fair value to be other-than-temporary. If it is determined that an other-than-temporary decline exists in a non-public equity security, VeriSign writes down the investment to its fair value and records the related impairment as an investment loss in its consolidated statementstatements of operations. During 2004, 2003 and 2002, VeriSign determined that the decline in value of certain of its public and non-public equity investments was other-than-temporary and recorded net impairments of these investments totaling $8.2 million, $16.5 million, and $162.5 million, respectively.
Occasionally, VeriSign may recognize revenues from companies in which it also has made an investment amounting to less than 20% of their outstanding equity. In addition to its normal revenue recognition policies, VeriSign also considers the amount of other third-party investments in the company, its earnings and revenue
VERISIGN, INC. AND SUBSIDIARIES
NOTES TO CONSOLIDATED FINANCIAL STATEMENTS—(Continued)
DECEMBER 31, 2004, 2003 AND 2002
outlook, and its operational performance in determining the propriety and amount of revenues to recognize. If the investment is made in the same quarter that revenues are recognized, VeriSign looks to the investments of other third parties made at that time to establish the fair value of VeriSign’s investment in the company as well as to support the amount of revenues recognized. VeriSign typically makes its investments with others where its investment is less than 50% of the total financing round. VeriSign’s policy is not to recognize revenue in excess of other investors’ financing of the company. These arrangements are independent relationships and are not terminable unless the terms of the agreements are violated. VeriSign recognized revenues totaling $51.7 million in 2004, $14.2 million in 2003 and $27.1 million in 2002 from customers, including VeriSign Affiliates and Network Solutions, in which it holds an equity investment.
Trade Accounts Receivable and Allowances for Doubtful Accounts
Trade accounts receivable are recorded at the invoiced amount and generally do not bear interest.include finance charges. VeriSign maintains allowances for doubtful accounts for estimated losses resulting from the inability of its customers to make required payments. VeriSign regularly reviews the adequacy of its accounts receivable allowance after considering the sizesignificance of the accounts receivable balance, each customer’s expected ability to pay and its collection history with each customer. VeriSign reviews significant invoices that are past due to determine if an allowance is appropriate based on the risk category using the factors described above. In addition,For those invoices not specifically reviewed, VeriSign maintains a general reserve for certain invoices by applying a percentageprovisions based onupon the age category.of the receivable. In determining these reserves, VeriSign also monitorsanalyzes its accounts receivable for concentrationhistorical collection experience and current economic trends. If the historical data VeriSign uses to any one customer, industry or geographic region. To date VeriSign’s receivables have not had any particular concentrations that, if not collected, would have a significant impact on operating income. VeriSign requires all acquired companies to adopt its credit policies. Thecalculate the allowance for doubtful accounts represents VeriSign’s best estimate, but changes in circumstances relatingdoes not reflect the future ability to collect outstanding receivables, additional provisions for doubtful accounts receivable may result in a requirement for additional allowances inbe needed and the future.future results of operations could be materially affected.
Property and Equipment
Property and equipment are stated at cost less accumulated depreciation. Depreciation is calculated using the straight-line method over the estimated useful lives of the assets with 40 years for buildings and three to five years for computer equipment, purchased software, office equipment, and furniture and fixtures. Leasehold improvements are amortized using the straight-line method over the lesser of the estimated useful lives of the assets or lease terms.
Capitalized Software
Costs incurred in connection with the development of software products are accounted for in accordance with the Financial Accounting Standards Board (“FASB”) Statement of Financial Accounting Standards (“SFAS”)SFAS No. 86, “Accounting for the Costs of Computer Software to Be Sold, Leased or Otherwise Marketed.” Development costs incurred in the research and development of new software products, and enhancements to existing software products are expensed as incurred until technological feasibility in the form of a working model has been established. VeriSign’s software has been available for general release concurrent with the establishment of technological feasibility, and accordingly no such costs have been capitalized.
113
VERISIGN, INC. AND SUBSIDIARIES
NOTES TO CONSOLIDATED FINANCIAL STATEMENTS—(Continued)
DECEMBER 31, 2007, 2006 AND 2005
Software included in property and equipment includes amounts paid for purchased software and implementation services for software used internally that has been capitalized in accordance with the American Institute of Certified Public Accountants Statement of Position (“SOP”) No. 98-1, “Accounting for the Costs ofComputer Software Developed or Obtained for Internal Use.”. In 2004 and 2003, VeriSign The following table summarizes the capitalized
VERISIGN, INC. AND SUBSIDIARIES
NOTES TO CONSOLIDATED FINANCIAL STATEMENTS—(Continued)
DECEMBER 31, 2004, 2003 AND 2002
$14.6 million and $13.9 million, respectively, of costs related to third-party implementation and consulting services from third parties for software that is used internally. In 2004 and 2003, VeriSign capitalized $10.5 million and $17.7 million, respectively, ofas well as costs related to internally developed software.software:
| Year Ended December 31, | ||||||
| 2007 | 2006 | |||||
| (In thousands) | ||||||
Internally used third-party software and consulting fees | $ | 12,230 | $ | 20,202 | ||
Internally developed software | 29,912 | 23,665 | ||||
Goodwill and Other Intangible Assets
Goodwill represents the excess of costs over fair value of net assets of businesses acquired. Goodwill and other intangible assets acquired in a purchase business combination and determined to have an indefinite useful life are not amortized, but instead tested for impairment at least annually in accordance with the provisions of SFAS No. 142 (“SFAS 142”), “Goodwill and Other Intangible Assets.Assets.” In accordance with SFAS No. 142, such goodwill and other intangible assets may also requiresbe tested for impairment between annual tests in the presence of impairment indicators such as: (a) a significant adverse change in legal factors or in the business climate; (b) an adverse action or assessment by a regulator; (c) unanticipated competition; (d) loss of key personnel; (e) a more-likely-than-not expectation of sale or disposal of a reporting unit or a significant portion thereof; (f) testing for recoverability under SFAS 144 of a significant asset group within a reporting unit; (g) recognition of a goodwill impairment loss in the financial statements of a subsidiary that is a component of a reporting unit. As of December 31, 2007, there were no other intangible assets with an indefinite useful life.
VeriSign performed its annual impairment tests as of June 30, 2007, 2006 and 2005. The fair value of VeriSign’s reporting units is determined using either the income or the market valuation approach or a combination thereof. Under the income approach, the fair value of the reporting unit is based on the present value of estimated future cash flows that the reporting unit is expected to generate over its remaining life. Under the market approach, the value of the reporting unit is based on an analysis that compares the value of the reporting unit to values of publicly traded companies in similar lines of business. In the application of the income and market valuation approaches, VeriSign is required to make estimates of future operating trends and judgments on discount rates and other variables. Actual future results related to assumed variables could differ from these estimates. There were no impairment charges for goodwill from the annual impairment tests conducted as of June 30, 2007, 2006 and 2005.
At December 31, 2007, VeriSign performed an additional impairment test as a result of its decision to divest its non-core businesses. As a result of the impairment test, the Company recorded an impairment charge of $182.2 million, $62.6 million and $4.3 million for goodwill, other intangible assets and property and equipment, respectively, related to the Company’s Content Services business reporting unit. See Note 7, “Goodwill and Other Intangible Assets,” for further information.
VeriSign amortizes intangible assets with estimable useful lives be amortized on a straight-linestraight line basis over their respective estimated useful lives and reviewed for impairment in accordance with SFAS No. 144, “Accounting for Impairment or Disposal of Long-Lived Assets.”142.
VERISIGN, INC. AND SUBSIDIARIES
NOTES TO CONSOLIDATED FINANCIAL STATEMENTS—(Continued)
DECEMBER 31, 2007, 2006 AND 2005
Impairment of Long-Lived Assets
In accordance with SFAS No. 144, long-lived assets, such as property, plant, and equipment, and purchased intangiblesintangible assets subject to amortization, are reviewed for impairment whenever events or changes in circumstances indicate that the carrying amount of an asset may not be recoverable. Such events or circumstances include, but are not limited to, a significant decrease in the fair value of the underlying business, a significant decrease in the benefits realized from an acquired business, difficulties or delays in integrating the business or a significant change in the operations of an acquired business. Recoverability of assets to be held and used is measured by a comparison of the carrying amount of an asset to estimated undiscounted future cash flows expected to be generated by the asset. If the carrying amount of an asset exceeds its estimated future cash flows, an impairment charge is recognized by the amount by which the carrying amount of the asset exceeds its fair value.
Goodwill and acquired intangible assets not subject to amortization are tested annually for impairment, and are tested for impairment more frequently if events and circumstances indicate that the asset might be impaired. For goodwill, an impairment loss is recognized when its carrying amount exceeds its implied fair value as defined by SFAS No. 142. For acquired intangible assets not subject to amortization, an impairment loss is recognized to the extent that the carrying amount of the asset exceeds its fair value.
Provision for royalty liabilities for intellectual property rightsRestructuring Charges
CertainVeriSign records restructuring charges related to workforce reduction in accordance with SFAS No. 112 (“SFAS 112”), “Employers’ Accounting for Postemployment Benefits an amendment of our mobile contentFASB Statements No. 5 and 43,” since benefits are provided pursuant to a severance plan which uses a standard formula of paying benefits based upon tenure with the Company. The accounting for such restructuring charges meets the four requirements of SFAS 112 which are: (i) the Company’s obligation relating to employees’ rights to receive compensation for future absences is attributable to employees’ services utilize intellectual property ownedalready rendered; (ii) the obligation relates to rights that vest or held under license by others. Where we have not yet enteredaccumulate; (iii) payment of the compensation is probable; and (iv) the amount can be reasonably estimated.
VeriSign records restructuring charges related to excess facilities and other exit costs in accordance with SFAS No. 146 (“SFAS 146), “Accounting for Costs Associated with Exit or Disposal Activities.”SFAS 146 requires that a liability for costs associated with an exit or disposal activity be measured and recognized initially at fair value only when the liability is incurred. Excess facilities restructuring charges take into a license agreement with a holder, we record a provisionaccount the fair value of lease obligations of the abandoned space, including the potential for royalty paymentssublease income. Estimating the amount of sublease income requires management to make estimates for the space that we estimate will be due once a license agreement is concluded. We estimaterented, the royalty payments based onrate per square foot that might be received and the prevailing royalty rate for the typevacancy period of intellectual property being utilized. Oureach property. These estimates could differ materially from the actual royalties to be paid under any definitive license agreements that may be reachedamounts due to changes in the market for such intellectual property,real estate markets in which the properties are located, such as the supply of office space and prevailing lease rates. Changing market conditions by location and considerable work with third-party leasing companies require us to periodically review each lease and change our estimates on a prospective basis, as necessary.
Contingent Convertible Debentures
The Company accounts for its contingent convertible debentures and related provisions in accordance with the provisions of Emerging Issues Task Force Issue (“EITF”) No. 98-5, “Accounting for Convertible Securities with Beneficial Conversion Features or Contingently Adjustable Conversion Ratios,” EITF No. 00-27, “Application of Issue No. 98-5 to Certain Convertible Instruments,” EITF No. 00-19 (“EITF 00-19”), “Accounting for Derivative Financial Instruments Indexed to, and Potentially Settled in, a Company’s Own Stock,” and EITF No. 01-6, “The Meaning of ‘Indexed to a Company’s Own Stock’,” EITF No. 04-08 (“EITF 04-08”), “The Effect of Contingently Convertible Debt on Diluted Earnings Per Share” and EITF No. 90-19, “Convertible Bonds with Issuer Option to Settle for Cash upon Conversion.” The Company also evaluates the instruments in accordance with SFAS No. 133 (“SFAS 133”), “Accounting for Derivative Instruments and
115
VERISIGN, INC. AND SUBSIDIARIES
NOTES TO CONSOLIDATED FINANCIAL STATEMENTS—(Continued)
DECEMBER 31, 2007, 2006 AND 2005
Hedging Activities,” which requires bifurcation of embedded derivative instruments and measurement of fair value for accounting purposes. EITF 04-08 requires the Company to include the dilutive effect of the shares of its common stock issuable upon conversion of the outstanding convertible debentures in its diluted income per share calculation regardless of whether the market price trigger or other contingent conversion feature has been met. The Company applies the treasury stock method as it has the intent and current ability to settle the principal amount of the convertible debentures in cash. This method results in incremental dilutive shares when the average fair value of the Company’s common stock for a reporting period exceeds the initial conversion price per share of $34.37.
The Company considers the embedded features related to the contingent interest payments, over-allotment option, and the Company’s ability to make specific types of distributions (e.g., extraordinary dividends) to qualify as derivatives and bundles them as a compound embedded derivative under SFAS 133. The fair value of the derivative at the date of issuance of the debentures is accounted for as a discount on the debentures. The over-allotment feature which was revalued on the date of exercise is accounted for as a premium on the debentures. The debt discount and the debt premium are being accreted to the face value of the debentures as interest expense, net, over the maturity period of the debentures. Any change in demand for a particular typethe fair value of content,this embedded derivative is recognized as an unrealized gain or loss in which case we would record a royalty expense materially different than our estimate.Other income, net.
Foreign Currency Translation and Hedging Instruments
VeriSign conducts business throughout the world and transacts business in multiple foreign currencies. The functional currency for most of VeriSign’s international subsidiaries is the U.S. Dollar. The subsidiaries’ financial statements are remeasured into U.S. Dollars using a combination of current and historical exchange rates and any remeasurement gains and losses are included in operating results.
VERISIGN, INC. AND SUBSIDIARIES
NOTES TO CONSOLIDATED FINANCIAL STATEMENTS—(Continued)
DECEMBER 31, 2004, 2003 AND 2002
The financial statements of the subsidiaries for which the local currency is the functional currency are translated into U.S. Dollars using the current rate for assets and liabilities and a weighted-average rate for the period for revenues and expenses. TheThis translation results in a cumulative translation adjustment that results from this translation is included in accumulated other comprehensive income (loss)or loss, which is a separate component of stockholders’ equity.
VeriSign transacts business in foreign countries in U.S. Dollars as well as multiple foreign currencies. In the fourth quarter of 2003, VeriSign initiatedmaintains a foreign currency risk management program using forward currency contractsdesigned to eliminate, reduce, or transfer selectedmitigate foreign exchange risks associated with the monetary assets and liabilities of its operations that are denominated in non-functional currencies. The primary objective of this program is to minimize the gains and losses resulting from fluctuations in exchange rates. The Company does not enter into foreign currency risks. Forwardtransactions for trading or speculative purposes, nor does it hedge foreign currency exposures in a manner that entirely offsets the effects of changes in exchange rates. The program may entail the use of forward or option contracts, and in each case, these contracts are limited to durationsa duration of less than 12 months.
At December 31, 2007, VeriSign held forward contracts in notional amounts totaling approximately $50.9 million to mitigate the impact of exchange rate fluctuations associated with certain foreign currencies. All derivativesforward contracts were recorded at fair market value on the balance sheet. Gainssheet and gains and losses resulting fromwere included in earnings. The Company attempts to limit its exposure to credit risk by executing foreign exchange contracts with high-quality financial institutions.
VERISIGN, INC. AND SUBSIDIARIES
NOTES TO CONSOLIDATED FINANCIAL STATEMENTS—(Continued)
DECEMBER 31, 2007, 2006 AND 2005
Accumulated Other Comprehensive Income (Loss)
Accumulated other comprehensive loss includes foreign currency translation adjustments and unrealized gains and losses on marketable securities classified as available-for-sale. The following table summarizes the changes in fair value were accounted for in operationsthe components of accumulated other comprehensive income (loss) during 2004.2007 and 2006:
| Foreign Currency Translation Adjustments Gain (Loss) | Unrealized Gain (Loss) On Investments, net of tax | Total Accumulated Other Comprehensive Income (Loss) | ||||||||||
| (In thousands) | ||||||||||||
Balance, December 31, 2005 | $ | (7,191 | ) | $ | (5,362 | ) | $ | (12,553 | ) | |||
Changes | 776 | 3,379 | 4,155 | |||||||||
Balance, December 31, 2006 | (6,415 | ) | (1,983 | ) | (8,398 | ) | ||||||
Changes | 8,101 | 2,272 | 10,373 | |||||||||
Balance, December 31, 2007 | $ | 1,686 | $ | 289 | $ | 1,975 | ||||||
Revenue Recognition
During 2004, we derived ourVeriSign derives its revenues from two reportable segments: (i) the Internet Services Group, which consists of the Security Services business and the Naming and Directory Services business;Information Services; and (ii) the Communications Services Group, which consists of the network connectivityNetwork Connectivity and interoperability services, intelligent database services, the mobile contentInteroperability Services, Intelligent Database Services, Content and application services business,Application Services, Clearing and the clearingSettlement Services, and settlement services business.Billing and Payment Services. Unless otherwise noted below, VeriSign’s revenue recognition policies are in accordance with SECthe U.S. Securities and Exchange Commission (“SEC”) Staff Accounting Bulletin (“SAB”) No. 104, “Revenue Recognition,” and Emerging Issues Task Force (“EITF”) Issue No. 00-21, “Revenue Arrangements with Multiple Deliverables.”
The revenue recognition policy for each of these categories is as follows:
Internet Services Group
Security Services
Revenues from the Security Services business are comprised of security services including managed security services and authentication services for enterprises.
Managed Security Services (“MSS”). Revenues from managed security services primarily consist of a set-up fee and a monthly service fee for the managed security service. Revenues from set-up fees are deferred and recognized ratably over the period that the fees are earned and revenues from the monthly service fees are recognized in the period in which the services are provided.
WeVeriSign also provideprovides global security consulting services to help enterprises assess, design, and deploy network security solutions. Revenues from global security consulting services are recognized using either the percentage-of-completion method or on a time-and-materialstime and materials basis as workthe services are performed, or for fixed price consulting as services are performed, completed and accepted. In some cases fixed price consulting is performed. Percentage-of-completionmeasured using the proportional performance method of accounting. Proportional performance is based upon the ratio of hours incurred to total hours estimated to be incurred for the project. We haveVeriSign has a history of accurately estimating project status and the hours required to complete projects. If different conditions were to prevail such that accurate estimates could not be made, then the
117
VERISIGN, INC. AND SUBSIDIARIES
NOTES TO CONSOLIDATED FINANCIAL STATEMENTS—(Continued)
DECEMBER 31, 2007, 2006 AND 2005
use of the completed contract method would be required and all revenue and costs would be deferred until the project was completed. Revenues from time-and-materials are recognized as services are performed.
Authentication Services. Revenues from the sale of authentication and security services primarily consist of a set-up fee, annual managed service and per seat license fee. Revenues from the fees are deferred and
VERISIGN, INC. AND SUBSIDIARIES
NOTES TO CONSOLIDATED FINANCIAL STATEMENTS—(Continued)
DECEMBER 31, 2004, 2003 AND 2002
recognized ratably over the term of the license, generally 12 to 36 months. Post-contract customer support (“PCS”) is bundled with authentication and security services licenses and recognized over the license term.
VeriSign Affiliate PKI Software and Services. VeriSign Affiliate PKI Software and Services (“International Affiliates”) are for digital certificate technology and business process technology. Revenues from the VeriSign Affiliate PKI Software and Services are derived from arrangements involving multiple elements including digital certificates, PCS and other services. These software licenses, which do not provide for right of return, are primarily perpetual licenses for which revenues are recognized up-front once all criteria for revenue recognition have been met.
We recognizeVeriSign recognizes revenues from VeriSign Affiliate PKI Software and Services in accordance with SOP 97-2, “Software Revenue Recognition,” as amended by SOP 98-9, “Modification of SOP 97-2, SoftwareRevenue Recognition with Respect to Certain Transactions,” when all of the following criteria are met: (1) persuasive evidence of an arrangement exists, (2) delivery has occurred, (3) the fee is fixed or determinable and (4) collectibility is probable. We defineVeriSign defines each of these four criteria as follows:
| • | Persuasive evidence of an arrangement exists. It is |
| • | Delivery has occurred. |
| • | The fee is fixed or determinable. It is |
| • | Collectibility is probable. Collectibility is assessed on a customer-by-customer basis. |
OurThe Company’s determination of fair value of each element in multiple elementmultiple-element software arrangements is based on vendor-specific objective evidence (“VSOE”) of fair value. We limit ourVeriSign limits its assessment of VSOE for each element to the price charged when the same element is sold separately. We haveVeriSign has analyzed all of the elements included in ourits multiple-element software arrangements and determined that we haveit has sufficient VSOE to allocate revenues to PCS and professional services components of ourits perpetual license arrangements. We sell ourVeriSign
VERISIGN, INC. AND SUBSIDIARIES
NOTES TO CONSOLIDATED FINANCIAL STATEMENTS—(Continued)
DECEMBER 31, 2007, 2006 AND 2005
sells its professional services separately, and havehas established VSOE on this basis. VSOE for PCS is determined based upon the customer’s annual renewal rates for these elements. Accordingly, assuming all other revenue recognition criteria are met, revenues from perpetual licenses are recognized upon delivery using the residual method in accordance with SOP 98-9.
VERISIGN, INC. AND SUBSIDIARIES
NOTES TO CONSOLIDATED FINANCIAL STATEMENTS—(Continued)
DECEMBER 31, 2004, 2003 AND 2002
OurVeriSign’s consulting services generally are not essential to the functionality of the software. OurThe Company’s software products are fully functional upon delivery and do not require any significant modification or alteration. Customers purchase these consulting services to facilitate the adoption of ourVeriSign’s technology and dedicate personnel to participate in the services being performed, but theycustomers may also decide to use their own resources or appoint other consulting service organizations to provide these services. Software products are billed separately and independently from consulting services, which are generally billed on a time-and-materials or milestone-achieved basis.
WeVeriSign also receivereceives ongoing royalties from each Digital Certificatedigital certificate or Authentication Serviceauthentication service sold by the VeriSign Affiliate to an end user. We recognizeThe Company recognizes the royalties from affiliates over the term of the digital certification or authentication service to which the royalty relates, which is generally 12 to 24 months.
Commerce SecuritySSL Certificate Services. Revenues from SSL Certificate services include the sale or renewal of digital certificates for commerce security servicescertificates. These revenues are deferred and recognized ratably over the life of the digital certificate, which is generally 12 to 2436 months.
Digital Brand Management Services. Revenues from digital brand management services include our domain name registration services and our brand monitoring services. Revenues from the registration fees are deferred and recognized ratably over the registration term and the revenues from the brand monitoring services are recognized ratably over the periods in which the services are provided.
Secure Payments Services. Revenues from secure payments services primarily consist of a set-up fee and a monthly service fee for the transaction processing services. Revenues from set-up fees are deferred and recognized ratably over the period that the fees are earned. Revenues from the service fees are recognized ratably over the periods in which the services are provided. Advance customer deposits received are deferred and allocated ratably to revenue over the periods the services are provided.
Naming and DirectoryInformation Services
Naming Services.VeriSign’s Naming and DirectoryInformation Services revenues primarily include our domain name registry services for the.com and.netgTLDs and certain ccTLDs, and managed domain name services.
Domain Name Registry Services. Domain name registration revenues consist primarily of registration fees charged to registrars for domain name registration services. Revenues from the initial registration or renewal of domain name registration services are deferred and recognized ratably over the registration term, generally one to two years and up to ten years. Fees for renewals and advance extensions to the existing term are deferred until the new incremental period commences. These fees are then recognized ratably over the new registration term, ranging from one to ten years.
Digital Brand Management Services. Revenues from digital brand management services include VeriSign’s domain name registration services and its brand monitoring services. Revenues from the registration fees are deferred and recognized ratably over the registration term and the revenues from the brand monitoring services are recognized ratably over the periods in which the services are provided, which is generally one to ten years.
Communications Services Group
Revenues from our communications service groupCommunications Services business are comprised of network connectivity and interoperability services, intelligent database services, mobile content and applicationservices, messaging services, clearing and settlement services, and billing and paymentOSS services.
Connectivity and Interoperability Services
Through VeriSign’s network connectivity and interoperability services, for wirelineVeriSign provides SS7 Connectivity and wireless telecommunications carriers, cable companies, enterprise customers,Signaling, and other users.Voice and Data Roaming services.
119
VERISIGN, INC. AND SUBSIDIARIES
NOTES TO CONSOLIDATED FINANCIAL STATEMENTS—(Continued)
DECEMBER 31, 2004, 20032007, 2006 AND 20022005
Network Connectivity and Interoperability Services
Through our network connectivity and interoperability services, we provide SS7 Connectivity and Signaling, Seamless Roaming for Wireless and Intelligent Database and Directory Services which provides for connections and services that signal and route information within and between telecommunication carrier networks.
SS7 Connectivity and Signaling. Network connectivity revenues are derived from establishing and maintaining connection to ourVeriSign’s SS7 network and trunk signaling services. Revenues from network connectivity consist primarily of monthly recurring fees, along with trunk signaling service fees, which are charged and recognized monthly based on the number of switches to which a customer signals.
WirelessVoice and Data Roaming. Voice and Data roaming revenues are derived from enabling service providers to offer wireless data roaming to their subscribers. Revenues from wireless account management services and unregistered wireless roaming services are based on the revenue retained by usVeriSign and recognized in the period in which such calls are processed on a per-minute or per-call basis.
Intelligent Database Services
Intelligent Database Services revenues include Number Portability, Caller Name Identification, Toll-free Database Services and TeleBlock Do Not Call, which are derived primarily from monthly database administration and database query services and are charged and recognized on a per-use or per-query basis.
Mobile Content and Application Services
Mobile contentContent services revenues are derived by providing mobiledigital content services, including content, aggregation, formatting, mediationDigital Content services, Messaging services and billing and paymentMobile Delivery services. Revenues from mobile content services primarily consist of weekly, biweekly or monthly subscriber fees for content services. We also provide content services on a transaction basis and recognize revenue upon delivery. For mobile content servicesfees. VeriSign recorded these revenues we record the revenue net of the fees from ourits wireless carriers in accordance with EITF No. 99-19, “Reporting Revenue Gross as a Principal versus Net as an Agent.”. VeriSign also provides content services on a transaction basis and recognizes revenue upon delivery. VeriSign’s content subscription plans allow for a specified number of content downloads per subscription period and give the customer the ability to rollover unused content downloads to future periods. VeriSign considers historical customer usage patterns to estimate and defer revenue for the number of content downloads expected to be rolled over and utilized prior to termination of the subscription plan.
Revenues from applicationMessaging services are derived by providing multimedia, global and short messaging services between carrier systems and devices, and across disparate networks and technologies so the carrierscarrier’s customers can exchange messages outside their carrier’s network. Revenues from applicationMessaging services primarily represent fees charged and recognized for the messaging services either based on a monthly fee or number of messages processed. VeriSign also provides consulting services to provide multimedia messaging and interoperability solutions. These fees are charged on a transaction or fixed-fee basis. The revenues associated with interoperability solutions are typically recognized over the estimated useful life, which is generally one to two years.
Clearing and Settlement Services
The Communications Services Group also offers advanced billing and customer care services to wireline and wireless carriers. OurVeriSign’s advanced billing and customer care services include:
Wireline and Wireless Clearinghouse ServicesServices.. Clearinghouse Servicesservices revenues are derived primarily from serving as a distribution and collection point for billing information and payment collection for services provided by one carrier to customers billed by another. Clearinghouse Services revenuesRevenues from clearinghouse services are earned based on the number of messages processed. Included in prepaid expenses and other current assets are amountsAmounts due from customers that are related to our telecommunications services for third-party network access, data base charges and clearinghouse toll amounts that have been invoiced and remitted to the customer.VeriSign’s
VERISIGN, INC. AND SUBSIDIARIES
NOTES TO CONSOLIDATED FINANCIAL STATEMENTS—(Continued)
DECEMBER 31, 2004, 20032007, 2006 AND 20022005
telecommunications services for third-party network access, database charges and clearinghouse toll amounts that have been invoiced and remitted to the customer are included in prepaid expenses and other current assets.
Billing and PaymentOSS Services
Revenues from billingBilling and customer careOSS services primarily represent a monthly recurring fee for every subscriber activated by ourVeriSign’s wireless carrier customers.
In June 2006, the FASB issued EITF No. 06-3 (“EITF 06-3”), “Reciprocal ArrangementsHow Taxes Collected from Customers and Remitted to Governmental Authorities Should Be Presented in the Income Statement
On occasion,.” EITF 06-3 provides guidance on an entity’s disclosure of its accounting policy regarding the gross or net presentation of certain taxes and provides that if taxes included in gross revenues are significant, a company should disclose the amount of such taxes for each period for which an income statement is presented (i.e., both interim and annual periods). Taxes within the scope of EITF 06-3 are those that are imposed on and concurrent with a specific revenue-producing transaction. VeriSign has purchased goods or services for its operations from organizations at or about the same time that VeriSign licensed its software to these organizations.records transaction-based taxes on a net basis. These transactionstaxes are recorded at terms VeriSign considersas current liabilities until remitted to be fair value. For these reciprocal arrangements, VeriSign considers Accounting Principles Board (“APB”) Opinion No. 29, “Accounting for Nonmonetary Transactions,” and EITF Issue No. 01-02, “Interpretation of APB Opinion No. 29,” to determine whether the arrangement is a monetary or non-monetary transaction. Transactions involving the exchange of boot representing 25% or greater of the fair value of the reciprocal arrangement are considered monetary transactions within the context of APB Opinion No. 29 and EITF Issue No. 01-02. Monetary transactions and non-monetary transactions that represent the culmination of an earnings process are recorded at the fair value of the products delivered or products or services received, whichever is more readily determinable, provided that fair values are determinable within reasonable limits. In determining fair value, VeriSign considers the recent history of cash sales of the same products or services in similar sized transactions. Revenues from such transactions may be recognized over a period of time as the products or services are received. For non-monetary reciprocal arrangements that do not represent the culmination of the earnings process, the exchange is recorded based on the carrying value of the products delivered, which is generally zero.relevant government authority.
VeriSign has not entered into any new reciprocal arrangements since the first quarter of 2002. Revenues recognized under reciprocal arrangements were approximately $3.0 million in 2004, of which $2.2 million involved non-monetary transactions, approximately $3.8 million in 2003, of which $2.7 million involved non-monetary transactions, and approximately $14.0 million in 2002, of which $9.7 million involved non-monetary transactions, as defined above.
Advertising Expense
Advertising costs are expensed as incurred and are included in sales and marketing expense in the accompanying consolidated statementsConsolidated Statements of operations.Operations. Advertising expense was $90.8$30.5 million in 2004, $26.92007, $149.8 million in 2003,2006, and $52.1$287.7 million in 2002.2005.
Income Taxes
VeriSign uses the asset and liability method to account for income taxes. Deferred tax assets and liabilities are recognized for the future tax consequences attributable to differences between the financial statement carrying amounts of existing assets and liabilities and their respective tax bases.bases and net operating loss carryforwards. Deferred tax assets and liabilities are measured using enacted tax rates expected to apply to taxable income in the years in which those temporary differences are expected to be recovered or settled. The effect on deferred tax assets and liabilities of a change in tax rates is recognized in income in the period that includes the enactment date. VeriSign records a valuation allowance to reduce deferred tax assets to an amount whose realization is more likely than not.
The Company adopted FASB Interpretation No. 48 (“FIN 48”), “Accounting for Uncertainty in Income Taxes—an interpretation of FASB Statement No. 109,” on January 1, 2007. FIN 48 is an interpretation of SFAS No. 109 (“SFAS 109”), “Accounting for Income Taxes,” and it seeks to reduce the diversity in practice associated with certain aspects of measurement and recognition in accounting for income taxes. FIN 48 prescribes a recognition threshold and measurement attribute for the financial statement recognition and measurement of a tax position that an entity takes or expects to take in a tax return. Additionally, FIN 48 provides guidance on de-recognition, classification, interest and penalties, accounting in interim periods, disclosures, and transition. Under FIN 48, an entity may only recognize or continue to recognize tax positions that meet a “more likely than not” threshold. In accordance with its accounting policy, the Company recognizes accrued interest and penalties related to unrecognized tax benefits as a component of income tax expense. The impact on adoption of FIN 48 is more fully described in Note 14, “Income Taxes.” The cumulative effect of adopting FIN 48 was a decrease in income taxes payable of $9.3 million, an increase in long-term deferred tax assets of $26.2 million, and a
121
VERISIGN, INC. AND SUBSIDIARIES
NOTES TO CONSOLIDATED FINANCIAL STATEMENTS—(Continued)
DECEMBER 31, 2004, 20032007, 2006 AND 20022005
decrease in the January 1, 2007, accumulated deficit balance of $35.5 million. Included in this amount is an adjustment made by the Company in the fourth quarter 2007 to increase accumulated deficit by $2.5 million. At the adoption date of January 1, 2007, the Company had an unrecognized tax benefit for income taxes associated with uncertain tax positions of $45.0 million. As of December 31, 2007, this amount was $41.4 million.
Stock Compensation Plans and UnearnedStock-Based Compensation
As of December 31, 2004,Prior to January 1, 2006, VeriSign has fouraccounted for stock-based employee compensation plans, including two terminated plansawards under the intrinsic value method, which options are outstanding but no further grants can be made, and two active plans. VeriSign accounts for these plans underfollowed the recognition and measurement principalsprinciples of APBAccounting Principles Board Opinion No. 25 (“APB 25”), ““Accounting for Stock Issued to Employees.Employees,”, and related interpretations. The following table illustrates the effect on net income (loss) and net income (loss) per share if VeriSign had applied theintrinsic value method of accounting resulted in compensation expense for restricted stock awards at fair value recognitionon date of grant based on the number of shares granted and the quoted price of the Company’s common stock, and for stock options to the extent option exercise prices were set below market prices on the date of grant. To the extent stock awards were forfeited prior to vesting, the corresponding previously recognized expense was reversed as an offset to operating expenses.
Effective January 1, 2006, the Company adopted the provisions of SFAS No. 123R (“SFAS 123R”), “Share-Based Payment.” SFAS 123R replaced SFAS No. 123 (“SFAS 123”), “Accounting for Stock-Based Compensation,””and superseded APB 25. VeriSign elected the modified prospective application method, under which prior periods are not revised for comparative purposes. The valuation provisions of SFAS 123R apply to new grants and to grants that were outstanding as of the effective date and are subsequently modified. For stock-based employee compensation:awards granted on or after January 1, 2006, the Company will amortize stock-based compensation expense on a straight-line basis over the requisite service period, which is the vesting period. Estimated compensation for grants that were outstanding as of the effective date will be recognized over the remaining service period using the compensation cost estimated for the SFAS 123 pro forma disclosures.
| Year Ended December 31, | ||||||||||||
| 2004 | 2003 | 2002 | ||||||||||
| (In thousands, except per share data) | ||||||||||||
Net income (loss), as reported | $ | 186,225 | $ | (259,879 | ) | $ | (4,961,297 | ) | ||||
Add: Unearned compensation, net of tax | 3,136 | 7,391 | 18,953 | |||||||||
Deduct: Equity-based compensation determined under the fair value method for all awards, net of tax | (139,953 | ) | (223,266 | ) | (240,731 | ) | ||||||
Pro forma net income (loss) | $ | 49,408 | $ | (475,754 | ) | $ | (5,183,075 | ) | ||||
Basic: | ||||||||||||
As reported | $ | 0.74 | $ | (1.08 | ) | $ | (20.97 | ) | ||||
Pro forma equity-based compensation | (0.54 | ) | (0.90 | ) | (0.94 | ) | ||||||
Pro forma net income (loss) per share | $ | 0.20 | $ | (1.98 | ) | $ | (21.91 | ) | ||||
Diluted: | ||||||||||||
As reported | $ | 0.72 | $ | (1.08 | ) | $ | (20.97 | ) | ||||
Pro forma equity-based compensation | (0.53 | ) | (0.90 | ) | (0.94 | ) | ||||||
Pro forma net income (loss) per share | $ | 0.19 | $ | (1.98 | ) | $ | (21.91 | ) | ||||
VeriSign recognized incremental stock-based compensation expense of $33.8 million during 2006 as a result of the adoption of SFAS 123R. See Note 13, “Stock-Based Compensation,” for further information regarding stock-based compensation assumptions and expenses. The FASB Staff Position (“FSP’) No. 123R-3 (“FSP 123R-3”),“Transition Election Related to Accounting for the Tax Effects of Share-Based Payment Awards,” provides an elective method for calculating the pool of excess tax benefits available to absorb tax deficiencies recognized subsequent to the adoption of SFAS 123R. FSP 123R-3 provides that an entity may make a one-time election to adopt the transition method. An entity may take up to one year from its initial adoption of SFAS 123R to make the election. During the second quarter ended June 30, 2006, VeriSign elected the short-cut transition method described in FSP 123R-3, and analyzed its effect on the Company’s consolidated financial statements for the periods presented. The election of the transition method did not have a material impact on VeriSign’s consolidated financial statements.
The fair valueAs a result of stock options and Employee Stock Purchase Plan options was estimatedthe adoption of SFAS 123R, VeriSign will only recognize a benefit from stock-based compensation in paid in capital if an incremental tax benefit is realized after all other tax attributes currently available to us have been utilized. Also upon adoption of SFAS 123R, VeriSign elected to account for the indirect benefits of stock-based compensation on the date of grant usingresearch tax credit through the Black-Scholes option pricing model. The following table sets forthconsolidated income statement (continuing operations) rather than through paid-in-capital. VeriSign does include deferred tax assets and the weighted-average assumptions usedassociated valuation allowance related to calculate the fair value ofnet operating loss and tax credit carryforwards for the accumulated stock optionsaward windfalls for income tax footnote disclosure purposes. VeriSign tracks these stock award attributes separately and Employee Stock Purchase Plan options for each period presented:
Year Ended December 31, | ||||||
2004 | 2003 | 2002 | ||||
Stock options: | ||||||
Volatility | 82% | 100% | 110% | |||
Risk-free interest rate | 2.81% | 2.00% | 3.96% | |||
Expected life | 2.9 years | 2.6 years | 3.5 years | |||
Dividend yield | zero | zero | zero | |||
Employee Stock Purchase Plan options: | ||||||
Volatility | 53% | 94% | 110% | |||
Risk-free interest rate | 2.22% | 1.49% | 1.98% | |||
Expected life | 1.25 years | 1.25 years | 1.25 years | |||
Dividend yield | zero | zero | zero | |||
The weighted-average fair value of stock options granted was $10.80, $9.00 and $11.97 during 2004, 2003 and 2002, respectively.recognizes these attributes through paid-in-capital in accordance with SFAS 123R.
VERISIGN, INC. AND SUBSIDIARIES
NOTES TO CONSOLIDATED FINANCIAL STATEMENTS—(Continued)
DECEMBER 31, 2004, 20032007, 2006 AND 20022005
Accumulated Other Comprehensive Loss
Accumulated other comprehensive loss includes foreign currency translation adjustments and unrealized gains and losses on marketable securities classified as available-for-sale. The following table summarizesillustrates the changes ineffect on net income and net income per share on VeriSign’s Consolidated Statement of Operations, if the componentsCompany had applied the fair value recognition provisions of accumulated other comprehensive loss during 2003 and 2004:SFAS 123 to stock-based employee compensation:
Foreign Currency Translation Adjustments Gain (Loss) | Unrealized Gain (Loss) On Investments, Net of Tax | Total Accumulated Other Comprehensive Income (Loss) | ||||||||||
| (In thousands) | ||||||||||||
Balance, December 31, 2002 | $ | (4,761 | ) | $ | (3 | ) | $ | (4,764 | ) | |||
Changes | 1,454 | 1,308 | 2,762 | |||||||||
Balance, December 31, 2003 | $ | (3,307 | ) | $ | 1,305 | $ | (2,002 | ) | ||||
Changes | 4,104 | (3,513 | ) | 591 | ||||||||
Balance, December 31, 2004 | $ | 797 | $ | (2,208 | ) | $ | (1,411 | ) | ||||
| Year ended December 31, | ||||
| 2005 | ||||
| (In thousands, except share data) | ||||
Net income, as reported | $ | 428,978 | ||
Less: Credit for stock-based compensation, net of tax | (7,611 | ) | ||
Less: Stock-based compensation determined under the fair value method for all awards, net of tax | (125,777 | ) | ||
Pro forma net income | $ | 295,590 | ||
Pro forma net income per share: | ||||
Basic: | ||||
As reported | $ | 1.67 | ||
Pro forma stock-based compensation | (0.52 | ) | ||
Pro forma net income per share | $ | 1.15 | ||
Diluted: | ||||
As reported | $ | 1.63 | ||
Pro forma stock-based compensation | (0.50 | ) | ||
Pro forma net income per share | $ | 1.13 | ||
The Company uses the Monte-Carlo simulation option-pricing model to determine the fair value of market-based awards. The Monte-Carlo simulation option-pricing model takes into account the same input assumptions as the Black-Scholes model; however, it also further incorporates into the fair-value determination, the possibility that the market condition may not be satisfied and the impact of the possible differing stock price paths. Compensation costs related to awards with a market-based condition will be recognized regardless of whether the market condition is satisfied, provided that the requisite service has been provided. The stock-based compensation expense for market-based awards is recognized on a straight-line basis over the requisite service period for each such award.
Concentration of Credit Risk
Financial instruments that potentially subject VeriSign to significant concentrations of credit risk consist principally of cash, cash equivalents, short and long-termshort-term investments and accounts receivable. VeriSign maintains its cash, cash equivalents and investments in marketable securities with high quality financial institutions and, as part of its cash management process, performs periodic evaluations of the relative credit standing of these financial institutions. In addition, the portfolio of investments in marketable securities conforms to VeriSign’s policy regarding concentration of investments, maximum maturity and quality of investment. Concentration of credit risk with respect to accounts receivable is limited by the diversity of the customer base and geographic dispersion. VeriSign also performs ongoing credit evaluations of its customers and generally requires no collateral. VeriSign maintains an allowance for potential credit losses on its accounts receivable. The following table summarizes the changes in the allowance for doubtful accounts:
| 2004 | 2003 | 2002 | ||||||||||
| (In thousands) | ||||||||||||
Allowance for doubtful accounts: | ||||||||||||
Balance, beginning of year | $ | 13,993 | $ | 27,853 | $ | 24,290 | ||||||
Add: additions to allowance | 689 | 6,055 | 42,712 | |||||||||
Less: uncollectible amounts written off | (3,232 | ) | (19,915 | ) | (39,149 | ) | ||||||
Balance, end of year | $ | 11,450 | $ | 13,993 | $ | 27,853 | ||||||
Reclassifications
Certain reclassifications to VeriSign’s Consolidated Financial Statements have been made to conform to the 2004 presentation. VeriSign reclassified prior period financial statements to reflect investments in market auction preferred securities as short-term investments rather than cash and cash equivalents. VeriSign invests in market auction preferred securities with reauction periods of 90 days or less, and the maturities of the instruments underlying the market auction preferred securities are generally more than 90 days from the balance sheet date (“Securities”). VeriSign previously considered investments in Securities as cash equivalents based on the reauction period; however, VeriSign has reclassified the investments in the Securities because the maturities of
123
VERISIGN, INC. AND SUBSIDIARIES
NOTES TO CONSOLIDATED FINANCIAL STATEMENTS—(Continued)
DECEMBER 31, 2004, 20032007, 2006 AND 20022005
The following table summarizes the underlying instruments are greater than 90 days fromchanges in the balance sheet dates. Forallowance for doubtful accounts:
| 2007 | 2006 | 2005 | ||||||||||
| (In thousands) | ||||||||||||
Allowance for doubtful accounts: | ||||||||||||
Balance, beginning of year | $ | 8,083 | $ | 11,559 | $ | 10,708 | ||||||
Add: provision for doubtful accounts | 850 | (1,165 | ) | 1,041 | ||||||||
Less: write-offs, net of recoveries and other adjustments | (2,604 | ) | (2,311 | ) | (190 | ) | ||||||
Balance, end of year | $ | 6,329 | $ | 8,083 | $ | 11,559 | ||||||
Discontinued Operations
In accordance with SFAS 144, the Consolidated Balance SheetCompany reports businesses or asset groups as discontinued operations when the operations and cash flows of the business or asset group have been or will be eliminated, when the Company will not have any continuing involvement with the business or asset group after the disposal transaction, and when the Company has met the following additional six criteria:
Management with the authority to do so, commits to a plan to sell the business or asset group;
The business or asset group is available for immediate sale;
An active program to sell the business or asset group has been initiated;
The sale of the business or asset group is probable within one year;
The marketed sales value of the business or asset group is reasonable in relation to its current fair value; and
It is unlikely that the plan to sell the business or asset group will be significantly altered or withdrawn.
The Company did not have any assets held for sale as of December 31, 2003, VeriSign has reclassified Securities of $92.2 million from cash equivalents to short-term investments.
In addition, VeriSign previously excluded purchases and sales of Securities from the Consolidated Statements of Cash Flows because the Securities were classified as cash equivalents. Purchases of investments in the Consolidated Statements of Cash Flows for the years ended December 31, 2004, 2003 and 2002 have been adjusted to include $53.8 million, $180.8 million and $29.0 million of purchases of Securities, and proceeds from maturities and sales of investments for the years ended December 31, 2004, 2003 and 2002 have been adjusted to include $146.0 million, $116.4 million and $13.9 million of sales and maturities of Securities.2007.
Recently Issued Accounting Pronouncements
In December 2004,2007, the FASB issued SFAS No 160 (“SFAS 160”), “Non-controlling Interests in Consolidated Financial Statements, an amendment of Accounting Research Bulletin No. 51,” which requires all entities to report minority interests in subsidiaries as equity in the consolidated financial statements, and requires that transactions between entities and non-controlling interests be treated as equity. SFAS 160 is effective for fiscal years beginning on or after December 15, 2008 and will be applied prospectively. The Company is currently evaluating the effect of SFAS 160, and the impact it will have on its financial position and results of operations.
In December 2007, the FASB issued SFAS No. 123R, “Share-Based Payment,” which requires the measurement of all employee share-based payments to employees, including grants of employee stock options, using a fair-value-based method and the recording of such expense in their consolidated statements of operations. The accounting provisions of 141(R) (“SFAS 123R are effective for reporting periods beginning after June 15, 2005. VeriSign is required to adopt SFAS 123R in the third quarter of 2005. The pro forma disclosures previously permitted under SFAS 123 no longer will be an alternative to financial statement recognition. See “Stock Compensation Plans and Unearned Compensation” above for further information regarding the pro forma net income (loss) and net income (loss) per share amounts, for 2002 through 2004, as if VeriSign had used a fair-value-based method similar to the methods required under SFAS 123R to measure compensation expense for employee stock incentive awards. Although the Company has not yet determined whether the adoption of SFAS 123R will result in amounts that are similar to the current pro forma disclosures under SFAS 123, VeriSign is evaluating the requirements under SFAS 123R and expect the adoption to have a significant adverse impact on their consolidated statements of operations and net income per share.
In December 2004, the FASB issued FASB Staff Position No. FAS 109-1 (“FAS 109-1”141R”), “Application of FASB Statement No. 109, “Accounting for Income Taxes,” to the Tax Deduction on Qualified Production Activities Provided by the American Jobs Creation Act of 2004.Business Combinations,” The AJCA introduces a special 9% tax deduction on qualified production activities. FAS 109-1 clarifies that this tax deduction should bewhich will significantly change how business acquisitions are accounted for and will impact financial statements both on the acquisition date and in subsequent periods. Some of the changes, such as the accounting for contingent consideration, will introduce more volatility into earnings, and may impact a special tax deduction in accordance withcompany's acquisition strategy. SFAS 109. Pursuant to the AJCA, VeriSign141R is effective for fiscal years beginning on or after December 15, 2008 and will not be able to claim this tax benefit until the first quarter of fiscal 2006.applied prospectively. The Company does not expectis currently evaluating the adoptioneffect of these new tax provisions toSFAS 141R, and the impact it will have a material impact on their consolidatedits financial position and results of operations or cash flows.
In December 2004, the FASB issued FASB Staff Position No. FAS 109-2 (“FAS 109-2”), “Accounting and Disclosure Guidance for the Foreign Earnings Repatriation Provision within the American Jobs Creations Act of 2004.” The AJCA introduces a limited time 85% dividends received deduction on the repatriation of certain foreign earnings to a U.S. taxpayer (repatriation provision), provided certain criteria are met. FAS 109-2 provides accounting and disclosure guidance for the repatriation provision. The Company does not expect the adoption of these new tax provisions to have a material impact on their consolidated financial position, results of operations or cash flows.
In March 2004, the FASB issued EITF Issue No. 03-1 (“EITF 03-1”), “The Meaning of Other-Than-Temporary Impairment and Its Application to Certain Investments” which provided new guidance for assessing impairment losses on investments. Additionally, EITF 03-1 includes new disclosure requirements for investmentsoperations.
VERISIGN, INC. AND SUBSIDIARIES
NOTES TO CONSOLIDATED FINANCIAL STATEMENTS—(Continued)
DECEMBER 31, 2004, 20032007, 2006 AND 20022005
that are deemed to be temporarily impaired. In September 2004,February 2007, the FASB delayedissued SFAS No. 159 (“SFAS 159”), “The Fair Value Option for Financial Assets or Financial Liabilities,” which provides companies with an option to report selected financial assets and liabilities at fair value. The objective is to reduce both complexity in accounting for financial instruments and the accountingvolatility in earnings caused by measuring related assets and liabilities differently. SFAS 159 also establishes presentation and disclosure requirements designed to facilitate comparisons between companies that choose different measurement attributes for similar types of assets and liabilities. SFAS 159 is effective as of the beginning of an entity’s first fiscal year beginning after November 15, 2007. Early adoption is permitted as of the beginning of the previous fiscal year provided that the entity makes that choice in the first 120 days of that fiscal year and also elects to apply the provisions of EITF 03-1; however the disclosure requirements remain effective for annual periods ending after June 15, 2004. VeriSignStatement No. 157 (“SFAS 157”), “Fair Value Measurements.” The Company does not expect the adoption of EITF 03-1 willSFAS 159 to have a material impact on its consolidated financial position and results of operations or cash flows.operations.
In September 2006, the FASB issued SFAS 157, which defines fair value, establishes guidelines for measuring fair value and expands disclosures regarding fair value measurements. SFAS 157 does not require any new fair value measurements but rather eliminates inconsistencies in guidance found in various prior accounting pronouncements. SFAS 157 is effective for fiscal years beginning after November 15, 2007. Earlier adoption is permitted, provided the company has not yet issued financial statements, including for interim periods, for that fiscal year. On February 12, 2008, the FASB issued FSP SFAS 157-2,“Effective Date of FASB Statement No. 157,”which defers the effective date for adoption of fair value measurements for nonfinancial assets and liabilities to fiscal years beginning after November 15, 2008. The Company does not expect the adoption of SFAS 157 to have a material impact on its financial position and results of operations.
Note 2. Joint Ventures
On January 31, 2007, VeriSign entered into two joint venture agreements with Fox Entertainment (“Fox”), a subsidiary of News Corporation, to provide mobile entertainment to consumers on a global basis. Under the terms of the agreements, Fox owns a 51% interest and VeriSign owns a 49% interest in the joint ventures. One of the joint ventures, Netherlands Mobile Holdings, C.V., is based in the Netherlands, and the other, US Mobile Holdings LLC, is based in the United States. VeriSign contributed 51% of its ownership interest in its wholly owned subsidiary Jamba’s business-to-consumer business to the Netherlands joint venture and Fox contributed its Fox Mobile Entertainment assets to the U.S.-based joint venture. Fox paid VeriSign approximately $192.4 million in cash for the divestiture of 51% of its ownership interest in Jamba and VeriSign paid Fox approximately $4.9 million in cash for its contribution of Fox Mobile Entertainment assets. The Company recognized a gain of approximately $68.2 million upon the divestiture of its majority ownership interest in Jamba and recorded its interests in the joint ventures as investments in unconsolidated entities in accordance with the equity method. As of December 31, 2007, the Company had a balance of $109.8 million in investments in unconsolidated entities related to the joint ventures. The Company’s Consolidated Financial Statements for the year ended December 31, 2007, includes one month of Jamba’s consolidated activity. During the third quarter, the Company invested an additional amount of $17.2 million pursuant to capital calls approved by the board of managers of the ventures, and recorded the amount as investments in unconsolidated entities. The purpose of the capital calls was to fund the ongoing business and working capital needs of the joint ventures. Under the terms of the joint venture agreements, the Company has agreed to invest an additional amount of approximately $15.6 million in the two joint ventures. In 2007, the Company provided a working capital loan of $15.0 million under a promissory note to the joint ventures. This loan is outstanding as of December 31, 2007, and is included in Other assets.
In connection with the joint ventures, VeriSign and Fox entered into various put and call agreements. VeriSign has the option to sell (“the put”) all of its interests in the joint ventures to Fox at particular times within
125
VERISIGN, INC. AND SUBSIDIARIES
NOTES TO CONSOLIDATED FINANCIAL STATEMENTS—(Continued)
DECEMBER 31, 2007, 2006 AND 2005
five years of the date of the agreements at prices determined pursuant to the terms of the put and call agreements. Fox has the option to purchase (“the call”) all of VeriSign’s interests in the joint ventures at particular times within five years of the date of the agreements at a price determined pursuant to the put and call agreements. The Company calculated the initial fair value of its written call options to be $10.9 million using the Black-Scholes option-pricing model. The Company has recorded the fair value of the call options within other long-term liabilities, and marks-to-market the call options at each reporting period. For the year ended December 31, 2007, the Company recorded an unrealized gain of $10.9 million, on joint venture call options within Other income, net. As of December 31, 2007, the Company determined that the call options did not have any value. The put options are not recorded in the Consolidated Financial Statements as they do not meet the definition of a derivative instrument under SFAS 133.
Note 3. Business Combinations
2007 Acquisitions:
VeriSign did not acquire any businesses in 2007.
2006 Acquisitions:
Jamba!inCode
In June 2004,On November 30, 2006, VeriSign completed its acquisition of Jamba!inCode Telecom Group, Inc. (“inCode”), a privately held provider of mobile content services.San Diego, California-based wireless and technology consulting company. VeriSign purchased inCode to give its customers a competitive edge in bringing advanced mobility solutions to market. VeriSign’s purchase price of $266.2$41.8 million for all the outstanding shares of capital stock of Jamba! consisted of approximately $178$40.2 million in cash consideration approximately $5.9and $1.6 million in direct transaction costs,costs. Immediately upon closing, VeriSign paid $21.7 million of inCode’s outstanding principal debt and assumed liabilities. In allocating the remainder in VeriSign common stock. The acquisition has been accounted for as a purchase and, accordingly, the total purchase price has been allocated to the tangible and intangible assets acquired and the liabilities assumed based on their respectiveestimated fair values, on the acquisition date. Jamba!’s results of operations have been included in the consolidated financial statements from its date of acquisition. As a result of the acquisition of Jamba!, VeriSign recorded goodwill of $187.8$27.8 million, andother intangible assets of $83.9$39.6 million which have been assigned toand assumed net liabilities of $25.6 million. At the Communications Services Group segment. The goodwill representsdate of acquisition, the excess value over both tangible and intangible assets acquired. The goodwill in this transaction is attributable to the anticipated ability to offer carriers a comprehensive wireless data utility by combining Jamba!’s current capabilities with VeriSign’s existing communications services platforms. None of the goodwill for Jamba! is deductible for tax purposes. The overall weighted-average life of the identified amortizable intangible assets acquired in the purchase of Jamba!inCode was 7.1 years. inCode is 4.2 years. These identified intangible assets will be amortized on a straight-line basis over their useful lives.
The allocation ofincluded in the purchase price to the assets acquired and liabilities assumed based on the estimated fair value of Jamba! was as follows:
| June 3, 2004 | Amortization Period | |||||
| (In thousands) | (Years) | |||||
Current assets | $ | 56,220 | — | |||
Long-term assets | 1,014 | — | ||||
Goodwill | 187,777 | — | ||||
Carrier relationships | 27,700 | 6 | ||||
Subscription base | 25,110 | 2 | ||||
Non-compete agreements | 10,520 | 2 | ||||
Trade name | 17,760 | 6 | ||||
Technology in place | 2,570 | 3 | ||||
Internally developed content | 210 | 3 | ||||
Total assets acquired | 328,881 | |||||
Current liabilities | (29,233 | ) | ||||
Deferred income tax liabilities | (33,493 | ) | ||||
Total liabilities assumed | (62,726 | ) | ||||
Net assets acquired | $ | 266,155 | ||||
VERISIGN, INC. AND SUBSIDIARIES
NOTES TO CONSOLIDATED FINANCIAL STATEMENTS—(Continued)
DECEMBER 31, 2004, 2003 AND 2002Communication Services Group segment.
GuardentGeoTrust
In February 2004,On September 1, 2006, VeriSign completed its acquisition of Guardent,GeoTrust, Inc. (“GeoTrust”), a privately heldNeedham, Massachusetts-based privately-held provider of managed security services. VeriSign paiddigital certificates and identity verification solutions. VeriSign’s purchase price of $127.4 million consisted of approximately $135$125.3 million for all the outstanding shares of capital stock of Guardent, of which approximately $65 million was in cash consideration and the remainder$2.1 million in VeriSign common stock. The acquisition has been accounted for as a purchase and, accordingly,direct transaction costs. In allocating the total purchase price has been allocated to the tangible and intangible assets acquired and the liabilities assumed based on their respectiveestimated fair values, on the acquisition date. Guardent’s results of operations have been included in the consolidated financial statements from its date of acquisition. As a result of the acquisition of Guardent, VeriSign recorded goodwill of $114.1$100.1 million, andother intangible assets of $22.2$28.3 million, which have been assigned toassumed net liabilities of $2.2 million and in-process research and development (“IPR&D”) expense of $1.2 million. At the Internet Services Group segment. The goodwill representsdate of acquisition, the excess value over both tangible and intangible assets acquired. VeriSign attributes the goodwill in this transaction to management’s belief that the acquisition is a strategic fit with its existing business and will create an unmatched breadth of service and consulting offerings, delivered from a global infrastructure that is highly scalable and offers reliable, state-of-the-art managed security services. None of the goodwill for Guardent is deductible for tax purposes. The overall weighted-average life of the identified amortizable intangible assets acquired in the purchase of GuardentGeoTrust was 5.4 years. GeoTrust is 4.5 years. These identified intangible assets will be amortized on a straight-line basis over their useful lives.
The following table summarizesincluded in the estimated fair value of the assets acquired and liabilities assumed at the date of acquisition:Internet Services Group segment.
| February 27, 2004 | Amortization Period | |||||
| (In thousands) | (Years) | |||||
Current assets | $ | 5,139 | — | |||
Property and equipment, net | 4,735 | — | ||||
Other long-term assets | 1,096 | — | ||||
Goodwill | 114,069 | — | ||||
Customer contracts and relationship | 13,200 | 5 – 6 | ||||
Non-compete agreement | 5,700 | 3 | ||||
Technology in place | 3,200 | 1 – 3 | ||||
Backlog | 100 | 1 | ||||
Total assets acquired | 147,239 | |||||
Total liabilities assumed | (6,017 | ) | ||||
Net assets acquired | $ | 141,222 | ||||
H.O. Systems, Inc.m-Qube
In February 2002,On May 1, 2006, VeriSign completed its acquisition of H.O. Systems,m-Qube, Inc. (“m-Qube”), a provider of billingWatertown, Massachusetts-based privately-held mobile channel enabler that helps companies develop, deliver and customer care solutions to wireless telecommunications carriers, to complement VeriSign’s acquisition of Illuminet Holdings, Inc., a provider of telecommunicationsbill for mobile content, applications and messaging services. VeriSign paid approximately $350 million in cash for all of the outstanding stock of LiveWire Corp., H.O. Systems’ parent company, for the purchase of H.O. Systems. The total purchase price has been allocatedpurchased m-Qube to the tangibleprovide an end-to-end technology platform, carrier relationships and intangible assets acquiredvalue-added services to consumer facing companies and the liabilities assumed based on their respective fair values on the acquisition date. VeriSign recorded goodwill of approximately $212.9 million and other intangible assets of approximately $210.3 million as a result of this acquisition. VeriSign subsequently reduced the carrying value of these amounts as a result of their annual impairment tests in accordance with SFAS No. 142. Other intangible assets, which includes installed customer
VERISIGN, INC. AND SUBSIDIARIES
NOTES TO CONSOLIDATED FINANCIAL STATEMENTS—(Continued)
DECEMBER 31, 2004, 20032007, 2006 AND 20022005
base, technology in placeservice providers to use wireless broadband as a content delivery, marketing and trade names, are being amortized over a six-year period. Goodwill is not amortized but is being testedcommunications channel. VeriSign’s purchase price of $269.2 million for impairment at least annually. H.O. Systems’ results of operations have been included in the consolidated financial statements from its date of acquisition. The goodwill has been assigned to the Communications Services Group segment. Portionsall of the outstanding capital stock and vested options of m-Qube consisted of approximately $266.0 million in cash consideration and $2.4 million in direct transaction costs. VeriSign also assumed $0.8 million of unvested stock options of m-Qube. In allocating the purchase price based on estimated fair values, VeriSign recorded goodwill andof $160.0 million, other intangible assets for H.O. Systems are deductible for tax purposes. Theof $93.6 million, net tangible assets of $11.0 million and IPR&D expense of $4.6 million. At the date of acquisition, the overall weighted-average life of the identified amortizable intangible assets acquired in the purchase of H.O. Systemsm-Qube was 5.3 years. m-Qube is 6.0 years. These identified intangible assets will be amortized on a straight-line basis over their useful lives.
The following table summarizesincluded in the estimated fair value of the assets acquired and liabilities assumed at the date of acquisition:Communications Services Group segment.
| February 5, 2002 | Amortization Period | |||||
| (In thousands) | (Years) | |||||
Current assets | $ | 29,791 | — | |||
Property and equipment, net | 28,513 | — | ||||
Other long-term assets | 201 | — | ||||
Goodwill | 212,923 | — | ||||
Customer base | 110,040 | 6 | ||||
Technology in place | 98,380 | 6 | ||||
Trade name | 1,850 | 6 | ||||
Total assets acquired | 481,698 | |||||
Current liabilities | (36,022 | ) | ||||
Deferred income tax liabilities | (84,542 | ) | ||||
Other long-term liabilities | (16,538 | ) | ||||
Total liabilities assumed | (137,102 | ) | ||||
Net assets acquired | $ | 344,596 | ||||
Network Solutions Domain Name Registrar BusinessKontiki
On November 25, 2003,March 14, 2006, VeriSign completed its acquisition of Kontiki, Inc. completed(“Kontiki”), a Sunnyvale, California-based provider of broadband content services. VeriSign purchased Kontiki to expedite large file downloads on the saleInternet. VeriSign’s purchase price of its Network Solutions domain name registrar business to Pivotal Private Equity.$59.6 million for all of the outstanding capital stock and vested options of Kontiki consisted of approximately $57.1 million in cash consideration and $2.3 million in direct transaction costs. VeriSign received $97.6also assumed $0.2 million of unvested stock options of Kontiki. In allocating the purchase price based on estimated fair values, VeriSign recorded goodwill of $23.9 million, other intangible assets of $23.5 million, net tangible assets of $2.2 million and IPR&D expense of $10.0 million. At the date of acquisition, the overall weighted-average life of the identified amortizable intangible assets acquired in the purchase of Kontiki was 6.4 years. Kontiki is included in the Communications Services Group segment.
3united Mobile Solutions
On February 28, 2006, VeriSign completed its acquisition of 3united Mobile Solutions ag (“3united”), a Vienna, Austria-based provider of wireless application services. VeriSign purchased 3united to provide anticipated ability to bundle different applications to engage and drive consumers to higher value services such as content, chat or mCommerce. VeriSign’s purchase price of $71.2 million for approximately 99.8% of the outstanding capital stock of 3united consisted of approximately $70.1 million in cash consideration, consistingand $1.1 million in direct transaction costs. In allocating the purchase price based on estimated fair values, VeriSign recorded goodwill of $57.6$48.3 million, other intangible assets of $26.7 million and assumed net liabilities of $3.8 million. Under Austrian tax law a portion of the goodwill is deductible for tax purposes. At the date of acquisition, the overall weighted-average life of the identified amortizable intangible assets acquired in the purchase of 3united was 6.6 years. 3united is included in the Communications Services Group segment.
CallVision
On January 24, 2006, VeriSign completed its acquisition of CallVision, Inc. (“CallVision”), a Seattle, Washington-based privately-held provider of online analysis applications for mobile communications customers. VeriSign purchased CallVision to provide online customer self-service with a single view of billing across multiple systems and vendors. VeriSign’s purchase price of $38.7 million for all of the outstanding capital stock and vested options of CallVision consisted of approximately $38.2 million in cash consideration and $0.4 million in direct transaction costs. VeriSign also assumed $0.1 million of unvested stock options of CallVision. In allocating the purchase price based on estimated fair values, VeriSign recorded goodwill of $18.0 million, other intangible assets of $12.0 million, net tangible assets of $8.2 million and IPR&D expense of $0.5 million. At the date of acquisition, the overall weighted-average life of the identified amortizable intangible assets acquired in the purchase of CallVision was 6.3 years. CallVision is included in the Communications Services Group segment.
127
VERISIGN, INC. AND SUBSIDIARIES
NOTES TO CONSOLIDATED FINANCIAL STATEMENTS—(Continued)
DECEMBER 31, 2007, 2006 AND 2005
Other Acquisitions
In addition to the above, VeriSign also acquired two other companies during 2006 for an aggregate purchase price of approximately $25.4 million. These acquisitions were not material on an individual basis or in the aggregate.
All of the Company’s 2006 acquisitions results of operations for periods prior to the date of acquisition were not material on an individual basis or in the aggregate when compared with VeriSign’s consolidated results.
2005 Acquisitions:
Retail Solutions International
On October 17, 2005, VeriSign completed its acquisition of Retail Solutions International, Inc. (“RSI”), a Lincoln, Rhode Island-based privately-held provider of operational point-of-sale data to the retail industry. VeriSign purchased RSI to increase the scope of services it offers to retail supply chain participants and enhances the infrastructure it has been developing in the RFID/EPC and pharmaceutical supply chain markets to deliver real time, relevant data for decision making. VeriSign’s purchase price of $25.2 million for all of the outstanding capital stock and vested options of RSI consisted of approximately $23.2 million in cash consideration and $0.4 million in direct transaction costs. VeriSign also assumed unvested stock options of RSI with a fair value of $1.6 million. In allocating the purchase price based on estimated fair values, VeriSign recorded goodwill of $17.1 million, other intangible assets of $6.1 million, net tangible assets of $1.7 million and IPR&D expense of $0.3 million. At the date of acquisition, the overall weighted-average life of the identified amortizable intangible assets acquired in the purchase of RSI was 5.3 years. RSI is included in the Internet Services Group segment. After the acquisition was completed, VeriSign renamed RSI as Retail Data Solutions (“RDS”).
On December 31, 2007, the Company sold its RDS business unit, which specialized in intelligent supply chain services, for $10.2 million in considerations. The sale price included $6.4 million in cash and $3.8 million in preferred stock of the acquiring company. The Company has recorded the preferred stock as a $40long-term investment. As part of the transaction, the Company recorded a $3.0 million senior subordinated note that bears interest at 7% per annumgain.
Moreover Technologies
On October 4, 2005, VeriSign completed its acquisition of Moreover Technologies, Inc. (“Moreover”), a San Francisco, California-based privately-held wholesale aggregator of real-time content for Web sites, search engines and enterprise customers. VeriSign purchased Moreover to offer bloggers, publishers, enterprises and Web portals a more intelligent and scalable, real-time content platform. VeriSign’s purchase price of $29.7 million for all of the first three yearsoutstanding capital stock of Moreover consisted of approximately $28.7 million in cash consideration and 9% per annum thereafter$1.0 million in direct transaction costs. In allocating the purchase price based on estimated fair values, VeriSign recorded goodwill of $13.9 million, other intangible assets of $10.4 million, net tangible assets of $4.1 million and matures five years fromIPR&D expense of $1.3 million. At the date of closing. The principal and interest are due upon maturity. This note is subordinated to a term loan made by ABLECO Finance toacquisition, the Network Solutions businessoverall weighted-average life of the identified amortizable intangible assets acquired in the principal amountpurchase of approximately $40 million as of the closing date. VeriSign recorded the present value of the note using a 10% market interest rate. VeriSign retained a 15% equity stakeMoreover was 5.5 years. Moreover is included in the Network Solutions business.Internet Services Group segment.
The Network Solutions business provides domain name registrations,siteRock
On October 3, 2005, VeriSign Japan K.K. (“VSJ”) completed its acquisition of siteRock K.K. (“siteRock”), a Tokyo, Japan-based privately-held remote network monitoring and value added services such as business email, websites, hostingoutage managing and other web presence services. Approximately 580 former VeriSign employees became employed by the Network Solutions business as a result of the transaction. In connection with the sale, VeriSign assigned the lease for its facility located in Drums, Pennsylvania to the purchaser and subleased certain facilities located in Herndon, Virginia to the purchaser.handling firm. VSJ
VERISIGN, INC. AND SUBSIDIARIES
NOTES TO CONSOLIDATED FINANCIAL STATEMENTS—(Continued)
DECEMBER 31, 2004, 20032007, 2006 AND 20022005
purchased siteRock to provide service and consulting offerings that offer managed security services. VSJ paid approximately $53.3 million in cash for all of the outstanding capital stock and certain transaction related expenses of siteRock. In allocating the purchase price based on estimated fair values, VSJ recorded goodwill of $36.4 million, other intangible assets of $11.8 million and net tangible assets of $5.1 million. At the date of acquisition, the overall weighted-average life of the identified amortizable assets acquired in the purchase of siteRock was approximately 4.5 years. siteRock is included in the Internet Services Group segment.
iDefense
On July 13, 2005, VeriSign completed its acquisition of iDefense, Inc. (“iDefense”), a Reston, Virginia-based privately held company. iDefense is a leading security intelligence services company providing detailed intelligence on network-based threats, vulnerabilities and malicious code. VeriSign paid approximately $37.8 million in cash for all the outstanding capital stock, vested stock options and certain transaction related expenses of iDefense and assumed unvested stock options. In allocating the purchase price based on estimated fair values, VeriSign recorded goodwill of $34.7 million, other intangible assets of $5.7 million, assumed net liabilities of $4.4 million and IPR&D expenses of $1.8 million. At the date of acquisition, the overall weighted average life of the identified amortizable assets acquired in the purchase of iDefense was 5.6 years. iDefense is included in the Internet Services Group segment.
LightSurf Technologies
On April 6, 2005, VeriSign completed its acquisition of LightSurf Technologies, Inc. (“LightSurf”), a Santa Cruz, California-based privately held provider of multimedia messaging and interoperability solutions for the wireless market. VeriSign paid approximately $275.4 million in common stock for all of the outstanding capital stock, warrants, vested stock options and certain transaction-related expenses and assumed unvested stock options. In allocating the purchase price based on estimated fair values, VeriSign recorded goodwill of $218.6 million, other intangible assets of $40.1 million, net tangible assets of $12.4 million and IPR&D expenses of $4.3 million. At the date of acquisition, the overall weighted-average life of the identified amortizable assets acquired in the purchase of LightSurf was 3.2 years. LightSurf is included in the Communications Services Group segment.
Other Acquisitions
In addition to the above, VeriSign also acquired one other company in 2005 for purchase price of approximately $15.0 million. The acquisition was not material on an individual basis.
All of the Company’s 2005 acquisitions results of operations for periods prior to the date of acquisition were not material on an individual basis or in the aggregate when compared with VeriSign’s consolidated results.
Note 4. Discontinued Operations
VeriSign accounts for discontinued operations when all criteria of SFAS 144 are met. Consequently, the results of operations have been excluded from the Company’s results from continuing operations for all periods presented and have instead been presented as discontinued operations.
129
VERISIGN, INC. AND SUBSIDIARIES
NOTES TO CONSOLIDATED FINANCIAL STATEMENTS—(Continued)
DECEMBER 31, 2007, 2006 AND 2005
The following table summarizespresents the proceeds received,revenues and the components of total net income from discontinued operations, net of tax:
| Year Ended December 31, | ||||||||||||
| 2007 | 2006 | 2005 | ||||||||||
| (In thousands) | ||||||||||||
Revenues | $ | 11,868 | $ | 12,162 | $ | 59,669 | ||||||
Operating income from discontinued operations | $ | 5,847 | $ | 7,078 | $ | 24,735 | ||||||
Income tax expense | (2,026 | ) | (2,363 | ) | (8,255 | ) | ||||||
Net income from discontinued operations | 3,821 | 4,715 | 16,480 | |||||||||
Gain on sale of discontinued operations, net of tax | 1,357 | — | 250,573 | |||||||||
Total net income from discontinued operations, net of tax | $ | 5,178 | $ | 4,715 | $ | 267,053 | ||||||
The Company did not have any assets held for sale as of December 31, 2007. The following table presents the carrying amounts of major classes of assets and liabilities divestedrelating to discontinued operations as of December 31, 2006:
| December 31, 2006 | |||
| (In thousands) | |||
Assets: | |||
Cash and cash equivalents | $ | 23,035 | |
Accounts receivable, net | 11,201 | ||
Prepaid expenses and other current assets | 95 | ||
Deferred tax assets | 2,330 | ||
Current assets of discontinued operations | 36,661 | ||
Long-term assets | 7,000 | ||
Total assets of discontinued operations | $ | 43,661 | |
Liabilities: | |||
Accounts payable and accrued liabilities | $ | 18,068 | |
Deferred revenues | 6,533 | ||
Current liabilities of discontinued operations | 24,601 | ||
Total liabilities of discontinued operations | $ | 24,601 | |
Jamba Service business
On September 1, 2007, the Company sold its wholly-owned Jamba Service GmbH subsidiary (“Jamba Service”), which marketed insurance and theextended service warranties to consumers for mobile electronic equipment and products, for $12.8 million in cash and recorded a net gain recorded by VeriSign on the closing dateof $1.4 million. Jamba Service was considered a discontinued operation and was part of the Network Solutions sale:Communications Services Group segment.
| November 25, 2003 | ||||
| (In thousands) | ||||
Proceeds from sale of Network Solutions: | ||||
Cash received | $ | 57,621 | ||
Present value of note outstanding | 33,916 | |||
| $ | 91,537 | |||
Assets and liabilities divested in sale of Network Solutions: | ||||
Current assets | $ | 50,114 | ||
Property and equipment, net | 55,330 | |||
Goodwill | 191,313 | |||
Other long-term assets, net | 55,000 | |||
Total assets divested | 351,757 | |||
Accrued vacation | (1,526 | ) | ||
Current deferred revenue | (114,346 | ) | ||
Long-term deferred revenue | (147,210 | ) | ||
Total liabilities divested | (263,082 | ) | ||
Net assets divested | $ | 88,675 | ||
Gain on sale of Network Solutions | $ | 2,862 | ||
Payment Gateway business
The gain onOn November 18, 2005, the Company completed the sale of the Network Solutions business of $2.9 million was included in sale of business and litigation settlements on the consolidated statements of operations.
2003 Restructuring Plan
In October 2003, VeriSign announced a restructuring initiativecertain assets related to the sale of its Network SolutionsPayment Gateway business and the realignment of other business units. The initiative resulted in reductions in workforce, abandonment of excess facilities, disposals of property and equipment and other charges.
Workforce reduction. VeriSign recorded restructuring charges related to workforce reduction in accordance with SFAS No. 112, “Employers’ Accounting for Postemployment Benefits an amendment of FASB Statements No. 5 and 43” since benefits were provided pursuant to an Asset Purchase Agreement, dated October 10, 2005 (the “Agreement”), among PayPal, Inc., PayPal International Limited (collectively, “PayPal”), a formal severance plan which used a standard formulawholly owned subsidiary of paying benefits based upon tenure witheBay Inc. Under the Company. The accounting for these restructuring charges has met the four requirements of SFAS No. 112 which are: (i) the Company’s obligation relating to employees’ rights to receive compensation for future absences is attributable to employees’ services already rendered; (ii) the obligation relates to rights that vest or accumulate; (iii) payment of the compensation is probable; and (iv) the amount can be reasonably estimated. The 2003 restructuring plan resulted in a workforce reduction of approximately 100 employees across all segments in the fourth quarter of 2003. VeriSign adjusted the workforce reduction charges relating primarily to severance and fringe benefits. All severance related charges will be paid by the end of 2005.
VERISIGN, INC. AND SUBSIDIARIES
NOTES TO CONSOLIDATED FINANCIAL STATEMENTS—(Continued)
DECEMBER 31, 2004, 20032007, 2006 AND 20022005
Agreement, PayPal acquired certain assets related to VeriSign’s Payment Gateway business and assumed certain liabilities related thereto for $370 million in cash. The Payment Gateway business was part of the Internet Services Group segment.
In connection with the sale of the Payment Gateway business, the Company entered into a Transitional Service Agreement (“TSA”) with PayPal to provide certain transitional network and customer support services. The related fees were recorded as a direct reduction to the respective costs and expenses included in discontinued operations. The expected cash flows under the TSA did not represent a significant continuation of the direct cash flows of the disposed payment gateway business. In April 2006, PayPal elected to terminate the customer support services provided by VeriSign under the TSA. In September 2006, PayPal elected to terminate the billing services, production services and other transitional services provided under the TSA.
The following table presents the calculation of the gain on the sale of the Payment Gateway business:
| Year Ended December 31, 2005 | |||
| (In thousands) | |||
Proceeds from sale | $ | 370,000 | |
Transaction costs | 2,778 | ||
Net proceeds | 367,222 | ||
Net liabilities assumed by PayPal | 7,600 | ||
Gain on sale before income taxes | 374,822 | ||
Income tax expense | 124,249 | ||
Gain on sale of discontinued operations, net of tax | $ | 250,573 | |
Note 5. Restructuring, Impairments and Other Charges (Reversals), Net
A comparison of restructuring, impairments and other charges (reversals), net:
| Year Ended December 31, | ||||||||||||
| 2007 | 2006 | 2005 | ||||||||||
| (In thousands) | ||||||||||||
2007 restructuring plan charges | $ | 29,615 | $ | — | $ | — | ||||||
2002 and 2003 restructuring reversals, net | (175 | ) | (6,420 | ) | (3,744 | ) | ||||||
Total restructuring charges (reversals), net | 29,440 | (6,420 | ) | (3,744 | ) | |||||||
Impairments and other charges | 80,670 | 1,949 | 22,447 | |||||||||
Total restructuring, impairments and other charges (reversals), net | $ | 110,110 | $ | (4,471 | ) | $ | 18,703 | |||||
2007 Restructuring Plan
In January 2007, VeriSign initiated a restructuring plan to execute a company-wide reorganization replacing the previous business unit structure with a new combined worldwide sales and services team, and an integrated development and products organization. The restructuring plan included workforce reductions, abandonment of excess facilities, and other exit costs. To date, VeriSign has recorded $29.6 million in restructuring charges under its 2007 restructuring plan.
131
VERISIGN, INC. AND SUBSIDIARIES
NOTES TO CONSOLIDATED FINANCIAL STATEMENTS—(Continued)
DECEMBER 31, 2007, 2006 AND 2005
Workforce reduction: The 2007 restructuring plan resulted in a workforce reduction of approximately 350 employees across both segments which started in the first quarter of 2007, followed by the next four quarters. All severance related charges will be paid by the end of the first quarter of 2008.
Excess facilities.facilities: Excess facilities restructuring charges take into account the fair value of lease obligations of the abandoned space, including the potential for sublease income. Estimating the amount of sublease income requires management to make estimates for the space that will be rented, the rate per square foot that might be received and the vacancy period of each property. These estimates could differ materially from actual amounts due to changes in the real estate markets in which the properties are located, such as the supply of office space and prevailing lease rates. Changing market conditions by location and considerable work with third-party leasing companies require us to periodically review each lease and change our estimates on a prospective basis, as necessary. VeriSign recorded additional charges for excess facilities located primarily in the United States and Europe that were either abandoned or downsized relating to lease terminations and non-cancelable lease costs primarily related to the Network Solutions segment. In 2004, VeriSign recorded adjustments to its excess facilities accrual due to a change in lease obligations for a facility.costs.
Exit costs.Other exit costs: VeriSign recorded other exit costs primarily relating to the realignment of its Communications Services Group segment.organization, including consulting fees related to the strategic and organizational structure.
Other charges. Property2003 and equipment that was disposed of or abandoned in 2004 consisted primarily of obsolete telecommunications computer software and other equipment2002 Restructuring Plans
In November 2003, VeriSign announced a restructuring initiative related to the Communications Services Group segment.
Restructuringsale of its Network Solutions business and the realignment of other business units. The restructuring plan resulted in reductions in workforce, abandonment of excess facilities, disposals of property and equipment and other charges recorded during the year ended December 31, 2004 and 2003 relating to the 2003 restructuring plan are as follows:
Year Ended December 31, | ||||||
| 2004 | 2003 | |||||
| (In thousands) | ||||||
Workforce reduction | $ | 1,053 | $ | 5,724 | ||
Excess facilities | 2,749 | 28,303 | ||||
Exit costs | 956 | 1,039 | ||||
Subtotal | 4,758 | 35,066 | ||||
Other charges | 20,287 | 19,086 | ||||
Total restructuring and other charges | $ | 25,045 | $ | 54,152 | ||
VERISIGN, INC. AND SUBSIDIARIES
NOTES TO CONSOLIDATED FINANCIAL STATEMENTS—(Continued)
DECEMBER 31, 2004, 2003 AND 2002
As of December 31, 2004, the accrued liability associated with the 2003 restructuring plan was $22.4 million and consisted of the following:
| Accrued Restructuring Costs at December 31, 2003 | Gross Restructuring and Other Charges | Reversals and Adjustments to Restructuring Charges | Net Restructuring and Other Charges | Restructuring Accrual Related to Acquisitions | Non-Cash Reductions to the Accrual | Cash Payments | Accrued Restructuring Costs at December 31, 2004 | ||||||||||||||||||||
| (In thousands) | |||||||||||||||||||||||||||
Workforce reduction | $ | 5,396 | $ | 3,383 | $ | (2,330 | ) | $ | 1,053 | $ | — | $ | (25 | ) | $ | (5,085 | ) | $ | 1,339 | ||||||||
Excess facilities | 26,392 | 4,270 | (1,521 | ) | 2,749 | 311 | 85 | (8,851 | ) | 20,686 | |||||||||||||||||
Exit costs | — | 956 | — | 956 | — | 1 | (849 | ) | 108 | ||||||||||||||||||
Subtotal | $ | 31,788 | $ | 8,609 | $ | (3,851 | ) | $ | 4,758 | $ | 311 | $ | 61 | $ | (14,785 | ) | $ | 22,133 | |||||||||
Other charges | 564 | 20,526 | (239 | ) | 20,287 | — | (20,037 | ) | (511 | ) | 303 | ||||||||||||||||
Total restructuring and other charges | $ | 32,352 | $ | 29,135 | $ | (4,090 | ) | $ | 25,045 | $ | 311 | $ | (19,976 | ) | $ | (15,296 | ) | $ | 22,436 | ||||||||
Included in current portion of accrued restructuring costs | $ | 11,835 | $ | 8,711 | |||||||||||||||||||||||
Included in long term restructuring costs | $ | 20,517 | $ | 13,725 | |||||||||||||||||||||||
2002 Restructuring Plancharges.
In April 2002, VeriSign announced plans to restructure its operations to rationalize, integrate and align resources. This restructuring plan included workforce reductions, abandonment of excess facilities, write-off of abandoned property and equipment and other charges.
Workforce reduction. VeriSign’s 2002The following table presents the consolidated restructuring plan resulted in acharges associated with all the restructuring plans:
| Year Ended December 31, | |||||||||||
| 2007 | 2006 | 2005 | |||||||||
| (In thousands) | |||||||||||
Workforce reduction | $ | 20,497 | $ | (107 | ) | $ | (787 | ) | |||
Excess facilities | 4,699 | (6,300 | ) | (2,882 | ) | ||||||
Other exit costs | 4,244 | (13 | ) | (75 | ) | ||||||
Total restructuring charges (reversals) | $ | 29,440 | $ | (6,420 | ) | $ | (3,744 | ) | |||
For the year ended December 31, 2007, approximately $2.3 million of the workforce reduction of approximately 400 employees across certain business functions, operating units, and geographic regions. Workforce reduction charges related primarily to severance and fringe benefits.
Excess facilities. Excess facilities restructuring charges take into account the fair value of lease obligations of the abandoned space, including the potentialstock-based compensation for sublease income. Estimating the amount of sublease income requires management to make estimates for the space that will be rented, the rate per square foot that might be received and the vacancy period of each property. These estimates could differ materially from actual amounts due to changes in the real estate markets in which the properties are located, such as the supply of office space and prevailing lease rates. Changing market conditions by location and considerable work with third-party leasing companies require us to periodically review each lease and change our estimates on a prospective basis, as necessary. VeriSign recorded charges and adjustments for excess facilities that were either abandoned or downsized relating to lease terminations and non-cancelable lease costs.
Exit costs. VeriSign recorded other exit costs consisting of the write-off of prepaid license fees associated with products that were originally intended to be incorporated into VeriSign’s product offerings but were subsequently abandoned as a result of the decision to restructure.
Other charges. As part of our efforts to rationalize, integrate and align resources, VeriSign recorded other charges during 2002 relating primarily to the write-off of prepaid marketing assets associated with discontinued advertising. Property and equipment that was disposed of or abandoned resulted in a net charge during 2003 and consisted primarily of computer software, leasehold improvements, and computer equipment.certain severed employees.
VERISIGN, INC. AND SUBSIDIARIES
NOTES TO CONSOLIDATED FINANCIAL STATEMENTS—(Continued)
DECEMBER 31, 2004, 20032007, 2006 AND 20022005
Restructuring and other charges, net of adjustments, recorded during the years endedAt December 31, 2004, 2003 and 20022007, the accrued restructuring costs associated with the 2002 restructuring plan are as follows:
| Year Ended December 31, | ||||||||||
| 2004 | 2003 | 2002 | ||||||||
| (In thousands) | ||||||||||
Workforce reduction | $ | (7 | ) | $ | 1,545 | $ | 6,207 | |||
Excess facilities | 212 | 8,694 | 29,689 | |||||||
Exit costs and other charges | (470 | ) | 1,014 | 9,040 | ||||||
Subtotal | (265 | ) | 11,253 | 44,936 | ||||||
Other charges | — | 9,228 | 43,638 | |||||||
Total restructuring and other charges | $ | (265 | ) | $ | 20,481 | $ | 88,574 | |||
As of December 31, 2004, the accrued liability associated with the 2002all restructuring plans was $8.5are $4.4 million and consistedconsist of the following:
| Accrued Restructuring Costs at December 31, 2003 | Reversals and Adjustments to Restructuring Charges | Non-Cash Reductions to the Accrual | Cash Payments | Accrued Restructuring Costs at December 31, 2004 | |||||||||||||
| (In thousands) | |||||||||||||||||
Workforce reduction | $ | 53 | $ | (7 | ) | $ | 3 | $ | (49 | ) | $ | — | |||||
Excess facilities | 15,505 | 212 | 11 | (7,342 | ) | 8,386 | |||||||||||
Exit costs | 661 | (470 | ) | 8 | (49 | ) | 150 | ||||||||||
Total restructuring charges | 16,219 | (265 | ) | 22 | (7,440 | ) | 8,536 | ||||||||||
Included in current portion of accrued restructuring costs | $ | 6,496 | $ | 2,985 | |||||||||||||
Included in long term restructuring costs | $ | 9,723 | $ | 5,551 | |||||||||||||
| Accrued Restructuring Costs at December 31, 2006 | Restructuring Charges | Cash Payments | Non-cash Write-offs | Accrued Restructuring Costs at December 31, 2007 | |||||||||||||
| (In thousands) | |||||||||||||||||
Workforce reduction | $ | — | $ | 20,497 | $ | (17,677 | ) | $ | (2,327 | ) | $ | 493 | |||||
Excess facilities | 4,613 | 4,699 | (5,717 | ) | 107 | 3,702 | |||||||||||
Other exit costs | 142 | 4,244 | (4,153 | ) | (77 | ) | 156 | ||||||||||
Total accrued restructuring costs | $ | 4,755 | $ | 29,440 | $ | (27,547 | ) | $ | (2,297 | ) | $ | 4,351 | |||||
Included in current portion of accrued | $ | 3,818 | $ | 2,878 | |||||||||||||
Included in long-term portion of accrued | $ | 937 | $ | 1,473 | |||||||||||||
Reversals and adjustments to restructuring and other charges in 2004 were the result of a change in sublease assumptions for two building leases in Herndon, Virginia and an adjustment of international severanceCash payments not taken against the liability.
Amountstotaling approximately $6.1 million related to the lease terminations due to the abandonment of excess facilities under all restructuring plans will be paid over the respective lease terms, the longest of which extends through 2014.2011. The present value of future cash payments related to lease terminations due to the abandonment of excess facilities is expected to be as follows:
| Contractual Lease Payments | Anticipated Sublease Income | Net | ||||||||
| (In thousands) | ||||||||||
2008 | $ | 2,583 | $ | (354 | ) | $ | 2,229 | |||
2009 | 1,215 | (689 | ) | 526 | ||||||
2010 | 1,211 | (677 | ) | 534 | ||||||
2011 | 908 | (495 | ) | 413 | ||||||
| $ | 5,917 | $ | (2,215 | ) | $ | 3,702 | ||||
Impairments and Other Charges
The following table presents the impairments and other charges:
| Year Ended December 31, | ||||||||||
| 2007 | 2006 | 2005 | ||||||||
| (In thousands) | ||||||||||
Impairment of other intangible assets | $ | 67,440 | $ | 1,950 | $ | — | ||||
Other charges | 13,230 | (1 | ) | 22,447 | ||||||
Total impairments and other charges | $ | 80,670 | $ | 1,949 | $ | 22,447 | ||||
Impairment of other intangible assets
During 2007, VeriSign recognized an impairment charge of $62.6 million for other intangible assets of the Content Services business reporting unit as a result of the impairment test conducted as required by SFAS 142
133
VERISIGN, INC. AND SUBSIDIARIES
NOTES TO CONSOLIDATED FINANCIAL STATEMENTS—(Continued)
DECEMBER 31, 2007, 2006 AND 2005
and SFAS 144 as of December 31, 2007. During 2007, the Company wrote-off an additional amount $4.8 million of other intangible assets primarily related to a significant change in the operations of an asset group.
During 2006, VeriSign wrote off approximately $2.0 million of other intangible assets specifically related to abandoned technology acquired for a specific customer.
Other charges
Other charges comprised of excess and obsolete property and equipment that were impaired, disposed of or abandoned. During 2007, VeriSign recognized an impairment charge of $4.3 million for property and equipment, net, of the Content Services business reporting unit as a result of the impairment test conducted as required by SFAS 144 as of December 31, 2007. During 2007, VeriSign recorded additional other charges of approximately $9.0 million, primarily for the abandonment of obsolete property and equipment and impairment specifically related to a significant change in the operations of an asset group. During 2005, VeriSign recorded an impairment of approximately $22.4 million relating to the abandonment of the development efforts related to an internally developed software project.
Note 6. Cash, Cash Equivalents, Investments and Restricted Cash
VeriSign’s cash equivalents, short-term investments and restricted investments have been classified as available-for-sale. The following tables summarize VeriSign’s cash, cash equivalents, short and long-term investments, and restricted cash and investments:
| As of December 31, 2007 | ||||||||||||
| Carrying Value | Unrealized Gains | Unrealized Losses | Estimated Fair Value | |||||||||
| (In thousands) | ||||||||||||
Classified as current assets: | ||||||||||||
Cash | $ | 157,423 | $ | — | $ | — | $ | 157,423 | ||||
Money market funds | 1,219,299 | — | — | 1,219,299 | ||||||||
Equity securities of public company | 722 | 289 | — | 1,011 | ||||||||
| $ | 1,377,444 | $ | 289 | $ | — | $ | 1,377,733 | |||||
Included in cash and cash equivalents | $ | 1,376,722 | ||||||||||
Included in short-term investments | $ | 1,011 | ||||||||||
Classified as long-term assets: | ||||||||||||
Equity securities of non-public companies | 6,385 | — | — | 6,385 | ||||||||
Money market funds | 46,936 | — | — | 46,936 | ||||||||
| $ | 53,321 | $ | — | $ | — | $ | 53,321 | |||||
Included in restricted cash and investments | $ | 46,936 | ||||||||||
Included in other assets | $ | 6,385 | ||||||||||
VERISIGN, INC. AND SUBSIDIARIES
NOTES TO CONSOLIDATED FINANCIAL STATEMENTS—(Continued)
DECEMBER 31, 2004, 20032007, 2006 AND 20022005
| As of December 31, 2006 | |||||||||||||
| Carrying Value | Unrealized Gains | Unrealized Losses | Estimated Fair Value | ||||||||||
| (In thousands) | |||||||||||||
Classified as current assets: | |||||||||||||
Cash | $ | 302,953 | $ | — | $ | — | $ | 302,953 | |||||
Money market funds | 168,573 | — | — | 168,573 | |||||||||
Commercial paper | 7,223 | 1 | — | 7,224 | |||||||||
Corporate bonds and notes | 83,507 | 1 | (580 | ) | 82,928 | ||||||||
U.S. government and agency securities | 30,356 | — | (238 | ) | 30,118 | ||||||||
Municipal bonds | 5,399 | — | (36 | ) | 5,363 | ||||||||
Asset-backed securities | 81,185 | — | (939 | ) | 80,246 | ||||||||
| $ | 679,196 | $ | 2 | $ | (1,793 | ) | $ | 677,405 | |||||
Included in cash and cash equivalents | $ | 478,749 | |||||||||||
Included in short-term investments | $ | 198,656 | |||||||||||
Classified as long-term assets: | |||||||||||||
Equity securities of non-public companies | 11,235 | — | — | 11,235 | |||||||||
Corporate bonds and notes | 11,312 | 2 | (73 | ) | 11,241 | ||||||||
Money market funds | 442 | — | — | 442 | |||||||||
Commercial Paper | 757 | — | — | 757 | |||||||||
U.S. government and agency securities | 10,206 | 17 | (32 | ) | 10,191 | ||||||||
Asset-backed securities | 22,476 | 18 | (124 | ) | 22,370 | ||||||||
Certificates of deposit | 4,436 | — | — | 4,436 | |||||||||
| $ | 60,864 | $ | 37 | $ | (229 | ) | $ | 60,672 | |||||
Included in restricted cash and investments | $ | 49,437 | |||||||||||
Included in other assets, net | $ | 11,235 | |||||||||||
Future cash payments
Gross realized losses on investments totaled $5.2 million in 2007 consisting of the impairment and anticipated sublease income, related to lease terminations due to the abandonmentsale of excess facilities are expected to be as follows:certain public and non-public debt and equity investments. Gross realized gains on investments were $3.4 million in 2007.
Contractual Payments | Anticipated Sublease Income | Net | ||||||||
| (In thousands) | ||||||||||
2005 | $ | 13,528 | $ | (3,731 | ) | $ | 9,797 | |||
2006 | 9,708 | (3,626 | ) | 6,082 | ||||||
2007 | 7,690 | (4,109 | ) | 3,581 | ||||||
2008 | 5,361 | (3,339 | ) | 2,022 | ||||||
2009 | 4,426 | (3,172 | ) | 1,254 | ||||||
Thereafter | 19,816 | (13,480 | ) | 6,336 | ||||||
| $ | 60,529 | $ | (31,457 | ) | $ | 29,072 | ||||
Gross realized losses on investments totaled $0.4 million in 2006 consisting of the impairment and sale of certain public and non-public debt and equity investments. Gross realized gains on investments were $23.2 million in 2006.
VeriSign’s cash equivalents and short-termGross realized losses on investments have been classified as available-for-sale. Cash, cash equivalents and short and long-term investments and restricted cash consisttotaled $0.8 million in 2005 consisting of the following:impairment and sale of certain public and non-public debt and equity investments. Gross realized gains on investments were $12.1 million in 2005.
| December 31, 2004 | |||||||||||||
Carrying Value | Unrealized Gains | Unrealized Losses | Estimated Fair Value | ||||||||||
| (In thousands) | |||||||||||||
Classified as current assets: | |||||||||||||
Cash | $ | 280,453 | $ | — | $ | — | $ | 280,453 | |||||
Commercial paper | 40,867 | — | — | 40,867 | |||||||||
Corporate bonds and notes | 140,761 | 12 | (622 | ) | 140,151 | ||||||||
Money market funds | 9,088 | — | — | 9,088 | |||||||||
U.S. government and agency securities | 191,853 | — | (1,131 | ) | 190,722 | ||||||||
Municipal bonds | 1,448 | — | (11 | ) | 1,437 | ||||||||
Asset-backed securities | 75,163 | 8 | (464 | ) | 74,707 | ||||||||
| 739,633 | 20 | (2,228 | ) | 737,425 | |||||||||
Included in cash and cash equivalents | $ | 330,641 | |||||||||||
Included in short-term investments | $ | 406,784 | |||||||||||
Long-term investments: | |||||||||||||
Debt and equity securities of non-public companies | 6,809 | — | — | 6,809 | |||||||||
Restricted cash | 51,518 | — | — | 51,518 | |||||||||
Total long-term investments and restricted cash | 58,327 | — | — | 58,327 | |||||||||
Total cash, cash equivalents, short and long-term investments, and restricted cash | $ | 797,960 | $ | 20 | $ | (2,228 | ) | $ | 795,752 | ||||
Unrealized gains and losses on available-for-sale investments are included in Accumulated other comprehensive income (loss) in the Consolidated Balance Sheets.
135
VERISIGN, INC. AND SUBSIDIARIES
NOTES TO CONSOLIDATED FINANCIAL STATEMENTS—(Continued)
DECEMBER 31, 2004, 20032007, 2006 AND 20022005
Gross realized losses on investments totaled $12.6 million in 2004 consisting of the impairment and sale of certain public and non-public equity investments. Gross realized gains on investments were $4.4 million in 2004. All investments with unrealized losses have been held less than 12 months.
| December 31, 2003 | |||||||||||||
Carrying Value | Unrealized Gains | Unrealized Losses | Estimated Fair Value | ||||||||||
| (In thousands) | |||||||||||||
Classified as current assets: | |||||||||||||
Cash | $ | 229,775 | $ | — | $ | — | $ | 229,775 | |||||
Commercial paper | 78,630 | 11 | (1 | ) | 78,640 | ||||||||
Corporate bonds and notes | 30,458 | 128 | (22 | ) | 30,564 | ||||||||
Money market funds | 6,993 | — | — | 6,993 | |||||||||
U.S. government and agency securities | 201,421 | 291 | (41 | ) | 201,671 | ||||||||
Municipal bonds | 51,909 | 26 | (22 | ) | 51,913 | ||||||||
Asset-backed securities | 5,647 | 3 | (15 | ) | 5,635 | ||||||||
Medium term notes | 2,257 | 3 | — | 2,260 | |||||||||
Foreign debt securities | 13,084 | 16 | (49 | ) | 13,051 | ||||||||
Equity securities | 1,779 | — | — | 1,779 | |||||||||
Certificates of deposit | 359 | — | — | 359 | |||||||||
Market auction preferred | 95,944 | — | — | 95,944 | |||||||||
Placement bonds | 5,089 | 13 | — | 5,102 | |||||||||
| 723,345 | 491 | (150 | ) | 723,686 | |||||||||
Included in cash and cash equivalents | $ | 301,593 | |||||||||||
Included in short-term investments | $ | 422,093 | |||||||||||
Long-term investments: | |||||||||||||
Debt and equity securities of non-public companies | 19,724 | — | — | 19,724 | |||||||||
Other | 2,025 | — | — | 2,025 | |||||||||
| 21,749 | — | — | 21,749 | ||||||||||
Restricted cash | 18,371 | — | — | 18,371 | |||||||||
Total long-term investments and restricted cash | 40,120 | — | — | 40,120 | |||||||||
Total cash, cash equivalents and short and long-term investments, and restricted cash | $ | 763,465 | $ | 491 | $ | (150 | ) | $ | 763,806 | ||||
Gross realized losses on investments totaled $17.0 million in 2003 consisting of the impairment and sale of certain public and non-public equity investments. Gross realized gains on investments were $0.5 million in 2003.
VERISIGN, INC. AND SUBSIDIARIES
NOTES TO CONSOLIDATED FINANCIAL STATEMENTS—(Continued)
DECEMBER 31, 2004, 2003 AND 2002
The following table presents detail of propertythe unrealized gains and equipment:losses on available-for-sale investments:
| December 31, | ||||||||
| 2004 | 2003 | |||||||
| (In thousands) | ||||||||
Land | $ | 222,516 | $ | 222,500 | ||||
Buildings | 74,515 | 74,515 | ||||||
Computer equipment and purchased software | 468,895 | 432,159 | ||||||
Office equipment, furniture and fixtures | 24,893 | 16,783 | ||||||
Leasehold improvements | 62,518 | 59,247 | ||||||
| 853,337 | 805,204 | |||||||
Less accumulated depreciation and amortization | (340,716 | ) | (284,985 | ) | ||||
Property and equipment, net | $ | 512,621 | $ | 520,219 | ||||
| As of December 31, | |||||||
| 2007 | 2006 | ||||||
| (In thousands) | |||||||
Gross unrealized gains | $ | 289 | $ | 39 | |||
Gross unrealized losses | — | (2,022 | ) | ||||
Net unrealized gains (losses) | $ | 289 | $ | (1,983 | ) | ||
Restricted Cash and Investments
As of December 31, 2007, restricted cash and investments primarily include $45.0 million related to a trust established during 2004 for VeriSign’s director and officer liability self-insurance coverage.
As of December 31, 2007 and 2006, VeriSign has pledged approximately $2.5 million and $4.4 million, respectively, as collateral for standby letters of credit that guarantee certain of its contractual obligations, primarily relating to its real estate lease agreements, the longest of which is expected to mature in 2014. Of the $2.5 million pledged as of December 31, 2007, approximately $2.0 million is classified as short-term restricted cash and is included in cash and cash equivalents because the letter of credit expires in less than one year.
Note 7. Goodwill and Other Intangible Assets
The following table summarizes the changes in the carrying amount of goodwill as allocated to the Company’s operating segments for the years ended December 31, 2004 and 2003:segments:
| Internet Services Group | Communications Services Group | Network Solutions | Total | |||||||||||||
| (In thousands) | ||||||||||||||||
December 31, 2002 | $ | 76,785 | $ | 356,059 | $ | 234,467 | $ | 667,311 | ||||||||
Impairments | (18,697 | ) | (20,034 | ) | (43,154 | ) | (81,885 | ) | ||||||||
Sale of Network Solutions | — | — | (191,313 | ) | (191,313 | ) | ||||||||||
Other | (1,236 | ) | 8,494 | — | 7,258 | |||||||||||
December 31, 2003 | 56,852 | 344,519 | — | 401,371 | ||||||||||||
Guardent acquisition | 114,069 | — | — | 114,069 | ||||||||||||
Jamba! acquisition | — | 187,777 | — | 187,777 | ||||||||||||
Other | 18,506 | 3,704 | — | 22,210 | ||||||||||||
December 31, 2004 | $ | 189,427 | $ | 536,000 | $ | — | $ | 725,427 | ||||||||
| Internet Services Group | Communications Services Group | Total | ||||||||||
| (In thousands) | ||||||||||||
December 31, 2005 | $ | 304,060 | $ | 757,903 | $ | 1,061,963 | ||||||
CallVision acquisition | — | 18,015 | 18,015 | |||||||||
3united acquisition | — | 48,316 | 48,316 | |||||||||
Kontiki acquisition | — | 23,898 | 23,898 | |||||||||
m-Qube acquisition | — | 159,978 | 159,978 | |||||||||
GeoTrust acquisition | 100,081 | — | 100,081 | |||||||||
inCode acquisition | — | 27,800 | 27,800 | |||||||||
Other acquisitions and adjustments (1) (2) | 11,651 | (9,209 | ) | 2,442 | ||||||||
December 31, 2006 | 415,792 | 1,026,701 | 1,442,493 | |||||||||
Divestiture of businesses | (184 | ) | (180,249 | ) | (180,433 | ) | ||||||
Impairment | — | (182,151 | ) | (182,151 | ) | |||||||
Other adjustments (2) | (957 | ) | 3,468 | 2,511 | ||||||||
December 31, 2007 | $ | 414,651 | $ | 667,769 | $ | 1,082,420 | ||||||
Purchased goodwill and certain indefinite-lived intangibles are not amortized but are subject to testing for impairment on at least an annual basis.
A two-step evaluation to assess goodwill for impairment is required. First, the fair value of each reporting unit is compared to its carrying value. If the fair value exceeds the carrying value, goodwill and other intangible assets are not considered to be impaired and proceeding to the second step is not required. If the carrying value of any reporting unit exceeds its fair value, then the implied fair value of the reporting unit’s goodwill and other intangible assets must be determined and compared to the carrying value of its goodwill and other intangible assets (the second step). If the carrying value of a reporting unit’s goodwill and other intangible assets exceeds its implied fair value, then an impairment charge equal to the difference is recorded.
| (1) | Other acquisitions consist of companies that were considered not material on an individual basis or in the aggregate at the time of purchase. In 2006, VeriSign acquired two companies with an aggregate goodwill of $18.9 million. These companies were included in the Internet Services Group. |
| (2) | VeriSign makes certain goodwill adjustments after the initial purchase to acquired companies for income tax adjustments, foreign exchange fluctuations and other additions or reductions that were determined after the initial purchase. |
VERISIGN, INC. AND SUBSIDIARIES
NOTES TO CONSOLIDATED FINANCIAL STATEMENTS—(Continued)
DECEMBER 31, 2004, 20032007, 2006 AND 20022005
VeriSign
In 2007, the Company divested its majority ownership interest in Jamba and reduced its goodwill balance by $180.2 million as part of the divestiture.
The Company performs its goodwill impairment analysis at the reporting unit, which is one level below its operating segment level.
As of December 31, 2007, based on a combination of factors, primarily a more-likely-than-not expectation that a significant portion of the Content Services (“Content”), and Commerce and Communications Services (“Commerce and Communications”) reporting units would be sold or otherwise disposed of in accordance with its recently announced strategic business decision to divest its non-core businesses, the Company concluded that there were sufficient indicators to require it to perform an analysis to assess whether any portion of the recorded goodwill balances for its Content, and Commerce and Communications reporting units were impaired.
At December 31, 2007, the Company performed an impairment review of its annualContent, and Commerce and Communications reporting units. In accordance with SFAS 142, the Company tested goodwill for each of these reporting units for impairment test as of June 30, 2004, 2003 and 2002. Theby comparing the fair value of VeriSign’sthe reporting units is determinedunit to its carrying value. The comparison of fair value to carrying value represents Step 1 of the two-step approach required by SFAS 142. The estimated fair value of each reporting unit was computed using eitherthe combination of the income or theand market valuation approach or a combination thereof.approach. Under the income approach, the fair value of the reporting unit is based on the present value of the estimated future cash flows that the reporting unit is expected to generate over its remaining life. Under the market approach, the value of the reporting unit is based on an analysis that compares the value of the reporting unit to values of publicly traded companies in similar lines of business. Other intangible assets are valued usingThe Commerce and Communications reporting unit had a fair value in excess of its carrying value and no further analysis was required. The Content reporting unit had a fair value less than its carrying value and the income approach. InCompany concluded that the applicationgoodwill in its Content reporting unit was impaired. Further analysis was required to determine the amount by which the carrying value of the incomegoodwill of this reporting unit exceeded its implied fair value.
A Step 2 analysis requires the Company to allocate the fair value of the Content reporting unit to all of the assets and market valuation approaches, VeriSignliabilities of that unit (including any unrecognized intangible assets) as if the reporting unit had been acquired in a current business combination and the fair value of the Content reporting unit was the price paid to acquire the reporting unit. The excess of the fair value of a reporting unit over the amounts assigned to its assets and liabilities is required to make estimatesthe implied fair value of future operating trendsgoodwill. The carrying value of the goodwill for the Content reporting unit exceeded the implied goodwill calculated by $182.2 million which the Company recorded as an impairment charge for the year ended December 31, 2007. This allocation process is performed only for purposes of testing goodwill for impairment, and judgments on discount rates and other variables. Actual future results related to assumed variables could differ from these estimates.an entity should not write up or write down a recognized asset or liability, nor should it recognize a previously unrecognized intangible asset as a result of this allocation process.
There waswere no impairment chargecharges for goodwill and other intangible assets from the annual impairment testtests conducted inas of June 2004. The annual impairment test conducted in June 2003 resulted in an impairment charge to goodwill30, 2007, 2006 and 2005.
137
VERISIGN, INC. AND SUBSIDIARIES
NOTES TO CONSOLIDATED FINANCIAL STATEMENTS—(Continued)
DECEMBER 31, 2007, 2006 AND 2005
VeriSign’s other intangible assets of $123.2 million during the second quarter of 2003. VeriSign recorded an additional impairment of goodwill of $30.2 million in the third quarter of 2003 as a result of VeriSign entering into an agreement to sell its Network Solutions business. The event triggered an evaluation of the carrying value of the goodwill assigned to Network Solutions. After considering the sales price of the assets and liabilities to be sold and the expenses associated with the divestiture, VeriSign determined that the carrying value exceeded the implied fair value of Network Solutions’ goodwill. Total impairment of goodwill andare comprised of:
| As of December 31, 2007 | ||||||||||||
| Gross Carrying Value | Accumulated Amortization and Impairment | Net Carrying Value | Weighted-Average Remaining Life in Years | |||||||||
| (Dollars in thousands) | ||||||||||||
Customer relationships | $ | 212,978 | $ | (152,844 | ) | $ | 60,134 | 5.6 | ||||
Technology in place | 212,377 | (179,144 | ) | 33,233 | 3.6 | |||||||
Carrier relationships | 36,300 | (26,864 | ) | 9,436 | 5.3 | |||||||
Non-compete agreement | 30,154 | (19,089 | ) | 11,065 | 1.8 | |||||||
Trade name | 12,968 | (7,425 | ) | 5,543 | 4.7 | |||||||
Other | 9,000 | (6,619 | ) | 2,381 | 3.2 | |||||||
Total other intangible assets | $ | 513,777 | $ | (391,985 | ) | $ | 121,792 | 4.6 | ||||
| As of December 31, 2006 | ||||||||||||
| Gross Carrying Value | Accumulated Amortization and Impairment | Net Carrying Value | Weighted-Average Remaining Life in Years | |||||||||
| (Dollars in thousands) | ||||||||||||
Customer relationships | $ | 459,088 | $ | (331,279 | ) | $ | 127,809 | 4.6 | ||||
Technology in place | 237,238 | (138,866 | ) | 98,372 | 4.2 | |||||||
Carrier relationships | 64,000 | (15,345 | ) | 48,655 | 5.4 | |||||||
Non-compete agreement | 40,196 | (13,785 | ) | 26,411 | 2.2 | |||||||
Trade name | 34,557 | (11,480 | ) | 23,077 | 4.0 | |||||||
Other | 11,250 | (2,144 | ) | 9,106 | 3.7 | |||||||
Total other intangible assets | $ | 846,329 | $ | (512,899 | ) | $ | 333,430 | 4.3 | ||||
Fully amortized other intangible assets as allocatedare not included in the above tables.
Estimated future amortization expense related to the Company’s operating segments for the year endedother intangible assets at December 31, 2003 are2007, is as follows:
| Internet Services Group | Communications Services Group | Network Solutions | Total Segments | |||||||||
| (In thousands) | ||||||||||||
Impairment of goodwill | $ | 18,697 | $ | 20,034 | $ | 43,154 | $ | 81,885 | ||||
Impairment of other intangible assets: | ||||||||||||
Technology in place | — | 27,499 | — | 27,499 | ||||||||
Customer lists | — | 44,035 | — | 44,035 | ||||||||
Total impairment of other intangible assets | — | 71,534 | — | 71,534 | ||||||||
Total impairment of goodwill and other intangible assets | $ | 18,697 | $ | 91,568 | $ | 43,154 | $ | 153,419 | ||||
The impairment charge to goodwill and other intangible assets from the annual impairment test resulted in an impairment in 2002 as follows:
| Internet Services Group | Communications Services Group | Network Solutions | Total | |||||||||
| (In thousands) | ||||||||||||
Impairment of goodwill | $ | 1,740,256 | $ | 794,866 | $ | 1,851,887 | $ | 4,387,009 | ||||
Impairment of other intangible assets: | ||||||||||||
Customer relationships | 3,297 | 24,294 | — | 27,591 | ||||||||
Technology in place | 256 | 40,693 | — | 40,949 | ||||||||
Trade name | — | 3,205 | — | 3,205 | ||||||||
Contracts with ICANN and customer lists | — | 23,092 | 129,007 | 152,099 | ||||||||
Total impairment of other intangible assets | 3,553 | 91,284 | 129,007 | 223,844 | ||||||||
Total impairment of goodwill and other intangible assets | $ | 1,743,809 | $ | 886,150 | $ | 1,980,894 | $ | 4,610,853 | ||||
| (In thousands) | |||
2008 | $ | 37,253 | |
2009 | 30,176 | ||
2010 | 19,069 | ||
2011 | 13,182 | ||
2012 | 8,800 | ||
Thereafter | 13,312 | ||
| $ | 121,792 | ||
VERISIGN, INC. AND SUBSIDIARIES
NOTES TO CONSOLIDATED FINANCIAL STATEMENTS—(Continued)
DECEMBER 31, 2004, 20032007, 2006 AND 20022005
Fully amortized other intangible assets are removed from the gross carrying value and accumulated amortization and impairment accounts. The following table presents details of VeriSign’s other intangible assets:Note 8. Other Balance Sheet Items
| As of December 31, 2004 | ||||||||||||
| Gross Carrying Value | Accumulated Amortization | Net Carrying Value | Weighted-Average Remaining Life | |||||||||
| (Dollars in thousands) | ||||||||||||
Other intangible assets: | ||||||||||||
Customer relationships | $ | 270,733 | $ | (146,145 | ) | $ | 124,588 | 2.7 years | ||||
Technology in place | 121,406 | (99,474 | ) | 21,932 | 2.7 years | |||||||
Carrier relationships | 27,700 | (2,667 | ) | 25,033 | 5.4 years | |||||||
Non-compete agreement | 16,220 | (4,622 | ) | 11,598 | 1.7 years | |||||||
Trade name | 17,828 | (1,728 | ) | 16,100 | 5.4 years | |||||||
Contracts with ICANN and customer lists | 146,238 | (101,651 | ) | 44,587 | 3.2 years | |||||||
Total other intangible assets | $ | 600,125 | $ | (356,287 | ) | $ | 243,838 | 3.2 years | ||||
| As of December 31, 2003 | ||||||||||||
| Gross Carrying Value | Accumulated Amortization and Impairment | Net Carrying Value | Weighted-Average Remaining Life | |||||||||
| (Dollars in thousands) | ||||||||||||
Other intangible assets: | ||||||||||||
Customer relationships | 263,591 | (120,630 | ) | 142,961 | 3.9 years | |||||||
Technology in place | 152,956 | (128,521 | ) | 24,435 | 3.7 years | |||||||
Contracts with ICANN and customer lists | 698,042 | (648,773 | ) | 49,269 | 3.2 years | |||||||
Total other intangible assets | $ | 1,114,589 | $ | 897,924 | $ | 216,665 | 3.7 years | |||||
Prepaid expenses and other current assets
Prepaid expenses and other current assets consist of the following:
| As of December 31, | ||||||
| 2007 | 2006 | |||||
| (In thousands) | ||||||
Prepaid expenses | $ | 25,344 | $ | 73,374 | ||
Other current assets | 91,617 | 141,581 | ||||
Securities litigation receivable | — | 80,000 | ||||
Total prepaid expenses and other current assets | $ | 116,961 | $ | 294,955 | ||
Other current assets primarily consist of pass-through receivables, which are amounts the Company collects from its customers that is due to third-party vendors as part of a revenue sharing agreement; and non-trade receivables, which primarily consist of income tax receivables and value added tax receivables. As of December 31, 2007 and 2006, the Company’s pass-through receivable balance was $71.4 million and $63.6 million, respectively. Prepaid expenses and other current assets as of December 31, 2006, include assets related to Jamba which was deconsolidated as a result of the Company’s divestiture of its majority ownership interest in January 2007. At December 31, 2006, VeriSign recorded an $80.0 million receivable from liability insurers for the Company and its directors and officers in connection with the settlement of the Securities Litigation and Derivative Litigation. The receivable and liability were settled in 2007.
Property and Equipment, Net
The following table summarizespresents the amortization expensedetail of other intangible assets as allocated by intangible asset category for the years ended December 31, 2004, 2003,property and 2002:equipment, net:
| 2004 | 2003 | 2002 | |||||||
| (In thousands) | |||||||||
Customer relationships | $ | 53,319 | $ | 35,953 | $ | 42,741 | |||
Technology in place | 8,978 | 17,450 | 25,071 | ||||||
ISP hosting relationships | — | 175 | 2,098 | ||||||
Carrier relationships | 2,738 | — | — | ||||||
Non-compete agreement | 4,686 | 31 | 339 | ||||||
Trade name | 1,803 | 25 | 356 | ||||||
Contracts with ICANN and customer lists | 7,916 | 128,452 | 213,256 | ||||||
Total amortization of other intangibles | $ | 79,440 | $ | 182,086 | $ | 283,861 | |||
| As of December 31, | ||||||||
| 2007 | 2006 | |||||||
| (In thousands) | ||||||||
Land | $ | 222,750 | $ | 222,750 | ||||
Buildings | 135,393 | 88,532 | ||||||
Computer equipment and software | 757,154 | 699,576 | ||||||
Office equipment, furniture and fixtures | 33,407 | 29,682 | ||||||
Leasehold improvements | 81,031 | 90,263 | ||||||
Total cost | 1,229,735 | 1,130,803 | ||||||
Less: accumulated depreciation and amortization | (607,818 | ) | (525,511 | ) | ||||
Total property and equipment, net | $ | 621,917 | $ | 605,292 | ||||
139
VERISIGN, INC. AND SUBSIDIARIES
NOTES TO CONSOLIDATED FINANCIAL STATEMENTS—(Continued)
DECEMBER 31, 2004, 20032007, 2006 AND 20022005
Estimated future amortization expense related to other intangibleOther Assets
Other assets atconsist of the following:
| As of December 31, | ||||||
| 2007 | 2006 | |||||
| (In thousands) | ||||||
Long-term note receivable | $ | 15,000 | $ | — | ||
Long-term investments | 6,385 | 11,234 | ||||
Debt issuance costs | 28,411 | 3,027 | ||||
Security deposits and other | 10,156 | 10,953 | ||||
Total other assets | $ | 59,952 | $ | 25,214 | ||
Long-term note receivable as of December 31, 20042007, included a working capital loan provided under a promissory note to the joint ventures described in Note 3, “Joint Ventures.” The promissory note bears an interest rate of 6% per annum and is receivable in December 2011. The promissory note may be optionally prepaid by the borrower at any time before maturity. Debt issuance costs as follows:of December 31, 2007, include costs incurred upon the issuance of the convertible debentures and credit facility, as described in Note 9, “Credit Facility,” and Note 10, “Junior Subordinated Convertible Debentures.”
| (In thousands) | |||
2005 | $ | 89,997 | |
2006 | 71,747 | ||
2007 | 57,801 | ||
2008 | 11,552 | ||
2009 | 9,364 | ||
2010 | 3,377 | ||
| $ | 243,838 | ||
Accounts Payable and Accrued Liabilities
Accounts payable and accrued liabilities consist of the following:
| December 31, | ||||||
| 2004 | 2003 | |||||
| (In thousands) | ||||||
Accounts payable | $ | 69,988 | $ | 45,563 | ||
Employee compensation | 72,300 | 53,425 | ||||
Customer deposits | 21,144 | 41,393 | ||||
Taxes | 79,906 | 72,215 | ||||
Other | 138,687 | 78,796 | ||||
| $ | 382,025 | $ | 291,392 | |||
| As of December 31, | ||||||
| 2007 | 2006 | |||||
| (In thousands) | ||||||
Accounts payable | $ | 9,075 | $ | 33,903 | ||
Employee compensation | 127,330 | 109,775 | ||||
Customer deposits | 115,014 | 73,845 | ||||
Taxes payable and other tax liabilities | 25,847 | 226,342 | ||||
Other accrued liabilities | 111,296 | 158,131 | ||||
Securities litigation payable | — | 80,000 | ||||
Total accounts payable and accrued liabilities | $ | 388,562 | $ | 681,996 | ||
In November 1999,At December 31, 2006, VeriSign entered into an Agreementrecorded the $80.0 million payable to account for the management and administrationsettlement of the Tuvalu Internet top-level domain, “.tv,” withSecurities Litigation and Derivative Litigation. Under terms of the Governmentsettlement, liability insurers for the Company and its directors and officers paid $80.0 in settlement of Tuvalu for payments of future royalties. Future royalty payment obligations will amount to $8.4 million. The current portion of $2.2 million is duethe lawsuits. This liability was settled in 2005 and the long-term portion of $6.2 million matures as follows:
| Future Royalty Payment Obligations | |||
| (In thousands) | |||
2006 | $ | 2,200 | |
2007 | 2,000 | ||
2008 | 2,000 | ||
| $ | 6,200 | ||
Additionally, VeriSign has $0.6 million of miscellaneous long-term liabilities which mature over the next four years.
The current portion of long-term liabilities payable is included in accounts2007. Accounts payable and accrued liabilities as of December 31, 2006, include liabilities related to Jamba which was deconsolidated as a result of the Company’s divestiture of its majority ownership interest in January 2007.
Note 9. Credit Facility
On June 7, 2006, VeriSign entered into a credit agreement (the “Credit Agreement”) with a syndicate of banks and other financial institutions related to a $500.0 million senior unsecured revolving credit facility (the “Facility”), under which VeriSign, or certain designated subsidiaries may be borrowers. At December 31, 2006, the non-current portion is included in other long-term liabilities ininterest rate on the accompanying consolidatedoutstanding balance sheets.of the facility was 5.86%. In February 2007, the Company repaid the
VERISIGN, INC. AND SUBSIDIARIES
NOTES TO CONSOLIDATED FINANCIAL STATEMENTS—(Continued)
DECEMBER 31, 2004, 20032007, 2006 AND 20022005
outstanding loan balance under the Facility of $199.0 million. As of December 31, 2007, there were no outstanding borrowings under the Facility. As of December 31, 2007, the Company was in compliance with all covenants under the facility. The Company’s Credit Agreement contains negative covenant that limits its ability to sell assets and freely deploy the proceeds it receives from such sales, subject to exceptions based on the size and timing of the sales.
On September 17, 2007, VeriSign, Inc. entered into an amendment agreement with Bank of America, N.A., as Administrative Agent and several financial institutions to amend the Credit Agreement. The amendment added certain covenants related to the indenture that VeriSign entered into with U.S. Bank National Association, as Trustee, on August 20, 2007, and VeriSign’s issuance of $1.25 billion aggregate principal amount of 3.25% convertible debentures due 2037 as described in Note 10, “Junior Subordinated Convertible Debentures.” Pursuant to the terms of the Amendment, the debentures are not included in the definition of “Consolidated Funded Indebtedness” in the Credit Agreement, and thus, the debentures are not included in the calculation of the Consolidated Leverage Ratio (as defined in the Credit Agreement), which was decreased such that it cannot exceed 1.50 to 1.00 at any time during any period of four fiscal quarters. VeriSign also agreed in the amendment that it would not enter into certain specified types of amendments to the debentures and indenture, and an event of default under the indenture would be an event of default under the Credit Agreement.
Note 10. Junior Subordinated Convertible Debentures
In August 2007, VeriSign issued $1.25 billion principal amount of 3.25% convertible debentures due August 15, 2037, to an initial purchaser in a private offering. The debentures are subordinated in right of payment to the Company’s existing and future senior debt and to the other liabilities of the Company’s subsidiaries. The debentures are initially convertible, subject to certain conditions, into shares of the Company common stock at a conversion rate of 29.0968 shares of common stock per $1,000 principal amount of debentures, representing an initial effective conversion price of approximately $34.37 per share of common stock. The conversion rate will be subject to adjustment for certain events as outlined in the indenture governing the debentures but will not be adjusted for accrued interest.
The Company received net proceeds of approximately $1.22 billion after deduction of $25.8 million of costs incurred upon the issuance of the convertible debentures. The debt issuance costs are recorded in long-term other assets and are being amortized to interest expense over 30 years. Interest is payable semiannually in arrears on August 15 and February 15, beginning on February 15, 2008. Interest expense related to the debentures for the year ended December 31,2007, was approximately $15.0 million and was included in Other income, net. The debentures also have a contingent interest component that will require the Company to pay interest based on certain thresholds beginning with the semi-annual interest period commencing on August 15, 2014, and upon the occurrence of certain events, as outlined in the indenture governing the debentures.
On or after August 15, 2017, the Company may redeem all or part of the debentures for the principal amount plus any accrued and unpaid interest if the closing price of the Company’s common stock has been at least 150% of the conversion price then in effect for at least 20 trading days during any 30 consecutive trading-day period prior to the date on which the Company provides notice of redemption. Upon conversion, the Company has the intent and the current ability to pay the holder the cash value of the applicable number of shares of the Company’s common stock, up to the principal amount of the debentures. If the conversion value exceeds $1,000, the Company may also deliver, at its option, cash or common stock or a combination of cash and common stock for the conversion value in excess of $1,000 (“conversion spread”).
141
VERISIGN, INC. AND SUBSIDIARIES
NOTES TO CONSOLIDATED FINANCIAL STATEMENTS—(Continued)
DECEMBER 31, 2007, 2006 AND 2005
Holders of the debentures may convert their debentures at the applicable conversion rate, in multiples of $1,000 principal amount, only under the following circumstances:
during any fiscal quarter beginning after December 31, 2007, if the last reported sale price of the Company’s common stock for at least 20 trading days during the period of 30 consecutive trading days ending on the last trading day of the immediately preceding fiscal quarter is greater than or equal to 130% of the applicable conversion price on the last trading day of such preceding fiscal quarter;
during the five business-day period after any 10 consecutive trading-day period in which the trading price per debenture for each day of that 10 consecutive trading-day period was less than 98% of the product of the last reported sale price of the Company’s common stock and the conversion rate on such day;
if the Company calls any or all of the debentures for redemption, at any time prior to the close of business on the trading day immediately preceding the redemption date;
upon the occurrence of specified corporate transactions as specified in the indenture governing the debentures; or
at any time on or after May 15, 2037, and prior to the maturity date.
In addition, holders of the debentures who convert their debentures in connection with a fundamental change, as defined in the indenture, may be entitled to a make-whole premium in the form of an increase in the conversion rate. Additionally, in the event of a fundamental change, the holders of the debentures may require VeriSign to purchase all or a portion of their debentures at a purchase price equal to 100% of the principal amount of debentures, plus accrued and unpaid interest, if any. As of December 31, 2007, none of the conditions allowing holders of the debentures to convert had been met.
The Company concluded that the embedded features related to the contingent interest payments, over-allotment option, and the Company making specific types of distributions (e.g., extraordinary dividends) qualify as derivatives and should be bundled as a compound embedded derivative under SFAS 133. The fair value of the derivative at the date of issuance of the debentures was $11.4 million including $7.8 million for the contingent interest payment features and $3.6 million for the over-allotment option feature, which is accounted for as a discount on the debentures. The over-allotment feature was revalued at $12.6 million on the date of exercise at August 28, 2007, which is accounted for as a premium on the debentures. The debt discount and the debt premium are being accreted to the face value of the debentures as interest expense and interest income, respectively, over 30 years. Any change in the fair value of this embedded derivative will be included in Other (loss) income, net. The fair value of the derivative as of December 31, 2007, was $14.2 million.
The balance of the convertible debentures at December 31, 2007, was $1.27 billion, including the fair value of the embedded derivative. The Company also concluded that the debentures are not conventional convertible debt instruments and that the embedded stock conversion option qualifies as a derivative under SFAS 133. In addition, in accordance with EITF 00-19, the Company has concluded that the embedded conversion option would be classified in stockholders’ equity if it were a freestanding instrument. Accordingly, the embedded conversion option is not required to be accounted for separately as a derivative.
Under the terms of the debentures, the Company is required to file a shelf registration statement covering resale of the debentures and any common stock issuable upon conversion of the debentures with the SEC and to use reasonable efforts to cause the shelf registration statement to be declared effective within 200 days of the closing of the offering of the debentures. In addition, the Company must use reasonable efforts to maintain the
VERISIGN, INC. AND SUBSIDIARIES
NOTES TO CONSOLIDATED FINANCIAL STATEMENTS—(Continued)
DECEMBER 31, 2007, 2006 AND 2005
effectiveness of the shelf registration statement for a period of two years after the closing of the offering of the debentures, subject to certain rights to suspend use of the shelf registration statement set forth in the registration rights agreement and the other limitations. If the Company fails to meet these terms, it will be required to pay additional interest on the debentures at a rate per annum equal to 0.25% for the first 90 days after the occurrence of the event and 0.50% after the first 90 days. The Company filed the shelf registration statement with the SEC on November 2, 2007. The registration statement has not yet been declared effective by the SEC.
Note 11. Stockholders’ Equity
Preferred Stock
VeriSign is authorized to issue up to 5,000,000 shares of preferred stock. As of December 31, 2004,2007, no shares of preferred stock had been issued. In connection with its stockholder rights plan, VeriSign authorized 3 million shares of Series A Junior Participating Preferred Stock, par value $0.001 per share. In the event of liquidation, each preferred share will be entitled to a $1.00 preference, and thereafter the holders of the preferred shares will be entitled to an aggregate payment of 100 times the aggregate payment made per common share. Each preferred share will have 100 votes, voting together with the common shares. Finally, in the event of any merger, consolidation or other transaction in which common shares are exchanged, each preferred share will be entitled to receive 100 times the amount received per common share. These rights are protected by customary anti-dilution provisions.
CommonTreasury Stock
In 2001,On a cumulative basis, the Company has repurchased 73.7 million shares of its common stock, which are recorded as part of treasury stock. Treasury stock is accounted for under the cost method. Treasury stock includes shares repurchased under Stock Repurchase Programs and shares withheld in lieu of tax withholdings due upon vesting of restricted stock units.
The summary of the Company’s common stock repurchases for 2007, 2006, and 2005 are as follows:
| 2007 | 2006 | 2005 | ||||||||||||||||||
Board Approval Date | Repurchases Under the Plan | Shares | Average Price | Shares | Average Price | Shares | Average Price | |||||||||||||
| (In thousands, except average price amounts) | ||||||||||||||||||||
April 2001 | Open market | $ | — | — | $ | — | 6,322 | $ | 26.42 | |||||||||||
August 2005 | Open market | — | — | — | — | 5,690 | 22.90 | |||||||||||||
| Structured repurchases (2) | — | — | 5,713 | 20.95 | 10,805 | 23.24 | ||||||||||||||
May 2006 | Structured repurchases (2) | — | — | 777 | 19.67 | — | — | |||||||||||||
August 2007 | Open market | 12,221 | 28.64 | — | — | — | — | |||||||||||||
| Structured repurchases (2) | 25,828 | 30.97 | — | — | — | — | ||||||||||||||
| From employees and other (1) | 200 | 32.46 | — | — | — | — | ||||||||||||||
Total shares | 38,249 | 30.24 | 6,490 | 20.80 | 22,817 | 24.04 | ||||||||||||||
Total costs | $ | 1,156,491 | $ | 135,000 | $ | 548,630 | ||||||||||||||
| (1) | The repurchases from employees and other primarily represents shares retired as treasury stock when surrendered in lieu of tax withholdings due for restricted stock units. |
| (2) | Stock repurchase agreements executed with large financial institutions. |
143
VERISIGN, INC. AND SUBSIDIARIES
NOTES TO CONSOLIDATED FINANCIAL STATEMENTS—(Continued)
DECEMBER 31, 2007, 2006 AND 2005
Stock Repurchase Programs
To facilitate the stock repurchase program, designed to return value to the stockholders and minimize dilution from stock issuances, the Company repurchases shares in the open market and from time to time enters into structured stock repurchase agreements with third parties.
On August 7, 2007, the Board of Directors of VeriSign authorized the use of up to $350 millionthe net proceeds from the issuance of the convertible debentures as described in Note 10, “Junior Subordinated Convertible Debentures,” to repurchase shares of VeriSign’sits common stock onin addition to the open market, or in negotiated or block trades. During 2001, VeriSign repurchased approximately 1.7previously approved 2006 stock repurchase program.
In 2007, the Company used proceeds from the issuance of the convertible debentures to repurchase 12.2 million shares at a cost of approximately $69.5 million. During 2003 and 2002, noits common stock was repurchased. During 2004, VeriSign repurchased approximately 4.4 million shares atfor an aggregate cost of approximately $113$350.0 million. AtAdditionally, the Company entered into a $600.0 million Accelerated Share Repurchase (“ASR”) agreement and a $200.0 million Guaranteed Share Repurchase (“GSR”) agreement with two independent financial institutions. Under the terms of the GSR agreement, the Company received approximately 6.3 million shares of its common stock. Under the terms of the ASR agreement, the Company received approximately 19.5 million shares of its common stock.
In 2006, the Board of Directors of VeriSign authorized a new stock repurchase program (“2006 stock repurchase program”) with no expiration date to repurchase up to $1.0 billion of its common stock. In 2007, the Company did not repurchase any shares under the 2006 stock repurchase program. In 2006, the Company repurchased approximately 0.7 million shares under the 2006 stock repurchase program for an aggregate cost of $15.3 million. As of December 31, 2004,2007, the Company has approximately $167$984.7 million remained available for future repurchases.under the 2006 stock repurchase program.
Other thanIn 2005, the dividendBoard of oneDirectors authorized a stock repurchase program (“2005 stock repurchase program”) to repurchase up to $500 million of its common stock. In 2006, the Company repurchased approximately 5.7 million shares under the 2005 stock repurchase program for an aggregate cost of approximately $119.7 million. In 2005, the Company repurchased approximately 16.5 million shares under the 2005 stock repurchase program for an aggregate cost of approximately $380.3 million. This stock repurchase program was completed in the second quarter of 2006.
In 2001, the Board of Directors authorized a stock repurchase program (“2001 stock repurchase program”) to repurchase up to $350 million of its common stock. In 2005, the Company repurchased approximately 6.3 million shares under the 2001 stock repurchase program for an aggregate cost of approximately $167.0 million. This stock repurchase program was completed in the third quarter of 2005.
From the inception of the stock purchase right for each outstanding shareprogram in 2001 to December 31, 2007, the Company has repurchased approximately 73.3 million shares of its common stock that was declared on September 24, 2002, no dividends have been declared or paid on VeriSign’s commonfor an aggregate cost of approximately $2.0 billion.
Tax withholdings
Upon vesting of restricted stock since inception.units, the Company places a sufficient portion of the vested restricted stock awards into treasury stock in lieu of tax withholdings due, and makes a cash payment to the Internal Revenue Service and state tax authorities to cover the applicable withholding taxes.
VERISIGN, INC. AND SUBSIDIARIES
NOTES TO CONSOLIDATED FINANCIAL STATEMENTS—(Continued)
DECEMBER 31, 2007, 2006 AND 2005
Stockholder Rights Plan
On September 24, 2002, the Board of Directors of VeriSign, declared a dividend of one stock purchase right (“Right”) for each outstanding share of VeriSign common stock. The dividend was paid to stockholders of record on October 4, 2002 (“Record Date”). In addition, one Right shall be issued with each common share that becomes outstanding (i) between the Record Date and the earliest of the Distribution Date, the Redemption Date and the Final Expiration Date (as such terms are defined in the Rights Agreement) or (ii) following the Distribution Date and prior to the Redemption Date or Final Expiration Date, pursuant to the exercise of stock options or under any employee plan or arrangement or upon the exercise, conversion or exchange of other securities of VeriSign, which options or securities were outstanding prior to the Distribution Date. The Rights will become exercisable only upon the occurrence of certain events specified in the Rights Agreement (“Rights Agreement”), including the acquisition of 20% of VeriSign’s outstanding common stock by a person or group. Each Right entitles the registered holder, other than an “acquiring person”, under specified circumstances, to purchase from VeriSign one one-hundredth of a share of VeriSign Series A Junior Participating Preferred Stock, par value $0.001 per share (“Preferred Share”), at a price of $55.00 per one one-hundredth of a Preferred Share, subject to adjustment. Preferred Shares purchasable upon exercise of the Rights will not be redeemable. In addition, each Right entitles the registered holder, other than an “acquiring person”, under specified circumstances, to purchase from VeriSign that number of shares of VeriSign common stock having a market value of two times the exercise price of the Right. In February 2006, VeriSign’s Board of Directors reviewed the stockholder rights plan and determined that it continues to be in the best interest of VeriSign and its stockholders. No cash dividends have been declared or paid on VeriSign’s common stock since inception.
Note 12. Calculation of Net (Loss) Income Per Share
In accordance with SFAS No. 128, “Earnings per Share,” the Company computes basic net (loss) income per share by dividing net (loss) income available to common stockholders by the weighted-average number of common shares outstanding during the period. Diluted net (loss) income per share gives effect to dilutive potential common shares, including unvested stock options, unvested restricted stock units, employee stock purchases, warrants and the conversion spread relating to the convertible debentures using the treasury stock method.
145
VERISIGN, INC. AND SUBSIDIARIES
NOTES TO CONSOLIDATED FINANCIAL STATEMENTS—(Continued)
DECEMBER 31, 2007, 2006 AND 2005
The following table presents the computation of basic and diluted net (loss) income per share:
| Year Ended December 31, | ||||||||||
| 2007 | 2006 | 2005 | ||||||||
| (In thousands, except per share data) | ||||||||||
Net (loss) income: | ||||||||||
Net (loss) income from continuing operations | $ | (144,680 | ) | $ | 374,300 | $ | 161,925 | |||
Net income from discontinued operations, net of tax | 3,821 | 4,715 | 16,480 | |||||||
Gain on sale of discontinued operations, net of tax | 1,357 | — | 250,573 | |||||||
Net (loss) income | $ | (139,502 | ) | $ | 379,015 | $ | 428,978 | |||
Weighted-average shares: | ||||||||||
Weighted-average common shares outstanding | 237,707 | 244,421 | 257,368 | |||||||
Weighted-average potential common shares outstanding: (1) | ||||||||||
Stock options | — | 2,344 | 6,064 | |||||||
Unvested restricted stock awards and other | — | 308 | 257 | |||||||
Shares used to compute diluted net (loss) income per share | 237,707 | 247,073 | 263,689 | |||||||
Net (loss) income per share: | ||||||||||
Basic: | ||||||||||
Net (loss) income from continuing operations | $ | (0.61 | ) | $ | 1.53 | $ | 0.63 | |||
Net income from discontinued operations | 0.02 | 0.02 | 0.06 | |||||||
Gain on sale of discontinued operations | — | — | 0.98 | |||||||
Net (loss) income | $ | (0.59 | ) | $ | 1.55 | $ | 1.67 | |||
Diluted: | ||||||||||
Net (loss) income from continuing operations | $ | (0.61 | ) | $ | 1.51 | $ | 0.62 | |||
Net income from discontinued operations | 0.02 | 0.02 | 0.06 | |||||||
Gain on sale of discontinued operations | — | — | 0.95 | |||||||
Net (loss) income | $ | (0.59 | ) | $ | 1.53 | $ | 1.63 | |||
The following table sets forth the weighted-average potential shares that were excluded from the above calculation because their effect was anti-dilutive, and the respective weighted-average exercise prices of the weighted-average stock options outstanding:
| Year Ended December 31, | |||||||||
| 2007 (1) | 2006 | 2005 | |||||||
| (In thousands, except per share data) | |||||||||
Weighted-average stock options outstanding | 27,636 | 25,632 | 13,737 | ||||||
Weighted-average exercise price | $ | 27.68 | $ | 36.46 | $ | 57.54 | |||
Weighted-average restricted stock awards outstanding | 3,387 | 131 | 104 | ||||||
Weighted-average conversion spread related to convertible debentures | 339 | — | — | ||||||
| (1) | As the Company recognized a net loss for the year ended December 31, 2007, all potential common shares were excluded as they were anti-dilutive. |
VERISIGN, INC. AND SUBSIDIARIES
NOTES TO CONSOLIDATED FINANCIAL STATEMENTS—(Continued)
DECEMBER 31, 2004, 20032007, 2006 AND 20022005
Note 13. Stock-Based Compensation |
Basic net income (loss) per share is computed by dividing net income (loss) by the weighted-average number of shares of common stock outstanding during the period. Diluted net income (loss) per share gives effect to dilutive potential common shares, including stock options, unvested restricted stock, and warrants using the treasury stock method.
The following table presentsEffective January 1, 2006, the computationCompany adopted the provisions of basicSFAS 123R. See Note 1, “Description of Business and diluted net income (loss) per share:
| Year Ended December 31, | |||||||||||
| 2004 | 2003 | 2002 | |||||||||
| (In thousands, except per share data) | |||||||||||
Net income (loss) | $ | 186,225 | $ | (259,879 | ) | $ | (4,961,297 | ) | |||
Weighted-average common shares outstanding | 250,564 | 239,780 | 236,552 | ||||||||
Diluted weighted-average common shares outstanding: | |||||||||||
Stock options | 7,254 | — | — | ||||||||
Unvested restricted stock | 155 | — | — | ||||||||
Warrant | 19 | — | — | ||||||||
Shares used to compute diluted net income (loss) per share | 257,992 | 239,780 | 236,552 | ||||||||
Basic net income (loss) per share | $ | 0.74 | $ | (1.08 | ) | $ | (20.97 | ) | |||
Diluted net income (loss) per share | $ | 0.72 | $ | (1.08 | ) | $ | (20.97 | ) | |||
For 2004, VeriSign excluded 12,133,492 weighted-average stock options with an exercise price that exceeded the average fair market valueSummary of Significant Accounting Policies,” for a description of VeriSign’s common stock for the period with a weighted-average exercise priceadoption of $69.80. These options could be dilutive in the future if the average fair market value of VeriSign’s common stock increases and is equal to or greater than the exercise price of these options. For 2003 and 2002, VeriSign excluded 2,717,195 and 3,498,082 weighted-average potential common shares, respectively, with a weighted-average exercise price of $8.33 and $8.18 for the respective periods because their effect would have been anti-dilutive.SFAS 123R.
Stock Option Plans
The majority of VeriSign’s stock-based compensation expense relates to restricted stock units (“RSUs”) and stock options. Historically, stock options have been granted to broad groups of employees at most levels on a discretionary basis. In the second quarter of 2006, the Compensation Committee, in consultation with other members of the Company’s Board of Directors, resolved to grant RSUs instead of stock options to employees below the director level. Employees at or above the director level continue to be eligible to receive stock options as well as RSUs. As of December 31, 2004,2007, a total of 54,685,48233.2 million shares of common stock were reserved for issuance upon the exercise of stock options and for the future grant of stock options or awards under VeriSign’s equity incentive plans.
On May 26, 2006, the stockholders of VeriSign approved the 2006 Equity Incentive Plan (“2006 Plan”). The 2006 Plan replaces VeriSign’s 1998 Directors Plan, 1998 Equity Incentive Plan, and 2001 Stock Incentive Plan. The 2006 Plan authorizes the award of incentive stock options to employees and non-qualified stock options, restricted stock awards, restricted stock units, stock bonus awards, stock appreciation rights and performance shares to eligible employees, officers, directors, consultants, independent contractors and advisors. Options may be granted at an exercise price not less than 100% of the fair market value of VeriSign’s common stock on the date of grant. The 2006 Plan is administered by the Compensation Committee which may delegate to a committee of one or more members of VeriSign’s Board of Directors or VeriSign’s officers the ability to grant awards and take certain other actions with respect to participants who are not executive officers or non-employee directors. All options have a term of not greater than 10 years from the date of grant. Options issued generally vest 25% on the first anniversary date and ratably over the following 12 quarters. A restricted stock unit is an award covering a number of shares of VeriSign common stock that may be settled in cash or by issuance of those shares, which may consist of restricted stock. Restricted stock units generally vest in four installments with 25% of the shares vesting on each anniversary of the date of grant over 4 years. The Compensation Committee, however, may authorize grants with a different vesting schedule in the future. 27.0 million common shares were authorized and reserved for issuance under the 2006 Plan.
The 2001 Stock Incentive Plan (“2001 Plan”) was terminated upon approval of the 2006 Plan. Options to purchase common stock granted under the 2001 Plan remain outstanding and subject to the vesting and exercise terms of the original grant. The 2001 Plan authorized the award of non-qualified stock options and restricted stock awards to eligible employees, officers who are not subject to Section 16 reporting requirements, contractors and consultants. As of December 31, 2007, no restricted stock awards have been made under the 2001 Plan. Options were granted at an exercise price not less than 100% of the fair market value of VeriSign’s common stock on the date of grant. All options were granted at the discretion of the Board and have a term not greater than 10 years from the date of grant. Options issued generally vest 25% on the first anniversary date and ratably over the following 12 quarters. No further options can be granted under the 2001 Plan.
The 1998 Equity Incentive Plan (“1998 Plan”) was terminated upon approval of the 2006 Plan. Options to purchase common stock granted under the 1998 Plan remain outstanding and subject to the vesting and exercise terms of the original grant. The 1998 Plan authorized the award of options, restricted stock awards, restricted stock
147
VERISIGN, INC. AND SUBSIDIARIES
NOTES TO CONSOLIDATED FINANCIAL STATEMENTS—(Continued)
DECEMBER 31, 2007, 2006 AND 2005
units and stock bonuses. Options were granted at an exercise price not less than 100% of the fair market value of VeriSign’s common stock on the date of grant for incentive stock options and 85% of the fair market value for non-qualified stock options. All options were granted at the discretion of the Board and have a term not greater than 10 years from the date of grant. Options issued generally vest 25% on the first anniversary date and ratably over the following 12 quarters. Restricted stock awards and restricted stock units entitle the recipient to receive, at VeriSign’s discretion, shares or cash upon vesting. No further options can be granted under the 1998 Plan.
The 1998 Directors Plan (“Directors Plan”) was terminated upon the approval of the 2006 Plan. Options to purchase common stock granted under the Directors Plan remain outstanding and subject to the vesting and exercise terms of the original grant. Members of the Board who were not employees of VeriSign, or of any parent, subsidiary or affiliate of VeriSign, were eligible to participate in the Directors Plan. The option grants under the Directors Plan were automatic and non-discretionary, and the exercise price of the options was 100% of the fair market value of the common stock on the date of the grant. Each eligible director was initially granted an option to purchase 25,000 shares on the date he or she first became a director (“Initial Grant”). On each anniversary of a director’s Initial Grant or most recent grant if he or she was ineligible to receive an Initial Grant, each eligible director was automatically granted an additional option to purchase 12,500 shares of common stock if the director had served continuously as a director since the date of the Initial Grant or most recent grant. The term of the options under the Directors Plan is ten years and options vest as to 6.25% of the shares each quarter after the date of the grant, provided the optionee remains a director of VeriSign.
The 1995 Stock Option Plan and the 1997 Stock Option Plan (“1995 and 1997 Plans”) were terminated concurrent with VeriSign’s initial public offering in 1998. Options to purchase common stock granted under the 1995 and 1997 Plans remain outstanding and subject to the vesting and exercise terms of the original grant. All shares that remained available for future issuance under the 1995 and 1997 Plans at the time of their termination were transferred to the 1998 Equity Incentive Plan. No further options can be granted under the 1995 and 1997 Plans. Options granted under the 1995 and 1997 Plans are subject to terms substantially similar to those described below with respect to options granted under the 1998 Equity Incentive Plan.
VERISIGN, INC. AND SUBSIDIARIES
NOTES TO CONSOLIDATED FINANCIAL STATEMENTS—(Continued)
DECEMBER 31, 2004, 2003 AND 2002
The 1998 Equity Incentive Plan (“1998 Plan”) authorizes the award of options, restricted stock awards, restricted stock units and stock bonuses. Options may be granted at an exercise price not less than 100% of the fair market value of VeriSign’s common stock on the date of grant for incentive stock options and 85% of the fair market value for non-qualified stock options. All options are granted at the discretion of the Board and have a term not greater than 7 years from the date of grant. Options issued generally vest 25% on the first anniversary date and ratably over the following 12 quarters. During 2004, VeriSign granted 125,000 restricted stock units under its 1998 Equity Incentive Plan to Stratton Sclavos, its Chief Executive Officer. 100,000 of the restricted stock units progressively vest over a four-year period at the rate of 10%, 20%, 30% and 40% for each year. The remaining 25,000 restricted stock units vest 25% on the first anniversary date and ratably over the following 12 quarters. The aggregate market value of the restricted stock units granted to Mr. Sclavos at the date of issuance was $4.2 million and was recorded as deferred compensation and is being amortized ratably over the four year vesting period. During 2003, VeriSign granted 150,000 shares of restricted stock under the 1998 Equity Incentive Plan to certain executive officers. The shares vest over a two-year period, with 2/3 of the shares eligible to be sold at the end of two years and the remaining 1/3 eligible at the end of the third year. The aggregate market value of the restricted stock at the date of issuance was $1.9 million and was recorded as deferred compensation and is being amortized ratably over the two year vesting period. At December 31, 2004, 13,587,292 shares remain available for future awards under the 1998 Plan including shares transferred from the 1995 and 1997 plans that were terminated.
The 2001 Stock Incentive Plan (“2001 Plan”) authorizes the award of non-qualified stock options and restricted stock awards to eligible employees, officers who are not subject to Section 16 reporting requirements, contractors and consultants. As of December 31, 2004, no restricted stock awards have been made under the 2001 Plan. Options may be granted at an exercise price not less than the par value of VeriSign’s common stock on the date of grant. All options are granted at the discretion of the Board and have a term not greater than 10 years from the date of grant. Options issued generally vest 25% on the first anniversary date and ratably over the following 12 quarters. At December 31, 2004, 7,709,240 shares remain available for future awards under the 2001 Plan. On January 1 of each year beginning in 2002, the number of shares available for grant under the 2001 Plan will automatically be increased by an amount equal to 2% of the outstanding common shares on the immediately preceding December 31.
In November 2002, VeriSign offered all U.S. employees holding options granted under the 2001 Plan between January 1, 2001 and May 24, 2002 the opportunity to cancel those options and to receive in exchange a new option to be granted not less than six months and one day after the cancellation date of the existing option. The number of shares granted under the new option was dependent on the exercise price of the original option, as follows:
|
| |
| ||
| ||
|
Under this program, employees tendered options to purchase approximately 11.4 million shares, which were cancelled effective December 26, 2002. In exchange, VeriSign granted options to purchase approximately 6.8 million shares at an exercise price of $13.79 which was equal to the fair market value on the date of grant, June 30, 2003. Except for the exercise price, all terms and conditions of the new options are substantially the same as the cancelled option. In particular, the new option is vested to the same degree, as a percentage of the
VERISIGN, INC. AND SUBSIDIARIES
NOTES TO CONSOLIDATED FINANCIAL STATEMENTS—(Continued)
DECEMBER 31, 2004, 2003 AND 2002
option, that the cancelled option would have been vested on the new option date if the cancelled option had not been cancelled and will continue to vest on the same schedule as the cancelled option.
Members of the Board who are not employees of VeriSign, or of any parent, subsidiary or affiliate of VeriSign, are eligible to participate in the 1998 Directors Plan (“Directors Plan”). The option grants under the Directors Plan are automatic and non-discretionary, and the exercise price of the options is 100% of the fair market value of the common stock on the date of the grant. Each eligible director is initially granted an option to purchase 25,000 shares on the date he or she first becomes a director (“Initial Grant”). On each anniversary of a director’s Initial Grant or most recent grant if he or she was ineligible to receive an Initial Grant, each eligible director will automatically be granted an additional option to purchase 12,500 shares of common stock if the director has served continuously as a director since the date of the Initial Grant or most recent grant. The term of the options under the Directors Plan is ten years and options vest as to 6.25% of the shares each quarter after the date of the grant, provided the optionee remains a director of VeriSign. At December 31, 2004, 510,781 shares remain available for future grant under the Directors Plan.
In connection with its acquisitions in 2004,2005 and 2006, VeriSign assumed some of the acquired companies’ stock options. Options assumed generally have terms of seven to ten years and generally vest over a four-year period.
A summary of stockperiod, as set forth in the applicable option activity under all Plans is as follows:agreement.
| Year Ended December 31, | ||||||||||||||||||
| 2004 | 2003 | 2002 | ||||||||||||||||
| Shares | Weighted- Average Exercise Price | Shares | Weighted- Average Exercise Price | Shares | Weighted- Average Exercise Price | |||||||||||||
Outstanding at beginning of year | 31,999,664 | $ | 36.87 | 26,960,479 | $ | 47.41 | 37,340,507 | $ | 52.50 | |||||||||
Assumed in business combinations | 687,659 | 4.79 | — | — | — | — | ||||||||||||
Granted | 9,156,123 | 20.20 | 13,199,316 | 13.45 | 12,850,130 | 16.69 | ||||||||||||
Exercised | (4,391,205 | ) | 11.04 | (2,321,981 | ) | 9.05 | (2,506,354 | ) | 4.30 | |||||||||
Cancelled | (4,574,072 | ) | 45.98 | (5,838,150 | ) | 43.66 | (20,723,804 | ) | 42.70 | |||||||||
Outstanding at end of year | 32,878,169 | 33.74 | 31,999,664 | 36.87 | 26,960,479 | 47.41 | ||||||||||||
Exercisable at end of year | 17,085,569 | 48.19 | 18,156,403 | 48.05 | 13,874,208 | 52.94 | ||||||||||||
Weighted-average fair value of options granted during the year | 10.80 | 9.00 | 11.97 | |||||||||||||||
| Equals Market Price | Exceeds Market Price | |||||||||||||||||
| Year Ended December 31, | Year Ended December 31, | |||||||||||||||||
| 2004 | 2003 | 2002 | 2004 | 2003 | 2002 | |||||||||||||
Weighted-average exercise prices | $ | 19.52 | $ | 13.45 | $ | 16.69 | $ | 35.05 | $ | — | $ | — | ||||||
Weighted-average fair value on grant date | 10.49 | 9.00 | 11.97 | 17.51 | — | — | ||||||||||||
VERISIGN, INC. AND SUBSIDIARIES
NOTES TO CONSOLIDATED FINANCIAL STATEMENTS—(Continued)
DECEMBER 31, 2004, 2003 AND 2002
The following table summarizes information about stock options outstanding as of December 31, 2004:
Range of Exercise Prices | Shares Outstanding | Weighted-Average Remaining Contractual Life | Weighted-Average Exercise Price | Shares Exercisable | Weighted-Average Exercise Price | |||||||
$ .38–$ 10.00 | 2,227,506 | 3.69 years | $ | 7.01 | 1,491,645 | $ | 6.76 | |||||
$ 10.08–$ 13.65 | 5,912,299 | 4.53 years | 12.01 | 2,908,040 | 11.86 | |||||||
$ 13.79 | 3,934,872 | 4.68 years | 13.79 | 2,410,535 | 13.79 | |||||||
$ 14.06–$ 19.90 | 7,862,698 | 6.73 years | 17.20 | 296,161 | 16.24 | |||||||
$ 20.44–$ 29.63 | 3,603,459 | 4.74 years | 25.07 | 1,996,753 | 24.82 | |||||||
$ 30.08–$ 38.92 | 3,489,836 | 3.77 years | 35.23 | 2,405,340 | 35.85 | |||||||
$ 40.08–$ 49.94 | 421,233 | 4.00 years | 43.31 | 400,293 | 43.26 | |||||||
$ 50.11–$ 98.55 | 2,520,497 | 4.62 years | 67.94 | 2,271,033 | 69.22 | |||||||
$100.87–$149.97 | 1,165,548 | 1.47 years | 129.67 | 1,165,548 | 129.67 | |||||||
$150.09–$253.00 | 1,740,221 | 2.45 years | 160.53 | 1,740,221 | 160.53 | |||||||
| 32,878,169 | 4.74 years | 33.74 | 17,085,569 | 48.19 | ||||||||
1998 Employee Stock Purchase Plan
VeriSign has reserved 12,625,26017,589,449 shares for issuance under the 1998 Employee Stock Purchase Plan (“1998 Purchase Plan”). Eligible employees may purchase common stock through payroll deductions by electing to have between 2% and 15%25% of their compensation withheld. Each participant is granted an option to purchase common stock on the first day of each 24-month offering period and this option is automatically exercised on the last day of each six-month purchase period during the offering period. The purchase price for the common stock under the Purchase Plan is 85% of the lesser of the fair market value of the common stock on the first day of the applicable offering period andor the last day of the applicable purchase period. Offering periods begin on February 1 and August 1 of each year. Shares of common stock issued under the Purchase Plan totaled 2,312,572 in 2004, 1,997,230 in 2003, and 645,595 in 2002. As of December 31, 2004, 6,139,707 shares remain available for future issuance. On January 1 of each year, the number of shares available for grant under the 1998 Purchase Plan will automatically be increased by an amount equal to 1% of the outstanding common shares on the immediately preceding December 31. The weighted-average fair value ofOn December 18, 2007, the stock purchase rights granted under the1998 Purchase Plan was $6.89 in 2004, $5.76 in 2003,expired and $4.84 in 2002.no more shares will be available for future offering under this Purchase Plan.
VERISIGN, INC. AND SUBSIDIARIES
NOTES TO CONSOLIDATED FINANCIAL STATEMENTS—(Continued)
DECEMBER 31, 2004, 20032007, 2006 AND 20022005
2007 Employee Stock Purchase Plan
On August 30, 2007, the Company’s stockholders approved the 2007 Employee Stock Purchase Plan (“2007 Purchase Plan”) which replaces the 1998 Purchase Plan. As of December 31, 2007, a total of 6.0 million shares of the Company’s common stock is reserved for issuance under this plan. Eligible employees may purchase common stock through payroll deductions by electing to have between 2% and 25% of their compensation withheld. Each participant is granted an option to purchase common stock on the first day of each 24-month offering period and this option is automatically exercised on the last day of each six-month purchase period during the offering period. The purchase price for the common stock under the 2007 Purchase Plan is 85% of the lesser of the fair market value of the common stock on the first day of the applicable offering period or the last day of the applicable purchase period. Offering periods begin on February 1 and August 1 of each year.
Common Stock Reserved for Convertible Debentures
In August 2007, VeriSign issued $1.25 billion principal amount of convertible debentures as described in Note 10, “Junior Subordinated Convertible Debentures”. The debentures are initially convertible, subject to certain conditions, into shares of the Company common stock at a conversion rate of 29.0968 shares of common stock per $1,000 principal amount of debentures, representing an initial effective conversion price of approximately $34.37 per share of common stock. As of December 31, 2007, approximately 36.4 million shares of common stock were reserved for issuance upon conversion or repurchase of the convertible debentures.
149
VERISIGN, INC. AND SUBSIDIARIES
NOTES TO CONSOLIDATED FINANCIAL STATEMENTS—(Continued)
DECEMBER 31, 2007, 2006 AND 2005
Stock-based Compensation
On March 29, 2005, the SEC issued Staff Accounting Bulletin (“SAB”) No. 107, which provides the Staff’s views on a variety of matters relating to stock-based payments. SAB 107 requires stock-based compensation to be classified in the same expense line items as cash compensation. The following table sets forth the total stock-based compensation recognized:
| Year Ended December 31, | ||||||||||||
| 2007 | 2006 | 2005 | ||||||||||
| (In thousands, except per share data) | ||||||||||||
Stock-based compensation: | ||||||||||||
Cost of revenue | $ | 19,779 | $ | 14,750 | $ | 982 | ||||||
Sales and marketing | 21,116 | 15,210 | 173 | |||||||||
Research and development | 14,409 | 10,406 | 1,328 | |||||||||
General and administrative | 33,028 | 25,482 | (12,950 | ) | ||||||||
Restructuring, impairments and other charges (reversals), net | 2,297 | — | — | |||||||||
Other income, net | 285 | — | — | |||||||||
Total stock-based compensation | 90,914 | 65,848 | (10,467 | ) | ||||||||
Tax (benefit) expense associated with stock-based compensation expense | (21,192 | ) | (17,647 | ) | 3,946 | |||||||
Net effect of stock-based compensation expense (benefit) on net (loss) income | $ | 69,722 | $ | 48,201 | $ | (6,521 | ) | |||||
Net effect of stock-based compensation expense (benefit) on net (loss) income per share: | ||||||||||||
Basic | $ | 0.29 | $ | 0.20 | $ | (0.03 | ) | |||||
Diluted | $ | 0.29 | $ | 0.20 | $ | (0.02 | ) | |||||
Shares used in per share computation: | ||||||||||||
Basic | 237,707 | 244,421 | 257,368 | |||||||||
Diluted | 237,707 | 247,073 | 263,689 | |||||||||
As of December 31, 2007, total unrecognized compensation cost related to unvested stock options and restricted stock awards was $87.6 million and $132.2 million, respectively, and is expected to be recognized over a weighted-average period of 2.6 years and 3.2 years, respectively. Stock-based compensation cost capitalized for internally developed software was $2.1 million in 2007.
In 2006, the Company suspended stock option exercises (the “Restriction”) due to independent review of the Company’s historical stock option granting practices and restatement of consolidated financial statements. Under the Restriction, certain terminated employees were unable to exercise their stock options prior to the expiration of this time period following termination of employment. As a result, the Board of Directors approved the extension of time for option exercise and the Company recognized $2.2 million of incremental stock-based compensation expense in connection with this extension in accordance with SFAS 123R.
Prior to the adoption of SFAS 123R, the Company presented unearned compensation as a separate component of stockholders’ equity. In accordance with the provisions of SFAS 123R, VeriSign reclassified the balance in unearned compensation to additional paid-in capital on its balance sheet in fiscal year 2006.
VERISIGN, INC. AND SUBSIDIARIES
NOTES TO CONSOLIDATED FINANCIAL STATEMENTS—(Continued)
DECEMBER 31, 2007, 2006 AND 2005
VeriSign currently uses the Black-Scholes option pricing model to determine the fair value of stock options and Purchase Plan awards. The determination of the fair value of stock-based payment awards using an option-pricing model is affected by the Company’s stock price as well as assumptions regarding a number of complex and subjective variables. The following table sets forth the weighted-average assumptions used to estimate the fair value of the stock options and Purchase Plan awards:
| Year Ended December 31, | |||||||||
| 2007 | 2006 | 2005 | |||||||
Stock options: | |||||||||
Volatility | 37 | % | 39 | % | 56 | % | |||
Risk-free interest rate | 4.37 | % | 4.82 | % | 3.91 | % | |||
Expected term | 3.3 years | 3.4 years | 3.1 years | ||||||
Dividend yield | zero | zero | zero | ||||||
Employee Stock Purchase Plan awards: | |||||||||
Volatility | 28 | % | 33 | % | 55 | % | |||
Risk-free interest rate | 4.94 | % | 5.09 | % | 2.51 | % | |||
Expected term | 1.25 | 1.25 years | 1.25 years | ||||||
Dividend yield | zero | zero | zero | ||||||
Under SFAS 123R, VeriSign’s expected volatility is based on the combination of historical volatility of the Company’s common stock over the period commensurate with the expected life of the options and the mean historical implied volatility from traded options. The risk-free interest rates are derived from the average U.S. Treasury constant maturity rates during the period, which approximate the rate in effect at the time of grant for the respective expected term. The expected terms are based on the observed and expected time to post-vesting exercise and/or cancellation of options. VeriSign does not anticipate paying any cash dividends in the foreseeable future and therefore uses an expected dividend yield of zero. Under SFAS 123R, VeriSign estimates forfeitures at the time of grant and revises those estimates in subsequent periods if actual forfeitures differ from those estimates. The Company uses historical data to estimate pre-vesting option forfeitures and records stock-based compensation expense only for those awards that are expected to vest.
151
VERISIGN, INC. AND SUBSIDIARIES
NOTES TO CONSOLIDATED FINANCIAL STATEMENTS—(Continued)
DECEMBER 31, 2007, 2006 AND 2005
General Option Information
The following table summarizes stock option activity:
| Year Ended December 31, | ||||||||||||||||||
| 2007 | 2006 | 2005 | ||||||||||||||||
| Shares | Weighted- Average Exercise Price | Shares | Weighted- Average Exercise Price | Shares | Weighted- Average Exercise Price | |||||||||||||
Outstanding at beginning of period | 35,642,171 | $ | 28.38 | 35,638,232 | $ | 31.51 | 32,878,169 | $ | 33.74 | |||||||||
Assumed in business combinations | — | — | 846,953 | 1.99 | 1,645,508 | 3.71 | ||||||||||||
Granted | 4,516,611 | 29.80 | 7,387,257 | 20.50 | 10,053,156 | 25.95 | ||||||||||||
Exercised | (15,622,253 | ) | 18.62 | (2,466,900 | ) | 12.40 | (5,343,504 | ) | 11.48 | |||||||||
Forfeited | (8,132,440 | ) | 33.47 | (3,859,952 | ) | 41.27 | (2,919,635 | ) | 35.84 | |||||||||
Expired | (1,604,073 | ) | 137.33 | (1,903,419 | ) | 39.25 | (675,462 | ) | 126.32 | |||||||||
Outstanding at end of period | 14,800,016 | 24.52 | 35,642,171 | 28.38 | 35,638,232 | 31.51 | ||||||||||||
Exercisable at end of period | 5,410,362 | 22.13 | 24,474,024 | 32.69 | 26,404,992 | 41.36 | ||||||||||||
Weighted-average fair value of options granted during the period | $ | 9.44 | $ | 6.87 | $ | 10.80 | ||||||||||||
Total intrinsic value of options exercised during the period (in thousands) | $ | 220,323 | $ | 26,197 | $ | 78,731 | ||||||||||||
The following table summarizes information about stock options outstanding as of December 31, 2007:
| Stock Options Outstanding | Stock Options Exercisable | |||||||||||
Range of Exercise Prices | Shares Outstanding | Weighted-Average Remaining Contractual Life (in years) | Weighted-Average Exercise Price | Shares Exercisable | Weighted-Average Exercise Price | |||||||
$ 0.09–$9.99 | 472,415 | 4.3 | $ | 4.76 | 398,785 | $ | 4.96 | |||||
$ 10.00–$13.78 | 521,329 | 2.6 | 12.51 | 521,206 | 12.51 | |||||||
$ 13.79 | 506,706 | 1.2 | 13.79 | 506,706 | 13.79 | |||||||
$ 13.80–$19.99 | 2,827,472 | 4.5 | 18.42 | 1,288,970 | 18.60 | |||||||
$ 20.00–$24.99 | 2,375,784 | 5.0 | 22.88 | 679,513 | 22.75 | |||||||
$ 25.00–$29.99 | 6,515,490 | 5.4 | 27.90 | 1,363,841 | 26.91 | |||||||
$ 30.00–$39.99 | 1,326,150 | 5.3 | 33.41 | 396,671 | 34.11 | |||||||
$ 40.00–$59.99 | 194,757 | 1.7 | 43.55 | 194,757 | 43.55 | |||||||
$ 60.00–$99.99 | 43,259 | 2.8 | 71.90 | 43,259 | 71.90 | |||||||
$100.00–$253.00 | 16,654 | 2.5 | 179.62 | 16,654 | 179.62 | |||||||
| 14,800,016 | 4.8 | $ | 24.52 | 5,410,362 | $ | 22.13 | ||||||
Intrinsic value is calculated as the difference between the market value as of December 31, 2007, and the exercise price of the shares. The closing price of VeriSign’s stock was $37.61 on December 31, 2007, as reported by the NASDAQ Global Select Market. The aggregate intrinsic value of stock options outstanding and stock options exercisable with an exercise price below $37.61 as of December 31, 2007, was $198.8 million and $88.8 million, respectively. The weighted-average remaining contractual live for stock options outstanding and exercisable at December 31, 2007, was 4.82 years and 3.48 years, respectively.
VERISIGN, INC. AND SUBSIDIARIES
NOTES TO CONSOLIDATED FINANCIAL STATEMENTS—(Continued)
DECEMBER 31, 2007, 2006 AND 2005
Employee Stock Purchase Plans
Due to independent review of the Company’s historical stock option granting practices and restatement consolidated financial statements, the Company was precluded from selling shares and suspended its employee payroll withholdings for the purchase of its common stock under the 1998 Purchase Plan for six months in 2007. The Company terminated the six-month purchase period ended January 31, 2007 and no shares were issued. In February 2007, the Company refunded the 1998 Purchase Plan contributions totaling approximately $11.6 million. In July 2007, the Company resumed its employee payroll withholdings for the purchase of its common stock under the 1998 Purchase Plan and allowed its employees affected by the earlier suspension to make catch-up payments to their accounts for the lost payroll contributions attributable to the period when the Company was not current in its reporting obligations under the Securities Exchange Act of 1934. The Company also allowed employees to increase their contribution withholding percentages from 15% up to a maximum of 25% of their compensation, subject to applicable U.S. Internal Revenue Service (“IRS”) limits, effective August 1, 2007. The Company has accounted for the increases in employee payroll withholdings as modifications in accordance with FAS 123R. The Company recorded approximately $25.6 million of stock-based compensation expense for the 1998 and 2007 Purchase Plans in 2007.
Restricted Stock Units
The following table summarizes unvested restricted stock award activity:
| Year Ended December 31, | ||||||||||||||||||
| 2007 | 2006 | 2005 | ||||||||||||||||
| Shares | Weighted- Average Grant-Date Fair Value | Shares | Weighted- Average Grant-Date Fair Value | Shares | Weighted- Average Grant-Date Fair Value | |||||||||||||
Unvested at beginning of period | 2,107,327 | $ | 20.01 | 322,433 | $ | 27.97 | 275,000 | $ | 22.20 | |||||||||
Granted | 4,262,277 | 29.23 | 1,958,052 | 18.98 | 222,683 | 25.26 | ||||||||||||
Released | (548,510 | ) | 22.00 | (49,811 | ) | 29.27 | (166,250 | ) | 14.88 | |||||||||
Forfeited | (1,004,229 | ) | 22.98 | (123,347 | ) | 20.80 | (9,000 | ) | 26.40 | |||||||||
| 4,816,865 | $ | 27.32 | 2,107,327 | $ | 20.01 | 322,433 | $ | 27.97 | ||||||||||
As of December 31, 2007, the aggregate intrinsic value of unvested restricted stock units was $181.2 million and the weighted-average remaining contractual life was 1.99 years. During 2007, the Compensation Committee approved total grants of 640,406 market-based restricted stock units that would vest upon meeting certain stock-price appreciation and service conditions. The Company recorded $1.4 million of stock-based compensation for the market-based stock awards in 2007.
Stock Options/Awards Acceleration
In 2007, the Company accelerated the vesting of certain outstanding options to purchase shares of the Company’s common stock and restricted stock units held by Mr. Stratton Sclavos, the former Chief Executive Officer; Ms. Dana Evan, the former Chief Financial Officer and certain other employees. The Company accelerated the vesting of all of Mr. Sclavos’ unvested stock options and restricted stock units that were scheduled to vest within twenty-four (24) months after his resignation date. The Company accelerated the vesting of twenty-five percent (25%) of Ms. Dana Evan’s and certain other employees’ unvested “in-the-money” stock
153
VERISIGN, INC. AND SUBSIDIARIES
NOTES TO CONSOLIDATED FINANCIAL STATEMENTS—(Continued)
DECEMBER 31, 2007, 2006 AND 2005
options outstanding that had fair market values in excess of the respective exercise prices on the acceleration date and had the lowest exercise prices, and restricted stock units. The Company has accounted for the acceleration of the stock-based awards as a modification under FAS 123R. As such, the Company recognized approximately $12.8 million of stock-based compensation upon modification.
On December 29, 2005, VeriSign’s Board of Directors approved the acceleration of the vesting of unvested and “out-of-the-money” stock options that had an exercise price per share in excess of $24.99, all of which were previously granted under VeriSign’s stock option plans and that were outstanding on December 29, 2005. Options to purchase approximately 8.8 million shares of common stock or 47% of the total outstanding unvested options on December 29, 2005, were subject to the acceleration. The options accelerated included certain options previously granted to executive officers and directors of VeriSign. The acceleration was accompanied by restrictions imposed on any shares purchased through the exercise of accelerated options. Those restrictions will prevent the sale of any such shares prior to the date such shares would have originally vested had the optionee been employed on such date (whether or not the optionee is actually an employee at that time). The purpose of the accelerated vesting was to enable the Company to reduce compensation expense associated with these options in future periods, beginning with the first quarter of 2006, in its Consolidated Financial Statements, pursuant to SFAS 123R. The acceleration of the vesting of these options did not result in a charge to expenses in 2005. At the time of the acceleration, VeriSign estimated that the acceleration reduced stock-based compensation expense it otherwise would have been required to record by approximately $27.7 million in 2006.
During 2007, the Company commenced a tender offer (the “Offer”) pursuant to which the Company offered to amend or replace outstanding “Eligible Options” (as defined in the Offer) held by current employees of the Company subject to taxation in the United States so that those options would not be subject to adverse tax consequences under Internal Revenue Code Section 409A (“Section 409A”). Each eligible participant had the right to elect to amend his or her Eligible Options to increase the exercise price per share of the Company’s common stock, par value $0.001 per share, purchasable thereunder and become eligible to receive a special “Cash Bonus” (as defined in the Offer) from the Company, all upon the terms and subject to the conditions set forth in the Offer. Alternatively, certain tendered Eligible Options were, in lieu of such amendment, canceled and replaced with new options under the Company’s 2006 Equity Incentive Plan that would have exactly the same terms as the canceled options but would have a new grant date and avoid adverse tax consequences under Section 409A. The Company accrued approximately $6.8 million liability related to the special “Cash Bonus” at the end of fiscal year 2007.
Note 14. Income Taxes
(Loss) income from continuing operations before income taxes, includes net incomeloss from foreign operations of approximately $34.9 million for 2004. Income before income taxes includes net losses from foreign operations of approximately $30.2 millionunconsolidated entities and $217.8 million for 2003 and 2002, respectively.minority interest is categorized geographically as follows:
| Year Ended December 31, | |||||||||||
| 2007 | 2006 | 2005 | |||||||||
| (In thousands) | |||||||||||
(Loss) income from continuing operations before income taxes, loss from unconsolidated entities and minority interest: | |||||||||||
United States | $ | (166,375 | ) | $ | 146,794 | $ | 111,061 | ||||
Foreign | 38,633 | (13,267 | ) | 156,352 | |||||||
Total (loss) income from continuing operations before income taxes, loss from unconsolidated entities and minority interest | $ | (127,742 | ) | $ | 133,527 | $ | 267,413 | ||||
VERISIGN, INC. AND SUBSIDIARIES
NOTES TO CONSOLIDATED FINANCIAL STATEMENTS—(Continued)
DECEMBER 31, 2007, 2006 AND 2005
The provision for income taxes consisted of the following:
| Year Ended December 31, | ||||||||||||
| 2004 | 2003 | 2002 | ||||||||||
| (In thousands) | ||||||||||||
Continuing operations: | ||||||||||||
Current: | ||||||||||||
Federal | $ | 764 | $ | 1,568 | $ | — | ||||||
State | (1,011 | ) | 2,141 | 9,180 | ||||||||
Foreign, including foreign withholding tax | 29,506 | 13,103 | 8,705 | |||||||||
| 29,259 | 16,812 | 17,885 | ||||||||||
Deferred: | ||||||||||||
Federal | — | — | 2,148 | |||||||||
State | — | — | — | |||||||||
Foreign | (8,705 | ) | (1,008 | ) | (9,658 | ) | ||||||
| (8,705 | ) | (1,008 | ) | (7,510 | ) | |||||||
Income tax expense | 20,554 | 15,804 | 10,375 | |||||||||
Charge in lieu of taxes attributable to employee stock option plans | 4,748 | 5,004 | — | |||||||||
Charge in lieu of taxes resulting from initial recognition of acquired tax benefits that are allocated to reduce goodwill related to the acquired entity | 2,278 | 2,545 | — | |||||||||
| $ | 27,580 | $ | 23,353 | $ | 10,375 | |||||||
The increase between 2003 and 2004 to current tax expense for foreign operations was the result of including the operations of Jamba! AG which were acquired in 2004.
| Year Ended December 31, | ||||||||||||
| 2007 | 2006 | 2005 | ||||||||||
| (In thousands) | ||||||||||||
Continuing operations: | ||||||||||||
Current (expense) benefit: | ||||||||||||
Federal | $ | (17,689 | ) | $ | (70 | ) | $ | (50,129 | ) | |||
State | (1,693 | ) | (3,266 | ) | (13 | ) | ||||||
Foreign, including foreign withholding tax | (2,740 | ) | (38,997 | ) | (58,519 | ) | ||||||
| (22,122 | ) | (42,333 | ) | (108,661 | ) | |||||||
Deferred (expense) benefit: | ||||||||||||
Federal | 6,928 | 244,367 | — | |||||||||
State | 3,559 | 33,077 | — | |||||||||
Foreign | 555 | 8,537 | 7,875 | |||||||||
| 11,042 | 285,981 | 7,875 | ||||||||||
Income tax (expense) benefit | (11,080 | ) | 243,648 | (100,786 | ) | |||||||
Total Income tax (expense) benefit from continuing operations | $ | (11,080 | ) | $ | 243,648 | $ | (100,786 | ) | ||||
Tax expense from discontinued operations | $ | (2,026 | ) | $ | (2,363 | ) | $ | (132,504 | ) | |||
The difference between income tax expense and the amount resulting from applying the federal statutory rate of 35% to net (loss) income (loss)from continuing operations before income taxes, loss from unconsolidated entities and minority interest is attributable to the following:
| Year Ended December 31, | Year Ended December 31, | |||||||||||||||||||||||
| 2004 | 2003 | 2002 | 2007 | 2006 | 2005 | |||||||||||||||||||
| (In thousands) | (In thousands) | |||||||||||||||||||||||
Income tax expense (benefit) at federal statutory rate | $ | 74,831 | $ | (82,784 | ) | $ | (1,732,677 | ) | ||||||||||||||||
Income tax (expense) benefit at federal statutory rate | $ | 44,709 | $ | (46,734 | ) | $ | (93,595 | ) | ||||||||||||||||
State taxes, net of federal benefit | (1,481 | ) | 3,317 | 9,180 | 734 | 28,259 | (4,097 | ) | ||||||||||||||||
Differences between statutory rate and foreign effective tax rate | 12,434 | 24,978 | 6,166 | (4,271 | ) | (3,103 | ) | 296 | ||||||||||||||||
Goodwill impairment | — | 91,526 | 1,463,782 | |||||||||||||||||||||
Tax associated with intercompany prepaid royalty | — | (35,000 | ) | — | ||||||||||||||||||||
Non-deductible stock compensation | (5,274 | ) | (7,161 | ) | 4,382 | |||||||||||||||||||
Change in valuation allowance | (48,232 | ) | (17,372 | ) | 270,569 | 6,525 | 200,555 | (15,529 | ) | |||||||||||||||
Research and experimentation credit | (12,198 | ) | — | — | 7,045 | 6,329 | 4,332 | |||||||||||||||||
Benefit from capital loss IRS relief | — | 104,623 | — | |||||||||||||||||||||
Impairment of goodwill | (63,753 | ) | — | — | ||||||||||||||||||||
Other | 2,226 | 3,688 | (6,645 | ) | 3,205 | (4,120 | ) | 3,425 | ||||||||||||||||
Total income tax (expense) benefit. | $ | (11,080 | ) | $ | 243,648 | $ | (100,786 | ) | ||||||||||||||||
| $ | 27,580 | $ | 23,353 | $ | 10,375 | |||||||||||||||||||
155
VERISIGN, INC. AND SUBSIDIARIES
NOTES TO CONSOLIDATED FINANCIAL STATEMENTS—(Continued)
DECEMBER 31, 2004, 20032007, 2006 AND 20022005
The tax effects of temporary differences that give rise to significant portions of VeriSign’s deferred tax assets and liabilities are as follows:
| December 31, | As of December 31, | |||||||||||||||
| 2004 | 2003 | 2007 | 2006 | |||||||||||||
| (In thousands) | (In thousands) | |||||||||||||||
Deferred tax assets: | ||||||||||||||||
Net operating loss carryforwards | $ | 277,080 | $ | 250,520 | $ | 8,210 | $ | 49,682 | ||||||||
Deductible goodwill and intangible assets | 176,618 | 204,254 | 124,816 | 142,963 | ||||||||||||
Tax credit carryforwards | 27,693 | 11,812 | 15,541 | 17,975 | ||||||||||||
Property and equipment | 8,381 | 2,635 | 24,228 | 15,707 | ||||||||||||
Deferred revenue, accruals and reserves | 86,198 | 126,066 | 132,063 | 121,574 | ||||||||||||
Capital loss carryforwards | 82,334 | 107,179 | ||||||||||||||
Capital loss carryforwards and investments with differences in book and tax basis | 53,289 | 51,970 | ||||||||||||||
Other | 16,771 | 9,116 | 2,901 | 6,560 | ||||||||||||
Total deferred tax assets | 675,075 | 711,582 | 361,048 | 406,431 | ||||||||||||
Valuation allowance | (608,204 | ) | (637,662 | ) | (54,112 | ) | (60,636 | ) | ||||||||
Net deferred tax assets | 66,871 | 73,920 | 306,936 | 345,795 | ||||||||||||
Deferred tax liabilities: | ||||||||||||||||
Non-deductible acquired intangibles | (78,889 | ) | (56,631 | ) | ||||||||||||
Unrealized gain | — | (5,666 | ) | |||||||||||||
Deferred revenue, accruals and reserves | (5,147 | ) | (5,222 | ) | ||||||||||||
Non-deductible acquired intangible assets | (27,991 | ) | (105,168 | ) | ||||||||||||
Interest deduction on convertible debt | (2,611 | ) | — | |||||||||||||
Other | (244 | ) | (957 | ) | (29 | ) | (906 | ) | ||||||||
Total deferred tax liabilities | (79,133 | ) | (63,254 | ) | (35,778 | ) | (111,296 | ) | ||||||||
Total net deferred tax (liabilities) assets | $ | (12,262 | ) | $ | 10,666 | |||||||||||
Total net deferred tax assets | $ | 271,158 | $ | 234,499 | ||||||||||||
The totalworldwide change in 2007 to the Company’s valuation allowance decreased $29.5was a decrease of $6.5 million, primarily relating to foreign net operating losses. Prior to June 30, 2006, VeriSign provided a tax valuation allowance on its US federal and state deferred tax assets based on its evaluation that realizability of such assets was not “more likely than not” as required by GAAP accounting standards. The Company continuously evaluated additional facts representing positive and negative evidence in 2004 and $5.5 million in 2003. In assessingthe determination of the realizability of the deferred tax assets. Such deferred tax assets management considers whetherconsisted primarily of net operating loss carryforwards, temporary differences on tax-deductible goodwill and intangible assets, and temporary differences on deferred revenue. In the quarter ended June 30, 2006, based on additional evidence regarding its past earnings, scheduling of deferred tax liabilities and projected future taxable income from operating activities, the Company determined that it was more likely than not that the deferred assets would be realized. Accordingly, the Company released its valuation allowance of $236.4 million from its deferred tax assets resulting in a benefit to deferred tax expense in its statement of operations.
VeriSign continues to assess the future realization of net US deferred tax assets and believes that it is more likely than not that some portion or all of deferredforecasted income, tax assets will not be realized. The realization of deferred tax assets is based on several factors, including the Company’s past earnings and the schedulingeffects of deferred tax liabilities and projected future taxable income from operating activities. Management doesactivities will be sufficient to support future realization of net US deferred tax assets.
VeriSign continues to apply a valuation allowance on certain deferred tax assets which we did not believe it isare more likely than not that they would be realized. The Company continues to apply a valuation allowance on the deferred tax assets relating to U.S. federal and state operations are realizable. The amount of the deferred tax asset considered realizable, however, could be increased in the near future if the Company exhibits sufficient positive evidence in future periods that demonstrate the continuation of its trend in projected earnings is achievable. If the valuation allowance relating to deferred assets were released as of December 31, 2004, approximately $240.7 million would be credited to the statement of operations, $268.6 million would be credited to additional paid-in capital, and $5.4 million would be credited to goodwill. Management would continue to apply a valuation allowance of $33.4 million to the deferred tax asset for capital loss carryforwards and $48.9 million to the deferred tax asset relating to the write-downbook impairments of investments, due to the limited carryover life of such tax attributes. Management does not believe it is more likely than not that $11.2 million of deferred tax assets relating to certain foreign operations are realizable; therefore, a valuation allowance is applied to the deferred tax asset. On the remaining foreign operations, management believes it is more likely than not that deferred tax assets will be realized; accordingly, a valuation allowance was not applied on these assets.
As of December 31, 2004, VeriSign had federal net operating loss carryforwards of approximately $697.9 million, state net operating loss carryforwards of approximately $555.9 million, and foreign net operating loss carryforwards of approximately $49.0 million. If VeriSign is not able to use them, the federal net operating
VERISIGN, INC. AND SUBSIDIARIES
NOTES TO CONSOLIDATED FINANCIAL STATEMENTS—(Continued)
DECEMBER 31, 2004, 20032007, 2006 AND 20022005
limited carryforward period and character of such tax attributes. The amount of this deferred tax asset which continues to be subject to a valuation allowance was $53.3 million and $51.9 million as of December 31, 2007 and December 31, 2006, respectively.
As of December 31, 2007, the Company had US federal and state net operating loss carryforwards of approximately $520.9 million and $136.3 million respectively, including federal and state net operating loss carryforwards of $520.9 million and $130.4 million respectively, related to the settlement of employee stock awards. When recognized pursuant to the implementation FAS 123R, these net operating losses will result in a benefit to additional paid-in capital. The Company’s policy is to account for the utilization of tax attributes under a with-and-without approach. As of December 31, 2007, the Company had foreign net operating loss carryforwards of approximately $27.0 million.
If VeriSign is not able to use them, the US federal net operating loss carryforwards will expire in 20102020 through 20232026 and the state net operating loss carryforwards will expire in 20052008 through 2023. Foreign2027. Most of the Company’s foreign net operating loss carryforwards willdo not expire, but could be subject to future restrictions based on various dates.changes in the business or ownership of the foreign subsidiary.
As of December 31, 2007, VeriSign had US federal and state research and experimentation tax credits available for federal income tax purposesfuture years of approximately $18.6$37.9 million, available for carryforwardand $22.1 million respectively. Of the $37.9 million federal research credit, $7.9 million will be recognized as a benefit to future years, and for state income tax purposes of approximately $13.9 million available for carryforward to future years.paid-in capital when utilized. The federal research and experimentation tax credits will expire, if not utilized, in 20102011 through 2024. State2027. Most state research and experimentation tax credits carry forward indefinitely until utilized.
The Tax Reform Act of 1986 imposes substantial restrictions on the utilization of net operating losses and tax credits in the event of a corporation’s ownership change, as defined in the Internal Revenue Code. VeriSign’sVeriSign experienced cumulative changes in ownership of greater than 50 percent in 2003 and 2002. These changes in ownership resulted in the imposition of an annual limitation on its ability to utilize certain U.S. federal and state net operating loss carryforwards mayof $232.9 million and $116.5 million, respectively. Losses not utilized due to these limitations can be limited as a result of such ownership changes.carried forward, but are subject to the expiration dates described above.
Deferred income taxes have not been provided on the undistributed earnings of foreign subsidiaries. The amount of such earnings included in consolidated retained earnings at December 31, 20042007 was $10.0$259.5 million, principally from VeriSign Japan KK.KK and VeriSign Switzerland SA. These earnings have been permanently reinvested and we doVeriSign does not plan to initiate any action that would precipitate the payment of income taxes thereon. It is not practicable to estimate the amount of additional tax that might be payable on the undistributed foreign earnings.
The Company’s effective rate in 2007 differs from 2006 primarily because of the 2007 impairment to goodwill which is nondeductible for tax purposes, the 2006 reduction in its valuation allowance, and the implementation in 2006 of a global business structure. The Company’s effective rate in 2007 also differs from 2006 because the Company was granted relief from the IRS in 2006 for an uncertainty regarding a tax benefit resulting from a prior divestiture. As a result, the Company benefited income tax expense $113.4 million in 2006.
The Company adopted the provisions of FIN 48 on January 1, 2007. The cumulative effect of adopting FIN 48 was a decrease in tax reserves of $9.3 million, an increase to non-current deferred tax assets of $26.2 million, and an increase of $35.5 million to the January 1, 2007 retained earnings balance. Included in this amount is an adjustment made by the Company in the fourth quarter of 2007 to increase accumulated deficit by $2.5 million. Upon adoption, the liability for income taxes associated with uncertain tax positions at January 1, 2007 was
157
VERISIGN, INC. AND SUBSIDIARIES
NOTES TO CONSOLIDATED FINANCIAL STATEMENTS—(Continued)
DECEMBER 31, 2007, 2006 AND 2005
$45.0 million. A reconciliation of the beginning and ending balances of the total amounts of gross unrecognized tax benefits is as follows (in thousands):
Gross unrecognized tax benefits at January 1, 2007 | $ | 45,016 | * | |
Increases in tax positions for prior years | 3,932 | |||
Decreases in tax positions for prior years | (13,482 | ) | ||
Increases in tax positions for current year | 5,916 | |||
Settlements | — | |||
Lapse in statute of limitations | — | |||
Gross unrecognized tax benefits at December 31, 2007 | $ | 41,382 | ||
| * | In the fourth quarter of 2007, the Company decreased the previously disclosed balance for unrecognized tax benefits by $37.8 million. This correction does not have an impact on the financial statements. |
As of December 31, 2007, approximately $45.0 million of unrecognized tax benefit, including penalties and interest could affect the Company’s tax provision and effective tax rate.
In accordance with its accounting policy, the Company recognizes accrued interest and penalties related unrecognized tax benefits as a component of tax expense. At January 1, 2007, the Company had $9.3 million of accrued interest and penalties. For the year ended December 31, 2007, the Company expensed an additional amount of $2.4 million for interest and penalties related to income tax liabilities through income tax expense.
We are currently under examination by the IRS and the California Franchise Tax Board for the years ended December 31, 2004 and December 31, 2005. The Company is also under examination by numerous state taxing jurisdictions. Because the Company uses historic net operating loss carryforwards and other tax attributes to offset its taxable income in current and future years, such attributes can be adjusted by the IRS and other taxing authorities until the statute closes on the year in which such attribute was utilized. The Company is not currently under examination by significant international taxing jurisdictions. The statutes of limitations for these jurisdictions are generally 5 years. It is reasonably possible that the balance of unrecognized tax benefits could decrease by $15 million in the next 12 months.
Note 15. Commitments and Contingencies
Leases
VeriSign leases a portion of its facilities under operating leases that extend through 20142017, and subleases a portion of its office space to third parties. The minimum lease payments under non-cancelable operating leases and the future minimum contractual sublease income as of December 31, 20042007, are as follows:
Operating Lease Payments | Sublease Income | Net Lease Payments | Operating Lease Payments | Sublease Income | Net Lease Payments | |||||||||||||||
| (In thousands) | (In thousands) | |||||||||||||||||||
2005 | $ | 27,648 | $ | (4,111 | ) | $ | 23,537 | |||||||||||||
2006 | 21,234 | (3,371 | ) | 17,863 | ||||||||||||||||
2007 | 16,630 | (2,854 | ) | 13,776 | ||||||||||||||||
2008 | 12,681 | (2,527 | ) | 10,154 | $ | 26,135 | $ | (537 | ) | $ | 25,598 | |||||||||
2009 | 11,354 | (73 | ) | 11,281 | 22,113 | (654 | ) | $ | 21,459 | |||||||||||
2010 | 18,859 | (11 | ) | $ | 18,848 | |||||||||||||||
2011 | 14,917 | (3 | ) | $ | 14,914 | |||||||||||||||
2012 | 9,426 | — | $ | 9,426 | ||||||||||||||||
Thereafter | 30,051 | (168 | ) | 29,883 | 24,284 | — | $ | 24,284 | ||||||||||||
Total | $ | 119,598 | $ | (13,104 | ) | $ | 106,494 | $ | 115,734 | $ | (1,205 | ) | $ | 114,529 | ||||||
VERISIGN, INC. AND SUBSIDIARIES
NOTES TO CONSOLIDATED FINANCIAL STATEMENTS—(Continued)
DECEMBER 31, 2007, 2006 AND 2005
Future operating lease payments include payments related to leases on excess facilities included in VeriSign’s restructuring plans.
Net rental expense under operating leases was $16.3$25.7 million in 2004, $23.62007, $29.2 million in 2003,2006, and $21.8$20.7 million in 2002.2005. VeriSign has subleased offices to various companies under non-cancelable operating leases. VeriSign received payments of $4.3$0.1 million in 2004, $1.62007, $0.6 million in 2003,2006, and $3.1$3.6 million in 2002.2005.
Restricted CashPurchase Obligations and Contractual Agreements
AsThe following table represents the minimum payments required by VeriSign under certain purchase obligations, the contractual agreement with the Internet Corporation for Assigned Names and Numbers (“ICANN”), and the interest payments and principal on the convertible debentures:
| Purchase Obligations | ICANN Agreement | Convertible Debentures | |||||||
| (In thousands) | |||||||||
2008 | $ | 39,577 | $ | 10,000 | $ | 40,061 | |||
2009 | 10,447 | 12,000 | 40,625 | ||||||
2010 | 1,555 | 12,000 | 40,625 | ||||||
2011 | 510 | 12,000 | 40,625 | ||||||
2012 | 43 | 11,000 | 40,625 | ||||||
Thereafter | — | — | 2,265,625 | ||||||
Total minimum payments | $ | 52,132 | $ | 57,000 | $ | 2,468,186 | |||
VeriSign enters into certain purchase obligations with various vendors. The Company’s significant purchase obligations primarily consist of Decemberfirm commitments with telecommunication carriers and other service providers. The Company does not have any significant purchase obligations beyond 2012.
In 2006, the Company entered into a contractual agreement with ICANN to be the sole registry operator for domain names in the .com top-level domain through November 30, 2012. Under the new agreement, the Company paid ICANN fixed, registry level fees of $10.0 million during 2007. Beginning in 2009, the agreement provides for contingent payments upon meeting certain criteria based on growth in annual domain name registrations that could amount to an additional $20.5 million through the end of the contract.
In August 2007, the Company issued $1.25 billion principal amount of 3.25% convertible debentures due August 15, 2037. The Company will pay cash interest at an annual rate of 3.25% payable semiannually on February 15 and August 15 of each year, beginning February 15, 2008 until maturity. See Note 10, “Junior Subordinated Convertible Debentures,” for more information.
Legal Proceedings
On September 7, 2001, NetMoneyIN, an Arizona corporation, filed a complaint alleging patent infringement against VeriSign and several other previously-named defendants in the United States District Court for the District of Arizona asserting infringement of certain patents. The complaint alleged that VeriSign’s Payflow payment products and services directly infringe certain claims of NetMoneyIN’s three patents and requested the Court to enter judgment in favor of NetMoneyIN, a permanent injunction against the defendants’ alleged infringing activities, an order requiring defendants to provide an accounting for NetMoneyIN’s damages, to pay
159
VERISIGN, INC. AND SUBSIDIARIES
NOTES TO CONSOLIDATED FINANCIAL STATEMENTS—(Continued)
DECEMBER 31, 2004, restricted cash includes $45.0 million2007, 2006 AND 2005
NetMoneyIN such damages and three times that amount for any willful infringers, and an order awarding NetMoneyIN attorney fees and costs. NetMoneyIN has withdrawn its allegations of cashinfringement of one of the patents and the Court has dismissed with prejudice all claims of infringement of such patent. In its ruling on the claim construction issues, the Court found some of the claims asserted against VeriSign to be valid. NetMoneyIN may file an appeal after a final judgment seeking to overturn this ruling. Only one claim remains in the case. On July 13, 2007, the Court issued an order granting summary judgment in favor of VeriSign based on the Court’s finding that such claim is invalid, and denying all other pending dispositive motions. On August 29, 2007, Plaintiff filed a Notice of Appeal. On September 19, 2007, the U.S. Court of Appeals for the Federal Circuit docketed the appeal. While VeriSign cannot predict the outcome of this lawsuit, the Company believes that the allegations are without merit.
On February 14, 2005, Southeast Texas Medical Associates, LLP filed a putative class action lawsuit in the Superior Court of California, alleging violations of the unfair competition laws, breach of express warranty and unjust enrichment relating to the Company’s Secure Site Pro SSL certificates. The complaint is brought on behalf of a class of persons who purchased the Secure Site Pro certificate from February 2001 to present. On April 17, 2006, the class was certified and class notice was issued on May 21, 2007. VeriSign disputes these claims. While VeriSign cannot predict the outcome of this matter, the Company believes that the allegations are without merit.
On April 11, 2005, Prism Technologies, LLC filed a complaint against VeriSign in the U.S. District Court for the District of Delaware alleging that VeriSign’s “Go Secure” suite of application and related hardware and software products and its Unified Authentication solution and related hardware and software products, including the VeriSign Identity Protection (“VIP”) product” infringe U.S. Patent No. 6,516,416, entitled “Subscription Access System for Use With an Untrusted Network.” Prism Technologies seeks judgment in favor of Prism Technologies, a permanent injunction from infringement, damages in an amount not less than a reasonable royalty, attorneys’ fees and costs. On April 2, 2007, the Court issued a ruling from the Markman claim construction hearing. On April 13, 2007, the Court granted Defendants’ Motion for Leave to File Amended Answers and Counterclaims to add an inequitable conduct defense. On April 23, 2007, on the basis of the Markman claim construction ruling, the Court entered a stipulated Final Judgment of Non-Infringement, dismissing all claims and counterclaims in the case. On April 27, 2007, Plaintiff filed a Notice of Appeal. On February 5, 2008, the U.S. Court of Appeals for the Federal Circuit affirmed the district court's claim construction ruling and dismissal in VeriSign's favor.
On June 26, 2006, VeriSign received a grand jury subpoena from the U.S. Attorney for the Northern District of California requesting documents relating to VeriSign’s stock option grants and practices. VeriSign also received an informal inquiry from the Securities and Exchange Commission (“SEC”) requesting documents related to VeriSign’s stock option grants and practices. On February 9, 2007, VeriSign received a formal order of investigation from the SEC. On October 29, 2007, the SEC issued a letter to VeriSign stating that the investigation had been terminated with no enforcement action recommended to the Commission.
On July 6, 2006, a stockholder derivative complaint (Parnes v. Bidzos, et al., and VeriSign) was filed against the Company, as a nominal defendant, and certain of its current and former directors and executive officers related to certain historical stock option grants. The complaint seeks unspecified damages on behalf of VeriSign, constructive trust established duringand other equitable relief. Two other derivative actions were filed, one in Untied States District Court for the first quarterNorthern District of 2004 for VeriSign’s directorCalifornia (Port Authority v. Bidzos, et al., and officer liability self-insurance coverage. As of December 31, 2004VeriSign), and December 31, 2003,one in state court (Port Authority v. Bidzos, et al., and VeriSign) on August 14, 2006. VeriSign has pledged approximately $6.5 millionis named as a nominal defendant in these actions. The federal actions have been consolidated and $18.4 million, respectively,plaintiffs filed a consolidated complaint on November 20, 2006. Motions to dismiss the consolidated federal court complaint were heard on
VERISIGN, INC. AND SUBSIDIARIES
NOTES TO CONSOLIDATED FINANCIAL STATEMENTS—(Continued)
DECEMBER 31, 2004, 20032007, 2006 AND 20022005
classified as restricted cashMay 23, 2007. Those motions were granted on September 14, 2007. Motions to stay the state court action are pending. On May 15, 2007, a putative class action (Mykityshyn v. Bidzos, et al., and VeriSign) was filed in Superior Court for the State of California, Santa Clara County naming the Company and certain current and former officers and directors, alleging false representations and disclosure failures regarding certain historical stock option grants. The plaintiff purports to represent all individuals who owned VeriSign common stock between April 3, 2002, and August 9, 2006. The complaint seeks rescission of amendments to the 1998 and 2006 Option Plans and the cancellation of shares added to the 1998 Option Plan. The complaint also seeks to enjoin defendants from granting any stock options and from allowing the exercise of any currently outstanding options granted under the 1998 and 2006 Option Plans. The complaint seeks an unspecified amount of compensatory damages, costs and attorneys fees. The identical case was filed in state court under a separate name (Pace. v. Bidzos, et al., and VeriSign) on June 19, 2007, and on October 3, 2007 (Mehdian v. Bidzos, et al.). On December 3, 2007, a consolidated complaint was filed in Superior Court for the State of California, Santa Clara County. VeriSign and the individual defendants dispute all of these claims.
On November 7, 2006, a judgment was entered against VeriSign by an Italian trial court in the matter of Penco v. VeriSign, Inc., for Euro 5.8 million plus fees arising from a lawsuit brought by a former consultant who claimed to be owed commissions. VeriSign was granted a stay on execution of the judgment. VeriSign has appealed the lower court’s ruling on the accompanying balance sheets,merits and the hearing on the appeal is scheduled in May 2008. VeriSign believes the claims are without merit.
On November 30, 2006, Freedom Wireless, Inc. filed a complaint against VeriSign and other defendants alleging that VeriSign infringes certain patents by making, using, selling or supplying products, methods or services relating to supplying prepaid wireless telephone services to telecommunications companies. VeriSign filed an answer to the complaint on January 25, 2007. The lawsuit is pending in the United States District Court for the Eastern District of Texas. While VeriSign cannot predict the outcome of this matter, the Company believes that the allegations are without merit and intends to vigorously defend against them.
On January 31, 2007, VeriSign and News Corporation finalized a joint venture giving News Corporation a controlling interest in VeriSign’s wholly owned Jamba subsidiary. Accordingly, effective January 31, 2007, VeriSign transferred to the joint venture direction and control of all litigation, described in prior reports filed with the SEC, relating to Jamba! GmbH and Jamster International Sarl.
On May 31, 2007, plaintiffs Karen Herbert, et al., on behalf of themselves and a nationwide class of consumers, filed a complaint against VeriSign, Inc., m-Qube, Inc., and other defendants alleging that defendants collectively operate an illegal lottery under the laws of multiple states by allowing viewers of the NBC television show “Deal or No Deal” to incur premium text message charges in order to participate in an interactive television promotion called “Lucky Case Game.” The lawsuit is pending in the United States District Court for the Central District of California, Western Division. On June 5, 2007, plaintiffs Cheryl Bentley, et al., on behalf of themselves and a nationwide class of consumers, filed a complaint against VeriSign, Inc., m-Qube, Inc., and other defendants alleging that defendants collectively operate an illegal lottery under the laws of multiple states by allowing viewers of the NBC television show “The Apprentice” to incur premium text message charges in order to participate in an interactive television promotion called “Get Rich With Trump.” The lawsuit is pending in the United States District Court for the Central District of California, Western Division. On June 7, 2007, plaintiffs Michael and Michele Hardin, on behalf of themselves and a nationwide class of consumers, filed a complaint against VeriSign, Inc. and other defendants alleging that defendants collectively operate various “gambling games” in violation of Georgia state law. Plaintiffs allege that interactive television promotions contained in various broadcasts, including NBC’s “Deal or No Deal,” wrongly permit participants to incur
161
VERISIGN, INC. AND SUBSIDIARIES
NOTES TO CONSOLIDATED FINANCIAL STATEMENTS—(Continued)
DECEMBER 31, 2007, 2006 AND 2005
premium text message charges in order to participate in the promotions to win a prize. The lawsuit is pending in the United States District Court for the Northern District of Georgia, Gainesville Division. While VeriSign cannot predict the outcome of any of these matters, the Company believes that the allegations in each of them are without merit and intends to vigorously defend against them.
On October 9, 2007, the Associated Press (“AP”) filed a complaint in federal court in New York against Moreover Technologies, Inc. and VeriSign, Inc. for copyright and trademark infringement and other claims arising from the Real Time Publishing business. The complaint seeks unspecified compensatory, punitive and treble damages and a permanent injunction. While VeriSign cannot predict the outcome of this matter, the Company intends to vigorously defend against the claims.
VeriSign is involved in various other investigations, claims and lawsuits arising in the normal conduct of its business, none of which, in the Company’s opinion will have a material effect on its business. VeriSign cannot assure you that it will prevail in any litigation. Regardless of the outcome, any litigation may require VeriSign to incur significant litigation expense and may result in significant diversion of management attention.
Indemnification
VeriSign enters into indemnification agreements with many of its customers and certain other business partners in the ordinary course of business. These agreements include provisions for indemnifying the customer, or business partner, applicable, against claims brought by third-parties that allege a VeriSign product infringes a patent, copyright or trademark, misappropriates a trade secret, or violates other proprietary rights of that third-party. These indemnification obligations are generally subject to limits as specified in the agreement. It is not possible to estimate the maximum potential amount of future payments VeriSign could be required to make under these indemnification agreements. VeriSign incurred no significant expenses to defend lawsuits or settle claims arising from indemnification agreements at December 31, 2007 or 2006.
At the Company’s discretion and in the ordinary course of business, VeriSign subcontracts the performance of certain services. VeriSign enters into indemnification agreements that indemnify customers against certain losses caused by the Company’s employees and subcontractors. These indemnification obligations are generally subject to limits as specified in the agreement. It is not possible to estimate the maximum potential amount of future payments VeriSign could be required to make under these indemnification agreements. The Company maintains insurance policies that may enable VeriSign to recover a portion of any such claim. VeriSign has not recorded any liabilities for these indemnification agreements at December 31, 2007 or 2006.
Off-Balance Sheet Arrangements
As of December 31, 2007, the Company did not have any relationships with unconsolidated entities or financial partnerships, such as entities often referred to as structured finance or special purpose entities, which would have been established for the purpose of facilitating off-balance sheet arrangements or other contractually narrow or limited purposes. As such, the Company is not exposed to any financing, liquidity, market or credit risk that could arise if the Company had engaged in such relationships.
It is not the Company’s business practice to enter into off-balance sheet arrangements. However, in the normal course of business, the Company does enter into contracts in which it makes representations and warranties that guarantee the performance of the Company's products and services as well as other indemnifications entered into in the normal course of business. Historically, there have been no significant losses
VERISIGN, INC. AND SUBSIDIARIES
NOTES TO CONSOLIDATED FINANCIAL STATEMENTS—(Continued)
DECEMBER 31, 2007, 2006 AND 2005
related to such guarantees and indemnifications. As of December 31, 2007 and 2006, VeriSign has pledged approximately $2.5 million and $4.4 million, respectively, as collateral for standby letters of credit that guarantee certain of its contractual obligations, primarily relating to its real estate lease agreements, the longest of which is expected to mature in 2014.
Legal Proceedings
VeriSign is engaged in several complaints, lawsuits and investigations arising in the ordinary course of business. VeriSign believes that it has adequate legal defenses and that the ultimate outcome of these actions will not have a material effect on VeriSign’s consolidated financial position and results of operations.
VeriSign conducts business throughout the world and transacts in multiple foreign currencies. As VeriSign continues to expand its international operations, the Company is increasingly exposed to foreign currency risks. In the fourth quarter of 2003, VeriSign initiated a foreign currency risk management program designed to mitigate foreign exchange risks associated with the monetary assets and liabilities of its operations that are denominated in non-functional currencies. The primary objective of this hedging program is to minimize the gains and losses resulting from fluctuations in exchange rates. The Company does not enter into foreign currency transactions for trading or speculative purposes, nor does it hedge foreign currency exposures in a manner that entirely offsets the effects of changes in exchange rates. The program may entail the use of forward or option contracts and in each case these contracts are limited to a duration of less than 12 months.
At December 31, 2004, VeriSign held forward contracts in notional amounts totaling approximately $54.5 million to mitigate the impact of exchange rate fluctuations associated with certain foreign currencies. All hedge contracts were recorded at fair market value on the balance sheet and in earnings at year end 2004 and 2003. The Company attempts to limit its exposure to credit risk by executing foreign exchange contracts with high-quality financial institutions.
Note 16. Segment Information
Description of Segments
During 2004, VeriSign operated itsThe Company’s business inconsists of two reportable segments: the Internet Services Group and the Communications Services Group. During 2003 and 2002, VeriSign operated its business in three reportable segments: the Internet Services Group, the Communications Services Group, and the Network Solutions business segment. The Network Solutions business provided domain name registration, and value added services such as business email, websites, hosting and other web presence services. On November 25, 2003, VeriSign completed the sale of its Network Solutions business to Pivotal Private Equity.
The Internet Services Group consists of the Information and Security Services business and the Naming and Directory Services business. The Information and Security Services business provides products and services that protect online and network interactions, enabling companies to enterprisesmanage reputational, operational and organizations that want to establish and deliver secure Internet-based services for their customers and business partners, including the following types of services: enterprise security services, including VeriSign’s managed security and authentication services, and e-commerce services, including Web trust and payment services.compliance risks. The Naming and Directory Services business provides registry services asis the exclusive registryauthoritative directory provider of all.com, .net, .cc, and .tvdomain names in the.comand .netgTLDs and certain ccTLDs, as well as providing certain value added services.
VERISIGN, INC. AND SUBSIDIARIES
NOTES TO CONSOLIDATED FINANCIAL STATEMENTS—(Continued)
DECEMBER 31, 2004, 2003 AND 2002
names. The Communications Services Group provides specialized managed communications services, to wirelinesuch as connectivity and wireless telecommunications carriers, cable companiesinteroperability services and enterprise customers. VeriSign’s managed communications service offerings include network services, intelligent database services; commerce services, such as billing and directoryoperational support system services, application services,and mobile commerce services; and content services, such as digital content and billing and paymentmessaging services.
The segments were determined based primarily on how the chief operating decision maker (“CODM”) views and evaluates VeriSign’s operations. VeriSign’s Chief Executive Officer has been identified as the CODM as defined by SFAS No. 131, “Disclosures About Segments of an Enterprise and Related Information.” Other factors, including customer base, homogeneity of products, technology and delivery channels, were also considered in determining the reportable segments. Additionally, the performance of the Internet Services Group and the Communications Services Group is the measure used by the CODM for purposes of making decisions about allocating resources between the segments.
The accounting policies used to derive reportable segment results are generally the same as those described in Note 1.
The following table reflects the results of VeriSign’s reportable segments. Internal revenues and segment gross margin include transactions between segments that are intended to reflect an arm’s length transfer at the best price available for comparable external transactions.segments:
Internet Services Group | Communications Services Group | Network Solutions | Unallocated Corporate Expenses | Total | |||||||||||||||
| (In thousands) | |||||||||||||||||||
Year ended December 31, 2004: | |||||||||||||||||||
Revenues | $ | 564,148 | $ | 602,307 | $ | — | $ | — | $ | 1,166,455 | |||||||||
Cost of revenues | 124,859 | 291,613 | — | 28,287 | 444,759 | ||||||||||||||
Gross margin | $ | 439,289 | $ | 310,694 | $ | — | $ | (28,287 | ) | $ | 721,696 | ||||||||
Year ended December 31, 2003: | |||||||||||||||||||
Total revenues | $ | 484,139 | $ | 406,745 | $ | 211,819 | $ | — | $ | 1,102,703 | |||||||||
Internal revenues | (47,923 | ) | — | — | — | (47,923 | ) | ||||||||||||
External revenues | $ | 436,216 | $ | 406,745 | $ | 211,819 | $ | — | $ | 1,054,780 | |||||||||
Total cost of revenues | $ | 117,033 | $ | 225,890 | $ | 117,412 | $ | 33,795 | $ | 494,130 | |||||||||
Internal cost of revenues | — | — | (47,923 | ) | — | (47,923 | ) | ||||||||||||
External cost of revenues | $ | 117,033 | $ | 225,890 | $ | 69,489 | $ | 33,795 | $ | 446,207 | |||||||||
Gross margin after eliminations | $ | 319,183 | $ | 180,855 | $ | 142,330 | $ | (33,795 | ) | $ | 608,573 | ||||||||
Year ended December 31, 2002: | |||||||||||||||||||
Total revenues | $ | 613,022 | $ | 385,734 | $ | 311,169 | $ | — | $ | 1,309,925 | |||||||||
Internal revenues | (88,257 | ) | — | — | — | (88,257 | ) | ||||||||||||
External revenues | $ | 524,765 | $ | 385,734 | $ | 311,169 | $ | — | $ | 1,221,668 | |||||||||
Total cost of revenues | $ | 242,500 | $ | 210,327 | $ | 178,891 | $ | 27,906 | $ | 659,624 | |||||||||
Internal cost of revenues | — | — | (88,257 | ) | — | (88,257 | ) | ||||||||||||
External cost of revenues | $ | 242,500 | $ | 210,327 | $ | 90,634 | $ | 27,906 | $ | 571,367 | |||||||||
Gross margin after eliminations | $ | 282,265 | $ | 175,407 | $ | 220,535 | $ | (27,906 | ) | $ | 650,301 | ||||||||
| Internet Services Group | Communications Services Group | Total Segments | |||||||
| (In thousands) | |||||||||
Year ended December 31, 2007: | |||||||||
Revenues | $ | 916,984 | $ | 579,305 | $ | 1,496,289 | |||
Cost of revenues | 163,092 | 355,763 | 518,855 | ||||||
Gross margin | $ | 753,892 | $ | 223,542 | $ | 977,434 | |||
Year ended December 31, 2006: | |||||||||
Revenues | $ | 758,763 | $ | 804,235 | $ | 1,562,998 | |||
Cost of revenues | 162,228 | 362,599 | 524,827 | ||||||
Gross margin | $ | 596,535 | $ | 441,636 | $ | 1,038,171 | |||
Year ended December 31, 2005: | |||||||||
Revenues | $ | 633,784 | $ | 970,793 | $ | 1,604,577 | |||
Cost of revenues | 131,589 | 340,288 | 471,877 | ||||||
Gross margin | $ | 502,195 | $ | 630,505 | $ | 1,132,700 | |||
163
VERISIGN, INC. AND SUBSIDIARIES
NOTES TO CONSOLIDATED FINANCIAL STATEMENTS—(Continued)
DECEMBER 31, 2004, 20032007, 2006 AND 20022005
ReconciliationA reconciliation of the totals reported for the reportable segments to VeriSign,the applicable line items in the Consolidated Financial Statements is as Reportedfollows:
| Year Ended December 31, | ||||||||||||
| 2004 | 2003 | 2002 | ||||||||||
| (In thousands) | ||||||||||||
Revenues: | ||||||||||||
Total segments | $ | 1,166,455 | $ | 1,102,703 | $ | 1,309,925 | ||||||
Elimination of internal revenues | — | (47,923 | ) | (88,257 | ) | |||||||
Revenues, as reported | $ | 1,166,455 | $ | 1,054,780 | $ | 1,221,668 | ||||||
Net income (loss): | ||||||||||||
Total segments’ gross margin | $ | 721,696 | $ | 608,573 | $ | 650,301 | ||||||
Operating expenses | (589,968 | ) | (836,823 | ) | (5,451,934 | ) | ||||||
Other income (expense), net | 82,077 | (8,276 | ) | (149,289 | ) | |||||||
Income tax expense | (27,580 | ) | (23,353 | ) | (10,375 | ) | ||||||
Net income (loss), as reported | $ | 186,225 | $ | (259,879 | ) | $ | (4,961,297 | ) | ||||
| Year Ended December 31, | ||||||||||
| 2007 | 2006 | 2005 | ||||||||
| (In thousands) | ||||||||||
Total Revenues from reportable segments | $ | 1,496,289 | $ | 1,562,998 | $ | 1,604,577 | ||||
Cost of Revenue from reportable segments | 518,855 | 524,827 | 471,877 | |||||||
Unallocated Corporate Cost of Revenue | 77,662 | 49,935 | 36,632 | |||||||
Total Cost of Revenue | 596,517 | 574,762 | 508,509 | |||||||
Operating expenses (1) | 1,121,273 | 897,352 | 880,629 | |||||||
Operating (loss) income | (221,501 | ) | 90,884 | 215,439 | ||||||
Other income, net | 93,759 | 42,643 | 51,974 | |||||||
(Loss) income from continuing operations before income taxes, loss from unconsolidated entities and minority interest | $ | (127,742 | ) | $ | 133,527 | $ | 267,413 | |||
| (1) | Operating Expenses consist of sales and marketing, research and development, general and administrative, restructuring, impairment, and other charges (reversals), net, impairment of goodwill, amortization of intangible assets, and acquired research and development. |
Geographic Information
The following table shows a comparison of our revenues by geographic region for each year presented:region:
| 2004 | 2003 | 2002 | |||||||
| (In thousands) | |||||||||
Americas: | |||||||||
United States | $ | 843,604 | $ | 941,913 | $ | 1,115,731 | |||
Other (1) | 19,734 | 13,080 | 6,343 | ||||||
Total Americas | 863,338 | 954,993 | 1,122,074 | ||||||
EMEA (2) | 237,310 | 48,217 | 54,345 | ||||||
APAC (3) | 65,807 | 51,570 | 45,249 | ||||||
Total revenues | $ | 1,166,455 | $ | 1,054,780 | $ | 1,221,668 | |||
| Year Ended December 31, | |||||||||
| 2007 | 2006 | 2005 | |||||||
| (In thousands) | |||||||||
Americas: | |||||||||
United States | $ | 1,248,071 | $ | 1,104,594 | $ | 1,012,448 | |||
Other (1) | 34,028 | 40,119 | 25,214 | ||||||
Total Americas | 1,282,099 | 1,144,713 | 1,037,662 | ||||||
EMEA (2) | 116,899 | 300,635 | 468,308 | ||||||
APAC (3) | 97,291 | 117,650 | 98,607 | ||||||
Total revenues | $ | 1,496,289 | $ | 1,562,998 | $ | 1,604,577 | |||
| (1) | Canada |
| (2) | Europe, the Middle East and Africa (“EMEA”) |
| (3) | Australia, Japan and Asia Pacific (“APAC”) |
VeriSign operates in the United States, Europe, Japan, Australia, Brazil,Latin America, South Africa and India. In general, revenues are attributed to the country in which the contract originated. However, revenues from all digital certificates issued from the Mountain View, California facility and domain names issued from the Dulles, Virginia facility are attributed to the United States because it is impracticable to determine the country of origin.
VERISIGN, INC. AND SUBSIDIARIES
NOTES TO CONSOLIDATED FINANCIAL STATEMENTS—(Continued)
DECEMBER 31, 2004, 20032007, 2006 AND 20022005
Long-lived assets exclude goodwill, other intangible assets, and restricted cash. The following table shows a comparison of our domesticproperty and international long-term assets:equipment, net of accumulated depreciation, by geographic region:
| December 31, | ||||||
| 2004 | 2003 | |||||
| (In thousands) | ||||||
Domestic tangible illiquid long-term assets | $ | 541,988 | $ | 560,092 | ||
International tangible illiquid long-term assets | 23,980 | 23,311 | ||||
Total tangible illiquid long-term assets | $ | 565,968 | $ | 583,403 | ||
| As of December 31, | ||||||
| 2007 | 2006 | |||||
| (In thousands) | ||||||
Americas: | ||||||
United States | $ | 592,554 | $ | 575,321 | ||
Other | 1,130 | 1,599 | ||||
Total Americas | 593,684 | 576,920 | ||||
EMEA | 10,005 | 11,780 | ||||
APAC | 18,228 | 16,592 | ||||
Total long-term assets | $ | 621,917 | $ | 605,292 | ||
Assets are not tracked by segment and the chief operating decision maker does not evaluate segment performance based on asset utilization.
Major Customers
No customer accounted for 10% or more of consolidated revenues or accounts receivable in 2004, 20032007, 2006 or 2002.
VeriSign retained a 15% interest in Network Solutions domain name registrar business after the sale to Pivotal Private Equity on November 25, 2003. Through November 25, 2003, Network Solutions purchased certain products and services from the Company and these intercompany revenues were eliminated in the Company’s consolidated financial statements through that date. VeriSign recognized $43.5 million and $3.9 million from Network Solutions as a customer in 2004 and 2003, respectively.2005.
As consideration for the Company’s saleNote 17. Equity Investments
The following table shows a comparison of its Network Solutions domain name registrar business on November 25, 2003,revenue recognized from customers in which VeriSign received a $40 million senior subordinated note that bears interest at 7% per annum for the first three years and 9% per annum thereafter and matures five years from the date of closing. The principal and interest are due upon maturity. This note is subordinated to a term loan made by ABLECO Finance to the Network Solutions business in the principal amount of approximately $40 million as of the closing date. The present value of the note at December 31, 2004 was approximately $40.0 million using a 10% market interest rate.holds an equity investment, including International Affiliates:
| As of December 31, | |||||||||
| 2007 | 2006 | 2005 | |||||||
| (In thousands) | |||||||||
Network Solutions | $ | — | $ | — | $ | 39,725 | |||
Unconsolidated entities | 10,212 | — | — | ||||||
Other equity investments | 3,291 | 3,492 | 9,338 | ||||||
Total revenues recognized from customers in which VeriSign holds an equity investment | $ | 13,503 | $ | 3,492 | $ | 49,063 | |||
In addition to2007, the above, VeriSignCompany recognized revenues totaling $8.1of $10.2 million from a license agreement with is joint ventures which are recorded as unconsolidated entities. At December 31, 2007, the Company had approximately $5.1 million in 2004, $10.3accounts receivables from its unconsolidated entities. At December 31, 2007 and 2006, VeriSign had $6.4 million and $4.7 million, respectively, in 2003, and $27.1 millionaccounts receivables from other equity investments. VeriSign no longer has an investment in 2002 from customers, including VeriSign Affiliates, in which it holds an equity investment.Network Solutions.
165
VERISIGN, INC. AND SUBSIDIARIES
NOTES TO CONSOLIDATED FINANCIAL STATEMENTS—(Continued)
DECEMBER 31, 2004, 20032007, 2006 AND 20022005
Note 18. Other Income, Net
The following table presents the components of other income, net:
| Year Ended December 31, | |||||||||||
| 2007 | 2006 | 2005 | |||||||||
| (In thousands) | |||||||||||
Interest income | $ | 47,348 | $ | 27,222 | $ | 29,924 | |||||
Interest expense | (18,266 | ) | (7,838 | ) | — | ||||||
Net (loss) gain on sale of investments | (1,787 | ) | 21,258 | 11,310 | |||||||
Net gain on divestiture of businesses | 71,216 | — | — | ||||||||
Unrealized gain on joint venture call options | 10,925 | — | — | ||||||||
Realized and unrealized loss on embedded derivative | (15,301 | ) | — | — | |||||||
Other, net | (376 | ) | 2,001 | 10,740 | |||||||
Total other income, net | $ | 93,759 | $ | 42,643 | $ | 51,974 | |||||
Interest income is earned principally from the investment of VeriSign’s surplus cash balances. Interest expense is derived principally from interest on VeriSign’s long-term debt. In 2007, VeriSign recorded a $68.2 million gain from the divestiture of its majority ownership interest in Jamba. In 2006, VeriSign recorded a $21.7 million gain on the sale of its remaining equity ownership interest in Network Solutions.
Other, net, primarily consists of foreign exchange rate gains and losses, and in 2005, it includes approximately $6.0 million of other income related to a litigation settlement with a telecommunication carrier.
Note 19. Subsequent Events
In January and February, 2008, VeriSign repurchased 13.3 million shares of its common stock under the 2006 stock repurchase program for an aggregate cost of $451.9 million. As of February 28, 2008, the Company has approximately $532.7 million available under the 2006 stock repurchase program.
On January 10, 2005,31, 2008, VeriSign’s Board of Directors authorized a new stock repurchase program (“2008 stock repurchase program”) having an aggregate purchase price of up to $600 million of its common stock.
On February 8, 2008, VeriSign announced that it had executed a definitiveentered into an ASR agreement to acquire LightSurf Technologies, Inc. (“LightSurf”). Underrepurchase $600 million of its common stock under the terms2008 stock repurchase program and announced an intent to repurchase up to an additional $200 million in open market transactions under the 2006 stock repurchase program. The Company paid $600 million to a financial institution in exchange for a number of shares, which will be determined, subject to a cap, based on market prices during the term of the agreement, VeriSign agreedASR agreement. Through February 28, 2008 the Company received 15.1 million shares under the ASR agreement. The Company expects to issue shares of its Common Stock having a value of approximately $270 million for all ofcomplete the outstanding capital stock, warrants and vested options of LightSurf and to pay certain transaction-related expenses of LightSurf. In addition, VeriSign will assume all unvested stock options of LightSurf. LightSurf is a leading privately held provider of multimedia messaging and interoperability solutions for the wireless market. The transaction is subject to certain closing conditions, including the issuance of a permit from the California Department of Corporations. The transaction is anticipated to closeASR by the end of the firstthird quarter of 2005.2008, although in certain circumstances the completion date may be shortened or extended.
InOn February 20, 2008, the first quarterBoard of 2005, VeriSign completed a settlementDirectors approved the sale of litigation with a telecommunications carrier, resolving disputes over certain tariff charges for SS7 traffic that VeriSign passed through to telecommunications carriers who purchased its SS7 services. Under the settlement, the carrier refunded and/or credited certain amounts to VeriSign and VeriSign refunded and/or credited certain amounts to its customers. As a resultVeriSign’s Digital Brand Management Services business unit, one of the settlement, VeriSignbusinesses within the Internet Services Group. In accordance with SFAS 144, the associated assets and liabilities of this business will record a reduction in cost of revenues of approximately $5 millionbe classified as held for sale and its operations will be reported as discontinued operations in the first quarter of 2005.2008.
As required under Item 15—Exhibits and Financial Statement Schedules, the exhibits filed as part of this report are provided in this separate section. The exhibits included in this section are as follows:
Exhibit Number | Exhibit Description | |
| 10.33 | Separation and General Release Agreement between the Registrant and Mark D. McLaughlin dated November 28, 2007 | |
| 21.01 | Subsidiaries of the Registrant | |
| 23.01 | Consent of Registered Independent Public Accounting Firm | |
| 24.01 | Powers of Attorney (Included on Page 101 as part of the signature pages hereto) | |
| 31.01 | Certification of President and Chief Executive Officer | |
| 31.02 | Certification of | |
| 32.01 | Certification of President and Chief Executive Officer | |
| 32.02 | Certification of | |
| ** | As contemplated by SEC Release No. 33-8212, these exhibits are furnished with this Annual Report on Form 10-K and are not deemed filed with the Securities and Exchange Commission and are not incorporated by reference in any filing of VeriSign, Inc. under the Securities Act of 1933 or the Securities Act of 1934, whether made before or after the date hereof and irrespective of any general incorporation language in such filings. |
115
167