UNITED STATES
SECURITIES AND EXCHANGE COMMISSION
WASHINGTON, D.C. 20549
FORM 10-K
| x | ANNUAL REPORT PURSUANT TO SECTION 13 OR 15(d) OF THE SECURITIES EXCHANGE ACT OF 1934 |
For the Fiscal Year Ended December 31, 20042006
| ¨ | TRANSITION REPORT PURSUANT TO SECTION 13 OR 15(d) OF THE SECURITIES EXCHANGE ACT OF 1934 |
For the Transition Period Fromto
Commission File Number 001-13533
NOVASTAR FINANCIAL, INC.
(Exact Name of Registrant as Specified in its Charter)
| Maryland | 74-2830661 | |
(State or Other Jurisdiction of Incorporation or Organization) | (I.R.S. Employer Identification No.) |
| 8140 Ward Parkway, Suite 300, Kansas City, MO | 64114 | |
| (Address of Principal Executive Office) | (Zip Code) |
Registrant’s Telephone Number, Including Area Code:(816) 237-7000
Securities Registered Pursuant to Section 12(b) of the Act:
| Title of Each Class | Name of Each Exchange on Which Registered | |
| Common Stock, $0.01 par value | New York Stock Exchange | |
| Redeemable Preferred Stock | New York Stock Exchange |
Securities Registered Pursuant to Section 12(g) of the Act:
None
Indicate by check mark if the registrant is a well-known seasoned issuer, as defined by Rule 405 of the Securities
Act. Yes x No ¨
Indicate by check mark if the registrant is not required to file reports pursuant to Section 13 or Section 15(d) of the
Act. Yes ¨ No x
Indicate by check mark whether the registrant (1) has filed all reports required to be filed by Section 13 or 15(d) of the Securities Exchange Act of 1934 during the preceding 12 months (or for such shorter period that the registrant was required to file such reports), and (2) has been subject to such filing requirements for the past 90 days. Yes x No ¨
Indicate by check mark if disclosure of delinquent filers pursuant to Item 405 of Regulation S-K is not contained herein, and will not be contained, to the best of registrant’s knowledge, in definitive proxy or information statements incorporated by reference in Part III of this Form 10-K or any amendment to this Form 10-K. x
Indicate by check mark whether the registrant is a large accelerated filer, an accelerated filer, or a non-accelerated filer. See definition of “accelerated filer and large accelerated filer” in Rule 12b-2 of the Exchange Act. (Check one):
Large accelerated filer x Accelerated filer ¨ Non-accelerated filer ¨
Indicate by check mark whether the registrant is an accelerated filera shell company (as defined in Exchange Act Rule 12b-2). Yes ¨ No x No ¨
The aggregate market value of voting and non-voting stock held by non-affiliates of the registrant as of June 30, 20042006 was approximately $948,751,931$972,533,092, based upon the closing sales price of the registrant’s common stock as reported byon the New York Stock Exchange Composite Transactions on such date.
The number of shares of the Registrant’s Common Stock outstanding on March 11, 2005February 28, 2007 was 27,860,629.37,410,228.
Documents Incorporated by Reference
Items 10, 11, 12, 13 and 14 of Part III are incorporated by reference to the NovaStar Financial, Inc. definitive proxy statement to shareholders, which will be filed with the Commission no later than 120 days after December 31, 2004.2006.
FORM 10-K
For the Fiscal Year Ended December 31, 20042006
TABLE OF CONTENTS
Item 1. | 2 | |||||
Item | ||||||
| Item 1B. | ||||||
| 31 | |||||
| Item 2. | 31 | |||||
| Item 3. | ||||||
| 31 | |||||
| Item 4. | ||||||
Item 5. | ||||||
| 33 | |||||
| Item 6. | ||||||
| 34 | |||||
| Item 7. | Management’s Discussion and Analysis of Financial Condition and Results of Operations | |||||
| 36 | |||||
| Item 7A. | ||||||
| 79 | |||||
| Item 8. | ||||||
| 80 | |||||
| Item 9. | Changes in and Disagreements | |||||
| 128 | |||||
| Item 9A. | ||||||
| 128 | |||||
| Item 9B. | ||||||
Item 10. | ||||||
| Item 11. | ||||||
| Executive Compensation | |||||
| 130 | |||||
| Item 12. | Security Ownership of Certain Beneficial Owners and Management and Related Stockholder Matters | |||||
| 131 | |||||
| Item 13. | Certain Relationships and Related Transactions, and Director Independence | |||||
| 131 | |||||
| Item 14. | ||||||
Item 15. | ||||||
Item 1.BusinessSafe Harbor Statement
This Annual Report on Form 10-K contains forward-looking statements within the meaning of Section 21E of the Securities Exchange Act of 1934, as amended, regarding management’s beliefs, estimates, projections, and assumptions with respect to, among other things, our future operations, business plans and strategies, as well as industry and market conditions, all of which are subject to change at any time without notice. Actual results and operations for any future period may vary materially from those projected herein and from past results discussed herein. Some important factors that could cause actual results to differ materially from those anticipated include: our ability to successfully integrate acquired businesses or assets with our existing business; our ability to generate sufficient liquidity on favorable terms; the size, frequency and structure of our securitizations; impairments on our mortgage assets; interest rate fluctuations on our assets that differ from our liabilities; increases in prepayment or default rates on our mortgage assets; changes in assumptions regarding estimated loan losses and fair value amounts; our continued status as a REIT; changes in origination and resale pricing of mortgage loans; our compliance with applicable local, state and federal laws and regulations or opinions of counsel relating thereto and the impact of new local, state or federal legislation or regulations, or opinions of counsel relating thereto, or court decisions on our operations; the initiation of margin calls under our credit facilities; the ability of our servicing operations to maintain high performance standards and maintain appropriate ratings from rating agencies; our ability to expand origination volume while maintaining an acceptable level of overhead; our ability to adapt to and implement technological changes; the stability of residential property values; the outcome of litigation or regulatory actions pending against us or other legal contingencies; compliance with new accounting pronouncements; the impact of general economic conditions; and the risks that are from time to time included in our filings with the Securities and Exchange Commission (the “SEC”), including this Annual Report on Form 10-K. Other factors not presently identified may also cause actual results to differ. Words such as “believe,” “expect,” “anticipate,” “promise,” “plan,” and other expressions or words of similar meanings, as well as future or conditional verbs such as “will,” “would,” “should,” “could,” or “may” are generally intended to identify forward-looking statements. This document speaks only as of its date and we expressly disclaim any duty to update the information herein.
We are a Maryland corporation formed on September 13, 1996 which operates as a specialty finance company that originates, purchases, securitizes, sells, invests in and services residential nonconforming loans. We operate through three separate but inter-related units—mortgage lendingloans and loan servicing, mortgage portfolio management and branch operations.mortgage-backed securities. We offer a wide range of mortgage loan products to nonconforming borrowers, commonly referred to as “nonconforming borrowers,” who generally do not satisfy the credit, collateral, documentation or other underwriting standards prescribed by conventional mortgage lenders and loan buyers, including United States of America government-sponsored entities such as Fannie Mae or Freddie Mac. We retain significant interests in the nonconforming loans we originate and purchase through our mortgage securities investment portfolio. Through our servicing platform, we then service all of the loans we retain interests in, in order to better manage the credit performance of those loans.
We have elected to be taxed as a real estate investment trust or REIT,(“REIT”) under the Internal Revenue Code of 1986, as amended (Code)(the “Code”). Management believes the tax-advantaged structure ofFor so long as we maintain our status as a REIT, maximizes the after-tax returns from mortgage assets. Wewe must meet numerous rules established by the Internal Revenue Service (IRS) to retain our status as a REIT.(“IRS”). In summary, theythese rules require us to:
Restrict investments to certain real estate related assets,assets;
Avoid certain investment trading and hedging activities,activities; and
Distribute virtually all REIT taxable income to stockholders.our shareholders.
As long as we maintain our REIT status, distributions to stockholdersour shareholders will generally be deductible by us for income tax purposes. This deduction effectively eliminates REIT level income taxes. Management believes it has and will continue to meetthat we have met the requirements to maintain our REIT status for 2006 and prior years. We are, however, currently evaluating whether it is in shareholders’ best interests to retain our REIT status.
We operate three core businesses:
Mortgage portfolio management;
Mortgage lending; and
Loan servicing.
Segment information regarding these businesses for the three years ended December 31, 2006 is included in Note 16 to our consolidated financial statements.
Mortgage Portfolio Management
portfolios.
EarningsIn 2005 we began retaining various subordinate securities from our securitization transactions. In 2006, we began purchasing subordinated ABS of other ABS issuers. We will continue to acquire, retain, and aggregate ABS with the intention of securing non-recourse long-term financing through collateralized debt obligation (“CDO”) securitizations. In the future, we may enter into derivative transactions referencing third party ABS, commonly referred to as “synthetic” assets. We also intend to retain the risk of the underlying securities by investing in the equity and subordinated debt of CDO securitizations. CDO equity securities bear the first-loss and second-loss credit risk with respect to the securities owned by the securitization entity. Our goal is to leverage our extensive portfolio management experience by purchasing securities that are higher in the capital structure than our residual securities and executing CDOs for long-term non-recourse financing, thereby generating good risk-adjusted returns. We closed our first CDO securitization which was structured as a financing transaction on February 8, 2007, and we expect to continue to purchase securities that are higher in the capital structure and finance them with CDOs.
The long-term mortgage loan portfolio on our balance sheet consists of mortgage loans and securities generate a substantial portion of our earnings. Gross interest income was $224.0 million, $170.4 million and $107.1 millionclassified as held-in-portfolio resulting from securitization transactions treated as financings completed in the three years ended December 31, 2004, 2003second and 2002, respectively. Net interest income before credit losses/recoveries from the portfolio was $171.4 million, $130.1 millionthird quarters of 2006 (NHES Series 2006-1 and $79.4 millionNHES Series 2006-MTA1). We have financed our investment in the three years ended December 31, 2004, 2003 and 2002, respectively. See our discussion of interest income under the heading “Results of Operations” and “Net Interest Income”. See Note 15 to our consolidated financial statements for a summary of operating results and total assets for mortgage portfolio management.these loans by issuing ABB.
A significant risk toThe credit performance and prepayment rates of the nonconforming loans underlying our operations, relating to our portfolio management, issecurities, as well as the risk thatloans classified as held-in-portfolio, directly affects the profitability of this segment. In addition short-term interest rates have a significant impact on our assets will not adjust at the same times or amounts that rates on our liabilities adjust. Many of the loans in our portfolio have fixed rates of interest for a period of time ranging from 2 to 30 years. Our funding costs are generally not constant or fixed. We use derivative instruments to mitigate the risk of our cost of funding increasing or decreasing at a faster rate than the interest on the loans (both those on the balance sheet and those that serve as collateral for mortgage securities – available-for-sale).this segment’s profitability.
In certain circumstances, because we enter into interest rate agreements that do not meet the hedging criteria set forth in accounting principles generally accepted in the United States of America, we are required to record the change in the value of derivatives as a component of earnings even though they may reduce our interest rate risk. In times where short-term rates rise or drop significantly, the value of our agreements will increase or decrease, respectively. As a result, we recognized losses on these derivatives of $8.9 million, $30.8 million and $36.8 million in 2004, 2003 and 2002, respectively.
Mortgage Lending and Loan Servicing
The mortgage lending operation is significant to our financial results as it produces the loans that ultimately collateralize the mortgage securities – available-for-sale that we hold in our portfolio. During 2004, we originated and purchased $8.4 billion in nonconforming mortgage loans, the majority of which were retained in our servicing portfolio and serve as collateral for our securities. The loans we originate and purchase are sold, either in securitization transactions structured as sales or infinancing transactions, or are sold outright sales to third parties. We recognized gainsfinance the loans we originate and purchase by using warehouse repurchase agreements on sales ofa short-term basis. For long-term financing, we securitize our mortgage assets totaling $145.0 million, $144.0 millionloans and $53.3 million during the three years ended December 31, 2004, 2003 and 2002, respectively. In securitization transactions accounted for as sales, we retain interest-only, prepayment penalty, overcollateralization and other subordinated securities, along with the right to service the loans. See Note 15 to our consolidated financial statements for a summary of operating results and total assets for mortgage lending and loan servicing.issue ABB.
Our wholly-owned subsidiary, NovaStar Mortgage, Inc.,mortgage lending operations generate earnings primarily from securitizing and selling loans for a premium. We also earn revenue from fees from loan originations and interest income on mortgage loans held-for-sale. The timing, size and structure of our securitization transactions have a significant impact on the gain on sale recognized and ultimately the profitability of this segment. In addition the market prices for whole loans and short-term interest rates have a significant impact on this segment’s profitability.
Our mortgage lending segment originates and purchases primarily nonconforming, single-family residential mortgage loans. Our mortgage lending operation continues to innovate in loan origination. Our lending decisions are driven by three primary objectives:
Originating loans that perform in line with expectations,
Maintaining economically sound pricing (profitable coupons), and
Controlling costs of origination.
In our nonconforming lending operations, we lend to individuals who generally do not qualify for agency/conventional lending programs because of a lack of available documentation, or previous credit difficulties.difficulties or higher loan-to-value (“LTV”) ratios. These types of borrowers are generally willing to pay higher mortgage loan origination fees and interest rates than those charged by conventional lending sources.lenders. Because these borrowers typically use the proceeds of the mortgage loans to consolidate debt and to finance home improvements, education and other consumer needs, loan volume is generally less dependent on general levels of interest rates or home sales and therefore less cyclical than conventional mortgage lending.
Our nationwide loan origination network includes wholesale loan brokers, mortgage lenders, and correspondent institutions, andall of which are independent of any of the NovaStar Financial entities, as well as our own direct to consumer operations. We have developed a nationwide network of wholesale loan brokers and mortgage lenders who submit mortgage loans to us. Except for NovaStar Home Mortgage brokers described below, these brokers and mortgage lenders are independent from any of the NovaStar entities. Our sales force, which includes account executives in 3938 states, develops and maintains relationships with this network of independent retail brokers. Our correspondent origination channel consists of a network of institutions from which we purchase nonconforming mortgage loans on a bulk or flow basis. Our direct to consumer originationoperations channel consists of call centers where we contact potential borrowers as well as a network of branch operations which use telemarketing and internet loan lead sourceswe acquired in the fourth quarter of 2006 in order to originate mortgage loans.expand this origination channel.
We underwrite, process, fund and service the nonconforming mortgage loans sourced through our broker network of wholesale loan brokers and mortgage lenders and our direct to consumer operations in centralized facilities. Further details regarding the loan originations are discussed under the “Mortgage Loans” section of “Management’s Discussion and Analysis of Financial Condition and Results of Operations”.
A significant risk to our mortgage lending operations is liquidity risk – the risk that we will not have financing facilities and cash available to fund and hold loans prior to their sale or securitization. We maintain committed lending facilities with large banking and investment institutions to reduce this risk. On a short-term basis, we finance mortgage loans using warehouse repurchase agreements. In addition, we have access to facilities secured by our mortgage securities – available-for-sale. Details regarding available financing arrangements and amounts outstanding under those arrangements are included in “Management’s Discussion and Analysis of Financial Condition and Results of Operations” and Note 7 to the consolidated financial statements.Loan Servicing
For long-term funding, we pool our mortgage loans and issue asset-backed bonds (ABB). Primary bonds – AAA through BBB rated – are issued to the public. We retain the interest-only, prepayment penalty, overcollateralization and other subordinated bonds. We also retain the right to service the loans. Prior to 1999, our ABB transactions were executed and designed to meet accounting rules that resulted in securitizations being treated as financing transactions. The mortgage loans and related debt continue to be presented on our consolidated balance sheets, and no gain was recorded. Beginning in 1999, our securitization transactions have been structured to qualify as sales for accounting and income tax purposes. The loans and related bond liability are not recorded in our consolidated financial statements. We do, however, record the value of the securities and servicing rights we retain. Details regarding ABBs we issued can be found in “Management’s Discussion and Analysis of Financial Condition and Results of Operations” and in Note 7 to our consolidated financial statements.
LoanManagement believes loan servicing remains a critical part of our business operation. In the opinion of management,operation because maintaining contact with our borrowers is critical in managing credit risk and infor borrower retention. Nonconforming borrowers are more prone to late payments and are more likely to default on their obligations than conventional borrowers. By servicing our loans, we strive to identify problems with borrowers early and take quick action to address problems. BorrowersIn addition, borrowers may be motivated to refinance their mortgage loans either by improving their personal credit or due to a decrease in interest rates. By keeping in close touch with borrowers, we can provide them with information about companyNovaStar Financial products to encourage them to refinance with us.
We retain the servicing rights with respect to the loans we securitize. Mortgage servicing yields fee income for us in the form of contractual fees approximating 0.50% of the outstanding balance of loans we service that have been securitized. In addition we receive fees paid by the borrowers for normal customer service and processing fees. In additionWe also earn interest income on funds we receive contractual fees approximating 0.50% of the outstanding balance and rights to future cash flows arising after the investors in the securitization trusts have received the return for which they contracted. We recognized $41.5 million, $21.1 million and $10.0 million in loan servicing fee income from the securitization trusts during the three years ended December 31, 2004, 2003 and 2002, respectively. See also “Mortgage Loan Servicing” under “Management’s Discussion and Analysis of Financial Condition and Results of Operations” for further discussion and analysishold as custodian as part of the servicing operations.
Branch Operationsprocess.
In 1999, we opened our retail mortgage broker business operating under the name NovaStar Home Mortgage, Inc. (“NHMI”). Prior to 2004, many of these NHMI branches were supported by LLC’s operating under LLC agreements where we owned a minority interest in the LLC and the branch manager was the majority interest holder. In December 2003, we decided to terminate the LLC’s effective January 1, 2004. As of January 1, 2004, continuing branches that formerly operated under LLC agreements became operating units of NHMI and their financial results are included in the consolidated financial statements. See Note 14 to our consolidated financial statements for further discussion. Branch offices offer conforming and nonconforming loans to potential borrowers. Loans are brokered for approved investors, including NovaStar Mortgage. The NHMI branches are considered departmental functions of NHMI under which the branch manager (department head) is an employee of NHMI and receives compensation based on the profitability of the branch (department) as bonus compensation. See Note 15 to our consolidated financial statements for a summary of operating results and total assets for our branches.
We routinely close branches and branch managers voluntarily terminate their employment with us, which generally results in the branch’s closure. As the demand for conforming loans declined significantly during 2004, many branches were not able to produce sufficient fees to meet operating expense demands. As a result of these conditions, a significant number of branch managers voluntarily terminated employment with us. We have also terminated many branches when loan production results were substandard. In these terminations, the branch and all operations are eliminated. Note 14 to our consolidated financial statements provides detail regarding the impact of the discontinued operations and modifications to our branch program.
The branch business provides an additional source for mortgage loan originations that, in most cases, we will eventually sell, either in securitizations or in outright sales to third parties. During 2004 and 2003, our branches brokered $3.7 billion and $6.4 billion, respectively, in nonconforming loans, of which we funded $1.7 billion and $1.2 billion, respectively.
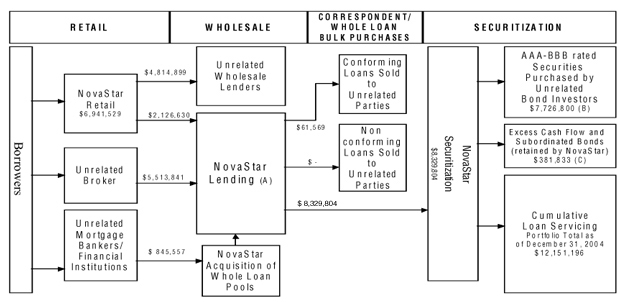
Following is a diagram of the industry in which we operate and our loan production including nonconforming and conforming during 2004 (in thousands).
Market in Which NovaStar Operates and Competes
Over the last ten years, the nonconforming lending market has grown from less than $50 billion annually to approximately $640 billion in 2006 as estimated by Inside Mortgage Finance Publications. A significant portion of nonconforming loans are made to borrowers who are using equity in their primary residence to consolidate installment or consumer debt, or take cash out for personal reasons. The nonconforming market has grown through a variety of interest rate environments. Management estimates that in 2006 we had a 1-2% share of the nonconforming loan market.
We face intense competition in the business of originating, purchasing, selling and securitizing mortgage loans. The number of market participants is believed to be well in excess of 100 companies who originate and purchase nonconforming loans. No single participant holds a dominant share of the lending market. We compete for borrowers with consumer finance companies, conventional mortgage bankers, commercial banks, credit unions, thrift institutions and other independent wholesale mortgage lenders. Our principal competition in the business of holding mortgage loans and mortgage securities – available-for-sale are life insurance companies, institutional investors such as mutual funds and pension funds, other well-capitalized publicly-owned mortgage lenders and certain other mortgage acquisition companies structured as REITs. Many of these competitors are substantially larger than we are and have considerably greater financial resources than we do.
Competition among industry participants can take many forms, including convenience in obtaining a loan, amount and term of the loan, customer service, marketing/distribution channels, loan origination fees and interest rates. To the extent any competitor significantly expands their activities in the nonconforming and subprime market, we could be materially adversely affected.
Our principal competition in the business of holding mortgage loans and mortgage securities are life insurance companies, institutional investors such as mutual funds and pension funds, other well-capitalized, publicly-owned mortgage lenders and certain other mortgage acquisition companies structured as REITs. Many of these competitors are substantially larger than we are and have considerably greater financial resources than we do.
One of our key competitive strengths is our employees and the level of service they are able to provide our borrowers. We service our nonconforming loans and, in doing so, we are able to stay in close contact with our borrowers and identify potential problems early.
We also believe we compete successfully due to our:
experienced management team;
use of technology to enhance customer service and reduce operating costs;
vertical integration – we broker and/or originate, purchase, fund, service and manage mortgage loans;
access to capital markets to securitize our assets.
Risk Management
Management recognizes the following primary risks associated with the business and industry in which it operates.
Interest Rate/Market
Liquidity/Funding
Credit
Prepayment
Regulatory
Interest Rate/Market Risk
Risk.Our investment policy sets the following general goals:
(1) Maintaingoals are to maintain the net interest margin between our assets and liabilities and
(2) Diminish to diminish the effect of changes in interest rate levels on ourthe market value of our assets.
Interest Rate Risk. When interest rates on our assets do not adjust at the same time or in the same amounts as the interest rates ason our liabilities or when the assets have fixed rates and the liabilities are adjusting,have adjustable rates, future earnings potential is affected. We express this interest rate risk as the risk that the market value of our assets will increase or decrease at different rates than that of theour liabilities. Expressed another way, this is the risk that our net asset value will experience an adverse change when interest rates change. We assess the risk based on the change in market values given increases and decreases in interest rates. We also assess the risk based on the impact to net income in changing interest rate environments.
Management primarily usesThe interest rates under our primary financing sources where the interest rate resetsreset frequently. As of December 31, 2004,2006, rates on a majority of our borrowings under all financing arrangements adjust daily or monthly.monthly off London Inter-Bank Offered Rate (“LIBOR”). On the other hand, very few of the mortgage assets we own adjust on a monthly or daily basis. Most of the mortgage loans contain features where theirhave rates that are fixed for some period of time and then adjust frequently thereafter.ranging from 2 to 30 years. For example, one of our loan products is the “2/28” loan. This loan is fixed for its first two years and then adjusts every six months thereafter.
While short-term borrowing rates are low and long-term asset rates are high, this portfolio structure produces good results. However, if short-term interest rates rise rapidly, earning potential iswould be significantly affected and impairments may be incurred, as the asset rate resets would lag the borrowing rate resets.
We transfer interest rate agreements at the time of securitization into the securitization trusts to protect the third-party bondholders from interest rate risk and to decrease the volatility of future cash flows related to the securitized mortgage loans. We enter into these interest rate agreements as we originate and purchase mortgage loans in our mortgage lending segment. At the time of a securitization structured as a sale, we transfer interest rate agreements into the securitization trusts and they are removed from our balance sheet. The trust assumes the obligation to make payments and obtains the right to receive payments under these agreements. Generally, net settlement obligations paid by the trust for these interest rate agreements reduce the excess interest cash flows to our residual securities. Net settlement receipts from these interest rate agreements are either used to cover interest shortfalls on the third-party primary bonds or to provide credit enhancement with any remaining funds then flowing to our residual securities. For securitizations structured as financings the derivatives will remain on our balance sheet. Generally, these interest rate agreements do not meet the hedging criteria set forth in accounting principles generally accepted in the United States of America (“GAAP”) while they are on our balance sheet; therefore, we are required to record their change in value as a component of earnings even though they may reduce our interest rate risk. In times when short-term rates rise or drop significantly, the value of our agreements will increase or decrease, respectively. Occasionally, we enter into interest rate agreements that do meet the hedging criteria set forth in GAAP. In these instances, we record their change in value, if effective, directly to other comprehensive income on our statement of shareholder’s equity.
Interest Rate Sensitivity Analysis. ToWe model financial information in a variety of interest rate scenarios to assess interest rate sensitivity as an indication of exposure to interest rate risk, management relies on models of financial information in a variety of interest rate scenarios.risk. Using these models, the fair value and interest rate sensitivity of each financial instrument, or groups of similar instruments, is estimated, and then aggregated to form a comprehensive picture of the risk characteristics of the balance sheet. The risks are analyzed on a market value basis.
The following table summarizes management’s estimates of the changes in market value of our same mortgage assets and interest rate agreements assuming interest rates were 100 and 200 basis points, or 1one and 2two percent higher andor lower. The cumulative change in market value represents the change in market value of mortgage assets, net of the change in market value of interest rate agreements. The change in market value of the liabilities on our balance sheet due to a change in interest rates is insignificant since a majority of our short-term borrowings and ABB are adjustable rate; however, as noted above, rapid increases in short-term interest rates would negatively impact the interest-rate spread between our liabilities onand assets and, consequently, our balance sheet which finance our mortgage assets is insignificant.earnings.
Interest Rate Sensitivity - Market Value
(dollars in thousands)
| Basis Point Increase (Decrease) in Interest Rate (A) | Basis Point Increase (Decrease) in Interest Rates (A) | ||||||||||||||||||||||||||||||
| (200) (C) | (100) | 100 | 200 | (200) | (100) | 100 | 200 | ||||||||||||||||||||||||
As of December 31, 2004: | |||||||||||||||||||||||||||||||
As of December 31, 2006: | |||||||||||||||||||||||||||||||
Change in market values of: | |||||||||||||||||||||||||||||||
Assets | 70,438 | $ | 33,198 | $ | (34,045 | ) | $ | (72,840 | ) | ||||||||||||||||||||||
Assets – non trading (B) | $ | 226,262 | $ | 105,038 | $ | (78,698 | ) | $ | (150,481 | ) | |||||||||||||||||||||
Assets – trading (C) | 9,999 | 7,080 | (14,120 | ) | (30,707 | ) | |||||||||||||||||||||||||
Interest rate agreements | (54,085 | ) | (28,046 | ) | 27,832 | 55,113 | (40,018 | ) | (20,946 | ) | 23,998 | 49,264 | |||||||||||||||||||
Cumulative change in market value | 16,353 | $ | 5,152 | $ | (6,213 | ) | $ | (17,727 | ) | $ | 196,243 | $ | 91,172 | $ | (68,820 | ) | $ | (131,924 | ) | ||||||||||||
Percent change of market value portfolio equity (B) | 3.3 | % | 1.0 | % | (1.3 | )% | (3.6 | )% | |||||||||||||||||||||||
Percent change of market value portfolio equity (D) | 34.0 | % | 15.8 | % | (11.9 | %) | (22.9 | %) | |||||||||||||||||||||||
As of December 31, 2003: | |||||||||||||||||||||||||||||||
As of December 31, 2005: | |||||||||||||||||||||||||||||||
Change in market values of: | |||||||||||||||||||||||||||||||
Assets | N/A | $ | 34,499 | $ | (65,216 | ) | $ | (144,343 | ) | ||||||||||||||||||||||
Assets – non trading (B) | $ | 95,322 | $ | 41,344 | $ | (41,417 | ) | $ | (84,971 | ) | |||||||||||||||||||||
Assets – trading (C) | 1,134 | 983 | (2,837 | ) | (7,512 | ) | |||||||||||||||||||||||||
Interest rate agreements | N/A | (31,250 | ) | 34,073 | 69,497 | (33,502 | ) | (17,365 | ) | 20,072 | 41,616 | ||||||||||||||||||||
Cumulative change in market value | N/A | $ | 3,249 | $ | (31,143 | ) | $ | (74,846 | ) | $ | 62,954 | $ | 24,962 | $ | (24,182 | ) | $ | (50,867 | ) | ||||||||||||
Percent change of market value portfolio equity (B) | N/A | 1.0 | % | (9.1 | )% | (21.9 | )% | ||||||||||||||||||||||||
Percent change of market value portfolio equity (D) | 11.0 | % | 4.4 | % | (4.2 | %) | (8.9 | %) | |||||||||||||||||||||||
| (A) | Change in market value of assets or interest rate agreements in a parallel shift in the yield curve, up and down 1% and 2%. |
| (B) | Includes mortgage loans held-for-sale, mortgage loans held-in-portfolio, mortgage securities—available-for-sale and mortgage servicing rights. |
| (C) | Consists of mortgage securities – trading. |
| (D) | Total change in estimated market value as a percent of market value portfolio equity as of December 31. |
Hedging.In orderWe use derivative instruments to addressmitigate the risk of our cost of funding increasing at a mismatch offaster rate than the interest rate indices and adjustment periods on our assets and liabilities, the hedging section of the investment policy is followed, as approved by the Board. Specifically, theloans. We adhere to an interest rate risk management program that is approved by our Board. This program is formulated with the intent to offset the potential adverse effects resulting from rate adjustment limitations on mortgage assets and the differences between interest rate adjustment indices and interest rate adjustment periods of adjustable-rate mortgage loans and related borrowings.
We use interest rate cap and swap contracts to mitigate the risk of the costfinancing expense of variable rate liabilities increasing at a faster rate than the earningsincome produced on assets during a period of rising rates. In this way, managementManagement intends generally to hedge as much of the interest rate risk as determined to be in our best interest, given the cost and risk of hedging transactions and the needlimitations on our ability to maintainhedge imposed on us by REIT status.tax requirements.
We seek to build a balance sheet and undertake an interest rate risk management program that is likely, in management’s view, to enable us to maintain an equity liquidation value sufficient to maintain operations given a variety of potentially adverse circumstances. Accordingly, the hedging program addresses both income preservation, as discussed in the first part of this section, and capital preservation concerns.
Interest rate cap and swap agreements are legal contracts between us and a third-party firm or “counterparty”. TheUnder an interest rate cap agreement the counterparty agrees to make payments to us in the future should the one-month LIBOR interest rate rise above the strike rate specified in the contract. We make either quarterly or monthly premium payments or have chosen to pay the premiums at the beginning to the counterparties under contract. Each contract has either a fixed or amortizing notional face amount on which the interest is computed, and a set term to maturity. When the referenced LIBOR interest rate rises above the contractual strike rate, we earn cap income. Payments on an annualized basis equal the contractual notional face amount times the difference between actual LIBOR and the strike rate. Interest rate swaps have similar characteristics. However,Under interest rate swap agreements allow us towe pay a fixed rate of interest while receiving a rate that adjusts with one-month LIBOR.
The following table summarizes the key contractual terms associated with our interest rate risk management contracts. Substantially allcontracts on our balance sheet as of theDecember 31, 2006. All of our pay-fixed swapsswap contracts and interest rate capscap contracts are indexed to one-month LIBOR.
We have determined the following estimated net fair value amounts by using available market information and valuation methodologies we deem appropriate as of December 31, 2004.2006.
Interest Rate Risk Management Contracts
(dollars in thousands)
| Maturity Range | |||||||||||||||||||
Net Fair Value | Total Notional Amount | 2005 | 2006 | 2007 | |||||||||||||||
Pay-fixed swaps: | |||||||||||||||||||
Contractual maturity | $ | 6,143 | $ | 1,350,000 | $ | 285,000 | $ | 840,000 | $ | 225,000 | |||||||||
Weighted average pay rate | 3.0 | % | 2.4 | % | 3.1 | % | 3.5 | % | |||||||||||
Weighted average receive rate | 2.4 | % | (A | ) | (A | ) | (A | ) | |||||||||||
Interest rate caps: | |||||||||||||||||||
Contractual maturity | $ | 5,819 | $ | 650,000 | $ | 450,000 | $ | 200,000 | $ | — | |||||||||
Weighted average strike rate | 1.7 | % | 1.6 | % | 2.0 | % | — | ||||||||||||
| Net Fair Value | Total Notional Amount | Maturity Range | |||||||||||||||||||||||||
| 2007 | 2008 | 2009 | 2010 | 2011 | |||||||||||||||||||||||
Pay-fixed swaps: | |||||||||||||||||||||||||||
Contractual maturity | $ | 6,527 | $ | 1,575,000 | $ | 490,000 | $ | 720,000 | $ | 365,000 | $ | — | $ | — | |||||||||||||
Weighted average pay rate | 4.9 | % | 4.7 | % | 5.0 | % | 4.9 | % | — | — | |||||||||||||||||
Weighted average receive rate | 5.4 | % | (A | ) | (A | ) | (A | ) | — | — | |||||||||||||||||
Interest rate caps: | |||||||||||||||||||||||||||
Contractual maturity | $ | 4,634 | $ | 610,000 | $ | 80,000 | $ | 285,000 | $ | 195,000 | $ | 40,000 | $ | 10,000 | |||||||||||||
Weighted average strike rate | 5.0 | % | 4.9 | % | 4.9 | % | 5.0 | % | 5.2 | % | 5.4 | % | |||||||||||||||
| (A) | The pay-fixed swaps receive rate is indexed to one-month |
Liquidity/Funding RiskWe had no interest rate agreements with contractual maturities beyond 2011 as of December 31, 2006.
MortgageLiquidity/Funding Risk.A significant risk to our mortgage lending requires significantoperations is the risk that we will not have financing facilities and cash available to fund loan originations and purchases. Our warehouse lending arrangements, includinghold loans prior to their sale or securitization, to fund required repurchase agreements, support the mortgage lending operation. Our warehouse mortgage lenders allow us to borrow between 98%requests and 100% of the outstanding principal. Funding for the difference – generally 2% of the principal - must come from cash on hand. If we are unable to obtain sufficient cash resources,margin calls or that we may not be able to operatesecuritize our loans or securities upon favorable terms. On a short-term basis, we finance mortgage loans using warehouse repurchase agreements that we maintain with large banking and investment institutions. In addition, we have access to facilities secured by our mortgage lending (banking) segment.
We are currently dependent upon a limited number of primary credit facilities forsecurities and servicing advance receivables. For long-term financing, we depend on securitizations and CDOs. Other matters also impact our liquidity and funding of our mortgage loan originations and acquisitions. Any failure to renew or obtain adequate funding under these financing arrangements could harm our lending operations and our overall performance. An increase in the cost of financing in excess of any change in the income derived from our mortgage assets could also harm our earnings and reduce the cash available for distributions to our stockholders. In October 1998, the subprime mortgage loan market faced a liquidity crisis with respect to the availability of short-term borrowings from major lenders and long-term borrowings through securitization. At that time, we faced significant liquidity constraints that harmed our business and our profitability. We can provide no assurance that those adverse circumstances will not recur.
We use repurchase agreements to finance the acquisition of mortgage assets in the short-term. In a repurchase agreement, we sell an asset and agree to repurchase the same asset at some period in the future. Generally, the repurchase agreements we entered into stipulate that we must repurchase the asset in 30 days. For financial accounting purposes, these arrangements are treated as secured financings. We retain the assets on our balance sheet and record an obligation to repurchase the asset. For our repurchase agreements secured by mortgage loans, the amount we may borrow is generally 98% of the mortgage loan market value. For our repurchase agreements secured by mortgage securities, the amount we may borrow is generally 75% of the mortgage securities market value. When asset market values decrease, we are required to repay the margin, or difference in market value. To the extent the market values of assets financed with repurchase agreements decline rapidly, we will be required to meet cash margin calls. If cash is unavailable, we may default on our obligations under the applicable repurchase agreement. In that event, the lender retains the right to liquidate the collateral we provided to it to settle the amount due from us.
We are dependent on the securitization market for the sale of our loans because we securitize loans directly and many of our whole loan buyers purchase our loans with the intention to securitize. The securitization market is dependent upon a number of factors, including general economic conditions, conditions in the securities market generally and conditions in the asset-backed securities market specifically. In addition, poor performance of our previously securitized loans could harm our access to the securitization market. Accordingly, a decline in the securitization market, the ability to obtain attractive terms or a change in the market’s demand for our loans could have a material adverse effect on our results of operations, financial condition and business prospects.
risk. See the “Liquidity and Capital Resources” section of “Management’s Discussion and Analysis of Financial Condition and Results of Operations” for further discussion of liquidity risks and resources available to us.
Credit Risk
. Credit risk is the risk that we will not fully collect the principal we have invested in mortgage loans or the amount we have invested in securities. Nonconforming mortgage loans comprise substantially our entire mortgage loan portfolio and serve as collateral for our mortgage securities – available-for-sale. Our nonconformingsecurities. Nonconforming borrowers include individuals who do not qualify for agency/conventional lending programs because of a lack of conventional documentation or previous credit difficulties but have considerable equity in their homes. Often, they are individuals or families who have built up high-rate consumer debt and are attempting to use the equity in their home to consolidate debt and reduce the amount of money it takes to service their monthly debt obligations. Our underwriting guidelines are intended to evaluate the credit history of the potential borrower, the capacity and willingness of the borrower to repay the loan, and the adequacy of the collateral securing the loan.
UnderwritingOur underwriting staff workworks under the credit policies established by our Chief Credit Officer.Committee. Underwriters are given approval authority only after their work has been reviewed for a period of time. Thereafter, the Chief Credit Officer re-evaluates the authority levels of all underwriting personnel on an ongoing basis. All loans in excess of $350,000 currently require the approval of an underwriting supervisor. Our Chief Credit Officer or our President must approve loans in excess of $1,000,000.
TheOur underwriting guidelines take into consideration the number of times the potential borrower has recently been late on a mortgage payment and whether that payment was 30, 60 or 90 days past due. Factors such as FICO score, bankruptcy and foreclosure filings, debt-to-income ratio, and loan-to-value ratio are also considered. The credit grade that is assigned to the borrower is a reflection of the borrower’s historical credit and the loan-to-value determined by the amount of documentation the borrower could produce to support income.credit. Maximum loan-to-value ratios for each credit grade depend on the level of income documentation provided by the potential borrower. In some instances, when the borrower exhibits strong compensating factors, exceptions to the underwriting guidelines may be approved.
In 2006, we saw the performance of our 2006 vintage production drop to unacceptable levels. We believe this performance is related to a few key fundamentals such as:
Downturn in the housing market
Underwriting guidelines that worked in a stronger housing market were no longer effective in the weaker 2006 market
Tolerance levels previously allowed for appraisals were no longer effective in the weaker 2006 market
KeyGoing forward, the key area of focus for our credit management function is to ensure that the 2007 vintage performs better than 2006 and in line with our successful underwriting process is the use of NovaStarIS®. NovaStarIS® is the second generation of our proprietary automated underwriting system. IS provides more consistency in underwriting loans and allows underwriting personnel to focus more of their time on loans that are not initially accepted by the IS system.expectations. In this regard, we have taken several steps which include:
Our mortgage loan portfolio by credit grade, allTightening of which are nonconforming can be accessed viaunderwriting guidelines
Enhancing our website at www.novastarmortgage.com.appraisal review process
Identifying loans with unacceptable levels of risk.
A toolOther strategies we use for managing credit risk isare to diversify the markets in which we originate, purchase and own mortgage loans. Presented via our website at www.novastarmortgage.com is a breakdownloans and the purchase of the geographic diversification of our loans. Details regarding loans charged off are disclosed in Note 2 to our consolidated financial statements.
mortgage insurance. We have purchased mortgage insurance on manya majority of the loans that are held in our portfolio – on the balance sheet and those that serve as collateral for our mortgage securities – available-for-sale.securities. The use of mortgage insurance is discussed under “Premiums for Mortgage Loan Insurance” in “Management’s Discussion and Analysis of Financial Condition and Results of Operations”. Details regarding loans charged off are disclosed in Note 2 to our consolidated financial statements.
Prepayment Risk
.Generally speaking, when market interest rates decline, borrowers are more likely to refinance their mortgages. The higher the interest rate a borrower currently has on his or her mortgage the more incentive he or she has to refinance the mortgage when rates decline. In addition, the higher the credit grade, the more incentive there is to refinance increases when credit ratings improve. When home values rise, loan-to-value ratios drop, making it more likely that a borrower has a low loan-to-value ratio, he or she is more likely towill do a “cash-out” refinance. Each of these factors increases the chance for higher prepayment speeds during the term of the loan.speeds.
The majority of our mortgage securities available-for-sale portfolio consists of securities which are “interest-only” in nature. These securities represent the net cash flow – interest income – on the underlying loans in excess of the cost to finance the loans. When borrowers repay the principal on their mortgage loans early, the effect is to shorten the period over which interest is earned, and therefore, reduce the cash flow and yield on our securities.
We mitigate prepayment risk by originating and purchasing loans that include a penalty if the borrower repays the loan in the early months of the loan’s life. For theA majority of our loans have a prepayment penalty is charged equalup to but no greater than 80% of six months interest on the principal balance that is to be paid in full.being repaid. As of December 31, 2004, 73%2006, 60% of our securitizedthe loans had a prepayment penalty. These loanswhich serve as collateral for our mortgage securities – available-for-sale.had a prepayment penalty. As of December 31, 2004, 65%2006, 60% of our mortgage loans - held-for-saleon our balance sheet had a prepayment penalty, which serve as collateral for our short-term borrowings.penalty. During 2004, 72%2006, 62% of the loans we originated and purchased had prepayment penalties.
Regulatory Risk
Risk.As a mortgage lender, we are subject to many laws and regulations. Any failure to comply with these rules and their interpretations or with any future interpretations or judicial decisions could harm our profitability or cause a change in the way we do business. For example, several lawsuits have been filed challenging types of payments made by mortgage lenders to mortgage brokers. Similarly,
State and local governing bodies are focused on the nonconforming lending business and are concerned about borrowers paying “excessive fees” in obtaining a mortgage loan – generally termed “predatory lending”. In several instances, states or local governing bodies have imposed strict laws on lenders to curb predatory lending. To date, these laws have not had a significant impact on our branch operations, we allowbusiness. We have capped fee structures consistent with those adopted by federal mortgage agencies and have implemented rigid processes to ensure that our branch managers considerable autonomy, which could result in our facing greater exposure to third-party claims if our compliance programslending practices are not strictly adhered to.predatory in nature.
Several states and cities are considering or have passed laws, regulations or ordinances aimed at curbing predatory lending practices. The federal government is also considering legislative and regulatory proposals in this regard. In general, these proposals involve loweringWe regularly monitor the existing federal Homeownership and Equity Protection Act thresholds for defining a “high-cost” loan, and establishing enhanced protections and remedies for borrowers who receive such loans. Passage of these laws and rules could reduce our loan origination volume. In addition, many whole loan buyers may elect not to purchase any loan labeled as a “high cost” loan under any local, state or federal law or regulation. Rating agencies likewise may refuse to rate securities backed by such loans. Accordingly, these laws and rules could severely restrict the secondary market for a significant portion of our loan production. This would effectively preclude us from continuing to originate loans either in jurisdictions unacceptable to the rating agencies or otherwise within newly defined thresholds and could have a material adverse effect on our business.
Recently enacted and effective laws, regulations and standards relating to corporate governance and disclosure requirements applicable to public companies, including the Sarbanes-Oxley Act of 2002, new Securities and Exchange Commission regulations and New York Stock Exchange rules have increased the costs of corporate governance, reporting and disclosure practices. These costs may increase in the future due to our continuing implementation of compliance programs mandated by these requirements. In addition, these new laws, rules and regulations create newthat apply to our business and analyze any changes to them. We integrate many legal bases for administrative enforcement and civilregulatory requirements into our automated loan origination system to reduce inadvertent non-compliance due to human error. We also maintain policies and criminal proceedings against us in case of non-compliance, thereby increasingprocedures, summaries and checklists to help our risks of liabilityorigination personnel comply with these laws. Our training programs are designed to teach our personnel about the significant laws, rules and potential sanctions.regulations that affect their job responsibilities.
Other Risk Factors
Although management considers the risk components set forth above to be its primary business risks, the following are other risks that should be considered by our investors. Further information regarding these risks is included in our registration statements filed with the Commission.
U.S. Federal Income Tax Consequences
The following general discussion summarizes the material U.S. federal income tax considerations regarding our qualification and taxation as a REIT. This discussion is based on interpretations of the Code, regulations issued thereunder, and rulings and decisions currently in effect (or in some cases proposed), all of which are subject to change. Any such change may be applied retroactively and may adversely affect the federal income tax consequences described herein. This summary does not discuss all of the tax consequences that may be relevant to particular shareholders or shareholders subject to special treatment under the federal income tax laws. Accordingly, you should consult your own tax advisor regarding the federal, state, local, foreign, and other tax consequences of your ownership of our common stock and our REIT status and any termination of our REIT status, and regarding potential changes in applicable tax laws.
General.Since inception, we have elected to be taxed as a REIT under Sections 856 through 859 of the Code. We believe we have complied, and intend to comply in the future for so long as we remain a REIT, with the requirements for qualification as a REIT under the Code. To the extent that we qualify as a REIT for federal income tax purposes, we generally will not be subject to federal income tax on the amount of income or gain that is distributed to shareholders. However, origination and broker operations are conducted through NovaStar Mortgage, and NovaStar Home Mortgage, which areis owned by NFI Holding Corporation, Inc. – a taxable REIT subsidiary (TRS)(“TRS”). Consequently, all of the taxable income of NFI Holding Corporation, Inc. is subject to federal and state corporate income taxes. In general, a TRS may hold assets that a REIT cannot hold directly and generally may engage in any real estate or non-real estate related business. However, special rules do apply to certain activities between a REIT and its TRS. For example, a TRS will be subject to earnings stripping limitations on the deductibility of interest paid to its REIT. In addition, a REIT will be subject to a 100% excise tax on certain excess amounts to ensure that (i) tenants who payamounts paid to a TRS for services are based on amounts that would be charged in an arm’s-length amount by the TRS,transaction, (ii) fees paid to a REIT by its TRS are reflected at fair market value and (iii) interest paid by a TRS to its REIT is commercially reasonable.
The REIT rules generally require that a REIT invest primarily in real estate related assets, that its activities be passive rather than active and that it distribute annually to its shareholders substantially all of its taxable income. We could be subject to a number of taxes if we failed to satisfy those rules or if we acquired certain types of income-producing real property through foreclosure. Although no complete assurance can be given, we do not expect that we will be subject to material amounts of such taxes.
Failure to satisfy certain Code requirements could cause loss of REIT status. If we fail to qualify, or elect to terminate our status, as a REIT for any taxable year, we would be subject to federal income tax (including any applicable minimum tax) at regular corporate rates and would not receive deductions for dividends paid to shareholders. As a result, the amount of after-tax earnings available for distribution to shareholders would decrease substantially. While we intend to operate in a manner that will enable us to qualify as a REIT in future taxable years, there can be no certainty that such intention will be realized.
Qualification as a REIT. Qualification as a REIT requires that we satisfy a variety of tests relating to income, assets, distributions and ownership.ownership so long as we remain a REIT. The significant tests are summarized below.
Sources of IncomeIncome.. WeTo qualify as a REIT, we must satisfy two tests with respect to the sourcesgross income requirements, each of income: the 75% income test, and the 95% income test. The 75% income test requires that we derivewhich is applied on an annual basis. First, at least 75% of our gross income, excluding gross income from prohibited transactions, for each taxable year generally must be derived directly or indirectly from:
rents from certain passive real estate-related activities. In orderproperty;
interest on debt secured by mortgages on real property or on interests in real property;
dividends or other distributions on, and gain from the sale of, stock in other REITs;
gain from the sale of real property or mortgage loans;
amounts, such as commitment fees, received in consideration for entering into an agreement to satisfymake a loan secured by real property, unless such amounts are determined by income and profits;
income derived from a Real Estate Mortgage Investment Conduit (“REMIC”) in proportion to the 95% income test,real estate assets held by the REMIC, unless at least 95% of the REMIC’s assets are real estate assets, in which case all of the income derived from the REMIC; and
interest or dividend income from investments in stock or debt instruments attributable to the temporary investment of new capital during the one-year period following our receipt of new capital that we raise through equity offerings or public offerings of debt obligations with at least a five-year term.
Second, at least 95% of our gross income, excluding gross income from prohibited transactions, for each taxable year must be derived from the same sources asthat qualify for purposes of the 75% gross income test, and from (i) dividends, (ii) interest, (iii) certain qualifying hedges entered into prior to January 1, 2005 and (iv) gain from the sale or from dividendsother disposition of stock, securities, or, interest from any source. certain qualifying hedges entered into prior to January 1, 2005.
Management believes that we were in compliance with both of the income tests for the 20042006 and 20032005 calendar years.
Nature and Diversification of AssetsAssets.. As of the last day of each calendar quarter, we must meet six requirements under the two asset tests. Under the 75% of assets test, at least 75% of the value of our total assets must represent cash or cash items (including receivables), government securities or real estate assets. Under the 25% of assets test, no more than 25% of the value of our total assets can be represented by securities, other than (A) government securities, (B) stock of a qualified REIT subsidiary and (C) securities that qualify as real estate assets under the 75% assets test (collectively((A), (B) and (C) are collectively the “75% Securities”). Additionally, under the 25% assets test, no more than 20% of the value of our total assets can be represented by securities of one or more taxable REIT subsidiaries and no more than 5% of the value of our total assets can be represented by the securities of a single issuer, excluding 75% Securities. Furthermore, we may not own more than 10% of the total voting power or the total value of the outstanding securities of any one issuer, excluding 75% Securities.
If we inadvertently fail to satisfy one or more of the asset tests at the end of a calendar quarter, such failure would not cause us to lose our REIT status. We could still avoid disqualification by eliminating any discrepancy within 30 days after the close of the calendar quarter in which the discrepancy arose. Management believes that we arewere in compliance with all of the requirements of both asset tests for all quarters during 20042006 and 2003.2005.
Ownership of Common StockStock.. Our capital stock must be held by a minimum of 100 persons for at least 335 days of each year. In addition, at all times during the second half of each taxable year, no more than 50% in value of our capital stock may be owned directly or indirectly by 5 or fewer individuals. We use the calendar year as our taxable year for income tax purposes. The Code requires us to send annual information questionnaires to specified shareholders in order to assure compliance with the ownership tests. Management believes that we have complied with these stock ownership tests for 20042006 and 2003.2005.
DistributionsDistributions.. WeTo maintain REIT status, we must distribute at least 90% of our taxable income and any after-tax net income from certain types of foreclosure property less any non-cash income. No distributions are required in periods in which there is no taxable income. Management believes that we have complied with these distribution requirements for 2005 and intends to comply with these requirements with respect to 2006 taxable income.
Taxable IncomeIncome.. We use the calendar year for both tax and financial reporting purposes. However, there may be differences between taxable income may, and in our case does, differ from income computed in accordance with accounting principles generally accepted in the United States of America (GAAP).GAAP. These differences primarily arise from timing and character differences in the recognition of revenue and expense and gains and losses for tax and GAAP purposes. Additionally, taxable income that is subject to the distribution requirement does not include the taxable income of our taxable subsidiary,TRS, although the subsidiary’s operating results are included in our GAAP results.
Personnel
As of December 31, 2004,2006, we employed 3,5022,048 people. Of these, 1,738 were employed inManagement believes that relations with its employees are good. None of our mortgage portfolio management and mortgage lending and loan servicing operations. Our branches employed 1,721 people as of December 31, 2004. The remaining employees were employed in our branch administrative functions.are represented by a union or covered by a collective bargaining agreement.
Available Information
A copyCopies of the filings we have madeour annual report on Form 10-K, quarterly reports on Form 10-Q, current reports on Form 8-K and any amendments to these reports filed or furnished with the Securities and Exchange Commission (SEC) may be obtained onSEC are available free of charge through our Internet site (www.novastarmortgage.com) as soon as reasonably practicable after filing with the SEC. References to our website (www.novastarmortgage.com), throughdo not incorporate by reference the information on such website into this Annual Report on Form 10-K and we disclaim any such incorporation by reference. Copies of our board committee charters, our board’s Corporate Governance Guidelines, Code of Conduct, and other corporate governance information are available at the SEC (www.sec.gov)Corporate Governance section of our Internet site (www.novastarmortgage.com), or by contacting us directly. Our investor relations contact information follows.
Investor Relations
8140 Ward Parkway, Suite 300
Kansas City, MO 64114
816.237.7000816.237.7424
Email: ir@novastar1.com
Risk Factors
You should carefully consider the risks described below before investing in our publicly traded securities. The risks described below are not the only ones facing us. Our business is also subject to the risks that affect many other companies, such as competition, inflation, technological obsolescence, labor relations, general economic conditions and geopolitical events. Additional risks not currently known to us or that we currently believe are immaterial also may impair our business, operations and our liquidity.
Risks Related to Securitization, Loan Sale, and Borrowing Activities
Our growth is dependent on leverage, which may create other risks.
Our success is dependent, in part, upon our ability to grow our assets through the use of leverage. Leverage creates an opportunity for increased net income, but at the same time creates risks. For example, while we will incur leverage only when there is an expectation that it will enhance returns, leveraging magnifies both positive and negative changes in our net worth. In addition, there can be no assurance that we will be able to meet our debt service obligations and, to the extent that we cannot, our financial condition and our ability to meet minimum REIT dividend requirements will be materially and adversely affected. Furthermore, if we were to liquidate, our debt holders and lenders will receive a distribution of our available assets before any distributions are made to our common shareholders.
An interruption or reduction in the securitization market or our ability to access this market would harm our financial position.
We are dependent on the securitization market for long-term financing of our origination and purchase of mortgage loans and mortgage securities, which we initially finance with our short-term financing. In addition, many of the buyers of our whole loans purchase the loans with the intention of securitizing them. A disruption in the securitization market could prevent us from being able to sell loans or mortgage securities at a favorable price or at all. Factors that could disrupt the securitization market include an international liquidity crisis such as occurred in the fall of 1998, sudden changes in interest rates, changes in the non-conforming loan market, a terrorist attack, an outbreak of war or other significant event risk, and market specific events such as a default under a comparable type of securitization. Further, poor performance of our previously securitized loans could harm our access to the securitization market.
In addition, a court recently found a lender and securitization underwriter liable for consumer fraud committed by a company to whom they provided financing and underwriting services. In the event other courts or regulators adopted the same liability theory, lenders and underwriters could be named as defendants in more litigation and as a result they may exit the business or charge more for their services, all of which could have a negative impact on our ability to securitize our mortgage loans and mortgage securities and the securitization market in general.
A decline in our ability to obtain long-term funding for our mortgage loans or mortgage securities in the securitization market in general or on attractive terms or a decline in the market’s demand for our mortgage loans or mortgage securities could harm our results of operations, financial condition and business prospects and could result in defaults under our short term financing arrangements for these assets.
We may not be able to continue to sell our mortgage loans on terms and conditions that are profitable to us.
A portion of our revenues comes from the gains on sale generated by sales of pools of our mortgage loans as whole loans. We make whole loan sales to a limited number of institutional purchasers, some of which may be frequent, repeat purchasers, and others of which may make only one or a few purchases from us. We cannot assure you that we will continue to have purchasers for our loans on terms and conditions that will be profitable to us. Also, even though our mortgage loans are generally marketable to multiple purchasers, certain loans may be marketable to only one or a few purchasers, thereby increasing the risk that we may be unable to sell such loans at a profit.
Failure to renew or obtain adequate funding under warehouse repurchase agreements may harm our business.
We are dependent upon several warehouse repurchase agreements to provide short term financing for our origination and purchase of mortgage loans pending their sale or securitization. In addition, we utilize warehouse repurchase agreements for short and medium term financing for our purchase and retention of mortgage securities. Under a warehouse repurchase agreement, we sell an asset and agree to repurchase the same asset at some point in time in the future. Generally, the repurchase agreements we enter into require monthly roll-over repurchase transactions, with a six- to nine-month maximum financing period for mortgage loans and a three-year maximum financing period for securities retained from our mortgage loan securitizations. For financial accounting purposes, these arrangements are treated as secured financings. We retain the assets on our balance sheet and record an obligation to repurchase the assets. The amount we may borrow under these arrangements is generally 95% to 100% of the asset market value with respect to performing mortgage loans and 70% to 80% of the asset market value with respect to nonperforming mortgage loans. Additionally, the amount we may borrow under these arrangements is generally 40% to 95% of the asset market value with respect to mortgage securities depending on the investment rating.
These warehouse repurchase agreements contain numerous representations, warranties and covenants, including requirements to maintain a certain minimum net worth, to maintain minimum equity ratios, to maintain our REIT status, and other customary debt covenants. Events of default under these facilities include material breaches of representations and warranties, failure to comply with covenants, material adverse effects upon or changes in our business, assets, or financial condition, and other customary matters. Events of default under certain of our facilities also include termination of our status as servicer with respect to certain securitized loan pools and failure to maintain profitability over consecutive quarters. If we were unable to make the necessary representations and warranties at the time we need financing, we would not be able to obtain needed funds. In addition, if we default under any warehouse repurchase agreement under which borrowings are then outstanding, the lenders under substantially all of our existing warehouse repurchase agreements could demand immediate payment of all outstanding amounts pursuant to cross-default provisions. Any failure to renew or obtain adequate funding under these financing arrangements for any reason, or any demand by warehouse lenders for immediate payment of outstanding balances, could harm our lending and loan purchase operations and have a material adverse effect on our results of operations, financial condition and business prospects. In addition, an increase in the cost of warehouse financing in excess of any change in the income derived from our mortgage assets could also harm our earnings and reduce the cash available for distribution to our shareholders. In October 1998, the subprime mortgage loan market faced a liquidity crisis with respect to the availability of short-term borrowings from major lenders and long-term borrowings through securitization. At that time, we faced significant liquidity constraints which harmed our business and our profitability. There is no assurance that a comparable situation will not occur in the future.
A decline in the market value of mortgage assets financed under our warehouse finance arrangements may result in margin calls or similar obligations, which may require that we liquidate assets at a disadvantageous time.
When, in a lender’s opinion, the market value of assets subject to a warehouse repurchase agreement decreases for any reason, including a rise in interest rates or general concern about the value or liquidity of the assets, we are required to repay the margin or difference in market value, or post additional collateral. If cash or additional collateral is unavailable to meet margin calls, we may default on our obligations under the applicable repurchase agreement, which would cross-default substantially all of our warehouse repurchase agreements. In that event, our lenders would have the right to liquidate the collateral we provided them to settle the amount due from us and, in general, the right to recover any deficiency from us.
In addition, we utilize warehouse financing arrangements for the accumulation of third-party mortgage-backed securities and related credit default derivatives for purposes of CDO offerings. Under these arrangements, the financing party has the right to liquidate any assets that decline in credit quality or fail to continue to meet eligibility requirements, and the right to liquidate the entire pool of financed assets if the related CDO offering does not occur by a specified date. If a liquidation results in a net loss, we are required to pay to the financing party the amount of the net loss.
In order to obtain cash to satisfy a margin call or a net loss payment obligation, we may be required to liquidate assets at a disadvantageous time, which could cause us to incur further losses and adversely affect our results of operations and financial condition. In addition, an unplanned liquidation of assets could change our mix of investments, which in turn could jeopardize our REIT status or our ability to rely on certain exemptions under the Investment Company Act of 1940, as amended (the “Investment Company Act”).
We may be required to repurchase mortgage loans or indemnify mortgage loan purchasers as a result of breaches of representations and warranties, borrower fraud, or certain borrower defaults, which could harm our liquidity, results of operations and financial condition.
When we sell mortgage loans, whether as whole loans or pursuant to a securitization, we are required to make customary representations and warranties to the purchaser about the mortgage loans and the manner in which they were originated. Our whole loan sale agreements require us to repurchase or substitute mortgage loans in the event we breach any of these representations or warranties. In addition, we may be required to repurchase mortgage loans as a result of borrower fraud or in the event of early payment default on a mortgage loan. Likewise, we are required to repurchase or substitute mortgage loans if we breach a representation or warranty in connection with our securitizations. The remedies available to us against the originating broker or correspondent may not be as broad as the remedies available to a purchaser of mortgage loans against us, and we face the further risk that the originating broker or correspondent may not have the financial capacity to perform remedies that otherwise may be available to us. Therefore, if a purchaser enforces its remedies against us, we may not be able to recover losses from the originating broker or correspondent. Repurchased loans are typically sold at a significant discount to the unpaid principal balance and, prior to sale, can be financed by us, if at all, only at a steep discount to our cost. As a result, significant repurchase activity could harm our liquidity, cash flow, results of operations, financial condition and business prospects.
Recently, we have received an increased number of repurchase and indemnity demands from purchasers of whole loans as a result of borrower fraud and early borrower payment defaults, which has had a negative impact on our results of operations. While we have taken steps to enhance our underwriting policies and procedures, there can be no assurance that these steps will be effective. To the extent that repurchase and indemnity demands continue at this rate or increase, our results of operations and financial condition will be adversely affected.
Our investments in mortgage securities and loans are subject to changes in credit spreads which could adversely affect our ability to realize gains on the sale of such investments and may subject us to margin calls or similar liquidity requirements.
The value of mortgage securities is dependent on the yield demanded on these securities by the market based on their credit relative LIBOR. Excessive supply of these securities combined with reduced demand will generally cause the market to require a higher yield on these securities, resulting in the use of a higher, or “wider,” spread over the benchmark rate (usually the applicable LIBOR security yield) to value such securities. Under such conditions, the value of our mortgage securities portfolio would tend to decline. Conversely, if the spread used to value such securities were to decrease, or “tighten,” the value of our mortgage securities portfolio would tend to increase.
Our loan portfolio is also subject to changes in credit spreads. The value of these loans is dependent on the yield demanded by the market based on their credit relative to LIBOR. The value of our loans would tend to decline should the market require a higher yield on such loans, resulting in the use of a higher spread over the benchmark rate (usually the applicable LIBOR yield). Conversely, if the spread used to value such loans were to decrease, or “tighten,” the value of our loan portfolio would tend to increase.
A decrease in the value of our loans or mortgage securities would reduce our ability to realize gains upon the sale or securitization of these assets and, with respect to mortgage securities (which are marked to market quarterly), could result in impairments for securities classified as available-for-sale or mark-to-market losses for securities classified as trading.. In addition, a decrease in the value of our mortgage loans or securities reduces the funds available to us in respect of these assets under our warehouse repurchase agreements and may result in margin calls. Further, a decrease in the value of third party mortgage securities that we have accumulated for the purpose of a CDO offering may reduce the availability or attractiveness of the CDO offering, in which case we may be required to seek other forms of potentially less attractive longer-term financing or to liquidate the assets on unfavorable terms.
We retain and assume credit risk under a variety of mortgage securities and similar assets in connection with and as a result of our securitization activities. Significant losses on these assets reduce our earnings, negatively affect our liquidity, and otherwise negatively affect our business.
We retain certain residual securities resulting from our securitizations of mortgage loans, which typically consist of interest-only, prepayment penalty, and overcollateralization bonds. We also retain from our securitizations, as well as purchase from 3rd party ABS issuers, certain investment grade and non-investment grade rated subordinated mortgage securities. The residual securities are typically unrated or rated below investment grade and, as such, involve significant investment risk that exceeds the aggregate risk of the full pool of securitized loans. By holding the residual securities, we retain the “first loss” risk associated with the underlying pool of mortgage loans. As a result, the credit performance and prepayment rates of the sub-prime loans underlying these mortgage securities directly affect our returns on these mortgage securities. Significant realized losses from our residual and subordinated mortgage securities could harm our results of operations and financial condition. In addition, because we finance these securities under medium-term warehouse repurchase agreements, decreases in the value of these retained securities may result in margin calls and adversely affect our liquidity.
We invest in or assume financial risk associated with mortgage securities issued by third party residential real estate loan securitization entities, most of which are backed by sub-prime loans. In addition, following a CDO offering, we retain equity or unsecured debt securities of the CDO issuer. We expect to increase our investment in third party mortgage securities and CDO issuer equity and debt securities and, consequently, to increase our credit and prepayment exposure to the assets that underlie these securities. A significant portion of these third party mortgage securities consists of securities that are subordinate to other securities secured by the same pool of assets and, as such, have significant investment risk. Generally, we do not control or influence the underwriting, servicing, management, or loss mitigation efforts with respect to the assets underlying securities issued by securitizations we do not sponsor. If the asset pools underlying any of these securities were to experience poor credit results, the market value of the third party securities that we hold directly and of our equity interest in or unsecured debt of a CDO issuer could decrease. Significant realized losses from third party mortgage securities, directly or indirectly through our interest in a CDO issuer, could harm our results from operations, liquidity, and financial condition.
Further, we may enter into or assume financial risk associated with ABS credit default swaps or similar derivatives, referred to a “synthetic securities,” in contemplation of the transfer of such synthetic securities to a CDO issuer in connection with our CDO offerings. Under these synthetic securities, we may assume, in exchange for a premium, payment and credit risk associated with third party mortgage securities. In addition to the risks associated with the third party securities to which the synthetic security relates, synthetic securities are unsecured and would expose us to the risk of payment default by the swap counterparty and to risks associated with the determination of settlement payments upon a credit event relating to the referenced mortgage securities or other settlement event. In addition, the market for synthetic securities of this type is not highly liquid and, as such, we may not be able to realize the full value of a synthetic security in the event we need to liquidate or dispose of the synthetic security, which could negatively impact our results of operations and financial condition.
Credit results with respect to mortgage assets underlying our securitizations may negatively affect our access to the securitization market on favorable terms, which in turn would harm our financial condition and prospects.
If the non-conforming loan industry continues to experience credit difficulties, our ability to access the securitization market on favorable terms may be negatively affected. In addition if the pools of mortgage loans underlying our securitizations of mortgage loans or indirectly underlying our securitizations of mortgage securities were to experience poor credit results, the securities issued in these securitizations could have their credit ratings down-graded, could suffer losses in market value, and could experience principal losses. In addition to reducing the long-term returns and near-term cash flows from the securities we have retained or acquired in these transactions, any of the foregoing may reduce our ability to sponsor securitization transactions, including CDO offerings, in the future.
Competition in the securitization market may erode our securitization margins, which in turn may adversely affect or harm our financial condition and prospects.
Competition in the business of sponsoring securitizations of the type we focus on is increasing as Wall Street broker-dealers, hedge funds, mortgage REITs, investment management companies, and other financial institutions expand their activities or enter this field. Increased competition could reduce our securitization margins. To the extent that our securitization margins erode, our results of operations, financial condition and business prospects will be negatively impacted.
Differences in our actual experience compared to the assumptions that we use to determine the value of our residual mortgage securities could adversely affect our financial position.
Our securitizations of mortgage loans that are structured as sales for financial reporting purposes result in gain recognition at closing as well as the recording of the residual mortgage securities we retain at fair value. As of December 31, 2006 we had retained residual mortgage securities from our securitizations of mortgage loans with a fair value of $349.3 million on our balance sheet.
Delinquency, loss, prepayment and discount rate assumptions have a material impact on the amount of gain recognized and on the carrying value of our residual mortgage securities. It is extremely difficult to validate the assumptions we use in determining the amount of gain on sale and the value of our residual mortgage securities. If our actual experience differs materially from the assumptions that we use to determine our gain on sale or the value of these mortgage securities, our future cash flows, our financial condition and our results of operations could be negatively affected.
The value of residual interests represents the present value of future cash flows expected to be received by us from the excess cash flows created in the securitization transaction. In general, future cash flows are estimated by taking the coupon rate of the loans underlying the transaction less the interest rate paid to the investors, less contractually specified servicing and trustee fees, and after giving effect to estimated prepayments and credit losses. We estimate future cash flows from these securities and value them utilizing assumptions based in part on projected discount rates, delinquency, mortgage loan prepayment speeds and credit losses. It is extremely difficult to validate the assumptions we use in valuing our residual interests. Even if the general accuracy of the valuation model is validated, valuations are highly dependent upon the reasonableness of our assumptions and the predictability of the relationships which drive the results of the model. Such assumptions are complex as we must make judgments about the effect of matters that are inherently uncertain. If our actual experience differs from our assumptions, we would be required to reduce the value of these securities.Furthermore, if our actual experience differs materially from these assumptions, our cash flow, financial condition, results of operations and business prospects may be harmed, including an adverse affect on the amount of dividend payments that are made on our common stock.
Changes in accounting standards might cause us to alter the way we structure or account for securitizations.
Changes could be made to current accounting standards, which could affect the way we structure or account for securitizations. For example, if changes were made in the types of transactions eligible for gain on sale treatment, we may have to change the way we account for securitizations, which may harm our results of operations or financial condition.
The rate at which we are able to acquire eligible mortgage loans or mortgage securities and changes in market conditions during asset accumulation may adversely affect our anticipated returns from the securitization of these assets.
We use short term warehouse financing arrangements to finance the acquisition of mortgage loans and mortgage securities until a sufficient quantity of assets is accumulated, at which time we may refinance these lines through a securitization or other long term financing. As a result, we are subject to the risk that we will not be able to acquire, during the period in which the relevant warehouse facility is available for the funding of such assets, a sufficient amount of eligible securities to maximize the efficiency of a securitization. In addition, changes in conditions in the capital markets may make a securitization less attractive to us by the time we do have a sufficient pool of collateral. If we are unable to securitize these assets, we may be required to seek other forms of potentially less attractive financing or otherwise to liquidate the assets on unfavorable terms.
Market factors may limit our ability to originate and acquire mortgage assets at yields that are favorable relative to costs.
Despite our experience in the origination and acquisition of mortgage assets and our relationships with brokers and sellers of mortgage assets, we face the risk that we might not be able to originate or acquire mortgage assets that earn interest rates greater than our cost of funds under our short-term borrowings and securitizations, or that we might not be able to originate or acquire a sufficient number of such mortgage assets to maintain our profitability. An inability to originate or purchase sufficient volumes of loans and mortgage securities at a cost lower than the net cash proceeds realized from their sale or securitization would materially harm our results of operations, financial condition and business prospects.
We have recently imposed stricter mortgage loan and borrower requirements, which may result in a decrease in our mortgage loan origination and purchase volumes and, consequently, our loan sale and securitization volumes.
As a result of less favorable economic conditions and an increase in the number of fraudulently obtained loans and borrower defaults, we have tightened our mortgage loan lending and purchase requirements and the processes we undergo to document loans. There may be fewer borrowers and loans that qualify under these revised standards, and we may face increased competition from lenders and loan purchasers with less rigorous standards. As a result, our loan origination and purchase volumes may decline. A decline in our loan origination or purchase volumes would decrease the volume of assets available to us for sale or securitization, which could adversely affect our results of operations and financial condition.
Risks Related to Interest Rates and Our Hedging Strategies
Changes in interest rates may harm our results of operations and equity value.
Our results of operations are likely to be harmed during any period of unexpected or rapid changes in interest rates. Our primary interest rate exposures relate to our mortgage securities, mortgage loans, floating rate debt obligations, interest rate swaps, and interest rate caps. Interest rate changes could adversely affect our results of operations and liquidity in the following ways:
a substantial or sustained increase in interest rates could harm our ability to originate or acquire mortgage loans and mortgage securities in expected volumes, which could result in a decrease in our cash flow and in our ability to support our fixed overhead expenses;
interest rate fluctuations may harm our earnings and access to capital as the spread between the interest rates we pay on our borrowings and hedges and the interest rates we receive on our mortgage assets narrows;
if prevailing interest rates increase after we fund a loan, the value that we receive upon the sale or securitization of the loan decreases;
when we securitize loans, the value of the residual and subordinated securities we retain and the income we receive from them are based primarily on LIBOR, and an increase in LIBOR increases our funding costs which reduces the net income we receive from, and the value of, these securities;
existing borrowers with adjustable-rate mortgages or higher risk loan products may incur higher monthly payments as the interest rate increases, and consequently may experience higher delinquency and default rates, resulting in decreased earnings and decreased value of our mortgage securities;
mortgage prepayment rates vary depending on such factors as mortgage interest rates and market conditions, and changes in anticipated prepayment rates may harm our earnings and the value of our mortgage securities.
In addition, interest rate changes may also impact our net book value as our mortgage securities and related hedge derivatives are marked to market each quarter. Our mortgage loans and debt obligations are not marked to market. Generally, as interest rates increase, the value of our mortgage securities decrease which decreases the book value of our equity. We intend to increase our investment in mortgage securities, which may amplify the impact of interest rate changes on our book value.
Furthermore, shifts in the yield curve, which represents the market’s expectations of future interest rates, also affects the yield required for the purchase of our mortgage securities and therefore their value. To the extent that there is an unexpected change in the yield curve it could have an adverse effect on our mortgage securities portfolio and our financial position and operations.
Hedging against interest rate exposure may adversely affect our earnings, which could adversely affect cash available for operations and for distribution to our shareholders.
There are limits on the ability of our hedging strategy to protect us completely against interest rate risks. When interest rates change, we expect the gain or loss on derivatives to be offset by a related but inverse change in the value of the hedged items, generally our liabilities. We cannot assure you, however, that our use of derivatives will offset the risks related to changes in interest rates. We cannot assure you that our hedging strategy and the derivatives that we use will adequately offset the risk of interest rate volatility or that our hedging transactions will not result in losses. We may enter into interest rate cap or swap agreements or pursue other interest rate hedging strategies. Our hedging activity will vary in scope based on interest rates, the type of mortgage assets held, other changing market conditions and, so long as we remain a REIT, compliance with REIT requirements. Interest rate hedging may fail to protect or could adversely affect us because, among other things:
interest rate hedging can be expensive, particularly during periods of rising and volatile interest rates;
hedging instruments involve risk because they often are not traded on regulated exchanges, guaranteed by an exchange or its clearing house, or regulated by any U.S. or foreign governmental authorities; consequently, there are no requirements with respect to record keeping, financial responsibility or segregation of customer funds and positions, and the enforceability of agreements underlying derivative transactions may depend on compliance with applicable statutory, commodity and other regulatory requirements;
available interest rate hedging may not correspond directly with the interest rate risk for which protection is sought;
the duration of the hedge may not match the duration of the related liability or asset;
the credit quality of the party owing money on the hedge may be downgraded to such an extent that it impairs our ability to sell or assign our side of the hedging transaction;
the party owing money in the hedging transaction may default on its obligation to pay, which may result in the loss of unrealized profits; and
we may not be able to dispose of or close out a hedging position without the consent of the hedging counterparty, and we may not be able to enter into an offsetting contract in order to cover our risks.
Any hedging activity we engage in may adversely affect our earnings, which could adversely affect cash available for operations and for distribution to our shareholders. Unanticipated changes in interest rates may result in poorer overall investment performance than if we had not engaged in any such hedging transactions.
Complying with REIT requirements may limit our ability to hedge effectively.
We attempt to minimize exposure to interest rate fluctuations by hedging. The REIT provisions of the Code limit our ability to hedge mortgage assets and related borrowings by requiring us to limit our income in each year from any qualified hedges, together with any other income not generated from qualified real estate assets, to no more than 25% of our gross income. The interest rate hedges that we generally enter into will not be counted as a qualified asset for the purposes of satisfying this requirement. In addition, under the Code, we must limit our aggregate income from non-qualified hedging transactions and from other non-qualifying sources to no more than 5% of our annual gross income. As a result, we may have to limit our use of advantageous hedging techniques. This could result in greater risks associated with changes in interest rates than we would otherwise want to incur. In addition, if it is ultimately determined that some of our interest rate hedging transactions are non-qualified under the Code; we may have more than 5% of our annual gross income from non-qualified sources. If we violate the 5% or 25% limitations, we may have to pay a penalty tax equal to the amount of income in excess of those limitations, multiplied by a fraction intended to reflect our profitability. In addition, if we fail to observe these limitations, we could lose our REIT status unless our failure was due to reasonable cause and not due to willful neglect.
Risks Related to Credit Losses and Prepayment Rates
Loans made to nonconforming mortgage borrowers entail relatively higher delinquency and default rates which will result in higher loan losses.
Lenders in the nonconforming mortgage banking industry make loans to borrowers who have impaired or limited credit histories, limited documentation of income and higher debt-to-income ratios than traditional mortgage lenders allow. Mortgage loans made to nonconforming mortgage loan borrowers generally entail a relatively higher risk of delinquency and foreclosure than mortgage loans made to borrowers with better credit and, therefore, will result in higher levels of realized losses than conventional loans. Delinquency interrupts the flow of projected interest income from a mortgage loan, and default can ultimately lead to a loss if the net realizable value of the real property securing the mortgage loan is insufficient to cover the principal and interest due on the loan. Loans that become delinquent prior to sale or securitization may become unsaleable or saleable only at a discount, and the longer we hold loans prior to sale or securitization, the greater the chance we will bear all costs associated with the loans’ delinquency. Also, our cost of financing and servicing a delinquent or defaulted loan is generally higher than for a performing loan.
We bear the risk of delinquency and default on loans beginning when we originate them. In whole loan sales, our risk of delinquency and default typically only extends until the borrower makes the first payment but can extend up to the third payment. When we securitize any of our loans, we continue to be exposed to delinquencies and losses, either through our residual interests for securitizations structured as sales or through the loans that remain on our balance sheet for securitizations structured as financings. We also re-acquire the risks of delinquency and default for loans that we are obligated to repurchase.
We attempt to manage these risks with risk based mortgage loan pricing and appropriate underwriting criteria and policies and loan collection methods. However, as with the broader nonconforming mortgage loan industry, we have recently experienced an increase in borrower delinquencies and defaults, which has adversely affected our cash flows, results of operations and financial condition. While we have taken steps to tighten our underwriting guidelines and procedures, there can be no assurance that these steps will be effective. To the extent that we cannot successfully address these issues, or the increase in delinquencies and defaults becomes more severe, our results of operations and financial condition may be further adversely affected.
We face loss exposure due to fraudulent and negligent acts on the part of loan applicants, employees, mortgage brokers and other third parties.
When we originate or purchase mortgage loans, we rely heavily upon information provided to us by third parties, including information relating to the loan application, property appraisal, title information and employment and income documentation. If any of this information is fraudulently or negligently misrepresented to us and such misrepresentation is not detected by us prior to loan funding, the value of the loan may be significantly lower than we expected. Whether a misrepresentation is made by the loan applicant, the loan broker, one of our employees, or any other third party, we generally bear the risk of loss associated with it. A loan subject to misrepresentation typically cannot be sold and, if sold prior to our detection of the misrepresentation, generally must be repurchased by us. We may not be able to recover losses incurred as a result of the misrepresentation.
As with the broader nonconforming mortgage loan industry, we have recently experienced an increase in exposure due to fraud, which has resulted in an increase in our repurchase and indemnity obligations and has adversely affected our cash flow, results of operations and financial condition. To the extent that we cannot successfully address these issues or the increase in fraud becomes more severe, our results of operations and financial condition may be further adversely affected.
Our reliance on cash-out refinancings as a significant source of our origination volume increases the risk that our earnings will be harmed if the demand for this type of refinancing declines.
Approximately 65% of our loan production volume during the year ended December 31, 2006 consisted of cash-out refinancings. Our reliance on cash-out refinancings as a significant source of our origination volume increases the risk that our earnings will be reduced if interest rates rise and the prices of homes decline, which would reduce the demand and production volume for this type of refinancing. To the extent interest rates continue to rise, the number of borrowers who would qualify or elect to pursue a cash-out refinancing could be reduced significantly, which will result in a decline in that origination source. Similarly, a decrease in home prices would reduce the amount of equity available to be borrowed against in cash-out refinancings and result in a decrease in our loan production volume from that origination source. Therefore, our reliance on cash-out refinancings as a significant source of our origination volume could harm our results of operations, financial condition and business prospects.
Our efforts to manage credit risk may not be successful in limiting delinquencies and defaults in underlying loans and, as a result, our results of operations may be affected.
There are many aspects of credit that we cannot control and our quality control and loss mitigation operations may not be successful in limiting future delinquencies, defaults and losses. For example, the value of the homes collateralizing residential loans may decline due to a variety of reasons beyond our control, such as weak economic conditions, natural disasters, over-leveraging of the borrower, and reduction in personal incomes. Interest-only loans, negative amortization loans, adjustable-rate loans, reduced documentation loans, sub-prime loans, home equity lines of credit and second lien loans may involve higher than expected delinquencies and defaults. Changes in consumer behavior, bankruptcy laws, and other laws may exacerbate loan losses.
Our comprehensive underwriting process may not be effective in mitigating these risks and our risk of loss on the underlying loans. Further, expanded loss mitigation efforts in the event that defaults increase could increase our operating costs. In response to increasing default rates recently experienced by us and the nonconforming mortgage loan industry generally, we have enhanced our underwriting policies and procedures, which may decrease our ability to originate and purchase loans. To the extent that these efforts are ineffective to reduce the current level of loan delinquencies and defaults or adversely affect our origination and purchase volumes, our results of operations may be adversely affected.
Mortgage insurers may in the future change their pricing or underwriting guidelines or may not pay claims resulting in increased credit losses.
We use mortgage insurance to mitigate our risk of credit losses. Our decision to obtain mortgage insurance coverage is dependent, in part, on pricing trends. Mortgage insurance coverage on our new mortgage loan production may not be available at rates that we believe are economically viable for us or at all. We also face the risk that our mortgage insurers might not have the financial ability to pay all claims presented by us or may deny a claim if the loan is not properly serviced, has been improperly originated, is the subject of fraud, or for other reasons. Any of those events could increase our credit losses and thus adversely affect our results of operations and financial condition.
Investments in diverse types of assets and businesses could expose us to new, different, or increased risks.
We have invested in and intend to invest in a variety of assets that are related to our current core business, including loans, securities, and related derivatives. We may make investments in debt and equity securities issued by our own and third party CDOs that own various types of assets. These CDOs may invest in manufactured housing loans, sub-prime residential mortgage loans, and other residential mortgage loans backed by lower-quality borrowers, in other loans and receivables, in securities backed by the foregoing, and in credit default derivatives referencing these or other securities. The higher credit and/or prepayment risks associated with these types of investments may increase our exposure to losses. In addition, certain of these assets may be relatively new or unique products, which may increase contractual and liquidity risks.
The federal banking agencies’ final guidance on nontraditional mortgage products may impact our ability to originate, buy, or sell certain nontraditional mortgage loans.
On October 4, 2006, the Office of the Comptroller of the Currency, the Board of Governors of the Federal Reserve System, the Federal Deposit Insurance Corporation, the Office of Thrift Supervision, and the National Credit Union Administration issued their final “Interagency Guidance on Nontraditional Mortgage Product Risks” (the “Guidance”). Nontraditional mortgage products are those which allow borrowers to defer payment of principal and sometimes interest. They include what are commonly referred to as “option ARM” loans and interest-only loans.
The Guidance addresses the portfolio risks and consumer protection issues that the federal agencies believe investors and lenders face when making or investing in nontraditional mortgage loans. As a matter of portfolio risk management, the Guidance warns applicable financial institutions that loan terms should be analyzed to ensure a manageable risk level, utilizing sound underwriting standards including an evaluation of factors that may compound the risk, such as reduced documentation programs and the use of second lien mortgages. The analysis of repayment ability “should avoid over-reliance on credit scores as a substitute for income verification in the underwriting process” and should include an analysis of the borrower’s ability to make the payment when it increases to include amortization of the loan.
As a matter of consumer protection, financial institutions subject to the Guidance, when promoting or describing nontraditional mortgage products, are directed to ensure that they provide consumers with marketing materials and at application with information that is designed to help them make informed decisions when selecting and using these products. Lenders subject to the Guidance are instructed that the information they are to provide should apprise consumers of the risk that the monthly payment amounts could increase in the future, and explain the possibility of negative amortization.
While not directly applicable to us, the Guidance may affect our ability to make, buy or sell the nontraditional loans covered by the Guidance. Further, the Guidance is instructive of the regulatory climate concerning those loans and may be adopted in whole or part by other agencies that regulate us. The Guidance reports that the Conference of State Bank Supervisors (“CSBS”) and the State Financial Regulators Roundtable (“SFRR”) are committed to preparing a model guidance document for state regulators of non-depository institutions such as us, which would be “similar in nature and scope” to the Guidance. It is also possible that the Guidance, or certain provisions within it, may be adopted as laws or used as guidance by federal, state or local agencies and that those laws or guidance may be applied to us.
If we are required (either by a regulatory agency or by third-party originators or investors) to make changes to our business practices to comply with the Guidance, it might affect the business activities in which we may engage and the profitability of those activities. Our business could be adversely affected if, as a result of the Guidance, investors from which we purchase loans, or to whom we sell loans, change their business practices and policies relative to nontraditional mortgage products. For example, if entities from which we purchase loans are required to change their origination guidelines thereby affecting the volume, diversity, and quality of loans available for purchase by us, or if purchasers of mortgage loans are required to make changes to the purchasing policies, then our loan volume, ability to sell mortgage loans and profitability, could be adversely affected.
Our interest-only loans may have a higher risk of default than our fully-amortizing loans.
For the year ended December 31, 2006, originations of interest-only loans totaled $1.4 billion, or 13%, of our total originations. These interest-only loans require the borrowers to make monthly payments only of accrued interest for the first 24, 36 or 120 months following origination. After such interest-only period, the borrower’s monthly payment is recalculated to cover both interest and principal so that the mortgage loan will amortize fully prior to its final payment date. The interest-only feature may reduce the likelihood of prepayment during the interest-only period due to the smaller monthly payments relative to a fully-amortizing mortgage loan. If the monthly payment increases, the related borrower may not be able to pay the increased amount and may default or may refinance the related mortgage loan to avoid the higher payment. Because no principal payments may be made on such mortgage loans for an extended period following origination, if the borrower ultimately defaults, the unpaid principal balance of the related loans would be greater than otherwise would be the case for a fully-amortizing loan. As a result, the likelihood that we would incur a loss on these loans will increase, especially in a declining real estate market.
Current loan performance data may not be indicative of future results.
When making capital budgeting and other decisions, we use projections, estimates and assumptions based on our experience with mortgage loans. Actual results and the timing of certain events could differ materially in adverse ways from those projected, due to factors including changes in general economic conditions, interest rates, mortgage loan prepayment rates and in losses due to defaults on mortgage loans. These differences and fluctuations could rise to levels that may adversely affect our profitability and financial condition.
Changes in prepayment rates of mortgage loans could adversely affect the return that we are able to achieve on our assets.
The value of our assets may be affected by prepayment rates on our residential mortgage loans and other floating rate assets. Prepayment rates are influenced by changes in current interest rates and a variety of economic, geographic and other factors beyond our control, and consequently, such prepayment rates cannot be predicted with certainty. In periods of declining mortgage interest rates, prepayments on loans generally increase. If general interest rates decline as well, the proceeds of such prepayments received during such periods are likely to be reinvested by us in assets yielding less than the yields on the assets that were prepaid. In addition, the market value of floating rate assets may, because of the risk of prepayment, benefit less than fixed rate assets from declining interest rates. Conversely, in periods of rising interest rates, prepayments on loans generally decrease, in which case we would not have the prepayment proceeds available to invest in assets with higher yields. Under certain interest rate and prepayment scenarios we may fail to recoup fully our cost of acquisition of certain investments. As a result of all of these factors, changes in prepayment rates could adversely affect our return on our assets.
Geographic concentration of mortgage loans we originate or purchase increases our exposure to risks in those areas.
Over-concentration of loans we originate or purchase in any one geographic area increases our exposure to the economic and natural hazard risks associated with that area. Declines in the residential real estate markets in which we are concentrated may reduce the values of the properties collateralizing our mortgages which in turn may increase the risk of delinquency, foreclosure, bankruptcy, or losses from those loans. To the extent that borrowers in a geographic area in which we have made a significant number of loans become delinquent or otherwise default on such loans, our financial condition and results of operations may be adversely affected.
To the extent that we have a large number of loans in an area hit by a natural disaster, we may suffer losses.
Standard homeowner insurance policies generally do not provide coverage for natural disasters, such as hurricanes and floods. Furthermore, nonconforming borrowers are not likely to have special hazard insurance. To the extent that borrowers do not have insurance coverage for natural disasters, they may not be able to repair the property or may stop paying their mortgages if the property is damaged. A natural disaster that results in a significant number of delinquencies could cause increased foreclosures and decrease our ability to recover losses on properties affected by such disasters, and that in turn could harm our financial condition and results of operations.
A prolonged economic slowdown or a decline in the real estate market could harm our results of operations.
A substantial portion of our mortgage assets consist of single-family mortgage loans or mortgage securities evidencing interests in single-family mortgage loans. Because we make a substantial number of loans to credit-impaired borrowers, the actual rates of delinquencies, foreclosures and losses on these loans tend to be higher during economic slowdowns. Recently, we have experienced an increase in delinquencies and foreclosures. Any sustained period of increased delinquencies or defaults or any sharp increase in the number of delinquencies and defaults could harm our ability to sell loans, the prices we receive for our loans, the values of our mortgage loans held for sale, our ability to finance loan originations and our residual interests in securitizations, which could harm our financial condition and results of operations. In addition, any material decline in real estate values would weaken our collateral loan-to-value ratios and increase the possibility of loss if a borrower defaults. In such event, we will be subject to the risk of loss on such mortgage asset arising from borrower defaults to the extent not covered by third-party credit enhancement.
Risks Related to the Legal and Regulatory Environment in Which We Operate
Various legal proceedings could adversely affect our financial condition or results of operations.
In the course of our business, we are subject to various legal proceedings and claims. See “Item 3 – Legal Proceedings.” The resolution of these legal matters or other legal matters could result in a material adverse impact on our results of operations, financial condition and business prospects.
We are subject to the risk that provisions of our loan agreements may be unenforceable.
Our rights and obligations with respect to our loans are governed by written loan agreements and related documentation. It is possible that a court could determine that one or more provisions of a loan agreement are unenforceable, such as a loan prepayment prohibition or the provisions governing our security interest in the underlying collateral. If this were to happen with respect to a material asset or group of assets, we could be required to repurchase these loans and may not be able to sell or liquidate the loans, which could negatively affect our liquidity and financial condition.
We are exposed to the risk of environmental liabilities with respect to properties to which we take title.
In the course of our business, we occasionally foreclose and take title to residential properties and as a result could become subject to environmental liabilities associated with these properties. We may be held liable for property damage, personal injury, investigation, and cleanup costs incurred in connection with environmental contamination. These costs could be substantial. If we ever become subject to significant environmental liabilities, our financial condition and results of operations could be adversely affected.
Regulation as an investment company could harm our business; efforts to avoid regulation as an investment company could limit our operations.
If we were required to comply with the Investment Company Act, we would be prevented from conducting our business as described in this document by, among other things, substantially limiting our ability to use leverage. The Investment Company Act does not regulate entities that are primarily engaged, directly or indirectly, in a business “other than that of investing, reinvesting, owning, holding or trading in securities,” or that are primarily engaged in the business of “purchasing or otherwise acquiring mortgages and other liens on and interests in real estate.” Under the Commission’s current interpretation, in order to qualify for the latter exemption we must maintain at least 55% of our assets directly in “qualifying real estate interests” and at least an additional 25% of our assets in other real estate-related assets or additional qualifying real estate interests. Mortgage-backed securities that do not represent all the certificates issued with respect to an underlying pool of mortgages may be treated as securities separate from the underlying mortgage loans and thus may not qualify as a qualifying real estate interest for the purposes of the 55% requirement. Therefore, to insure that we continue to qualify for the exemption, we may be required to adopt less efficient methods of financing certain of our mortgage assets, we may be required to sell certain mortgage securities at disadvantageous terms, and we may be precluded from acquiring certain types of higher yielding mortgage assets. If we fail to qualify for an applicable exemption from the Investment Company Act, we could not operate our business efficiently under the regulatory scheme imposed by the Investment Company Act. Accordingly, we could be required to restructure our activities which could materially adversely affect our financial condition and results of operations.
Our failure to comply with federal, state or local regulation of, or licensing requirements with respect to, mortgage lending, loan servicing, broker compensation programs, or other aspects of our business could harm our operations and profitability.
As a mortgage lender, loan servicer and broker, we are subject to an extensive body of both state and federal law. The volume of new or modified laws and regulations has increased in recent years and, in addition, some individual municipalities and cities have begun to enact laws that restrict loan origination and servicing activities. As a result, it may be more difficult to comprehensively identify and accurately interpret all of these laws and regulations, to properly program our technology systems and to effectively train our personnel with respect to all of these laws and regulations, thereby potentially increasing our exposure to the risks of noncompliance with these laws and regulations. Our failure to comply with these laws and regulations can lead to civil and criminal liability; loss of licensure; damage to our reputation in the industry; inability to sell or securitize our loans; demands for indemnification or loan repurchases from purchasers of our loans; fines and penalties and litigation, including class action lawsuits; or administrative enforcement actions. Any of these results could harm our results of operations, financial condition and business prospects.
New legislation could restrict our ability to make, finance and sell mortgage loans, could increase our compliance and origination costs, and could expose us to lawsuits and compliance actions, any of which could harm our earnings and business prospects.
The regulatory environments in which we operate have an impact on the activities in which we may engage, how these activities may be carried out, and the profitability of these activities. Therefore, changes to laws, regulations or regulatory policies can affect whether and to what extent we are able to operate profitably.
Several states, cities or other government entities are considering or have passed laws, regulations or ordinances aimed at curbing lending practices perceived as predatory. The federal government is also considering legislative and regulatory proposals in this regard. In general, these proposals involve lowering the existing thresholds for defining a “high-cost” loan and establish enhanced protections and remedies for borrowers who receive such loans. For example, certain of these new or proposed laws and regulations prohibit inclusion of some provisions in mortgage loans that have mortgage rates or origination costs in excess of prescribed levels, and require that borrowers be given certain disclosures or obtain advice, at the expense of the lender, prior to the consummation of such mortgage loans. Passage of these laws and rules could reduce our loan origination and purchase volumes and could increase our costs. The institutions that provide short-term financing to us generally refuse to finance any loan labeled as a “high cost” loan under any local, state or federal law or regulation. In addition, many whole loan buyers may elect not to purchase these loans, and rating agencies likewise may refuse to rate securities backed by such loans. Accordingly, these laws and rules could severely restrict short-term financing and the secondary market for a significant portion of our loan production. This would effectively preclude us from continuing to originate loans either in jurisdictions unacceptable to our lenders or the rating agencies or that exceed the newly defined thresholds, which in either case could harm our results of operations and business prospects.
We cannot provide any assurance that these proposed laws, rules and regulations, or other similar laws, rules or regulations, will not be adopted in the future. Adoption of these laws and regulations could have a material adverse impact on our business by substantially increasing the costs of compliance with a variety of inconsistent federal, state and local rules, or by restricting our ability to charge rates and fees adequate to compensate us for the risk associated with certain loans. Compliance with some of these restrictions requires lenders to make subjective judgments, such as whether a loan will provide a “net tangible benefit” to the borrower. These restrictions impact the way in which a loan is underwritten and expose a lender to risks of litigation and regulatory sanction regardless of the care with which a loan is underwritten. Our failure to comply with these laws could subject us to monetary penalties and could result in the borrowers rescinding the loans, whether held by us or subsequent holders. The remedies for violations of these laws are not based solely on actual harm to the consumer and can result in damages and penalties that could extend not only to us, but to our secured warehouse lenders, institutional loan purchasers, securitization trusts that hold our loans and other assignees, regardless of whether such assignee knew of or participated in the violation, which, in turn, could have an adverse affect on the availability of financing to us and our access to securitization and other secondary markets.
Similarly, recently enacted and proposed local, state and federal privacy laws and laws prohibiting or limiting marketing by telephone, facsimile, email and the Internet may limit our ability to market and our ability to access potential loan applicants.
We are subject to significant legal and reputational risks and expenses under federal and state laws concerning privacy, use, and security of customer information.
The scope of business activity affected by “privacy” concerns is likely to expand and will affect our non-prime mortgage loan origination business. The federal Gramm-Leach-Bliley financial reform legislation imposes significant privacy obligations on us in connection with the collection, use and security of financial and other non-public information provided to us by applicants and borrowers. We adopted a privacy policy and adopted controls and procedures to comply with the law after it took effect on July 1, 2001. Privacy rules also require us to protect the security and integrity of the customer information we use and hold. Although we have systems and procedures designed to help us with these privacy requirements, we cannot assure you that more restrictive laws and regulations will not be adopted in the future, or that governmental bodies will not interpret existing laws or regulations in a more restrictive manner, making compliance more difficult or expensive. These requirements also increase the risk that we may be subject to liability for non-compliance.
A number of states are considering privacy amendments that may be more demanding than federal law, and California recently has enacted two statutes — the California Financial Information Privacy Act (also know as SB-1) and the California Online Privacy Protection Act, both of which took effect on July 1, 2004. Under SB-1, a financial company must allow its customers to opt out of the sharing of their information with affiliates in separately regulated lines of business and must receive a customer opt-in before confidential customer data may be shared with unaffiliated companies (subject to certain exceptions). A federal court rejected the effort of three financial trade associations to prevent SB-1 from taking effect, and as of July 1, 2004, the California Department of Financial Institutions announced that it would require immediate compliance with SB-1. Under the new California Online Privacy Act, all operators of commercial websites and online services that allow interaction with California consumers (even if no transactions may be effected online) must post privacy policies meeting statutory requirements. The FTC, which administers the federal privacy rules for mortgage lenders, has determined that privacy laws in several states are not preempted by Gramm-Leach-Bliley, most recently new privacy laws enacted by Vermont and Illinois. In view of the public concern with privacy, we cannot assure you that additional rules that restrict or make more costly our activities and the activities of our vendors will not be adopted and will not restrict the marketing of our products and services to new customers.
Because laws and rules concerning the use and protection of customer information are continuing to develop at the federal and state levels, we expect to incur increased costs in our effort to be and remain in full compliance with these requirements. Nevertheless, despite our efforts, we will be subject to legal and reputational risks in connection with our collection and use of customer information, and we cannot assure you that we will not be subject to lawsuits or compliance actions under such state or federal privacy requirements. Furthermore, to the extent that a variety of inconsistent state privacy rules or requirements are enacted, our compliance costs could substantially increase.
New regulatory actions affecting the mortgage industry may increase our costs and decrease our mortgage acquisition.
In addition to changes to legal requirements contained in statutes, regulations, case law, and other sources of law, changes in the investigation or enforcement policies of federal and state regulatory agencies could impact the activities in which we may engage, how the activities may be carried out, and the profitability of those activities. Several state and federal agencies have initiated regulatory enforcement proceedings against mortgage companies for engaging in business practices that were not specifically or clearly proscribed by law, but which in the judgment of the regulatory agencies were unfair or deceptive to consumers. For example, state attorneys general and other state officials representing various states entered into a settlement agreement with a large subprime mortgage company.
The subject company agreed to pay a substantial amount in restitution to consumers and reimbursement to the states and also agreed to make changes to certain business practices, including the company’s underwriting criteria and pricing policies. Many of the practices and policies are not specifically prohibited by any federal or state laws but were alleged to be deceptive or unfair to consumers. The terms of this settlement agreement do not apply directly to us; however, federal and state regulatory agencies and private parties might nevertheless expect mortgage companies, including us, to make our business practices consistent with the provisions of the settlement agreement. If this happens, it could impact the activities in which we may engage, how we carry out those activities, our acquisition practices and our profitability. We might also be required to pay fines, make reimbursements, and make other payments to third parties for our business practices. Additionally, if an administrative enforcement proceeding were to result in us having to discontinue or alter certain business practices, then we might be placed at a competitive disadvantage vis-à-vis competitors who are not required to make comparable changes to their business practices.
Changes in Internal Revenue Service regulations regarding the timing of income recognition and/or deductions could materially adversely affect the amount of our dividends.
On September 30, 2004, the IRS released Announcement 2004-75, which describes rules that may be included in proposed IRS regulations regarding the timing of recognizing income and/or deductions attributable to interest-only securities. We believe the effect of these regulations, if adopted, may narrow the spread between book income and taxable income on the interest-only securities we hold and would thus reduce our taxable income during the initial periods that we hold such securities. A significant portion of our mortgage securities—available-for-sale consists of interest-only securities. If regulations are adopted by the IRS that reduces our taxable income in a particular year during which we are a REIT, our dividend paid to common shareholders may be reduced for that year because, so long as we remain a REIT, the amount of our dividend on common stock is entirely dependent upon our taxable income.
If we do not maintain our REIT status, we would be subject to tax as a regular corporation and would otherwise operate as a regular corporation. We conduct a substantial portion of our business through our taxable REIT subsidiaries, which creates additional compliance requirements.
We must comply with numerous complex tests to continue to qualify as a REIT for federal income tax purposes, including the requirement that we distribute 90% of taxable income to our shareholders and the requirement that no more than 5% of our annual gross income come from non-qualifying sources. So long as we remain a REIT, failure to comply with these requirements may subject us to penalty taxes and may put our REIT status at risk. In the event that we fail to maintain or elect to terminate our REIT status, we would be taxed at the corporate level and would not be required to pay out our taxable income in the form of dividends. For any year that we do not generate taxable income, we are not required to declare and maintain dividends to maintain our REIT status.
We conduct a substantial portion of our business through taxable REIT subsidiaries, such as NovaStar Mortgage. Despite our qualification as a REIT, our taxable REIT subsidiaries must pay federal income tax on their taxable income. Our income from, and investments in, our taxable REIT subsidiaries do not constitute permissible income or investments for some of the REIT qualification tests. We may be subject to a 100% penalty tax, or our taxable REIT subsidiaries may be denied deductions, to the extent that our dealings with our taxable REIT subsidiaries are deemed not to be arm’s length in nature.
Our cash balances and cash flows may become limited relative to our cash needs, which may ultimately affect our REIT status or solvency.
We use cash for originating mortgage loans, to meet minimum REIT dividend distribution requirements, and for other operating needs. Cash is also required to pay interest on our outstanding indebtedness and may be required to pay down indebtedness in the event that the market values of the assets collateralizing our debt decline, the terms of short-term debt become less attractive or for other reasons. If our income as calculated for tax purposes significantly exceeds our cash flows from operations, our minimum REIT dividend distribution requirements could exceed the amount of our available cash. In the event that our liquidity needs exceed our access to liquidity, we may need to sell assets at an inopportune time, thus adversely affecting our financial condition and results of operations. Furthermore, in an adverse cash flow situation, our REIT status or our solvency could be threatened.
The tax imposed on REITs engaging in “prohibited transactions” will limit our ability to engage in transactions, including certain methods of securitizing loans, which would be treated as sales for federal income tax purposes.
A REIT’s net income from prohibited transactions is subject to a 100% tax. In general, prohibited transactions are sales or other dispositions of property, other than foreclosure property but including any mortgage loans held in inventory primarily for sale to customers in the ordinary course of business. We might be subject to this tax if we were to sell a loan or securitize the loans in a manner that was treated as a sale of such inventory for federal income tax purposes. Therefore, in order to avoid the prohibited transactions tax, we may choose not to engage in certain sales of loans other than through our taxable REIT subsidiaries and may limit the structures we utilize for our securitization transactions even though such sales or structures might otherwise be beneficial for us. In addition, this prohibition may limit our ability to restructure our portfolio of mortgage loans from time to time even if we believe it would be in our best interest to do so.
Even if we qualify as a REIT, the income earned by our taxable REIT subsidiaries will be subject to federal income tax and we could be subject to an excise tax on non-arm’s-length transactions with our taxable REIT subsidiaries.
Our taxable REIT subsidiaries, including NovaStar Mortgage, expect to earn income from activities that are prohibited for REITs, and will owe income taxes on the taxable income from these activities. For example, we expect that NovaStar Mortgage will earn income from our loan origination and sales activities, as well as from other origination and servicing functions, which would generally not be qualifying income for purposes of the gross income tests applicable to REITs or might otherwise be subject to adverse tax liability if the income were generated by a REIT. Our taxable REIT subsidiaries are taxable as C corporations and are subject to federal, state and local income tax at the applicable corporate rates on their taxable income, notwithstanding our qualification as a REIT.
In the event that any transactions between us and any of our taxable REIT subsidiaries are not conducted on an arm’s-length basis, we could be subject to a 100% excise tax on certain amounts from such transactions. Any such tax could affect our overall profitability and the amounts of cash available for operations or to make distributions.
We may, at some point in the future, borrow funds from one or more of our corporate subsidiaries. The IRS may recharacterize the indebtedness as a dividend distribution to us by our subsidiary. Any such recharacterization may cause us to fail one or more of the REIT requirements.
We may be harmed by changes in tax laws applicable to REITs or the reduced 15% tax rate on certain corporate dividends may harm us.
Changes to the laws and regulations affecting us, including changes to securities laws and changes to the Code applicable to the taxation of REITs may harm our business. New legislation may be enacted into law or new interpretations, rulings or regulations could be adopted, any of which could harm us and our shareholders, potentially with retroactive effect.
Generally, dividends paid by REITs are not eligible for the 15% U.S. federal income tax rate on certain corporate dividends, with certain exceptions. The more favorable treatment of regular corporate dividends could cause domestic non-corporate investors to consider stocks of other corporations that pay dividends as more attractive relative to stocks of REITs.
We may be unable to comply with the requirements applicable to REITs or compliance with such requirements could harm our financial condition.
The requirements to qualify as a REIT under the Code are highly technical and complex. We routinely rely on legal opinions to support our tax positions. A technical or inadvertent failure to comply with the Code as a result of an incorrect interpretation of the Code or otherwise could jeopardize our REIT status. The determination that we qualify as a REIT requires an analysis of various factual matters and circumstances that may not be totally within our control. For example, to qualify as a REIT, at least 75% of our gross income must come from real estate sources and 95% of our gross income must come from real estate sources and certain other sources that are itemized in the REIT tax laws, mainly interest and dividends. We are subject to various limitations on our ownership of securities, including a limitation that the value of our investment in taxable REIT subsidiaries, including NovaStar Mortgage, cannot exceed 20% of our total assets at the end of any calendar quarter. In addition, at the end of each calendar quarter, at least 75% of our assets must be qualifying real estate assets, government securities and cash and cash items. The need to comply with these asset ownership requirements may cause us to acquire other assets that are qualifying real estate assets for purposes of the REIT requirements (for example, interests in other mortgage loan portfolios or mortgage-related assets) but are not part of our overall business strategy and might not otherwise be the best investment alternative for us. Moreover, we may be unable to acquire sufficient qualifying REIT assets, due to our inability to obtain adequate financing or otherwise, in which case we may fail to qualify as a REIT or may incur a penalty tax at the REIT level.
Also, to qualify as a REIT, we must distribute to our shareholders with respect to each year at least 90% of our REIT taxable income (determined without regard to the dividends paid deduction and by excluding any net capital gain). After-tax earnings generated by our taxable REIT subsidiaries and not distributed to us are not subject to these distribution requirements and may be retained by such subsidiaries to provide for future growth, subject to the limitations imposed by REIT tax rules. To the extent that we satisfy the 90% distribution requirement, but distribute less than 100% of our taxable income, we will be subject to federal corporate income tax on our undistributed taxable income. In addition, we will be subject to a 4% nondeductible excise tax if the actual amount that we pay out to our shareholders in a calendar year is less than a minimum amount specified under federal tax laws. We expect in some years that we will be subject to the 4% excise tax. We could be required to borrow funds on a short-term basis even if conditions are not favorable for borrowing, or to sell loans from our portfolio potentially at disadvantageous prices, to meet the REIT distribution requirements and to avoid corporate income taxes. These alternatives could harm our financial condition and could reduce amounts available to originate mortgage loans.
If we fail to qualify or remain qualified as a REIT, our distributions will not be deductible by us, and we will be subject to federal income tax on our taxable income. This would substantially reduce our earnings and our cash available to make distributions. The resulting tax liability, in the event of our failure to qualify as a REIT, might cause us to borrow funds, liquidate some of our investments or take other steps that could negatively affect our operating results. Moreover, if our REIT status is terminated because of our failure to meet a technical REIT requirement or if we voluntarily revoke our election, we generally would be disqualified from electing treatment as a REIT for the four taxable years following the year in which REIT status is lost.
We could lose our REIT status if more than 20% of the value of our total assets are represented by the securities of one or more taxable REIT subsidiaries at the close of any calendar quarter.
To qualify as a REIT, not more than 20% of the value of our total assets may be represented by the securities of one or more taxable REIT subsidiaries at the close of any calendar quarter, subject to a 30-day “cure” period following the close of the quarter and, for taxable years beginning on or after January 1, 2005, subject to certain relief provisions even after the 30-day cure period. Our taxable REIT subsidiaries, including NovaStar Mortgage, conduct a substantial portion of our business activities, including a majority of our loan origination and servicing activities. If the IRS determines that the value of our investment in our taxable REIT subsidiaries was more than 20% of the value of our total assets at the close of any calendar quarter, we could lose our REIT status. In certain cases, we may need to borrow from third parties to acquire additional qualifying REIT assets or increase the amount and frequency of dividends from our taxable REIT subsidiaries in order to comply with the 20% of assets test.
Risks Related to Our Capital Stock
Investors in our common stock may experience losses, volatility and poor liquidity, and we may reduce or delay payment of our dividends in a variety of circumstances.
Our earnings, cash flow, taxable income, GAAP income, book value and dividends can be volatile and difficult to predict. Investors should not rely on past performance, predictions or management beliefs. Although we historically paid a regular common stock dividend, we may reduce or eliminate our dividend payments in the future for a variety of reasons. For example, to the extent that the historic difference between our taxable income and GAAP income is reduced or reversed due to changes in the tax laws, our operating results or otherwise, our dividend could be reduced or eliminated. Furthermore, if we failed, or chose not to satisfy the complex requirements necessary to maintain our REIT status, our dividend may be reduced or eliminated because we would not be required to pay out our taxable income in the form of dividends. We may not provide public warnings of such dividend reductions or eliminations prior to their occurrence. Fluctuations in our current and prospective earnings, cash flow and dividends, as well as many other factors such as perceptions, economic conditions, stock market conditions, and the like, can affect the price of our common stock. Investors may experience volatile returns and material losses. In addition, liquidity in the trading of our common stock may be insufficient to allow investors to sell their stock in a timely manner or at a reasonable price.
We may not pay common stock dividends to stockholders.
So long as we maintain our status as a REIT, REIT provisions of the Code generally require that we annually distribute to our stockholders at least 90% of all of our taxable income, exclusive of the application of any tax loss carry forwards that may be used to offset current period taxable income. These provisions restrict our ability to retain earnings and thereby generate capital from our operating activities. If in any year, however, we do not generate taxable income, we are not required to declare and pay common stock dividends to maintain our REIT status. In addition, we are currently evaluating and may decide at a future date to terminate our REIT status, which would cause us to be taxed at corporate levels and to significantly reduce or eliminate regular dividends.
Restrictions on ownership of capital stock may inhibit market activity and the resulting opportunity for holders of our capital stock to receive a premium for their securities.
In order for us to meet the requirements for qualification as a REIT, our charter generally prohibits, so long as we remain a REIT, any person from acquiring or holding, directly or indirectly, (i) shares of our common stock in excess of 9.8% (in value or number of shares, whichever is more restrictive) of the aggregate outstanding shares of our common stock or (ii) shares of our capital stock in excess of 9.8% in value of the aggregate outstanding shares of our capital stock. These restrictions may inhibit market activity and the resulting opportunity for the holders of our capital stock to receive a premium for their stock that might otherwise exist in the absence of such restrictions.
The market price of our common stock and trading volume may be volatile, which could result in substantial losses for our shareholders.
The market price of our common stock can be highly volatile and subject to wide fluctuations. In addition, the trading volume in our common stock may fluctuate and cause significant price variations to occur. Some of the factors that could negatively affect our share price or result in fluctuations in the price or trading volume of our common stock include:
general market and economic conditions;
actual or anticipated changes in residential real estate value;
actual or anticipated changes in the delinquency and default rates on mortgage loans, in general, and specifically on the loans we originate or invest in through our mortgage securities-available for-sale;
actual or anticipated changes in our future financial performance;
actual or anticipated changes in market interest rates;
actual or anticipated changes in our access to capital;
actual or anticipated changes in the amount of our dividend or any delay in the payment of a dividend;
competitive developments, including announcements by us or our competitors of new products or services;
the operations and stock performance of our competitors;
developments in the mortgage lending industry or the financial services sector generally;
the impact of new state or federal legislation or adverse court decisions;
fluctuations in our quarterly operating results;
the activities of investors who engage in short sales of our common stock;
actual or anticipated changes in financial estimates by securities analysts;
sales, or the perception that sales could occur, of a substantial number of shares of our common stock by insiders;
additions or departures of senior management and key personnel; and
actions by institutional shareholders.
Our common stock may become illiquid if an active public trading market cannot be sustained, which could adversely affect the trading price and your ability to transfer our common stock.
Our common stock’s trading volume is relatively low compared to the securities of many other companies listed on the New York Stock Exchange. If an active public trading market cannot be sustained, the trading price of our common stock could be adversely affected and your ability to transfer your shares of our common stock may be limited.
We may issue additional shares that may cause dilution and may depress the price of our common stock.
Our charter permits our board of directors, without shareholder approval, to:
authorize the issuance of additional shares of common stock or preferred stock without shareholder approval, including the issuance of shares of preferred stock that have preference rights over the common stock with respect to dividends, liquidation, voting and other matters or shares of common stock that have preference rights over our outstanding common stock with respect to voting; and
classify or reclassify any unissued shares of common stock or preferred stock and to set the preferences, rights and other terms of the classified or reclassified shares.
In the future, we expect to access the capital markets from time to time by making additional offerings of securities, including debt instruments, preferred stock or common stock. Additional equity offerings by us may dilute your interest in us or reduce the market price of our common stock, or both. Our outstanding shares of preferred stock have, and any additional series of preferred stock may also have, a preference on distribution payments that could limit our ability to make a distribution to common shareholders. Because our decision to issue securities in any future offering will depend on market conditions and other factors beyond our control, we cannot predict or estimate the amount, timing or nature of our future offerings. Further, market conditions could require us to accept less favorable terms for the issuance of our securities in the future. Thus, our common shareholders will bear the risk of our future offerings reducing the market price of our common stock and diluting their interest in us.
Other Risks Related to our Business
Intense competition in our industry may harm our financial condition.
Our loan origination business faces intense competition, primarily from consumer finance companies, conventional mortgage bankers, commercial banks, credit unions, thrift institutions, and other independent wholesale mortgage lenders, including internet-based lending companies and other mortgage REITs. Competitors with lower costs of capital have a competitive advantage over us. In addition, establishing a mortgage lending operation such as ours requires a relatively small commitment of capital and human resources, which permits new competitors to enter our markets quickly and to effectively compete with us. Furthermore, national banks, thrifts and their operating subsidiaries are generally exempt from complying with many of the state and local laws that affect our operations, such as the prohibition on prepayment penalties. Thus, they may be able to provide more competitive pricing and terms than we can offer. Any increase in the competition among lenders to originate nonconforming mortgage loans may result in either reduced income on mortgage loans compared to present levels, or revised underwriting standards permitting higher loan-to-value ratios on properties securing nonconforming mortgage loans, either of which could adversely affect our results of operations, financial condition or business prospects. In addition, the government-sponsored entities, Fannie Mae and Freddie Mac, may also expand their participation in the subprime mortgage industry. To the extent they materially expand their purchase of subprime loans, our ability to profitably originate and purchase mortgage loans may be adversely affected because their size and cost-of-funds advantage allows them to purchase loans with lower rates or fees than we are willing to offer.
If we are unable to maintain and expand our network of independent brokers, our loan origination business will decrease.
A significant majority of our originations of mortgage loans comes from independent brokers. For the year ended December 31, 2006, 86% of our loan originations were originated through our broker network. Our brokers are not contractually obligated to do business with us. Further, our competitors also have relationships with our brokers and actively compete with us in our efforts to expand our broker networks. Our failure to maintain existing relationships or expand our broker networks could significantly harm our business, financial condition, liquidity and results of operations.
Our reported GAAP financial results differ from the taxable income results that drive our common stock dividend distributions, and our consolidated balance sheet, income statement, and statement of cash flows as reported for GAAP purposes may be difficult to interpret.
We manage our business based on long-term opportunities to earn cash flows. Our common stock dividend distributions are driven by the REIT tax laws and our taxable income as calculated pursuant to the Code. Our reported results for GAAP purposes differ materially, however, from both our cash flows and our taxable income. We transfer mortgage loans or mortgage securities into securitization trusts to obtain long-term non-recourse funding for these assets. When we surrender control over the transferred mortgage loans or mortgage securities, the transaction is accounted for as a sale. When we retain control over the transferred mortgage loans or mortgage securities, the transaction is accounted for as a secured borrowing. These securitization transactions do not differ materially in their structure or cash flow generation characteristics, yet under GAAP accounting these transactions are recorded differently. In a securitization transaction accounted for as a sale, we record a gain or loss on the assets transferred in our income statement and we record the retained interests at fair value on our balance sheet. In a securitization transaction accounted for as a secured borrowing, we consolidate all the assets and liabilities of the trust on our financial statements (and thus do not show the retained interest we own as an asset). As a result of this and other accounting issues, shareholders and analysts must undertake a complex analysis to understand our economic cash flows, actual financial leverage, and dividend distribution requirements. This complexity may cause trading in our stock to be relatively illiquid or may lead observers to misinterpret our results.
Market values for our mortgage assets and hedges can be volatile. For GAAP purposes, we mark-to-market our non-hedging derivative instruments through our GAAP consolidated income statement and we mark-to-market our mortgage securities—available-for-sale through our GAAP consolidated balance sheet through other comprehensive income unless the mortgage securities are in an unrealized loss position which has been deemed as an other-than-temporary impairment. An other-than-temporary impairment is recorded through the income statement in the period incurred. Additionally, we do not mark-to-market our loans held for sale as they are carried at lower of cost or market, as such, any change in market value would not be recorded through our income statement until the related loans are sold. If we sell an asset that has not been marked-to-market through our income statement at a reduced market price relative to its basis, our reported earnings will be reduced. A decrease in market value of our mortgage assets may or may not result in deterioration in future cash flows. As a result, changes in our GAAP consolidated income statement and balance sheet due to market value adjustments should be interpreted with care.
If we attempt to make any acquisitions, we will incur a variety of costs and may never realize the anticipated benefits.
In the past we have acquired businesses that we believe are a strategic fit with our business and expect to pursue additional acquisition opportunities in the future. The process of negotiating the acquisition and integrating an acquired business may result in operating difficulties and expenditures and may require significant management attention that would otherwise be available for ongoing development of our business. Moreover, we may never realize the anticipated benefits of any acquisitions. Future acquisitions could result in potentially dilutive issuances of equity securities, the incurrence of debt, contingent liabilities and/or amortization expenses related to goodwill and other intangible assets, which could harm our results of operations, financial condition and business prospects.
The inability to attract and retain qualified employees could significantly harm our business.
We depend on the diligence, skill and experience of our top executives, including our chief executive officer, our president and chief operating officer, and our chief investment officer. To the extent that one or more of our top executives are no longer employed by us, our operations and business prospects may be adversely affected. We also depend on our employees who structure our securitizations and who manage our portfolio of mortgage securities. To the extent that we lose the services of these employees, our ability to manage our portfolio business and our profitability will be adversely affected. Further, we rely on our wholesale account executives and retail loan officers to attract borrowers by, among other things, developing relationships with financial institutions, other mortgage companies and brokers, real estate agents, borrowers and others. The market for skilled account executives and loan officers is highly competitive and historically has experienced a high rate of turnover. Competition for qualified account executives and loan officers may lead to increased hiring and retention costs. If we are unable to attract or retain a sufficient number of skilled account executives at manageable costs, we will be unable to continue to originate quality mortgage loans that we are able to sell for a profit, which would harm our results of operations, financial condition and business prospects.
The success and growth of our business will depend upon our ability to adapt to and implement technological changes.
Our mortgage loan origination business is currently dependent upon our ability to effectively interface with our brokers, borrowers and other third parties and to efficiently process loan applications and closings. The origination process is becoming more dependent upon technological advancement, such as the ability to process applications over the Internet, accept electronic signatures and provide process status updates instantly and other customer-expected conveniences that are cost-efficient to our process. Becoming proficient with new technology will require significant financial and personnel resources. If we become reliant on any particular technology or technological solution, we may be harmed to the extent that such technology or technological solution (i) becomes non-compliant with existing industry standards, (ii) fails to meet or exceed the capabilities of our competitors’ equivalent technologies or technological solutions, (iii) becomes increasingly expensive to service, retain and update, or (iv) becomes subject to third-party claims of copyright or patent infringement. Any failure to acquire technologies or technological solutions when necessary could limit our ability to remain competitive in our industry and could also limit our ability to increase the cost-efficiencies of our operating model, which would harm our results of operations, financial condition and business prospects.
Our business could be adversely affected if we experienced an interruption in or breach of our communication or information systems or if we were unable to safeguard the security and privacy of the personal financial information we receive.
We rely heavily upon communications and information systems to conduct our business. Any material interruption, or breach in security, of our communication or information systems or the third-party systems on which we rely could cause underwriting or other delays and could result in fewer loan applications being received, slower processing of applications and reduced efficiency in loan servicing. Additionally, in connection with our loan file due diligence reviews, we have access to the personal financial information of the borrowers which is highly sensitive and confidential, and subject to significant federal and state regulation. If a third party were to misappropriate this information or if we inadvertently disclosed this information, we potentially could be subject to both private and public legal actions. Our policies and safeguards may not be sufficient to prevent the misappropriation or inadvertent disclosure of confidential information, may become noncompliant with existing federal or state laws or regulations governing privacy, or with those laws or regulations that may be adopted in the future.
We may enter into certain transactions at the REIT in the future that incur excess inclusion income that will increase the tax liability of our shareholders.
When we incur excess inclusion income at the REIT, it will be allocated among our shareholders. A shareholder’s share of excess inclusion income (i) would not be allowed to be offset by any net operating losses otherwise available to the shareholder, (ii) would be subject to tax as unrelated business taxable income in the hands of most types of shareholders that are otherwise generally exempt from federal income tax, and (iii) would result in the application of U.S. federal income tax withholding at the maximum rate (i.e., 30%), without reduction for any otherwise applicable income tax treaty, to the extent allocable to most types of foreign shareholders. How such income is to be reported to shareholders is not clear under current law. Tax-exempt investors, foreign investors, and taxpayers with net operating losses should carefully consider the tax consequences of having excess inclusion income allocated to them and are urged to consult their tax advisors.
Excess inclusion income would be generated if we issue debt obligations with two or more maturities and the terms of the payments on these obligations bear a relationship to the payments that we received on our mortgage loans or mortgage-backed securities securing those debt obligations. The structure of this type of CMO securitization generally gives rise to excess inclusion income. It is reasonably likely that we will structure some future CMO securitizations in this manner. Excess inclusion income could also result if we were to hold a residual interest in a REMIC. The amounts of excess inclusion income in any given year from these transactions could be significant.
Some provisions of our charter, bylaws and Maryland law may deter takeover attempts, which may limit the opportunity of our shareholders to sell their common stock at favorable prices.
Certain provisions of our charter, bylaws and Maryland law could discourage, delay or prevent transactions that involve an actual or threatened change in control, and may make it more difficult for a third party to acquire us, even if doing so may be beneficial to our shareholders by providing them with the opportunity to sell their shares possibly at a premium over the then market price. For example, our board of directors is divided into three classes with three year staggered terms of office. This makes it more difficult for a third party to gain control of our board because a majority of directors cannot be elected at a single meeting. Further, under our charter, generally a director may only be removed for cause and only by the affirmative vote of the holders of at least a majority of all classes of shares entitled to vote in the election for directors together as a single class. Our bylaws make it difficult for any person other than management to introduce business at a duly called meeting requiring such other person to follow certain advance notice procedures. Finally, Maryland law provides protection for Maryland corporations against unsolicited takeover situations. These provisions, as well as others, could discourage potential acquisition proposals, or delay or prevent a change in control and prevent changes in our management, even if such actions would be in the best interests of our shareholders.
Strategies undertaken to comply with REIT requirements under the Code may create volatility in future reported GAAP earnings.
Certain of the residual securities that historically have been held at the REIT generate interest income based on cash flows received from excess interest spread, prepayment penalties and derivatives (i.e., interest rate swap and cap contracts). The cash flows received from the derivatives do not represent qualified income for the REIT income tests requirements of the Code. The Code limits the amount of income from derivative income together with any income not generated from qualified REIT assets to no more than 25% of our gross income. In addition, under the Code, we must limit our aggregate income from derivatives (that are non-qualified tax hedges) and from other non-qualifying sources to no more than 5% of our annual gross income. Because of the magnitude of the derivative income projected for 2006 it was highly likely that we would not satisfy the REIT income tests. In order to resolve this REIT qualification issue, we isolated cash flows received from certain residual securities and created a separate security (the “CT Bonds”). We then contributed the CT Bonds from the REIT to our taxable REIT subsidiary. This transaction may add volatility to future reported GAAP earnings because both the interest only residual bonds (“IO Bonds”) and CT Bonds will be evaluated separately for impairment. Historically, the CT Bonds have acted as an economic hedge for the IO Bonds that are retained at the REIT, thus mitigating the impairment risk to the IO Bonds in a rising interest rate environment. As a result of transferring the CT Bonds to the TRS, the IO and CT Bonds will be valued separately creating the risk of earnings volatility resulting from other-than-temporary impairment charges. For example, in a rising rate environment, the IO bond will generally decrease in value while the CT Bond will increase in value. If the decrease in value of the IO Bond is deemed to be other than temporary in nature, we would record an impairment charge through the income statement for such decrease. At the same time, any increase in value of the CT Bond would be recorded in accumulated other comprehensive income.
Item 1B.Unresolved Staff Comments
None
Our executive, administrative and loan servicing offices are located in Kansas City, Missouri, and consist of approximately 200,000 square feet of leased office space. The lease agreements on the premises expire in January 2011. The current annual rent for these offices is approximately $4.1$4.2 million.
We lease office space for our mortgage lending operations in Lake Forest, California; Independence, Ohio; Richfield, Ohio; Troy, Michigan;Michigan, Salt Lake City, Utah, Carmel, Indiana and Columbia, Maryland and Vienna, Virginia.Maryland. Currently, these offices consist of approximately 255,000316,444 square feet. The leases on the premises expire from January 2005December 2009 through May 2012,2013, and the current annual rent is approximately $4.1$5.5 million.
Since April 2004, a number of substantially similar class action lawsuits have been filed and consolidated into a single action in Unitedthe Untied States District Court for the Western District of Missouri. The consolidated complaint names as defendants the Companyus and three of itsour executive officers as defendants and generally alleges that the defendants made public statements that were misleading for failing to disclose certain regulatory and licensing matters. The plaintiffs purport to have brought this consolidated action on behalf of all persons who purchased the Company’sour common stock (and sellers of put options on the Company’sour common stock) during the period October 29, 2003 through April 8, 2004. The Company believesOn January 14, 2005, we filed a motion to dismiss this action, and on May 12, 2005, the court denied such motion. On February 8, 2007, the court certified the case as a class action, and on February 20, 2007, we filed a motion to reconsider with the court. We believe that these claims are without merit and intendscontinue to vigorously defend against them.
In the wake of the securities class action, the Company haswe have also been named as a nominal defendant in several derivative actions brought against certain of the Company’sour officers and directors in Missouri and Maryland. The complaints in these actions generally claim that the defendants are liable to the Companyus for failing to monitor corporate affairs so as to ensure compliance with applicable state licensing and regulatory requirements.
In July 2004, an employee of NHMIApril 2005, three putative class actions filed a class and collective action lawsuit against NHMI and NovaStar Mortgage, Inc. (“NMI”)certain of its affiliates were consolidated for pre-trial proceedings in the California superior Court for the County of Los Angeles. Subsequently, NHMI and NMI removed the matter to the United States District courtCourt for the CentralSouthern District of California.Georgia entitledIn Re NovaStar Home Mortgage, Inc. Mortgage Lending Practices Litigation. These cases contend that NHMI improperly shared settlement service fees with limited liability companies in which NHMI had an interest (the “LLCs”), in violation of the fee splitting and anti-referral provisions of the federal Real Estate Settlement Procedures Act (“RESPA”), and also allege certain violations of state law and civil conspiracy. Plaintiffs seek treble damages with respect to the RESPA claims, disgorgement of fees with respect to the state law claims as well as other damages, injunctive relief, and attorneys’ fees. In addition, two other related class actions have been filed in state courts.Miller v. NovaStar Financial, Inc., et al., was filed in October 2004 in the Circuit Court of Madison County, Illinois andJones et al. v. NovaStar Home Mortgage, Inc., et al., was filed in December 2004 in the Circuit Court for Baltimore City, Maryland. In theMiller case, plaintiffs allege a violation of the Illinois Consumer Fraud and Deceptive Practices Act and civil conspiracy and contend certain LLCs provided settlement services without the borrower’s knowledge. The plaintiff brought this classplaintiffs in the Miller case seek a disgorgement of fees, other damages, injunctive relief and collective actionattorney’s fees on behalf of herselfthe class of plaintiffs. In theJones case, the plaintiffs allege the LLCs violated the Maryland Mortgage Lender Law by acting as lenders and/or brokers in Maryland without proper licenses and all pastcontend this arrangement amounted to a civil conspiracy. The plaintiffs in theJones case seek a disgorgement of fees and present employees of NHMI and NMI who were employed since May 1, 2000 in the capacity generally described as Loan Officer. The plaintiff alleged that NHMI and NMI failed to pay her and the membersattorney’s fees. In January 2007, all of the class she purported to represent overtime premium and minimum wage as required by the Fair Labor Standards Act and California state laws for the period commencing May 1, 2000. In January 2005, the plaintiffplaintiffs and NHMI agreed upon a nationwide settlement in the nominal amount of $3.1 million on behalf of a class of all NHMI Loan Officers nationwide. The settlement, which is subject to court approval, covers all minimum wage and overtime claims going back to July 30, 2001, and includes the dismissal with prejudice of the claims against NMI.settlement. Since not all class members will elect to be part of the settlement, the Companywe estimated the probable obligation related to the settlement to be in a range of $1.3$3.9 million to $1.7$4.7 million. In accordance with SFAS No. 5,Accounting “Accounting for ContingenciesContingencies”, the Companywe recorded a charge to earnings of $1.3$3.9 million in 2004.December of 2006. This amount is included in “Accounts payable and other liabilities” on our consolidated balance sheet and included in “Professional and outside services” on our consolidated statement of income.
In December 2005, a putative class action was filed against NMI in the United States District Court for the Western District of Washington entitledPierce et al. v. NovaStar Mortgage, Inc. Plaintiffs contend that NMI failed to disclose prior to closing that a broker payment would be made on their loans, which was an unfair and deceptive practice in violation of the Washington Consumer Protection Act. Plaintiffs seek excess interest charged, and treble damages as provided in the Washington Consumer Protection Act and attorney’s fees. On October 31, 2006, the district court granted plaintiffs’ motion to certify a Washington state class. NMI sought to appeal the grant of class certification; however, a panel of the Ninth Circuit Court of Appeals denied the request for interlocutory appeal so review of the class certification order must wait until after a final judgment is entered, if necessary. The case is set for trial on April 23, 2007. NMI believes that it has valid defenses to plaintiffs’ claims and it intends to vigorously defend against them.
In December 2005, a putative class action was filed against NHMI in the United States District Court for the Middle District of Louisiana entitledPearson v. NovaStar Home Mortgage, Inc. Plaintiff contends that NHMI violated the federal Fair Credit Reporting Act (“FCRA”) in connection with its use of pre-approved offers of credit. Plaintiff seeks (on his own behalf, as well as for others similarly situated) statutory damages, other nominal damages, punitive damages and attorney’s fees and costs. In January 2007, the named plaintiff and NHMI agreed to settle the lawsuit for a nominal amount.
In February, 2007, two putative class actions were filed in the United States District Court for the Western District of Missouri. The complaints name us and three of our executive officers as defendants and generally allege, among other things, that the defendants made materially false and misleading statements regarding our business and financial results. The plaintiffs purport to have brought the actions on behalf of all persons who purchased or otherwise acquired our common stock during the period May 4, 2006 through February 20, 2007. We believe that these claims are without merit and will vigorously defend against them.
In addition to those matters listed above, the Company iswe are currently a party to various other legal proceedings and claims. claims, including, but not limited to, breach of contract claims, class action or individual claims for violations of the RESPA, FLSA, federal and state laws prohibiting employment discrimination, federal and state laws prohibiting discrimination in lending and federal and state licensing and consumer protection laws.
While management, including internal counsel, currently believes that the ultimate outcome of all these proceedings and claims individually and in the aggregate, will not have a material adverse effect on the Company’sour financial condition or results of operations, litigation is subject to inherent uncertainties. If an unfavorable ruling were to occur, there exists the possibility of a material adverse impact on theour financial condition and results of operations for the period in which the ruling occurs.
In April 2004, the Company also received notice of an informal inquiry from the Securities & Exchange Commission requesting that it provide various documents relating to its business. The Company has been cooperating fully with the Commission’s inquiry.operations.
Item 4.Submission of Matters to a Vote of Security Holders
None
Item 5.Market for Registrant’s Common Equity, and Related Stockholder Matters and Issuer Purchases of Equity Securities
Market Price of and Dividends on the Registrant’s Common and Preferred Equity and Related Stockholder Matters. The Our common stock of NovaStar Financial, Inc (“NFI”) is traded on the NYSE under the symbol “NFI”. Our Series C Cumulative Redeemable Perpetual Preferred Stock is traded on the NYSE under the symbol “NFI-PC”. The following table sets forth, for the periods indicated, the high and low sales prices per share of common stock on the NYSE and the cash dividends paid or payable per share of capitalcommon stock.
Common Stock Prices | Cash Dividends | ||||||||||||||
| High | Low | Class of Stock | Declared | Paid or Payable | Amount Per Share | ||||||||||
1/1/03 to 3/31/03 | $ | 18.10 | $ | 13.90 | Common Common | 1/29/03 4/22/03 | 2/11/03 5/15/03 | $ | 0.17 1.13 | ||||||
4/1/03 to 6/30/03 | 30.50 | 17.15 | Common | 7/30/03 | 8/20/03 | 1.25 | |||||||||
7/1/03 to 9/30/03 | 37.75 | 24.25 | Common | 10/29/03 | 11/19/03 | 1.25 | |||||||||
10/1/03 to 12/31/03 | 45.80 | 28.63 | Common | 12/17/03 | 1/6/04 | 1.25 | |||||||||
1/1/04 to 3/31/04 | 70.32 | 42.50 | Preferred Common | 1/28/04 4/28/04 | 3/31/04 5/26/04 | | 0.43 1.35 | ||||||||
4/1/04 to 6/30/04 | 66.59 | 28.75 | Preferred Common | 4/28/04 7/28/04 | 6/30/04 8/26/04 | | 0.56 1.35 | ||||||||
7/1/04 to 9/30/04 | 48.69 | 37.29 | Preferred Common | 7/28/04 10/28/04 | 9/30/04 11/22/04 | | 0.56 1.40 | ||||||||
10/1/04 to 12/31/04 | 58.04 | 40.19 | Preferred Common | 10/28/04 12/22/04 | 12/31/04 1/14/05 | | 0.56 2.65 | ||||||||
| Dividends | |||||||||||||
| High | Low | Date Declared | Date Paid | Amount Per Share | |||||||||
2005 | |||||||||||||
First Quarter | $ | 48.15 | $ | 32.40 | 5/2/05 | 5/27/05 | $ | 1.40 | |||||
Second Quarter | 39.98 | 34.50 | 7/29/05 | 8/26/05 | 1.40 | ||||||||
Third Quarter | 42.19 | 32.20 | 9/15/05 | 11/22/05 | 1.40 | ||||||||
Fourth Quarter | 33.01 | 26.20 | 12/14/05 | 1/13/06 | 1.40 | ||||||||
2006 | |||||||||||||
First Quarter | $ | 33.80 | $ | 25.70 | 5/4/06 | 5/26/06 | $ | 1.40 | |||||
Second Quarter | 37.63 | 29.08 | 8/3/06 | 8/28/06 | 1.40 | ||||||||
Third Quarter | 35.60 | 28.25 | 9/11/06 | 11/30/06 | 1.40 | ||||||||
Fourth Quarter | 32.81 | 26.32 | 9/11/06 | 12/29/06 | 1.40 | ||||||||
As of March 11, 2005,February 23, 2007, we had approximately 27,000 stockholders held2,243 shareholders of record of our 27,860,629 shares of common stock, asincluding holders who are nominees for an undetermined number of beneficial owners based upon a review of the securities position listing provided by third-party brokers andour transfer agent reports.agent.
WeAs long as we remain a REIT, we intend to make distributions to stockholdersshareholders of all or substantially all of taxable income in each year, subject to certain adjustments, so as to qualify for the tax benefits accorded to a REIT under the Code. All distributions will be made at the discretion of the Board of Directors and will depend on earnings, financial condition, maintenance of REIT status, cost of equity, investment opportunities and other factors as the Board of Directors may deem relevant. Our estimate of 2006 taxable income already distributed to shareholders in the form of dividends is $17 million which includes $1.7 million of preferred dividends paid on January 2, 2007. During 2007, we expect to payout all of our remaining 2006 taxable income, which we currently estimate to be approximately $170 million, in the form of dividends. During the period 2007 through 2011, we expect to recognize little, if any, taxable income as tax losses are realized on our current outstanding securitizations because of the reversal in timing differences between the recognition of GAAP income and taxable income. Further, we do not expect that our recent and future securitizations will result in significant taxable income in the early years due to steps we have taken over the last two years to structure our securitizations to minimize the difference between tax and GAAP income. This combination of our older securitizations maturing and the structuring of our recent and future securitizations will result in minimal taxable income over the next several years. This reduction in taxable income will correspondingly result in little, if any, common stock dividend distributions for those respective years, regardless of whether we remain a REIT. See “Industry Overview and Known Material Trends and Uncertainties” for further discussion regarding future uncertainties surrounding our taxable income.
Recent Sales of Unregistered Securities. None.Securities.
None
Purchase of Equity Securities by the Issuer.
Issuer Purchases of Equity Securities
(dollars in thousands)
Total Number of Shares Purchased | Average Price Paid per Share | Total Number of Shares Purchased as Part of Publicly Announced Plans or Programs | Approximate Dollar that May Yet Be Purchased Under the Plans or Programs (A) | ||||||
October 1, 2004 – October 31, 2004 | — | — | — | $ | 1,020 | ||||
November 1, 2004 – November 30, 2004 | — | — | — | $ | 1,020 | ||||
December 1, 2004 – December 31, 2004 | — | — | — | $ | 1,020 | ||||
Total Number of Shares Purchased | Average Price Paid per Share | Total Number of Shares Purchased as Part of Publicly Programs | Approximate Dollar Value of Shares | ||||||
October 1, 2006 – October 31, 2006 | — | — | — | $ | 1,020 | ||||
November 1, 2006 – November 30, 2006 | — | — | — | 1,020 | |||||
December 1, 2006 – December 31, 2006 | — | — | — | 1,020 | |||||
| (A) |
Item 6.Selected Financial Data
The following selected consolidated financial data is derived from our audited consolidated financial statements for the periods presented and should be read in conjunction with the more detailed information therein and “Management’s Discussion and Analysis of Financial Condition and Results of Operations” included elsewhere in this annual report. Operating results are not necessarily indicative of future performance.
Selected Consolidated Financial and Other DataSafe Harbor Statement
This Annual Report on Form 10-K contains forward-looking statements within the meaning of Section 21E of the Securities Exchange Act of 1934, as amended, regarding management’s beliefs, estimates, projections, and assumptions with respect to, among other things, our future operations, business plans and strategies, as well as industry and market conditions, all of which are subject to change at any time without notice. Actual results and operations for any future period may vary materially from those projected herein and from past results discussed herein. Some important factors that could cause actual results to differ materially from those anticipated include: our ability to successfully integrate acquired businesses or assets with our existing business; our ability to generate sufficient liquidity on favorable terms; the size, frequency and structure of our securitizations; impairments on our mortgage assets; interest rate fluctuations on our assets that differ from our liabilities; increases in prepayment or default rates on our mortgage assets; changes in assumptions regarding estimated loan losses and fair value amounts; our continued status as a REIT; changes in origination and resale pricing of mortgage loans; our compliance with applicable local, state and federal laws and regulations or opinions of counsel relating thereto and the impact of new local, state or federal legislation or regulations, or opinions of counsel relating thereto, or court decisions on our operations; the initiation of margin calls under our credit facilities; the ability of our servicing operations to maintain high performance standards and maintain appropriate ratings from rating agencies; our ability to expand origination volume while maintaining an acceptable level of overhead; our ability to adapt to and implement technological changes; the stability of residential property values; the outcome of litigation or regulatory actions pending against us or other legal contingencies; compliance with new accounting pronouncements; the impact of general economic conditions; and the risks that are from time to time included in our filings with the Securities and Exchange Commission (the “SEC”), including this Annual Report on Form 10-K. Other factors not presently identified may also cause actual results to differ. Words such as “believe,” “expect,” “anticipate,” “promise,” “plan,” and other expressions or words of similar meanings, as well as future or conditional verbs such as “will,” “would,” “should,” “could,” or “may” are generally intended to identify forward-looking statements. This document speaks only as of its date and we expressly disclaim any duty to update the information herein.
We are a Maryland corporation formed on September 13, 1996 which operates as a specialty finance company that originates, purchases, securitizes, sells, invests in and services residential nonconforming loans and mortgage-backed securities. We offer a wide range of mortgage loan products to nonconforming borrowers, who generally do not satisfy the credit, collateral, documentation or other underwriting standards prescribed by conventional mortgage lenders and loan buyers, including United States of America government-sponsored entities such as Fannie Mae or Freddie Mac.
We have elected to be taxed as a real estate investment trust (“REIT”) under the Internal Revenue Code of 1986, as amended (the “Code”). For so long as we maintain our status as a REIT, we must meet numerous rules established by the Internal Revenue Service (“IRS”). In summary, these rules require us to:
Restrict investments to certain real estate related assets;
Avoid certain investment trading and hedging activities; and
Distribute virtually all REIT taxable income to our shareholders.
As long as we maintain our REIT status, distributions to our shareholders will generally be deductible by us for income tax purposes. This deduction effectively eliminates REIT level income taxes. Management believes that we have met the requirements to maintain our REIT status for 2006 and prior years. We are, however, currently evaluating whether it is in shareholders’ best interests to retain our REIT status.
We operate three core businesses:
Mortgage portfolio management;
Mortgage lending; and
Loan servicing.
Segment information regarding these businesses for the three years ended December 31, 2006 is included in Note 16 to our consolidated financial statements.
Mortgage Portfolio Management
We operate as a long-term mortgage securities and mortgage loan portfolio investor. Our portfolio of mortgage securities includes interest-only, prepayment penalty, and overcollateralization securities retained from our securitizations of nonconforming, single-family residential mortgage loans which we have accounted for as sales, under applicable accounting rules (collectively, the “residual securities”). Our portfolio of mortgage securities also includes subordinated mortgage securities retained from our securitizations and subordinated home equity loan asset-backed securities (“ABS”) purchased from other ABS issuers (collectively, the “subordinated securities”). We finance our investment in these mortgage securities by issuing asset-backed bonds (“ABB”), debt and capital stock and by entering into repurchase agreements. Our mortgage portfolio management operations generate earnings primarily from the interest income generated from our mortgage securities and mortgage loan portfolios.
In 2005 we began retaining various subordinate securities from our securitization transactions. In 2006, we began purchasing subordinated ABS of other ABS issuers. We will continue to acquire, retain, and aggregate ABS with the intention of securing non-recourse long-term financing through collateralized debt obligation (“CDO”) securitizations. In the future, we may enter into derivative transactions referencing third party ABS, commonly referred to as “synthetic” assets. We also intend to retain the risk of the underlying securities by investing in the equity and subordinated debt of CDO securitizations. CDO equity securities bear the first-loss and second-loss credit risk with respect to the securities owned by the securitization entity. Our goal is to leverage our extensive portfolio management experience by purchasing securities that are higher in the capital structure than our residual securities and executing CDOs for long-term non-recourse financing, thereby generating good risk-adjusted returns. We closed our first CDO securitization which was structured as a financing transaction on February 8, 2007, and we expect to continue to purchase securities that are higher in the capital structure and finance them with CDOs.
The long-term mortgage loan portfolio on our balance sheet consists of mortgage loans classified as held-in-portfolio resulting from securitization transactions treated as financings completed in the second and third quarters of 2006 (NHES Series 2006-1 and NHES Series 2006-MTA1). We have financed our investment in these loans by issuing ABB.
The credit performance and prepayment rates of the nonconforming loans underlying our securities, as well as the loans classified as held-in-portfolio, directly affects the profitability of this segment. In addition short-term interest rates have a significant impact on this segment’s profitability.
Mortgage Lending
The mortgage lending operation is significant to our financial results as it produces loans that ultimately collateralize the mortgage securities that we hold in our portfolio. The loans we originate and purchase are sold, either in securitization transactions structured as sales or financing transactions, or are sold outright to third parties. We finance the loans we originate and purchase by using warehouse repurchase agreements on a short-term basis. For long-term financing, we securitize our mortgage loans and issue ABB.
Our mortgage lending operations generate earnings primarily from securitizing and selling loans for a premium. We also earn revenue from fees from loan originations and interest income on mortgage loans held-for-sale. The timing, size and structure of our securitization transactions have a significant impact on the gain on sale recognized and ultimately the profitability of this segment. In addition the market prices for whole loans and short-term interest rates have a significant impact on this segment’s profitability.
Our mortgage lending segment originates and purchases primarily nonconforming, single-family residential mortgage loans. Our mortgage lending operation continues to innovate in loan origination. Our lending decisions are driven by three primary objectives:
Originating loans that perform in line with expectations,
Maintaining economically sound pricing (profitable coupons), and
Controlling costs of origination.
In our nonconforming lending operations, we lend to individuals who generally do not qualify for agency/conventional lending programs because of a lack of available documentation, previous credit difficulties or higher loan-to-value (“LTV”) ratios. These types of borrowers are generally willing to pay higher mortgage loan origination fees and interest rates than those charged by conventional lenders. Because these borrowers typically use the proceeds of the mortgage loans to consolidate debt and to finance home improvements, education and other consumer needs, loan volume is generally less dependent on general levels of interest rates or home sales and therefore less cyclical than conventional mortgage lending.
Our nationwide loan origination network includes wholesale loan brokers, mortgage lenders, and correspondent institutions, all of which are independent of any of the NovaStar Financial entities, as well as our own direct to consumer operations. Our sales force, which includes account executives in 38 states, develops and maintains relationships with this network of independent retail brokers. Our correspondent origination channel consists of a network of institutions from which we purchase nonconforming mortgage loans on a bulk or flow basis. Our direct to consumer operations channel consists of call centers where we contact potential borrowers as well as a network of branch operations which we acquired in the fourth quarter of 2006 in order to expand this origination channel.
We underwrite, process, fund and service the nonconforming mortgage loans sourced through our network of wholesale loan brokers and mortgage lenders and our direct to consumer operations in centralized facilities.
Loan Servicing
Management believes loan servicing remains a critical part of our business operation because maintaining contact with our borrowers is critical in managing credit risk and for borrower retention. Nonconforming borrowers are more prone to late payments and are more likely to default on their obligations than conventional borrowers. By servicing our loans, we strive to identify problems with borrowers early and take quick action to address problems. In addition, borrowers may be motivated to refinance their mortgage loans either by improving their personal credit or due to a decrease in interest rates. By keeping in close touch with borrowers, we can provide them with information about NovaStar Financial products to encourage them to refinance with us.
We retain the servicing rights with respect to the loans we securitize. Mortgage servicing yields fee income for us in the form of contractual fees approximating 0.50% of the outstanding balance of loans we service that have been securitized. In addition we receive fees paid by borrowers for normal customer service and processing fees. We also earn interest income on funds we hold as custodian as part of the servicing process.
Market in Which NovaStar Operates and Competes
Over the last ten years, the nonconforming lending market has grown from less than $50 billion annually to approximately $640 billion in 2006 as estimated by Inside Mortgage Finance Publications. A significant portion of nonconforming loans are made to borrowers who are using equity in their primary residence to consolidate installment or consumer debt, or take cash out for personal reasons. The nonconforming market has grown through a variety of interest rate environments. Management estimates that in 2006 we had a 1-2% share of the nonconforming loan market.
We face intense competition in the business of originating, purchasing, selling and securitizing mortgage loans. The number of market participants is believed to be well in excess of 100 companies who originate and purchase nonconforming loans. No single participant holds a dominant share of the lending market. We compete for borrowers with consumer finance companies, conventional mortgage bankers, commercial banks, credit unions, thrift institutions and other independent wholesale mortgage lenders. Competition among industry participants can take many forms, including convenience in obtaining a loan, amount and term of the loan, customer service, marketing/distribution channels, loan origination fees and interest rates. To the extent any competitor significantly expands their activities in the nonconforming and subprime market, we could be adversely affected.
Our principal competition in the business of holding mortgage loans and mortgage securities are life insurance companies, institutional investors such as mutual funds and pension funds, other well-capitalized, publicly-owned mortgage lenders and certain other mortgage acquisition companies structured as REITs. Many of these competitors are substantially larger than we are and have considerably greater financial resources than we do.
One of our key competitive strengths is our employees and the level of service they are able to provide our borrowers. We service our nonconforming loans and, in doing so, we are able to stay in close contact with our borrowers and identify potential problems early.
We also believe we compete successfully due to our:
experienced management team;
use of technology to enhance customer service and reduce operating costs;
freedom from depository institution regulation;
vertical integration – we broker and/or originate, purchase, fund, service and manage mortgage loans;
access to capital markets to securitize our assets.
Risk Management
Management recognizes the following primary risks associated with the business and industry in which it operates.
Interest Rate/Market
Liquidity/Funding
Credit
Prepayment
Regulatory
Interest Rate/Market Risk. Our investment policy goals are to maintain the net interest margin between our assets and liabilities and to diminish the effect of changes in interest rate levels on the market value of our assets.
Interest Rate Risk. When interest rates on our assets do not adjust at the same time or in the same amounts as the interest rates on our liabilities or when the assets have fixed rates and the liabilities have adjustable rates, future earnings potential is affected. We express this interest rate risk as the risk that the market value of our assets will increase or decrease at different rates than that of our liabilities. Expressed another way, this is the risk that our net asset value will experience an adverse change when interest rates change. We assess the risk based on the change in market values given increases and decreases in interest rates.
The interest rates under our primary financing sources reset frequently. As of December 31, 2006, rates on a majority of our borrowings adjust daily or monthly off London Inter-Bank Offered Rate (“LIBOR”). On the other hand, very few of the mortgage assets we own adjust on a monthly or daily basis. Most of the mortgage loans have rates that are fixed for some period of time ranging from 2 to 30 years. For example, one of our loan products is the “2/28” loan. This loan is fixed for its first two years and then adjusts every six months thereafter.
While short-term borrowing rates are low and long-term asset rates are high, this portfolio structure produces good results. However, if short-term interest rates rise rapidly, earning potential would be significantly affected and impairments may be incurred, as the asset rate resets would lag the borrowing rate resets.
We transfer interest rate agreements at the time of securitization into the securitization trusts to protect the third-party bondholders from interest rate risk and to decrease the volatility of future cash flows related to the securitized mortgage loans. We enter into these interest rate agreements as we originate and purchase mortgage loans in our mortgage lending segment. At the time of a securitization structured as a sale, we transfer interest rate agreements into the securitization trusts and they are removed from our balance sheet. The trust assumes the obligation to make payments and obtains the right to receive payments under these agreements. Generally, net settlement obligations paid by the trust for these interest rate agreements reduce the excess interest cash flows to our residual securities. Net settlement receipts from these interest rate agreements are either used to cover interest shortfalls on the third-party primary bonds or to provide credit enhancement with any remaining funds then flowing to our residual securities. For securitizations structured as financings the derivatives will remain on our balance sheet. Generally, these interest rate agreements do not meet the hedging criteria set forth in accounting principles generally accepted in the United States of America (“GAAP”) while they are on our balance sheet; therefore, we are required to record their change in value as a component of earnings even though they may reduce our interest rate risk. In times when short-term rates rise or drop significantly, the value of our agreements will increase or decrease, respectively. Occasionally, we enter into interest rate agreements that do meet the hedging criteria set forth in GAAP. In these instances, we record their change in value, if effective, directly to other comprehensive income on our statement of shareholder’s equity.
Interest Rate Sensitivity Analysis.We model financial information in a variety of interest rate scenarios to assess interest rate sensitivity as an indication of exposure to interest rate risk. Using these models, the fair value and interest rate sensitivity of each financial instrument, or groups of similar instruments, is estimated, and then aggregated to form a comprehensive picture of the risk characteristics of the balance sheet. The risks are analyzed on a market value basis.
The following table summarizes management’s estimates of the changes in market value of our mortgage assets and interest rate agreements assuming interest rates were 100 and 200 basis points, or one and two percent higher or lower. The cumulative change in market value represents the change in market value of mortgage assets, net of the change in market value of interest rate agreements. The change in market value of the liabilities on our balance sheet due to a change in interest rates is insignificant since a majority of our short-term borrowings and ABB are adjustable rate; however, as noted above, rapid increases in short-term interest rates would negatively impact the interest-rate spread between our liabilities and assets and, consequently, our earnings.
Interest Rate Sensitivity - Market Value
(dollars in thousands, except per share amounts)thousands)
| For the Year Ended December 31, | ||||||||||||||||||||
| 2004 | 2003 | 2002 | 2001 | 2000 (A) | ||||||||||||||||
Consolidated Statement of Operations Data: | ||||||||||||||||||||
Interest income | $ | 224,024 | $ | 170,420 | $ | 107,143 | $ | 57,904 | $ | 47,627 | ||||||||||
Interest expense | 52,590 | 40,364 | 27,728 | 27,366 | 34,696 | |||||||||||||||
Net interest income before credit recoveries (losses) | 171,434 | 130,056 | 79,415 | 30,538 | 12,931 | |||||||||||||||
Credit (losses) recoveries | (726 | ) | 389 | 432 | (3,608 | ) | (5,449 | ) | ||||||||||||
Gains (losses) on sales of mortgage assets | 144,950 | 144,005 | 53,305 | 37,347 | (826 | ) | ||||||||||||||
Losses on derivative instruments | (8,905 | ) | (30,837 | ) | (36,841 | ) | (3,953 | ) | — | |||||||||||
Impairment on mortgage securities – available for sale | (15,902 | ) | — | — | — | — | ||||||||||||||
General and administrative expenses | 271,125 | 174,408 | 84,594 | 46,505 | 3,017 | |||||||||||||||
Income from continuing operations | 119,497 | 111,996 | 48,761 | 32,308 | 5,626 | |||||||||||||||
Loss from discontinued operations, net of income tax (C) | (4,108 | ) | — | — | — | — | ||||||||||||||
Net income available to common shareholders | 109,124 | 111,996 | 48,761 | 32,308 | 5,626 | |||||||||||||||
Basic income per share: | ||||||||||||||||||||
Income from continuing operations available to common shareholders | $ | 4.47 | $ | 5.04 | $ | 2.35 | $ | 1.61 | $ | 0.26 | ||||||||||
Loss from discontinued operations, net of income tax (C) | (0.16 | ) | — | — | — | — | ||||||||||||||
Net income available to common shareholders | $ | 4.31 | $ | 5.04 | $ | 2.35 | $ | 1.61 | $ | 0.26 | ||||||||||
Diluted income per share: | ||||||||||||||||||||
Income from continuing operations available to common shareholders | $ | 4.40 | $ | 4.91 | $ | 2.25 | $ | 1.51 | $ | 0.25 | ||||||||||
Loss from discontinued operations, net of income tax (C) | (0.16 | ) | — | — | — | — | ||||||||||||||
Net income available to common shareholders | $ | 4.24 | $ | 4.91 | $ | 2.25 | $ | 1.51 | $ | 0.25 | ||||||||||
| As of December 31, | ||||||||||||||||||||
| 2004 | 2003 | 2002 | 2001 | 2000 (A) | ||||||||||||||||
Consolidated Balance Sheet Data: | ||||||||||||||||||||
Mortgage Assets: | ||||||||||||||||||||
Mortgage loans | $ | 807,121 | $ | 792,709 | $ | 1,133,509 | $ | 365,560 | $ | 375,927 | ||||||||||
Mortgage securities – available-for-sale | 489,175 | 382,287 | 178,879 | 71,584 | 46,650 | |||||||||||||||
Mortgage securities - trading | 143,153 | — | — | — | — | |||||||||||||||
Total assets | 1,861,311 | 1,399,957 | 1,452,497 | 512,380 | 494,482 | |||||||||||||||
Borrowings | 1,295,422 | 1,005,516 | 1,225,228 | 362,398 | 382,437 | |||||||||||||||
Stockholders’ equity | 426,344 | 300,224 | 183,257 | 129,997 | 107,919 | |||||||||||||||
Other Data: Loans originated and purchased, principal Loans securitized, principal Nonconforming loans sold, principal Loan servicing portfolio, principal Annualized return on assets Annualized return on equity Taxable income (loss) available to common shareholders (D) Taxable income (loss) per common share (B) (D) Dividends declared per common share (B) Dividends declared per preferred share As of December 31, 2006: Change in market values of: Assets – non trading (B) Assets – trading (C) Interest rate agreements Cumulative change in market value Percent change of market value portfolio equity (D) As of December 31, 2005: Change in market values of: Assets – non trading (B) Assets – trading (C) Interest rate agreements Cumulative change in market value Percent change of market value portfolio equity (D) For the Year Ended December 31, 2004 2003 2002 2001 2000 $ 8,486,028 $ 5,994,492 $ 2,781,539 $ 1,333,366 $ 719,341 $ 8,329,804 $ 5,319,435 $ 1,560,001 $ 1,215,100 $ 584,350 $ — $ 151,210 $ 142,159 $ 73,324 $ 172,839 $ 12,151,196 $ 7,206,113 $ 3,657,640 $ 1,994,448 $ 1,112,615 7.01 % 9.93 % 6.05 % 6.03 % 0.97 % 34.29 % 58.90 % 30.30 % 27.04 % 5.50 % $ 250,501 $ 137,851 $ 49,511 $ 5,221 $ (2 ) $ 9.04 $ 5.64 $ 2.36 $ 0.45 $ — $ 6.75 $ 5.04 $ 2.15 $ 0.48 $ — $ 2.11 $ — $ — $ 1.08 $ 0.49 Basis Point Increase (Decrease) in Interest Rates (A) (200) (100) 100 200 $ 226,262 $ 105,038 $ (78,698 ) $ (150,481 ) 9,999 7,080 (14,120 ) (30,707 ) (40,018 ) (20,946 ) 23,998 49,264 $ 196,243 $ 91,172 $ (68,820 ) $ (131,924 ) 34.0 % 15.8 % (11.9 %) (22.9 %) $ 95,322 $ 41,344 $ (41,417 ) $ (84,971 ) 1,134 983 (2,837 ) (7,512 ) (33,502 ) (17,365 ) 20,072 41,616 $ 62,954 $ 24,962 $ (24,182 ) $ (50,867 ) 11.0 % 4.4 % (4.2 %) (8.9 %)
| (A) |
| (B) |
| (C) |
| (D) |
Hedging.We use derivative instruments to mitigate the risk of our cost of funding increasing at a faster rate than the interest on the loans. We adhere to an interest rate risk management program that is approved by our Board. This program is formulated with the intent to offset the potential adverse effects resulting from rate adjustment limitations on mortgage assets and the differences between interest rate adjustment indices and interest rate adjustment periods of adjustable-rate mortgage loans and related borrowings.
We use interest rate cap and swap contracts to mitigate the risk of the financing expense of variable rate liabilities increasing at a faster rate than the income produced on assets during a period of rising rates. Management intends generally to hedge as much of the interest rate risk as determined to be in our best interest, given the cost and risk of hedging transactions and the limitations on our ability to hedge imposed on us by REIT tax requirements.
We seek to build a balance sheet and undertake an interest rate risk management program that is likely, in management’s view, to enable us to maintain an equity liquidation value sufficient to maintain operations given a variety of potentially adverse circumstances. Accordingly, the hedging program addresses both income preservation, as discussed in the first part of this section, and capital preservation concerns.
Interest rate cap and swap agreements are legal contracts between us and a third-party firm or “counterparty”. Under an interest rate cap agreement the counterparty agrees to make payments to us in the future should the one-month LIBOR interest rate rise above the strike rate specified in the contract. We make either quarterly or monthly premium payments or have chosen to pay the premiums at the beginning to the counterparties under contract. Each contract has either a fixed or amortizing notional face amount on which the interest is computed, and a set term to maturity. When the referenced LIBOR interest rate rises above the contractual strike rate, we earn cap income. Under interest rate swap agreements we pay a fixed rate of interest while receiving a rate that adjusts with one-month LIBOR.
The following table summarizes the key contractual terms associated with interest rate risk management contracts on our balance sheet as of December 31, 2006. All of our pay-fixed swap contracts and interest rate cap contracts are indexed to one-month LIBOR.
We have determined the following estimated net fair value amounts by using available market information and valuation methodologies we deem appropriate as of December 31, 2006.
Interest Rate Risk Management Contracts
(dollars in thousands)
| Net Fair Value | Total Notional Amount | Maturity Range | |||||||||||||||||||||||||
| 2007 | 2008 | 2009 | 2010 | 2011 | |||||||||||||||||||||||
Pay-fixed swaps: | |||||||||||||||||||||||||||
Contractual maturity | $ | 6,527 | $ | 1,575,000 | $ | 490,000 | $ | 720,000 | $ | 365,000 | $ | — | $ | — | |||||||||||||
Weighted average pay rate | 4.9 | % | 4.7 | % | 5.0 | % | 4.9 | % | — | — | |||||||||||||||||
Weighted average receive rate | 5.4 | % | (A | ) | (A | ) | (A | ) | — | — | |||||||||||||||||
Interest rate caps: | |||||||||||||||||||||||||||
Contractual maturity | $ | 4,634 | $ | 610,000 | $ | 80,000 | $ | 285,000 | $ | 195,000 | $ | 40,000 | $ | 10,000 | |||||||||||||
Weighted average strike rate | 5.0 | % | 4.9 | % | 4.9 | % | 5.0 | % | 5.2 | % | 5.4 | % | |||||||||||||||
| (A) | The pay-fixed swaps receive rate is |
We had no interest rate agreements with contractual maturities beyond 2011 as of December 31, 2006.
Item 7.Liquidity/Funding Risk.Management’sA significant risk to our mortgage lending operations is the risk that we will not have financing facilities and cash available to fund and hold loans prior to their sale or securitization, to fund required repurchase requests and margin calls or that we may not be able to securitize our loans or securities upon favorable terms. On a short-term basis, we finance mortgage loans using warehouse repurchase agreements that we maintain with large banking and investment institutions. In addition, we have access to facilities secured by our mortgage securities and servicing advance receivables. For long-term financing, we depend on securitizations and CDOs. Other matters also impact our liquidity and funding risk. See the “Liquidity and Capital Resources” section of “Management’s Discussion and Analysis of Financial Condition and Results of OperationsOperations” for further discussion of liquidity risks and resources available to us.
Credit Risk. Credit risk is the risk that we will not fully collect the principal we have invested in mortgage loans or the amount we have invested in securities. Nonconforming mortgage loans comprise substantially our entire mortgage loan portfolio and serve as collateral for our mortgage securities. Nonconforming borrowers include individuals who do not qualify for agency/conventional lending programs because of a lack of conventional documentation or previous credit difficulties but have considerable equity in their homes. Often, they are individuals or families who have built up high-rate consumer debt and are attempting to use the equity in their home to consolidate debt and reduce the amount of money it takes to service their monthly debt obligations. Our underwriting guidelines are intended to evaluate the credit history of the potential borrower, the capacity and willingness of the borrower to repay the loan, and the adequacy of the collateral securing the loan.
Our underwriting staff works under the credit policies established by our Credit Committee. Underwriters are given approval authority only after their work has been reviewed for a period of time. Thereafter, the Chief Credit Officer re-evaluates the authority levels of all underwriting personnel on an ongoing basis. All loans in excess of $350,000 currently require the approval of an underwriting supervisor. Our Chief Credit Officer or our President must approve loans in excess of $1,000,000.
Our underwriting guidelines take into consideration the number of times the potential borrower has recently been late on a mortgage payment and whether that payment was 30, 60 or 90 days past due. Factors such as FICO score, bankruptcy and foreclosure filings, debt-to-income ratio, and loan-to-value ratio are also considered. The credit grade that is assigned to the borrower is a reflection of the borrower’s historical credit. Maximum loan-to-value ratios for each credit grade depend on the level of income documentation provided by the potential borrower. In some instances, when the borrower exhibits strong compensating factors, exceptions to the underwriting guidelines may be approved.
In 2006, we saw the performance of our 2006 vintage production drop to unacceptable levels. We believe this performance is related to a few key fundamentals such as:
Downturn in the housing market
Underwriting guidelines that worked in a stronger housing market were no longer effective in the weaker 2006 market
Tolerance levels previously allowed for appraisals were no longer effective in the weaker 2006 market
Going forward, the key area of focus for our credit management function is to ensure that the 2007 vintage performs better than 2006 and in line with our expectations. In this regard, we have taken several steps which include:
Tightening of underwriting guidelines
Enhancing our appraisal review process
Identifying loans with unacceptable levels of risk.
Other strategies we use for managing credit risk are to diversify the markets in which we originate, purchase and own mortgage loans and the purchase of mortgage insurance. We have purchased mortgage insurance on a majority of the loans that are held in our portfolio – on the balance sheet and those that serve as collateral for our mortgage securities. The use of mortgage insurance is discussed under “Premiums for Mortgage Loan Insurance” in “Management’s Discussion and Analysis of Financial Condition and Results of Operations”. Details regarding loans charged off are disclosed in Note 2 to our consolidated financial statements.
Prepayment Risk.Generally speaking, when market interest rates decline, borrowers are more likely to refinance their mortgages. The higher the interest rate a borrower currently has on his or her mortgage the more incentive he or she has to refinance the mortgage when rates decline. In addition, the incentive to refinance increases when credit ratings improve. When home values rise, loan-to-value ratios drop, making it more likely that a borrower will do a “cash-out” refinance. Each of these factors increases the chance for higher prepayment speeds.
The majority of our mortgage securities available-for-sale portfolio consists of securities which are “interest-only” in nature. These securities represent the net cash flow – interest income – on the underlying loans in excess of the cost to finance the loans. When borrowers repay the principal on their mortgage loans early, the effect is to shorten the period over which interest is earned, and therefore, reduce the cash flow and yield on our securities.
We mitigate prepayment risk by originating and purchasing loans that include a penalty if the borrower repays the loan in the early months of the loan’s life. A majority of our loans have a prepayment penalty up to but no greater than 80% of six months interest on the principal balance that is being repaid. As of December 31, 2006, 60% of the loans which serve as collateral for our mortgage securities had a prepayment penalty. As of December 31, 2006, 60% of our mortgage loans on our balance sheet had a prepayment penalty. During 2006, 62% of the loans we originated and purchased had prepayment penalties.
Regulatory Risk.As a mortgage lender, we are subject to many laws and regulations. Any failure to comply with these rules and their interpretations or with any future interpretations or judicial decisions could harm our profitability or cause a change in the way we do business. For example, several lawsuits have been filed challenging types of payments made by mortgage lenders to mortgage brokers.
State and local governing bodies are focused on the nonconforming lending business and are concerned about borrowers paying “excessive fees” in obtaining a mortgage loan – generally termed “predatory lending”. In several instances, states or local governing bodies have imposed strict laws on lenders to curb predatory lending. To date, these laws have not had a significant impact on our business. We have capped fee structures consistent with those adopted by federal mortgage agencies and have implemented rigid processes to ensure that our lending practices are not predatory in nature.
We regularly monitor the laws, rules and regulations that apply to our business and analyze any changes to them. We integrate many legal and regulatory requirements into our automated loan origination system to reduce inadvertent non-compliance due to human error. We also maintain policies and procedures, summaries and checklists to help our origination personnel comply with these laws. Our training programs are designed to teach our personnel about the significant laws, rules and regulations that affect their job responsibilities.
U.S. Federal Income Tax Consequences
The following general discussion summarizes the material U.S. federal income tax considerations regarding our qualification and taxation as a REIT. This discussion is based on interpretations of the Code, regulations issued thereunder, and rulings and decisions currently in effect (or in some cases proposed), all of which are subject to change. Any such change may be applied retroactively and may adversely affect the federal income tax consequences described herein. This summary does not discuss all of the tax consequences that may be relevant to particular shareholders or shareholders subject to special treatment under the federal income tax laws. Accordingly, you should consult your own tax advisor regarding the federal, state, local, foreign, and other tax consequences of your ownership of our common stock and our REIT status and any termination of our REIT status, and regarding potential changes in applicable tax laws.
General.Since inception, we have elected to be taxed as a REIT under Sections 856 through 859 of the Code. We believe we have complied, and intend to comply in the future for so long as we remain a REIT, with the requirements for qualification as a REIT under the Code. To the extent that we qualify as a REIT for federal income tax purposes, we generally will not be subject to federal income tax on the amount of income or gain that is distributed to shareholders. However, origination and broker operations are conducted through NovaStar Mortgage, which is owned by NFI Holding Corporation, Inc. – a taxable REIT subsidiary (“TRS”). Consequently, all of the taxable income of NFI Holding Corporation, Inc. is subject to federal and state corporate income taxes. In general, a TRS may hold assets that a REIT cannot hold directly and generally may engage in any real estate or non-real estate related business. However, special rules do apply to certain activities between a REIT and its TRS. For example, a TRS will be subject to earnings stripping limitations on the deductibility of interest paid to its REIT. In addition, a REIT will be subject to a 100% excise tax on certain excess amounts to ensure that (i) amounts paid to a TRS for services are based on amounts that would be charged in an arm’s-length transaction, (ii) fees paid to a REIT by its TRS are reflected at fair market value and (iii) interest paid by a TRS to its REIT is commercially reasonable.
The REIT rules generally require that a REIT invest primarily in real estate related assets, that its activities be passive rather than active and that it distribute annually to its shareholders substantially all of its taxable income. We could be subject to a number of taxes if we failed to satisfy those rules or if we acquired certain types of income-producing real property through foreclosure. Although no complete assurance can be given, we do not expect that we will be subject to material amounts of such taxes.
Failure to satisfy certain Code requirements could cause loss of REIT status. If we fail to qualify, or elect to terminate our status, as a REIT for any taxable year, we would be subject to federal income tax (including any applicable minimum tax) at regular corporate rates and would not receive deductions for dividends paid to shareholders. As a result, the amount of after-tax earnings available for distribution to shareholders would decrease substantially.
Qualification as a REIT. Qualification as a REIT requires that we satisfy a variety of tests relating to income, assets, distributions and ownership so long as we remain a REIT. The significant tests are summarized below.
Sources of Income.To qualify as a REIT, we must satisfy two gross income requirements, each of which is applied on an annual basis. First, at least 75% of our gross income, excluding gross income from prohibited transactions, for each taxable year generally must be derived directly or indirectly from:
rents from real property;
interest on debt secured by mortgages on real property or on interests in real property;
dividends or other distributions on, and gain from the sale of, stock in other REITs;
gain from the sale of real property or mortgage loans;
amounts, such as commitment fees, received in consideration for entering into an agreement to make a loan secured by real property, unless such amounts are determined by income and profits;
income derived from a Real Estate Mortgage Investment Conduit (“REMIC”) in proportion to the real estate assets held by the REMIC, unless at least 95% of the REMIC’s assets are real estate assets, in which case all of the income derived from the REMIC; and
interest or dividend income from investments in stock or debt instruments attributable to the temporary investment of new capital during the one-year period following our receipt of new capital that we raise through equity offerings or public offerings of debt obligations with at least a five-year term.
Second, at least 95% of our gross income, excluding gross income from prohibited transactions, for each taxable year must be derived from sources that qualify for purposes of the 75% gross income test, and from (i) dividends, (ii) interest, (iii) certain qualifying hedges entered into prior to January 1, 2005 and (iv) gain from the sale or other disposition of stock, securities, or, certain qualifying hedges entered into prior to January 1, 2005.
Management believes that we were in compliance with both of the income tests for the 2006 and 2005 calendar years.
Nature and Diversification of Assets. As of the last day of each calendar quarter, we must meet six requirements under the two asset tests. Under the 75% of assets test, at least 75% of the value of our total assets must represent cash or cash items (including receivables), government securities or real estate assets. Under the 25% of assets test, no more than 25% of the value of our total assets can be represented by securities, other than (A) government securities, (B) stock of a qualified REIT subsidiary and (C) securities that qualify as real estate assets under the 75% assets test ((A), (B) and (C) are collectively the “75% Securities”). Additionally, under the 25% assets test, no more than 20% of the value of our total assets can be represented by securities of one or more taxable REIT subsidiaries and no more than 5% of the value of our total assets can be represented by the securities of a single issuer, excluding 75% Securities. Furthermore, we may not own more than 10% of the total voting power or the total value of the outstanding securities of any one issuer, excluding 75% Securities.
If we inadvertently fail to satisfy one or more of the asset tests at the end of a calendar quarter, such failure would not cause us to lose our REIT status. We could still avoid disqualification by eliminating any discrepancy within 30 days after the close of the calendar quarter in which the discrepancy arose. Management believes that we were in compliance with all of the requirements of both asset tests for all quarters during 2006 and 2005.
Ownership of Common Stock. Our capital stock must be held by a minimum of 100 persons for at least 335 days of each year. In addition, at all times during the second half of each taxable year, no more than 50% in value of our capital stock may be owned directly or indirectly by 5 or fewer individuals. We use the calendar year as our taxable year for income tax purposes. The Code requires us to send annual information questionnaires to specified shareholders in order to assure compliance with the ownership tests. Management believes that we have complied with these stock ownership tests for 2006 and 2005.
Distributions.To maintain REIT status, we must distribute at least 90% of our taxable income and any after-tax net income from certain types of foreclosure property less any non-cash income. No distributions are required in periods in which there is no taxable income. Management believes that we have complied with these distribution requirements for 2005 and intends to comply with these requirements with respect to 2006 taxable income.
Taxable Income. We use the calendar year for both tax and financial reporting purposes. However, taxable income may, and in our case does, differ from income computed in accordance with GAAP. These differences primarily arise from timing and character differences in the recognition of revenue and expense and gains and losses for tax and GAAP purposes. Additionally, taxable income that is subject to the distribution requirement does not include the taxable income of our TRS, although the subsidiary’s operating results are included in our GAAP results.
Personnel
As of December 31, 2006, we employed 2,048 people. Management believes that relations with its employees are good. None of our employees are represented by a union or covered by a collective bargaining agreement.
Available Information
Copies of our annual report on Form 10-K, quarterly reports on Form 10-Q, current reports on Form 8-K and any amendments to these reports filed or furnished with the SEC are available free of charge through our Internet site (www.novastarmortgage.com) as soon as reasonably practicable after filing with the SEC. References to our website do not incorporate by reference the information on such website into this Annual Report on Form 10-K and we disclaim any such incorporation by reference. Copies of our board committee charters, our board’s Corporate Governance Guidelines, Code of Conduct, and other corporate governance information are available at the Corporate Governance section of our Internet site (www.novastarmortgage.com), or by contacting us directly. Our investor relations contact information follows.
Investor Relations
8140 Ward Parkway, Suite 300
Kansas City, MO 64114
816.237.7424
Email: ir@novastar1.com
Risk Factors
You should carefully consider the risks described below before investing in our publicly traded securities. The risks described below are not the only ones facing us. Our business is also subject to the risks that affect many other companies, such as competition, inflation, technological obsolescence, labor relations, general economic conditions and geopolitical events. Additional risks not currently known to us or that we currently believe are immaterial also may impair our business, operations and our liquidity.
Risks Related to Securitization, Loan Sale, and Borrowing Activities
Our growth is dependent on leverage, which may create other risks.
Our success is dependent, in part, upon our ability to grow our assets through the use of leverage. Leverage creates an opportunity for increased net income, but at the same time creates risks. For example, while we will incur leverage only when there is an expectation that it will enhance returns, leveraging magnifies both positive and negative changes in our net worth. In addition, there can be no assurance that we will be able to meet our debt service obligations and, to the extent that we cannot, our financial condition and our ability to meet minimum REIT dividend requirements will be materially and adversely affected. Furthermore, if we were to liquidate, our debt holders and lenders will receive a distribution of our available assets before any distributions are made to our common shareholders.
An interruption or reduction in the securitization market or our ability to access this market would harm our financial position.
We are dependent on the securitization market for long-term financing of our origination and purchase of mortgage loans and mortgage securities, which we initially finance with our short-term financing. In addition, many of the buyers of our whole loans purchase the loans with the intention of securitizing them. A disruption in the securitization market could prevent us from being able to sell loans or mortgage securities at a favorable price or at all. Factors that could disrupt the securitization market include an international liquidity crisis such as occurred in the fall of 1998, sudden changes in interest rates, changes in the non-conforming loan market, a terrorist attack, an outbreak of war or other significant event risk, and market specific events such as a default under a comparable type of securitization. Further, poor performance of our previously securitized loans could harm our access to the securitization market.
In addition, a court recently found a lender and securitization underwriter liable for consumer fraud committed by a company to whom they provided financing and underwriting services. In the event other courts or regulators adopted the same liability theory, lenders and underwriters could be named as defendants in more litigation and as a result they may exit the business or charge more for their services, all of which could have a negative impact on our ability to securitize our mortgage loans and mortgage securities and the securitization market in general.
A decline in our ability to obtain long-term funding for our mortgage loans or mortgage securities in the securitization market in general or on attractive terms or a decline in the market’s demand for our mortgage loans or mortgage securities could harm our results of operations, financial condition and business prospects and could result in defaults under our short term financing arrangements for these assets.
We may not be able to continue to sell our mortgage loans on terms and conditions that are profitable to us.
A portion of our revenues comes from the gains on sale generated by sales of pools of our mortgage loans as whole loans. We make whole loan sales to a limited number of institutional purchasers, some of which may be frequent, repeat purchasers, and others of which may make only one or a few purchases from us. We cannot assure you that we will continue to have purchasers for our loans on terms and conditions that will be profitable to us. Also, even though our mortgage loans are generally marketable to multiple purchasers, certain loans may be marketable to only one or a few purchasers, thereby increasing the risk that we may be unable to sell such loans at a profit.
Failure to renew or obtain adequate funding under warehouse repurchase agreements may harm our business.
We are dependent upon several warehouse repurchase agreements to provide short term financing for our origination and purchase of mortgage loans pending their sale or securitization. In addition, we utilize warehouse repurchase agreements for short and medium term financing for our purchase and retention of mortgage securities. Under a warehouse repurchase agreement, we sell an asset and agree to repurchase the same asset at some point in time in the future. Generally, the repurchase agreements we enter into require monthly roll-over repurchase transactions, with a six- to nine-month maximum financing period for mortgage loans and a three-year maximum financing period for securities retained from our mortgage loan securitizations. For financial accounting purposes, these arrangements are treated as secured financings. We retain the assets on our balance sheet and record an obligation to repurchase the assets. The amount we may borrow under these arrangements is generally 95% to 100% of the asset market value with respect to performing mortgage loans and 70% to 80% of the asset market value with respect to nonperforming mortgage loans. Additionally, the amount we may borrow under these arrangements is generally 40% to 95% of the asset market value with respect to mortgage securities depending on the investment rating.
These warehouse repurchase agreements contain numerous representations, warranties and covenants, including requirements to maintain a certain minimum net worth, to maintain minimum equity ratios, to maintain our REIT status, and other customary debt covenants. Events of default under these facilities include material breaches of representations and warranties, failure to comply with covenants, material adverse effects upon or changes in our business, assets, or financial condition, and other customary matters. Events of default under certain of our facilities also include termination of our status as servicer with respect to certain securitized loan pools and failure to maintain profitability over consecutive quarters. If we were unable to make the necessary representations and warranties at the time we need financing, we would not be able to obtain needed funds. In addition, if we default under any warehouse repurchase agreement under which borrowings are then outstanding, the lenders under substantially all of our existing warehouse repurchase agreements could demand immediate payment of all outstanding amounts pursuant to cross-default provisions. Any failure to renew or obtain adequate funding under these financing arrangements for any reason, or any demand by warehouse lenders for immediate payment of outstanding balances, could harm our lending and loan purchase operations and have a material adverse effect on our results of operations, financial condition and business prospects. In addition, an increase in the cost of warehouse financing in excess of any change in the income derived from our mortgage assets could also harm our earnings and reduce the cash available for distribution to our shareholders. In October 1998, the subprime mortgage loan market faced a liquidity crisis with respect to the availability of short-term borrowings from major lenders and long-term borrowings through securitization. At that time, we faced significant liquidity constraints which harmed our business and our profitability. There is no assurance that a comparable situation will not occur in the future.
A decline in the market value of mortgage assets financed under our warehouse finance arrangements may result in margin calls or similar obligations, which may require that we liquidate assets at a disadvantageous time.
When, in a lender’s opinion, the market value of assets subject to a warehouse repurchase agreement decreases for any reason, including a rise in interest rates or general concern about the value or liquidity of the assets, we are required to repay the margin or difference in market value, or post additional collateral. If cash or additional collateral is unavailable to meet margin calls, we may default on our obligations under the applicable repurchase agreement, which would cross-default substantially all of our warehouse repurchase agreements. In that event, our lenders would have the right to liquidate the collateral we provided them to settle the amount due from us and, in general, the right to recover any deficiency from us.
In addition, we utilize warehouse financing arrangements for the accumulation of third-party mortgage-backed securities and related credit default derivatives for purposes of CDO offerings. Under these arrangements, the financing party has the right to liquidate any assets that decline in credit quality or fail to continue to meet eligibility requirements, and the right to liquidate the entire pool of financed assets if the related CDO offering does not occur by a specified date. If a liquidation results in a net loss, we are required to pay to the financing party the amount of the net loss.
In order to obtain cash to satisfy a margin call or a net loss payment obligation, we may be required to liquidate assets at a disadvantageous time, which could cause us to incur further losses and adversely affect our results of operations and financial condition. In addition, an unplanned liquidation of assets could change our mix of investments, which in turn could jeopardize our REIT status or our ability to rely on certain exemptions under the Investment Company Act of 1940, as amended (the “Investment Company Act”).
We may be required to repurchase mortgage loans or indemnify mortgage loan purchasers as a result of breaches of representations and warranties, borrower fraud, or certain borrower defaults, which could harm our liquidity, results of operations and financial condition.
When we sell mortgage loans, whether as whole loans or pursuant to a securitization, we are required to make customary representations and warranties to the purchaser about the mortgage loans and the manner in which they were originated. Our whole loan sale agreements require us to repurchase or substitute mortgage loans in the event we breach any of these representations or warranties. In addition, we may be required to repurchase mortgage loans as a result of borrower fraud or in the event of early payment default on a mortgage loan. Likewise, we are required to repurchase or substitute mortgage loans if we breach a representation or warranty in connection with our securitizations. The remedies available to us against the originating broker or correspondent may not be as broad as the remedies available to a purchaser of mortgage loans against us, and we face the further risk that the originating broker or correspondent may not have the financial capacity to perform remedies that otherwise may be available to us. Therefore, if a purchaser enforces its remedies against us, we may not be able to recover losses from the originating broker or correspondent. Repurchased loans are typically sold at a significant discount to the unpaid principal balance and, prior to sale, can be financed by us, if at all, only at a steep discount to our cost. As a result, significant repurchase activity could harm our liquidity, cash flow, results of operations, financial condition and business prospects.
Recently, we have received an increased number of repurchase and indemnity demands from purchasers of whole loans as a result of borrower fraud and early borrower payment defaults, which has had a negative impact on our results of operations. While we have taken steps to enhance our underwriting policies and procedures, there can be no assurance that these steps will be effective. To the extent that repurchase and indemnity demands continue at this rate or increase, our results of operations and financial condition will be adversely affected.
Our investments in mortgage securities and loans are subject to changes in credit spreads which could adversely affect our ability to realize gains on the sale of such investments and may subject us to margin calls or similar liquidity requirements.
The value of mortgage securities is dependent on the yield demanded on these securities by the market based on their credit relative LIBOR. Excessive supply of these securities combined with reduced demand will generally cause the market to require a higher yield on these securities, resulting in the use of a higher, or “wider,” spread over the benchmark rate (usually the applicable LIBOR security yield) to value such securities. Under such conditions, the value of our mortgage securities portfolio would tend to decline. Conversely, if the spread used to value such securities were to decrease, or “tighten,” the value of our mortgage securities portfolio would tend to increase.
Our loan portfolio is also subject to changes in credit spreads. The value of these loans is dependent on the yield demanded by the market based on their credit relative to LIBOR. The value of our loans would tend to decline should the market require a higher yield on such loans, resulting in the use of a higher spread over the benchmark rate (usually the applicable LIBOR yield). Conversely, if the spread used to value such loans were to decrease, or “tighten,” the value of our loan portfolio would tend to increase.
A decrease in the value of our loans or mortgage securities would reduce our ability to realize gains upon the sale or securitization of these assets and, with respect to mortgage securities (which are marked to market quarterly), could result in impairments for securities classified as available-for-sale or mark-to-market losses for securities classified as trading.. In addition, a decrease in the value of our mortgage loans or securities reduces the funds available to us in respect of these assets under our warehouse repurchase agreements and may result in margin calls. Further, a decrease in the value of third party mortgage securities that we have accumulated for the purpose of a CDO offering may reduce the availability or attractiveness of the CDO offering, in which case we may be required to seek other forms of potentially less attractive longer-term financing or to liquidate the assets on unfavorable terms.
We retain and assume credit risk under a variety of mortgage securities and similar assets in connection with and as a result of our securitization activities. Significant losses on these assets reduce our earnings, negatively affect our liquidity, and otherwise negatively affect our business.
We retain certain residual securities resulting from our securitizations of mortgage loans, which typically consist of interest-only, prepayment penalty, and overcollateralization bonds. We also retain from our securitizations, as well as purchase from 3rd party ABS issuers, certain investment grade and non-investment grade rated subordinated mortgage securities. The residual securities are typically unrated or rated below investment grade and, as such, involve significant investment risk that exceeds the aggregate risk of the full pool of securitized loans. By holding the residual securities, we retain the “first loss” risk associated with the underlying pool of mortgage loans. As a result, the credit performance and prepayment rates of the sub-prime loans underlying these mortgage securities directly affect our returns on these mortgage securities. Significant realized losses from our residual and subordinated mortgage securities could harm our results of operations and financial condition. In addition, because we finance these securities under medium-term warehouse repurchase agreements, decreases in the value of these retained securities may result in margin calls and adversely affect our liquidity.
We invest in or assume financial risk associated with mortgage securities issued by third party residential real estate loan securitization entities, most of which are backed by sub-prime loans. In addition, following a CDO offering, we retain equity or unsecured debt securities of the CDO issuer. We expect to increase our investment in third party mortgage securities and CDO issuer equity and debt securities and, consequently, to increase our credit and prepayment exposure to the assets that underlie these securities. A significant portion of these third party mortgage securities consists of securities that are subordinate to other securities secured by the same pool of assets and, as such, have significant investment risk. Generally, we do not control or influence the underwriting, servicing, management, or loss mitigation efforts with respect to the assets underlying securities issued by securitizations we do not sponsor. If the asset pools underlying any of these securities were to experience poor credit results, the market value of the third party securities that we hold directly and of our equity interest in or unsecured debt of a CDO issuer could decrease. Significant realized losses from third party mortgage securities, directly or indirectly through our interest in a CDO issuer, could harm our results from operations, liquidity, and financial condition.
Further, we may enter into or assume financial risk associated with ABS credit default swaps or similar derivatives, referred to a “synthetic securities,” in contemplation of the transfer of such synthetic securities to a CDO issuer in connection with our CDO offerings. Under these synthetic securities, we may assume, in exchange for a premium, payment and credit risk associated with third party mortgage securities. In addition to the risks associated with the third party securities to which the synthetic security relates, synthetic securities are unsecured and would expose us to the risk of payment default by the swap counterparty and to risks associated with the determination of settlement payments upon a credit event relating to the referenced mortgage securities or other settlement event. In addition, the market for synthetic securities of this type is not highly liquid and, as such, we may not be able to realize the full value of a synthetic security in the event we need to liquidate or dispose of the synthetic security, which could negatively impact our results of operations and financial condition.
Credit results with respect to mortgage assets underlying our securitizations may negatively affect our access to the securitization market on favorable terms, which in turn would harm our financial condition and prospects.
If the non-conforming loan industry continues to experience credit difficulties, our ability to access the securitization market on favorable terms may be negatively affected. In addition if the pools of mortgage loans underlying our securitizations of mortgage loans or indirectly underlying our securitizations of mortgage securities were to experience poor credit results, the securities issued in these securitizations could have their credit ratings down-graded, could suffer losses in market value, and could experience principal losses. In addition to reducing the long-term returns and near-term cash flows from the securities we have retained or acquired in these transactions, any of the foregoing may reduce our ability to sponsor securitization transactions, including CDO offerings, in the future.
Competition in the securitization market may erode our securitization margins, which in turn may adversely affect or harm our financial condition and prospects.
Competition in the business of sponsoring securitizations of the type we focus on is increasing as Wall Street broker-dealers, hedge funds, mortgage REITs, investment management companies, and other financial institutions expand their activities or enter this field. Increased competition could reduce our securitization margins. To the extent that our securitization margins erode, our results of operations, financial condition and business prospects will be negatively impacted.
Differences in our actual experience compared to the assumptions that we use to determine the value of our residual mortgage securities could adversely affect our financial position.
Our securitizations of mortgage loans that are structured as sales for financial reporting purposes result in gain recognition at closing as well as the recording of the residual mortgage securities we retain at fair value. As of December 31, 2006 we had retained residual mortgage securities from our securitizations of mortgage loans with a fair value of $349.3 million on our balance sheet.
Delinquency, loss, prepayment and discount rate assumptions have a material impact on the amount of gain recognized and on the carrying value of our residual mortgage securities. It is extremely difficult to validate the assumptions we use in determining the amount of gain on sale and the value of our residual mortgage securities. If our actual experience differs materially from the assumptions that we use to determine our gain on sale or the value of these mortgage securities, our future cash flows, our financial condition and our results of operations could be negatively affected.
The value of residual interests represents the present value of future cash flows expected to be received by us from the excess cash flows created in the securitization transaction. In general, future cash flows are estimated by taking the coupon rate of the loans underlying the transaction less the interest rate paid to the investors, less contractually specified servicing and trustee fees, and after giving effect to estimated prepayments and credit losses. We estimate future cash flows from these securities and value them utilizing assumptions based in part on projected discount rates, delinquency, mortgage loan prepayment speeds and credit losses. It is extremely difficult to validate the assumptions we use in valuing our residual interests. Even if the general accuracy of the valuation model is validated, valuations are highly dependent upon the reasonableness of our assumptions and the predictability of the relationships which drive the results of the model. Such assumptions are complex as we must make judgments about the effect of matters that are inherently uncertain. If our actual experience differs from our assumptions, we would be required to reduce the value of these securities.Furthermore, if our actual experience differs materially from these assumptions, our cash flow, financial condition, results of operations and business prospects may be harmed, including an adverse affect on the amount of dividend payments that are made on our common stock.
Changes in accounting standards might cause us to alter the way we structure or account for securitizations.
Changes could be made to current accounting standards, which could affect the way we structure or account for securitizations. For example, if changes were made in the types of transactions eligible for gain on sale treatment, we may have to change the way we account for securitizations, which may harm our results of operations or financial condition.
The rate at which we are able to acquire eligible mortgage loans or mortgage securities and changes in market conditions during asset accumulation may adversely affect our anticipated returns from the securitization of these assets.
We use short term warehouse financing arrangements to finance the acquisition of mortgage loans and mortgage securities until a sufficient quantity of assets is accumulated, at which time we may refinance these lines through a securitization or other long term financing. As a result, we are subject to the risk that we will not be able to acquire, during the period in which the relevant warehouse facility is available for the funding of such assets, a sufficient amount of eligible securities to maximize the efficiency of a securitization. In addition, changes in conditions in the capital markets may make a securitization less attractive to us by the time we do have a sufficient pool of collateral. If we are unable to securitize these assets, we may be required to seek other forms of potentially less attractive financing or otherwise to liquidate the assets on unfavorable terms.
Market factors may limit our ability to originate and acquire mortgage assets at yields that are favorable relative to costs.
Despite our experience in the origination and acquisition of mortgage assets and our relationships with brokers and sellers of mortgage assets, we face the risk that we might not be able to originate or acquire mortgage assets that earn interest rates greater than our cost of funds under our short-term borrowings and securitizations, or that we might not be able to originate or acquire a sufficient number of such mortgage assets to maintain our profitability. An inability to originate or purchase sufficient volumes of loans and mortgage securities at a cost lower than the net cash proceeds realized from their sale or securitization would materially harm our results of operations, financial condition and business prospects.
We have recently imposed stricter mortgage loan and borrower requirements, which may result in a decrease in our mortgage loan origination and purchase volumes and, consequently, our loan sale and securitization volumes.
As a result of less favorable economic conditions and an increase in the number of fraudulently obtained loans and borrower defaults, we have tightened our mortgage loan lending and purchase requirements and the processes we undergo to document loans. There may be fewer borrowers and loans that qualify under these revised standards, and we may face increased competition from lenders and loan purchasers with less rigorous standards. As a result, our loan origination and purchase volumes may decline. A decline in our loan origination or purchase volumes would decrease the volume of assets available to us for sale or securitization, which could adversely affect our results of operations and financial condition.
Risks Related to Interest Rates and Our Hedging Strategies
Changes in interest rates may harm our results of operations and equity value.
Our results of operations are likely to be harmed during any period of unexpected or rapid changes in interest rates. Our primary interest rate exposures relate to our mortgage securities, mortgage loans, floating rate debt obligations, interest rate swaps, and interest rate caps. Interest rate changes could adversely affect our results of operations and liquidity in the following ways:
a substantial or sustained increase in interest rates could harm our ability to originate or acquire mortgage loans and mortgage securities in expected volumes, which could result in a decrease in our cash flow and in our ability to support our fixed overhead expenses;
interest rate fluctuations may harm our earnings and access to capital as the spread between the interest rates we pay on our borrowings and hedges and the interest rates we receive on our mortgage assets narrows;
if prevailing interest rates increase after we fund a loan, the value that we receive upon the sale or securitization of the loan decreases;
when we securitize loans, the value of the residual and subordinated securities we retain and the income we receive from them are based primarily on LIBOR, and an increase in LIBOR increases our funding costs which reduces the net income we receive from, and the value of, these securities;
existing borrowers with adjustable-rate mortgages or higher risk loan products may incur higher monthly payments as the interest rate increases, and consequently may experience higher delinquency and default rates, resulting in decreased earnings and decreased value of our mortgage securities;
mortgage prepayment rates vary depending on such factors as mortgage interest rates and market conditions, and changes in anticipated prepayment rates may harm our earnings and the value of our mortgage securities.
In addition, interest rate changes may also impact our net book value as our mortgage securities and related hedge derivatives are marked to market each quarter. Our mortgage loans and debt obligations are not marked to market. Generally, as interest rates increase, the value of our mortgage securities decrease which decreases the book value of our equity. We intend to increase our investment in mortgage securities, which may amplify the impact of interest rate changes on our book value.
Furthermore, shifts in the yield curve, which represents the market’s expectations of future interest rates, also affects the yield required for the purchase of our mortgage securities and therefore their value. To the extent that there is an unexpected change in the yield curve it could have an adverse effect on our mortgage securities portfolio and our financial position and operations.
Hedging against interest rate exposure may adversely affect our earnings, which could adversely affect cash available for operations and for distribution to our shareholders.
There are limits on the ability of our hedging strategy to protect us completely against interest rate risks. When interest rates change, we expect the gain or loss on derivatives to be offset by a related but inverse change in the value of the hedged items, generally our liabilities. We cannot assure you, however, that our use of derivatives will offset the risks related to changes in interest rates. We cannot assure you that our hedging strategy and the derivatives that we use will adequately offset the risk of interest rate volatility or that our hedging transactions will not result in losses. We may enter into interest rate cap or swap agreements or pursue other interest rate hedging strategies. Our hedging activity will vary in scope based on interest rates, the type of mortgage assets held, other changing market conditions and, so long as we remain a REIT, compliance with REIT requirements. Interest rate hedging may fail to protect or could adversely affect us because, among other things:
interest rate hedging can be expensive, particularly during periods of rising and volatile interest rates;
hedging instruments involve risk because they often are not traded on regulated exchanges, guaranteed by an exchange or its clearing house, or regulated by any U.S. or foreign governmental authorities; consequently, there are no requirements with respect to record keeping, financial responsibility or segregation of customer funds and positions, and the enforceability of agreements underlying derivative transactions may depend on compliance with applicable statutory, commodity and other regulatory requirements;
available interest rate hedging may not correspond directly with the interest rate risk for which protection is sought;
the duration of the hedge may not match the duration of the related liability or asset;
the credit quality of the party owing money on the hedge may be downgraded to such an extent that it impairs our ability to sell or assign our side of the hedging transaction;
the party owing money in the hedging transaction may default on its obligation to pay, which may result in the loss of unrealized profits; and
we may not be able to dispose of or close out a hedging position without the consent of the hedging counterparty, and we may not be able to enter into an offsetting contract in order to cover our risks.
Any hedging activity we engage in may adversely affect our earnings, which could adversely affect cash available for operations and for distribution to our shareholders. Unanticipated changes in interest rates may result in poorer overall investment performance than if we had not engaged in any such hedging transactions.
Complying with REIT requirements may limit our ability to hedge effectively.
We attempt to minimize exposure to interest rate fluctuations by hedging. The REIT provisions of the Code limit our ability to hedge mortgage assets and related borrowings by requiring us to limit our income in each year from any qualified hedges, together with any other income not generated from qualified real estate assets, to no more than 25% of our gross income. The interest rate hedges that we generally enter into will not be counted as a qualified asset for the purposes of satisfying this requirement. In addition, under the Code, we must limit our aggregate income from non-qualified hedging transactions and from other non-qualifying sources to no more than 5% of our annual gross income. As a result, we may have to limit our use of advantageous hedging techniques. This could result in greater risks associated with changes in interest rates than we would otherwise want to incur. In addition, if it is ultimately determined that some of our interest rate hedging transactions are non-qualified under the Code; we may have more than 5% of our annual gross income from non-qualified sources. If we violate the 5% or 25% limitations, we may have to pay a penalty tax equal to the amount of income in excess of those limitations, multiplied by a fraction intended to reflect our profitability. In addition, if we fail to observe these limitations, we could lose our REIT status unless our failure was due to reasonable cause and not due to willful neglect.
Risks Related to Credit Losses and Prepayment Rates
Loans made to nonconforming mortgage borrowers entail relatively higher delinquency and default rates which will result in higher loan losses.
Lenders in the nonconforming mortgage banking industry make loans to borrowers who have impaired or limited credit histories, limited documentation of income and higher debt-to-income ratios than traditional mortgage lenders allow. Mortgage loans made to nonconforming mortgage loan borrowers generally entail a relatively higher risk of delinquency and foreclosure than mortgage loans made to borrowers with better credit and, therefore, will result in higher levels of realized losses than conventional loans. Delinquency interrupts the flow of projected interest income from a mortgage loan, and default can ultimately lead to a loss if the net realizable value of the real property securing the mortgage loan is insufficient to cover the principal and interest due on the loan. Loans that become delinquent prior to sale or securitization may become unsaleable or saleable only at a discount, and the longer we hold loans prior to sale or securitization, the greater the chance we will bear all costs associated with the loans’ delinquency. Also, our cost of financing and servicing a delinquent or defaulted loan is generally higher than for a performing loan.
We bear the risk of delinquency and default on loans beginning when we originate them. In whole loan sales, our risk of delinquency and default typically only extends until the borrower makes the first payment but can extend up to the third payment. When we securitize any of our loans, we continue to be exposed to delinquencies and losses, either through our residual interests for securitizations structured as sales or through the loans that remain on our balance sheet for securitizations structured as financings. We also re-acquire the risks of delinquency and default for loans that we are obligated to repurchase.
We attempt to manage these risks with risk based mortgage loan pricing and appropriate underwriting criteria and policies and loan collection methods. However, as with the broader nonconforming mortgage loan industry, we have recently experienced an increase in borrower delinquencies and defaults, which has adversely affected our cash flows, results of operations and financial condition. While we have taken steps to tighten our underwriting guidelines and procedures, there can be no assurance that these steps will be effective. To the extent that we cannot successfully address these issues, or the increase in delinquencies and defaults becomes more severe, our results of operations and financial condition may be further adversely affected.
We face loss exposure due to fraudulent and negligent acts on the part of loan applicants, employees, mortgage brokers and other third parties.
When we originate or purchase mortgage loans, we rely heavily upon information provided to us by third parties, including information relating to the loan application, property appraisal, title information and employment and income documentation. If any of this information is fraudulently or negligently misrepresented to us and such misrepresentation is not detected by us prior to loan funding, the value of the loan may be significantly lower than we expected. Whether a misrepresentation is made by the loan applicant, the loan broker, one of our employees, or any other third party, we generally bear the risk of loss associated with it. A loan subject to misrepresentation typically cannot be sold and, if sold prior to our detection of the misrepresentation, generally must be repurchased by us. We may not be able to recover losses incurred as a result of the misrepresentation.
As with the broader nonconforming mortgage loan industry, we have recently experienced an increase in exposure due to fraud, which has resulted in an increase in our repurchase and indemnity obligations and has adversely affected our cash flow, results of operations and financial condition. To the extent that we cannot successfully address these issues or the increase in fraud becomes more severe, our results of operations and financial condition may be further adversely affected.
Our reliance on cash-out refinancings as a significant source of our origination volume increases the risk that our earnings will be harmed if the demand for this type of refinancing declines.
Approximately 65% of our loan production volume during the year ended December 31, 2006 consisted of cash-out refinancings. Our reliance on cash-out refinancings as a significant source of our origination volume increases the risk that our earnings will be reduced if interest rates rise and the prices of homes decline, which would reduce the demand and production volume for this type of refinancing. To the extent interest rates continue to rise, the number of borrowers who would qualify or elect to pursue a cash-out refinancing could be reduced significantly, which will result in a decline in that origination source. Similarly, a decrease in home prices would reduce the amount of equity available to be borrowed against in cash-out refinancings and result in a decrease in our loan production volume from that origination source. Therefore, our reliance on cash-out refinancings as a significant source of our origination volume could harm our results of operations, financial condition and business prospects.
Our efforts to manage credit risk may not be successful in limiting delinquencies and defaults in underlying loans and, as a result, our results of operations may be affected.
There are many aspects of credit that we cannot control and our quality control and loss mitigation operations may not be successful in limiting future delinquencies, defaults and losses. For example, the value of the homes collateralizing residential loans may decline due to a variety of reasons beyond our control, such as weak economic conditions, natural disasters, over-leveraging of the borrower, and reduction in personal incomes. Interest-only loans, negative amortization loans, adjustable-rate loans, reduced documentation loans, sub-prime loans, home equity lines of credit and second lien loans may involve higher than expected delinquencies and defaults. Changes in consumer behavior, bankruptcy laws, and other laws may exacerbate loan losses.
Our comprehensive underwriting process may not be effective in mitigating these risks and our risk of loss on the underlying loans. Further, expanded loss mitigation efforts in the event that defaults increase could increase our operating costs. In response to increasing default rates recently experienced by us and the nonconforming mortgage loan industry generally, we have enhanced our underwriting policies and procedures, which may decrease our ability to originate and purchase loans. To the extent that these efforts are ineffective to reduce the current level of loan delinquencies and defaults or adversely affect our origination and purchase volumes, our results of operations may be adversely affected.
Mortgage insurers may in the future change their pricing or underwriting guidelines or may not pay claims resulting in increased credit losses.
We use mortgage insurance to mitigate our risk of credit losses. Our decision to obtain mortgage insurance coverage is dependent, in part, on pricing trends. Mortgage insurance coverage on our new mortgage loan production may not be available at rates that we believe are economically viable for us or at all. We also face the risk that our mortgage insurers might not have the financial ability to pay all claims presented by us or may deny a claim if the loan is not properly serviced, has been improperly originated, is the subject of fraud, or for other reasons. Any of those events could increase our credit losses and thus adversely affect our results of operations and financial condition.
Investments in diverse types of assets and businesses could expose us to new, different, or increased risks.
We have invested in and intend to invest in a variety of assets that are related to our current core business, including loans, securities, and related derivatives. We may make investments in debt and equity securities issued by our own and third party CDOs that own various types of assets. These CDOs may invest in manufactured housing loans, sub-prime residential mortgage loans, and other residential mortgage loans backed by lower-quality borrowers, in other loans and receivables, in securities backed by the foregoing, and in credit default derivatives referencing these or other securities. The higher credit and/or prepayment risks associated with these types of investments may increase our exposure to losses. In addition, certain of these assets may be relatively new or unique products, which may increase contractual and liquidity risks.
The federal banking agencies’ final guidance on nontraditional mortgage products may impact our ability to originate, buy, or sell certain nontraditional mortgage loans.
On October 4, 2006, the Office of the Comptroller of the Currency, the Board of Governors of the Federal Reserve System, the Federal Deposit Insurance Corporation, the Office of Thrift Supervision, and the National Credit Union Administration issued their final “Interagency Guidance on Nontraditional Mortgage Product Risks” (the “Guidance”). Nontraditional mortgage products are those which allow borrowers to defer payment of principal and sometimes interest. They include what are commonly referred to as “option ARM” loans and interest-only loans.
The Guidance addresses the portfolio risks and consumer protection issues that the federal agencies believe investors and lenders face when making or investing in nontraditional mortgage loans. As a matter of portfolio risk management, the Guidance warns applicable financial institutions that loan terms should be analyzed to ensure a manageable risk level, utilizing sound underwriting standards including an evaluation of factors that may compound the risk, such as reduced documentation programs and the use of second lien mortgages. The analysis of repayment ability “should avoid over-reliance on credit scores as a substitute for income verification in the underwriting process” and should include an analysis of the borrower’s ability to make the payment when it increases to include amortization of the loan.
As a matter of consumer protection, financial institutions subject to the Guidance, when promoting or describing nontraditional mortgage products, are directed to ensure that they provide consumers with marketing materials and at application with information that is designed to help them make informed decisions when selecting and using these products. Lenders subject to the Guidance are instructed that the information they are to provide should apprise consumers of the risk that the monthly payment amounts could increase in the future, and explain the possibility of negative amortization.
While not directly applicable to us, the Guidance may affect our ability to make, buy or sell the nontraditional loans covered by the Guidance. Further, the Guidance is instructive of the regulatory climate concerning those loans and may be adopted in whole or part by other agencies that regulate us. The Guidance reports that the Conference of State Bank Supervisors (“CSBS”) and the State Financial Regulators Roundtable (“SFRR”) are committed to preparing a model guidance document for state regulators of non-depository institutions such as us, which would be “similar in nature and scope” to the Guidance. It is also possible that the Guidance, or certain provisions within it, may be adopted as laws or used as guidance by federal, state or local agencies and that those laws or guidance may be applied to us.
If we are required (either by a regulatory agency or by third-party originators or investors) to make changes to our business practices to comply with the Guidance, it might affect the business activities in which we may engage and the profitability of those activities. Our business could be adversely affected if, as a result of the Guidance, investors from which we purchase loans, or to whom we sell loans, change their business practices and policies relative to nontraditional mortgage products. For example, if entities from which we purchase loans are required to change their origination guidelines thereby affecting the volume, diversity, and quality of loans available for purchase by us, or if purchasers of mortgage loans are required to make changes to the purchasing policies, then our loan volume, ability to sell mortgage loans and profitability, could be adversely affected.
Our interest-only loans may have a higher risk of default than our fully-amortizing loans.
For the year ended December 31, 2006, originations of interest-only loans totaled $1.4 billion, or 13%, of our total originations. These interest-only loans require the borrowers to make monthly payments only of accrued interest for the first 24, 36 or 120 months following origination. After such interest-only period, the borrower’s monthly payment is recalculated to cover both interest and principal so that the mortgage loan will amortize fully prior to its final payment date. The interest-only feature may reduce the likelihood of prepayment during the interest-only period due to the smaller monthly payments relative to a fully-amortizing mortgage loan. If the monthly payment increases, the related borrower may not be able to pay the increased amount and may default or may refinance the related mortgage loan to avoid the higher payment. Because no principal payments may be made on such mortgage loans for an extended period following origination, if the borrower ultimately defaults, the unpaid principal balance of the related loans would be greater than otherwise would be the case for a fully-amortizing loan. As a result, the likelihood that we would incur a loss on these loans will increase, especially in a declining real estate market.
Current loan performance data may not be indicative of future results.
When making capital budgeting and other decisions, we use projections, estimates and assumptions based on our experience with mortgage loans. Actual results and the timing of certain events could differ materially in adverse ways from those projected, due to factors including changes in general economic conditions, interest rates, mortgage loan prepayment rates and in losses due to defaults on mortgage loans. These differences and fluctuations could rise to levels that may adversely affect our profitability and financial condition.
Changes in prepayment rates of mortgage loans could adversely affect the return that we are able to achieve on our assets.
The value of our assets may be affected by prepayment rates on our residential mortgage loans and other floating rate assets. Prepayment rates are influenced by changes in current interest rates and a variety of economic, geographic and other factors beyond our control, and consequently, such prepayment rates cannot be predicted with certainty. In periods of declining mortgage interest rates, prepayments on loans generally increase. If general interest rates decline as well, the proceeds of such prepayments received during such periods are likely to be reinvested by us in assets yielding less than the yields on the assets that were prepaid. In addition, the market value of floating rate assets may, because of the risk of prepayment, benefit less than fixed rate assets from declining interest rates. Conversely, in periods of rising interest rates, prepayments on loans generally decrease, in which case we would not have the prepayment proceeds available to invest in assets with higher yields. Under certain interest rate and prepayment scenarios we may fail to recoup fully our cost of acquisition of certain investments. As a result of all of these factors, changes in prepayment rates could adversely affect our return on our assets.
Geographic concentration of mortgage loans we originate or purchase increases our exposure to risks in those areas.
Over-concentration of loans we originate or purchase in any one geographic area increases our exposure to the economic and natural hazard risks associated with that area. Declines in the residential real estate markets in which we are concentrated may reduce the values of the properties collateralizing our mortgages which in turn may increase the risk of delinquency, foreclosure, bankruptcy, or losses from those loans. To the extent that borrowers in a geographic area in which we have made a significant number of loans become delinquent or otherwise default on such loans, our financial condition and results of operations may be adversely affected.
To the extent that we have a large number of loans in an area hit by a natural disaster, we may suffer losses.
Standard homeowner insurance policies generally do not provide coverage for natural disasters, such as hurricanes and floods. Furthermore, nonconforming borrowers are not likely to have special hazard insurance. To the extent that borrowers do not have insurance coverage for natural disasters, they may not be able to repair the property or may stop paying their mortgages if the property is damaged. A natural disaster that results in a significant number of delinquencies could cause increased foreclosures and decrease our ability to recover losses on properties affected by such disasters, and that in turn could harm our financial condition and results of operations.
A prolonged economic slowdown or a decline in the real estate market could harm our results of operations.
A substantial portion of our mortgage assets consist of single-family mortgage loans or mortgage securities evidencing interests in single-family mortgage loans. Because we make a substantial number of loans to credit-impaired borrowers, the actual rates of delinquencies, foreclosures and losses on these loans tend to be higher during economic slowdowns. Recently, we have experienced an increase in delinquencies and foreclosures. Any sustained period of increased delinquencies or defaults or any sharp increase in the number of delinquencies and defaults could harm our ability to sell loans, the prices we receive for our loans, the values of our mortgage loans held for sale, our ability to finance loan originations and our residual interests in securitizations, which could harm our financial condition and results of operations. In addition, any material decline in real estate values would weaken our collateral loan-to-value ratios and increase the possibility of loss if a borrower defaults. In such event, we will be subject to the risk of loss on such mortgage asset arising from borrower defaults to the extent not covered by third-party credit enhancement.
Risks Related to the Legal and Regulatory Environment in Which We Operate
Various legal proceedings could adversely affect our financial condition or results of operations.
In the course of our business, we are subject to various legal proceedings and claims. See “Item 3 – Legal Proceedings.” The resolution of these legal matters or other legal matters could result in a material adverse impact on our results of operations, financial condition and business prospects.
We are subject to the risk that provisions of our loan agreements may be unenforceable.
Our rights and obligations with respect to our loans are governed by written loan agreements and related documentation. It is possible that a court could determine that one or more provisions of a loan agreement are unenforceable, such as a loan prepayment prohibition or the provisions governing our security interest in the underlying collateral. If this were to happen with respect to a material asset or group of assets, we could be required to repurchase these loans and may not be able to sell or liquidate the loans, which could negatively affect our liquidity and financial condition.
We are exposed to the risk of environmental liabilities with respect to properties to which we take title.
In the course of our business, we occasionally foreclose and take title to residential properties and as a result could become subject to environmental liabilities associated with these properties. We may be held liable for property damage, personal injury, investigation, and cleanup costs incurred in connection with environmental contamination. These costs could be substantial. If we ever become subject to significant environmental liabilities, our financial condition and results of operations could be adversely affected.
Regulation as an investment company could harm our business; efforts to avoid regulation as an investment company could limit our operations.
If we were required to comply with the Investment Company Act, we would be prevented from conducting our business as described in this document by, among other things, substantially limiting our ability to use leverage. The Investment Company Act does not regulate entities that are primarily engaged, directly or indirectly, in a business “other than that of investing, reinvesting, owning, holding or trading in securities,” or that are primarily engaged in the business of “purchasing or otherwise acquiring mortgages and other liens on and interests in real estate.” Under the Commission’s current interpretation, in order to qualify for the latter exemption we must maintain at least 55% of our assets directly in “qualifying real estate interests” and at least an additional 25% of our assets in other real estate-related assets or additional qualifying real estate interests. Mortgage-backed securities that do not represent all the certificates issued with respect to an underlying pool of mortgages may be treated as securities separate from the underlying mortgage loans and thus may not qualify as a qualifying real estate interest for the purposes of the 55% requirement. Therefore, to insure that we continue to qualify for the exemption, we may be required to adopt less efficient methods of financing certain of our mortgage assets, we may be required to sell certain mortgage securities at disadvantageous terms, and we may be precluded from acquiring certain types of higher yielding mortgage assets. If we fail to qualify for an applicable exemption from the Investment Company Act, we could not operate our business efficiently under the regulatory scheme imposed by the Investment Company Act. Accordingly, we could be required to restructure our activities which could materially adversely affect our financial condition and results of operations.
Our failure to comply with federal, state or local regulation of, or licensing requirements with respect to, mortgage lending, loan servicing, broker compensation programs, or other aspects of our business could harm our operations and profitability.
As a mortgage lender, loan servicer and broker, we are subject to an extensive body of both state and federal law. The volume of new or modified laws and regulations has increased in recent years and, in addition, some individual municipalities and cities have begun to enact laws that restrict loan origination and servicing activities. As a result, it may be more difficult to comprehensively identify and accurately interpret all of these laws and regulations, to properly program our technology systems and to effectively train our personnel with respect to all of these laws and regulations, thereby potentially increasing our exposure to the risks of noncompliance with these laws and regulations. Our failure to comply with these laws and regulations can lead to civil and criminal liability; loss of licensure; damage to our reputation in the industry; inability to sell or securitize our loans; demands for indemnification or loan repurchases from purchasers of our loans; fines and penalties and litigation, including class action lawsuits; or administrative enforcement actions. Any of these results could harm our results of operations, financial condition and business prospects.
New legislation could restrict our ability to make, finance and sell mortgage loans, could increase our compliance and origination costs, and could expose us to lawsuits and compliance actions, any of which could harm our earnings and business prospects.
The regulatory environments in which we operate have an impact on the activities in which we may engage, how these activities may be carried out, and the profitability of these activities. Therefore, changes to laws, regulations or regulatory policies can affect whether and to what extent we are able to operate profitably.
Several states, cities or other government entities are considering or have passed laws, regulations or ordinances aimed at curbing lending practices perceived as predatory. The federal government is also considering legislative and regulatory proposals in this regard. In general, these proposals involve lowering the existing thresholds for defining a “high-cost” loan and establish enhanced protections and remedies for borrowers who receive such loans. For example, certain of these new or proposed laws and regulations prohibit inclusion of some provisions in mortgage loans that have mortgage rates or origination costs in excess of prescribed levels, and require that borrowers be given certain disclosures or obtain advice, at the expense of the lender, prior to the consummation of such mortgage loans. Passage of these laws and rules could reduce our loan origination and purchase volumes and could increase our costs. The institutions that provide short-term financing to us generally refuse to finance any loan labeled as a “high cost” loan under any local, state or federal law or regulation. In addition, many whole loan buyers may elect not to purchase these loans, and rating agencies likewise may refuse to rate securities backed by such loans. Accordingly, these laws and rules could severely restrict short-term financing and the secondary market for a significant portion of our loan production. This would effectively preclude us from continuing to originate loans either in jurisdictions unacceptable to our lenders or the rating agencies or that exceed the newly defined thresholds, which in either case could harm our results of operations and business prospects.
We cannot provide any assurance that these proposed laws, rules and regulations, or other similar laws, rules or regulations, will not be adopted in the future. Adoption of these laws and regulations could have a material adverse impact on our business by substantially increasing the costs of compliance with a variety of inconsistent federal, state and local rules, or by restricting our ability to charge rates and fees adequate to compensate us for the risk associated with certain loans. Compliance with some of these restrictions requires lenders to make subjective judgments, such as whether a loan will provide a “net tangible benefit” to the borrower. These restrictions impact the way in which a loan is underwritten and expose a lender to risks of litigation and regulatory sanction regardless of the care with which a loan is underwritten. Our failure to comply with these laws could subject us to monetary penalties and could result in the borrowers rescinding the loans, whether held by us or subsequent holders. The remedies for violations of these laws are not based solely on actual harm to the consumer and can result in damages and penalties that could extend not only to us, but to our secured warehouse lenders, institutional loan purchasers, securitization trusts that hold our loans and other assignees, regardless of whether such assignee knew of or participated in the violation, which, in turn, could have an adverse affect on the availability of financing to us and our access to securitization and other secondary markets.
Similarly, recently enacted and proposed local, state and federal privacy laws and laws prohibiting or limiting marketing by telephone, facsimile, email and the Internet may limit our ability to market and our ability to access potential loan applicants.
We are subject to significant legal and reputational risks and expenses under federal and state laws concerning privacy, use, and security of customer information.
The scope of business activity affected by “privacy” concerns is likely to expand and will affect our non-prime mortgage loan origination business. The federal Gramm-Leach-Bliley financial reform legislation imposes significant privacy obligations on us in connection with the collection, use and security of financial and other non-public information provided to us by applicants and borrowers. We adopted a privacy policy and adopted controls and procedures to comply with the law after it took effect on July 1, 2001. Privacy rules also require us to protect the security and integrity of the customer information we use and hold. Although we have systems and procedures designed to help us with these privacy requirements, we cannot assure you that more restrictive laws and regulations will not be adopted in the future, or that governmental bodies will not interpret existing laws or regulations in a more restrictive manner, making compliance more difficult or expensive. These requirements also increase the risk that we may be subject to liability for non-compliance.
A number of states are considering privacy amendments that may be more demanding than federal law, and California recently has enacted two statutes — the California Financial Information Privacy Act (also know as SB-1) and the California Online Privacy Protection Act, both of which took effect on July 1, 2004. Under SB-1, a financial company must allow its customers to opt out of the sharing of their information with affiliates in separately regulated lines of business and must receive a customer opt-in before confidential customer data may be shared with unaffiliated companies (subject to certain exceptions). A federal court rejected the effort of three financial trade associations to prevent SB-1 from taking effect, and as of July 1, 2004, the California Department of Financial Institutions announced that it would require immediate compliance with SB-1. Under the new California Online Privacy Act, all operators of commercial websites and online services that allow interaction with California consumers (even if no transactions may be effected online) must post privacy policies meeting statutory requirements. The FTC, which administers the federal privacy rules for mortgage lenders, has determined that privacy laws in several states are not preempted by Gramm-Leach-Bliley, most recently new privacy laws enacted by Vermont and Illinois. In view of the public concern with privacy, we cannot assure you that additional rules that restrict or make more costly our activities and the activities of our vendors will not be adopted and will not restrict the marketing of our products and services to new customers.
Because laws and rules concerning the use and protection of customer information are continuing to develop at the federal and state levels, we expect to incur increased costs in our effort to be and remain in full compliance with these requirements. Nevertheless, despite our efforts, we will be subject to legal and reputational risks in connection with our collection and use of customer information, and we cannot assure you that we will not be subject to lawsuits or compliance actions under such state or federal privacy requirements. Furthermore, to the extent that a variety of inconsistent state privacy rules or requirements are enacted, our compliance costs could substantially increase.
New regulatory actions affecting the mortgage industry may increase our costs and decrease our mortgage acquisition.
In addition to changes to legal requirements contained in statutes, regulations, case law, and other sources of law, changes in the investigation or enforcement policies of federal and state regulatory agencies could impact the activities in which we may engage, how the activities may be carried out, and the profitability of those activities. Several state and federal agencies have initiated regulatory enforcement proceedings against mortgage companies for engaging in business practices that were not specifically or clearly proscribed by law, but which in the judgment of the regulatory agencies were unfair or deceptive to consumers. For example, state attorneys general and other state officials representing various states entered into a settlement agreement with a large subprime mortgage company.
The subject company agreed to pay a substantial amount in restitution to consumers and reimbursement to the states and also agreed to make changes to certain business practices, including the company’s underwriting criteria and pricing policies. Many of the practices and policies are not specifically prohibited by any federal or state laws but were alleged to be deceptive or unfair to consumers. The terms of this settlement agreement do not apply directly to us; however, federal and state regulatory agencies and private parties might nevertheless expect mortgage companies, including us, to make our business practices consistent with the provisions of the settlement agreement. If this happens, it could impact the activities in which we may engage, how we carry out those activities, our acquisition practices and our profitability. We might also be required to pay fines, make reimbursements, and make other payments to third parties for our business practices. Additionally, if an administrative enforcement proceeding were to result in us having to discontinue or alter certain business practices, then we might be placed at a competitive disadvantage vis-à-vis competitors who are not required to make comparable changes to their business practices.
Changes in Internal Revenue Service regulations regarding the timing of income recognition and/or deductions could materially adversely affect the amount of our dividends.
On September 30, 2004, the IRS released Announcement 2004-75, which describes rules that may be included in proposed IRS regulations regarding the timing of recognizing income and/or deductions attributable to interest-only securities. We believe the effect of these regulations, if adopted, may narrow the spread between book income and taxable income on the interest-only securities we hold and would thus reduce our taxable income during the initial periods that we hold such securities. A significant portion of our mortgage securities—available-for-sale consists of interest-only securities. If regulations are adopted by the IRS that reduces our taxable income in a particular year during which we are a REIT, our dividend paid to common shareholders may be reduced for that year because, so long as we remain a REIT, the amount of our dividend on common stock is entirely dependent upon our taxable income.
If we do not maintain our REIT status, we would be subject to tax as a regular corporation and would otherwise operate as a regular corporation. We conduct a substantial portion of our business through our taxable REIT subsidiaries, which creates additional compliance requirements.
We must comply with numerous complex tests to continue to qualify as a REIT for federal income tax purposes, including the requirement that we distribute 90% of taxable income to our shareholders and the requirement that no more than 5% of our annual gross income come from non-qualifying sources. So long as we remain a REIT, failure to comply with these requirements may subject us to penalty taxes and may put our REIT status at risk. In the event that we fail to maintain or elect to terminate our REIT status, we would be taxed at the corporate level and would not be required to pay out our taxable income in the form of dividends. For any year that we do not generate taxable income, we are not required to declare and maintain dividends to maintain our REIT status.
We conduct a substantial portion of our business through taxable REIT subsidiaries, such as NovaStar Mortgage. Despite our qualification as a REIT, our taxable REIT subsidiaries must pay federal income tax on their taxable income. Our income from, and investments in, our taxable REIT subsidiaries do not constitute permissible income or investments for some of the REIT qualification tests. We may be subject to a 100% penalty tax, or our taxable REIT subsidiaries may be denied deductions, to the extent that our dealings with our taxable REIT subsidiaries are deemed not to be arm’s length in nature.
Our cash balances and cash flows may become limited relative to our cash needs, which may ultimately affect our REIT status or solvency.
We use cash for originating mortgage loans, to meet minimum REIT dividend distribution requirements, and for other operating needs. Cash is also required to pay interest on our outstanding indebtedness and may be required to pay down indebtedness in the event that the market values of the assets collateralizing our debt decline, the terms of short-term debt become less attractive or for other reasons. If our income as calculated for tax purposes significantly exceeds our cash flows from operations, our minimum REIT dividend distribution requirements could exceed the amount of our available cash. In the event that our liquidity needs exceed our access to liquidity, we may need to sell assets at an inopportune time, thus adversely affecting our financial condition and results of operations. Furthermore, in an adverse cash flow situation, our REIT status or our solvency could be threatened.
The tax imposed on REITs engaging in “prohibited transactions” will limit our ability to engage in transactions, including certain methods of securitizing loans, which would be treated as sales for federal income tax purposes.
A REIT’s net income from prohibited transactions is subject to a 100% tax. In general, prohibited transactions are sales or other dispositions of property, other than foreclosure property but including any mortgage loans held in inventory primarily for sale to customers in the ordinary course of business. We might be subject to this tax if we were to sell a loan or securitize the loans in a manner that was treated as a sale of such inventory for federal income tax purposes. Therefore, in order to avoid the prohibited transactions tax, we may choose not to engage in certain sales of loans other than through our taxable REIT subsidiaries and may limit the structures we utilize for our securitization transactions even though such sales or structures might otherwise be beneficial for us. In addition, this prohibition may limit our ability to restructure our portfolio of mortgage loans from time to time even if we believe it would be in our best interest to do so.
Even if we qualify as a REIT, the income earned by our taxable REIT subsidiaries will be subject to federal income tax and we could be subject to an excise tax on non-arm’s-length transactions with our taxable REIT subsidiaries.
Our taxable REIT subsidiaries, including NovaStar Mortgage, expect to earn income from activities that are prohibited for REITs, and will owe income taxes on the taxable income from these activities. For example, we expect that NovaStar Mortgage will earn income from our loan origination and sales activities, as well as from other origination and servicing functions, which would generally not be qualifying income for purposes of the gross income tests applicable to REITs or might otherwise be subject to adverse tax liability if the income were generated by a REIT. Our taxable REIT subsidiaries are taxable as C corporations and are subject to federal, state and local income tax at the applicable corporate rates on their taxable income, notwithstanding our qualification as a REIT.
In the event that any transactions between us and any of our taxable REIT subsidiaries are not conducted on an arm’s-length basis, we could be subject to a 100% excise tax on certain amounts from such transactions. Any such tax could affect our overall profitability and the amounts of cash available for operations or to make distributions.
We may, at some point in the future, borrow funds from one or more of our corporate subsidiaries. The IRS may recharacterize the indebtedness as a dividend distribution to us by our subsidiary. Any such recharacterization may cause us to fail one or more of the REIT requirements.
We may be harmed by changes in tax laws applicable to REITs or the reduced 15% tax rate on certain corporate dividends may harm us.
Changes to the laws and regulations affecting us, including changes to securities laws and changes to the Code applicable to the taxation of REITs may harm our business. New legislation may be enacted into law or new interpretations, rulings or regulations could be adopted, any of which could harm us and our shareholders, potentially with retroactive effect.
Generally, dividends paid by REITs are not eligible for the 15% U.S. federal income tax rate on certain corporate dividends, with certain exceptions. The more favorable treatment of regular corporate dividends could cause domestic non-corporate investors to consider stocks of other corporations that pay dividends as more attractive relative to stocks of REITs.
We may be unable to comply with the requirements applicable to REITs or compliance with such requirements could harm our financial condition.
The requirements to qualify as a REIT under the Code are highly technical and complex. We routinely rely on legal opinions to support our tax positions. A technical or inadvertent failure to comply with the Code as a result of an incorrect interpretation of the Code or otherwise could jeopardize our REIT status. The determination that we qualify as a REIT requires an analysis of various factual matters and circumstances that may not be totally within our control. For example, to qualify as a REIT, at least 75% of our gross income must come from real estate sources and 95% of our gross income must come from real estate sources and certain other sources that are itemized in the REIT tax laws, mainly interest and dividends. We are subject to various limitations on our ownership of securities, including a limitation that the value of our investment in taxable REIT subsidiaries, including NovaStar Mortgage, cannot exceed 20% of our total assets at the end of any calendar quarter. In addition, at the end of each calendar quarter, at least 75% of our assets must be qualifying real estate assets, government securities and cash and cash items. The need to comply with these asset ownership requirements may cause us to acquire other assets that are qualifying real estate assets for purposes of the REIT requirements (for example, interests in other mortgage loan portfolios or mortgage-related assets) but are not part of our overall business strategy and might not otherwise be the best investment alternative for us. Moreover, we may be unable to acquire sufficient qualifying REIT assets, due to our inability to obtain adequate financing or otherwise, in which case we may fail to qualify as a REIT or may incur a penalty tax at the REIT level.
Also, to qualify as a REIT, we must distribute to our shareholders with respect to each year at least 90% of our REIT taxable income (determined without regard to the dividends paid deduction and by excluding any net capital gain). After-tax earnings generated by our taxable REIT subsidiaries and not distributed to us are not subject to these distribution requirements and may be retained by such subsidiaries to provide for future growth, subject to the limitations imposed by REIT tax rules. To the extent that we satisfy the 90% distribution requirement, but distribute less than 100% of our taxable income, we will be subject to federal corporate income tax on our undistributed taxable income. In addition, we will be subject to a 4% nondeductible excise tax if the actual amount that we pay out to our shareholders in a calendar year is less than a minimum amount specified under federal tax laws. We expect in some years that we will be subject to the 4% excise tax. We could be required to borrow funds on a short-term basis even if conditions are not favorable for borrowing, or to sell loans from our portfolio potentially at disadvantageous prices, to meet the REIT distribution requirements and to avoid corporate income taxes. These alternatives could harm our financial condition and could reduce amounts available to originate mortgage loans.
If we fail to qualify or remain qualified as a REIT, our distributions will not be deductible by us, and we will be subject to federal income tax on our taxable income. This would substantially reduce our earnings and our cash available to make distributions. The resulting tax liability, in the event of our failure to qualify as a REIT, might cause us to borrow funds, liquidate some of our investments or take other steps that could negatively affect our operating results. Moreover, if our REIT status is terminated because of our failure to meet a technical REIT requirement or if we voluntarily revoke our election, we generally would be disqualified from electing treatment as a REIT for the four taxable years following the year in which REIT status is lost.
We could lose our REIT status if more than 20% of the value of our total assets are represented by the securities of one or more taxable REIT subsidiaries at the close of any calendar quarter.
To qualify as a REIT, not more than 20% of the value of our total assets may be represented by the securities of one or more taxable REIT subsidiaries at the close of any calendar quarter, subject to a 30-day “cure” period following the close of the quarter and, for taxable years beginning on or after January 1, 2005, subject to certain relief provisions even after the 30-day cure period. Our taxable REIT subsidiaries, including NovaStar Mortgage, conduct a substantial portion of our business activities, including a majority of our loan origination and servicing activities. If the IRS determines that the value of our investment in our taxable REIT subsidiaries was more than 20% of the value of our total assets at the close of any calendar quarter, we could lose our REIT status. In certain cases, we may need to borrow from third parties to acquire additional qualifying REIT assets or increase the amount and frequency of dividends from our taxable REIT subsidiaries in order to comply with the 20% of assets test.
Risks Related to Our Capital Stock
Investors in our common stock may experience losses, volatility and poor liquidity, and we may reduce or delay payment of our dividends in a variety of circumstances.
Our earnings, cash flow, taxable income, GAAP income, book value and dividends can be volatile and difficult to predict. Investors should not rely on past performance, predictions or management beliefs. Although we historically paid a regular common stock dividend, we may reduce or eliminate our dividend payments in the future for a variety of reasons. For example, to the extent that the historic difference between our taxable income and GAAP income is reduced or reversed due to changes in the tax laws, our operating results or otherwise, our dividend could be reduced or eliminated. Furthermore, if we failed, or chose not to satisfy the complex requirements necessary to maintain our REIT status, our dividend may be reduced or eliminated because we would not be required to pay out our taxable income in the form of dividends. We may not provide public warnings of such dividend reductions or eliminations prior to their occurrence. Fluctuations in our current and prospective earnings, cash flow and dividends, as well as many other factors such as perceptions, economic conditions, stock market conditions, and the like, can affect the price of our common stock. Investors may experience volatile returns and material losses. In addition, liquidity in the trading of our common stock may be insufficient to allow investors to sell their stock in a timely manner or at a reasonable price.
We may not pay common stock dividends to stockholders.
So long as we maintain our status as a REIT, REIT provisions of the Code generally require that we annually distribute to our stockholders at least 90% of all of our taxable income, exclusive of the application of any tax loss carry forwards that may be used to offset current period taxable income. These provisions restrict our ability to retain earnings and thereby generate capital from our operating activities. If in any year, however, we do not generate taxable income, we are not required to declare and pay common stock dividends to maintain our REIT status. In addition, we are currently evaluating and may decide at a future date to terminate our REIT status, which would cause us to be taxed at corporate levels and to significantly reduce or eliminate regular dividends.
Restrictions on ownership of capital stock may inhibit market activity and the resulting opportunity for holders of our capital stock to receive a premium for their securities.
In order for us to meet the requirements for qualification as a REIT, our charter generally prohibits, so long as we remain a REIT, any person from acquiring or holding, directly or indirectly, (i) shares of our common stock in excess of 9.8% (in value or number of shares, whichever is more restrictive) of the aggregate outstanding shares of our common stock or (ii) shares of our capital stock in excess of 9.8% in value of the aggregate outstanding shares of our capital stock. These restrictions may inhibit market activity and the resulting opportunity for the holders of our capital stock to receive a premium for their stock that might otherwise exist in the absence of such restrictions.
The market price of our common stock and trading volume may be volatile, which could result in substantial losses for our shareholders.
The market price of our common stock can be highly volatile and subject to wide fluctuations. In addition, the trading volume in our common stock may fluctuate and cause significant price variations to occur. Some of the factors that could negatively affect our share price or result in fluctuations in the price or trading volume of our common stock include:
general market and economic conditions;
actual or anticipated changes in residential real estate value;
actual or anticipated changes in the delinquency and default rates on mortgage loans, in general, and specifically on the loans we originate or invest in through our mortgage securities-available for-sale;
actual or anticipated changes in our future financial performance;
actual or anticipated changes in market interest rates;
actual or anticipated changes in our access to capital;
actual or anticipated changes in the amount of our dividend or any delay in the payment of a dividend;
competitive developments, including announcements by us or our competitors of new products or services;
the operations and stock performance of our competitors;
developments in the mortgage lending industry or the financial services sector generally;
the impact of new state or federal legislation or adverse court decisions;
fluctuations in our quarterly operating results;
the activities of investors who engage in short sales of our common stock;
actual or anticipated changes in financial estimates by securities analysts;
sales, or the perception that sales could occur, of a substantial number of shares of our common stock by insiders;
additions or departures of senior management and key personnel; and
actions by institutional shareholders.
Our common stock may become illiquid if an active public trading market cannot be sustained, which could adversely affect the trading price and your ability to transfer our common stock.
Our common stock’s trading volume is relatively low compared to the securities of many other companies listed on the New York Stock Exchange. If an active public trading market cannot be sustained, the trading price of our common stock could be adversely affected and your ability to transfer your shares of our common stock may be limited.
We may issue additional shares that may cause dilution and may depress the price of our common stock.
Our charter permits our board of directors, without shareholder approval, to:
authorize the issuance of additional shares of common stock or preferred stock without shareholder approval, including the issuance of shares of preferred stock that have preference rights over the common stock with respect to dividends, liquidation, voting and other matters or shares of common stock that have preference rights over our outstanding common stock with respect to voting; and
classify or reclassify any unissued shares of common stock or preferred stock and to set the preferences, rights and other terms of the classified or reclassified shares.
In the future, we expect to access the capital markets from time to time by making additional offerings of securities, including debt instruments, preferred stock or common stock. Additional equity offerings by us may dilute your interest in us or reduce the market price of our common stock, or both. Our outstanding shares of preferred stock have, and any additional series of preferred stock may also have, a preference on distribution payments that could limit our ability to make a distribution to common shareholders. Because our decision to issue securities in any future offering will depend on market conditions and other factors beyond our control, we cannot predict or estimate the amount, timing or nature of our future offerings. Further, market conditions could require us to accept less favorable terms for the issuance of our securities in the future. Thus, our common shareholders will bear the risk of our future offerings reducing the market price of our common stock and diluting their interest in us.
Other Risks Related to our Business
Intense competition in our industry may harm our financial condition.
Our loan origination business faces intense competition, primarily from consumer finance companies, conventional mortgage bankers, commercial banks, credit unions, thrift institutions, and other independent wholesale mortgage lenders, including internet-based lending companies and other mortgage REITs. Competitors with lower costs of capital have a competitive advantage over us. In addition, establishing a mortgage lending operation such as ours requires a relatively small commitment of capital and human resources, which permits new competitors to enter our markets quickly and to effectively compete with us. Furthermore, national banks, thrifts and their operating subsidiaries are generally exempt from complying with many of the state and local laws that affect our operations, such as the prohibition on prepayment penalties. Thus, they may be able to provide more competitive pricing and terms than we can offer. Any increase in the competition among lenders to originate nonconforming mortgage loans may result in either reduced income on mortgage loans compared to present levels, or revised underwriting standards permitting higher loan-to-value ratios on properties securing nonconforming mortgage loans, either of which could adversely affect our results of operations, financial condition or business prospects. In addition, the government-sponsored entities, Fannie Mae and Freddie Mac, may also expand their participation in the subprime mortgage industry. To the extent they materially expand their purchase of subprime loans, our ability to profitably originate and purchase mortgage loans may be adversely affected because their size and cost-of-funds advantage allows them to purchase loans with lower rates or fees than we are willing to offer.
If we are unable to maintain and expand our network of independent brokers, our loan origination business will decrease.
A significant majority of our originations of mortgage loans comes from independent brokers. For the year ended December 31, 2006, 86% of our loan originations were originated through our broker network. Our brokers are not contractually obligated to do business with us. Further, our competitors also have relationships with our brokers and actively compete with us in our efforts to expand our broker networks. Our failure to maintain existing relationships or expand our broker networks could significantly harm our business, financial condition, liquidity and results of operations.
Our reported GAAP financial results differ from the taxable income results that drive our common stock dividend distributions, and our consolidated balance sheet, income statement, and statement of cash flows as reported for GAAP purposes may be difficult to interpret.
We manage our business based on long-term opportunities to earn cash flows. Our common stock dividend distributions are driven by the REIT tax laws and our taxable income as calculated pursuant to the Code. Our reported results for GAAP purposes differ materially, however, from both our cash flows and our taxable income. We transfer mortgage loans or mortgage securities into securitization trusts to obtain long-term non-recourse funding for these assets. When we surrender control over the transferred mortgage loans or mortgage securities, the transaction is accounted for as a sale. When we retain control over the transferred mortgage loans or mortgage securities, the transaction is accounted for as a secured borrowing. These securitization transactions do not differ materially in their structure or cash flow generation characteristics, yet under GAAP accounting these transactions are recorded differently. In a securitization transaction accounted for as a sale, we record a gain or loss on the assets transferred in our income statement and we record the retained interests at fair value on our balance sheet. In a securitization transaction accounted for as a secured borrowing, we consolidate all the assets and liabilities of the trust on our financial statements (and thus do not show the retained interest we own as an asset). As a result of this and other accounting issues, shareholders and analysts must undertake a complex analysis to understand our economic cash flows, actual financial leverage, and dividend distribution requirements. This complexity may cause trading in our stock to be relatively illiquid or may lead observers to misinterpret our results.
Market values for our mortgage assets and hedges can be volatile. For GAAP purposes, we mark-to-market our non-hedging derivative instruments through our GAAP consolidated income statement and we mark-to-market our mortgage securities—available-for-sale through our GAAP consolidated balance sheet through other comprehensive income unless the mortgage securities are in an unrealized loss position which has been deemed as an other-than-temporary impairment. An other-than-temporary impairment is recorded through the income statement in the period incurred. Additionally, we do not mark-to-market our loans held for sale as they are carried at lower of cost or market, as such, any change in market value would not be recorded through our income statement until the related loans are sold. If we sell an asset that has not been marked-to-market through our income statement at a reduced market price relative to its basis, our reported earnings will be reduced. A decrease in market value of our mortgage assets may or may not result in deterioration in future cash flows. As a result, changes in our GAAP consolidated income statement and balance sheet due to market value adjustments should be interpreted with care.
If we attempt to make any acquisitions, we will incur a variety of costs and may never realize the anticipated benefits.
In the past we have acquired businesses that we believe are a strategic fit with our business and expect to pursue additional acquisition opportunities in the future. The process of negotiating the acquisition and integrating an acquired business may result in operating difficulties and expenditures and may require significant management attention that would otherwise be available for ongoing development of our business. Moreover, we may never realize the anticipated benefits of any acquisitions. Future acquisitions could result in potentially dilutive issuances of equity securities, the incurrence of debt, contingent liabilities and/or amortization expenses related to goodwill and other intangible assets, which could harm our results of operations, financial condition and business prospects.
The inability to attract and retain qualified employees could significantly harm our business.
We depend on the diligence, skill and experience of our top executives, including our chief executive officer, our president and chief operating officer, and our chief investment officer. To the extent that one or more of our top executives are no longer employed by us, our operations and business prospects may be adversely affected. We also depend on our employees who structure our securitizations and who manage our portfolio of mortgage securities. To the extent that we lose the services of these employees, our ability to manage our portfolio business and our profitability will be adversely affected. Further, we rely on our wholesale account executives and retail loan officers to attract borrowers by, among other things, developing relationships with financial institutions, other mortgage companies and brokers, real estate agents, borrowers and others. The market for skilled account executives and loan officers is highly competitive and historically has experienced a high rate of turnover. Competition for qualified account executives and loan officers may lead to increased hiring and retention costs. If we are unable to attract or retain a sufficient number of skilled account executives at manageable costs, we will be unable to continue to originate quality mortgage loans that we are able to sell for a profit, which would harm our results of operations, financial condition and business prospects.
The success and growth of our business will depend upon our ability to adapt to and implement technological changes.
Our mortgage loan origination business is currently dependent upon our ability to effectively interface with our brokers, borrowers and other third parties and to efficiently process loan applications and closings. The origination process is becoming more dependent upon technological advancement, such as the ability to process applications over the Internet, accept electronic signatures and provide process status updates instantly and other customer-expected conveniences that are cost-efficient to our process. Becoming proficient with new technology will require significant financial and personnel resources. If we become reliant on any particular technology or technological solution, we may be harmed to the extent that such technology or technological solution (i) becomes non-compliant with existing industry standards, (ii) fails to meet or exceed the capabilities of our competitors’ equivalent technologies or technological solutions, (iii) becomes increasingly expensive to service, retain and update, or (iv) becomes subject to third-party claims of copyright or patent infringement. Any failure to acquire technologies or technological solutions when necessary could limit our ability to remain competitive in our industry and could also limit our ability to increase the cost-efficiencies of our operating model, which would harm our results of operations, financial condition and business prospects.
Our business could be adversely affected if we experienced an interruption in or breach of our communication or information systems or if we were unable to safeguard the security and privacy of the personal financial information we receive.
We rely heavily upon communications and information systems to conduct our business. Any material interruption, or breach in security, of our communication or information systems or the third-party systems on which we rely could cause underwriting or other delays and could result in fewer loan applications being received, slower processing of applications and reduced efficiency in loan servicing. Additionally, in connection with our loan file due diligence reviews, we have access to the personal financial information of the borrowers which is highly sensitive and confidential, and subject to significant federal and state regulation. If a third party were to misappropriate this information or if we inadvertently disclosed this information, we potentially could be subject to both private and public legal actions. Our policies and safeguards may not be sufficient to prevent the misappropriation or inadvertent disclosure of confidential information, may become noncompliant with existing federal or state laws or regulations governing privacy, or with those laws or regulations that may be adopted in the future.
We may enter into certain transactions at the REIT in the future that incur excess inclusion income that will increase the tax liability of our shareholders.
When we incur excess inclusion income at the REIT, it will be allocated among our shareholders. A shareholder’s share of excess inclusion income (i) would not be allowed to be offset by any net operating losses otherwise available to the shareholder, (ii) would be subject to tax as unrelated business taxable income in the hands of most types of shareholders that are otherwise generally exempt from federal income tax, and (iii) would result in the application of U.S. federal income tax withholding at the maximum rate (i.e., 30%), without reduction for any otherwise applicable income tax treaty, to the extent allocable to most types of foreign shareholders. How such income is to be reported to shareholders is not clear under current law. Tax-exempt investors, foreign investors, and taxpayers with net operating losses should carefully consider the tax consequences of having excess inclusion income allocated to them and are urged to consult their tax advisors.
Excess inclusion income would be generated if we issue debt obligations with two or more maturities and the terms of the payments on these obligations bear a relationship to the payments that we received on our mortgage loans or mortgage-backed securities securing those debt obligations. The structure of this type of CMO securitization generally gives rise to excess inclusion income. It is reasonably likely that we will structure some future CMO securitizations in this manner. Excess inclusion income could also result if we were to hold a residual interest in a REMIC. The amounts of excess inclusion income in any given year from these transactions could be significant.
Some provisions of our charter, bylaws and Maryland law may deter takeover attempts, which may limit the opportunity of our shareholders to sell their common stock at favorable prices.
Certain provisions of our charter, bylaws and Maryland law could discourage, delay or prevent transactions that involve an actual or threatened change in control, and may make it more difficult for a third party to acquire us, even if doing so may be beneficial to our shareholders by providing them with the opportunity to sell their shares possibly at a premium over the then market price. For example, our board of directors is divided into three classes with three year staggered terms of office. This makes it more difficult for a third party to gain control of our board because a majority of directors cannot be elected at a single meeting. Further, under our charter, generally a director may only be removed for cause and only by the affirmative vote of the holders of at least a majority of all classes of shares entitled to vote in the election for directors together as a single class. Our bylaws make it difficult for any person other than management to introduce business at a duly called meeting requiring such other person to follow certain advance notice procedures. Finally, Maryland law provides protection for Maryland corporations against unsolicited takeover situations. These provisions, as well as others, could discourage potential acquisition proposals, or delay or prevent a change in control and prevent changes in our management, even if such actions would be in the best interests of our shareholders.
Strategies undertaken to comply with REIT requirements under the Code may create volatility in future reported GAAP earnings.
Certain of the residual securities that historically have been held at the REIT generate interest income based on cash flows received from excess interest spread, prepayment penalties and derivatives (i.e., interest rate swap and cap contracts). The cash flows received from the derivatives do not represent qualified income for the REIT income tests requirements of the Code. The Code limits the amount of income from derivative income together with any income not generated from qualified REIT assets to no more than 25% of our gross income. In addition, under the Code, we must limit our aggregate income from derivatives (that are non-qualified tax hedges) and from other non-qualifying sources to no more than 5% of our annual gross income. Because of the magnitude of the derivative income projected for 2006 it was highly likely that we would not satisfy the REIT income tests. In order to resolve this REIT qualification issue, we isolated cash flows received from certain residual securities and created a separate security (the “CT Bonds”). We then contributed the CT Bonds from the REIT to our taxable REIT subsidiary. This transaction may add volatility to future reported GAAP earnings because both the interest only residual bonds (“IO Bonds”) and CT Bonds will be evaluated separately for impairment. Historically, the CT Bonds have acted as an economic hedge for the IO Bonds that are retained at the REIT, thus mitigating the impairment risk to the IO Bonds in a rising interest rate environment. As a result of transferring the CT Bonds to the TRS, the IO and CT Bonds will be valued separately creating the risk of earnings volatility resulting from other-than-temporary impairment charges. For example, in a rising rate environment, the IO bond will generally decrease in value while the CT Bond will increase in value. If the decrease in value of the IO Bond is deemed to be other than temporary in nature, we would record an impairment charge through the income statement for such decrease. At the same time, any increase in value of the CT Bond would be recorded in accumulated other comprehensive income.
Item 1B.Unresolved Staff Comments
None
Our executive, administrative and loan servicing offices are located in Kansas City, Missouri, and consist of approximately 200,000 square feet of leased office space. The lease agreements on the premises expire in January 2011. The current annual rent for these offices is approximately $4.2 million.
We lease office space for our mortgage lending operations in Lake Forest, California; Independence, Ohio; Richfield, Ohio; Troy, Michigan, Salt Lake City, Utah, Carmel, Indiana and Columbia, Maryland. Currently, these offices consist of approximately 316,444 square feet. The leases on the premises expire from December 2009 through May 2013, and the current annual rent is approximately $5.5 million. In addition the mortgage lending operations have mortgage production offices located in various states with premises lease terms expiring in a range of two months up to 3.5 years.
Since April 2004, a number of substantially similar class action lawsuits have been filed and consolidated into a single action in the Untied States District Court for the Western District of Missouri. The consolidated complaint names us and three of our executive officers as defendants and generally alleges that the defendants made public statements that were misleading for failing to disclose certain regulatory and licensing matters. The plaintiffs purport to have brought this consolidated action on behalf of all persons who purchased our common stock (and sellers of put options on our common stock) during the period October 29, 2003 through April 8, 2004. On January 14, 2005, we filed a motion to dismiss this action, and on May 12, 2005, the court denied such motion. On February 8, 2007, the court certified the case as a class action, and on February 20, 2007, we filed a motion to reconsider with the court. We believe that these claims are without merit and continue to vigorously defend against them.
In the wake of the securities class action, we have also been named as a nominal defendant in several derivative actions brought against certain of our officers and directors in Missouri and Maryland. The complaints in these actions generally claim that the defendants are liable to us for failing to monitor corporate affairs so as to ensure compliance with applicable state licensing and regulatory requirements.
In April 2005, three putative class actions filed against NHMI and certain of its affiliates were consolidated for pre-trial proceedings in the United States District Court for the Southern District of Georgia entitledIn Re NovaStar Home Mortgage, Inc. Mortgage Lending Practices Litigation. These cases contend that NHMI improperly shared settlement service fees with limited liability companies in which NHMI had an interest (the “LLCs”), in violation of the fee splitting and anti-referral provisions of the federal Real Estate Settlement Procedures Act (“RESPA”), and also allege certain violations of state law and civil conspiracy. Plaintiffs seek treble damages with respect to the RESPA claims, disgorgement of fees with respect to the state law claims as well as other damages, injunctive relief, and attorneys’ fees. In addition, two other related class actions have been filed in state courts.Miller v. NovaStar Financial, Inc., et al., was filed in October 2004 in the Circuit Court of Madison County, Illinois andJones et al. v. NovaStar Home Mortgage, Inc., et al., was filed in December 2004 in the Circuit Court for Baltimore City, Maryland. In theMiller case, plaintiffs allege a violation of the Illinois Consumer Fraud and Deceptive Practices Act and civil conspiracy and contend certain LLCs provided settlement services without the borrower’s knowledge. The plaintiffs in the Miller case seek a disgorgement of fees, other damages, injunctive relief and attorney’s fees on behalf of the class of plaintiffs. In theJones case, the plaintiffs allege the LLCs violated the Maryland Mortgage Lender Law by acting as lenders and/or brokers in Maryland without proper licenses and contend this arrangement amounted to a civil conspiracy. The plaintiffs in theJones case seek a disgorgement of fees and attorney’s fees. In January 2007, all of the plaintiffs and NHMI agreed upon a nationwide settlement. Since not all class members will elect to be part of the settlement, we estimated the probable obligation related to the settlement to be in a range of $3.9 million to $4.7 million. In accordance with SFAS No. 5, “Accounting for Contingencies”, we recorded a charge to earnings of $3.9 million in December of 2006. This amount is included in “Accounts payable and other liabilities” on our consolidated balance sheet and included in “Professional and outside services” on our consolidated statement of income.
In December 2005, a putative class action was filed against NMI in the United States District Court for the Western District of Washington entitledPierce et al. v. NovaStar Mortgage, Inc. Plaintiffs contend that NMI failed to disclose prior to closing that a broker payment would be made on their loans, which was an unfair and deceptive practice in violation of the Washington Consumer Protection Act. Plaintiffs seek excess interest charged, and treble damages as provided in the Washington Consumer Protection Act and attorney’s fees. On October 31, 2006, the district court granted plaintiffs’ motion to certify a Washington state class. NMI sought to appeal the grant of class certification; however, a panel of the Ninth Circuit Court of Appeals denied the request for interlocutory appeal so review of the class certification order must wait until after a final judgment is entered, if necessary. The case is set for trial on April 23, 2007. NMI believes that it has valid defenses to plaintiffs’ claims and it intends to vigorously defend against them.
In December 2005, a putative class action was filed against NHMI in the United States District Court for the Middle District of Louisiana entitledPearson v. NovaStar Home Mortgage, Inc. Plaintiff contends that NHMI violated the federal Fair Credit Reporting Act (“FCRA”) in connection with its use of pre-approved offers of credit. Plaintiff seeks (on his own behalf, as well as for others similarly situated) statutory damages, other nominal damages, punitive damages and attorney’s fees and costs. In January 2007, the named plaintiff and NHMI agreed to settle the lawsuit for a nominal amount.
In February, 2007, two putative class actions were filed in the United States District Court for the Western District of Missouri. The complaints name us and three of our executive officers as defendants and generally allege, among other things, that the defendants made materially false and misleading statements regarding our business and financial results. The plaintiffs purport to have brought the actions on behalf of all persons who purchased or otherwise acquired our common stock during the period May 4, 2006 through February 20, 2007. We believe that these claims are without merit and will vigorously defend against them.
In addition to those matters listed above, we are currently a party to various other legal proceedings and claims, including, but not limited to, breach of contract claims, class action or individual claims for violations of the RESPA, FLSA, federal and state laws prohibiting employment discrimination, federal and state laws prohibiting discrimination in lending and federal and state licensing and consumer protection laws.
While management, including internal counsel, currently believes that the ultimate outcome of all these proceedings and claims will not have a material adverse effect on our financial condition or results of operations, litigation is subject to inherent uncertainties. If an unfavorable ruling were to occur, there exists the possibility of a material adverse impact on our financial condition and results of operations.
Item 4.Submission of Matters to a Vote of Security Holders
None
Item 5.Market for Registrant’s Common Equity, Related Stockholder Matters and Issuer Purchases of Equity Securities
Market Price of and Dividends on the Registrant’s Common Equity and Related Stockholder Matters. Our common stock is traded on the NYSE under the symbol “NFI”. The following table sets forth, for the periods indicated, the high and low sales prices per share of common stock on the NYSE and the cash dividends paid or payable per share of common stock.
| Dividends | |||||||||||||
| High | Low | Date Declared | Date Paid | Amount Per Share | |||||||||
2005 | |||||||||||||
First Quarter | $ | 48.15 | $ | 32.40 | 5/2/05 | 5/27/05 | $ | 1.40 | |||||
Second Quarter | 39.98 | 34.50 | 7/29/05 | 8/26/05 | 1.40 | ||||||||
Third Quarter | 42.19 | 32.20 | 9/15/05 | 11/22/05 | 1.40 | ||||||||
Fourth Quarter | 33.01 | 26.20 | 12/14/05 | 1/13/06 | 1.40 | ||||||||
2006 | |||||||||||||
First Quarter | $ | 33.80 | $ | 25.70 | 5/4/06 | 5/26/06 | $ | 1.40 | |||||
Second Quarter | 37.63 | 29.08 | 8/3/06 | 8/28/06 | 1.40 | ||||||||
Third Quarter | 35.60 | 28.25 | 9/11/06 | 11/30/06 | 1.40 | ||||||||
Fourth Quarter | 32.81 | 26.32 | 9/11/06 | 12/29/06 | 1.40 | ||||||||
As of February 23, 2007, we had approximately 2,243 shareholders of record of our common stock, including holders who are nominees for an undetermined number of beneficial owners based upon a review of the securities position listing provided by our transfer agent.
As long as we remain a REIT, we intend to make distributions to shareholders of all or substantially all of taxable income in each year, subject to certain adjustments, so as to qualify for the tax benefits accorded to a REIT under the Code. All distributions will be made at the discretion of the Board of Directors and will depend on earnings, financial condition, maintenance of REIT status, cost of equity, investment opportunities and other factors as the Board of Directors may deem relevant. Our estimate of 2006 taxable income already distributed to shareholders in the form of dividends is $17 million which includes $1.7 million of preferred dividends paid on January 2, 2007. During 2007, we expect to payout all of our remaining 2006 taxable income, which we currently estimate to be approximately $170 million, in the form of dividends. During the period 2007 through 2011, we expect to recognize little, if any, taxable income as tax losses are realized on our current outstanding securitizations because of the reversal in timing differences between the recognition of GAAP income and taxable income. Further, we do not expect that our recent and future securitizations will result in significant taxable income in the early years due to steps we have taken over the last two years to structure our securitizations to minimize the difference between tax and GAAP income. This combination of our older securitizations maturing and the structuring of our recent and future securitizations will result in minimal taxable income over the next several years. This reduction in taxable income will correspondingly result in little, if any, common stock dividend distributions for those respective years, regardless of whether we remain a REIT. See “Industry Overview and Known Material Trends and Uncertainties” for further discussion regarding future uncertainties surrounding our taxable income.
Recent Sales of Unregistered Securities.
None
Purchase of Equity Securities by the Issuer.
Issuer Purchases of Equity Securities
(dollars in thousands)
Total Number of Shares Purchased | Average Price Paid per Share | Total Number of Shares Purchased as Part of Publicly Programs | Approximate Dollar Value of Shares | ||||||
October 1, 2006 – October 31, 2006 | — | — | — | $ | 1,020 | ||||
November 1, 2006 – November 30, 2006 | — | — | — | 1,020 | |||||
December 1, 2006 – December 31, 2006 | — | — | — | 1,020 | |||||
| (A) | A current report on Form 8-K was filed on October 2, 2000 announcing that the Board of Directors authorized the Company to repurchase its common shares, bringing the total authorization to $9 million. |
Item 6.Selected Financial Data
The following selected consolidated financial data is derived from our audited consolidated financial statements for the periods presented and should be read in conjunction with the consolidated financial statementsmore detailed information therein and “Management’s Discussion and Analysis of NovaStar Financial Inc.Condition and the notes theretoResults of Operations” included elsewhere in this annual report. Operating results are not necessarily indicative of future performance.
Safe Harbor Statement
“Safe Harbor” statement under the Private Securities Litigation Reform Act of 1995: Statements in this discussion regarding NovaStar Financial, Inc. and its business, which are not historical facts, are “forward-looking statements” that involve risks and uncertainties. Certain matters discussed in this report may constituteThis Annual Report on Form 10-K contains forward-looking statements within the meaning of Section 21E of the federal securities laws that inherently include certain risksSecurities Exchange Act of 1934, as amended, regarding management’s beliefs, estimates, projections, and uncertainties.assumptions with respect to, among other things, our future operations, business plans and strategies, as well as industry and market conditions, all of which are subject to change at any time without notice. Actual results and the time of certain eventsoperations for any future period may vary materially from those projected herein and from past results discussed herein. Some important factors that could cause actual results to differ materially from those projectedanticipated include: our ability to successfully integrate acquired businesses or assets with our existing business; our ability to generate sufficient liquidity on favorable terms; the size, frequency and structure of our securitizations; impairments on our mortgage assets; interest rate fluctuations on our assets that differ from our liabilities; increases in prepayment or contemplated bydefault rates on our mortgage assets; changes in assumptions regarding estimated loan losses and fair value amounts; our continued status as a REIT; changes in origination and resale pricing of mortgage loans; our compliance with applicable local, state and federal laws and regulations or opinions of counsel relating thereto and the forward-looking statements dueimpact of new local, state or federal legislation or regulations, or opinions of counsel relating thereto, or court decisions on our operations; the initiation of margin calls under our credit facilities; the ability of our servicing operations to a numbermaintain high performance standards and maintain appropriate ratings from rating agencies; our ability to expand origination volume while maintaining an acceptable level of factors, includingoverhead; our ability to adapt to and implement technological changes; the stability of residential property values; the outcome of litigation or regulatory actions pending against us or other legal contingencies; compliance with new accounting pronouncements; the impact of general economic conditions, fluctuationsconditions; and the risks that are from time to time included in interest rates, fluctuations in prepayment speeds, fluctuations in losses due to defaults on mortgage loans,our filings with the availability of nonconforming residential mortgage loans, the availabilitySecurities and access to financing and liquidity resources, and other risk factors previously outlined inExchange Commission (the “SEC”), including this annual reportAnnual Report on Form 10-K for the fiscal year ended December 31, 2004.10-K. Other factors not presently identified may also cause actual results to differ. Management continuously updatesWords such as “believe,” “expect,” “anticipate,” “promise,” “plan,” and revises these estimatesother expressions or words of similar meanings, as well as future or conditional verbs such as “will,” “would,” “should,” “could,” or “may” are generally intended to identify forward-looking statements. This document speaks only as of its date and assumptions based on actual conditions experienced. It is not practicablewe expressly disclaim any duty to publish all revisions and, as a result, no one should assume that results projected in or contemplated byupdate the forward-looking statements will continue to be accurate in the future.information herein.
Overview of PerformanceItem 1.Business
During 2004,We are a Maryland corporation formed on September 13, 1996 which operates as a specialty finance company that originates, purchases, securitizes, sells, invests in and services residential nonconforming loans and mortgage-backed securities. We offer a wide range of mortgage loan products to nonconforming borrowers, who generally do not satisfy the credit, collateral, documentation or other underwriting standards prescribed by conventional mortgage lenders and loan buyers, including United States of America government-sponsored entities such as Fannie Mae or Freddie Mac.
We have elected to be taxed as a real estate investment trust (“REIT”) under the Internal Revenue Code of 1986, as amended (the “Code”). For so long as we reportedmaintain our status as a REIT, we must meet numerous rules established by the Internal Revenue Service (“IRS”). In summary, these rules require us to:
Restrict investments to certain real estate related assets;
Avoid certain investment trading and hedging activities; and
Distribute virtually all REIT taxable income from continuing operations available to commonour shareholders.
As long as we maintain our REIT status, distributions to our shareholders of $113.2 million, or $4.40 per diluted share, as compared to $112.0 million, or $4.91 per diluted share in 2003. We also reported a loss from discontinued operations, net ofwill generally be deductible by us for income tax of $4.1 million, or $0.16 per diluted sharepurposes. This deduction effectively eliminates REIT level income taxes. Management believes that we have met the requirements to maintain our REIT status for 2006 and prior years. We are, however, currently evaluating whether it is in 2004. See further discussion of discontinued operations under the heading “Results of Operations.”shareholders’ best interests to retain our REIT status.
Our income from continuing operations available to common shareholders was driven largely by the income generated by our mortgage securities portfolio, which increased from $382.3 million as of December 31, 2003 to $489.2 million as of December 31, 2004. These securities are retained from securitizations of the mortgage loans we originate and purchase. We securitized $8.3 billion of mortgage loans in 2004 as compared to $5.3 billion in 2003. The increased volume of mortgage loans we securitized is directly attributable to the increase in our loan origination and purchase volume. During 2004 and 2003, we originated and purchased $8.4 billion and $5.3 billion, respectively, in nonconforming, residential mortgage loans. We increased our loan production through adding sales personnel primarily in new and underserved markets. Although we securitized approximately $3.0 billion more of nonconforming, residential mortgage loans in 2004 as compared to 2003, our income from continuing operations available to common shareholders increased only slightly by $1.2 million as a result of the decline in profit margins in our mortgage lending (banking) segment and the impairments on our mortgage securities available-for-sale within our mortgage portfolio segment.operate three core businesses:
Our profit margins withinMortgage portfolio management;
Mortgage lending; and
Loan servicing.
Segment information regarding these businesses for the mortgage lending (banking) segment were down as a result of the significant increase in short-term rates while the coupons on the mortgage loans we originated and purchased increased only slightly from 2003. One-month LIBOR and the two-year swap rate increased from 1.12% and 2.15%, respectively, at December 31, 2003 to 2.40% and 3.45%, respectively, at December 31, 2004 while the weighted average coupon on our nonconforming originations and purchases in 2004 was 7.6% as compared to 7.3% in 2003. These factors contributed to the whole loan price used in valuing our mortgage securities to significantly decrease in 2004, which is directly correlated to the decrease in gains on sales of mortgage loans as a percentage of the collateral securitized. For thethree years ended December 31, 2004 and 2003, the weighted average net whole loan price used2006 is included in the initial valuation ofNote 16 to our retained securities was 103.28 and 104.21, respectively, and the weighted average gain on securitization as a percentage of the collateral securitized was 1.7% and 2.6%, respectively.consolidated financial statements.
Mortgage Portfolio Management
We recognized impairments onoperate as a long-term mortgage securities and mortgage loan portfolio investor. Our portfolio of mortgage securities includes interest-only, prepayment penalty, and overcollateralization securities retained from our securitizations of nonconforming, single-family residential mortgage loans which we have accounted for as sales, under applicable accounting rules (collectively, the “residual securities”). Our portfolio of mortgage securities also includes subordinated mortgage securities retained from our securitizations and subordinated home equity loan asset-backed securities (“ABS”) purchased from other ABS issuers (collectively, the “subordinated securities”). We finance our investment in these mortgage securities by issuing asset-backed bonds (“ABB”), debt and capital stock and by entering into repurchase agreements. Our mortgage portfolio management operations generate earnings primarily from the interest income generated from our mortgage securities available-for-saleand mortgage loan portfolios.
In 2005 we began retaining various subordinate securities from our securitization transactions. In 2006, we began purchasing subordinated ABS of $15.9 millionother ABS issuers. We will continue to acquire, retain, and aggregate ABS with the intention of securing non-recourse long-term financing through collateralized debt obligation (“CDO”) securitizations. In the future, we may enter into derivative transactions referencing third party ABS, commonly referred to as “synthetic” assets. We also intend to retain the risk of the underlying securities by investing in 2004. The impairments were relatedthe equity and subordinated debt of CDO securitizations. CDO equity securities bear the first-loss and second-loss credit risk with respect to the significant increasesecurities owned by the securitization entity. Our goal is to leverage our extensive portfolio management experience by purchasing securities that are higher in the capital structure than our residual securities and executing CDOs for long-term non-recourse financing, thereby generating good risk-adjusted returns. We closed our first CDO securitization which was structured as a financing transaction on February 8, 2007, and we expect to continue to purchase securities that are higher in the capital structure and finance them with CDOs.
The long-term mortgage loan portfolio on our balance sheet consists of mortgage loans classified as held-in-portfolio resulting from securitization transactions treated as financings completed in the second and third quarters of 2006 (NHES Series 2006-1 and NHES Series 2006-MTA1). We have financed our investment in these loans by issuing ABB.
The credit performance and prepayment rates of the nonconforming loans underlying our securities, as well as the loans classified as held-in-portfolio, directly affects the profitability of this segment. In addition short-term interest rates during 2004 as well as higher than anticipated prepayments which resulted from substantial increases in housing prices in recent years. The impairments were primarily related to our 2004 mortgage securities. As discussed under the heading “Mortgage Securities Available-for-Sale” under “Critical Accounting Estimates,” to the extent that the cost basis of our mortgage securities exceeds the fair value and the unrealized loss is considered other than temporary, an impairment charge is recognized in earnings. Conversely, when the fair value of our mortgage securities exceeds the cost basis then the unrealized gain is recorded in accumulated other comprehensive income which ishave a component of the stockholders’ equity section of our consolidated balance sheet.
Summary of Operations and Key Performance MeasurementsMortgage Lending
Our net incomeThe mortgage lending operation is highly dependent uponsignificant to our financial results as it produces loans that ultimately collateralize the mortgage securities - available-for-sale portfolio, which is generated from the securitization of nonconforming loansthat we have originated and purchased. These mortgage securities represent the right to receive the net future cash flows from a pool of nonconforming loans. Generally speaking, the more nonconforminghold in our portfolio. The loans we originate and purchase the larger our securities portfolio and, therefore, the greater earnings potential. As a result, earnings are relatedsold, either in securitization transactions structured as sales or financing transactions, or are sold outright to the volume of nonconforming loans and related performance factors for those loans, including their average coupon, borrower default rate and borrower prepayment rate. Information regarding our lending volume is presented under the heading “Mortgage Loans.”
The primary function of our mortgage lending operations is to generate nonconforming loans, the majority of which will serve as collateral for our mortgage securities - available-for-sale. While our mortgage lending operations generate sizable revenues in the form of gains on sales of mortgage loans and fee income from borrowers and third party investors,parties. We finance the revenue serves largely to offset the related costs.
We also service the mortgage loans we originate and purchase and that serve as collateral forby using warehouse repurchase agreements on a short-term basis. For long-term financing, we securitize our mortgage securities - available-for-sale.loans and issue ABB.
Our mortgage lending operations generate earnings primarily from securitizing and selling loans for a premium. We also earn revenue from fees from loan originations and interest income on mortgage loans held-for-sale. The servicing function is critical totiming, size and structure of our securitization transactions have a significant impact on the management of credit risk (risk of borrower defaultgain on sale recognized and ultimately the related economic loss) within our mortgage portfolio. Again, while this operation generates significant fee revenue, its revenue serves largely to offset the costprofitability of this function.segment. In addition the market prices for whole loans and short-term interest rates have a significant impact on this segment’s profitability.
The key performance measures for management are:Our mortgage lending segment originates and purchases primarily nonconforming, single-family residential mortgage loans. Our mortgage lending operation continues to innovate in loan origination. Our lending decisions are driven by three primary objectives:
Originating loans that perform in line with expectations,
Maintaining economically sound pricing (profitable coupons), and
Controlling costs of origination.
In our nonconforming lending operations, we lend to individuals who generally do not qualify for agency/conventional lending programs because of a lack of available documentation, previous credit difficulties or higher loan-to-value (“LTV”) ratios. These types of borrowers are generally willing to pay higher mortgage loan origination fees and interest rates than those charged by conventional lenders. Because these borrowers typically use the proceeds of the mortgage loans to consolidate debt and to finance home improvements, education and other consumer needs, loan volume is generally less dependent on general levels of interest rates or home sales and therefore less cyclical than conventional mortgage lending.
Our nationwide loan origination network includes wholesale loan brokers, mortgage lenders, and correspondent institutions, all of which are independent of any of the NovaStar Financial entities, as well as our own direct to consumer operations. Our sales force, which includes account executives in 38 states, develops and maintains relationships with this network of independent retail brokers. Our correspondent origination channel consists of a network of institutions from which we purchase nonconforming mortgage loans originated and purchased
2006 in order to expand this origination channel.
Management’s discussionWe underwrite, process, fund and analysisservice the nonconforming mortgage loans sourced through our network of financial conditionwholesale loan brokers and results ofmortgage lenders and our direct to consumer operations along with other portions of this report, are designed to provide information regarding our performance and these key performance measures.in centralized facilities.
Known Material TrendsLoan Servicing
Management believes loan servicing remains a critical part of our business operation because maintaining contact with our borrowers is critical in managing credit risk and for borrower retention. Nonconforming borrowers are more prone to late payments and are more likely to default on their obligations than conventional borrowers. By servicing our loans, we strive to identify problems with borrowers early and take quick action to address problems. In addition, borrowers may be motivated to refinance their mortgage loans either by improving their personal credit or due to a decrease in interest rates. By keeping in close touch with borrowers, we can provide them with information about NovaStar Financial products to encourage them to refinance with us.
We retain the servicing rights with respect to the loans we securitize. Mortgage servicing yields fee income for us in the form of contractual fees approximating 0.50% of the outstanding balance of loans we service that have been securitized. In addition we receive fees paid by borrowers for normal customer service and processing fees. We also earn interest income on funds we hold as custodian as part of the servicing process.
Market in Which NovaStar Operates and Competes
Over the last ten years, the nonconforming lending market has grown from less than $50 billion annually to approximately $530$640 billion in 20042006 as estimated by the NationalInside Mortgage News.Finance Publications. A significant portion of thesenonconforming loans are made to borrowers who are using equity in their primary residence to consolidate low-balance, installment or consumer debt.debt, or take cash out for personal reasons. The nonconforming market has grown through a variety of interest rate environments. One of the main drivers of growth in this market has been the rise in housing prices which gives borrowers the opportunity to use the equity in their home to consolidate their high interest rate, short-term, non-tax deductible consumer or installment debt into lower interest rate, long-term, often tax deductible mortgage debt. Management estimates that NovaStar hasin 2006 we had a 1-2% market share. While management cannot predict consumer spending and borrowing habits, historical trends indicate thatshare of the market in which we operate is relatively stable and should continue to experience long term growth.nonconforming loan market.
We depend onface intense competition in the business of originating, purchasing, selling and securitizing mortgage loans. The number of market participants is believed to be well in excess of 100 companies who originate and purchase nonconforming loans. No single participant holds a dominant share of the lending market. We compete for borrowers with consumer finance companies, conventional mortgage bankers, commercial banks, credit unions, thrift institutions and other independent wholesale mortgage lenders. Competition among industry participants can take many forms, including convenience in obtaining a loan, amount and term of the loan, customer service, marketing/distribution channels, loan origination fees and interest rates. To the extent any competitor significantly expands their activities in the nonconforming and subprime market, we could be adversely affected.
Our principal competition in the business of holding mortgage loans and mortgage securities are life insurance companies, institutional investors such as mutual funds and pension funds, other well-capitalized, publicly-owned mortgage lenders and certain other mortgage acquisition companies structured as REITs. Many of these competitors are substantially larger than we are and have considerably greater financial resources than we do.
One of our key competitive strengths is our employees and the level of service they are able to provide our borrowers. We service our nonconforming loans and, in doing so, we are able to stay in close contact with our borrowers and identify potential problems early.
We also believe we compete successfully due to our:
experienced management team;
use of technology to enhance customer service and reduce operating costs;
freedom from depository institution regulation;
vertical integration – we broker and/or originate, purchase, fund, service and manage mortgage loans;
access to capital markets to financesecuritize our assets.
Risk Management
Management recognizes the following primary risks associated with the business and industry in which it operates.
Interest Rate/Market
Liquidity/Funding
Credit
Prepayment
Regulatory
Interest Rate/Market Risk. Our investment policy goals are to maintain the net interest margin between our assets and liabilities and to diminish the effect of changes in interest rate levels on the market value of our assets.
Interest Rate Risk. When interest rates on our assets do not adjust at the same time or in the same amounts as the interest rates on our liabilities or when the assets have fixed rates and the liabilities have adjustable rates, future earnings potential is affected. We express this interest rate risk as the risk that the market value of our assets will increase or decrease at different rates than that of our liabilities. Expressed another way, this is the risk that our net asset value will experience an adverse change when interest rates change. We assess the risk based on the change in market values given increases and decreases in interest rates.
The interest rates under our primary financing sources reset frequently. As of December 31, 2006, rates on a majority of our borrowings adjust daily or monthly off London Inter-Bank Offered Rate (“LIBOR”). On the other hand, very few of the mortgage assets we own adjust on a monthly or daily basis. Most of the mortgage loans have rates that are fixed for some period of time ranging from 2 to 30 years. For example, one of our loan products is the “2/28” loan. This loan is fixed for its first two years and then adjusts every six months thereafter.
While short-term borrowing rates are low and long-term asset rates are high, this portfolio structure produces good results. However, if short-term interest rates rise rapidly, earning potential would be significantly affected and impairments may be incurred, as the asset rate resets would lag the borrowing rate resets.
We transfer interest rate agreements at the time of securitization into the securitization trusts to protect the third-party bondholders from interest rate risk and to decrease the volatility of future cash flows related to the securitized mortgage loans. We enter into these interest rate agreements as we originate and purchase.purchase mortgage loans in our mortgage lending segment. At the time of a securitization structured as a sale, we transfer interest rate agreements into the securitization trusts and they are removed from our balance sheet. The trust assumes the obligation to make payments and obtains the right to receive payments under these agreements. Generally, net settlement obligations paid by the trust for these interest rate agreements reduce the excess interest cash flows to our residual securities. Net settlement receipts from these interest rate agreements are either used to cover interest shortfalls on the third-party primary bonds we issueor to provide credit enhancement with any remaining funds then flowing to our residual securities. For securitizations structured as financings the derivatives will remain on our balance sheet. Generally, these interest rate agreements do not meet the hedging criteria set forth in our loan securitizations are sold to large, institutional investors andaccounting principles generally accepted in the United States of America government-sponsored enterprises.(“GAAP”) while they are on our balance sheet; therefore, we are required to record their change in value as a component of earnings even though they may reduce our interest rate risk. In times when short-term rates rise or drop significantly, the value of our agreements will increase or decrease, respectively. Occasionally, we enter into interest rate agreements that do meet the hedging criteria set forth in GAAP. In these instances, we record their change in value, if effective, directly to other comprehensive income on our statement of shareholder’s equity.
Interest Rate Sensitivity Analysis.We model financial information in a variety of interest rate scenarios to assess interest rate sensitivity as an indication of exposure to interest rate risk. Using these models, the fair value and interest rate sensitivity of each financial instrument, or groups of similar instruments, is estimated, and then aggregated to form a comprehensive picture of the risk characteristics of the balance sheet. The risks are analyzed on a market value basis.
The following table summarizes management’s estimates of the changes in market value of our mortgage assets and interest rate agreements assuming interest rates were 100 and 200 basis points, or one and two percent higher or lower. The cumulative change in market value represents the change in market value of mortgage assets, net of the change in market value of interest rate agreements. The change in market value of the liabilities on our balance sheet due to a change in interest rates is insignificant since a majority of our short-term borrowings and ABB are adjustable rate; however, as noted above, rapid increases in short-term interest rates would negatively impact the interest-rate spread between our liabilities and assets and, consequently, our earnings.
Interest Rate Sensitivity - Market Value
(dollars in thousands)
| Basis Point Increase (Decrease) in Interest Rates (A) | ||||||||||||||||
| (200) | (100) | 100 | 200 | |||||||||||||
As of December 31, 2006: | ||||||||||||||||
Change in market values of: | ||||||||||||||||
Assets – non trading (B) | $ | 226,262 | $ | 105,038 | $ | (78,698 | ) | $ | (150,481 | ) | ||||||
Assets – trading (C) | 9,999 | 7,080 | (14,120 | ) | (30,707 | ) | ||||||||||
Interest rate agreements | (40,018 | ) | (20,946 | ) | 23,998 | 49,264 | ||||||||||
Cumulative change in market value | $ | 196,243 | $ | 91,172 | $ | (68,820 | ) | $ | (131,924 | ) | ||||||
Percent change of market value portfolio equity (D) | 34.0 | % | 15.8 | % | (11.9 | %) | (22.9 | %) | ||||||||
As of December 31, 2005: | ||||||||||||||||
Change in market values of: | ||||||||||||||||
Assets – non trading (B) | $ | 95,322 | $ | 41,344 | $ | (41,417 | ) | $ | (84,971 | ) | ||||||
Assets – trading (C) | 1,134 | 983 | (2,837 | ) | (7,512 | ) | ||||||||||
Interest rate agreements | (33,502 | ) | (17,365 | ) | 20,072 | 41,616 | ||||||||||
Cumulative change in market value | $ | 62,954 | $ | 24,962 | $ | (24,182 | ) | $ | (50,867 | ) | ||||||
Percent change of market value portfolio equity (D) | 11.0 | % | 4.4 | % | (4.2 | %) | (8.9 | %) | ||||||||
| (A) | Change in market value of assets or interest rate agreements in a parallel shift in the yield curve, up and down 1% and 2%. |
| (B) | Includes mortgage loans held-for-sale, mortgage loans held-in-portfolio, mortgage securities—available-for-sale and mortgage servicing rights. |
| (C) | Consists of mortgage securities – trading. |
| (D) | Total change in estimated market value as a percent of market value portfolio equity as of December 31. |
Hedging.We use derivative instruments to mitigate the risk of our cost of funding increasing at a faster rate than the interest on the loans. We adhere to an interest rate risk management program that is approved by our Board. This program is formulated with the intent to offset the potential adverse effects resulting from rate adjustment limitations on mortgage assets and the differences between interest rate adjustment indices and interest rate adjustment periods of adjustable-rate mortgage loans and related borrowings.
We use interest rate cap and swap contracts to mitigate the risk of the financing expense of variable rate liabilities increasing at a faster rate than the income produced on assets during a period of rising rates. Management intends generally to hedge as much of the interest rate risk as determined to be in our best interest, given the cost and risk of hedging transactions and the limitations on our ability to hedge imposed on us by REIT tax requirements.
We seek to build a balance sheet and undertake an interest rate risk management program that is likely, in management’s view, to enable us to maintain an equity marketplace provides capitalliquidation value sufficient to operate our business. The trend has been favorablemaintain operations given a variety of potentially adverse circumstances. Accordingly, the hedging program addresses both income preservation, as discussed in the first part of this section, and capital markets forpreservation concerns.
Interest rate cap and swap agreements are legal contracts between us and a third-party firm or “counterparty”. Under an interest rate cap agreement the typescounterparty agrees to make payments to us in the future should the one-month LIBOR interest rate rise above the strike rate specified in the contract. We make either quarterly or monthly premium payments or have chosen to pay the premiums at the beginning to the counterparties under contract. Each contract has either a fixed or amortizing notional face amount on which the interest is computed, and a set term to maturity. When the referenced LIBOR interest rate rises above the contractual strike rate, we earn cap income. Under interest rate swap agreements we pay a fixed rate of securitization transactionsinterest while receiving a rate that adjusts with one-month LIBOR.
The following table summarizes the key contractual terms associated with interest rate risk management contracts on our balance sheet as of December 31, 2006. All of our pay-fixed swap contracts and interest rate cap contracts are indexed to one-month LIBOR.
We have determined the following estimated net fair value amounts by using available market information and valuation methodologies we execute. Investor appetite for the bonds created has been strong. Additionally, commercial and investment banks have provideddeem appropriate as of December 31, 2006.
Interest Rate Risk Management Contracts
(dollars in thousands)
| Net Fair Value | Total Notional Amount | Maturity Range | |||||||||||||||||||||||||
| 2007 | 2008 | 2009 | 2010 | 2011 | |||||||||||||||||||||||
Pay-fixed swaps: | |||||||||||||||||||||||||||
Contractual maturity | $ | 6,527 | $ | 1,575,000 | $ | 490,000 | $ | 720,000 | $ | 365,000 | $ | — | $ | — | |||||||||||||
Weighted average pay rate | 4.9 | % | 4.7 | % | 5.0 | % | 4.9 | % | — | — | |||||||||||||||||
Weighted average receive rate | 5.4 | % | (A | ) | (A | ) | (A | ) | — | — | |||||||||||||||||
Interest rate caps: | |||||||||||||||||||||||||||
Contractual maturity | $ | 4,634 | $ | 610,000 | $ | 80,000 | $ | 285,000 | $ | 195,000 | $ | 40,000 | $ | 10,000 | |||||||||||||
Weighted average strike rate | 5.0 | % | 4.9 | % | 4.9 | % | 5.0 | % | 5.2 | % | 5.4 | % | |||||||||||||||
| (A) | The pay-fixed swaps receive rate is indexed to one-month LIBOR. |
We had no interest rate agreements with contractual maturities beyond 2011 as of December 31, 2006.
Liquidity/Funding Risk.A significant liquidityrisk to finance our mortgage lending operations throughis the risk that we will not have financing facilities and cash available to fund and hold loans prior to their sale or securitization, to fund required repurchase requests and margin calls or that we may not be able to securitize our loans or securities upon favorable terms. On a short-term basis, we finance mortgage loans using warehouse repurchase facilities. While management cannot predict the futureagreements that we maintain with large banking and investment institutions. In addition, we have access to facilities secured by our mortgage securities and servicing advance receivables. For long-term financing, we depend on securitizations and CDOs. Other matters also impact our liquidity environment, we are unaware of any material reason that would disrupt continued liquidity support in the capital markets for our business.and funding risk. See the “Liquidity and Capital Resources” section of “Management’s Discussion and Analysis of Financial Condition and Results of Operations” for further discussion of liquidity risks and resources available to us.
WithinCredit Risk. Credit risk is the risk that we will not fully collect the principal we have invested in mortgage loans or the amount we have invested in securities. Nonconforming mortgage loans comprise substantially our entire mortgage loan portfolio and serve as collateral for our mortgage securities. Nonconforming borrowers include individuals who do not qualify for agency/conventional lending programs because of a lack of conventional documentation or previous credit difficulties but have considerable equity in their homes. Often, they are individuals or families who have built up high-rate consumer debt and are attempting to use the equity in their home to consolidate debt and reduce the amount of money it takes to service their monthly debt obligations. Our underwriting guidelines are intended to evaluate the credit history of the potential borrower, the capacity and willingness of the borrower to repay the loan, and the adequacy of the collateral securing the loan.
Our underwriting staff works under the credit policies established by our Credit Committee. Underwriters are given approval authority only after their work has been reviewed for a period of time. Thereafter, the Chief Credit Officer re-evaluates the authority levels of all underwriting personnel on an ongoing basis. All loans in excess of $350,000 currently require the approval of an underwriting supervisor. Our Chief Credit Officer or our President must approve loans in excess of $1,000,000.
Our underwriting guidelines take into consideration the number of times the potential borrower has recently been late on a mortgage payment and whether that payment was 30, 60 or 90 days past two years,due. Factors such as FICO score, bankruptcy and foreclosure filings, debt-to-income ratio, and loan-to-value ratio are also considered. The credit grade that is assigned to the borrower is a reflection of the borrower’s historical credit. Maximum loan-to-value ratios for each credit grade depend on the level of income documentation provided by the potential borrower. In some instances, when the borrower exhibits strong compensating factors, exceptions to the underwriting guidelines may be approved.
In 2006, we saw the performance of our 2006 vintage production drop to unacceptable levels. We believe this performance is related to a few key fundamentals such as:
Downturn in the housing market
Underwriting guidelines that worked in a stronger housing market were no longer effective in the weaker 2006 market
Tolerance levels previously allowed for appraisals were no longer effective in the weaker 2006 market
Going forward, the key area of focus for our credit management function is to ensure that the 2007 vintage performs better than 2006 and in line with our expectations. In this regard, we have taken several steps which include:
Tightening of underwriting guidelines
Enhancing our appraisal review process
Identifying loans with unacceptable levels of risk.
Other strategies we use for managing credit risk are to diversify the markets in which we originate, purchase and own mortgage loans and the purchase of mortgage insurance. We have purchased mortgage insurance on a majority of the loans that are held in our portfolio – on the balance sheet and those that serve as collateral for our mortgage securities. The use of mortgage insurance is discussed under “Premiums for Mortgage Loan Insurance” in “Management’s Discussion and Analysis of Financial Condition and Results of Operations”. Details regarding loans charged off are disclosed in Note 2 to our consolidated financial statements.
Prepayment Risk.Generally speaking, when market interest rates decline, borrowers are more likely to refinance their mortgages. The higher the interest rate a borrower currently has on his or her mortgage the more incentive he or she has to refinance the mortgage REIT industry has seenwhen rates decline. In addition, the incentive to refinance increases when credit ratings improve. When home values rise, loan-to-value ratios drop, making it more likely that a significant increaseborrower will do a “cash-out” refinance. Each of these factors increases the chance for higher prepayment speeds.
The majority of our mortgage securities available-for-sale portfolio consists of securities which are “interest-only” in nature. These securities represent the net cash flow – interest income – on the underlying loans in excess of the cost to finance the loans. When borrowers repay the principal on their mortgage loans early, the effect is to shorten the period over which interest is earned, and therefore, reduce the cash flow and yield on our securities.
We mitigate prepayment risk by originating and purchasing loans that include a penalty if the borrower repays the loan in the desireearly months of the loan’s life. A majority of our loans have a prepayment penalty up to but no greater than 80% of six months interest on the principal balance that is being repaid. As of December 31, 2006, 60% of the loans which serve as collateral for raising public capital. Additionally, thereour mortgage securities had a prepayment penalty. As of December 31, 2006, 60% of our mortgage loans on our balance sheet had a prepayment penalty. During 2006, 62% of the loans we originated and purchased had prepayment penalties.
Regulatory Risk.As a mortgage lender, we are subject to many laws and regulations. Any failure to comply with these rules and their interpretations or with any future interpretations or judicial decisions could harm our profitability or cause a change in the way we do business. For example, several lawsuits have been several new entrantsfiled challenging types of payments made by mortgage lenders to the mortgage REIT business and other mortgage lender conversions (or proposed conversions) to REIT status. This increased activity may impact the pricing and underwriting guidelines within the nonconforming marketplace.brokers.
State and local governing bodies are focused on the nonconforming lending business and any excessive feesare concerned about borrowers incurpaying “excessive fees” in obtaining a mortgage loan – generally termed “predatory lending” within the mortgage industry.. In several instances, states or local governing bodies have imposed strict laws on lenders to curb predatory lending. To date, these laws have not had a significant impact on our business. We have capped fee structures consistent with those adopted by federal mortgage agencies and have implemented rigid processes to ensure that our lending practices are not predatory in nature.
We regularly monitor the laws, rules and regulations that apply to our business and analyze any changes to them. We integrate many legal and regulatory requirements into our automated loan origination system to reduce inadvertent non-compliance due to human error. We also maintain policies and procedures, summaries and checklists to help our origination personnel comply with these laws. Our training programs are designed to teach our personnel about the significant laws, rules and regulations that affect their job responsibilities.
U.S. Federal Income Tax Consequences
The following general discussion summarizes the material U.S. federal income tax considerations regarding our qualification and taxation as a REIT. This discussion is based on interpretations of the Code, regulations issued thereunder, and rulings and decisions currently in effect (or in some cases proposed), all of which are subject to change. Any such change may be applied retroactively and may adversely affect the federal income tax consequences described herein. This summary does not discuss all of the tax consequences that may be relevant to particular shareholders or shareholders subject to special treatment under the federal income tax laws. Accordingly, you should consult your own tax advisor regarding the federal, state, local, foreign, and other tax consequences of your ownership of our common stock and our REIT status and any termination of our REIT status, and regarding potential changes in applicable tax laws.
General.Since inception, we have elected to be taxed as a REIT under Sections 856 through 859 of the Code. We believe we have complied, and intend to comply in the future for so long as we remain a REIT, with the requirements for qualification as a REIT under the Code. To the extent that we qualify as a REIT for federal income tax purposes, we generally will not be subject to federal income tax on the amount of income or gain that is distributed to shareholders. However, origination and broker operations are conducted through NovaStar Mortgage, which is owned by NFI Holding Corporation, Inc. – a taxable REIT subsidiary (“TRS”). Consequently, all of the taxable income of NFI Holding Corporation, Inc. is subject to federal and state corporate income taxes. In general, a TRS may hold assets that a REIT cannot hold directly and generally may engage in any real estate or non-real estate related business. However, special rules do apply to certain activities between a REIT and its TRS. For example, a TRS will be subject to earnings stripping limitations on the deductibility of interest paid to its REIT. In addition, a REIT will be subject to a 100% excise tax on certain excess amounts to ensure that (i) amounts paid to a TRS for services are based on amounts that would be charged in an arm’s-length transaction, (ii) fees paid to a REIT by its TRS are reflected at fair market value and (iii) interest paid by a TRS to its REIT is commercially reasonable.
The REIT rules generally require that a REIT invest primarily in real estate related assets, that its activities be passive rather than active and that it distribute annually to its shareholders substantially all of its taxable income. We could be subject to a number of taxes if we failed to satisfy those rules or if we acquired certain types of income-producing real property through foreclosure. Although no complete assurance can be given, we do not expect that we will be subject to material amounts of such taxes.
Failure to satisfy certain Code requirements could cause loss of REIT status. If we fail to qualify, or elect to terminate our status, as a REIT for any taxable year, we would be subject to federal income tax (including any applicable minimum tax) at regular corporate rates and would not receive deductions for dividends paid to shareholders. As a result, the amount of after-tax earnings available for distribution to shareholders would decrease substantially.
Qualification as a REIT. Qualification as a REIT requires that we satisfy a variety of tests relating to income, assets, distributions and ownership so long as we remain a REIT. The significant tests are summarized below.
Sources of Income.To qualify as a REIT, we must satisfy two gross income requirements, each of which is applied on an annual basis. First, at least 75% of our gross income, excluding gross income from prohibited transactions, for each taxable year generally must be derived directly or indirectly from:
rents from real property;
interest on debt secured by mortgages on real property or on interests in real property;
dividends or other distributions on, and gain from the sale of, stock in other REITs;
gain from the sale of real property or mortgage loans;
amounts, such as commitment fees, received in consideration for entering into an agreement to make a loan secured by real property, unless such amounts are determined by income and profits;
income derived from a Real Estate Mortgage Investment Conduit (“REMIC”) in proportion to the real estate assets held by the REMIC, unless at least 95% of the REMIC’s assets are real estate assets, in which case all of the income derived from the REMIC; and
interest or dividend income from investments in stock or debt instruments attributable to the temporary investment of new capital during the one-year period following our receipt of new capital that we raise through equity offerings or public offerings of debt obligations with at least a five-year term.
Second, at least 95% of our gross income, excluding gross income from prohibited transactions, for each taxable year must be derived from sources that qualify for purposes of the 75% gross income test, and from (i) dividends, (ii) interest, (iii) certain qualifying hedges entered into prior to January 1, 2005 and (iv) gain from the sale or other disposition of stock, securities, or, certain qualifying hedges entered into prior to January 1, 2005.
Management believes that we were in compliance with both of the income tests for the 2006 and 2005 calendar years.
Nature and Diversification of Assets. As of the last day of each calendar quarter, we must meet six requirements under the two asset tests. Under the 75% of assets test, at least 75% of the value of our total assets must represent cash or cash items (including receivables), government securities or real estate assets. Under the 25% of assets test, no more than 25% of the value of our total assets can be represented by securities, other than (A) government securities, (B) stock of a qualified REIT subsidiary and (C) securities that qualify as real estate assets under the 75% assets test ((A), (B) and (C) are collectively the “75% Securities”). Additionally, under the 25% assets test, no more than 20% of the value of our total assets can be represented by securities of one or more taxable REIT subsidiaries and no more than 5% of the value of our total assets can be represented by the securities of a single issuer, excluding 75% Securities. Furthermore, we may not own more than 10% of the total voting power or the total value of the outstanding securities of any one issuer, excluding 75% Securities.
If we inadvertently fail to satisfy one or more of the asset tests at the end of a calendar quarter, such failure would not cause us to lose our REIT status. We could still avoid disqualification by eliminating any discrepancy within 30 days after the close of the calendar quarter in which the discrepancy arose. Management believes that we were in compliance with all of the requirements of both asset tests for all quarters during 2006 and 2005.
Ownership of Common Stock. Our capital stock must be held by a minimum of 100 persons for at least 335 days of each year. In addition, at all times during the second half of each taxable year, no more than 50% in value of our capital stock may be owned directly or indirectly by 5 or fewer individuals. We use the calendar year as our taxable year for income tax purposes. The Code requires us to send annual information questionnaires to specified shareholders in order to assure compliance with the ownership tests. Management believes that we have complied with these stock ownership tests for 2006 and 2005.
Distributions.To maintain REIT status, we must distribute at least 90% of our taxable income and any after-tax net income from certain types of foreclosure property less any non-cash income. No distributions are required in periods in which there is no taxable income. Management believes that we have complied with these distribution requirements for 2005 and intends to comply with these requirements with respect to 2006 taxable income.
Taxable Income. We use the calendar year for both tax and financial reporting purposes. However, taxable income may, and in our case does, differ from income computed in accordance with GAAP. These differences primarily arise from timing and character differences in the recognition of revenue and expense and gains and losses for tax and GAAP purposes. Additionally, taxable income that is subject to the distribution requirement does not include the taxable income of our TRS, although the subsidiary’s operating results are included in our GAAP results.
Personnel
As of December 31, 2006, we employed 2,048 people. Management believes that relations with its employees are good. None of our employees are represented by a union or covered by a collective bargaining agreement.
Available Information
Copies of our annual report on Form 10-K, quarterly reports on Form 10-Q, current reports on Form 8-K and any amendments to these reports filed or furnished with the SEC are available free of charge through our Internet site (www.novastarmortgage.com) as soon as reasonably practicable after filing with the SEC. References to our website do not incorporate by reference the information on such website into this Annual Report on Form 10-K and we disclaim any such incorporation by reference. Copies of our board committee charters, our board’s Corporate Governance Guidelines, Code of Conduct, and other corporate governance information are available at the Corporate Governance section of our Internet site (www.novastarmortgage.com), or by contacting us directly. Our investor relations contact information follows.
Investor Relations
8140 Ward Parkway, Suite 300
Kansas City, MO 64114
816.237.7424
Email: ir@novastar1.com
Risk Factors
You should carefully consider the risks described below before investing in our publicly traded securities. The risks described below are not the only ones facing us. Our business is also subject to the risks that affect many other companies, such as competition, inflation, technological obsolescence, labor relations, general economic conditions and geopolitical events. Additional risks not currently known to us or that we currently believe are immaterial also may impair our business, operations and our liquidity.
Risks Related to Securitization, Loan Sale, and Borrowing Activities
Our growth is dependent on leverage, which may create other risks.
Our success is dependent, in part, upon our ability to grow our assets through the use of leverage. Leverage creates an opportunity for increased net income, but at the same time creates risks. For example, while we will incur leverage only when there is an expectation that it will enhance returns, leveraging magnifies both positive and negative changes in our net worth. In addition, there can be no assurance that we will be able to meet our debt service obligations and, to the extent that we cannot, our financial condition and our ability to meet minimum REIT dividend requirements will be materially and adversely affected. Furthermore, if we were to liquidate, our debt holders and lenders will receive a distribution of our available assets before any distributions are made to our common shareholders.
An interruption or reduction in the securitization market or our ability to access this market would harm our financial position.
We are dependent on the securitization market for long-term financing of our origination and purchase of mortgage loans and mortgage securities, which we initially finance with our short-term financing. In addition, many of the buyers of our whole loans purchase the loans with the intention of securitizing them. A disruption in the securitization market could prevent us from being able to sell loans or mortgage securities at a favorable price or at all. Factors that could disrupt the securitization market include an international liquidity crisis such as occurred in the fall of 1998, sudden changes in interest rates, changes in the non-conforming loan market, a terrorist attack, an outbreak of war or other significant event risk, and market specific events such as a default under a comparable type of securitization. Further, poor performance of our previously securitized loans could harm our access to the securitization market.
In addition, a court recently found a lender and securitization underwriter liable for consumer fraud committed by a company to whom they provided financing and underwriting services. In the event other courts or regulators adopted the same liability theory, lenders and underwriters could be named as defendants in more litigation and as a result they may exit the business or charge more for their services, all of which could have a negative impact on our ability to securitize our mortgage loans and mortgage securities and the securitization market in general.
A decline in our ability to obtain long-term funding for our mortgage loans or mortgage securities in the securitization market in general or on attractive terms or a decline in the market’s demand for our mortgage loans or mortgage securities could harm our results of operations, financial condition and business prospects and could result in defaults under our short term financing arrangements for these assets.
We may not be able to continue to sell our mortgage loans on terms and conditions that are profitable to us.
A portion of our revenues comes from the gains on sale generated by sales of pools of our mortgage loans as whole loans. We make whole loan sales to a limited number of institutional purchasers, some of which may be frequent, repeat purchasers, and others of which may make only one or a few purchases from us. We cannot assure you that we will continue to have purchasers for our loans on terms and conditions that will be profitable to us. Also, even though our mortgage loans are generally marketable to multiple purchasers, certain loans may be marketable to only one or a few purchasers, thereby increasing the risk that we may be unable to sell such loans at a profit.
Failure to renew or obtain adequate funding under warehouse repurchase agreements may harm our business.
We are dependent upon several warehouse repurchase agreements to provide short term financing for our origination and purchase of mortgage loans pending their sale or securitization. In addition, we utilize warehouse repurchase agreements for short and medium term financing for our purchase and retention of mortgage securities. Under a warehouse repurchase agreement, we sell an asset and agree to repurchase the same asset at some point in time in the future. Generally, the repurchase agreements we enter into require monthly roll-over repurchase transactions, with a six- to nine-month maximum financing period for mortgage loans and a three-year maximum financing period for securities retained from our mortgage loan securitizations. For financial accounting purposes, these arrangements are treated as secured financings. We retain the assets on our balance sheet and record an obligation to repurchase the assets. The amount we may borrow under these arrangements is generally 95% to 100% of the asset market value with respect to performing mortgage loans and 70% to 80% of the asset market value with respect to nonperforming mortgage loans. Additionally, the amount we may borrow under these arrangements is generally 40% to 95% of the asset market value with respect to mortgage securities depending on the investment rating.
These warehouse repurchase agreements contain numerous representations, warranties and covenants, including requirements to maintain a certain minimum net worth, to maintain minimum equity ratios, to maintain our REIT status, and other customary debt covenants. Events of default under these facilities include material breaches of representations and warranties, failure to comply with covenants, material adverse effects upon or changes in our business, assets, or financial condition, and other customary matters. Events of default under certain of our facilities also include termination of our status as servicer with respect to certain securitized loan pools and failure to maintain profitability over consecutive quarters. If we were unable to make the necessary representations and warranties at the time we need financing, we would not be able to obtain needed funds. In addition, if we default under any warehouse repurchase agreement under which borrowings are then outstanding, the lenders under substantially all of our existing warehouse repurchase agreements could demand immediate payment of all outstanding amounts pursuant to cross-default provisions. Any failure to renew or obtain adequate funding under these financing arrangements for any reason, or any demand by warehouse lenders for immediate payment of outstanding balances, could harm our lending and loan purchase operations and have a material adverse effect on our results of operations, financial condition and business prospects. In addition, an increase in the cost of warehouse financing in excess of any change in the income derived from our mortgage assets could also harm our earnings and reduce the cash available for distribution to our shareholders. In October 1998, the subprime mortgage loan market faced a liquidity crisis with respect to the availability of short-term borrowings from major lenders and long-term borrowings through securitization. At that time, we faced significant liquidity constraints which harmed our business and our profitability. There is no assurance that a comparable situation will not occur in the future.
A decline in the market value of mortgage assets financed under our warehouse finance arrangements may result in margin calls or similar obligations, which may require that we liquidate assets at a disadvantageous time.
When, in a lender’s opinion, the market value of assets subject to a warehouse repurchase agreement decreases for any reason, including a rise in interest rates or general concern about the value or liquidity of the assets, we are required to repay the margin or difference in market value, or post additional collateral. If cash or additional collateral is unavailable to meet margin calls, we may default on our obligations under the applicable repurchase agreement, which would cross-default substantially all of our warehouse repurchase agreements. In that event, our lenders would have the right to liquidate the collateral we provided them to settle the amount due from us and, in general, the right to recover any deficiency from us.
In addition, we utilize warehouse financing arrangements for the accumulation of third-party mortgage-backed securities and related credit default derivatives for purposes of CDO offerings. Under these arrangements, the financing party has the right to liquidate any assets that decline in credit quality or fail to continue to meet eligibility requirements, and the right to liquidate the entire pool of financed assets if the related CDO offering does not occur by a specified date. If a liquidation results in a net loss, we are required to pay to the financing party the amount of the net loss.
In order to obtain cash to satisfy a margin call or a net loss payment obligation, we may be required to liquidate assets at a disadvantageous time, which could cause us to incur further losses and adversely affect our results of operations and financial condition. In addition, an unplanned liquidation of assets could change our mix of investments, which in turn could jeopardize our REIT status or our ability to rely on certain exemptions under the Investment Company Act of 1940, as amended (the “Investment Company Act”).
We may be required to repurchase mortgage loans or indemnify mortgage loan purchasers as a result of breaches of representations and warranties, borrower fraud, or certain borrower defaults, which could harm our liquidity, results of operations and financial condition.
When we sell mortgage loans, whether as whole loans or pursuant to a securitization, we are required to make customary representations and warranties to the purchaser about the mortgage loans and the manner in which they were originated. Our whole loan sale agreements require us to repurchase or substitute mortgage loans in the event we breach any of these representations or warranties. In addition, we may be required to repurchase mortgage loans as a result of borrower fraud or in the event of early payment default on a mortgage loan. Likewise, we are required to repurchase or substitute mortgage loans if we breach a representation or warranty in connection with our securitizations. The remedies available to us against the originating broker or correspondent may not be as broad as the remedies available to a purchaser of mortgage loans against us, and we face the further risk that the originating broker or correspondent may not have the financial capacity to perform remedies that otherwise may be available to us. Therefore, if a purchaser enforces its remedies against us, we may not be able to recover losses from the originating broker or correspondent. Repurchased loans are typically sold at a significant discount to the unpaid principal balance and, prior to sale, can be financed by us, if at all, only at a steep discount to our cost. As a result, significant repurchase activity could harm our liquidity, cash flow, results of operations, financial condition and business prospects.
Recently, we have received an increased number of repurchase and indemnity demands from purchasers of whole loans as a result of borrower fraud and early borrower payment defaults, which has had a negative impact on our results of operations. While we have taken steps to enhance our underwriting policies and procedures, there can be no assurance that these steps will be effective. To the extent that repurchase and indemnity demands continue at this rate or increase, our results of operations and financial condition will be adversely affected.
Our investments in mortgage securities and loans are subject to changes in credit spreads which could adversely affect our ability to realize gains on the sale of such investments and may subject us to margin calls or similar liquidity requirements.
The value of mortgage securities is dependent on the yield demanded on these securities by the market based on their credit relative LIBOR. Excessive supply of these securities combined with reduced demand will generally cause the market to require a higher yield on these securities, resulting in the use of a higher, or “wider,” spread over the benchmark rate (usually the applicable LIBOR security yield) to value such securities. Under such conditions, the value of our mortgage securities portfolio would tend to decline. Conversely, if the spread used to value such securities were to decrease, or “tighten,” the value of our mortgage securities portfolio would tend to increase.
Our loan portfolio is also subject to changes in credit spreads. The value of these loans is dependent on the yield demanded by the market based on their credit relative to LIBOR. The value of our loans would tend to decline should the market require a higher yield on such loans, resulting in the use of a higher spread over the benchmark rate (usually the applicable LIBOR yield). Conversely, if the spread used to value such loans were to decrease, or “tighten,” the value of our loan portfolio would tend to increase.
A decrease in the value of our loans or mortgage securities would reduce our ability to realize gains upon the sale or securitization of these assets and, with respect to mortgage securities (which are marked to market quarterly), could result in impairments for securities classified as available-for-sale or mark-to-market losses for securities classified as trading.. In addition, a decrease in the value of our mortgage loans or securities reduces the funds available to us in respect of these assets under our warehouse repurchase agreements and may result in margin calls. Further, a decrease in the value of third party mortgage securities that we have accumulated for the purpose of a CDO offering may reduce the availability or attractiveness of the CDO offering, in which case we may be required to seek other forms of potentially less attractive longer-term financing or to liquidate the assets on unfavorable terms.
We retain and assume credit risk under a variety of mortgage securities and similar assets in connection with and as a result of our securitization activities. Significant losses on these assets reduce our earnings, negatively affect our liquidity, and otherwise negatively affect our business.
We retain certain residual securities resulting from our securitizations of mortgage loans, which typically consist of interest-only, prepayment penalty, and overcollateralization bonds. We also retain from our securitizations, as well as purchase from 3rd party ABS issuers, certain investment grade and non-investment grade rated subordinated mortgage securities. The residual securities are typically unrated or rated below investment grade and, as such, involve significant investment risk that exceeds the aggregate risk of the full pool of securitized loans. By holding the residual securities, we retain the “first loss” risk associated with the underlying pool of mortgage loans. As a result, the credit performance and prepayment rates of the sub-prime loans underlying these mortgage securities directly affect our returns on these mortgage securities. Significant realized losses from our residual and subordinated mortgage securities could harm our results of operations and financial condition. In addition, because we finance these securities under medium-term warehouse repurchase agreements, decreases in the value of these retained securities may result in margin calls and adversely affect our liquidity.
We invest in or assume financial risk associated with mortgage securities issued by third party residential real estate loan securitization entities, most of which are backed by sub-prime loans. In addition, following a CDO offering, we retain equity or unsecured debt securities of the CDO issuer. We expect to increase our investment in third party mortgage securities and CDO issuer equity and debt securities and, consequently, to increase our credit and prepayment exposure to the assets that underlie these securities. A significant portion of these third party mortgage securities consists of securities that are subordinate to other securities secured by the same pool of assets and, as such, have significant investment risk. Generally, we do not control or influence the underwriting, servicing, management, or loss mitigation efforts with respect to the assets underlying securities issued by securitizations we do not sponsor. If the asset pools underlying any of these securities were to experience poor credit results, the market value of the third party securities that we hold directly and of our equity interest in or unsecured debt of a CDO issuer could decrease. Significant realized losses from third party mortgage securities, directly or indirectly through our interest in a CDO issuer, could harm our results from operations, liquidity, and financial condition.
Further, we may enter into or assume financial risk associated with ABS credit default swaps or similar derivatives, referred to a “synthetic securities,” in contemplation of the transfer of such synthetic securities to a CDO issuer in connection with our CDO offerings. Under these synthetic securities, we may assume, in exchange for a premium, payment and credit risk associated with third party mortgage securities. In addition to the risks associated with the third party securities to which the synthetic security relates, synthetic securities are unsecured and would expose us to the risk of payment default by the swap counterparty and to risks associated with the determination of settlement payments upon a credit event relating to the referenced mortgage securities or other settlement event. In addition, the market for synthetic securities of this type is not highly liquid and, as such, we may not be able to realize the full value of a synthetic security in the event we need to liquidate or dispose of the synthetic security, which could negatively impact our results of operations and financial condition.
Credit results with respect to mortgage assets underlying our securitizations may negatively affect our access to the securitization market on favorable terms, which in turn would harm our financial condition and prospects.
If the non-conforming loan industry continues to experience credit difficulties, our ability to access the securitization market on favorable terms may be negatively affected. In addition if the pools of mortgage loans underlying our securitizations of mortgage loans or indirectly underlying our securitizations of mortgage securities were to experience poor credit results, the securities issued in these securitizations could have their credit ratings down-graded, could suffer losses in market value, and could experience principal losses. In addition to reducing the long-term returns and near-term cash flows from the securities we have retained or acquired in these transactions, any of the foregoing may reduce our ability to sponsor securitization transactions, including CDO offerings, in the future.
Competition in the securitization market may erode our securitization margins, which in turn may adversely affect or harm our financial condition and prospects.
Competition in the business of sponsoring securitizations of the type we focus on is increasing as Wall Street broker-dealers, hedge funds, mortgage REITs, investment management companies, and other financial institutions expand their activities or enter this field. Increased competition could reduce our securitization margins. To the extent that our securitization margins erode, our results of operations, financial condition and business prospects will be negatively impacted.
Differences in our actual experience compared to the assumptions that we use to determine the value of our residual mortgage securities could adversely affect our financial position.
Our securitizations of mortgage loans that are structured as sales for financial reporting purposes result in gain recognition at closing as well as the recording of the residual mortgage securities we retain at fair value. As of December 31, 2006 we had retained residual mortgage securities from our securitizations of mortgage loans with a fair value of $349.3 million on our balance sheet.
Delinquency, loss, prepayment and discount rate assumptions have a material impact on the amount of gain recognized and on the carrying value of our residual mortgage securities. It is extremely difficult to validate the assumptions we use in determining the amount of gain on sale and the value of our residual mortgage securities. If our actual experience differs materially from the assumptions that we use to determine our gain on sale or the value of these mortgage securities, our future cash flows, our financial condition and our results of operations could be negatively affected.
The value of residual interests represents the present value of future cash flows expected to be received by us from the excess cash flows created in the securitization transaction. In general, future cash flows are estimated by taking the coupon rate of the loans underlying the transaction less the interest rate paid to the investors, less contractually specified servicing and trustee fees, and after giving effect to estimated prepayments and credit losses. We estimate future cash flows from these securities and value them utilizing assumptions based in part on projected discount rates, delinquency, mortgage loan prepayment speeds and credit losses. It is extremely difficult to validate the assumptions we use in valuing our residual interests. Even if the general accuracy of the valuation model is validated, valuations are highly dependent upon the reasonableness of our assumptions and the predictability of the relationships which drive the results of the model. Such assumptions are complex as we must make judgments about the effect of matters that are inherently uncertain. If our actual experience differs from our assumptions, we would be required to reduce the value of these securities.Furthermore, if our actual experience differs materially from these assumptions, our cash flow, financial condition, results of operations and business prospects may be harmed, including an adverse affect on the amount of dividend payments that are made on our common stock.
Changes in accounting standards might cause us to alter the way we structure or account for securitizations.
Changes could be made to current accounting standards, which could affect the way we structure or account for securitizations. For example, if changes were made in the types of transactions eligible for gain on sale treatment, we may have to change the way we account for securitizations, which may harm our results of operations or financial condition.
The rate at which we are able to acquire eligible mortgage loans or mortgage securities and changes in market conditions during asset accumulation may adversely affect our anticipated returns from the securitization of these assets.
We use short term warehouse financing arrangements to finance the acquisition of mortgage loans and mortgage securities until a sufficient quantity of assets is accumulated, at which time we may refinance these lines through a securitization or other long term financing. As a result, we are subject to the risk that we will not be able to acquire, during the period in which the relevant warehouse facility is available for the funding of such assets, a sufficient amount of eligible securities to maximize the efficiency of a securitization. In addition, changes in conditions in the capital markets may make a securitization less attractive to us by the time we do have a sufficient pool of collateral. If we are unable to securitize these assets, we may be required to seek other forms of potentially less attractive financing or otherwise to liquidate the assets on unfavorable terms.
Market factors may limit our ability to originate and acquire mortgage assets at yields that are favorable relative to costs.
Despite our experience in the origination and acquisition of mortgage assets and our relationships with brokers and sellers of mortgage assets, we face the risk that we might not be able to originate or acquire mortgage assets that earn interest rates greater than our cost of funds under our short-term borrowings and securitizations, or that we might not be able to originate or acquire a sufficient number of such mortgage assets to maintain our profitability. An inability to originate or purchase sufficient volumes of loans and mortgage securities at a cost lower than the net cash proceeds realized from their sale or securitization would materially harm our results of operations, financial condition and business prospects.
We have recently imposed stricter mortgage loan and borrower requirements, which may result in a decrease in our mortgage loan origination and purchase volumes and, consequently, our loan sale and securitization volumes.
As a result of less favorable economic conditions and an increase in the number of fraudulently obtained loans and borrower defaults, we have tightened our mortgage loan lending and purchase requirements and the processes we undergo to document loans. There may be fewer borrowers and loans that qualify under these revised standards, and we may face increased competition from lenders and loan purchasers with less rigorous standards. As a result, our loan origination and purchase volumes may decline. A decline in our loan origination or purchase volumes would decrease the volume of assets available to us for sale or securitization, which could adversely affect our results of operations and financial condition.
Risks Related to Interest Rates and Our Hedging Strategies
Changes in interest rates may harm our results of operations and equity value.
Our results of operations are likely to be harmed during any period of unexpected or rapid changes in interest rates. Our primary interest rate exposures relate to our mortgage securities, mortgage loans, floating rate debt obligations, interest rate swaps, and interest rate caps. Interest rate changes could adversely affect our results of operations and liquidity in the following ways:
a substantial or sustained increase in interest rates could harm our ability to originate or acquire mortgage loans and mortgage securities in expected volumes, which could result in a decrease in our cash flow and in our ability to support our fixed overhead expenses;
interest rate fluctuations may harm our earnings and access to capital as the spread between the interest rates we pay on our borrowings and hedges and the interest rates we receive on our mortgage assets narrows;
if prevailing interest rates increase after we fund a loan, the value that we receive upon the sale or securitization of the loan decreases;
when we securitize loans, the value of the residual and subordinated securities we retain and the income we receive from them are based primarily on LIBOR, and an increase in LIBOR increases our funding costs which reduces the net income we receive from, and the value of, these securities;
existing borrowers with adjustable-rate mortgages or higher risk loan products may incur higher monthly payments as the interest rate increases, and consequently may experience higher delinquency and default rates, resulting in decreased earnings and decreased value of our mortgage securities;
mortgage prepayment rates vary depending on such factors as mortgage interest rates and market conditions, and changes in anticipated prepayment rates may harm our earnings and the value of our mortgage securities.
In addition, interest rate changes may also impact our net book value as our mortgage securities and related hedge derivatives are marked to market each quarter. Our mortgage loans and debt obligations are not marked to market. Generally, as interest rates increase, the value of our mortgage securities decrease which decreases the book value of our equity. We intend to increase our investment in mortgage securities, which may amplify the impact of interest rate changes on our book value.
Furthermore, shifts in the yield curve, which represents the market’s expectations of future interest rates, also affects the yield required for the purchase of our mortgage securities and therefore their value. To the extent that there is an unexpected change in the yield curve it could have an adverse effect on our mortgage securities portfolio and our financial position and operations.
Hedging against interest rate exposure may adversely affect our earnings, which could adversely affect cash available for operations and for distribution to our shareholders.
There are limits on the ability of our hedging strategy to protect us completely against interest rate risks. When interest rates change, we expect the gain or loss on derivatives to be offset by a related but inverse change in the value of the hedged items, generally our liabilities. We cannot assure you, however, that our use of derivatives will offset the risks related to changes in interest rates. We cannot assure you that our hedging strategy and the derivatives that we use will adequately offset the risk of interest rate volatility or that our hedging transactions will not result in losses. We may enter into interest rate cap or swap agreements or pursue other interest rate hedging strategies. Our hedging activity will vary in scope based on interest rates, the type of mortgage assets held, other changing market conditions and, so long as we remain a REIT, compliance with REIT requirements. Interest rate hedging may fail to protect or could adversely affect us because, among other things:
interest rate hedging can be expensive, particularly during periods of rising and volatile interest rates;
hedging instruments involve risk because they often are not traded on regulated exchanges, guaranteed by an exchange or its clearing house, or regulated by any U.S. or foreign governmental authorities; consequently, there are no requirements with respect to record keeping, financial responsibility or segregation of customer funds and positions, and the enforceability of agreements underlying derivative transactions may depend on compliance with applicable statutory, commodity and other regulatory requirements;
available interest rate hedging may not correspond directly with the interest rate risk for which protection is sought;
the duration of the hedge may not match the duration of the related liability or asset;
the credit quality of the party owing money on the hedge may be downgraded to such an extent that it impairs our ability to sell or assign our side of the hedging transaction;
the party owing money in the hedging transaction may default on its obligation to pay, which may result in the loss of unrealized profits; and
we may not be able to dispose of or close out a hedging position without the consent of the hedging counterparty, and we may not be able to enter into an offsetting contract in order to cover our risks.
Any hedging activity we engage in may adversely affect our earnings, which could adversely affect cash available for operations and for distribution to our shareholders. Unanticipated changes in interest rates may result in poorer overall investment performance than if we had not engaged in any such hedging transactions.
Complying with REIT requirements may limit our ability to hedge effectively.
We attempt to minimize exposure to interest rate fluctuations by hedging. The REIT provisions of the Code limit our ability to hedge mortgage assets and related borrowings by requiring us to limit our income in each year from any qualified hedges, together with any other income not generated from qualified real estate assets, to no more than 25% of our gross income. The interest rate hedges that we generally enter into will not be counted as a qualified asset for the purposes of satisfying this requirement. In addition, under the Code, we must limit our aggregate income from non-qualified hedging transactions and from other non-qualifying sources to no more than 5% of our annual gross income. As a result, we may have to limit our use of advantageous hedging techniques. This could result in greater risks associated with changes in interest rates than we would otherwise want to incur. In addition, if it is ultimately determined that some of our interest rate hedging transactions are non-qualified under the Code; we may have more than 5% of our annual gross income from non-qualified sources. If we violate the 5% or 25% limitations, we may have to pay a penalty tax equal to the amount of income in excess of those limitations, multiplied by a fraction intended to reflect our profitability. In addition, if we fail to observe these limitations, we could lose our REIT status unless our failure was due to reasonable cause and not due to willful neglect.
Risks Related to Credit Losses and Prepayment Rates
Loans made to nonconforming mortgage borrowers entail relatively higher delinquency and default rates which will result in higher loan losses.
Lenders in the nonconforming mortgage banking industry make loans to borrowers who have impaired or limited credit histories, limited documentation of income and higher debt-to-income ratios than traditional mortgage lenders allow. Mortgage loans made to nonconforming mortgage loan borrowers generally entail a relatively higher risk of delinquency and foreclosure than mortgage loans made to borrowers with better credit and, therefore, will result in higher levels of realized losses than conventional loans. Delinquency interrupts the flow of projected interest income from a mortgage loan, and default can ultimately lead to a loss if the net realizable value of the real property securing the mortgage loan is insufficient to cover the principal and interest due on the loan. Loans that become delinquent prior to sale or securitization may become unsaleable or saleable only at a discount, and the longer we hold loans prior to sale or securitization, the greater the chance we will bear all costs associated with the loans’ delinquency. Also, our cost of financing and servicing a delinquent or defaulted loan is generally higher than for a performing loan.
We bear the risk of delinquency and default on loans beginning when we originate them. In whole loan sales, our risk of delinquency and default typically only extends until the borrower makes the first payment but can extend up to the third payment. When we securitize any of our loans, we continue to be exposed to delinquencies and losses, either through our residual interests for securitizations structured as sales or through the loans that remain on our balance sheet for securitizations structured as financings. We also re-acquire the risks of delinquency and default for loans that we are obligated to repurchase.
We attempt to manage these risks with risk based mortgage loan pricing and appropriate underwriting criteria and policies and loan collection methods. However, as with the broader nonconforming mortgage loan industry, we have recently experienced an increase in borrower delinquencies and defaults, which has adversely affected our cash flows, results of operations and financial condition. While we have taken steps to tighten our underwriting guidelines and procedures, there can be no assurance that these steps will be effective. To the extent that we cannot successfully address these issues, or the increase in delinquencies and defaults becomes more severe, our results of operations and financial condition may be further adversely affected.
We face loss exposure due to fraudulent and negligent acts on the part of loan applicants, employees, mortgage brokers and other third parties.
When we originate or purchase mortgage loans, we rely heavily upon information provided to us by third parties, including information relating to the loan application, property appraisal, title information and employment and income documentation. If any of this information is fraudulently or negligently misrepresented to us and such misrepresentation is not detected by us prior to loan funding, the value of the loan may be significantly lower than we expected. Whether a misrepresentation is made by the loan applicant, the loan broker, one of our employees, or any other third party, we generally bear the risk of loss associated with it. A loan subject to misrepresentation typically cannot be sold and, if sold prior to our detection of the misrepresentation, generally must be repurchased by us. We may not be able to recover losses incurred as a result of the misrepresentation.
As with the broader nonconforming mortgage loan industry, we have recently experienced an increase in exposure due to fraud, which has resulted in an increase in our repurchase and indemnity obligations and has adversely affected our cash flow, results of operations and financial condition. To the extent that we cannot successfully address these issues or the increase in fraud becomes more severe, our results of operations and financial condition may be further adversely affected.
Our reliance on cash-out refinancings as a significant source of our origination volume increases the risk that our earnings will be harmed if the demand for this type of refinancing declines.
Approximately 65% of our loan production volume during the year ended December 31, 2006 consisted of cash-out refinancings. Our reliance on cash-out refinancings as a significant source of our origination volume increases the risk that our earnings will be reduced if interest rates rise and the prices of homes decline, which would reduce the demand and production volume for this type of refinancing. To the extent interest rates continue to rise, the number of borrowers who would qualify or elect to pursue a cash-out refinancing could be reduced significantly, which will result in a decline in that origination source. Similarly, a decrease in home prices would reduce the amount of equity available to be borrowed against in cash-out refinancings and result in a decrease in our loan production volume from that origination source. Therefore, our reliance on cash-out refinancings as a significant source of our origination volume could harm our results of operations, financial condition and business prospects.
Our efforts to manage credit risk may not be successful in limiting delinquencies and defaults in underlying loans and, as a result, our results of operations may be affected.
There are many aspects of credit that we cannot control and our quality control and loss mitigation operations may not be successful in limiting future delinquencies, defaults and losses. For example, the value of the homes collateralizing residential loans may decline due to a variety of reasons beyond our control, such as weak economic conditions, natural disasters, over-leveraging of the borrower, and reduction in personal incomes. Interest-only loans, negative amortization loans, adjustable-rate loans, reduced documentation loans, sub-prime loans, home equity lines of credit and second lien loans may involve higher than expected delinquencies and defaults. Changes in consumer behavior, bankruptcy laws, and other laws may exacerbate loan losses.
Our comprehensive underwriting process may not be effective in mitigating these risks and our risk of loss on the underlying loans. Further, expanded loss mitigation efforts in the event that defaults increase could increase our operating costs. In response to increasing default rates recently experienced by us and the nonconforming mortgage loan industry generally, we have enhanced our underwriting policies and procedures, which may decrease our ability to originate and purchase loans. To the extent that these efforts are ineffective to reduce the current level of loan delinquencies and defaults or adversely affect our origination and purchase volumes, our results of operations may be adversely affected.
Mortgage insurers may in the future change their pricing or underwriting guidelines or may not pay claims resulting in increased credit losses.
We use mortgage insurance to mitigate our risk of credit losses. Our decision to obtain mortgage insurance coverage is dependent, in part, on pricing trends. Mortgage insurance coverage on our new mortgage loan production may not be available at rates that we believe are economically viable for us or at all. We also face the risk that our mortgage insurers might not have the financial ability to pay all claims presented by us or may deny a claim if the loan is not properly serviced, has been improperly originated, is the subject of fraud, or for other reasons. Any of those events could increase our credit losses and thus adversely affect our results of operations and financial condition.
Investments in diverse types of assets and businesses could expose us to new, different, or increased risks.
We have invested in and intend to invest in a variety of assets that are related to our current core business, including loans, securities, and related derivatives. We may make investments in debt and equity securities issued by our own and third party CDOs that own various types of assets. These CDOs may invest in manufactured housing loans, sub-prime residential mortgage loans, and other residential mortgage loans backed by lower-quality borrowers, in other loans and receivables, in securities backed by the foregoing, and in credit default derivatives referencing these or other securities. The higher credit and/or prepayment risks associated with these types of investments may increase our exposure to losses. In addition, certain of these assets may be relatively new or unique products, which may increase contractual and liquidity risks.
The federal banking agencies’ final guidance on nontraditional mortgage products may impact our ability to originate, buy, or sell certain nontraditional mortgage loans.
On October 4, 2006, the Office of the Comptroller of the Currency, the Board of Governors of the Federal Reserve System, the Federal Deposit Insurance Corporation, the Office of Thrift Supervision, and the National Credit Union Administration issued their final “Interagency Guidance on Nontraditional Mortgage Product Risks” (the “Guidance”). Nontraditional mortgage products are those which allow borrowers to defer payment of principal and sometimes interest. They include what are commonly referred to as “option ARM” loans and interest-only loans.
The Guidance addresses the portfolio risks and consumer protection issues that the federal agencies believe investors and lenders face when making or investing in nontraditional mortgage loans. As a matter of portfolio risk management, the Guidance warns applicable financial institutions that loan terms should be analyzed to ensure a manageable risk level, utilizing sound underwriting standards including an evaluation of factors that may compound the risk, such as reduced documentation programs and the use of second lien mortgages. The analysis of repayment ability “should avoid over-reliance on credit scores as a substitute for income verification in the underwriting process” and should include an analysis of the borrower’s ability to make the payment when it increases to include amortization of the loan.
As a matter of consumer protection, financial institutions subject to the Guidance, when promoting or describing nontraditional mortgage products, are directed to ensure that they provide consumers with marketing materials and at application with information that is designed to help them make informed decisions when selecting and using these products. Lenders subject to the Guidance are instructed that the information they are to provide should apprise consumers of the risk that the monthly payment amounts could increase in the future, and explain the possibility of negative amortization.
While not directly applicable to us, the Guidance may affect our ability to make, buy or sell the nontraditional loans covered by the Guidance. Further, the Guidance is instructive of the regulatory climate concerning those loans and may be adopted in whole or part by other agencies that regulate us. The Guidance reports that the Conference of State Bank Supervisors (“CSBS”) and the State Financial Regulators Roundtable (“SFRR”) are committed to preparing a model guidance document for state regulators of non-depository institutions such as us, which would be “similar in nature and scope” to the Guidance. It is also possible that the Guidance, or certain provisions within it, may be adopted as laws or used as guidance by federal, state or local agencies and that those laws or guidance may be applied to us.
If we are required (either by a regulatory agency or by third-party originators or investors) to make changes to our business practices to comply with the Guidance, it might affect the business activities in which we may engage and the profitability of those activities. Our business could be adversely affected if, as a result of the Guidance, investors from which we purchase loans, or to whom we sell loans, change their business practices and policies relative to nontraditional mortgage products. For example, if entities from which we purchase loans are required to change their origination guidelines thereby affecting the volume, diversity, and quality of loans available for purchase by us, or if purchasers of mortgage loans are required to make changes to the purchasing policies, then our loan volume, ability to sell mortgage loans and profitability, could be adversely affected.
Our interest-only loans may have a higher risk of default than our fully-amortizing loans.
For the year ended December 31, 2006, originations of interest-only loans totaled $1.4 billion, or 13%, of our total originations. These interest-only loans require the borrowers to make monthly payments only of accrued interest for the first 24, 36 or 120 months following origination. After such interest-only period, the borrower’s monthly payment is recalculated to cover both interest and principal so that the mortgage loan will amortize fully prior to its final payment date. The interest-only feature may reduce the likelihood of prepayment during the interest-only period due to the smaller monthly payments relative to a fully-amortizing mortgage loan. If the monthly payment increases, the related borrower may not be able to pay the increased amount and may default or may refinance the related mortgage loan to avoid the higher payment. Because no principal payments may be made on such mortgage loans for an extended period following origination, if the borrower ultimately defaults, the unpaid principal balance of the related loans would be greater than otherwise would be the case for a fully-amortizing loan. As a result, the likelihood that we would incur a loss on these loans will increase, especially in a declining real estate market.
Current loan performance data may not be indicative of future results.
When making capital budgeting and other decisions, we use projections, estimates and assumptions based on our experience with mortgage loans. Actual results and the timing of certain events could differ materially in adverse ways from those projected, due to factors including changes in general economic conditions, interest rates, mortgage loan prepayment rates and in losses due to defaults on mortgage loans. These differences and fluctuations could rise to levels that may adversely affect our profitability and financial condition.
Changes in prepayment rates of mortgage loans could adversely affect the return that we are able to achieve on our assets.
The value of our assets may be affected by prepayment rates on our residential mortgage loans and other floating rate assets. Prepayment rates are influenced by changes in current interest rates and a variety of economic, geographic and other factors beyond our control, and consequently, such prepayment rates cannot be predicted with certainty. In periods of declining mortgage interest rates, prepayments on loans generally increase. If general interest rates decline as well, the proceeds of such prepayments received during such periods are likely to be reinvested by us in assets yielding less than the yields on the assets that were prepaid. In addition, the market value of floating rate assets may, because of the risk of prepayment, benefit less than fixed rate assets from declining interest rates. Conversely, in periods of rising interest rates, prepayments on loans generally decrease, in which case we would not have the prepayment proceeds available to invest in assets with higher yields. Under certain interest rate and prepayment scenarios we may fail to recoup fully our cost of acquisition of certain investments. As a result of all of these factors, changes in prepayment rates could adversely affect our return on our assets.
Geographic concentration of mortgage loans we originate or purchase increases our exposure to risks in those areas.
Over-concentration of loans we originate or purchase in any one geographic area increases our exposure to the economic and natural hazard risks associated with that area. Declines in the residential real estate markets in which we are concentrated may reduce the values of the properties collateralizing our mortgages which in turn may increase the risk of delinquency, foreclosure, bankruptcy, or losses from those loans. To the extent that borrowers in a geographic area in which we have made a significant number of loans become delinquent or otherwise default on such loans, our financial condition and results of operations may be adversely affected.
To the extent that we have a large number of loans in an area hit by a natural disaster, we may suffer losses.
Standard homeowner insurance policies generally do not provide coverage for natural disasters, such as hurricanes and floods. Furthermore, nonconforming borrowers are not likely to have special hazard insurance. To the extent that borrowers do not have insurance coverage for natural disasters, they may not be able to repair the property or may stop paying their mortgages if the property is damaged. A natural disaster that results in a significant number of delinquencies could cause increased foreclosures and decrease our ability to recover losses on properties affected by such disasters, and that in turn could harm our financial condition and results of operations.
A prolonged economic slowdown or a decline in the real estate market could harm our results of operations.
A substantial portion of our mortgage assets consist of single-family mortgage loans or mortgage securities evidencing interests in single-family mortgage loans. Because we make a substantial number of loans to credit-impaired borrowers, the actual rates of delinquencies, foreclosures and losses on these loans tend to be higher during economic slowdowns. Recently, we have experienced an increase in delinquencies and foreclosures. Any sustained period of increased delinquencies or defaults or any sharp increase in the number of delinquencies and defaults could harm our ability to sell loans, the prices we receive for our loans, the values of our mortgage loans held for sale, our ability to finance loan originations and our residual interests in securitizations, which could harm our financial condition and results of operations. In addition, any material decline in real estate values would weaken our collateral loan-to-value ratios and increase the possibility of loss if a borrower defaults. In such event, we will be subject to the risk of loss on such mortgage asset arising from borrower defaults to the extent not covered by third-party credit enhancement.
Risks Related to the Legal and Regulatory Environment in Which We Operate
Various legal proceedings could adversely affect our financial condition or results of operations.
In the course of our business, we are subject to various legal proceedings and claims. See “Item 3 – Legal Proceedings.” The resolution of these legal matters or other legal matters could result in a material adverse impact on our results of operations, financial condition and business prospects.
We are subject to the risk that provisions of our loan agreements may be unenforceable.
Our rights and obligations with respect to our loans are governed by written loan agreements and related documentation. It is possible that a court could determine that one or more provisions of a loan agreement are unenforceable, such as a loan prepayment prohibition or the provisions governing our security interest in the underlying collateral. If this were to happen with respect to a material asset or group of assets, we could be required to repurchase these loans and may not be able to sell or liquidate the loans, which could negatively affect our liquidity and financial condition.
We are exposed to the risk of environmental liabilities with respect to properties to which we take title.
In the course of our business, we occasionally foreclose and take title to residential properties and as a result could become subject to environmental liabilities associated with these properties. We may be held liable for property damage, personal injury, investigation, and cleanup costs incurred in connection with environmental contamination. These costs could be substantial. If we ever become subject to significant environmental liabilities, our financial condition and results of operations could be adversely affected.
Regulation as an investment company could harm our business; efforts to avoid regulation as an investment company could limit our operations.
If we were required to comply with the Investment Company Act, we would be prevented from conducting our business as described in this document by, among other things, substantially limiting our ability to use leverage. The Investment Company Act does not regulate entities that are primarily engaged, directly or indirectly, in a business “other than that of investing, reinvesting, owning, holding or trading in securities,” or that are primarily engaged in the business of “purchasing or otherwise acquiring mortgages and other liens on and interests in real estate.” Under the Commission’s current interpretation, in order to qualify for the latter exemption we must maintain at least 55% of our assets directly in “qualifying real estate interests” and at least an additional 25% of our assets in other real estate-related assets or additional qualifying real estate interests. Mortgage-backed securities that do not represent all the certificates issued with respect to an underlying pool of mortgages may be treated as securities separate from the underlying mortgage loans and thus may not qualify as a qualifying real estate interest for the purposes of the 55% requirement. Therefore, to insure that we continue to qualify for the exemption, we may be required to adopt less efficient methods of financing certain of our mortgage assets, we may be required to sell certain mortgage securities at disadvantageous terms, and we may be precluded from acquiring certain types of higher yielding mortgage assets. If we fail to qualify for an applicable exemption from the Investment Company Act, we could not operate our business efficiently under the regulatory scheme imposed by the Investment Company Act. Accordingly, we could be required to restructure our activities which could materially adversely affect our financial condition and results of operations.
Our failure to comply with federal, state or local regulation of, or licensing requirements with respect to, mortgage lending, loan servicing, broker compensation programs, or other aspects of our business could harm our operations and profitability.
As a mortgage lender, loan servicer and broker, we are subject to an extensive body of both state and federal law. The volume of new or modified laws and regulations has increased in recent years and, in addition, some individual municipalities and cities have begun to enact laws that restrict loan origination and servicing activities. As a result, it may be more difficult to comprehensively identify and accurately interpret all of these laws and regulations, to properly program our technology systems and to effectively train our personnel with respect to all of these laws and regulations, thereby potentially increasing our exposure to the risks of noncompliance with these laws and regulations. Our failure to comply with these laws and regulations can lead to civil and criminal liability; loss of licensure; damage to our reputation in the industry; inability to sell or securitize our loans; demands for indemnification or loan repurchases from purchasers of our loans; fines and penalties and litigation, including class action lawsuits; or administrative enforcement actions. Any of these results could harm our results of operations, financial condition and business prospects.
New legislation could restrict our ability to make, finance and sell mortgage loans, could increase our compliance and origination costs, and could expose us to lawsuits and compliance actions, any of which could harm our earnings and business prospects.
The regulatory environments in which we operate have an impact on the activities in which we may engage, how these activities may be carried out, and the profitability of these activities. Therefore, changes to laws, regulations or regulatory policies can affect whether and to what extent we are able to operate profitably.
Several states, cities or other government entities are considering or have passed laws, regulations or ordinances aimed at curbing lending practices perceived as predatory. The federal government is also considering legislative and regulatory proposals in this regard. In general, these proposals involve lowering the existing thresholds for defining a “high-cost” loan and establish enhanced protections and remedies for borrowers who receive such loans. For example, certain of these new or proposed laws and regulations prohibit inclusion of some provisions in mortgage loans that have mortgage rates or origination costs in excess of prescribed levels, and require that borrowers be given certain disclosures or obtain advice, at the expense of the lender, prior to the consummation of such mortgage loans. Passage of these laws and rules could reduce our loan origination and purchase volumes and could increase our costs. The institutions that provide short-term financing to us generally refuse to finance any loan labeled as a “high cost” loan under any local, state or federal law or regulation. In addition, many whole loan buyers may elect not to purchase these loans, and rating agencies likewise may refuse to rate securities backed by such loans. Accordingly, these laws and rules could severely restrict short-term financing and the secondary market for a significant portion of our loan production. This would effectively preclude us from continuing to originate loans either in jurisdictions unacceptable to our lenders or the rating agencies or that exceed the newly defined thresholds, which in either case could harm our results of operations and business prospects.
We cannot provide any assurance that these proposed laws, rules and regulations, or other similar laws, rules or regulations, will not be adopted in the future. Adoption of these laws and regulations could have a material adverse impact on our business by substantially increasing the costs of compliance with a variety of inconsistent federal, state and local rules, or by restricting our ability to charge rates and fees adequate to compensate us for the risk associated with certain loans. Compliance with some of these restrictions requires lenders to make subjective judgments, such as whether a loan will provide a “net tangible benefit” to the borrower. These restrictions impact the way in which a loan is underwritten and expose a lender to risks of litigation and regulatory sanction regardless of the care with which a loan is underwritten. Our failure to comply with these laws could subject us to monetary penalties and could result in the borrowers rescinding the loans, whether held by us or subsequent holders. The remedies for violations of these laws are not based solely on actual harm to the consumer and can result in damages and penalties that could extend not only to us, but to our secured warehouse lenders, institutional loan purchasers, securitization trusts that hold our loans and other assignees, regardless of whether such assignee knew of or participated in the violation, which, in turn, could have an adverse affect on the availability of financing to us and our access to securitization and other secondary markets.
Similarly, recently enacted and proposed local, state and federal privacy laws and laws prohibiting or limiting marketing by telephone, facsimile, email and the Internet may limit our ability to market and our ability to access potential loan applicants.
We are subject to significant legal and reputational risks and expenses under federal and state laws concerning privacy, use, and security of customer information.
The scope of business activity affected by “privacy” concerns is likely to expand and will affect our non-prime mortgage loan origination business. The federal Gramm-Leach-Bliley financial reform legislation imposes significant privacy obligations on us in connection with the collection, use and security of financial and other non-public information provided to us by applicants and borrowers. We adopted a privacy policy and adopted controls and procedures to comply with the law after it took effect on July 1, 2001. Privacy rules also require us to protect the security and integrity of the customer information we use and hold. Although we have systems and procedures designed to help us with these privacy requirements, we cannot assure you that more restrictive laws and regulations will not be adopted in the future, or that governmental bodies will not interpret existing laws or regulations in a more restrictive manner, making compliance more difficult or expensive. These requirements also increase the risk that we may be subject to liability for non-compliance.
A number of states are considering privacy amendments that may be more demanding than federal law, and California recently has enacted two statutes — the California Financial Information Privacy Act (also know as SB-1) and the California Online Privacy Protection Act, both of which took effect on July 1, 2004. Under SB-1, a financial company must allow its customers to opt out of the sharing of their information with affiliates in separately regulated lines of business and must receive a customer opt-in before confidential customer data may be shared with unaffiliated companies (subject to certain exceptions). A federal court rejected the effort of three financial trade associations to prevent SB-1 from taking effect, and as of July 1, 2004, the California Department of Financial Institutions announced that it would require immediate compliance with SB-1. Under the new California Online Privacy Act, all operators of commercial websites and online services that allow interaction with California consumers (even if no transactions may be effected online) must post privacy policies meeting statutory requirements. The FTC, which administers the federal privacy rules for mortgage lenders, has determined that privacy laws in several states are not preempted by Gramm-Leach-Bliley, most recently new privacy laws enacted by Vermont and Illinois. In view of the public concern with privacy, we cannot assure you that additional rules that restrict or make more costly our activities and the activities of our vendors will not be adopted and will not restrict the marketing of our products and services to new customers.
Because laws and rules concerning the use and protection of customer information are continuing to develop at the federal and state levels, we expect to incur increased costs in our effort to be and remain in full compliance with these requirements. Nevertheless, despite our efforts, we will be subject to legal and reputational risks in connection with our collection and use of customer information, and we cannot assure you that we will not be subject to lawsuits or compliance actions under such state or federal privacy requirements. Furthermore, to the extent that a variety of inconsistent state privacy rules or requirements are enacted, our compliance costs could substantially increase.
New regulatory actions affecting the mortgage industry may increase our costs and decrease our mortgage acquisition.
In addition to changes to legal requirements contained in statutes, regulations, case law, and other sources of law, changes in the investigation or enforcement policies of federal and state regulatory agencies could impact the activities in which we may engage, how the activities may be carried out, and the profitability of those activities. Several state and federal agencies have initiated regulatory enforcement proceedings against mortgage companies for engaging in business practices that were not specifically or clearly proscribed by law, but which in the judgment of the regulatory agencies were unfair or deceptive to consumers. For example, state attorneys general and other state officials representing various states entered into a settlement agreement with a large subprime mortgage company.
The subject company agreed to pay a substantial amount in restitution to consumers and reimbursement to the states and also agreed to make changes to certain business practices, including the company’s underwriting criteria and pricing policies. Many of the practices and policies are not specifically prohibited by any federal or state laws but were alleged to be deceptive or unfair to consumers. The terms of this settlement agreement do not apply directly to us; however, federal and state regulatory agencies and private parties might nevertheless expect mortgage companies, including us, to make our business practices consistent with the provisions of the settlement agreement. If this happens, it could impact the activities in which we may engage, how we carry out those activities, our acquisition practices and our profitability. We might also be required to pay fines, make reimbursements, and make other payments to third parties for our business practices. Additionally, if an administrative enforcement proceeding were to result in us having to discontinue or alter certain business practices, then we might be placed at a competitive disadvantage vis-à-vis competitors who are not required to make comparable changes to their business practices.
Changes in Internal Revenue Service regulations regarding the timing of income recognition and/or deductions could materially adversely affect the amount of our dividends.
On September 30, 2004, the IRS released Announcement 2004-75, which describes rules that may be included in proposed IRS regulations regarding the timing of recognizing income and/or deductions attributable to interest-only securities. We believe the effect of these regulations, if adopted, may narrow the spread between book income and taxable income on the interest-only securities we hold and would thus reduce our taxable income during the initial periods that we hold such securities. A significant portion of our mortgage securities—available-for-sale consists of interest-only securities. If regulations are adopted by the IRS that reduces our taxable income in a particular year during which we are a REIT, our dividend paid to common shareholders may be reduced for that year because, so long as we remain a REIT, the amount of our dividend on common stock is entirely dependent upon our taxable income.
If we do not maintain our REIT status, we would be subject to tax as a regular corporation and would otherwise operate as a regular corporation. We conduct a substantial portion of our business through our taxable REIT subsidiaries, which creates additional compliance requirements.
We must comply with numerous complex tests to continue to qualify as a REIT for federal income tax purposes, including the requirement that we distribute 90% of taxable income to our shareholders and the requirement that no more than 5% of our annual gross income come from non-qualifying sources. So long as we remain a REIT, failure to comply with these requirements may subject us to penalty taxes and may put our REIT status at risk. In the event that we fail to maintain or elect to terminate our REIT status, we would be taxed at the corporate level and would not be required to pay out our taxable income in the form of dividends. For any year that we do not generate taxable income, we are not required to declare and maintain dividends to maintain our REIT status.
We conduct a substantial portion of our business through taxable REIT subsidiaries, such as NovaStar Mortgage. Despite our qualification as a REIT, our taxable REIT subsidiaries must pay federal income tax on their taxable income. Our income from, and investments in, our taxable REIT subsidiaries do not constitute permissible income or investments for some of the REIT qualification tests. We may be subject to a 100% penalty tax, or our taxable REIT subsidiaries may be denied deductions, to the extent that our dealings with our taxable REIT subsidiaries are deemed not to be arm’s length in nature.
Our cash balances and cash flows may become limited relative to our cash needs, which may ultimately affect our REIT status or solvency.
We use cash for originating mortgage loans, to meet minimum REIT dividend distribution requirements, and for other operating needs. Cash is also required to pay interest on our outstanding indebtedness and may be required to pay down indebtedness in the event that the market values of the assets collateralizing our debt decline, the terms of short-term debt become less attractive or for other reasons. If our income as calculated for tax purposes significantly exceeds our cash flows from operations, our minimum REIT dividend distribution requirements could exceed the amount of our available cash. In the event that our liquidity needs exceed our access to liquidity, we may need to sell assets at an inopportune time, thus adversely affecting our financial condition and results of operations. Furthermore, in an adverse cash flow situation, our REIT status or our solvency could be threatened.
The tax imposed on REITs engaging in “prohibited transactions” will limit our ability to engage in transactions, including certain methods of securitizing loans, which would be treated as sales for federal income tax purposes.
A REIT’s net income from prohibited transactions is subject to a 100% tax. In general, prohibited transactions are sales or other dispositions of property, other than foreclosure property but including any mortgage loans held in inventory primarily for sale to customers in the ordinary course of business. We might be subject to this tax if we were to sell a loan or securitize the loans in a manner that was treated as a sale of such inventory for federal income tax purposes. Therefore, in order to avoid the prohibited transactions tax, we may choose not to engage in certain sales of loans other than through our taxable REIT subsidiaries and may limit the structures we utilize for our securitization transactions even though such sales or structures might otherwise be beneficial for us. In addition, this prohibition may limit our ability to restructure our portfolio of mortgage loans from time to time even if we believe it would be in our best interest to do so.
Even if we qualify as a REIT, the income earned by our taxable REIT subsidiaries will be subject to federal income tax and we could be subject to an excise tax on non-arm’s-length transactions with our taxable REIT subsidiaries.
Our taxable REIT subsidiaries, including NovaStar Mortgage, expect to earn income from activities that are prohibited for REITs, and will owe income taxes on the taxable income from these activities. For example, we expect that NovaStar Mortgage will earn income from our loan origination and sales activities, as well as from other origination and servicing functions, which would generally not be qualifying income for purposes of the gross income tests applicable to REITs or might otherwise be subject to adverse tax liability if the income were generated by a REIT. Our taxable REIT subsidiaries are taxable as C corporations and are subject to federal, state and local income tax at the applicable corporate rates on their taxable income, notwithstanding our qualification as a REIT.
In the event that any transactions between us and any of our taxable REIT subsidiaries are not conducted on an arm’s-length basis, we could be subject to a 100% excise tax on certain amounts from such transactions. Any such tax could affect our overall profitability and the amounts of cash available for operations or to make distributions.
We may, at some point in the future, borrow funds from one or more of our corporate subsidiaries. The IRS may recharacterize the indebtedness as a dividend distribution to us by our subsidiary. Any such recharacterization may cause us to fail one or more of the REIT requirements.
We may be harmed by changes in tax laws applicable to REITs or the reduced 15% tax rate on certain corporate dividends may harm us.
Changes to the laws and regulations affecting us, including changes to securities laws and changes to the Code applicable to the taxation of REITs may harm our business. New legislation may be enacted into law or new interpretations, rulings or regulations could be adopted, any of which could harm us and our shareholders, potentially with retroactive effect.
Generally, dividends paid by REITs are not eligible for the 15% U.S. federal income tax rate on certain corporate dividends, with certain exceptions. The more favorable treatment of regular corporate dividends could cause domestic non-corporate investors to consider stocks of other corporations that pay dividends as more attractive relative to stocks of REITs.
We may be unable to comply with the requirements applicable to REITs or compliance with such requirements could harm our financial condition.
The requirements to qualify as a REIT under the Code are highly technical and complex. We routinely rely on legal opinions to support our tax positions. A technical or inadvertent failure to comply with the Code as a result of an incorrect interpretation of the Code or otherwise could jeopardize our REIT status. The determination that we qualify as a REIT requires an analysis of various factual matters and circumstances that may not be totally within our control. For example, to qualify as a REIT, at least 75% of our gross income must come from real estate sources and 95% of our gross income must come from real estate sources and certain other sources that are itemized in the REIT tax laws, mainly interest and dividends. We are subject to various limitations on our ownership of securities, including a limitation that the value of our investment in taxable REIT subsidiaries, including NovaStar Mortgage, cannot exceed 20% of our total assets at the end of any calendar quarter. In addition, at the end of each calendar quarter, at least 75% of our assets must be qualifying real estate assets, government securities and cash and cash items. The need to comply with these asset ownership requirements may cause us to acquire other assets that are qualifying real estate assets for purposes of the REIT requirements (for example, interests in other mortgage loan portfolios or mortgage-related assets) but are not part of our overall business strategy and might not otherwise be the best investment alternative for us. Moreover, we may be unable to acquire sufficient qualifying REIT assets, due to our inability to obtain adequate financing or otherwise, in which case we may fail to qualify as a REIT or may incur a penalty tax at the REIT level.
Also, to qualify as a REIT, we must distribute to our shareholders with respect to each year at least 90% of our REIT taxable income (determined without regard to the dividends paid deduction and by excluding any net capital gain). After-tax earnings generated by our taxable REIT subsidiaries and not distributed to us are not subject to these distribution requirements and may be retained by such subsidiaries to provide for future growth, subject to the limitations imposed by REIT tax rules. To the extent that we satisfy the 90% distribution requirement, but distribute less than 100% of our taxable income, we will be subject to federal corporate income tax on our undistributed taxable income. In addition, we will be subject to a 4% nondeductible excise tax if the actual amount that we pay out to our shareholders in a calendar year is less than a minimum amount specified under federal tax laws. We expect in some years that we will be subject to the 4% excise tax. We could be required to borrow funds on a short-term basis even if conditions are not favorable for borrowing, or to sell loans from our portfolio potentially at disadvantageous prices, to meet the REIT distribution requirements and to avoid corporate income taxes. These alternatives could harm our financial condition and could reduce amounts available to originate mortgage loans.
If we fail to qualify or remain qualified as a REIT, our distributions will not be deductible by us, and we will be subject to federal income tax on our taxable income. This would substantially reduce our earnings and our cash available to make distributions. The resulting tax liability, in the event of our failure to qualify as a REIT, might cause us to borrow funds, liquidate some of our investments or take other steps that could negatively affect our operating results. Moreover, if our REIT status is terminated because of our failure to meet a technical REIT requirement or if we voluntarily revoke our election, we generally would be disqualified from electing treatment as a REIT for the four taxable years following the year in which REIT status is lost.
We could lose our REIT status if more than 20% of the value of our total assets are represented by the securities of one or more taxable REIT subsidiaries at the close of any calendar quarter.
To qualify as a REIT, not more than 20% of the value of our total assets may be represented by the securities of one or more taxable REIT subsidiaries at the close of any calendar quarter, subject to a 30-day “cure” period following the close of the quarter and, for taxable years beginning on or after January 1, 2005, subject to certain relief provisions even after the 30-day cure period. Our taxable REIT subsidiaries, including NovaStar Mortgage, conduct a substantial portion of our business activities, including a majority of our loan origination and servicing activities. If the IRS determines that the value of our investment in our taxable REIT subsidiaries was more than 20% of the value of our total assets at the close of any calendar quarter, we could lose our REIT status. In certain cases, we may need to borrow from third parties to acquire additional qualifying REIT assets or increase the amount and frequency of dividends from our taxable REIT subsidiaries in order to comply with the 20% of assets test.
Risks Related to Our Capital Stock
Investors in our common stock may experience losses, volatility and poor liquidity, and we may reduce or delay payment of our dividends in a variety of circumstances.
Our earnings, cash flow, taxable income, GAAP income, book value and dividends can be volatile and difficult to predict. Investors should not rely on past performance, predictions or management beliefs. Although we historically paid a regular common stock dividend, we may reduce or eliminate our dividend payments in the future for a variety of reasons. For example, to the extent that the historic difference between our taxable income and GAAP income is reduced or reversed due to changes in the tax laws, our operating results or otherwise, our dividend could be reduced or eliminated. Furthermore, if we failed, or chose not to satisfy the complex requirements necessary to maintain our REIT status, our dividend may be reduced or eliminated because we would not be required to pay out our taxable income in the form of dividends. We may not provide public warnings of such dividend reductions or eliminations prior to their occurrence. Fluctuations in our current and prospective earnings, cash flow and dividends, as well as many other factors such as perceptions, economic conditions, stock market conditions, and the like, can affect the price of our common stock. Investors may experience volatile returns and material losses. In addition, liquidity in the trading of our common stock may be insufficient to allow investors to sell their stock in a timely manner or at a reasonable price.
We may not pay common stock dividends to stockholders.
So long as we maintain our status as a REIT, REIT provisions of the Code generally require that we annually distribute to our stockholders at least 90% of all of our taxable income, exclusive of the application of any tax loss carry forwards that may be used to offset current period taxable income. These provisions restrict our ability to retain earnings and thereby generate capital from our operating activities. If in any year, however, we do not generate taxable income, we are not required to declare and pay common stock dividends to maintain our REIT status. In addition, we are currently evaluating and may decide at a future date to terminate our REIT status, which would cause us to be taxed at corporate levels and to significantly reduce or eliminate regular dividends.
Restrictions on ownership of capital stock may inhibit market activity and the resulting opportunity for holders of our capital stock to receive a premium for their securities.
In order for us to meet the requirements for qualification as a REIT, our charter generally prohibits, so long as we remain a REIT, any person from acquiring or holding, directly or indirectly, (i) shares of our common stock in excess of 9.8% (in value or number of shares, whichever is more restrictive) of the aggregate outstanding shares of our common stock or (ii) shares of our capital stock in excess of 9.8% in value of the aggregate outstanding shares of our capital stock. These restrictions may inhibit market activity and the resulting opportunity for the holders of our capital stock to receive a premium for their stock that might otherwise exist in the absence of such restrictions.
The market price of our common stock and trading volume may be volatile, which could result in substantial losses for our shareholders.
The market price of our common stock can be highly volatile and subject to wide fluctuations. In addition, the trading volume in our common stock may fluctuate and cause significant price variations to occur. Some of the factors that could negatively affect our share price or result in fluctuations in the price or trading volume of our common stock include:
general market and economic conditions;
actual or anticipated changes in residential real estate value;
actual or anticipated changes in the delinquency and default rates on mortgage loans, in general, and specifically on the loans we originate or invest in through our mortgage securities-available for-sale;
actual or anticipated changes in our future financial performance;
actual or anticipated changes in market interest rates;
actual or anticipated changes in our access to capital;
actual or anticipated changes in the amount of our dividend or any delay in the payment of a dividend;
competitive developments, including announcements by us or our competitors of new products or services;
the operations and stock performance of our competitors;
developments in the mortgage lending industry or the financial services sector generally;
the impact of new state or federal legislation or adverse court decisions;
fluctuations in our quarterly operating results;
the activities of investors who engage in short sales of our common stock;
actual or anticipated changes in financial estimates by securities analysts;
sales, or the perception that sales could occur, of a substantial number of shares of our common stock by insiders;
additions or departures of senior management and key personnel; and
actions by institutional shareholders.
Our common stock may become illiquid if an active public trading market cannot be sustained, which could adversely affect the trading price and your ability to transfer our common stock.
Our common stock’s trading volume is relatively low compared to the securities of many other companies listed on the New York Stock Exchange. If an active public trading market cannot be sustained, the trading price of our common stock could be adversely affected and your ability to transfer your shares of our common stock may be limited.
We may issue additional shares that may cause dilution and may depress the price of our common stock.
Our charter permits our board of directors, without shareholder approval, to:
authorize the issuance of additional shares of common stock or preferred stock without shareholder approval, including the issuance of shares of preferred stock that have preference rights over the common stock with respect to dividends, liquidation, voting and other matters or shares of common stock that have preference rights over our outstanding common stock with respect to voting; and
classify or reclassify any unissued shares of common stock or preferred stock and to set the preferences, rights and other terms of the classified or reclassified shares.
In the future, we expect to access the capital markets from time to time by making additional offerings of securities, including debt instruments, preferred stock or common stock. Additional equity offerings by us may dilute your interest in us or reduce the market price of our common stock, or both. Our outstanding shares of preferred stock have, and any additional series of preferred stock may also have, a preference on distribution payments that could limit our ability to make a distribution to common shareholders. Because our decision to issue securities in any future offering will depend on market conditions and other factors beyond our control, we cannot predict or estimate the amount, timing or nature of our future offerings. Further, market conditions could require us to accept less favorable terms for the issuance of our securities in the future. Thus, our common shareholders will bear the risk of our future offerings reducing the market price of our common stock and diluting their interest in us.
Other Risks Related to our Business
Intense competition in our industry may harm our financial condition.
Our loan origination business faces intense competition, primarily from consumer finance companies, conventional mortgage bankers, commercial banks, credit unions, thrift institutions, and other independent wholesale mortgage lenders, including internet-based lending companies and other mortgage REITs. Competitors with lower costs of capital have a competitive advantage over us. In addition, establishing a mortgage lending operation such as ours requires a relatively small commitment of capital and human resources, which permits new competitors to enter our markets quickly and to effectively compete with us. Furthermore, national banks, thrifts and their operating subsidiaries are generally exempt from complying with many of the state and local laws that affect our operations, such as the prohibition on prepayment penalties. Thus, they may be able to provide more competitive pricing and terms than we can offer. Any increase in the competition among lenders to originate nonconforming mortgage loans may result in either reduced income on mortgage loans compared to present levels, or revised underwriting standards permitting higher loan-to-value ratios on properties securing nonconforming mortgage loans, either of which could adversely affect our results of operations, financial condition or business prospects. In addition, the government-sponsored entities, Fannie Mae and Freddie Mac, may also expand their participation in the subprime mortgage industry. To the extent they materially expand their purchase of subprime loans, our ability to profitably originate and purchase mortgage loans may be adversely affected because their size and cost-of-funds advantage allows them to purchase loans with lower rates or fees than we are willing to offer.
If we are unable to maintain and expand our network of independent brokers, our loan origination business will decrease.
A significant majority of our originations of mortgage loans comes from independent brokers. For the year ended December 31, 2006, 86% of our loan originations were originated through our broker network. Our brokers are not contractually obligated to do business with us. Further, our competitors also have relationships with our brokers and actively compete with us in our efforts to expand our broker networks. Our failure to maintain existing relationships or expand our broker networks could significantly harm our business, financial condition, liquidity and results of operations.
Our reported GAAP financial results differ from the taxable income results that drive our common stock dividend distributions, and our consolidated balance sheet, income statement, and statement of cash flows as reported for GAAP purposes may be difficult to interpret.
We manage our business based on long-term opportunities to earn cash flows. Our common stock dividend distributions are driven by the REIT tax laws and our taxable income as calculated pursuant to the Code. Our reported results for GAAP purposes differ materially, however, from both our cash flows and our taxable income. We transfer mortgage loans or mortgage securities into securitization trusts to obtain long-term non-recourse funding for these assets. When we surrender control over the transferred mortgage loans or mortgage securities, the transaction is accounted for as a sale. When we retain control over the transferred mortgage loans or mortgage securities, the transaction is accounted for as a secured borrowing. These securitization transactions do not differ materially in their structure or cash flow generation characteristics, yet under GAAP accounting these transactions are recorded differently. In a securitization transaction accounted for as a sale, we record a gain or loss on the assets transferred in our income statement and we record the retained interests at fair value on our balance sheet. In a securitization transaction accounted for as a secured borrowing, we consolidate all the assets and liabilities of the trust on our financial statements (and thus do not show the retained interest we own as an asset). As a result of this and other accounting issues, shareholders and analysts must undertake a complex analysis to understand our economic cash flows, actual financial leverage, and dividend distribution requirements. This complexity may cause trading in our stock to be relatively illiquid or may lead observers to misinterpret our results.
Market values for our mortgage assets and hedges can be volatile. For GAAP purposes, we mark-to-market our non-hedging derivative instruments through our GAAP consolidated income statement and we mark-to-market our mortgage securities—available-for-sale through our GAAP consolidated balance sheet through other comprehensive income unless the mortgage securities are in an unrealized loss position which has been deemed as an other-than-temporary impairment. An other-than-temporary impairment is recorded through the income statement in the period incurred. Additionally, we do not mark-to-market our loans held for sale as they are carried at lower of cost or market, as such, any change in market value would not be recorded through our income statement until the related loans are sold. If we sell an asset that has not been marked-to-market through our income statement at a reduced market price relative to its basis, our reported earnings will be reduced. A decrease in market value of our mortgage assets may or may not result in deterioration in future cash flows. As a result, changes in our GAAP consolidated income statement and balance sheet due to market value adjustments should be interpreted with care.
If we attempt to make any acquisitions, we will incur a variety of costs and may never realize the anticipated benefits.
In the past we have acquired businesses that we believe are a strategic fit with our business and expect to pursue additional acquisition opportunities in the future. The process of negotiating the acquisition and integrating an acquired business may result in operating difficulties and expenditures and may require significant management attention that would otherwise be available for ongoing development of our business. Moreover, we may never realize the anticipated benefits of any acquisitions. Future acquisitions could result in potentially dilutive issuances of equity securities, the incurrence of debt, contingent liabilities and/or amortization expenses related to goodwill and other intangible assets, which could harm our results of operations, financial condition and business prospects.
The inability to attract and retain qualified employees could significantly harm our business.
We depend on the diligence, skill and experience of our top executives, including our chief executive officer, our president and chief operating officer, and our chief investment officer. To the extent that one or more of our top executives are no longer employed by us, our operations and business prospects may be adversely affected. We also depend on our employees who structure our securitizations and who manage our portfolio of mortgage securities. To the extent that we lose the services of these employees, our ability to manage our portfolio business and our profitability will be adversely affected. Further, we rely on our wholesale account executives and retail loan officers to attract borrowers by, among other things, developing relationships with financial institutions, other mortgage companies and brokers, real estate agents, borrowers and others. The market for skilled account executives and loan officers is highly competitive and historically has experienced a high rate of turnover. Competition for qualified account executives and loan officers may lead to increased hiring and retention costs. If we are unable to attract or retain a sufficient number of skilled account executives at manageable costs, we will be unable to continue to originate quality mortgage loans that we are able to sell for a profit, which would harm our results of operations, financial condition and business prospects.
The success and growth of our business will depend upon our ability to adapt to and implement technological changes.
Our mortgage loan origination business is currently dependent upon our ability to effectively interface with our brokers, borrowers and other third parties and to efficiently process loan applications and closings. The origination process is becoming more dependent upon technological advancement, such as the ability to process applications over the Internet, accept electronic signatures and provide process status updates instantly and other customer-expected conveniences that are cost-efficient to our process. Becoming proficient with new technology will require significant financial and personnel resources. If we become reliant on any particular technology or technological solution, we may be harmed to the extent that such technology or technological solution (i) becomes non-compliant with existing industry standards, (ii) fails to meet or exceed the capabilities of our competitors’ equivalent technologies or technological solutions, (iii) becomes increasingly expensive to service, retain and update, or (iv) becomes subject to third-party claims of copyright or patent infringement. Any failure to acquire technologies or technological solutions when necessary could limit our ability to remain competitive in our industry and could also limit our ability to increase the cost-efficiencies of our operating model, which would harm our results of operations, financial condition and business prospects.
Our business could be adversely affected if we experienced an interruption in or breach of our communication or information systems or if we were unable to safeguard the security and privacy of the personal financial information we receive.
We rely heavily upon communications and information systems to conduct our business. Any material interruption, or breach in security, of our communication or information systems or the third-party systems on which we rely could cause underwriting or other delays and could result in fewer loan applications being received, slower processing of applications and reduced efficiency in loan servicing. Additionally, in connection with our loan file due diligence reviews, we have access to the personal financial information of the borrowers which is highly sensitive and confidential, and subject to significant federal and state regulation. If a third party were to misappropriate this information or if we inadvertently disclosed this information, we potentially could be subject to both private and public legal actions. Our policies and safeguards may not be sufficient to prevent the misappropriation or inadvertent disclosure of confidential information, may become noncompliant with existing federal or state laws or regulations governing privacy, or with those laws or regulations that may be adopted in the future.
We may enter into certain transactions at the REIT in the future that incur excess inclusion income that will increase the tax liability of our shareholders.
When we incur excess inclusion income at the REIT, it will be allocated among our shareholders. A shareholder’s share of excess inclusion income (i) would not be allowed to be offset by any net operating losses otherwise available to the shareholder, (ii) would be subject to tax as unrelated business taxable income in the hands of most types of shareholders that are otherwise generally exempt from federal income tax, and (iii) would result in the application of U.S. federal income tax withholding at the maximum rate (i.e., 30%), without reduction for any otherwise applicable income tax treaty, to the extent allocable to most types of foreign shareholders. How such income is to be reported to shareholders is not clear under current law. Tax-exempt investors, foreign investors, and taxpayers with net operating losses should carefully consider the tax consequences of having excess inclusion income allocated to them and are urged to consult their tax advisors.
Excess inclusion income would be generated if we issue debt obligations with two or more maturities and the terms of the payments on these obligations bear a relationship to the payments that we received on our mortgage loans or mortgage-backed securities securing those debt obligations. The structure of this type of CMO securitization generally gives rise to excess inclusion income. It is reasonably likely that we will structure some future CMO securitizations in this manner. Excess inclusion income could also result if we were to hold a residual interest in a REMIC. The amounts of excess inclusion income in any given year from these transactions could be significant.
Some provisions of our charter, bylaws and Maryland law may deter takeover attempts, which may limit the opportunity of our shareholders to sell their common stock at favorable prices.
Certain provisions of our charter, bylaws and Maryland law could discourage, delay or prevent transactions that involve an actual or threatened change in control, and may make it more difficult for a third party to acquire us, even if doing so may be beneficial to our shareholders by providing them with the opportunity to sell their shares possibly at a premium over the then market price. For example, our board of directors is divided into three classes with three year staggered terms of office. This makes it more difficult for a third party to gain control of our board because a majority of directors cannot be elected at a single meeting. Further, under our charter, generally a director may only be removed for cause and only by the affirmative vote of the holders of at least a majority of all classes of shares entitled to vote in the election for directors together as a single class. Our bylaws make it difficult for any person other than management to introduce business at a duly called meeting requiring such other person to follow certain advance notice procedures. Finally, Maryland law provides protection for Maryland corporations against unsolicited takeover situations. These provisions, as well as others, could discourage potential acquisition proposals, or delay or prevent a change in control and prevent changes in our management, even if such actions would be in the best interests of our shareholders.
Strategies undertaken to comply with REIT requirements under the Code may create volatility in future reported GAAP earnings.
Certain of the residual securities that historically have been held at the REIT generate interest income based on cash flows received from excess interest spread, prepayment penalties and derivatives (i.e., interest rate swap and cap contracts). The cash flows received from the derivatives do not represent qualified income for the REIT income tests requirements of the Code. The Code limits the amount of income from derivative income together with any income not generated from qualified REIT assets to no more than 25% of our gross income. In addition, under the Code, we must limit our aggregate income from derivatives (that are non-qualified tax hedges) and from other non-qualifying sources to no more than 5% of our annual gross income. Because of the magnitude of the derivative income projected for 2006 it was highly likely that we would not satisfy the REIT income tests. In order to resolve this REIT qualification issue, we isolated cash flows received from certain residual securities and created a separate security (the “CT Bonds”). We then contributed the CT Bonds from the REIT to our taxable REIT subsidiary. This transaction may add volatility to future reported GAAP earnings because both the interest only residual bonds (“IO Bonds”) and CT Bonds will be evaluated separately for impairment. Historically, the CT Bonds have acted as an economic hedge for the IO Bonds that are retained at the REIT, thus mitigating the impairment risk to the IO Bonds in a rising interest rate environment. As a result of transferring the CT Bonds to the TRS, the IO and CT Bonds will be valued separately creating the risk of earnings volatility resulting from other-than-temporary impairment charges. For example, in a rising rate environment, the IO bond will generally decrease in value while the CT Bond will increase in value. If the decrease in value of the IO Bond is deemed to be other than temporary in nature, we would record an impairment charge through the income statement for such decrease. At the same time, any increase in value of the CT Bond would be recorded in accumulated other comprehensive income.
Item 1B.Unresolved Staff Comments
None
Our executive, administrative and loan servicing offices are located in Kansas City, Missouri, and consist of approximately 200,000 square feet of leased office space. The lease agreements on the premises expire in January 2011. The current annual rent for these offices is approximately $4.2 million.
We lease office space for our mortgage lending operations in Lake Forest, California; Independence, Ohio; Richfield, Ohio; Troy, Michigan, Salt Lake City, Utah, Carmel, Indiana and Columbia, Maryland. Currently, these offices consist of approximately 316,444 square feet. The leases on the premises expire from December 2009 through May 2013, and the current annual rent is approximately $5.5 million. In addition the mortgage lending operations have mortgage production offices located in various states with premises lease terms expiring in a range of two months up to 3.5 years.
Since April 2004, a number of substantially similar class action lawsuits have been filed and consolidated into a single action in the Untied States District Court for the Western District of Missouri. The consolidated complaint names us and three of our executive officers as defendants and generally alleges that the defendants made public statements that were misleading for failing to disclose certain regulatory and licensing matters. The plaintiffs purport to have brought this consolidated action on behalf of all persons who purchased our common stock (and sellers of put options on our common stock) during the period October 29, 2003 through April 8, 2004. On January 14, 2005, we filed a motion to dismiss this action, and on May 12, 2005, the court denied such motion. On February 8, 2007, the court certified the case as a class action, and on February 20, 2007, we filed a motion to reconsider with the court. We believe that these claims are without merit and continue to vigorously defend against them.
In the wake of the securities class action, we have also been named as a nominal defendant in several derivative actions brought against certain of our officers and directors in Missouri and Maryland. The complaints in these actions generally claim that the defendants are liable to us for failing to monitor corporate affairs so as to ensure compliance with applicable state licensing and regulatory requirements.
In April 2005, three putative class actions filed against NHMI and certain of its affiliates were consolidated for pre-trial proceedings in the United States District Court for the Southern District of Georgia entitledIn Re NovaStar Home Mortgage, Inc. Mortgage Lending Practices Litigation. These cases contend that NHMI improperly shared settlement service fees with limited liability companies in which NHMI had an interest (the “LLCs”), in violation of the fee splitting and anti-referral provisions of the federal Real Estate Settlement Procedures Act (“RESPA”), and also allege certain violations of state law and civil conspiracy. Plaintiffs seek treble damages with respect to the RESPA claims, disgorgement of fees with respect to the state law claims as well as other damages, injunctive relief, and attorneys’ fees. In addition, two other related class actions have been filed in state courts.Miller v. NovaStar Financial, Inc., et al., was filed in October 2004 in the Circuit Court of Madison County, Illinois andJones et al. v. NovaStar Home Mortgage, Inc., et al., was filed in December 2004 in the Circuit Court for Baltimore City, Maryland. In theMiller case, plaintiffs allege a violation of the Illinois Consumer Fraud and Deceptive Practices Act and civil conspiracy and contend certain LLCs provided settlement services without the borrower’s knowledge. The plaintiffs in the Miller case seek a disgorgement of fees, other damages, injunctive relief and attorney’s fees on behalf of the class of plaintiffs. In theJones case, the plaintiffs allege the LLCs violated the Maryland Mortgage Lender Law by acting as lenders and/or brokers in Maryland without proper licenses and contend this arrangement amounted to a civil conspiracy. The plaintiffs in theJones case seek a disgorgement of fees and attorney’s fees. In January 2007, all of the plaintiffs and NHMI agreed upon a nationwide settlement. Since not all class members will elect to be part of the settlement, we estimated the probable obligation related to the settlement to be in a range of $3.9 million to $4.7 million. In accordance with SFAS No. 5, “Accounting for Contingencies”, we recorded a charge to earnings of $3.9 million in December of 2006. This amount is included in “Accounts payable and other liabilities” on our consolidated balance sheet and included in “Professional and outside services” on our consolidated statement of income.
In December 2005, a putative class action was filed against NMI in the United States District Court for the Western District of Washington entitledPierce et al. v. NovaStar Mortgage, Inc. Plaintiffs contend that NMI failed to disclose prior to closing that a broker payment would be made on their loans, which was an unfair and deceptive practice in violation of the Washington Consumer Protection Act. Plaintiffs seek excess interest charged, and treble damages as provided in the Washington Consumer Protection Act and attorney’s fees. On October 31, 2006, the district court granted plaintiffs’ motion to certify a Washington state class. NMI sought to appeal the grant of class certification; however, a panel of the Ninth Circuit Court of Appeals denied the request for interlocutory appeal so review of the class certification order must wait until after a final judgment is entered, if necessary. The case is set for trial on April 23, 2007. NMI believes that it has valid defenses to plaintiffs’ claims and it intends to vigorously defend against them.
In December 2005, a putative class action was filed against NHMI in the United States District Court for the Middle District of Louisiana entitledPearson v. NovaStar Home Mortgage, Inc. Plaintiff contends that NHMI violated the federal Fair Credit Reporting Act (“FCRA”) in connection with its use of pre-approved offers of credit. Plaintiff seeks (on his own behalf, as well as for others similarly situated) statutory damages, other nominal damages, punitive damages and attorney’s fees and costs. In January 2007, the named plaintiff and NHMI agreed to settle the lawsuit for a nominal amount.
In February, 2007, two putative class actions were filed in the United States District Court for the Western District of Missouri. The complaints name us and three of our executive officers as defendants and generally allege, among other things, that the defendants made materially false and misleading statements regarding our business and financial results. The plaintiffs purport to have brought the actions on behalf of all persons who purchased or otherwise acquired our common stock during the period May 4, 2006 through February 20, 2007. We believe that these claims are without merit and will vigorously defend against them.
In addition to those matters listed above, we are currently a party to various other legal proceedings and claims, including, but not limited to, breach of contract claims, class action or individual claims for violations of the RESPA, FLSA, federal and state laws prohibiting employment discrimination, federal and state laws prohibiting discrimination in lending and federal and state licensing and consumer protection laws.
While management, including internal counsel, currently believes that the ultimate outcome of all these proceedings and claims will not have a material adverse effect on our financial condition or results of operations, litigation is subject to inherent uncertainties. If an unfavorable ruling were to occur, there exists the possibility of a material adverse impact on our financial condition and results of operations.
Item 4.Submission of Matters to a Vote of Security Holders
None
Item 5.Market for Registrant’s Common Equity, Related Stockholder Matters and Issuer Purchases of Equity Securities
Market Price of and Dividends on the Registrant’s Common Equity and Related Stockholder Matters. Our common stock is traded on the NYSE under the symbol “NFI”. The following table sets forth, for the periods indicated, the high and low sales prices per share of common stock on the NYSE and the cash dividends paid or payable per share of common stock.
| Dividends | |||||||||||||
| High | Low | Date Declared | Date Paid | Amount Per Share | |||||||||
2005 | |||||||||||||
First Quarter | $ | 48.15 | $ | 32.40 | 5/2/05 | 5/27/05 | $ | 1.40 | |||||
Second Quarter | 39.98 | 34.50 | 7/29/05 | 8/26/05 | 1.40 | ||||||||
Third Quarter | 42.19 | 32.20 | 9/15/05 | 11/22/05 | 1.40 | ||||||||
Fourth Quarter | 33.01 | 26.20 | 12/14/05 | 1/13/06 | 1.40 | ||||||||
2006 | |||||||||||||
First Quarter | $ | 33.80 | $ | 25.70 | 5/4/06 | 5/26/06 | $ | 1.40 | |||||
Second Quarter | 37.63 | 29.08 | 8/3/06 | 8/28/06 | 1.40 | ||||||||
Third Quarter | 35.60 | 28.25 | 9/11/06 | 11/30/06 | 1.40 | ||||||||
Fourth Quarter | 32.81 | 26.32 | 9/11/06 | 12/29/06 | 1.40 | ||||||||
As of February 23, 2007, we had approximately 2,243 shareholders of record of our common stock, including holders who are nominees for an undetermined number of beneficial owners based upon a review of the securities position listing provided by our transfer agent.
As long as we remain a REIT, we intend to make distributions to shareholders of all or substantially all of taxable income in each year, subject to certain adjustments, so as to qualify for the tax benefits accorded to a REIT under the Code. All distributions will be made at the discretion of the Board of Directors and will depend on earnings, financial condition, maintenance of REIT status, cost of equity, investment opportunities and other factors as the Board of Directors may deem relevant. Our estimate of 2006 taxable income already distributed to shareholders in the form of dividends is $17 million which includes $1.7 million of preferred dividends paid on January 2, 2007. During 2007, we expect to payout all of our remaining 2006 taxable income, which we currently estimate to be approximately $170 million, in the form of dividends. During the period 2007 through 2011, we expect to recognize little, if any, taxable income as tax losses are realized on our current outstanding securitizations because of the reversal in timing differences between the recognition of GAAP income and taxable income. Further, we do not expect that our recent and future securitizations will result in significant taxable income in the early years due to steps we have taken over the last two years to structure our securitizations to minimize the difference between tax and GAAP income. This combination of our older securitizations maturing and the structuring of our recent and future securitizations will result in minimal taxable income over the next several years. This reduction in taxable income will correspondingly result in little, if any, common stock dividend distributions for those respective years, regardless of whether we remain a REIT. See “Industry Overview and Known Material Trends and Uncertainties” for further discussion regarding future uncertainties surrounding our taxable income.
Recent Sales of Unregistered Securities.
None
Purchase of Equity Securities by the Issuer.
Issuer Purchases of Equity Securities
(dollars in thousands)
Total Number of Shares Purchased | Average Price Paid per Share | Total Number of Shares Purchased as Part of Publicly Programs | Approximate Dollar Value of Shares | ||||||
October 1, 2006 – October 31, 2006 | — | — | — | $ | 1,020 | ||||
November 1, 2006 – November 30, 2006 | — | — | — | 1,020 | |||||
December 1, 2006 – December 31, 2006 | — | — | — | 1,020 | |||||
| (A) | A current report on Form 8-K was filed on October 2, 2000 announcing that the Board of Directors authorized the Company to repurchase its common shares, bringing the total authorization to $9 million. |
Item 6.Selected Financial Data
The following selected consolidated financial data is derived from our audited consolidated financial statements for the periods presented and should be read in conjunction with the more detailed information therein and “Management’s Discussion and Analysis of Financial Condition and Results of Operations” included elsewhere in this annual report. Operating results are not necessarily indicative of future performance.
Selected Consolidated Financial and Other Data
(dollars in thousands, except per share amounts)
| For the Year Ended December 31, | ||||||||||||||||||||
| 2006 | 2005(A) | 2004(A) | 2003(A) | 2002(A) | ||||||||||||||||
Consolidated Statement of Operations Data: | ||||||||||||||||||||
Interest income | $ | 494,890 | $ | 320,727 | $ | 230,845 | $ | 171,468 | $ | 108,227 | ||||||||||
Interest expense | 235,331 | 80,755 | 52,482 | 40,364 | 27,728 | |||||||||||||||
Net interest income before credit (losses) recoveries | 259,559 | 239,972 | 178,363 | 131,104 | 80,499 | |||||||||||||||
Credit (losses) recoveries | (30,131 | ) | (1,038 | ) | (726 | ) | 389 | 432 | ||||||||||||
Gains on sales of mortgage assets | 41,749 | 65,148 | 144,950 | 144,005 | 53,305 | |||||||||||||||
Gains (losses) on derivative instruments | 11,998 | 18,155 | (8,905 | ) | (30,837 | ) | (36,841 | ) | ||||||||||||
Impairment on mortgage securities – available for sale | (30,690 | ) | (17,619 | ) | (15,902 | ) | — | — | ||||||||||||
General and administrative expenses | 201,261 | 184,630 | 168,260 | 143,512 | 65,754 | |||||||||||||||
Income from continuing operations | 77,205 | 150,827 | 138,942 | 111,946 | 48,212 | |||||||||||||||
(Loss) gain from discontinued operations, net of income tax | (4,267 | ) | (11,703 | ) | (23,553 | ) | 50 | 549 | ||||||||||||
Net income available to common shareholders | 66,285 | 132,471 | 109,124 | 111,996 | 48,761 | |||||||||||||||
Basic income per share: | ||||||||||||||||||||
Income from continuing operations available to common shareholders | $ | 2.07 | $ | 4.86 | $ | 5.24 | $ | 5.04 | $ | 2.32 | ||||||||||
(Loss) gain from discontinued operations, net of income tax | (0.13 | ) | (0.40 | ) | (0.93 | ) | — | 0.03 | ||||||||||||
Net income available to common shareholders | $ | 1.94 | $ | 4.46 | $ | 4.31 | $ | 5.04 | $ | 2.35 | ||||||||||
Diluted income per share: | ||||||||||||||||||||
Income from continuing operations available to common shareholders | $ | 2.04 | $ | 4.81 | $ | 5.15 | $ | 4.91 | $ | 2.23 | ||||||||||
(Loss) gain from discontinued operations, net of income tax | (0.12 | ) | (0.39 | ) | (0.91 | ) | — | 0.02 | ||||||||||||
Net income available to common shareholders | $ | 1.92 | $ | 4.42 | $ | 4.24 | $ | 4.91 | $ | 2.25 | ||||||||||
Mortgage Assets: Mortgage loans – held-for-sale Mortgage loans – held-in-portfolio Mortgage securities – available-for-sale Mortgage securities - trading Total assets Borrowings Shareholders’ equity As of December 31, 2006 2005 2004 2003 2002 Consolidated Balance Sheet Data: $ 1,741,819 $ 1,291,556 $ 747,594 $ 697,992 $ 983,633 2,116,535 28,840 59,527 94,717 149,876 349,312 505,645 489,175 382,287 178,879 329,361 43,738 143,153 — — 5,028,263 2,335,734 1,861,311 1,399,957 1,452,497 4,312,258 1,619,812 1,295,422 1,005,516 1,225,228 514,570 564,220 426,344 300,224 183,257
| For the Year Ended December 31, | ||||||||||||||||||||
| 2006 | 2005 | 2004 | 2003 | 2002 | ||||||||||||||||
Other Data: | ||||||||||||||||||||
Nonconforming loans originated or purchased, principal | $ | 11,224,088 | $ | 9,283,138 | $ | 8,424,361 | $ | 5,250,978 | $ | 2,492,767 | ||||||||||
Loans securitized, principal | $ | 8,625,318 | $ | 7,621,030 | $ | 8,329,804 | $ | 5,319,435 | $ | 1,560,001 | ||||||||||
Nonconforming loans sold, principal | $ | 2,248,633 | $ | 1,138,098 | $ | — | $ | 151,210 | $ | 142,159 | ||||||||||
Loan servicing portfolio, principal | $ | 16,659,784 | $ | 14,030,697 | $ | 12,151,196 | $ | 7,206,113 | $ | 3,657,640 | ||||||||||
Annualized return on assets | 1.98 | % | 6.63 | % | 7.08 | % | 7.85 | % | 4.96 | % | ||||||||||
Annualized return on equity | 13.52 | % | 28.09 | % | 31.76 | % | 46.33 | % | 31.13 | % | ||||||||||
Taxable net income available to common shareholders (B) | $ | 180,627 | $ | 270,432 | $ | 250,555 | $ | 137,851 | $ | 49,511 | ||||||||||
Taxable net income per common share (B) (C) | $ | 4.85 | $ | 8.40 | $ | 9.04 | $ | 5.64 | $ | 2.36 | ||||||||||
Dividends declared per common share (C) | $ | 5.60 | $ | 5.60 | $ | 6.75 | $ | 5.04 | $ | 2.15 | ||||||||||
Dividends declared per preferred share | $ | 2.23 | $ | 2.23 | $ | 2.11 | $ | — | $ | — | ||||||||||
| (A) | Reclassified to conform to current year presentation in accordance with SFAS No. 144,Accounting for the Impairment or Disposal of Long-Lived Assets,as described in Note 15 to the consolidated financial statements. |
| (B) | Taxable income for years prior to 2006 are actual while 2006 taxable income is an estimate. For a reconciliation of taxable income to GAAP income see “Income Taxes” included in “Management’s Discussion and Analysis of Financial Condition and Results of Operations.” The common shares outstanding as of the end of each period presented are used in calculating the taxable income per common share. |
| (C) | On January 29, 2003, a $0.165 special dividend related to 2002 taxable income was declared per common share. On December 22, 2004, a $1.25 special dividend related to 2004 taxable income was declared per common share. |
Item 7.Management’s Discussion and Analysis of Financial Condition and Results of Operations
The following discussion should be read in conjunction with the consolidated financial statements of NovaStar Financial, Inc. and the notes thereto included elsewhere in this report.
General Overview
We are a specialty finance company that originates, purchases, securitizes, sells, invests in and services residential nonconforming loans and mortgage-backed securities. We operate through three separate operating segments – mortgage portfolio management, mortgage lending and loan servicing.
We offer a wide range of mortgage loan products to “nonconforming borrowers,” who generally do not satisfy the credit, collateral, documentation or other underwriting standards prescribed by conventional mortgage lenders and loan buyers, including U.S. government-sponsored entities such as Fannie Mae or Freddie Mac. We retain significant interests in the nonconforming loans we originate and purchase through our mortgage securities investment portfolio. Through our servicing platform, we then service all of the loans in which we retain interests, in order to better manage the credit performance of those loans.
We have elected to be taxed as a REIT under the Code. We must meet numerous rules established by the IRS to retain our status as a REIT. As long as we maintain our REIT status, distributions to shareholders will generally be deductible by us for income tax purposes. This deduction effectively eliminates REIT level income taxes. Management believes we have met the requirements to maintain our REIT status. We are, however, currently evaluating whether it is in shareholders’ best interests to retain our REIT status.
Our net income is highly dependent upon our mortgage securities portfolio, which is generated primarily from the securitization of nonconforming loans we have originated and purchased but also includes third-party mortgage-backed securities we have purchased. These securities represent the right to receive the net future cash flows from a pool of assets consisting primarily of nonconforming loans. As a result, earnings are related to the volume of nonconforming loans and related performance factors for those loans, including their average coupon, borrower default rate and borrower prepayment rate.
The primary function of our mortgage lending operations is to generate nonconforming loans, the majority of which will serve as collateral for our mortgage securities. While our mortgage lending operations generate sizable revenues in the form of gains on sales of mortgage loans and fee income from borrowers and third party investors, the revenue serves largely to offset the related costs.
We also service the mortgage loans we originate and purchase and that serve as collateral for the mortgage securities that we issue. The servicing function is critical to the management of credit risk (risk of borrower default and the related economic loss) within our mortgage portfolio. This operation generates significant fee revenue and interest income from investing funds held as custodian, but its revenue serves largely to offset the cost of this function.
The key performance measures for executive management are:
net income available to common shareholders
dollar volume of nonconforming mortgage loans originated and purchased
relative cost of the loans originated and purchased
characteristics of the loans (coupon, credit quality, etc.), which will indicate their expected yield, and
return on our mortgage asset investments and the related management of interest rate risk.
Management’s discussion and analysis of financial condition and results of operations, along with other portions of this report, are designed to provide information regarding our performance and these key performance measures.
Executive Overview of Performance
The 2006 fiscal year proved to be a challenging environment in the mortgage industry. The following macroeconomic factors were significant drivers in our 2006 financial results:
Interest rate squeeze – As the Federal Reserve increased interest rates, our cost of funding from 2004 to 2006 increased, while coupons on nonconforming loans did not increase in the same proportion. This squeeze on net interest margins reduced the profitability of mortgage banking.
Housing price correction – During 2006 housing price appreciation slowed dramatically. Though varying in severity across regions, the housing correction had widespread effects on the economy, mortgage originations and the ability of homeowners to borrow.
Credit performance – With repayment risks no longer offset by rapidly rising home values, delinquencies in the industry began to rise in 2006. These credit issues have caused whole loans to lose some value, affecting the value of and income generated by our portfolio of mortgage loans and securities.
Competitive pressures – Profitability in nonprime lending continued to suffer in 2006 as a result of lenders focusing on market share at the expense of margins and underwriting standards. Weaker competitors, including some big ones, have begun to exit the industry.
In our mortgage portfolio management business, returns were negatively affected by the volatile interest rate environment and credit related impairments, resulting in full-year returns in 2006 that were more in line with historic returns for this asset class. We generally expect returns to be near the level of 1% to 1.25% over the long-term. While we are optimistic that returns in 2007 will fall in this range, we are staying focused on the disciplines of risk mitigation should it prove to be another challenging year.
In our mortgage banking business, gain-on-sale margins continued to be tight in 2006 as coupons on originations increased only slightly and mortgage credit quality declined. In 2006, we were able to achieve some success despite the tough market conditions by increasing our production by over 20% compared to 2005 as many competitors either ceased operations or withdrew from the industry due to the difficult operating conditions. We also made significant strides in our campaign to decrease our cost to originate as it decreased from 2.37% in 2005 to 2.03% in 2006. See Table 25 for a reconciliation of our cost of production to general and administrative expenses. We will continue to focus on further efficiencies and productivity improvements in 2007.
As discussed under “Risk Management – Credit Risk” and “Industry Overview and Known Material Trends and Uncertainties”, our 2006 vintage loan originations performed below expectations. We intensified our focus on asset quality as a deterioration of credit performance became apparent in 2006. We underwrite loans with an eye on risk – adjusting guidelines to market changes, keeping a watch on geographic diversity and maintaining loan coupons while competitors decrease their coupons. The credit challenges were greater than expected in 2006, due to the slowdown in housing prices. In response, we have significantly altered our proprietary modeling and underwriting processes in an attempt to minimize losses and enhance asset quality in loan originations going forward.
Over the last several years the REIT’s taxable income has exceeded our GAAP earnings as a result of the difference between tax and GAAP accounting recognition of income on our mortgage securities portfolio. However, over the life of the portfolio, GAAP and tax income will generally be equal. The reversal in timing differences between the recognition of GAAP income and taxable income is occurring and will accelerate as our older vintage securitizations mature. We experienced a decline of taxable income in 2006 of approximately 32 percent from 2005. Furthermore, we expect to recognize little or no taxable income at the REIT during the period from 2007 through 2011. See “Industry Overview and Known Material Trends and Uncertainties” for further discussion on taxable income.
The following selected key performance metrics are derived from our consolidated financial statements for the periods presented and should be read in conjunction with the more detailed information therein and “Management’s Discussion and Analysis of Financial Condition and Results of Operations.”
Table 1 — Summary of Financial Highlights and Key Performance Metrics
(dollars in thousands; except per share amounts)
| For the Year Ended December 31, | ||||||||||||
| 2006 | 2005 | 2004 | ||||||||||
Net income available to common shareholders | $ | 66,285 | $ | 132,471 | $ | 109,124 | ||||||
Net income available to common shareholders, per diluted share | $ | 1.92 | $ | 4.42 | $ | 4.24 | ||||||
Estimated taxable net income available to common shareholders (A) | $ | 180,627 | $ | 270,432 | $ | 250,555 | ||||||
Estimated taxable net income available to common shareholders, per share (A) | $ | 4.85 | $ | 8.40 | $ | 9.04 | ||||||
Cash dividends declared per common share | $ | 5.60 | $ | 5.60 | $ | 6.75 | ||||||
Nonconforming originations and purchases | $ | 11,224,088 | $ | 9,283,138 | $ | 8,424,361 | ||||||
Weighted average coupon of nonconforming originations and purchases | 8.55 | % | 7.66 | % | 7.63 | % | ||||||
Nonconforming loans securitized in transactions structured as sales, principal | $ | 6,075,405 | $ | 7,621,030 | $ | 8,329,804 | ||||||
Nonconforming loans securitized in transactions structured as financings, principal | $ | 2,549,913 | $ | — | $ | — | ||||||
Nonconforming loans sold to third parties, principal | $ | 2,248,633 | $ | 1,138,098 | $ | — | ||||||
Gains on sales of mortgage assets | $ | 41,749 | $ | 65,148 | $ | 144,950 | ||||||
Net interest yield on assets (B) | 1.21 | % | 1.76 | % | 1.70 | % | ||||||
Net yield on mortgage securities (C) | 29.82 | % | 42.11 | % | 32.77 | % | ||||||
Weighted average whole loan price used in the initial valuation of residual interests | 101.86 | 102.00 | 103.28 | |||||||||
Costs of production, as a percent of principal (D) | 2.03 | % | 2.37 | % | 2.77 | % | ||||||
| (A) | The common shares outstanding at the end of each period presented are used in calculating the taxable income per common share. Taxable income for years prior to 2006 are actual while 2006 taxable income is an estimate. |
| (B) | This metric is defined in Table 21. |
| (C) | This metric is defined in Table 20. |
| (D) | This metric is defined in Table 29. |
For the year ended December 31, 2006 as compared to the year ended December 31, 2005.
Net income available to common shareholders declined by approximately $66.2 million during 2006 as compared to 2005. The following factors contributed to the decline:
Gains on sales of mortgage assets decreased by $23.4 million from 2005 to 2006. The reasons for this are:
Net gains on sales of loans to third parties declined by $10.1 million even though we doubled the volume of loans sold due to the increase in our reserve for losses related to loan repurchases. Because of the increase in loan repurchase requests which resulted from increased delinquencies in our 2006 production, we increased our reserve for future expected losses resulting from these repurchases by $25.4 million from 2005 to 2006.
A shift in securitization strategies in 2006 to add qualified assets to our balance sheet to ensure our compliance with certain REIT tests. This decision ultimately resulted in a decrease in securitization sales transaction volume from $7.6 billion for 2005 to $6.1 billion for 2006. During the second quarter of 2006, we structured the NHES Series 2006-1 securitization as well as the NHES 2006-MTA1 securitization as financing transactions instead of our typical sales transactions. As a result of the decline in the volume of loans securitized in sales transactions, our gains from securitizations of mortgage loans declined to $50.2 million for 2006 from $58.8 million for 2005.
As default rates have increased so have the assets we acquired through foreclosure (real estate owned). Our losses on sales of real estate owned increased by $6.3 million in 2006 from 2005 as a result of the deteriorating credit quality of our portfolio.
Although the overall balance of our mortgage securities increased in 2006 from 2005 because of the purchase and retention of subordinated securities, our interest income from our securities portfolio as well as the net yield on these securities declined in 2006. Interest income – mortgage securities decreased by $24.0 million from 2005 and the net yield also decreased by 12.29% from 2005. These declines can be attributed to the following main factors:
The estimated fair value of our residual securities decreased by $160.2 million from 2005 to 2006. This was caused by erosion of the portfolio being much greater than the initial value of our newly retained residual securities. Because of the higher credit loss expectancies of the 2006 production as well as the tightening of margins, the residual securities we retained from our 2006 securitization deals as a percentage of the collateral balance delivered decreased by 1.2%. Also contributing to this decrease was the $1.5 billion decrease in loans securitized in transactions structured as sales from 2005 to 2006. Significant erosion of the fair value of our portfolio has been driven by higher expected credit losses throughout the entire portfolio as well as normal paydowns.
The addition of lower-yielding mortgage securities to our portfolio. The mortgage securities – available-for-sale (residual interests) we retained from our most recent securitizations are accreting income at lower yields than many of our older securities due to margin compression and higher credit loss expectancies. Also, we increased our trading securities portfolio by $285.6 million and the yields on our trading securities are generally lower than the yields on our mortgage securities – available-for-sale.
Our portfolio management focus continues to be on managing a portfolio to deliver attractive risk-adjusted returns. The net yield on our mortgage securities portfolio is highly dependent on market conditions and the types of securities in which we invest.
Higher expected credit losses contributed to impairments to our mortgage securities available-for-sale portfolio increasing by $13.1 million from 2005 to 2006. As can be seen by our increase in credit loss assumptions as well as our high provision for credit losses, we are beginning to see the effects of a cooling housing market on mortgage credit quality.
We increased our provision for credit losses by approximately $29.1 million during 2006 from 2005 due to $2.7 billion of securitizations structured as financing transactions we executed in 2006. Our provision for credit losses significantly offset the positive impact to interest income yielded by these transactions.
The rise in short-term interest rates in 2006 was much less than 2005. This resulted in a $6.2 million decrease in the gains we recognized on derivative instruments which did not qualify for hedge accounting during 2006 compared to 2005.
Industry Overview and Known Material Trends and Uncertainties
Described below are some of the marketplace conditions and known material trends and uncertainties that may impact our future results of operations.
Despite the cyclical downturn, we believe the mortgage business will continue to be a pillar of the U.S. economy. The value of homes, even after a correction, represents the largest asset of most American families. Inside Mortgage Finance Publications estimated nonprime originations at more than $600 billion in 2006, roughly one-fifth of total mortgage lending in the United States.
The following trends have become evident in the business environment in which we operate and could have a significant impact on our financial condition, results of operations and cash flows:
Industry publications have predicted that borrower delinquencies and credit deterioration will continue into 2007 with a positive trend beginning in 2008. In the meantime, the key area of focus for our mortgage banking operation is to ensure that the 2007 vintage performs better than 2006 and in line with our expectations. In this regard, we have significantly altered our proprietary model and underwriting guidelines and processes in an attempt to minimize losses and enhance asset quality in loan originations going forward.
Various industry publications also predict that growth in the nonconforming origination market will be relatively flat in 2007 with some publications predicting a slight decline. Additionally, our origination volume could be negatively impacted by our tightening of underwriting guidelines as fewer borrowers may qualify for loans and as brokers adjust to these tighter guidelines. Our ability to increase the size of our securitized mortgage loan portfolio, which drives our mortgage securities portfolio, could prove difficult under these tighter conditions. We continue to pursue opportunities to increase our market share in the nonconforming market, including the acquisition or new development of businesses. We also believe there are opportunities to increase our market share as the number of competitors decline as a result of the difficult operating conditions. As we explore opportunities for growth, generating good risk-adjusted returns for shareholders remains our focus.
The nonprime market remains very competitive and will likely continue to see pressure on margins as the market normalizes. We see potential for a more rational business environment as some overly aggressive competitors have either ceased operations or withdrawn from the industry. Our ability to generate acceptable risk-adjusted returns is very dependent on the movement in these margins.
Home sales growth and home price appreciation both significantly declined throughout 2006. For 2007, many economists are expecting home-price growth to continue its decline in some markets which had experienced substantial growth. This could have a significant impact on origination growth in our mortgage lending segment, as well as, prepayment speed and credit loss assumptions on the mortgage securities held by our mortgage portfolio management segment.
As a result of the many uncertainties in the subprime mortgage market (i.e. home price appreciation, home sales, credit quality, interest rates), and their impact to the securitization market, we may allocate more capital to mortgage assets which are higher in the capital structure as well as synthetic assets. We also may sell more of our loan production to third parties and we may even sell all or a portion of the residual securities we retain from our securitizations until we begin to see a more rational market.
During 2005 and 2006 we retained various subordinate investment-grade securities from our securitization transactions that were previously held in the form of overcollateralization bonds. We also purchased subordinated securities from other asset-backed securities (“ABS”) issuers. We will continue to retain, acquire and aggregate various types of ABS as well as synthetic assets with the intention of securing non-recourse long-term financing through securitizations while retaining the risk of the underlying securities by investing in the equity and subordinated debt pieces of the collateralized debt obligation (“CDO”). CDO equity securities bear the first-loss and second-loss credit risk with respect to the securities owned by the securitization entity. Our goal is to leverage our extensive portfolio management experience for shareholders by purchasing securities that are higher in the capital structure than our residual securities and executing CDOs for long-term non-recourse financing, thereby generating good risk-adjusted returns for shareholders. As discussed in Note 24 to the consolidated financial statements, we executed our first CDO securitization on February 8, 2007.
As discussed under “Executive Overview of Performance”, over the last several years the REIT’s taxable income has exceeded GAAP earnings as a result of the timing difference between tax and GAAP accounting recognition of income on our mortgage securities portfolio. Generally, this timing difference is created by a variety of factors including the deferred recognition of losses in computing the yield on these securities for tax purposes. However, over the life of the portfolio, GAAP and tax income will generally be equal. The reversal in timing differences between the recognition of GAAP income and taxable income is occurring and will accelerate as our older vintage securitizations mature. We experienced a decline of taxable income in 2006 of approximately 32 percent from 2005. Furthermore, we expect to recognize little or no taxable income at the REIT during the period from 2007 through 2011. Given this outlook, and the operating efficiencies to be gained through operating as a traditional C corporation, we are currently evaluating whether it is in shareholders’ best interest to retain our REIT status. In order to voluntarily revoke REIT status, we must file such revocation with the Internal Revenue Service within 90 days of the beginning of the first tax year for which the revocation is to be effective. We will continue to be subject to the REIT dividend distribution requirements for the year prior to the year in which the revocation is effective. For example, if we elect to revoke our REIT status for 2008, we would still be required to distribute at least 90 percent of our 2007 taxable income by the end of 2008 in order to retain REIT status for 2007.
Critical Accounting Estimates
We prepare our consolidated financial statements in conformity with accounting principles generally accepted in the United States of AmericaGAAP and, therefore, are required to make estimates regarding the values of our assets and liabilities and in recording income and expenses. These estimates are based, in part, on our judgment and assumptions regarding various economic conditions that we believe are reasonable based on facts and circumstances existing at the time of reporting. The results of theseThese estimates affect reported amounts of assets, liabilities and accumulated other comprehensive income at the date of the consolidated financial statements and the reported amounts of income, expenses and other comprehensive income during the periods presented. The following summarizes the components of our consolidated financial statements where understanding accounting policies is critical to understanding and evaluating our reported financial results, especially given the significant estimates used in applying the policies. The discussion is intended to demonstrate the significance of estimates to our financial statements and the related accounting policies. Detailed accounting policies are provided in Note 1 to our consolidated financial statements. Our critical accounting estimates impact only twoeach of our three reportable segments; our mortgage portfolio management, and mortgage lending and loan servicing segments. Management has discussed the development and selection of these critical accounting estimates with the audit committee of our boardBoard of directorsDirectors and the audit committee has reviewed our disclosure.
Transfers of Assets (Loan and Mortgage Security Securitizations) and Related Gains. In a loan securitization, we combine the mortgage loans we originate and purchase in pools to serve as collateral for issued asset-backed bonds that are issued to the public.bonds. In a mortgage security securitization (also known as a “Resecuritization”“resecuritization”), we combine mortgage securities - available-for-sale retained in previous loan securitization transactions to serve as collateral for asset-backed bonds that are issued to the public.bonds. The loans or mortgage securities - available-for-sale are transferred to a trust designed to serve only for the purpose of holding the collateral. The trust is considered a qualifying special purpose entity as defined by SFAS No. 140 (“SFAS 140”),Accounting for Transfers and Servicing of Financial Assets and Extinguishments of Liabilities – a replacement of FASB Statement No. 125. The owners of the asset-backed bonds have no recourse to us in the event the collateral does not perform as planned except where defects have occurred in the loan documentation and underwriting process.
In order for us to determine proper accounting treatment for each securitization or resecuritization, we evaluate whether or not we have retained or surrendered control over the transferred assets by reference to the conditions set forth in SFAS No. 140. All terms of these transactions are evaluated against the conditions set forth in these statements.this statement. Some of the questions that must be considered include:
Have the transferred assets been isolated from the transferor?
Does the transferee have the right to pledge or exchange the transferred assets?
Is there a “call” agreement that requires the transferor to return specific assets?
Is there an agreement that both obligates and entitles the transferortransferee to repurchase or redeemreturn the transferred assets prior to maturity?
Have any derivative instruments been transferred?
Generally, we intend to structure our securitizations so that control over the collateral is transferred and the transfer is accounted for as a sale. For resecuritizations, we intend to structure these transactions to be accounted for as secured borrowings.
When these transfers are executed in a manner such that we have surrendered control over the collateral, the transfer is accounted for as a sale. In accordance with SFAS No. 140, a gain or loss on the sale is recognized based on the carrying amount of the financial assets involved in the transfer, allocated between the assets transferred and the retained interests based on their relative fair value at the date of transfer. In a loan securitization accounted for as a sale, we do retain the right to service the underlying mortgage loans and we also retain certain mortgage securities - available-for-sale issued by the trust (see Mortgage Securities – Available-for-Sale below).trust. As previously discussed, the gain recognized upon a securitization structured as a sale depends on, among other things, the estimated fair value of the components of the securitization – the loans or mortgage securities -– available-for-sale and derivative instruments transferred, the securities retained and the mortgage servicing rights. The estimated fair value of the securitization components is considered a “critical accounting estimate” as 1) these gains or losses can represent a significant portion of our operating results and 2) the valuation assumptions used regarding economic conditions and the make-up of the collateral, including interest rates, principal payments, prepayments and loan defaults are highly uncertain and require a large degree of judgment.
We use two methodologies for determining the initial value of our residual securities 1) the whole loan price methodology and 2) the discount rate methodology. We believe the best estimate of the initial value of the residual securities we retain in our securitizations accounted for as a whole loan securitizationsale is derived from the market value of the pooled loans. TheAs such, we generally will try to use the whole loan price methodology when significant open market sales pricing data is available. Under this method, the initial value of the loans transferred in a securitization accounted for as a sale is estimated based on the expected open market sales price of a similar pool. In open
market transactions, the purchaser has the right to reject loans at its discretion. In a loan securitization, loans generally cannot generally be rejected. As a result, we adjust the market price for the loans to compensate for the estimated value of rejected loans. The market price of the securities retained is derived by deducting the percent of net proceeds received in the securitization (i.e. the economic value of the loans transferred) from the estimated adjusted market price for the entire pool of the loans.
An implied yield (discount rate) is calculated based onderived by taking the initial value derived above and using projected cash flows generated using assumptions for prepayments, expected credit losses and interest rates.rates and then solving for the discount rate required to present value the cash flows back to the initial value derived above. We then ascertain whether the resulting implied yielddiscount rate is commensurate with current market conditions. Additionally, this yieldthe initial discount rate serves as the initial accretable yield used to recognize income on the securities.
When significant open market pricing information is not readily available to us, we use the discount rate methodology. Under this method, we first analyze market discount rates for similar assets. After establishing the market discount rate, the projected cash flows are discounted back to ascertain the initial value of the residual securities. We then ascertain whether the resulting initial value is commensurate with current market conditions.
For purposes of valuing our mortgageresidual securities, - available-for-sale, it is important to know that in recentbeginning with our 2002 vintage securitization transactions we not only have transferred loans to the trust, but we have also transferred interest rate agreements to the trust with the objective of reducing interest rate risk within the trust. During the period before loans are transferred in a securitization transaction as discussed under “Net Interest Income”, “Interest Rate/Market Risk” and “Hedging”, we enter into interest rate swap or cap agreements to reduce interest rate risk. We use interest rate cap and swap contracts to mitigate the riskagreements. Certain of the cost of variable rate liabilities increasing at a faster rate than the earnings on assets during a period of rising rates. Certainthese interest rate agreements are then transferred into the trust at the time of securitization. Therefore, the trust assumes the obligation to make payments and obtains the right to receive payments under these agreements.
In valuing our mortgageresidual securities, - available-for-sale it is also important to understand what portion of the underlying mortgage loan collateral is covered by mortgage insurance. At the time of a securitization transaction, the trust legally assumes the responsibility to pay the mortgage insurance premiums associated with the loans transferred and the rights to receive claims for credit losses. Therefore, we have no obligation to pay these insurance premiums. The cost of the insurance is paid by the trust from proceeds the trust receives from the underlying collateral. The trust legally assumes the responsibility to pay the mortgage insurance premiums and the rights to receive claims for credit losses. Therefore, we have no obligation to pay these insurance premiums. This information is significant for valuation as the mortgage insurance significantly reduces the credit losses born by the owner of the loan. Mortgage insurance claims on loans where a defect occurred in the loan origination process will not be paid by the mortgage insurer. The assumptions we use to value our mortgageresidual securities - available-for-sale consider this risk. We discuss mortgage insurance premiums under the heading “Premiums for Mortgage Loan Insurance”.
The weighted average net whole loan market price used in the initial valuation of our retained securities was 103.28101.86 for the year ended December 31, 2006 as compared to 102.00 and 104.21 during 2004 and 2003, respectively. The weighted average implied discount rate103.28 for the years ended December 31, 2005 and 2004, respectively. The weighted average initial implied discount rate was 15% for the years ended December 31, 2006 and 2003 was 22%.2005. If the whole loan market price used in the initial valuation of our mortgageresidual securities - available-for-sale in 2004for the year ended December 31, 2006 had been increased or decreased by 50 basis points, the initial value of our mortgageresidual securities - available-for-sale and the gain we recognized would have increased or decreased by $41.6$30.4 million.
Information regarding the assumptions we used is discussed under “Mortgage Securities – Available-for-Sale” in the following discussion.
When we do have the ability to exert control over the transferred collateral in a securitization, the assets remain on our financial recordsstatements and a liability is recorded for the related asset-backed bonds. The servicing agreements that we execute for loans we have securitized includes a removal of accounts provision which gives us the right, but not the obligation, to repurchase mortgage loans from the trust. The removal of accounts provision can be exercised for loans that are 90 days to 119 days delinquent. We record the mortgage loans subject to the removal of accounts provision in mortgage loans held-for-sale at fair value and the related repurchase obligation as a liability. The clean upIn addition, we have a “clean up” call option that can be exercised when the aggregate principal balance of the mortgage loans has declined to ten percent or less of the original aggregated mortgage loan principal balance.
Mortgage Securities – Available-for-Sale.Available-for-Sale and Trading. Our mortgage securities – available-for-sale and trading represent beneficial interests we retain in securitization transactions.and resecuritization transactions which include residual securities and subordinated securities as well as bonds issued by others which we have purchased. The beneficial interestsresidual securities include interest-only mortgage securities, prepayment penalty bonds and over-collateralization bonds. All of the residual securities retained by us have been classified as available-for-sale. The subordinated securities represent bonds which are senior to the residual securities but are subordinated to the bonds sold to third party investors. We have classified certain of our subordinated securities in both the available-for-sale and trading categories.
The residual securities we retain in securitization transactions structured as sales primarily consist of the right to receive the future cash flows from a pool of securitized mortgage loans which include:
The interest spread between the coupon net of servicing fees on the underlying loans, and the cost of financing.financing, mortgage insurance, payments or receipts on or from derivative contracts and bond administrative costs.
Prepayment penalties received from borrowers who payoff their loans early in their life.
Overcollateralization and other subordinated securities, which areis designed to protect the primary bondholder from credit loss on the underlying loans.
The subordinated securities we retain in our securitization transactions have a stated principal amount and interest rate. The performance of the securities is dependent upon the performance of the underlying pool of securitized mortgage loans. The interest rates these securities earn are variable and are subject to an available funds cap as well as a maximum rate cap. The securities receive principal payments in accordance with a payment priority which is designed to maintain specified levels of subordination to the senior bonds within the respective securitization trust. Because the subordinated securities are rated lower than AA, they are considered low credit quality and we account for the securities based on guidance set forth from Emerging Issuance Task Force 99-20 “Recognition of Interest Income and Impairment on Purchased and Retained Beneficial Interests in Securitized Financial Assets” (“EITF 99-20”) using the effective yield method. The fair value of the subordinated securities is based on third-party quotes.
The cash flows we receive are highly dependent upon the interest rate environment. The cost of financing forinterest rates on the securitized loans isbonds issued by the securitization trust are indexed to short-term interest rates, while the loan coupons on the pool of loans held by the securitization trust are less interest rate sensitive. As a result, as rates rise and fall, our cash flows will fall and rise, which in turn will decrease or increasebecause the cash we receive on our residual securities is dependent on this interest rate spread. As our cash flows fall and rise, the value of our mortgage securities.residual securities will decrease or increase. Additionally, the cash flows we receive are dependent on the default and prepayment experience of the borrowers of the underlying mortgage security collateral. Increasing or decreasing cash flows will increase or decrease the yield on our securities.
We believe the accounting estimates related to the valuation of our mortgage securities -– available-for-sale and establishing the rate of income recognition on the mortgage securities -– available-for-sale and trading are “critical accounting estimates”, because they can materially affect net income and stockholders’shareholders’ equity and require us to forecast interest rates, mortgage principal payments, prepayments and loan default assumptions which are highly uncertain and require a large degree of judgment. The rate used to discount the projected cash flows is also critical in the valuation of our mortgage securities - available-for-sale.residual securities. We use internal, historical collateral performance data and published forward yield curves when modeling future expected cash flows and establishing the rate of income recognized on mortgage securities - available-for-sale.securities. We believe the value of our mortgageresidual securities - available-for-sale is fair, but can provide no assurance that future changes in interest rates, prepayment and loss experience or changes in their requiredthe market discount rate will not require write-downs of the residual assets. ImpairmentsFor mortgage securities classified as available-for-sale, impairments would reduce income in future periods when deemed other-than-temporary.
As previously described, our mortgage securities available-for-sale and trading represent retained beneficial interests in certain components of the cash flows of the underlying mortgage loans to securitization trusts. Income recognition for our mortgage securities – available-for-sale and trading is based on the effective yield method. Under the effective yield method, as payments are received, they are applied to the cost basis of the mortgage related security. Each period, the accretable yield for each mortgage security is evaluated and, to the extent there has been a change in the estimated cash flows, it is adjusted and applied prospectively. The estimated cash flows change as management’s assumptions forabout credit losses, borrower prepayments and interest rates are updated. The assumptions are established using internally developed models. We prepare analyses of the yield for each security using a range of these assumptions. The accretable yield used in recording interest income is generally set within a range of base assumptions. The accretable yield is recorded as interest income with a corresponding increase to the cost basis of the mortgage security.
At each reporting period subsequent to the initial valuation of the retainedresidual securities, the fair value of mortgagethe residual securities - available-for-sale is estimated based on the present value of future expected cash flows to be received. Management’s best estimate of key assumptions, including credit losses, prepayment speeds, the market discount rates and forward yield curves commensurate with the risks involved, are used in estimating future cash flows. We estimate initial and subsequent fair value for the subordinated securities based on quoted market prices.
To the extent that the cost basis of mortgage securities -– available-for-sale exceeds the fair value and the unrealized loss is considered to be other than temporary, an impairment charge is recognized and the amount recorded in accumulated other comprehensive income or loss is reclassified to earnings as a realized loss. During the year ended December 31, 2004,When we recorded an impairment loss of $15.9 million on NMFT Series 1999-1, 2004-1, 2004-2 and 2004-3. The impairments wereretain new residual securities during a result of a significant increase inperiod when short-term interest rates during the year as well as higherrate increases are greater than anticipated prepayments. While we do use forward yield curves in valuing our securities, the increase in two-year and three-year swap rates was greater thanby the forward yield curve, had anticipated, thus causing a greater than expectedwe generally are more susceptible to impairments on our newer mortgage securities as they do not have sizable unrealized gains to help offset the decline in value. Prepayments were higher than expected due to substantial increases in housing prices in the past few years. Increases in housing prices give borrowers the opportunity to use the increase in the equity in their homes to refinance their existing mortgage into lower-rate mortgages. See Table 4 for a quarterly summary of the cost basis, unrealized gain (loss) and fair value of our mortgage securities - - available-for-sale.
Our average security yield has decreasedThe market discount rates we are using to 31.4% for the year ended December 31, 2004 from 34.3% for the same period of 2003. This decrease is a result of the significant rise in short-term interest rates in 2004. Mortgageinitially value our residual securities – available-for-sale income has increased from $98.8 million for the year ended December 31, 2003 to $133.6 million for the same period of 2004 due to the increase in the average balance of our securities portfolio. If the rates used to accrue income on our mortgage securities - available-for-sale during 2004 had increased or decreased by 10%, net income during the year ended 2004 would have increased by $34.1 million and decreased by $36.8 million, respectively.
declined since 2005. As of December 31, 2004 and 2003,2006, the weighted average discount rate used in valuing our mortgageresidual securities - available-for-sale was 22%.16% as compared to 18% for December 31, 2005. The weighted averageweighted-average constant prepayment rate used in valuing our mortgageresidual securities - available-for-sale as of December 31, 20042006 was 3947% versus 3349% as of December 31, 2003.2005. If the discount rate used in valuing our mortgageresidual securities - available-for-sale as of December 31, 20042006 had been increased by 500 basis points,5%, the value of our mortgage securities -securities- available-for-sale would have decreased $24.8by $14.7 million. If we had decreased the discount rate used in valuing our mortgageresidual securities - available-for-sale by 500 basis points,5%, the value of our mortgageresidual securities - available-for-sale would have increased $28.6by $15.9 million.
Mortgage Loans and Allowance for Credit LossesLoans.. Mortgage loans held-for-sale are recorded at the lower of cost or market determined on an aggregate basis. Mortgage loan origination fees and direct costs on mortgage loans held-for-sale are deferred until the related loans are sold. Premiums paid to acquire mortgage loans held-for-sale are also deferred until the related loans are sold. Mortgage loans held-in-portfolio are recorded at their cost, adjusted for the amortization of net deferred costs and for credit losses inherent in the portfolio. Mortgage loan origination fees and associated direct costs on mortgage loans held-in-portfolio are deferred and recognized over the life of the loan as an adjustment to yield using the level yield method. Premiums paid to acquire mortgage loans held-in-portfolio are also deferred and recognized over the life of the loan as an adjustment to yield using the level yield method.
Allowance for Credit Losses. An allowance for credit losses is maintained for mortgage loans held-in-portfolio.
The allowance for credit losses on mortgage loans held-in-portfolio, and thereforeamount of the related adjustment to income,allowance is based on the assessment by management of probable losses incurred based on various factors affecting our mortgage loan portfolio, including current economic conditions, the
makeup of the portfolio based on credit grade, loan-to-value ratios, delinquency status, mortgage insurance we purchase and other relevant factors. The allowance is maintained through ongoing adjustments to operating income. The assumptions used by management regarding key economic indicators are highly uncertain and involve a great deal of judgment.
An internally developed migration analysis is the primary tool used in analyzing our allowance for credit losses. This tool takes into consideration historical information regarding foreclosure and loss severity experience and applies that information to the portfolio at the reporting date. We also take into consideration our use of mortgage insurance as a method of managing credit risk. We pay mortgage insurance premiums on loans maintained on our balance sheet and have included the cost of mortgage insurance in our income statement.
Our estimate of expected losses could increase if our actual loss experience is different than originally estimated. In addition our estimate of expected losses could increase if economic factors change the value we could reasonably expect to obtain from the sale of the property. If actual losses increase or if values reasonably expected to be obtained from property sales decrease, the provision for losses would increase. Any increase in the provision for losses would adversely affect our results of operations.
Reserve for Losses – Loans Sold to Third Parties.We maintain a reserve for the representation and warranty liabilities related to loans sold to third parties, and for the contractual obligation to rebate a portion of any premium paid by a purchaser when a borrower prepays a sold loan within an agreed period. The reserve, which is recorded as a liability on the consolidated balance sheet, is established when loans are sold, and is calculated as the estimated fair value of losses reasonably estimated to occur over the life of the contractual obligation. Management estimates inherent losses based upon historical loss trends and frequency and severity of losses for similar loan product sales. The adequacy of this reserve is evaluated and adjusted as required. The provision for losses recognized at the sale date is included in the consolidated statements of income as a reduction of gains on sales of mortgage assets.
Derivative Instruments and Hedging Activities.Activities.Our objective and strategy for using derivative instruments is to mitigate the risk of increased costs on our variable rate liabilities during a period of rising rates (i.e. interest rate risk). Our primary goals for managing interest rate risk are to maintain the net interest margin spread between our assets and liabilities and diminish the effect of changes in general interest rate levels on our market value. We primarily enter intoGenerally the interest rate swap agreements and interest rate cap agreements to manage our sensitivity to changes in market interest rates. The interest rate agreements we use have an active secondary market, and none are obtained for a speculative nature, for instance, trading.nature. These interest rate agreements are intended to provide income and cash flows to offset potential reduced net interest income and cash flows under certain interest rate environments. The determination of effectiveness is the primary assumption and estimate used in hedging. At trade date, these instruments and their hedging relationship are identified, designated and documented.
SFAS No. 133,Accounting for Derivative Instruments and Hedging Activities (as amended)(“SFAS 133”), standardizes the accounting for derivative instruments, including certain instruments embedded in other contracts, by requiring that an entity recognize those items as assets or liabilities in the balance sheet and measure them at fair value. If certain conditions are met, an entity may elect to designate a derivative instrument either as a cash flow hedge, a fair value hedge or a hedge of foreign currency exposure. SFAS No. 133 requires derivative instruments to be recorded at their fair value with hedge ineffectiveness recognized in earnings.
Our derivativeDerivative instruments that meet the hedge accounting criteria of SFAS No. 133 are considered cash flow hedges. We also have derivative instruments that do not meet the requirements for hedge accounting. However, these derivative instruments alsodo contribute to our overall risk management strategy by serving to reduce interest rate risk on average short-term borrowings used to fundcollateralized by our loans held-for-sale.
Any changes in fair value of derivative instruments related to hedge effectiveness are reported in accumulated other comprehensive income. Changes in fair value of derivative instruments related to hedge ineffectiveness and non-hedge activity are recorded as adjustments to earnings. For those derivative instruments that do not qualify for hedge accounting, changes in the fair value of the instruments are recorded as adjustments to earnings.
Mortgage Servicing Rights (MSR)(“MSRs”). MSR MSRs are recorded at allocated cost based upon the relative fair values of the transferred loans, derivative instruments and the servicing rights. MSRMSRs are amortized in proportion to and over the projected net servicing revenues. Periodically, we evaluate the carrying value of originated MSRMSRs based on their estimated fair value. If the estimated fair value, using a discounted cash flow methodology, is less than the carrying amount of the mortgage servicing rights, the mortgage servicing rights are written down to the amount of the estimated fair value. For purposes of evaluating and measuring impairment of MSRMSRs we stratify the mortgage servicing rights based on their predominant risk characteristics. The most predominant risk characteristic considered is period of origination. The mortgage loans underlying the MSRMSRs are pools of homogeneous, nonconforming residential loans.
The fair value of MSRMSRs is highly sensitive to changes in assumptions. Changes in prepayment speed assumptions have the most significantgreatest impact on the fair value of MSR.MSRs. Generally, as interest rates decline, prepayments accelerate due to increased refinance activity, which results in a decrease in the fair value of MSR. AsMSRs. Conversely, as interest rates rise, prepayments typically slow down, which generally results in an increase in the fair value of MSR.MSRs. All assumptions are reviewed for reasonableness on a quarterly basis and adjusted as necessary to reflect current and anticipated market conditions. Thus, any measurement of the fair value of MSRMSRs is limited by the existing conditions and the assumptions utilized as of a particular point in time. Those same assumptions may not be appropriate if applied at a different point in time.
Stock-Based Compensation. Prior to 2003, we accounted for our stock-based compensation plan using the recognition and measurement principles of Accounting Principles Board (APB) Opinion No. 25,Accounting for Stock Issued to Employees and related interpretations. We accounted for stock options based on the specific terms of the options granted. Options with variable terms, including those options for which the strike price has been adjusted and options issued by us with attached dividend equivalent rights, resulted in adjustments to compensation expense to the extent the market price of the common stock changed. No expense was recognized for options with fixed terms.
During the fourth quarter of 2003, we adopted the fair value recognition provisions of Statement of Financial Accounting Standards (SFAS) No. 123,Accounting for Stock-Based Compensation. SFAS No. 123 requires that all options be valued at the date of grant and expensed over their vesting period. We use the Black-Scholes option pricing model to value options granted.
Additionally, we selected the modified prospective method of adoption described in SFAS No. 148,Accounting for Stock-Based Compensation-Transition and Disclosure. Under this method, the change is retroactive to January 1, 2003 and compensation cost
recognized in 2003 is the same as that which would have been recognized had the fair value method of SFAS No. 123 been applied from its original effective date. The pretax impact of adopting the provisions under the modified prospective method for the nine months ended September 30, 2003 was a decrease to compensation expense of $7.1 million. In accordance with the modified prospective method of adoption, results for prior years have not been restated. SFAS No. 123 states that the adoption of the fair value based method is a change to a preferable method of accounting. We believe that use of the fair value based method to record stock-based compensation expense is consistent with the accounting for all other forms of compensation.
In accordance with the provisions of SFAS No. 123 and SFAS No. 148, $1.8 million and $1.3 million was recorded for total stock-based compensation expense in 2004 and 2003, respectively. In accordance with APB No. 25, total stock-based compensation expense was $2.5 million for the year ended December 31, 2002.
Financial Condition as of December 31, 20042006 and 2003December 31, 2005
Mortgage Loans. We classify our mortgage loans into two categories: “held-for-sale” and “held-in-portfolio”. Loans we have originated and purchased, but have not yet sold or securitized, are classified as “held-for-sale”- Held-for-Sale. We expect to sell these loans outright in third-party transactions or in securitization transactions that will be, for tax and accounting purposes, recorded as sales. We use warehouse mortgage repurchase agreements to finance our held-for-sale loans. As such, the fluctuations in mortgage loans held-for-sale and short-term borrowings between December 31, 2004 and December 31, 2003 is dependent on loans we have originated and purchased during the period as well as loans we have sold outright or through securitization transactions.
The volume and cost of our loan production is critical to our financial results. The loans we produce serve as collateral for our mortgage securities - available-for-sale and generate gains as they are sold or securitized. The cost of our production is also critical to our financial results as it is a significant factor in the gains we recognize. The following table summarizes our loan production for 2004 and 2003. We discuss our costthe activity of production under “General and Administrative Expenses” under “Results of Operations”. Also, detail regardingour mortgage loans sold or securitizedclassified as held-for-sale for the years ended December 31, 2006 and the gains recognized during 2004 can be found in the “Gains on Sales of Mortgage Assets and Gains (Losses) on Derivative Instruments” section of this document.2005.
Table 1 — Nonconforming Loan Originations and Purchases
(dollars in thousands, except for average loan balance)
| Number | Principal | Average Loan Balance | Price Paid to Broker | Weighted Average | Percent with Prepayment Penalty | |||||||||||||||||
Loan to Value | FICO Score | Coupon | ||||||||||||||||||||
2004 | 55,974 | $ | 8,424,361 | $ | 150,505 | 101.3 | % | 82 | % | 622 | 7.6 | % | 72 | % | ||||||||
2003 | 36,911 | $ | 5,250,978 | $ | 142,261 | 101.2 | % | 81 | % | 638 | 7.3 | % | 77 | % | ||||||||
A portion of the mortgage loans on our balance sheet serve as collateral for asset-backed bonds we have issued and are classified as “held-in-portfolio.” The carrying value of “held-in-portfolio” mortgage loans as of December 31, 2004 was $59.5 million compared to $94.7 million as of December 31, 2003.
Premiums are paid on substantially all mortgage loans. Premiums on mortgage loans held-in-portfolio are amortized as a reduction of interest income over the estimated lives of the loans. For mortgage loans held-for-sale, premiums are deferred until the related loans are sold. To mitigate the effect of prepayments on interest income from mortgage loans, we generally strive to originate and purchase mortgage loans with prepayment penalties.
In periods of decreasing interest rates, borrowers are more likely to refinance their mortgages to obtain a better interest rate. Even in rising rate environments, borrowers tend to repay their mortgage principal balances earlier than is required by the terms of their mortgages. Nonconforming borrowers, as they update their credit rating and as housing prices increase, are more likely to refinance their mortgage loan to obtain a lower interest rate.
The operating performance of our mortgage loan portfolio, including net interest income, allowance for credit losses and effects of hedging, are discussed under “Results of Operations” and “Interest Rate/Market Risk.” Gains on the sales of mortgage loans, including impact of securitizations treated as sales, is also discussed under “Results of Operations.” Additional information relating to our loans held-in-portfolio and loans held-for-sale can be accessed via our website at www.novastarmortgage.com. Such information includes a summary of our loans held-in-portfolio and loans held-for-sale by FICO score and geographic concentration. For held-in-portfolio loans, loan performance characteristics such as credit quality and prepayment experience are also available.
Table 2 — Carrying ValueRollforward of Mortgage Loans - Held-for-Sale
(dollars in thousands)
December 31, 2004 | December 31, 2003 | |||||||
Held-in-portfolio: | ||||||||
Current principal | $ | 58,859 | $ | 94,162 | ||||
Premium | $ | 1,175 | $ | 1,874 | ||||
Coupon | 10.0 | % | 10.0 | % | ||||
Percent with prepayment penalty | — | % | — | % | ||||
Held-for-sale: | ||||||||
Current principal | $ | 719,904 | $ | 673,405 | ||||
Premium | $ | 6,760 | $ | 10,112 | ||||
Coupon | 7.7 | % | 7.7 | % | ||||
Percent with prepayment penalty | 65 | % | 74 | % | ||||
| For the Year Ended December 31, | ||||||||
| 2006 | 2005 | |||||||
Beginning principal balance | $ | 1,238,689 | $ | 719,904 | ||||
Originations and purchases | 11,233,844 | 9,282,404 | ||||||
Borrower repayments | (77,490 | ) | (9,908 | ) | ||||
Sales to third parties | (2,248,633 | ) | (1,156,216 | ) | ||||
Sales in securitizations | (6,075,405 | ) | (7,621,030 | ) | ||||
Transfers to real estate owned | (15,376 | ) | (712 | ) | ||||
Repurchase of mortgage loans from securitization trusts | 192,821 | 13,976 | ||||||
Transfers of mortgage loans (to) from held-in-portfolio | (2,616,559 | ) | 10,271 | |||||
Ending principal balance | 1,631,891 | 1,238,689 | ||||||
Loans under removal of accounts provision | 107,043 | 44,382 | ||||||
Net Premium | 7,891 | 12,015 | ||||||
Allowance for the lower of cost or fair value | (5,006 | ) | (3,530 | ) | ||||
Mortgage loans held-for-sale | $ | 1,741,819 | $ | 1,291,556 | ||||
Mortgage Securities– Available-for-Sale.Since 1998, we have pooledOur portfolio of mortgage loans held-for-sale increased to $1.7 billion at December 31, 2006 from $1.3 billion at December 31, 2005. This increase is a result of a larger volume of originations and purchases during 2006 as well as the majoritytiming of our securitizations.
The following table provides information on the FICO scores, weighted average coupons and original weighted average loan-to-values for our loans we have originated or purchased to serveclassified as collateral for asset-backed bonds in securitizations that are treated as sales for accounting and tax purposes. In these transactions, the loans are removed from our balance sheet. However, we retain excess interest, prepayment penalty and subordinated principal securities. Additionally, we service the loans sold in these securitizations (see “Mortgage Servicing Rights” under the header “Financial Conditionheld-for-sale as of December 31, 20042006 and 2003”). 2005.
Table 3 — Mortgage Loans – Held-for-Sale by FICO Score
(dollars in thousands)
| As of December 31, 2006 | As of December 31, 2005 | |||||||||||||||||
FICO Score | Current Principal | Weighted Average Coupon | Original Weighted Average Loan- to-Value | Current Principal | Weighted Average Coupon | Original Weighted Average Loan- to-Value | ||||||||||||
FICO score not available | $ | 577 | 10.89 | % | 63.0 | % | $ | 900 | 10.52 | % | 80.3 | % | ||||||
540 and below | 134,147 | 9.68 | 79.7 | 78,250 | 9.40 | 76.4 | ||||||||||||
540 to 579 | 248,559 | 9.21 | 81.4 | 149,150 | 9.03 | 79.5 | ||||||||||||
580 to 619 | 336,457 | 8.90 | 84.6 | 231,002 | 8.50 | 81.6 | ||||||||||||
620 to 659 | 392,316 | 8.60 | 84.7 | 301,879 | 8.01 | 82.1 | ||||||||||||
660 and above | 519,835 | 8.11 | 83.1 | 477,508 | 7.49 | 81.8 | ||||||||||||
Total | $ | 1,631,891 | 8.69 | % | 83.2 | % | $ | 1,238,689 | 8.11 | % | 81.2 | % | ||||||
The following table provides information on the collateral location for our loans classified as held-for-sale as of December 31, 2006 and December 31, 2005.
Table 4 — Mortgage Loans – Held-for-Sale by Collateral Location
As of December 31, 2006 | As of December 31, 2005 | |||||||
Collateral Location | Percent of Total | Collateral Location | Percent of Total | |||||
Florida | 19 | % | California | 22 | % | |||
California | 12 | Florida | 21 | |||||
Michigan | 5 | Virginia | 5 | |||||
Maryland | 4 | Maryland | 5 | |||||
All other states (each less than 4% of total) | 60 | All other states (each less than 5% of total) | 47 | |||||
Total | 100 | % | Total | 100 | % | |||
The following table provides information on the product type for our loans classified as held-for-sale as of December 31, 2006 and 2005.
Table 5 — Mortgage Loans – Held-for-Sale by Product Type
(dollars in thousands)
| As of December 31, | ||||||
Product Type | 2006 | 2005 | ||||
2-Year Fixed | $ | 621,108 | $ | 601,626 | ||
2-Year Fixed 40/30 | 301,488 | 35,525 | ||||
30-Year Fixed | 220,473 | 127,276 | ||||
MTA (Option ARM) | 177,032 | 90,596 | ||||
2-Year Fixed Interest-only | 140,899 | 265,664 | ||||
30/15-Year Fixed | 68,225 | 76,148 | ||||
Other Products | 102,666 | 41,854 | ||||
Total | $ | 1,631,891 | $ | 1,238,689 | ||
The following table provides delinquency information for our loans classified as held-for-sale as well as assets acquired through foreclosure (real estate owned) as of December 31, 2006 and 2005.
Table 6 — Mortgage Loans – Held-for-Sale Delinquencies and Real Estate Owned
(dollars in thousands)
| As of December 31, | ||||||||||||
| 2006 | 2005 | |||||||||||
| Current Principal | Percent of Total | Current Principal | Percent of Total | |||||||||
Current | $ | 1,613,112 | 99 | % | $ | 1,236,848 | 100 | % | ||||
30-59 days delinquent | 5,777 | — | 474 | — | ||||||||
60-89 days delinquent | 1,351 | — | 209 | — | ||||||||
90 + days delinquent | 1,349 | — | 283 | — | ||||||||
In process of foreclosure | 10,302 | 1 | 875 | — | ||||||||
Total principal | $ | 1,631,891 | 100 | % | $ | 1,238,689 | 100 | % | ||||
Real estate owned | $ | 12,110 | $ | 529 | ||||||||
Mortgage Loans - Held-in-Portfolio.
The following table summarizes the activity of our mortgage loans classified as held-in-portfolio for the years ended December 31, 2006 and 2005.
Table 7 — Rollforward of Mortgage Loans - Held-in-Portfolio
(dollars in thousands)
| For the Year Ended December 31, | ||||||||
| 2006 | 2005 | |||||||
Beginning principal balance | $ | 29,084 | $ | 58,859 | ||||
Borrower repayments | (551,796 | ) | (16,673 | ) | ||||
Capitalization of interest | 29,541 | — | ||||||
Transfers of mortgage loans from (to) held-for-sale | 2,616,559 | (10,271 | ) | |||||
Transfers to real estate owned | (21,620 | ) | (2,831 | ) | ||||
Ending principal balance | 2,101,768 | 29,084 | ||||||
Net unamortized premium | 37,219 | 455 | ||||||
Amortized cost | 2,138,987 | 29,539 | ||||||
Allowance for credit losses | (22,452 | ) | (699 | ) | ||||
Mortgage loans held-in-portfolio | $ | 2,116,535 | $ | 28,840 | ||||
Our portfolio of mortgage loans held-in-portfolio increased to $2.1 billion at December 31, 2006 from $28.8 million at December 31, 2005. During the first quarter of 2006 we transferred mortgage loans with a principal balance of $2.6 billion from the held-for-sale classification to the held-in-portfolio classification due to our change in securitization strategies with respect to these loans. Included in this total is approximately $1.0 billion of monthly treasury average (MTA) loans we purchased during the period. During the second quarter of 2006 we completed two securitization transactions structured as financings using these loans as the underlying collateral.
The following table provides information on the FICO scores, weighted average coupons and original weighted average loan-to-values for our loans classified as held-in-portfolio as of December 31, 2006 and 2005.
Table 8 — Mortgage Loans – Held-in-Portfolio by FICO Score
(dollars in thousands)
| As of December 31, 2006 | As of December 31, 2005 | |||||||||||||||||
FICO Score | Current Principal | Weighted Average Coupon | Original Weighted Average Loan- to-Value | Current Principal | Weighted Average Coupon | Original Weighted Average Loan- to-Value | ||||||||||||
FICO score not available | $ | 14,605 | 7.85 | % | 73.6 | % | $ | 892 | 10.35 | % | 76.8 | % | ||||||
540 and below | 79,552 | 9.66 | 75.6 | 4,283 | 10.23 | 77.5 | ||||||||||||
540 to 579 | 163,578 | 9.25 | 78.3 | 5,581 | 10.01 | 80.6 | ||||||||||||
580 to 619 | 255,777 | 8.81 | 81.0 | 8,718 | 9.84 | 83.6 | ||||||||||||
620 to 659 | 368,232 | 8.24 | 79.5 | 5,781 | 9.65 | 81.1 | ||||||||||||
660 and above | 1,220,024 | 8.09 | 77.4 | 3,829 | 9.44 | 80.2 | ||||||||||||
Total | $ | 2,101,768 | 8.35 | % | 78.2 | % | $ | 29,084 | 9.85 | % | 81.0 | % | ||||||
The following table provides information on the collateral location for our loans classified as held-in-portfolio as of December 31, 2006 and 2005.
Table 9 — Mortgage Loans – Held-in-Portfolio by Collateral Location
As of December 31, 2006 | As of December 31, 2005 | |||||||
Collateral Location | Percent of Total | Collateral Location | Percent of Total | |||||
California | 42 | % | Florida | 12 | % | |||
Florida | 19 | North Carolina | 8 | |||||
All other states (each less than 5% of total) | 39 | All other states (each less than 8% of total) | 80 | |||||
Total | 100 | % | Total | 100 | % | |||
The following table provides information on the product type for our loans classified as held-in-portfolio as of December 31, 2006 and 2005.
Table 10 — Mortgage Loans – Held-in-Portfolio by Product Type
(dollars in thousands)
| As of December 31, | ||||||
Product Type | 2006 | 2005 | ||||
MTA (Option ARM) | $ | 1,042,415 | $ | — | ||
2-Year Fixed | 608,188 | 7,332 | ||||
2-Year Fixed Interest-only | 190,349 | — | ||||
30-Year Fixed | 135,576 | 7,551 | ||||
Other Products | 125,240 | 14,201 | ||||
Total | $ | 2,101,768 | $ | 29,084 | ||
The following table provides delinquency information for our loans classified as held-in-portfolio as well as assets acquired through foreclosure (real estate owned) as of December 31, 2006 and 2005.
Table 11 — Mortgage Loans – Held-in-Portfolio Delinquencies and Real Estate Owned
(dollars in thousands)
| As of December 31, | ||||||||||||
| 2006 | 2005 | |||||||||||
| Current Principal | Percent of Total | Current Principal | Percent of Total | |||||||||
Current | $ | 2,013,541 | 96 | % | $ | 26,098 | 90 | % | ||||
30-59 days delinquent | 29,316 | 1 | 914 | 3 | ||||||||
60-89 days delinquent | 15,593 | 1 | 657 | 2 | ||||||||
90 + days delinquent | 5,080 | — | 387 | 1 | ||||||||
In process of foreclosure | 38,238 | 2 | 1,028 | 4 | ||||||||
Total principal | $ | 2,101,768 | 100 | % | $ | 29,084 | 100 | % | ||||
Real estate owned | $ | 19,472 | $ | 1,052 | ||||||||
Mortgage Securities Available-for-Sale.
The following tables summarize our mortgage securities – available for sale portfolio and the current assumptions and assumptions at the time of securitization as of December 31, 2006 and 2005:
Table 12 — Valuation of Individual Mortgage Securities – Available-for-Sale and Assumptions
(dollars in thousands)
As of December 31, 20042006
Securitization Trust | Cost (A) | Unrealized | Estimated | Current Assumptions | Assumptions at Trust Securitization | |||||||||||||||||||||||
| Discount Rate | Constant Prepayment Rate | Expected Credit Losses (B) | Discount Rate | Constant Prepayment Rate | Expected Credit Losses (B) | |||||||||||||||||||||||
NMFT Series: | ||||||||||||||||||||||||||||
2002-3 | $ | 3,384 | $ | 56 | $ | 3,440 | 20 | % | 35 | % | 0.4 | % | 20 | % | 30 | % | 1.0 | % | ||||||||||
2003-1 | 9,398 | 418 | 9,816 | 20 | 32 | 1.3 | 20 | 28 | 3.3 | |||||||||||||||||||
2003-2 | 5,458 | 2,450 | 7,908 | 20 | 31 | 0.8 | 28 | 25 | 2.7 | |||||||||||||||||||
2003-3 | 5,255 | 254 | 5,509 | 20 | 29 | 0.8 | 20 | 22 | 3.6 | |||||||||||||||||||
2003-4 | 3,509 | 1,513 | 5,022 | 20 | 38 | 1.0 | 20 | 30 | 5.1 | |||||||||||||||||||
2004-1 | 13,511 | 3,170 | 16,681 | 20 | 47 | 1.3 | 20 | 33 | 5.9 | |||||||||||||||||||
2004-1 (D) | 132 | — | 132 | 20 | N/A | N/A | N/A | N/A | N/A | |||||||||||||||||||
2004-2 | 14,321 | 4,492 | 18,813 | 20 | 47 | 1.3 | 26 | 31 | 5.1 | |||||||||||||||||||
2004-2 (D) | 1,322 | 60 | 1,382 | 20 | N/A | N/A | N/A | N/A | N/A | |||||||||||||||||||
2004-3 | 24,939 | 8,982 | 33,921 | 19 | 48 | 1.5 | 19 | 34 | 4.5 | |||||||||||||||||||
2004-4 | 16,237 | 8,684 | 24,921 | 20 | 56 | 1.3 | 26 | 35 | 4.0 | |||||||||||||||||||
2005-1 | 20,525 | 4,558 | 25,083 | 15 | 60 | 1.7 | 15 | 37 | 3.6 | |||||||||||||||||||
2005-2 | 13,831 | 67 | 13,898 | 13 | 54 | 1.5 | 13 | 39 | 2.1 | |||||||||||||||||||
2005-3 | 13,047 | 1,169 | 14,216 | 15 | 51 | 1.5 | 15 | 41 | 2.0 | |||||||||||||||||||
2005-3 (C) | 47,814 | (1,131 | ) | 46,683 | N/A | N/A | N/A | N/A | N/A | N/A | ||||||||||||||||||
2005-3 (D) | 6,423 | 1,473 | 7,896 | 15 | N/A | N/A | N/A | N/A | N/A | |||||||||||||||||||
2005-4 | 11,087 | 1,194 | 12,281 | 15 | 49 | 2.0 | 15 | 43 | 2.3 | |||||||||||||||||||
2005-4 (D) | 5,278 | 1,143 | 6,421 | 15 | N/A | N/A | N/A | N/A | N/A | |||||||||||||||||||
2006-2 | 13,835 | — | 13,835 | 15 | 46 | 3.2 | 15 | 44 | 2.4 | |||||||||||||||||||
2006-3 | 13,746 | — | 13,746 | 15 | 45 | 4.3 | 15 | 43 | 3.0 | |||||||||||||||||||
2006-4 | 19,019 | — | 19,019 | 15 | 45 | 3.5 | 15 | 43 | 2.9 | |||||||||||||||||||
2006-5 | 22,181 | — | 22,181 | 15 | 44 | 4.8 | 15 | 43 | 3.9 | |||||||||||||||||||
2006-6 | 26,508 | — | 26,508 | 15 | 42 | 3.9 | 15 | 41 | 3.7 | |||||||||||||||||||
Total | $ | 310,760 | $ | 38,552 | $ | 349,312 | ||||||||||||||||||||||
| (A) | The interest-only, prepayment penalty and overcollateralization securities are presented on a combined basis. |
| (B) | For securities that have not reached their call date - represents expected credit losses for the life of the securitization up to the expected date in which the related asset-backed bonds can be called, net of mortgage insurance recoveries. |
| (C) | Consists of the Class M-11 and M-12 certificates of NMFT Series 2005-3. The M-11 is rated BBB/BBB- by Standard & Poor’s and Fitch, respectively. The M-12 is rated BBB- by Standard and Poor’s. The fair value for these securities is based upon market prices. |
| (D) | Represent CT Bonds. |
As of December 31, 2005
Securitization Trust | Cost (A) | Unrealized | Estimated | Current Assumptions | Assumptions at Trust Securitization | |||||||||||||||||||||||
| Discount Rate | Constant Prepayment Rate | Expected Credit Losses (B) | Discount Rate | Constant Prepayment Rate | Expected Credit Losses (B) | |||||||||||||||||||||||
NMFT Series: | ||||||||||||||||||||||||||||
2000-1 | $ | 521 | $ | 596 | $ | 1,117 | 15 | % | 36 | % | 1.3 | % | 15 | % | 27 | % | 1.0 | % | ||||||||||
2000-2 | — | 907 | 907 | 15 | 37 | 1.0 | 15 | 28 | 1.0 | |||||||||||||||||||
2001-1 | — | 1,661 | 1,661 | 20 | 40 | 1.3 | 20 | 28 | 1.2 | |||||||||||||||||||
2001-2 | — | 3,701 | 3,701 | 20 | 31 | 0.7 | 25 | 28 | 1.2 | |||||||||||||||||||
2002-1 | 1,632 | 2,184 | 3,816 | 20 | 41 | 0.7 | 20 | 32 | 1.7 | |||||||||||||||||||
2002-2 | 2,415 | 542 | 2,957 | 20 | 43 | 1.4 | 25 | 27 | 1.6 | |||||||||||||||||||
2002-3 | 4,127 | 1,132 | 5,259 | 20 | 44 | 0.4 | 20 | 30 | 1.0 | |||||||||||||||||||
2003-1 | 30,815 | 5,941 | 36,756 | 20 | 39 | 1.3 | 20 | 28 | 3.3 | |||||||||||||||||||
2003-2 | 11,043 | 8,330 | 19,373 | 20 | 39 | 0.8 | 28 | 25 | 2.7 | |||||||||||||||||||
2003-3 | 18,261 | 6,860 | 25,121 | 20 | 37 | 0.7 | 20 | 22 | 3.6 | |||||||||||||||||||
2003-4 | 11,070 | 12,191 | 23,261 | 20 | 46 | 0.8 | 20 | 30 | 5.1 | |||||||||||||||||||
2004-1 | 17,065 | 13,142 | 30,207 | 20 | 56 | 1.3 | 20 | 33 | 5.9 | |||||||||||||||||||
2004-2 | 18,368 | 13,432 | 31,800 | 20 | 55 | 1.4 | 26 | 31 | 5.1 | |||||||||||||||||||
2004-3 | 36,502 | 17,287 | 53,789 | 19 | 53 | 1.5 | 19 | 34 | 4.5 | |||||||||||||||||||
2004-4 | 34,473 | 16,102 | 50,575 | 20 | 54 | 1.5 | 26 | 35 | 4.0 | |||||||||||||||||||
2005-1 | 44,387 | 8,481 | 52,868 | 15 | 53 | 1.8 | 15 | 37 | 3.6 | |||||||||||||||||||
2005-2 | 37,377 | 1,296 | 38,673 | 13 | 51 | 1.5 | 13 | 39 | 2.1 | |||||||||||||||||||
2005-3 | 46,627 | — | 46,627 | 15 | 47 | 2.0 | 15 | 41 | 2.0 | |||||||||||||||||||
2005-3 (C) | 45,058 | (2,247 | ) | 42,811 | N/A | N/A | N/A | N/A | N/A | N/A | ||||||||||||||||||
2005-4 | 34,366 | — | 34,366 | 15 | 43 | 2.3 | 15 | 43 | 2.3 | |||||||||||||||||||
Total | $ | 394,107 | $ | 111,538 | $ | 505,645 | ||||||||||||||||||||||
| (A) | The interest-only, prepayment penalty and overcollateralization securities are presented on a combined basis. |
| (B) | For securities that have not reached their call date - represents expected credit losses for the life of the securitization up to the expected date in which the related asset-backed bonds can be called, net of mortgage insurance recoveries. |
| (C) | Consists of the Class M-11 and M-12 certificates of NMFT Series 2005-3. The M-11 is rated BBB/BBB- by Standard & Poor’s and Fitch, respectively. The M-12 is rated BBB- by Standard and Poor’s. The fair value for these securities is based upon market prices. |
As of December 31, 2006 and 2003,2005 the fair value of our mortgage securities – available-for-sale was $489.2$349.3 million and $382.3$505.6 million, respectively. The decline is mostly due to compressed margins, credit impairments and normal paydowns. During 20042006 and 2003,2005 we executed securitizations totaling $8.3 billion and $5.3 billion, respectively, in mortgage loans and retained residual mortgage securities – available-for-sale with a cost basis of $381.8$155.0 million and $292.7$289.5 million, respectively, from securitizations treated as sales during the year. This decrease is primarily due to the fact that we structured two securitizations as on-balance sheet transactions during 2006. During 2006 and 2005 we recognized impairments on mortgage securities – available-for-sale of $30.7 million and $17.6 million, respectively. The increase in impairments was caused by deterioration in credit quality of the loans in our portfolio. See Note 34 to the consolidated financial statements for a summary of the activity in our mortgage securities portfolio.
The value ofprevious tables demonstrate how the increase in housing prices from 2002 through 2005 positively impacted our mortgage securities representssecurity performance and how the present value ofcurrent deterioration in the securities’ cash flows that we expecthousing market is negatively impacting this performance. An increase in home prices will generally lead to receive over their lives, considering estimatedan increase in prepayment speedsrate assumptions as well as a decrease in expected credit loss assumptions. As home prices change in the future our prepayment and credit losses of the underlying loans, discounted at an appropriate risk-adjusted market rate of return. The cash flows are realized over the life of the loan collateral as cash distributions are received from the trust that owns the collateral.
In estimating the fair value of our mortgage securities, management must makeloss assumptions will likely change. Table 20 provides additional detail regarding the future performance and cash flow of the mortgage loans collateralizing the securities. These estimates are based on management’s judgments about the nature of the loans. The cash flows we receiveyields on our mortgage securities will be the net of the gross coupon and the bond cost less administrative costs (servicing and trustee fees) and the cost of mortgage insurance. Additionally, the trust is a party to interest rate agreements. Our cash flow will include (exclude) payments from (to) the interest rate agreement counterparty. Table 3 provides a summary of the critical assumptions used in estimating the cash flows of the collateral and the resulting estimated fair value of the mortgage securities.available-for-sale.
In 2002 and 2003,We have experienced periods prior to 2004 when the interest expense on asset-backed bonds was unexpectedly low.declined significantly due to reductions in short-term interest rates. As a result, the spread between the coupon interest and the bond cost was unusually high and our cost basis in many of our older mortgage securities was significantly reduced. For example, our cost basisreduced due to the dramatic increase in NMFT Series 2000-2, 2001-1 and 2001-2 has been reduced to zero (see Table 3).cash flows. When our cost basis in the retainedresidual securities (interest-only, prepayment penalty and subordinated securities) reaches zero, the remaining future cash flows received on the securities are recognized entirely as income. This was the case of the residual securities we retained from the 2000-2, 2001-1 and 2001-2 securitizations at December 31, 2005 as shown in the table above.
During the first quarter of 2006, to ensure we maintained our REIT qualification, we contributed certain bonds from the REIT to the TRS. We isolated derivative cash flows received from certain residual securities and created the CT Bonds. We then contributed the CT Bonds from the REIT to our TRS. This transaction may add volatility to future reported GAAP earnings because both the IO Bonds and CT Bonds will be evaluated separately for impairment. Historically, the CT Bonds have acted as an economic hedge for the IO Bonds that are retained at the REIT, thus mitigating the impairment risk to the IO Bonds in a rising interest rate environment. As a result of transferring the CT Bonds to the TRS, the IO and CT Bonds will be valued separately creating the risk of earnings volatility resulting from other-than-temporary impairment charges. For example, in a rising rate environment, the IO bond will generally decrease in value while the CT Bond will increase in value. If the decrease in value of the IO Bond is deemed to be other than temporary in nature, we would record an impairment charge through the income statement for such decrease. At the same time, any increase in value of the CT Bond would be recorded in accumulated other comprehensive income.
Summary of Securitizations.
The operating performancefollowing tables provide a summary of our mortgage securities portfolio, including net interest income and effects of hedging are discussed under “Results of Operations” and “Interest Rate/Market Risk.” Additional information relating to ourthe loans collateralizing our mortgage securities can be accessed via our website at www.novastarmortgage.com. Such information includes a summary of our loans collateralizing our mortgage securities by FICO score and geographic concentration,securitizations structured as sales as well as loan performance characteristics such as credit qualitythe outstanding asset backed bonds which were outstanding at December 31, 2006 and prepayment experience.
Table 313 — ValuationSummary of Individual Mortgage Securities – Available-for-Sale and AssumptionsSecuritizations
(dollars in thousands)
| Cost | Net Unrealized Gain | Estimated Fair Value of Mortgage Securities | Current Assumptions | Assumptions at Trust Securitization | |||||||||||||||||||||||
Discount Rate | Constant Prepayment Rate | Expected Credit Losses (A) | Discount Rate | Constant Prepayment Rate | Expected Credit Losses (A) | ||||||||||||||||||||||
December, 2004: | |||||||||||||||||||||||||||
NMFT 1999-1 | |||||||||||||||||||||||||||
Subordinated securities | $ | 7,001 | $ | — | $ | 7,001 | 17 | % | 33 | % | 4.8 | % | 17 | % | 30 | % | 2.5 | % | |||||||||
NMFT 2000-1 | |||||||||||||||||||||||||||
Interest-only | — | 352 | 352 | ||||||||||||||||||||||||
Prepayment penalty | — | 28 | 28 | ||||||||||||||||||||||||
Subordinated securities | 681 | 158 | 839 | ||||||||||||||||||||||||
| 681 | 538 | 1,219 | 15 | 46 | 1.2 | 15 | 27 | 1.0 | |||||||||||||||||||
NMFT 2000-2 | |||||||||||||||||||||||||||
Interest-only | — | 2,019 | 2,019 | ||||||||||||||||||||||||
Prepayment penalty | — | 105 | 105 | ||||||||||||||||||||||||
Subordinated securities | — | 166 | 166 | ||||||||||||||||||||||||
| — | 2,290 | 2,290 | 15 | 34 | 1.0 | 15 | 28 | 1.0 | |||||||||||||||||||
NMFT 2001-1 | |||||||||||||||||||||||||||
Interest-only | — | 2,262 | 2,262 | ||||||||||||||||||||||||
Prepayment penalty | — | 161 | 161 | ||||||||||||||||||||||||
Subordinated securities | — | 688 | 688 | ||||||||||||||||||||||||
| — | 3,111 | 3,111 | 20 | 37 | 1.1 | 20 | 28 | 1.2 | |||||||||||||||||||
NMFT 2001-2 | |||||||||||||||||||||||||||
Interest-only | — | 6,182 | 6,182 | ||||||||||||||||||||||||
Prepayment penalty | — | 458 | 458 | ||||||||||||||||||||||||
Subordinated securities | — | 1,961 | 1,961 | ||||||||||||||||||||||||
| — | 8,601 | 8,601 | 25 | 33 | 0.8 | 25 | 28 | 1.2 | |||||||||||||||||||
NMFT 2002-1 | |||||||||||||||||||||||||||
Interest-only | 3,553 | 242 | 3,795 | ||||||||||||||||||||||||
Prepayment penalty | 111 | 457 | 568 | ||||||||||||||||||||||||
Subordinated securities | 1,314 | 5,413 | 6,727 | ||||||||||||||||||||||||
| 4,978 | 6,112 | 11,090 | 20 | 42 | 0.9 | 20 | 32 | 1.7 | |||||||||||||||||||
NMFT 2002-2 | |||||||||||||||||||||||||||
Interest-only | 2,713 | — | 2,713 | ||||||||||||||||||||||||
Prepayment penalty | 151 | 251 | 402 | ||||||||||||||||||||||||
Subordinated securities | 2,184 | 1,391 | 3,575 | ||||||||||||||||||||||||
| 5,048 | 1,642 | 6,690 | 25 | 40 | 1.4 | 25 | 27 | 1.6 | |||||||||||||||||||
As of December 31, 2006
Net Unrealized Gain (Loss) Estimated Fair Value of Mortgage Securities Discount Rate Constant Prepayment Rate Expected Credit Losses (A) Discount Rate Constant Prepayment Rate Expected Credit Losses (A) NMFT 2002-3 Interest-only Prepayment penalty Subordinated securities NMFT 2003-1 Interest-only Prepayment penalty Subordinated securities NMFT 2003-2 Interest-only Prepayment penalty Subordinated securities NMFT 2003-3 Interest-only Prepayment penalty Subordinated securities NMFT 2003-4 Interest-only Prepayment penalty Subordinated securities NMFT 2004-1 Interest-only Prepayment penalty Subordinated securities NMFT 2004-2 Interest-only Prepayment penalty Subordinated securities Cost Current Assumptions Assumptions at Trust Securitization 8,148 — 8,148 509 686 1,195 2,387 3,131 5,518 11,044 3,817 14,861 20 41 0.7 20 30 1.0 17,963 363 18,326 2,316 956 3,272 11,783 3,912 15,695 32,062 5,231 37,293 20 39 1.8 20 28 3.3 15,404 2,422 17,826 4,089 2,133 6,222 2,487 3,368 5,855 21,980 7,923 29,903 28 38 1.5 28 25 2.7 20,825 3,449 24,274 5,108 3,427 8,535 6,842 2,363 9,205 32,775 9,239 42,014 20 37 1.6 20 22 3.6 21,466 5,480 26,946 4,994 5,408 10,402 — 6,839 6,839 26,460 17,727 44,187 20 44 1.7 20 30 5.1 35,731 — 35,731 6,816 5,968 12,784 — 1,335 1,335 42,547 7,303 49,850 20 43 3.5 20 33 5.9 31,062 — 31,062 5,313 4,814 10,127 3,481 881 4,362 39,856 5,695 45,551 26 41 3.8 26 31 5.1
Securitization | Issue Date | Loan Collateral | Asset Backed Bonds | |||||||||||||||||||||
| Original Principal | Current Principal | Weighted Average Coupon | Percent of Loans With Prepayment Penalties | Prepayment Penalty Period for Penalty (Yrs.) | Remaining Principal | Weighted Average Interest Rate | Estimated Months to Call | |||||||||||||||||
NMFT Series: | ||||||||||||||||||||||||
2002-3 | 9/27/2002 | $ | 750,003 | $ | 73,038 | 8.92 | % | 39 | % | 0.25 | $ | 69,709 | 6.05 | % | 3 | |||||||||
2003-1 | 2/27/2003 | 1,300,141 | 173,155 | 8.09 | 38 | 0.34 | 161,034 | 6.17 | 10 | |||||||||||||||
2003-2 | 6/12/2003 | 1,499,998 | 214,894 | 7.92 | 41 | 0.52 | 205,224 | 6.14 | 13 | |||||||||||||||
2003-3 | 9/16/2003 | 1,499,374 | 282,333 | 7.62 | 41 | 0.64 | 273,863 | 6.23 | 23 | |||||||||||||||
2003-4 | 11/20/2003 | 1,499,732 | 260,628 | 8.27 | 36 | 0.62 | 253,505 | 6.37 | 15 | |||||||||||||||
2004-1 | 3/11/2004 | 1,750,000 | 309,992 | 9.01 | 41 | 0.49 | 287,573 | 6.39 | 12 | |||||||||||||||
2004-2 | 6/16/2004 | 1,399,999 | 274,380 | 9.06 | 54 | 0.63 | 249,761 | 6.33 | 14 | |||||||||||||||
2004-3 | 9/9/2004 | 2,199,995 | 496,297 | 9.31 | 50 | 0.65 | 452,297 | 6.38 | 16 | |||||||||||||||
2004-4 | 11/18/2004 | 2,500,000 | 642,881 | 9.43 | 38 | 0.31 | 613,188 | 6.22 | 16 | |||||||||||||||
2005-1 | 2/22/2005 | 2,100,000 | 903,930 | 7.75 | 42 | 0.29 | 879,083 | 5.83 | 20 | |||||||||||||||
2005-2 | 5/27/2005 | 1,799,992 | 972,061 | 7.65 | 73 | 0.49 | 963,061 | 5.80 | 27 | |||||||||||||||
2005-3 | 9/22/2005 | 2,499,983 | 1,566,120 | 7.45 | 71 | 0.67 | 1,499,111 | 5.72 | 32 | |||||||||||||||
2005-4 | 12/15/2005 | 1,599,999 | 1,109,493 | 7.89 | 70 | 0.84 | 1,056,693 | 5.69 | 36 | |||||||||||||||
2006-2 | 6/19/2006 | 1,021,102 | 870,831 | 8.76 | 68 | 1.11 | 852,451 | 5.54 | 42 | |||||||||||||||
2006-3 | 6/29/2006 | 1,100,000 | 992,739 | 8.97 | 67 | 1.21 | 967,989 | 5.55 | 45 | |||||||||||||||
2006-4 | 8/29/2006 | 1,025,359 | 951,206 | 9.25 | 60 | 1.15 | 922,495 | 5.52 | 45 | |||||||||||||||
2006-5 | 9/28/2006 | 1,300,000 | 1,250,254 | 9.37 | 61 | 1.24 | 1,218,404 | 5.55 | 48 | |||||||||||||||
2006-6 | 11/30/2006 | 1,250,000 | 1,242,134 | 9.06 | 63 | 1.38 | 1,209,009 | 5.55 | 52 | |||||||||||||||
Total | $ | 28,095,677 | $ | 12,586,366 | 8.52 | % | 60 | % | 0.84 | $ | 12,134,450 | 5.77 | % | |||||||||||
Net Unrealized Gain (Loss) Estimated Fair Value of Mortgage Securities Discount Rate Constant Prepayment Rate Expected Credit Losses (A) Discount Rate Constant Prepayment Rate Expected Credit Losses (A) NMFT 2004-3 (B) NMFT 2004-4 (B) Total Cost Current Assumptions Assumptions at Trust Securitization 89,442 — 89,442 19 39 3.9 19 34 4.5 96,072 — 96,072 25 36 3.7 25 35 4.0 $ 409,946 $ 79,229 $ 489,175
As of December 31, 2005
Loan Collateral | Asset Backed Bonds | |||||||||||||||||||||||
Securitization | Issue Date | Original Principal | Current Principal | Weighted Average Coupon | Percent of Loans With Prepayment Penalties | Prepayment Penalty Period for Loans w/ Penalty (Yrs.) | Remaining Principal | Weighted Average Interest Rate | Estimated Months to Call | |||||||||||||||
NMFT Series: | ||||||||||||||||||||||||
2000-1 | 3/31/2000 | $ | 230,138 | $ | 14,899 | 10.25 | % | — | % | — | $ | 13,966 | 5.40 | % | — | |||||||||
2000-2 | 9/28/2000 | 339,688 | 19,671 | 10.34 | — | — | 18,828 | 6.22 | — | |||||||||||||||
2001-1 | 3/31/2001 | 415,067 | 36,504 | 10.24 | 26 | 0.05 | 35,736 | 5.13 | — | |||||||||||||||
2001-2 | 9/25/2001 | 800,033 | 80,033 | 9.74 | 42 | 0.25 | 76,483 | 4.83 | 2 | |||||||||||||||
2002-1 | 3/28/2002 | 499,998 | 63,126 | 9.10 | 42 | 0.43 | 59,970 | 4.80 | 7 | |||||||||||||||
2002-2 | 6/28/2002 | 310,000 | 43,692 | 9.61 | 38 | 0.48 | 41,288 | 4.79 | 9 | |||||||||||||||
2002-3 | 9/27/2002 | 750,003 | 116,150 | 8.56 | 34 | 0.55 | 112,085 | 4.78 | 11 | |||||||||||||||
2003-1 | 2/27/2003 | 1,300,141 | 275,785 | 8.05 | 34 | 0.61 | 234,639 | 5.63 | 20 | |||||||||||||||
2003-2 | 6/12/2003 | 1,499,998 | 346,390 | 7.86 | 58 | 0.83 | 327,640 | 5.40 | 22 | |||||||||||||||
2003-3 | 9/16/2003 | 1,499,374 | 451,033 | 7.68 | 58 | 0.99 | 428,533 | 5.25 | 31 | |||||||||||||||
2003-4 | 11/20/2003 | 1,499,732 | 476,251 | 8.04 | 53 | 0.90 | 458,251 | 5.25 | 25 | |||||||||||||||
2004-1 | 3/11/2004 | 1,750,000 | 750,080 | 7.57 | 60 | 0.67 | 727,330 | 4.94 | 23 | |||||||||||||||
2004-2 | 6/16/2004 | 1,399,999 | 681,199 | 7.43 | 79 | 0.83 | 655,999 | 4.96 | 25 | |||||||||||||||
2004-3 | 9/9/2004 | 2,199,995 | 1,206,415 | 7.73 | 81 | 0.96 | 1,162,415 | 5.01 | 28 | |||||||||||||||
2004-4 | 11/18/2004 | 2,500,000 | 1,498,414 | 7.59 | 76 | 0.84 | 1,467,164 | 4.96 | 29 | |||||||||||||||
2005-1 | 2/22/2005 | 2,100,000 | 1,543,209 | 7.62 | 71 | 0.95 | 1,516,959 | 4.78 | 32 | |||||||||||||||
2005-2 | 5/27/2005 | 1,799,992 | 1,527,351 | 7.69 | 69 | 1.14 | 1,518,351 | 4.74 | 38 | |||||||||||||||
2005-3 | 9/22/2005 | 2,499,983 | 2,378,349 | 7.52 | 66 | 1.27 | 2,310,849 | 4.69 | 44 | |||||||||||||||
2005-4 (A) | 12/15/2005 | 1,221,055 | 1,213,728 | 7.95 | 64 | 1.35 | 1,528,673 | 4.60 | 51 | |||||||||||||||
Total | $ | 24,615,196 | $ | 12,722,279 | 7.72 | % | 67 | % | 1.01 | $ | 12,695,159 | 4.87 | % | |||||||||||
| (A) |
Net Unrealized Gain (Loss) Estimated Fair Value of Mortgage Securities Discount Rate Constant Prepayment Rate Expected Credit Losses (A) Discount Rate Constant Prepayment Rate Expected Credit Losses (A) December 31, 2003: NMFT 1999-1 Subordinated securities NMFT 2000-1 Interest-only Prepayment penalty Subordinated securities NMFT 2000-2 Interest-only Prepayment penalty Subordinated securities NMFT 2001-1 Interest-only Prepayment penalty Subordinated securities NMFT 2001-2 Interest-only Prepayment penalty Subordinated securities NMFT 2002-1 Interest-only Prepayment penalty Subordinated securities NMFT 2002-2 Interest-only Prepayment penalty Subordinated securities Cost Current Assumptions Assumptions at Trust Securitization $ 6,119 $ (101 ) $ 6,018 17 % 39 % 5.2 % 17 % 30 % 2.5 % — 1,942 1,942 — 244 244 299 708 1,007 299 2,894 3,193 15 57 1.3 15 27 1.0 — 3,074 3,074 — 274 274 754 1,993 2,747 754 5,341 6,095 15 63 1.0 15 28 1.0 — 6,386 6,386 — 518 518 — 1,629 1,629 — 8,533 8,533 20 53 1.1 20 28 1.2 — 16,343 16,343 — 1,469 1,469 185 3,164 3,349 185 20,976 21,161 25 41 0.9 25 28 1.2 8,437 5,285 13,722 550 937 1,487 1,183 3,444 4,627 10,170 9,666 19,836 20 45 1.3 20 32 1.7 7,093 1,489 8,582 582 678 1,260 1,750 1,315 3,065 9,425 3,482 12,907 25 44 1.8 25 27 1.6
Net Unrealized Gain (Loss) Estimated Fair Value of Mortgage Securities Discount Rate Constant Prepayment Expected Credit Losses (A) Discount Rate Constant Prepayment Rate Expected Credit Losses (A) NMFT 2002-3 Interest-only Prepayment penalty Subordinated securities NMFT 2003-1 Interest-only Prepayment penalty Subordinated securities NMFT 2003-2 Interest-only Prepayment penalty Subordinated securities NMFT 2003-3 Interest-only Prepayment penalty Subordinated securities NMFT 2003-4 Interest-only Prepayment penalty Subordinated securities Total Cost Current Assumptions Assumptions at Trust Securitization
Rate 20,801 5,362 26,163 1,348 1,662 3,010 2,225 1,847 4,072 24,374 8,871 33,245 20 39 0.9 20 30 1.0 47,352 2,280 49,632 3,949 1,814 5,763 6,698 2,877 9,575 57,999 6,971 64,970 20 28 2.8 20 28 3.3 58,709 4,863 63,572 3,042 2,513 5,555 25 265 290 61,776 7,641 69,417 28 30 2.6 28 25 2.7 72,637 3,128 75,765 3,098 1,830 4,928 1,628 3,535 5,163 77,363 8,493 85,856 20 26 3.4 20 22 3.6 41,668 4,107 45,775 4,430 61 4,491 — 790 790 46,098 4,958 51,056 20 33 5.3 20 30 5.1 $ 294,562 $ 87,725 $ 382,287
The following table summarizesprovides information on the cost basis, unrealized gain (loss)FICO scores, weighted average coupons and original weighted average loan-to-values for our loans collateralizing our securitizations structured as sales as of December 31, 2006 and 2005.
Table 14 — Mortgage Loans Collateralizing Mortgage Securities by FICO Score
(dollars in thousands)
| As of December 31, 2006 | As of December 31, 2005 | |||||||||||||||||
FICO Score | Current Principal | Weighted Average Coupon | Original Weighted Average Loan- to-Value | Current Principal | Weighted Average Coupon | Original Weighted Average Loan- to-Value | ||||||||||||
FICO score not available | $ | 7,733 | 10.08 | % | 69.4 | % | $ | 10,004 | 9.54 | % | 70.2 | % | ||||||
540 and below | 922,909 | 9.85 | 77.1 | 965,704 | 8.99 | 78.0 | ||||||||||||
540 to 579 | 1,942,624 | 9.28 | 79.6 | 1,981,585 | 8.44 | 79.5 | ||||||||||||
580 to 619 | 2,728,305 | 8.79 | 82.5 | 2,505,987 | 7.93 | 82.1 | ||||||||||||
620 to 659 | 2,923,022 | 8.27 | 82.6 | 2,946,485 | 7.47 | 82.3 | ||||||||||||
660 and above | 4,061,773 | 7.85 | 83.0 | 4,312,514 | 7.16 | 83.0 | ||||||||||||
Total | $ | 12,586,366 | 8.52 | % | 81.9 | % | $ | 12,722,279 | 7.72 | % | 81.7 | % | ||||||
The following table provides information on the collateral location for our loans collateralizing our securitizations structured as sales as of December 31, 2006 and 2005.
Table 15 — Mortgage Loans Collateralizing Mortgage Securities by Collateral Location
As of December 31, 2006 | As of December 31, 2005 | |||||||
Collateral Location | Percent of Total | Collateral Location | Percent of Total | |||||
Florida | 20 | % | California | 18 | % | |||
California | 15 | Florida | 18 | |||||
Texas | 5 | Texas | 5 | |||||
All other states (each less than 5% of total) | 60 | All other states (each less than 5% of total) | 59 | |||||
Total | 100 | % | Total | 100 | % | |||
The following table provides information on the product type for our loans collateralizing our securitizations structured as sales as of December 31, 2006 and 2005.
Table 16 — Mortgage Loans Collateralizing Mortgage Securities by Product Type
(dollars in thousands)
| As of December 31, | ||||||
Product Type | 2006 | 2005 | ||||
2-Year Fixed | $ | 6,078,256 | $ | 7,112,368 | ||
30-Year Fixed | 2,353,660 | 2,156,910 | ||||
2-Year Fixed Interest-only | 1,655,605 | 1,780,297 | ||||
2-Year Fixed 40/30 | 899,385 | 20,435 | ||||
30/15-Year Fixed | 484,363 | 418,590 | ||||
15-Year Fixed | 356,506 | 418,237 | ||||
3-Year Fixed | 278,350 | 426,511 | ||||
Other Products | 480,241 | 388,931 | ||||
Outstanding principal | $ | 12,586,366 | $ | 12,722,279 | ||
The following table provides delinquency information for our loans collateralizing our securitizations structured as sales as of December 31, 2006 and 2005.
Table 17 — Mortgage Loans Collateralizing Mortgage Securities Delinquencies and Real Estate Owned
(dollars in thousands)
| As of December 31, | ||||||||||||
| 2006 | 2005 | |||||||||||
| Current Principal | Percent of Total | Current Principal | Percent of Total | |||||||||
Current | $ | 11,488,283 | 91 | % | $ | 12,210,770 | 96 | % | ||||
30-59 days delinquent | 288,209 | 2 | 106,918 | 1 | ||||||||
60-89 days delinquent | 148,986 | 1 | 63,413 | 0 | ||||||||
90 + days delinquent | 67,622 | 1 | 68,337 | 1 | ||||||||
In process of foreclosure | 347,285 | 3 | 167,898 | 1 | ||||||||
Real estate owned | 245,981 | 2 | 104,943 | 1 | ||||||||
Total principal and real estate owned | $ | 12,586,366 | 100 | % | $ | 12,722,279 | 100 | % | ||||
Mortgage Securities – Trading.
The following tables provide a summary of our portfolio of trading securities at December 31, 2006 and 2005:
Table 18 — Mortgage Securities - Trading
(dollars in thousands)
As of December 31, 2006
S&P Rating | Original Face | Amortized Cost Basis | Fair Value | Number of Securities | Weighted Average Yield | |||||||||
A+ | $ | 2,199 | $ | 2,202 | $ | 2,195 | 1 | 6.40 | % | |||||
A | 15,692 | 15,444 | 15,466 | 3 | 6.96 | |||||||||
A- | 13,432 | 12,338 | 12,227 | 4 | 10.52 | |||||||||
BBB+ | 53,657 | 51,442 | 51,367 | 14 | 8.56 | |||||||||
BBB | 99,795 | 93,035 | 92,750 | 24 | 9.71 | |||||||||
BBB- | 135,890 | 121,971 | 120,003 | 28 | 11.94 | |||||||||
BB+ | 31,733 | 25,584 | 25,181 | 8 | 16.25 | |||||||||
BB | 13,500 | 10,029 | 10,172 | 3 | 19.50 | |||||||||
Total | $ | 365,898 | $ | 332,045 | $ | 329,361 | 85 | 11.03 | % | |||||
As of December 31, 2005
S&P Rating | Original Face | Amortized Cost Basis | Fair Value | Number of Securities | Weighted Average Yield | |||||||||
A | $ | 11,200 | $ | 10,858 | $ | 10,881 | 1 | 8.00 | % | |||||
BBB+ | 11,200 | 9,391 | 9,193 | 1 | 13.00 | |||||||||
BBB | 12,000 | 8,825 | 9,045 | 1 | 17.00 | |||||||||
BBB- | 20,000 | 14,115 | 14,619 | 1 | 19.00 | |||||||||
Total | $ | 54,400 | $ | 43,189 | $ | 43,738 | 4 | 14.59 | % | |||||
As of December 31, 2006, mortgage securities – trading consisted of subordinated securities which were retained from our securitization transactions in 2005 and 2006 as well as subordinated securities purchased from other issuers during 2006. As of December 31, 2005 mortgage securities – trading consisted of subordinated securities which were retained from our securitization transactions in 2005. The aggregate fair market value of these securities as of December 31, 2006 and December 31, 2005 was $329.4 million and $43.7 million, respectively. Management estimates their fair value based on quoted market prices. The market value of our mortgage securities—available-for-salesecurities – trading fluctuates inversely with bond spreads in the market. Generally, as bond spreads widen (i.e. investors demand more return), the value of our mortgage securities – trading will decline, alternatively, as they tighten, the market value of our mortgage securities – trading will increase. We recognized net trading (losses) gains of $(3.2) million and $0.5 million for the years ended December 31, 2006 and 2005, respectively. As bond spreads have continued to widen into early 2007, we could experience additional mark-to-market losses on our mortgage securities – trading if this trend does not reverse.
We expect to continue to retain, acquire and aggregate various ABS with the mortgage securities—available-for-sale groupedintention of securing non-recourse long-term financing through securitizations while retaining the risk of the underlying securities by yearinvesting in the equity and subordinated debt pieces of issue. For example, under the “Year of Issue for Mortgage Securities Retained” column, the year 2003 is a combination of NMFT Series 2003-1, NMFT Series 2003-2, NMFT Series 2003-3 and NMFT Series 2003-4.CDO.
Table 4 — Summary of Mortgage Securities – Available-for-Sale Retained by Year of Issue
(in thousands)
| 2004 | ||||||||||||||||||||||||||||||||||||
Year of Mortgage | As of December 31 | As of September 30 | As of June 30 | As of March 31 | ||||||||||||||||||||||||||||||||
| Cost | Unrealized Gain (Loss) | Fair Value | Cost | Unrealized (Loss) | Fair Value | Cost | Unrealized Gain (Loss) | Fair Value | Cost | Unrealized Gain (Loss) | Fair Value | |||||||||||||||||||||||||
1999 | $ | 7,001 | $ | — | $ | 7,001 | $ | 6,818 | $ | — | $ | 6,818 | $ | 6,597 | $ | — | $ | 6,597 | $ | 6,353 | $ | 185 | $ | 6,538 | ||||||||||||
2000 | 681 | 2,828 | 3,509 | 539 | 3,046 | 3,585 | 412 | 5,161 | 5,573 | 1,298 | 8,194 | 9,492 | ||||||||||||||||||||||||
2001 | — | 11,712 | 11,712 | — | 16,064 | 16,064 | 321 | 20,910 | 21,231 | 233 | 27,579 | 27,812 | ||||||||||||||||||||||||
2002 | 21,070 | 11,571 | 32,641 | 23,978 | 14,181 | 38,159 | 29,202 | 14,067 | 43,269 | 36,201 | 18,899 | 55,100 | ||||||||||||||||||||||||
2003 | 113,277 | 40,120 | 153,397 | 142,796 | 28,458 | 171,254 | 184,097 | 8,841 | 192,938 | 226,676 | 16,090 | 242,766 | ||||||||||||||||||||||||
2004 | 267,917 | 12,998 | 280,915 | 218,898 | 7,709 | 226,607 | 118,684 | 758 | 119,442 | 60,961 | 1,334 | 62,295 | ||||||||||||||||||||||||
Total | $ | 409,946 | $ | 79,229 | $ | 489,175 | $ | 393,029 | $ | 69,458 | $ | 462,487 | $ | 339,313 | $ | 49,737 | $ | 389,050 | $ | 331,722 | $ | 72,281 | $ | 404,003 | ||||||||||||
| 2003 | ||||||||||||||||||||||||||||||||||||||||
Year Mortgage | As of December 31 | As of September 30 | As of June 30 | As of March 31 | ||||||||||||||||||||||||||||||||||||
| Cost | Unrealized Gain (Loss) | Fair Value | Cost | Unrealized Gain (Loss) | Fair Value | Cost | Unrealized Gain (Loss) | Fair Value | Cost | Unrealized Gain (Loss) | Fair Value | |||||||||||||||||||||||||||||
1999 | $ | 6,119 | $ | (101 | ) | $ | 6,018 | $ | 6,014 | $ | (423 | ) | $ | 5,591 | $ | 5,938 | $ | (363 | ) | $ | 5,575 | $ | 5,864 | $ | (655 | ) | $ | 5,209 | ||||||||||||
2000 | 1,053 | 8,235 | 9,288 | 1,040 | 10,154 | 11,194 | 1,289 | 11,929 | 13,218 | 2,327 | 12,352 | 14,679 | ||||||||||||||||||||||||||||
2001 | 185 | 29,509 | 29,694 | 1,419 | 35,459 | 36,878 | 5,426 | 41,359 | 46,785 | 10,310 | 43,527 | 53,837 | ||||||||||||||||||||||||||||
2002 | 43,969 | 22,019 | 65,988 | 50,848 | 25,869 | 76,717 | 58,883 | 27,345 | 86,228 | 66,928 | 26,775 | 93,703 | ||||||||||||||||||||||||||||
2003 | 243,236 | 28,063 | 271,299 | 189,710 | 17,542 | 207,252 | 132,959 | 16,167 | 149,126 | 67,134 | 7,515 | 74,649 | ||||||||||||||||||||||||||||
Total | $ | 294,562 | $ | 87,725 | $ | 382,287 | $ | 249,031 | $ | 88,601 | $ | 337,632 | $ | 204,495 | $ | 96,437 | $ | 300,932 | $ | 152,563 | $ | 89,514 | $ | 242,077 | ||||||||||||||||
Mortgage Securities – Trading. Mortgage securities – trading consist of mortgage securities purchased by us that we intend to sell in the near term. These securities are recorded at fair value with gains and losses, realized and unrealized, included in earnings. As of December 31, 2004, mortgage securities—trading consisted of an adjustable-rate mortgage-backed security with a fair market value of $143.2 million. For the year ended December 31, 2004, we recorded no gains or losses related to the security. As of December 31, 2004, we had pledged the security as collateral for financing purposes.
Mortgage Servicing Rights. As discussed under Mortgage Securities – Available for Sale, we
We retain the right to service mortgage loans we originate, purchase and have securitized. Servicing rights for loans we sell to third parties are not retained and we have not purchased the right to service those loans. As of December 31, 2004,2006, we have $42.0had $62.8 million in capitalized mortgage servicing rights compared with $19.7$57.1 million as of December 31, 2003.2005. This increase was due to the addition of $39.5 million in capitalized mortgage servicing rights from securitizations structured as sales we completed during 2006 offset by amortization of mortgage servicing rights of $33.6 million for 2006.
Warehouse Notes Receivable.
Warehouse notes receivable increased to $39.5 million at December 31, 2006 from $25.4 million at December 31, 2005. These notes receivable represent warehouse lines of credit provided to a network of approved mortgage lenders. The increase in warehouse notes receivable from 2005 to 2006 is a result of growth in this business.
Accrued Interest Receivable.
Accrued interest receivable increased to $37.7 million at December 31, 2006 from $4.9 million at December 31, 2005. This increase is directly related to the significant increase in our loan balances at December 31, 2006 from December 31, 2005.
Real Estate Owned.
Real estate owned increased to $21.5 million at December 31, 2006 from $1.2 million at December 31, 2005. This increase is directly related to the significant increase in our mortgage servicing rightsloan held-in-portfolio balances at December 31, 2006 from December 31, 2005. The stated amount of real estate owned on our consolidated balance sheet is attributable tonet of expected future losses on the sale of the property. In addition, we experienced a higher rate of delinquencies from loan borrowers in 2006 which brought about an increase in the size of our securitizations during 2004 as compared to 2003. The value of the mortgage servicing rights we retained in our securitizations during 2004 and 2003 was $39.3 million and $20.8 million, respectively. Amortization of mortgage servicing rights was $16.9 million, $9.0 million and $4.6 million for the years ended December 31, 2004, 2003 and 2002, respectively.foreclosures.
Derivative Instruments, net.
Servicing Related Advances.Advances on behalf of borrowers for taxes, insurance and other customer service functions are made by NovaStar Mortgage and aggregated $20.2 million as of December 31, 2004 compared with $19.3 million as of December 31, 2003.
Derivative Instruments, net.Derivative instruments, net decreased from $19.5increased to $16.8 million at December 31, 2003 to $18.82006 from $12.8 million at December 31, 2004. Derivative instruments2005. These amounts include the collateral (margin deposits) required under the terms of our derivative instrument contracts, net of the derivative instrument market values. Due to the nature of derivative instruments we use, the margin deposits required will generally increase as interest rates decline and decrease as interest rates rise. On the other hand, the market value of our derivative instruments will decline as interest rates decline and increase as interest rates rise.
Other AssetsShort-term Borrowings. Included in other assets are receivables from securitizations, warehouse loans receivable, tax assets and other miscellaneous assets. Our receivables from securitizations were $4.8 million and $6.2 million at December 31, 2004 and December 31, 2003, respectively. These receivables represent cash due to us on our mortgage securities - available-for-sale. As of December 31, 2004 we had warehouse loans receivable of $5.9 million. In 2004, we began lending to independent mortgage loan brokers in an effort to strengthen our relationships with these brokers and, in turn, increase our nonconforming loan production. As of December 31, 2004, we had a deferred tax asset of $11.2 million compared to $10.5 million as of December 31, 2003. As of December 31, 2004, we had a current tax receivable of $17.2 million. We had a current tax liability as of December 31, 2003 as discussed under the heading “Accounts Payable and Other Liabilities”. The change from a current tax liability to a current tax receivable was primarily the result of an overpayment of estimated 2004 income taxes.
Short-term Borrowings.Mortgage loan originations and purchases are funded with various financing facilities prior to securitization.securitization or sales to third parties. Repurchase agreements are used as interim, short-term financing before loans are sold or transferred in our securitization transactions. In addition we finance certain of our mortgage securities by using repurchase agreements. As of December 31, 2006 we had $2.2 billion in short-term borrowings compared to $1.4 billion at December 31, 2005. The balances outstanding under our short-term arrangementsrepurchase agreements fluctuate based on lending volume, equity and debt issuances, financing activities and cash flows from other operating and investing and other financing activities and equity transactions. As shown inactivities. See Table 5, we have $268.6 million in immediately available funds as of December 31, 2004. We have borrowed approximately $765.6 million of the $3.7 billion in committed mortgage securities repurchase facilities, leaving approximately $2.9 billion available to support the mortgage lending and mortgage portfolio operations. See the “Liquidity and Capital Resources” section of “Management’s Discussion and Analysis of Financial Condition and Results of Operations”35 for a further discussion of liquidity risksour financing availability and resources available to us.liquidity.
Asset-backed bonds.
Table 5 — Short-term Financing Resources
(in thousands)
Credit Limit | Lending Value of Collateral | Borrowings | Availability | |||||||||
Unrestricted cash | $ | 268,563 | ||||||||||
Mortgage securities and mortgage loans repurchase facilities | $ | 3,650,000 | $ | 765,645 | $ | 765,645 | — | |||||
Other | 235,912 | 139,883 | 139,883 | — | ||||||||
Total. | $ | 3,885,912 | $ | 905,528 | $ | 905,528 | $ | 268,563 | ||||
Asset-backed Bonds. During 1997 and 1998, we completed the securitization of loans in transactions that were structured as financing arrangements for accounting purposes. These non-recourse financing arrangements match the loans with the financing arrangement for long periods of time, as compared to repurchase agreements that mature frequently with interest rates that reset frequently andWe have liquidity risk in the form of margin calls. Under the terms of ourissued asset-backed bonds we are entitled to repurchase thesecured by mortgage loan collateral and repay the remaining bond obligations when the aggregate collateral principal balance falls below 35% of their original balance for the loans in NHES 97-01 and 25% for the loans in NHES 97-02, 98-01 and 98-02. We have not exercised our right to repurchase any loans and repay bond obligations.
During 2004, we issued three asset-backed bonds, NIMs, totaling $515.1 million compared to one issue in 2003 for $54 million. These NIMs are secured by the interest-only, prepayment penalty and subordinated mortgage securities of our mortgage securities – available-for-sale as a means for long-term financing. The resecuritizations were structured as secured borrowings for financial reporting and income tax purposes. In accordance with SFAS No. 140, control over the transferred assets was not surrendered and thus the transaction was considered a financing for the mortgage securities - available-for-sale. Therefore, the mortgage securities are recorded as assets and the asset-backed bonds are recorded as debt. Note 7 to the consolidated financial statements provides additional detail regarding these transactions.
Due to trusts.Due to trusts represents the fair value of the loans we have the right to repurchase from the securitization trusts. The servicing agreements we execute for loans we have securitized include a removal of accounts provision which gives us the right, not the obligation, to repurchase mortgage loans from the trust. The removal of accounts provision can be exercised for loans that are 90 days to 119 days delinquent. As of December 31, 2004 and December 31, 2003, our liability related2006 we had $2.1 billion in asset-backed bonds compared to this provision was $20.9 million and $14.5 million, respectively.
Accounts Payable and Other Liabilities. Included in accounts payable and other liabilities is accrued payroll and other liabilities. Our accrued payroll increased from $18.1$152.6 million at December 31, 20032005. We executed two loan securitizations treated as financings during 2006 which increased our asset-backed bonds by $2.5 billion. This increase was partially offset by bond payments during the year.
Junior Subordinated Debentures.
Junior subordinated debentures increased to $24.9$83.0 million at December 31, 2004. The increase in accrued payroll is due to our change2006 from paying employees twice a month to every two weeks. Our current income tax liability was $7.9$48.7 million as ofat December 31, 2003.
Stockholders’ Equity.The increase.
The decrease in our stockholders’shareholders’ equity as of December 31, 20042006 compared to December 31, 20032005 is a result of the following increases and decreases.
Stockholders’Shareholders’ equity increased by:
$115.472.9 million due to net income recognized for the year ended December 31, 20042006;
$72.1 million due to issuance of preferred stock
$15.930.0 million due to impairment on mortgage securities – available for sale reclassified to earningsearnings;
$2.5 million due to net settlements on cash flow hedges reclassified to earnings
$3.80.9 million due to issuance of stock under incentive stock compensation plansplans;
$0.97.2 million due to tax benefit derived from stock compensation plans,the capitalization of an affiliate; and
$0.10.2 million due to forgiveness of founders’ notes receivable.the increase in unrealized gains on derivative instruments used in cash flow hedges.
Stockholders’Shareholders’ equity decreased by:
$177.00.3 million due to adjustments on derivatives instruments used in cash flow hedges reclassified to earnings;
$99.7 million due to the decrease in unrealized gains on mortgage securities classified as available-for-sale;
$5.1 million due to the decrease in unrealized gain on mortgage securities – available-for-sale related to repurchase of mortgage loans from securitization trusts;
$198.2 million due to dividends accrued or paid on common stockstock;
$24.4 million due to decrease in unrealized gains on mortgage securities classified as available-for-sale, and
The Board of Directors declared a two-for-one split of its common stock, providing shareholders of record as of November 17, 2003, with one additional share of common stock for each share owned. The additional shares resulting from the split were issued on December 1, 2003 increasing the number of common shares outstanding$2.2 million due to 24.1 million shares.dividend equivalent rights (DERs) paid in cash.
Results of Operations
Continuing OperationsDecember 31, 2006 as Compared to December 31, 2005.During
During the yeartwelve months ended December 31, 2004,2006 we earned net income from continuing operations available to common shareholders of $113.2$66.3 million, or $4.40$1.92 per diluted share compared with income from continuing operations available to common shareholders of $112.0$132.5 million or $4.91 per diluted share and of $48.8 million, or $2.25$4.42 per diluted share for the same periodsperiod in 2005.
As discussed under “Executive Overview of 2003Performance,” net income available to common shareholders decreased during the twelve months ended December 31, 2006 as compared to the same period in 2005 due primarily to:
Decline in gains on sales of mortgage assets of $23.4 million. This was due primarily to an increase of $25.4 million to the reserve for losses related to loan repurchases on loans we sold to third parties. Because of the performance of our 2006 loan production, we anticipate a greater level of loan repurchase requests than we have had historically, requiring us to increase this reserve.
Increase in provision for credit losses of $29.1 million due to the securitization of $2.6 billion of mortgage loans during the second and 2002, respectively.third quarters of 2006 structured as financings. An allowance for loan losses was recorded for estimated probable losses within the mortgage loans. Most of this increase is due to the initial establishment of the reserve, yet, the provision is higher than anticipated due to increased delinquency rates.
Increase in impairments on mortgage securities – available-for-sale of $13.1 million. These impairments were driven largely by increasing credit loss assumptions mostly in our 2006 vintage residual securities.
Interest income from our securities portfolio as well as the net yield on these securities declined. Although the overall balance of our mortgage securities increased in 2006 from 2005 because of the purchase and retention of subordinated securities, interest income – mortgage securities decreased by $24.0 million from
2005 and the net yield also decreased by 12.29% from 2005. These declines were primarily a result of the addition of lower-yielding securities and the erosion in our portfolio of residual securities caused by margin compression, credit deterioration and normal paydowns.
December 31, 2005 as Compared to December 31, 2004.
Our primary sourcesDuring the twelve months ended December 31, 2005, we earned net income available to common shareholders of revenue are interest earned on our mortgage loan and securities portfolios, fee$132.5 million, or $4.42 per diluted share, compared with net income and gains on sales and securitizations of mortgage loans. As discussed under “Overview$109.1 million, or $4.24 per diluted share for the same period of Performance,”2004.
Net income from continuing operations available to common shareholders increased during 2004the twelve months ended December 31, 2005 as compared to 2003the same period in 2004 due primarily to higher volumes of averageto:
Increase in income generated by our mortgage securities -– available-for-sale held andportfolio, which increased to $505.6 million as of December 31, 2005 from $489.2 million as of December 31, 2004. The higher average balance along with a higher net yield on our mortgage loan originations and purchases securitized. The effects ofsecurities in 2005 led to the increase in income on our mortgage securities.
Increase in interest income on servicing funds we hold as custodian driven by higher mortgage security volume are displayedshort-term interest rates in Table 6. Details regarding higher mortgage loan origination and purchase volumes and2005 compared to 2004.
Increase in gains on securitizationderivative instruments due to the significant increase in short-term interest rates.
All three of these factors were able to offset the decline in gains on sales of mortgage assets are shownwhich resulted from the decline in Tables 1, 8 and 9.mortgage banking profit margins.
Discontinued Operations.Net Interest Income.As
We earn interest income primarily on our mortgage assets which include mortgage securities available-for-sale, mortgage securities trading, mortgage loans held-in-portfolio and mortgage loans held-for-sale. In addition we earn interest income on servicing funds we hold as custodian along with general operating funds. Interest expense consists primarily of interest paid on borrowings secured by mortgage assets, which includes warehouse repurchase agreements and asset backed bonds.
The following table provides the demandcomponents of net interest income for conforming loans declined significantly during 2004, many branches have not been ablethe years ended December 31, 2006, 2005 and 2004.
Table 19 — Net Interest Income
(dollars in thousands)
| For the Year Ended December 31, | ||||||||||||
| 2006 | 2005 | 2004 | ||||||||||
Interest income: | ||||||||||||
Mortgage securities | $ | 164,858 | $ | 188,856 | $ | 133,633 | ||||||
Mortgage loans held-for-sale | 157,807 | 105,104 | 83,571 | |||||||||
Mortgage loans held-in-portfolio | 134,604 | 4,311 | 6,673 | |||||||||
Other interest income | 37,621 | 22,456 | 6,968 | |||||||||
Total interest income | 494,890 | 320,727 | 230,845 | |||||||||
Interest expense: | ||||||||||||
Short-term borrowings secured by mortgage loans | 121,628 | 58,492 | 31,411 | |||||||||
Short-term borrowings secured by mortgage securities | 14,237 | 1,770 | 4,836 | |||||||||
Other short-term borrowings | 488 | — | — | |||||||||
Asset-backed bonds secured by mortgage loans | 88,117 | 1,810 | 2,980 | |||||||||
Asset-backed bonds secured by mortgage securities | 3,860 | 15,628 | 13,255 | |||||||||
Junior subordinated debentures | 7,001 | 3,055 | — | |||||||||
Total interest expense | 235,331 | 80,755 | 52,482 | |||||||||
Net interest income before provision for credit losses | 259,559 | 239,972 | 178,363 | |||||||||
Provision for credit losses | (30,131 | ) | (1,038 | ) | (726 | ) | ||||||
Net interest income | $ | 229,428 | $ | 238,934 | $ | 177,637 | ||||||
Our net interest income decreased to produce sufficient fees to meet operating expense demands. As a result of these conditions, a significant number of branch managers voluntarily terminated employment with us. We also terminated branches when loan production results were substandard. In these terminations, the branch and all operations are eliminated. The operating results for these discontinued operations have been segregated from our on-going operating results. Our loss from discontinued operations net of income tax$229.4 million for the year ended December 31, 2004 was $4.1 million. Note 142006 from $238.9 million for December 31, 2005. While our interest income increased in 2006 due to our consolidated financial statements provides detail regarding the impact of the discontinued operations.
Net Interest Income.Our mortgage securities available-for-sale primarily represent our ownership in the net cash flows of the underlyinghigher average mortgage loan collateralbalances, this increase was offset by an increase in excess of bond expenses and cost of funding. The cost of funding is indexed to one-month LIBOR and resets monthly while the coupon on the mortgage loan collateral adjusts more slowly depending on the contractual terms of the loan. In 2002, we began transferringour interest rate agreements at the time of securitization into the securitization trusts to help reduce this interest rate risk and to decrease the volatility of future cash flows related to the securitized mortgage loans. As a result, future interest income on our mortgage securities is expected to be less volatile. The spreads on our newer mortgage securities - available-for-sale have returned to expected or normal levelsexpense as a result of higher average outstanding debt balances as well as increases in the cost of this financing, due to increasing short-term interest rate risk management strategy and alsorates. In addition, the significant increase in our provision for credit losses reduced our net interest income for 2006 as compared to 2005. The increase in the provision for credit losses in 2006 is due largely to the transfer of $2.7 billion of mortgage loans from the held-for-sale classification to the held-in-portfolio classification during the first quarter of 2006 as a result of the coupon on the mortgagesecuritizing these loans adjusting downward. The significant increase in one-month LIBOR in 2004 has also contributed to the decline in our overall securities yield from 2003.
While the spreads on our securities have decreased, the overall interest income continues to be high due to the sizeable increase in our mortgage securities - available-for-sale retained. Based on these factors,transactions structured as shown in Table 6, we experienced a decrease in the average net yield on our securities from 31.3% for the year ended December 31, 2003 to 27.2% for the same period of 2004. Mortgage security net yield for the year ended December 31, 2002 was 40.6%.
The overall dollar volume of interest income has increased primarily because the size of our mortgage securities - available-for-sale portfolio has increased significantlyfinancings, which were completed during the past year. As shown in Tables 6 and 7, the average valuethird quarter of 2006. A provision for loan losses was recorded for estimated probable losses within our mortgage securities - available-for-sale increased from $288.4 million and $132.3 million during the years ended December 31, 2003 and 2002, respectively, to $425.4 million during the year ended December 31, 2004. The average balanceportfolio of mortgage loans collateralizingclassified as held-in-portfolio. Also contributing to the increase in the provision for credit losses in 2006 is deterioration in credit quality of our securities increased from $4.3 billionloans. Our allowance for credit losses will be impacted in 2003 to $8.4 billionthe future by our securitization strategies as well as delinquency and loss rates in 2004. We expect to increase the amountour portfolio of mortgage securities - available-for-sale we own as we securitizeloans held-in-portfolio.
Activity in the allowance for credit losses on mortgage loans we originate and purchase.
As previously discussed, the trust that issues our interest-only securities owns interest rate agreements. These agreements reduce interest rate risk within the trust and,– held-in-portfolio is as a result, the cash flows we receive on our interest-only securities are less volatile as interest rates change. Table 6 is a summary of the interest income and expense related to our mortgage securities and the related yields as a percentage of the fair market value of these securitiesfollows for the three years ended December 31, (dollars in thousands):
| 2006 | 2005 | 2004 | ||||||||||
Balance, beginning of period | $ | 699 | $ | 507 | $ | 1,319 | ||||||
Provision for credit losses | 30,131 | 1,038 | 726 | |||||||||
Charge-offs, net of recoveries | (8,378 | ) | (846 | ) | (1,538 | ) | ||||||
Balance, end of period | $ | 22,452 | $ | 699 | $ | 507 | ||||||
As shown in table 20, below, our average net security yield decreased to 29.82% for 2006 from 42.11% for 2005 and 32.77% for 2004. The decrease in our average security yield from 2005 to 2006 is primarily a result of margin compression as well as our retention and purchase of lower-yielding residual and subordinated securities. The increase in yield from 2004 to 2005 is a result of lowering credit loss assumptions in 2005 due to better than expected performance as a result of substantial housing price appreciation.
The following table presents the average balances for our mortgage securities, mortgage loans held-for-sale, mortgage loans held-in-portfolio and our repurchase agreement and securitization financings for those assets with the corresponding yields for the years ended December 31, 2006, 2005 and 2004.
Table 6 - Mortgage Securities20 — Net Interest Income Analysis
(dollars in thousands)
| December 31, | ||||||||||||
| 2004 | 2003 | 2002 | ||||||||||
Average fair market value of mortgage securities – available-for-sale | $ | 425,400 | $ | 288,361 | $ | 132,250 | ||||||
Average borrowings | 337,282 | 222,653 | 89,612 | |||||||||
Interest income | 133,633 | 98,804 | 56,481 | |||||||||
Interest expense | 18,091 | 8,676 | 2,834 | |||||||||
Net interest income | $ | 115,542 | $ | 90,128 | $ | 53,647 | ||||||
Yields: | ||||||||||||
Interest income | 31.4 | % | 34.3 | % | 42.7 | % | ||||||
Interest expense | 5.4 | 3.9 | 3.2 | |||||||||
Net interest spread | 26.0 | % | 30.4 | % | 39.5 | % | ||||||
Net Yield | 27.2 | % | 31.3 | % | 40.6 | % | ||||||
Mortgage securities interest analysis Average balances: Mortgage securities (A) Short-term borrowings secured by mortgage securities Asset-backed bonds secured by mortgage securities Yield analysis: Interest income (A) Interest expense short-term borrowings Interest expense asset backed bonds Total financing expense Net interest spread Net yield (B) Mortgage loans held-for-sale interest analysis Average balances: Mortgage loans held-for-sale Short-term borrowings secured by mortgage loans held-for-sale Yield analysis: Interest income Interest expense short-term borrowings Net interest spread Net yield (B) Mortgage loans held-in-portfolio interest analysis Average balances: Mortgage loans held-in-portfolio Asset-backed bonds secured by mortgage loans held-in-portfolio Short-term borrowings secured by mortgage loans held-in-portfolio Yield analysis: Interest income Interest expense asset backed bonds Interest expense short-term borrowings Total financing expense Net interest spread Net yield (B) For the Year Ended December 31, 2006 2005 2004 $ 492,155 $ 407,119 $ 352,608 223,715 42,376 167,822 54,836 227,733 166,868 33.50 % 46.39 % 37.90 % 6.36 % 4.18 % 2.88 % 7.04 % 6.86 % 7.94 % 6.50 % 6.44 % 5.41 % 27.00 % 39.95 % 32.49 % 29.82 % 42.11 % 32.77 % $ 1,757,246 $ 1,338,716 $ 1,198,534 1,680,337 1,242,388 1,172,607 8.98 % 7.85 % 6.97 % 6.01 % 4.67 % 2.68 % 2.97 % 3.18 % 4.29 % 3.24 % 3.51 % 4.35 % $ 1,790,302 $ 47,857 $ 75,337 1,511,650 42,916 70,687 327,609 — — 7.52 % 9.01 % 8.86 % 5.83 % 4.22 % 4.22 % 5.53 % — % — % 5.78 % 4.22 % 4.22 % 1.74 % 4.79 % 4.64 % 1.58 % 5.23 % 4.90 %
| (A) | Consists of the average cost basis of our mortgage securities-available-for-sale portfolio as well as the average fair value of our mortgage securities trading portfolio. The yield information does not give effect to the changes in fair value of our mortgage securities-available-for-sale portfolio which are reflected as a component of shareholders’ equity. |
| (B) | Net yield is calculated as the net interest income divided by the average daily balance of the asset. The net yield will not equal the net interest spread due to the difference in denominators of the two calculations. |
Mortgage Portfolio Net interest income on mortgage loans represents income on loans held-for-sale during their warehouse period as well as loans held-in-portfolio, which are maintained on our balance sheet as a result of the four securitization transactions we executed in 1997 and 1998. Net interest income on mortgage loans before other expense increased from $39.9 million and $25.8 million for the years ended December 31, 2003 and 2002, respectively to $55.9 million for the same period of 2004. The net interest income from mortgage loans is primarily driven by loan volume and the amount of time held-for-sale loans are in the warehouse.
Future net interest income will be dependent upon the size and volume of our mortgage securities - available-for-sale and loan portfolios and economic conditions.
Interest Income. Our portfolio income comes from mortgage loans either directly (mortgage loans held-in-portfolio)held-in-portfolio and mortgage loans held-for-sale) or indirectly (mortgage securities). Table 721 attempts to look through the balance sheet presentation of our portfolio income and present income as a percentage of average assets under management. The net interest income for mortgage securities, mortgage loans held-for-saleheld-in-portfolio and mortgage loans held-in-portfolioheld-for-sale reflects the income after interest expense, hedging prepayment penalty income and credit expense (mortgage insurance and provision for credit (losses) recoveries)losses). This metric allows us to be more easily compared to other finance companies or financial institutions that use on balance sheet portfolio accounting, where return on assets is a common performance calculation. Over time, we believe a sustainable return on these assets should be in the range of 1% to 1.25%.
Our portfolio net interest yield on assets was 1.53%1.21% for the year ended December 31, 20042006 as compared to 2.25%1.76% and 2.49%,1.70% respectively, for the same periodperiods of 20032005 and 2002. As2004. The decrease in yield from 2006 and 2005 can be attributed primarily to the addition of lower-yielding securities and recording a higher provision for credit losses in 2006 compared to 2005.
The increase in yield from 2004 to 2005 can be attributed to the lower than expected credit losses due to rising housing prices which resulted in the lowering of our credit loss assumptions on certain mortgage securities available-for-sale as previously discussed, the decreasediscussed. In addition, net settlement expense on non-cash flow hedging derivatives was lower in 2005 compared with 2004 as short-term interest rates increased in 2005.
We generally expect our net interest yield on portfolio assets primarily resulted from the decreaseto be in the spreads on our mortgage securities.range of 1% to 1.25% over the long-term. Table 721 shows the net interest yield in bothon assets under management and the return on assets during the three years ended December 31, 2006, 2005 and 2004.
Table 721 — Mortgage Portfolio Management Net Interest Income Analysis
(dollars in thousands)
Mortgage Securities | Mortgage Loans Held-for- Sale | Mortgage Loans Held-in- Portfolio | Total | Mortgage Securities – Available-for-Sale | Mortgage Loans Held-in-Portfolio | Mortgage for-Sale | Total | |||||||||||||||||||||||||
For the Year Ended: | ||||||||||||||||||||||||||||||||
December 31, 2004 | ||||||||||||||||||||||||||||||||
Interest income | $ | 133,633 | $ | 83,718 | $ | 6,673 | $ | 224,024 | ||||||||||||||||||||||||
December 31, 2006 | ||||||||||||||||||||||||||||||||
Interest income (A) | $ | 139,021 | $ | 134,604 | $ | 157,807 | $ | 431,432 | ||||||||||||||||||||||||
Interest expense: | ||||||||||||||||||||||||||||||||
Short-term borrowings (A) | 4,836 | 30,005 | — | 34,841 | ||||||||||||||||||||||||||||
Short-term borrowings | — | 18,120 | 103,508 | 121,628 | ||||||||||||||||||||||||||||
Asset-backed bonds | 13,255 | — | 1,422 | 14,677 | — | 88,117 | — | 88,117 | ||||||||||||||||||||||||
Cash flow hedging net settlements | — | 1,514 | 1,558 | 3,072 | ||||||||||||||||||||||||||||
Total interest expense | 18,091 | 31,519 | 2,980 | 52,590 | ||||||||||||||||||||||||||||
Total interest expense (B) | — | 106,237 | 103,508 | 209,745 | ||||||||||||||||||||||||||||
Mortgage portfolio net interest income before other expense | 115,542 | 52,199 | 3,693 | 171,434 | 139,021 | 28,367 | 54,299 | 221,687 | ||||||||||||||||||||||||
Other expense (B) | 368 | (23,123 | ) | (1,254 | ) | (24,009 | ) | |||||||||||||||||||||||||
Other (expense) income (C) | — | (36,401 | ) | 3,688 | (32,713 | ) | ||||||||||||||||||||||||||
Mortgage portfolio net interest income (expense) | $ | 139,021 | $ | (8,034 | ) | $ | 57,987 | $ | 188,974 | |||||||||||||||||||||||
Average balance of the underlying loans | $ | 12,057,038 | $ | 1,790,302 | $ | 1,757,246 | $ | 15,604,586 | ||||||||||||||||||||||||
Net interest yield on assets | 1.15 | % | (0.45 | %) | 3.30 | % | 1.21 | % | ||||||||||||||||||||||||
December 31, 2005 | ||||||||||||||||||||||||||||||||
Interest income (A) | $ | 188,856 | $ | 4,311 | $ | 105,104 | $ | 298,271 | ||||||||||||||||||||||||
Interest expense: | ||||||||||||||||||||||||||||||||
Short-term borrowings | — | — | 58,492 | 58,492 | ||||||||||||||||||||||||||||
Asset-backed bonds | — | 1,810 | — | 1,810 | ||||||||||||||||||||||||||||
Total interest expense (B) | — | 1,810 | 58,492 | 60,302 | ||||||||||||||||||||||||||||
Mortgage portfolio net interest income before other expense | 188,856 | 2,501 | 46,612 | 237,969 | ||||||||||||||||||||||||||||
Other income (expense) (C) | 1,651 | (1,124 | ) | (2,580 | ) | (2,053 | ) | |||||||||||||||||||||||||
Mortgage portfolio net interest income | $ | 115,910 | $ | 29,076 | $ | 2,439 | $ | 147,425 | $ | 190,507 | $ | 1,377 | $ | 44,032 | $ | 235,916 | ||||||||||||||||
Average balance of the underlying loans | $ | 8,431,708 | $ | 1,113,736 | $ | 71,784 | $ | 9,617,228 | $ | 12,006,929 | $ | 47,857 | $ | 1,338,716 | $ | 13,393,502 | ||||||||||||||||
Net interest yield on assets | 1.37 | % | 2.61 | % | 3.40 | % | 1.53 | % | 1.59 | % | 2.88 | % | 3.29 | % | 1.76 | % | ||||||||||||||||
December 31, 2003 | ||||||||||||||||||||||||||||||||
Interest income | $ | 98,804 | $ | 60,878 | $ | 10,738 | $ | 170,420 | ||||||||||||||||||||||||
December 31, 2004 | ||||||||||||||||||||||||||||||||
Interest income (A) | $ | 133,633 | $ | 6,673 | $ | 83,571 | $ | 223,877 | ||||||||||||||||||||||||
Interest expense: | ||||||||||||||||||||||||||||||||
Short-term borrowings (A) | 3,450 | 20,060 | — | 23,510 | ||||||||||||||||||||||||||||
Short-term borrowings | — | — | 31,411 | 31,411 | ||||||||||||||||||||||||||||
Asset-backed bonds | 5,226 | — | 2,269 | 7,495 | — | 2,980 | 2,980 | |||||||||||||||||||||||||
Cash flow hedging net settlements | — | 2,871 | 6,488 | 9,359 | ||||||||||||||||||||||||||||
Total interest expense | 8,676 | 22,931 | 8,757 | 40,364 | ||||||||||||||||||||||||||||
Total interest expense (B) | — | 2,980 | 31,411 | 34,391 | ||||||||||||||||||||||||||||
Mortgage portfolio net interest income before other expense | 90,128 | 37,947 | 1,981 | 130,056 | 133,633 | 3,693 | 52,160 | 189,486 | ||||||||||||||||||||||||
Other expense (B) | — | (11,507 | ) | (895 | ) | (12,402 | ) | |||||||||||||||||||||||||
Other income (expense) (C) | 368 | (1,253 | ) | (23,123 | ) | (24,008 | ) | |||||||||||||||||||||||||
Mortgage portfolio net interest income | $ | 90,128 | $ | 26,440 | $ | 1,086 | $ | 117,654 | $ | 134,001 | $ | 2,440 | $ | 29,037 | $ | 165,478 | ||||||||||||||||
Average balance of the underlying loans | $ | 4,316,599 | $ | 792,991 | $ | 116,048 | $ | 5,225,638 | $ | 8,431,708 | $ | 75,337 | $ | 1,198,534 | $ | 9,705,579 | ||||||||||||||||
Net interest yield on assets | 2.09 | % | 3.33 | % | 0.94 | % | 2.25 | % | 1.59 | % | 3.24 | % | 2.42 | % | 1.70 | % | ||||||||||||||||
December 31, 2002 | ||||||||||||||||||||||||||||||||
Interest income | $ | 56,481 | $ | 33,736 | $ | 16,926 | $ | 107,143 | ||||||||||||||||||||||||
Interest expense: | ||||||||||||||||||||||||||||||||
Short-term borrowings (A) | 2,107 | 10,406 | — | 12,513 | ||||||||||||||||||||||||||||
Asset-backed bonds | 727 | — | 4,195 | 4,922 | ||||||||||||||||||||||||||||
Cash flow hedging net settlements | — | 1,672 | 8,621 | 10,293 | ||||||||||||||||||||||||||||
Total interest expense | 2,834 | 12,078 | 12,816 | 27,728 | ||||||||||||||||||||||||||||
Mortgage portfolio net interest income before other expense | 53,647 | 21,658 | 4,110 | 79,415 | ||||||||||||||||||||||||||||
Other expense (B) | — | (11,782 | ) | (1,624 | ) | (13,406 | ) | |||||||||||||||||||||||||
Mortgage portfolio net interest income | $ | 53,647 | $ | 9,876 | $ | 2,486 | $ | 66,009 | ||||||||||||||||||||||||
Average balance of the underlying loans | $ | 2,080,955 | $ | 395,394 | $ | 172,954 | $ | 2,649,303 | ||||||||||||||||||||||||
Net interest yield on assets | 2.58 | % | 2.50 | % | 1.44 | % | 2.49 | % | ||||||||||||||||||||||||
| (A) |
| (B) | Does not include interest expense incurred to finance our mortgage securities trading and available-for sale, interest expense for our junior subordinated debentures and interest expense on our servicing advance facility. |
| (C) | Other expense includes |
Gains on Sales of Mortgage Assets.
Impact of Interest Rate Agreements.We have executed interest rate agreements designed to mitigate exposure to interest rate risk on short-term borrowings. Interest rate cap agreements require us to pay either a one-time “up front” premium or a monthly or quarterly premium, while allowing us to receive a rate that adjusts with LIBOR when rates rise above a certain agreed-upon rate. Interest rate swap agreements allow us to pay a fixed rate of interest while receiving a rate that adjusts with one-month LIBOR. These agreements are used to alter, in effect,The following table shows the interest rates on funding costs to more closely match the yield on interest-earning assets. We incurred expenses of $22.1 million, $18.7 millionchanges and $21.5 million related to the net settlementsmakeup of our interest rate agreementsgains on sales of mortgage assets for the three years ended December 31, 2004, 20032006, 2005 and 2002, respectively. Fluctuations2004.
Table 22 — Gains on Sales of Mortgage Assets
(dollars in these expenses are solely dependent upon the movement in LIBOR as well as our average notional amount outstanding.
Credit (Losses) Recoveries.We originate, purchase and own loans in which the borrower possesses credit risk higher than that of conforming borrowers. Delinquent loans and losses are expected to occur. We maintain an allowance for credit losses for our mortgage loans – held-in-portfolio. Provisions for credit losses are made in amounts considered necessary to maintain an allowance at a level sufficient to cover probable losses inherent in the loan portfolio. Charge-offs are recognized at the time of foreclosure by recording the value of real estate owned property at its estimated realizable value. One of the principal methods used to estimate expected losses is a delinquency migration analysis. This analysis takes into consideration historical information regarding foreclosure and loss severity experience and applies that information to the portfolio at the reporting date.thousands)
We use several techniques to mitigate credit losses including pre-funding audits by quality control personnel and in-depth appraisal reviews. Another loss mitigation technique allows a borrower to sell their property for less than the outstanding loan balance prior to foreclosure in transactions known as short sales, when it is believed that the resulting loss is less than what would be realized through foreclosure. Loans are charged-off in full when the cost of pursuing foreclosure and liquidation exceed recorded balances. While short sales have served to reduce the overall severity of losses incurred, they also accelerate the timing of losses. As discussed further under the caption “Premiums for Mortgage Loan Insurance”, lender paid mortgage insurance is also used as a means of managing credit risk exposure. Generally, the exposure to credit loss on insured loans is considered minimal.
| For the Year Ended December 31, | ||||||||||||
| 2006 | 2005 | 2004 | ||||||||||
Gains on sales of mortgage loans transferred in securitizations | $ | 50,215 | $ | 58,765 | $ | 144,252 | ||||||
Gains on sales of mortgage loans to third parties – nonconforming | 28,456 | 13,183 | — | |||||||||
Reserve for losses-loans sold to third parties | (28,617 | ) | (3,265 | ) | — | |||||||
Gains on sales of mortgage loans to third parties – conforming | — | 370 | 1,436 | |||||||||
Losses on sales of real estate owned | (7,166 | ) | (880 | ) | (738 | ) | ||||||
Gains on sales of trading securities | 351 | — | — | |||||||||
Elimination of gains from discontinued operations | (1,490 | ) | (3,025 | ) | — | |||||||
Gains on sales of mortgage assets | $ | 41,749 | $ | 65,148 | $ | 144,950 | ||||||
DuringGains on sales of mortgage assets were $41.7 million for the year ended December 31, 2004 we recognized net credit losses of $0.7 million2006 compared with net credit recoveries of $0.4to $65.1 million and $0.4$145.0 million for the years ended for December 31, 20032005 and 2002,2004, respectively. We incurred net charge-offsThe decrease in gains recognized between 2006 and 2005 is due primarily to an increase of $1.5$25.4 million $1.3 millionto the reserve for losses in 2006 related to loan repurchases on sales to third parties due to an increase in the number of repurchase requests we received from third parties. The decrease in gains recognized between 2005 and $2.1 million2004 is a result of a $0.7 billion decline in loans securitized as well as significant profit margin compression driven by a whole loan price decline period over period.
Activity in the reserve for the years ended December 31, 2004, 2003 and 2002, respectively. A rollforward of the allowance for credit lossesrepurchases is as follows for the three years ended December 31, 2004 is presented(dollars in Note 2thousands):
| 2006 | 2005 | 2004 | |||||||||
Balance, beginning of period | $ | 2,345 | $ | — | $ | — | |||||
Provision for repurchased loans | 28,617 | 3,265 | — | ||||||||
Charge-offs, net | (6,189 | ) | (920 | ) | — | ||||||
Balance, end of period | $ | 24,773 | $ | 2,345 | $ | — | |||||
The following table provides a summary of our mortgage loan securitizations treated as sales by year with the significant assumptions used at the time of securitization to value the consolidated financial statements.residual securities we retained.
Fee Income.Fee incomeTable 23 — Mortgage Loans Transferred in 2004 primarily consists of broker fees and service fee income. During 2003 and 2002, NHMI branch management fees were also a component of fee income. Due to the elimination of the LLC’s and their subsequent inclusionSecuritizations Structured as Sales
(dollars in the consolidated financial statements, branch management fees are eliminated in consolidation in 2004.thousands)
For the Year Ended December 31, | Principal Amount | Whole Loan Price Used in the Initial Valuation of Retained Interests | Net Gain Recognized | Initial Cost Basis of Retained Securities | Weighted Average Assumptions Underlying Initial Value of Mortgage Securities – Available-for-Sale | |||||||||||||||
| Constant Prepayment Rate | Discount Rate | Expected Total Credit Losses, Net | ||||||||||||||||||
2006 | $ | 6,075,405 | 101.86 | $ | 50,215 | $ | 244,978 | 43 | % | 15 | % | 3.20 | % | |||||||
2005 | $ | 7,621,030 | 102.00 | $ | 58,765 | $ | 332,420 | 40 | % | 15 | % | 2.47 | % | |||||||
2004 | $ | 8,329,804 | 103.28 | $ | 144,252 | $ | 381,833 | 33 | % | 22 | % | 4.77 | % | |||||||
Broker fees are paid by borrowers and other lenders for placing
The following table summarizes our sales of nonconforming loans with third-party investors (lenders) and are based on negotiated rates with each lender to whom we broker loans. Revenue is recognized upon loan origination.
Service fees are paid to us by either the investor on mortgage loans serviced or the borrower. Fees paid by investors on loans serviced are determined as a percentage of the principal collected for the loans serviced and are recognized in the period in which payments on the loans are received. Fees paid by borrowers on loans serviced are considered ancillary fees related to loan servicing and include late fees, processing fees and, for loans held-in-portfolio, prepayment penalties. Revenue is recognized on fees received from borrowers when an event occurs that generates the fee and they are considered to be collectible.
NHMI branch management fees, a source of fee income in 2003 and 2002, were charged to LLC’s formed to support NHMI branches to manage branch administrative operations, which included providing accounting, payroll, human resources, loan investor management and license management services. The amount of the fees was agreed upon when entering the LLC agreements and recognized as services were rendered. NHMI branch management fees were $13.0 million and $5.2 millionthird parties for the years ended December 31, 20032006 and 2002, respectively.
Overall, fee income increased from $68.3 million and $36.0 million2005. There were no sales of nonconforming loans to third parties for the years ended December 31, 2003 and 2002, respectively, to $102.8 million for the same period of 2004 due primarily to the termination of the LLC’s and the inclusion of those branches in our consolidated financial statements. This had a significant impact on fee income due to the volume of broker fee income that these branches generate. For comparative purposes, if the LLC’s had been operating units during 2003 and 2002 fee income would have been $91.8 million and $41.5 million for the years ended December 31, 2003 and 2002, respectively.
Additionally, fee income increased due to the increase in our servicing portfolio from $7.2 billion and $3.7 billion as of December 31, 2003 and 2002, respectively, to $12.2 billion as of December 31, 2004.
Gains on Sales of Mortgage Assets and Losses on Derivative Instruments. We execute securitization transactions in which we transfer mortgage loan collateral to an independent trust. The trust holds the mortgage loans as collateral for the securities it issues to finance the sale of the mortgage loans. In those transactions, certain securities are issued to entities unrelated to us, and we retain the interest-only, prepayment penalty and non-investment grade subordinated securities. In addition, we continue to service the loan collateral. These transactions were structured as sales for accounting and income tax reporting during the three yearsyear ended December 31, 2004. WholeThis table shows the impact of the provision for losses related to loan repurchases on our net gain (loss) recognized from loan sales havein 2006 and 2005. This table also been executed whereby weshows the impact of the lower whole loan sales prices on the gains recognized. We will continue to sell loans to third parties. Inparties which do not possess the outright sales of mortgage loans, we retain no assets or servicing rights. economic characteristics which meet our long-term portfolio management objectives.
Table 9 provides a summary of mortgage loans sold outright and transferred24 — Mortgage Loan Sales to Third Parties – Nonconforming
(dollars in securitizations.thousands)
For the Year Ended December 31, | Principal Amount | Net (Loss)Gain Recognized | Weighted Average Price to Par of the Loans Sold | |||||||
2006 | $ | 2,248,633 | $ | (161 | ) | 101.57 | % | |||
2005 | $ | 1,138,098 | $ | 9,918 | 102.01 | % | ||||
Gains (Losses) on Derivative Instruments.
We have entered into derivative instrument contracts that do not meet the requirements for hedge accounting treatment, but contribute to our overall risk management strategy by serving to reduce interest rate risk related to short-term borrowing rates. ChangesAdditionally, we transfer certain of these derivative instruments into our securitization trusts when they are structured as sales to provide interest rate protection to the third-party bondholders. Prior to the date when we transfer these derivatives, changes in the fair value of these derivative instruments and net settlements with counterparties are credited or charged to current earnings. We recognized lossesThe derivative instruments we use to mitigate interest rate risk will generally increase in value as short-term interest rates increase and decrease in value as rates decrease. Fair value, at the date of $8.9 million duringsecuritization, of the yearderivative instruments transferred into securitizations structured as sales is included as part of the cost basis of the mortgage loans securitized. Derivative instruments transferred into a securitization trust are administered by the trustee in accordance with the trust documents. Any cash flows from these derivatives projected to flow to our residual securities are included in the valuation. The gains (losses) on derivative instruments can be summarized for the years ended December 31, 2006, 2005 and 2004 compared with $30.8 million and $36.8 million for the same period of 2003 and 2002, respectively.
Table 8 provides the components of our gains on sales of mortgage assets and losses on derivative instruments.as follows:
Table 8 — 25—Gains on Sales of Mortgage Assets and Losses(Losses) on Derivative Instruments
(in thousands)
| For the Year Ended December 31, | ||||||||||||
| 2004 | 2003 | 2002 | ||||||||||
Gains on sales of mortgage loans transferred in securitizations | $ | 144,252 | $ | 136,302 | $ | 47,894 | ||||||
Gains on sales of mortgage loans to third parties – nonconforming | — | 3,404 | 2,299 | |||||||||
Gains on sales of mortgage loans to third parties – conforming | 1,435 | 6,942 | 3,903 | |||||||||
Losses on sales of real estate owned | (737 | ) | (2,643 | ) | (791 | ) | ||||||
Gains on sales of mortgage assets | 144,950 | 144,005 | 53,305 | |||||||||
Losses on derivatives | (8,905 | ) | (30,837 | ) | (36,841 | ) | ||||||
Net gains on sales of mortgage assets and derivative instruments | $ | 136,045 | $ | 113,168 | $ | 16,464 | ||||||
Table 9 — Mortgage Loan Sales and Securitizations
(dollars in thousands)
| Outright Mortgage Loan Sales (A) | |||||||||||
For the Year Ended December 31, | Principal Amount | Percent of Total Sales | Net Gain (Loss) Recognized | Weighted Average Price To Par | |||||||
2004 | There were no outright mortgage loan sales in 2004. | ||||||||||
2003 | $ | 151,210 | 2.8 | % | $ | 3,404 | 104.1 | ||||
2002 | $ | 142,159 | 8.4 | % | $ | 2,299 | 102.9 | ||||
Mortgage Loans Transferred in Securitizations | |||||||||||||||||||||
Principal Amount | Percent of Total Sales | Net Gain Recognized | Initial Cost Basis of Mortgage Securities | Weighted Average Assumptions Underlying Initial Value of Mortgage Securities – Available-for-Sale | |||||||||||||||||
For the Year Ended December 31, | Constant Prepayment Rate | Discount Rate | Expected Total Credit Losses, Net of Mortgage Insurance | ||||||||||||||||||
2004 | $ | 8,329,804 | 100.0 | % | $ | 144,252 | $ | 381,833 | 33 | % | 22 | % | 4.77 | % | |||||||
2003 | $ | 5,319,435 | 97.2 | % | $ | 136,302 | $ | 292,675 | 26 | % | 22 | % | 3.55 | % | |||||||
2002 | $ | 1,560,001 | 91.6 | % | $ | 47,894 | $ | 90,785 | 29 | % | 21 | % | 1.50 | % | |||||||
| For the Year Ended December 31, | ||||||||||||
| 2006 | 2005 | 2004 | ||||||||||
Increase in fair value | $ | 3,854 | $ | 15,224 | $ | 10,586 | ||||||
Net settlement income (expense) | 9,837 | 4,657 | (19,065 | ) | ||||||||
Losses on commitments to originate mortgage loans | (1,693 | ) | (1,726 | ) | (426 | ) | ||||||
Gains (losses) on derivative instruments | $ | 11,998 | $ | 18,155 | $ | (8,905 | ) | |||||
Impairment on Mortgage Securities – Available-for-Sale.
To the extent that the cost basis of mortgage securities – available-for-sale exceeds the fair value and the unrealized loss is considered to be other than temporary, an impairment charge is recognized and the amount recorded in accumulated other comprehensive income or loss is reclassified to earnings as a realized loss. For the years ended December 31, 2006, 2005 and 2004, we recorded an impairment loss on our mortgage securities available-for-sale of $30.7 million, $17.6 million and $15.9 million, respectively. The increase in impairments in 2006 was primarily driven by an increase in projected losses due to the credit quality of the loans declining in 2006 from 2005. The following table summarizes the impairment on our mortgage securities – available-for-sale by mortgage security for the years ended December 31, 2006, 2005 and 2004.
Table 26 — Impairment on Mortgage Securities – Available-for-Sale by Mortgage Security
(dollars in thousands)
| For the Year Ended December 31, | |||||||||
| 2006 | 2005 | 2004 | |||||||
Mortgage Securities – Available-for-Sale: | |||||||||
NMFT Series 1999-1 | $ | — | $ | 117 | $ | 87 | |||
NMFT Series 2004-1 | 15 | — | — | ||||||
NMFT Series 2004-4 | — | — | 6,484 | ||||||
NMFT Series 2004-2 | — | — | 7,384 | ||||||
NMFT Series 2004-3 | — | — | 1,947 | ||||||
NMFT Series 2004-4 | — | 1,496 | — | ||||||
NMFT Series 2005-1 | — | 1,426 | — | ||||||
NMFT Series 2005-2 | — | 7,027 | — | ||||||
NMFT Series 2005-3 | 531 | 7,553 | — | ||||||
NMFT Series 2005-4 | 7,739 | — | — | ||||||
NMFT Series 2006-2 | 7,879 | — | — | ||||||
NMFT Series 2006-3 | 8,620 | — | — | ||||||
NMFT Series 2006-4 | 5,906 | — | — | ||||||
Impairment on mortgage securities – available-for-sale | $ | 30,690 | $ | 17,619 | $ | 15,902 | |||
Fee Income.
Our fee income declined slightly to $29.0 million for the year ended December 31, 2006 from $30.7 million for 2005 and 2004. Fee income primarily consists of service fee income. Service fees are paid to us by either the investor or the borrower on mortgage loans serviced. Fees paid by investors on loans serviced are determined as a percentage of the principal collected for the loans serviced and are recognized in the period in which payments on the loans are received. These fees are approximately 0.50% of the outstanding balance of the loans being serviced. Fees paid by borrowers on loans serviced are considered ancillary fees related to loan servicing and include late fees and processing fees. Revenue is recognized on fees received from borrowers when an event occurs that generates the fee and they are considered to be collectible. Servicing fees received from the securitization trusts were $59.2 million, $59.8 million and $41.5 million for the years ended December 31, 2006, 2005 and 2004, respectively.
The amortization of mortgage servicing rights is also included in fee income. Mortgage servicing rights are amortized in proportion to and over the estimated period of net servicing income. Generally, as the size of our servicing portfolio increases the amortization expense will increase. In addition the amortization of mortgage servicing rights is impacted by our assumptions regarding prepayment speeds for the loans being serviced for investors. During periods of increasing loan prepayments, the amortization on our mortgage servicing rights generally will increase. See Table 12 for a summary of our expected prepayment rate assumptions by securitization trust. Amortization of mortgage servicing rights increased to $33.6 million for 2006 as compared with $28.4 million for 2005 and $16.9 million for 2004. This increase is amortization from 2005 to 2006 is a result of a larger balance of mortgage servicing rights period over period.
Origination fees are received from borrowers at the time of loan closing and deferred until the related loans are sold or securitized in transactions structured as sales. For securitizations structured as financings this fee income is deferred and amortized into interest income over the life of the loans using a level yield method.
Premiums for Mortgage Loan InsuranceInsurance..
The use of mortgage insurance is one method of managing the credit risk in the mortgage asset portfolio. Premiums for mortgage insurance on loans maintained on our balance sheet are paid by us and are recorded as a portfolio cost and are included in the income statement under the caption “Premiums for Mortgage Loan Insurance”. These premiums totaled $12.4 million, $5.7 million and $4.2 million $3.1 millionin 2006, 2005 and $2.3 million2004, respectively. The increase in premiums on mortgage loan insurance for 2006 as compared to 2005 and 2004 2003 and 2002, respectively. We received mortgage insurance proceeds on claims filedis due to the increase in loans-held-in-portfolio as a result of $2.2 million, $1.9 million and $2.1 million in 2004, 2003 and 2002, respectively.structuring two loan securitizations as financings during the second quarter of 2006.
Some of the mortgage loans that serve as collateral for our mortgage securities -– available-for-sale carry mortgage insurance. When loans are securitized in transactions treated as sales, the obligation to pay mortgage insurance premiums is legally assumed by the trust. Therefore, we have no obligation to pay for mortgage insurance premiums on these loans.
We intend to continue to use mortgage insurance coverage as a credit management tool as we continue to originate, purchase and securitize mortgage loans. Mortgage insurance claims on loans where a defect occurred in the loan origination process will not be paid by the mortgage insurer. The assumptions we use to value our mortgage securities -– available-for-sale consider this risk. The percentage of loans with mortgage insurance has decreased in 2004 and 2003 and generally should be lower than 50% in the future. For the 2004-1, 2004-2, 2004-3NMFT Series 2006-2, 2006-3, 2006-4, 2006-5 and 2004-42006-6 securitizations, the mortgage loans that were transferred into the truststrust had mortgage insurance coverage at the time of transfer of 26%56%, 38%54%, 35%64%, 56% and 51%,60% of total principal, respectively. As of December 31, 2004, 45%2006, 56% of the total principal of our securitized loans, excluding NHES 2006-MTA1, had mortgage insurance coverage.coverage compared to 54% as of December 31, 2005. We have excluded our NHES 2006-MTA deal from our analysis of securitized loans with mortgage insurance due to low percentage of mortgage insurance purchased on those loans due to their higher credit quality. As of December 31, 2006 only 6% of the total principal of the loans collateralizing our NHES 2006-MTA1 deal had mortgage insurance.
We have the risk that mortgage insurance providers will revise their guidelines to an extent where we will no longer be able to acquire coverage on all of our new loan production. Similarly, the providers may also increase insurance premiums to a point where the cost of coverage outweighs its benefit. We monitor the mortgage insurance market and currently anticipate being able to obtain affordable coverage to the extent we deem it is warranted.
Other Income, net.Other income, net increased from $0.4 million and $1.4 million for the years ended December 31, 2003 and 2002, respectively, to $6.6 million for the same period of 2004. Included in other income, net is primarily interest income on our cash accounts and deposits with derivative instrument counterparties (swap margin). The increase from prior years to 2004 is primarily attributable to the increase in our cash on hand and the increase in the interest rates we are earning on this cash.
General and Administrative Expenses.
The main categories of our general and administrative expenses areare; compensation and benefits, office administration, professional and outside services, loan expense, marketing office administrationexpense and professional and outside services.other expense. Compensation and benefits includes employee base salaries, benefit costs and incentive compensation awards. For discussion on stock-based compensation expense included in compensation and benefits, see discussion of the adoption of SFAS No. 123 under “Critical Accounting Estimates” and “Results of Operations.” Loan expense primarily includes expenses relating to the underwriting of mortgage loans that do not fund successfully and servicing costs. Marketing primarily includes costs of purchased loan leads, advertising and business promotion. Office administration includes items such as rent, depreciation, telephone, office supplies, postage, delivery, maintenance and repairs. Professional and outside services include fees for legal, accounting and other consulting services. Loan expense primarily consists of expenses relating to the underwriting of mortgage loans that do not fund successfully and servicing costs. Marketing expenses primarily consists of costs for purchased loan leads, advertising and business promotion. Other expense primarily includes miscellaneous banking fees and travel and entertainment expenses. General and administrative expenses increased from $184.6 million and $168.3 million for the years ended December 31, 2005 and 2004, respectively, to $201.3 million for the same period of 2006. The increase is primarily related to increased commissions expenses due to a 21% increase in loan originations in 2006 compared with 2005. Also contributing to the increase are higher legal costs in 2006 as a result of litigation.
Other Operational Data
Loan Fundings.
The increasefollowing table summarizes our loan production for the year ended December 31, 2006 and 2005. We have separated MTA (option ARM) bulk loan purchased in generalthe first quarter of 2006 from our normal originations and administrative expenses from $174.4 million and $84.6 million in 2003 and 2002, respectively, to $271.1 million in 2004 is primarily attributablepurchases because of the unique nature of these purchases. These purchases were executed solely for the purpose of adding qualified assets to the termination of the LLC’s and the inclusion of those branches in our consolidated financial statements. Our new retail lines of business, growth in our wholesale business and our expanding servicing operations also contributed to the increase in general and administrative expenses. Nonrecurring costs related to the implementation of requirements under the Sarbanes-Oxley Act also contributed to the increase in general and administrative expenses in 2004. We employed 1,738 people as of December 31, 2004 compared with 1,409 and 913 as of December 31, 2003 and 2002, respectively, in our mortgage portfolio management and mortgage lending and loan servicing operations.
Note 15 to the consolidated financial statements presents an income statement for our three segments, detailing our expenses by segment. For comparative purposes, Table 10 presents the general and administrative expenses assuming the LLC’s had been included in our consolidated financial statements during 2003 and 2002.REIT.
Table 1027 — GeneralNonconforming Loan Originations and Administrative ExpensesPurchases
(dollars in thousands, except for average loan balance)
Number | Principal | Average | Price Paid | Weighted Average | Percent with | |||||||||||||||||
| Loan to Value | FICO Score | Coupon | ||||||||||||||||||||
2006: | 60,332 | $ | 10,232,681 | $ | 169,606 | 100.8 | % | 83 | % | 625 | 8.71 | % | 61 | % | ||||||||
MTA Bulk Purchases | 2,415 | 991,407 | 410,520 | 103.4 | 74 | 713 | 6.89 | 68 | ||||||||||||||
2006 Total: | 62,747 | $ | 11,224,088 | $ | 178,878 | 101.1 | % | 82 | % | 633 | 8.55 | % | 62 | % | ||||||||
2005: | 58,542 | $ | 9,283,138 | $ | 158,572 | 101.1 | % | 82 | % | 632 | 7.66 | % | 65 | % | ||||||||
We originated and purchased $11.2 billion in nonconforming loans for the year ended December 31, 2006 compared to $9.3 billion in 2005. The weighted average coupon on the loans originated in 2006 was 89 basis points higher than the weighted average coupon on the loans originated in 2005. We continue to pursue opportunities to increase our market share while ensuring that the loans we originate generate good risk-adjusted returns. As discussed in Industry Overview and Known Material Trends and Uncertainties we have taken several steps to position ourselves for a deteriorating credit environment which may impact our origination volumes going forward.
The adjustable-rate loan product we commonly refer to as our MTA product increased from approximately 1% of total loan originations during the year ended December 31, 2005 to approximately 12% during the year ended December 31, 2006. Included in the 2006 originations are bulk purchases of $991.4 million in loans of this same product type which we executed with the intention to securitize these loans. This product is also commonly referred to as an “option ARM”, “negative amortization ARM”, “pay-option” or “MTA” loan within the mortgage industry. We refer to this product as MTA, which stands for monthly treasury average. The monthly treasury average is the interest rate index for a majority of the loans of this product type which we have originated or purchased.
The interest rates for MTA loans are generally fixed for one, two or three months following their origination and then adjust monthly. These loans allow the borrower to defer making the full interest payment for at least the first year of the loan. After this “option” period, minimum monthly payments increase by no more than 7.50% per year unless the unpaid balance increases to a specified limit, which is no more than 125% of the original loan amount, at which time a new monthly payment amount adequate to repay the loan over its remaining contractual life is established. To ensure that contractual loan payments are adequate to repay a loan, the fully amortizing loan payment amount is re-established every five years.
Due to the MTA loans’ amortization characteristics, the loss that we would realize in the event of default may be higher than that realized on a “traditional” loan that results in the payment of principal. Our MTA loans contain features that address the risk of borrower default and the increased risk of loss in the event of default. Specifically, our underwriting standards conform to those required to make the MTA loans salable into the secondary market at the date of funding, including a requirement that the borrower meet secondary market debt-service ratio tests designed to ensure that they can make the fully amortizing loan payment assuming the loan’s interest rate is fully indexed. (A fully indexed loan rate equals the sum of the current index rate plus the margin applicable to the loan.) The loan’s terms limit the amount of potential increase of loss in the event of default by restricting the amount of interest that may be added to the loan’s balance as described in the preceding paragraph.
Our MTA loan portfolio has a relatively high initial loan quality, with a weighted average original FICO score (a measure of credit rating) of 708 and weighted average original loan-to-value (“LTV”) of 80.4% at December 31, 2006. We only originate MTA loans to borrowers who can qualify at the loan’s fully indexed interest rates. This high credit quality notwithstanding, lower initial payment requirements of MTA loans may increase the credit risk inherent in our portfolio of loans held-in-portfolio and our portfolio of loans held-for-sale. This is because when the required monthly payments for pay-option loans eventually increase (in a period not to exceed 60 months), borrowers may be less able to pay the increased amounts and, therefore, more likely to default on the loan, than a borrower with an amortizing loan. Our exposure to this higher credit risk is increased by any negative amortization that has been added to the principal balance.
The following is a summary of the our MTA loan originations and purchases for year ended December 31, 2006 and 2005 as well as information on the negative amortization on these loans during the time periods presented:
Table 28 — Summary of MTA Loan Activity
(dollars in thousands)
| For the Year Ended December 31, | |||||||||
| 2004 | 2003 Pro Forma | 2002 Pro Forma | |||||||
Compensation and benefits | $ | 138,516 | $ | 107,708 | $ | 54,509 | |||
Office administration | 38,625 | 28,278 | 12,196 | ||||||
Marketing | 37,812 | 43,911 | 16,477 | ||||||
Professional and outside services | 19,887 | 7,462 | 3,254 | ||||||
Loan expense | 18,753 | 19,707 | 6,262 | ||||||
Other | 17,532 | 11,260 | 4,092 | ||||||
Total general and administrative expenses | $ | 271,125 | $ | 218,326 | $ | 96,790 | |||
Employees Other | 3,502 | 2,661 | 1,457 | ||||||
| 2006 | 2005 | |||||||
MTA loans originated during the period | $ | 355,941 | $ | 91,232 | ||||
MTA bulk purchases during the period | 991,407 | — | ||||||
Total MTA originations or purchases | $ | 1,347,348 | $ | 91,232 | ||||
MTA loan portfolio at period end | $ | 1,219,447 | $ | 76,148 | ||||
Accumulated negative amortization during the period | $ | 29,541 | $ | 251 | ||||
Number of loans with negative amortization during the period | 3,295 | 172 | ||||||
Original Weighted Average LTV at period end | 80.4 | % | 77.1 | % | ||||
Original Weighted Average FICO score at period end | 708 | 707 | ||||||
Cost of Production.
The loan costscost of production table below includes all costs paid and fees collected during the wholesale loan origination cycle, including loans that do not fund. This distinction is important as we can only capitalize as deferred broker premium and costs, those costs (net of fees) directly associated with a “funded” loan. Costs associated with loans that do not fund are recognized immediately as a component of general and administrative expenses. For loans held-for-sale, deferred net costs are recognized when the related loans are sold outright or transferred in securitizations. For loans held-in-portfolio, deferred net costs are recognized over the life of the loan as a reduction to interest income. The cost of our production is also critical to our financial results as it is a significant factor in the gains we recognize. Increased efficiencies in the nonconforming lending operation correlate to lower general and administrative costs and higher gains on sales of mortgage assets.
Table 11 — Wholesale Loan Costs29 —Cost of Production, as a Percent of Principal
Overhead Costs | Premium Paid to Broker, Net of Fees Collected | Total Acquisition Cost | ||||
2004 | 1.79 | 0.74 | 2.53 | |||
2003 | 1.69 | 0.71 | 2.40 | |||
2002 | 1.93 | 0.78 | 2.71 |
For the Year Ended December 31, | Overhead Costs | Premium Paid to Broker, Net of Fees | Total Cost | ||||||
2006 | 1.49 | % | 0.54 | % | 2.03 | % | |||
2005 | 1.82 | % | 0.55 | % | 2.37 | % | |||
2004 | 1.94 | % | 0.83 | % | 2.77 | % |
We were able to reduce our overhead costs in both 2006 and 2005 from prior comparative years as a result of significant cost reduction and process improvement initiatives. During 2006, we were able to only slightly reduce the premium paid to broker, net of fees collected after significantly reducing this cost in 2005 from 2004. Our premiums paid to brokers are driven largely by market competition.
The following table is a reconciliation of our lending division’s overhead costs included in our cost of production to the general and administrative expenses of the mortgage lending and loan servicing segment as shown in Note 1516 to the consolidated financial statements, presented in accordance with GAAP. The reconciliation does not address premiums paid to brokers since they are deferred at origination under GAAP and recognized when the related loans are sold or securitized. TheWe believe this presentation of overheadour cost of production provides useful information to investors regarding our financial performance because it more accurately reflects the direct costs of loan production and allows us to monitor the performance of our core operations, which is more difficult to do when looking at GAAP financial statements. Thisstatements, and provides useful information regarding our financial performance. Management uses this measure for the same purpose. However, this presentation is not intended to be used as a substitute for financial results prepared in accordance with GAAP.
Table 1230 – Reconciliation of Overhead Costs, Non-GAAP Financial Measure
(dollars in thousands, except lending overhead as a percentage)
| 2004 | 2003 | 2002 | ||||||||||
Mortgage lending and loan servicing general and administrative expenses (A) | $ | 149,908 | $ | 133,196 | $ | 59,306 | ||||||
Direct origination costs classified as a reduction in gain-on-sale | 44,641 | 26,351 | 13,334 | |||||||||
Costs of servicing | (22,845 | ) | (14,261 | ) | (7,703 | ) | ||||||
Other lending expenses (B) | (42,930 | ) | (65,402 | ) | (17,995 | ) | ||||||
Overhead costs | $ | 128,774 | $ | 79,884 | $ | 46,942 | ||||||
Wholesale production, principal | $ | 7,185,773 | $ | 4,735,061 | $ | 2,427,048 | ||||||
Overhead, as a percentage | 1.79 | % | 1.69 | % | 1.93 | % | ||||||
| For the Year Ended December 31, | ||||||||||||
| 2006 | 2005 | 2004 | ||||||||||
Mortgage lending general and administrative expenses (A) | $ | 150,281 | $ | 135,665 | $ | 136,089 | ||||||
Direct origination costs classified as a reduction in gain-on-sale | 29,923 | 54,020 | 52,179 | |||||||||
Other non-lending overhead expenses | (12,535 | ) | (21,075 | ) | (24,733 | ) | ||||||
Lending overhead costs | 167,669 | 168,610 | 163,535 | |||||||||
Premium paid to broker, net of fees collected | 59,771 | 51,830 | 69,619 | |||||||||
Total cost of loan production | $ | 227,440 | $ | 220,440 | $ | 233,154 | ||||||
Loan production, principal (B) | $ | 11,224,088 | $ | 9,283,138 | $ | 8,424,361 | ||||||
Total cost of production, as a percentage of loan production | 2.03 | % | 2.37 | % | 2.77 | % | ||||||
| (A) | Mortgage lending |
| (B) |
Mortgage Loan Servicing.
Servicing income, before amortization of mortgage servicing rights includes fee income and interest income, which is earned on custodial bank accounts. The costs of servicing include the general and administrative expenses incurred by our servicing operation as well as allocated corporate expenses.
Our annualized servicing income per loan before tax per unit increased to $177 for the year ended December 31, 2006 from $57 for the year ended December 31, 2005 and $2 for the year ended December 31, 2004. These increases are due largely to higher interest income earned on funds held as custodian which is a result of higher average balances in the accounts. In addition we are earning higher rates of interest on these funds due to the increase in short-term interest rates during the periods presented.
Table 31 — Summary of Servicing Operations
(dollars in thousands, except per loan cost)
| 2006 | 2005 | 2004 | ||||||||||||||||||||||
| Amount | Per Loan (B) | Amount | Per Loan (B) | Amount | Per Loan (B) | |||||||||||||||||||
Unpaid principal at period end (A) | $ | 16,659,784 | $ | 14,030,697 | $ | 12,151,196 | ||||||||||||||||||
Number of loans at period end (A) | 107,237 | 98,287 | 87,543 | |||||||||||||||||||||
Average unpaid principal during the period (A) | $ | 15,753,024 | $ | 13,547,325 | $ | 9,881,848 | ||||||||||||||||||
Average number of loans during the period (A) | 104,044 | 96,726 | 72,415 | |||||||||||||||||||||
Servicing income, before amortization of mortgage servicing rights | $ | 86,939 | $ | 836 | $ | 68,370 | $ | 707 | $ | 41,793 | $ | 577 | ||||||||||||
Costs of servicing | (34,968 | ) | (336 | ) | (34,515 | ) | (357 | ) | (24,698 | ) | (341 | ) | ||||||||||||
Net servicing income, before amortization of mortgage servicing rights | 51,971 | 500 | 33,855 | 350 | 17,095 | 236 | ||||||||||||||||||
Amortization of mortgage servicing rights | (33,639 | ) | (323 | ) | (28,364 | ) | (293 | ) | (16,934 | ) | (234 | ) | ||||||||||||
| $ | 18,332 | $ | 177 | $ | 5,491 | $ | 57 | $ | 161 | $ | 2 | |||||||||||||
| (A) | Includes loans we have sold and are still servicing on an interim basis. |
| (B) | Per unit amounts are calculated using the average number of loans during the period presented. |
Income Taxes.Since
Since our inception, NFI has elected to be treated as a REIT for federal income tax purposes. AsSo long as NFI maintains its status as a REIT, NFI is not required to pay any corporate level income taxes as long as we distribute 100 percent of our taxable income in the form of dividend distributions to our shareholders. To maintain our REIT status, NFI must meet certain requirements prescribed by the Code. We intendare, however, currently evaluating whether it is in shareholders’ best interests to operate NFI in a manner that allows us to meet these requirements.retain our REIT status.
Below is a summary of the taxable net income available to common shareholders for the years ended December 31, 2004, 20032006, 2005 and 2002.2004.
Table 1332 — Taxable Net Income
(dollars in thousands)thousands except per share)
| For the Year Ended December 31, | For the Year Ended December 31, | |||||||||||||||||||||||
2004 Estimated | 2003 Actual | 2002 Actual | 2006 Estimated | 2005 Actual | 2004 Actual | |||||||||||||||||||
Consolidated net income | $ | 115,389 | $ | 111,996 | $ | 48,761 | $ | 72,938 | $ | 139,124 | $ | 115,389 | ||||||||||||
Equity in net income of NFI Holding Corp. | (2,517 | ) | (27,737 | ) | 9,013 | |||||||||||||||||||
Equity in net loss (income) of NFI Holding Corporation | 5,512 | 24,678 | (2,517 | ) | ||||||||||||||||||||
Consolidation eliminations between the REIT and TRS | 2,800 | 7,686 | — | 10,955 | 2,073 | 2,800 | ||||||||||||||||||
REIT net income | 115,672 | 91,945 | 57,774 | 89,405 | 165,875 | 115,672 | ||||||||||||||||||
Adjustments to net income to compute taxable income | 141,094 | 45,906 | (8,263 | ) | 97,875 | 111,210 | 141,148 | |||||||||||||||||
Taxable income before preferred dividends | 256,766 | 137,851 | 49,511 | 187,280 | 277,085 | 256,820 | ||||||||||||||||||
Preferred dividends | (6,265 | ) | — | — | (6,653 | ) | (6,653 | ) | (6,265 | ) | ||||||||||||||
Taxable income available to common shareholders | $ | 250,501 | $ | 137,851 | $ | 49,511 | ||||||||||||||||||
Taxable net income available to common shareholders | $ | 180,627 | $ | 270,432 | $ | 250,555 | ||||||||||||||||||
Taxable income per common share (A) | $ | 9.04 | $ | 5.64 | $ | 2.36 | ||||||||||||||||||
Taxable net income per common share (A) | $ | 4.85 | $ | 8.40 | $ | 9.04 | ||||||||||||||||||
| (A) | The common shares outstanding as of the end of each period presented |
The primary differencedifferences between consolidatedREIT net income and taxable income isare due to differences in the recognition of income on our portfolio of interest-only mortgage securities – available-for-sale.available-for-sale, the deductibility of impairment losses on our mortgage securities, and the timing of deductibility of loan losses. Generally, the accrual of interest on interest-only securities is accelerated for income tax purposes. This is the result of the current original issue discount rules as promulgated by Internal Revenueunder Code Sections 1271 through 1275. On September 30, 2004, the IRS released Announcement 2004-75. This Announcement describes rules that may be included in proposed regulations regarding the timing of income and/or deductions attributable to interest-only securities. NoAs of December 31, 2006, no proposed regulations that would impact income for 2004 have been issued. BasedGenerally, impairment losses on securities are not deductible for income tax purposes until the Announcement,losses become realized. The timing of deductibility for loan losses for income tax purposes is usually delayed compared to GAAP, because bad debts are not deductible for tax purposes until they become worthless.
The decline in estimated REIT taxable income for the year ended December 31, 2006 when compared to the same period in 2005 was primarily the result of a few significant items. The REIT’s GAAP net income decreased by $76.5 million from the year ended December 31, 2005 to the year ended December 31, 2006. Next, we believestructured two securitizations (NHES Series 2006-1 and NHES 2006-MTA1) as financing for both GAAP and tax purposes. Typically these securitizations would have been structured as sales and we would have retained certain of the residual securities from the transaction. These residual securities would normally generate taxable income in the form of original issue discount that if the IRS does propose and adopt new regulations on this issue, the change will have the effectis in excess of narrowing the spread between book income andduring the early life of the security. However, because the transactions were structured as financings, the acceleration of original issue discount did not occur on these transactions. Finally, interest rate derivative instruments held by the REIT increased taxable income on interest-only mortgageduring the year ended December 31, 2006 compared to the same period in 2005 due to the increase in LIBOR during 2006.
In order to satisfy ongoing REIT income tests we transferred certain securities and thus, will have a similar impactthat had historically been held by the REIT to NFI in years following the effective dateTRS. These securities receive income from derivative instruments that is not qualified REIT income. This transfer caused the derivative income to be recognized by the TRS instead of the rules.REIT.
To maintain itsour qualification as a REIT, NFI is required to declare dividend distributions of at least 90 percent of our taxable income by the filing date of our federal tax return, including extensions. Any taxable income that has not been declared to be distributed by this date is subject to corporate income taxes. At this time, NFI intends to declare dividends equal to 100 percenthas distributed all of ourits 2005 taxable income for 2004 by the required distribution date. Accordingly, we have not accrued any corporate income tax for NFI for the year ended December 31, 2004.2006.
As a REIT, NFI may be subject to a federal excise tax. An excise tax is incurred if NFI distributes less than 85 percent of its taxable income by the end of the calendar year. As part of the amount distributed by the end of the calendar year, NFI may include dividends that were declared in October, November or December and paid on or before January 31 of the following year. To the extent that 85 percent of our taxable income exceeds our dividend distributions in any given year, an excise tax of 4 percent is due and payable on the shortfall. For the year ended December 31, 2004,2006 and 2005 we have provided foraccrued excise tax expense of $2.1 million.$4.6 million and $7.3 million, respectively. Excise taxes aretax is reflected as ain the other component of general and administrative expenses on our Consolidated Statementsconsolidated statements of Income.income. As of December 31, 20042006 and 2003,2005, accrued excise tax payable was $1.8$4.7 million and $0.2$6.5 million, respectively. The excise tax payable is reflected as a component of accounts payable and other liabilities on our Consolidated Balance Sheets.consolidated balance sheets.
NFI Holding Corporation, a wholly-owned subsidiary of NFI, and its subsidiaries (collectively known as “the TRS”) are treated as “taxable REIT subsidiaries.” The TRS is subject to corporate income taxes and files a consolidated federal income tax return. The TRS reported net income (loss) from continuing operations before income taxes of $12.0$(3.0) million for the year ended December 31, 20042006 compared with $50.6$(19.6) million and $(11.0)$42.8 million for the same periodperiods of 20032005 and 2002. As shown in our statement of income, this2004, respectively. This resulted in an income tax (benefit) expense (benefit) of $5.4 million, $22.9 million and $(2.0)$(1.8) million for the yearsyear ended December 31, 2006 compared with $(6.6) million and $16.8 million for the same periods in 2005 and 2004, 2003 and 2002 respectively. The $(1.8) million tax benefit on $(3.0) million of loss from continuing operations in the year ended December 31, 2006 is exclusive of the deferral of $7.0 million tax expense related to the $18.5 million intercompany gain, which is eliminated in our consolidated statements of income. Additionally, the TRS reported a net loss(loss) income from discontinued operations before income taxes of $6.7$(6.8) million for the year ended December 31, 2006 compared with $(18.6) million and $(37.5) million for the same periods of 2005 and 2004, resultingrespectively. This resulted in an income tax benefit of $2.6 million.$(2.5) million for the year ended December 31, 2006 compared with $(6.9) million and $(14.0) million for the same periods of 2005 and 2004, respectively.
During the past five years, we believe that a minority of our shareholders have been non-United States holders. Accordingly, we anticipate that NFI will qualify as a “domestically-controlled REIT” for United States federal income tax purposes. Investors who are non-United States holders should contact their tax advisor regarding the United States federal income tax consequences of dispositions of shares of a “domestically-controlled REIT.”
Pro Forma 2003 and 2002 Statements of Income.Prior to 2004, we were party to limited liability company (“LLC”) agreements governing LLC’s formed to facilitate the operation of retail mortgage broker businesses as branches of NHMI. The LLC agreements were terminated effective January 1, 2004. Continuing branches that formerly operated under these agreements became our operating units and their financial results are included in the consolidated financial statements. The inclusion resulted in expected increases in general and administrative expenses, which were substantially offset by increases in related fee income. We did not purchase any assets or liabilities as a result of these branches becoming operating units.
The following table compares the year ended December 31, 2003 and 2002 as reported Pro Forma as if the LLC’s had been our operating units. The Pro Forma only includes LLC’s that are still in existence as of December 31, 2004.
Table 14 – Pro Forma 2003 and 2002
(dollars in thousands, except per share amounts)
For the Year Ended December 31, 2003 | For the Year Ended December 31, 2002 | |||||||||||||||
| Actual | Pro Forma | Actual | Pro Forma | |||||||||||||
Net interest income | $ | 130,445 | $ | 130,445 | $ | 79,847 | $ | 79,847 | ||||||||
Gains on sales of mortgage assets | 144,005 | 165,879 | 53,305 | 59,506 | ||||||||||||
Fee income | 68,341 | 91,784 | 35,983 | 41,542 | ||||||||||||
Other expense, net | (33,527 | ) | (33,527 | ) | (37,811 | ) | (37,811 | ) | ||||||||
General and administrative expenses | (174,408 | ) | (218,326 | ) | (84,594 | ) | (96,790 | ) | ||||||||
Income before income tax expense (benefit) | 134,856 | 136,255 | 46,730 | 46,294 | ||||||||||||
Income tax expense (benefit) | 22,860 | 23,207 | (2,031 | ) | (1,913 | ) | ||||||||||
Income from continuing operations | 111,996 | 113,048 | 48,761 | 48,207 | ||||||||||||
Loss from discontinued operations, net of income tax | — | (2,505 | ) | — | (605 | ) | ||||||||||
Net income | $ | 111,996 | $ | 110,543 | $ | 48,761 | $ | 47,602 | ||||||||
Basic earnings per share: | ||||||||||||||||
Income from continuing operations | $ | 5.04 | $ | 5.09 | $ | 2.35 | $ | 2.32 | ||||||||
Loss from discontinued operations, net of income tax | — | (0.11 | ) | — | (0.03 | ) | ||||||||||
Net income available to common shareholders | $ | 5.04 | $ | 4.98 | $ | 2.35 | $ | 2.29 | ||||||||
Diluted earnings per share: | ||||||||||||||||
Income from continuing operations | $ | 4.91 | $ | 4.96 | $ | 2.25 | $ | 2.23 | ||||||||
Loss from discontinued operations, net of income tax | — | (0.11 | ) | — | (0.03 | ) | ||||||||||
Net income available to common shareholders | $ | 4.91 | $ | 4.85 | $ | 2.25 | $ | 2.20 | ||||||||
Mortgage Loan Servicing.Loan servicing is a critical part of our business. In the opinion of management, maintaining contact with borrowers is vital in managing credit risk and in borrower retention. Nonconforming borrowers are prone to late payments and are more likely to default on their obligations than conventional borrowers. We strive to identify issues and trends with borrowers early and take quick action to address such matters. Our annualized costs of servicing per unit decreased from $263 and $267 at December 31, 2003 and 2002, respectively, to $261 at December 31, 2004.
Table 15 — Summary of Servicing Operations
(dollars in thousands, except per loan cost)
| 2004 | 2003 | 2002 | ||||||||||||||||||||||
| Amount | Per Unit | Amount | Per Unit | Amount | Per Unit | |||||||||||||||||||
Unpaid principal | $ | 12,151,196 | $ | 7,206,113 | $ | 3,657,640 | ||||||||||||||||||
Number of loans | 87,543 | 54,196 | 28,849 | |||||||||||||||||||||
Servicing income, before amortization of mortgage servicing rights | $ | 35,773 | $ | 409 | $ | 20,486 | $ | 378 | $ | 12,796 | $ | 444 | ||||||||||||
Costs of servicing | (22,845 | ) | (261 | ) | (14,261 | ) | (263 | ) | (7,703 | ) | (267 | ) | ||||||||||||
Net servicing income, before amortization of mortgage servicing rights | 12,928 | 148 | 6,225 | 115 | 5,093 | 177 | ||||||||||||||||||
Amortization of mortgage servicing rights | (16,934 | ) | (193 | ) | (8,995 | ) | (166 | ) | (4,609 | ) | (160 | ) | ||||||||||||
Net servicing income (loss) | $ | (4,006 | ) | $ | (45 | ) | $ | (2,770 | ) | $ | (51 | ) | $ | 484 | $ | 17 | ||||||||
Liquidity and Capital Resources
Liquidity means the need for, access to and uses of cash. Our primary needs for cash include the acquisition of mortgage loans, principal repayment and interest on borrowings, operating expenses and dividend payments. Substantial cash is required to support the operating activities of the business, especially the mortgage origination operation. Mortgage asset sales, principal, interest and fees collected on mortgage assets support cash needs. Drawing upon various borrowing arrangements typically satisfies major cash requirements. As shown in Table 5, we have $268.6 million in immediately available funds.
Mortgage lending requires significant cash to fund loan originations and purchases. Our warehouse lending arrangements, which include repurchase agreements, support the mortgage lending operation. Our warehouse mortgage lenders allow us to borrow between 98% and 100% of the outstanding principal. Funding for the difference – generally 2% of the principal - must come from cash on hand.
Loans financed with warehouse repurchase credit facilities are subject to changing market valuation and margin calls. The market value of our loans is dependent on a variety of economic conditions, including interest rates (and borrower demand) and end investor desire and capacity. Market values have been consistent over the past three years. However, there is no certainty that the prices will remain constant. To the extent the value of the loans declines significantly, we would be required to repay portions of the amounts we have borrowed. The value of our loans held-for-sale, excluding the loans under removal of accounts provision, as of December 31, 2004 would need to decline by approximately 37% before we would use all immediately available funds, assuming no other constraints on our immediately available funds.
In the ordinary course of business, we sell loans with recourse where a defect occurred in the loan origination process and guarantee to cover investor losses should origination defects occur. Defects may occur in the loan documentation and underwriting process, either through processing errors made by us or through intentional or unintentional misrepresentations made by the borrower or agents during those processes. If a defect is identified, we are required to repurchase the loan. As of December 31, 2004 and 2003, we had loans sold with recourse with an outstanding principal balance of $11.4 billion and $6.4 billion, respectively. Repurchases of loans where a defect has occurred have been insignificant, as such, there is minimal liquidity risk.
The derivative financial instruments we use also subject us to “margin call” risk. Under our interest rate swaps, we pay a fixed rate to the counterparties while they pay us a floating rate. While floating rates are low, on a net basis we are paying the counterparty. In order to mitigate credit exposure to us, the counterparty requires us to post margin deposits with them. As of December 31, 2004, we have approximately $6.7 million on deposit. A decline in interest rates would subject us to additional exposure for cash margin calls. However, the asset side of the balance sheet should increase in value in a further declining interest rate scenario. Incoming cash on our mortgage loans and securities is a principal source of cash. The volume of cash depends on, among other things, interest rates. While short-term interest rates (the basis for our funding costs) are low and the coupon rates on our loans are high, our net interest margin (and therefore incoming cash flow) is high. Severe and immediate changes in interest rates will impact the volume of our incoming cash flow. To the extent rates increase dramatically, our funding costs will increase quickly. While many of our loans are adjustable, they typically will not reset as quickly as our funding costs. This circumstance would temporarily reduce incoming cash flow. As noted above, derivative financial instruments are used to mitigate the effect of interest rate volatility. In this rising rate situation, our interest rate swaps and caps would provide additional cash flows to mitigate the lower cash flows on loans and securities.
Loans we originate and purchase can be sold to a third-party, which also generates cash to fund on-going operations. When market prices exceed our cost to originate, we believe we can operate in this manner, provided that the level of loan originations is at or near the capacity of the loan production infrastructure.
Cash activity during the years ended December 31, 2004, 2003 and 2002 is presented in the consolidated statement of cash flows.
As noted above, proceeds from equity offerings have supported our operations. Since inception, we have raised $362 million in net proceeds through private and public equity offerings. Equity offerings provide another future liquidity source.
Off Balance Sheet Arrangements
As discussed previously, we pool the loans we originate and purchase and securitize them to obtain long-term financing for the assets. The loans are transferred to a trust where they serve as collateral for asset-backed bonds, which the trust issues to the public. Our ability to use the securitization capital market is critical to the operations of our business. Table 3 summarizes our off balance sheet securitizations.
External factors that are reasonably likely to affect our ability to continue to use this arrangement would be those factors that could disrupt the securitization capital market. A disruption in the market could prevent us from being able to sell the securities at a favorable price, or at all. Factors that could disrupt the securitization market include an international liquidity crisis such as occurred in the fall of 1998, a terrorist attack, outbreak of war or other significant event risk, and market specific events such as a default of a comparable type of securitization. If we were unable to access the securitization market, we may still be able to finance our mortgage operations by selling our loans to investors in the whole loan market. We were able to do this following the liquidity crisis in 1998.
Specific items that may affect our ability to use the securitizations to finance our loans relate primarily to the performance of the loans that have been securitized. Extremely poor loan performance may lead to poor bond performance and investor unwillingness to buy bonds supported by our collateral. Our financial performance and condition has little impact on our ability to securitize, as evidenced by our ability to securitize in 1998, 1999 and 2000 when our financial trend was weak.
We have commitments to borrowers to fund residential mortgage loans as well as commitments to purchase and sell mortgage loans to third parties. As of December 31, 2004, we had outstanding commitments to originate loans of $361.2 million. We had no commitments to purchase or sell loans at December 31, 2004. As of December 31, 2003, we had outstanding commitments to originate and purchase loans of $228 million and $60 million, respectively. We had no commitments to sell loans to third parties at December 31, 2003. The commitments to originate and purchase loans do not necessarily represent future cash requirements, as some portion of the commitments are likely to expire without being drawn upon or may be subsequently declined for credit or other reasons.
Contractual Obligations
We have entered into certain long-term debt, hedging and lease agreements, which obligate us to make future payments to satisfy the related contractual obligations. Notes 7 and 8 of the consolidated financial statements discuss these obligations in further detail.
The following table summarizes our contractual obligations with regard to our long-term debt and lease agreements as of December 31, 2004.2006, with the exception of short-term borrowing arrangements.
Table 1633 — Contractual Obligations
(dollars in thousands)
| Payments Due by Period | Payments Due by Period | |||||||||||||||||||||||||||||
Contractual Obligations | Total | Less than 1 Year | 1-3 Years | 4-5 Years | After 5 Years | Total | Less than 1 Year | 1-3 Years | 4-5 Years | After 5 Years | ||||||||||||||||||||
Short-term borrowings | $ | 905,528 | $ | 905,528 | — | — | — | |||||||||||||||||||||||
Long-term debt (A) | $ | 407,242 | $ | 292,325 | $ | 100,887 | $ | 10,579 | $ | 3,451 | ||||||||||||||||||||
Long—term debt (A) | $ | 2,295,544 | $ | 790,589 | $ | 1,073,920 | $ | 431,035 | $ | — | ||||||||||||||||||||
Junior subordinated debentures (B) | 301,558 | 7,531 | 15,062 | 15,062 | 263,903 | |||||||||||||||||||||||||
Operating leases | $ | 48,965 | $ | 8,540 | $ | 16,471 | $ | 16,052 | $ | 7,902 | 45,727 | 11,656 | 22,159 | 10,538 | 1,374 | |||||||||||||||
Purchase obligations (D) | 11,791 | 11,791 | — | — | — | |||||||||||||||||||||||||
Premiums due to counterparties related to interest rate cap agreements | $ | 1,874 | $ | 1,372 | $ | 502 | — | — | 3,916 | 1,793 | 1,455 | 495 | 173 | |||||||||||||||||
Total | $ | 2,658,536 | $ | 823,360 | $ | 1,112,596 | $ | 457,130 | $ | 265,450 | ||||||||||||||||||||
| (A) |
| (B) | The junior subordinated debentures are assumed to mature in 2035 and 2036 in computing the future payments. These amounts include expected interest payments on the obligations. Interest obligations on our junior subordinated debentures are based on the prevailing interest rate at December 31, 2006 for each respective obligation. |
| (C) | Does not include rental income of $3.8 million to be received under sublease contracts. |
| (D) | The commitment to purchase mortgage loans does not necessarily represent future cash requirements as some portion of the commitment may be declined for credit or other reasons. |
We enteredrecorded deferred lease incentives, which will be amortized into variousrent expense over the life of the respective lease. Deferred lease agreements in which the lessor agreed to repay us for certain existing lease obligations. We received approximately $61,000, $2.3incentives as of December 31, 2006 and 2005 were $3.0 million and $62,000 related to these agreements in 2004, 2003 and 2002,$3.5 million, respectively. These agreements expired in 2004.
We also entered into various sublease agreements for office space formerly occupied by us. We received approximately $861,000 in 2006 under these agreements compared to approximately $53,000 and $1.2 million $537,000in 2005 and $704,0002004, respectively.
As of December 31, 2006 we had expected cash requirements for the payment of interest of $9.3 million on our debt obligations. The future amount of these interest payments will depend on the outstanding amount of our borrowings as well as the underlying rates for our variable rate borrowings. As of December 31, 2006 we had expected cash requirements for taxes of $5.9 million. The amount of taxes to be paid in the future will depend on taxable income in future periods as well as the amount and timing of dividend payments and other factors.
Liquidity and Capital Resources
Substantial cash is required to support our business operations. We strive to maintain adequate liquidity at all times to cover normal cyclical swings in funding availability and mortgage demand and to allow us to meet abnormal and unexpected funding requirements.
We believe that current cash balances, currently available financing facilities, capital raising capabilities and cash flows generated from our mortgage portfolio should adequately provide for required dividend payments and needs for business operations. However, if we are unable to raise capital in the future, we may not be able to grow as planned. Refer to “Risk Factors” for additional information regarding risks that could adversely affect our liquidity.
Factors management considers important in determining whether to finance our operations via warehouse and repurchase facilities, resecuritization or other asset-backed bond issuances or equity or debt offerings are as follows:
The financing costs involved.
The dilutive effect to our common shareholders.
The market price of our common stock.
Subordination rights of lenders and shareholders.
Collateral and other covenant requirements.
We had $150.5 million in cash and cash equivalents at December 31, 2006, which was a decrease of $114.2 million from December 31, 2005. At December 31, 2005 we had $264.7 million in cash and cash equivalents, which was a decrease of $3.9 million from December 31, 2004. One factor causing the decrease during 2006 is that we distributed two dividend payments during the fourth quarter of 2006 which increased our dividends paid significantly from 2005. In prior years, we generally have paid the dividend declared during the fourth quarter in January of the following year. Yet, in 2006, we distributed our fourth quarter dividend prior to December 31, 2006. Another significant factor is the amount of capital we have invested in haircuts related to our subordinated mortgage securities portfolio. As we purchase and aggregate these securities in preparation for a CDO securitization we leverage these securities at advance rates ranging from 75% to 89% of market value. These haircuts are funded from our cash reserves. Any subsequent margin calls are funded from our cash reserves as well.
The following table provides a summary of our operating, investing and financing cash flows as taken from our consolidated statements of cash flows for the years ended December 31, 2006, 2005 and 2004.
Table 34 — Summary of Operating, Investing and Financing Cash Flows
(dollars in thousands)
| For the Year Ended December 31, | ||||||||||||
| 2006 | 2005 | 2004 | ||||||||||
Consolidated Statements of Cash Flows: | ||||||||||||
Cash used in operating activities | $ | (3,510,910 | ) | $ | (727,181 | ) | $ | (565,706 | ) | |||
Cash flows provided by investing activities | 809,307 | 467,017 | 376,215 | |||||||||
Cash flows provided by financing activities | 2,587,431 | 256,295 | 339,874 | |||||||||
Operating Activities. Net cash used in operating activities increased to $(3.5) billion for the year ended December 31, 2006 from $(0.7) billion and $(0.6) billion for the years ended December 31, 2005 and 2004, 2003respectively. This increase is due primarily to the issuance of $2.5 billion in asset-backed bonds secured by our mortgage loans held-in-portfolio in 2006. Because the loans securing these transactions were not sold in securitizations, the transactions are presented as financing activities rather than operating activities on our consolidated statements of cash flows for the year ended December 31, 2006. We had no loan securitization transactions structured as financings for accounting purposes during 2005 and 2002, respectively2004.
In addition, our cash used for originations and purchases of mortgage loans held-for-sale increased by $1.9 billion and $2.7 billon from 2005 and 2004, respectively. This is due to an increase in our overall loan production during 2006 compared to the prior two years. This increase was offset somewhat by the cash provided to us in 2006 from our sales on mortgage loans held-for-sale to third parties.
Investing Activities. Net cash provided by investing activities increased to $809.3 million for the year ended December 31, 2006 from $467.0 million and $376.2 million for the years ended December 31, 2005 and 2004, respectively. This increase is due primarily to higher repayments of our mortgage loans held-in-portfolio during 2006 compared to 2005 and 2004. This increase is offset somewhat by a decrease in paydowns on our mortgage securities – available-for-sale during 2006 compared to 2005 and 2004.
Financing Activities. Net cash provided by financing activities increased to $2.6 billion for the year ended December 31, 2006 from $0.3 billion and $0.3 billion for the years ended December 31, 2005 and 2004, respectively. This increase is due primarily to the issuance of $2.5 billion in asset-backed bonds secured by our mortgage loans held-in-portfolio during 2006. Because the loans securing these transactions were not sold in securitizations, the transactions are presented as financing activities rather than operating activities on our consolidated statements of cash flows for the year ended December 31, 2006.
Primary Uses of Cash
Investments in New Mortgage Securities.We retain significant interests in the nonconforming loans we originate and purchase through our mortgage securities investment portfolio. We require capital in our securitizations to fund the primary bonds we retain, overcollateralization, securitization expenses and our operating costs to originate the mortgage loans.
Our investments in new mortgage securities should generally increase or decrease in conjunction with our mortgage loan production. In 2005, because we began retaining certain subordinated primary bonds, the amount of capital needed for our securitizations increased. We will continue to retain certain subordinated primary bonds when we feel they provide attractive risk-adjusted returns. In addition in 2006 we began purchasing subordinated bonds from other issuers, which also requires capital. For the year ended December 31, 2006 we retained residual securities with a cost basis of $155.0 million and subordinated securities with a cost basis of $90.0 million from our securitization transactions. In addition we purchased subordinated securities with a cost basis of $205.1 million from other issuers. For the years ended December 31, 2005 and 2004 we retained residual securities with a cost basis of $289.5 million and $381.8 million, respectively. In 2005 we retained subordinated securities with a cost basis of $42.9 million from our securitization transactions. In 2005 we purchased no subordinated securities from other issuers. In 2004 we purchased subordinated securities with a cost basis of $143.2 million from other issuers.
Originations and Purchases of Mortgage Loans.Mortgage lending requires significant cash to fund loan originations and purchases. The capital invested in our mortgage loans is outstanding until we sell or securitize the loans. Initial capital invested in our mortgage loans includes premiums paid to the brokers plus any haircut required upon financing, which is generally determined by the value and type of the mortgage loan being financed. A haircut is the difference between the principal balance of a mortgage loan and the amount we can borrow from a lender when using that loan to secure the debt. As values of mortgage loans have decreased in 2005 and 2006, lenders have required larger haircuts, which has required us to invest more capital in our mortgage loans. Lender haircuts for performing loans have generally been between zero and two percent of the principal balance of our mortgage loans. In the future haircuts may fluctuate as the values for the market for our loans fluctuate. Margin compression within the mortgage banking industry has also resulted in a decline in the premiums we paid to brokers for our mortgage loans to 0.8% for the year ended December 31, 2006, excluding the premiums we paid to acquire our MTA bulk pools, from 1.1% and 1.3% for the years ended December 31, 2005 and 2004, respectively. We paid a premium of 3.4% to acquire our MTA bulk pools during 2006. For the years ended December 31, 2006, 2005 and 2004 we used $11.3 billion, $9.4 billion and $8.5 billion in cash for the origination and purchase of mortgage loans held-for-sale, respectively.
Repayments of Long-Term Borrowings.Our payments on asset-backed bonds increased to $565.2 million for the year ended December 31, 2006 from $363.9 million and $254.9 million for years ended 2005 and 2004, respectively. Long-term borrowing repayments will fluctuate with the timing of new issuances of long-term debt and their respective maturities. See “Primary Sources of Cash - Net Proceeds From Issuances of Long-Term Debt.”
Common and Preferred Stock Dividend Payments. To maintain our qualification as a REIT, we must distribute at least 90% of our REIT taxable income to our common shareholders in the form of dividend payments. Historically, we have generally declared dividends equal to 100% of our REIT taxable income. The amount and timing of future dividends are determined by our Board of Directors based on REIT tax requirements as well as our financial condition and business trends at the time of declaration. We are currently evaluating whether it is in shareholders’ best interests to retain our REIT status.
We declared common stock dividends per share of $5.60, $5.60 and $6.75 for the years ended December 31, 2006, 2005 and 2004, respectively. Preferred stock dividends declared per share were $2.23, $2.23 and $2.11 for the years ended December 31, 2006, 2005 and 2004, respectively.
Loan Sale and Securitization Repurchases. In the ordinary course of business, we sell whole pools of loans with recourse for borrower defaults. When whole pools are sold as opposed to securitized, the third party has recourse against us for certain borrower defaults. Because the loans are no longer on our balance sheet, the recourse component is considered a guarantee. During 2006, we sold $2.2 billion of loans with recourse for borrower defaults compared to $1.1 billion in 2005. We maintained a $24.8 million recourse reserve related to these agreements.guarantees as of December 31, 2006 compared with a reserve of $2.3 million as of December 31, 2005. We paid $21.3 million in cash to repurchase loans sold to third parties in 2006 and paid $2.3 million in 2005. The recourse reserve is our estimate of the loss we expect to incur in repurchasing the loan and then either liquidating or reselling the loan. The cash we must have on hand to repurchase these loans is much higher as we generally must reimburse the investor for the remaining unpaid principal balance, any premium recapture, any unpaid accrued interest and any other out-of-pocket advances in accordance with the loan sale agreement. Repurchased loans will subsequently be financed on our warehouse repurchase agreements if eligible and then liquidated or sold. See discussion of haircuts on these loans below in “Primary Sources of Cash – Change in Short-Term Borrowings, net (Warehouse Lending Arrangements).”
We also sell loans to securitization trusts and make a guarantee to cover losses suffered by the trust resulting from defects in the loan origination process. Defects may occur in the loan documentation and underwriting process, either through processing errors made by us or through intentional or unintentional misrepresentations made by the borrower or agents during those processes. If a defect is identified, we are required to repurchase the loan. As of December 31, 2006 and December 31, 2005, we had loans sold with recourse with an outstanding principal balance of $12.6 billion and $12.7 billion, respectively. Historically, repurchases of loans from securitization trusts where a defect has occurred have been insignificant. As a result, and because we have received no significant requests to repurchase loans from our securitization trusts as of December 31, 2006, we have not recorded any reserves related to these guarantees.
We have amended certain of our lending agreements to provide for financing of nonperforming repurchased loans. Please see “Primary Sources of Cash – Change in Short-Term Borrowings, net (Warehouse Lending Arrangements)” for further discussion of these amendments and the liquidity they provide.
Primary Sources of Cash
Change in Short-Term Borrowings, net (Warehouse Lending Arrangements). Mortgage lending requires significant cash to fund loan originations and purchases. Our warehouse lending arrangements, which include repurchase agreements generally having one-year terms, support our mortgage lending operation. Our warehouse repurchase agreements have various collateral advance rates depending on the collateral type or delinquency status. Generally, for performing mortgage loans our lending agreements provide for advances at the lesser of 98% of market value or 100% of par. Funding for the difference, or “haircut”, must come from cash on hand. Advance rates on nonperforming assets are generally tiered down depending on the delinquency severity and can range as low as 70% of the lesser of market value or principal balance. For our mortgage securities financings, our lending agreements have advance rates ranging from 40% to 90% of the market value, depending on the type, age and rating of the security. Most of our subordinated securities have an advance rate of 80% while our residual securities generally have an advance rate of 75%. Our proceeds from changes in short-term borrowings increased to $741.1 million for the year ended December 31, 2006 from $499.7 million and $53.8 million for the years ended December 31, 2005 and 2004, respectively. At December 31, 2006 we had $3 million of collateral lending value pledged under these agreements and available for financing. However, we had not utilized all borrowing capacity that would be available under these agreements upon the pledge of additional collateral.
Loans financed with warehouse repurchase credit facilities and securities financed with repurchase agreements are subject to changing market valuation and margin calls. The market value of our loans is dependent on a variety of economic conditions, including interest rates, borrower demand, borrower creditworthiness, and end investor desire and capacity. Market values of our loans have declined over the past year, but have remained in excess of par. However, there is no certainty that the prices will remain in excess of par. The market value of our securities is also dependent on a variety of economic conditions, including interest rates, default rates on the underlying loans and market demand for the types of securities we retain from our securitizations and purchase from other issuers. To the extent the value of the loans or securities declines below the required market value margin set forth in the lending agreements, we would be required to repay portions of the amounts we have borrowed.
All of our warehouse repurchase credit facilities include numerous representations, warranties and covenants, including requirements to maintain a certain minimum net worth, minimum equity ratios and other customary debt covenants. Events of default under these facilities include material breaches of representations or warranties, failure to comply with covenants, material adverse effects upon or changes in our business, assets, or financial condition, and other customary matters. Events of default under certain of our facilities also include termination of our status as servicer with respect to certain securitized loan pools and failure to maintain profitability over consecutive quarters. If we were unable to make the necessary representations and warranties at the time we need financing, we would not be able to obtain needed funds. In addition, if we breach any covenant or an event of default otherwise occurs under any warehouse repurchase credit facility under which borrowings are outstanding, the lenders under all existing warehouse repurchase credit facilities could demand immediate repayment of all outstanding amounts because all of our warehouse repurchase credit facilities contain cross-default provisions. While management believes we are in compliance with all applicable material covenants as of December 31, 2006, any future breach or noncompliance could have a material adverse effect on our financial condition. We may fail to satisfy the profitability covenant under one of our warehouse repurchase facilities if our GAAP net income, determined on a pre-tax basis, is not greater than $1 for the six months ended March 31, 2007. In the event that we do not obtain a modification or waiver of this requirement, the borrowing capacity under this facility would not be available to us so long as we remained out of compliance. Further, if at the time of noncompliance we continued to have borrowings outstanding under this facility, the breach would permit lenders under each of our warehouse repurchase facilities to accelerate all amounts then outstanding. While we currently have borrowings outstanding under this facility, we have the unilateral right to prepay these borrowings at any time. The borrowing capacity currently existing and expected to exist under our other warehouse repurchase agreements is adequate to permit a transfer of all collateral from this facility and management believes is adequate to maintain our current level of operations.
During 2006, we entered into three new securities repurchase agreements (the “residual repurchase facilities”) with credit limits aggregating $450 million. These facilities provide financing for our residual securities but can only be used for our newer residual securities, starting with the NMFT Series 2005-3. Each has a three-year term but contains a one-year revolving period at which time either party can terminate the right to enter into additional financings under the facility. Two of these agreements expiredeach provide for additional capacity of $150 million beyond the capacity we already have with our master repurchase agreements (“MRA”) for those particular lenders. One of the agreements does not provide for additional capacity beyond the maximum capacity we have in place under the MRA for that particular lender and essentially acts as a sub-limit underneath the overall capacity. At December 31, 2006 we had fully borrowed against the lending value of the collateral then pledged under these agreements, but had not utilized all borrowing capacity that would be available under these agreements upon the pledge of additional collateral.
In late 2006 and early 2007, we amended our lending agreements to provide for sub-limits for non-performing assets such as early payment defaults, first payment defaults, loans delinquent greater than 90 days, and real estate owned to help accommodate our financing needs in the current mortgage environment of rising delinquencies and loan repurchase requests. We have added $90 million of capacity for these assets and expect to add additional capacity in the first half of 2007. Advance rates on these assets are in a range of 70% to 95% of market value. This additional capacity can also be used to help finance the delinquent loans which come back on our balance sheet when we call an off-balance sheet securitization.
We also entered into a new securities repurchase agreement (the “CDO aggregation facility”) in 2006, having a one-year term, to provide for a maximum of $500 million of financing for the securities which we accumulate for our future CDO securitizations. This agreement provides for advance rates ranging from 50% to 89% of the security’s market value. The advance rates on trading securities which we have purchased as of December 31, 2006 range from 75% to 89%.
We also have the ability to leverage our receivables arising from servicing related advances as a source of liquidity. These receivables primarily represent advances we have made to securitization trusts as well as on behalf of borrowers for taxes and insurance. This loan agreement provides for capacity of $80 million, secured by the receivables, with an advance rate of 85%-90%. Capacity that we utilize under this facility reduces borrowing capacity available to us under the warehouse repurchase agreement that we have with this lender. This capacity also functions as a sub-limit underneath the overall MRA capacity for that particular lender. At December 31, 2006 we had fully borrowed against the lending value of the collateral then pledged under these agreements, but had not utilized all borrowing capacity that would be available under these agreements upon the pledge of additional collateral.
As shown in Table 35, we had $153.5 million in immediately available funds as of December 31, 2006 to support our mortgage lending and mortgage portfolio operations. We have borrowed approximately $2.2 billion of the $4.3 billion in mortgage securities, mortgage loans and servicing advance financing facilities, leaving approximately $2.1 billion available upon the pledge of eligible mortgage loans, securities or other collateral to support the mortgage lending and mortgage portfolio operations.
Table 35 — Short-term Financing Resources
(dollars in thousands)
| Credit Limit | Lending Value of Collateral | Borrowings | Immediately Available Funds | |||||||||
Unrestricted cash | $ | 150,522 | ||||||||||
Mortgage securities, mortgage loans and servicing advance repurchase facilities | $ | 4,250,000 | $ | 2,155,208 | $ | 2,152,208 | 3,000 | |||||
Total | $ | 4,250,000 | $ | 2,155,208 | $ | 2,152,208 | $ | 153,522 | ||||
Cash Received From Our Mortgage Securities Portfolio.A major driver of cash flows from investing activities are the proceeds we receive from our mortgage securities—available-for-sale portfolio. For the year ended December 31, 2006 we received $327.2 million in proceeds from repayments on mortgage securities—available-for-sale as compared to $453.8 million and $346.6 million for years ended 2005 and 2004, respectively. The cash flows we receive on our mortgage securities—available-for-sale are highly dependent on the interest rate spread between the underlying collateral and the bonds issued by the securitization trusts and default and prepayment experience of the underlying collateral. The following factors have been the significant drivers in the overall fluctuations in these cash flows:
The coupons on the underlying collateral of our mortgage securities have increased modestly while the interest rates paid on the bonds issued by the securitization trusts have dramatically risen over the last couple of years.
The lower spreads are due in part to higher credit losses due to the substantial decline in housing price appreciation of the underlying collateral during 2006.
We have lower average balances of our mortgage securities—available-for-sale portfolio as our paydowns have increased faster than our addition of new bonds from our securitizations.
Proceeds from Repayments of Mortgage Loans. For the year ended December 31, 2006 we received $629.3 million in proceeds from the repayments of our portfolio of mortgage loans held-for-sale and mortgage loans held-in-portfolio compared to $26.6 million and $59.8 million for the years ended 2005 and 2004, respectively. The significant increase in repayments is due to a larger portfolio of mortgage loans held-in-portfolio in the current year as compared to 2005 and 2004.
Net Proceeds from Securitizations of Mortgage Loans. We depend on the capital markets to finance the mortgage loans we originate and purchase. The primary bonds we issue in our loan securitizations are sold to large, institutional investors and U.S. government-sponsored enterprises. If the non-conforming loan industry continues to experience credit difficulties, our ability to access the securitization market on favorable terms may be negatively affected. The net proceeds from sales of mortgage loans held-for-sale in securitizations decreased to $5.9 billion for the year ended December 31, 2006 from $7.4 billion and $8.2 billion for the years ended 2005 and 2004, respectively.
Net Proceeds from Sales of Mortgage Loans to Third Parties.We also depend on third party investors to provide liquidity for our mortgage loans. We generally will sell loans to third party investors that do not possess the economic characteristics meeting our long-term portfolio management objectives. For the years ended December 31, 2006, 2005 and 2004 we received net proceeds from the sales of mortgage loans held-for-sale to third parties of $2.3 billion, $1.2 billion and $64.5 million, respectively. The increase in proceeds from sales of mortgage loans to third parties is a result of the environment of tighter margins in the mortgage banking industry. These tighter margins prompted us to sell loans to third parties rather than adding them to our securitized portfolio due to unattractive returns.
Net Proceeds from Issuances of Long-Term Debt.The resecuritization of our mortgage securities—available-for-sale, on balance sheet securitizations, collateralized debt obligations as well as private debt offerings provide long-term sources of liquidity.
We received net proceeds of $1.3 billion and $1.2 billion, respectively, through the issuance of NHES Series 2006-1 and NHES Series 2006-MTA1 during the year ended December 31, 2006. These asset-backed bonds are collateralized by mortgage loans – held-in-portfolio on our consolidated balance sheet.
In 2005 we began retaining various subordinate investment-grade securities from our securitization transactions that were previously held in the form of overcollateralization bonds. We also purchase subordinated securities from other ABS issuers. We will continue to retain, acquire and aggregate various types of ABS as well as synthetic assets with the intention of securing non-recourse long-term financing using our portfolio of mortgage securities – trading as collateral. We executed our first CDO in February 2007.
We periodically issue asset-backed bonds (NIMs) secured by our mortgage securities – available-for-sale as a means for long-term non-recourse financing for these assets.
We received net proceeds of $33.9 million from the issuance of unsecured floating rate junior subordinated debentures during the year ended December 31, 2006 and $48.4 million for the year ended December 31, 2005 from the issuance of similar debentures. We had no issuances of these debentures in 2004. We will continue to take advantage of this market when we feel we can issue debt at more attractive costs than issuing capital stock.
Net Proceeds from Issuances Equity or Debt or the Retention of Cash Flow. If our board of directors determines that additional financing is required, we may raise the funds through additional equity offerings, debt financings, retention of cash flow (subject to provisions in the Code concerning distribution requirements and taxability of undistributed REIT taxable income, so long as we remain a REIT) or a combination of these methods. In the event that our board of directors determines to raise additional equity capital, it has the authority, without stockholder approval, subject to applicable law and NYSE regulations, to issue additional common stock or preferred stock in any manner and on terms and for consideration it deems appropriate up to the amount of authorized stock set forth in our charter. Since inception, we have raised $563.5 million in net proceeds through private and public equity offerings.
In 2006, we sold 2,938,200 shares of common stock under our Direct Stock Purchase and Dividend Reinvestment Plan (DRIP) raising $85.4 million in net proceeds, 2,000,000 shares of common stock were sold in a registered controlled equity offering raising $57.5 million in net proceeds and we issued 130,444 shares of common stock under the stock-based compensation plan raising $0.6 million in net proceeds.
In 2005, we completed a public offering of 1,725,000 shares of common stock raising $57.9 million in net proceeds. Additionally, we sold 2,609,320 shares of common stock under our DRIP raising $83.6 million in net proceeds and 148,797 shares of common stock under the stock-based compensation plan raising $0.7 million.
In 2004, we completed a public offering of 1,725,000 shares of common stock raising $70.1 million in net proceeds. Additionally, we sold 1,104,488 shares of common stock under our DRIP raising $49.4 million in net proceeds and 433,181 shares of common stock under the stock-based compensation plan raising $2.0 million. We also sold 2,990,000 shares of redeemable preferred stock raising $72.1 million in net proceeds.
Other Liquidity Factors
The derivative financial instruments we use also subject us to “margin call” risk. Under our interest rate swaps, we pay a fixed rate to the counterparties while they pay us a floating rate. When floating rates are lower than the fixed rate on the interest rate swap, we are paying the counterparty. In order to mitigate credit exposure to us, the counterparty requires us to post margin deposits with them. As of December 31, 2006, we had approximately $5.7 million on deposit with counterparties. A decline in interest rates would subject us to additional exposure for cash margin calls. However, when short-term interest rates (the basis for our funding costs) are low and the coupon rates on our loans are high, our net interest margin (and therefore incoming cash flow) is high which should offset any requirement to post additional collateral. Severe and immediate changes in interest rates will impact the volume of our incoming cash flow. To the extent rates increase dramatically, our funding costs will increase quickly. While many of our loans are adjustable, they typically will not reset as quickly as our funding costs. This circumstance would reduce incoming cash flow. As noted above, derivative financial instruments are used to mitigate the effect of interest rate volatility. In this rising rate situation, our interest rate swaps and caps would provide additional cash flows to mitigate the lower cash flow on loans and securities.
Table 33 details our major contractual obligations due over the next 12 months and beyond. Management believes cash and cash equivalents on hand combined with other available liquidity sources including: 1) proceeds from mortgage loan sales and securitizations, 2) cash received on our mortgage securities available-for-sale, 3) draw downs on mortgage loan and securities repurchase agreements, 4) proceeds from private and public debt and equity offerings and 5) proceeds from resecuritizations will be adequate to meet our liquidity needs for the next twelve months. In addition, we do not believe our long-term growth plans will be constrained due to a lack of available liquidity resources. However, we can provide no assurance, that, if needed, the liquidity resources we utilize will be available or will be available on terms we consider favorable. Factors that can affect our liquidity are discussed in the “Risk Factors” section of this document.
Off-Balance Sheet Arrangements
As discussed previously, we pool the loans we originate and purchase and typically securitize them to obtain long-term financing for the assets. The loans are transferred to a trust where they serve as collateral for asset-backed bonds, which the trust issues to the public. Our ability to use the securitization capital market is critical to the operations of our business.
External factors that are reasonably likely to affect our ability to continue to use this arrangement would be those factors that could disrupt the securitization capital market. A disruption in the market could prevent us from being able to sell the securities at a favorable price, or at all. Factors that could disrupt the securitization market include an international liquidity crisis such as occurred in the fall of 1998, sudden changes in interest rates, a terrorist attack, outbreak of war or other significant event risk, and market specific events such as a default of a comparable type of securitization. If we were unable to access the securitization market, we may still be able to finance our mortgage operations by selling our loans to investors in the whole loan market. We were able to do this following the liquidity crisis in 1998; however, there can be no assurance that in a future liquidity crisis that we would be able to obtain sufficient liquidity to support our historic operations.
Specific items that may affect our ability to use the securitizations to finance our loans relate primarily to the performance of the loans that have been securitized. Extremely poor loan performance may lead to poor bond performance and investor unwillingness to buy bonds supported by our collateral. Our financial performance and condition has little impact on our ability to securitize, as evidenced by our ability to securitize in 1998, 1999 and 2000 when our financial condition was weak. There is no assurance, however, that we will be able to securitize loans in the future if we have poor loan performance.
We have commitments to borrowers to fund residential mortgage loans as well as commitments to purchase and sell mortgage loans to third parties. As of December 31, 2006, we had outstanding commitments to originate and purchase loans of $774.0 million and $11.8 million, respectively. We had no outstanding commitments to sell loans at December 31, 2006. As of December 31, 2005, we had outstanding commitments to originate, purchase and sell loans of $545.4 million, $33.4 million and $93.6 million, respectively. The commitments to originate and purchase loans do not necessarily represent future cash requirements, as some portion of the commitments are likely to expire without being drawn upon or may be subsequently declined for credit or other reasons.
In the ordinary course of business, we sell whole pools of loans to investors with recourse for borrower defaults. We also sell loans to securitization trusts and make a guarantee to cover losses suffered by the trust resulting from defects in the loan origination process. See “Liquidity and Capital Resources – Primary Uses of Cash – Loan Sale and Securitization Repurchases” for further discussion of these guarantees and recourse obligations.
Inflation
Virtually all of our assets and liabilities are financial in nature. As a result, interest rates and other factors drive companyour performance far more than does inflation. Changes in interest rates do not necessarily correlate with inflation rates or changes in inflation rates. Our financial statements are prepared in accordance with accounting principles generally accepted in the United States of AmericaGAAP and common stock dividends are based on taxable income. In each case, financial activities and the balance sheet are measured with reference to historical cost or fair market value without considering inflation.
Impact of Recently Issued Accounting Pronouncements
In December 2004,February 2006, the FASB issued a revisionSFAS No. 155, “Accounting for Certain Hybrid Financial Instruments”, an amendment of FASB Statements No. 133 and SFAS No. 140 (“SFAS 155”). This statement permits fair value remeasurement for any hybrid financial instrument that contains an embedded derivative that otherwise would require bifurcation. It also clarifies which interest-only strips and principal-only strips are not subject to FASB Statement No. 123,Accounting133, “Accounting for Stock-Based CompensationDerivative Instruments and Hedging Activities” (“SFAS 133”). This StatementThe statement also establishes standards for the accounting for transactionsa requirement to evaluate interests in which an entity exchanges its equity instruments for goods or services. It also addresses transactions in which an entity incurs liabilities in exchange for goods or servicessecuritized financial assets to identify interests that are basedfreestanding derivatives or hybrid financial instruments that contain an embedded derivative requiring bifurcation. The statement also clarifies that concentration of credit risks in the form of subordination are not embedded derivatives, and it also amends SFAS 140 to eliminate the prohibition on a Qualifying Special Purpose Entity (“QSPE”) from holding a derivative financial instrument that pertains to a beneficial interest other than another derivative financial instrument. SFAS 155 is effective for all financial instruments acquired or issued after the fair valuebeginning of an entity’s first fiscal year that begins after September 15, 2006.
In January 2007, the FASB provided a scope exception under FAS 155 for securitized interests that only contain an embedded derivative that is tied to the prepayment risk of the entity’s equity instruments or that mayunderlying prepayable financial assets, and for which the investor does not control the right to accelerate the settlement. If a securitized interest contains any other embedded derivative (for example, an inverse floater), then it would be settled bysubject to the bifurcation tests in FAS 133, as would securities purchased at a significant premium. Following the issuance of those equity instruments. This Statement focuses primarilythe scope exception by the FASB, changes in the market value of our investment securities would continue to be made through other comprehensive income, a component of stockholders’ equity. We do not expect that the adoption of FAS 155 will have a material impact on accounting for transactionsour financial position, results of operations or cash flows. However, to the extent that certain of our future investments in which an entity obtains employee servicessecuritized financial assets do not meet the scope exception adopted by the FASB, our future results of operations may exhibit volatility if such investments are required to be bifurcated or marked to market value in share-based payment transactions and does not changetheir entirety through the accounting guidance for share-based payment transactions with parties other than employees provided in SFAS No. 123 and Emerging Issues Task Force ofincome statement, depending on the election made.
In March 2006, the Financial Accounting Standards Board (EITF) Issue No. 96-18,Accounting for Equity Instruments That Are Issued to Other Than Employees for Acquiring, or in Conjunction with Selling, Goods or Services. Entities no longer have the option to use the intrinsic value method of APB 25 that was provided in SFAS 123 as originally(“FASB”) issued which generally resulted in the recognition of no compensation cost. Under SFAS No. 123(R)156, “Accounting for Servicing of Financial Assets”, the costan amendment of employee services receivedSFAS No. 140 (“SFAS 156”). This statement requires that an entity separately recognize a servicing asset or a servicing liability when it undertakes an obligation to service a financial asset under a servicing contract in exchange for an equity award mustcertain situations. Such servicing assets or servicing liabilities are required to be based on the grant-dateinitially measured at fair value, if practicable. SFAS 156 also allows an entity to choose one of two methods when subsequently measuring its servicing assets and servicing liabilities: (1) the award.amortization methodor (2) the fair value measurement method. The cost of the awardsamortization method existed under SFAS 123(R) will be recognized140 and remains unchanged in (1) allowing entities to amortize their servicing assets or servicing liabilities in proportion to and over the period an employee provides service, typicallyof estimated net servicing income or net servicing loss and (2) requiring the vesting period. No compensation cost is recognizedassessment of those servicing assets or servicing liabilities for equity instruments in which the requisite service is not provided. For employee awards that are treated as liabilities, initial cost of the awards will be measuredimpairment or increased obligation based on fair value at fair value.each reporting date. The fair value of the liability awards will be remeasured subsequentlymeasurement method allows entities to measure their servicing assets or servicing liabilities at fair value each reporting date through the settlement date withand report changes in fair value duringin earnings in the period an employee provides service recognized as compensation cost overthe change occurs. SFAS 156 introduces the notion ofclassesand allows companies to make a separate subsequent measurement election for each class of its servicing rights. In addition, SFAS 156 requires certain comprehensive roll-forward disclosures that period. Thismust be presented for each class. The Statement is effective as of the beginning of an entity’s first interim or annual reporting periodfiscal year that begins after JuneSeptember 15, 2005. As discussed in Note 12006. Earlier adoption is permitted as of the beginning of an entity’s fiscal year, so long as the entity has not yet issued financial statements, including financial statements for any interim period, for that fiscal year. We do not expect the adoption of SFAS 156 will have a material impact on our consolidated financial statements,statements.
In June 2006, the FASB issued FASB Interpretation No. 48 (“FIN 48”), “Accounting for Uncertainty in Income Taxes – an interpretation of FASB Statement No. 109”. FIN 48 prescribes a recognition threshold and measurement attribute for the financial statement recognition and measurement of a tax position taken or to be taken on a tax return. This interpretation also provides additional guidance on derecognition, classification, interest and penalties, accounting in interim periods, disclosure, and transition. This interpretation is effective for fiscal years after December 15, 2006. We will adopt the provisions of FIN 48 beginning in the first quarter of 2007. The cumulative effect of applying the provisions of FIN 48 will be reported as an adjustment to the opening balance of retained earnings on January 1, 2007. We do not expect the adoption of FIN 48 to have a material impact to our consolidated financial statements; however, we implementedare still in the process of completing our evaluation of the impact of adopting FIN 48.
In September 2006, the FASB issued SFAS No. 157, “Fair Value Measurements” (“SFAS No. 157”). SFAS No. 157 establishes a framework for measuring fair value provisions of SFAS No. 123 during 2003. As such,and requires expanded disclosures regarding fair value measurements. This accounting standard is effective for financial statements issued for fiscal years beginning after November 15, 2007. We are still evaluating the impact the adoption of this statement is not anticipated towill have a significant impact on theour consolidated financial statements.
In March 2004, SECSeptember 2006, the Securities and Exchange Commission (“SEC”) issued Staff Accounting Bulletin (SAB) No. 105,Application108, Considering the Effects of Accounting Principles to Loan Commitments was released. This release summarizes the SEC staff positionPrior Year Misstatements when Quantifying Misstatements in Current Year Financial Statements (“SAB No. 108”). SAB No. 108 provides guidance regarding the applicationconsideration of accounting principles generally acceptedthe effects of prior year misstatements in quantifying current year misstatements for the United Statespurpose of America to loan commitments accounted for as derivative instruments. We account for interest rate lock commitments issued on mortgage loans that will be held for sale as derivative instruments. Consistent withmateriality assessments. The method established by SAB No. 105, we considered108 requires each of our financial statements and the fair value of these commitmentsrelated financial statement disclosures to be zero atconsidered when quantifying and assessing the commitment date, with subsequent changes in fair value determined solely on changes in market interest rates. Asmateriality of December 31, 2004, we had interest rate lock commitments on mortgage loans with principal balancesthe misstatement. The provisions of $361.2 million, the fair value of which was $(75,000).
At the March 17-18, 2004 EITF meeting, the EITF reached a consensus on Issue No. 03-1,The Meaning of Other-Than-Temporary Impairment and its Application to Certain Investments. Issue 03-1 provides guidance for determining when an investment is other-than-temporarily impaired and disclosure requirements regarding impairments that have not been recognized as other-than-temporary. In September 2004, the FASB delayed the effective date of paragraphs 10-20 of this issue. These paragraphs give guidance on how to evaluate and recognize an impairment loss that is other than temporary. The delay does not suspend the requirements to recognize other than temporary impairments as required by existing authoritative literature. The disclosure requirements wereSAB 108 are effective for reporting periods beginning after June 15, 2004. Issue 03-1 is not expected to have a material impact on the consolidated financial statements.
In December 2003, the American Institute of Certified Public Accountants (AICPA)statements issued Statement of Position (SOP) 03-3,Accounting for Certain Loans or Debt Securities Acquired in a Transfer.This SOP addresses accounting for differences between contractual cash flows and cash flows expected to be collected from an investor’s initial investment in loans or debt securities (loans) acquired in a transfer if those differences are attributable, at least in part, to credit quality. It includes such loans acquired in purchase business combinations and applies to all nongovernmental entities, including not-for-profit organizations. This SOP does not apply to loans originated by the entity, loans acquired in a business combination accounted for at historical cost, mortgage-backed securities in securitization transactions, acquired loans classified as held-for-sale, trading securities and derivatives. This SOP limits the yield that may be accreted to the excess of the investor’s estimate of undiscounted expected principal, interest, and other cash flows (cash flows expected at acquisition to be collected) over the investor’s initial investment in the loan. This SOP requires that the excess of contractual cash flows over cash flows expected to be collected (nonaccretable difference) not be recognized as an adjustment of yield, loss accrual, or valuation allowance. This SOP prohibits investors from displaying the accretable yield and nonaccretable difference in the balance sheet. Subsequent increases in cash flows expected to be collected generally should be recognized prospectively through adjustment of the loan’s yield over its remaining life. Decreases in cash flows expected to be collected should be recognized as impairment. This SOP prohibits “carrying over” or creation of valuation allowances in the initial accounting of all loans acquired in a transfer that are within the scope of this SOP. The prohibition of the valuation allowance carryover applies to the purchase of an individual loan, a pool of loans, a group of loans, and loans acquired in a purchase business combination. This SOP is effective for loans acquired in fiscal years beginning after December 15, 2004. Early adoption is encouraged. For loans acquired in fiscal years beginning on or before December 15, 2004, this SOP should be applied prospectively for fiscal years beginning after December 15, 2004. SOP 03-3 is not expected to31, 2006. We are still evaluating the impact the adoption of this statement will have a significant impact on theour consolidated financial statements.
In February 2007, the FASB issued SFAS No. 159, “The Fair Value Option for Financial Assets and Financial Liabilities—Including an amendment of FASB Statement No. 115.” SFAS No. 159 permits entities to choose to measure many financial instruments and certain other items at fair value. Unrealized gains and losses on items for which the fair value option has been elected will be recognized in earnings at each subsequent reporting date. This accounting standard is effective for financial statements issued for fiscal years beginning after November 15, 2007. We are still evaluating the impact the adoption of this statement will have on our consolidated financial statements.
Item 7A.Quantitative and Qualitative Disclosures about Market Risk
See discussion under “Interest Rate/Market Risk” in “Item 1. Business”.
Item 8.Financial Statements and Supplementary Data
NOVASTAR FINANCIAL, INC.
CONSOLIDATED BALANCE SHEETS
(dollars in thousands, except share amounts)
| December 31, | December 31, | |||||||||||||||
| 2004 | 2003 | 2006 | 2005 | |||||||||||||
Assets | ||||||||||||||||
Cash and cash equivalents | $ | 268,563 | $ | 118,180 | $ | 150,522 | $ | 264,694 | ||||||||
Mortgage loans – held-for-sale | 747,594 | 697,992 | 1,741,819 | 1,291,556 | ||||||||||||
Mortgage loans – held-in-portfolio | 59,527 | 94,717 | ||||||||||||||
Mortgage loans – held-in-portfolio, net of allowance of $22,452 and $699, respectively | 2,116,535 | 28,840 | ||||||||||||||
Mortgage securities – available-for-sale | 489,175 | 382,287 | 349,312 | 505,645 | ||||||||||||
Mortgage securities – trading | 143,153 | — | 329,361 | 43,738 | ||||||||||||
Mortgage servicing rights | 42,010 | 19,685 | 62,830 | 57,122 | ||||||||||||
Deferred income tax asset, net | 47,188 | 30,780 | ||||||||||||||
Servicing related advances | 20,190 | 19,281 | 40,923 | 26,873 | ||||||||||||
Warehouse notes receivable | 39,462 | 25,390 | ||||||||||||||
Accrued interest receivable | 37,692 | 4,866 | ||||||||||||||
Real estate owned | 21,534 | 1,208 | ||||||||||||||
Derivative instruments, net | 18,841 | 19,492 | 16,816 | 12,765 | ||||||||||||
Property and equipment, net | 15,476 | 14,537 | ||||||||||||||
Other assets | 56,782 | 33,786 | 74,269 | 42,257 | ||||||||||||
Total assets | $ | 1,861,311 | $ | 1,399,957 | $ | 5,028,263 | $ | 2,335,734 | ||||||||
Liabilities and Stockholders’ Equity | ||||||||||||||||
Liabilities and Shareholders’ Equity | ||||||||||||||||
Liabilities: | ||||||||||||||||
Short-term borrowings secured by mortgage loans | $ | 720,791 | $ | 639,852 | $ | 1,631,773 | $ | 1,238,122 | ||||||||
Short-term borrowings secured by mortgage securities | 184,737 | 232,684 | 503,680 | 180,447 | ||||||||||||
Other short-term borrowings | 16,755 | — | ||||||||||||||
Asset-backed bonds secured by mortgage loans | 53,453 | 89,384 | 2,067,490 | 26,949 | ||||||||||||
Asset-backed bonds secured by mortgage securities | 336,441 | 43,596 | 9,519 | 125,630 | ||||||||||||
Junior subordinated debentures | 83,041 | 48,664 | ||||||||||||||
Due to securitization trusts | 107,043 | 44,382 | ||||||||||||||
Dividends payable | 73,431 | 30,559 | 1,663 | 45,070 | ||||||||||||
Due to trusts | 20,930 | 14,475 | ||||||||||||||
Accounts payable and other liabilities | 45,184 | 49,183 | 92,729 | 62,250 | ||||||||||||
Total liabilities | 1,434,967 | 1,099,733 | 4,513,693 | 1,771,514 | ||||||||||||
Commitments and contingencies (Note 9) | ||||||||||||||||
Commitments and contingencies (Note 8) | ||||||||||||||||
Stockholders’ equity: | ||||||||||||||||
Shareholders’ equity: | ||||||||||||||||
Capital stock, $0.01 par value, 50,000,000 shares authorized: | ||||||||||||||||
Redeemable preferred stock, $25 liquidating preference per share; 2,990,000 shares authorized, issued and outstanding | 30 | — | ||||||||||||||
Common stock, 27,709,984 and 24,447,315 shares authorized, issued and outstanding, respectively | 277 | 245 | ||||||||||||||
Redeemable preferred stock, $25 liquidating preference per share; 2,990,000 shares, issued and outstanding | 30 | 30 | ||||||||||||||
Common stock, 37,261,252 and 32,193,101 shares, issued and outstanding, respectively | 373 | 322 | ||||||||||||||
Additional paid-in capital | 433,107 | 231,294 | 741,748 | 581,580 | ||||||||||||
Accumulated deficit | (85,354 | ) | (15,522 | ) | (263,572 | ) | (128,554 | ) | ||||||||
Accumulated other comprehensive income | 79,120 | 85,183 | 36,548 | 111,538 | ||||||||||||
Other | (836 | ) | (976 | ) | (557 | ) | (696 | ) | ||||||||
Total stockholders’ equity | 426,344 | 300,224 | ||||||||||||||
Total shareholders’ equity | 514,570 | 564,220 | ||||||||||||||
Total liabilities and stockholders’ equity | $ | 1,861,311 | $ | 1,399,957 | ||||||||||||
Total liabilities and shareholders’ equity | $ | 5,028,263 | $ | 2,335,734 | ||||||||||||
See notes to consolidated financial statements.
NOVASTAR FINANCIAL, INC.
CONSOLIDATED STATEMENTS OF INCOME
(dollars in thousands, except per share amounts)
| For the Year Ended December 31, | For the Year Ended December 31, | |||||||||||||||||||||||
| 2004 | 2003 | 2002 | 2006 | 2005 | 2004 | |||||||||||||||||||
Interest income: | ||||||||||||||||||||||||
Mortgage securities | $ | 133,633 | $ | 98,804 | $ | 56,481 | ||||||||||||||||||
Mortgage loans held-for-sale | 83,718 | 60,878 | 33,736 | |||||||||||||||||||||
Mortgage loans held-in-portfolio | 6,673 | 10,738 | 16,926 | |||||||||||||||||||||
Interest income | $ | 494,890 | $ | 320,727 | $ | 230,845 | ||||||||||||||||||
Interest expense | 235,331 | 80,755 | 52,482 | |||||||||||||||||||||
Total interest income | 224,024 | 170,420 | 107,143 | |||||||||||||||||||||
Interest expense: | ||||||||||||||||||||||||
Short-term borrowings secured by mortgage loans | 30,005 | 20,060 | 10,406 | |||||||||||||||||||||
Short-term borrowings secured by mortgage securities | 4,836 | 3,450 | 2,107 | |||||||||||||||||||||
Asset-backed bonds secured by mortgage loans | 1,422 | 2,269 | 4,195 | |||||||||||||||||||||
Asset-backed bonds secured by mortgage securities | 13,255 | 5,226 | 727 | |||||||||||||||||||||
Net settlements of derivative instruments used in cash flow hedges | 3,072 | 9,359 | 10,293 | |||||||||||||||||||||
Total interest expense | 52,590 | 40,364 | 27,728 | |||||||||||||||||||||
Net interest income before credit (losses) recoveries | 171,434 | 130,056 | 79,415 | |||||||||||||||||||||
Credit (losses) recoveries | (726 | ) | 389 | 432 | ||||||||||||||||||||
Net interest income before provision for credit losses | 259,559 | 239,972 | 178,363 | |||||||||||||||||||||
Provision for credit losses | (30,131 | ) | (1,038 | ) | (726 | ) | ||||||||||||||||||
Net interest income | 170,708 | 130,445 | 79,847 | 229,428 | 238,934 | 177,637 | ||||||||||||||||||
Other operating income (expense): | ||||||||||||||||||||||||
Gains on sales of mortgage assets | 144,950 | 144,005 | 53,305 | 41,749 | 65,148 | 144,950 | ||||||||||||||||||
Gains (losses) on derivative instruments | 11,998 | 18,155 | (8,905 | ) | ||||||||||||||||||||
Impairment on mortgage securities – available-for-sale | (30,690 | ) | (17,619 | ) | (15,902 | ) | ||||||||||||||||||
Fee income | 102,756 | 68,341 | 35,983 | 29,032 | 30,678 | 30,668 | ||||||||||||||||||
Premiums for mortgage loan insurance | (4,218 | ) | (3,102 | ) | (2,326 | ) | (12,419 | ) | (5,672 | ) | (4,218 | ) | ||||||||||||
Losses on derivative instruments | (8,905 | ) | (30,837 | ) | (36,841 | ) | ||||||||||||||||||
Impairment on mortgage securities – available-for-sale | (15,902 | ) | — | — | ||||||||||||||||||||
Other income, net | 6,609 | 412 | 1,356 | |||||||||||||||||||||
Other income (expense), net | 647 | (784 | ) | (272 | ) | |||||||||||||||||||
Total other operating income | 40,317 | 89,906 | 146,321 | |||||||||||||||||||||
General and administrative expenses: | ||||||||||||||||||||||||
Compensation and benefits | 138,516 | 89,954 | 49,060 | 124,156 | 100,492 | 87,887 | ||||||||||||||||||
Office administration | 38,625 | 22,945 | 10,092 | 27,491 | 28,453 | 26,496 | ||||||||||||||||||
Professional and outside services | 21,020 | 18,120 | 17,207 | |||||||||||||||||||||
Loan Expense | 7,416 | 13,155 | 14,411 | |||||||||||||||||||||
Marketing | 37,812 | 23,109 | 9,986 | 4,908 | 2,817 | 6,386 | ||||||||||||||||||
Professional and outside services | 19,887 | 7,482 | 3,263 | |||||||||||||||||||||
Loan expense | 18,753 | 19,433 | 6,667 | |||||||||||||||||||||
Other | 17,532 | 11,485 | 5,526 | 16,270 | 21,593 | 15,873 | ||||||||||||||||||
Total general and administrative expenses | 271,125 | 174,408 | 84,594 | 201,261 | 184,630 | 168,260 | ||||||||||||||||||
Income from continuing operations before income tax expense (benefit) | 124,873 | 134,856 | 46,730 | |||||||||||||||||||||
Income tax expense (benefit) | 5,376 | 22,860 | (2,031 | ) | ||||||||||||||||||||
Income from continuing operations before income tax (benefit) expense | 68,484 | 144,210 | 155,698 | |||||||||||||||||||||
Income tax (benefit) expense | (8,721 | ) | (6,617 | ) | 16,756 | |||||||||||||||||||
Income from continuing operations | 119,497 | 111,996 | 48,761 | 77,205 | 150,827 | 138,942 | ||||||||||||||||||
Loss from discontinued operations, net of income tax | (4,108 | ) | — | — | (4,267 | ) | (11,703 | ) | (23,553 | ) | ||||||||||||||
Net income | 115,389 | 111,996 | 48,761 | 72,938 | 139,124 | 115,389 | ||||||||||||||||||
Dividends on preferred shares | (6,265 | ) | — | — | (6,653 | ) | (6,653 | ) | (6,265 | ) | ||||||||||||||
Net income available to common shareholders | $ | 109,124 | $ | 111,996 | $ | 48,761 | $ | 66,285 | $ | 132,471 | $ | 109,124 | ||||||||||||
Basic earnings per share: | ||||||||||||||||||||||||
Income from continuing operations available to common shareholders | $ | 4.47 | $ | 5.04 | $ | 2.35 | $ | 2.07 | $ | 4.86 | $ | 5.24 | ||||||||||||
Loss from discontinued operations, net of income tax | (0.16 | ) | — | — | (0.13 | ) | (0.40 | ) | (0.93 | ) | ||||||||||||||
Net income available to common shareholders | $ | 4.31 | $ | 5.04 | $ | 2.35 | $ | 1.94 | $ | 4.46 | $ | 4.31 | ||||||||||||
Diluted earnings per share: | ||||||||||||||||||||||||
Income from continuing operations available to common shareholders | $ | 4.40 | $ | 4.91 | $ | 2.25 | $ | 2.04 | $ | 4.81 | $ | 5.15 | ||||||||||||
Loss from discontinued operations, net of income tax | (0.16 | ) | — | — | (0.12 | ) | (0.39 | ) | (0.91 | ) | ||||||||||||||
Net income available to common shareholders | $ | 4.24 | $ | 4.91 | $ | 2.25 | $ | 1.92 | $ | 4.42 | $ | 4.24 | ||||||||||||
Weighted average basic shares outstanding | 25,290 | 22,220 | 20,758 | 34,212 | 29,669 | 25,290 | ||||||||||||||||||
Weighted average diluted shares outstanding | 25,763 | 22,821 | 21,660 | 34,472 | 29,993 | 25,763 | ||||||||||||||||||
Dividends declared per common share | $ | 6.75 | $ | 5.04 | $ | 2.15 | $ | 5.60 | $ | 5.60 | $ | 6.75 | ||||||||||||
See notes to consolidated financial statements.
NOVASTAR FINANCIAL, INC.
CONSOLIDATED STATEMENTSSTATEMENT OF STOCKHOLDERS’SHAREHOLDERS’ EQUITY
(dollars in thousands, except share amounts)
Preferred Stock | Common Stock | Additional Paid-in Capital | Accumulated Deficit | Accumulated Other Comprehensive Income | Other | Total Stockholders’ Equity | ||||||||||||||||||||
Balance, January 1, 2002 | $ | 43 | $ | 116 | $ | 137,802 | $ | (15,887 | ) | $ | 9,177 | $ | (1,254 | ) | $ | 129,997 | ||||||||||
Conversion of preferred stock to common, 8,571,428 shares | (43 | ) | 86 | (43 | ) | — | — | — | — | |||||||||||||||||
Acquisition of warrants, 812,731 | — | — | (9,499 | ) | — | — | — | (9,499 | ) | |||||||||||||||||
Conversion of 350,000 warrants for 421,406 shares of common stock | — | 4 | (4 | ) | — | — | — | — | ||||||||||||||||||
Forgiveness of founders’ notes receivable | — | — | — | — | — | 139 | 139 | |||||||||||||||||||
Exercise of stock options, 358,476 shares | — | 4 | 1,782 | — | — | — | 1,786 | |||||||||||||||||||
Compensation recognized under stock option plan | — | — | 3,215 | — | — | — | 3,215 | |||||||||||||||||||
Dividends on common stock ($2.15 per share) | — | — | — | (44,900 | ) | — | — | (44,900 | ) | |||||||||||||||||
Increase in common stock held in rabbi trusts | — | — | — | — | — | (911 | ) | (911 | ) | |||||||||||||||||
Increase in deferred compensation obligation | — | — | — | — | — | 911 | 911 | |||||||||||||||||||
Comprehensive income: | ||||||||||||||||||||||||||
Net income | 48,761 | — | 48,761 | |||||||||||||||||||||||
Other comprehensive income | — | 53,758 | 53,758 | |||||||||||||||||||||||
Total comprehensive income | 102,519 | |||||||||||||||||||||||||
Balance, December 31, 2002 | — | 210 | 133,253 | (12,026 | ) | 62,935 | (1,115 | ) | 183,257 | |||||||||||||||||
Forgiveness of founders’ notes receivable | — | — | — | — | — | 139 | 139 | |||||||||||||||||||
Issuance of common stock, 3,188,620 shares | — | 32 | 93,889 | — | — | — | 93,921 | |||||||||||||||||||
Exercise of stock options, 298,875 shares | — | 3 | 1,644 | — | — | — | 1,647 | |||||||||||||||||||
Compensation recognized under stock option plan | — | — | 1,310 | — | — | — | 1,310 | |||||||||||||||||||
Dividend equivalent rights (DERs) on vested options | — | — | 1,198 | (1,198 | ) | — | — | — | ||||||||||||||||||
Dividends on common stock ($5.04 per share) | — | — | — | (114,294 | ) | — | — | (114,294 | ) | |||||||||||||||||
Increase in common stock held in rabbi trusts | — | — | — | — | — | (3,145 | ) | (3,145 | ) | |||||||||||||||||
Increase in deferred compensation obligation | — | — | — | — | — | 3,145 | 3,145 | |||||||||||||||||||
Comprehensive income: | ||||||||||||||||||||||||||
Net income | 111,996 | — | 111,996 | |||||||||||||||||||||||
Other comprehensive income | — | 22,248 | 22,248 | |||||||||||||||||||||||
Total comprehensive income | 134,244 | |||||||||||||||||||||||||
Balance, December 31, 2003 | — | 245 | 231,294 | (15,522 | ) | 85,183 | (976 | ) | 300,224 | |||||||||||||||||
| Preferred Stock | Common Stock | Additional Paid-in Capital | Accumulated Deficit | Accumulated Other Comprehensive Income | Other | Total Shareholders’ Equity | |||||||||||||||||||
Balance, January 1, 2004 | $ | — | $ | 245 | $ | 231,294 | $ | (15,522 | ) | $ | 85,183 | $ | (976 | ) | $ | 300,224 | |||||||||
Forgiveness of founders’ notes receivable | — | — | — | — | — | 140 | 140 | ||||||||||||||||||
Issuance of common stock, 2,829,488 shares | — | 28 | 121,306 | — | — | — | 121,334 | ||||||||||||||||||
Issuance of preferred stock, 2,990,000 shares | 30 | — | 72,089 | — | — | — | 72,119 | ||||||||||||||||||
Issuance of stock under stock compensation plans, 433,181 shares | — | 4 | 3,811 | — | — | — | 3,815 | ||||||||||||||||||
Compensation recognized under stock compensation plans | — | — | 1,810 | — | — | — | 1,810 | ||||||||||||||||||
Dividend equivalent rights (DERs) on vested options | — | — | 1,900 | (1,900 | ) | — | — | — | |||||||||||||||||
Dividends on common stock ($6.75 per share) | — | — | — | (177,056 | ) | — | — | (177,056 | ) | ||||||||||||||||
Dividends on preferred stock ($2.11 per share) | — | — | — | (6,265 | ) | — | — | (6,265 | ) | ||||||||||||||||
Tax benefit derived from stock compensation plans | — | — | 897 | — | — | — | 897 | ||||||||||||||||||
Comprehensive income: | |||||||||||||||||||||||||
Net income | 115,389 | 115,389 | |||||||||||||||||||||||
Other comprehensive loss | (6,063 | ) | (6,063 | ) | |||||||||||||||||||||
Total comprehensive income | 109,326 | ||||||||||||||||||||||||
Balance, December 31, 2004 | $ | 30 | $ | 277 | $ | 433,107 | $ | (85,354 | ) | $ | 79,120 | $ | (836 | ) | $ | 426,344 | |||||||||
Continued
Preferred Stock Common Stock Additional Paid-in Capital Total Stockholders’ Equity Forgiveness of founders’ notes receivable Issuance of common stock, 2,829,488 shares Issuance of preferred stock, 2,990,000 shares Issuance of stock under stock compensation plans, 433,181 shares Compensation recognized under stock compensation plans Dividend equivalent rights (DERs) on vested options Dividends on common stock ($6.75 per share) Dividends on preferred stock ($2.11 per share) Tax benefit derived from stock compensation plans Increase in common stock held in rabbi trusts Increase in deferred compensation obligation Comprehensive income: Net income Other comprehensive loss Total comprehensive income Balance, December 31, 2004 Balance, January 1, 2005 Forgiveness of founders’ notes receivable Issuance of common stock, 4,334,320 shares Issuance of stock under stock compensation plans, 148,797 shares Compensation recognized under stock compensation plans Dividend equivalent rights (DERs) on vested options Dividends on common stock ($5.60 per share) Dividends on preferred stock ($2.23 per share) Other Comprehensive income: Net income Other comprehensive income Total comprehensive income Balance, December 31, 2005 Accumulated
Deficit Accumulated
Other
Comprehensive
Income Other — — — — — 140 140 — 28 121,306 — — — 121,334 30 — 72,089 — — — 72,119 — 4 3,811 — — — 3,815 — — 1,810 — — — 1,810 — — 1,900 (1,900 ) — — — — — — (177,056 ) — — (177,056 ) — — — (6,265 ) — — (6,265 ) — — 897 — — — 897 — — — — — (2,290 ) (2,290 ) — — — — — 2,290 2,290 115,389 — 115,389 — (6,063 ) (6,063 ) 109,326 $ 30 $ 277 $ 433,107 $ (85,354 ) $ 79,120 $ (836 ) $ 426,344 Concluded Preferred
Stock Common
Stock Additional
Paid-in
Capital Accumulated
Deficit Accumulated
Other
Comprehensive
Income Other Total
Shareholders’
Equity $ 30 $ 277 $ 433,107 $ (85,354 ) $ 79,120 $ (836 ) $ 426,344 — — — — — 140 140 — 43 145,313 — — — 145,356 — 2 921 — — — 923 — — 2,226 — — — 2,226 — — 304 (4,369 ) — — (4,065 ) — — — (171,302 ) — — (171,302 ) — — — (6,653 ) — — (6,653 ) — — (291 ) — — (291 ) 139,124 139,124 32,418 32,418 171,542 $ 30 $ 322 $ 581,580 $ (128,554 ) $ 111,538 $ (696 ) $ 564,220
See notes to consolidated financial statements.Continued
Balance, January 1, 2006 Forgiveness of founders’ notes receivable Issuance of common stock, 4,938,200 shares Issuance of stock under stock compensation plans, 130,444 shares Compensation recognized under stock compensation plans Dividend equivalent rights (DERs) on vested options Dividends on common stock ($5.60 per share) Dividends on preferred stock ($2.23 per share) Common stock repurchased, 493 shares Tax benefit derived from capitalization of affiliate Other Comprehensive income: Net income Other comprehensive loss Total comprehensive loss Balance, December 31, 2006 Preferred
Stock Common
Stock Additional
Paid-in
Capital Accumulated
Deficit Accumulated
Other
Comprehensive
Income Other Total
Shareholders’
Equity $ 30 $ 322 $ 581,580 $ (128,554 ) $ 111,538 $ (696 ) $ 564,220 — — — — — 139 139 — 50 148,741 — — — 148,791 — 1 906 — — — 907 — — 2,548 — — — 2,548 — — 825 (3,084 ) — — (2,259 ) — — — �� (198,219 ) — — (198,219 ) — — — (6,653 ) — — (6,653 ) — — (17 ) — — — (17 ) — — 7,173 — — — 7,173 — — (8 ) — — — (8 ) 72,938 72,938 (74,990 ) (74,990 ) (2,052 ) $ 30 $ 373 $ 741,748 $ (263,572 ) $ 36,548 $ (557 ) $ 514,570
| See notes to consolidated financial statements | Concluded |
NOVASTAR FINANCIAL, INC.
CONSOLIDATED STATEMENTS OF CASH FLOWS
(dollars in thousands)
| For the Year Ended December 31, | For the Year Ended December 31, | |||||||||||||||||||||||
| 2004 | 2003 | 2002 | 2006 | 2005 | 2004 | |||||||||||||||||||
Cash flows from operating activities: | ||||||||||||||||||||||||
Net Income | $ | 72,938 | $ | 139,124 | $ | 115,389 | ||||||||||||||||||
Loss from discontinued operations | 4,267 | 11,703 | 23,553 | |||||||||||||||||||||
Income from continuing operations | $ | 119,497 | $ | 111,996 | $ | 48,761 | 77,205 | 150,827 | 138,942 | |||||||||||||||
Adjustments to reconcile net income to net cash provided by (used in) operating activities: | ||||||||||||||||||||||||
Adjustments to reconcile net income to net cash used in operating activities: | ||||||||||||||||||||||||
Amortization of mortgage servicing rights | 16,934 | 8,995 | 4,609 | 33,639 | 28,364 | 16,934 | ||||||||||||||||||
Retention of mortgage servicing rights | (39,474 | ) | (43,476 | ) | (39,259 | ) | ||||||||||||||||||
Impairment on mortgage securities – available-for-sale | 15,902 | — | — | 30,690 | 17,619 | 15,902 | ||||||||||||||||||
Losses on derivative instruments | 8,905 | 30,837 | 36,841 | |||||||||||||||||||||
(Gains) losses on derivative instruments | (11,998 | ) | (18,155 | ) | 8,905 | |||||||||||||||||||
Depreciation expense | 6,090 | 3,872 | 1,203 | 7,266 | 7,433 | 6,090 | ||||||||||||||||||
Amortization of deferred debt issuance costs | 5,036 | 1,100 | 172 | 3,408 | 5,683 | 5,036 | ||||||||||||||||||
Compensation recognized under stock compensation plans | 1,810 | 1,310 | 3,215 | 2,548 | 2,226 | 1,810 | ||||||||||||||||||
Tax benefit derived from stock compensation plans | 897 | — | — | |||||||||||||||||||||
Credit losses (recoveries) | 726 | (389 | ) | (432 | ) | |||||||||||||||||||
Provision for credit losses | 30,131 | 1,038 | 726 | |||||||||||||||||||||
Amortization of premiums on mortgage loans | 699 | 1,120 | 1,930 | 10,409 | 376 | 699 | ||||||||||||||||||
Interest capitalized on loans held-in-portfolio | (29,541 | ) | — | — | ||||||||||||||||||||
Forgiveness of founders’ promissory notes | 140 | 139 | 139 | 139 | 140 | 140 | ||||||||||||||||||
Provision for deferred income taxes | (1,322 | ) | (5,848 | ) | (4,652 | ) | (8,589 | ) | (12,727 | ) | (1,322 | ) | ||||||||||||
Accretion of available-for-sale securities | (100,666 | ) | (78,097 | ) | (56,481 | ) | ||||||||||||||||||
Accretion of available-for-sale and trading securities | (158,984 | ) | (172,019 | ) | (100,666 | ) | ||||||||||||||||||
Gains on sales of mortgage assets | (2,275 | ) | (21,672 | ) | (105,691 | ) | ||||||||||||||||||
Losses (gains) on trading securities | 3,192 | (549 | ) | — | ||||||||||||||||||||
Originations and purchases of mortgage loans held-for-sale | (8,560,314 | ) | (6,071,042 | ) | (2,811,315 | ) | (11,275,926 | ) | (9,379,682 | ) | (8,539,944 | ) | ||||||||||||
Repayments of mortgage loans held-for-sale | 27,979 | 18,474 | 10,943 | |||||||||||||||||||||
Proceeds from repayments of mortgage loans held-for-sale | 77,490 | 9,908 | 27,979 | |||||||||||||||||||||
Repurchase of mortgage loans from securitization trusts | (183,814 | ) | (6,784 | ) | — | |||||||||||||||||||
Proceeds from sale of mortgage loans held-for-sale to third parties | 64,476 | 966,537 | 394,240 | 2,260,845 | 1,176,518 | 64,476 | ||||||||||||||||||
Proceeds from sale of mortgage loans held-for-sale in securitizations | 8,173,829 | 5,207,525 | 1,520,712 | 5,922,975 | 7,428,063 | 8,173,829 | ||||||||||||||||||
Gains on sales of mortgage assets | (144,950 | ) | (144,005 | ) | (53,305 | ) | ||||||||||||||||||
Purchase of mortgage securities - trading | (143,153 | ) | — | — | (205,078 | ) | — | (143,153 | ) | |||||||||||||||
Proceeds from paydowns of mortgage securities - trading | 9,436 | — | — | |||||||||||||||||||||
Proceeds from sale of mortgage securities - trading | 11,223 | 143,153 | — | |||||||||||||||||||||
Changes in: | ||||||||||||||||||||||||
Servicing related advances | (707 | ) | (6,247 | ) | (3,173 | ) | (13,890 | ) | (6,752 | ) | (707 | ) | ||||||||||||
Accrued interest receivable | (69,475 | ) | (35,296 | ) | (23,753 | ) | ||||||||||||||||||
Derivative instruments, net | 13,553 | (9,577 | ) | (41,866 | ) | (392 | ) | 2,509 | 13,553 | |||||||||||||||
Other assets | (43,753 | ) | (25,074 | ) | 3,093 | (24,420 | ) | (9,809 | ) | (13,740 | ) | |||||||||||||
Accounts payable and other liabilities | (24,204 | ) | 30,422 | (2,936 | ) | 30,154 | 19,572 | (24,692 | ) | |||||||||||||||
Net cash provided by (used in) operating activities from continuing operations | (562,596 | ) | 42,048 | (948,302 | ) | |||||||||||||||||||
Net cash used in operating activities from discontinued operations | (3,110 | ) | — | — | ||||||||||||||||||||
Net cash used in operating activities from continuing operations | (3,513,106 | ) | (713,492 | ) | (517,906 | ) | ||||||||||||||||||
Net cash provided by (used in) operating activities from discontinued operations | 2,196 | (13,689 | ) | (47,800 | ) | |||||||||||||||||||
Net cash provided by (used in) operating activities | (565,706 | ) | 42,048 | (948,302 | ) | |||||||||||||||||||
Net cash used in operating activities | (3,510,910 | ) | (727,181 | ) | (565,706 | ) | ||||||||||||||||||
Cash flows from investing activities: | ||||||||||||||||||||||||
Proceeds from paydowns on available-for-sale securities | 346,558 | 179,317 | 100,071 | |||||||||||||||||||||
Mortgage loan repayments—held-in-portfolio | 31,781 | 49,101 | 65,505 | |||||||||||||||||||||
Proceeds from paydowns on mortgage securities - available-for-sale | 327,218 | 453,750 | 346,558 | |||||||||||||||||||||
Purchase of mortgage securities – available-for-sale | (1,922 | ) | — | — | ||||||||||||||||||||
Proceeds from repayments of mortgage loans held-in-portfolio | 551,796 | 16,673 | 31,781 | |||||||||||||||||||||
Proceeds from sales of assets acquired through foreclosure | 4,905 | 6,719 | 14,876 | 2,341 | 1,909 | 4,905 | ||||||||||||||||||
Acquisition of retail branches | (60,105 | ) | — | — | ||||||||||||||||||||
Purchases of property and equipment | (7,029 | ) | (13,000 | ) | (5,280 | ) | (10,021 | ) | (5,315 | ) | (7,029 | ) | ||||||||||||
Net cash provided by investing activities | 376,215 | 222,137 | 175,172 | 809,307 | 467,017 | 376,215 | ||||||||||||||||||
Cash flows from financing activities: | ||||||||||||||||||||||||
Proceeds from issuance of asset-backed bonds, net of debt issuance costs | 506,745 | 52,271 | 66,906 | |||||||||||||||||||||
Payments on asset-backed bonds | (254,867 | ) | (120,083 | ) | (86,434 | ) | ||||||||||||||||||
Proceeds from issuance of capital stock and exercise of equity instruments, net of offering costs | 193,615 | 94,321 | 1,786 | |||||||||||||||||||||
Change in short-term borrowings | 32,992 | (153,000 | ) | 882,186 | ||||||||||||||||||||
Repurchase of warrants | — | — | (9,499 | ) | ||||||||||||||||||||
Dividends paid on preferred stock | (6,265 | ) | — | (2,014 | ) | |||||||||||||||||||
Dividends paid on common stock | (132,346 | ) | (99,256 | ) | (30,876 | ) | ||||||||||||||||||
Net cash provided by (used in) financing activities | 339,874 | (225,747 | ) | 822,055 | ||||||||||||||||||||
Net increase in cash and cash equivalents | 150,383 | 38,438 | 48,925 | |||||||||||||||||||||
Cash and cash equivalents, beginning of year | 118,180 | 79,742 | 30,817 | |||||||||||||||||||||
Cash and cash equivalents, end of year | $ | 268,563 | $ | 118,180 | $ | 79,742 | ||||||||||||||||||
See notes to consolidated financial statements.Continued
Cash flows from financing activities: Proceeds from issuance of asset-backed bonds, net of debt issuance costs Payments on asset-backed bonds Payments on asset-backed bonds due to exercise of redemption provisions Proceeds from issuance of capital stock and exercise of equity instruments, net of offering costs Net change in short-term borrowings Proceeds from the issuance of junior subordinated debentures Repurchase of common stock Dividends paid on vested stock options Dividends paid on preferred stock Dividends paid on common stock Net cash provided by financing activities from continuing operations Net cash (used in) provided by financing activities from discontinued operations Net cash provided by financing activities Net (decrease) increase in cash and cash equivalents Cash and cash equivalents, beginning of year Cash and cash equivalents, end of year For the Year Ended December 31, 2006 2005 2004 2,505,457 128,921 506,745 (565,188 ) (363,861 ) (254,867 ) (18,788 ) (7,822 ) — 143,478 142,114 193,615 741,082 499,715 53,761 33,917 48,428 — (17 ) — — (2,725 ) (2,113 ) — (4,990 ) (6,653 ) (6,265 ) (237,352 ) (195,760 ) (132,346 ) 2,594,874 242,969 360,643 (7,443 ) 13,326 (20,769 ) 2,587,431 256,295 339,874 (114,172 ) (3,869 ) 150,383 264,694 268,563 118,180 $ 150,522 $ 264,694 $ 268,563
| See notes to consolidated financial statements. | Concluded |
NOVASTAR FINANCIAL, INC.
NOTES TO CONSOLIDATED FINANCIAL STATEMENTS
Note 1. Summary of Significant Accounting and Reporting Policies
Description of Operations NovaStar Financial, Inc. and subsidiaries (the “Company”) operates as a specialty finance company that originates, purchases, securitizes, sells, invests in and services residential nonconforming loans.loans and mortgage backed securities. The Company offers a wide range of mortgage loan products to borrowers, commonly referred to as “nonconforming borrowers,” who generally do not satisfy the credit, collateral, documentation or other underwriting standards prescribed by conventional mortgage lenders and loan buyers, including United States of AmericaU.S. government-sponsored entities such as Fannie Mae or Freddie Mac. The Company retains significant interests in the nonconforming loans originated and purchased through their mortgage securities investment portfolio. TheHistorically, the Company serviceshas serviced all of the loans in which they retain interests in through their servicing platform, in order to better manage the credit performance of those loans.platform.
Financial Statement PresentationThe Company’s consolidated financial statements have been prepared in conformity with accounting principles generally accepted in the United States of America and prevailing practices within the financial services industry. The preparation of financial statements requires management to make estimates and assumptions that affect the reported amounts of assets and liabilities at the date of the financial statements and the reported amounts of income and expense during the period. The Company uses estimates and employs the judgments of management in determining the amount of its allowance for credit losses, amortizing premiums or accreting discounts on its mortgage assets, amortizing mortgage servicing rights and establishing the fair value of its mortgage securities, reserve for losses on third party sales, derivative instruments and mortgage servicing rights and estimating appropriate accrual rates on mortgage securities – available-for-sale. While the consolidated financial statements and footnotes reflect the best estimates and judgments of management at the time, actual results could differ significantly from those estimates. For example, it is possible that credit losses or prepayments could rise to levels that would adversely affect profitability if those levels were sustained for more than brief periods.
The consolidated financial statements of the Company include the accounts of all wholly-owned subsidiaries. Intercompany accounts and transactions have been eliminated during consolidation.
Cash and Cash Equivalents The Company considers investments with original maturities of three months or less at the date of purchase to be cash equivalents. The Company maintains cash balances at several major financial institutions in the United States. Accounts at each institution are secured by the Federal Deposit Insurance Corporation up to $100,000. At December 31, 2006 and 2005, 93% and 96% of the Company’s cash and cash equivalents were with one institution. Uninsured balances with this institution aggregated $139.2 million and $253.0 million at December 31, 2006 and 2005, respectively.
Mortgage LoansMortgage loans include loans originated by the Company and acquired from other originators. Mortgage loans are recorded net of deferred loan origination fees and associated direct costs and are stated at amortized cost. Mortgage loan origination fees and associated direct mortgage loan origination costs on mortgage loans held-in-portfolio are deferred and recognized over the estimated life of the loan as an adjustment to yield using the level yield method. The Company uses actual and estimated cash flows, which consider the actual and future estimated prepayments of the loans, to derive an effective level yield. Mortgage loan origination fees and direct mortgage loan origination costs on mortgage loans held-for-sale are deferred until the related loans are sold. Mortgage loans held-for-sale are carried at the lower of cost or market determined on an aggregate basis.
Interest is recognized as revenue when earned according to the terms of the mortgage loans and when, in the opinion of management, it is collectible. For all mortgage loans held-for-sale and only mortgage loans held-in-portfolio whichthat do not carry mortgage insurance, the accrual of interest on loans is discontinued when, in management’s opinion, the interest is not collectible in the normal course of business, but in no case beyond when a loan becomes ninety90 days delinquent. For mortgage loans held-in-portfolio, whichthat do carry mortgage insurance, the accrual of interest is only discontinued when in management’s opinion, the interest is not collectible. Interest collected on non-accrual loans is recognized as income upon receipt.
The mortgage loan portfolio is collectively evaluated for impairment as the individual loans are smaller-balance and are homogeneous in nature. For mortgage loans held-in-portfolio, the Company maintains an allowance for credit losses inherent in the portfolio at the balance sheet date. The allowance is based upon the assessment by management of various factors affecting its mortgage loan portfolio, including current economic conditions, the makeup of the portfolio based on credit grade, loan-to-value, delinquency status, historical credit losses, whether the Company purchased mortgage insurance and other factors deemed to warrant consideration. The allowance is maintained through ongoing adjustments to operating income. The assumptions used by management regarding key economic indicators are highly uncertain and involve a great deal of judgment.
An internally developed migration analysis is the primary tool used in analyzing the adequacy of the allowance for credit losses. This tool takes into consideration historical information regarding foreclosure and loss severity experience and applies that information to the portfolio at the reporting date. Management also takes into consideration the use of mortgage insurance as a method of managing credit risk. The Company uses contractual termspays mortgage insurance premiums on loans maintained on the consolidated balance sheet and includes the cost of mortgage insurance in determining past duethe consolidated statements of income.
Management’s estimate of expected losses could increase if the actual loss experience is different than originally estimated. In addition, the estimate of expected losses could increase if economic factors change the value that can be reasonably expected to obtain from the sale of the property. If actual losses increase, or delinquency status of loans.if values reasonably expected to be obtained from property sales decrease, the provision for losses would increase.
The servicing agreements the Company executes for loans it has securitized include a removal of accounts provision which gives it the right, not the obligation, to repurchase mortgage loans from the trust. The removal of accounts provision can be exercised for loans that are 90 days to 119 days delinquent. The Company records the mortgage loans subject to the removal of accounts provision in mortgage loans held-for-sale at fair value.
Mortgage Securities – Available-for-SaleMortgage securities – available-for-sale represent beneficial interests the Company retains in securitization and resecuritization transactions which include residual interests (the “residual securities”) and subordinated primary securities (the “subordinated securities”). The residual securities include interest-only mortgage securities, prepayment penalty bonds and overcollateralization bonds. The subordinated securities represent investment-grade and non-investment grade rated bonds which are senior to the residual interests but subordinated to the bonds sold to third party investors. Mortgage securities classified as available-for-sale are reported at their estimated fair value with unrealized gains and losses reported in accumulated other comprehensive income. To the extent that the cost basis of mortgage securities exceeds the fair value and the unrealized loss is considered to be other than temporary, an impairment charge is recognized and the amount recorded in accumulated other comprehensive income or loss is reclassified to earnings as a realized loss. The specific identification method was used in computing realized gains or losses.
over-collateralization bonds and other subordinated securities. Interest-only mortgage securities represent the contractual right to receive excess interest cash flows from a pool of securitized mortgage loans. Interest payments received by the independent trust are first applied to the principal and interest bonds (held by outside investors), servicing fees and administrative fees. The excess, if any, is remitted to the Company related to its ownership of the interest-only mortgage security. Prepayment penalty bonds give the holder the contractual right to receive prepayment penalties collected by the independent trust on the underlying mortgage loans. Overcollateralization bonds represent the contractual right to excess principal payments resulting from over collateralization of the obligations of the trust.
SubordinatedThe subordinated securities retained by the Company in resecuritizations representits securitization transactions have a stated principal amount and interest rate. The performance of the contractual rightsecurities is dependent upon the performance of the underlying pool of securitized mortgage loans. The interest rates these securities earn are variable and are subject to an available funds cap as well as a maximum rate cap. The securities receive the remaining cash flows from the trust after the obligationsprincipal payments in accordance with a payment priority which is designed to maintain specified levels of subordination to the outside bond holders have been satisfied. When those obligations have been satisfied,senior bonds within the trust returnsrespective securitization trust. The Company accounts for the transferred securities tobased on EITF 99-20 which prescribes the subordinated interest holders.
Mortgage securities classified as available for sale are reported at their estimated fair value with unrealized gains and losses reported in accumulated other comprehensive income. The specific identification method was used in computing realized gains or losses.effective yield method.
As previously described, mortgage securities available-for-sale represent the retained beneficial interests in certain components of the cash flows of the underlying mortgage loans or mortgage securities transferred to securitization trusts. As payments are received on both the residual and subordinated securities, the payments are applied to the cost basis of the related mortgage related security.securities. Each period, the accretable yield for each mortgage security is evaluated and, to the extent there has been a change in the estimated cash flows, it is adjusted and applied prospectively. The estimated cash flows change as management’s assumptions for credit losses, borrower prepayments and interest rates are updated. The assumptions are established using proprietary models the Company has developed. The accretable yield is recorded as interest income with a corresponding increase to the cost basis of the mortgage security.
At each reporting period subsequent toManagement believes the best estimate of the initial valuationvalue of the retainedresidual securities it retains in a whole loan securitization is derived from the fairmarket value of mortgagethe pooled loans. The initial value of the loans is estimated based on the expected open market sales price of a similar pool (“the whole loan price methodology”). In open market transactions, the purchaser has the right to reject loans at its discretion. In a loan securitization, loans cannot generally be rejected. As a result, management adjusts the market price for loans to compensate for the estimated value of rejected loans. The market price of the securities retained is derived by deducting the net proceeds received in the securitization (i.e. the economic value of the loans transferred) from the estimated adjusted market price for the entire pool of the loans.
The Company uses the whole loan price methodology when it feels enough relevant information is available through its internal bidding processes for purchasing similar pools of loans in the market. When such information is not available, the Company estimates the initial value of residual securities retained in a whole loan securitization based on the present value of future expected cash flows to be received.received (“the discount rate methodology”). Management’s best estimate of key assumptions, including credit losses, prepayment speeds, the market discount rates and forward yield curves commensurate with the risks involved, are used in estimating future cash flows. To
For purposes of valuing the extent thatretained residual securities at each reporting period subsequent to the cost basis of mortgage securities exceedsinitial valuation, the Company uses the discount rate methodology.
The Company estimates initial and subsequent fair value andfor the unrealized loss is considered to be other than temporary, an impairment charge is recognized and the amount recorded in accumulated other comprehensive income or loss is reclassified to earnings as a realized loss.subordinated securities based on quoted market prices obtained from brokers.
Mortgage Securities - TradingMortgage securities – trading consist of mortgage securities purchased by the Company withas well as retained by the principal intent to sellCompany in the near term. Theseits securitization transactions. Trading securities are recorded at fair value with gains and losses, realized and unrealized, included in earnings. The Company uses the specific identification method in computing realized gains or losses.
As described underMortgage Securities – Available-for-Sale, the Company retains subordinated securities in its securitization transactions which have a stated principal amount and interest rate and have been retained at a market discount from the stated principal amount. In addition the Company has purchased subordinated mortgage backed securities from other issuers. The fairperformance of the securities is dependent upon the performance of the underlying pool of securitized mortgage loans. The interest rates these securities earn are variable and are subject to an available funds cap as well as a maximum rate cap. The securities receive principal payments in accordance with a payment priority which is designed to maintain specified levels of subordination to the senior bonds within the respective securitization trust. The Company accounts for the securities based on the effective yield method. Fair value is estimated using quoted market prices.
Mortgage Servicing RightsMortgage servicing rights are recorded at allocated cost based upon the relative fair values of the transferred loans and the servicing rights. Mortgage servicing rights are amortized in proportion to and over the projected net servicing revenues. Periodically, the Company evaluates the carrying value of mortgage servicing rights based on their estimated fair value. If the estimated fair value, using a discounted cash flow methodology, is less than the carrying amount of the mortgage servicing rights, the mortgage servicing rights are written down to the amount of the estimated fair value. For purposes of evaluating and measuring impairment of mortgage servicing rights the Company stratifies the mortgage servicing rights based on their predominant risk characteristics. The significant risk characteristic considered by the Company is period of origination. The mortgage loans underlying the mortgage servicing rights are pools of homogenous, nonconforming residential loans.
Servicing Related AdvancesThe Company advances funds on behalf of borrowers for taxes, insurance and other customer service functions. These advances are routinely assessed for collectibility and any uncollectible advances are appropriately charged to earnings.
Real Estate OwnedReal estate owned, which consists of residential real estate acquired in satisfaction of loans, is carried at the lower of cost or estimated fair value less estimated selling costs. Adjustments to the loan carrying value required at time of foreclosure are charged against the allowance for credit losses. Costs related to the development of real estate are capitalized and those related to holding the property are expensed. Losses or gains from the ultimate disposition of real estate owned are charged or credited to operating income.
Derivative Instruments, netThe Company uses derivative instruments with the objective of hedging interest rate risk. Interest rates on the Company’s liabilities typically adjust more frequently than interest rates on the Company’s assets. Derivative instruments are recorded at their fair value with hedge ineffectiveness recognized in earnings.on the consolidated balance sheet. For derivative instruments that qualify for hedge accounting, any changes in fair value of derivative instruments related to hedge effectiveness are reported in accumulated other comprehensive income. Gains and losses reported as a component of accumulated other comprehensive income are reclassified into earnings as the forecasted transactions occur. Changes in fair value of derivative instruments related to hedge ineffectiveness and non-hedge activity are recorded as adjustments to earnings.earnings through the gains (losses) on derivative instruments line item of the Company’s consolidated income statement. For those derivative instruments that do not qualify for hedge accounting, changes in the fair value of the instruments are recorded as adjustments to earnings.earnings through the gains (losses) on derivative instruments line item of the Company’s consolidated income statement. The fair value of the Company’s derivative instruments, along with any margin accounts associated with the contracts, are included in derivative instruments, net.net on the Company’s balance sheet.
Property and Equipment, netLeasehold improvements, furniture and fixtures and office and computer equipment are stated at cost less accumulated depreciation. Depreciation is computed using the straight-line method over the estimated useful lives of the related assets. The estimated useful lives of the assets are as follows:
Leasehold improvements | 5 years | (A) | |
Furniture and fixtures | 5 years | ||
Office and computer equipment |
| (A) | Lesser of 5 years or remaining lease term. |
Maintenance and repairs are charged to expense. Major renewals and improvements are capitalized. Gains and losses on dispositions are credited or charged to earnings as incurred.
The principal balance of the Company’s property and equipment was $41.8 million and $29.8 million as of December 31, 2006 and 2005, respectively. The accumulated depreciation recorded on the property and equipment was $23.7 million and $16.7 million as of December 31, 2006 and 2005, respectively.
Warehouse Notes Receivable Warehouse notes receivable represent outstanding warehouse lines of credit the Company provides to approved borrowers. The lines of credit are used by the borrowers to originate mortgage loans. The notes receivable are collateralized by the mortgage loans originated by the Company’s borrowers and are recorded at amortized cost. The Company recognizes interest income in accordance with the terms of agreement with the borrower. The accrual of interest is discontinued when, in management’s opinion, the interest is not collectible in the normal course of business.
Due to Securitization TrustsDue to securitization trusts represents the fair value of the mortgage loans the Company has the right to repurchase from the securitization trusts. The servicing agreements the Company executes for loans it has securitized include a removal of accounts provision which gives it the right, not the obligation, to repurchase mortgage loans from the trust. The removal of accounts provision can be exercised for loans that are 90 days to 119 days delinquent. Upon exercise of the call options, the related obligation to the trusts is removed from the Company’s balance sheet.
Premiums for Mortgage Loan InsuranceThe Company uses lender paid mortgage insurance to mitigate the risk of loss on loans that are originated. For those loans held-in-portfolio and loans held-for-sale, the premiums for mortgage insurance are expensed by the Company as the costcosts of the premiums are incurred. For those loans sold in securitization transactions accounted for as a sale, the independent trust assumes the obligation to pay the premiums and obtains the right to receive insurance proceeds.
Transfers of Assets A transfer of mortgage loans or mortgage securities – available-for-sale in which the Company surrenders control over the financial assets is accounted for as a sale. When the Company retains control over transferred mortgage loans or mortgage securities, – available-for-sale, the transaction is accounted for as a secured borrowing. When the Company sells mortgage loans or mortgage securities – available-for-sale in securitization and resecuritization transactions, it may retain one or more bond classes and servicing rights in the securitization. Gains and losses on the assets transferred are recognized based on the carrying amount of the financial assets involved in the transfer, allocated between the assets transferred and the retained interests based on their relative fair value at the date of transfer.
Management believes the best estimate of the initial value of the residual securities it retains in a whole loan securitization is derived from the market value of the pooled loans. The initial value of the loans is estimated based on the expected open market saleswhole loan price of a similar pool.methodology. In open market transactions, the purchaser has the right to reject loans at its discretion. In a loan securitization, loans cannot generally be rejected. As a result, management adjusts the market price for loans to compensate for the estimated value of rejected loans. The market price of the securities retained is derived by deducting the net proceeds received in the securitization (i.e. the economic value of the loans transferred) from the estimated adjusted market price for the entire pool of the loans.
An implied yield (discount rate) is calculated based onderived by taking the initial value derived above and using projected cash flows generated using assumptions for prepayments, expected credit losses and interest rates. We ensurerates and then solving for the discount rate required to present value the cash flows back to the initial value derived above. The Company then ascertains the resulting implied yielddiscount rate is commensurate with current market conditions. Additionally, this yieldthe initial discount rate serves as the initial accretable yield used to recognize income on the securities.
The Company uses the whole loan price methodology when it feels enough relevant information is available through its internal bidding processes for purchasing similar pools of loans in the market. When such information is not available, the Company estimates fairthe initial value for theof residual securities it retainsretained in a resecuritization transactionwhole loan securitization based on the present value of future expected cash flows estimated using management’sdiscount rate methodology. Management’s best estimate of the key assumptions, including credit losses, prepayment speeds, market discount rates and forward yield curves and discount rates commensurate with the risks involved.involved, are used in estimating future cash flows.
For purposes of valuing the retained residual securities at each reporting period subsequent to the initial valuation, the Company uses the discount rate methodology.
For purposes of valuing the Company’s securities, it is important to know that the Company also transfers interest rate agreements to the trust with the objective of reducing interest rate risk within the trust. During the period before loans are transferred in a securitization transaction the Company enters into interest rate swap or cap agreements. Certain of these interest rate agreements are then transferred into the trust at the time of securitization. Therefore, the trust assumes the obligation to make payments and obtains the right to receive payments under these agreements.
A significant factor in valuing the residual securities is the portion of the underlying mortgage loan collateral that is covered by mortgage insurance. At the time of a securitization transaction, the trust legally assumes the responsibility to pay the mortgage insurance premiums associated with the loans transferred and the rights to receive claims for credit losses. Therefore, the Company has no obligation to pay these insurance premiums. The cost of the insurance is paid by the trust from proceeds the trust receives from the underlying collateral. This information is significant for valuation as the mortgage insurance significantly reduces the severity of credit losses incurred by the trust. Mortgage insurance claims on loans where a defect occurred in the loan origination process will not be paid by the mortgage insurer. The assumptions the Company uses to value its residual securities consider this risk.
The following is a description of the methods used by the Company to transfer assets, including the related accounting treatment under each method:
| • | Whole Loan Sales Whole loan sales represent loans sold to third parties with servicing released. Gains and losses on whole loan sales are recognized in the period the sale occurs and the Company has determined that the criteria for sales treatment has been achieved as it has surrendered control over the assets transferred. The Company generally has an obligation to repurchase whole loans sold in circumstances in which the borrower fails to make the first |
| • | Loans and Securities Sold Under Agreements to Repurchase (Repurchase Agreements)Repurchase agreements represent legal sales of loans or mortgage securities |
securities – available-for-sale at a later date. Repurchase agreements are accounted for as secured borrowings because the Company has not surrendered control of the transferred assets as it is both entitled and obligated to repurchase the transferred assets prior to their maturity.
| • | Securitization TransactionsThe Company regularly securitizes mortgage loans by transferring mortgage loans to independent trusts which issue securities to investors. The securities are collateralized by the mortgage loans transferred into the independent trusts. The Company retains interests in some of the securities issued by the trust. Certain of the securitization agreements require the Company to repurchase loans that are found to have legal deficiencies subsequent to the date of transfer. The Company is also required to buy back any loan for which the borrower converts from an adjustable rate to a fixed rate. The fair values of these recourse obligations are recorded upon the transfers of the mortgage loans and on an ongoing basis. The Company also has the right, but not the obligation, to acquire loans when they are 90 to 119 days delinquent and at the time a property is liquidated. As discussed above, the accounting treatment for transfers of assets upon securitization depends on whether or not the Company has retained control over the transferred assets. The Company records an asset and a liability on the balance sheet for the aggregate fair value of delinquent loans that it has a right to call as of the balance sheet |
| • | Resecuritization Transactions The Company also engages in resecuritization transactions. A resecuritization is the transfer or sale of mortgage securities |
Reserve for Losses – Loans Sold to Third PartiesThe Company maintains a reserve for the representation and warranty liabilities related to loans sold to third parties, and for the contractual obligation to rebate a portion of any premium paid by a purchaser when a borrower prepays a sold loan within an agreed period. The reserve, which is recorded as a liability on the consolidated balance sheet, is established when loans are sold, and is calculated as the estimated fair value of losses reasonably estimated to occur over the life of the loan. Management estimates inherent losses based upon historical loss trends and frequency and severity of losses for similar loan product sales. The
adequacy of this reserve is evaluated and adjusted as required. The provision for losses recognized at the sale date is included in the consolidated statements of income as a reduction of gains on sales of mortgage assets.
Fee Income The Company receives fee income from several sources. The following describes significant fee income sources and the related accounting treatment:
| • | Broker FeesBroker fees are paid by other lenders for placing loans with third-party investors (lenders) and are based on negotiated rates with each lender to whom the Company brokers loans. Revenue is recognized upon loan origination and delivery. |
| • | Loan Origination Fees Loan origination fees represent fees paid to the Company by borrowers and are associated with the origination of mortgage loans. Loan origination fees are determined based on the type and amount of loans originated. Loan origination fees and direct origination costs on mortgage loans held-in-portfolio are deferred and recognized over the life of the loan using the level yield method. Loan origination fees and direct origination costs on mortgage loans held-for-sale are deferred and considered as part of the carrying value of the loan when sold. |
| • | Service Fee Income Service fees are paid to the Company by either the investor on mortgage loans serviced or the borrower. Fees paid by investors on loans serviced are determined as a percentage of the principal collected for the loans serviced and are recognized in the period in which payments on the loans are received. Fees paid by borrowers on loans serviced are considered ancillary fees related to loan servicing and include late fees and processing |
Stock-Based Compensation Prior to 2003,At December 31, 2006, the Company had one stock-based employee compensation plan, which is described more fully in Note 20. From January 1, 2004 through December 31, 2005, the Company accounted for its stock-based compensationthe plan usingunder the recognition and measurement principlesprovisions of Accounting Principles Board (APB) OpinionFASB Statement No. 25,123 (“SFAS 123”), “Accounting for Stock Issued to EmployeesStock-Based Compensation. and related interpretations. The Company accounted for stock options based on the specific terms of the options granted. Options with variable terms, including those options for which the strike price has been adjusted and options issued by the Company with attached dividend equivalent rights, resulted in adjustments to compensation expense to the extent the market price of the common stock changed. No expense was recognized for options with fixed terms.
During the fourth quarter of 2003,” Effective January 1, 2006, the Company adopted the fair value recognition provisions of FASB Statement No. 123(R) (“SFAS 123(R)”), “Share-Based Payment”, using the modified-prospective-transition method. Because the Company was applying the provisions of Financial Accounting Standards (SFAS) No.SFAS 123Accounting for Stock-Based Compensation. The Company selected the modified
prospective method of adoption described in SFAS No. 148,Accounting for Stock-Based Compensation-Transition and Disclosure. Under this method, the change is retroactive prior to January 1, 2003 and2006, the adoption of SFAS 123(R) had no material impact on the consolidated financial statements.
Prior to adoption of SFAS 123(R), the Company presented all tax benefits of deductions resulting from the exercise of stock options as operating cash flows in the Statement of Cash Flows. SFAS 123(R) requires the cash flows resulting from the tax benefits of tax deductions in excess of the compensation cost recognized in 2003 isfor those options (excess tax benefits) to be classified as financing cash flows. Additionally, the same as that which would have beenwrite-off of deferred tax assets relating to the excess of recognized hadcompensation cost over the fair value method of SFAS No. 123 been appliedtax deduction resulting from its original effective date. In accordance with the modified prospective method of adoption, results for prior years have not been restated.
The following table illustrates the effect on net income and earnings per share as if the fair value method had been appliedaward will continue to all outstanding and unvested awards in each period (in thousands, except per share amounts):be reflected within operating cash flows.
| For the Year Ended December 31, | ||||||||||||
| 2004 | 2003 | 2002 | ||||||||||
Net income, as reported | $ | 115,389 | $ | 111,996 | $ | 48,761 | ||||||
Add: Stock-based employee compensation expense included in reported net income, net of related tax effects | 1,810 | 1,310 | 2,473 | |||||||||
Deduct: Total stock-based employee compensation expense determined under fair value based method for all awards, net of related tax effects | (1,810 | ) | (1,310 | ) | (600 | ) | ||||||
Pro forma net income | $ | 115,389 | $ | 111,996 | $ | 50,634 | ||||||
Earnings per share: | ||||||||||||
Basic – as reported | $ | 4.31 | $ | 5.04 | $ | 2.35 | ||||||
Basic – pro forma | $ | 4.31 | $ | 5.04 | $ | 2.44 | ||||||
Diluted – as reported | $ | 4.24 | $ | 4.91 | $ | 2.25 | ||||||
Diluted – pro forma | $ | 4.24 | $ | 4.91 | $ | 2.34 | ||||||
The following table summarizes the weighted average fair value of the granted options, determined using the Black-Scholes option pricing model and the assumptions used in their determination.
| 2004 | 2003 | 2002 | ||||||||||
Weighted average: | ||||||||||||
Fair value, at date of grant | $ | 21.24 | $ | 22.48 | $ | 10.29 | ||||||
Expected life in years | 6 | 7 | 7 | |||||||||
Annual risk-free interest rate | 4.7 | % | 3.3 | % | 4.1 | % | ||||||
Volatility | 0.7 | 2.0 | 2.1 | |||||||||
Dividend yield | 0.0 | % | 0.0 | % | 2.2 | % | ||||||
Income TaxesThe Company is taxed as a Real Estate Investment Trust (REIT)(“REIT”) under Section 857 of the Internal Revenue Code of 1986, as amended.amended (the “Code”). As a REIT, the Company generally is not subject to federal income tax. To maintain its qualification as a REIT, the Company must distribute at least 90% of its REIT taxable income to its stockholdersshareholders and meet certain other tests relating to assets and income. If the Company fails to qualify as a REIT in any taxable year, the Company will be subject to federal income tax on its taxable income at regular corporate rates. The Company may also be subject to certain state and local taxes. Under certain circumstances, even though the Company qualifies as a REIT, federal income and excise taxes may be due on its undistributed taxable income. Because the Company has paid or intends to pay dividends in the amount of its taxable income by the statutorily required due date, no provision for income taxes has been provided in the accompanying financial statements related to the REIT. However, NFI Holding Corporation, a wholly-owned subsidiary, and its subsidiaries have not elected REIT-status and, therefore, are subject to corporate income taxes. Accordingly, a provision for income taxes has been provided for the Company’s non-REIT subsidiaries.
The Company has elected to treat NFI Holding Corporation and its subsidiaries as taxable REIT subsidiaries (collectively the “TRS”). In general, the TRS may hold assets that the Company cannot hold directly and generally may engage in any real estate or non-real estate related business. The subsidiaries comprising the TRS are subject to corporate federal income tax and are taxed as regular C corporations. However, special rules do apply to certain activities between a REIT and a TRS. For example, the TRS willmay be subject to earnings stripping limitations on the deductibility of interest paid to its REIT. In addition, a REIT will be subject to a 100% excise tax on certain excess amounts to ensure that (i) tenants who pay theamounts paid to a TRS for services are based on amounts that would be charged in an arm’s-length amount by the TRS, (ii) fees paid to a REIT by the TRS are reflected at fair market value and (iii) interest paid by the TRS to its REIT is commercially reasonable.
The TRS records deferred tax assets and liabilities for the future tax consequences attributable to differences between the financial statement carrying amounts of existing assets and liabilities and their respective income tax bases.
Discontinued Operations On November 4, 2005, the Company adopted a formal plan to terminate substantially all of the branches operated by NovaStar Home Mortgage, Inc. (“NHMI”). By June 30, 2006, the Company had terminated all of the remaining NHMI branches and related operations. The Company considers a branch to be discontinued upon its termination date, which is the point in time when the operations cease. The provisions of SFAS No. 144, “Accounting for the Impairment or Disposal of Long-Lived Assets”, require the results of operations associated with those branches terminated subsequent to January 1, 2004 to be classified as discontinued operations and segregated from the Company’s continuing results of operations for all periods presented. The Company has recorded a valuation allowancepresented the operating results of NHMI as discusseddiscontinued operations in Note 11. The deferred tax asset is included in other assets on the consolidated balance sheet.
Earnings Per Share (EPS)Basic earnings per shareEPS excludes dilution and is computed by dividing net income available to common stockholdersshareholders by the weighted-average number of common shares outstanding for the period. Diluted earnings per shareEPS reflects the potential dilution that could occur if securities or other contracts to issue common stock were exercised or converted into common stock or resulted in the issuance of common stock that then shared in the earnings of the entity. Diluted EPS is calculated assuming all options, restricted stock, performance based awards and warrants on the Company’s common stock have been exercised, unless the exercise would be antidilutive.
Commitments to Originate Mortgage Loans Commitments to originate mortgage loans - held-for-sale meet the definition of a derivative and are recorded at fair value and are classified as other liabilities in the Company’s consolidated balance sheets. The Company uses the Black-Scholes option pricing model to determine the value of its commitments. Significant assumptions used in the valuation determination include volatility, strike price, current market price, expiration and one-month LIBOR.
New Accounting PronouncementsIn December 2004,February 2006, the FASB issued a revisionSFAS No. 155, “Accounting for Certain Hybrid Financial Instruments”, an amendment of FASB Statements No. 133 and SFAS No. 140 (“SFAS 155”). This statement permits fair value remeasurement for any hybrid financial instrument that contains an embedded derivative that otherwise would require bifurcation. It also clarifies which interest-only strips and principal-only strips are not subject to FASB Statement No. 123,133, “Accounting for Stock-Based CompensationDerivative Instruments and Hedging Activities” (“SFAS 133”). The statement also establishes a requirement to evaluate interests in securitized financial assets to identify interests that are freestanding derivatives or hybrid financial instruments that contain an embedded derivative requiring bifurcation. The statement also clarifies that concentration of credit risks in the form of subordination are not embedded derivatives, and it also amends SFAS 140 to eliminate the prohibition on a Qualifying Special Purpose Entity (“QSPE”) from holding a derivative financial instrument that pertains to a beneficial interest other than another derivative financial instrument. SFAS 155 is effective for all financial instruments acquired or issued after the beginning of an entity’s first fiscal year that begins after September 15, 2006.
In January 2007, the FASB provided a scope exception under SFAS 155 for securitized interests that only contain an embedded derivative that is tied to the prepayment risk of the underlying prepayable financial assets, and for which the investor does not control the right to accelerate the settlement. If a securitized interest contains any other embedded derivative (for example, an inverse floater), then it would be subject to the bifurcation tests in SFAS 133, as would securities purchased at a significant premium. The Company does not expect that the adoption of SFAS 155 will have a material impact on the Company’s financial position, results of operations or cash flows. However, to the extent that certain of the Company’s future investments in securitized financial assets do not meet the scope exception adopted by the FASB, the Company’s future results of operations may exhibit volatility if such investments are required to be bifurcated or marked to market value in their entirety through the income statement, depending on the election made by the Company.
In March 2006, the FASB issued SFAS No. 156, “Accounting for Servicing of Financial Assets”, an amendment of SFAS No. 140 (“SFAS 156”). This Statement establishes standards for the accounting for transactions in whichstatement requires that an entity exchanges its equity instruments for goodsseparately recognize a servicing asset or services. Ita servicing liability when it undertakes an obligation to service a financial asset under a servicing contract in certain situations. Such servicing assets or servicing liabilities are required to be initially measured at fair value, if practicable. SFAS 156 also addresses transactions in whichallows an entity incurs liabilities in exchange for goods to choose one of two methods when subsequently measuring its servicing assets and servicing liabilities: (1) the amortization methodor services that are based on (2) the fair value of the entity’s equity instruments or that may be settled by the issuance of those equity instruments. This Statement focuses primarily on accounting for transactions in which an entity obtains employee services in share-based payment transactions and does not change the accounting guidance for share-based payment transactions with parties other than employees provided in SFAS No. 123 and Emerging Issues Task Force of the Financial Accounting Standards Board (EITF) Issue No. 96-18,Accounting for Equity Instruments That Are Issued to Other Than Employees for Acquiring, or in Conjunction with Selling, Goods or Servicesmeasurement method. Entities no longer have the option to use the intrinsic valueThe amortization method of APB 25 that was provided in SFAS 123 as originally issued, which generally resulted in the recognition of no compensation cost. Under SFAS No. 123(R), the cost of employee services received in exchange for an equity award must be based on the grant-date fair value of the award. The cost of the awardsexisted under SFAS 123(R) will be recognized140 and remains unchanged in (1) allowing entities to amortize their servicing assets or servicing liabilities in proportion to and over the period an employee provides service, typicallyof estimated net servicing income or net servicing loss and (2) requiring the vesting period. No compensation cost is recognizedassessment of those servicing assets or servicing liabilities for equity instruments in which the requisite service is not provided. For employee awards that are treated as liabilities, initial cost of the awards will be measuredimpairment or increased obligation based on fair value at fair value.each reporting date. The fair value of the liability awards will be remeasured subsequentlymeasurement method allows entities to measure their servicing assets or servicing liabilities at fair value each reporting date through the settlement date withand report changes in fair value duringin earnings in the period an employee provides service recognized as compensation cost overthe change occurs. SFAS 156 introduces the notion ofclassesand allows companies to make a separate subsequent measurement election for each class of its servicing rights. In addition, SFAS 156 requires certain comprehensive roll-forward disclosures that period. Thismust be presented for each class. The Statement is effective as of the beginning of an entity’s first interim or annual reporting periodfiscal year that begins after JuneSeptember 15, 2005. As discussed previously in Note 1, the2006. The Company implemented the fair value provisions of SFAS No. 123 during 2003. As such,does not expect the adoption of this Statement is not anticipated toSFAS 156 will have a significantmaterial impact on the consolidatedCompany’s financial statements.
In March 2004, SEC Staff Accounting Bulletin (SAB) No. 105,Application of Accounting Principles to Loan Commitments was released. This release summarizes the SEC staff position regarding the application of accounting principles generally accepted in the United States of America to loan commitments accounted for as derivative instruments. The Company accounts for interest rate lock commitments issued on mortgage loans that will be held for sale as derivative instruments. Consistent with SAB No. 105, the Company considers the fair value of these commitments to be zero at the commitment date, with subsequent changes in fair value determined solely on changes in market interest rates. As of December 31, 2004, the Company had interest rate lock commitments on mortgage loans with principal balances of $361.2 million, the fair value of which was $(75,000).
At the March 17-18, 2004 EITF meeting, the EITF reached a consensus on Issue No. 03-1,The Meaning of Other-Than-Temporary Impairment and its Application to Certain Investments. Issue 03-1 provides guidance for determining when an investment is other-than-temporarily impaired and disclosure requirements regarding impairments that have not been recognized as other-than-temporary. An impairment exists when the carrying amount of an asset exceeds its fair value and is determined to be other-than-temporary. In September 2004,June 2006, the FASB delayed the effective date of paragraphs 10-20 of this issue. These paragraphs give guidance on how to evaluate and recognize an impairment loss that is other than temporary. The delay does not suspend the requirements to recognize other than temporary impairments as required by existing authoritative literature. The disclosure requirements were effective for reporting periods beginning after June 15, 2004. Issue 03-1 is not expected to have a significant impact on the consolidated financial statements.
In December 2003, the American Institute of Certified Public Accountants (AICPA) issued Statement of Position (SOP) 03-3,FASB Interpretation No. 48 (“FIN 48”), “Accounting for Certain LoansUncertainty in Income Taxes – an interpretation of FASB Statement No. 109”. FIN 48 prescribes a recognition threshold and measurement attribute for the financial statement recognition and measurement of a tax position taken or Debt Securities Acquired in a Transfer.This SOP addresses accounting for differences between contractual cash flows and cash flows expected to be collected from an investor’s initial investment in loans or debt securities (loans) acquired intaken on a transfer if those differences are attributable, at least in part, to credit quality. It includes such loans acquired in purchase business combinations and applies to all nongovernmental entities, including not-for-profit organizations.tax return. This SOP does not apply to loans originated by the entity, loans acquired in a business combination accounted for at historical cost, mortgage-backed securities in securitization transactions, acquired loans classified as held-for-sale, trading securities and derivatives. This SOP limits the yield that may be accreted to the excess of the investor’s estimate of undiscounted expected
principal,interpretation also provides additional guidance on derecognition, classification, interest and other cash flows (cash flows expected at acquisition to be collected) over the investor’s initial investmentpenalties, accounting in the loan.interim periods, disclosure, and transition. This SOP requires that the excess of contractual cash flows over cash flows expected to be collected (nonaccretable difference) not be recognized as an adjustment of yield, loss accrual, or valuation allowance. This SOP prohibits investors from displaying the accretable yield and nonaccretable difference in the balance sheet. Subsequent increases in cash flows expected to be collected generally should be recognized prospectively through adjustment of the loan’s yield over its remaining life. Decreases in cash flows expected to be collected should be recognized as impairment. This SOP prohibits “carrying over” or creation of valuation allowances in the initial accounting of all loans acquired in a transfer that are within the scope of this SOP. The prohibition of the valuation allowance carryover applies to the purchase of an individual loan, a pool of loans, a group of loans, and loans acquired in a purchase business combination. This SOPinterpretation is effective for loans acquired in fiscal years beginning after December 15, 2004. Early adoption is encouraged. For loans acquired in fiscal years beginning on or before December 15, 2004, this SOP should be applied prospectively for fiscal years beginning after December 15, 2004. SOP 03-3 is2006. The Company will adopt the provisions of FIN 48 beginning in the first quarter of 2007. The cumulative effect of applying the provisions of FIN 48 will be reported as an adjustment to the opening balance of retained earnings on January 1, 2007. The Company does not expectedexpect the adoption of FIN 48 to have a significantmaterial impact to its consolidated financial statements; however, the Company is still in the process of completing its evaluation of the impact of adopting FIN 48.
In September 2006, the FASB issued SFAS No. 157, “Fair Value Measurements” (“SFAS No. 157”). SFAS No. 157 establishes a framework for measuring fair value and requires expanded disclosures regarding fair value measurements. This accounting standard is effective for financial statements issued for fiscal years beginning after November 15, 2007. The Company is still evaluating the impact the adoption of this statement will have on its consolidated financial statements.
In September 2006, the Securities and Exchange Commission (“SEC”) issued Staff Accounting Bulletin No. 108, Considering the Effects of Prior Year Misstatements when Quantifying Misstatements in Current Year Financial Statements (“SAB No. 108”). SAB No. 108 provides guidance regarding the consideration of the effects of prior year misstatements in quantifying current year misstatements for the purpose of materiality assessments. The method established by SAB No. 108 requires each of the Company’s financial statements and the related financial statement disclosures to be considered when quantifying and assessing the materiality of the misstatement. The provisions of SAB 108 are effective for financial statements issued for fiscal years beginning after December 31, 2006. The Company is still evaluating the impact the adoption of this statement will have on its consolidated financial statements.
In February 2007, the FASB issued SFAS No. 159, “The Fair Value Option for Financial Assets and Financial Liabilities—Including an amendment of FASB Statement No. 115.” SFAS No. 159 permits entities to choose to measure many financial instruments and certain other items at fair value. Unrealized gains and losses on items for which the fair value option has been elected will be recognized in earnings at each subsequent reporting date. This accounting standard is effective for financial statements issued for fiscal years beginning after November 15, 2007. The Company is still evaluating the impact the adoption of this statement will have on its consolidated financial statements.
FASB has been deliberating on a technical interpretation of GAAP with respect to the accounting for transactions where assets are purchased and simultaneously financed through a repurchase agreement with the same party and whether these transactions create derivatives requiring a “net” presentation instead of the acquisition of assets and related financing obligation. The Company’s current accounting for these transactions is to record the transactions as an acquisition of assets and related financing obligation. The alternative accounting treatment would be to record any net cash representing the “haircut” amount as a deposit and the forward leg of the repurchase agreement (that is, the obligation to purchase the financial asset(s) at the end of the repo term) as a derivative. Because the FASB has not issued any guidance on this matter as of the filing date of this report, the Company has not changed its accounting treatment for this item. During the first quarter of 2006, the Company purchased approximately $1.0 billion of mortgage loans from counterparties which were subsequently financed through repurchase agreements with that same counterparty. As of December 31, 2006, the entire $1.0 billion of mortgage loans purchased during the first quarter remained on the Company’s consolidated balance sheet but they were no longer financed with repurchase agreements as they had been securitized in transactions structured as financings and the short-term repurchase agreements were replaced with asset backed bond financing. Additionally, during 2006 the Company purchased $64.1 million of securities from counterparties which were subsequently financed through repurchase agreements with the same counterparties. As of December 31, 2006 the market value of these securities which remained on the Company’s consolidated balance sheet was $62.9 million. If the Company would be required to change its current accounting based on this interpretation the Company does not believe that there would be a material impact on its consolidated statements of income, however, total assets and total liabilities would be reduced by approximately $50.9 million at December 31, 2006. In addition, cash flows from operating and financing activities would be reduced by approximately $50.9 million for the year ended December 31, 2006. The Company believes its liquidity would be unchanged, and it does not believe the economics of the transactions or its taxable income or status as a REIT would be affected.
Reclassifications Reclassifications to prior year amounts have been made to conform to current year presentation.presentation, as follows.
In accordance with SFAS No. 144, “Accounting for the Impairment or Disposal of Long-Lived Assets”, the Company has reclassified the operating results of NHMI and its branches through December 31, 2006, as discontinued operations in the Consolidated Statements of Income for the years ended 2006, 2005 and 2004.
The Company earns interest income from funds the Company holds as custodian and earns interest from corporate operating cash. The Company has reclassified these earnings from “Other Income, net” to “Interest Income” on the consolidated statements of income for the years ended 2005 and 2004. The amount of other income reclassified to interest income for 2005 and 2004 was $21.5 million and $6.8 million, respectively.
Note 2. Mortgage Loans
Mortgage loans, all of which are secured by residential properties, consisted of the following as of December 31, (in(dollars in thousands):
| 2004 | 2003 | 2006 | 2005 | |||||||||||||
Mortgage loans – held-for-sale: | ||||||||||||||||
Outstanding principal | $ | 719,904 | $ | 673,405 | $ | 1,631,891 | $ | 1,238,689 | ||||||||
Net premium | 6,760 | 10,112 | ||||||||||||||
| 726,664 | 683,517 | |||||||||||||||
Loans under removal of accounts provision | 20,930 | 14,475 | 107,043 | 44,382 | ||||||||||||
Net deferred origination costs | 7,891 | 12,015 | ||||||||||||||
Allowance for the lower of cost or fair value | (5,006 | ) | (3,530 | ) | ||||||||||||
Mortgage loans – held-for-sale | $ | 747,594 | $ | 697,992 | $ | 1,741,819 | $ | 1,291,556 | ||||||||
Weighted average coupon | 8.69 | % | 8.11 | % | ||||||||||||
Percent of loans with prepayment penalties | 58 | % | 65 | % | ||||||||||||
Mortgage loans – held-in-portfolio: | ||||||||||||||||
Outstanding principal | $ | 58,859 | $ | 94,162 | $ | 2,101,768 | $ | 29,084 | ||||||||
Net unamortized premium | 1,175 | 1,874 | ||||||||||||||
Net unamortized deferred origination costs | 37,219 | 455 | ||||||||||||||
Amortized cost | 60,034 | 96,036 | 2,138,987 | 29,539 | ||||||||||||
Allowance for credit losses | (507 | ) | (1,319 | ) | (22,452 | ) | (699 | ) | ||||||||
Mortgage loans – held-in-portfolio | $ | 59,527 | $ | 94,717 | $ | 2,116,535 | $ | 28,840 | ||||||||
Weighted average coupon | 8.35 | % | 9.85 | % | ||||||||||||
Percent of loans with prepayment penalties | 61 | % | 0 | % | ||||||||||||
ActivityDuring 2006 the Company transferred $2.7 billion of mortgage loans from its held-for-sale classification to held-in-portfolio. These loans were either subsequently securitized in transactions structured as financings or paid off.
During 1997 and 1998, the Company completed the securitization of loans in transactions that were structured as financing arrangements for accounting purposes. These non-recourse financing arrangements match the loans with the financing arrangement for long periods of time, as compared to repurchase agreements that mature frequently with interest rates that reset frequently and have liquidity risk in the allowance for credit lossesform of margin calls. Under the terms of the asset-backed bonds issued in the securitizations, the Company is as followsentitled to repurchase the mortgage loan collateral and repay the remaining bond obligations when the aggregate collateral principal balance falls below 35% of their original balance for the three years ended December 31, (in thousands):loans in Series 97-01 and 25% for the loans in Series 97-02, Series 98-01 and Series 98-02. During the fourth quarter of 2006, the Company exercised this option for Series 1998-1 and Series 1998-2 and retired the related asset-backed bonds, which had a remaining balance of $18.8 million. During the fourth quarter of 2005, the Company exercised this option for Series 1997-1 and Series 1997-2 and retired the related asset-backed bonds, which had a remaining balance of $7.8 million. The Company transferred $20.4 million and $10.3 million of mortgage loans associated with these asset backed bonds from the held-in-portfolio classification to held-for-sale in 2006 and 2005, respectively, with the intent to sell or securitize the loans.
| 2004 | 2003 | 2002 | ||||||||||
Balance, January 1 | $ | 1,319 | $ | 3,036 | $ | 5,557 | ||||||
Credit losses (recoveries) | 726 | (389 | ) | (432 | ) | |||||||
Amounts charged off, net of recoveries | (1,538 | ) | (1,328 | ) | (2,089 | ) | ||||||
Balance, December 31 | $ | 507 | $ | 1,319 | $ | 3,036 | ||||||
The servicing agreements the Company executes for loans it has securitized include a “clean up” call option which gives it the right, not the obligation, to repurchase mortgage loans from the trust. The clean up call option can be exercised when the aggregate principal balance of the mortgage loans has declined to ten percent or less of the original aggregated mortgage loan principal balance. During the twelve months ended December 31, 2006, the Company exercised the “clean up” call option on NMFT Series 2000-1, NMFT Series 2000-2, NMFT Series 2001-1, NMFT Series 2001-2, NMFT Series 2002-1 and NMFT Series 2002-2 and repurchased loans with a remaining principal balance of $192.8 million from these trusts for $184.7 million in cash. The trusts distributed the $184.7 million to retire the bonds held by third parties. The repurchased mortgage loans are included in the mortgage loans held-for-sale classification on the Company’s consolidated balance sheets and it is the Company’s intention to sell or securitize these loans. On September 25, 2005, the Company exercised the “clean up” call option on NMFT Series 1999-1 and repurchased loans with a remaining principal balance of $14.0 million from the trust for $6.8 million in cash. The trust distributed the $6.8 million to retire the bonds held by third parties.
At December 31, 2004,2006, the Company had the right, not the obligation, to repurchase $32.8$73.0 million of mortgage loans from the NMFT Series 2000-22002-3 securitization trust.
The majority of mortgage loans serve as collateral for borrowing arrangements discussed in Note 7. The weighted-average interest rate on mortgage loans as of December 31, 2004 and 2003 was 7.88% and 7.94%, respectively.trust under the Company’s clean up call option.
Collateral for 18%19% and 17%12% of the mortgage loans held-for-sale outstanding as of December 31, 20042006 was located in Florida and California, respectively. Collateral for 42% and 19% of the mortgage loans held-in-portfolio outstanding as of December 31, 2006 was located in California and Florida, respectively. As of December 31, 2006 interest only loan products made up 10% of the loans classified both as held-for-sale and held-in-portfolio. In addition as of December 31, 2006 MTA loan products made up 11% and 50% of the loans classified as held-for-sale and held-in-portfolio, respectively. These MTA loans had $29.5 million in negative amortization during 2006. The Company has no other significant concentration of credit risk on mortgage loans.
The recorded investment inAt December 31, 2006 a majority of the loans inclassified as held-for-sale and all of the loans classified as held-in-portfolio were pledged as collateral for financing purposes.
Loans that the Company has placed on non-accrual status totaled $48.8 and $3.7 million at December 31, 2006 and 2005, respectively. At December 31, 2006 the Company had $57.4 million in loans past due 90 days or more, butwhich were still accruing interest was $2.7as compared to $7.2 million and $9.8 million as ofat December 31, 2004, respectively.2005. These loans carried mortgage insurance and the accrual will be discontinued when in management’s opinion the interest is not collectible.
Activity in the allowance for credit losses on mortgage loans – held-in-portfolio is as follows for the three years ended December 31, (dollars in thousands):
| 2006 | 2005 | 2004 | ||||||||||
Balance, beginning of period | $ | 699 | $ | 507 | $ | 1,319 | ||||||
Provision for credit losses | 30,131 | 1,038 | 726 | |||||||||
Charge-offs, net of recoveries | (8,378 | ) | (846 | ) | (1,538 | ) | ||||||
Balance, end of period | $ | 22,452 | $ | 699 | $ | 507 | ||||||
Details ofNote 3. Loan Securitizations and Loan Sales
The Company executes loan securitization transactions onwhich are accounted for as sales of loans. Derivative instruments are also transferred into the datetrusts as part of each of these sales transactions to reduce interest rate risk to the third-party bondholders.
Details of the securitizationsecuritizations structured as sales for the three years ended December 31, are as follows (in
(dollars in thousands):
Net Bond | Allocated Value of Retained Interests | Principal Balance | Gain | ||||||||||||
| Mortgage Servicing Rights | Subordinated Bond Classes | ||||||||||||||
Year ended December 31, 2004: | |||||||||||||||
NMFT Series 2004-4 | $ | 2,459,875 | $ | 13,628 | $ | 94,911 | $ | 2,500,000 | $ | 21,721 | |||||
NMFT Series 2004-3 | 2,149,260 | 9,520 | 104,901 | 2,199,995 | 40,443 | ||||||||||
NMFT Series 2004-2 | 1,370,021 | 6,244 | 67,468 | 1,399,999 | 8,961 | ||||||||||
NMFT Series 2004-1 | 1,722,282 | 7,987 | 92,059 | 1,750,000 | 64,112 | ||||||||||
NMFT Series 2003-4 (A) | 472,391 | 1,880 | 22,494 | 479,810 | 9,015 | ||||||||||
| $ | 8,173,829 | $ | 39,259 | $ | 381,833 | $ | 8,329,804 | $ | 144,252 | ||||||
Year ended December 31, 2003: | |||||||||||||||
NMFT Series 2003-4 | $ | 1,004,427 | $ | 3,986 | $ | 47,499 | $ | 1,019,922 | $ | 22,035 | |||||
NMFT Series 2003-3 | 1,472,920 | 5,829 | 84,268 | 1,499,374 | 34,544 | ||||||||||
NMFT Series 2003-2 | 1,476,358 | 5,843 | 78,686 | 1,499,998 | 50,109 | ||||||||||
NMFT Series 2003-1 | 1,253,820 | 5,116 | 82,222 | 1,300,141 | 29,614 | ||||||||||
| $ | 5,207,525 | $ | 20,774 | $ | 292,675 | $ | 5,319,435 | $ | 136,302 | ||||||
Year ended December 31, 2002: | |||||||||||||||
NMFT Series 2002-3 | $ | 734,584 | $ | 2,939 | $ | 39,099 | $ | 750,003 | $ | 29,353 | |||||
NMFT Series 2002-2 | 300,304 | 1,173 | 22,021 | 310,000 | 10,459 | ||||||||||
NMFT Series 2002-1 | 485,824 | 1,958 | 29,665 | 499,998 | 8,082 | ||||||||||
| $ | 1,520,712 | $ | 6,070 | $ | 90,785 | $ | 1,560,001 | $ | 47,894 | ||||||
Net Bond | Allocated Value of Retained Interests | Principal Balance | Fair Value of Derivative Instruments Transferred | Gain Recognized | |||||||||||||||
| Mortgage Servicing Rights | Subordinated Bond Classes | ||||||||||||||||||
2006: | |||||||||||||||||||
NMFT Series 2005-4 (A) | $ | 378,944 | $ | 2,258 | $ | 9,416 | $ | 378,944 | $ | 259 | $ | 1,203 | |||||||
NMFT Series 2006-2 | 999,790 | 6,041 | 40,858 | 1,021,102 | 6,015 | 11,942 | |||||||||||||
NMFT Series 2006-3 | 1,072,258 | 6,516 | 47,408 | 1,100,000 | 5,073 | 10,209 | |||||||||||||
NMFT Series 2006-4 | 993,841 | 7,040 | 51,956 | 1,025,359 | 1,818 | 14,401 | |||||||||||||
NMFT Series 2006-5 | 1,264,695 | 8,969 | 46,762 | 1,300,000 | 1,732 | 5,675 | |||||||||||||
NMFT Series 2006-6 | 1,213,447 | 8,650 | 48,578 | 1,250,000 | 2,811 | 6,785 | |||||||||||||
| $ | 5,922,975 | $ | 39,474 | $ | 244,978 | $ | 6,075,405 | $ | 17,708 | $ | 50,215 | ||||||||
2005: | |||||||||||||||||||
NMFT Series 2005-1 | $ | 2,066,840 | $ | 11,448 | $ | 88,433 | $ | 2,100,000 | $ | 13,669 | $ | 18,136 | |||||||
NMFT Series 2005-2 | 1,783,102 | 9,751 | 62,741 | 1,799,992 | 2,364 | 29,202 | |||||||||||||
NMFT Series 2005-3 | 2,425,088 | 14,966 | 104,206 | 2,499,983 | 9,194 | 3,947 | |||||||||||||
NMFT Series 2005-4 (A) | 1,153,033 | 7,311 | 77,040 | 1,221,055 | 5,232 | 7,480 | |||||||||||||
| $ | 7,428,063 | $ | 43,476 | $ | 332,420 | $ | 7,621,030 | $ | 30,459 | $ | 58,765 | ||||||||
2004: | |||||||||||||||||||
NMFT Series 2003-4 (B) | $ | 472,391 | $ | 1,880 | $ | 22,494 | $ | 479,810 | $ | — | $ | 9,015 | |||||||
NMFT Series 2004-1 | 1,722,282 | 7,987 | 92,059 | 1,750,000 | (13,848 | ) | 64,112 | ||||||||||||
NMFT Series 2004-2 | 1,370,021 | 6,244 | 67,468 | 1,399,999 | 15,665 | 8,961 | |||||||||||||
NMFT Series 2004-3 | 2,149,260 | 9,520 | 104,901 | 2,199,995 | (6,705 | ) | 40,443 | ||||||||||||
NMFT Series 2004-4 | 2,459,875 | 13,628 | 94,911 | 2,500,000 | 5,617 | 21,721 | |||||||||||||
| $ | 8,173,829 | $ | 39,259 | $ | 381,833 | $ | 8,329,804 | $ | 729 | $ | 144,252 | ||||||||
| (A) | On January 20, 2006 NovaStar Mortgage delivered to the trust the remaining $378.9 million in loans collateralizing NMFT Series 2005-4. All of the bonds were issued to the third-party investors at the date of initial close, but the Company did not receive the escrowed proceeds related to the final close until January 20, 2006. |
| (B) | On January 14, 2004 NovaStar Mortgage delivered to the trust the remaining $479.8 million in loans collateralizing NMFT Series 2003-4. All of the bonds were issued to the third-party |
In the securitizations, the Company retains residual securities (representing interest-only securities, prepayment penalty bonds and otherovercollateralization bonds) and certain subordinated securities representing subordinated interests in the underlying cash flows and servicing responsibilities. The value of the Company’s retained interestssecurities is subject to credit, prepayment, and interest rate risks on the transferred financial assets.
During 20042006 and 2003, United States of America2005, U.S. government-sponsored enterprises purchased 55%49% and 70%51%, respectively, of the bonds sold to the third-party investors in the Company’s securitization transactions. The investors and securitization trusts have no recourse to the Company’s assets for failure of borrowers to pay when due except when defects occur in the loan documentation and underwriting process, either through processing errors made by the Company or through intentional or unintentional misrepresentations made by the borrower or agents during those processes. Refer to Note 89 for further discussion.
FairMortgage loans held-in-portfolio include loans that the Company has securitized in structures that are accounted for as financings. During 2006, the Company executed two securitization transactions, NovaStar Home Equity Series (“NHES”) 2006-1 and NHES 2006-MTA1, respectively, which were accounted for as financings under SFAS No. 140, “Accounting for Transfers and Servicing of Financial Assets and Extinguishments of Liabilities — a replacement of FASB Statement No. 125” .
These securitizations are structured legally as sales, but for accounting purposes are treated as financings under SFAS No. 140. These securitizations do not meet the qualifying special purpose entity criteria under SFAS No. 140 and related interpretations because after the loans are securitized the securitization trusts may acquire derivatives relating to beneficial interests retained by the Company and, the Company, as servicer, subject to applicable contractual provisions, has discretion to call (other than a clean-up call) loans back from the trust. Accordingly, the loans remain on the balance sheet as “loans held-in-portfolio”, retained interests are not created, and securitization bond financing replaces the short-term debt with the loans. The Company records interest income on loans held-in-portfolio and interest expense on the bonds issued in the securitizations over the life of the securitizations. Deferred debt issuance costs and discounts related to the bonds are amortized on a level yield basis over the estimated life of the bonds.
Details of the Company’s securitization transactions structured as financings during 2006 are as follows (dollars in thousands):
| Net Bond Proceeds | Principal Balance of Loans Financed | |||||
NHES Series 2006-1 | $ | 1,317,346 | $ | 1,350,000 | ||
NHES Series 2006-MTA1 | 1,188,111 | 1,199,913 | ||||
| $ | 2,505,457 | $ | 2,549,913 | |||
As described in Note 1, fair value of the subordinated bond classesresidual securities at the date of securitization is either measured by estimating the open market saleswhole loan price of a similarmethodology or the discount rate methodology. For the whole loan pool. Anprice methodology, an implied yield (discount rate) is calculated based on the value derived and using projected cash flows generated using key economic assumptions. Comparatively, under the discount rate methodology, the Company assumes a discount rate that it feels is commensurate with current market conditions. Key economic assumptions used to project cash flows at the time of loan securitization during the three years ended December 31, 20042006 were as follows:
Mortgage Loan Collateral for NovaStar Mortgage Funding Trust Series | Constant Prepayment Rate | Average Life (in Years) | Expected Total Credit Losses, Net of Mortgage Insurance (A) | Discount Rate | |||||||
2004-4 | 35 | % | 2.29 | 4.0 | % | 25 | % | ||||
2004-3 | 34 | 2.44 | 4.5 | 19 | |||||||
2004-2 | 31 | 2.70 | 5.1 | 26 | |||||||
2004-1 | 33 | 2.71 | 5.9 | 20 | |||||||
2003-4 | 30 | 3.06 | 5.1 | 20 | |||||||
2003-3 | 22 | 3.98 | 3.6 | 20 | |||||||
2003-2 | 25 | 3.54 | 2.7 | 28 | |||||||
2003-1 | 28 | 3.35 | 3.3 | 20 | |||||||
2002-3 | 30 | 3.09 | 1.0 | 20 | |||||||
2002-2 | 27 | 3.13 | 1.6 | 25 | |||||||
2002-1 | 32 | 2.60 | 1.7 | 20 |
NovaStar Mortgage Funding Trust Series | Constant Prepayment Rate | Average Life (in Years) | Expected Total Credit Mortgage Insurance (A) | Discount Rate | |||||||
2006-6 | 41 | % | 2.19 | 3.7 | % | 15 | % | ||||
2006-5 | 43 | 2.11 | 3.9 | 15 | |||||||
2006-4 | 43 | 2.07 | 2.9 | 15 | |||||||
2006-3 | 43 | 2.15 | 3.0 | 15 | |||||||
2006-2 | 44 | 2.02 | 2.4 | 15 | |||||||
2005-4 | 43 | 2.12 | 2.3 | 15 | |||||||
2005-3 | 41 | 2.06 | 2.0 | 15 | |||||||
2005-2 | 39 | 2.02 | 2.1 | 13 | |||||||
2005-1 | 37 | 2.40 | 3.6 | 15 | |||||||
2004-4 | 35 | 2.29 | 4.0 | 26 | |||||||
2004-3 | 34 | 2.44 | 4.5 | 19 | |||||||
2004-2 | 31 | 2.70 | 5.1 | 26 | |||||||
2004-1 | 33 | 2.71 | 5.9 | 20 |
| (A) | Represents expected credit losses for the life of the securitization up to the expected date in which the related asset-backed bonds can be called. |
Fair value of the subordinated securities at the date of securitization is based on quoted market prices.
The Company executes sales of loans to third parties with servicing released. Gains and losses on whole loan sales are recognized in the period the sale occurs. The Company generally has an obligation to repurchase whole loans sold in circumstances in which the borrower fails to make the first payment. Additionally, the Company is also required to repay all or a portion of the premium it receives on the sale of whole loans in the event that the loan is prepaid in its entirety in the first year. The Company records a reserve for losses on repurchased loans upon the sale of the mortgage loans.
Activity in the reserve for repurchases is as follows for the three years ended December 31, (dollars in thousands):
| 2006 | 2005 | 2004 | |||||||||
Balance, beginning of period | $ | 2,345 | $ | — | $ | — | |||||
Provision for repurchased loans | 28,617 | 3,265 | — | ||||||||
Charge-offs, net | (6,189 | ) | (920 | ) | — | ||||||
Balance, end of period | $ | 24,773 | $ | 2,345 | $ | — | |||||
Note 3.4. Mortgage Securities – Available-for-Sale
Available-for-sale mortgageMortgage securities consisted– available-for-sale consist of the Company’s investment in the residual securities and subordinated securities issued by securitization trusts sponsored by the Company. Residual securities consist of interest-only, prepayment penalty and other subordinatedovercollateralization bonds. Subordinated securities thatconsist of rated bonds which are lower on the trust issued. The primary bonds were sold to parties independentcapital structure. Management estimates the fair value of the Company. Management estimates their fair valueresidual securities by discounting the expected future cash flowflows of the collateral and bonds. The average yield on mortgageFair value of the subordinated securities is based on quoted market prices. The following table presents certain information on the interest income for the year as a percentage of the average fair market value on mortgage securities. The cost basis, unrealized gains and losses, estimated fair value and average yieldCompany’s portfolio of mortgage securities as of December 31, 2004 and 2003 were as follows– available-for-sale for the periods indicated (dollars in thousands):
| Cost Basis | Gross Unrealized | Estimated Fair Value | Average Yield | ||||||||||||
| Gains | Losses | ||||||||||||||
As of December 31, 2004 | $ | 409,946 | $ | 79,229 | $ | — | $ | 489,175 | 31.4 | % | |||||
As of December 31, 2003 | 294,562 | 87,826 | 101 | 382,287 | 34.3 | ||||||||||
| Cost Basis | Unrealized Gain | Unrealized Losses Less Than Twelve Months | Estimated Fair Value | Average Yield (A) | ||||||||||||
As of December 31, 2006 | $ | 310,760 | $ | 39,683 | $ | (1,131 | ) | $ | 349,312 | 41.84 | % | |||||
As of December 31, 2005 | 394,107 | 113,785 | (2,247 | ) | 505,645 | 47.32 | ||||||||||
| (A) | The average yield is calculated from the cost basis of the mortgage securities and does not give effect to changes in fair value that are reflected as a component of shareholders’ equity. |
The $101,000 gross unrealized loss as ofDuring the twelve months ended December 31, 2003 was on NMFT Series 1999-1. During 2004,2006 and 2005 management concluded that the decline in value on this security and othercertain securities in the Company’s mortgage securities – available-for-sale portfolio were other-than-temporary. As a result, the Company recognized an impairment on mortgage securities -– available-for-sale of $15.9$30.7 and $17.6 million in 2004. The impairments were a result of a significant increase in short-term interest rates during the year as well as higher than anticipated prepayments. Whiletwelve months ended December 31, 2006 and 2005 respectively.
During the twelve months ended December 31, 2006, the Company uses forward yield curves in valuingexercised the “clean up” call option on NMFT Series 2000-1, NMFT Series 2000-2, NMFT Series 2001-1, NMFT Series 2001-2, NMFT Series 2002-1 and NMFT Series 2002-2. The mortgage loans were repurchased from the trusts and cash was paid to retire the bonds held by third parties. Along with the cash paid to the trusts, any remaining cost basis of the related mortgage securities and mortgage servicing rights, $6.6 million, became part of the increasecost basis of the repurchased mortgage loans.
During the twelve months ended December 31, 2005, the Company exercised the “clean up” call option on NMFT Series 1999-1. The mortgage loans were repurchased from the trusts and cash was paid to retire the bonds held by third parties. Along with the cash paid to the trusts, any remaining cost basis of the related mortgage securities, $7.4 million, became part of the cost basis of the repurchased mortgage loans.
As of December 31, 2006 and December 31, 2005, the Company had two subordinated available-for-sale securities with unrealized losses and fair values aggregating $46.7 million and $42.8 million, respectively. The Company has deemed these securities to be only temporarily impaired because there was not an adverse change in two-year and three-year swap rates was greater than the forward yield curve had anticipated, thus causing a greater than expected decline in value. Prepayments were higher than expected due to substantial increases in housing prices in the past few years.estimated cash flows.
The following table is a rollforwardroll-forward of mortgage securities – available-for-sale from January 1, 20032005 to December 31, 20042006 (in thousands):
| Cost Basis | Net Unrealized Gain | Estimated Fair Value of Mortgage Securities | Cost Basis | Unrealized (Loss) | Estimated Fair Mortgage Securities | |||||||||||||||||||
As of January 1, 2003 | $ | 102,665 | $ | 76,214 | $ | 178,879 | ||||||||||||||||||
As of January 1, 2005 | $ | 409,946 | $ | 79,229 | $ | 489,175 | ||||||||||||||||||
Increases (decreases) to mortgage securities: | ||||||||||||||||||||||||
New securities retained in securitizations | 292,675 | 7,077 | 299,752 | 289,519 | 2,073 | 291,592 | ||||||||||||||||||
Accretion of income (A) | 78,097 | — | 78,097 | 171,734 | — | 171,734 | ||||||||||||||||||
Proceeds from paydowns of securities (A) (B) | (178,875 | ) | — | (178,875 | ) | (452,050 | ) | — | (452,050 | ) | ||||||||||||||
Impairment on mortgage securities - available-for-sale | (17,619 | ) | 17,619 | — | ||||||||||||||||||||
Transfer of securities to mortgage loans held-for-sale due to repurchase of mortgage loans from securitization trust (C) | (7,423 | ) | — | (7,423 | ) | |||||||||||||||||||
Mark-to-market value adjustment | — | 4,434 | 4,434 | — | 12,617 | 12,617 | ||||||||||||||||||
Net increase to mortgage securities | 191,897 | 11,511 | 203,408 | |||||||||||||||||||||
Net (decrease) increase to mortgage securities | (15,839 | ) | 32,309 | 16,470 | ||||||||||||||||||||
As of December 31, 2003 | 294,562 | 87,725 | 382,287 | |||||||||||||||||||||
As of December 31, 2005 | 394,107 | 111,538 | 505,645 | |||||||||||||||||||||
Increases (decreases) to mortgage securities: | ||||||||||||||||||||||||
New securities retained in securitizations | 381,833 | 6,637 | 388,470 | 154,990 | 2,462 | 157,452 | ||||||||||||||||||
Purchase of securities | 1,922 | — | 1,922 | |||||||||||||||||||||
Accretion of income (A) | 100,666 | — | 100,666 | 142,879 | — | 142,879 | ||||||||||||||||||
Proceeds from paydowns of securities (A)(B) | (351,213 | ) | — | (351,213 | ) | |||||||||||||||||||
Proceeds from paydowns of securities (A) (B) | (346,047 | ) | — | (346,047 | ) | |||||||||||||||||||
Impairment on mortgage securities - available-for-sale | (15,902 | ) | — | (15,902 | ) | (30,690 | ) | 30,690 | — | |||||||||||||||
Transfer of securities to mortgage loans held-for-sale due to repurchase of mortgage loans from securitization trusts (D) | (6,401 | ) | (5,153 | ) | (11,554 | ) | ||||||||||||||||||
Mark-to-market value adjustment | — | (15,133 | ) | (15,133 | ) | — | (100,985 | ) | (100,985 | ) | ||||||||||||||
Net increase (decrease) to mortgage securities | 115,384 | (8,496 | ) | 106,888 | ||||||||||||||||||||
Net decrease to mortgage securities | (83,347 | ) | (72,986 | ) | (156,333 | ) | ||||||||||||||||||
As of December 31, 2004 | $ | 409,946 | $ | 79,229 | $ | 489,175 | ||||||||||||||||||
As of December 31, 2006 | $ | 310,760 | $ | 38,552 | $ | 349,312 | ||||||||||||||||||
| (A) | Cash received on mortgage securities with no cost basis was |
| (B) | For mortgage securities with a remaining cost basis, the Company reduces the cost basis by the amount of cash that is contractually due from the securitization trusts. In contrast, for mortgage securities in which the cost basis has previously reached zero, the Company records in interest income the amount of cash that is contractually due from the securitization trusts. In both cases, there are instances where the Company may not receive a portion of this cash until after the balance sheet reporting date. Therefore, these amounts are recorded as receivables from the securitization |
| (C) | The remaining loans in the NMFT Series 1999-1 securitization trust were called on September 25, 2005. |
| (D) | The remaining loans in the NMFT Series 2000-1, NMFT Series 2000-2, NMFT Series 2001-1, NMFT Series 2001-2, NMFT Series 2002-1 and NMFT Series 2002-2 securitization trusts were called during 2006. |
Maturities of mortgage securities owned by the Company depend on repayment characteristics and experience of the underlying financial instruments. The Company expects the securities it owns as of December 31, 20042006 to mature in one to five years.
All mortgage securities owned by the Company are pledged for borrowings as discussed in Note 7.
During 20042005 and 2003,2004, the Company securitized the interest-only, prepayment penalty and subordinatedovercollateralization securities of various securitizations and issued NovaStar Net Interest Margin Certificates (NIMs). These resecuritizations were accounted for as secured borrowings. In accordance with SFAS No. 140,Accounting for Transfers and Servicing of Financial Assets and Extinguishments of Liabilities, control over the transferred assets was not surrendered and thus the transactions were recorded as financings for the mortgage securities. The detail of these transactions is shown in Note 7.8.
As of December 31, 2004,2006, key economic assumptions and the sensitivity of the current fair value of retained interests owned by the CompanyCompany’s residual securities to immediate adverse changes in those assumptions are as follows, on average for the portfolio (dollars in thousands):
Carrying amount/fair value of retained interests | $ | 489,175 | |
Weighted average life (in years) | 1.8 | ||
Weighted average prepayment speed assumption (CPR) | 39 | ||
Fair value after a 10% increase | $ | 479,571 | |
Fair value after a 25% increase | $ | 478,020 | |
Weighted average expected annual credit losses (percent of current collateral balance) | 3.3 | ||
Fair value after a 10% increase | $ | 467,837 | |
Fair value after a 25% increase | $ | 440,032 | |
Weighted average residual cash flows discount rate (percent) | 22 | ||
Fair value after a 500 basis point increase | $ | 464,423 | |
Fair value after a 1000 basis point increase | $ | 442,335 | |
Market interest rates | |||
Fair value after a 100 basis point increase | $ | 456,057 | |
Fair value after a 200 basis point increase | $ | 422,580 | |
Carrying amount/fair value of residual interests (A) | $ | 302,629 | |
Weighted average life (in years) | 1.2 | ||
Weighted average prepayment speed assumption (CPR) (percent) | 47 | ||
Fair value after a 10% increase in prepayment speed | $ | 303,916 | |
Fair value after a 25% increase in prepayment speed | $ | 311,749 | |
Weighted average expected annual credit losses (percent of current collateral balance) | 3.2 | ||
Fair value after a 10% increase in annual credit losses | $ | 280,773 | |
Fair value after a 25% increase in annual credit losses | $ | 254,792 | |
Weighted average residual cash flows discount rate (percent) | 16 | ||
Fair value after a 500 basis point increase in discount rate | $ | 288,135 | |
Fair value after a 1000 basis point increase in discount rate | $ | 274,641 | |
Market interest rates: | |||
Fair value after a 100 basis point increase in discount rate | $ | 253,831 | |
Fair value after a 200 basis point increase in discount rate | $ | 218,956 |
| (A) | The subordinated securities are not included in this table as their fair value is based on quoted market prices. |
These sensitivities are hypothetical and should be used with caution. As the analysis indicates, changes in fair value based on a 10% variationor 25% change in assumptions generally cannot be extrapolated because the relationship of the change in assumption to the change in fair value may not be linear. Also, in this table the effect of a variation in a particular assumption on the fair value of the retained interest is calculated without changing any other assumption; in reality, changes in one factor may result in changes in another (for example, increases in market interest rates may result in lower prepayments and increased credit losses), which might magnify or counteract the sensitivities.
The actual static pool credit loss as of December 31, 20042006 was 0.21%0.42% and the cumulative projected static pool credit loss for the remaining life of the securities is 2.49%1.86%. Static pool losses are calculated by summing the actual and projected future credit losses and dividing them by the original balance of each pool of assets.
The table below presents quantitative information about delinquencies, net credit losses, and components of securitized financial assets and other assets managed together with them (in(dollars in thousands):
| December 31, | For the Year Ended December 31, | Net Credit Losses During the Year Ended December 31, | ||||||||||||||||||||||||||||||||||||||
Total Principal Amount of Loans (A) | Principal Amount of Loans 30 Days or More Past Due | Net Credit Losses During the Year Ended December 31, | Total Principal Amount of Loans (A) | Principal Amount of Loans 60 Days or More Past Due | ||||||||||||||||||||||||||||||||||||
| 2004 | 2003 | 2004 | 2003 | 2004 | 2003 | 2006 | 2005 | 2006 | 2005 | 2006 | 2005 | |||||||||||||||||||||||||||||
Loans securitized | $ | 11,350,311 | $ | 6,428,364 | $ | 324,333 | $ | 201,774 | $ | 21,535 | $ | 7,700 | $ | 12,586,366 | $ | 12,722,279 | $ | 809,874 | $ | 404,592 | $ | 73,784 | $ | 38,639 | ||||||||||||||||
Loans held-for-sale | 720,035 | 674,031 | 3,383 | 3,125 | 1,097 | 498 | 1,647,063 | 1,238,953 | 25,112 | 1,897 | 7,166 | 1,027 | ||||||||||||||||||||||||||||
Loans held-in-portfolio | 59,836 | 96,729 | 10,174 | 15,313 | 2,490 | (B) | 4,402 | (B) | 2,108,129 | 30,028 | 78,384 | 3,124 | 1,605 | (C) | 1,072 | (C) | ||||||||||||||||||||||||
| �� | ||||||||||||||||||||||||||||||||||||||||
Total loans managed or securitized | $ | 12,130,182 | $ | 7,199,124 | $ | 337,890 | $ | 220,212 | $ | 25,122 | $ | 12,600 | $ | 16,341,558 | $ | 13,991,260 | $ | 913,370 | $ | 409,613 | $ | 82,555 | $ | 40,738 | ||||||||||||||||
| (A) | Includes assets acquired through foreclosure. |
| (B) | Loans under removal of accounts provision have not been repurchased from the securitization trusts, therefore, they are included in loans securitized. |
| (C) | Excludes mortgage insurance proceeds on policies paid by the Company and includes interest accrued on loans 90 days or more past due for which the Company had discontinued interest accrual. |
Note 4.5. Mortgage Securities -– Trading
As of December 31, 2004,2006, mortgage securities -– trading consisted of an adjustable-rate mortgage-backed security with a fair market value of $143.2 million. For the year ended December 31, 2004,certain subordinated securities retained by the Company recorded no gains or losses related tofrom securitization transactions as well as subordinated securities purchased from other issuers in the security.open market. As of December 31, 2004,2005, mortgage securities – trading consisted of certain subordinated securities retained by the Company from securitization transactions. Management estimates their fair value based on quoted market prices. The following table summarizes the Company’s mortgage securities – trading as of December 31, 2006 and 2005 (dollars in thousands):
| Original Face | Amortized Cost Basis | Fair Value | Average Yield (A) | |||||||||
As of December 31, 2006 | $ | 365,898 | $ | 332,045 | $ | 329,361 | 13.12 | % | ||||
As of December 31, 2005 | 54,400 | 43,189 | 43,738 | 14.59 | ||||||||
| (A) | Calculated from the average fair value of the securities. |
The Company recognized net trading (losses) gains of $(3.2) million and $0.5 million for the years ended December 31, 2006 and 2005, respectively.
On February 23, 2006, the Company sold the M-9 bond class security which it had retained from its NMFT Series 2005-4 securitization, to a third party and recognized a gain on the sale of approximately $351,000.
As of December 31, 2006 and 2005 the Company had pledged the securityall of its trading securities as collateral for financing purposes.
Note 5.6. Mortgage Servicing Rights
The Company records mortgage servicing rights arising from the transfer of loans to the securitization trusts. The following schedule summarizes the carrying value of mortgage servicing rights and the activity during 2006, 2005 and 2004 2003 and 2002 (in(dollars in thousands):
| 2004 | 2003 | 2002 | 2006 | 2005 | 2004 | |||||||||||||||||||
Balance, January 1 | $ | 19,685 | $ | 7,906 | $ | 6,445 | $ | 57,122 | $ | 42,010 | $ | 19,685 | ||||||||||||
Amount capitalized in connection with transfer of loans to securitization trusts | 39,259 | 20,774 | 6,070 | 39,474 | 43,476 | 39,259 | ||||||||||||||||||
Amortization | (16,934 | ) | (8,995 | ) | (4,609 | ) | (33,639 | ) | (28,364 | ) | (16,934 | ) | ||||||||||||
Transfer of cost basis to mortgage loans held-for-sale due to securitization calls | (127 | ) | — | — | ||||||||||||||||||||
Balance, December 31 | $ | 42,010 | $ | 19,685 | $ | 7,906 | $ | 62,830 | $ | 57,122 | $ | 42,010 | ||||||||||||
The estimated fair value of the servicing rights aggregated $58.6$74.2 million and $33.8$71.9 million at December 31, 20042006 and December 31, 2003,2005, respectively. The fair value is estimated by discounting estimated future cash flows from the servicing assets using discount rates that approximate current market rates. The fair value as of December 31, 20042006 was determined utilizing a 15%12% discount rate, credit losses net of mortgage insurance (as a percent of current principal balance) of 3.3%3.2% and an annual prepayment rate of 39%47%. The fair value as of December 31, 20032005 was determined utilizing a 15%12% discount rate, credit losses net of mortgage insurance (as a percent of current principal balance) of 2.8%2.1% and an annual prepayment rate of 26%49%. There was no allowance for the impairment of mortgage servicing rights as of December 31, 2004, 20032006 and 2002.2005.
Mortgage servicing rights are amortized in proportion to and over the estimated period of net servicing income. The estimated amortization expense for 2005, 2006, 2007, 2008, 2009, 2010, 2011 and thereafter is $16.4$29.6 million, $8.7$15.2 million, $4.7$6.8 million, $3.1$3.6 million, $2.2$2.3 million and $6.9$5.3 million, respectively.
The Company receives annual servicing fees approximating 0.50% of the outstanding balance and rights to future cash flows arising after the investors in the securitization trusts have received the return for which they contracted. Servicing fees received from the securitization trusts were $41.5$59.2 million, $21.1$59.8 million and $10.0$41.5 million for the years ended December 31, 2006, 2005 and 2004, 2003 and 2002, respectively. During the year ended December 31, 2006 the Company paid $32,000 to cover losses on delinquent or foreclosed loans from securitizations in which the Company did not maintain control over the mortgage loans transferred. During the year ended December 31, 2005 the Company incurred $220,000 in losses on delinquent or foreclosed loans purchased from securitizations in which the Company did not maintain control over the mortgage loans transferred. No such transactions were executed with securitizations in which the Company did not maintain control over the mortgage loans transferred during the year ended December 31, 2004.
The Company holds, as custodian, principal and interest collected from borrowers on behalf of the securitization trusts, as well as funds collected from borrowers to ensure timely payment of hazard and primary mortgage insurance and property taxes related to the properties securing the loans. These funds are not owned by the Company and are held in trust. The Company held, as custodian, $471.5$545.2 million and $188.8$585.1 million at December 31, 20042006 and 2003, respectively.
Note 6. Property and Equipment, Net
Property and equipment consisted of the following at December 31, (in thousands):
| 2004 | 2003 | |||||
Office and computer equipment | $ | 18,957 | $ | 13,617 | ||
Furniture and fixtures | 8,406 | 7,209 | ||||
Leasehold improvements | 3,423 | 3,048 | ||||
| 30,786 | 23,874 | |||||
Less accumulated depreciation | 15,310 | 9,337 | ||||
Property and equipment, net | $ | 15,476 | $ | 14,537 | ||
Depreciation expense for the years ended December 31, 2004, 2003 and 2002 was $6.1 million, $3.9 million and $1.2 million,2005, respectively.
Note 7. Warehouse Notes Receivable
The Company had $39.5 million and $25.4 million due from borrowers at December 31, 2006 and 2005, respectively. These notes receivable represent warehouse lines of credit provided to a network of approved mortgage borrowers. The weighted average interest rate on these notes receivable is indexed to one-month LIBOR and was 9.12% and 7.89% at December 31, 2006 and 2005, respectively. The allowance for losses the Company recorded on these notes receivable was insignificant as of December 31, 2006 and 2005.
Note 8. Borrowings
Short-term Borrowings The following tables summarize the Company’s repurchase agreements as of December 31, 2004 and 2003for the periods indicated (dollars in thousands):
| Maximum Borrowing Capacity | Rate | Days to Reset | Balance | Average Balance Year | Weighted Average Interest Rate During the Year | Maximum Amount Outstanding During the Year | ||||||||||||||
December 31, 2004 | ||||||||||||||||||||
Short-term borrowings (indexed to one-month LIBOR): | ||||||||||||||||||||
Repurchase agreement expiring November 15, 2005 | $ | 1,000,000 | 3.39 | % | 1 | $ | 488,089 | |||||||||||||
Repurchase agreement expiring March 30, 2005 | 800,000 | 3.25 | 11 | 128,107 | ||||||||||||||||
Repurchase agreement expiring October 7, 2005 | 800,000 | 3.30 | 25 | 104,693 | ||||||||||||||||
Repurchase agreement expiring June 30, 2005 | 750,000 | 2.88 | 1 | 36,113 | ||||||||||||||||
Repurchase agreement expiring April 30, 2005 | 300,000 | 2.93 | 25 | 8,643 | ||||||||||||||||
Repurchase agreement expiring August 26, 2005 | 100,000 | 3.90 | 12 | 3,971 | ||||||||||||||||
Repurchase agreement, expiring January 24, 2005 | 135,912 | 2.47 | 24 | 135,912 | ||||||||||||||||
Total short-term borrowings | $ | 3,885,912 | $ | 905,528 | $ | 1,226,313 | 2.96 | % | $ | 2,587,112 | ||||||||||
December 31, 2003 | ||||||||||||||||||||
Short-term borrowings (indexed to one-month LIBOR): | ||||||||||||||||||||
Repurchase agreement expiring March 31, 2004 | $ | 600,000 | 2.91 | % | 22 | $ | 100,161 | |||||||||||||
Repurchase agreement expiring June 5, 2004 | 600,000 | 1.87 | 16 | 431,515 | ||||||||||||||||
Repurchase agreement expiring April 30, 2004 | 300,000 | 1.64 | 26 | 28,179 | ||||||||||||||||
Repurchase agreement expiring September 8, 2004 | 500,000 | — | — | — | ||||||||||||||||
Repurchase agreement expiring May 22, 2004 | 300,000 | 2.25 | 15 | 214,899 | ||||||||||||||||
Repurchase agreement expiring October 23, 2004 | 575,000 | 2.17 | 15 | 97,782 | ||||||||||||||||
Total short-term borrowings | $ | 2,875,000 | $ | 872,536 | $ | 915,689 | 2.57 | % | $ | 1,574,156 | ||||||||||
| Maximum Borrowing Capacity | Rate | Days to Reset | Balance | ||||||||
December 31, 2006 | |||||||||||
Short-term borrowings (indexed to one-month LIBOR): | |||||||||||
Repurchase agreement expiring November 15, 2007 (D) | $ | 1,000,000 | 5.77 | % | 1 | $ | 393,746 | ||||
Repurchase agreement expiring April 14, 2007 (F) | 800,000 | 6.00 | 11 | 436,302 | |||||||
Repurchase agreement expiring January 6, 2007 (A) (F) | 800,000 | 5.77 | 25 | 371,860 | |||||||
Repurchase agreement expiring November 9, 2007 (F) | 750,000 | 5.77 | 12 | 429,733 | |||||||
Repurchase agreement expiring May 31, 2007 (E) | 500,000 | 6.00 | 1 | 322,906 | |||||||
Repurchase agreement expiring June 28, 2009 (E) | 150,000 | 7.10 | 1 | 60,000 | |||||||
Repurchase agreement expiring April 12, 2009 (E) | 150,000 | 7.10 | 25 | 40,127 | |||||||
Repurchase agreement expiring July 31, 2009 (B) (E) | 150,000 | 7.13 | 1 | 40,449 | |||||||
Loan and receivables agreement expiring January 6, 2007 (A) (B) | 80,000 | 6.02 | 3 | 16,755 | |||||||
Repurchase agreement, expiring January 10, 2007 (C) (D) | 100,000 | 6.32 | 12 | 40,330 | |||||||
Total short-term borrowings | $ | 2,152,208 | |||||||||
December 31, 2005 | |||||||||||
Short-term borrowings (indexed to one-month LIBOR): | |||||||||||
Repurchase agreement expiring November 15, 2006 (D) | $ | 1,000,000 | 4.98 | % | 1 | $ | 388,056 | ||||
Repurchase agreement expiring April 14, 2006 (F) | 800,000 | 5.30 | 13 | 262,867 | |||||||
Repurchase agreement expiring February 6, 2006 (F) | 800,000 | 5.12 | 25 | 422,452 | |||||||
Repurchase agreement expiring September 29, 2006 (F) | 750,000 | 5.25 | 9 | 327,339 | |||||||
Repurchase agreement expiring August 4, 2006 (F) | 100,000 | — | 25 | — | |||||||
Loan and receivables agreement expiring October 6, 2006 (B) (G) | 80,000 | — | — | — | |||||||
Repurchase agreement, expiring December 1, 2006 (D) | 50,000 | 5.38 | 12 | 17,855 | |||||||
Total short-term borrowings | $ | 1,418,569 | |||||||||
| (A) | Expiration date was extended to October 8, 2007 subsequent to December 31, 2006. |
| (B) | Agreements do not provide for additional capacity beyond the maximum capacity the Company has in place under the master repurchase agreement for that particular lender and essentially act as sub-limits underneath the overall capacity. |
| (C) | Expiration date was extended to March 2, 2007 subsequent to December 31, 2006. |
| (D) | Eligible collateral for this agreement is mortgage loans. |
| (E) | Eligible collateral for this agreement is mortgage securities. |
| (F) | Eligible collateral for this agreement is both mortgage loans and mortgage securities. |
| (G) | Eligible collateral for this agreement is servicing related advances. |
The following table presents certain information on the Company’s repurchase agreements for the periods indicated (dollars in thousands):
| For the Year Ended December 31, | ||||||||
| 2006 | 2005 | |||||||
Maximum month-end outstanding balance during the period | $ | 3,978,629 | $ | 2,362,995 | ||||
Average balance outstanding during the period | 2,282,715 | 1,294,452 | ||||||
Weighted average rate for period | 5.98 | % | 4.66 | % | ||||
Weighted average interest rate at period end | 5.95 | % | 5.15 | % | ||||
The Company’s mortgage loans, certain mortgage securities and securitiescertain servicing related advances are pledged as collateral on these borrowings.
All short-term financing arrangements requireof the CompanyCompany’s warehouse repurchase credit facilities include numerous representations, warranties and covenants, including requirements to maintain a certain minimum tangible net worth, meet a minimum equity ratio testratios and comply with other customary debt covenants. Events of default under these facilities include material breaches of representations or warranties, failure to comply with covenants, material adverse effects upon or changes in business, assets, or financial condition, and other customary matters. Events of default under certain of the Company’s facilities also include termination of our status as servicer with respect to certain securitized loan pools and failure to maintain profitability over consecutive quarters. In addition, if the Company breaches any covenant or an event of default otherwise occurs under any warehouse repurchase credit facility under which borrowings are outstanding, the lenders under all existing warehouse repurchase credit facilities could demand immediate repayment of all outstanding amounts because all of the warehouse repurchase credit facilities contain cross-default provisions. Management believes the Company is in compliance with all debt covenants.covenants at December 31, 2006.
In the event that the Company does not obtain a modification or waiver of any breach of a covenant requirement, the borrowing capacity under such breached facility would not be available to the Company so long as the Company remained out of compliance. Further, if at the time of noncompliance the Company continued to have borrowings outstanding under such breached facility, the breach would permit lenders under each of the Company’s other warehouse repurchase facilities to accelerate all amounts then outstanding. The Company also has the unilateral right to prepay the borrowings at any time. Management believes the borrowing capacity currently existing and expected to exist under the Company’s warehouse repurchase agreements is adequate to permit a transfer of all collateral from any breached facility and is adequate to maintain the Company’s current level of operations.
Repurchase agreements generally contain margin calls under which a portion of the borrowings must be repaid if the fair value of the mortgage securities – available-for-sale, mortgage securities - trading or mortgage loans collateralizing the repurchase agreements falls below a contractual ratio to the borrowings outstanding.
Accrued interest on the Company’s repurchase agreements was $6.7 million as of December 31, 2006 as compared to $3.2 million as of December 31, 2005.
In connection with the lending agreement with UBS Warburg Real Estate Securities, Inc. (“UBS”), NovaStar Mortgage SPV I (“NovaStar Trust”), a Delaware statutory trust, has been established by NMI as a wholly owned special-purpose warehouse finance subsidiary whose assets and liabilities are included in the Company’s consolidated financial statements.
NovaStar Trust has agreed to issue and sell to UBS mortgage notes (the “Notes”). Under the agreements that document the issuance and sale of the Notes:
all assets which are from time to time owned by NovaStar Trust are legally owned by NovaStar Trust and not by NMI.
NovaStar Trust is a legal entity separate and distinct from NMI and all other affiliates of NMI.
the assets of NovaStar Trust are legally assets only of NovaStar Trust, and are not legally available to NMI and all other affiliates of NMI or their respective creditors, for pledge to other creditors or to satisfy the claims of other creditors.
none of NMI or any other affiliate of NMI is legally liable on the debts of NovaStar Trust, except for an amount limited to 10% of the maximum dollar amount of the Notes permitted to be issued.
the only assets of NMI resulting from the issuance and sale of the Notes are:
| 1) | any cash portion of the purchase price paid from time to time by NovaStar Trust in consideration of Mortgage Loans sold to NovaStar Trust by NMI; and |
| 2) | the value of NMI’s net equity investment in NovaStar Trust. |
As of December 31, 2006, NovaStar Trust had the following assets:
| 1) | whole loans: $395.4 million |
| 2) | cash and cash equivalents: $2.0 million. |
As of December 31, 2006, NovaStar Trust had the following liabilities and equity:
| 1) | short-term debt due to UBS: $393.7 million, and |
| 2) | $3.7 million in members’ equity investment. |
Asset-backed Bonds (ABB)(“ABB”) The Company issued ABB secured by its mortgage loans as a means for long-term non-recourse financing. For financial reporting and tax purposes, the mortgage loans held-in-portfolio as collateral are recorded as assets of the Company and the ABB are recorded as debt. Interest and principal on each ABB is payable only from principal and interest on the underlying mortgage loans collateralizing the ABB. Interest rates reset monthly and are indexed to one-month LIBOR. The estimated weighted-average months to maturity is based on estimates and assumptions made by management. The actual maturity may differ from expectations. However, the Company retains the option to repay the ABB, and reacquire the mortgage loans, when the remaining unpaid principal balance of the underlying mortgage loans falls below 35% of their original amounts for issue 1997-1 and 25% on 1997-2,Series 1998-1 and Series 1998-2. During the fourth quarter of 2006, the Company exercised this option for Series 1998-1 and 1998-2 and retired the related ABB which had a remaining balance of $18.8 million. The mortgage loans were transferred from the held-in-portfolio classification to held-for-sale and have been or will be sold to third party investors or used as collateral in the Company’s securitization transactions.
The following table summarizes the ABB transactions for the year ended December 31, 2006 (dollars in thousands):
| Date Issued | Bonds Issued (A)(B) | Interest Rate Spread Over LIBOR (A) | Loans Pledged | |||||||
NHES Series 2006-1 | April 28, 2006 | $ | 1,320,974 | 0.06%-1.95% | $ | 1,350,000 | ||||
NHES Series 2006-MTA 1 | June 8, 2006 | 1,189,785 | 0.19%-0.65% | 1,199,913 | ||||||
| (A) | The amounts shown do not include subordinated bonds retained by the Company. |
| (B) | The bonds issued for the NHES 2006-MTA1 securitization include $19.2 million in Class X Notes. The Class X Notes are AAA-rated and are entitled to interest-only cash flows. |
The Company issued NIMsnet interest margin certificates (“NIMs”) secured by its mortgage securities available-for-sale as a means for long-term financing. For financial reporting and tax purposes, the mortgage securities available-for-sale collateral are recorded as assets of the Company and the ABBNIMs are recorded as debt. The performance of the mortgage loan collateral underlying these securities as presented in Note 2 directly affects the performance of these bonds. Interest rates are fixed at the time of issuance and do not adjust over the life of the bonds. The estimated weighted average months to maturity are based on estimates and assumptions made by management. The actual maturity may differ from expectations. There were no NIMs transactions in the year ended December 31, 2006.
The following table summarizedsummarizes the NIMs transactions for the years endingyear ended December 31, 2004 and 20032005 (dollars in thousands):
Date Issued | Bonds Issued | Interest Rate | Collateral (NMFT Series) (A) | |||||||
Year ended December 31, 2004: | ||||||||||
Issue 2004-N1 | February 19, 2004 | $ | 156,600 | 4.46 | % | 2003-3 and 2003-4 | ||||
Issue 2004-N2 | July 23, 2004 | 157,500 | 4.46 | 2004-1 and 2004-2 | ||||||
Issue 2004-N3 | December 21, 2004 | 201,000 | 3.97 | 2004-3 and 2004-4 | ||||||
Year ended December 31, 2003: | ||||||||||
Issue 2003-N1 | July 2, 2003 | 54,000 | 7.39 | 2003-2 | ||||||
| Date Issued | Bonds Issued | Interest Rate | Collateral (NMFT Series) (A) | |||||||
Issue 2005-N1 | June 22, 2005 | $ | 130,875 | 4.78 | % | 2005-1 and 2005-2 | ||||
| (A) | The NIMs transactions are secured by the interest-only, prepayment penalty and |
FollowingThe following is a summary of outstanding ABB and related loans (dollars in thousands):
| Asset-backed Bonds | Mortgage Loans | ||||||||||||||||
| Remaining Principal | Interest Rate | Remaining Principal (A) | Weighted Average Coupon | Estimated Weighted to Call | |||||||||||||
As of December 31, 2004: | |||||||||||||||||
NovaStar Home Equity Series: | |||||||||||||||||
Collateralizing Mortgage Loans: | |||||||||||||||||
Issue 1997-1 | $ | 5,508 | 2.69 | % | $ | 6,939 | 10.36 | % | — | ||||||||
Issue 1997-2 | 8,333 | 2.69 | 9,414 | 10.29 | — | ||||||||||||
Issue 1998-1 | 13,827 | 2.58 | 16,152 | 9.95 | — | ||||||||||||
Issue 1998-2 | 25,785 | 2.59 | 27,331 | 9.76 | — | ||||||||||||
| $ | 53,453 | $ | 59,836 | ||||||||||||||
Collateralizing Mortgage Securities – Available-for-Sale: | |||||||||||||||||
Issue 2003-N1 | $ | 5,825 | 7.39 | %(C) | (C | ) | (C | ) | (C | ) | |||||||
Issue 2004-N1 | 48,830 | 4.46 | (D) | (D | ) | (D | ) | (D | ) | ||||||||
Issue 2004-N2 | 93,586 | 4.46 | (E) | (E | ) | (E | ) | (E | ) | ||||||||
Issue 2004-N3 | 193,093 | 3.97 | (F) | (F | ) | (F | ) | (F | ) | ||||||||
Unamortized debt issuance costs, net | (4,893 | ) | |||||||||||||||
| $ | 336,441 | ||||||||||||||||
As of December 31, 2003: | |||||||||||||||||
NovaStar Home Equity Series: | |||||||||||||||||
Collateralizing Mortgage Loans: | |||||||||||||||||
Issue 1997-1 | $ | 10,249 | 1.63 | % | $ | 11,721 | 10.17 | % | — | ||||||||
Issue 1997-2 | 13,177 | 1.63 | 14,629 | 10.51 | — | ||||||||||||
Issue 1998-1 | 24,337 | 1.54 | 27,118 | 9.94 | — | ||||||||||||
Issue 1998-2 | 41,621 | 1.55 | 43,261 | 9.87 | — | ||||||||||||
| $ | 89,384 | $ | 96,729 | ||||||||||||||
Collateralizing Mortgage Securities - Available-for-Sale: | |||||||||||||||||
Issue 2002-C1 | $ | 7,070 | 7.15 | %(B) | (B | ) | (B | ) | (B | ) | |||||||
Issue 2003-N1 | 38,100 | 7.39 | (C) | (C | ) | (C | ) | (C | ) | ||||||||
Unamortized debt issuance costs, net | (1,574 | ) | |||||||||||||||
| $ | 43,596 | ||||||||||||||||
| Asset-backed Bonds | Mortgage Loans | |||||||||||||||
| Remaining Principal | Weighted Average Interest Rate | Estimated Weighted Average Months to Call or Maturity | Remaining (A) | Weighted Average Coupon | ||||||||||||
As of December 31, 2006: | ||||||||||||||||
ABB: | ||||||||||||||||
NHES Series 2006-1 | $ | 1,042,202 | 5.61 | % | 40 | $ | 1,059,353 | 8.58 | % | |||||||
NHES Series 2006-MTA1 | 1,032,842 | 5.60 | 49 | 1,042,415 | 8.12 | |||||||||||
Unamortized debt issuance costs, net | (7,554 | ) | ||||||||||||||
| $ | 2,067,490 | $ | 2,101,768 | |||||||||||||
NIMs: | ||||||||||||||||
Issue 2005-N1 | $ | 9,558 | 4.78 | % | 5 | (D | ) | (D | ) | |||||||
Unamortized debt issuance costs, net | (39 | ) | ||||||||||||||
| $ | 9,519 | |||||||||||||||
As of December 31, 2005: | ||||||||||||||||
ABB: | ||||||||||||||||
NHES Series 1998-1 | $ | 9,391 | 4.78 | % | 33 | $ | 10,933 | 9.91 | % | |||||||
NHES Series 1998-2 | 17,558 | 4.79 | 48 | 19,095 | 9.82 | |||||||||||
| $ | 26,949 | $ | 30,028 | |||||||||||||
NIMs: | ||||||||||||||||
Issue 2004-N2 | $ | 3,557 | 4.46 | % | 1 | (B | ) | (B | ) | |||||||
Issue 2004-N3 | 49,475 | 3.97 | 9 | (C | ) | (C | ) | |||||||||
Issue 2005-N1 | 73,998 | 4.78 | 22 | (D | ) | (D | ) | |||||||||
Unamortized debt issuance costs, net | (1,400 | ) | ||||||||||||||
| $ | 125,630 | |||||||||||||||
| (A) | Includes assets acquired through |
| (B) | Collateral for the |
| (C) | Collateral for the |
| (D) | Collateral for the 2005-N1 ABB is the interest-only, prepayment penalty and overcollateralization mortgage securities of NMFT 2005-1 and NMFT 2005-2. |
The following table summarizes the expected repayment requirements relating to the securitization bond financing at December 31, 2004.2006. Amounts listed as bond payments are based on anticipated receipts of principal and interest on underlying mortgage loan collateral using expected prepayment speeds (inspeeds. Principal repayments on these ABB is payable only from the mortgage loans collateralizing the ABB. (dollars in thousands):
| Asset-backed Bonds | Asset-backed Bonds | |||||
2005 | $ | 283,058 | ||||
2006 | 82,503 | |||||
2007 | 15,665 | $ | 693,318 | |||
2008 | 5,649 | 598,868 | ||||
2009 | 4,505 | 380,091 | ||||
2010 | 284,677 | |||||
2011 | 127,648 | |||||
Thereafter | 3,407 | — | ||||
| $ | 2,084,602 | |||||
Junior Subordinated Debentures.In connection withApril 2006, the lending agreement with UBS Warburg Real Estate Securities, Inc. (UBS),Company established NovaStar Mortgage SPV I (NovaStar Trust)Capital Trust II (“NCTII”), a Delaware statutory trust has been established byorganized under Delaware law for the sole purpose of issuing trust preferred securities. NovaStar Mortgage, Inc. (NMI) as(“NMI”) owns all of the common securities of NCTII. On April 18, 2006, NCTII issued $35 million in unsecured floating rate trust preferred securities to other investors. The trust preferred securities require quarterly interest payments. The interest rate is floating at the three-month LIBOR rate plus 3.5% and resets quarterly. The trust preferred securities are redeemable, at NCTII’s option, in whole or in part, anytime without penalty on or after June 30, 2011, but are mandatorily redeemable when they mature on June 30, 2036. If they are redeemed on or after June 30, 2011, but prior to maturity, the redemption price will be 100% of the principal amount plus accrued and unpaid interest.
The proceeds from the issuance of the trust preferred securities and the common securities of NCTII were loaned to NMI in exchange for $36.1 million of junior subordinated debentures of NMI, which are the sole assets of NCTII. The terms of the junior subordinated debentures match the terms of the trust preferred securities. The debentures are subordinate and junior in right of payment to all present and future senior indebtedness and certain other financial obligations of the Company. NovaStar Financial entered into a wholly owned special-purpose warehouse finance subsidiary whoseguarantee for the purpose of guaranteeing the payment of any amounts to be paid by NMI under the terms of the debentures. NovaStar Financial may not declare or pay any dividends or distributions on, or redeem, purchase, acquire or make a liquidation payment with respect to any of its capital stock if there has occurred and is continuing an event of default under the guarantee. Following payment by the Company of offering costs, the Company’s net proceeds from the offering aggregated $33.9 million.
The assets and liabilities of NCTII are not consolidated into the consolidated financial statements of the Company. Accordingly, the Company’s equity interest in NCTII is accounted for using the equity method. Interest on the junior subordinated debt is included in the Company’s consolidated financial statements.statements of income as interest expense—subordinated debt and the junior subordinated debentures are presented as a separate category on the consolidated balance sheets.
In March 2005, the Company established NovaStar Capital Trust has agreed to issue and sell to UBS mortgage notes (the “Notes”I (“NCTI”). Under, a statutory trust organized under Delaware law for the legal agreements which document the issuance and salesole purpose of issuing trust preferred securities. NMI owns all of the Notes:common securities of NCTI. On March 15, 2005, NCTI issued $50 million in unsecured floating rate trust preferred securities to other investors. The trust preferred securities require quarterly interest payments. The interest rate is floating at the three-month LIBOR rate plus 3.5% and resets quarterly. The trust preferred securities are redeemable, at NCTI’s option, in whole or in part, anytime without penalty on or after March 15, 2010, but are mandatorily redeemable when they mature on March 15, 2035. If they are redeemed on or after March 15, 2010, but prior to maturity, the redemption price will be 100% of the principal amount plus accrued and unpaid interest.
common stock of NCTI to the Company were loaned to the Company in exchange for $51.6 million of junior subordinated debentures of the Company, which are the sole assets of NCTI. The terms of the junior subordinated debentures match the terms of the trust preferred securities. The debentures are subordinate and junior in right of payment to all present and future senior indebtedness and certain other financial obligations of the Company. NovaStar Financial entered into a guarantee for the purpose of guaranteeing the payment of any amounts to be paid by NMI under the terms of the debentures. If an event of default has occurred and is continuing under the junior subordinated debentures, NMI may not declare or pay any dividends or distributions on, or redeem, purchase, acquire or make a liquidation payment with respect to, any shares of its capital stock. In addition, NovaStar Financial may not declare or pay any dividends or distributions on, or redeem, purchase, acquire or make a liquidation payment with respect to any of its capital stock if there has occurred and is continuing an event of default under the guarantee. Following payment by the Company of offering costs, the Company’s net proceeds from the offering aggregated $48.4 million.
AsThe assets and liabilities of December 31, 2004, NovaStar Trust hadNCTI are not consolidated into the following assets:consolidated financial statements of the Company. Accordingly, the Company’s equity interest in NCTI is accounted for using the equity method. Interest on the junior subordinated debt is included in the Company’s consolidated statements of income as interest expense—subordinated debt and the junior subordinated debentures are presented as a separate category on the consolidated balance sheets.
As of December 31, 2004, NovaStar Trust had the following liabilities and equity:
Note 8.9. Commitments and Contingencies
CommitmentsCommitments. The Company has commitments to borrowers to fund residential mortgage loans as well as commitments to purchase and sell mortgage loans to third parties. At December 31, 2004,2006, the Company had outstanding commitments to originate and purchase loans of $361.2 million.$774.0 million and $11.8 million, respectively. The Company had no outstanding commitments to purchase and sell loans at December 31, 2004.2006. At December 31, 2003,2005, the Company had outstanding commitments to originate, purchase and sell loans of $228$545.4 million, $60$33.4 million and $0,$93.6 million, respectively. The commitments to originate and purchase loans do not necessarily represent future cash requirements, as some portion of the commitments are likely to expire without being drawn upon or may be subsequently declined for credit or other reasons.upon.
The Company leases office space under various operating lease agreements. Rent expense for 2004, 2003 and 2002, aggregated $15.9 million, $7.5 million and $2.4 million, respectively. At December 31, 2004, future minimum lease commitments under those leases are as follows (in thousands):
Lease Obligations | |||
2005 | $ | 8,540 | |
2006 | 8,344 | ||
2007 | 8,127 | ||
2008 | 8,030 | ||
2009 | 8,022 | ||
Thereafter | 7,902 | ||
The Company has entered into various lease agreements in which the lessor agreed to repay the Company for certain existing lease obligations. The Company received approximately $61,000, $2.3 million and $62,000 related to these agreements in 2004, 2003 and 2002, respectively. These agreements expired in 2004.
The Company has also entered into various sublease agreements for office space formerly occupied by the Company. The Company received approximately $1.2 million, $537,000 and $704,000 in 2004, 2003 and 2002, respectively under these agreements. These agreements expired in 2004.
In the ordinary course of business, the Company sells whole pools of loans with recourse for borrower defaults. ForWhen whole pools are sold as opposed to securitized, the third party has recourse against the Company for certain borrower defaults. Because the loans that have been sold with recourse and are no longer on the Company’s balance sheet, the recourse component is considered a guarantee. TheDuring 2006 the Company sold no$2.2 billion of loans with recourse for borrower defaults in 2004,as compared to $151.2$1.1 billion in 2005. The Company maintained a $24.8 million in 2003. The Company’s reserve related to these guarantees totaled $45,000 and $41,000 as of December 31, 2004 and 2003, respectively.2006 compared with a reserve of $2.3 million as of December 31, 2005. During the course of 2006 the Company paid $21.3 million in cash to repurchase loans sold to third parties. In 2005, the Company paid $2.3 million in cash to repurchase loans sold to third parties.
In the ordinary course of business, the Company sells loans with recourse where a defect occurredto securitization trusts and guarantees losses suffered by the trusts resulting from defects in the loan origination process and guarantees to cover investor losses should origination defects occur.process. Defects may occur in the loan documentation and underwriting process, either through processing errors made by the Company or through intentional or unintentional misrepresentations made by the borrower or agents during those processes. If a defect is identified, the Company is required to repurchase the loan. As of December 31, 20042006 and 2003,2005 the Company had loans sold with recourse with an outstanding principal balance of $11.4$12.6 billion and $6.4$12.7 billion, respectively. RepurchasesHistorically, repurchases of loans where a defect has occurred have been insignificant.insignificant; therefore, the Company has recorded no reserves related to these guarantees.
The Company leases office space under various operating lease agreements. Rent expense for 2006, 2005 and 2004, aggregated $8.7 million, $11.0 million and $15.9 million, respectively. At December 31, 2006, future minimum lease commitments under those leases are as follows (dollars in thousands):
Lease Obligations | |||
2007 | $ | 11,656 | |
2008 | 11,395 | ||
2009 | 10,764 | ||
2010 | 7,958 | ||
2011 | 2,580 | ||
Thereafter | 1,374 | ||
The Company has entered into various lease agreements in which the lessor agreed to repay the Company for certain existing lease obligations. The Company has recorded deferred lease incentives related to these payments which will be amortized into rent expense over the life of the respective lease on a straight-line basis. Deferred lease incentives as of December 31, 2006 and 2005 were $3.0 million and $3.5 million, respectively.
The Company has also entered into various sublease agreements for office space formerly occupied by the Company. The Company received approximately $861,000, $53,000 and $1.2 million in 2006, 2005 and 2004, respectively under these agreements. At December 31, 2006, future minimum rental receipts under those subleases are as follows (dollars in thousands):
| Lease Receipts | |||
2007 | $ | 1,101 | |
2008 | 1,130 | ||
2009 | 1,163 | ||
2010 | 405 | ||
2011 | — | ||
Thereafter | — | ||
ContingenciesContingencies. Since April 2004, a number of substantially similar class action lawsuits have been filed and consolidated into a single action in Unitedthe Untied States District Court for the Western District of Missouri. The consolidated complaint names as defendants the Company and three of itsthe Company’s executive officers as defendants and generally alleges that the defendants made public statements that were misleading for failing to disclose certain regulatory and licensing matters. The plaintiffs purport to have brought this consolidated action on behalf of all persons who purchased the Company’s common stock (and sellers of put options on the Company’s common stock) during the period October 29, 2003 through April 8, 2004. On January 14, 2005, the Company filed a motion to dismiss this action, and on May 12, 2005, the court denied such motion. On February 8, 2007, the court certified the case as a class action, and on February 20, 2007, the Company filed a motion to reconsider with the court. The Company believes that these claims are without merit and intendscontinues to vigorously defend against them.
In the wake of the securities class action, the Company has also been named as a nominal defendant in several derivative actions brought against certain of the Company’s officers and directors in Missouri and Maryland. The complaints in these actions generally claim that the defendants are liable to the Company for failing to monitor corporate affairs so as to ensure compliance with applicable state licensing and regulatory requirements.
In July 2004, an employee of NHMIApril 2005, three putative class actions filed a class and collective action lawsuit against NHMI and NMIcertain of its affiliates were consolidated for pre-trial proceedings in the California superior Court for the County of Los Angeles. Subsequently, NHMI and NMI removed the matter to the United States District courtCourt for the CentralSouthern District of California.Georgia entitledIn Re NovaStar Home Mortgage, Inc. Mortgage Lending Practices Litigation. These cases contend that NHMI improperly shared settlement service fees with limited liability companies in which NHMI had an interest (the “LLCs”), in violation of the fee splitting and anti-referral provisions of the federal Real Estate Settlement Procedures Act (“RESPA”), and also allege certain violations of state law and civil conspiracy. Plaintiffs seek treble damages with respect to the RESPA claims, disgorgement of fees with respect to the state law claims as well as other damages, injunctive relief, and attorneys’ fees. In addition, two other related class actions have been filed in state courts.Miller v. NovaStar Financial, Inc., et al., was filed in October 2004 in the Circuit Court of Madison County, Illinois andJones et al. v. NovaStar Home Mortgage, Inc., et al., was filed in December 2004 in the Circuit Court for Baltimore City, Maryland. In theMiller case, plaintiffs allege a violation of the Illinois Consumer Fraud and Deceptive Practices Act and civil conspiracy and contend certain LLCs provided settlement services without the borrower’s knowledge. The plaintiff brought this classplaintiffs in theMiller case seek a disgorgement of fees, other damages, injunctive relief and collective actionattorney’s fees on behalf of herselfthe class of plaintiffs. In theJones case, the plaintiffs allege the LLCs violated the Maryland Mortgage Lender Law by acting as lenders and/or brokers in Maryland without proper licenses and all past and present employees of NHMI and NMI who were employed since May 1, 2000contend this arrangement amounted to a civil conspiracy. The plaintiffs in the capacity generally described as Loan Officer. The plaintiff alleged that NHMIJones case seek a disgorgement of fees and NMI failed to pay her and the membersattorney’s fees. In January 2007, all of the class she purported to represent overtime premium and minimum wage as required by the Fair Labor Standards Act and California state laws for the period commencing May 1, 2000. In January 2005, the plaintiffplaintiffs and NHMI agreed upon a nationwide settlement in the nominal amount of $3.1 million on behalf of a class of all NHMI Loan Officers nationwide. The settlement, which is subject to court approval, covers all minimum wage and overtime claims going back to July 30, 2001, and includes the dismissal with prejudice of the claims against NMI.settlement. Since not all class members will elect to be part of the settlement, the Company estimated the probable obligation related to the settlement to be in a range of $1.3$3.9 million to $1.7$4.7 million. In accordance with SFAS No. 5, “Accounting for Contingencies”, the Company recorded a charge to earnings of $1.3$3.9 million in 2004.December of 2006. This amount is included in “Accounts payable and other liabilities” on our consolidated balance sheet and included in “Professional and outside services” on our consolidated statement of income.
In December 2005, a putative class action was filed against NMI in the United States District Court for the Western District of Washington entitledPierce et al. v. NovaStar Mortgage, Inc. Plaintiffs contend that NMI failed to disclose prior to closing that a broker payment would be made on their loans, which was an unfair and deceptive practice in violation of the Washington Consumer Protection Act. Plaintiffs seek excess interest charged, and treble damages as provided in the Washington Consumer Protection Act and attorney’s fees. On October 31, 2006, the district court granted plaintiffs’ motion to certify a Washington state class. NMI sought to appeal the grant of class certification; however, a panel of the Ninth Circuit Court of Appeals denied the request for interlocutory appeal so review of the class certification order must wait until after a final judgment is entered, if necessary. The case is set for trial on April 23, 2007. NMI believes that it has valid defenses to plaintiffs’ claims and it intends to vigorously defend against them.
In December 2005, a putative class action was filed against NHMI in the United States District Court for the Middle District of Louisiana entitledPearson v. NovaStar Home Mortgage, Inc. Plaintiff contends that NHMI violated the federal Fair Credit Reporting Act (“FCRA”) in connection with its use of pre-approved offers of credit. Plaintiff seeks (on his own behalf, as well as for others similarly situated) statutory damages, other nominal damages, punitive damages and attorney’s fees and costs. In January 2007, the named plaintiff and NHMI agreed to settle the lawsuit for a nominal amount.
In February, 2007, two putative class actions were filed in the United States District Court for the Western District of Missouri. The complaints name the Company and three of the Company’s executive officers as defendants and generally allege, among other things, that the defendants made materially false and misleading statements regarding the Company’s business and financial results. The plaintiffs purport to have brought the actions on behalf of all persons who purchased or otherwise acquired common stock of the Company during the period May 4, 2006 through February 20, 2007. The Company believes that these claims are without merit and will vigorously defend against them.
In addition to those matters listed above, the Company is currently a party to various other legal proceedings and claims. claims, including, but not limited to, breach of contract claims, class action or individual claims for violations of the RESPA, FLSA, federal and state laws prohibiting employment discrimination, federal and state laws prohibiting discrimination in lending and federal and state licensing and consumer protection laws.
While management, including internal counsel, currently believes that the ultimate outcome of all these proceedings and claims individually and in the aggregate, will not have a material adverse effect on the Company’s financial condition or results of operations, litigation is subject to inherent uncertainties. If an unfavorable ruling were to occur, there exists the possibility of a material adverse impact on the Company’s financial condition and results of operations for the period in which the ruling occurs.
In April 2004, the Company also received notice of an informal inquiry from the Securities & Exchange Commission requesting that it provide various documents relating to its business. The Company has been cooperating fully with the Commission’s inquiry.operations.
Note 9. Stockholders’10. Shareholders’ Equity
In November 2004, the Company completed a public offering of 1,725,000 shares of its common stock at $42.50 per share. The Company raised $70.1 million in net proceeds from this offering.
In the first quarter of 2004, the Company sold 2,990,000 shares of Series C Cumulative Redeemable Perpetual PreferredCompany’s Direct Stock raising $72.1 million in net proceeds. The shares have a liquidation value of $25.00 per sharePurchase and pay an annual coupon of 8.90% and are not convertible into any other securities. The Company may, at its option, redeem the preferred stock, in the aggregate or in part, at any time on or after January 22, 2009. As such, this stock is not considered mandatorily or contingently redeemable under the provisions of SFAS 150,Accounting for Certain Financial Instruments with Characteristics of both Liabilities and Equity and is therefore classified as a component of equity.
On May 21, 2003, the Company completed a public offering of 1,207,500 shares of its common stock at $22.13 per share. The Company raised $25.2 million in net proceeds from this offering. The Company completed another public offering of 1,403,000 shares of its common stock at $38.50 per share on November 7, 2003, resulting in $51.7 million in net proceeds.
On May 2, 2003, the Company established a direct stock purchase and dividend reinvestment plan. TheDividend Reinvestment Plan (“DRIP”) allows for the purchase of stock directly from the Company and/or the automatic reinvestment of all or a percentage of the dividends shareholders receive. The Planreceive and allows for a discount from market of up to 3%. During 2006 the Company sold 2,938,200 shares of its common stock under the DRIP at a weighted average discount of 1.6%, resulting in net proceeds of $85.4 million. During 2005 the Company sold 2,609,320 shares of its common stock under the DRIP at a weighted average discount of 2.0%, resulting in net proceeds of $83.6 million.
The Company also sold 1,104,4882,000,000 shares of its common stock during 2004 at2006 in a weighted average discountregistered controlled equity offering. The Company raised $57.5 million in proceeds from these sales, which were net of 1.4%. Net proceeds$0.5 million in expenses related to the offering.
During the years ended December 31, 2006 and 2005, 130,444 and 148,797 shares of $51.2common stock were issued under the Company’s stock-based compensation plan, respectively. Proceeds of $0.6 million and $0.7 million were raisedreceived under these sales of common stock. Under the Plan,issuances during 2006 and 2005, respectively.
On January 20, 2006, the Company sold 578,120initiated offers to rescind certain shares of its common stock during 2003 atissued pursuant to its 401(k) plan and DRIP that may have been sold in a weighted average discountmanner that may not have complied with the registration requirements of 1.9%. Net proceeds of $17.0 million were raised under these sales of common stock.
applicable securities laws. The Board of Directors declared a two-for-one splitCompany repurchased 493 shares of its common stock providing shareholders of recordfrom eligible investors who accepted the rescission offers as of November 17, 2003, with one additional shareMarch 31, 2006, the date the rescission offers expired.
In June 2005, the Company completed a firm-commitment underwritten public offering of 1,725,000 shares of its common stock for each share owned.at $35.00 per share. The additional shares resultingCompany raised $57.9 million in net proceeds from the split were issued on December 1, 2003 increasing the number of common shares outstanding to 24.1 million. Share amounts and earnings per share disclosures for 2002 have been restated to reflect the stock split.this offering.
The Company’s Board of Directors has approved the purchase of up to $9 million of the Company’s common stock. No shares were purchasedrepurchased during the three years ended December 31,2005 and 2004. Under Maryland law, shares purchased under this plan are to be returned to the Company’s authorized but unissued shares of common stock. Common stock purchased under this plan is charged against additional paid-in capital.
In connection with various regulatory lending requirements, certain wholly-owned subsidiaries of the Company are required to maintain minimum levels of net worth. At December 31, 2004,2006, the highest minimum net worth requirement applicable to eachany subsidiary was $250,000. TheAll wholly-owned subsidiaries were in compliance with these requirements as of December 31, 2004.2006.
The following is a rollforward of accumulated other comprehensive income for the three years ended December 31, 2004 (in thousands):
Available- for-Sale | Derivative Used in Cash Flow | Total | ||||||||||
Balance, January 1, 2002 | $ | 16,990 | $ | (7,813 | ) | $ | 9,177 | |||||
Change in unrealized gain (loss), net of related tax effects | 55,649 | (11,492 | ) | 44,157 | ||||||||
Net settlements reclassified to earnings | — | 9,704 | 9,704 | |||||||||
Other amortization | — | (103 | ) | (103 | ) | |||||||
Other comprehensive income (loss) | 55,649 | (1,891 | ) | 53,758 | ||||||||
Balance, December 31, 2002 | 72,639 | (9,704 | ) | 62,935 | ||||||||
Change in unrealized gain (loss), net of related tax effects | 15,086 | (1,038 | ) | 14,048 | ||||||||
Net settlements reclassified to earnings | — | 8,303 | 8,303 | |||||||||
Other amortization | — | (103 | ) | (103 | ) | |||||||
Other comprehensive income | 15,086 | 7,162 | 22,248 | |||||||||
Balance, December 31, 2003 | 87,725 | (2,542 | ) | 85,183 | ||||||||
Change in unrealized (loss), net of related tax effects | (24,398 | ) | (38 | ) | (24,436 | ) | ||||||
Impairment reclassified to earnings | 15,902 | — | 15,902 | |||||||||
Net settlements reclassified to earnings | — | 2,497 | 2,497 | |||||||||
Other amortization | — | (26 | ) | (26 | ) | |||||||
Other comprehensive income (loss) | (8,496 | ) | 2,433 | (6,063 | ) | |||||||
Balance, December 31, 2004 | $ | 79,229 | $ | (109 | ) | $ | 79,120 | |||||
Note 10.11. Derivative Instruments and Hedging Activities
The Company’s objective and strategy for using derivative instruments is to mitigate the risk of increased costs on its variable rate liabilities during a period of rising rates. The Company’s primary goals for managing interest rate risk are to maintain the net interest margin between its assets and liabilities and diminish the effect of changes in general interest rate levels on the market value of the Company.
The derivative instruments used by the Company to manage this risk are interest rate caps and interest rate swaps. Interest rate caps are contracts in which the Company pays either an upfront premium or monthly or quarterly premium to a counterparty. In return, the Company receives payments from the counterparty when interest rates rise above a certain rate specified in the contract. During 2004, 20032006, 2005 and 2002,2004, premiums paid related to interest rate cap agreements aggregated $1.6$1.3 million, $7.4$2.4 million and $3.9$1.6 million, respectively. When premiums are financed by the Company, a liability is recorded for the premium obligation. Premiums due to counterparties as of December 31, 20042006 and 20032005 were $1.9$3.9 million and $3.5$3.4 million, respectively, and bear a weighted average interest rate of 1.9%4.0% and 3.5% in 20042006 and 2003.2005, respectively. The future contractual maturities of premiums due to counterparties as of December 31, 20042006 are $1.8 million, $1.4 million, $0.5 million and $0.5$0.2 million due in 2005years 2007, 2008, 2009 and 2006,2010, respectively. The interest rate swap agreements to which the Company is party stipulate that the Company pay a fixed rate of interest to the counterparty and the counterparty pays the company a variable rate of interest based on the notional amount of the contract. The liabilities the Company hedges are asset-backed bonds and borrowings under its mortgage loan and mortgage security repurchase agreements as discussed in Note 7.8.
All of theThe Company’s derivative instruments that meet the hedge accounting criteria of SFAS No. 133 are considered cash flow hedges. During the three years ended December 31, 2004, there was no hedge ineffectiveness. The Company also has derivative instruments that do not meet the requirements for hedge accounting. However, these derivative instruments alsodo contribute to the Company’s overall risk management strategy by serving to reduce interest rate risk on average short-term borrowings used to fundcollateralized by the Company’s loans held-for-sale.
The following tables present derivative instruments as of December 31, 20042006 and 20032005 (dollars in thousands):
| Notional Amount | Fair Value | Maximum Days to Maturity | Notional Amount | Fair Value | Maximum Days to Maturity | ||||||||||||
As of December 31, 2004: | |||||||||||||||||
As of December 31, 2006: | |||||||||||||||||
Non-hedge derivative instruments | $ | 1,375,000 | $ | 7,111 | 1,606 | ||||||||||||
Cash flow hedge derivative instruments | $ | 35,000 | $ | (179 | ) | 84 | 810,000 | 4,050 | 756 | ||||||||
As of December 31, 2005: | |||||||||||||||||
Non-hedge derivative instruments | 1,965,000 | 12,141 | 1,089 | $ | 1,555,000 | $ | 8,395 | 1,820 | |||||||||
Total derivative instruments | $ | 2,000,000 | $ | 11,962 | |||||||||||||
As of December 31, 2003: | |||||||||||||||||
Cash flow hedge derivative instruments | $ | 250,000 | $ | (3,224 | ) | 450 | |||||||||||
Non-hedge derivative instruments | 2,085,144 | 1,255 | 1,090 | ||||||||||||||
Total derivative instruments | $ | 2,335,144 | $ | (1,969 | ) | ||||||||||||
The Company recognized $3.1net (income) expense of $(0.3) million, $9.4$0.2 million and $10.3$3.1 million during the three years ended December 31, 2006, 2005 and 2004, 2003 and 2002, respectively, in net expense on derivative instruments qualifying as cash flow hedges, which is recorded as a component of interest expense.
During the three years ended December 31, 2006, hedge ineffectiveness was insignificant. The net amount included in other comprehensive income expected to be reclassified into earnings within the next twelve months is a charge to earningsincome of approximately $179,000 ($109,000, net of income tax benefit).$163,000.
The derivative financial instruments we usethe Company uses also subject usthem to “margin call” risk. The Company’s deposits with derivative counterparties were $6.7$5.7 million and $20.9$4.4 million as of December 31, 20042006 and 2003,2005, respectively.
The Company’s derivative instruments involve, to varying degrees, elements of credit and market risk in addition to the amount recognized in the consolidated financial statements.
Credit RiskThe Company’s exposure to credit risk on derivative instruments is limitedequal to the amount of deposits (margin) held by the counterparty, plus any net receivable due from the counterparty, plus the cost of replacing the contracts should the counterparty fail. The Company seeks to minimize credit risk through the use of credit approval and review processes, the selection of only the most creditworthy counterparties, continuing review and monitoring of all counterparties, exposure reduction techniques and thorough legal scrutiny of agreements. Before engaging in negotiated derivative transactions with any counterparty, the Company has in place fully executed written agreements. Agreements with counterparties also call for full two-way netting of payments. Under these agreements, on each payment exchange date all gains and losses of counterparties are netted into a single amount, limiting exposure to the counterparty to any net receivable amount due.
Market RiskThe potential for financial loss due to adverse changes in market interest rates is a function of the sensitivity of each position to changes in interest rates, the degree to which each position can affect future earnings under adverse market conditions, the source and nature of funding for the position, and the net effect due to offsetting positions. The derivative instruments utilized leave the Company in a market position that is designed to be a better position than if the derivative instrument had not been used in interest rate risk management.
Other Risk ConsiderationsThe Company is cognizant of the risks involved with derivative instruments and has policies and procedures in place to mitigate risk associated with the use of derivative instruments in ways appropriate to its business activities, considering its risk profile as a limited end-user.
Note 11.12. Comprehensive Income
Comprehensive income includes revenues, expenses, gains and losses that are not included in net income. The following is a rollforward of accumulated other comprehensive income for the three years ended December 31, 2006 (dollars in thousands):
| For the Year Ended December 31, | |||||||||||
| 2006 | 2005 | 2004 | |||||||||
Net Income | $ | 72,938 | $ | 139,124 | $ | 115,389 | |||||
Other comprehensive (loss) income: | |||||||||||
Change in unrealized gain on mortgage securities – available-for-sale, net of tax | (99,703 | ) | 14,690 | (24,462 | ) | ||||||
Change in unrealized gain on mortgage securities – available-for-sale due to repurchase of mortgage loans from securitization trusts | (5,153 | ) | — | — | |||||||
Impairment on mortgage securities - available-for-sale reclassified to earnings | 30,009 | 17,619 | 15,902 | ||||||||
Reclassification adjustment into income for derivatives used in cash flow hedges | (315 | ) | 109 | 2,497 | |||||||
Change in unrealized gain on derivative instruments used in cash flow hedges | 172 | — | — | ||||||||
Other comprehensive (loss) income | (74,990 | ) | 32,418 | (6,063 | ) | ||||||
Total comprehensive (loss) income | $ | (2,052 | ) | $ | 171,542 | $ | 109,326 | ||||
Note 13. Interest Income
The following table presents the components of interest income for the years ended December 31, 2006, 2005 and 2004 (dollars in thousands):
| For the Year Ended December 31, | |||||||||
| 2006 | 2005 | 2004 | |||||||
Interest income: | |||||||||
Mortgage securities | $ | 164,858 | $ | 188,856 | $ | 133,633 | |||
Mortgage loans held-for-sale | 157,807 | 105,104 | 83,571 | ||||||
Mortgage loans held-in-portfolio | 134,604 | 4,311 | 6,673 | ||||||
Other interest income (A) | 37,621 | 22,456 | 6,968 | ||||||
Total interest income | $ | 494,890 | $ | 320,727 | $ | 230,845 | |||
| (A) | Other interest income includes interest earned on funds the Company holds as custodian, interest from corporate operating cash and interest earned on the Company’s warehouse notes receivable. |
Note 14. Interest Expense
The following table presents the components of interest expense for the years ended December 31, 2006, 2005 and 2004 (dollars in thousands):
| For the Year Ended December 31, | |||||||||
| 2006 | 2005 | 2004 | |||||||
Interest expense: | |||||||||
Short-term borrowings secured by mortgage loans | $ | 121,628 | $ | 58,492 | $ | 31,411 | |||
Short-term borrowings secured by mortgage securities | 14,237 | 1,770 | 4,836 | ||||||
Other short-term borrowings | 488 | — | — | ||||||
Asset-backed bonds secured by mortgage loans | 88,117 | 1,810 | 2,980 | ||||||
Asset-backed bonds secured by mortgage securities | 3,860 | 15,628 | 13,255 | ||||||
Junior subordinated debentures | 7,001 | 3,055 | — | ||||||
Total interest expense | $ | 235,331 | $ | 80,755 | $ | 52,482 | |||
Note 15. Discontinued Operations
Prior to 2004, the Company was party to limited liability company (“LLC”) agreements governing LLCs formed to facilitate the operation of retail mortgage broker businesses as branches of Novastar Home Mortgage, Inc (NHMI). The LLC agreements provided for initial capitalization and membership interests of 99.99% to each branch manager and 0.01% to the Company. The Company accounted for its interest in the LLC agreements using the equity method of accounting. In December 2003, the Company determined it would terminate the LLCs effective January 1, 2004. During February 2004, the Company notified the branch managers of the LLCs that the Company was terminating these agreements effective January 1, 2004.
On November 4, 2005, the Company adopted a formal plan to terminate substantially all of the remaining NHMI branches by June 30, 2006. As of June 30, 2006, the Company had terminated all of the remaining NHMI branches and related operations. The Company considers a branch to be discontinued upon its termination date, which is the point in time when the operations cease. The Company has presented the operating results of NHMI as discontinued operations in the consolidated statements of income for the years ended December 31, 2006, 2005 and 2004.
The operating results of all discontinued operations are summarized as follows (dollars in thousands):
| For the Year Ended December 31, | ||||||||||||
| 2006 | 2005 | 2004 | ||||||||||
Interest income | $ | 230 | $ | 790 | $ | 41 | ||||||
Interest expense | (194 | ) | (88 | ) | (108 | ) | ||||||
Gains on sales of mortgage assets | 1,490 | 3,025 | — | |||||||||
Fee income | 6,056 | 36,605 | 134,250 | |||||||||
Other income (expense) | 154 | (81 | ) | 19 | ||||||||
General and administrative expenses | (14,531 | ) | (58,886 | ) | (171,707 | ) | ||||||
Loss before income tax benefit | (6,795 | ) | (18,635 | ) | (37,505 | ) | ||||||
Income tax benefit | (2,528 | ) | (6,932 | ) | (13,952 | ) | ||||||
Loss from discontinued operations | $ | (4,267 | ) | $ | (11,703 | ) | $ | (23,553 | ) | |||
As of December 31, 2006, the Company had $1.0 million in cash, $4.4 million in deferred income tax asset, net, $0.5 million in other assets and $7.3 in payables included in accounts payable and other liabilities pertaining to discontinued operations, which are included in the consolidated balance sheets. As of December 31, 2005, the Company had $5.6 million in cash, $7.4 million in mortgage loans held-for-sale, $4.6 million in deferred income tax asset, net, $1.5 million in other assets, $7.4 million in short-term borrowings secured by mortgage loans and $5.2 million in payables included in accounts payable and other liabilities pertaining to discontinued operations, which are included in the consolidated balance sheets.
Note 16. Segment Reporting
The Company reviews, manages and operates its business in three segments: mortgage portfolio management, mortgage lending and loan servicing. The Company’s branch operations segment was discontinued as of June 30, 2006, therefore the Company no longer considers it as a segment. The branch operations are now included as part of the mortgage lending segment and are presented as discontinued operations. The prior period results have been reclassified to reflect this change. Mortgage portfolio management operating results are driven from the income generated on the assets the Company manages less associated costs. Mortgage lending operations include the marketing, underwriting and funding of loan production as well as the results of NHMI, a wholly owned subsidiary of the Company, which has been presented as a discontinued operation. Loan servicing operations represent the income and costs to service the Company’s portfolio of loans.
Following is a summary of the operating results of the Company’s segments for the years ended December 31, 2006, 2005 and 2004, as reclassified to reflect the change in segment structure and the results of the discontinued operations for the years ended December 31, 2005 and December 31, 2004 (dollars in thousands):
For the Year Ended December 31, 2006
| Mortgage Portfolio Management | Mortgage Lending | Loan Servicing | Eliminations | Total | ||||||||||||||||
Interest income | $ | 303,600 | $ | 162,631 | $ | 28,659 | $ | — | $ | 494,890 | ||||||||||
Interest expense | 124,333 | 128,024 | — | (17,026 | ) | 235,331 | ||||||||||||||
Net interest income before provision for credit losses | 179,267 | 34,607 | 28,659 | 17,026 | 259,559 | |||||||||||||||
Provision for credit losses | (30,131 | ) | — | — | — | (30,131 | ) | |||||||||||||
Gains on sales of mortgage assets | 362 | 60,693 | — | (19,306 | ) | 41,749 | ||||||||||||||
Premiums for mortgage loan insurance | (6,269 | ) | (6,150 | ) | — | — | (12,419 | ) | ||||||||||||
Fee income | 4,987 | 5,738 | 24,641 | (6,334 | ) | 29,032 | ||||||||||||||
Gains on derivative instruments | 109 | 11,889 | — | — | 11,998 | |||||||||||||||
Impairment on mortgage securities – available- for-sale | (30,690 | ) | — | — | — | (30,690 | ) | |||||||||||||
Other income (expense), net | 13,646 | (2,307 | ) | — | (10,692 | ) | 647 | |||||||||||||
General and administrative expenses | (16,012 | ) | (150,281 | ) | (34,968 | ) | — | (201,261 | ) | |||||||||||
Income (loss) from continuing operations before income tax expense | 115,269 | (45,811 | ) | 18,332 | (19,306 | ) | 68,484 | |||||||||||||
Income tax expense (benefit) | 9,466 | (18,054 | ) | 7,020 | (7,153 | ) | (8,721 | ) | ||||||||||||
Income (loss) from continuing operations | 105,803 | (27,757 | ) | 11,312 | (12,153 | ) | 77,205 | |||||||||||||
Loss from discontinued operations, net of income tax | — | (4,267 | ) | — | — | (4,267 | ) | |||||||||||||
Net income (loss) | $ | 105,803 | $ | (32,024 | ) | $ | 11,312 | $ | (12,153 | ) | $ | 72,938 | ||||||||
December 31, 2006: | ||||||||||||||||||||
Total assets | $ | 3,234,848 | $ | 2,137,297 | $ | 41,123 | $ | (385,005 | ) | $ | 5,028,263 | |||||||||
For the Year Ended December 31, 2005
| Mortgage Portfolio Management | Mortgage Lending | Loan Servicing | Eliminations | Total | ||||||||||||||||
Interest income | $ | 196,407 | $ | 106,069 | $ | 18,251 | $ | $ | 320,727 | |||||||||||
Interest expense | 19,028 | 74,646 | — | (12,919 | ) | 80,755 | ||||||||||||||
Net interest income before provision for credit losses | 177,379 | 31,423 | 18,251 | 12,919 | 239,972 | |||||||||||||||
Provision for credit losses | (1,038 | ) | — | — | — | (1,038 | ) | |||||||||||||
(Losses) gains on sales of mortgage assets | (27 | ) | 67,248 | — | (2,073 | ) | 65,148 | |||||||||||||
Premiums for mortgage loan insurance | (341 | ) | (5,331 | ) | — | — | (5,672 | ) | ||||||||||||
Fee income | — | 9,174 | 21,755 | (251 | ) | 30,678 | ||||||||||||||
Gains on derivative instruments | 248 | 17,907 | — | — | 18,155 | |||||||||||||||
Impairment on mortgage securities – available- for-sale | (17,619 | ) | — | — | — | (17,619 | ) | |||||||||||||
Other income (expense), net | 19,671 | (7,788 | ) | — | (12,667 | ) | (784 | ) | ||||||||||||
General and administrative expenses | (14,450 | ) | (135,665 | ) | (34,515 | ) | — | (184,630 | ) | |||||||||||
Income (loss) from continuing operations before income tax expense | 163,823 | (23,032 | ) | 5,491 | (2,072 | ) | 144,210 | |||||||||||||
Income tax expense (benefit) | 168 | (8,035 | ) | 2,062 | (812 | ) | (6,617 | ) | ||||||||||||
Income (loss) from continuing operations | 163,655 | (14,997 | ) | 3,429 | (1,260 | ) | 150,827 | |||||||||||||
Loss from discontinued operations, net of income tax | — | (11,703 | ) | — | (11,703 | ) | ||||||||||||||
Net income (loss) | $ | 163,655 | $ | (26,700 | ) | $ | 3,429 | $ | (1,260 | ) | $ | 139,124 | ||||||||
December 31, 2005: | ||||||||||||||||||||
Total assets | $ | 968,740 | $ | 1,508,283 | $ | 27,553 | $ | (168,842 | ) | $ | 2,335,734 | |||||||||
For the Year Ended December 31, 2004
| Mortgage Portfolio Management | Mortgage Lending | Loan Servicing | Eliminations | Total | ||||||||||||||||
Interest income | $ | 142,960 | $ | 83,718 | $ | 4,167 | $ | — | $ | 230,845 | ||||||||||
Interest expense | 21,071 | 39,658 | — | (8,247 | ) | 52,482 | ||||||||||||||
Net interest income before provision for credit losses | 121,889 | 44,060 | 4,167 | 8,247 | 178,363 | |||||||||||||||
Provision for credit losses | (726 | ) | — | — | — | (726 | ) | |||||||||||||
Gains on sales of mortgage assets | 360 | 147,390 | — | (2,800 | ) | 144,950 | ||||||||||||||
Premiums for mortgage loan insurance | (528 | ) | (3,690 | ) | — | — | (4,218 | ) | ||||||||||||
Fee income | — | 10,399 | 20,692 | (423 | ) | 30,668 | ||||||||||||||
Losses on derivative instruments | (111 | ) | (8,794 | ) | — | — | (8,905 | ) | ||||||||||||
Impairment on mortgage securities – available- for-sale | (15,902 | ) | — | — | — | (15,902 | ) | |||||||||||||
Other income (expense), net | 13,997 | (6,445 | ) | — | (7,824 | ) | (272 | ) | ||||||||||||
General and administrative expenses | (7,473 | ) | (136,089 | ) | (24,698 | ) | — | (168,260 | ) | |||||||||||
Income from continuing operations before income tax expense | 111,506 | 46,831 | 161 | (2,800 | ) | 155,698 | ||||||||||||||
Income tax expense | — | 16,722 | 160 | (126 | ) | 16,756 | ||||||||||||||
Income from continuing operations | 111,506 | 30,109 | 1 | (2,674 | ) | 138,942 | ||||||||||||||
Loss from discontinued operations, net of income tax | — | (23,553 | ) | — | (23,553 | ) | ||||||||||||||
Net income | $ | 111,506 | $ | 6,556 | $ | 1 | $ | (2,674 | ) | $ | 115,389 | |||||||||
December 31, 2004 | ||||||||||||||||||||
Total assets | $ | 1,078,064 | $ | 929,621 | $ | 21,022 | $ | (167,396 | ) | $ | 1,861,311 | |||||||||
Intersegment revenues and expenses that were eliminated in consolidation were as follows for the years ended 2006, 2005 and 2004 (dollars in thousands):
| 2006 | 2005 | 2004 | ||||||||||
Amounts paid to (received from) mortgage portfolio management from (to) mortgage lending: | ||||||||||||
Interest income on intercompany debt | $ | 17,026 | $ | 12,819 | $ | 8,200 | ||||||
Guaranty, commitment, loan sale and securitization fees | 5,061 | 9,494 | 10,833 | |||||||||
Interest income on warehouse borrowings | — | 100 | 47 | |||||||||
Gains on sales of mortgage securities – available-for-sale retained in securitizations | (2,462 | ) | (2,073 | ) | (2,800 | ) | ||||||
Gains on sales of mortgage loans | (16,844 | ) | — | — | ||||||||
Amounts paid to (received from) mortgage portfolio management from (to) loan servicing: | ||||||||||||
Loan servicing fees | $ | (6,264 | ) | $ | (251 | ) | $ | (423 | ) | |||
Amounts paid to (received from) mortgage lending from (to) loan servicing: | ||||||||||||
Loan servicing fees | $ | (70 | ) | $ | — | $ | — | |||||
Note 17. Earnings Per Share
The computations of basic and diluted earnings per share for the years ended December 31, 2006, 2005 and 2004 are as follows (dollars in thousands, except per share amounts):
| For the Year Ended December 31, | ||||||||||||
| 2006 | 2005 | 2004 | ||||||||||
Numerator: | ||||||||||||
Income from continuing operations | $ | 77,205 | $ | 150,827 | $ | 138,942 | ||||||
Dividends on preferred shares | (6,653 | ) | (6,653 | ) | (6,265 | ) | ||||||
Income from continuing operations available to common shareholders | 70,552 | 144,174 | 132,677 | |||||||||
Loss from discontinued operations, net of income tax | (4,267 | ) | (11,703 | ) | (23,553 | ) | ||||||
Net income available to common shareholders | $ | 66,285 | $ | 132,471 | $ | 109,124 | ||||||
Denominator: | ||||||||||||
Weighted average common shares outstanding – basic | 34,212 | 29,669 | 25,290 | |||||||||
Weighted average common shares outstanding – dilutive: | ||||||||||||
Weighted average common shares outstanding – basic | 34,212 | 29,669 | 25,290 | |||||||||
Stock options | 237 | 316 | 435 | |||||||||
Restricted stock | 23 | 8 | 38 | |||||||||
Weighted average common shares outstanding – dilutive | 34,472 | 29,993 | 25,763 | |||||||||
Basic earnings per share: | ||||||||||||
Income from continuing operations | $ | 2.26 | $ | 5.09 | $ | 5.49 | ||||||
Dividends on preferred shares | (0.19 | ) | (0.23 | ) | (0.25 | ) | ||||||
Income from continuing operations available to common shareholders | 2.07 | 4.86 | 5.24 | |||||||||
Loss from discontinued operations, net of income tax | (0.13 | ) | (0.40 | ) | (0.93 | ) | ||||||
Net income available to common shareholders | $ | 1.94 | $ | 4.46 | $ | 4.31 | ||||||
Diluted earnings per share: | ||||||||||||
Income from continuing operations | $ | 2.23 | $ | 5.03 | $ | 5.39 | ||||||
Dividends on preferred shares | (0.19 | ) | (0.22 | ) | (0.24 | ) | ||||||
Income from continuing operations available to common shareholders | 2.04 | 4.81 | 5.15 | |||||||||
Loss from discontinued operations, net of income tax | (0.12 | ) | (0.39 | ) | (0.91 | ) | ||||||
Net income available to common shareholders | $ | 1.92 | $ | 4.42 | $ | 4.24 | ||||||
The following stock options to purchase shares of common stock were outstanding during each period presented, but were not included in the computation of diluted earnings per share because the number of shares assumed to be repurchased, as calculated was greater than the number of shares to be obtained upon exercise, therefore, the effect would be antidilutive (in thousands, except exercise prices):
| For the Year Ended December 31, | |||||||||
| 2006 | 2005 | 2004 | |||||||
Number of stock options and warrants (in thousands) | 247 | 93 | 15 | ||||||
Weighted average exercise price | $ | 35.20 | $ | 40.58 | $ | 33.59 | |||
Note 18. Income Taxes
The components of income tax expense (benefit) attributable to continuing operations for the years ended December 31, 2004, 20032006, 2005 and 20022004 were as follows (in(dollars in thousands):
| For the Year Ended December 31, | For the Year Ended December 31, | |||||||||||||||||||||||
| 2004 | 2003 | 2002 | 2006 | 2005 | 2004 | |||||||||||||||||||
Current: | ||||||||||||||||||||||||
Federal | $ | 6,078 | $ | 24,181 | $ | 2,303 | $ | 105 | $ | 5,153 | $ | 16,548 | ||||||||||||
State and local | 620 | 4,527 | 318 | (237 | ) | 957 | 1,530 | |||||||||||||||||
Total current | 6,698 | 28,708 | 2,621 | (132 | ) | 6,110 | 18,078 | |||||||||||||||||
Deferred: (A) | ||||||||||||||||||||||||
Federal | (1,258 | ) | (4,926 | ) | (4,088 | ) | (7,374 | ) | (11,176 | ) | (1,258 | ) | ||||||||||||
State and local | (64 | ) | (922 | ) | (564 | ) | (1,215 | ) | (1,551 | ) | (64 | ) | ||||||||||||
Total deferred | (1,322 | ) | (5,848 | ) | (4,652 | ) | (8,589 | ) | (12,727 | ) | (1,322 | ) | ||||||||||||
Total income tax expense (benefit) | $ | 5,376 | $ | 22,860 | $ | (2,031 | ) | |||||||||||||||||
Total income tax (benefit) expense | $ | (8,721 | ) | $ | (6,617 | ) | $ | 16,756 | ||||||||||||||||
| (A) | Does not reflect the deferred tax effects of unrealized gains and losses on mortgage securities-available-for-sale and derivative financial instruments that are included in |
A reconciliation of the expected federal income tax expense (benefit) using the federal statutory tax rate of 35 percent to the taxable REIT subsidiary’sCompany’s actual income tax expense and resulting effective tax rate from continuing operations for the years ended December 31, 2004, 20032006, 2005 and 20022004 were as follows (in(dollars in thousands):
| For the Year Ended December 31, | For the Year Ended December 31, | ||||||||||||||||||||||
| 2004 | 2003 | 2002 | 2006 | 2005 | 2004 | ||||||||||||||||||
Income tax at statutory rate (taxable REIT subsidiary) | $ | 4,200 | $ | 18,102 | $ | (3,755 | ) | ||||||||||||||||
Income tax at statutory rate | $ | (7,507 | ) | $ | (6,857 | ) | $ | 14,989 | |||||||||||||||
Taxable gain on security sale to REIT | 1,342 | 2,761 | 805 | — | — | 1,342 | |||||||||||||||||
State income taxes, net of federal tax benefit | 362 | 1,549 | (442 | ) | (944 | ) | (386 | ) | 953 | ||||||||||||||
Nondeductible expenses | 240 | 228 | 117 | 423 | 601 | 240 | |||||||||||||||||
Cash surrender value of company owned life insurance | (270 | ) | — | — | |||||||||||||||||||
Reduction of estimated income tax accruals | (904 | ) | — | — | — | — | (904 | ) | |||||||||||||||
Other | 136 | 220 | 1,244 | (423 | ) | 25 | 136 | ||||||||||||||||
Total income tax expense (benefit) | $ | 5,376 | $ | 22,860 | $ | (2,031 | ) | ||||||||||||||||
Total income tax (benefit) expense | $ | (8,721 | ) | $ | (6,617 | ) | $ | 16,756 | |||||||||||||||
Significant components of the taxable REIT subsidiary’sCompany’s deferred tax assets and liabilities at December 31, 20042006 and 20032005 were as follows (in(dollars in thousands):
| December 31, | December 31, | |||||||||||||||
| 2004 | 2003 | 2006 | 2005 | |||||||||||||
Deferred tax assets: | ||||||||||||||||
Federal net operating loss carryforwards | $ | 19,055 | $ | 22,569 | ||||||||||||
Excess inclusion income | $ | 18,449 | $ | 10,242 | 10,884 | 16,489 | ||||||||||
Basis difference - investments | 10,639 | — | ||||||||||||||
Mark-to-market adjustment on held-for-sale loans | 7,866 | 2,123 | ||||||||||||||
Deferred compensation | 5,158 | 2,319 | 8,158 | 5,997 | ||||||||||||
Loan sale recourse obligations | 9,272 | 1,049 | ||||||||||||||
State net operating loss carryforwards | 2,474 | 7,469 | ||||||||||||||
Deferred lease incentive income | 1,026 | — | 2,262 | 2,353 | ||||||||||||
Deferred loan fees, net | 548 | — | ||||||||||||||
Mark-to-market adjustment on held-for-sale loans | 4,871 | 7,724 | ||||||||||||||
State net operating loss carryforwards | 2,353 | 1,470 | ||||||||||||||
Accrued expenses for branch closings | 743 | 87 | ||||||||||||||
Accrued expenses, other | 666 | 630 | 2,216 | 1,333 | ||||||||||||
Allowance for losses on loans and other real estate | 552 | 142 | ||||||||||||||
Other | 427 | 671 | 2,152 | 900 | ||||||||||||
Gross deferred tax asset | 34,793 | 23,285 | 74,978 | 60,282 | ||||||||||||
Valuation allowance | (2,353 | ) | (1,470 | ) | (685 | ) | (5,498 | ) | ||||||||
Deferred tax asset | 32,440 | 21,815 | 74,293 | 54,784 | ||||||||||||
Deferred tax liabilities: | ||||||||||||||||
Mortgage servicing rights | 16,199 | 7,677 | 23,675 | 21,246 | ||||||||||||
Mark-to-market adjustment on derivative instruments | 2,706 | — | ||||||||||||||
Premises and equipment | 2,119 | 2,319 | ||||||||||||||
Other | 226 | 1,364 | 3,430 | 2,758 | ||||||||||||
Deferred tax liability | 21,250 | 11,360 | 27,105 | 24,004 | ||||||||||||
Net deferred tax asset | $ | 11,190 | $ | 10,455 | $ | 47,188 | $ | 30,780 | ||||||||
As of December 31, 2006 NFI Holding Corporation, the taxable REIT subsidiary, has an estimated federal net operating loss carryforward of $55.9 million, which will be available to offset future taxable income. If not used, this net operating loss will expire in 2025.
The valuation allowance included in the taxable REIT subsidiary’sCompany’s deferred tax assets at December 31, 20042006 and 2003 represent2005 represents various state net operating loss carryforwards for which it is more likely than not that realization will not occur. The state net operating losses will expire in varying amounts through 2024. The $0.9 million increase in the valuation allowance for deferred tax assets resulted from state net operating losses being generated by the taxable REIT subsidiary in 2004 where realization is not expected to occur.2026.
Note 12.19. Employee Benefit Plans
The NovaStar Financial, Inc. 401(k) Plan (the Plan)“Plan”) is a defined contribution plan which allows eligible employees to save for retirement through pretax contributions. Under the Plan, employees of the Company may contribute up to the statutory limit. The Company may elect to match a certain percentage of participants’ contributions. The Company may also elect to make a discretionary contribution, which is allocated to participants based on each participant’s compensation. Contributions to the Plan by the Company for the years ended December 31, 2006, 2005 and 2004 2003were $0.8 million, $1.2 million and 2002 were $3.1 million, $2.0 million and $806,000, respectively.
The Company’sCompany has a Deferred Compensation Plan (the DCP)“DCP”) that is a nonqualified deferred compensation plan that benefits certain designated key members of management and highly compensated employees and allows them to defer payment of a portion of their compensation to future years. Under the DCP, an employee may defer up to 50% of his or her base salary, bonus and/or commissions on a pretax basis. The Company may make both voluntarydiscretionary and/or matching contributions to the DCP on behalf of DCP participants. All DCP assets are corporate assets rather than individual property and are therefore subject to creditors’ claims against the Company. The Company made contributions to the DCP for the years ended December 31, 2005 and 2004 2003of $777,000 and 2002 of $371,000, $643,000 and $482,000, respectively. The Company made no contribution to the DCP for the year ended December 31, 2006.
Note 13.20. Stock Compensation Plans
On June 8, 2004, the Company’s 1996 Stock Option Plan terminated except for outstanding awards that remain to become vested, exercised or free of restrictions and(the “1996 Plan”) was replaced by the 2004 Incentive Stock Plan (the Plan)“2004 Plan”). The 2004 Plan provides for the grant of qualified incentive stock options (ISOs)(“ISOs”), non-qualified stock options (NQSOs)(“NQSOs”), deferred stock, restricted stock, restricted stock units, performance share awards, dividend equivalent rights (DERs)(“DERs”) and stock appreciation and limited stock appreciations awards (SARs)(“SARs”). The Company has granted ISOs, NQSOs, restricted stock, restricted stock units, performance share awards and DERs. ISOs may be granted to the officers and employees of the Company. NQSOs, DERs, SARs and stock awards may be granted to the directors, officers, employees, agents and consultants of the Company or any subsidiaries. Under the terms of the Plan, the number of shares available for grant is equal toThe Company registered 2.5 million shares of common stock.stock under the 2004 Plan, of which approximately 1.9 million shares were available for future issuances as of December 31, 2006. The 2004 Plan will remain in effect unless terminated by the Board of Directors or no shares of stock remain available for awards to be granted. The Company’s policy is to issue new shares upon option exercise.
Prior to 2003, the Company accounted for stock-based compensation plans under the recognition and measurement provisions of APB No. 25 and related interpretations. Effective January 1, 2003,2006, the Company adopted the fair value recognition provisions of SFAS No. 123.123(R). The Company selected the modified prospective method of adoption described in SFAS No. 148. Compensation cost recognized in 2003 is the same as that which would have been recognized had the fair value method of SFAS No. 123 been applied from its original effective date. See Note 1.
In accordance with the provisions of SFAS No. 123 and SFAS No. 148, $1.8 million and $1.3 million ofadoption. The Company recorded stock-based compensation expense was recorded in 2004of $2.5 million, $2.2 million and 2003. In accordance with APB No. 25, total stock-based compensation expense was $2.5$1.8 million for the yearyears ended December 31, 2002.2006, 2005 and 2004, respectively. The total income tax benefit recognized in the income statement for stock-based compensation arrangements was $627,000, $411,000 and $339,000 for 2006, 2005 and 2004, respectively. As of December 31, 2006, there was $4.0 million of total unrecognized compensation cost related to non-vested share-based compensation arrangements granted. The cost is expected to be amortized over a weighted average period of 3.44 years.
All options have been granted at exercise prices greater than or equal to the estimated fair value of the underlying stock at the date of grant. Outstanding options generally vest equally over four years and expire ten years after the date of grant.
The following table summarizes activity, pricing and other information for the Company’s stock optionoptions activity for 2004, 2003 and 2002, respectively:the year ended December 31, 2006:
| 2004 | 2003 | 2002 | ||||||||||||||||
Stock Options | Shares | Weighted Average Price | Shares | Weighted Average Price | Shares | Weighted Average Price | ||||||||||||
Outstanding at the beginning of year | 746,800 | $ | 8.22 | 1,032,670 | $ | 7.40 | 1,078,840 | $ | 4.69 | |||||||||
Granted | 15,000 | 33.59 | 15,000 | 22.66 | 314,000 | 12.05 | ||||||||||||
Exercised | (305,700 | ) | 6.55 | (275,390 | ) | 5.98 | (355,250 | ) | 3.05 | |||||||||
Forfeited | (22,500 | ) | 10.50 | (25,480 | ) | 7.79 | (4,920 | ) | 8.25 | |||||||||
Outstanding at the end of year | 433,600 | $ | 10.16 | 746,800 | $ | 8.22 | 1,032,670 | $ | 7.40 | |||||||||
Exercisable at the end of year | 215,600 | $ | 7.48 | 275,050 | $ | 7.67 | 294,420 | $ | 7.63 | |||||||||
Stock Options | Number of Shares | Weighted Average Exercise Price | Weighted Average Remaining Contractual Term (Years) | Aggregate Intrinsic Value (in thousands) | ||||||||
Outstanding at the beginning of the year | 401,168 | $ | 18.39 | |||||||||
Granted | 162,040 | 31.74 | ||||||||||
Exercised | (59,000 | ) | 10.39 | |||||||||
Forfeited or expired | (6,480 | ) | 20.86 | |||||||||
Outstanding at the end of the year | 497,728 | $ | 23.65 | 7.17 | $ | 1,493 | ||||||
Exercisable at the end of the year | 287,179 | $ | 16.02 | 6.02 | $ | 3,052 | ||||||
Stock options expected to vest at the end of the year | 190,063 | $ | 27.39 | 8.70 | $ | (1,474 | ) | |||||
Options granted since 2002The total intrinsic value of options exercised during the years ended December 31, 2006, 2005 and 2004 was $1.1 million, $3.2 million and $13.5 million, respectively. The total fair value of options vested during the years ended December 31, 2006, 2005 and 2004 was $2.0 million, $1.3 million and $1.3 million, respectively.
Pursuant to a resolution of the Company’s compensation committee of the Board of Directors dated December 14, 2005, 227,455 and 70,363 options issued to employees and directors, respectively, were modified. The Company modified all options that were either unvested as of January 1, 2005 or were granted with DERs. Underduring 2005. For employee options, the termsrate at which DERs accrue was modified from sixty percent of the dividend per share amount to one hundred percent and the form in which DERs will be paid was modified from stock to cash upon vesting. For director options, only the form in which DERs will be paid was modified from stock to cash upon vesting. These options were granted and canceled during the fourth quarter of 2005. No modifications were made to the exercise prices, vesting periods or expiration dates. At the date of modification, the canceled options were revalued and the modified options were initially valued. The incremental difference between the value of the modified option and the canceled option will be amortized into compensation expense over the remaining vesting period.
For options that vested prior to January 1, 2005, a recipient is entitled to receive additional shares of stock upon the exercise of options.options as a result of DERs associated with the option. For employees, the DERs accrue at a rate equal to the number of options outstanding times sixty percent of the dividends per share amount at each dividend payment date. For directors, the DERs accrue at a rate equal to the number of options outstanding times the dividends per share amount at each dividend payment date. The accrued DERs convert to shares based on the stock’s fair value on the dividend payment date. Certain of the options exercised in 2004, 20032006, 2005 and 20022004 had DERs payable in additional shares of stock attached to them when issued. As a result of these exercises, an additional 47,969, 23,48515,793, 13,972 and 3,22647,969 shares of common stock were issued in 2004, 20032006, 2005 and 2002,2004, respectively.
DuringFor options granted after January 1, 2005, a recipient is entitled to receive DERs paid in cash upon vesting of the options. The DERs accrue at a rate equal to the number of options outstanding times the dividends per share amount at each dividend payment date. The DERs begin accruing immediately upon grant, but are not paid until the options vest.
The following table summarizes the weighted average fair value of options granted for the years ended December 31, 2006, 2005 and 2004, respectively, determined using the Black-Scholes option pricing model and the assumptions used in their determination. Expected volatilities are based on implied volatilities from traded options on the Company’s common stock. The expected life is a significant assumption as it determines the period for which the risk free interest rate, volatility and dividend yield must be applied. The expected life is the period over which employees and directors are expected to hold their options. It is based on the Company’s historical experience with similar grants. The Company’s options have DERs and accordingly, the assumed dividend yield was zero for these options.
| 2006 | 2005 (A) | 2004 | ||||||||||
Weighted average: | ||||||||||||
Fair value, at date of grant | $ | 12.48 | $ | 14.25 | $ | 21.24 | ||||||
Expected life in years | 5 | 2 | 6 | |||||||||
Annual risk-free interest rate | 4.7 | % | 4.4 | % | 4.7 | % | ||||||
Volatility | 37.5 | % | 33.3 | % | 65.2 | % | ||||||
Dividend yield | 0.0 | % | 0.0 | % | 0.0 | % | ||||||
| (A) | Includes the assumptions used in the revaluation of modified options. The weighted average expected life of newly granted options in 2005 (not including prior year granted options modified in 2005) was four. |
The Company granted and issued 41,200 shares of restricted stock at an average fair market value of $46.42.during 2006, 2005 and 2004. The 2006 restricted stock awards vest at the end of 5 years, the 2005 restricted stock awards vest at the end of 10 years and the 2004 restricted stock awards vest equally over four years. Of these shares, 800 shares were forfeited in 2004.
Additionally, during the first quarter of 2004,During 2005, the Company issued 39,112granted restricted shares to employees and officers under Performance Contingent Deferred Stock Award Agreements. Under the agreements, the Company will issue shares of restricted stock as payment for bonus compensation earnedif certain performance targets are achieved by certain executives of the Company in 2003.within a three-year period. The shares vest equally over two years upon issuance. No shares were issued at an average fair market valueunder these agreements in 2006 or 2005 and the total number of $46.42. The shares are fully vested upon issuance.which can be issued in the future is 20,655 as of December 31, 2006.
In November 2004, the Company entered into a Performance Contingent Deferred Stock Award Agreement with an executive of the Company. Under the agreement, the Company will grantissue shares of restricted stock if certain performance targets based on wholesale nonconforming origination volume are achieved by the Company within a five-year period. The shares vest equally over four years upon issuance. No shares have been granted under this award and the total number of shares that can be issued under this agreementin the future is 100,000.100,000 as of December 31, 2006.
The following table presents information on restricted stock options outstanding as of December 31, 2004.2006.
| Outstanding | Exercisable | |||||||||||
Exercise Price | Quantity | Weighted Average (Years) | Weighted Average Exercise Price | Quantity | Weighted Average Exercise Price | |||||||
$1.53 – $7.16 | 169,250 | 6.46 | $ | 4.65 | 118,500 | $ | 3.78 | |||||
$7.91 - $12.22 | 220,600 | 7.56 | 11.78 | 87,100 | 11.46 | |||||||
$12.97 - $33.59 | 43,750 | 8.43 | 23.36 | 10,000 | 16.60 | |||||||
| 433,600 | 7.22 | $ | 10.16 | 215,600 | $ | 7.48 | ||||||
| Number of Shares | Weighted Average Grant Date Fair Value | |||||
Outstanding at the beginning of year | 169,969 | $ | 27.81 | |||
Granted | 62,182 | 31.19 | ||||
Vested | (9,714 | ) | 45.36 | |||
Forfeited | (1,560 | ) | 43.51 | |||
Outstanding at the end of period | 220,877 | $ | 27.88 | |||
Note 14. Branch Operations
Prior to 2004, the Company was party to limited liability company (“LLC”) agreements governing LLC’s formed to facilitate the operationThe weighted average grant date fair value of retail mortgage broker businesses as branches of NHMI. The LLC agreements provided for initial capitalization and membership interests of 99.9% to each branch manager and 0.1% to the Company. The Company accounted for its interest in the LLC agreements using the equity method of accounting. In December 2003, the Company determined it would terminate the LLC’s effective January 1, 2004. During February 2004, the Company notified the branch managers of the limited liability companies that the Company was terminating these agreements effective January 1, 2004. Continuing branches that formerly operated under these agreements became operating units of the Company and their financial results are included in the consolidated financial statements. The inclusion resulted in expected increases in general and administrative expenses, which were substantially offset by increases in related fee income. The Company did not purchase any assets or liabilities as a result of these branches becoming operating units.
As the demand for conforming loans has declined significantlyrestricted stock granted during 2004, many branches have not been able to produce sufficient fees to meet operating expense demands. As a result of these conditions, a significant number of branch managers have voluntarily terminated employment with the Company. The Company has also terminated branches when loan production results were substandard. The Company considers a branch to be discontinued upon its termination date, which is the point in time when the operations cease. The discontinued operations apply to the branch operations segment presented in Note 15. The operating results for these discontinued operations have been segregated from the on-going operating results of the Company. The operating results of all discontinued operations are summarized as follows (in thousands):
For the Year Ended December 31, 2004 | ||||
Fee income | $ | 60,309 | ||
General and administrative expenses | 66,989 | |||
Loss before income tax benefit | (6,680 | ) | ||
Income tax benefit | (2,572 | ) | ||
Loss from discontinued operations | $ | (4,108 | ) | |
As of December 31, 2004, the Company has $1.0 million in cash, $0.2 million in receivables included in other assets and $1.2 million in payables included in accounts payable and other liabilities pertaining to discontinued operations, which are included in the consolidated balance sheets.
As of December 31, 2003, there were 423 such branches. For the years ended December 31, 20032006, 2005 and 2002, the Company recorded fee income aggregating $12.8 million2004 was $31.19, $40.96 and $5.2 million, respectively, for providing administrative services for the branches. During 2003 and 2002, the aggregate amount of loans brokered by these branches was approximately $5.7 billion and $2.2 billion,$29.90, respectively. Of those amounts, approximately $1.3 billion and $399.6 million, respectively, were acquired by the Company’s mortgage subsidiary. The aggregate premiums paid by the Company for loans brokered by these branches were approximately $15.1 million and $5.1 million for the years ended December 31, 2003 and 2002, respectively.
Note 15. Segment Reporting
The Company reviews, manages and operates its business in three segments. These business segments are: mortgage portfolio management, mortgage lending and loan servicing and branch operations. Mortgage portfolio management operating results are driven from the income generated on the assets the Company manages less associated management costs. Mortgage lending and loan servicing operations include the marketing, underwriting and funding of loan production. Servicing operations represent the income and costs to service the Company’s on and off -balance sheet loans. Branch operations include the collective income generated by NovaStar Home Mortgage, Inc. (NHMI) brokers and the associated operating costs. Also, the corporate-level income and costs to support the NHMI branches are represented in the branch operations segment. As discussed in Note 14, the LLC agreements were terminated effective January 1, 2004. Continuing branch operations that formerly operated under these agreements became operating units of the Company and their financial results are included in the consolidated financial statements. Branches that have terminated in 2004 have been segregated from the results of the ongoing operations of the Company for the year ended December 31, 2004. Following is a summary of the operating results of the Company’s primary operating units for the year ended December 31, 2004, 2003 and 2002 (in thousands):
For the Year Ended December 31, 2004
| Mortgage Portfolio Management | Mortgage Lending and | Branch Operations | Eliminations | Total | ||||||||||||||||
Interest income | $ | 140,304 | $ | 83,759 | $ | — | $ | (39 | ) | $ | 224,024 | |||||||||
Interest expense | 21,071 | 39,727 | 108 | (8,316 | ) | 52,590 | ||||||||||||||
Net interest income before credit losses | 119,233 | 44,032 | (108 | ) | 8,277 | 171,434 | ||||||||||||||
Credit losses | (726 | ) | — | — | — | (726 | ) | |||||||||||||
Gains on sales of mortgage assets | 360 | 113,211 | — | 31,379 | 144,950 | |||||||||||||||
Fee income | — | 29,269 | 129,149 | (55,662 | ) | 102,756 | ||||||||||||||
Losses on derivative instruments | (111 | ) | (8,794 | ) | — | — | (8,905 | ) | ||||||||||||
Impairment on mortgage securities – available-for-sale | (15,902 | ) | — | — | — | (15,902 | ) | |||||||||||||
Other income (expense) | 20,291 | (10,135 | ) | 35 | (7,800 | ) | 2,391 | |||||||||||||
General and administrative expenses | (7,473 | ) | (149,908 | ) | (135,842 | ) | 22,098 | (271,125 | ) | |||||||||||
Income (loss) before income tax | 115,672 | 17,675 | (6,766 | ) | (1,708 | ) | 124,873 | |||||||||||||
Income tax expense (benefit) | — | 7,540 | (2,638 | ) | 474 | 5,376 | ||||||||||||||
Income (loss) from continuing operations | 115,672 | 10,135 | (4,128 | ) | (2,182 | ) | 119,497 | |||||||||||||
Income (loss) from discontinued operations, net of income tax | — | — | (2,562 | ) | (1,546 | ) | (4,108 | ) | ||||||||||||
Net income (loss) | $ | 115,672 | $ | 10,135 | $ | (6,690 | ) | $ | (3,728 | ) | $ | 115,389 | ||||||||
December 31, 2004: | ||||||||||||||||||||
Total assets | $ | 1,078,064 | $ | 915,360 | $ | 35,283 | $ | (167,396 | ) | $ | 1,861,311 | |||||||||
For the Year Ended December 31, 2003
| Mortgage Portfolio Management | Mortgage Lending and | Branch Operations | Eliminations | Total | ||||||||||||||||
Interest income | $ | 109,542 | $ | 60,878 | $ | — | $ | — | $ | 170,420 | ||||||||||
Interest expense | 17,433 | 31,055 | — | (8,124 | ) | 40,364 | ||||||||||||||
Net interest income before credit recoveries | 92,109 | 29,823 | — | 8,124 | 130,056 | |||||||||||||||
Credit recoveries | 389 | — | — | — | 389 | |||||||||||||||
Gains (losses) on sales of mortgage assets | (1,911 | ) | 140,870 | — | 5,046 | 144,005 | ||||||||||||||
Fee income | 65 | 37,505 | 40,290 | (9,519 | ) | 68,341 | ||||||||||||||
Losses on derivative instruments | (894 | ) | (29,943 | ) | — | — | (30,837 | ) | ||||||||||||
Other income (expense) | 15,934 | (14,563 | ) | 53 | (4,114 | ) | (2,690 | ) | ||||||||||||
General and administrative expenses | (6,667 | ) | (133,196 | ) | (34,545 | ) | — | (174,408 | ) | |||||||||||
Income (loss) before income tax | 99,025 | 30,496 | 5,798 | (463 | ) | 134,856 | ||||||||||||||
Income tax expense | — | 20,580 | 2,280 | — | 22,860 | |||||||||||||||
Net income (loss) | $ | 99,025 | $ | 9,916 | $ | 3,518 | $ | (463 | ) | $ | 111,996 | |||||||||
December 31, 2003: | ||||||||||||||||||||
Total assets | $ | 563,930 | $ | 834,980 | $ | 17,276 | $ | (16,229 | ) | $ | 1,399,957 | |||||||||
For the Year Ended December 31, 2002
|
| |||||||||||||||||||
| Mortgage Portfolio Management | Mortgage Lending and | Branch Operations | Eliminations | Total | ||||||||||||||||
Interest income | $ | 73,407 | $ | 33,736 | $ | — | $ | — | $ | 107,143 | ||||||||||
Interest expense | 15,650 | 20,715 | — | (8,637 | ) | 27,728 | ||||||||||||||
Net interest income before credit recoveries | 57,757 | 13,021 | — | 8,637 | 79,415 | |||||||||||||||
Credit recoveries | 432 | — | — | — | 432 | |||||||||||||||
Gains (losses) on sales of mortgage assets | (791 | ) | 52,282 | — | 1,814 | 53,305 | ||||||||||||||
Fee income | 432 | 18,084 | 21,495 | (4,028 | ) | 35,983 | ||||||||||||||
Losses on derivative instruments | (2,282 | ) | (34,559 | ) | — | — | (36,841 | ) | ||||||||||||
Other income (expense) | 12,466 | (6,532 | ) | 62 | (6,966 | ) | (970 | ) | ||||||||||||
General and administrative expenses | (6,991 | ) | (59,306 | ) | (18,840 | ) | 543 | (84,594 | ) | |||||||||||
Income (loss) before income tax | 61,023 | (17,010 | ) | 2,717 | — | 46,730 | ||||||||||||||
Income tax expense (benefit) | — | (3,372 | ) | 1,341 | — | (2,031 | ) | |||||||||||||
Net income (loss) | $ | 61,023 | $ | (13,638 | ) | $ | 1,376 | $ | — | $ | 48,761 | |||||||||
December 31, 2002: | ||||||||||||||||||||
Total assets | $ | 387,600 | $ | 1,053,477 | $ | 11,814 | $ | (394 | ) | 1,452,497 | ||||||||||
Intersegment revenues and expenses that were eliminated in consolidation were as follows (in thousands):
| 2004 | 2003 | 2002 | ||||||||||
Amounts paid to (received from) mortgage portfolio from (to) mortgage lending and loan servicing: | ||||||||||||
Loan servicing fees | $ | (423 | ) | $ | (685 | ) | $ | (1,074 | ) | |||
Administrative fees | — | — | (449 | ) | ||||||||
Intercompany interest income | 8,200 | 8,124 | 8,637 | |||||||||
Guaranty, commitment, loan sale and securitization fees | 10,833 | 9,244 | 6,001 | |||||||||
Interest income on warehouse borrowings | 47 | — | — | |||||||||
Gain on sale of mortgage securities – available-for-sale retained in securitizations | (2,800 | ) | — | — | ||||||||
Amounts paid to (received from) branch operations from (to) mortgage lending and loan servicing: | ||||||||||||
Lender premium | 27,269 | 5,509 | 1,814 | |||||||||
Subsidized fees | 24 | 3,325 | 1,139 | |||||||||
Interest income on warehouse line | (39 | ) | — | — | ||||||||
Fee income on warehouse line | (30 | ) | — | — | ||||||||
Administrative fees | — | — | (94 | ) | ||||||||
Additionally, as previously discussed, the LLC agreements were terminated effective January 1, 2004 and all continuing branches that formerly operated under these agreements became operating units of the Company. As a result, during consolidation, the Company applied the provisions of SFAS No. 91 “Accounting for Nonrefundable Fees and Costs Associated with Originating or Acquiring Loans and Initial Direct Costs of Leases” to its branch operations segment. Based on SFAS No. 91, the Company defers certain nonrefundable fees and direct costs associated with the origination of loans in the branch operations segment which are subsequently brokered to the mortgage lending and servicing segment. The mortgage lending and servicing segment ultimately funds the loans and then sells the loans either through securitizations or outright sales to third parties. The net deferred cost (income) becomes part of the cost basis of the loans and serves to either increase (net deferred income) or decrease (net deferred cost) the gain or loss recognized by the mortgage lending and servicing segment. These transactions are accounted for in the eliminations column of the Company’s segment reporting. The following table summarizes these amounts for the year ended December 31, 2004 (in thousands):
| 2004 | ||||
Gains on sales of mortgage assets | $ | 8,472 | ||
Fee income | (36,913 | ) | ||
General & administrative expenses | 28,582 | |||
Note 16.21. Fair Value of Financial Instruments
The following disclosure of the estimated fair value of financial instruments presents amounts that have been determined using available market information and appropriate valuation methodologies. However, considerable judgment is required to interpret market data to develop the estimates of fair value. Accordingly, the estimates presented herein are not necessarily indicative of the amounts that could be realized in a current market exchange. The use of different market assumptions or estimation methodologies could have a material impact on the estimated fair value amounts.
The estimated fair values of the Company’s financial instruments are as follows as of December 31, (in(dollars in thousands):
| 2004 | 2003 | 2006 | 2005 | |||||||||||||||||||||||
| Carrying Value | Fair Value | Carrying Value | Fair Value | Carrying Value | Fair Value | Carrying Value | Fair Value | |||||||||||||||||||
Financial assets: | ||||||||||||||||||||||||||
Cash and cash equivalents | $ | 268,563 | $ | 268,563 | $ | 118,180 | $ | 118,180 | $ | 150,522 | $ | 150,522 | $ | 264,694 | $ | 264,694 | ||||||||||
Mortgage loans: | ||||||||||||||||||||||||||
Held-for-sale | 747,594 | 758,932 | 697,992 | 715,414 | 1,741,819 | 1,757,965 | 1,291,556 | 1,298,244 | ||||||||||||||||||
Held-in-portfolio | 59,527 | 61,214 | 94,717 | 96,455 | 2,116,535 | 2,141,028 | 28,840 | 29,452 | ||||||||||||||||||
Mortgage securities - available-for-sale | 489,175 | 489,175 | 382,287 | 382,287 | 349,312 | 349,312 | 505,645 | 505,645 | ||||||||||||||||||
Mortgage securities - trading | 143,153 | 143,153 | — | — | 329,361 | 329,361 | 43,738 | 43,738 | ||||||||||||||||||
Mortgage servicing rights | 42,010 | 58,616 | 19,685 | 33,788 | 62,830 | 74,177 | 57,122 | 71,897 | ||||||||||||||||||
Warehouse notes receivable | 39,462 | 39,462 | 25,390 | 25,390 | ||||||||||||||||||||||
Deposits with derivative instrument counterparties | 6,700 | 6,700 | 20,900 | 20,900 | 5,655 | 5,655 | 4,370 | 4,370 | ||||||||||||||||||
Accrued interest receivable | 37,692 | 37,692 | 4,866 | 4,866 | ||||||||||||||||||||||
Financial liabilities: | ||||||||||||||||||||||||||
Borrowings: | ||||||||||||||||||||||||||
Short-term | 905,528 | 905,528 | 872,536 | 872,536 | 2,152,208 | 2,152,208 | 1,418,569 | 1,418,569 | ||||||||||||||||||
Asset-backed bonds secured by mortgage loans | 53,453 | 53,453 | 89,384 | 89,384 | 2,067,490 | 2,067,490 | 26,949 | 26,949 | ||||||||||||||||||
Asset-backed bonds secured by mortgage securities | 336,441 | 336,726 | 43,596 | 44,253 | 9,519 | 9,467 | 125,630 | 123,965 | ||||||||||||||||||
Junior subordinated debentures | 83,041 | 83,041 | 48,664 | 48,664 | ||||||||||||||||||||||
Accrued interest payable | 9,327 | 9,327 | 2,837 | 2,837 | ||||||||||||||||||||||
Derivative instruments: | ||||||||||||||||||||||||||
Interest rate cap agreements | 5,819 | 5,819 | 6,679 | 6,679 | 4,634 | 4,634 | 5,105 | 5,105 | ||||||||||||||||||
Interest rate swap agreements | 6,143 | 6,143 | (8,648 | ) | (8,648 | ) | 6,527 | 6,527 | 3,290 | 3,290 | ||||||||||||||||
Cash and cash equivalents – The fair value of cash and cash equivalents approximates its carrying value.
Mortgage loans – The fair value for all loans is estimated by discounting the projected future cash flows using market discount rates at which similar loans made to borrowers with similar credit ratings and maturities would be discounted in the market.
Mortgage securities – available-for-sale— – Mortgage securities – available-for-sale is made up of residual securities and subordinated securities. The fair value of mortgageresidual securities – available-for-sale is estimated by discounting future projected cash flows using a discount rate commensurate with the risks involved. The fair value of the subordinated securities is estimated using quoted market prices.
Mortgage securities- trading – The fair value of mortgage securities - trading is estimated using quoted market prices.
Mortgage servicing rights – The fair value of mortgage servicing rights is calculated based on a discounted cash flow methodology incorporating numerous assumptions, including servicing income, servicing costs, market discount rates and prepayment speeds.
Warehouse notes receivable– The fair value of warehouse notes receivable approximates their carrying value.
Deposits with derivative instrument counterparties – The fair value of deposits with counterparties approximates itstheir carrying value.
Borrowings – The fair value of short-term borrowings, and asset-backed bonds secured by mortgage loans and junior subordinated debentures approximates their carrying value as the borrowings bear interest at rates that approximate current market rates for similar borrowings. The fair value of asset-backed bonds secured by mortgage securities is determined by the present value of future payments based on interest rate conditions at December 31, 20042006 and 2003.2005.
Derivative instruments – The fair value of derivative instruments is estimated by discounting the projected future cash flows using appropriate rates. The fair value of commitments to originate mortgage loans is estimated using the Black-Scholes option pricing model.
Accrued interest receivable and payable – The fair value of accrued interest receivable and payable approximates their carrying value.
Note 17.22. Supplemental Disclosure of Cash Flow Information
(dollars in thousands)
(in thousands) | 2004 | 2003 | 2002 | |||||||||
Cash paid for interest | $ | 51,431 | $ | 41,058 | $ | 37,546 | ||||||
Cash paid for income taxes | $ | 27,944 | $ | 18,831 | $ | 3,581 | ||||||
Cash received on mortgage securities – available-for-sale with no cost basis | $ | 32,244 | $ | 20,707 | $ | — | ||||||
Non-cash operating, investing and financing activities: | ||||||||||||
Cost basis of securities retained in securitizations | $ | 381,833 | $ | 292,675 | $ | 90,785 | ||||||
Retention of mortgage servicing rights | $ | 39,259 | $ | 20,774 | $ | 6,070 | ||||||
Change in loans under removal of accounts provision | $ | 6,455 | $ | 3,020 | $ | 11,455 | ||||||
Change in due to trusts | $ | (6,455 | ) | $ | (3,020 | ) | $ | (11,455 | ) | |||
Assets acquired through foreclosure | $ | 3,558 | $ | 6,619 | $ | 8,417 | ||||||
Dividends payable | $ | 73,431 | $ | 30,559 | $ | 16,768 | ||||||
Dividend reinvestment plan program | $ | 1,839 | $ | 1,247 | $ | — | ||||||
Restricted stock issued in satisfaction of prior year accrued bonus | $ | 1,816 | $ | — | $ | — | ||||||
Surrender of warrants | $ | — | $ | — | $ | 3,673 | ||||||
| 2006 | 2005 | 2004 | ||||||||
Cash paid for interest | $ | 242,014 | $ | 79,880 | $ | 51,431 | ||||
Cash paid (received) for income taxes | 2,836 | (4,712 | ) | 27,944 | ||||||
Cash received on mortgage securities – available-for-sale with no cost basis | 5,407 | 17,564 | 32,244 | |||||||
Cash received for dividend reinvestment plan | 5,937 | 3,903 | 1,839 | |||||||
Non-cash investing and financing activities: | ||||||||||
Cost basis of securities retained in securitizations | 244,978 | 332,420 | 381,833 | |||||||
Change in loans under removal of accounts provision | 62,661 | 23,452 | 6,455 | |||||||
Transfer of cost basis of residual securities and mortgage servicing rights to mortgage loans held-for-sale due to securitization calls | 6,528 | 7,423 | — | |||||||
Transfer of loans to held-in-portfolio from held-for-sale | 2,663,731 | — | — | |||||||
Assets acquired through foreclosure | 25,601 | 2,891 | 3,558 | |||||||
Dividends payable | 1,663 | 45,070 | 73,431 | |||||||
Tax benefit derived from capitalization of affiliate | 7,173 | — | — | |||||||
Restricted stock issued in satisfaction of prior year accrued bonus | 283 | 262 | 1,816 | |||||||
Note 18. Earnings Per Share23. Condensed Quarterly Financial Information (unaudited)
On November 4, 2005, the Company adopted a formal plan to terminate all of the remaining NHMI branches. The computationsCompany considers a branch to be discontinued upon its termination date, which is the point in time when the operations cease. The provisions of basicSFAS No. 144 require the results of operations associated with those branches terminated subsequent to January 1, 2004 to be classified as discontinued operations and diluted earnings per sharesegregated from the Company’s continuing results of operations for all periods presented. As of June 30, 2006, the Company had terminated all NHMI branches and related operations. The Company has presented the operating results of NHMI as discontinued operations in the Consolidated Statements of Income for the years ended December 31, 2004, 20032006, 2005 and 20022004. The Company’s condensed consolidated quarterly operating results for the three months ended March 31, June 30, September 30, and December 31, 2006 and 2005 as revised from amounts previously reported to account for all branches discontinued through December 31, 2006 are as follows (in(dollars in thousands, except per share amounts):
��
| For the Year Ended December 31, | ||||||||||
| 2004 | 2003 | 2002 | ||||||||
Numerator: | ||||||||||
Income from continuing operations | $ | 119,497 | $ | 111,996 | $ | 48,761 | ||||
Dividends on preferred shares | (6,265 | ) | — | — | ||||||
Income from continuing operations available to common shareholders | 113,232 | 111,996 | 48,761 | |||||||
Loss from discontinued operations, net of income tax | (4,108 | ) | — | — | ||||||
Net income available to common shareholders | $ | 109,124 | $ | 111,996 | $ | 48,761 | ||||
Denominator: | ||||||||||
Weighted average common shares outstanding – basic: | ||||||||||
Common shares outstanding | 25,290 | 22,220 | 19,537 | |||||||
Convertible preferred stock | — | — | 1,221 | |||||||
Weighted average common shares outstanding – basic | 25,290 | 22,220 | 20,758 | |||||||
Weighted average common shares outstanding – dilutive: | ||||||||||
Weighted average common shares outstanding – basic | 25,290 | 22,220 | 20,758 | |||||||
Stock options | 435 | 601 | 524 | |||||||
Restricted stock | 38 | — | — | |||||||
Warrants | — | — | 378 | |||||||
Weighted average common shares outstanding – dilutive | 25,763 | 22,821 | 21,660 | |||||||
Basic earnings per share: | ||||||||||
Income from continuing operations | $ | 4.72 | $ | 5.04 | $ | 2.35 | ||||
Dividends on preferred shares | (0.25 | ) | — | — | ||||||
Income from continuing operations available to common shareholders | 4.47 | 5.04 | 2.35 | |||||||
Loss from discontinued operations, net of income tax | (0.16 | ) | — | — | ||||||
Net income available to common shareholders | $ | 4.31 | $ | 5.04 | $ | 2.35 | ||||
Diluted earnings per share: | ||||||||||
Income from continuing operations | $ | 4.64 | $ | 4.91 | $ | 2.25 | ||||
Dividends on preferred shares | (0.24 | ) | — | — | ||||||
Income from continuing operations available to common shareholders | 4.40 | 4.91 | 2.25 | |||||||
Loss from discontinued operations, net of income tax | (0.16 | ) | — | — | ||||||
Net income available to common shareholders | $ | 4.24 | $ | 4.91 | $ | 2.25 | ||||
The following stock options and warrants to purchase shares of common stock were outstanding during each period presented, but were not included in the computation of diluted earnings per share because the number of shares assumed to be repurchased, as calculated was greater than the number of shares to be obtained upon exercise, therefore, the effect would be antidilutive:
| For the Year Ended December 31, | |||||||||
| 2004 | 2003 | 2002 | |||||||
Number of stock options and warrants (in thousands) | 15 | 15 | 300 | ||||||
Weighted average exercise price | $ | 33.59 | $ | 22.66 | $ | 12.50 | |||
| 2006 Quarters | 2005 Quarters | |||||||||||||||||||||||||||||||
| First | Second | Third | Fourth | First | Second | Third | Fourth | |||||||||||||||||||||||||
Net interest income before credit (losses) recoveries | $ | 57,743 | $ | 67,529 | $ | 73,119 | $ | 61,168 | $ | 48,995 | $ | 58,794 | $ | 69,226 | $ | 62,957 | ||||||||||||||||
Credit (losses) recoveries | (3,545 | ) | (6,045 | ) | (10,286 | ) | (10,255 | ) | (619 | ) | (100 | ) | (331 | ) | 12 | |||||||||||||||||
Gains (losses) on sales of mortgage assets | 33 | 23,285 | 27,709 | (9,278 | ) | 18,246 | 32,525 | 9,691 | 4,686 | |||||||||||||||||||||||
Gains (losses) on derivative instruments | 8,591 | 6,140 | (6,877 | ) | 4,144 | 14,601 | (7,848 | ) | 6,522 | 4,880 | ||||||||||||||||||||||
Income (loss) from continuing operations before income tax expense (benefit) | 20,674 | 40,764 | 30,298 | (23,252 | ) | 40,746 | 41,531 | 36,952 | 24,981 | |||||||||||||||||||||||
Income tax (benefit) expense | (4,579 | ) | 5,443 | 1,813 | (11,398 | ) | 2,190 | (1,175 | ) | (1,708 | ) | (5,924 | ) | |||||||||||||||||||
Income (loss) from continuing operations | 25,253 | 35,321 | 28,485 | (11,854 | ) | 38,556 | 42,706 | 38,660 | 30,905 | |||||||||||||||||||||||
(Loss) income from discontinued operations, net of income tax | (1,225 | ) | (586 | ) | 94 | (2,550 | ) | (3,353 | ) | (3,187 | ) | (2,367 | ) | (2,796 | ) | |||||||||||||||||
Net income (loss) | 24,028 | 34,735 | 28,579 | (14,404 | ) | 35,203 | 39,519 | 36,293 | 28,109 | |||||||||||||||||||||||
Dividends on preferred stock | 1,663 | 1,663 | 3,327 | — | 1,663 | 1,663 | 1,663 | 1,664 | ||||||||||||||||||||||||
Net income (loss) available to common shareholders | 22,365 | 33,072 | 25,252 | (14,404 | ) | 33,540 | 37,856 | 34,630 | 26,445 | |||||||||||||||||||||||
Basic earnings per share: | ||||||||||||||||||||||||||||||||
Income (loss) from continuing operations available to common shareholders | $ | 0.73 | $ | 1.02 | $ | 0.73 | $ | (0.32 | ) | $ | 1.33 | $ | 1.42 | $ | 1.21 | $ | 0.94 | |||||||||||||||
Loss from discontinued operations, net | (0.04 | ) | (0.02 | ) | — | (0.07 | ) | (0.12 | ) | (0.11 | ) | (0.08 | ) | (0.09 | ) | |||||||||||||||||
Net income (loss) available to common shareholders | $ | 0.69 | $ | 1.00 | $ | 0.73 | $ | (0.39 | ) | $ | 1.21 | $ | 1.31 | $ | 1.13 | $ | 0.85 | |||||||||||||||
Diluted earnings per share: | ||||||||||||||||||||||||||||||||
Income (loss) from continuing operations available to common shareholders | $ | 0.73 | $ | 1.01 | $ | 0.73 | $ | (0.32 | ) | $ | 1.31 | $ | 1.40 | $ | 1.20 | $ | 0.93 | |||||||||||||||
Loss from discontinued operations, net | (0.04 | ) | (0.02 | ) | — | (0.07 | ) | (0.12 | ) | (0.11 | ) | (0.08 | ) | (0.09 | ) | |||||||||||||||||
Net income (loss) available to common shareholders | $ | 0.69 | $ | 0.99 | $ | 0.73 | $ | (0.39 | ) | $ | 1.19 | $ | 1.29 | $ | 1.12 | $ | 0.84 | |||||||||||||||
Note 19.24. Subsequent Events
On February 22, 2005,8, 2007 the Company closed a $375 million collateralized debt obligation. Five rated secured classes of notes were issued with an aggregate face value of $347.2 million (the “Secured Notes”) along with subordinated notes with an aggregate face value of $27.8 million. The aggregate face amount of the underlying collateral that secures the Secured Notes is expected to be $375 million. The Company retained the Class D and subordinated notes. The Class D notes are rated BBB by both Fitch and Standard & Poor’s. The subordinated notes entitle the Company to excess cash flow from the underlying asset-backed securities and serve as overcollateralization for the Secured Notes.
On February 28 2007, the Company executed a securitization, NovaStar Mortgage Funding Trust (“NMFT”) Series 2005-1,2007-1, which offered 1517 rated classes of certificates with a face value of $2,073,750,000.$1,845,384,000. The Company will initially retain the M-6 through M-11 certificates, which collectively represent $106.7 million in principal. The Company also retained the Class C certificate, which was not covered by the prospectus. Class C has a notional amount of $2.1$1.9 billion, entitles the Company to excess interest and prepayment penalty fee cash flow from the underlying loan collateral and serves as overcollateralization.over collateralization. Other than prepayment penalty fee cash flow, Class C is subordinated to the other classes, all of which were offered pursuant to the prospectus. On February 22, 2005, $1.328, 2007, $1.9 billion in loans collateralizing NMFT Series 2005-12007-1 were delivered to the trust. The remaining $0.8 billion in loans is expected totransaction will be delivered totreated as a financing for GAAP reporting purposes and as a sale for tax purposes. The assets and accompanying debt will remain on the trust by March 31, 2005.
On March 15, 2005, the Company issued $51.6 million of unsecured floating rate junior subordinated notes (“Trust Preferred Securities”). The floating interest rate is three-month LIBOR plus 3.5% and resets quarterly. The notes will mature in 30 years and are redeemable, in whole or in part, anytime without penalty after five years.
Note 20. Condensed Quarterly Financial Information (unaudited)
Following is condensed consolidated quarterly operating results for the Company (in thousands, except per share amounts):
| 2004 Quarters | 2003 Quarters | |||||||||||||||||||||||||||||||
| First | Second | Third | Fourth | First | Second | Third | Fourth | |||||||||||||||||||||||||
Net interest income before credit (losses) recoveries | $ | 39,638 | $ | 42,947 | $ | 45,439 | $ | 43,410 | $ | 28,687 | $ | 31,547 | $ | 33,469 | $ | 36,353 | ||||||||||||||||
Credit (losses) recoveries | (146 | ) | (515 | ) | (182 | ) | 117 | 92 | 171 | 875 | (749 | ) | ||||||||||||||||||||
Gains on sales of mortgage assets | 51,780 | 25,174 | 46,415 | 21,581 | 29,443 | 44,031 | 34,188 | 36,343 | ||||||||||||||||||||||||
Gains (losses) on derivative instruments | (25,398 | ) | 27,115 | (19,536 | ) | 8,914 | (9,149 | ) | (15,037 | ) | (8,144 | ) | 1,493 | |||||||||||||||||||
Income from continuing operations before income tax expense (benefit) | 33,073 | 44,505 | 24,364 | 22,931 | 27,100 | 32,904 | 30,952 | 43,900 | ||||||||||||||||||||||||
Income tax expense (benefit) | 1,101 | 7,720 | (1,547 | ) | (1,898 | ) | 4,141 | 4,183 | 5,844 | 8,692 | ||||||||||||||||||||||
Income from continuing operations | 31,972 | 36,785 | 25,911 | 24,829 | 22,959 | 28,721 | 25,108 | 35,208 | ||||||||||||||||||||||||
Loss from discontinued operations, net of income tax | (1,047 | ) | (1,159 | ) | (1,523 | ) | (379 | ) | — | — | — | — | ||||||||||||||||||||
Net income | 30,925 | 35,626 | 24,388 | 24,450 | 22,959 | 28,721 | 25,108 | 35,208 | ||||||||||||||||||||||||
Dividends on preferred stock | 1,275 | 1,663 | 1,663 | 1,664 | — | — | — | — | ||||||||||||||||||||||||
Net income available to common shareholders | 29,650 | 33,963 | 22,725 | 22,786 | 22,959 | 28,721 | 25,108 | 35,208 | ||||||||||||||||||||||||
Basic earnings per share: | ||||||||||||||||||||||||||||||||
Income from continuing operations available to common shareholders | $ | 1.24 | $ | 1.41 | $ | 0.97 | $ | 0.87 | $ | 1.09 | $ | 1.32 | $ | 1.12 | $ | 1.49 | ||||||||||||||||
Loss from discontinued operations, net of income tax | (0.04 | ) | (0.05 | ) | (0.06 | ) | (0.01 | ) | — | — | — | — | ||||||||||||||||||||
Net income available to common shareholders | $ | 1.20 | $ | 1.36 | $ | 0.91 | $ | 0.86 | $ | 1.09 | $ | 1.32 | $ | 1.12 | $ | 1.49 | ||||||||||||||||
Diluted earnings per share: | ||||||||||||||||||||||||||||||||
Income from continuing operations available to common shareholders | $ | 1.21 | $ | 1.39 | $ | 0.95 | $ | 0.86 | $ | 1.07 | $ | 1.28 | $ | 1.09 | $ | 1.45 | ||||||||||||||||
Loss from discontinued operations, net of income tax | (0.04 | ) | (0.05 | ) | (0.06 | ) | (0.01 | ) | — | — | — | — | ||||||||||||||||||||
Net income available to common shareholders | $ | 1.17 | $ | 1.34 | $ | 0.89 | $ | 0.85 | $ | 1.07 | $ | 1.28 | $ | 1.09 | $ | 1.45 | ||||||||||||||||
During 2004, the Company changed policies governing its broker branches. As a result, a significant number of branch managers have voluntarily terminated employment with the Company and the Company has terminated branches when loan production results were substandard. The operating results for these discontinued operations have been segregated from the on-going operating resultsbalance sheet of the Company. The following amounts from the Company’s financial statements for the three months ended March 31, June 30 and September 30, 2004 have been revised from amounts previously reported to account for the discontinued operations (in thousands, except per share amounts):taxable REIT subsidiary.
| March 31, 2004 | June 30, 2004 | September 30, 2004 | ||||||||||||||||||||
| As Previously Reported | As Adjusted | As Previously Reported | As Adjusted | As Previously Reported | As Adjusted | |||||||||||||||||
Fee Income | $ | 45,519 | $ | 25,452 | $ | 43,231 | $ | 23,056 | $ | 34,265 | $ | 24,692 | ||||||||||
General and administrative expenses | 80,383 | 58,735 | 89,506 | 67,706 | 79,733 | 69,862 | ||||||||||||||||
Income from continuing operations before income tax expense (benefit) | 31,371 | 33,073 | 42,620 | 44,505 | 24,066 | 24,364 | ||||||||||||||||
Income tax expense (benefit) | 446 | 1,101 | 6,994 | 7,720 | (1,385 | ) | (1,547 | ) | ||||||||||||||
Income from continuing operations | 30,925 | 31,972 | 35,626 | 36,785 | 25,451 | 25,911 | ||||||||||||||||
Loss from discontinued operations, net of income tax | — | (1,047 | ) | — | (1,159 | ) | (1,063 | ) | (1,523 | ) | ||||||||||||
Net income | $ | 30,925 | $ | 30,925 | $ | 35,626 | $ | 35,626 | $ | 24,388 | $ | 24,388 | ||||||||||
Basic earnings per share: | ||||||||||||||||||||||
Income from continuing operations available to common shareholders | $ | 1.20 | $ | 1.24 | $ | 1.36 | $ | 1.41 | $ | 0.95 | $ | 0.97 | ||||||||||
Loss from discontinued operations, net of income tax | — | (0.04 | ) | — | (0.05 | ) | (0.04 | ) | (0.06 | ) | ||||||||||||
Net income available to common shareholders | $ | 1.20 | $ | 1.20 | $ | 1.36 | $ | 1.36 | $ | 0.91 | $ | 0.91 | ||||||||||
Diluted earnings per share: | ||||||||||||||||||||||
Income from continuing operations available to common shareholders | $ | 1.17 | $ | 1.21 | $ | 1.34 | $ | 1.39 | $ | 0.93 | $ | 0.95 | ||||||||||
Loss from discontinued operations, net of income tax | — | (0.04 | ) | — | (0.05 | ) | (0.04 | ) | (0.06 | ) | ||||||||||||
Net income available to common shareholders | $ | 1.17 | $ | 1.17 | $ | 1.34 | $ | 1.34 | $ | 0.89 | $ | 0.89 | ||||||||||
REPORT OF INDEPENDENT REGISTERED PUBLIC ACCOUNTING FIRM
To the Board of Directors and StockholdersShareholders of
NovaStar Financial, Inc.
Kansas City, Missouri
We have audited the accompanying consolidated balance sheets of NovaStar Financial, Inc. and subsidiaries (the “Company”) as of December 31, 20042006 and 2003,2005, and the related consolidated statements of income, stockholders’shareholders’ equity, and cash flows for each of the three years in the period ended December 31, 2004.2006. These financial statements are the responsibility of the Company’s management. Our responsibility is to express an opinion on these financial statements based on our audits.
We conducted our audits in accordance with the standards of the Public Company Accounting Oversight Board (United States). Those standards require that we plan and perform the audit to obtain reasonable assurance about whether the financial statements are free of material misstatement. An audit includes examining, on a test basis, evidence supporting the amounts and disclosures in the financial statements. An audit also includes assessing the accounting principles used and significant estimates made by management, as well as evaluating the overall financial statement presentation. We believe that our audits provide a reasonable basis for our opinion.
In our opinion, such consolidated financial statements present fairly, in all material respects, the financial position of the Company as of December 31, 20042006 and 2003,2005, and the results of its operations and its cash flows for each of the three years in the period ended December 31, 20042006 in conformity with accounting principles generally accepted in the United States of America.
As discussed in Note 1 to the consolidated financial statements, the Company changed its method of accounting for stock-based compensation to conform to Statement of Financial Accounting Standards No. 123,Accounting for Stock-Based Compensation effective January 1, 2003.
We have also audited, in accordance with the standards of the Public Company Accounting Oversight Board (United States), the effectiveness of the Company’s internal control over financial reporting as of December 31, 2004,2006, based on the criteria established inInternal Control—Integrated Framework issued by the Committee of Sponsoring Organizations of the Treadway Commission and our report dated March 15, 2005February 28, 2007 expressed an unqualified opinion on management’s assessment of the effectiveness of the Company’s internal control over financial reporting and an unqualified opinion on the effectiveness of the Company’s internal control over financial reporting.
/s/ Deloitte & Touche LLP
Kansas City, Missouri
March 15, 2005February 28, 2007
Item 9.Changes in and Disagreements with Accountants on Accounting and Financial Disclosure
None
Item 9A.Controls and Procedures
Disclosure Controls and Procedures
The Company maintains a system of disclosure controls and procedures which are designed to ensure that information required to be disclosed by the Company in reports that it files or submits under the federal securities laws, including this report, is recorded, processed, summarized and reported on a timely basis. These disclosure controls and procedures include controls and procedures designed to ensure that information required to be disclosed under the federal securities laws is accumulated and communicated to the Company’s management on a timely basis to allow decisions regarding required disclosure. The Company’s principal executive officer and principal financial officer evaluated the Company’s disclosure controls and procedures (as defined in Exchange Act Rules 13a-15(e) and 15d-15(d)) as of the end of the period covered by this report and concluded that the Company’s controls and procedures were effective.
Internal Control over Financial Reporting
Management’s Report on Internal Control over Financial Reporting
Management of NovaStar Financial, Inc. and subsidiaries (the “Company”) is responsible for establishing and maintaining adequate internal control over financial reporting as defined in Rule 13a-15(f) of the Securities Exchange Act of 1934. This internal control system has been designed to provide reasonable assurance to the Company’s management and board of directors regarding the preparation and fair presentation of the company’sCompany’s published financial statements.
All internal control systems, no matter how well designed, have inherent limitations. Therefore, even those systems determined to be effective can provide only reasonable assurance with respect to financial statement preparation and presentation.
Management of the Company has assessed the effectiveness of the company’sCompany’s internal control over financial reporting as of December 31, 2004.2006. To make this assessment, management used the criteria for effective internal control over financial reporting described inInternal Control—Integrated Framework, issued by the Committee of Sponsoring Organizations of the Treadway Commission. Based on our assessment we believeunder the framework inInternal Control—Integrated Framework, management concluded that as of December 31, 2004, the Company’s internal control over financial reporting met those criteria.was effective as of December 31, 2006.
Our independent registered public accounting firm, Deloitte & Touche LLP, havehas issued an attestation report, included herein, on our assessment of the Company’s internal control over financial reporting.
|
|
|
Changes in Internal Control over Financial Reporting
There were no changes in our internal controls over financial reporting during the quarter ended December 31, 20042006 that have materially affected, or is reasonably likely to materially affect our internal control over financial reporting.
Attestation Report of the Registered Public Accounting Firm
REPORT OF INDEPENDENT REGISTERED PUBLIC ACCOUNTING FIRM
To the Board of Directors and StockholdersShareholders of
NovaStar Financial, Inc.
Kansas City, Missouri
We have audited management’s assessment, included in the accompanying Management’s Report on Internal Control Over Financial Reporting, that NovaStar Financial, Inc. and subsidiaries (the “Company”) maintained effective internal control over financial reporting as of December 31, 2004,2006, based on the criteria established inInternal Control—Integrated Framework issued by the Committee of Sponsoring Organizations of the Treadway Commission. The Company’s management is responsible for maintaining effective internal control over financial reporting and for its assessment of the effectiveness of internal control over financial reporting. Our responsibility is to express an opinion on management’s assessment and an opinion on the effectiveness of the Company’s internal control over financial reporting based on our audit.
We conducted our audit in accordance with the standards of the Public Company Accounting Oversight Board (United States). Those standards require that we plan and perform the audit to obtain reasonable assurance about whether effective internal control over financial reporting was maintained in all material respects. Our audit included obtaining an understanding of internal control over financial reporting, evaluating management’s assessment, testing and evaluating the design and operating effectiveness of internal control, and performing such other procedures as we considered necessary in the circumstances. We believe that our audit provides a reasonable basis for our opinions.
A company’s internal control over financial reporting is a process designed by, or under the supervision of, the company’s principal executive and principal financial officers, or persons performing similar functions, and effected by the company’s board of directors, management, and other personnel to provide reasonable assurance regarding the reliability of financial reporting and the preparation of financial statements for external purposes in accordance with generally accepted accounting principles. A company’s internal control over financial reporting includes those policies and procedures that (1) pertain to the maintenance of records that, in reasonable detail, accurately and fairly reflect the transactions and dispositions of the assets of the company; (2) provide reasonable assurance that transactions are recorded as necessary to permit preparation of financial statements in accordance with generally accepted accounting principles, and that receipts and expenditures of the company are being made only in accordance with authorizations of management and directors of the company; and (3) provide reasonable assurance regarding prevention or timely detection of unauthorized acquisition, use, or disposition of the company’s assets that could have a material effect on the financial statements.
Because of the inherent limitations of internal control over financial reporting, including the possibility of collusion or improper management override of controls, material misstatements due to error or fraud may not be prevented or detected on a timely basis. Also, projections of any evaluation of the effectiveness of the internal control over financial reporting to future periods are subject to the risk that the controls may become inadequate because of changes in conditions, or that the degree of compliance with the policies or procedures may deteriorate.
In our opinion, management’s assessment that the Company maintained effective internal control over financial reporting as of December 31, 2004,2006, is fairly stated, in all material respects, based on the criteria established inInternal Control—Integrated Framework issued by the Committee of Sponsoring Organizations of the Treadway Commission. Also in our opinion, the Company maintained, in all material respects, effective internal control over financial reporting as of December 31, 2004,2006, based on the criteria established inInternal Control—Integrated Framework issued by the Committee of Sponsoring Organizations of the Treadway Commission.
We have also audited, in accordance with the standards of the Public Company Accounting Oversight Board (United States), the consolidated financial statements as of and for the year ended December 31, 20042006 of the Company and our report dated March 15, 2005February 28, 2007 expressed an unqualified opinion on those financial statements.
/s/ Deloitte & Touche LLP
Kansas City, Missouri
March 15, 2005February 28, 2007
None
Item 10.Directors, and Executive Officers of the Registrantand Corporate Governance
Information with respect to Item 401Items 401,405 and Item 405407(d)(4) and (d)(5) of Regulation S-K is incorporated by reference to the information included on NovaStar Financial’sin our Proxy Statement, dated April 18, 2005, for the 2007 Annual Meeting of Shareholders to be held at May 20, 2005 at 10:00 a.m., Central Daylight Time, at the NovaStar Financial, Inc. Corporate Offices, 8401 Ward Parkway, Kansas City, Missouri 64114.Shareholders.
Information with respect to our corporate governance guidelines, charters of audit, compensation, nominating and corporate governance committees, and code of conduct may be obtained onfrom the corporate governance section of our website (www.novastarmortgage.com) or by contacting us directly. References to our website do not incorporate by reference the information on such website into this Annual Report on Form 10-K and we disclaim any such incorporation by reference.
The code of conduct applies to our principal executive officer, principal financial officer, principal accounting officer, directors and other employees performing similar functions. A Form 8-K will be filed and a posting on our website will be made uponWe intend to satisfy the disclosure requirements regarding any amendment to, or waiver from, a provision of theour code of conduct that applies to anyour principal executive officer, principal financial officer, principal accounting officer, controller or director. persons performing similar functions by disclosing such matters on our website.
Our investor relations contact information follows.follows:
Investor Relations
8140 Ward Parkway, Suite 300
Kansas City, MO 64114
816.237.7000816.237.7424
Email: ir@novastar1.com
Because our common stock is listed on the NYSE, our chief executive officer is required to make an annual certification to the NYSE stating that he is not aware of any violation by NovaStar Financial, Inc. of the NYSE Corporate Governance listing standards. Last year,Following our 2006 Annual Meeting of Shareholders, our chief executive officer submitted such annual certification to the NYSE. In addition, NovaStar Financial, Inc. has filed, as exhibits to last year’s Annual Report on Form 10-K and is filing as exhibits to this Annual Report, the certifications of its chief executive officer and chief financial officer required under Section 302 of the Sarbanes-Oxley Act of 2002 to be filed with the Securities and Exchange Commission regarding the quality of NovaStar Financial, Inc. public disclosure.disclosures.
Item 11.Executive Compensation
Information with respect to ItemItems 402 and 407(e)(4) and (e)(5) of Regulation S-K is incorporated by reference to the information included on NovaStar Financial’sin our Proxy Statement, dated April 18, 2005, for the 2007 Annual Meeting of Shareholders to be held at May 20, 2005 at 10:00 a.m., Central Daylight Time, at the NovaStar Financial, Inc. Corporate Offices, 8401 Ward Parkway, Kansas City, Missouri 64114.Shareholders.
Item 12.Security Ownership of Certain Beneficial Owners and Management and Related Stockholder Matters.
Information with respect to ItemItems 403 and 407(a) of Regulation S-K is incorporated by reference to the information included on NovaStar Financial’sin our Proxy Statement, dated April 18, 2005, for the 2007 Annual Meeting of Shareholders to be held at May 20, 2005 at 10:00 a.m., Central Daylight Time, at the NovaStar Financial, Inc. Corporate Offices, 8401 Ward Parkway, Kansas City, Missouri 64114.Shareholders.
The following table sets forth information as of December 31, 20042006 with respect to compensation plans under which our common stock may be issued.
Equity Compensation Plan Information
Plan Category | Number of Securities to be Issued Upon Exercise of Outstanding Options, Warrants and Rights | Weighted Average Exercise Price of Outstanding Options, Warrants and Rights | Number of Securities Remaining Available for Future Issuance Under Equity Compensation Plans (Excluding Shares Reflected in the First Column) | Number of Securities to Exercise of Outstanding Options, Warrants and Rights | Weighted Average Exercise Price of Outstanding Options, Warrants and Rights | Number of Securities Remaining Available for Future Issuance Under Equity Compensation Plans (Excluding Shares Reflected in the First Column) | ||||||||||
Equity compensation plans approved by stockholders | 433,600 | (A) | $ | 10.16 | 2,500,000 | 618,383 | (A) | $ | 19.04 | 1,912,088 | ||||||
Equity compensation plans not approved by stockholders | — | — | — | — | — | — | ||||||||||
Total | 433,600 | $ | 10.16 | 2,500,000 | 618,383 | $ | 19.04 | 1,912,088 | ||||||||
| (A) | Certain of the options have dividend equivalent rights (DERs) attached to them when issued. As of December 31, |
Item 13.Certain Relationships and Related Transactions.Transactions, and Director Independence.
Information with respect to Item 404 of Regulation S-K is incorporated by reference to the information included on NovaStar Financial’sin our Proxy Statement, dated April 18, 2005, for the 2007 Annual Meeting of Shareholders to be held at May 20, 2005 at 10:00 a.m., Central Daylight Time, at the NovaStar Financial, Inc. Corporate Offices, 8401 Ward Parkway, Kansas City, Missouri 64114.Shareholders.
Item 14.Principal Accountant Fees and Services.
Information with respect to Item 9(e) of Schedule 14A is incorporated by reference to the information included on NovaStar Financial’sin our Proxy Statement, dated April 18, 2005, for the 2007 Annual Meeting of Shareholders to be held at May 20, 2005 at 10:00 a.m., Central Daylight Time, at the NovaStar Financial, Inc. Corporate Offices, 8401 Ward Parkway, Kansas City, Missouri 64114.Shareholders.
Item 15.Exhibits and Financial Statements Schedules
Financial Statements and Schedules
(1) The financial statements as set forth under Item 8 of this report on Form 10-K are included herein.
(2) The required financial statement schedules are omitted because the information is disclosed elsewhere herein.
| (1) | The financial statements as set forth under Item 8 of this report on Form 10-K are included herein. |
| (2) | The required financial statement schedules are omitted because the information is disclosed elsewhere herein. |
Exhibit Listing
| Exhibit No. | Description of Document | |
| 3.1 | Articles of Amendment and Restatement of the Registrant | |
| Articles Supplementary of the Registrant adopted January 15, | ||
| 3.3.1(10) | Amended and Restated Bylaws of the Registrant, adopted July 27, 2005 | |
| 4.1 | Specimen Common Stock Certificate | |
| 4.3(9) | Specimen | |
| 10.6(1) | Form of Master Repurchase Agreement for mortgage loan financing | |
| 10.7.1(2) | Form of Master Repurchase Agreement of the Registrant | |
| 10.8(6) | Employment Agreement, dated September 30, 1996, between the Registrant and Scott F. Hartman | |
| 10.8.1(16) | Amendment dated December 20, 2006 to the Employment Agreement dated September 30, 1996 between NovaStar Financial Inc., and Scott F. Hartman. | |
| 10.9(6) | Employment Agreement, dated September 30, 1996, between the Registrant and W. Lance Anderson | |
| 10.9.1(16) | Amendment dated December 20, 2006 to the Employment Agreement dated September 30, 1996 between NovaStar Financial Inc., and W. Lance Anderson. | |
| 10.10(14) | Form of Indemnification Agreement for Officers and Directors of NovaStar Financial, Inc. and its Subsidiaries | |
| 10.11(13) | NovaStar Mortgage, Inc. Amended and Restated Deferred Compensation Plan | |
| 10.14(1) | 1996 Executive and Non-Employee Director Stock Option Plan, as last amended December 6, 1996 | |
| 10.25(4) | NovaStar Financial Inc. 2004 Incentive Stock Plan | |
| 10.25.1(5) | Stock Option Agreement under NovaStar Financial, Inc. 2004 Incentive Stock Plan | |
| 10.25.2(5) | Restricted Stock Agreement under NovaStar Financial, Inc. 2004 Incentive Stock Plan | |
| 10.25.3(5) | Performance Contingent Deferred Stock Award Agreement under NovaStar Financial, Inc. 2004 Incentive Stock Plan | |
| 10.26(5) | NovaStar Financial, Inc. Executive Officer Bonus Plan | |
| 10.27(7) | Employment Agreement between NovaStar Mortgage, Inc. and David A. Pazgan, Executive Vice President of NovaStar Mortgage, Inc. | |
| 10.27.1(16) | Amendment dated December 20, 2006 to the Employment Agreement dated July 15, 2004 between NovaStar Mortgage Inc., and Dave Pazgan. | |
| 10.28 | ||
| 10.30(7) | 2005 Compensation Plan for Independent Directors | |
| 10.31(7) | Employment Agreement between NovaStar Financial, Inc. and Gregory S. Metz, Senior Vice President and Chief Financial Officer | |
| 10.31.1(16) | Amendment dated December 20, 2006 to the Employment Agreement dated July 15, 2004 between NovaStar Financial Inc., and Gregory Metz. | |
| 10.32(7) | Employment Agreement between NovaStar Financial, Inc. and Michael L. Bamburg, Senior Vice President and Chief Investment Officer | |
| 10.32.1(16) | Amendment dated December 20, 2006 to the Employment Agreement dated July 15, 2004 between NovaStar Financial Inc., and Michael L. Bamburg. | |
| 10.33(7) | Description of Oral At-Will Agreement between NovaStar Financial, Inc. and Rodney E. Schwatken, Vice President, Controller and Chief Accounting Officer | |
| 10.34(11) | Purchase Agreement, dated March 15, 2005, among the Registrant, NovaStar Mortgage, Inc., NovaStar Capital Trust I, Merrill Lynch International and Taberna Preferred Funding I, LTD | |
| 10.35(11) | Amended and Restated Trust Agreement, dated March 15, 2005, between the Registrant, JPMorgan Chase Bank, Chase Bank USA and certain administrative trustees | |
| 10.36(11) | Junior Subordinated Indenture, dated March 15, 2005, between the Registrant and JPMorgan Chase Bank | |
| 10.37(11) | Parent Guarantee Agreement, dated March 15, 2005, between the Registrant and JP Morgan Chase Bank | |
| 10.38(17) | Purchase Agreement, dated April 18, 2006, among NovaStar Financial, Inc., NovaStar Mortgage, Inc., NovaStar Capital Trust II and Kodiak Warehouse LLC | |
| 10.39(17) | Amended and Restated Trust Agreement, dated April 18, 2006, between NovaStar Mortgage, Inc., JPMorgan Chase Bank, NA Chase Bank USA, NA and certain administrative trustees as well as the form of security representing the Junior Subordinated Notes and the form of Trust Preferred Securities Certificate | |
| 10.40(17) | Junior Subordinated Indenture, dated April 18, 2006 between NovaStar Mortgage, Inc., NovaStar Financial, Inc. and JPMorgan Chase Bank, NA | |
| 10.41(17) | Parent Guarantee Agreement, dated April 18, 2006, between NovaStar Financial, Inc. and JP Morgan Chase Bank, NA | |
| 10.42(18) | Description of Employment Agreement between NovaStar Financial, Inc. and Todd M. Phillips, Vice President, Treasurer and Chief Accounting Officer | |
| 10.43(19) | NovaStar Financial, Inc. Long Term Incentive Plan | |
| 11.1(3) | Statement regarding computation of per share earnings | |
| 14.1(15) | NovaStar Financial, Inc. Code of Conduct | |
| 21.1 | Subsidiaries of the Registrant | |
| 23.1 | Consents of Deloitte & Touche LLP | |
| 31.1 | Chief Executive Officer Certification - Section 302 of the Sarbanes-Oxley Act of 2002 | |
| 31.2 | Principal Financial Officer Certification - Section 302 of the Sarbanes-Oxley Act of 2002 | |
| 32.1 | Chief Executive Officer Certification - Section 906 of the Sarbanes-Oxley Act of 2002 | |
| 32.2 | Principal Financial Officer Certification - Section 906 of the Sarbanes-Oxley Act of 2002 | |
| (1) | Incorporated by reference to the correspondingly numbered exhibit to the Registration Statement on Form S-11 (373-32327) filed by the Registrant with the SEC on July 29, 1997, as amended. |
| (2) | Incorporated by reference to the correspondingly numbered exhibit to the Annual Report on Form 10-K filed by the Registrant with the SEC on March |
| (3) | See Note |
| (4) | Incorporated by reference to Exhibit 10.15 to the Registration Statement on Form S-8 (333-116998) filed by the Registrant with the SEC on June 30, 2004. |
| (5) | Incorporated by reference to the correspondingly numbered exhibit to Form 8-K filed by the Registrant with the SEC on February 4, 2005. |
| (6) | Incorporated by reference to the correspondingly numbered exhibit to Form S-11 filed by the Registrant with the SEC on July 29, 1997. |
| (7) | Incorporated by reference to the correspondingly numbered exhibit to Form 8-K filed by the Registrant with the SEC on February 11, 2005. |
| (8) | Incorporated by reference to |
| (9) | Incorporated by reference to the correspondingly numbered exhibit to Form 8-A/A filed by the Registrant with the SEC on January 20, 2004. |
| (10) | Incorporated by reference to the correspondingly numbered exhibit to Form 10-Q filed by the Registrant with the SEC on August 5, 2005. |
| (11) | Incorporated by reference to the correspondingly numbered exhibit to Form 10-Q filed by the Registrant with the SEC on May 5, 2005. |
| (12) | Incorporated by reference to Exhibit 3.1 to Form 8-K filed by the Registrant with the SEC on May 26, 2005. |
| (13) | Incorporated by reference to the correspondingly numbered exhibit to the Registration Statement on Form S-3 (333-126699) filed by the Registrant with the SEC on July 19, 2005. |
| (14) | Incorporated by reference to Exhibit 10.10 to Form 8-K filed by the Registrant with the SEC on November 16, 2005. |
| (15) | Incorporated by reference to the correspondingly numbered exhibit to Form 8-K filed by the Registrant with the SEC on February 14, 2006. |
| (16) | Incorporated by reference to an Exhibit 10 to Form 8-K filed by the Registrant with the SEC on December 21, 2006. |
| (17) | Incorporated by reference to the correspondingly numbered exhibit to Form 8-K filed by the Registrant with the SEC on April 24, 2006. |
| (18) | Incorporated by reference to Exhibit 10.38 to Form 8-K/A filed by the Registrant with the SEC on May 2, 2006. |
| (19) | Incorporated by reference to Exhibit 10.34 to Form 8-K filed by the Registrant with the SEC on November 16, 2005. |
Signatures
Pursuant to the requirements of Section 13 or 15(d) of the Securities Exchange Act of 1934, the registrant has duly caused this report to be signed on its behalf by the undersigned, thereunto duly authorized.
NovaStar Financial, Inc.
(Registrant)
| NOVASTAR FINANCIAL, INC | ||||||
| (Registrant) | ||||||
/s/ SCOTT F. HARTMAN | ||||||
| Scott F. Hartman, Chairman of the Board | ||||||
| of Directors and Chief Executive Officer | ||||||
| Pursuant to the requirements of the Securities Exchange Act of 1934, this report has been signed below by the following persons on behalf of the registrant and in the capacities and dates indicated. | ||||||
/s/ SCOTT F. HARTMAN | ||||||
| Scott F. Hartman, Chairman of the Board | ||||||
| of Directors and Chief Executive Officer | ||||||
| (Principal Executive Officer) | ||||||
| DATE:March 1, 2007 | /s/ W. LANCE ANDERSON | |||||
| W. Lance Anderson, President, | ||||||
| Chief Operating Officer and Director | ||||||
/s/ GREGORY S. METZ | ||||||
| Gregory S. Metz, Chief Financial Officer | ||||||
| (Principal Financial Officer) | ||||||
/s/ | ||||||
| Controller and Chief Accounting Officer | ||||||
| (Principal Accounting Officer) | ||||||
/s/ EDWARD W. MEHRER | ||||||
| Edward W. Mehrer, Director | ||||||
/s/ GREGORY T. BARMORE | ||||||
| Gregory T. Barmore, Director | ||||||
/s/ ART N. BURTSCHER | ||||||
| Art N. Burtscher, Director | ||||||
| DATE:March 1, 2007 | /s/ DONALD M. BERMAN | |||||
| Donald M. Berman, Director | ||||||
91135