
UNITED STATES
SECURITIES AND EXCHANGE COMMISSION
Washington, D.C. 20549
FORM 10–K
(Mark One)
x | ANNUAL REPORT PURSUANT TO SECTION 13 OR 15(d) OF THE SECURITIES EXCHANGE ACT OF 1934 |
For the fiscal year ended May 31, 20052008
OR
¨ | TRANSITION REPORT PURSUANT TO SECTION 13 OR 15(d) OF THE SECURITIES EXCHANGE ACT OF 1934 |
For the transition period from to
Commission File Number 1-8399
WORTHINGTON INDUSTRIES, INC.
(Exact name of Registrantregistrant as specified in its Charter)charter)
Ohio | 31-1189815 | |
| (State or other jurisdiction of incorporation or organization) | (I.R.S. Employer Identification No.) | |
200 Old Wilson Bridge Road, Columbus, Ohio | 43085 | |
| (Address of principal executive offices) | (Zip Code) |
| Registrant’s telephone number, including area code | (614) 438-3210 | |
| ||
Securities registered pursuant to Section 12(b) of the Act:
Title of |
| |
| Common Shares, Without Par Value | Name of each exchange on which registered New York Stock Exchange | |
Securities Registered Pursuantregistered pursuant to Section 12(g) of the Act:None
Indicate by check mark if the registrant is a well-known seasoned issuer, as defined in Rule 405 of the Securities Act. x YES ¨ NO
Indicate by check mark if the registrant is not required to file reports pursuant to Section 13 or Section 15(d) of the Act. ¨ YES x NO
Indicate by check mark whether the Registrantregistrant (1) has filed all reports required to be filed by Section 13 or 15(d) of the Securities Exchange Act of 1934 during the preceding 12 months (or for such shorter period that the Registrantregistrant was required to file such reports), and (2) has been subject to such filing requirements for the past 90 days.
YESx NOYES ¨ NO
Indicate by check mark if disclosure of delinquent filers pursuant to Item 405 of Regulation S-K (§229.405 of this chapter) is not contained herein, and will not be contained, to the best of Registrant’sregistrant’s knowledge, in definitive proxy or information statements incorporated by reference in Part III
| of this Form 10-K or any amendment to this Form 10-K. ¨ |
Indicate by check mark whether the Registrantregistrant is a large accelerated filer, an accelerated filer, a non-accelerated filer, or a smaller reporting company. See the definitions of “large accelerated filer,” “accelerated filer” and “smaller reporting company” in Rule 12b-2 of the Exchange Act:
Large accelerated filer x Accelerated filer ¨ Non-accelerated filer ¨ Smaller reporting company ¨
(Do not check if a smaller reporting company)
Indicate by check mark whether the registrant is a shell company (as defined in Rule 12b-2 of the Act).
¨YESx NO¨
Based uponState the closingaggregate market value of the voting and non-voting common equity held by non-affiliates computed by reference to the price at which the common equity was last sold, or the average bid and asked price of such common equity, as of the Common Shares on November 30, 2004, as reported onlast business day of the New York Stock Exchange composite tape (as reported byregistrant’s most recently completed second fiscal quarter. The Wall Street Journal), the aggregate market value of the Common Shares (the only common equity) held by non-affiliates based on the closing price on the New York Stock Exchange on November 30, 2007, was approximately $1,385,500,000.
Indicate the number of shares outstanding of each of the Registrantregistrant’s classes of common stock, as of such date was approximately $1,854,008,074.
The number ofthe latest practicable date. On July 24, 2008, the Registrant had 78,769,498 Common Shares issued and outstanding as of August 1, 2005, was 87,962,152.
outstanding.
DOCUMENT INCORPORATED BY REFERENCE
Selected portions of the Registrant’s definitive Proxy Statement to be furnished to shareholders of the Registrant in connection with the Annual Meeting of Shareholders to be held on September 29, 2005,24, 2008, are incorporated by reference into Part III of this Annual Report on Form 10-K to the extent provided herein.
| ii | |||
| ||||
Item 1. | 1 | |||
Item 1A. | 9 | |||
Item 1B. | 13 | |||
Item 2. | ||||
Item 3. | ||||
Item 4. | ||||
Supplemental Item. | ||||
| ||||
Item 5. | ||||
Item 6. | ||||
Item 7. | Management’s Discussion and Analysis of Financial Condition and Results of Operations | |||
Item 7A. | ||||
Item 8. | ||||
Item 9. | Changes in and Disagreements With Accountants on Accounting and Financial Disclosure | |||
Item 9A. | ||||
Item 9B. | ||||
| ||||
Item 10. | Directors, | |||
Item 11. | ||||
Item 12. | Security Ownership of Certain Beneficial Owners and Management and Related Stockholder Matters | |||
Item 13. | Certain Relationships and Related Transactions, and Director Independence | |||
Item 14. | ||||
| ||||
Item 15. | ||||
| 85 | ||||
| E-1 | ||||
i
Selected statements contained in this Annual Report on Form 10-K, including, without limitation, in “PART I – Item 1. – Business” and “PART II – Item 7. – Management’s Discussion and Analysis of Financial Condition and Results of Operations,” constitute “forward-looking statements” as that term is used in the Private Securities Litigation Reform Act of 1995. Such forward-looking statements are based, in whole or in part, on management’s beliefs, estimates, assumptions and currently available information and can often be identified by the words “will,” “may,” “designed to,” “outlook,” “believes,” “should,” “plans,” “expects,” “intends,” “estimates” and similar expressions.1995 (the “Act”). These forward-looking statements include, without limitation, statements relating to:
• | future |
• | projected capacity and working capital needs; |
| • | pricing trends for raw materials and finished |
• | anticipated capital expenditures and asset sales; |
• | projected timing, results, costs, charges and expenditures related to acquisitions or to facility startups, dispositions, shutdowns and consolidations; |
• | new products, services and markets; |
• | expectations for Company and customer inventories, jobs and orders; |
• | expectations for the economy and markets; |
• | expected benefits from |
• | expectations for improvements in efficiencies or the |
| • | expectations for improving margins and increasing shareholder value; and |
• | effects of judicial rulings and other non-historical |
Because they are based on beliefs, estimates and assumptions, forward-looking statements are inherently subject to risks and uncertainties that could cause actual results to differ materially from those projected. Any number of factors could affect actual results, including, without limitation:limitation, those that follow:
• | product demand and |
| • | changes in product mix, product substitution and market acceptance of the Company’s products; |
• | fluctuations in pricing, quality or availability of raw materials (particularly steel), supplies, transportation, utilities and other items required by operations; |
• | effects of facility closures and the consolidation of operations; |
• | the effect of consolidation and other changes within the steel, automotive, construction and related industries; |
| • | failure to maintain appropriate levels of inventories; |
| • | the ability to realize targeted expense reductions such as head count reductions, facility closures and other expense reductions; |
| • | the ability to realize other cost savings and operational efficiencies and improvements on a timely basis; |
• | the overall success of, and ability to integrate, newly-acquired businesses and achieve synergies therefrom; |
• | capacity levels and efficiencies within facilities and within the industry as a whole; |
• | financial difficulties (including bankruptcy filings) of customers, suppliers, joint venture partners and others with whom |
• | the effect of national, regional and worldwide economic conditions generally and within major product markets, including a prolonged or substantial economic downturn; |
• | the effect of |
• | changes in customer inventories, spending patterns, product choices, and supplier choices; |
• | risks associated with doing business internationally, including economic, political and social instability, and foreign currency |
• |
|
| the ability to improve and maintain processes and business practices to keep pace with the economic, competitive and technological environment; |
• | adverse claims experience with respect to workers’ compensation, product recalls or liability, casualty events or other matters; |
| • | deviation of actual results from estimates and/or assumptions used by |
• |
|
• | the impact of judicial rulings and governmental regulations, both in the United States and abroad; and |
• | other risks described from time to time in filings with the United States Securities and Exchange |
We note these factors for investors as contemplated by the Act. It is impossible to predict or identify all potential risk factors. Consequently, you should not consider the foregoing list to be a complete set of all potential risks and uncertainties. Any forward-looking statements in this Annual Report on Form 10-K are based on current information as of the date of this Annual Report on Form 10-K, and we assume no obligation to correct or update any such statements in the future, except as required by applicable law.
ii
PART I
General Overview
Worthington Industries, Inc., an is a corporation formed under the laws of the State of Ohio corporation (individually, the “Registrant” or “Worthington Industries” or, together with its subsidiaries, “Worthington”collectively, “we,” “our,” “Worthington,” or “Company”),. Founded in 1955, Worthington is primarily a diversified metal processing company, focused on value-added steel processing and manufactured metal products, such as metal framing, pressure cylinders, automotive partpast-model service stampings and, through joint ventures, metal ceiling grid systems and laser-welded blanks.
Worthington was founded in 1955 and currently operates 47 manufacturing facilities worldwide and holds equity positions in nine joint ventures, which operate an additional 19 manufacturing facilities worldwide.
Worthington is headquartered in Columbus, Ohio, at 200 Old Wilson Bridge Road, Columbus, Ohio 43085. Our43085, telephone number is (614) 438-3210 and our web site address is www.worthingtonindustries.com.438-3210. The common shares of Worthington isIndustries are traded on the New York Stock Exchange under the symbol WOR.
Our operations are reported in three principal business segments: Processed Steel Products, Metal Framing and Pressure Cylinders. The Processed Steel Products segment includes The Worthington Steel Company business unit (“Worthington Steel”) and The Gerstenslager Company business unit (“Gerstenslager”). The Metal Framing segment is comprised of the Dietrich Industries, Inc. business unit (“Dietrich”). The Pressure Cylinders segment consists of the Worthington Cylinder Corporation business unit (“Worthington Cylinders”). Worthington holds equity positions in nine joint ventures, further discussed below under the subheading “Joint Ventures.” Two of the joint ventures are consolidated into the consolidated financial statements which are included in “Item 8. – Financial Statements and Supplementary Data.” During the fiscal year ended May 31, 2005 (“fiscal 2005”), the Processed Steel Products, Metal Framing and Pressure Cylinders segments served approximately 1,100, 3,400 and 2,500 customers, respectively, located primarily in the United States. Foreign sales account for less than 10% of consolidated net sales and are comprised primarily of sales to customers in Canada and Europe. No single customer accounts for over 10% of our consolidated net sales.
Effective August 1, 2004, the Decatur, Alabama, steel-processing facility and its cold-rolling assets were sold to Nucor Corporation for $80.4 million in cash. Worthington Steel retained the slitting and cut-to-length assets, and net working capital associated with this facility and continues to serve customers from a portion of the Decatur facility used under a long-term lease. As a result of the sale, Worthington recorded a $67.4 million pre-tax charge during its fourth quarter of the fiscal year ended May 31, 2004 (“fiscal 2004”) and an additional pre-tax charge of $5.6 million in the first quarter of fiscal 2005, the latter mainly relating to contract termination costs. For further discussion on this matter, see “Item 1. – Business – Processed Steel Products” and “Item 7. – Management’s Discussion and Analysis of Financial Condition and Results of Operations.”
On September 17, 2004, Worthington Cylinders acquired substantially all of the net assets (other than real property) of the propane and specialty gas cylinder business of Western Industries, Inc. (“Western Cylinder Assets”) for $65.1 million in cash. This acquisition provides the capability to manufacture 14.1 oz. and 16.4 oz. disposable cylinders for products such as hand torches, propane-fueled camping equipment, portable heaters, and tabletop grills from facilities near Milwaukee, Wisconsin. Additional discussion of this acquisition is contained below in “Item 1. – Business – Pressure Cylinders.” See also “Item 8. - Financial Statements and Supplementary Data – Notes to Consolidated Financial Statements – Note Q – Acquisitions.”
On September 23, 2004, Dietrich formed a 50%-owned unconsolidated joint venture, Dietrich Residential Construction, LLC, with Pacific Steel Construction, Inc. (“Pacific”) to focus on residential steel framing, particularly for the military. Pacific contributed its existing contracts to the joint venture, and Dietrich made a $1.5 million capital contribution. The Metal Framing segment sells steel framing products to the joint venture for its projects. This provides an immediate presence in the growing market for steel framed military housing and an additional base from which to penetrate the overall residential market. Additional discussion of this joint venture is
contained below in “Item 1. –Business – Metal Framing” and “Item 7. –Management’s Discussion and Analysis of Financial Condition and Results of Operations–Results of Operations.”
On October 13, 2004, Worthington Cylinders purchased the remaining 49% interest in the joint venture that operates a pressure cylinder manufacturing facility in Hustopece, Czech Republic, for $1.1 million.
On November 5, 2004, Dietrich formed a 60%-owned consolidated Canadian metal framing joint venture, operating under the name Dietrich Metal Framing Canada, LP, with Encore Coils Holdings Ltd. Facilities are located in Mississauga, a suburb of Toronto, Vancouver and Montreal. The joint venture manufactures steel framing products and also offers a variety of proprietary products and systems supplied by our Metal Framing facilities in the United States. Additional discussion of our Canadian joint venture is contained below in “Item 1. – Business – Metal Framing” and “Item 7. – Management’s Discussion and Analysis of Financial Condition and Results of Operations – Results of Operations.”
Worthington Industries maintains an Internet web site at www.worthingtonindustries.com. (ThisThis uniform resource locator, or URL, is an inactive textual reference only and is not intended to incorporate Worthington Industries’ web site into this Annual Report on Form 10-K.) We make available, free of charge, on or through our web site, our annual Annual reports on Form 10-K, quarterly reports on Form 10-Q, current reports on Form 8-K and amendments to those reports, filed or furnished pursuant to Section 13(a) or 15(d) of the Securities Exchange Act of 1934, as amended (the “Exchange Act”), are available free of charge, on or through the Worthington Industries web site, as soon as reasonably practicable after we electronically file such material is electronically filed with, or furnish itfurnished to, the Securities and Exchange Commission (the “SEC”).
Processed Steel ProductsBusiness Segments
At the end of the fiscal year ended May 31, 2008 (“fiscal 2008”), the Company had 44 manufacturing facilities worldwide and held equity positions in ten joint ventures, which operated an additional 22 manufacturing facilities worldwide.
The ProcessedCompany has three principal reportable operating segments: Steel ProductsProcessing, Metal Framing and Pressure Cylinders. The Steel Processing segment consists of twothe Worthington Steel business unit (“Worthington Steel”). The Metal Framing segment consists of the Dietrich Metal Framing business unit (“Dietrich”). The Pressure Cylinders segment consists of the Worthington Cylinder business unit (“Worthington Cylinders”). All other business units not included in these three reportable operating segments are combined and disclosed in the Other category, which also includes income and expense items not allocated to the operating segments. The Other category includes the Automotive Body Panels, Construction Services and Steel Packaging segments.
Worthington holds equity positions in ten joint ventures, which are further discussed below under the subheading “Joint Ventures.” Only one of the ten joint ventures is consolidated and its operating results are reported in the Steel Processing segment.
During fiscal 2008, the Steel Processing, Metal Framing and Pressure Cylinders segments served approximately 1,200, 3,800 and 2,400 customers, respectively, located primarily in the United States. Foreign sales accounted for approximately 9% of consolidated net sales and were comprised primarily of sales to customers in Canada and Europe. No single customer accounted for over 5% of consolidated net sales. Further reportable operating segment data is provided in “Item 8. – Financial Statements and Supplementary Data – Notes to Consolidated Financial Statements – Note H – Segment Data” of this Annual Report on Form 10-K.
Recent Developments
On September 14, 2007, the Company segment acquired certain cylinder production assets of Wolfedale Engineering, the largest Canadian manufacturer of portable propane gas steel cylinders for use with
barbeque gas grills, recreational vehicles, campers and trailers. These assets and production were integrated into existing facilities.
On September 17, 2007, the Company acquired a 50% interest in Serviacero Planos which operates two steel processing facilities in central Mexico. This joint venture is known as Serviacero Planos, S.A. de C.V. (“Serviacero Worthington”). On March 5, 2008, Serviacero Worthington announced plans to add a greenfield site in the Monterrey, Mexico region. This will be the third facility in Mexico for the Serviacero Worthington joint venture.
On September 25, 2007, a steel processing joint venture was formed with The Magnetto Group to construct and operate a Class One steel processing facility in Slovakia. This 49%-owned joint venture started operations in February 2008 as Canessa Worthington Slovakia s.r.o. (“Canessa Worthington”) and services customers throughout central Europe.
On September 25, 2007, Worthington announced the closure or downsizing of five production facilities in the Metal Framing segment. The affected facilities were: East Chicago, Indiana; Rock Hill, South Carolina; Goodyear, Arizona; Wildwood, Florida; and Montreal, Canada which is being downsized. The Rock Hill facility continues to operate as a steel processing operation and will also produce product for the Aegis joint venture. In addition to the plant closures, the Metal Framing executive and administrative offices will be relocated from Pittsburg, Pennsylvania, to our corporate offices in Columbus, OH. Annual net sales generated by the closed facilities totaled approximately $125.0 million, the majority of which are expected to be transferred to other nearby Metal Framing locations. As of May 31, 2008, all five of the Metal Framing operating facilities have been closed or downsized. Of the $9.0 million in annual savings expected from these actions, $2.1 million was realized in fiscal 2008. The balance will be realized in fiscal 2009. Restructuring charges related to these closures totaled $8.1 million in fiscal 2008 with an additional $4.6 million expected in fiscal 2009.
On September 26, 2007, Worthington Industries announced that the Board of Directors had approved the repurchase of ten million of its outstanding common shares. A prior authorization to repurchase up to ten million common shares, originally approved by the Board of Directors on June 13, 2005, had 1,370,800 common shares remaining under it, making a total of 11,370,800 common shares available for repurchase at the time of the announcement. During fiscal 2008, the Company repurchased 6,451,500 common shares, and at year-end, there were 9,099,500 common shares authorized for repurchase.
On October 25, 2007, Worthington acquired a 49% interest in crate and pallet maker LEFCO Industries, LLC, a minority business enterprise. The resulting joint venture, called LEFCO Worthington, LLC, will manufacture steel rack systems for the automotive and trucking industries, in addition to continuing LEFCO’s existing products.
On March 1, 2008 TWB Company, L.L.C. (“TWB”), our joint venture with ThyssenKrupp Steel North America, Inc. (“ThyssenKrupp”), acquired ThyssenKrupp Tailored Blanks, S.A. de C.V., the Mexican subsidiary of ThyssenKrupp, to expand TWB’s presence in Mexico. As a result, ThyssenKrupp now owns 55% of TWB and Worthington now owns 45%.
On June 2, 2008, Worthington made an additional capital contribution of $392,000 to Viking & Worthington Steel Enterprise, LLC. The other member in the joint venture did not make its contribution as required by the operating agreement. As a result, Worthington became the majority owner of the joint venture, and Gerstenslager.the joint venture will be consolidated in Worthington’s financial statements starting in fiscal 2009.
On June 2, 2008, the Company acquired substantially all of the assets of The Sharon Companies Ltd. (“Sharon Stairs”). The Sharon Stairs business designs and manufactures steel egress stair systems for the commercial construction market and operates one manufacturing facility in Akron, Ohio. It will operate as part of Worthington Integrated Building Systems, LLC (“Worthington-IBS”).
Steel Processing
The Steel Processing segment consists of the Worthington Steel business unit, and includes Precision Specialty Metals, Inc., a specialty stainless processor located in Los Angeles, California (“PSM”), and Spartan Steel Coating, LLC (“Spartan”), a consolidated joint venture. For fiscal 2005,2008, the fiscal 2004,year ended May 31, 2007 (“fiscal 2007”), and the fiscal year ended May 31, 20032006 (“fiscal 2003”2006”), the percentage of consolidated net sales generated by the Processed Steel ProductsProcessing segment was 58.6%48%, 57.7%49%, and 60.5%51%, respectively.
Both Worthington Steel and Gerstenslager areis one of America’s largest independent intermediate processors of flat-rolled steel. Worthington SteelIt occupies a niche in the steel industry by focusing on products requiring exact specifications. These products cannot typically cannot be supplied as efficiently by steel mills or steel end-users. We believe that end-users of these products.
The Steel Processing segment, including Spartan, owns and operates ten manufacturing facilities – one each in California, Indiana, Kentucky and Maryland, two in Michigan, and three in Ohio – and leases one manufacturing facility in Alabama.
Worthington Steel is one of the largest independent flat-rolled steel processors in the United States. Gerstenslager is a leading independent supplier of automotive quality exterior body panels to the North American automotive original equipment and past model service markets. Gerstenslager’s strength is its ability to handle a large number of past-model service and current-model production automotive and heavy-duty truck body parts.
The Processed Steel Products segment operates 10 manufacturing facilities throughout the United States and one consolidated joint venture, Spartan Steel Coating, LLC (“Spartan”). Together, they serveserves approximately 1,1001,200 customers from these facilities, principally in the automotive, construction, lawn and garden, hardware, furniture, office equipment, electrical control, tubing, leisure and recreation, appliance, farm implement,agricultural, HVAC, container, and aerospace markets. During fiscal 2005, noAutomotive-related customers have historically represented approximately half of its net sales. No single customer represented greater than 7% of net sales for the segment.
Steel Processing segment during fiscal 2008.
Worthington Steel buys coils of steel from major integrated steel mills and mini-mills and processes them to the precise type, thickness, length, width, shape, temper and surface quality required by customer specifications. Computer-aided processing capabilities include, among others:
pickling, a chemical process using an acidic solution to remove surface oxide which develops on hot-rolled steel;
slitting, which cuts steel to specific widths;
cold reduction,reducing, which achieves close tolerances of thickness and temper by rolling;
hot-dipped galvanizing, which coats steel with zinc and zinc alloys through a hot-dipped process;
hydrogen annealing, a thermal process that changes the hardness and certain metallurgical characteristics of steel;
cutting-to-length, which cuts flattened steel to exact lengths;
tension leveling, a method of applying pressure to achieve precise flatness tolerances for steel;
edging, which conditions the edges of the steel by imparting round, smooth or knurled edges;
|
|
non-metallic coating including dry lubrication, acrylic and paint; and
configured blanking, which stamps steel into specific shapes.
Worthington Steel also toll processes steel for steel mills, large end-users, service centers, and other processors. Toll processing is different from typical steel processing becausein that the mill, end-user, or end-userother party retains title to the steel and has the responsibility for selling the end product. Toll processing enhances Worthington’sWorthington Steel’s participation in the market for wide sheet steel and large standard orders, which is a market generally served by steel mills rather than by intermediate steel processors.
Gerstenslager stamps, assembles, primes, and packages exterior automotive body parts and panels. The steel used in the Gerstenslager operations is occasionally consigned material, similar to toll processing. Gerstenslager processes a large number of past-model service and current-model production automotive and heavy-duty truck parts, managing over 3,000 finished good part numbers and over 11,000 die/fixture sets.
The Processed Steel Productsprocessing industry is fragmented and highly competitive. There are many competitors, including other independent intermediate processors, and, with respect to automotive stamping, captive processors owned by the automotive companies, independent tier-one suppliers of current-model components, and a number of smaller competitors.processors. Competition is primarily on the basis of price, product quality, and the ability to meet delivery requirements, and price.requirements. Technical service and support for material testing and customer-specific applications enhance the quality of our products. However, we have not quantified the extent to which our technical service capability has improved our competitive position. Seeproducts (See “Item 1. – Business – Technical Services.” We believe that ourServices”). However, the extent to which technical service capability has improved Worthington Steel’s competitive
position has not been quantified. Worthington Steel’s ability to meet tight delivery schedules is, in part, based on the proximity of our facilities to customers, suppliers and one another. Again, we have not quantified theThe extent to which plant location has impacted ourWorthington Steel’s competitive position. Our processedposition has not been quantified. Processed steel products are priced competitively, primarily based on market factors, including, among other things, competitive pricing, the cost and availability of raw materials, transportation and shipping costs, and overall economic conditions in the United States and abroad.
Effective August 1, 2004, the Decatur, Alabama, steel-processing facility and its cold-rolling assets were sold to Nucor Corporation for $80.4 million cash. Worthington Steel retained the slitting and cut-to-length assets and net working capital associated with this facility and continues to serve customers from a portion of the Decatur facility used under a long-term lease. As a result of the sale, Worthington recorded a $67.4 million pre-tax charge during its fourth quarter of fiscal 2004 and an additional pre-tax charge of $5.6 million during the first quarter of fiscal 2005, the latter mainly relating to contract termination costs. For further discussion on this matter, see “Item 7. – Management’s Discussion and Analysis of Financial Condition and Results of Operations – Overview.”
We use our “Worthington Steel” and “Gerstenslager” trade names in our Processed Steel Products segment, and we use the unregistered trademark “CleanCoat™” in connection with our dry lubrication process. We intend to continue the use of our intellectual property. The “CleanCoat™” trademark is important to our Processed Steel Products segment, but we do not consider it material.
Metal Framing
OurThe Metal Framing segment, consistsconsisting of onethe Dietrich Metal Framing business unit, Dietrich, which designs and produces metal framing components, and systems and related accessories for the commercial and residential construction markets within the United States.States and Canada. For fiscal 2005,2008, fiscal 2004,2007, and fiscal 2003,2006, the percentage of consolidated net sales generated by ourthe Metal Framing segment was 27.5%26%, 27.8%26%, and 24.3%28%, respectively.
Our Metal Framing products include steel studs and track, floor and wall system components, roof trusses and other metal framing accessories. Some of our specific products include “TradeReady®” Floor Systems, “Spazzer®” bars, “Clinch-On®”building product accessories, such as metal corner bead, lath, lath accessories, clips, fasteners and trimvinyl bead and “Ultra Span®” trusses through our unconsolidated joint venture, Aegis Metal Framing, LLC (“Aegis”).trim.
OurThe Metal Framing segment has 2720 operating facilities located throughout the United States.States: one each in Arizona, Colorado, Georgia, Hawaii, Illinois, Indiana, Kansas, Maryland, Massachusetts, New Jersey, South Carolina and Washington; two each in California, Florida, Ohio and Texas. This segment also operates our consolidated joint venture, Dietrich Metal Framing Canada, LP, which currently has an additional three2 operating facilities in Canada. They believe that Canada: one each in British Columbia and Ontario.
Dietrich is the largest national supplier of metal framing products and supplies,manufacturer in the United States, supplying approximately 41%35% of the metal framing products sold in the United States. We haveDietrich is the second largest metal framing manufacturer in Canada with a market share of between 20% and 25%. Dietrich serves approximately 3,4003,800 customers, primarily consisting of wholesale distributors, commercial and residential building contractors, and big box building material retailers.mass merchandisers. During fiscal 2005, their two2008, Dietrich’s three largest customers represented approximately 13%16%, 10% and 12%10%, respectively, of the net sales for the segment, while no other customer represented more than 4%2% of net sales for the segment.
The light gaugelight-gauge metal framing industry is very competitive. We competeDietrich competes with seven large regional or national competitors and numerous small, more localized competitors. We competecompetitors, primarily on the basis of quality,price, service and price.quality. As is the case in our Processedthe Steel ProductsProcessing segment, the proximity of our facilities to our customers and their project sites provides us with a service advantage and impacts our freight and shipping costs. OurDietrich’s products are transported almost exclusively by both common carrier. We have not quantified theand dedicated carriers. The extent to which facility location has impacted ourDietrich’s competitive position.
position has not been quantified.
Dietrich uses numerous trademarks and patents in its business. Dietrich licenses from Hadley Industries the “UltraSTEEL®” registered trademark and the United States and Canadian patents to manufacture “UltraSTEEL®” metal framing and accessory products. The “Spazzer®” trademark is used in connection with wall component products that are the subject of four United States patents, onetwo foreign patent,patents, one pending United States patent application, and several pending foreign patent applications. The trademark “TradeReady®” is used in connection with floor-system products that are the subject of four United States patents, seventeennumerous foreign patents, one pending United States patent application, and fiveseveral pending foreign patent applications. The “Clinch-On®” trademark is used east of the Rockies in connection with corner bead and metal trim products for gypsum wallboard. Dietrich licenses the “SLP-TRK®” trademark as well as the patent to manufacture “SLP-TRK®” slotted track in the United States from Brady Construction Innovations, Inc. Aegis Metal Framing, LLC, an unconsolidated joint venture, uses the “Ultra-Span®” registered trademark in connection with certain patents for proprietary roof trusses. We intendDietrich intends to continue to use and renew each of ourits registered trademarks. Dietrich also has a number of other patents, trademarks and trade names relating to specialized products. Although trademarks, trade names, and patents are important to our Metal Framing segment, none is considered material.
Pressure Cylinders
OurThe Pressure Cylinders segment consists of onethe Worthington Cylinders business unit, Worthington Cylinders.unit. For fiscal 2005,2008, fiscal 2004,2007, and fiscal 2003,2006, the percentage of consolidated net sales generated by Worthington Cylinders was 13.3%20%, 13.8%18%, and 14.5%16%, respectively.
Worthington Cylinders operates nineeight manufacturing facilities with three in Ohio, two in Wisconsin, and one each in Wisconsin, Austria, Canada, the Czech Republic, and Portugal
Portugal.
OurThe Pressure Cylinders segment produces a diversified line of pressure cylinders, including low-pressure liquefied petroleum gas (“LPG”) and refrigerant gas cylinders andcylinders; high-pressure and industrial/specialty gas cylinders. Ourcylinders; airbrake tanks; and certain consumer products. LPG cylinders are sold to manufacturers, distributors and/orand mass merchandisers and are used to hold fuel for gas barbecue grills, recreational vehicle equipment, residential and light commercial heating systems, industrial forklifts, propane-fueled camping equipment, hand held torches, and commercial/residential cooking (the latter, generally outside North America). Refrigerant gas cylinders are sold primarily to major refrigerant gas producers and distributors and are used to hold refrigerant gases for commercial, residential, and residentialautomotive air conditioning and refrigeration systems and for automotive air conditioning systems. High-pressure and industrial/specialty gas cylinders are sold primarily to gas producers and distributors as containers for gases used in: cutting and welding metals; breathing (medical, diving and firefighting); semiconductor production; beverage delivery; and compressed natural gas systems. Worthington Cylinders also produces recovery tanks for refrigerant gases, air reservoirs for truck and trailer original equipment manufacturers, and non-refillable cylinders for “Balloon Time®” helium kits.kits which include non-refillable cylinders. While a large percentage of our cylinder sales are made to major accounts, Worthington Cylinders has approximately 2,5002,400 customers. During fiscal 2005,2008, no single customer represented more than 7%6% of net sales for the segment.
On September 17, 2004, Worthington Cylinders acquired the Western Cylinder Assets. This acquisition gives us the ability to manufacture 14.1 oz. and 16.4 oz disposable cylinders from locations in Chilton and Menomonee Falls, Wisconsin. At these facilities, we manufacture and fill the cylinders with various gases, including propane, MAPPTM, propylene and oxygen, for use with hand torches, propane-fueled camping equipment, portable heaters, and tabletop grills. The acquisition expands our consumer product offerings to both our retail and gas distributor customers.
Worthington Cylinders produces low-pressure steel cylinders with refrigerant capacities of 15 to 1,000 lbs.pounds and steel and aluminum cylinders with LPG capacities of 14.1 oz.ounces to 420 lbs.pounds. Low-pressure cylinders are produced by precision stamping, drawing, and welding and/or brazing component parts to customer specifications. They are then tested, painted and packaged, as required. Our high-pressureHigh-pressure steel cylinders are manufactured by several processes, including deep drawing, tube spinning and billet piercing. In the United States and Canada, our high-pressure and low-pressure cylinders are primarily manufactured in accordance with U.S. Department of Transportation and Transport Canada specifications. Outside the United States and Canada, we manufacture cylinders are manufactured according to European Normnorm specifications, as well as various other international standards.
In the United States and Canada, Worthington Cylinders has one principal domestic competitor in the low-pressure non-refillable refrigerant market, one principal domestic competitor in the low-pressure LPG cylinder market, and two principal domestic competitors in the high-pressure cylinder market. There are also several smaller foreign competitors in these markets. We believeWorthington Cylinders believes that we haveit has the largest domestic market share in both low-pressure cylinder markets. In the European high-pressure cylinder market, there are several competitors. We believeWorthington Cylinders believes that we have the largest European market shareit is a leading producer in both the high-pressure cylinder and low-pressure non-refillable cylinder markets.markets in Europe. As with ourWorthington’s other segments, we compete on the basis ofcompetition is based upon price, service price and quality.
OurThe Pressure Cylinders segment uses the trade name “Worthington Cylinders” to conduct business and the registered trademark “Balloon Time®” to market low-pressure helium balloon kits. We intendkits; the trademark “FLAMESAVER™” to market certain LP gas cylinders; the trademark “WORTHINGTON PRO GRADE™” to market certain LPG cylinders, hand torch cylinders and camping fuel cylinders; and the trademark “MAP-PRO™”. The Pressure Cylinders segment intends to continue to use these trademarks and renew ourits registered trademark.trademarks. This intellectual property is important to ourthe Pressure Cylinders segment but is not considered material.
Other
The “Other” category consists of those operationssegments that do not fit into our reportable segments and are immaterialmeet the materiality tests for purposes of separate disclosure. They includedisclosure and other corporate related entities. These segments are Automotive Body Panels, Construction Services and Steel Packaging.
The Automotive Body Panels segment consists of The Gerstenslager Company (“Gerstenslager”), which is ISO/TS 16949:2002 and ISO14001 certified. Gerstenslager provides stamping, blanking, assembly, painting, packaging, die management, warehousing, distribution management and other services to customers, primarily in the automotive industry. Gerstenslager is a major supplier to the automotive past-model market and manages more than 3,300 finished good part numbers and more than 12,600 stamping dies/fixture sets for the past- and current-model year automotive and truck manufacturers, both domestic and transplant.
The Construction Services segment consists of the Worthington-IBS business unit which includes Worthington Mid-Rise Construction, Inc., which designs and builds mid-rise light-gauge steel framed commercial structures and multi-family housing units; Worthington Military Construction, Inc., which is involved in the supply and construction of metal framing products for, and in the framing of, single family housing, with a focus on military; a 36 unit mid-rise light-gauge steel framed apartment project in China entered into primarily for research and development purposes; and recently acquired Sharon Stairs, a manufacturer of pre-engineered egress stair solutions.
The Steel Packaging segment consists of Worthington Steelpac Systems, LLC (“Steelpac”) and corporate related entities., which is an ISO-9001: 2000 certified manufacturer of engineered, recyclable steel shipping solutions. Steelpac designs and manufactures reusable custom steel platforms, racks, and pallets made of steel for supporting, protecting and handling products throughthroughout the entire shipping process servicing the retail,for industries such as automotive, lawn care, foodand garden and recreational vehicle markets.
vehicles.
Segment Financial Data
Financial information for ourthe reportable segments is provided in “Item 8. – Financial Statements and Supplementary Data – Notes to Consolidated Financial Statements – Note H – Industry Segment Data.”
Data” of this Annual Report on Form 10-K. That financial information is incorporated herein by reference.
Financial Information About Geographic Areas
Foreign operations represented 9%, 8%, and exports represent less than 10%6% of our production and consolidated net sales.sales for fiscal 2008, fiscal 2007, and fiscal 2006, respectively. Summary information about ourWorthington’s foreign operations is set forth in “Item 8. – Financial Statements and Supplementary Data – Notes to Consolidated Financial Statements – Note A – Summary of Significant Accounting Policies –Risks and Uncertainties.Uncertainties” of this Annual Report on Form 10-K. That summary information is incorporated herein by reference. For fiscal 20052008, fiscal 2007, and fiscal 2004, we2006, Worthington had operations in North America and Europe, and prior years also included operations in South America.Europe. Net sales by geographic region are provided in “Item 8. – Financial Statements and Supplementary Data – Notes to Consolidated Financial Statements – Note H – Industry Segment Data.”
Data” of this Annual Report on Form 10-K. That information is incorporated herein by reference.
Suppliers
In fiscal 2005, we2008, Worthington purchased over 3.0approximately three million tons of steel for use as raw material for our Processed(58% hot-rolled, 29% galvanized, and 13% cold-rolled) on a consolidated basis. Steel Products, Pressure Cylinders and Metal Framing segments. We purchase steelis purchased in large quantities at regular intervals
from major primary producers, both domestic and foreign. In our Processedthe Steel ProductsProcessing segment, westeel is primarily purchasepurchased and process steelprocessed based on specific customer orders and do not typically purchase steel without a customer order. Ourorders. The Metal Framing and Pressure Cylinders segments purchase steel to meet their production schedules. Our rawRaw materials are generally purchased in the open market on a negotiated spot-market basis at prevailing market prices. WeSupply contracts are also enterentered into, supply contracts, some of which have fixed pricing. During fiscal 2005, our2008, major suppliers of steel were, in
alphabetical order: AK Steel Corporation; ArcelorMittal; California Steel Industries, Inc.; Gallatin Steel Company; North Star BlueScope Steel LLC; Nucor Corporation; USSeverCorr, LLC; Severstal North America, Inc.; Steel Dynamics, Inc.; Stemcor Holdings Limited; United States Steel Corporation; USS-POSCO Industries; and WCI Steel, Inc. Alcoa, Inc. was the primary aluminum supplier for ourthe Pressure Cylinders segment in fiscal 2005. We believe that our2008. Major suppliers of zinc to the Steel Processing segment were, in alphabetical order: Considar Metal Marketing (a/k/a HudBay), Industrias Peñoles, Teck Cominco Limited and Xstrata Zinc Canada. Approximately 35 million pounds of zinc were purchased in fiscal 2008. Worthington believes its supplier relationships are good.
Technical Services
We employWorthington employs a staff of engineers and other technical personnel and maintain fully-equipped modernmaintains fully equipped laboratories to support our operations. These facilities enable us to verify, analyzeverification, analysis and documentdocumentation of the physical, chemical, metallurgical and mechanical properties of our raw materials and products. Technical service personnel also work in conjunction with ourthe sales force to determine the types of flat-rolled steel required for our customers’ particularcustomer needs. Additionally, technical service personnel design and engineer metal framing structures and provide sealed shop drawings to the building construction markets. To provide these services, we maintainWorthington maintains a continuing program of developmental engineering with respect to theproduct characteristics and performance of our products under varying conditions. Laboratory facilities also perform metallurgical and chemical testing as dictated by the regulations of the U.S. Department of Transportation, Transport Canada, and other associated agencies, along with International Organization for Standardization (ISO) and customer requirements. All design work complies with applicable current local and national building code requirements. OurAn IAS (International Accreditations Service, Incorporated) accredited product-testing laboratory supports these design efforts.
Seasonality
Sales are generally weaker in the third quarter of the fiscal year, primarily due to reduced activity in the building and construction industry as a result of the weather, as well as customer plant shutdowns in the automotive industry due to holidays. Sales are generally strongest in the fourth quarter of the fiscal year when all of the segments are normally operating at seasonal peaks.
Employees
As of May 31, 2005, we2008, Worthington employed approximately 6,4506,900 employees in ourits operations, excluding the unconsolidated joint ventures, approximately 9%ventures. Approximately 14% of whomthese employees were represented by collective bargaining units. Worthington believes it has good relationships with its employees in general, including those covered by collective bargaining agreements. We believe that we have good relationships with our employees.
units.
Joint Ventures
As part of oura strategy to selectively develop new products, markets, and technological capabilities and to expand ouran international presence, while mitigating the risks and costs associated with those activities, we participateWorthington participates in twoone consolidated and sevennine unconsolidated joint ventures.
Consolidated
Dietrich Metal Framing Canada, LP, a 60%-owned joint venture with Encore Coils Holdings Ltd, operates a Canadian metal framing joint venture which manufactures steel framing products at its Canadian facilities in Mississauga, Vancouver and LaSalle, and also offers a variety of proprietary products and systems supplied by our Metal Framing facilities in the United States.
Spartan Steel Coating, LLC (“Spartan”) is a 52%-owned consolidated joint venture with Severstal North America, Inc., located in Monroe, Michigan. It operates a cold-rolled, hot-dipped galvanizing line for toll processing steel coils into galvanized and galvannealed products intended primarily for the automotive industry. Spartan’s financial results are fully consolidated into the Steel Processing segment. The equity ownership of Severstal is shown as minority interest on the consolidated balance sheets and its portion of operating income is eliminated in miscellaneous expense on the consolidated statements of earnings.
Unconsolidated
• | Accelerated Building Technologies, LLC (“ABT”), a 50%-owned joint venture with NOVA Chemicals Corporation, evaluates, develops, tests, manufactures, sells and otherwise commercializes construction products which are used in combination with light-gauge steel framing. ABT has developed the accel-E™ wall panel system which combines high strength, technically enhanced UltraSTEEL® framing with a fire, termite and mold- resistant modified EPS insulation to provide a cost-effective, energy-efficient and structurally superior panelized building alternative to conventional stick and batt framing. |
• | Aegis Metal Framing, LLC (“Aegis”), is a 60%-owned joint venture with MiTek Industries Inc., headquartered in Chesterfield, Missouri. Aegis supplies an integrated package of sophisticated design software, professional engineering services, and cold-formed metal framing products to the pre-fabricated building components industry. Aegis’ comprehensive range of metal framing elements, including the Ultra-Span® truss system, TradeReady® joist system, and structural wall framing is sold to companies that design and assemble pre-fabricated trusses, wall panels and floor systems. These pre-assembled elements are used to speed construction cycle times and reduce overall costs in the commercial, institutional, and multi-family construction markets. |
Canessa Worthington Slovakia s.r.o. (“Canessa Worthington”), a 49%-owned joint venture with The Magnetto Group, operates one manufacturing facility in Monroe, Michigan.Kosice, Slovakia. Canessa Worthington offers Class One steel processing services such as slitting, blanking and cutting-to-length for customers throughout central Europe.
UnconsolidatedLEFCO Worthington, LLC (“LEFCO Worthington”), a 49%-owned joint venture with LEFCO Industries, LLC, is a minority business enterprise which offers engineered wooden crates, specialty pallets, and steel rack systems for a variety of industries, including defense and automotive. LEFCO Worthington also mass produces the first light-weight, flame-resistant steel pallet designed to meet the Grocery Manufacturers Association’s capacity and compatibility standards. LEFCO Worthington operates one manufacturing facility in Cleveland, Ohio.
Acerex,Serviacero Planos, S.A. de C.V. (“Acerex”Serviacero Worthington”), a 50%-owned joint venture with HylsamexInverzer, S.A. de C.V., operates atwo facilities in Mexico, one in Leon and one in Queretaro. Serviacero Worthington provides steel processing facility in Monterrey, Mexico.
Aegis Metal Framing, LLC, a 60%-owned joint venture with MiTek Industries, Inc., headquartered in Chesterfield, Missouri, offers light-gauge metal component manufacturersservices such as slitting, multi-blanking and contractors design, estimatingcutting-to-length for automotive, appliance and management software, a full line of metal framing products, and integrated professional engineering services.
Dietrich Residential Construction, LLC (“DRC”), a 50%-owned joint venture with Pacific Steel Construction, Inc., focuses on residential steel framing, particularly for the military.electronics related customers.
TWB Company, LLCL.L.C. (“TWB”), a 50%45%-owned joint venture with ThyssenKrupp Steel North America, Inc., is a leading North American supplier of tailor welded blanks, manufacturing 13 million per year. TWB produces laser-welded blanks for use in the automotive industry for products such as inner-door panels.panels, bodysides, rails and pillars. TWB operates facilities in Prattville, Alabama; Monroe, Michigan; Columbus, Indiana; and SaltilloPuebla, Ramos Arizpe (Saltillo) and Hermosillo, Mexico.
Viking & Worthington Steel Enterprise, LLC (“VWS”VWSE”), a 49%-owned joint venture with Bainbridge Steel, LLC, an affiliate of Viking Industries, LLC, operates a steel processing facility in Valley City, Ohio,Ohio. VWSE closed its manufacturing operations in June 2008 and is a qualified minorityits business enterprise.will be reorganized or wound down.
Worthington Armstrong Venture (“WAVE”), a 50%-owned joint venture with Armstrong Ventures, Inc., a subsidiary of Armstrong World Industries, Inc., is one of the three leadingfour global manufacturers and multiple smaller international manufacturers of suspended ceilingsuspension grid systems for concealed and lay-in panel ceilings.ceilings used in commercial and residential ceiling markets. WAVE operates seven facilities in five countries: Aberdeen, Maryland; Benton Harbor, Michigan; and North Las Vegas, Nevada;Nevada, within the United States; Shanghai, the Peoples Republic of China; Team Valley, United Kingdom; Valenciennes, France; and Madrid, Spain.
Worthington Specialty Processing Inc. (“WSP”), a 50%-owned general partnershipjoint venture with U.S.United States Steel Corporation (“U.S. Steel”), operates a steel processing facility in Jackson, Michigan, operatesMichigan. The facility is managed by Worthington Steel and serves primarily as a toll processor for U.S. Steel. WSP processes
master steel coils into both slit coils and sheared first operation blanks, including rectangles, trapezoids, parallelograms and chevrons, designed to meet specifications for the automotive, appliance, furniture and metal door industries. |
See “Item 8. – Financial Statements and Supplementary Data – Notes to Consolidated Financial Statements – Note J – Investments in Unconsolidated Affiliates” for further information about Worthington’s participation in unconsolidated joint ventures.
Environmental Regulation
OurWorthington’s manufacturing facilities, generally in common with those of similar industries making similar products, are subject to many federal, state and local requirements relating to the protection of the environment. WeWorthington continually examineexamines ways to reduce emissions and waste and to decrease costs related to environmental compliance. We do not anticipate that theThe cost of compliance or capital expenditures for environmental control facilities required to meet environmental requirements willare not anticipated to be material when compared with our overall costs and capital expenditures and, accordingly, willare not anticipated to have a material effect on the financial position, results of operations or cash flows, or the competitive position of the Company.
Future results and the market price for Worthington Industries’ common shares are subject to numerous risks, many of which are driven by factors that cannot be controlled or predicted. The following discussion, as well as other sections of this Annual Report on Form 10-K, including “Item 7. – Management’s Discussion and Analysis of Financial Condition and Results of Operations,” describe certain business risks. Consideration should be given to the risk factors described below as well as those in the Safe Harbor Statement at the beginning of this Annual Report on Form 10-K, in conjunction with reviewing the forward-looking statements and other information contained in this Annual Report on Form 10-K.
Raw Material Prices
Our future operating results may be affected by fluctuations in raw material prices. Our principal raw material is flat-rolled steel, which we purchase from multiple primary steel producers. The steel industry as a whole has been cyclical, and at times availability and pricing can be volatile due to a number of factors beyond our control. These factors include general economic conditions, domestic and worldwide demand, curtailed production at major mills due to factors such as equipment breakdowns, repairs or catastrophic events, labor costs or problems, competition, import duties, tariffs, energy costs, availability and cost of steel inputs (e.g. ore, scrap, coke, energy, etc.), currency exchange rates, and other factors described below under “Raw Material Availability.” This volatility can significantly affect our steel costs. In an environment of increasing prices for steel and other raw materials, competitive conditions may impact how much of the price increases we can pass on to our customers. To the extent we are unable to pass on future price increases in our raw materials to our customers, our financial results could be adversely affected. Also, if steel prices decrease, in general, competitive conditions may impact how quickly we must reduce our prices to our customers and we could be forced to use higher-priced raw materials to complete orders for which the selling prices have decreased.
Raw Material Availability
The costs of manufacturing our products and the ability to supply our customers could be negatively impacted if we experience interruptions in deliveries of needed raw materials or supplies. If, for any reason, our supply of flat-rolled steel or other key raw materials, such as aluminum and zinc, is curtailed or we are
otherwise unable to obtain the quantities we need at competitive prices, our business could suffer and our financial results could be adversely affected. Such interruptions might result from a number of factors including events such as a shortage of capacity in the supplier base or of the raw materials, energy or the inputs needed to make steel or other supplies, failure of suppliers to fulfill their supply obligations, financial difficulties of suppliers, significant events affecting supplier facilities, significant weather events, those factors listed above under “Raw Material Prices” or other factors beyond our control. Further, the number of suppliers has decreased in recent years due to industry consolidation and the financial difficulties of certain suppliers, and consolidation may continue. Accordingly, if delivery from a major supplier is disrupted, it may be more difficult to obtain an alternative supply than in the past.
Inventories
Our business could be harmed if we fail to maintain proper inventory levels. We are required to maintain sufficient inventories to accommodate the needs of our customers including, in many cases, short lead times and just-in-time delivery requirements. Although we typically have customer orders in hand prior to placement of our raw material orders for Steel Processing, we anticipate and forecast customer demand for all segments. We purchase raw materials on a regular basis in an effort to maintain our inventory at levels that we believe are sufficient to satisfy the anticipated needs of our customers based upon orders, customer volume expectations, historic buying practices and market conditions. Inventory levels in excess of customer demand may result in the use of higher-priced inventory to fill orders reflecting lower selling prices, if steel prices have significantly decreased. These events could adversely affect our financial results. Conversely, if we underestimate demand for our products or if our suppliers fail to supply quality products in a timely manner, we may experience inventory shortages. Inventory shortages might result in unfilled orders, negatively impacting our customer relationships, and resulting in lost revenues, any of which could harm our business and adversely affect our financial results.
Economic or Industry Downturns
Downturns or weakness in the economy in general or in key industries, such as construction or automotive, may adversely affect our customers, which may cause the demand for our products and services to decline and adversely affect our financial results. Many of our customers are in industries and businesses that are cyclical in nature and affected by changes in general economic conditions or conditions specific to their respective markets, such as the construction and automotive industries. Product demand in our customer’s end markets is based on numerous factors such as interest rates, general economic conditions, consumer confidence, and other factors beyond our control. Downturns in demand from the construction industry, the automotive industry or any of the other industries we serve, or a decrease in the margins that we can realize from sales of our products to customers in any of these industries, could adversely affect our financial results.
Reduced construction activity, especially in office buildings, could negatively impact our financial results. The construction market is a key end market with approximately 40% of our net sales going to that market in fiscal 2008. If construction activity in the United States, in general, or by one or more of our major customers, in particular, were to be reduced significantly, it could negatively affect our sales and financial results.
Reduced automotive/truck production and the financial difficulties of customers in this market could negatively impact our financial results. The automotive and truck market remains a key customer group with approximately 26% of the Company’s net sales derived from that market in fiscal 2008. If domestic automotive production, in general, or by one or more of our major domestic customers, in particular, were to be reduced significantly, it could negatively affect our sales and financial results.
The financial difficulties and internal strategies of customers could adversely affect us. A portion of our business is highly dependent on automotive manufacturers, many of which have publicly announced plans to
reduce production levels and eliminate excess manufacturing capacity including plans to eliminate jobs and reduce costs. These actions are impacting automotive suppliers who are also taking similar actions. Some customers in the construction and other industries are also experiencing cutbacks. The financial difficulties of certain customers and the efforts under way by our customers to improve their overall financial condition could result in numerous changes that are beyond our control, including additional unannounced customer plant closings, decreased production, changes in product mix or distribution patterns, volume reductions, labor disruptions, collectibility of our accounts receivable, mandatory reductions or other unfavorable changes in our pricing, terms or service conditions or market share losses, as well as other changes we may not accurately anticipate. These events could adversely impact our financial results.
The loss of significant volume from key customers could adversely affect us. In fiscal 2008, our largest customer accounted for approximately 4% of our gross sales, and our ten largest customers accounted for approximately 24% of our gross sales. A significant loss of, or decrease in, business from any of these customers could have an adverse effect on our sales and financial results if we cannot obtain replacement business. Also, due to consolidation in the industries we serve, including the construction, automotive and retail industries, our gross sales may be increasingly sensitive to deterioration in the financial condition of, or other adverse developments with respect to, one or more of our top customers.
Competition
Our business is highly competitive, and increased competition could negatively impact our financial results. Generally, the markets in which we conduct business are highly competitive. Competition for most of our products is primarily on the basis of price, product quality, and our ability to meet delivery requirements. Increased competition could cause us to lose market share, increase expenditures, lower our margins or offer additional services at a higher cost to us, which could adversely impact our financial results.
Material Substitution
In certain applications, steel competes with other materials, such as aluminum (particularly in the automobile industry), cement and wood (particularly in the construction industry), composites, glass and plastic. Prices of all of these materials fluctuate widely and differences between them and steel prices may adversely affect demand for our products and/or encourage substitution, which could adversely affect prices and demand for steel products. The sharp increase in the cost of steel during fiscal 2008 could make material substitution more attractive for certain uses.
Freight and Energy
The availability and cost of freight and energy, such as electricity, natural gas and diesel fuel, is important in the manufacture and transport of our products. Our operating costs increase when energy costs rise. During periods of increasing freight and energy costs, we might not be able to fully recover our operating cost increases through price increases without reducing demand for our products. Our financial results could be adversely affected if we are unable to pass all of the increases on to our customers or if we are unable to obtain the necessary freight and energy. Also, increasing energy costs could put a strain on the transportation of materials and products if it forces certain transporters to close.
Information Systems
We are subject to information system security risks and systems integration issues that could disrupt our internal operations. We are dependent upon information technology for the distribution of information internally and also to our customers and suppliers. This information technology is subject to damage or interruption from a variety of sources, including but not limited to computer viruses, security breaches and defects in design. There also could be system or network disruptions if new or upgraded business
management systems are defective or are not installed properly, or are not properly integrated into operations. We are currently in the process of implementing a new software-based enterprise resource planning system (“ERP”). Various measures have been implemented to manage our risks related to information system and network disruptions, but a system failure or failure to implement new systems properly could negatively impact our operations and financial results.
Business Disruptions
Disruptions to our business or the business of our customers or suppliers, could adversely impact our operations and financial results. Business disruptions, including increased costs for or interruptions in the supply of energy or raw materials, resulting from shortages of supply or transportation, from severe weather events (such as hurricanes, floods and blizzards), from casualty events (such as fires or material equipment breakdown), from acts of terrorism, from pandemic disease, from labor disruptions, or from other events (such as required maintenance shutdowns), could cause interruptions to our businesses as well as the operations of our customers and suppliers. Such interruptions could have an adverse effect on our operations and financial results.
Foreign
Economic, political and other risks associated with foreign operations could adversely affect our international financial results. Although the substantial majority of our business activity takes place in the United States, we derive a portion of our revenues and earnings from operations in foreign countries, and are subject to risks associated with doing business internationally. We have wholly-owned facilities in Austria, Canada, the Czech Republic and Portugal and joint venture facilities in China, France, Mexico, Slovakia, Spain and the United Kingdom. The risks of doing business in foreign countries include the potential for adverse changes in the local political climate, in diplomatic relations between foreign countries and the United States or competitive position.in government policies, laws or regulations; terrorist activity that may cause social disruption; logistical and communications challenges; costs of complying with a variety of laws and regulations; difficulty in staffing and managing geographically diverse operations; deterioration of foreign economic conditions; currency rate fluctuations; foreign exchange restrictions; differing local business practices and cultural considerations; restrictions on imports and exports or sources of supply; and changes in duties or taxes. We believe that our business activities outside of the United States involve a higher degree of risk than our domestic activities.
Joint Ventures
A change in the relationship between the members of our joint ventures may have an adverse effect on that joint venture. Worthington has been successful in the development and operation of various joint ventures, and equity in net income from our joint ventures, particularly WAVE, has been important to our financial results. We believe an important element in the success of any joint venture is a solid relationship between the members of that joint venture. If there is a change in ownership, a change of control, a change in management or other event with respect to a member that adversely impacts the relationship between the members, it may adversely impact the joint venture.
Acquisitions
We may not be able to consummate, manage and integrate future acquisitions successfully. Some of our growth has been through acquisitions. We continue to seek additional businesses to acquire in the future. There are no assurances, however, that any acquisition opportunities will arise or, if they do, that they will be consummated, or that any needed additional financing will be available on satisfactory terms when required. In addition, acquisitions involve risks that the businesses acquired will not perform in accordance with expectations, that business judgments concerning the value, strengths and weaknesses of businesses acquired will prove incorrect, that the acquired businesses may not be integrated successfully and that the acquisitions may strain our management resources.
Accounting & Tax Estimates
We are required to make accounting and tax-related estimates and judgments in preparing our consolidated financial statements. In preparing our consolidated financial statements in accordance with accounting principles generally accepted in the United States, we make certain estimates and assumptions that affect the accounting for and recognition of assets, liabilities, revenues and expenses. These estimates and assumptions must be made because certain information that is used in the preparation of our consolidated financial statements is dependent on future events, or cannot be calculated with a high degree of precision from data available. In some cases, these estimates are particularly difficult to determine and we must exercise significant judgment. The estimates and the assumptions having the greatest amount of uncertainty, subjectivity and complexity are related to our accounting for bad debts, returns and allowances, self-insurance, derivatives, stock-based compensation, deferred income taxes, and asset impairments. Actual results could differ materially from the estimates and assumptions that we use, which could have a material adverse effect on our financial condition and results of operations.
Claims and Insurance
Adverse claims experience, to the extent not covered by insurance, may have an adverse effect on our financial results. We self-insure a significant portion of our potential liability for workers’ compensation, product liability, general liability, property, automobile liability, stop loss and employee medical claims. In order to reduce risk, we purchase insurance from highly rated licensed insurance carriers that covers most claims in excess of the deductible or retained amounts. We maintain an accrual for the estimated cost to resolve open claims as well as an estimate of the cost of claims that have been incurred but not reported. The occurrence of significant claims, our failure to adequately reserve for such claims, a significant cost increase to maintain our insurance, or the failure of our insurance provider to perform, could have an adverse impact on our financial condition and results of operations.
Principal Shareholder
Our principal shareholder may have the ability to exert significant influence in matters requiring a shareholder vote and could delay, deter or prevent a change in control of Worthington Industries. Pursuant to our charter documents, certain matters such as those in which a person would attempt to acquire or take control of the Company, must be approved by the vote of the holders of common shares representing at least 75% of Worthington Industries’ outstanding voting power. Approximately 23% of our outstanding common shares may be voted by John P. McConnell, our Chairman of the Board and Chief Executive Officer. As a result of his voting power, John P. McConnell may have the ability to exert significant influence in these matters and other proposals upon which our shareholders vote.
Item 1B. — Unresolved Staff Comments
No response required.
General
OurThe principal corporate offices of Worthington Industries, as well as the corporate offices for Worthington Cylinders and Worthington Steel, are located in a leased office building in Columbus, Ohio.Ohio, containing approximately 117,700 square feet. Worthington also owns three facilities for administrative and medical facilities in Columbus, Ohio containing an aggregate of approximately 166,000 square feet. The corporate and administrative offices of Dietrich Metal Framing are being relocated from Pennsylvania to Columbus, OH in calendar 2008. As of May 31, 2005, we2008, Worthington owned or leased a total of approximately 10,300,0009,500,000 square feet of space for our operations, of which approximately 9,900,0008,000,000 square feet is(9,100,000 square
feet with warehouses) was devoted to manufacturing, product distribution and sales offices. Our majorMajor leases contain renewal options for periods of up to ten years. For information concerning our rental obligations, see the discussion of contractual obligations under “Item 7. – Management’s Discussion and Analysis of Financial Condition and Results of Operations –Contractual Cash Obligations and Other Commercial Commitments”Commitments” as well as “Item 8. – Financial Statements and Supplementary Data – Notes to Consolidated Financial Statements – Note L – Operating Leases.” We believe that our distributionLeases” of this Annual Report on Form 10-K. Distribution and office facilities provide adequate space for our operations and are well maintained and suitable.
Excluding our joint ventures, we operate 47Worthington operates 44 manufacturing facilities and twotwelve warehouses. All of ourThe facilities are generally well maintained and in good operating condition, and we believe they are believed to be sufficient to meet our current needs.
Processed Steel ProductsProcessing
The Processed Steel ProductsProcessing segment, which includes the consolidated joint venture Spartan, operates 10ten manufacturing facilities, nine of which are ownedwholly-owned, containing approximately 2,990,000 square feet, and one of which is leased.leased, containing approximately 228,500 square feet. These facilities are located in Alabama, California, Indiana, Kentucky, Maryland, Michigan (2) and Ohio (3). This segment also owns one warehouse in Ohio containing approximately 110,000 square feet. As noted above, its corporate offices are located in Columbus, Ohio.
Metal Framing
The Metal Framing segment operates 22 manufacturing facilities: 20 in the United States and two in Canada. In the United States, these facilities are located in Arizona, California (2), Colorado, Florida (2), Georgia, Hawaii, Illinois, Indiana, Kansas, Maryland, Massachusetts, New Jersey, Ohio (2), South Carolina, Texas (2), and Washington. The facilities in Canada are located in British Columbia and Ontario. Of these manufacturing facilities, 12 are leased containing approximately 880,000 square feet and 10 are owned containing approximately 1,500,000 square feet. This segment operates three warehouses — one warehouse in Ohio which is owned and contains approximately 314,000 square feet and two in Canada which are leased and contain approximately 36,000 square feet. This segment also owns and operates an administrative facility containing approximately 37,000 square feet in Indiana; and leases administrative space in three locations containing approximately 40,000 square feet in California and Pennsylvania (2). The Pennsylvania corporate and administrative offices are being closed and will move to Columbus, Ohio by the end of calendar 2008. As part of the Restructuring Plan announced by the Company in September 2007, this segment has ceased manufacturing operations at two leased facilities — of which one lease expires in August 2008 and the other in 2011, which is being offered for sublet — and at one owned manufacturing facilities, both of which are currently up for sale.
Pressure Cylinders
The Pressure Cylinders segment operates eight owned manufacturing facilities located in Ohio (3), Wisconsin, Austria, Canada, the Czech Republic and Portugal containing approximately 1,200,000 square feet and two owned warehouses in Canada and Czech Republic containing approximately 121,000 square feet.
Other
Steelpac operates one leased manufacturing facility located in Pennsylvania. Gerstenslager owns and operates two manufacturing facilities, both located in Ohio, containing approximately 1,200,000 square feet; and leases approximately 616,000 square feet in six warehouses throughout Ohio. Construction Services operates manufacturing facilities in Ohio and Washington and leases approximately 4,800 square feet for three administrative offices in Hawaii, Tennessee and China. The newly acquired Sharon Stairs operation leases one manufacturing facility in Akron, Ohio, which has not been included in this count.
Joint Ventures
The Spartan consolidated joint venture owns and operates one manufacturing facility in Michigan, which is included in the Steel Processing segment. The unconsolidated joint ventures operate a total of 21 manufacturing facilities, located in Alabama, Indiana, Kentucky, Maryland, Michigan and Ohio (5). This segment also maintains a warehouse in Columbus, Ohio. In addition, the segment includes Spartan, our consolidated joint venture in Michigan.
Metal Framing
The Metal Framing segment operates 27 manufacturing facilities. These facilities are located in Arizona (2), California (2), Colorado, Florida (4), Georgia (2), Hawaii, Illinois, Indiana (3), Kansas, Maryland, Massachusetts, New Jersey, Ohio (3), South Carolina, Texas (2), and Washington. Of these facilities, 13 are leased and 14 are owned. This segment also leases administrative offices in Pittsburgh and Blairsville, Pennsylvania. The Metal Framing segment includes Dietrich Metal Framing Canada, our consolidated joint venture in Canada.
Pressure Cylinders
The Pressure Cylinders segment owns six manufacturing facilities. These facilities are located in Ohio (3), Austria, Canada, and Czech Republic. This segment also leases two manufacturing facilities in Wisconsin and one in Portugal.
Other
Steelpac operates one leased facility located in Pennsylvania.
Joint Ventures
Our consolidated joint ventures operate four manufacturing facilities in Michigan and Canada (3). Of these facilities, one is owned and three are leased. Our unconsolidated joint ventures operate 15 manufacturing facilities, located in Indiana, Maryland, Michigan (3), Missouri, Nevada and Ohio (2), domestically, and in China, France, Mexico (3)(5), Slovakia, Spain and the United Kingdom, internationally.
Various legal actions, which generally have arisen in the ordinary course of business, are pending against Worthington. None of this pending litigation, individually or collectively, is expected to have a material adverse effect on Worthington.
the financial position, results of operation or cash flows of the Company.
Item 4. –— Submission of Matters to a Vote of Security Holders
None.
No response required.
Supplemental Item. –Item — Executive Officers of the Registrant
The following table lists the names, positions held and ages of the Registrant’s executive officers as of August 1, 2005:July 30, 2008:
Name | Age | Position(s) with the Registrant | Present Office Held Since | |||
John P. McConnell | 51 | Chairman of the Board and Chief Executive Officer | 1996 | |||
John S. Christie | 55 | President and Chief Financial Officer | 2004 | |||
Dale T. Brinkman | 52 | Vice President-Administration, General Counsel and Secretary | 2000 | |||
Joe W. Harden | 55 | President, The Worthington Steel Company | 2003 | |||
Name Position(s) with the Registrant Edmund L. Ponko, Jr. President, Dietrich Industries, Inc. Ralph V. Roberts Senior Vice President-Marketing George P. Stoe President, Worthington Cylinder Corporation Virgil L. Winland Senior Vice President-Manufacturing Richard G. Welch Controller Age Present Office
Held Since 47 2001 58 2001 59 2003 57 2001 47 2000
Name | Age | Position(s) with the Registrant | Present Office Held Since | |||
John P. McConnell | 54 | Chairman of the Board and Chief Executive Officer; a Director | 1996 | |||
John S. Christie | 58 | President and Chief Financial Officer; a Director | 2004 | |||
George P. Stoe | 62 | Executive Vice President and Chief Operating Officer | 2007 | |||
Dale T. Brinkman | 55 | Vice President-Administration, General Counsel and Secretary | 2000 | |||
Harry A. Goussetis | 54 | President, Worthington Cylinder Corporation | 2005 | |||
Lester V. Hess | 53 | Treasurer | 2006 | |||
John E. Roberts | 53 | President, Dietrich Industries, Inc. | 2007 | |||
Ralph V. Roberts | 61 | Senior Vice President-Marketing; President, Worthington Integrated Building Systems, LLC | 2006 | |||
Mark A. Russell | 45 | President, The Worthington Steel Company | 2007 | |||
Richard G. Welch | 50 | Controller | 2000 | |||
Virgil L. Winland | 60 | Senior Vice President-Manufacturing | 2001 |
John P. McConnell has served as Worthington Industries’ Chief Executive Officer since June 1993, as a director of Worthington Industries continuously since 1990, and as Chairman of the Board of Worthington Industries since September 1996. Mr. McConnell also serves as the ChairmanChair of the Executive Committee of Worthington Industries’ Board of Directors. Mr. McConnellHe has served in various positions with Worthington Industries since 1975.
John S. Christie has served as President and as a director of Worthington Industries continuously since June 1999. He became interim Chief Financial Officer of Worthington Industries in September 2003 and Chief Financial Officer in January 2004. He also served as Chief Operating Officer of Worthington Industries from June 1999 until September 2003. Mr. Christie will retire from his positions as President and Chief Financial Officer and a director of Worthington Industries on July 31, 2008.
George P. Stoe has served as Executive Vice President and Chief Operating Officer of Worthington Industries since December 2005. He also served as President of Worthington Cylinder Corporation from January 2003 to December 2005.
Dale T. Brinkman has served as Worthington Industries’ Vice President-Administration since December 1998 and General Counsel since September 1982. He has been Secretary of Worthington Industries since 2000 and served as Assistant Secretary of Worthington Industries from 1982 to 2000.
Joe W. HardenHarry A. Goussetis has served as President of The Worthington Steel CompanyCylinder Corporation since December 2005. From January 2001 to December 2005, Mr. Goussetis served as Vice President-Human Resources for Worthington Industries, and held various other positions with Worthington Industries from November 1983 to January 2001.
Lester V. Hess has served Worthington Industries as Treasurer since February 2003. From2006. Prior thereto, he served Worthington Industries as Assistant Treasurer from November 2003 to February 1999 through February 2003, Mr. Harden served2006; and as PresidentDirector of Buckeye Steel Castings Company in Columbus, Ohio, which filed a voluntary petition under the Federal Bankruptcy Act in December 2002.Treasury from August 2002 to November 2003.
Edmund L. Ponko, Jr.John E. Roberts has served as President, of Dietrich Industries, Inc. since June 2001. PriorOctober 2007, and prior thereto, Mr. Ponko served Dietrich Industries, Inc. as Executiveits Vice President of Sales and Marketing from 1998June 2007 to 2001, as marketing managerOctober 2007. He was Regional General Manager, Director of Sales and Marketing for Owens Corning, a producer of residential and commercial building materials, glass fiber reinforcements and engineered materials for composite systems, from 1987 to 1998, and as a sales representative from 1981 to 1987.
1996 through June 2007.
Ralph V. Roberts has served as President of Worthington Integrated Building Systems, LLC since November 2006; and has been Senior Vice President-Marketing of Worthington Industries since January 2001. From June 1998 through January 2001, he served as President of The Worthington Steel Company. Prior to that time, Mr. Roberts servedCompany, and he has held various other positions with Worthington Industries since 1973, in various positions, including Vice President-Corporate Development and PresidentChief Executive Officer of ourthe WAVE joint venture.
George P. StoeMark A. Russell has served as President of The Worthington Cylinder CorporationSteel Company since January 2003.February 2007. From August 2004 through February 2007, Mr. StoeRussell was a Partner in Russell & Associates, an acquisition group formed to acquire aluminum products companies. Mr. Russell served as PresidentChief Executive Officer of Zinc CorporationIndalex Inc., a producer of America, the nation’s largest zinc producer, located in Monaca, Pennsylvania,extruded aluminum products, from November 2000 until May 2002. From AprilJanuary 2002 to March 2004.
Richard G. Welch has served as Controller of Worthington Industries since March 2000. He served as Assistant Controller of Worthington Industries from September 1999 to November 2000, he served as President of Wise Alloys, LLC, a rolling mill and cast house beverage can recycling and coating operation.
March 2000.
Virgil L. Winland has served as Senior Vice President-Manufacturing of Worthington Industries since January 2001. He has served in various positions with Worthington Industries since 1971, including President of Worthington Cylinder Corporation from June 19961998 through January 2001.
Richard G. Welch has served as Controller of Worthington Industries since March 2000. He served as Assistant Controller from September 1999 to March 2000.
Executive officers serve at the pleasure of the directors.directors of the Registrant. There are no family relationships among any of the Registrant’s executive officers or directors. No arrangements or understandings exist pursuant to which any individual has been, or is to be, selected as an executive officer.officer of the Registrant.
Item 5. – —Market for Registrant’s Common Equity, Related Stockholder Matters, and Issuer Purchases of Equity Securities.Securities
Common Shares Information
The common shares of Worthington Industries, Inc. (“Worthington Industries”) trade on the New York Stock Exchange (“NYSE”) under the symbol “WOR”"WOR" and are listed in most newspapers as “WorthgtnInd.”"WorthgtnInd." As of August 1, 2005,July 24, 2008, Worthington Industries had 8,2008,437 registered shareholders. The following table sets forth (i) the low and high closing prices and the closing pricesprice for Worthington Industries’ common shares for each quarter of fiscal 20042008 and fiscal 2005,2007, and (ii) the cash dividends per share declared on Worthington Industries’ common shares during each quarter of fiscal 20042008 and fiscal 2005.2007.
| Market Price | Cash Dividends | |||||||||||
| Low | High | Closing | ||||||||||
Fiscal 2004 Quarter Ended | ||||||||||||
August 31, 2003 | $ | 13.39 | $ | 16.23 | $ | 15.10 | $ | 0.16 | ||||
November 30, 2003 | $ | 12.47 | $ | 15.35 | $ | 14.32 | $ | 0.16 | ||||
February 29, 2004 | $ | 14.59 | $ | 18.10 | $ | 17.33 | $ | 0.16 | ||||
May 31, 2004 | $ | 17.00 | $ | 19.37 | $ | 19.14 | $ | 0.16 | ||||
Fiscal 2005 Quarter Ended | ||||||||||||
August 31, 2004 | $ | 18.62 | $ | 20.59 | $ | 20.35 | $ | 0.16 | ||||
November 30, 2004 | $ | 19.32 | $ | 22.71 | $ | 21.51 | $ | 0.16 | ||||
February 28, 2005 | $ | 18.93 | $ | 21.48 | $ | 20.95 | $ | 0.17 | ||||
May 31, 2005 | $ | 15.36 | $ | 21.01 | $ | 16.76 | $ | 0.17 | ||||
Fiscal 2008 Quarter Ended August 31, 2007 November 30, 2007 February 29, 2008 May 31, 2008 Fiscal 2007 Quarter Ended August 31, 2006 November 30, 2006 February 28, 2007 May 31, 2007 Market Price Cash
Dividends
Declared Low High Closing $ 19.60 $ 23.00 $ 21.16 $ 0.17 $ 20.38 $ 25.86 $ 21.19 $ 0.17 $ 14.58 $ 22.87 $ 17.59 $ 0.17 $ 16.00 $ 19.94 $ 19.94 $ 0.17 $ 16.36 $ 21.74 $ 19.11 $ 0.17 $ 16.64 $ 19.58 $ 18.50 $ 0.17 $ 16.84 $ 20.42 $ 19.91 $ 0.17 $ 18.28 $ 23.25 $ 21.11 $ 0.17
Dividends are declared at the discretion of the boardWorthington Industries Board of directors.Directors. Worthington Industries declared quarterly dividends of $0.16 per share for the first two quarters of fiscal 2005 and $0.17 per common share for the last two quartersin fiscal 2008 and fiscal 2007. The Board of fiscal 2005. The board of directorsDirectors reviews the dividend quarterly and establishes the dividend rate based upon Worthington’sWorthington Industries’ financial condition, results of operations, capital requirements, current and projected cash flows, business prospects, and other factors which theythe directors may deem relevant. While Worthington Industries has paid a dividend every quarter since becoming a public company in 1968, there is no guarantee that this will continue in the future.
Shareholder Return Performance
The following table provides information about purchases madein this Item 5 of this Annual Report on Form 10-K is not deemed to be “soliciting material” or to be “filed” with the Securities and Exchange Commission or subject to Regulation 14A or 14C under the Securities Exchange Act of 1934, as amended (the “Exchange Act”), or to the liabilities of Section 18 of the Exchange Act, and will not be deemed to be incorporated by reference into any filing under the Securities Act of 1933, as amended, or the Exchange Act, except to the extent we specifically incorporate such information into such a filing.
The following graph compares the five-year cumulative return on Worthington Industries’ common shares, the S&P Midcap 400 Index and the S&P 1500 Steel Composite Index. The graph assumes that $100.00 was invested at May 31, 2003, in Worthington Industries’ common shares and each index.
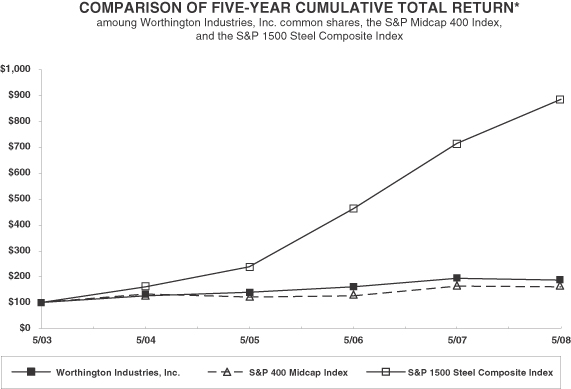
* $100 invested on 5/31/03 in stock or index. Assumes reinvestment of dividends when received. Fiscal year ending May 31.
| 5/03 | 5/04 | 5/05 | 5/06 | 5/07 | 5/08 | |||||||
Worthington Industries, Inc. | 100.00 | 133.44 | 120.74 | 127.25 | 163.83 | 160.29 | ||||||
S&P Midcap 400 | 100.00 | 125.32 | 141.20 | 161.33 | 193.09 | 185.86 | ||||||
S&P 1500 Steel Composite | 100.00 | 160.85 | 239.46 | 462.03 | 715.17 | 884.73 |
Worthington Industries became a part of the S&P Midcap 400 Index on December 17, 2004. The S&P 1500 Steel Composite Index, of which Worthington Industries is a component, is the most specific index relative to the largest line of business of Worthington Industries and its subsidiaries. At May 31, 2008, the index included 11 steel related companies from the S&P 500, S&P Midcap 400 and S&P 600 indices: Allegheny Technologies Incorporated; Carpenter Technology Corporation; A.M. Castle & Co.; Cleveland-Cliffs Inc.; Commercial Metals Company; Nucor Corporation; Olympic Steel, Inc.; Reliance Steel & Aluminum Co.; Steel Dynamics Inc.; United States Steel Corporation; and Worthington Industries.
Issuer Purchases of Equity Securities
No common shares of Worthington Industries were purchased by, or on behalf of, Worthington Industries or any “affiliated purchaser” (as defined in Rule 10b – 18(a) (3) under the Securities Exchange Act of 1934)Act) during the fiscal quarter ended May 31, 2008. The following table provides information about the number of common shares of Worthington Industries during each month ofthat may yet be purchased under the fiscal quarter ended May 31, 2005:publicly announced repurchase authorization:
Period | Total Number
| Average
| Total Number Common
| Maximum Number
Common Shares May Yet Be
Plans or | ||||
March 1-31, | ||||||||
April 1-30, | ||||||||
May 1-31, | ||||||||
Total | - | - | - | 9,099,500 |
(1) | The number shown represents, as of the end of each period, the maximum number of common shares that could be purchased under the publicly announced repurchase authorization then in effect. On |
Item 6. -— Selected Financial Data
| Year ended May 31, | ||||||||||||||||||||
| In thousands, except per share | 2005 | 2004 | 2003 | 2002 | 2001 | |||||||||||||||
FINANCIAL RESULTS | ||||||||||||||||||||
Net sales | $ | 3,078,884 | $ | 2,379,104 | $ | 2,219,891 | $ | 1,744,961 | $ | 1,826,100 | ||||||||||
Cost of goods sold | 2,580,011 | 2,003,734 | 1,916,990 | 1,480,184 | 1,581,178 | |||||||||||||||
Gross margin | 498,873 | 375,370 | 302,901 | 264,777 | 244,922 | |||||||||||||||
Selling, general & administrative expense | 225,915 | 195,785 | 182,692 | 165,885 | 173,264 | |||||||||||||||
Impairment charges and other | 5,608 | 69,398 | (5,622 | ) | 64,575 | 6,474 | ||||||||||||||
Operating income | 267,350 | 110,187 | 125,831 | 34,317 | 65,184 | |||||||||||||||
Miscellaneous income (expense) | (7,991 | ) | (1,589 | ) | (7,240 | ) | (3,224 | ) | (928 | ) | ||||||||||
Nonrecurring losses | — | — | (5,400 | ) | (21,223 | ) | — | |||||||||||||
Interest expense | (24,761 | ) | (22,198 | ) | (24,766 | ) | (22,740 | ) | (33,449 | ) | ||||||||||
Equity in net income of unconsolidated affiliates | 53,871 | 41,064 | 29,973 | 23,110 | 25,201 | |||||||||||||||
Earnings from continuing operations before income taxes | 288,469 | 127,464 | 118,398 | 10,240 | 56,008 | |||||||||||||||
Income tax expense | 109,057 | 40,712 | 43,215 | 3,738 | 20,443 | |||||||||||||||
Earnings from continuing operations | 179,412 | 86,752 | 75,183 | 6,502 | 35,565 | |||||||||||||||
Discontinued operations, net of taxes | — | — | — | — | — | |||||||||||||||
Extraordinary item, net of taxes | — | — | — | — | — | |||||||||||||||
Cumulative effect of accounting change, net of taxes | — | — | — | — | — | |||||||||||||||
Net earnings | $ | 179,412 | $ | 86,752 | $ | 75,183 | $ | 6,502 | $ | 35,565 | ||||||||||
Earnings per share - diluted: | ||||||||||||||||||||
Continuing operations | $ | 2.03 | $ | 1.00 | $ | 0.87 | $ | 0.08 | $ | 0.42 | ||||||||||
Discontinued operations, net of taxes | — | — | — | — | — | |||||||||||||||
Extraordinary item, net of taxes | — | — | — | — | — | |||||||||||||||
Cumulative effect of accounting change, net of taxes | — | — | — | — | — | |||||||||||||||
Net earnings per share | $ | 2.03 | $ | 1.00 | $ | 0.87 | $ | 0.08 | $ | 0.42 | ||||||||||
Continuing operations: | ||||||||||||||||||||
Depreciation and amortization | $ | 57,874 | $ | 67,302 | $ | 69,419 | $ | 68,887 | $ | 70,582 | ||||||||||
Capital expenditures (including acquisitions and investments)* | 112,937 | 30,089 | 139,673 | 60,100 | 64,943 | |||||||||||||||
Cash dividends declared | 57,942 | 55,312 | 54,938 | 54,677 | 54,762 | |||||||||||||||
Per share | $ | 0.66 | $ | 0.64 | $ | 0.64 | $ | 0.64 | $ | 0.64 | ||||||||||
Average shares outstanding - diluted | 88,503 | 86,950 | 86,537 | 85,929 | 85,623 | |||||||||||||||
FINANCIAL POSITION | ||||||||||||||||||||
Current assets | $ | 938,333 | $ | 833,110 | $ | 506,246 | $ | 490,340 | $ | 449,719 | ||||||||||
Current liabilities | 545,443 | 475,060 | 318,171 | 339,351 | 306,619 | |||||||||||||||
Working capital | $ | 392,890 | $ | 358,050 | $ | 188,075 | $ | 150,989 | $ | 143,100 | ||||||||||
Net fixed assets | $ | 552,956 | $ | 555,394 | $ | 743,044 | $ | 766,596 | $ | 836,749 | ||||||||||
Total assets | 1,830,005 | 1,643,139 | 1,478,069 | 1,457,314 | 1,475,862 | |||||||||||||||
Total debt** | 388,432 | 289,768 | 292,028 | 295,613 | 324,750 | |||||||||||||||
Shareholders’ equity | 820,836 | 680,374 | 636,294 | 606,256 | 649,665 | |||||||||||||||
Per share | $ | 9.33 | $ | 7.83 | $ | 7.40 | $ | 7.09 | $ | 7.61 | ||||||||||
Shares outstanding | 87,933 | 86,856 | 85,949 | 85,512 | 85,375 | |||||||||||||||
| Fiscal Years Ended May 31, | ||||||||||||||||||||
| In thousands, except per share | 2008 | 2007 | 2006 | 2005 | 2004 | |||||||||||||||
FINANCIAL RESULTS | ||||||||||||||||||||
Net sales | $ | 3,067,161 | $ | 2,971,808 | $ | 2,897,179 | $ | 3,078,884 | $ | 2,379,104 | ||||||||||
Cost of goods sold | 2,711,414 | 2,610,176 | 2,525,545 | 2,580,011 | 2,003,734 | |||||||||||||||
Gross margin | 355,747 | 361,632 | 371,634 | 498,873 | 375,370 | |||||||||||||||
Selling, general and administrative expense | 231,602 | 232,487 | 214,030 | 225,915 | 195,785 | |||||||||||||||
Restructuring charges and other | 18,111 | - | - | 5,608 | 69,398 | |||||||||||||||
Operating income | 106,034 | 129,145 | 157,604 | 267,350 | 110,187 | |||||||||||||||
Miscellaneous income (expense) | (6,348 | ) | (4,446 | ) | (1,524 | ) | (7,991 | ) | (1,589 | ) | ||||||||||
Nonrecurring losses | - | - | - | - | - | |||||||||||||||
Gain on sale of Acerex | - | - | 26,609 | - | - | |||||||||||||||
Interest expense | (21,452 | ) | (21,895 | ) | (26,279 | ) | (24,761 | ) | (22,198 | ) | ||||||||||
Equity in net income of unconsolidated affiliates | 67,459 | 63,213 | 56,339 | 53,871 | 41,064 | |||||||||||||||
Earnings from continuing operations before income taxes | 145,693 | 166,017 | 212,749 | 288,469 | 127,464 | |||||||||||||||
Income tax expense | 38,616 | 52,112 | 66,759 | 109,057 | 40,712 | |||||||||||||||
Earnings from continuing operations | 107,077 | 113,905 | 145,990 | 179,412 | 86,752 | |||||||||||||||
Discontinued operations, net of taxes | - | - | - | - | - | |||||||||||||||
Extraordinary item, net of taxes | - | - | - | - | - | |||||||||||||||
Cumulative effect of accounting change, net of | - | - | - | - | - | |||||||||||||||
Net earnings | $ | 107,077 | $ | 113,905 | $ | 145,990 | $ | 179,412 | $ | 86,752 | ||||||||||
Earnings per share-diluted: | ||||||||||||||||||||
Continuing operations | $ | 1.31 | $ | 1.31 | $ | 1.64 | $ | 2.03 | $ | 1.00 | ||||||||||
Discontinued operations, net of taxes | - | - | - | - | - | |||||||||||||||
Extraordinary item, net of taxes | - | - | - | - | - | |||||||||||||||
Cumulative effect of accounting change, net of taxes | - | - | - | - | - | |||||||||||||||
Net earnings per share | $ | 1.31 | $ | 1.31 | $ | 1.64 | $ | 2.03 | $ | 1.00 | ||||||||||
Continuing operations: | ||||||||||||||||||||
Depreciation and amortization | $ | 63,413 | $ | 61,469 | $ | 59,116 | $ | 57,874 | $ | 67,302 | ||||||||||
Capital expenditures (including acquisitions and investments) | 97,343 | 90,418 | 66,904 | 112,937 | 30,089 | |||||||||||||||
Cash dividends declared | 54,640 | 58,380 | 60,110 | 57,942 | 55,312 | |||||||||||||||
Per share | $ | 0.68 | $ | 0.68 | $ | 0.68 | $ | 0.66 | $ | 0.64 | ||||||||||
Average shares outstanding-diluted | 81,898 | 87,002 | 88,976 | 88,503 | 86,950 | |||||||||||||||
FINANCIAL POSITION | ||||||||||||||||||||
Current assets | $ | 1,104,970 | $ | 969,383 | $ | 996,241 | $ | 938,333 | $ | 833,110 | ||||||||||
Current liabilities | 664,895 | 420,494 | 490,786 | 545,443 | 475,060 | |||||||||||||||
Working capital | $ | 440,075 | $ | 548,889 | $ | 505,455 | $ | 392,890 | $ | 358,050 | ||||||||||
Net fixed assets | $ | 549,944 | $ | 564,265 | $ | 546,904 | $ | 552,956 | $ | 555,394 | ||||||||||
Total assets | 1,988,031 | 1,814,182 | 1,900,397 | 1,830,005 | 1,643,139 | |||||||||||||||
Total debt* | 380,450 | 276,650 | 252,684 | 388,432 | 289,768 | |||||||||||||||
Shareholders' equity | 885,377 | 936,001 | 945,306 | 820,836 | 680,374 | |||||||||||||||
Per share | $ | 11.16 | $ | 11.02 | $ | 10.66 | $ | 9.33 | $ | 7.83 | ||||||||||
Shares outstanding | 79,308 | 84,908 | 88,691 | 87,933 | 86,856 | |||||||||||||||
The acquisition of PSM capital stock has been included since August 2006. The acquisition of the Western Cylinder Assets has been included since September 2004. The disposition of certain Decatur assets has been reflected since August 2004. The acquisition of Unimast Incorporated has been included since July 2002. All financial data includes the results of The Gerstenslager Company, which was acquired in February 1997 through a pooling of interests. The acquisition of Dietrich Industries, Inc. has been included since February 1996.
| Fiscal Years Ended May 31, | ||||||||||||||||||||||||
| 2003 | 2002 | 2001 | 2000 | 1999 | 1998 | |||||||||||||||||||
| $ | 2,219,891 | $ | 1,744,961 | $ | 1,826,100 | $ | 1,962,606 | $ | 1,763,072 | $ | 1,624,449 | |||||||||||||
| 1,916,990 | 1,480,184 | 1,581,178 | 1,629,455 | 1,468,886 | 1,371,841 | |||||||||||||||||||
| 302,901 | 264,777 | 244,922 | 333,151 | 294,186 | 252,608 | |||||||||||||||||||
| 182,692 | 165,885 | 173,264 | 163,662 | 147,990 | 117,101 | |||||||||||||||||||
| (5,622 | ) | 64,575 | 6,474 | - | - | - | ||||||||||||||||||
| 125,831 | 34,317 | 65,184 | 169,489 | 146,196 | 135,507 | |||||||||||||||||||
| (7,240 | ) | (3,224 | ) | (928 | ) | 2,653 | 5,210 | 1,396 | ||||||||||||||||
| (5,400 | ) | (21,223 | ) | - | (8,553 | ) | - | - | ||||||||||||||||
| - | - | - | - | - | - | |||||||||||||||||||
| (24,766 | ) | (22,740 | ) | (33,449 | ) | (39,779 | ) | (43,126 | ) | (25,577 | ) | |||||||||||||
| 29,973 | 23,110 | 25,201 | 26,832 | 24,471 | 19,316 | |||||||||||||||||||
| 118,398 | 10,240 | 56,008 | 150,642 | 132,751 | 130,642 | |||||||||||||||||||
| 43,215 | 3,738 | 20,443 | 56,491 | 49,118 | 48,338 | |||||||||||||||||||
| 75,183 | 6,502 | 35,565 | 94,151 | 83,633 | 82,304 | |||||||||||||||||||
| - | - | - | - | (20,885 | ) | 17,337 | ||||||||||||||||||
| - | - | - | - | - | 18,771 | |||||||||||||||||||
| - | - | - | - | (7,836 | ) | - | ||||||||||||||||||
| $ | 75,183 | $ | 6,502 | $ | 35,565 | $ | 94,151 | $ | 54,912 | $ | 118,412 | |||||||||||||
| $ | 0.87 | $ | 0.08 | $ | 0.42 | $ | 1.06 | $ | 0.90 | $ | 0.85 | |||||||||||||
| - | - | - | - | (0.23 | ) | 0.18 | ||||||||||||||||||
| - | - | - | - | - | 0.19 | |||||||||||||||||||
| - | - | - | - | (0.08 | ) | - | ||||||||||||||||||
| $ | 0.87 | $ | 0.08 | $ | 0.42 | $ | 1.06 | $ | 0.59 | $ | 1.22 | |||||||||||||
| $ | 69,419 | $ | 68,887 | $ | 70,582 | $ | 70,997 | $ | 64,087 | $ | 41,602 | |||||||||||||
| 139,673 | 60,100 | 64,943 | 72,649 | 132,458 | 297,516 | |||||||||||||||||||
| 54,938 | 54,667 | 54,762 | 53,391 | 52,343 | 51,271 | |||||||||||||||||||
| $ | 0.64 | $ | 0.64 | $ | 0.64 | $ | 0.61 | $ | 0.57 | $ | 0.53 | |||||||||||||
| 86,537 | 85,929 | 85,623 | 88,598 | 93,106 | 96,949 | |||||||||||||||||||
| $ | 506,246 | $ | 490,340 | $ | 449,719 | $ | 624,229 | $ | 624,255 | $ | 642,995 | |||||||||||||
| 318,171 | 339,351 | 306,619 | 433,270 | 427,725 | 410,031 | |||||||||||||||||||
| �� | ||||||||||||||||||||||||
| $ | 188,075 | $ | 150,989 | $ | 143,100 | $ | 190,959 | $ | 196,530 | $ | 232,964 | |||||||||||||
| $ | 743,044 | $ | 766,596 | $ | 836,749 | $ | 862,512 | $ | 871,347 | $ | 933,158 | |||||||||||||
| 1,478,069 | 1,457,314 | 1,475,862 | 1,673,873 | 1,686,951 | 1,842,342 | |||||||||||||||||||
| 292,028 | 295,613 | 324,750 | 525,072 | 493,313 | 501,950 | |||||||||||||||||||
| 636,294 | 606,256 | 649,665 | 673,354 | 689,649 | 780,273 | |||||||||||||||||||
| $ | 7.40 | $ | 7.09 | $ | 7.61 | $ | 7.85 | $ | 7.67 | $ | 8.07 | |||||||||||||
| 85,949 | 85,512 | 85,375 | 85,755 | 89,949 | 96,657 | |||||||||||||||||||
* |
|
|
| Excludes Debt Exchangeable for Common Stock of Rouge Industries, Inc. of $52,497 |
|
Year ended May 31, 2000 1999 1998 1997 1996 1995 $ 1,962,606 $ 1,763,072 $ 1,624,449 $ 1,428,346 $ 1,126,492 $ 1,125,495 1,629,455 1,468,886 1,371,841 1,221,078 948,505 942,672 333,151 294,186 252,608 207,268 177,987 182,823 163,662 147,990 117,101 96,252 78,852 67,657 — — — — — — 169,489 146,196 135,507 111,016 99,135 115,166 2,653 5,210 1,396 906 1,013 648 (8,553 ) — — — — — (39,779 ) (43,126 ) (25,577 ) (18,427 ) (8,687 ) (6,673 ) 26,832 24,471 19,316 13,959 28,710 37,395 150,642 132,751 130,642 107,454 120,171 146,536 56,491 49,118 48,338 40,844 46,130 55,190 94,151 83,633 82,304 66,610 74,041 91,346 — (20,885 ) 17,337 26,708 26,932 31,783 — — 18,771 — — — — (7,836 ) — — — — $ 94,151 $ 54,912 $ 118,412 $ 93,318 $ 100,973 $ 123,129 $ 1.06 $ 0.90 $ 0.85 $ 0.69 $ 0.76 $ 0.94 — (0.23 ) 0.18 0.27 0.28 0.33 — — 0.19 — — — — (0.08 ) — — — — $ 1.06 $ 0.59 $ 1.22 $ 0.96 $ 1.04 $ 1.27 $ 70,997 $ 64,087 $ 41,602 $ 34,150 $ 26,931 $ 23,741 72,649 132,458 297,516 287,658 275,052 55,876 53,391 52,343 51,271 45,965 40,872 37,212 $ 0.61 $ 0.57 $ 0.53 $ 0.49 $ 0.45 $ 0.41 88,598 93,106 96,949 96,841 96,822 96,789 $ 624,229 $ 624,255 $ 642,995 $ 594,128 $ 505,104 $ 474,853 433,270 427,725 410,031 246,794 167,585 191,672 $ 190,959 $ 196,530 $ 232,964 $ 347,334 $ 337,519 $ 283,181 $ 862,512 $ 871,347 $ 933,158 $ 691,027 $ 544,052 $ 358,579 1,673,873 1,686,951 1,842,342 1,561,186 1,282,424 964,299 525,072 493,313 501,950 417,883 317,997 108,916 673,354 689,649 780,273 715,518 667,318 608,142 $ 7.85 $ 7.67 $ 8.07 $ 7.40 $ 6.91 $ 6.30 85,755 89,949 96,657 96,711 96,505 96,515
Item 7. –— Management’s Discussion and Analysis of Financial Condition and Results of Operations
Selected statements contained in this “Item 7. –— Management’s Discussion and Analysis of Financial Condition and Results of Operations” constitute “forward-looking statements” as that term is used in the Private Securities Litigation Reform Act of 1995. Such forward-looking statements are based, in whole or in part, on management’s beliefs, estimates, assumptions and currently available information. For a more detailed discussion of what constitutes a forward-looking statement and of some of the factors that could cause actual results to differ materially from such forward-looking statements, please refer to the “Safe Harbor Statement” in the beginning of this Annual Report on Form 10-K and “Part I — Item 1A. — Risk Factors” of this Annual Report on Form 10-K.
Overview
The following discussion and analysis of financial condition and results of operations should be read in conjunction with our consolidated financial statements included in “Item 8. – Financial Statements and Supplementary Data.”
Worthington Industries, Inc., together with its subsidiaries (collectively, “we,” “our,” “Worthington,” or the “Company”), is primarily a diversified metal processing company, that focusesfocused on value-added steel processing and manufactured metal products. products, such as metal framing, pressure cylinders, automotive past-model service stampings and, through joint ventures, metal ceiling grid systems and laser-welded blanks. Our number one goal is to increase shareholder value, which we seek to accomplish by optimizing existing operations, developing and commercializing new products and applications, and pursuing strategic acquisitions and joint ventures.
As of May 31, 2005,2008, excluding our joint ventures, we operated 4744 manufacturing facilities worldwide, principally in three reportable business segments: Processed Steel Products,Processing, Metal Framing and Pressure Cylinders. We also held equity positions in nineten joint ventures, which operated 1922 manufacturing facilities worldwide as of May 31, 2005.
2008. Each of these segments and key joint ventures hold a leadership position in its respective market. We have capacity in each of our segments to handle additional sales growth without significantly increasing our capital investment. For more information on our segments, please refer to “Item 1. — Business” of Part I of this Annual Report on Form 10-K.
The resultstwo largest markets we serve are construction and automotive, representing 40% and 26%, respectively, of our operationsconsolidated net sales in fiscal 2008. Our results are mainlyprimarily driven by two factors, product demand and spread. During the fiscal year ended May 31, 2005 (“fiscal 2005”), spread orbetween the difference between material cost and theaverage selling price of our products and the finished product, drove the improvement in results compared to the prior year.cost of raw materials, mainly steel. The spread can be significantly affected by our first-in, first-out (“FIFO”) inventory costing method. In a rising steel-price environment, our operations arereported income is often favorably impacted as lower-priced inventory acquired during the previous months flows through cost of goods sold while our selling prices increase to meet the rising replacement cost of steel. In a decreasing steel-price environment, the inverse often occurs as higher-priced inventory on hand flows through cost of goods sold andas our selling prices increase. This wasdecrease. The results from these market dynamics are referred to as inventory holding gains or losses. We strive to limit the case lateinventory holding impact by controlling inventory levels.
A majority of our full-time employees participate in profit sharing and bonus programs which are tied to performance. Generally, when earnings are up, profit sharing and bonus expenses increase; when earnings are down, profit sharing and bonus expenses decrease. Because of this relationship, profit sharing and bonus expenses may somewhat lessen the volatility of our earnings.
Market & Industry Overview
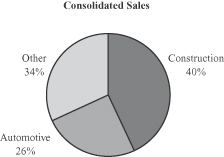 |
For our fiscal year ended May 31, 20042008 (“fiscal 2004”2008”), our sales breakdown by end user market is illustrated by the chart to the left. Substantially all of the sales of our Metal Framing segment and the Construction Services segment, as well as approximately 25% of the sales for the Steel Processing segment, are to the construction market, both residential and non-residential. We estimate that approximately 10% of our consolidated sales, or one-fourth of our construction market sales, are to the residential market. While the market price of steel significantly impacts this business, there are other key indicators that are meaningful in analyzing construction market demand including U.S. gross domestic product (GDP), the Dodge Index of construction contracts, and trends in the relative price of framing lumber and steel. Construction is also the predominant end market for three of our joint ventures, including our largest, Worthington Armstrong Venture (“WAVE”). The sales of these joint ventures are not consolidated in our results; however, adding our ownership percentage of joint venture construction market sales to our reported sales would not materially change the sales breakdown in the chart.
The automotive industry is the largest consumer of flat-rolled steel and thus the largest end market for our Steel Processing segment. Approximately half of the sales of our Steel Processing segment, and substantially all of the sales of the Automotive Body Panels segment, are to the automotive market. North American vehicle production, primarily by Chrysler, Ford and General Motors (the “Big Three automakers”), has a considerable impact on the customers within these two segments. These segments are also impacted by the market price of steel and, to a lesser extent, the market price of commodities used in their operations, such as zinc, natural gas and diesel fuel. The majority of the sales of three of our unconsolidated joint ventures also go to the automotive end market. These sales are not consolidated in our results; however, adding our ownership percentage of joint venture automotive market sales to our reported sales does not materially change the sales breakdown in the previous chart.
The sales of our Pressure Cylinders and Steel Packaging segments, and approximately 30% of the sales of our Steel Processing segment, are to other markets such as appliance, leisure and recreation, distribution and transportation, HVAC, lawn and garden, and consumer specialty products. Given the many different product lines that make up these sales and the wide variety of end markets, it is very difficult to list the key market indicators that drive this portion of our business. However, we believe that the trend in U.S. GDP growth is a good economic indicator for analyzing these segments.
We use the following information to monitor our cost and major end markets:
| Fiscal Year Ended May 31, | Inc / (Dec) | |||||||||||||||||||
| 2008 | 2007 | 2006 | 2008 vs. 2007 | 2007 vs. 2006 | ||||||||||||||||
U.S. GDP (% growth year-over-year) | 2.4 | % | 2.2 | % | 3.1 | % | 0.2 | % | -0.9 | % | ||||||||||
Hot Rolled Steel ($ per ton)1 | $ | 636 | $ | 571 | $ | 528 | $ | 65 | $ | 43 | ||||||||||
Big Three Auto Build (,000s vehicles)2 | 8,691 | 9,331 | 10,348 | (640 | ) | (1,017 | ) | |||||||||||||
No. America Auto Build (,000s vehicles)2 | 14,662 | 15,068 | 15,998 | (406 | ) | (930 | ) | |||||||||||||
Dodge Index | 121 | 137 | 150 | (16 | ) | (13 | ) | |||||||||||||
Framing Lumber ($ per 1,000 board ft)3 | $ | 265 | $ | 286 | $ | 392 | $ | (21 | ) | $ | (106 | ) | ||||||||
Zinc ($ per pound)4 | $ | 1.24 | $ | 1.65 | $ | 0.89 | $ | (0.41 | ) | $ | 0.77 | |||||||||
Natural Gas ($ per mcf)5 | $ | 7.66 | $ | 6.73 | $ | 9.32 | $ | 0.94 | $ | (2.60 | ) | |||||||||
Retail Diesel Prices, All types ($ per gallon)6 | $ | 3.36 | $ | 2.72 | $ | 2.61 | $ | 0.64 | $ | 0.11 | ||||||||||
1 CRU Index; annual average 2 CSM Autobase 3 Random Lengths; annual average 4 LME Zinc; annual average 5 NYMEX Henry Hub Natural Gas; annual average 6 Energy Information Administration; annual average
U.S. GDP growth rate trends are generally indicative of the strength in demand and, in many cases, pricing for our products. Historically, we have seen that increasing U.S. GDP growth rates year-over-year can have a positive effect on our results, as a stronger economy generally improves demand and pricing for our products. Conversely, the opposite is also generally true. Changes in U.S. GDP growth rates can also signal changes in conversion costs related to production and selling, general and administrative (“SG&A”) expenses. However, these are all general assumptions, which do not hold true in all cases.
The market price of hot-rolled steel is a significant factor impacting selling prices and early in fiscal 2005,can also impact earnings. In a rising price environment, such as we benefited fromexperienced during the third and fourth quarters of fiscal 2008, our results are generally favorably impacted as lower-priced inventory, whenmaterial, purchased in previous periods, flows through cost of goods sold, while our selling prices rose. Prices peakedincrease at a faster pace to cover current replacement costs. On the other hand, when steel prices fall, as they did during the first part of fiscal 2008, we typically have higher-priced material flowing through cost of goods sold while selling prices compress to what the market will bear, negatively impacting our results. These are all general assumptions, however, which do not hold true in Septemberall cases. Our FIFO inventory costing method results in inventory holding gains and losses, which we attempt to limit through inventory management.
No single customer makes up more than 5% of our consolidated net sales. While our automotive business is largely driven by Big Three production schedules, our customer base is much broader than the Big Three automakers and includes many of their suppliers as well. Seasonal automotive shutdowns in July and December can cause weaker demand in our first and third quarters. Domestic automotive sales have declined since, eliminating that benefit.been hurt in recent quarters as the rising cost of gasoline has shifted consumer demand to smaller, more fuel efficient vehicles — a market historically dominated by foreign manufacturers. We strivecontinue to pursue customer diversification beyond the Big Three automakers and their suppliers.
The Dodge Index represents the value of total construction contracts, including residential and non-residential building construction. This overall index serves as a broad indicator of the construction markets in which we participate, as it consists of actual construction starts. The relative pricing of framing lumber, an alternative construction material with which we compete, can also affect our Metal Framing segment, as certain applications may permit the use of alternative building materials.
The market trends of certain other commodities such as zinc, natural gas and diesel fuel are important to us as they represent a significant portion of our cost of goods sold, both directly through our plant operations and indirectly through transportation and freight. A rise in the price of any of these commodities could
increase our cost of goods sold. We attempt to limit the downside impact of these cycles by managing inventory levelspricing fluctuations through contracts, hedging activities and, selling at prices we believe to be appropriate.specifically for transportation, leveraging opportunities across multiple business units, where available.
We monitor certain national and industry data to better understand the markets in which eachAs previously stated, residential construction does not make up a large portion of our overall business, about 10%. However, the slowdown in this industry and the related struggles in the credit markets have negatively affected most of our segments, operates. Relativeeach to fiscal 2004,a varying degree. Although much of the impact falls on those segments which directly serve the construction markets, other segments are indirectly impacted by the ripple effect felt in other parts of the economy, for example, in consumer spending and the labor market.
Business Strategy
Our first goal is to increase shareholder value. To accomplish this data indicates that conditions improved in fiscal 2005 across most markets except “Big Three” automotive (collectively, DaimlerChrysler AG, Ford Motor Co.goal, we focus on driving top line growth; increasing operating margins; and General Motors Corp.) where production was down 7% for Ford Motor Co. and 6% for General Motors Corp. but up 3% for DaimlerChrysler AG.improving asset utilization. During fiscal 2005, domestic GDP continued its upward trend2008, we completed a number of value-added growth initiatives which further extend our product lines and was up 3% overpenetrate new markets. These included the preceding year. In commercial construction, the U.S. Census Bureau’s Index of Private Construction Spending confirms that overall commercial construction activity has shown improvement during fiscal 2005. As a result, excess inventories in the metal framing industry, which resulted from a combination of customer purchases ahead of price increases and weather-related postponement of construction starts, are shrinking. Even though overall commercial construction activity has improved, construction activity in our largest market, office buildings, has improved only slightly and remains near five-year lows.
While pricing in the steel industry historically has been unpredictable, the industry experienced unprecedented steel price increases during the second half of fiscal 2004 and the first four months of fiscal 2005. During this time period, the People’s Republic of China (“China”) was a net importer of steel due to a surge in the demand for steel. Also, China’s steel production increased, which required more raw materials. This contributed to shortages in the United States in the supply of steel scrap and coke, two key materials used in the production of steel. Thus, prices soared for these commodities, in turn raising the cost of steel. Also, the weakened U.S. dollar and higher transportation costs made foreign steel more expensive than domestic steel, thereby reducing the supply of imports to the United States. Finally, the consolidation of the steel industry within the United States reduced the availability of steel. Because of these conditions, obtaining steel was challenging, but our long-term relationships with the mills were advantageous.
The price of steel peaked in September 2004 and has continued to decline since then. Many factors have contributed to this decline. In recent months, China has increased steel production significantly contributing to global supply and placing significant pressure on prices. Also contributing to the decline are excess inventories and lower steel demand from automotive and other key metalworking sectors. Among steel producers, plant shutdowns are scheduled to cut production to better match demand. This may help limit supply and lead to a more stable price environment.
We have focused over the last several years on improved returns on capital by investing in growth markets and products, consolidating facilities and divesting non-strategic assets or other assets that were not delivering appropriate returns. We have also added products and operations, including joint ventures, which we believe complement our existing business and strengths. Because of our success with joint ventures, we continue to look for additional opportunities where we can bring together complementary skill sets, manage our risk and effectively invest our capital. The following are examples of this activity over the last two fiscal years:actions:
On June 27, 2003, Worthington Steel joined with Bainbridge Steel, LLC (“Bainbridge”), an affiliate of Viking Industries, LLC, a qualified minority business enterprise (“MBE”), to create Viking & Worthington Steel Enterprise, LLC (“VWS”), an unconsolidated joint venture in which Worthington Steel has a 49% interest and Bainbridge has a 51% interest. VWS purchased substantially all of theSeptember 14, 2007, our Pressure Cylinders segment acquired certain cylinder production assets of Valley City Steel, LLC in Valley City, Ohio,Wolfedale Engineering, the largest Canadian manufacturer of portable propane gas steel cylinders for approximately $5.7 million. Bainbridge manages the operations of the joint ventureuse with barbeque gas grills, recreational vehicles, campers and Worthington Steel provides assistance in operations, selling and marketing. VWS operates as an MBE.
Effective August 1, 2004, we sold our Decatur, Alabama, steel-processing facility and its cold-rolling assets to Nucor Corporation (“Nucor”) for $80.4 million in cash. We retained the slitting and cut-to-lengthtrailers. These assets and net working capital associated with this facility.related production were integrated into our existing facilities.
On September 17, 2004,2007, we purchased substantially all of the net assets of the propane and specialty gas cylinder business of Western Industries, Inc.acquired a 50% interest in Serviacero Planos, S.A. de C.V. (“Western Cylinder Assets”Serviacero Worthington”) for $65.1 million in cash. This businesswhich operates two steel processing facilities in Wisconsin at which we manufacture 14.1 oz. and 16.4 oz. disposable cylinders for products such as hand torches, propane-fueled camping equipment, portable heaters and tabletop grills. This purchase expands our product lines. The Western Cylinder Assets and results of operations of this business are includedcentral Mexico. On March 5, 2008, Serviacero Worthington announced plans to add a greenfield site in our Pressure Cylinders segment.the Monterrey, Mexico, region.
On September 23, 2004,25, 2007, we formed a 50%-owned unconsolidatedsteel processing joint venture, in which we have an equity interest of 49%, with Pacific Steel Construction Inc. (“Pacific”)The Magnetto Group to focus on residentialconstruct and operate a Class One steel framing, particularly for the military. Pacific contributed its existing contracts to theprocessing facility in Slovakia. This joint venture started operations in February 2008 as Canessa Worthington Slovakia s.r.o. (“Canessa Worthington”) and we made a $1.5 million capital contribution. Our Metal Framing segment sells steel framing products to the joint venture for its projects. This gives us an immediate presence in the growing market for steel framed military housing and an additional base from which to penetrate the overall residential market.services customers throughout central Europe.
On October 13, 2004,25, 2007, we purchased for $1.1 million theacquired a 49% interest of ourin crate and pallet maker LEFCO Industries, LLC (“LEFCO”), a minority partner in thebusiness enterprise. The joint venture, that operates a pressure cylinder manufacturing facilitycalled LEFCO Worthington, LLC, (“LEFCO Worthington”) will manufacture steel rack systems for the automotive and trucking industries, in Hustopece, Czech Republic.addition to LEFCO’s existing product offerings.
On November 5, 2004, we formed a 60%-owned consolidated Canadian metal framingMarch 1, 2008, TWB Company, L.L.C. (“TWB”), our joint venture with Encore Coils Holdings LtdThyssenKrupp Steel North America, Inc. (“Encore”ThyssenKrupp”), acquired ThyssenKrupp Tailored Blanks, S.A. de C.V., the Mexican subsidiary of ThyssenKrupp, to expand TWB’s presence in Mexico. As a result, ThyssenKrupp now owns 55% of TWB and Worthington now owns 45%.
To increase our operating undermargins and asset utilization we began two initiatives, one focused on reducing costs and the name Dietrich Metal Framing Canada, LP. The joint venture manufactures steel framing products at its Canadianother on reviewing the utilization of our facilities in Mississauga, VancouverMetal Framing. These two initiatives have grown into a much larger transformational effort (the “Transformation Plan”) which now includes the additional initiatives of increasing efficiency throughout the Company, and LaSalle, and also offers a variety of proprietary products and systems supplied byimproving our Metal Framing facilitiessupply chain. The intent behind these initiatives is to significantly transform the Company’s earnings potential over the next three years. At this point, we have identified opportunities to generate an estimated $38.5 million in annual savings, excluding the United States. The assets and results of operations of this joint venture are consolidatedexpenses related to achieving these savings. Of the savings, $30.4 million will come from overhead expense reductions with the remaining $8.1 million coming from announced plant closures in our Metal Framing segment. Updates on these initiatives are as follows:
Expense reduction: We realized $18.5 million in savings during fiscal 2008. However, these savings were almost entirely offset by increases in other expenses, primarily in employee compensation, which increased due to favorable earnings, depreciation expense related to our new enterprise resource planning system, and bad debt expense. The balance of the savings will come in fiscal 2009 with a portion to be realized in fiscal 2010.
Asset utilization: On September 25, 2007, we announced the closure or downsizing of five production facilities in our Metal Framing segment. The affected facilities were: East Chicago, Indiana; Rock Hill, South Carolina; Goodyear, Arizona; Wildwood, Florida; and Montreal, Canada which is being downsized. The Rock Hill facility continues to operate only as a steel processing operation and will also produce product for the Aegis joint venture. In addition to the plant closures, the Metal Framing corporate offices will be relocated from Pittsburgh, Pennsylvania, to our corporate offices in Columbus, Ohio. Annual net sales generated by the closed facilities totaled approximately $125.0 million, the majority of which are expected to be transferred to other nearby Metal Framing locations. As of May 31, 2008, all five of the Metal Framing operating facilities have been closed or downsized. Of the $9.0 million in annual savings expected from these actions, $2.1 million was realized in fiscal 2008. The balance will be realized in fiscal 2009. Restructuring charges related to these closures and the relocation of the executive and administrative offices totaled $8.1 million in fiscal 2008 with an additional $4.6 million expected in fiscal 2009.
Rapid improvement team: We have created a rapid improvement team focused on improving the efficiency at each of our facilities. They have completed a review of one facility, but it is too early to provide the beneficial impact of their findings.
High performance organization: Under this initiative we have identified a number of efforts to enhance our talent management and business performance management processes. Those efforts are aimed at driving sustainable performance improvement.
Results of Operations
Fiscal 20052008 Compared to Fiscal 20042007
Consolidated Operations
The following table presents our consolidated operating results for the fiscal years indicated:results:
| 2005 | 2004 | |||||||||||||
| In millions, except per share | Actual | % of Net Sales | % Change | Actual | % of Net Sales | |||||||||
Net sales | $ | 3,078.9 | 100.0% | 29% | $ | 2,379.1 | 100.0% | |||||||
Cost of goods sold | 2,580.0 | 83.8% | 29% | 2,003.7 | 84.2% | |||||||||
Gross margin | 498.9 | 16.2% | 33% | 375.4 | 15.8% | |||||||||
Selling, general and administrative expense | 225.9 | 7.3% | 15% | 195.8 | 8.2% | |||||||||
Impairment charges and other | 5.6 | 0.2% | 69.4 | 3.0% | ||||||||||
Operating income | 267.4 | 8.7% | 143% | 110.2 | 4.6% | |||||||||
Other income (expense): | ||||||||||||||
Miscellaneous expense | (8.0 | ) | (1.6 | ) | ||||||||||
Interest expense | (24.8 | ) | -0.8% | 12% | (22.2 | ) | -0.9% | |||||||
Equity in net income of unconsolidated affiliates | 53.9 | 1.7% | 31% | 41.1 | 1.7% | |||||||||
Earnings before income taxes | 288.5 | 9.4% | 126% | 127.5 | 5.4% | |||||||||
Income tax expense | 109.1 | 3.5% | 168% | 40.7 | 1.8% | |||||||||
Net earnings | $ | 179.4 | 5.8% | 107% | $ | 86.8 | 3.6% | |||||||
Average common shares outstanding - diluted | 88.5 | 86.9 | ||||||||||||
Earnings per share - diluted | $ | 2.03 | 103% | $ | 1.00 | |||||||||
| Fiscal Year Ended May 31, | ||||||||||||||||||
| Dollars in millions | 2008 | % of Net sales | 2007 | % of Net sales | Increase/ (Decrease) | |||||||||||||
Net sales | $ | 3,067.2 | 100.0 | % | $ | 2,971.8 | 100.0 | % | $ | 95.4 | ||||||||
Cost of goods sold | 2,711.5 | 88.4 | % | 2,610.2 | 87.8 | % | 101.3 | |||||||||||
Gross margin | 355.7 | 11.6 | % | 361.6 | 12.2 | % | (5.9 | ) | ||||||||||
Selling, general and administrative expense | 231.6 | 7.6 | % | 232.5 | 7.8 | % | (0.9 | ) | ||||||||||
Restructuring charges | 18.1 | 0.6 | % | - | 0.0 | % | 18.1 | |||||||||||
Operating income | 106.0 | 3.5 | % | 129.1 | 4.3 | % | (23.1 | ) | ||||||||||
Other expense, net | (6.3 | ) | -0.2 | % | (4.4 | ) | -0.1 | % | 1.9 | |||||||||
Interest expense | (21.5 | ) | -0.7 | % | (21.9 | ) | -0.7 | % | (0.4 | ) | ||||||||
Equity in net income of unconsolidated affiliates | 67.5 | 2.2 | % | 63.2 | 2.1 | % | 4.3 | |||||||||||
Income tax expense | (38.6 | ) | -1.3 | % | (52.1 | ) | -1.8 | % | (13.5 | ) | ||||||||
Net earnings | $ | 107.1 | 3.5 | % | $ | 113.9 | 3.8 | % | $ | (6.8 | ) | |||||||
Net earnings increased $92.6 million to $179.4 million for fiscal 2005,2008 decreased $6.8 million from $86.8 million for fiscal 2004. Fiscal 2005 diluted earnings per share increased $1.03the prior year to $2.03 per share from $1.00 per share in fiscal 2004.$107.1 million.
Net sales increased 29%, or $699.8$95.4 million to $3,078.9$3,067.2 million in fiscal 2005 from $2,379.1 million for fiscal 2004. Virtually allthe prior year. Most of the increase in net sales was due to higher pricing, as volumes excluding acquisitions($63.4 million), stronger foreign currencies relative to the U.S. dollar ($31.3 million) and divestitures, were down on a comparative year-over-year basis for Metal Framing andmarginal increase in average selling prices. Volume increases boosted sales in nearly all of our segments, especially Construction Services, where sales increased $36.5 million.
Gross margin decreased $5.9 million from the prior year primarily due to declines in our Pressure Cylinders segment as a result of lower average selling prices in local currencies in Europe and up slightly for Processed Steel Products.
Gross margin increased 33%, or $123.5 million, to $498.9 million for fiscal 2005 from $375.4 million for fiscal 2004. A favorable pricing spread accounted for $127.6 millionmaterial costs. All of the increase, offset by a $5.3 million increase in direct labor and manufacturing expenses. Collectively, these factorsour other segments reported increased gross margin as a percentage of net salesdue to 16.2% in fiscal 2005 from 15.8% in fiscal 2004.stronger volumes.
Selling, general and administrative (“SG&A”)&A expense decreased to 7.3% of net sales in fiscal 2005 compared to 8.2% of net sales in fiscal 2004. In total, SG&A expense increased $30.1$0.9 million to $225.9from the prior year. The Transformation Plan provided $15.2 million in fiscal 2005 from $195.8 million in fiscal 2004. This was mainly due to a $16.6 million increase in profit sharing expense,SG&A savings, which was up significantly due to record earnings; a $9.9 million increase in professional fees;partially offset by increased compensation, depreciation and a $2.7 million increase in bad debt expense. The increase in professional fees is due to $5.5 million of additional expenses associated with meeting the requirements of the Sarbanes-Oxley Act of 2002 (“SOX”) and $5.3 million is due to the ongoing implementation of our new enterprise resource planning system (“ERP”). The increase in bad debt expense is a result of the increased collection risk of certain customers.
ImpairmentRestructuring charges and other for fiscal 2004 includes a $67.4of $18.1 million pre-tax charge for the impairment of certain assets and other related costs at the Decatur, Alabama, steel-processing facility and a $2.0 million pre-tax
charge for the impairment of certain assets related to the European operationsTransformation Plan. The Transformation Plan is being led by Company management with the assistance of Pressure Cylinders. An additional pre-tax chargeoutside consultants, who specialize in these types of $5.6plans. Restructuring charges included asset accelerated depreciation, employee early retirements and severance, facility restoration, equipment relocations, and professional fees.
Equity in net income of unconsolidated affiliates of $67.5 million mainly due to contract termination costs related towas largely made up of earnings from our WAVE joint venture, which increased $5.8 million over the salelast year. Increased earnings from WAVE and the addition of the Decatur facility, was recognized during the first quarter of fiscal 2005. Refer toearnings from Serviacero Worthington ($3.1 million) were offset by decreased earnings at WSP, TWB, and certain other joint ventures. See “Item 8. – Financial Statements and Supplementary Data – Notes to Consolidated Financial Statements – Note NJ – Impairment Charges and Restructuring Expense”Investments in Unconsolidated Affiliates” for more information.further information about our participation in unconsolidated joint ventures.
MiscellaneousIncome tax expense in fiscal 2005 increased $6.4 million from fiscal 2004, largely due to a $4.3 million higher elimination for the minority shareholder’s interest inyear decreased $13.5 million and the net earnings of our consolidated joint ventures. The prior period included a $3.6 million gain from the settlement of a hedge position with the Enron bankruptcy estate while the current year also included a $1.1 million increase in interest income.
Interest expense increased 12%, or $2.6 million, to $24.8 million in fiscal 2005 from $22.2 million in fiscal 2004, due to higher average debt balances.
Equity in neteffective income of unconsolidated affiliates increased 31%, or $12.8 million, to $53.9 million in fiscal 2005 from $41.1 million in fiscal 2004. Five of our seven unconsolidated joint ventures had strong double-digit increases in earnings. Collectively, the unconsolidated joint ventures generated approximately $767.0 million in sales in fiscal 2005, which are not reflected in consolidated net sales. Joint venture income continues to be a consistent and significant contributor to our profitability and over the last three years, our aggregate annual return on the investment in these joint ventures has averaged 41%. The joint ventures are also a source of cash to us, with aggregate annual distributions averaging more than $25.0 million over the same time period.
Our effective tax rate was 37.8% for fiscal 2005 and 31.9% for fiscal 2004. Income tax expense increased in fiscal 200526.5% compared to fiscal 2004 due31.4% in the prior year. The decrease in income tax is primarily because of lower earnings and a lower effective tax rate. The decrease in the effective income tax rate is primarily because of adjustments to a higher level of incomeour current and various tax adjustments. Fiscal 2005 included a net unfavorable adjustment of $2.6 million compared to favorable adjustments of $7.7 million recorded in fiscal 2004. The current year net adjustment was comprised of an unfavorable $4.3 million adjustment due to a ruling by the Sixth Circuit Court of Appeals that the State of Ohio’s investment tax credit program is unconstitutional and was partially offset by a $1.7 million favorable adjustment for the revision ofdeferred estimated tax liabilities resulting from tax audits settlements and related developments. The $7.7 million favorable adjustments in fiscal 2004 were comprised of a $6.3 million credit for the favorable resolution of certain tax audits and a $1.4 million credit for an adjustment to deferred taxes. Excluding these adjustments,change in the mix of our effective tax rate was 36.9% for fiscal 2005 and 38.0% for fiscal 2004.foreign earnings.
Segment Operations
Processed Steel ProductsProcessing
Our Processed Steel Products segment represented 59% of consolidated net sales in fiscal 2005. The steel pricing environment and the automotive industry, which accounts for approximately 50% to 60% of its net sales, significantly impacts this segment’s results. After rising steadily in early fiscal 2005, steel prices declined from their peak in September of 2004. Overall, the price of steel in fiscal 2005 was significantly higher than in fiscal 2004. Our ability to raise prices to our customer contributed to an improved spread between our average selling price and material cost. Sales volume to the automotive market for fiscal 2005 was 2.6% higher than for fiscal 2004, due to market share gains and exposure to faster growing product lines. Big Three automotive production volumes were down about 4.4% for the same period, while North American vehicle production for all manufacturers stayed relatively flat.
Effective August 1, 2004, we sold our Decatur, Alabama, steel-processing facility and its cold-rolling assets (“Decatur”) to Nucor for $80.4 million in cash. The assets sold at Decatur included the land and buildings, the four-stand tandem cold mill, the temper mill, the pickle line and the annealing furnaces. The sale excluded the slitting and cut-to-length assets and net working capital. We continue to serve customers by providing steel-processing services at the Decatur site under a long-term building lease with Nucor.
As a result of the sale, we recorded a $67.4 million pre-tax charge during the fourth quarter of fiscal 2004, primarily for the impairment of assets at the Decatur, Alabama, facility. All but an estimated $0.8 million of the pre-tax charge was non-cash. An additional pre-tax charge of $5.6 million, mainly relating to contract termination costs, was recognized during the first quarter of fiscal 2005.
The following table presents a summary of operating results for the Processed Steel ProductsProcessing segment for the fiscal yearsperiods indicated:
| 2005 | 2004 | Fiscal Year Ended May 31, | ||||||||||||||||||||||||||
| Dollars in millions, tons in thousands | Actual | % of Net Sales | % Change | Actual | % of Net Sales | |||||||||||||||||||||||
| Dollars in millions | 2008 | % of Net Sales | 2007 | % of Net Sales | Increase/ (Decrease) | |||||||||||||||||||||||
Net sales | $ | 1,805.0 | 100.0% | 31% | $ | 1,373.1 | 100.0% | $ | 1,463.2 | 100.0 | % | $ | 1,460.7 | 100.0 | % | $ | 2.5 | |||||||||||
Cost of goods sold | 1,574.0 | 87.2% | 31% | 1,199.0 | 87.3% | 1,313.5 | 89.8 | % | 1,313.2 | 89.9 | % | 0.3 | ||||||||||||||||
Gross margin | 231.0 | 12.8% | 33% | 174.1 | 12.7% | 149.7 | 10.2 | % | 147.5 | 10.1 | % | 2.2 | ||||||||||||||||
Selling, general and administrative expense | 99.4 | 5.5% | 12% | 88.7 | 6.5% | 92.8 | 6.3 | % | 92.1 | 6.3 | % | 0.7 | ||||||||||||||||
Impairment charges and other | 5.6 | 0.3% | 67.4 | 4.9% | ||||||||||||||||||||||||
Restructuring charges | 1.1 | 0.1 | % | - | 0.0 | % | 1.1 | |||||||||||||||||||||
Operating income | $ | 126.0 | 7.0% | 600% | $ | 18.0 | 1.3% | $ | 55.8 | 3.8 | % | $ | 55.4 | 3.8 | % | $ | 0.4 | |||||||||||
Tons shipped | 3,685 | -3% | 3,806 | |||||||||||||||||||||||||
Material cost | $ | 1,305.0 | 72.3% | 46% | $ | 893.7 | 65.1% | $ | 1,105.7 | $ | 1,106.5 | $ | (0.8 | ) | ||||||||||||||
Tons shipped (in thousands) | 3,286 | 3,282 | 4 | |||||||||||||||||||||||||
Net sales and operating income highlights were as follows:
Net sales increased $2.5 million from the prior year to $1,463.2 million. The increase was attributable to a full year of operations at our stainless steel processing facility, Precision Specialty Metals, Inc. (“PSM”), compared to nine and one-half months of operations in the prior year. Increased sales at PSM were partially offset by decreases in net sales at our carbon steel processing facilities, due to decreased average selling prices early in the year and lower volumes.
Operating income increased $108.0$0.4 million compared to $126.0last year. Gross margin improved $2.2 million in fiscal 2005 from $18.0 million in fiscal 2004. Excluding the effectas a result of the “impairment charges and other” line item from each year, operating income increased $46.2 million, to $131.6 million, or 7.3% of net sales, in fiscal 2005 from $85.4 million, or 6.2% of net sales, in fiscal 2004. This increase wasvolumes at PSM due to a larger spreadfull year of $50.1 million between average selling priceoperations, offset by higher freight expense, wages and material cost and a decrease in expenses largelyutilities. SG&A expense was up slightly, primarily due to the salea higher allocation of Decatur. Net sales increased 31%, or $431.9corporate expenses. Restructuring charges of $1.1 million related to $1,805.0 million from $1,373.1 million because of increased pricing. Volumes declined slightly compared to the prior fiscal year, but excluding the volumes associated with the assets sold at Decatur in each period, tons shipped increased 3.1% compared to the prior period. SG&A expense for fiscal 2005 was $99.4 million, an increase of $10.7 million from $88.7 million for fiscal 2004; however, as a percentage of net sales, SG&A declined due to the significant increase in net sales. The increase in SG&A was largely due to an increase in profit sharingemployee early retirements and bonus expense of $5.8 million; higher bad debt expense of $3.4 million resulting from the increased collection risk of certain customers, including Tower Automotive; and additional expenses of $2.7 million associated with meeting SOX requirements.severance.
Metal Framing
Fiscal 2005 represented the best year in the Metal Framing segment’s history. This is primarily due to the wider spread between average selling price and material cost. During fiscal 2005, as spread continued to drive profitability, volumes slowed due to the weak commercial and office construction market. Even though volumes declined in fiscal 2005 compared to fiscal 2004, there were signs that the commercial construction market was improving, including an 18% increase in volumes for the fourth quarter of fiscal 2005 compared to the third quarter of the same year. Certain commercial construction indices generally trended higher in fiscal 2005 compared to fiscal 2004, while our largest market, office buildings, declined in activity. In general, commercial construction activity has been depressed for over three years and any increase in demand should be beneficial to this business segment.
During the second quarter of fiscal 2005, we entered into an unconsolidated joint venture with Pacific. This joint venture is focused on the military housing construction market. Our Metal Framing segment sells steel framing products to the joint venture for its projects. The operating results of the joint venture are included in “Equity in net income of unconsolidated affiliates” on the Consolidated Statement of Earnings.
Also during the second quarter of fiscal 2005, we formed a consolidated joint venture with Encore, operating under the name Dietrich Metal Framing Canada, LP. This joint venture manufactures steel framing products for the Canadian market and also offers a variety of proprietary products supplied by our Metal Framing facilities in the United States. This joint venture is a 60%-owned Canadian limited liability company whose assets and results of operations are consolidated in our Metal Framing segment.
The following table presents a summary of operating results for the Metal Framing segment for the fiscal yearsperiods indicated:
| 2005 | 2004 | Fiscal Year Ended May 31, | ||||||||||||||||||||||||||||
| Dollars in millions, tons in thousands | Actual | % of Net Sales | % Change | Actual | % of Net Sales | |||||||||||||||||||||||||
| Dollars in millions | 2008 | % of Net Sales | 2007 | % of Net Sales | Increase/ (Decrease) | |||||||||||||||||||||||||
Net sales | $ | 848.0 | 100.0% | 28% | $ | 662.0 | 100.0% | $ | 788.8 | 100.0 | % | $ | 771.4 | 100.0 | % | $ | 17.4 | |||||||||||||
Cost of goods sold | 655.2 | 77.3% | 24% | 528.2 | 79.8% | 729.0 | 92.4 | % | 711.7 | 92.3 | % | 17.3 | ||||||||||||||||||
Gross margin | 192.8 | 22.7% | 44% | 133.8 | 20.2% | 59.8 | 7.6 | % | 59.7 | 7.7 | % | 0.1 | ||||||||||||||||||
Selling, general and administrative expense | 84.3 | 9.9% | 20% | 70.0 | 10.6% | 67.0 | 8.5 | % | 68.9 | 8.9 | % | (1.9 | ) | |||||||||||||||||
Restructuring charges | 9.0 | 1.1 | % | - | 0.0 | % | 9.0 | |||||||||||||||||||||||
Operating income | $ | 108.5 | 12.8% | 70% | $ | 63.8 | 9.6% | |||||||||||||||||||||||
Operating loss | $ | (16.2 | ) | -2.1 | % | $ | (9.2 | ) | -1.2 | % | $ | (7.0 | ) | |||||||||||||||||
Tons shipped | 657 | -16% | 781 | |||||||||||||||||||||||||||
Material cost | $ | 499.9 | 59.0% | 37% | $ | 364.6 | 55.1% | $ | 557.3 | $ | 547.6 | $ | 9.7 | |||||||||||||||||
Tons shipped (in thousands) | 666 | 644 | 22 | |||||||||||||||||||||||||||
Net sales and operating loss highlights were as follows:
Operating incomeNet sales increased $44.7$17.4 million from the prior year to $788.8 million. The increase in net sales was due to higher volumes ($28.3 million) offset by lower average selling prices ($10.9 million).
The operating loss of $16.2 million was $7.0 million worse than last year due to $9.0 million in restructuring charges recorded in the current year. Metal Framing was able to return to operating profitability in the fourth quarter, but that was not enough to make up for the losses recorded earlier in the fiscal year. Overall volumes were up over last year contributing $8.9 million to a record $108.5 million in fiscal 2005 from $63.8 million in fiscal 2004. The primary driver for the increase was an $89.6 million expansion in the spreadgross margin; however, improved volumes were nearly offset by lower spreads between average selling price and material cost. Net sales increased 28%, or $186.0 million, to $848.0 million in fiscal 2005 from $662.0 million in fiscal 2004. This increase is due to a 52% increase in average selling price, which increased net sales $280.7 million, offset by a 16% volume decrease, which reduced net sales by $94.7 million. Gross margin increased 44% to $192.8 million from $133.8 million in fiscal 2004, mostly due to an increase in the spread between average selling priceprices and material cost and lower manufacturingincreased conversion costs. SG&A decreased $1.9 million as we have begun to recognized benefits from our Transformation Plan. Restructuring charges of $9.0 million were associated with the Transformation Plan that is expected to reduce expenses partially offset by a $38.8$16.5 million impact due to lower sales volume. Even though SG&A expense increased $14.3annually. The Transformation Plan has already provided $9.6 million it decreased as a percentage of net sales to 9.9%in savings in fiscal 2005 from 10.6%2008, with an additional $6.9 million in annual savings expected to be recognized in fiscal 2004 due to the significant increase in net sales. SG&A expense increased primarily due to a $8.4 million increase in profit sharing and bonus expense, additional expenses of $3.7 million for professional fees mainly due to the ERP implementation and $1.3 million associated with meeting SOX requirements. The combined impact of the factors discussed above was an increase in operating income as a percentage of net sales to 12.8% in fiscal 2005 from 9.6% in fiscal 2004.2009.
Pressure Cylinders
We acquired the Western Cylinder Assets on September 17, 2004. This business operates two facilities in Wisconsin, which manufacture 14.1 oz. and 16.4 oz. disposable cylinders for products such as hand torches, propane-fueled camping equipment, portable heaters and tabletop grills. These new products lines generated $45.8 million of net sales for us in fiscal 2005 after the acquisition.
In Europe, we have been successful with high-pressure and refrigerant cylinders, but have struggled with the liquefied petroleum gas (“LPG”) cylinders due to market overcapacity and declining demand. As a result, an impairment charge on certain of our Portugal LPG assets was recorded in the fourth quarter of fiscal 2004 and production of the LPG cylinders at the Portugal facility ceased during the first quarter of fiscal 2005.
On October 13, 2004, we purchased the 49% interest of our minority partner in the joint venture that operates a pressure cylinder manufacturing facility in Hustopece, Czech Republic.
The following table presents a summary of operating results for the Pressure Cylinders segment for the fiscal yearsperiods indicated:
| 2005 | 2004 | Fiscal Year Ended May 31, | ||||||||||||||||||||||||||
| Dollars in millions, units in thousands | Actual | % of Net Sales | % Change | Actual | % of Net Sales | |||||||||||||||||||||||
| Dollars in millions | 2008 | % of Net Sales | 2007 | % of Net Sales | Increase/ (Decrease) | |||||||||||||||||||||||
Net sales | $ | 408.3 | 100.0% | 24% | $ | 328.7 | 100.0% | $ | 578.8 | 100.0 | % | $ | 544.8 | 100.0 | % | $ | 34.0 | |||||||||||
Cost of goods sold | 334.1 | 81.8% | 27% | 262.6 | 79.9% | 457.2 | 79.0 | % | 411.1 | 75.5 | % | 46.1 | ||||||||||||||||
Gross margin | 74.2 | 18.2% | 12% | 66.1 | 20.1% | 121.6 | 21.0 | % | 133.7 | 24.5 | % | (12.1 | ) | |||||||||||||||
Selling, general and administrative expense | 40.6 | 10.0% | 17% | 34.7 | 10.6% | 51.5 | 8.9 | % | 49.1 | 9.0 | % | 2.4 | ||||||||||||||||
Impairment charges and other | — | 0.0% | 2.0 | 0.6% | ||||||||||||||||||||||||
Restructuring charges | 0.1 | 0.0 | % | - | 0.0 | % | 0.1 | |||||||||||||||||||||
Operating income | $ | 33.6 | 8.2% | 14% | $ | 29.4 | 8.9% | $ | 70.0 | 12.1 | % | $ | 84.6 | 15.5 | % | $ | (14.6 | ) | ||||||||||
Units shipped | ||||||||||||||||||||||||||||
Without acquisition* | 14,569 | 14,670 | ||||||||||||||||||||||||||
Acquisition* | 22,135 | — | ||||||||||||||||||||||||||
Total units shipped | 36,704 | 14,670 | ||||||||||||||||||||||||||
Material cost | $ | 197.5 | 48.4% | 38% | $ | 142.6 | 43.4% | $ | 273.1 | $ | 251.1 | $ | 22.0 | |||||||||||||||
Units shipped (in thousands) | 48,058 | 44,891 | 3,167 | |||||||||||||||||||||||||
Net sales and operating income highlights were as follows:
* AcquisitionNet sales of $578.8 million increased by $34.0 million over fiscal 2007. Stronger foreign currencies relative to the U.S. dollar positively impacted reported U.S. dollar sales of the Western Cylinder Assets effective September 17, 2004
Operating income increased 14%, or $4.2non-U.S. operations by $26.9 million compared to $33.6last year. This was offset by a $9.8 million decline in fiscal 2005sales from $29.4 millionour European operations in fiscal 2004.local currencies, primarily as a result of lower average selling prices. The remaining increase in net sales was due to improved volumes in our 14.1 ounce cylinders and higher volumeselling prices across most North American product lines.
Operating income decreased $14.6 million from last year. Gross margin declined to 21.0% of $19.6 million, partially offset by a decline insales from 24.5% as the spread betweenlower average selling priceprices in European local currencies and increased material cost of $11.6 million. Net sales increased 24%, or $79.6 million, to $408.3 million due to higher sales volumes, with $45.8 million of this increase attributable to the purchase of the Western Cylinder Assets. The strength of foreign currencies against the U.S. dollar also contributed $10.2 million to net sales. Gross margin increased $8.1 million to $74.2 million for fiscal 2005 from $66.1 million for fiscal 2004. Although SG&A expense decreased slightly as a percentage of net sales, the dollar expense increased $5.9 million primarily due to $2.9 million of expenses related to the purchase of the Western Cylinder Assets, which included $1.7 million of amortization expense of customer list intangible assets, an increase in profit sharing and bonus expense of $1.7 million, and additional expenses of $0.6 million associated with meeting SOX requirements.
Fiscal 2004 Compared to Fiscal 2003
Consolidated Operations
The following table presents our consolidated operating results for the fiscal years indicated:
| 2004 | 2003 | |||||||||||||
| In millions, except per share | Actual | % of Net Sales | % Change | Actual | % of Net Sales | |||||||||
Net sales | $ | 2,379.1 | 100.0% | 7% | $ | 2,219.9 | 100.0% | |||||||
Cost of goods sold | 2,003.7 | 84.2% | 5% | 1,917.0 | 86.4% | |||||||||
Gross margin | 375.4 | 15.8% | 24% | 302.9 | 13.6% | |||||||||
Selling, general and administrative expense | 195.8 | 8.2% | 7% | 182.7 | 8.2% | |||||||||
Impairment charges and other | 69.4 | 3.0% | (5.6 | ) | -0.3% | |||||||||
Operating income | 110.2 | 4.6% | -12% | 125.8 | 5.7% | |||||||||
Other income (expense): | ||||||||||||||
Miscellaneous expense | (1.6 | ) | (7.2 | ) | ||||||||||
Nonrecurring losses | — | (5.4 | ) | |||||||||||
Interest expense | (22.2 | ) | -0.9% | -10% | (24.8 | ) | -1.1% | |||||||
Equity in net income of unconsolidated affiliates | 41.1 | 1.7% | 37% | 30.0 | 1.4% | |||||||||
Earnings before income taxes | 127.5 | 5.4% | 8% | 118.4 | 5.3% | |||||||||
Income tax expense | 40.7 | 1.8% | -6% | 43.2 | 1.9% | |||||||||
Net earnings | $ | 86.8 | 3.6% | 15% | $ | 75.2 | 3.4% | |||||||
Average common shares outstanding - diluted | 86.9 | 86.5 | ||||||||||||
Earnings per share - diluted | $ | 1.00 | 15% | $ | 0.87 | |||||||||
Net earnings increased $11.6 million to $86.8 million in fiscal 2004, from $75.2 million in the year ended May 31, 2003 (“fiscal 2003”). Fiscal 2004 diluted earnings per share increased $0.13 per share to $1.00 per share from diluted earnings per share of $0.87 in fiscal 2003.
Net sales increased 7%, or $159.2 million, to $2,379.1 million in fiscal 2004 from $2,219.9 million in fiscal 2003. In the second half of fiscal 2004, we raised our selling prices to meet the dramatic increase in steel prices. This accounted for approximately 60% of the year-over-year increase in net sales. The remaining increase was primarily due to an increase in volumes in Metal Framing caused by the acquisition of Unimast Incorporated (“Unimast”), which closed July 31, 2002, and contributed two additional months of net sales in fiscal 2004 compared to fiscal 2003.
Gross margin increased 24%, or $72.5 million, to $375.4 million in fiscal 2004 from $302.9 million in fiscal 2003. Favorable pricing accounted for $64.5 million of the increase with higher volumes contributing an additional $26.6 million. These increases were partially offset by an $18.6 million increase in direct labor and manufacturing expenses due to higher profit sharing and the addition of Unimast. Collectively, these factors increased gross margin as a percentage of net sales to 15.8% in fiscal 2004 from 13.6% in fiscal 2003.
SG&A expense remained a consistent 8.2% of net sales. In total, SG&A expense increased $13.1 million, to $195.8 million in fiscal 2004 from $182.7 million in fiscal 2003. This was mainly due to a $6.3 million increase in profit sharing expense, which was up significantly due to higher earnings. In addition, the acquisition of Unimast, an increase in bad debt expense and higher professional fees contributed to the increase. The increase in bad debt expense was a result of higher receivables balances, and the increase in professional fees was related to the ongoing
implementation of our new ERP. For more information on the ERP implementation, see the discussion on capital spending in the Liquidity and Capital Resources section.
Impairment charges and other for fiscal 2004 includes a $67.4 million pre-tax charge for the impairment of certain assets and other related costs at the Decatur, Alabama, steel-processing facility and a $2.0 million pre-tax charge for the impairment of certain assets related to the European operations of Pressure Cylinders. In fiscal 2003, a favorable adjustment of $5.6 million was made to the fiscal 2002 plant consolidation restructuring charge. Refer to “Item 8. – Financial Statements and Supplementary Data – Notes to Consolidated Financial Statements – Note N – Impairment Charges and Restructuring Expense” for more information.
Miscellaneous expense decreased $5.6 million from fiscal 2003 due in part to a $3.6 million gain from the settlement of a hedge position with the Enron bankruptcy estate. In addition, lower usage of the accounts receivable securitization facility during fiscal 2004 resulted in a $1.7$12.1 million reductiondecline in related fees.
A nonrecurring loss of $5.4 million was recognized in fiscal 2003 for potential liabilities relating to certain workers’ compensation claims of Buckeye Steel Castings Company (“Buckeye Steel”)gross margin for the period prior to its sale by Worthington in fiscal 1999, when a Worthington guaranty was in place.year.
Interest expense decreased 10%, or $2.6 million, to $22.2 million in fiscal 2004 from $24.8 million in fiscal 2003, due to lower average debt balances and lower average interest rates.
Equity in net income of unconsolidated affiliates increased 37%, or $11.1 million, to $41.1 million in fiscal 2004 from $30.0 million in fiscal 2003. The main reasons for the increase were higher net sales and improved margins at each of our six unconsolidated affiliates for fiscal 2004. Four of the six unconsolidated joint ventures had what were then record years.
Our effective tax rate was 31.9% for fiscal 2004. During fiscal 2004, a $7.7 million credit was recorded to income tax expense, comprised of a $6.3 million credit for the favorable resolution of certain tax audits and a $1.4 million credit for an adjustment to deferred taxes. Excluding this $7.7 million credit, the effective tax rate was 38.0%. This increase from our effective tax rate of 36.5% in fiscal 2003 was due to higher state and local tax rates and a change in our mix of income.
Segment OperationsOther
ProcessedThe “Other” category includes the Automotive Body Panels, Construction Services and Steel Products
Our Processed Steel Products segment resultsPackaging segments, which are significantly impacted byimmaterial for purposes of separate disclosure, along with income and expense items not allocated to the automotive industry and the steel pricing environment. With Big 3 automotive production volumes down in fiscal 2004 from fiscal 2003, our volumes decreased as well. However, the increased demand for steel in the latter part of fiscal 2004 led to higher steel prices and an environment that enabled us to significantly improve the spread between our average selling price and material cost, which resulted in a 14% increase in our gross margin.
On May 27, 2004, we signed an agreement to sell our Decatur, Alabama, steel-processing facility and its cold-rolling assets to Nucor for $82.0 million in cash.
As a result of the sale, we recorded a $67.4 million pre-tax charge during the fourth quarter of fiscal 2004, primarily for the impairment of assets at the Decatur facility. All but an estimated $0.8 million of the pre-tax charge was non-cash. We recognized an additional pre-tax charge of $5.6 million relating to contract termination costs in the first quarter of fiscal 2005.
segments.
The following table presents a summary of operating results for the fiscal yearsperiods indicated:
| 2004 | 2003 | ||||||||||||
| Dollars in millions, tons in thousands | Actual | % of Net Sales | % Change | Actual | % of Net Sales | ||||||||
Net sales | $ | 1,373.1 | 100.0% | 2% | $ | 1,343.4 | 100.0% | ||||||
Cost of goods sold | 1,199.0 | 87.3% | 1% | 1,190.4 | 88.6% | ||||||||
Gross margin | 174.1 | 12.7% | 14% | 153.0 | 11.4% | ||||||||
Selling, general and administrative expense | 88.7 | 6.5% | 10% | 80.7 | 6.0% | ||||||||
Impairment charges and other | 67.4 | 4.9% | (8.7 | ) | -0.6% | ||||||||
Operating income | $ | 18.0 | 1.3% | -78% | $ | 81.0 | 6.0% | ||||||
Tons shipped | 3,806 | -2% | 3,890 | ||||||||||
Material cost | $ | 893.7 | 65.1% | 1% | $ | 883.5 | 65.8% | ||||||
| Fiscal Year Ended May 31, | ||||||||||||||||||
| Dollars in millions | 2008 | % of Net Sales | 2007 | % of Net Sales | Increase/ (Decrease) | |||||||||||||
Net sales | $ | 236.4 | 100.0 | % | $ | 194.9 | 100.0 | % | $ | 41.5 | ||||||||
Cost of goods sold | 211.9 | 89.6 | % | 174.2 | 89.4 | % | 37.7 | |||||||||||
Gross margin | 24.5 | 10.4 | % | 20.7 | 10.6 | % | 3.8 | |||||||||||
Selling, general and administrative expense | 20.2 | 8.5 | % | 22.4 | 11.5 | % | (2.2 | ) | ||||||||||
Restructuring charges | 7.9 | 3.3 | % | - | 0.0 | % | 7.9 | |||||||||||
Operating loss | $ | (3.6 | ) | -1.5 | % | $ | (1.7 | ) | -0.9 | % | $ | (1.9 | ) | |||||
Net sales and operating loss highlights were as follows:
Operating income decreased $63.0The $41.5 million net sales increase in 2008 was almost entirely attributable to $18.0the Construction Services segment driven by higher volumes in the military construction group.
The operating loss widened by $1.9 million versus last year due to $7.9 million in fiscal 2004 from $81.0restructuring charges. These charges include professional fees and early retirement and severance costs largely related to corporate employees. Gross margin improved $3.8 million in fiscal 2003. The decline was due to the $67.4 million “impairmentoperating performance of the Construction Services segment, which improved significantly over the prior year due to a combination of higher volumes in the military construction group and other charge”stronger margins for the Decaturmid-rise construction projects.
Fiscal 2007 Compared to Fiscal 2006
Consolidated Operations
The following table presents consolidated operating results:
| Fiscal Year Ended May 31, | ||||||||||||||||||
| Dollars in millions | 2007 | % of Net Sales | 2006 | % of Net Sales | Increase/ (Decrease) | |||||||||||||
Net sales | $ | 2,971.8 | 100.0 | % | $ | 2,897.2 | 100.0 | % | $ | 74.6 | ||||||||
Cost of goods sold | 2,610.2 | 87.8 | % | 2,525.6 | 87.2 | % | 84.6 | |||||||||||
Gross margin | 361.6 | 12.2 | % | 371.6 | 12.8 | % | (10.0 | ) | ||||||||||
Selling, general and administrative expense | 232.5 | 7.8 | % | 214.0 | 7.4 | % | 18.5 | |||||||||||
Operating income | 129.1 | 4.3 | % | 157.6 | 5.4 | % | (28.5 | ) | ||||||||||
Other expense, net | (4.4 | ) | -0.1 | % | (1.5 | ) | -0.1 | % | 2.9 | |||||||||
Interest expense | (21.9 | ) | -0.7 | % | (26.3 | ) | -0.9 | % | (4.4 | ) | ||||||||
Gain on sale of Acerex | - | 0.0 | % | 26.6 | 0.9 | % | (26.6 | ) | ||||||||||
Equity in net income of unconsolidated affiliates | 63.2 | 2.1 | % | 56.3 | 1.9 | % | 6.9 | |||||||||||
Income tax expense | (52.1 | ) | -1.8 | % | (66.7 | ) | -2.3 | % | (14.6 | ) | ||||||||
Net earnings | $ | 113.9 | 3.8 | % | $ | 146.0 | 5.0 | % | $ | (32.1 | ) | |||||||
Our fiscal 2007 net earnings decreased $32.1 million, or 22%, from fiscal 2006. Fiscal 2006 earnings included a $12.5 million after-tax gain on the sale transaction recorded inof our Acerex, S.A. de C.V. (“Acerex”) Mexican steel processing joint venture.
Net sales increased by $74.6 million to $2,971.8 million. The fiscal 2004 versus the $8.72007 acquisition of PSM contributed $46.2 million restructuring credit recorded in fiscal 2003. Excluding the effect of the “impairment charges and other” line item from each year, operating income increased $13.1increase. In addition, average selling prices throughout our segments improved over fiscal 2006, contributing $240.5 million to $85.4net sales. However, lower volumes related to soft market conditions in our Steel Processing and Metal Framing segments negatively impacted net sales by $163.4 million, partially offset by volume increases of $43.7 million in our Pressure Cylinders segment and Other category.
Gross margin decreased $10.0 million from fiscal 20042006, and decreased as a percent of net sales from $72.3 million12.8% to 12.2%, primarily due to lower volumes related to soft market conditions in fiscal 2003. A $28.1 million favorable impact to operating income resulted from an increase in theour Steel Processing and Metal Framing segments as well as a lower spread between average selling priceprices and material cost, as higher average selling prices were matched against lower-cost inventory. This, however, was reduced by an $8.0 million increasecosts in Metal Framing.
SG&A expense a $5.2increased $18.5 million increase in labor and manufacturing expenses and a slight decrease in volume,over fiscal 2006 primarily as a result of a dropincreases in tolling tons. SG&A expense, as a percentage of net sales, increased to 6.5% in fiscal 2004 from 6.0% in fiscal 2003, reflecting higher profit sharingbenefits ($9.9 million), wages ($8.8 million), stock-based compensation ($3.5 million) and bonus expense and an increase in bad debt expense. The $5.2expense ($3.6 million). These increases were partially offset by lower professional fees ($5.9 million) and insurance and taxes ($2.2 million).
Interest and other expense, net decreased $1.5 million increase in labor and manufacturingcompared to fiscal 2006. Interest expense isdecreased $4.4 million primarily due to lower average debt levels compared to fiscal 2006, while other expense increased profit sharing expense.$2.9 million primarily due to lower interest income.
Equity in net income of unconsolidated affiliates increased $6.9 million, primarily due to the negative impact in fiscal 2006 of a $6.0 million income tax accrual adjustment at Acerex, and increased equity income from WAVE. The unconsolidated joint ventures generated $652.2 million in sales and $124.5 million in net income during fiscal 2007.
Income tax expense decreased $14.6 million due to lower earnings and the tax impact from the gain on sale of Acerex in fiscal 2006. The effective tax rate was 31.4% for both years.
Segment Operations
Metal FramingSteel Processing
In fiscal 2004, our Metal Framing segment posted its then best performance ever. From August 2002 until the third quarter of fiscal 2004, we experienced a depressed commercial construction market and deteriorating spread between average selling price and material cost. In the first half of fiscal 2004, we also incurred approximately $4.0 million of unanticipated integration costs related to the Unimast acquisition, primarily for temporary labor and repairs and maintenance of equipment and facilities. During the third quarter of fiscal 2004, we
began to realize synergies from the acquisition and, aided by an improving economy, spread widened and demand began to pick up. This trend continued into the fourth quarter of fiscal 2004 as spread improved dramatically and volume continued to increase.
The following table presents a summary of operating results for the fiscal yearsSteel Processing segment for the periods indicated:
| 2004 | 2003 | Fiscal Year Ended May 31, | ||||||||||||||||||||||||||
| Dollars in millions, tons in thousands | Actual | % of Net Sales | % Change | Actual | % of Net Sales | |||||||||||||||||||||||
| Dollars in millions | 2007 | % of Net sales | 2006 | % of Net sales | Increase/ (Decrease) | |||||||||||||||||||||||
Net sales | $ | 662.0 | 100.0% | 23% | $ | 539.4 | 100.0% | $ | 1,460.7 | 100.0 | % | $ | 1,486.2 | 100.0 | % | $ | (25.5 | ) | ||||||||||
Cost of goods sold | 528.2 | 79.8% | 17% | 452.4 | 83.9% | 1,313.2 | 89.9 | % | 1,347.6 | 90.7 | % | (34.4 | ) | |||||||||||||||
Gross margin | 133.8 | 20.2% | 54% | 87.0 | 16.1% | 147.5 | 10.1 | % | 138.6 | 9.3 | % | 8.9 | ||||||||||||||||
Selling, general and administrative expense | 70.0 | 10.6% | 11% | 62.9 | 11.7% | 92.1 | 6.3 | % | 76.8 | 5.2 | % | 15.3 | ||||||||||||||||
Impairment charges and other | — | 1.6 | 0.2% | |||||||||||||||||||||||||
Operating income | $ | 63.8 | 9.6% | 183% | $ | 22.5 | 4.2% | $ | 55.4 | 3.8 | % | $ | 61.8 | 4.2 | % | $ | (6.4 | ) | ||||||||||
Tons shipped | 781 | 13% | 694 | |||||||||||||||||||||||||
Material cost | $ | 364.6 | 55.1% | 16% | $ | 315.5 | 58.5% | $ | 1,106.5 | $ | 1,139.0 | $ | (32.5 | ) | ||||||||||||||
Tons shipped (in thousands) | 3,282 | 3,611 | (329 | ) | ||||||||||||||||||||||||
Net sales and operating income highlights were as follows:
Net sales decreased $25.5 million from fiscal 2006 to $1,460.7 million. Volumes were down 9% from fiscal 2006 resulting in a $184.3 million reduction to net sales, as virtually all end markets served by this segment, especially automotive and construction, were weak compared to fiscal 2006. Volume declines were partially offset by $112.6 million in higher average selling prices and additional net sales of $46.2 million generated by PSM.
Operating income increased $41.3decreased $6.4 million to a then record $63.8 million in fiscal 2004 from $22.5 million in fiscal 2003. The volume increase of 13% reflected the impact of twelve months of Unimast activity in fiscal 2004 compared to only ten months during fiscal 2003, and was better than the 8% improvement in the U.S. Census Bureau’s index of office construction. Average selling price increased 9%. As a result of these factors, net sales increased 23%, or $122.6 million, to $662.0 million in fiscal 2004 from $539.4 million in fiscal 2003. Gross margin increased 54% to $133.8 million from $87.0 million in fiscal 2003, mostlyprimarily due to an increase in the spread between average selling price and material cost and the volume increase mentioned above. Gross marginlower volumes as a percentage of net sales increased to 20.2% in fiscal 2004 from 16.1% in fiscal 2003. Even thoughwell as higher SG&A expense. SG&A expense increased $7.1 million, it decreased as a percentage of net sales to 10.6% in fiscal 2004 from 11.7% in fiscal 2003 due to the significant increase in net sales.acquisition of PSM and because SG&A expense increased primarily due to a $3.4 million increase in profit sharing and bonus expense related to higher income and a $3.1 million increase in wages due mainly to the Unimast acquisition. In addition, a $1.6 million restructuring charge was recorded during the second quarter of fiscal 2003. The combined impact of the factors discussed above was an increase in operating income as a percentage of net sales to 9.6% in fiscal 2004 from 4.2% in fiscal 2003.2006 was significantly decreased by a favorable bad debt recovery.
Pressure CylindersMetal Framing
Demand declined for certain LPG cylinders during fiscal 2004 and 2003 due to the diminishing impact of the regulations effective April 2002 requiring overfill prevention devices on these cylinders; however, the impact was not as significant as originally expected. Increases in total North American unit sales, which represent approximately 80% of total units sales, were offset by declines at our European facilities where the strong Euro made it unattractive for our customers to export their products. We have had success in the European market with our high-pressure and refrigerant cylinders, but we have struggled with LPG cylinder sales due to overcapacity and declining demand. As a result, we ceased LPG cylinder production in Portugal and recorded an impairment charge of $2.0 million on certain of our European LPG assets during the fourth quarter of fiscal 2004.
The following table presents a summary of operating results for the fiscal yearsMetal Framing segment for the periods indicated:
| 2004 | 2003 | Fiscal Year Ended May 31, | |||||||||||||||||||||||||||
| Dollars in millions, units in thousands | Actual | % of Net Sales | % Change | Actual | % of Net Sales | ||||||||||||||||||||||||
| Dollars in millions | 2007 | % of Net sales | 2006 | % of Net sales | Increase/ (Decrease) | ||||||||||||||||||||||||
Net sales | $ | 328.7 | 100.0% | 2% | $ | 321.8 | 100.0% | $ | 771.4 | 100.0 | % | $ | 796.3 | 100.0 | % | $ | (24.9 | ) | |||||||||||
Cost of goods sold | 262.6 | 79.9% | 3% | 255.4 | 79.4% | 711.7 | 92.3 | % | 673.4 | 84.6 | % | 38.3 | |||||||||||||||||
Gross margin | 66.1 | 20.1% | 0% | 66.4 | 20.6% | 59.7 | 7.7 | % | 122.9 | 15.4 | % | (63.2 | ) | ||||||||||||||||
Selling, general and administrative expense | 34.7 | 10.6% | 6% | 32.7 | 10.2% | 68.9 | 8.9 | % | 76.2 | 9.6 | % | (7.3 | ) | ||||||||||||||||
Impairment charges and other | 2.0 | 0.6% | 1.4 | 0.4% | |||||||||||||||||||||||||
Operating income | $ | 29.4 | 8.9% | -9% | $ | 32.3 | 10.0% | ||||||||||||||||||||||
Operating income (loss) | $ | (9.2 | ) | -1.2 | % | $ | 46.7 | 5.9 | % | $ | (55.9 | ) | |||||||||||||||||
Units shipped | 14,670 | -4% | 15,235 | ||||||||||||||||||||||||||
Material cost | $ | 142.6 | 43.4% | 0% | $ | 142.0 | 44.1% | $ | 547.6 | $ | 508.6 | $ | 39.0 | ||||||||||||||||
Tons shipped (in thousands) | 644 | 704 | (60.0 | ) | |||||||||||||||||||||||||
Operating income decreased 9%, or $2.9 million, to $29.4 million in fiscal 2004 from $32.3 million in fiscal 2003. Excluding the “impairment chargesNet sales and other” line item from each year, operating income decreased $2.3 million, to $31.4 million in fiscal 2004 from $33.7 million in fiscal 2003. (loss) highlights were as follows:
Net sales increased 2%, or $6.9decreased $24.9 million from fiscal 2006 to $328.7$771.4 million in fiscal 2004 from $321.8 million in fiscal 2003. This increase was primarily due to the benefiteffect of a $12.0 million gain related to the translation of European sales to U.S. dollars,9% decline in volume ($71.5 million), partially offset by a declinean increase in average selling prices ($46.6 million). Lower volume was the result of weak demand due to: reduced residential and commercial construction activity, especially in the significant Florida market; product substitution, as steel remained higher priced than alternative building materials, such as wood; increased competition; and delays in commercial construction projects as developers anticipated lower material prices. Average selling prices rose from fiscal 2006 in an attempt to offset increasing galvanized material costs resulting from higher zinc prices.
The segment reported an operating loss of $9.2 million compared to operating income of $46.7 million in fiscal 2006, primarily due to a $32.7 million decrease in the spread between average selling prices and material costs. While selling prices increased over fiscal 2006, the increase was not enough to offset significantly higher material costs. Material costs climbed significantly due to higher galvanized steel costs and an unfavorable mix of prime and secondary steel inventory for a portion of the year. SG&A expenses decreased $7.4 million, primarily due to lower professional fees and a favorable bad debt recovery recorded in fiscal 2007. In addition, we reduced the value of assets by $1.7 million as a result of the LaPorte, Indiana, facility closure in fiscal 2007.
Pressure Cylinders
The following table presents a summary of operating results for the Pressure Cylinders segment for the periods indicated:
| Fiscal Year Ended May 31, | ||||||||||||||||
| Dollars in millions | 2007 | % of Net sales | 2006 | % of Net sales | Increase/ (Decrease) | |||||||||||
Net sales | $ | 544.8 | 100.0 | % | $ | 461.9 | 100.0 | % | $ | 82.9 | ||||||
Cost of goods sold | 411.1 | 75.5 | % | 367.2 | 79.5 | % | 43.9 | |||||||||
Gross margin | 133.7 | 24.5 | % | 94.7 | 20.5 | % | 39.0 | |||||||||
Selling, general and administrative expense | 49.1 | 9.0 | % | 45.4 | 9.8 | % | 3.7 | |||||||||
Operating income | $ | 84.6 | 15.5 | % | $ | 49.3 | 10.7 | % | $ | 35.3 | ||||||
Material cost | $ | 251.1 | $ | 221.8 | $ | 29.3 | ||||||||||
Units shipped (in thousands) | 44,891 | 48,621 | (3,730 | ) | ||||||||||||
Net sales and operating income highlights were as follows:
Net sales grew $82.9 million from fiscal 2006 to $544.8 million primarily due to higher average selling prices ($75.2 million). Changes in the overall product mix and price of steel portable and refrigerantincreases in certain product lines to cover increased material costs were the primary reasons for the higher average selling prices. Volume increases, especially in the higher priced cylinders, in North America. Higher unitcontributed $7.7 million to net sales. Net sales in North America were offset by lowerincreased $28.8 million as most product lines showed increases over fiscal 2006. European revenues increased $54.1 million as a result of the continued strong market conditions for our steel high-pressure cylinders and the growth in air tank unit sales in Europe. Gross margin was slightly lower than infor truck braking applications.
Operating income increased over fiscal 2003 because2006 as a result of higher labor and manufacturing expenses in Europe and lower average selling pricesthe strong performances in North America partially offset by favorable pricing inand Europe. Operating income was minimallyEarnings were impacted by the favorable exchange rate. The previously mentioned factors decreaseda strategy implemented to cut costs, exit unprofitable product lines, introduce new product lines, consolidate facilities and grow profitable lines through capacity and geographic expansion over a several year period. These actions, combined with a strong overall sales effort, led to a 71% increase in operating income as a percentage of net sales to 8.9% inover fiscal 2004 from 10.0% in fiscal 2003.2006.
OthersOther
The “Other” category includes the Automotive Body Panels, Construction Services and Steel Packaging segments, which are immaterial for purposes of separate disclosure, and also includes income and expense items not allocated to the segments.
The following table presents a summary of operating results for the periods indicated:
| Fiscal Year Ended May 31 | ||||||||||||||||||
| Dollars in millions | 2007 | % of Net sales | 2006 | % of Net sales | Increase/ (Decrease) | |||||||||||||
Net sales | $ | 194.9 | 100.0 | % | $ | 152.9 | 100.0 | % | $ | 42.0 | ||||||||
Cost of goods sold | 174.2 | 89.4 | % | 137.4 | 89.9 | % | 36.8 | |||||||||||
Gross margin | 20.7 | 10.6 | % | 15.5 | 10.1 | % | 5.2 | |||||||||||
Selling, general and administrative expense | 22.4 | 11.5 | % | 15.7 | 10.3 | % | 6.7 | |||||||||||
Operating loss | $ | (1.7 | ) | -0.9 | % | $ | (0.2 | ) | -0.1 | % | $ | (1.5 | ) | |||||
Net sales and operating loss for this “Other” category was $1.0 million in fiscal 2004 compared to a loss of $10.0 million for fiscal 2003. This $9.0 million improvement is mainly due to a $4.3 million and a $2.7 million improvement in the Worthington Machine Technology (“WMT”) and the Steelpac operations, respectively. In fiscal 2003, management decided that WMT would stop servicing external customers and focus only on the internal needs of Worthington Industries. This decision resulted in the elimination in fiscal 2004 of the $2.6 million operating loss recorded in fiscal 2003 and also in fiscal 2003 we recorded a $1.7 million reserve for severance and other items. The fiscal 2004 operations of Steelpac improved by $2.0highlights were as follows:
Net sales increased $42.0 million over fiscal 2003. In addition, $0.7 million2006 primarily as a result of equipment was written-off by Steelpacincreased sales in the Construction Services and Automotive Body Panels segments. The Steel Packaging segment also realized a small increase in net sales over the same period in fiscal 2003.2006.
This category reported an increase in operating loss of $1.5 million compared to fiscal 2006. The Construction Services segment expenses were higher due to $1.6 million expense of a development project in China combined with the higher expenses from increased domestic activity. The Automotive Body Panels segment improved its operating income over fiscal 2006.
Liquidity and Capital Resources
Cash and cash equivalents for fiscal 2008 increased $35.5 million compared to the end of the same period last year. The following table summarizes consolidated cash flows.
| Fiscal Years Ended May 31, | ||||||||
Cash Flow Summary (in millions) | 2008 | 2007 | ||||||
Cash provided by operating activities | $ | 180.5 | $ | 180.4 | ||||
Cash used by investing activities | (70.7 | ) | (95.5 | ) | ||||
Cash used by financing activities | (74.3 | ) | (102.8 | ) | ||||
Increase (decrease) in cash and cash equivalents | 35.5 | (17.9 | ) | |||||
Cash and cash equivalents at beginning of period | 38.3 | 56.2 | ||||||
Cash and cash equivalents at end of period | $ | 73.8 | $ | 38.3 | ||||
We believe we have access to adequate resources to meet our needs for normal operating costs, capital expenditures, debt redemptions, dividend payments and working capital for our existing businesses. These resources include cash, cash equivalents, cash provided by operating activities, access to capital markets and unused lines of credit.
Operating activities
Cash flows from operating activities may fluctuate during the year and from year-to-year due to economic conditions. We rely on cash and short-term financing to meet increases in working capital needs. Cash requirements generally rise during periods of increasing economic activity or increasing raw material prices due to higher inventory volumes and/or cost and increased accounts receivable. During fiscal 2005, we generated $32.3economic slowdowns or periods of decreasing raw material prices, positive cash flow generally results from the reduction in the amount of and/or cost of inventories and lower levels of accounts receivable. This cash is typically used to reduce, or eliminate, short-term debt.
Net cash provided by operating activities was $180.5 million and $180.4 million in fiscal 2008 and fiscal 2007. Fiscal 2008 cash from operating activities. This wasneeds for inventory and accounts payable increases were affected by the resultlarge increase in steel cost in the second half of higher earningsfiscal 2008 versus fiscal 2007. Receivables decreased due to a $100.0 million increase in usage of our accounts receivable securitization facility, partially offset by the changes in inventory, accounts receivable, accountshigher selling prices. Accounts payable and accrued expenses. The increase in accounts receivable isincreased primarily due to a $60.0the higher steel prices for raw material. Also during fiscal 2008, distributions from our unconsolidated affiliates of $58.9 million decreasewere $72.8 million less than in the usage of our trade accounts receivable securitization (“TARS”) facility since May 31, 2004.
fiscal 2007. Consolidated net working capital was $392.9$440.1 million at May 31, 2005,2008, compared to $358.1$548.9 million at May 31, 2004. Contributing2007, primarily due to this increase was the $62.8a $103.8 million increase in inventories, which is attributed to higher steel prices over the same period. Also, accounts receivable rose $55.7short-term debt outstanding.
Investing activities
Net cash used by investing activities was $70.7 million reflecting the lower usage of the TARS facility, which was unused at May 31, 2005and $95.5 million in fiscal 2008 and fiscal 2007.
Capital expenditures by reportable segment represent cash used for investment in property, plant and equipment and are presented below:
| Fiscal Year Ended May 31, | ||||||
| In millions | 2008 | 2007 | ||||
Steel Processing | $ | 7.2 | $ | 14.0 | ||
Metal Framing | 6.8 | 15.7 | ||||
Pressure Cylinders | 16.5 | 14.1 | ||||
Other | 17.0 | 13.9 | ||||
| $ | 47.5 | $ | 57.7 | |||
The Steel Processing segment capital expenditures decreased in fiscal 2008 compared to the $60.0 million usagefiscal 2007, which had included a furnace upgrade at May 31, 2004. Assets held for saleour Spartan joint venture facility.
The Metal Framing segment capital expenditures decreased in fiscal 2008 compared to fiscal 2007 due to reduced spending for the collectionconversion of $80.4drywall metal framing lines to UltraSTEEL®.
Capital expenditures for the Other category increased $3.1 million from fiscal 2007 due primarily to increased expenditures related to our enterprise resource planning system.
In addition to capital expenditures, other significant investing activities in cash proceeds2008 included an aggregate of $47.6 million invested in our new joint ventures, Serviacero Worthington, Canessa Worthington and LEFCO Worthington, and $25.6 million received from the sale of short-term investments. Fiscal 2007 included the Decatur assets, which had been classified as assets held for sale at May 31, 2004. Current maturities of long-term debt increased $142.1$31.7 million due primarily to the pending maturity of our 7.125% notes in May 2006. We believe we have adequate liquidity to satisfy the payment obligation with cash from operations and availability under the revolving credit and TARS facilities.
Our primary investing and financing activities included $65.1 million for the acquisition of the Western Cylinder Assets, $56.9PSM, $25.6 million in dividend payments to shareholderspurchase of short-term investments, and $46.3$16.4 million in capital projects, including $13.3 million for our ERP system. We generated net cash in the amount of $89.5 million through the sale of assets, including the previously mentioned $80.4 million cash proceedsreceived from the sale and subsequent leaseback of the Decatur assets. We also generated $14.7 million in cash from the issuance of common shares through employee stock option exercises. We anticipate that our fiscal 2006 capital spending, excluding acquisitions will be somewhat greater than our annual depreciation expense. The capital spending for fiscal 2006 is expected to include approximately $20.0 million related to the ongoing implementation of our ERP system.
On December 17, 2004, we issued $100.0 million of unsecured Floating Rate Senior Notes due December 2014 (“2014 Notes”) through a private placement to provide long-term financing for the acquisition of the Western Cylinder Assets and other strategic initiatives including the ERP system. Through an interest rate swap executed in anticipation of the debt issuance, we achieved an effective fixed rate of 5.26% for the ten-year duration of the 2014 Notes. See “Item 8 – Financial Statements and Supplementary Data – Notes to Consolidated Financial Statements – Note C – Debt” for additional information.
A $435.0 million long-term revolving credit facility, the $100.0 million TARS facility, and $40.0 million in short-term uncommitted credit lines primarily serve our short-term liquidity needs. The revolving credit facility and the uncommitted credit lines were unused as of May 31, 2005 and 2004. The TARS facility was unused as of May 31, 2005, compared to usage of $60.0 million at May 31, 2004.
Our $435.0 million long-term revolving credit facility, provided by a group of 15 banks, matures in May 2007. In July 2004, we amended this facility to increase the borrowing limit from $235.0 million to $435.0 million and eliminate certain covenants. The issuance of the 2014 Notes and the increased revolving credit facility significantly enhance our flexibility related to the maturity of our 7.125% notes due in May 2006.
After the issuance of the 2014 Notes, we reduced the amount available under the TARS facility to $100.0 million from $190.0 million and extended the maturity date to January 2008. This will significantly reduce the costs associated with the unused portion of the TARS facility but keep it available should we have a need for it in the future.
Uncommitted lines of credit are extended to us on a discretionary basis. Because the outstanding principal amounts can be adjusted daily, these uncommitted lines typically provide us with the greatest amount of funding flexibility compared to our other sources of short-term capital.
At May 31, 2005, our total debt was $388.4 million compared to $289.8 million at the end of fiscal 2004. Our debt to total capitalization ratio was 32.1% at fiscal year end 2005, up from 29.9% at the end of fiscal 2004.
The Company announced on June 13, 2005, that its board of directors authorized the repurchase of up to ten million, or approximately 11%, of its outstanding common shares. The purchases would be made from time to time, on the open market or in private transactions, with consideration given to the market price of the stock, the nature of other investment opportunities, cash flows from operations and general economic conditions.
corporate aircraft.
We assess acquisition opportunities as they arise. Additional financingarise, which may be required if we decide to makerequire additional acquisitions.financing. There can be no assurance, however, that any such opportunities will arise, that any such acquisitions will be consummated, or that any needed additional financing will be available on satisfactory terms when required. Absent any
Financing activities
Long-term debt - Our senior unsecured long-term debt is rated “investment grade” by both Moody’s Investors Service, Inc. (Baa2) and Standard & Poor’s Ratings Group (BBB). We typically use the net proceeds from long-term debt for acquisitions, refinancing outstanding debt, capital expenditures and general corporate purposes. As of May 31, 2008, we were in compliance with our long-term debt covenants and expect to remain compliant in the future. Our long-term debt agreements do not include ratings triggers or material adverse change provisions.
Short-term debt - On May 6, 2008, we amended our $435.0 million five-year revolving credit facility, which had been due to expire on September 29, 2010. The amendment extended the commitment date to May 6, 2013, except for a $35.0 million commitment by one lender that will expire September 29, 2010. In addition, the amendment increased the facility fees and applicable percentage for base rate and Eurodollar loans payable. Borrowings under this facility have maturities of less than one year. We also have a $100.0 million revolving trade accounts receivable securitization facility as well as $40.0 million of uncommitted credit lines available at the discretion of several banks. These facilities were established with major domestic banks. We had $125.5 million and $21.7 million of committed borrowings, $100.0 million and $0.0 million of
securitization facility usage, and $10.0 million and $10.0 million of uncommitted borrowings outstanding at May 31, 2008 and 2007. We also provided $9.1 million in letters of credit for third parties as of May 31, 2008.
We were in compliance with our short-term debt covenants at May 31, 2008. Our short-term debt agreements do not include ratings triggers or material adverse change provisions.
Common shares - We maintained our quarterly dividend during fiscal 2008 at $0.17 per common share. We paid dividends on our common shares of $55.6 million and $59.0 million in fiscal 2008 and fiscal 2007. We currently have no material contractual or regulatory restrictions on the payment of dividends.
At its meeting on September 27, 2006, the Board of Directors of Worthington reconfirmed its authorization to repurchase up to 10,000,000 of Worthington’s outstanding common shares, which had initially been announced on June 13, 2005. This repurchase authorization was completed during December 2007. On September 26, 2007, Worthington announced that the Board of Directors had authorized the repurchase of up to an additional 10,000,000 of Worthington’s outstanding common shares. A total of 9,099,500 common shares remained available under this repurchase authorization as of May 31, 2008. The common shares available for purchase under this authorization may be purchased from time to time, with consideration given to the market price of the common shares, the nature of other acquisitions, we anticipate thatinvestment opportunities, cash flows from operations and unused borrowing capacity shouldgeneral economic conditions. Repurchases may be sufficient to fund expected normal operating costs, dividends, workingmade on the open market or through privately negotiated transactions. During fiscal 2008 and fiscal 2007, we spent $125.8 million and $76.6 million, respectively, on common share repurchases.
Dividend Policy
Dividends are declared at the discretion of the Board of Directors of Worthington. The Board reviews the dividend quarterly and establishes the dividend rate based upon our financial condition, results of operations, capital capital expenditures,requirements, current and projected cash flows, business prospects and other relevant factors. While we have paid a dividend every quarter since becoming a public company in 1968, there is no guarantee that this will continue in the payment of our 7.125% notes.future.
Contractual Cash Obligations and Other Commercial Commitments
The following table summarizes our contractual cash obligations as of May 31, 2005.2008. Certain of these contractual obligations are reflected on our consolidated balance sheet, while others are disclosed as future obligations under accounting principles generally accepted in the United States.
| Payments Due by Period | Payments Due by Period | |||||||||||||||||||||||||||||
| In millions | Total | Less Than 1 Year | 1 - 3 Years | 4 - 5 Years | After 5 Years | Total | Less Than 1 Year | 1 - 3 Years | 4 - 5 Years | After 5 Years | ||||||||||||||||||||
Notes payable | $ | 135.5 | $ | 135.5 | $ | - | $ | - | $ | - | ||||||||||||||||||||
Long-term debt | $ | 388.4 | $ | 143.4 | $ | — | $ | 145.0 | $ | 100.0 | 245.0 | - | 145.0 | - | 100.0 | |||||||||||||||
Interest expense on long-term debt | 112.1 | 25.2 | 30.1 | 30.1 | 26.7 | 56.8 | 15.1 | 20.4 | 10.7 | 10.6 | ||||||||||||||||||||
Capital lease obligations | — | — | — | — | — | |||||||||||||||||||||||||
Operating leases | 57.3 | 7.5 | 14.8 | 12.4 | 22.6 | 47.8 | 10.7 | 17.8 | 12.4 | 6.9 | ||||||||||||||||||||
Unconditional purchase obligations | 33.1 | 2.4 | 4.7 | 4.7 | 21.3 | 26.0 | 2.4 | 4.7 | 4.7 | 14.2 | ||||||||||||||||||||
Other long-term obligations | — | — | — | — | — | |||||||||||||||||||||||||
Total contractual cash obligations | $ | 590.9 | $ | 178.5 | $ | 49.6 | $ | 192.2 | $ | 170.6 | $ | 511.1 | $ | 163.7 | $ | 187.9 | $ | 27.8 | $ | 131.7 | ||||||||||
The interest expense on long-term debt is computed by using the fixed rates of interest on the debt including the interest rate swap hedge. The unconditional purchase obligations are to secure access to a facility used to regenerate acid used in our Steel Processing facilities through fiscal 2019. Due to the uncertainty regarding the timing of future cash outflows associated with our unrecognized tax benefits of $2.1 million, we are unable to make a reliable estimate of the periods of cash settlement with the respective tax authorities and have not included such amount in the contractual obligations table above.
The following table summarizes our other commercial commitments as of May 31, 2005.2008. These commercial commitments are not reflected on our consolidated balance sheet.
| Commitment Expiration per Period | |||||||||||||||
| In millions | Total | Less Than 1 Year | 1 - 3 Years | 4 - 5 Years | After 5 Years | ||||||||||
Lines of credit | $ | 435.0 | $ | — | $ | 435.0 | $ | — | $ | — | |||||
Standby letters of credit | 11.6 | 11.6 | — | — | — | ||||||||||
Guarantees | 5.1 | 5.1 | — | — | — | ||||||||||
Standby repurchase obligations | — | — | — | — | — | ||||||||||
Other commercial commitments | — | — | — | — | — | ||||||||||
Total commercial commitments | $ | 451.7 | $ | 16.7 | $ | 435.0 | $ | — | $ | — | |||||
| Commitment Expiration by Period | |||||||||||||||
| In millions | Total | Less Than 1 Year | 1 - 3 Years | 4 - 5 Years | After 5 Years | ||||||||||
Guarantees | $ | 6.3 | $ | 6.3 | $ | - | $ | - | $ | - | |||||
Standby letters of credit | 9.1 | 9.1 | - | - | - | ||||||||||
Total commercial commitments | $ | 15.4 | $ | 15.4 | $ | - | $ | - | $ | - | |||||
Off Balance Sheet Arrangements
We maintain a $100.0 million revolving trade accounts receivable securitization facility which expires in January 2011. Pursuant to the terms of the facility, certain of our subsidiaries sell their accounts receivable, on a revolving basis, to Worthington Receivables Corporation (“WRC”), a wholly-owned, consolidated, bankruptcy-remote subsidiary. In turn, WRC may sell, on a revolving basis, up to $100.0 million of undivided ownership interests in this pool of accounts receivable to independent third parties. We retain an undivided interest in this pool and are subject to risk of loss based on the collectability of the receivables from this retained interest. Because the amount eligible to be sold excludes receivables more than 90 days past due, receivables offset by an allowance for doubtful accounts because of bankruptcy or other cause, receivables from foreign customers, concentrations over limits with specific customers and certain reserve amounts, we believe additional risk of loss is minimal. The Company had no material off-balance sheet arrangements atbook value of the retained portion of the pool of accounts receivable approximates fair value. As of May 31, 2005.
2008, $100.0 million of undivided ownership interests in this pool of accounts receivable had been sold.
Recently Issued Accounting Standards
In November 2004,September 2006, the Financial Accounting StandardStandards Board (“FASB”) issued Statement of Financial Accounting Standards (“SFAS”) No. 157,Fair Value Measurements, to establish a framework for measuring fair value and expand disclosures about fair value measurements. SFAS No. 151,Inventory Costs (“SFAS 151”). SFAS 151 amends the guidance in ARB No. 43, Chapter 4,Inventory Pricing to clarify the accounting for abnormal amounts of idle facility expense, freight, handling cost and wasted material (spoilage). In addition, SFAS 151 requires that allocation of fixed production overhead to the costs of conversion be based on the normal capacity of the production facilities. SFAS 151157 is effective for inventory costs incurred during fiscal years beginningfinancial assets and liabilities after June 15, 2005. We are in the process of evaluating theMay 31, 2008, and for non-financial assets and liabilities after May 31, 2009. SFAS No. 157 is not expected to materially impact of SFAS 151 on our consolidated financial position andor results of operations.
In December 2004,September 2006, the FASB issued SFAS No. 153,158,Exchanges of Non-monetary Assets, Employers’ Accounting for Defined Benefit Pension and Other Postretirement Plans—an amendment of APB OpinionFASB Statements No. 2987, 88, 106, and 132(R) (“, to improve financial reporting regarding defined benefit pension and other postretirement plans. We adopted the recognition provisions of SFAS 153”).APB Opinion No. 29 is based on the principle that exchanges158 at May 31, 2007. The measurement date provision of non-monetary assets should be measured by the fair value of the assets exchanged. The guidance in that Opinion, however,
included certain exceptions to that principle. SFAS 153 amends APB Opinion No. 29 to eliminate the exception for non-monetary exchanges of similar productive assets and replaces it with a general exception for exchanges of non-monetary assets that do not have commercial substance. SFAS 153158 is effective for non-monetary exchanges occurring in fiscal periods beginning after June 15, 2005. We doat May 31, 2009, and is not expect the adoption of SFAS 153expected to have a materialmaterially impact on our consolidated financial position or results of operations.
In December 2004,February 2007, the FASB issued SFAS No. 123 (revised 2004),159,Share-Based Payment(“SFAS 123(R)”).SFAS 123(R) is a revisionThe Fair Value Option for Financial Assets and Financial Liabilities - Including an amendment of SFAS 123FASB Statement No. 115,to improve financial reporting by providing entities with the opportunity to mitigate volatility in reported earnings caused by measuring related assets and it supercedes APB No. 25 and amendsliabilities differently through the use of fair value measurements. SFAS No. 95,Statement of Cash Flows.Generally, the approach in SFAS 123(R) is similar to the approach described in SFAS 123. However, SFAS 123(R) requires all share-based payments to employees, including grants of employee stock options, to be recognized in the income statement based on their fair values. Proforma disclosure will not be an alternative. SFAS 123(R)159 is effective for all fiscal years beginning after June 15, 2005,1, 2008, and thus will become effective for the Company beginning in fiscal 2007. Early adoption will be permitted in periods in which financial statements have not yet been issued.
SFAS 123(R) permits public companies to choose between the following two adoption methods:
1. A “modified prospective” method in which compensation cost is recognized beginning with the effective date (a) based on the requirements of SFAS 123(R) for all share-based payments granted after the effective date and (b) based on the requirements of SFAS 123 for all awards granted to employees prior to the effective date of SFAS 123(R) that remain unvested on the effective date.
2. A “modified retrospective” method which includes the requirements of the modified prospective method described above, but also permits entities to restate based on the amounts previously recognized under SFAS 123 for purposes of pro forma disclosures either (a) all prior periods presented or (b) prior interim periods of the year of adoption.
The adoption of SFAS 123(R)’s fair value method will have an impact on our result of operations, although it will have no impact on our overall financial position. Stock option expense after the adoption of SFAS 123(R) is not expected to be materially different thanimpact our consolidated financial position or results of operations.
In December 2007, the expense reportedFASB issued SFAS No. 141 (revised 2007) (“SFAS No. 141(R)”),Business Combinations,to improve the relevance, representational faithfulness and comparability of the information that a reporting entity provides in “Item 8 – Financial Statementsits financial reports about a business combination and Supplementary Data – Notesits effects. SFAS No. 141(R) applies prospectively to business combinations after May 31, 2009, and is not expected to materially impact our consolidated financial position or results of operations.
In December 2007, the FASB issued SFAS No. 160,Noncontrolling Interests In Consolidated Financial Statements – Note A – Summary- an amendment of Significant Accounting Policies,” but this will not be known until a full analysisARB No. 51,to improve the relevance, comparability and transparency of the impactfinancial information that a reporting entity provides in its consolidated financial statements by establishing accounting and reporting standards for the noncontrolling interest (minority interest) in a subsidiary and for the deconsolidation of a subsidiary. SFAS 123(R)No. 160 is completed. The impacteffective June 1, 2009, and will largely depend on levels of share-based payments grantedrequire a change in the future.
On March 29, 2005, the Securities and Exchange Commission (“SEC”) issued Staff Accounting Bulletin No. 107 (“SAB 107”). SAB 107 provides interpretations expressing the viewspresentation of the SEC staff regardingminority interest in the interaction betweenconsolidated financial statements.
In March 2008, the FASB issued SFAS 123(R)No. 161,Disclosures about Derivative Instruments and certain SEC rulesHedging Activities - an amendment of FASB Statement No. 133,to improve the transparency of financial reporting by requiring enhanced disclosures about derivative and regulations, and provides the staff’s views regarding the valuation of share-based payment arrangements for public companies. SAB 107 does not modify any ofhedging activities. SFAS 123(R)’s conclusions or requirements.
No. 161 is effective December 1, 2008.
Environmental
We believe environmental issues will not have a material effect on capital expenditures, future results of operations or financial position.
Inflation
The effects of inflation on our operations were not significant during the periods presented in the consolidated financial statements.
Critical Accounting Policies
The discussion and analysis of our financial condition and results of operations are based upon our consolidated financial statements, which have been prepared in accordance with accounting principles generally accepted in the United States. The preparation of these consolidated financial statements requires us to make estimates and assumptions that affect the reported amounts of assets and liabilities and the disclosure of contingent assets and
liabilities at the date of the consolidated financial statements and the reported amounts of revenues and expenses during the reporting period.periods. We continually evaluate our estimates, including those related to our allowance for doubtful accounts,valuation of receivables, intangible assets, accrued liabilities, income and other tax accruals, and contingencies and litigation. We base our estimates on historical experience and various other assumptions that we believe to be reasonable under the circumstances. These results form the basis for making judgments about the carrying values of assets and liabilities that are not readily apparent from other sources. Critical accounting policies are defined as those that reflect our significant judgments and uncertainties that could potentially result in materially different results under different assumptions and conditions. Although actual results historically have not deviated significantly from those determined using our estimates, as discussed below, our financial position or results of operations could be materially different if we were to report under different conditions or to use different assumptions in the application of such policies. We believe the following accounting policies are the most critical to us since these are the primary areas where financial information is subject to our estimates, assumptions and judgment in the preparation of our consolidated financial statements.
Revenue Recognition:We recognize revenue upon transfer of title and risk of loss provided evidence of an arrangement exists, pricing is fixed and determinable, and collectibilitythe ability to collect is probable. In circumstances where the collection of payment is highly questionable at the time of shipment, we defer recognition of revenue until payment is collected. We provide an allowance for returns based on experience and current customer activities. As of May 31, 2008 and May 31, 2007, we had deferred $9.1 million and $2.4 million, respectively, of revenue related to pricing disputes.
Within our Construction Services segment, which represented less than 4.0% of consolidated net sales for each of the last three fiscal years, revenue is recognized on a percentage-of-completion method.
Receivables:We review our receivables on a monthlyan ongoing basis to ensure that they are properly valued and collectible. This is accomplished through two contra-receivable accounts: returns and allowances and allowance for doubtful accounts. Returns and allowances are used to record estimates of returns or other allowances resulting from quality, delivery, discounts or other issues affecting the value of receivables. This account is estimated based on historical trends and current market conditions, with the offset recorded to net sales.
The allowance for doubtful accounts is used to record the estimated risk of loss related to the customers’ abilityinability to pay. This allowance is maintained at a level that we consider appropriate based on factors that affect collectibility,collectability, such as the financial health of the customer, historical trends of charge-offs and recoveries, and current and projected economic and market conditions. As we monitor our receivables, we identify customers that may have a problem paying,payment problems, and we adjust the allowance accordingly, with the offset to SG&A expense.
Fluctuating steel prices have increased the risk of collectibility. We have evaluated this risk and have made appropriate adjustments to these two allowance accounts. While we believe these allowances are adequate, deteriorationchanges in economic conditions, or the financial health of customers, and bankruptcy settlements could adversely impact our future earnings.
Impairment of Long-Lived AssetsAssets:: We review the carrying value of our long-lived assets, including intangible assets, whenever events or changes in circumstances indicate that the carrying value of an asset or a group of assets may not be recoverable. Accounting standards require an impairment charge to be recognized in the financial statements if the carrying amount of an asset or group of assets exceeds the undiscounted cash flows generated by that asset or group of assets would generate.assets. The loss recognized would be the difference between the fair value and the carrying amount of the asset or group of assets.
Annually, during our fiscal fourth quarter, we review goodwill for impairment using the present value technique to determine the estimated implied fair value of goodwill associated with each reporting entity. There are three significant sets of values used to determine the implied fair value: estimated future discounted cash flows, capitalization raterates and tax rates. The estimated future discounted cash flows used in the model are based on planned growth with an assumed perpetual growth rate. The capitalization rate is based on our current cost of debt and equity capital. Tax rates are maintained at current levels.
Accounting for Derivatives and Other Contracts at Fair Value:We use derivatives in the normal course of business to manage our exposure to fluctuations in commodity prices, foreign currency and interest rates. These derivatives are based on quoted market values. These estimates are based upon valuation methodologies deemed appropriate in the circumstances; however, the use of different assumptions could affect the estimated fair values.
Stock-Based Compensation:We currently accountEffective June 1, 2006, we adopted SFAS No. 123 (revised 2004),Share-Based Payment(“SFAS 123(R)”). SFAS 123(R) requires all share-based payments to employees, including grants of employee stock options, to be recorded as expense in the statement of earnings based on their fair values. For the periods prior to June 1, 2006, we accounted for employee and non-employee stock option plans under the recognition and measurement principles of Accounting Principles Board (“APB”)APB Opinion No. 25,
Accounting for Stock Issued to Employees, and the related interpretations. Nointerpretations.No stock-based employee compensation cost iscosts for the prior fiscal periods were reflected in net earnings, as all options granted under our plans had an exercise price equal to the fair market value of the underlying stockcommon shares on the grant date. Beginning in fiscal 2007, we will be required to record an expense for our stock-based compensation plans using the fair value method. Had we accounted for stock-based compensation plans using thethis fair value method, prescribed in SFAS No. 123(R), we estimate that diluted earnings per share would have been reduced by $0.03 per share in fiscal 2005, $0.02 in fiscal 2004 and $0.01 in fiscal 2003. See “Item 8. – Financial Statements and Supplementary Data – Note A – Summary of Significant Accounting Policies – Stock-Based Compensation” and “Item 8. – Financial Statements and Supplementary Data – Note F – Stock-Based Compensation” for a more detailed presentation of accounting for stock-based compensation plans.2006.
Income Taxes: In accordance with the provisions of SFAS No. 109,Accounting for Income Taxes, we account for income taxes using the asset and liability method. The asset and liability method requires the recognition of deferred tax assets and liabilities for expected future tax consequences of temporary differences that currently exist between the tax basesbasis and financial reporting basesbasis of our assets and liabilities. In assessing the realizability of deferred tax assets, we consider whether it is more likely than not that some, or
a portion, of the deferred tax assets will not be realized. We provide a valuation allowance for deferred income tax assets when, in our judgment, based upon currently available information and other factors, it is more likely than not that a portion of such deferred income tax assets will not be realized. The determination of the need for a valuation allowance is based on an on-going evaluation of current information including, among other things, estimates of future earnings in different tax jurisdictions and the expected timing of deferred income tax asset reversals. We believe that the determination to record a valuation allowance to reduce deferred income tax assets is a critical accounting estimate because it is based on an estimate of future taxable income in the United States,various tax jurisdictions in which we do business, which is susceptible to change and may or may not occur, and because the impact of adjusting a valuation allowance may be material.
In June 2006, the FASB issued FASB Interpretation No. 48,Accounting for Uncertainty in Income Taxes - an interpretation of FASB Statement No. 109 (“FIN 48”). The interpretation addresses the determination of whether tax benefits claimed, or expected to be claimed, on a tax return should be recorded in the financial statements. Under FIN 48, a tax benefit may be recognized from an uncertain tax position only if it is more likely than not that the tax position will be sustained on examination by the taxing authorities, including resolution of any related appeals or litigation processes, based on the technical merits of the position. The tax benefits recognized in the financial statements from such a position should be measured based on the largest benefit that has a greater than fifty percent likelihood of being realized upon ultimate settlement. FIN 48 also provides guidance on income tax related issues such as derecognition, classification, interest and penalties, accounting treatment in interim periods and increased disclosure requirements.
We have a reservereserves for taxes and associated interest and penalties that are determined in accordance with FIN 48, that may become payable in future years as a result of audits by taxing authorities. While we believe the positions taken on previously filed tax returns are appropriate, we have established the tax and interest reserves in recognition that various taxing authorities may challenge our positions. The tax and interest reserves are analyzed periodically, and adjustments are made as events occur to warrant adjustment to the reserve,reserves, such as lapsing of applicable statutes of limitations, conclusion of tax audits, additional exposure based on current calculations, identification of new issues, release of administrative guidance or court decisions affecting a particular tax issue.
Self-Insurance Reserves:We are largely self-insured with respect to workersworkers’ compensation, general and auto liability, andproperty damage, employee medical claims.claims and other potential losses. In order to reduce risk and better manage overall loss exposure, we purchase stop-loss insurance that covers individual claims in excess of the deductible amounts. We maintain an accrualreserves for the estimated cost to settle open claims as well as an estimate of the cost of claims that have been incurred but not reported. These estimates are based on actuarial valuations that take into consideration valuations provided by third-party actuaries, the historical average claim volume, the average cost for settled claims, current trends in claim costs, changes in our business and workforce, general economic factors and other assumptions believed to be reasonable under the circumstances. The estimated accrualsreserves for these liabilities could be affected if future occurrences and claims differ from assumptions used and historical trends. These accruals are reviewedFacility consolidations, a focus on investment in safety initiatives, and an emphasis on property loss prevention and product quality, have resulted in an improvement in our loss history and the related assumptions used to analyze the property and casualty insurance reserves. This improvement resulted in reductions to these reserves of $5.3 million in fiscal 2008 and $3.6 million in fiscal 2007. We will continue to review these reserves on a quarterly basis, or more frequently if factors dictate a more frequent review is warranted.
The critical accounting policies discussed herein are not intended to be a comprehensive list of all of our accounting policies. In many cases, the accounting treatment of a particular transaction is specifically dictated by accounting principles generally accepted in the United States, with no need for our judgment in their application. There are also areas in which our judgment in selecting an available alternative would not produce a materially different result. See “Item 8. – Financial Statements and Supplementary Data – Note A – Summary of Significant Accounting Policies.”
Item 7A. –— Quantitative and Qualitative Disclosures About Market Risk
In the normal course of business, we are exposed to various market risks. We continually monitor these risks and regularly develop appropriate strategies to manage them. Accordingly, from time to time, we may enter into certain derivative financial and commodity instruments. These instruments are used solely to mitigate market exposure and are not used for trading or speculative purposes.
Interest Rate Risk
We entered into an interest rate swap in October 2004, which was amended December 17, 2004. The swap had a notional amount of $100$100.0 million to hedge changes in cash flows attributable to changes in the LIBOR rate associated with the December 17, 2004, issuance of the unsecured Floating Rate Senior Notes due December 17, 2014. See “Item 8 – Financial Statements and Supplementary Data – Notes to Consolidated Financial Statements – Note C – Debt.”Debt” of this Annual Report on Form 10-K. The critical terms of the derivative correspond with the critical terms of the underlying exposure. The interest rate swap was executed with a highly rated financial institution.institution, therefore, no credit loss is anticipated. We pay a fixed rate of 4.46% and receive a variable rate based on six-month LIBOR. A sensitivity analysis of changes in the interest rate yield curve associated with our interest rate swap indicates that a 10% parallel decline in the yield curve would reduce the fair value of our interest rate swap by $3.5$2.3 million.
A sensitivity analysis of changes in the interest rates on our variable rate debt indicates that a 10% increase in those rates would not have materially impacted our net earnings.
Foreign Currency Risk
The translation of our foreign operations from their local currencies tointo United States dollars subjects the U.S. dollar subjects usCompany to exposure related to fluctuating exchange rates. We doDerivative instruments are not use derivative instrumentsused to manage this risk. However, we dorisk; however, the Company does make limited use of forward contracts to manage our exposure to certain intercompanyinter-company loans with our foreign affiliates. Such contracts limit our exposure to both favorable and unfavorable currency fluctuations. At May 31, 2005,2008, the difference between the contract and book value was not material to ourthe Company’s consolidated financial position, results of operations or cash flows. We do not expect that aA 10% change in the exchange rate to the U.S. dollar forward rate wouldis not expected to materially impact our consolidated financial position, results of operations, or cash flows. A sensitivity analysis of changes in the U.S. dollar on these foreign currency-denominated contracts indicates that if the U.S. dollar uniformly weakened by 10% against all of ourthese currency exposures, the fair value of these instruments would decrease by $5.1$6.3 million. Any resulting changes in fair value would be offset by changes in the underlying hedged balance sheet position. A sensitivity analysis of changes in the currency exchange rates of our foreign locations indicates that a 10% increase in those rates would not have materially impacted our net earnings. The sensitivity analysis assumes a paralleluniform shift in all foreign currency exchange rates. The assumption that exchange rates change in paralleluniformity may overstate the impact of changing exchange rates on assets and liabilities denominated in a foreign currency.
Commodity Price Risk
We are exposed to market risk for price fluctuations on purchases of steel, natural gas, zinc (see additional information below regarding natural gas and zinc) and other raw materials and utility requirements. We attemptThe Company attempts to negotiate the best prices for our commodities and to competitively price our products and services to reflect the fluctuations in market prices.
We selectively use derivative Derivative financial instruments are used to manage a portion of our exposure to fluctuations in the cost of our supply ofzinc and natural gas and zinc.gas. These contracts cover periods commensurate with known or expected exposures through calendar 2008. We do not hold anyNo derivatives are held for trading purposes. No credit loss is anticipated, as the counterparties to these agreements are major financial institutions that are highly rated. The derivatives are classified as cash flow hedges. The effective portions of the changes in the fair values of these derivatives are recorded in other comprehensive income and are reclassified to cost of goods sold in the period in which earnings are impacted by the hedged items or in the period that the transaction no longer qualifies as a cash flow hedge. There were no transactions that ceased to qualify as a cash flow hedge in fiscal 2005. In September 2004, we entered into additional commodity derivative contracts to further hedge our exposure to natural gas prices.
A sensitivity analysis of changes in the price of hedged commodities indicates that a 10% decline in zinc prices would reduce the fair value of our hedge position by $2.2$0.3 million. A similar 10% decline in natural gas prices would reduce the fair value of ourthe natural gas hedge position by $1.3$0.2 million. Any resulting changes in fair value would be recorded as adjustments to other comprehensive income.
Notional transaction amounts and fairFair values for ourthe outstanding derivative positions as of May 31, 20052008, and 2004,2007, are summarized below. Fair values of the derivatives do not consider the offsetting underlying hedged item.
| May 31, 2005 | May 31, 2004 | Change In | |||||||||||||||
| In millions | Notional Amount | Fair Value | Notional Amount | Fair Value | |||||||||||||
Zinc | $ | 15.5 | $ | 5.7 | $ | 21.2 | $ | 5.0 | $ | 0.7 | |||||||
Natural gas | 10.1 | 2.5 | 4.1 | 1.4 | 1.1 | ||||||||||||
Interest rate | 100.0 | (1.0 | ) | — | — | (1.0 | ) | ||||||||||
| Fair Value At May 31, | Change In Fair Value | ||||||||||
| In millions | 2008 | 2007 | |||||||||
Zinc | $ | 3.1 | $ | 18.9 | $ | (15.8 | ) | ||||
Natural gas | 1.5 | 2.2 | (0.7 | ) | |||||||
Interest rate | (0.3 | ) | 5.8 | (6.1 | ) | ||||||
| $ | 4.3 | $ | 26.9 | $ | (22.6 | ) | |||||
Safe Harbor
Our quantitativeQuantitative and qualitative disclosures about market risk include forward-looking statements with respect to management’s opinion about risks associated with ourthe use of derivative instruments. These statements are based on certain assumptions with respect to market prices and industry supply of, and demand for, steel products and certain raw materials. To the extent these assumptions prove to be inaccurate, future outcomes with respect to our hedging programs may differ materially from those discussed in the forward-looking statements.
This page intentionally left blank
Item 8. –— Financial Statements and Supplementary Data
Report of Independent Registered Public Accounting Firm
The Board of Directors and ShareholdersStockholders
Worthington Industries, Inc.:
We have audited the accompanying consolidated balance sheets of Worthington Industries, Inc. and subsidiaries as of May 31, 20052008 and 2004,2007, and the related consolidated statements of earnings, shareholders’ equity, and cash flows for each of the years in the three-year period ended May 31, 2005.2008. In connection with our audits of the consolidated financial statements, we also have also audited the financial statementstatements schedule of valuation and qualifying accounts. These consolidated financial statements and financial statement schedule are the responsibility of the Company’s management. Our responsibility is to express an opinion on these consolidated financial statements and financial statement schedule based on our audits.
We conducted our audits in accordance with the standards of the Public Company Accounting Oversight Board (United States). Those standards require that we plan and perform the audit to obtain reasonable assurance about whether the financial statements are free of material misstatement. An audit includes examining, on a test basis, evidence supporting the amounts and disclosures in the financial statements. An audit also includes assessing the accounting principles used and significant estimates made by management, as well as evaluating the overall financial statement presentation. We believe that our audits provide a reasonable basis for our opinion.
In our opinion, the consolidated financial statements referred to above present fairly, in all material respects, the financial position of Worthington Industries, Inc. and subsidiaries as of May 31, 20052008 and 2004,2007, and the results of their operations and their cash flows for each of the years in the three-year period ended May 31, 2005,2008, in conformity with U.S. generally accepted accounting principles. Also in our opinion, the related financial statement schedule, when considered in relation to the basic consolidated financial statements taken as a whole, presents fairly, in all material respects, the information set forth therein.
As discussed in Note A to the consolidated financial statements, effective June 1, 2006, Worthington Industries, Inc. and subsidiaries adopted the provisions of Statement of Financial Accounting Standards No. 123 (revised 2004),Share-Based Payment.
We also have audited, in accordance with the standards of the Public Company Accounting Oversight Board (United States), the effectiveness of Worthington Industries, Inc. and subsidiaries’’s internal control over financial reporting as of May 31, 2005,2008, based on criteria established inInternal Control—Control – Integrated Framework issued by the Committee of Sponsoring Organizations of the Treadway Commission (COSO), and our report dated August 12, 2005July 30, 2008 expressed an unqualified opinion on management’s assessmentthe effectiveness of and the effective operation of,Company’s internal control over financial reporting.
/s/ KPMG LLP |
Columbus, Ohio
August 12, 2005
Report of Independent Registered Public Accounting Firm
The Board of Directors and Shareholders
Worthington Industries, Inc.:
We have audited management’s assessment, included in the accompanying Annual Report of Management on Internal Control over Financial Reporting that Worthington Industries, Inc. and subsidiaries maintained effective internal control over financial reporting as of May 31, 2005, based on criteria established in Internal Control—Integrated Framework issued by the Committee of Sponsoring Organizations of the Treadway Commission (COSO). Worthington Industries, Inc. and subsidiaries’ management is responsible for maintaining effective internal control over financial reporting and for its assessment of the effectiveness of internal control over financial reporting. Our responsibility is to express an opinion on management’s assessment and an opinion on the effectiveness of the Company’s internal control over financial reporting based on our audit.
We conducted our audit in accordance with the standards of the Public Company Accounting Oversight Board (United States). Those standards require that we plan and perform the audit to obtain reasonable assurance about whether effective internal control over financial reporting was maintained in all material respects. Our audit included obtaining an understanding of internal control over financial reporting, evaluating management’s assessment, testing and evaluating the design and operating effectiveness of internal control, and performing such other procedures as we considered necessary in the circumstances. We believe that our audit provides a reasonable basis for our opinion.
A company’s internal control over financial reporting is a process designed to provide reasonable assurance regarding the reliability of financial reporting and the preparation of financial statements for external purposes in accordance with generally accepted accounting principles. A company’s internal control over financial reporting includes those policies and procedures that (1) pertain to the maintenance of records that, in reasonable detail, accurately and fairly reflect the transactions and dispositions of the assets of the company; (2) provide reasonable assurance that transactions are recorded as necessary to permit preparation of financial statements in accordance with generally accepted accounting principles, and that receipts and expenditures of the company are being made only in accordance with authorizations of management and directors of the company; and (3) provide reasonable assurance regarding prevention or timely detection of unauthorized acquisition, use, or disposition of the company’s assets that could have a material effect on the financial statements.
Because of its inherent limitations, internal control over financial reporting may not prevent or detect misstatements. Also, projections of any evaluation of effectiveness to future periods are subject to the risk that controls may become inadequate because of changes in conditions, or that the degree of compliance with the policies or procedures may deteriorate.
In our opinion, management’s assessment that Worthington Industries, Inc. and subsidiaries maintained effective internal control over financial reporting as of May 31, 2005, is fairly stated, in all material respects, based on criteria established in Internal Control—Integrated Framework issued by the Committee of Sponsoring Organizations of the Treadway Commission (COSO).Also, in our opinion, Worthington Industries, Inc. and subsidiaries maintained, in all material respects, effective internal control over financial reporting as of May 31, 2005, based on criteria established in Internal Control—Integrated Framework issued by the Committee of Sponsoring Organizations of the Treadway Commission (COSO).
We also have audited, in accordance with the standards of the Public Company Accounting Oversight Board (United States), the consolidated balance sheets of Worthington Industries, Inc. and subsidiaries as of May 31, 2005 and 2004, and the related consolidated statements of earnings, shareholders’ equity, and cash flows for each of the years in the three-year period ended May 31, 2005, and our report dated August 12, 2005 expressed an unqualified opinion on those consolidated financial statements.
Columbus, Ohio
August 12, 2005July 30, 2008
WORTHINGTON INDUSTRIES, INC.
CONSOLIDATED BALANCE SHEETS
(Dollars in thousands)
| May 31, | ||||||||
| 2005 | 2004 | |||||||
| ASSETS | ||||||||
Current assets: | ||||||||
Cash and cash equivalents | $ | 57,249 | $ | 1,977 | ||||
Receivables, less allowances of $11,225 and $6,870 at May 31, 2005 and 2004 | 404,506 | 348,833 | ||||||
Inventories: | ||||||||
Raw materials | 227,718 | 185,426 | ||||||
Work in process | 97,168 | 97,007 | ||||||
Finished products | 100,837 | 80,473 | ||||||
| 425,723 | 362,906 | |||||||
Assets held for sale | 4,644 | 95,571 | ||||||
Deferred income taxes | 19,490 | 3,963 | ||||||
Prepaid expenses and other current assets | 26,721 | 19,860 | ||||||
Total current assets | 938,333 | 833,110 | ||||||
Investments in unconsolidated affiliates | 136,856 | 109,040 | ||||||
Goodwill | 168,267 | 117,769 | ||||||
Other assets | 33,593 | 27,826 | ||||||
Property, plant and equipment: | ||||||||
Land | 20,632 | 20,456 | ||||||
Buildings and improvements | 231,651 | 222,258 | ||||||
Machinery and equipment | 801,289 | 768,160 | ||||||
Construction in progress | 18,124 | 6,452 | ||||||
| 1,071,696 | 1,017,326 | |||||||
Less accumulated depreciation | 518,740 | 461,932 | ||||||
| 552,956 | 555,394 | |||||||
Total assets | $ | 1,830,005 | $ | 1,643,139 | ||||
| LIABILITIES AND SHAREHOLDERS’ EQUITY | ||||||||
Current liabilities: | ||||||||
Accounts payable | $ | 280,181 | $ | 313,909 | ||||
Accrued compensation, contributions to employee benefit plans and related taxes | 56,773 | 56,080 | ||||||
Dividends payable | 14,950 | 13,899 | ||||||
Other accrued items | 45,867 | 38,469 | ||||||
Income taxes payable | 4,240 | 51,357 | ||||||
Current maturities of long-term debt | 143,432 | 1,346 | ||||||
Total current liabilities | 545,443 | 475,060 | ||||||
Other liabilities | 56,262 | 53,092 | ||||||
Long-term debt | 245,000 | 288,422 | ||||||
Deferred income taxes | 119,462 | 104,216 | ||||||
Contingent liabilities and commitments - Note G | — | — | ||||||
Minority interest | 43,002 | 41,975 | ||||||
Shareholders’ equity: | ||||||||
Preferred shares, without par value; authorized - 1,000,000 shares; issued and outstanding - none | — | — | ||||||
Common shares, without par value; authorized - 150,000,000 shares; issued and outstanding, 2005 - 87,933,202 shares, 2004 - 86,855,642 shares | — | — | ||||||
Additional paid-in capital | 149,167 | 131,255 | ||||||
Cumulative other comprehensive loss, net of taxes of $(2,628) and $(1,414) at May 31, 2005 and 2004 | (1,313 | ) | (2,393 | ) | ||||
Retained earnings | 672,982 | 551,512 | ||||||
| 820,836 | 680,374 | |||||||
Total liabilities and shareholders’ equity | $ | 1,830,005 | $ | 1,643,139 | ||||
| May 31, | ||||||
| 2008 | 2007 | |||||
ASSETS | ||||||
Current assets: | ||||||
Cash and cash equivalents | $ | 73,772 | $ | 38,277 | ||
Short-term investments | - | 25,562 | ||||
Receivables, less allowances of $4,849 and $3,641 at May 31, 2008 and 2007 | 384,354 | 400,916 | ||||
Inventories: | ||||||
Raw materials | 350,256 | 261,849 | ||||
Work in process | 123,106 | 97,633 | ||||
Finished products | 119,599 | 88,382 | ||||
Total inventories | 592,961 | 447,864 | ||||
Assets held for sale | 1,132 | 4,600 | ||||
Deferred income taxes | 17,966 | 13,067 | ||||
Prepaid expenses and other current assets | 34,785 | 39,097 | ||||
Total current assets | 1,104,970 | 969,383 | ||||
Investments in unconsolidated affiliates | 119,808 | 57,540 | ||||
Goodwill | 183,523 | 179,441 | ||||
Other assets | 29,786 | 43,553 | ||||
Property, plant and equipment: | ||||||
Land | 34,241 | 33,228 | ||||
Buildings and improvements | 249,624 | 241,729 | ||||
Machinery and equipment | 901,067 | 875,737 | ||||
Construction in progress | 11,758 | 8,268 | ||||
Total property, plant and equipment | 1,196,690 | 1,158,962 | ||||
Less accumulated depreciation | 646,746 | 594,697 | ||||
Total property, plant and equipment, net | 549,944 | 564,265 | ||||
Total assets | $ | 1,988,031 | $ | 1,814,182 | ||
LIABILITIES AND SHAREHOLDERS’ EQUITY | ||||||
Current liabilities: | ||||||
Accounts payable | $ | 356,129 | $ | 263,665 | ||
Notes payable | 135,450 | 31,650 | ||||
Accrued compensation, contributions to employee benefit plans and related taxes | 59,619 | 46,237 | ||||
Dividends payable | 13,487 | 14,440 | ||||
Other accrued items | 68,545 | 45,519 | ||||
Income taxes payable | 31,665 | 18,983 | ||||
Total current liabilities | 664,895 | 420,494 | ||||
Other liabilities | 49,785 | 57,383 | ||||
Long-term debt | 245,000 | 245,000 | ||||
Deferred income taxes | 100,811 | 105,983 | ||||
Total liabilities | 1,060,491 | 828,860 | ||||
Contingent liabilities and commitments - Note G | ||||||
Minority interest | 42,163 | 49,321 | ||||
Shareholders’ equity: | ||||||
Preferred shares, without par value; authorized - 1,000,000 shares; issued and outstanding - none | - | - | ||||
Common shares, without par value; authorized - 150,000,000 shares; issued and outstanding, 2008 - 79,308,056 shares, 2007 - 84,908,476 shares | - | - | ||||
Additional paid-in capital | 174,900 | 166,908 | ||||
Cumulative other comprehensive income, net of taxes of $78 and $(6,168) at May 31, 2008 and 2007 | 24,633 | 23,181 | ||||
Retained earnings | 685,844 | 745,912 | ||||
Total shareholders’ equity | 885,377 | 936,001 | ||||
Total liabilities and shareholders’ equity | $ | 1,988,031 | $ | 1,814,182 | ||
See notes to consolidated financial statements.
WORTHINGTON INDUSTRIES, INC.
CONSOLIDATED STATEMENTS OF EARNINGS
(In thousands, except per share)
| Fiscal Years Ended May 31, | ||||||||||||
| 2005 | 2004 | 2003 | ||||||||||
Net sales | $ | 3,078,884 | $ | 2,379,104 | $ | 2,219,891 | ||||||
Cost of goods sold | 2,580,011 | 2,003,734 | 1,916,990 | |||||||||
Gross margin | 498,873 | 375,370 | 302,901 | |||||||||
Selling, general and administrative expense | 225,915 | 195,785 | 182,692 | |||||||||
Impairment charges and other | 5,608 | 69,398 | (5,622 | ) | ||||||||
Operating income | 267,350 | 110,187 | 125,831 | |||||||||
Other income (expense): | ||||||||||||
Miscellaneous expense | (7,991 | ) | (1,589 | ) | (7,240 | ) | ||||||
Nonrecurring losses | — | — | (5,400 | ) | ||||||||
Interest expense | (24,761 | ) | (22,198 | ) | (24,766 | ) | ||||||
Equity in net income of unconsolidated affiliates | 53,871 | 41,064 | 29,973 | |||||||||
Earnings before income taxes | 288,469 | 127,464 | 118,398 | |||||||||
Income tax expense | 109,057 | 40,712 | 43,215 | |||||||||
Net earnings | $ | 179,412 | $ | 86,752 | $ | 75,183 | ||||||
Average common shares outstanding - basic | 87,646 | 86,312 | 85,785 | |||||||||
Earnings per share - basic | $ | 2.05 | $ | 1.01 | $ | 0.88 | ||||||
Average common shares outstanding - diluted | 88,503 | 86,950 | 86,537 | |||||||||
Earnings per share - diluted | $ | 2.03 | $ | 1.00 | $ | 0.87 | ||||||
| Fiscal Years Ended May 31, | ||||||||||||
| 2008 | 2007 | 2006 | ||||||||||
Net sales | $ | 3,067,161 | $ | 2,971,808 | $ | 2,897,179 | ||||||
Cost of goods sold | 2,711,414 | 2,610,176 | 2,525,545 | |||||||||
Gross margin | 355,747 | 361,632 | 371,634 | |||||||||
Selling, general and administrative expense | 231,602 | 232,487 | 214,030 | |||||||||
Restructuring charges | 18,111 | - | - | |||||||||
Operating income | 106,034 | 129,145 | 157,604 | |||||||||
Other income (expense): | ||||||||||||
Miscellaneous expense | (6,348 | ) | (4,446 | ) | (1,524 | ) | ||||||
Gain on sale of Acerex | - | - | 26,609 | |||||||||
Interest expense | (21,452 | ) | (21,895 | ) | (26,279 | ) | ||||||
Equity in net income of unconsolidated affiliates | 67,459 | 63,213 | 56,339 | |||||||||
Earnings before income taxes | 145,693 | 166,017 | 212,749 | |||||||||
Income tax expense | 38,616 | 52,112 | 66,759 | |||||||||
Net earnings | $ | 107,077 | $ | 113,905 | $ | 145,990 | ||||||
Average common shares outstanding - basic | 81,232 | 86,351 | 88,288 | |||||||||
Earnings per share - basic | $ | 1.32 | $ | 1.32 | $ | 1.65 | ||||||
Average common shares outstanding - diluted | 81,898 | 87,002 | 88,976 | |||||||||
Earnings per share - diluted | $ | 1.31 | $ | 1.31 | $ | 1.64 | ||||||
See notes to consolidated financial statements.
WORTHINGTON INDUSTRIES, INC.
CONSOLIDATED STATEMENTS OF SHAREHOLDERS’SHAREHOLDERS' EQUITY
(Dollars in thousands, except per share)
Cumulative Other Comprehensive Loss, Net of | |||||||||||||||||||||
Additional Paid- in | |||||||||||||||||||||
| Common Shares | Retained | ||||||||||||||||||||
| Shares | Amount | Capital | Tax | Earnings | Total | ||||||||||||||||
Balance at June 1, 2002 | 85,512,225 | $ | — | $ | 111,484 | $ | (5,055 | ) | $ | 499,827 | $ | 606,256 | |||||||||
Comprehensive income: | |||||||||||||||||||||
Net earnings | — | — | — | — | 75,183 | 75,183 | |||||||||||||||
Unrealized gain (loss) on investment | — | — | — | (115 | ) | — | (115 | ) | |||||||||||||
Foreign currency translation | — | — | — | 2,909 | — | 2,909 | |||||||||||||||
Minimum pension liability | — | — | — | (3,400 | ) | — | (3,400 | ) | |||||||||||||
Cash flow hedges | — | — | — | 493 | — | 493 | |||||||||||||||
Total comprehensive income | 75,070 | ||||||||||||||||||||
Common shares issued | 436,411 | — | 5,964 | — | — | 5,964 | |||||||||||||||
Cash dividends declared ($0.64 per share) | — | — | — | — | (54,938 | ) | (54,938 | ) | |||||||||||||
Gain on TWB minority interest acquisition | — | — | 3,942 | — | — | 3,942 | |||||||||||||||
Balance at May 31, 2003 | 85,948,636 | — | 121,390 | (5,168 | ) | 520,072 | 636,294 | ||||||||||||||
Comprehensive income: | |||||||||||||||||||||
Net earnings | — | — | — | — | 86,752 | 86,752 | |||||||||||||||
Unrealized gain (loss) on investment | — | — | — | 94 | — | 94 | |||||||||||||||
Foreign currency translation | — | — | — | (1,747 | ) | — | (1,747 | ) | |||||||||||||
Minimum pension liability | — | — | — | 1,015 | — | 1,015 | |||||||||||||||
Cash flow hedges | — | — | — | 3,413 | — | 3,413 | |||||||||||||||
Total comprehensive income | 89,527 | ||||||||||||||||||||
Common shares issued | 907,006 | — | 11,357 | — | — | 11,357 | |||||||||||||||
Cash dividends declared ($0.64 per share) | — | — | — | (55,312 | ) | (55,312 | ) | ||||||||||||||
Other | — | — | (1,492 | ) | — | — | (1,492 | ) | |||||||||||||
Balance at May 31, 2004 | 86,855,642 | — | 131,255 | (2,393 | ) | 551,512 | 680,374 | ||||||||||||||
Comprehensive income: | |||||||||||||||||||||
Net earnings | — | — | — | — | 179,412 | 179,412 | |||||||||||||||
Unrealized gain (loss) on investment | — | — | — | 164 | — | 164 | |||||||||||||||
Foreign currency translation | — | — | — | 698 | — | 698 | |||||||||||||||
Minimum pension liability | — | — | — | (332 | ) | — | (332 | ) | |||||||||||||
Cash flow hedges | — | — | — | 550 | — | 550 | |||||||||||||||
Total comprehensive income | 180,492 | ||||||||||||||||||||
Common shares issued | 1,077,560 | — | 17,917 | — | — | 17,917 | |||||||||||||||
Cash dividends declared ($0.66 per share) | — | — | — | — | (57,942 | ) | (57,942 | ) | |||||||||||||
Other | — | — | (5 | ) | — | — | (5 | ) | |||||||||||||
Balance at May 31, 2005 | 87,933,202 | $ | — | $ | 149,167 | $ | (1,313 | ) | $ | 672,982 | $ | 820,836 | |||||||||
| Additional Paid-in Capital | Cumulative Other Comprehensive Income (Loss), Net of Tax | Retained Earnings | Total | |||||||||||||||||||
| Common Shares | ||||||||||||||||||||||
| Shares | Amount | |||||||||||||||||||||
Balance at June 1, 2005 | 87,933,202 | $ | - | $ | 149,167 | $ | (1,313 | ) | $ | 672,982 | $ | 820,836 | ||||||||||
Comprehensive income: | ||||||||||||||||||||||
Net earnings | - | - | - | - | 145,990 | 145,990 | ||||||||||||||||
Unrealized gain on investment | - | - | - | 139 | - | 139 | ||||||||||||||||
Foreign currency translation | - | - | - | 8,711 | - | 8,711 | ||||||||||||||||
Minimum pension liability | - | - | - | 2,473 | - | 2,473 | ||||||||||||||||
Cash flow hedges | - | - | - | 17,106 | - | 17,106 | ||||||||||||||||
Total comprehensive income | 174,419 | |||||||||||||||||||||
Common shares issued | 758,002 | - | 10,161 | - | - | 10,161 | ||||||||||||||||
Cash dividends declared ($0.68 per share) | - | - | - | - | (60,110 | ) | (60,110 | ) | ||||||||||||||
Balance at May 31, 2006 | 88,691,204 | - | 159,328 | 27,116 | 758,862 | 945,306 | ||||||||||||||||
Comprehensive income: | ||||||||||||||||||||||
Net earnings | - | - | - | - | 113,905 | 113,905 | ||||||||||||||||
Unrealized loss on investment | - | - | - | (296 | ) | - | (296 | ) | ||||||||||||||
Foreign currency translation | - | - | - | 4,507 | - | 4,507 | ||||||||||||||||
Minimum pension liability | - | - | - | 34 | - | 34 | ||||||||||||||||
Cash flow hedges | - | - | - | (7,586 | ) | - | (7,586 | ) | ||||||||||||||
Total comprehensive income | 110,564 | |||||||||||||||||||||
Adjustment to initially apply FASB 158 | - | - | - | (594 | ) | - | (594 | ) | ||||||||||||||
Common shares issued | 666,272 | - | 12,242 | - | - | 12,242 | ||||||||||||||||
Stock-based compensation | - | - | 3,480 | - | - | 3,480 | ||||||||||||||||
Purchases and retirement of common shares | (4,449,000 | ) | - | (8,142 | ) | - | (68,475 | ) | (76,617 | ) | ||||||||||||
Cash dividends declared ($0.68 per share) | - | - | - | - | (58,380 | ) | (58,380 | ) | ||||||||||||||
Balance at May 31, 2007 | 84,908,476 | - | 166,908 | 23,181 | 745,912 | 936,001 | ||||||||||||||||
Comprehensive income: | ||||||||||||||||||||||
Net earnings | - | - | - | - | 107,077 | 107,077 | ||||||||||||||||
Foreign currency translation | - | - | - | 13,080 | - | 13,080 | ||||||||||||||||
Minimum pension liability | - | - | - | 590 | - | 590 | ||||||||||||||||
Cash flow hedges | - | - | - | (12,218 | ) | - | (12,218 | ) | ||||||||||||||
Total comprehensive income | 108,529 | |||||||||||||||||||||
Common shares issued | 851,080 | - | 15,318 | - | - | 15,318 | ||||||||||||||||
Stock-based compensation | - | - | 4,010 | - | - | 4,010 | ||||||||||||||||
Gain from TWB dilution | - | - | 1,944 | - | - | 1,944 | ||||||||||||||||
Purchases and retirement of common shares | (6,451,500 | ) | - | (13,280 | ) | - | (112,505 | ) | (125,785 | ) | ||||||||||||
Cash dividends declared ($0.68 per share) | - | - | - | - | (54,640 | ) | (54,640 | ) | ||||||||||||||
Balance at May 31, 2008 | 79,308,056 | $ | - | $ | 174,900 | $ | 24,633 | $ | 685,844 | $ | 885,377 | |||||||||||
See notes to consolidated financial statements.
WORTHINGTON INDUSTRIES, INC.
CONSOLIDATED STATEMENTS OF CASH FLOWS
(Dollars in thousands)
| Fiscal Years Ended May 31, | ||||||||||||
| 2005 | 2004 | 2003 | ||||||||||
Operating activities: | ||||||||||||
Net earnings | $ | 179,412 | $ | 86,752 | $ | 75,183 | ||||||
Adjustments to reconcile net earnings to net cash provided by operating activities: | ||||||||||||
Depreciation and amortization | 57,874 | 67,302 | 69,419 | |||||||||
Impairment charges and other | 5,608 | 69,398 | (5,622 | ) | ||||||||
Provision for deferred income taxes | (1,496 | ) | (22,508 | ) | 16,411 | |||||||
Nonrecurring losses | — | — | 5,400 | |||||||||
Equity in net income of unconsolidated affiliates, net of distributions received | (25,351 | ) | (28,912 | ) | 11,134 | |||||||
Minority interest in net income of consolidated subsidiaries | 8,963 | 4,733 | 4,283 | |||||||||
Net loss (gain) on sale of assets | 2,641 | (3,127 | ) | 1,227 | ||||||||
Changes in assets and liabilities: | ||||||||||||
Accounts receivable | (50,661 | ) | (175,290 | ) | 60,012 | |||||||
Inventories | (59,236 | ) | (94,073 | ) | (13,675 | ) | ||||||
Prepaid expenses and other current assets | (10,195 | ) | 12,841 | (1,815 | ) | |||||||
Other assets | (831 | ) | 90 | (1,886 | ) | |||||||
Accounts payable and accrued expenses | (72,933 | ) | 162,383 | (49,507 | ) | |||||||
Other liabilities | (1,524 | ) | (222 | ) | 10,157 | |||||||
Net cash provided by operating activities | 32,271 | 79,367 | 180,721 | |||||||||
Investing activities: | ||||||||||||
Investment in property, plant and equipment, net | (46,318 | ) | (29,599 | ) | (24,970 | ) | ||||||
Acquisitions, net of cash acquired | (65,119 | ) | — | (114,703 | ) | |||||||
Investment in unconsolidated affiliate | (1,500 | ) | (490 | ) | — | |||||||
Proceeds from sale of assets | 89,488 | 5,662 | 27,814 | |||||||||
Purchases of short-term investments | (72,875 | ) | — | — | ||||||||
Sales of short-term investments | 72,875 | — | — | |||||||||
Net cash used by investing activities | (23,449 | ) | (24,427 | ) | (111,859 | ) | ||||||
Financing activities: | ||||||||||||
Payments on short-term borrowings | — | (1,145 | ) | (7,340 | ) | |||||||
Proceeds from long-term debt, net | 99,409 | — | 735 | |||||||||
Principal payments on long-term debt | (2,381 | ) | (1,234 | ) | (6,883 | ) | ||||||
Proceeds from issuance of common shares | 14,673 | 10,644 | 5,419 | |||||||||
Payments to minority interest | (8,360 | ) | (7,200 | ) | (5,281 | ) | ||||||
Dividends paid | (56,891 | ) | (55,167 | ) | (54,869 | ) | ||||||
Net cash provided (used) by financing activities | 46,450 | (54,102 | ) | (68,219 | ) | |||||||
Increase in cash and cash equivalents | 55,272 | 838 | 643 | |||||||||
Cash and cash equivalents at beginning of year | 1,977 | 1,139 | 496 | |||||||||
Cash and cash equivalents at end of year | $ | 57,249 | $ | 1,977 | $ | 1,139 | ||||||
| Fiscal Years Ended May 31, | ||||||||||||
| 2008 | 2007 | 2006 | ||||||||||
Operating activities: | ||||||||||||
Net earnings | $ | 107,077 | $ | 113,905 | $ | 145,990 | ||||||
Adjustments to reconcile net earnings to net cash provided by operating activities: | ||||||||||||
Depreciation and amortization | 63,413 | 61,469 | 59,116 | |||||||||
Restructuring charges, non-cash | 5,169 | - | - | |||||||||
Provision for deferred income taxes | (3,228 | ) | (3,068 | ) | (12,645 | ) | ||||||
Equity in net income of unconsolidated affiliates, net of distributions | (8,539 | ) | 68,510 | 702 | ||||||||
Minority interest in net income of consolidated subsidiaries | 6,969 | 5,409 | 6,088 | |||||||||
Net loss on sale of assets | 3,756 | 826 | 6,079 | |||||||||
Gain on sale of Acerex | - | - | (26,609 | ) | ||||||||
Stock-based compensation | 4,173 | 3,480 | - | |||||||||
Excess tax benefits—stock-based compensation | (2,035 | ) | (2,370 | ) | - | |||||||
Changes in assets and liabilities: | ||||||||||||
Receivables | 6,967 | 8,312 | 11,616 | |||||||||
Inventories | (144,474 | ) | 19,588 | (33,788 | ) | |||||||
Prepaid expenses and other current assets | 8,252 | (2,078 | ) | (9,186 | ) | |||||||
Other assets | (1,546 | ) | 4,898 | (563 | ) | |||||||
Accounts payable and accrued expenses | 138,822 | (99,283 | ) | 79,114 | ||||||||
Other liabilities | (4,255 | ) | 833 | 1,152 | ||||||||
Net cash provided by operating activities | 180,521 | 180,431 | 227,066 | |||||||||
Investing activities: | ||||||||||||
Investment in property, plant and equipment, net | (47,520 | ) | (57,691 | ) | (60,128 | ) | ||||||
Investment in aircraft | - | - | (16,435 | ) | ||||||||
Acquisitions, net of cash acquired | (2,225 | ) | (31,727 | ) | (6,776 | ) | ||||||
Investment in unconsolidated affiliates | (47,598 | ) | (1,000 | ) | - | |||||||
Proceeds from sale of assets | 1,025 | 18,237 | 3,225 | |||||||||
Proceeds from sale of Acerex | - | - | 44,604 | |||||||||
Purchases of short-term investments | - | (25,562 | ) | (493,860 | ) | |||||||
Sales of short-term investments | 25,562 | 2,173 | 491,687 | |||||||||
Net cash used by investing activities | (70,756 | ) | (95,570 | ) | (37,683 | ) | ||||||
Financing activities: | ||||||||||||
Net proceeds from short-term borrowings | 103,800 | 31,650 | 7,684 | |||||||||
Principal payments on long-term debt | - | (7,691 | ) | (143,416 | ) | |||||||
Proceeds from issuance of common shares | 13,171 | 9,866 | 9,138 | |||||||||
Excess tax benefits—stock-based compensation | 2,035 | 2,370 | - | |||||||||
Payments to minority interest | (11,904 | ) | (3,360 | ) | (3,840 | ) | ||||||
Repurchase of common shares | (125,785 | ) | (76,617 | ) | - | |||||||
Dividends paid | (55,587 | ) | (59,018 | ) | (59,982 | ) | ||||||
Net cash used by financing activities | (74,270 | ) | (102,800 | ) | (190,416 | ) | ||||||
Increase (decrease) in cash and cash equivalents | 35,495 | (17,939 | ) | (1,033 | ) | |||||||
Cash and cash equivalents at beginning of year | 38,277 | 56,216 | 57,249 | |||||||||
Cash and cash equivalents at end of year | $ | 73,772 | $ | 38,277 | $ | 56,216 | ||||||
See notes to consolidated financial statements.
WORTHINGTON INDUSTRIES, INC.
NOTES TO CONSOLIDATED FINANCIAL STATEMENTS
Fiscal Years Ended May 31, 2005, 20042008, 2007 and 20032006
Note A – Summary of Significant Accounting Policies
Consolidation:The consolidated financial statements include the accounts of Worthington Industries, Inc. and consolidated subsidiaries (the(collectively, “we,” “our,” “Worthington,” or the “Company”). Spartan Steel Coating, LLC (owned 52%) and Dietrich Metal Framing Canada, LP (owned 60%), areis fully consolidated with the equity owned by the respective partnersother joint venture member shown as minority interest on the consolidated balance sheetsheets, and theirits portion of net income or loss includedearnings eliminated in miscellaneous income or expense. Investments in unconsolidated affiliates are accounted for using the equity method. Significant intercompany accounts and transactions are eliminated.
Use of Estimates: The preparation of financial statements in conformity with accounting principles generally accepted in the United States requires management to make estimates and assumptions that affect the amounts reported in the financial statements and accompanying notes. Actual results could differ from those estimates.
Cash and Cash Equivalents: The Company considersWe consider all highly liquid investments purchased with aan original maturity of three months or less to be cash equivalents.
Short-term Investments: At May, 31, 2007, we held $25,562,000 in short-term investments consisting of money market mutual funds which were classified as available-for-sale securities. Unrealized holding gains (losses) were immaterial. These investments were sold during fiscal 2008.
Inventories: Inventories are valued at the lower of cost or market. With the exception of steel coil inventories, which are accounted for using the specific identification method, costCost is determined using the first-in, first-out method or standard costing which approximates the first-in, first-out method for all inventories.
Derivative Financial Instruments:The Company does We do not engage in currency or commodity speculation and generally entersenter into derivatives only to hedge specific interest, foreign currency or commodity transactions. All derivatives are accounted for using mark-to-market accounting. Gains or losses from these transactions offset gains or losses of the assets, liabilities or transactions being hedged. Current assets other assets and currentother liabilities include derivative fair values at May 31, 20052008, of $3,644,000, $4,397,000$4,773,000 and $110,000, respectively. If a cash flow derivative is terminated and the cash flows remain probable, the amount in other comprehensive income remains and will be reclassified to net earnings when the hedged cash flow occurs.$516,000. Ineffectiveness of the hedges during the fiscal year ended May 31, 2005,2008 (“fiscal 2005”2008”), the fiscal year ended May 31, 20042007 (“fiscal 2004”2007”) and the fiscal year ended May 31, 2003,2006 (“fiscal 2003”2006”) was immaterial and was reported in other income (expense).
For hedging relationships to qualify under Statement of Accounting Standards (“SFAS”) No. 133 (“SFAS 133”), we formally document the hedging relationship and its risk management objective and the hedge strategy, the hedging instrument, the hedge item, the nature of the risk being hedged, how the hedge instrument effectiveness against offsetting the hedged risk will be assessed prospectively and retrospectively, and a description of the method of measuring ineffectiveness.
We discontinue hedge accounting when it is determined that the derivative is no longer effective in offsetting cash flows of the hedged item, the derivative expires or is sold, is terminated, is no longer designated as a hedging instrument, because it is unlikely that a forecasted transaction will occur, or we determine that designation of the hedging instrument is no longer appropriate. In all situations in which hedge accounting is discontinued and the derivative is retained, we continue to carry the derivative at its fair value on the balance sheet and recognize any subsequent changes in its fair value in net earnings. When it is probable that a forecasted transaction will not occur, we discontinue hedge accounting and recognize immediately in net earnings gains and losses that were accumulated in other comprehensive income.
Interest Rate Risk
We entered into an interest rate swap in October 2004, which was amended December 17, 2004. The commodityswap had a notional amount of $100,000,000 to hedge changes in cash flows attributable to changes in the LIBOR rate associated with the December 17, 2004, issuance of the unsecured Floating Rate Senior Notes due December 17, 2014. See “Note C – Debt.” No credit loss is anticipated as the interest rate swap was executed with a highly rated financial institution. We pay a fixed rate of 4.46% and receive a variable rate based on six-month LIBOR. The interest rate derivative is classified as a cash flow hedge per SFAS 133. The effective portion of the change in the fair value of the derivative is recorded in other comprehensive income and is reclassified to interest expense in the period in which earnings are impacted by the hedged items or in the period that the transaction no longer qualifies as a cash flow hedge. A sensitivity analysis of changes in the interest rate yield curve associated with our interest rate swap indicates that a 10% parallel decline in the yield curve would reduce the fair value of our interest rate swap by $2.3 million.
Foreign Currency Risk
The translation of foreign currencies into United States dollars subjects the Company to exposure related to fluctuating exchange rates. Derivative instruments are not used to manage this risk; however, the Company does make use of forward contracts to manage exposure to certain inter-company loans with our foreign affiliates. Such contracts limit exposure to both favorable and unfavorable currency fluctuations. No credit loss is anticipated as the counterparties to these agreements are major financial institutions that are highly rated. At May 31, 2008, the difference between the contract and book value was not material to the Company’s consolidated financial position, results of operations or cash flows. The foreign currency derivatives hedge exposure through 2008.are classified as fair value derivatives per SFAS 133. The change in the fair value of the derivatives are recorded either in the balance sheet under foreign currency translation or in net earnings in the same period in which foreign currency translation or net earnings are impacted by the hedged items. A 10% change in the exchange rate to the U.S. dollar forward rate is not expected to materially impact our consolidated financial position, results of operations, or cash flows. A sensitivity analysis of changes in the U.S. dollar on these foreign currency-denominated contracts indicates that if the U.S. dollar uniformly weakened by 10% against all of these currency exposures, the fair value of these instruments would decrease by $6,300,000. Any resulting changes in fair value would be offset by changes in the underlying hedged balance sheet position. The sensitivity analysis assumes a uniform shift in all foreign currency exchange rates. The assumption that exchange rates change in uniformity may overstate the impact of changing exchange rates on assets and liabilities denominated in a foreign currency.
Commodity Price Risk
We are exposed to market risk for price fluctuations on purchases of steel, natural gas, zinc and other raw materials and utility requirements. The Company attempts to negotiate the best prices for commodities and to competitively price products and services to reflect the fluctuations in market prices. Derivative financial instruments are used to manage a portion of our exposure to fluctuations in the cost of natural gas and zinc. These contracts cover periods commensurate with known or expected exposures through calendar 2008. No derivatives are held for trading purposes. No credit loss is anticipated as the counterparties to these agreements are major financial institutions that are highly rated. The zinc derivative is classified as a cash flow hedge per SFAS 133. The effective portion of the change in the fair value of the zinc derivative is recorded in other comprehensive income and is reclassified to cost of goods sold in the period in which earnings are impacted by the hedged items or in the period that the transaction no longer qualifies as a cash flow hedge. One natural gas derivative is classified as a cash flow hedge per SFAS 133. The effective portion of the change in the fair value of the derivative is recorded in other comprehensive income and is reclassified to cost of goods sold in the period in which earnings are impacted by the hedged items or in the period that the transaction no longer qualifies as a cash flow hedge. The other natural gas derivative’s change in fair value is recorded in cost of goods sold, as it does not qualify for hedge accounting under SFAS 133. A sensitivity analysis of changes in the price of hedged commodities indicates that a 10% decline in zinc prices would
reduce the fair value of our hedge position by $300,000. A similar 10% decline in natural gas prices would reduce the fair value of the natural gas hedge position by $200,000. Any resulting changes in fair value of the zinc hedge and one natural gas hedge would be recorded as adjustments to other comprehensive income.
Investments in Unconsolidated Affiliates: Securities and Exchange Commission (“SEC”) Staff Accounting Bulletin No. 51, “Accounting for Sales of Stock by a Subsidiary” (“SAB 51”), provides guidance on accounting for the effect of changes in an unconsolidated affiliate's stock or equity on the parent's investment in that unconsolidated affiliate. SAB 51 allows election of an accounting policy of recording such increases or decreases in a parent's investment either in net earnings or in equity. We record such increases or decreases to our equity as additional paid-in capital.
Fair Value of Financial Instruments: The non-derivative financial instruments included in the carrying amounts of cash and cash equivalents, short-term investments, receivables, other assets, accounts and payablesnotes payable, accrued expenses and income taxes payable, approximate fair values. The fair value of long-term debt, including current maturities, based upon quoted market prices was $408,101,000$252,073,000 and $326,547,000$249,524,000 at May 31, 20052008 and 2004, respectively.2007.
Risks and UncertaintiesUncertainties:: As of May 31, 2005,2008, the Company, including unconsolidated affiliates, operated 66 production facilities in 2324 states and 1011 countries. The Company’sOur largest markets are the construction and the automotive and automotive supply markets, which comprise approximately one-thirdcomprised 40% and 26%, of the Company’s net sales. Foreign operations and exports represent less than 10% of the Company’s production,our consolidated net sales in fiscal 2008. Our foreign operations represented 9% of consolidated net sales, 35% of consolidated pre-tax earnings and 16% of consolidated net assets. Approximately 9%14% of the Company’sCompany's consolidated labor force is coveredrepresented by current collective bargaining agreements. Of theseagents. This includes 271 employees whose labor contracts 25% expire or will otherwise require renegotiation within one year from May 31, 2005. These numbers exclude 140 employees that are covered by a contract that expired in March of 2005 that is currently being renegotiated.the next fiscal year. The concentration of credit risks from financial instruments related to the markets served by the Company is not expected to have a material adverse effect on the Company’sCompany's consolidated financial position, cash flows or future results of operations.
Receivables: We review our receivables on an ongoing basis to ensure that they are properly valued and collectible. This is accomplished through two contra-receivable accounts: returns and allowances and allowance for doubtful accounts. Returns and allowances are used to record estimates of returns or other allowances resulting from quality, delivery, discounts or other issues affecting the value of receivables. This account is estimated based on historical trends and current market conditions, with the offset to net sales. The allowance for doubtful accounts is used to record the estimated risk of loss related to the customers’ inability to pay. This allowance is maintained at a level that we consider appropriate based on factors that affect collectability, such as the financial health of the customer, historical trends of charge-offs and recoveries, and current economic and market conditions. As we monitor our receivables, we identify customers that may have payment problems, and we adjust the allowance accordingly, with the offset to SG&A expense.
Property and Depreciation:Property, plant and equipment are carried at cost and depreciated using the straight-line method. Buildings and improvements are depreciated over 10 to 40 years and machinery and equipment over 3 to 20 years. Depreciation expense was $55,409,000$61,154,000 for fiscal 2005, $66,545,0002008, $59,478,000 for the fiscal
year ended May 31, 2004 (“fiscal 2004”),2007, and $67,828,000$56,769,000 for the fiscal year ended May 31, 2003 (“fiscal 2003”).2006. Accelerated depreciation methods are used for income tax purposes.
Planned Maintenance Activities: We use the deferral method to account for costs of planned maintenance shutdowns. Under this method, the costs of a qualifying shutdown are capitalized and amortized on a straight-line basis into maintenance expense until the next anticipated shutdown. In no case will the amortization period exceed twelve months.
Leases: Certain lease agreements contain fluctuating or escalating payments and rent holiday periods. The related rent expense is recorded on a straight-line basis over the length of the lease term. Leasehold improvements made by the lessee, whether funded by the lessee or by landlord allowances or incentives are
recorded as leasehold improvement assets and will be amortized over the shorter of the economic life or the lease term. These incentives are also recorded as deferred rent and amortized as reductions in rent expense over the lease term.
Capitalized Interest: The Company capitalizesWe capitalize interest in connection with the construction of qualified assets. Under this policy, the Companywe capitalized interest of $158,000$146,000 in fiscal 2005, $22,0002008, $1,757,000 in fiscal 20042007 and $48,000$638,000 in fiscal 2003.2006.
Stock-Based Compensation:At May 31, 2005, the Company2008, we had stock optionstock-based compensation plans for employees and non-employee directors which are described more fully in “Note F – Stock-Based Compensation.” The Company accountsEffective June 1, 2006, we adopted SFAS No. 123 (revised 2004),Share-Based Payment(“SFAS 123(R)”). SFAS 123(R) requires all share-based payments, including grants of stock options, to be recorded as expense in the statement of earnings based on their fair values. For the periods prior to June 1, 2006, we accounted for these plansemployee and non-employee director stock options under the recognition and measurement principles of Accounting Principles Board (“APB”)APB Opinion No. 25,Accounting for Stock Issued to Employees, and the related interpretations. Nointerpretations.No stock-based employee compensation cost iscosts for the prior fiscal periods were reflected in net earnings, as all stock options granted under theour plans had an exercise price equal to the fair market value of the underlying common shares on the date of the grant. Pro forma information regarding net earnings and earnings per share is required by Statement of Financial Accounting Standards (“SFAS”) No. 123,Accounting for Stock-Based Compensation, as amended by SFAS No. 148,Accounting for Stock-Based Compensation – Transition and Disclosure. This information is required to be determined as if the Company had accounted for its options granted after December 31, 1994, under the fair value method prescribed by that Statement.grant date.
In December 2004, the FASB issued SFAS No. 123 (revised 2004),Share-Based Payment(“SFAS 123(R)”).SFAS 123(R) is a revision of SFAS 123 and it supercedes APB No. 25 and amends SFAS No. 95,Statement of Cash Flows.Generally, the approach in SFAS 123(R) is similar to the approach described in SFAS 123. However, SFAS 123(R) requires all share-based payments to employees, including grants of employee options, to be recognized in the income statement based on their fair values. Proforma disclosure will not be an alternative. SFAS 123(R) is effective for all fiscal years beginning after June 15, 2005, and thus will become effective for the Company beginning in fiscal 2007. Early adoption will be permitted in periods in which financial statements have not yet been issued.
SFAS 123(R) permits public companies to choose between the following two adoption methods:
1. A “modified prospective” method in which compensation cost is recognized beginning with the effective date (a) based on the requirements of SFAS 123(R) for all share-based payments granted after the effective date and (b) based on the requirements of SFAS 123 for all awards granted to employees prior to the effective date of SFAS 123(R) that remain unvested on the effective date.
2. A “modified retrospective” method which includes the requirements of the modified prospective method described above, but also permits entities to restate based on the amounts previously recognized under SFAS 123 for purposes of pro forma disclosures either (a) all prior periods presented or (b) prior interim periods of the year of adoption.
The adoption of SFAS 123(R)’s fair value method will have an impact on results of operations, although it will have no impact on the Company’s overall financial position. Stock option expense after the adoption of SFAS 123(R) is not expected to be materially different than the expense reported in the table below, but this will not be known until a full analysis of the impact of SFAS 123(R) is completed. The impact will largely depend on levels of share-based payments granted in the future.
On March 29, 2005, the Securities and Exchange Commission (“SEC”) issued Staff Accounting Bulletin No. 107 (“SAB 107”). SAB 107 provides interpretations expressing the views of the SEC staff regarding the interaction between SFAS 123(R) and certain SEC rules and regulations, and provides the staff’s views regarding the valuation of share-based payment arrangements for public companies. SAB 107 does not modify any of SFAS 123(R)’s conclusions or requirements.
The weighted average fair value of stock options granted in fiscal 2005, fiscal 2004 and fiscal 2003 was $3.14, $2.82 and $2.71, respectively, based on the Black Scholes option pricing model with the following weighted average assumptions:
| 2005 | 2004 | 2003 | ||||
Assumptions used: | ||||||
Dividend yield | 3.33% | 4.04% | 4.01% | |||
Expected volatility | 25.00% | 26.00% | 25.00% | |||
Risk-free interest rate | 3.88% | 3.88% | 2.63% | |||
Expected lives (years) | 6.6 | 6.2 | 6.5 |
The following table illustrates the effect on net earnings and earnings per share as if the Company had accounted for the stock option plans under the fair value method of accounting, as required by SFAS 123, for the years ended May 31:fiscal 2006:
| In thousands, except per share | 2005 | 2004 | 2003 | ||||||
Net earnings, as reported | $ | 179,412 | $ | 86,752 | $ | 75,183 | |||
Deduct: total stock-based employee compensation expense determined under fair value based method, net of tax | 1,977 | 1,328 | 1,475 | ||||||
Pro forma net earnings | $ | 177,435 | $ | 85,424 | $ | 73,708 | |||
Earnings per share: | |||||||||
Basic, as reported | $ | 2.05 | $ | 1.01 | $ | 0.88 | |||
Basic, pro forma | 2.02 | 0.99 | 0.86 | ||||||
Diluted, as reported | 2.03 | 1.00 | 0.87 | ||||||
Diluted, pro forma | 2.00 | 0.98 | 0.86 | ||||||
| In thousands, except per share | |||
Net earnings, as reported | $ | 145,990 | |
Deduct: total stock-based employee compensation expense determined under fair value based method, net of tax | 2,381 | ||
Pro forma net earnings | $ | 143,609 | |
Earnings per share: | |||
Basic, as reported | $ | 1.65 | |
Basic, pro forma | 1.63 | ||
Diluted, as reported | 1.64 | ||
Diluted, pro forma | 1.61 | ||
Revenue Recognition:The Company recognizesWe recognize revenue upon transfer of title and risk of loss provided evidence of an arrangement exists, pricing is fixed and determinable, and collectibilitycollectability is probable. In circumstances where the collection of payment is highly questionable at the time of shipment, the Company deferswe defer recognition of revenue until payment is collected. The Company providesWe provide an allowance for expected returns based on experience and current customer activities. As of May 31, 2008 and May 31, 2007, we had deferred $9.1 million and $2.4 million, respectively, of revenue related to pricing disputes. Within the Construction Services segment, which represented less than 4% of consolidated net sales for the last three fiscal years, revenue is recognized on a percentage-of-completion method. Taxes collected from customers on revenues are reported on a net basis (excluded from revenues).
Advertising Expense:The Company expensesWe expense advertising costs as incurred. Advertising expense was $3,924,000, $3,024,000$4,220,000, $4,117,000 and $2,520,000$3,571,000 for fiscal 2005,2008, fiscal 20042007 and fiscal 2003, respectively.2006.
Shipping and Handling Fees and Costs:Shipping and handling fees billed to customers are included in net sales, and shipping and handling costs incurred by the Company are included in cost of goods sold.
Environmental Costs: Environmental costs are capitalized if the costs extend the life of the property, increase its capacity, and/or mitigate or prevent contamination from future operations. Costs related to environmental contamination treatment and clean-upclean up are charged to expense.
Statements of Cash Flows:Supplemental cash flow information for the years ended May 31 is as follows:
| In thousands | 2005 | 2004 | 2003 | ||||||
Interest paid | $ | 25,039 | $ | 21,889 | $ | 25,027 | |||
Income taxes paid, net of refunds | 155,901 | 4,749 | 37,909 | ||||||
| In thousands | 2008 | 2007 | 2006 | ||||||
Interest paid, net of amount capitalized | $ | 21,442 | $ | 21,884 | $ | 27,734 | |||
Income taxes paid, net of refunds | 29,641 | 49,600 | 67,163 | ||||||
Nonrecurring Losses:As partWe use the “look-through” approach for determining cash flow presentation of distributions from our unconsolidated joint ventures. Distributions paid out of the Company’s salecumulative operating cash flows of Buckeye Steel Castings Company (“Buckeye Steel”)our joint ventures are included in the fiscal year ended May 31, 1999, the acquirer assumed liability for certain workers’ compensation liabilities which arose while the Company’s workers’ compensation guarantee wasour statements of cash flows in place. The acquirer agreed to indemnify the Company against claims made on the guarantee related to the assumed workers’ compensation claims. During the second quarter of fiscal 2003, economic conditions caused Buckeye Steel to cease operations and file for bankruptcy thereby raising the issue of the acquirer’s ability to fulfill its obligations. As a result, the Company recorded a $5,400,000 reserve for the estimated potential liability relating to these workers’ compensation claims.
operating activities.
Income Taxes: In accordance with the provisions of SFAS No. 109,Accounting for Income Taxes the Company accounts(“SFAS 109”), we account for income taxes using the asset and liability method. The asset and liability method requires the recognition of deferred tax assets and liabilities for expected future tax consequences of temporary differences that currently exist between the tax basesbasis and financial reporting basesbasis of the Company’sour assets and liabilities. In assessing the realizability of deferred tax assets, the Company considerswe consider whether it is more likely than not that some, or a portion, of the deferred tax assets will not be realized. The Company providesWe provide a valuation allowance for deferred income tax assets when it is more likely than not that a portion of such deferred income tax assets will not be realized.
In June 2006, the Financial Accounting Standards Board (“FASB”) issued FASB Interpretation No. 48,Accounting for Uncertainty in Income Taxes – an interpretation of FASB Statement No. 109 (“FIN 48”). The Companyinterpretation addresses the determination of whether tax benefits claimed, or expected to be claimed, on a tax return should be recorded in the financial statements. Under FIN 48, a tax benefit may be recognized from an uncertain tax position only if it is more likely than not that the tax position will be sustained on examination by the taxing authorities, including resolution of any related appeals or litigation processes, based on the technical merits of the position. The tax benefits recognized in the financial statements from such a position should be measured based on the largest benefit that has a reservegreater than fifty percent likelihood of being realized upon ultimate settlement. FIN 48 also provides guidance on income tax related issues such as derecognition, classification, interest and penalties, accounting treatment in interim periods and increased disclosure requirements.
We have reserves for taxes and associated interest and penalties that may become payable as a result of auditsare determined in future periodsaccordance with respect to previously filed tax returns included in long-term liabilities. It is the Company’s policy to establish reserves for taxesFIN 48, that may become payable in future years as a result of an examinationaudits by taxing authorities. The Company establishesIt is our policy to record these in income tax expense. While we believe the reserves based upon management’s assessment of exposure associated with permanentpositions taken on previously filed tax differences,returns are appropriate, we have established the tax credits and interest expense applied to temporary difference adjustments.reserves in recognition that various taxing authorities may challenge our positions. The tax reserves are analyzed periodically, and adjustments are made as events occur to warrant adjustment to the reserves.
reserves, such as lapsing of applicable statutes of limitations, conclusion of tax audits, additional exposure based on current calculations, identification of new issues, release of administrative guidance or court decisions affecting a particular tax issue.
Recently Issued Accounting StandardsStandards::In November 2004,September 2006, the FASB issued SFAS No. 151,157,Inventory CostsFair Value Measurements (“, to establish a framework for measuring fair value and expand disclosures about fair value measurements. SFAS 151”). SFAS 151 amends the guidance in ARB No. 43, Chapter 4,Inventory Pricing to clarify the accounting for abnormal amounts of idle facility expense, freight, handling cost and wasted material (spoilage). In addition, SFAS 151 requires that allocation of fixed production overhead to the costs of conversion be based on the normal capacity of the production facilities. SFAS 151157 is effective for inventory costs incurred during fiscal years beginningfinancial assets and liabilities after June 15, 2005. The Company is in the process of evaluating the impact of SFAS 151 on the Company’s financial positionMay 31, 2008, and results of operations.
In December 2004, the FASB issuedfor non-financial assets and liabilities after May 31, 2009. SFAS No. 153,Exchanges of Non-monetary Assets, an amendment of APB Opinion No. 29 (“SFAS 153”).APB Opinion No. 29157 is based on the principle that exchanges of non-monetary assets should be measured by the fair value of the assets exchanged. The guidance in that Opinion, however, included certain exceptionsnot expected to that principle. SFAS 153 amends APB Opinion No. 29 to eliminate the exception for non-monetary exchanges of similar productive assets and replaces it with a general exception for exchanges of non-monetary assets that do not have commercial substance. SFAS 153 is effective for non-monetary exchanges occurring in fiscal periods beginning after June 15, 2005. The Company does not expect the adoption of SFAS 153 to have a materialmaterially impact on itsour consolidated financial position or results of operations.
In September 2006, the FASB issued SFAS No. 158,Employers’ Accounting for Defined Benefit Pension and Other Postretirement Plans – an amendment of FASB Statements No. 87, 88, 106, and 132(R), to improve financial reporting regarding defined benefit pension and other postretirement plans. We adopted the recognition provisions of SFAS No. 158 at May 31, 2007. The measurement date provision of SFAS No. 158 is effective at May 31, 2009, and is not expected to materially impact our consolidated financial position or results of operations.
In February 2007, the FASB issued SFAS No. 159,The Fair Value Option for Financial Assets and Financial Liabilities – Including an amendment of FASB Statement No. 115,to improve financial reporting by providing entities with the opportunity to mitigate volatility in reported earnings caused by measuring related assets and liabilities differently through the use of fair value measurements. SFAS No. 159 is effective June 1, 2008, and is not expected to materially impact our consolidated financial position or results of operations.
In December 2007, the FASB issued SFAS No. 141 (revised 2007) (“SFAS No. 141(R)”),Business Combinations,to improve the relevance, representational faithfulness and comparability of the information that a reporting entity provides in its financial reports about a business combination and its effects. SFAS No. 141(R) applies prospectively to business combinations after May 31, 2009, and is not expected to materially impact our consolidated financial position or results of operations.
In December 2007, the FASB issued SFAS No. 160,Noncontrolling Interests In Consolidated Financial Statements – an amendment of ARB No. 51,to improve the relevance, comparability and transparency of the financial information that a reporting entity provides in its consolidated financial statements by establishing accounting and reporting standards for the noncontrolling interest (minority interest) in a subsidiary and for the deconsolidation of a subsidiary. SFAS No. 160 is effective June 1, 2009, and will require a change in the presentation of the minority interest in the consolidated financial statements.
In March 2008, the FASB issued SFAS No. 161,Disclosures about Derivative Instruments and Hedging Activities – an amendment of FASB Statement No. 133,to improve the transparency of financial reporting by requiring enhanced disclosures about derivative and hedging activities. SFAS No. 161 is effective December 1, 2008.
Note B – Shareholders’ Equity
Preferred Shares:The Company’sWorthington Industries, Inc. Amended Articles of Incorporation authorize two classes of preferred shares and their relative voting rights. The boardBoard of directorsDirectors of Worthington Industries, Inc. is empowered to determine the issue prices, dividend rates, amounts payable upon liquidation, and other terms of the preferred shares when issued. No preferred shares are issued or outstanding.
Common SharesShares::The Company At its meeting on September 27, 2006, the Board of Directors of Worthington Industries, Inc. reconfirmed its authorization to repurchase up to 10,000,000 of Worthington Industries, Inc.’s outstanding common shares, which had initially been announced on June 13, 2005,2005. This repurchase authorization was completed during December 2007. On September 26, 2007, Worthington Industries, Inc. announced that its boardthe Board of directorsDirectors had authorized the repurchase of up to ten million, or approximately 11%,an additional 10,000,000 of its thenWorthington Industries, Inc.’s outstanding common shares. A total of 9,099,500 common shares remained available under this repurchase authorization as of May 31, 2008. The purchases wouldcommon shares available for purchase under this authorization may be madepurchased from time to time, on the open market or in private transactions, with consideration given to the market price of the common shares, the nature of other investment opportunities, cash flows from operations and general economic conditions. Repurchases may be made on the open market or through privately negotiated transactions.
Comprehensive Income:The components of other comprehensive income (loss) and related tax effects for the years ended May 31, were as follows:
| In thousands | 2005 | 2004 | 2003 | |||||||||
Other comprehensive income (loss): | ||||||||||||
Unrealized gain (loss) on investment | $ | 164 | $ | 94 | $ | (115 | ) | |||||
Foreign currency translation, net of tax of $(756), $0 and $(2,214) in 2005, 2004 and 2003 | 698 | (1,747 | ) | 2,909 | ||||||||
Minimum pension liability, net of tax of $203, $(492) and $1,463 in 2005, 2004 and 2003 | (332 | ) | 1,015 | (3,400 | ) | |||||||
Cash flow hedges, net of tax of $(661), $(2,628) and $(253) in 2005, 2004 and 2003 | 550 | 3,413 | 493 | |||||||||
Other comprehensive income (loss), net of tax | $ | 1,080 | $ | 2,775 | $ | (113 | ) | |||||
| In thousands | 2008 | 2007 | 2006 | ||||||||
Other comprehensive income (loss): | |||||||||||
Unrealized gain (loss) on investment | $ | - | $ | (296 | ) | $ | 139 | ||||
Foreign currency translation, net of tax of $0, $212 and $677 in 2008, 2007 and 2006 | 13,080 | 4,507 | 8,711 | ||||||||
Minimum pension liability, net of tax of $(44), $(139) and $28 in 2008, 2007 and 2006 | 590 | 34 | 2,473 | ||||||||
Cash flow hedges, net of tax of $6,290, $4,300 and $(8,364) in 2008, 2007 and 2006 | (12,218 | ) | (7,586 | ) | 17,106 | ||||||
Other comprehensive income (loss), net of tax | $ | 1,452 | $ | (3,341 | ) | $ | 28,429 | ||||
The components of cumulative other comprehensive loss,income (loss), net of tax, at May 31 were as follows:
| In thousands | 2005 | 2004 | ||||||
Unrealized gain (loss) on investment | $ | 152 | $ | (12 | ) | |||
Foreign currency translation | (2,251 | ) | (2,949 | ) | ||||
Minimum pension liability | (2,749 | ) | (2,417 | ) | ||||
Cash flow hedges | 3,535 | 2,985 | ||||||
Cumulative other comprehensive loss, net of tax | $ | (1,313 | ) | $ | (2,393 | ) | ||
| In thousands | 2008 | 2007 | ||||||
Unrealized loss on investment | $ | (5 | ) | $ | (5 | ) | ||
Foreign currency translation | 24,047 | 10,967 | ||||||
Defined benefit pension liability | (246 | ) | (836 | ) | ||||
Cash flow hedges | 837 | 13,055 | ||||||
Cumulative other comprehensive income, net of tax | $ | 24,633 | $ | 23,181 | ||||
Reclassification adjustments for cash flow hedges in fiscal 2005,2008, fiscal 2004,2007 and fiscal 20032006 were $1,402,000$7,514,000 (net of tax of $859,000)$3,719,000), $248,000$9,046,000 (net of tax of $152,000)$4,617,000) and $(519,000)$4,382,000 (net of tax of $(318,000)), respectively.
$2,686,000).
The estimated net amount of the existing gains or losses in other comprehensive income at May 31, 20052008 expected to be reclassified into net earnings within the twelve months was $1,192,000.$2,235,000 (net of tax of $1,106,000). This amount was computed using the fair value of the cash flow hedges at May 31, 20052008, and will change before actual reclassification from other comprehensive income to net earnings during fiscal 2006.
2009.
Note C – Debt
Debt at May 31 is summarized as follows:
| In thousands | 2005 | 2004 | 2008 | 2007 | ||||||||
7.125% senior notes due May 15, 2006 | $ | 142,409 | $ | 142,409 | ||||||||
6.700% senior notes due December 1, 2009 | 145,000 | 145,000 | ||||||||||
Notes payable | $ | 135,450 | $ | 31,650 | ||||||||
6.7% senior notes due December 1, 2009 | 145,000 | 145,000 | ||||||||||
Floating rate senior notes due December 17, 2014 | 100,000 | — | 100,000 | 100,000 | ||||||||
Other | 1,023 | 2,359 | ||||||||||
Total debt | 388,432 | 289,768 | 380,450 | 276,650 | ||||||||
Less current maturities and short-term notes payable | 143,432 | 1,346 | ||||||||||
Less current maturities and notes payable | 135,450 | 31,650 | ||||||||||
Total long-term debt | $ | 245,000 | $ | 288,422 | $ | 245,000 | $ | 245,000 | ||||
As ofAt May 31, 2005, the Company had a $435,000,000 multi-year2008, notes payable consisted of $125,450,000 of borrowings under our revolving credit facility, provideddescribed below, and $10,000,000 of borrowings on uncommitted credit lines. The average variable rate was 3.16% at May 31, 2008, and is based on our senior unsecured long-term debt ratings assigned by a groupStandard & Poor’s Ratings Group and Moody’s Investors Service, Inc. At May 31, 2007, our notes payable consisted of 15 banks, which matures in May 2007. During July 2004, the Company amended its $235,000,000$21,650,000 of borrowings under our revolving credit facility and $10,000,000 of borrowings on uncommitted credit lines. The average variable rate was 5.81%.
On May 6, 2008, we amended our $435,000,000 five-year revolving credit facility, which had been due to increase its sizeexpire on September 29, 2010. The amendment extended the commitment date to $435,000,000May 6, 2013, except for a $35,000,000 commitment by one lender that will expire on September 29, 2010. In addition, the amendment increased the facility fees and to eliminate certain covenants. The Company pays commitmentapplicable percentage for base rate and Eurodollar loans payable. Borrowings under this facility have maturities of less than one year. We pay facility fees on the unused credit amount under the facility.commitment amount. Interest rates on borrowings under the facility and related facility fees are determined by the Company’sbased on our senior unsecured long-term debt ratings as assigned by Standard & Poor’sPoor's Ratings ServicesGroup and Moody’sMoody's Investors Service. There was no outstanding balance under the facility at May
31, 2005 or 2004.Service, Inc. The covenants in the revolving credit facility include, among others, maintenance of a debt-to-total capitalizationdebt-to-total-capitalization ratio of not more than 55% at the end of any fiscal quarter and maintenance of a debt-to-EBITDA (Earnings Before Interest, Taxes, Depreciation and Amortization)an interest coverage ratio of not moreless than 3.003.25 times through maturity. The Company wasWe were in compliance with all covenants under the revolving credit facility at May 31, 2005.2008.
We also have $40,000,000 of uncommitted credit lines available at the discretion of several banks. These facilities were established with major domestic banks.
Effective December 17, 2004, the Company issued $100,000,000 in aggregate principal amount of unsecured Floating Rate Senior NotesThe floating rate notes are due on December 17, 2014 (the “2014(“2014 Notes”) through a private placement. The 2014 Notesand bear interest at a variable rate equal to six-month LIBOR plus 80 basis points. This rate was 3.51%5.63% as of May 31, 2005.2008. However, we entered into an interest rate swap agreement whereby we receive interest on the $100,000,000 notional amount at the six-month LIBOR rate and we pay interest on the same notional amount at a fixed rate of 4.46%, effectively fixing the interest rate at 5.26%. The notes2014 Notes are callable at the Company’s option,par, at par, on or after December 17, 2006.our option. The covenants in the notes2014 Notes, as amended December 19, 2006, include among others, maintenance of a debt-to-total capitalizationdebt-to-total-capitalization ratio of not more than 55% and maintenance of a debt-to-EBITDAan interest coverage ratio, calculated at the end of any fiscal quarter, of not moreless than 3.253.0 times through maturity. The Company wasWe were in compliance with all covenants under the 2014 Notes at May 31, 2005.
In anticipation of the issuance of the 2014 Notes, the Company entered into an interest rate swap agreement in October 2004, which was amended in December 2004. Under the terms of the agreement, the Company receives interest on a $100,000,000 notional amount at the six-month LIBOR rate and the Company pays interest on the same notional amount at a fixed rate of 4.46%.
At May 31, 2005, the Company’s “Other” debt represented debt from foreign operations with an interest rate of 0%.
2008.
Principal payments due on long-term debt in the next five fiscal years and the remaining years thereafter are as follows:
| In thousands | |||
2006 | $ | 143,432 | |
2007 | — | ||
2008 | — | ||
2009 | — | ||
2010 | 145,000 | ||
Thereafter | 100,000 | ||
Total | $ | 388,432 | |
| In thousands | |||
2009 | $ | - | |
2010 | 145,000 | ||
2011 | - | ||
2012 | - | ||
2013 | - | ||
Thereafter | 100,000 | ||
Total | $ | 245,000 | |
Note D – Income Taxes
Earnings before income taxes for the years ended May 31 include the following components:
| In thousands | 2005 | 2004 | 2003 | 2008 | 2007 | 2006 | ||||||||||||
Pre-tax earnings: | ||||||||||||||||||
United States based operations | $ | 271,831 | $ | 119,658 | $ | 107,948 | $ | 95,418 | $ | 106,246 | $ | 194,427 | ||||||
Non - United States based operations | 16,638 | 7,806 | 10,450 | 50,275 | 59,771 | 18,322 | ||||||||||||
| $ | 288,469 | $ | 127,464 | $ | 118,398 | $ | 145,693 | $ | 166,017 | $ | 212,749 | |||||||
Significant components of income tax expense for the years ended May 31 were as follows:
| In thousands | 2005 | 2004 | 2003 | |||||||||
Current: | ||||||||||||
Federal | $ | 94,295 | $ | 52,720 | $ | 20,391 | ||||||
State and local | 13,387 | 7,061 | 1,060 | |||||||||
Foreign | 2,871 | 3,439 | 5,353 | |||||||||
| 110,553 | 63,220 | 26,804 | ||||||||||
Deferred: | ||||||||||||
Federal | (4,434 | ) | (19,034 | ) | 16,963 | |||||||
State | 3,634 | (2,229 | ) | 208 | ||||||||
Foreign | (696 | ) | (1,245 | ) | (760 | ) | ||||||
| (1,496 | ) | (22,508 | ) | 16,411 | ||||||||
| $ | 109,057 | $ | 40,712 | $ | 43,215 | |||||||
| In thousands | 2008 | 2007 | 2006 | |||||||||
Current: | ||||||||||||
Federal | $ | 29,969 | $ | 38,644 | $ | 56,911 | ||||||
State and local | 2,617 | 1,617 | 8,343 | |||||||||
Foreign | 9,258 | 14,919 | 14,150 | |||||||||
| 41,844 | 55,180 | 79,404 | ||||||||||
Deferred: | ||||||||||||
Federal | (3,038 | ) | (2,402 | ) | (6,051 | ) | ||||||
State | (1,601 | ) | (334 | ) | (1,950 | ) | ||||||
Foreign | 1,411 | (332 | ) | (4,644 | ) | |||||||
| (3,228 | ) | (3,068 | ) | (12,645 | ) | |||||||
| $ | 38,616 | $ | 52,112 | $ | 66,759 | |||||||
Tax benefits related to the exercise of optionsstock-based compensation that were credited to additional paid-in capital were $3,542,000, $446,000$2,035,000, $2,370,000 and $489,000$1,279,000 for fiscal 2005,2008, fiscal 2004,2007 and fiscal 2003, respectively.2006. Tax benefits (expenses) related to foreign currency translation adjustments that were credited to (deducted from) other comprehensive income were $(756,000), $0, $212,000, and $(2,214,000)$677,000 for fiscal 2005,2008, fiscal 2004,2007 and fiscal 2003, respectively. The tax2006. Tax benefits (expenses) related to minimumdefined benefit pension liability that were credited to (deducted from) other comprehensive income were $203,000, $(492,000)($44,000), $(393,000), and $1,463,000$28,000 for fiscal 2005,2008, fiscal 2004,2007 and fiscal 2003 respectively.2006. Tax benefits (expenses) related to cash flow hedges that were credited to (deducted from) other comprehensive income were $(661,000), $(2,628,000)$6,290,000, $4,300,000, and $(253,000)$(8,364,000) for fiscal 2005,2008, fiscal 2004,2007 and fiscal 2003, respectively.2006. Tax benefits related to the gain from the dilution of our interest in TWB Company, L.L.C. (“TWB”) as a result of our partner’s contribution to this unconsolidated joint venture credited to additional paid-in capital were $1,032,000 for fiscal 2008 (see Note J).
TheA reconciliation of the differences between the effective incomefederal statutory tax rate and the statutory federal income tax rate for the years ended May 31 is asof 35 percent to total provisions (benefits) follows:
| 2005 | 2004 | 2003 | |||||||
Federal statutory rate | 35.0 | % | 35.0 | % | 35.0 | % | |||
State and local income taxes, net of federal tax benefit | 3.0 | 2.5 | 1.5 | ||||||
Reversal of income tax accruals for favorable resolution of tax audits and change in estimate of deferred tax | (0.2 | ) | (6.1 | ) | — | ||||
Foreign and other | — | 0.5 | — | ||||||
Effective tax rate | 37.8 | % | 31.9 | % | 36.5 | % | |||
The Company establishes reserves based upon management’s assessment of exposure associated with permanent tax differences, tax credits, interest expense applied to temporary difference adjustments and tax return positions. The tax reserves are analyzed periodically, and adjustments are made as events occur to warrant adjustment to the reserve. As a result of the favorable resolution of certain tax audits and related developments, the Company decreased the tax reserve by $2,112,000 and $3,377,000 for fiscal 2005 and fiscal 2004, respectively.
The Company adjusted deferred taxes in fiscal 2005 and fiscal 2004, resulting in a $1,628,000 increase and $1,361,000 decrease, respectively, in income tax expense.
| 2008 | 2007 | 2006 | |||||||
Federal statutory rate | 35.0 | % | 35.0 | % | 35.0 | % | |||
State and local income taxes, net of federal tax benefit | 0.7 | 1.5 | 3.6 | ||||||
Change in income tax accruals for resolution of tax audits and change in estimate of deferred tax | (1.7 | ) | 1.1 | (1.4 | ) | ||||
Non-U.S. income taxes at other than 35% | (4.6 | ) | (3.6 | ) | (4.1 | ) | |||
Ohio income tax law change | - | - | (2.3 | ) | |||||
Special foreign earnings repatriations and sale of non-U.S. company | - | - | 2.5 | ||||||
Deferred tax adjustment for foreign earnings | - | - | (2.2 | ) | |||||
Other | (2.9 | ) | (2.6 | ) | 0.3 | ||||
Effective tax rate | 26.5 | % | 31.4 | % | 31.4 | % | |||
The Company has considered undistributed earnings of foreign subsidiaries to be indefinitely reinvested. However, on October 22, 2004, the President of the United States signed the American Jobs Creation Act of 2004 (the “Act”). The Act provides an 85% dividends-received-deduction on qualifying dividends from controlled foreign corporations. On December 21, 2004,In June 2006, the FASB issued SFASFASB Interpretation No. 109-2,48,Accounting and Disclosure Guidance for the Foreign Earnings Repatriation Provision within the American Jobs Creation ActUncertainty in Income Taxes – an interpretation of 2004, which provides relief concerning the timing of the SFASFASB Statement No. 109 requirement to accrue deferred taxes for unremitted earnings (“FIN 48”). The interpretation addresses the determination of foreign subsidiaries. The FASB determined that the provisions of the Act were sufficiently complex and
ambiguous that companies may not be in a position to determine the impact of the Act on their plans for repatriationwhether tax benefits claimed, or reinvestment of foreign earnings or the corresponding deferred tax liability. Accrual of any deferred tax liability is not required until companies have the information necessary to determine the amount of earningsexpected to be repatriated andclaimed, on a reasonable estimate cantax return should be made of the deferred tax liability.
The Company is still evaluating the potential effect this provision will have should it decide to repatriate earnings from foreign operations. Currently, the Company expects this evaluation and any repatriation to be completed in fiscal 2006. Depending on the outcome of this evaluation, the Company could repatriate up to $74,300,000, representing all of its foreign earnings. The corresponding tax effect of a total repatriation would be $3,900,000.
The components of the Company’s deferred tax assets and liabilities as of May 31 were as follows:
| In thousands | 2005 | 2004 | ||||||
Deferred tax assets: | ||||||||
Accounts receivable | $ | 5,820 | $ | 6,312 | ||||
Inventories | 3,181 | 3,050 | ||||||
Accrued expenses | 20,642 | 15,370 | ||||||
Restructuring expense | — | 5,008 | ||||||
Net operating loss carryforwards | 17,374 | 24,321 | ||||||
Tax credit carryforwards | 2,276 | 3,060 | ||||||
Income taxes | 1,277 | — | ||||||
Total deferred tax assets | 50,570 | 57,121 | ||||||
Valuation allowance for deferred tax assets | (17,858 | ) | (21,127 | ) | ||||
Net deferred tax assets | 32,712 | 35,994 | ||||||
Deferred tax liabilities: | ||||||||
Property, plant and equipment | 106,287 | 113,455 | ||||||
Income taxes | — | 1,492 | ||||||
Undistributed earnings of unconsolidated affiliates | 23,393 | 17,198 | ||||||
Other | 3,004 | 4,102 | ||||||
Total deferred tax liabilities | 132,684 | 136,247 | ||||||
Net deferred tax liability | $ | 99,972 | $ | 100,253 | ||||
The above amounts are classifiedrecorded in the consolidated balance sheets as of May 31 as follows:
| In thousands | 2005 | 2004 | ||||||
Current assets: | ||||||||
Deferred income taxes | $ | 19,490 | $ | 3,963 | ||||
Noncurrent liabilities: | ||||||||
Deferred income taxes | 119,462 | 104,216 | ||||||
Net deferred tax liabilities | $ | 99,972 | $ | 100,253 | ||||
At May 31, 2005, the Company hadfinancial statements. Under FIN 48, a tax benefits for federal net operating loss carryforwards of $785,000 that expirebenefit may be recognized from fiscal 2006 to fiscal 2019. These net operating loss carryforwards are subject to utilization limitations. At May 31, 2005, the Company hadan uncertain tax benefits for state net operating loss carryforwards of $11,905,000 that expire from fiscal 2006 to fiscal 2024 and state credit carryforwards of $2,276,000. At May 31, 2005, the Company had tax benefits for foreign net operating loss carryforwards of $4,684,000 for income tax purposes that expire from fiscal 2006 to fiscal 2011.
A valuation allowance of $17,858,000 has been recognized to offset the deferred tax assets related to the net operating loss carryforwards and state credit carryforwards. The valuation allowance includes $785,000 for
federal, $12,617,000 for state and $4,456,000 for foreign. The majority of the state valuation allowance relates to a corporation which owned the Decatur, Alabama, facility while the majority of the foreign valuation allowance relates to operations in the Czech Republic and Portugal. The Company has determined thatposition only if it is more likely than not that therethe tax position will not be sufficient taxable income in future years to utilize allsustained on examination by the taxing authorities, including resolution of any related appeals or litigation processes, based on the technical merits of the net operating loss carryforwards.position. The tax benefits recognized in the financial statements from such a position should be measured based on the largest
benefit that has a greater than fifty percent likelihood of being realized upon ultimate settlement. FIN 48 also provides guidance on income tax related issues such as derecognition, classification, interest and penalties, accounting treatment in interim periods and increased disclosure requirements.
On June 1, 2007, we adopted the provisions of FIN 48. There was no effect on our consolidated financial position or cumulative adjustment to our beginning retained earnings as a result of the implementation. However, certain amounts have been reclassified on the consolidated balance sheets in order to comply with the requirements of the interpretation.
The total amount of unrecognized tax benefits was $2,093,000 and $16,826,000 as of May 31, 2008 and June 1, 2007, respectively. The total amount of unrecognized tax benefits that, if recognized, would affect the effective tax rate was $1,966,000 as of May 31, 2008. Unrecognized tax benefits are the differences between a tax position taken, or expected to be taken in a tax return, and the benefit recognized for accounting purposes pursuant to FIN 48. Accrued amounts of interest and penalties related to unrecognized tax benefits are recognized as part of income tax expense within our consolidated statement of earnings. As of May 31, 2008 and June 1, 2007, we had accrued liabilities of $720,000 and $5,056,000, respectively, for interest and penalties within the unrecognized tax benefits.
A tabular reconciliation of unrecognized tax benefits follows:
| In thousands | ||||
Balance at June 1, 2007 | $ | 16,826 | ||
Increases – tax positions taken in prior years | 403 | |||
Decreases – tax positions taken in prior years | (9,830 | ) | ||
Increases – current tax positions | 63 | |||
Decreases – current tax positions | (112 | ) | ||
Lapse of statute | (5,257 | ) | ||
Balance at May 31, 2008 | $ | 2,093 | ||
Approximately $1,205,000 of the liability for unrecognized tax benefits is expected to be settled in the next twelve months due to the expiration of statutes of limitations in various tax jurisdictions. While it is expected that the amount of unrecognized tax benefits will change in the next twelve months, any change is not expected to have a material impact on our consolidated financial position, results of operations or cash flows.
Following is a summary of the tax years open to examination by major tax jurisdiction:
U.S. Federal – 2000 – 2003; 2005 and forward
U.S. State and Local – 2003 and forward
Austria – 2001 and forward
We also adjusted our deferred taxes in fiscal 2008 and fiscal 2007, resulting in an increase (decrease) of $(2,057,000) and $917,000 in income tax expense, respectively. Fiscal 2007 included adjustments for changes to estimated tax liabilities. Fiscal 2006 included a $4,623,000 adjustment for an over-accrual of deferred tax liabilities related to the foreign earnings of the Worthington Armstrong Venture (“WAVE”) joint venture and a $4,346,000 deferred tax liability adjustment for the Ohio tax law change, discussed below, offset by a $3,370,000 adjustment for changes in estimated tax liabilities.
On June 30, 2005, the Statestate of Ohio enacted various changes to its tax laws. One change iswas the phase outphase-out of the Ohio franchise tax, which is generally based on federal taxable income. This phase outphase-out is scheduled to occur at the rate of 20% per year for 2006 through 2010. The Company’sOur accrual for income taxes for fiscal
2005 included 100% of the expected Ohio franchise tax liability. As a result of the law change, only 80% of that liability will be duewas due. As such, in fiscal 2006 we made an adjustment to reduce our accrued income taxes. In addition, as a result of the first 20% phase out. As such, during the first quarter of fiscal 2006, the Company will make an adjustment to reduce its accrued income taxes in the amount of $683,000. In addition, the Company is still evaluating the effect the various changes to Ohio’s tax laws will have on its deferred taxes. This evaluation will be completed and any adjustment toin fiscal 2006, we adjusted our deferred taxes will beby $4,346,000.
Taxes on Foreign Income
Pre-tax earnings attributable to foreign sources for fiscal 2008, fiscal 2007 and fiscal 2006 is as noted above. Without regard to the one-time repatriation discussed above, as of May 31, 2008, and based on the tax laws in effect at that time, it remains our intention to continue to indefinitely reinvest our undistributed foreign earnings, except for the foreign earnings of our TWB joint venture. Accordingly, where this election has been made, no deferred tax liability has been recorded for those foreign earnings. Undistributed earnings of our consolidated foreign subsidiaries at May 31, 2008, amounted to $212,082,000. If such earnings were not permanently reinvested, a deferred tax liability of $21,777,000 would have been required.
The American Jobs Creation Act of 2004 created a temporary incentive for U.S. corporations to repatriate accumulated income earned abroad by providing an 85 percent dividends-received deduction for certain dividends from controlled foreign corporations. During fiscal 2006, we approved a plan for reinvestment and repatriated a cash dividend amount of $42,157,000, of which $41,395,000 qualified for the 85 percent dividends-received deduction. Pursuant to the plan for reinvestment, during fiscal 2006, we made expenditures for capital additions and improvements and other qualifying amounts at our domestic facilities in excess of the $42,157,000 cash dividend amount. As a result, we recorded a related tax expense of $1,702,000 for the cash dividend repatriation.
The components of our deferred tax assets and liabilities as of May 31 were as follows:
| In thousands | 2008 | 2007 | ||||||
Deferred tax assets: | ||||||||
Accounts receivable | $ | 2,300 | $ | 3,044 | ||||
Inventories | 6,021 | 4,024 | ||||||
Accrued expenses | 18,609 | 14,900 | ||||||
Net operating loss carryforwards | 17,989 | 17,048 | ||||||
Tax credit carryforwards | 2,473 | 1,012 | ||||||
Stock-based compensation | 2,362 | 1,173 | ||||||
Other | 1,041 | 1,082 | ||||||
Total deferred tax assets | 50,795 | 42,283 | ||||||
Valuation allowance for deferred tax assets | (13,248 | ) | (12,930 | ) | ||||
Net deferred tax assets | 37,547 | 29,353 | ||||||
Deferred tax liabilities: | ||||||||
Property, plant and equipment | 97,057 | 94,462 | ||||||
Derivative contracts | 1,247 | 8,013 | ||||||
Undistributed earnings of unconsolidated affiliates | 17,207 | 14,552 | ||||||
Income taxes | 862 | 463 | ||||||
Other | 380 | 249 | ||||||
Total deferred tax liabilities | 116,753 | 117,739 | ||||||
Net deferred tax liability | $ | 79,206 | $ | 88,386 | ||||
The above amounts are classified in the first quarterconsolidated balance sheets as of fiscal 2006.May 31 as follows:
| In thousands | 2008 | 2007 | ||||
Current assets: | ||||||
Deferred income taxes | $ | 17,966 | $ | 13,067 | ||
Other assets: | ||||||
Deferred income taxes | 3,639 | 4,530 | ||||
Noncurrent liabilities: | ||||||
Deferred income taxes | 100,811 | 105,983 | ||||
Net deferred tax liabilities | $ | 79,206 | $ | 88,386 | ||
At May 31, 2008, we had tax benefits for federal net operating loss carryforwards of $131,000 that expire from fiscal 2009 to fiscal 2019. These net operating loss carryforwards are subject to utilization limitations. At May 31, 2008, we had tax benefits for state net operating loss carryforwards of $12,962,000 that expire from fiscal 2009 to fiscal 2028 and state credit carryforwards of $1,411,000 that expire from fiscal 2009 to fiscal 2030. At May 31, 2008, we had tax benefits for foreign net operating loss carryforwards of $4,896,000 for income tax purposes that expire from fiscal 2009 to fiscal 2018. At May 31, 2008, we had tax benefits for foreign tax credit carryforwards of $1,062,000 that expire in fiscal 2016.
A valuation allowance of $13,248,000 has been recognized to offset the deferred tax assets related to the net operating loss carryforwards and foreign tax credit carryforwards and certain state tax credits. The valuation allowance includes $930,000 for federal, $10,914,000 for state and $1,404,000 for foreign. The majority of the federal valuation allowance relates to the foreign tax credit with the remainder relating to the net operating loss carryforward. The majority of the state valuation allowance relates to owning the Decatur, Alabama, facility while the foreign valuation allowance relates to operations in Portugal and China. We have determined that it is more likely than not that deferred tax assets are realizable, except for certain net operating loss carryforwards and tax credits.
Note E – Employee Pension Plans
The Company provides pensionWe provide retirement benefits to employees mainly through defined benefit orcontributory, deferred profit sharing plans. The Company hasContributions to the deferred profit sharing plans are determined as a percentage of our pre-tax income before profit sharing, with contributions guaranteed to represent at least 3% of the participants’ compensation. We match employee contributions at 50% up to defined maximums. We also have one defined pension benefit plan, The Gerstenslager Company Bargaining Unit Employees’ Pension Plan.Plan (the “Gerstenslager Plan”). The defined benefit planGerstenslager Plan is a non-contributory pension plan, which covers certain employees based on age and length of service. CompanyOur contributions to this plan comply with ERISA’sERISA's minimum funding requirements.
Effective May 31, 2007, we adopted SFAS No. 158, “Employers’ Accounting for Defined Benefit Pension and Other Postretirement Plans – an Amendment of FASB Statements No. 87, 88, 106 and 132(R)”. The remaining employees are coveredadoption did not materially impact our consolidated financial position or results of operations. Also, as required by deferred profit sharing plans to which employees may also contribute. Company contributions toSFAS No. 158, for our fiscal year ending May 31, 2009, and thereafter, we will measure the deferred profit sharing plans are determined as a percentageassets and benefit obligations of the Company’s pre-tax income before profit sharing. In addition,Gerstenslager Plan at May 31, rather than the Company began matching employee contributions upcurrent March 31 measurement date. We do not expect the change in measurement date to 2%materially affect our consolidated financial position, results of their pay starting in January 2003.operations or cash flows.
As part of its consolidation plan announced in fiscal 2002, the Company recognized in the restructuring charge actual curtailment losses on plan assets of $3,135,000 in fiscal 2003. The loss primarily resulted from the recognition of prior service costs of terminated employees in the Malvern, the NRM Trucking and the Jackson defined benefit plans. During fiscal 2003 and fiscal 2004, the Internal Revenue Service and the Pension Benefit Guaranty Corporation approved The Notice of Intent to Terminate and Freeze the Malvern, NRM Trucking and Jackson plans. Annuity contracts were purchased in fiscal 2004 and fiscal 2003 to settle the liabilities under these plans. During fiscal 2004, the liabilities of the Malvern, NRM Trucking and Jackson plans were settled through annuity purchases requiring additional employer contributions of $5,991,000.
The following table summarizes the components of net periodic pension cost, excludingfor the amounts recorded as part of the restructuring charge, forGerstenslager Plan (i.e. the defined benefit plan) and the defined contribution plans for the years ended May 31:
| In thousands | 2005 | 2004 | 2003 | |||||||||
Defined benefit plans: | ||||||||||||
Service cost | $ | 696 | $ | 703 | $ | 645 | ||||||
Interest cost | 646 | 600 | 1,419 | |||||||||
Actual loss (return) on plan assets | (622 | ) | (2,160 | ) | 3,032 | |||||||
Net amortization and deferral | 323 | 2,222 | (4,242 | ) | ||||||||
Net pension cost on defined benefit plans | 1,043 | 1,365 | 854 | |||||||||
Defined contribution plans | 10,776 | 9,920 | 6,540 | |||||||||
Total pension cost | $ | 11,819 | $ | 11,285 | $ | 7,394 | ||||||
Defined benefit plan: Service cost Interest cost Actual return on plan assets Net amortization and deferral Net pension cost on defined benefit plan Defined contribution plans Total retirement plan costIn thousands 2008 2007 2006 $ 599 $ 610 $ 700 900 818 719 496 (1,257 ) (1,621 ) (1,538 ) 396 1,149 457 567 947 11,641 9,694 9,663 $ 12,098 $ 10,261 $ 10,610
The following actuarial assumptions were used for the Company’sour defined benefit pension plans:plan:
| 2005 | 2004 | 2003 | 2008 | 2007 | 2006 | ||||||||||
Terminated Plans: | |||||||||||||||
Weighted average discount rate | — | — | 5.37% | ||||||||||||
Weighted average expected long-term rate of return | — | — | 1.00% | ||||||||||||
Continuing Plan: | |||||||||||||||
To determine benefit obligation: | |||||||||||||||
Discount rate | 5.61% | 5.75% | 6.00% | 6.82 | % | 6.14 | % | 6.03 | % | ||||||
To determine net periodic pension cost: | |||||||||||||||
Discount rate | 5.75% | 6.00% | 7.00% | 6.14 | % | 6.03 | % | 5.61 | % | ||||||
Expected long-term rate of return | 7.00% | 7.00% | 9.00% | 8.00 | % | 8.00 | % | 8.00 | % | ||||||
Rate of compensation increase | n/a | n/a | n/a | n/a | n/a | n/a | |||||||||
To calculate the discount rate, we used the expected cash flows of the benefit payments and the Citigroup Pension Index. The expected long-term rate of returnsreturn on the continuingdefined benefit plan in fiscal 20052008, fiscal 2007 and fiscal 2004 are2006 was based on the actual historical returns adjusted for a change in the frequency of lump sum settlements upon retirement. The expected long-term rate of return on the continuing plan for fiscal 2003 was based on historical returns.
The following tables provide a reconciliation of the changes in the projected benefit obligation and fair value of plan assets and the funded status for the defined benefit plan during fiscal 20052008 and fiscal 20042007 as of the March 31, measurement date:
| In thousands | 2005 | 2004 | 2008 | 2007 | ||||||||||||
Change in benefit obligation | ||||||||||||||||
Benefit obligation, beginning of year | $ | 11,844 | $ | 24,913 | $ | 14,626 | $ | 13,696 | ||||||||
Service cost | 696 | 703 | 599 | 610 | ||||||||||||
Interest cost | 646 | 600 | 900 | 818 | ||||||||||||
Settlements | — | (14,660 | ) | |||||||||||||
Actuarial loss | 302 | 358 | ||||||||||||||
Actuarial gain | (1,577 | ) | (327 | ) | ||||||||||||
Benefits paid | (131 | ) | (70 | ) | (219 | ) | (171 | ) | ||||||||
Benefit obligation, end of year | $ | 13,357 | $ | 11,844 | $ | 14,329 | $ | 14,626 | ||||||||
Change in plan assets | ||||||||||||||||
Fair value, beginning of year | $ | 8,746 | $ | 15,037 | $ | 16,135 | $ | 13,373 | ||||||||
Actual return on plan assets | 622 | 2,160 | (496 | ) | 1,257 | |||||||||||
Company contributions | — | 821 | - | 1,677 | ||||||||||||
Settlements | — | (9,202 | ) | |||||||||||||
Benefits paid | (131 | ) | (70 | ) | (219 | ) | (172 | ) | ||||||||
Fair value, end of year | $ | 9,237 | $ | 8,746 | $ | 15,420 | $ | 16,135 | ||||||||
Funded Status | $ | 1,091 | $ | 1,509 | ||||||||||||
Amounts recognized in the statement of financial position consist of: | ||||||||||||||||
Noncurrent assets | $ | 1,091 | $ | 1,509 | ||||||||||||
Cumulative other comprehensive income | 869 | 909 | ||||||||||||||
Amounts recognized in cumulative other comprehensive income consist of: | ||||||||||||||||
Net loss | 650 | 450 | ||||||||||||||
Prior service cost | 219 | 459 | ||||||||||||||
Total | $ | 869 | $ | 909 | ||||||||||||
The following table shows other changes in plan assets and benefit obligations recognized in other comprehensive income during the fiscal year ended May 31:
Projected benefit obligation in excess of plan assets as of measurement date Unrecognized net actuarial loss Unrecognized prior service cost Minimum pension liability Accrued benefit cost Plans with benefit obligations in excess of fair value of plan assets: Projected and accumulated benefit obligation Fair value of plan assets Funded status 2005 2004 $ (4,120 ) $ (3,098 ) 2,776 2,557 939 1,179 (3,715 ) (3,736 ) $ (4,120 ) $ (3,098 ) $ 13,357 $ 11,844 9,237 8,746 $ (4,120 ) $ (3,098 )
| In thousands | 2008 | 2007 | ||||||
Adjustment to minimum liability | $ | - | $ | 483 | ||||
Net actuarial gain (loss) | 201 | (483 | ) | |||||
Amortization of prior service cost | (240 | ) | (240 | ) | ||||
Elimination of minimum liability | - | (483 | ) | |||||
Total recognized in other comprehensive income | $ | (39 | ) | $ | (723 | ) | ||
Total recognized in net periodic benefit cost and other comprehensive income | $ | 417 | $ | (156 | ) | |||
The estimated prior service cost for the defined benefit pension plan that will be amortized from accumulated other comprehensive income into net periodic benefit cost over the next fiscal year is $219,000.
Plan assets for the continuingdefined benefit plan consist principally of the following as of the March 31 measurement date:
| 2005 | 2004 | ||||
Asset category | |||||
Equity securities | 70% | 71% | |||
Debt securities | 30% | 29% | |||
Total | 100% | 100% | |||
| 2008 | 2007 | |||||
Asset category | ||||||
Equity securities | 68 | % | 70 | % | ||
Debt securities | 32 | % | 30 | % | ||
Total | 100 | % | 100 | % | ||
Equity securities include no employer stock. The investment policiespolicy and strategiesstrategy for the continuingdefined benefit plan are as follows:is: (i) The plan’s objectives are long-term in nature andwith liquidity requirements that are anticipated to be minimal due to the projected normal retirement date of the average employee and the current average age of participants.participants; (ii) The plan’s objective is to earn nominal returns, net of investment fees, equal to or in excess of the actuarial assumption of the plan.plan; and (iii) Theto include a strategic asset allocation includesof 60-80% equities, including international, and 20-40% fixed income investments.
Contributions No contributions to the continuingdefined benefit plan are expected to be approximately $3,000,000 during fiscal 2006.2009. The following estimated future benefits, which reflect expected future service, as appropriate, are expected to be paid:
| In thousands | |||
2006 | $ | 111 | |
2007 | 137 | ||
2008 | 158 | ||
2009 | 236 | ||
2010 | 261 | ||
2011-2015 | 2,573 | ||
| In thousands | |||
2009 | $ | 260 | |
2010 | 287 | ||
2011 | 346 | ||
2012 | 404 | ||
2013 | 524 | ||
2014-2018 | 4,010 | ||
Austrian commercialCommercial law requires the Companyus to pay severance and service benefits to employees.employees at our Austrian Pressure Cylinders location. Severance benefits have tomust be paid to all employees hired before December 31, 2002. Employees hired after that date are covered under a governmental plan that requires the Companyus to pay benefits as a percentage of compensation (included in payroll tax withholdings). Service benefits are based on a percentage of compensation and years of service. The accrued liability for these plans was $5,017,000$6,879,000 and $4,806,000$5,768,000 at May 31, 20052008 and 2004, respectively,2007, and was included in ‘Other liabilities’. Austrian tax law requires a percentage ofother liabilities on the accrued liability for severance benefits to be held in securities. This amount was $705,000 at May 31, 2005 and was included in ‘Other assets’. This requirement will no longer be law after fiscal 2007.consolidated balance sheets. Net periodic pension cost for these plans was $570,000, $550,000,$587,000, $588,000, and $558,000$580,000 for fiscal 2005,2008, fiscal 20042007 and fiscal 2003, respectively.2006. The assumed salary rate increase was 3.5 %3.5% for fiscal 20052008, fiscal 2007 and fiscal 2004, and 4.0% for fiscal 2003.2006. The discount rate at May 31, 20052008, 2007 and 20042006 was 5.61%6.00%, 4.80% and 5.25%, respectively.4.70%. This discount rate is based on a published corporate bond rate with a term approximating the estimated benefit payment cash flows and is consistent with European and Austrian regulations.
Note F – Stock-Based Compensation
Under itsour employee stock optionand non-employee directors stock-based compensation plans, the Companywe may grant incentive or non-qualified stock options and performance shares to employees, and non-qualified stock options and restricted stock to non-employee directors. The stock options may be granted to purchase common shares at not less than 100% of fair market value on the date of grant andthe grant. All outstanding stock options are non-qualified stock options at a price determined by the Compensation and Stock Option Committee. The company also has a plan for non-employee directors. Under this plan, the Company may grant non-qualified stock options to purchase common shares at a price determined by the Compensation and Stock Option Committee.options. The exercise price of all stock options granted has been set at 100% of the fair market value of the underlying common shares on the date of grant. Generally, the stock options granted to employees vest and become exercisable at the rate of 20% per year beginning one year from the date of grant and expire ten years after the date of grant..grant. The non-qualified stock options granted to non-employee directors vest and become exercisable on the first to occur of (a) the first anniversary of the date of grant and (b) as to any option granted as of the date of an annual meeting of shareholders of Worthington Industries, Inc., the date on which the next annual meeting of shareholders is held following the
date of grant. In addition to the stock options previously discussed, we have awarded to certain employees, performance shares that are contingent (i.e., vest) upon achieving corporate targets for economic value added, earnings per share and, in the case of business unit executives, business unit operating income targets for the three-year periods ending May 31, 2009 and 2010. These performance share awards will be paid, to the extent earned, in common shares of Worthington Industries, Inc. in the fiscal quarter following the end of the applicable three-year performance period. The restricted shares granted to non-employee directors are valued at the closing market price of common shares of Worthington Industries, Inc. on the date of the grant. The restricted shares vest under the same parameters used for non-employee director stock options discussed above.
Effective June 1, 2006, we adopted SFAS 123(R). SFAS 123(R) requires all share-based payments, including grants of stock options, to be recorded as expense in the statement of earnings based on their fair values. In adopting SFAS 123(R), we selected the modified prospective transition method. This method requires that compensation expense be recorded prospectively over the remaining vesting period of the stock options on a straight-line basis using the fair value of the stock options on the date of grant. It does not require restatement of financial results for the prior period expense related to stock option awards that were outstanding prior to adoption.
We calculate the fair value of the stock options using the Black-Scholes option pricing model and certain assumptions. The computation of fair values for all stock options use the following assumptions: the expected volatility, which is based on the historical volatility of the common shares of Worthington Industries, Inc.; and the risk-free interest rate, which is based on the United States Treasury strip rate for the expected term of the stock option. The expected term was developed using the simplified approach allowed by the Securities and Exchange Commission’s Staff Accounting Bulletin No. 107. The assumptions used to value specific grants are disclosed below.
We granted non-qualified stock options, effective July 2, 2007, covering 467,500 common shares under our employee stock-based compensation plans. The option price of $22.73 per share was equal to the market price of the underlying common shares at the grant date. The fair value of these stock options, based on the Black-Scholes option-pricing model, calculated at the grant date, was $6.94 per share. The following assumptions were used to value the stock options: dividend yield of 3.5%; expected term 6.5 years; expected volatility of 35.7%; and risk-free interest rate of 4.9%. The calculated pre-tax stock-based compensation expense for these stock options is $2,628,000, which will be recognized on a straight-line basis over the five-year vesting period of the stock options.
We granted non-qualified stock options, effective September 26, 2007, covering 42,500 common shares and 11,150 restricted shares under our equity incentive plan for non-employee directors. The option price of $22.95 per share was equal to the market price of the underlying common shares at the grant date. The fair value of these stock options, based on the Black-Scholes option-pricing model, calculated at the grant date, was $6.94 per share. The assumptions used to value the stock options were the same as those in the preceding paragraph. The restricted shares granted were valued at the closing market price of $22.95 for the underlying common shares at the grant date. The calculated pre-tax stock-based compensation expense for the stock options and the restricted shares granted on September 26, 2007, is $551,000, which will be recognized on a straight-line basis over the one-year vesting period.
We granted non-qualified stock options, during December 2007, covering an aggregate of 1,344,000 common shares under our employee stock-based compensation plan. The option prices of $20.80 and $21.61 per share were equal to the market price of the underlying common shares at the respective grant dates. The fair value of these stock options, based on the Black-Scholes option-pricing model, calculated at the respective grant dates, was $5.97 per share. The following assumptions were used to value the stock options: dividend yield of 3.2%; expected term 6.5 years; expected volatility of 34.8%; and risk-free interest rate of 3.6%. Stock-based compensation expense of $6,499,000 will be recognized on a straight-line basis over the five-year vesting period of the stock options.
The weighted average fair value of stock options granted in fiscal 2008, fiscal 2007 and fiscal 2006 was $6.24, $4.08, and $3.62, respectively, based on the Black-Scholes option pricing model with the following weighted average assumptions:
| 2008 | 2007 | 2006 | |||||||
Assumptions used: | |||||||||
Dividend yield | 3.28 | % | 3.60 | % | 3.58 | % | |||
Expected volatility | 35.05 | % | 38.10 | % | 25.00 | % | |||
Risk-free interest rate | 3.96 | % | 5.00 | % | 4.38 | % | |||
Expected life (years) | 6.5 | 6.5 | 6.6 |
The calculated pre-tax stock-based compensation expense of $4,173,000 ($2,898,000 after-tax) for fiscal 2008 and $3,480,000 ($2,401,000 after-tax) for fiscal 2007, was recorded in selling, general and administrative expense.
In fiscal 2006, as allowed by SFAS 123, stock options were accounted for using the intrinsic-value method (i.e., the difference between the market price at exercise and the price paid by the employee to exercise the stock option). Under that method, no compensation expense was recognized on the grant date, since on that date the stock option exercise price equaled the market price of the underlying common shares. However, we complied with the disclosure-only provisions of SFAS 123. “Note A—Summary of Significant Accounting Policies” summarizes this information as disclosed in the prior year on a pro forma basis as if we had applied the fair value recognition provisions of SFAS 123.
The following table summarizes thetables summarize our activities in stock option plans’ activitiesplans for the years ended May 31:
| 2005 | 2004 | 2003 | 2008 | 2007 | 2006 | |||||||||||||||||||||||||||||||
In thousands, except per share
| Stock Options | Weighted Average Price | Stock Options | Weighted Average Price | Stock Options | Weighted Average Price | Stock Options | Weighted Average Price | Stock Options | Weighted Average Price | Stock Options | Weighted Average Price | ||||||||||||||||||||||||
Outstanding, beginning of year | 5,395 | $ | 13.86 | 5,942 | $ | 13.49 | 5,417 | $ | 13.05 | 5,241 | $ | 16.33 | 5,588 | $ | 16.09 | 5,803 | $ | 15.48 | ||||||||||||||||||
Granted | 2,035 | 19.23 | 762 | 15.15 | 1,086 | 15.12 | 1,849 | 21.34 | 799 | 18.15 | 762 | 17.18 | ||||||||||||||||||||||||
Exercised | (1,040 | ) | 13.12 | (795 | ) | 11.58 | (355 | ) | 11.86 | (840 | ) | 15.72 | (673 | ) | 14.87 | (773 | ) | 12.12 | ||||||||||||||||||
Expired | (16 | ) | 18.61 | (174 | ) | 20.09 | (71 | ) | 19.76 | |||||||||||||||||||||||||||
Forfeited | (587 | ) | 17.75 | (514 | ) | 14.80 | (206 | ) | 13.88 | (276 | ) | 18.99 | (299 | ) | 17.85 | (133 | ) | 17.32 | ||||||||||||||||||
Outstanding, end of year | 5,803 | 15.48 | 5,395 | 13.86 | 5,942 | 13.49 | 5,958 | 17.84 | 5,241 | 16.33 | 5,588 | 16.09 | ||||||||||||||||||||||||
Exercisable at end of year | 2,581 | 13.41 | 3,200 | 14.18 | 3,276 | 14.30 | 2,714 | 15.37 | 2,680 | 14.81 | 2,702 | 14.33 | ||||||||||||||||||||||||
| Number of Stock Options (in thousands) | Weighted Average Remaining Contractual Life (in years) | Aggregate Intrinsic Value (in thousands) | |||||
May 31, 2008 | |||||||
Outstanding | 5,958 | 6.47 | $ | 15,116 | |||
Exercisable | 2,714 | 4.34 | 12,474 | ||||
May 31, 2007 | |||||||
Outstanding | 5,241 | 6.02 | 25,078 | ||||
Exercisable | 2,680 | 4.52 | 16,907 | ||||
May 31, 2006 | |||||||
Outstanding | 5,588 | 6.32 | 10,146 | ||||
Exercisable | 2,702 | 4.63 | 8,891 | ||||
During fiscal 2008, the total intrinsic value of stock options exercised was $6,241,000. The total amount of cash received from employees exercising stock options was $13,171,000 during fiscal 2008, and the related net tax benefit realized from the exercise of these stock options was $2,035,000 during the same period.
The following table summarizes information about non-vested stock option awards for stock options outstanding and exercisable atthe year ended May 31, 2005:2008:
| Outstanding | Exercisable | |||||||||||
In thousands, except per share
| Number | Weighted Average Exercise Price | Weighted Average Remaining Contractual Life | Number | Weighted Average Exercise Price | |||||||
Exercise prices between | ||||||||||||
$ 9.00 and $ 13.00 | 1,930 | $ | 11.21 | 4.8 | 1,657 | $ | 11.52 | |||||
$14.68 and $ 20.88 | 3,873 | 17.61 | 7.5 | 924 | 16.79 | |||||||
| Number of Stock Options (in thousands) | Weighted Average Grant Date Fair Value Per Share | |||||
Non-vested, beginning of year | 2,561 | $ | 4.28 | |||
Granted | 1,849 | 6.24 | ||||
Vested | (874 | ) | 3.93 | |||
Forfeited | (292 | ) | 4.73 | |||
Non-vested, end of year | 3,244 | $ | 5.44 | |||
Under APB No. 25, the Company does not recognizeAt May 31, 2008, total unrecognized compensation expensecost related to options, as no options have been granted at a price belownon-vested non-qualified stock option awards was $12,853,000, which will be expensed over the fair market price on the date of grant. See “Note A – Summary of Significant Accounting Policies – Stock-Based Compensation” for pro forma disclosures required by SFAS No. 148.
next five fiscal years.
Note G – Contingent Liabilities and Commitments
The Company is a defendantWe are defendants in certain legal actions. In the opinion of management, the outcome of these actions, which is not clearly determinable at the present time, would not significantly affect the Company’sour consolidated financial position or future results of operations. The Company believesWe believe that environmental issues will not have a material effect on our capital expenditures, consolidated financial position or future results of operations.
To secure access to a facility used to regenerate acid used in certain steel processing locations, the Company haswe have entered into unconditional purchase obligations with a third party under which three of the Company’sour steel processing facilities deliver their spent acid for processing annually through fiscal 2019. In addition, the Company iswe are required to pay for freight and utilities used in processing itsregenerating the spent acid. Total net payments to this third party were $5,359,000, $5,048,000, and $5,391,000 for fiscal 2008, fiscal 2007 and fiscal 2006, respectively. The aggregate amount of required future payments at May 31, 2005,2008, is as follows (in thousands):
2006 | $ | 2,367 | ||||
2007 | 2,367 | |||||
2008 | 2,367 | |||||
2009 | 2,367 | $ | 2,367 | |||
2010 | 2,367 | 2,367 | ||||
2011 | 2,367 | |||||
2012 | 2,367 | |||||
2013 | 2,367 | |||||
Thereafter | 21,303 | 14,202 | ||||
Total | $ | 33,138 | $ | 26,037 | ||
The CompanyWe may terminate the unconditional purchase obligations by assuming or otherwise repayingpurchasing this facility. At May 31, 2008, the cost of this purchase option was not expected to exceed certain debt of the supplier related to the facility, which was $13,755,000 at May 31, 2005.
At the closing of the sale of the Decatur facility on August 1, 2004, the unconditional purchase obligation associated with Decatur was eliminated. The estimated termination cost was recorded in first quarter of fiscal 2005. See “Note N – Impairment Charges and Restructuring Expense” for more information.
approximately $10,600,000.
Note H – Industry Segment Data
The Company’sOur operations include three reportable segments: Processed Steel Products,Processing, Metal Framing and Pressure Cylinders. Factors used to identify these segments include the products and services provided by each segment as well as the management reporting structure used by the Company.used. A discussion of each segment is outlined below.
Processed Steel ProductsProcessing: ThisThe Steel Processing segment consists of two business units, Thethe Worthington Steel Companybusiness unit, and includes Precision Specialty Metals, Inc. (“Worthington Steel”) and The Gerstenslager Company (“Gerstenslager”PSM”). Both areWorthington Steel is an intermediate processorsprocessor of flat-rolled steel. This segment’s processing capabilities include pickling, slitting,pickling; slitting; cold reduction,reducing; hot-dipped galvanizing,galvanizing; hydrogen annealing, cutting-to-length,annealing; cutting-to-length; tension leveling, edging,leveling; edging; non-metallic coating, including dry lubricating,lubrication, acrylic and paint; configured blankingblanking; and stamping. Worthington Steel sells to customers principally in the automotive, construction, lawn and garden, hardware, furniture, office equipment, electrical control, tubing, leisure and recreation, appliance, farm implement,agricultural, HVAC, container and aerospace markets. Gerstenslager supplies exposed body panels and unexposed components for past model service and current model production primarily to domestic and transplant automotive and heavy-duty truck manufacturers in the United States.
Metal Framing: ThisThe Metal Framing segment consists of onethe Dietrich Metal Framing business unit, Dietrich Industries, Inc. (“Dietrich”), which designs and produces metal framing components and systems and related accessories for the commercial and residential construction markets within the United States.States and Canada. Dietrich’s customers primarily consist of wholesale distributors, commercial and residential building contractors, and big box building material retailers.mass merchandisers.
Pressure Cylinders: ThisThe Pressure Cylinders segment consists of onethe Worthington Cylinders business unit, Worthington Cylinder Corporation (“Worthington Cylinders”).unit. Worthington Cylinders produces a diversified line of pressure cylinders, including low-pressure liquefied petroleum gas (“LPG”) cylinders,and refrigerant gas cylinders andcylinders; high-pressure and industrial/specialty gas cylinders.cylinders; airbrake tanks; and certain consumer products. The LPG cylinders are used to hold fuel for gas barbecue grills, recreational vehicle equipment, residential and light commercial heating systems, industrial forklifts, hand held torches, propane-fueled camping equipment and commercial/residential cooking (the latter, generally outside North America). Refrigerant gas cylinders are used to hold refrigerant gases for commercial, residential and residentialautomotive air conditioning and refrigeration systems and for automotive air conditioning systems. High-pressure and industrial/specialty gas cylinders are containers for gases used in the following: cutting and welding metals; breathing (medical, diving and firefighting); semiconductor production; beverage delivery; and compressed natural gas systems. Worthington Cylinders also produces recovery tanks for refrigerant gases, air reservoirs for truck and trailer manufacturers, and non-refillable cylinders for “Balloon Time®” helium kits.
Other: Included in the Other category are segments that do not fit into the reportable segments, and are immaterial for purposes of separate disclosure, and other corporate related entities. These operating segments are: Automotive Body Panels, Construction Services and Steel Packaging. Each of these segments is explained in more detail below.
Automotive Body Panels: This segment consists of the Gerstenslager business unit which provides services including stamping, blanking, assembly, painting, packaging, die management, warehousing, distribution management and other services to customers primarily in the automotive industry.
Construction Services: This segment consists of Worthington Integrated Building Systems, LLC, which includes Worthington Mid-Rise Construction, Inc., which designs and builds mid-rise light-gauge steel framed commercial structures and multi-family housing units; Worthington Military Construction, Inc., which is involved in the supply and construction of metal framing products for, and in the framing of, single family housing, with a focus on military; and a 36 unit mid-rise light-gauge steel framed apartment project in China entered into primarily for research and development purposes.
Steel Packaging: This segment consists of Worthington Steelpac Systems, LLC (“Steelpac”) which designs and manufactures reusable custom platforms, racks, and pallets made of steel for supporting, protecting and handling products throughout the shipping process for customers in industries such as automotive, lawn and garden and recreational vehicles.
The accounting policies of the operating segments are described in “Note A – Summary of Significant Accounting Policies.” The Company evaluatesWe evaluate segment performance based on operating income. Inter-segment sales are not material.
Summarized financial information for the Company’sour reportable segments as of, and for, the indicated years ended May 31, is shown in the following table. The “Other” category includes corporate related items, results of immaterial operations, and income and expense not allocable to the reportable segments.
| In thousands | 2005 | 2004 | 2003 | |||||||||
Net sales | ||||||||||||
Processed Steel Products | $ | 1,805,023 | $ | 1,373,145 | $ | 1,343,397 | ||||||
Metal Framing | 848,029 | 661,999 | 539,358 | |||||||||
Pressure Cylinders | 408,271 | 328,692 | 321,790 | |||||||||
Other | 17,561 | 15,268 | 15,346 | |||||||||
Total | $ | 3,078,884 | $ | 2,379,104 | $ | 2,219,891 | ||||||
Operating income | ||||||||||||
Processed Steel Products | $ | 125,964 | $ | 18,036 | $ | 80,998 | ||||||
Metal Framing | 108,517 | 63,778 | 22,537 | |||||||||
Pressure Cylinders | 33,575 | 29,376 | 32,273 | |||||||||
Other | (706 | ) | (1,003 | ) | (9,977 | ) | ||||||
Total | $ | 267,350 | $ | 110,187 | $ | 125,831 | ||||||
Depreciation and amortization | ||||||||||||
Processed Steel Products | $ | 27,103 | $ | 39,097 | $ | 41,796 | ||||||
Metal Framing | 14,166 | 14,706 | 14,786 | |||||||||
Pressure Cylinders | 10,929 | 8,749 | 8,835 | |||||||||
Other | 5,676 | 4,750 | 4,002 | |||||||||
Total | $ | 57,874 | $ | 67,302 | $ | 69,419 | ||||||
Total assets | ||||||||||||
Processed Steel Products | $ | 873,181 | $ | 888,661 | $ | 806,859 | ||||||
Metal Framing | 498,665 | 471,972 | 392,010 | |||||||||
Pressure Cylinders | 268,862 | 168,496 | 164,833 | |||||||||
Other | 189,297 | 114,010 | 114,367 | |||||||||
Total | $ | 1,830,005 | $ | 1,643,139 | $ | 1,478,069 | ||||||
Capital expenditures | ||||||||||||
Processed Steel Products | $ | 6,649 | $ | 6,136 | $ | 8,382 | ||||||
Metal Framing | 20,549 | 10,269 | 10,398 | |||||||||
Pressure Cylinders | 4,925 | 3,182 | 3,462 | |||||||||
Other | 14,194 | 10,012 | 2,728 | |||||||||
Total | $ | 46,318 | $ | 29,599 | $ | 24,970 | ||||||
Net sales Steel Processing Metal Framing Pressure Cylinders Other Total Operating income (loss) Steel Processing Metal Framing Pressure Cylinders Other Total Depreciation and amortization Steel Processing Metal Framing Pressure Cylinders Other Total Total assets Steel Processing Metal Framing Pressure Cylinders Other Total Capital expenditures Steel Processing Metal Framing Pressure Cylinders Other TotalIn thousands 2008 2007 2006 $ 1,463,202 $ 1,460,665 $ 1,486,165 788,788 771,406 796,272 578,808 544,826 461,875 236,363 194,911 152,867 $ 3,067,161 $ 2,971,808 $ 2,897,179 $ 55,799 $ 55,382 $ 61,765 (16,215 ) (9,159 ) 46,735 70,004 84,649 49,275 (3,554 ) (1,727 ) (171 ) $ 106,034 $ 129,145 $ 157,604 $ 26,779 $ 25,662 $ 22,898 16,907 16,628 16,231 10,454 9,858 10,853 9,273 9,321 9,134 $ 63,413 $ 61,469 $ 59,116 $ 942,885 $ 815,070 $ 812,024 527,446 476,100 498,409 437,159 357,696 277,300 80,541 165,316 312,664 $ 1,988,031 $ 1,814,182 $ 1,900,397 $ 7,157 $ 14,030 $ 14,303 6,770 15,657 19,700 16,540 14,068 7,916 17,053 13,936 18,209 $ 47,520 $ 57,691 $ 60,128
Net sales by geographic region for the years ended May 31 are shown in the following table:
| In thousands | 2005 | 2004 | 2003 | ||||||
United States | 2,935,879 | 2,259,609 | 2,103,492 | ||||||
Canada | 22,906 | 24,680 | 24,639 | ||||||
Europe | 120,099 | 94,815 | 91,760 | ||||||
Total | $ | 3,078,884 | $ | 2,379,104 | $ | 2,219,891 | |||
| In thousands | 2008 | 2007 | 2006 | |||||||||
United States | $ | 2,786,679 | $ | 2,719,240 | $ | 2,714,813 | ||||||
Canada | 74,623 | 60,340 | 44,288 | |||||||||
Europe | 205,859 | 192,228 | 138,078 | |||||||||
Total | $ | 3,067,161 | $ | 2,971,808 | $ | 2,897,179 | ||||||
Net fixed assets by geographic region for the years endedas of May 31 are shown in the following table:
| In thousands | 2005 | 2004 | 2003 | 2008 | 2007 | 2006 | |||||||||||||||
United States | 526,756 | 528,596 | 712,530 | $ | 505,988 | $ | 528,181 | $ | 513,915 | ||||||||||||
Canada | 2,378 | 2,552 | 3,138 | 8,025 | 8,995 | 8,713 | |||||||||||||||
Europe | 23,822 | 24,246 | 27,376 | 35,931 | 27,089 | 24,276 | |||||||||||||||
Total | $ | 552,956 | $ | 555,394 | $ | 743,044 | $ | 549,944 | $ | 564,265 | $ | 546,904 | |||||||||
Note I – Related Party Transactions
The Company purchasesWe purchase from, and sellssell to, affiliated companies certain raw materials and services at prevailing market prices. Net sales to affiliated companies for fiscal 2005,2008, fiscal 20042007 and fiscal 20032006 totaled $27,674,000, $18,960,000$25,962,000, $34,915,000, and $12,534,000, respectively. Expenses$30,503,000. Purchases from affiliated companies for fiscal 2005,2008, fiscal 20042007 and fiscal 20032006 totaled $13,652,000, 9,669,000$10,680,000, $6,394,000, and $5,520,000, respectively.$9,063,000. Accounts receivable related to these transactionsfrom affiliated companies were $3,178,000$5,107,000 and $2,901,000$2,019,000 at May 31, 20052008 and 2004, respectively.2007. Accounts payable to affiliated companies were $1,520,000$136,000 and $18,000$1,349,000 at May 31, 20052008 and 2004, respectively.
2007.
Note J – Investments in Unconsolidated Affiliates
The Company’sOur investments in affiliated companies, which are not controlled through majority ownership or otherwise, are accounted for using the equity method. TheseAt May 31, 2008, these equity investments, and the percentage interest owned, consist of Worthington Armstrong Ventureconsisted of: WAVE (50%), TWB Company, LLC (50%), Acerex, S.A. de C.V. (50%(45%), Worthington Specialty Processing (50%), Aegis Metal Framing, LLC (60%), Viking & Worthington Steel Enterprise, LLC (“VWS”(49%), Accelerated Building Technologies, LLC (50%), Serviacero Planos S.A. de C.V. (50%), Canessa Worthington Slovakia s.r.o. (49%), and Dietrich Residential Construction,LEFCO Worthington, LLC (50%(49%).
On March 1, 2008, our joint venture, TWB acquired ThyssenKrupp Tailored Blanks S.A. de C.V., the Mexican laser welding subsidiary of ThyssenKrupp Steel North America, Inc. (“ThyssenKrupp”), to expand TWB’s presence in Mexico. The acquisition was made through a contribution of capital by ThyssenKrupp, and as a result, ThyssenKrupp owns 55% of TWB, and Worthington owns 45%. This resulted in a dilution gain of $1,944,000 (net of taxes of $1,031,000) and was recorded as additional paid-in capital.
On June 27, 2003, Worthington Steel joined with Bainbridge Steel, LLC (“Bainbridge”), an affiliate of VikingOctober 25, 2007, we acquired a 49% interest in crate and pallet maker LEFCO Industries, LLC, a qualified minority business enterprise (“MBE”), to form Viking & Worthington Steel Enterprise, LLC, an unconsolidatedenterprise. The resulting joint venture, called LEFCO Worthington, LLC, will manufactures steel rack systems for the automotive and trucking industries, in which Worthington Steel hasaddition to continuing LEFCO’s existing products.
On September 25, 2007, a 49% intereststeel processing joint venture was formed with The Magnetto Group to construct and Bainbridge hasoperate a 51% interest. VWS purchased substantially all of the assets of Valley City Steel, LLCClass One steel processing facility in Valley City, Ohio, for approximately $5,700,000. Bainbridge manages the operations ofSlovakia. Our investment in the joint venture was $4,254,000. This 49%-owned joint venture is known as Canessa Worthington Slovakia s.r.o. and Worthington Steel provides assistance in operations, selling and marketing. The parties operate VWS as an MBE.
services customers throughout central Europe.
On September 23, 2004, the Company formed17, 2007, Worthington acquired a 50%-owned unconsolidated interest in Serviacero Planos in central Mexico. This joint venture with Pacific Steel Construction Inc. (“Pacific”), Dietrich Residential Construction, LLC, to focus on residential steel framing, particularly foris known as Serviacero Planos, S.A de C.V. The purchase price of the military. Pacific contributed its existing contracts toinvestment was $41,767,000. The investment exceeded the joint venture andbook value of the Company made a capital contribution of $1,500,000. The Company sells steel framing products manufacturedunderlying equity in its Metal Framing segment to the joint venture for its projects. The joint venture focusesnet assets by $22,258,000. Of this excess amount, $12,828,000 was allocated based on the residential construction market, combiningfair value of those underlying net assets and will be amortized to equity in net income of unconsolidated affiliates over the Company’s expertise in steel framingremaining useful lives of those assets, with Pacific’s experience in military housing construction.the remainder of $9,430,000 allocated to goodwill.
During fiscal 2003, TWB acquired the ownership interests of the minority partners, thereby increasing the Company’s ownership interest from 33% to 50% and resulting in an increase to shareholders’ equity of $2,450,000 (net of deferred taxes of $1,492,000).
The CompanyWe received distributions from unconsolidated affiliates totaling $28,520,000$58,920,000, $131,723,000 and $12,152,000$57,040,000 in fiscal 20052008, fiscal 2007 and fiscal 2004,2006, respectively.
Financial information for affiliated companies accounted for using the equity method as of, and for the years ended, May 31, was as follows:
| In thousands | 2005 | 2004 | 2003 | 2008 | 2007 | 2006 | ||||||||||||
Current assets | $ | 315,308 | $ | 246,844 | $ | 173,195 | ||||||||||||
Cash | $ | 79,538 | $ | 64,190 | $ | 93,877 | ||||||||||||
Other current assets | 225,469 | 154,797 | 163,718 | |||||||||||||||
Noncurrent assets | 142,065 | 141,450 | 145,446 | 194,169 | 102,261 | 109,841 | ||||||||||||
Current liabilities | 155,894 | 143,750 | 70,044 | |||||||||||||||
Noncurrent liabilities | 36,423 | 35,727 | 94,239 | |||||||||||||||
Current maturities of long-term debt | $ | - | $ | 3,158 | $ | 3,158 | ||||||||||||
Other current liabilities | 124,258 | 78,281 | 81,176 | |||||||||||||||
Long-term debt | 101,411 | 124,214 | 37,813 | |||||||||||||||
Other noncurrent liabilities | 34,394 | 7,228 | 6,049 | |||||||||||||||
Net sales | 767,041 | 604,243 | 484,078 | $ | 745,437 | $ | 652,178 | $ | 810,271 | |||||||||
Gross margin | 163,947 | 133,218 | 96,880 | 206,927 | 183,603 | 188,109 | ||||||||||||
Depreciation and amortization | 20,234 | 19,369 | 18,001 | 13,056 | 14,164 | 18,479 | ||||||||||||
Interest expense | 3,421 | 2,804 | 2,208 | 7,575 | 3,701 | 3,346 | ||||||||||||
Income tax expense | 4,168 | 2,650 | 1,380 | 8,974 | 6,674 | 18,318 | ||||||||||||
Net earnings | 100,307 | 79,625 | 60,816 | 134,925 | 124,456 | 108,672 | ||||||||||||
The Company’sOur share of undistributed earnings of unconsolidated affiliates was $51,360,000$7,350,000 at May 31, 2005.2008.
On June 2, 2008, Worthington made an additional capital contribution of $392,000 to Viking & Worthington Steel Enterprise, LLC. The other member in the joint venture did not make its contribution as required by the operating agreement. As a result, Worthington became the majority owner of the joint venture, and the joint venture will be consolidated in Worthington’s financial statements starting in fiscal 2009.
Note K – Earnings Per Share
The following table sets forth the computation of basic and diluted earnings per share for the years ended May 31:
| In thousands, except per share | 2005 | 2004 | 2003 | ||||||
Numerator (basic & diluted): | |||||||||
Net earnings – income available to common shareholders | $ | 179,412 | $ | 86,752 | $ | 75,183 | |||
Denominator: | |||||||||
Denominator for basic earnings per share – weighted average shares | 87,646 | 86,312 | 85,785 | ||||||
Effect of dilutive securities – stock options | 857 | 638 | 752 | ||||||
Denominator for diluted earnings per share – adjusted weighted average | 88,503 | 86,950 | 86,537 | ||||||
Earnings per share – basic | $ | 2.05 | $ | 1.01 | $ | 0.88 | |||
Earnings per share – diluted | 2.03 | 1.00 | 0.87 | ||||||
| In thousands, except per share | 2008 | 2007 | 2006 | ||||||
Numerator (basic & diluted): | |||||||||
Net earnings – income available to common shareholders | $ | 107,077 | $ | 113,905 | $ | 145,990 | |||
Denominator: | |||||||||
Denominator for basic earnings per share – weighted average shares | 81,232 | 86,351 | 88,288 | ||||||
Effect of dilutive securities | 666 | 651 | 688 | ||||||
Denominator for diluted earnings per share – adjusted weighted average shares | 81,898 | 87,002 | 88,976 | ||||||
Earnings per share – basic | $ | 1.32 | $ | 1.32 | $ | 1.65 | |||
Earnings per share – diluted | 1.31 | 1.31 | 1.64 | ||||||
Stock options covering 2,319,218, 854,9351,346,625, 1,818,813, and 2,211,6002,137,798 common shares for fiscal 2005,2008, fiscal 20042007 and fiscal 20032006 have been excluded from the computation of diluted earnings per share because the effect would have been anti-dilutive for those periods.
Note L – Operating Leases
The Company leasesWe lease certain property and equipment from third parties under non-cancelable operating lease agreements. Rent expense under operating leases was $10,328,000$14,188,000, $13,926,000 and $12,637,000 in fiscal 2005, $6,221,000 in2008, fiscal 2004,2007 and $9,377,000 in fiscal 2003.2006. Future minimum lease payments for non-cancelable operating leases having an initial or remaining term in excess of one year at May 31, 2005,2008, are as follows:
| In thousands | |||
2006 | $ | 7,537 | |
2007 | 7,529 | ||
2008 | 7,286 | ||
2009 | 6,804 | ||
2010 | 5,663 | ||
Thereafter | 22,578 | ||
Total | $ | 57,397 | |
On February 7, 2005, the SEC staff issued a letter clarifying the SEC’s position on application of accounting principles generally accepted in the United States for certain lease accounting rules. The letter addressed the SEC’s view of proper accounting for the amortization of leasehold improvements, rent holidays and escalations, and landlord or tenant incentives. The Company analyzed its leases to determine whether its lease accounting method conforms to the SEC’s position and made an immaterial adjustment during the fourth quarter of fiscal 2005.
| In thousands | |||
2009 | $ | 10,753 | |
2010 | 9,804 | ||
2011 | 8,016 | ||
2012 | 6,349 | ||
2013 | 6,022 | ||
Thereafter | 6,903 | ||
Total | $ | 47,847 | |
Note M – Sale of Accounts Receivable
The Company and certain of its subsidiariesWe maintain a $100,000,000 revolving trade receivablesaccounts receivable securitization facility.facility which expires in January 2011. Pursuant to the terms of the facility, thesecertain of our subsidiaries sell their accounts receivable, on a revolving basis, to Worthington Receivables Corporation (“WRC”), a wholly-owned, consolidated, bankruptcy-remote subsidiary. In turn, WRC sells,may sell, on a revolving basis, up to $100,000,000 of undivided ownership interests in this pool of accounts receivable to independent third parties. The Company retainsWe retain an undivided interest in this pool and isare subject to risk of loss based on the collectibilitycollectability of the receivables from this retained interest. Because the amount eligible to be sold excludes receivables more than 90 days past due, balances withreceivables offset by an allowance for doubtful accounts because of bankruptcy or other cause, receivables from foreign customers, concentrations over limits with specific customers and certain reserve amounts, the Company believeswe believe additional risk of loss is minimal. Also because of these exclusions, no discount occurs on the sale, and no gain or loss is recorded. Facility fees of $887,000, $1,641,000$341,000, $580,000, and $3,292,000$103,000 were incurred during fiscal 2005,2008, fiscal 20042007 and fiscal 2003, respectively,2006, and were recorded as miscellaneous expense. The book value of the retained portion of the pool of accounts receivable approximates fair value. The Company continuesWe continue to service the accounts receivable. No servicing asset or liability has been recognized, as the Company’sour cost to service the accounts receivable is expected to approximate the servicing income.
As of May 31, 2005, no2008, $100,000,000 of undivided interest in this pool of accounts receivable had been sold. As of May 31, 2004, a $60,000,000 undivided interestownership interests in this pool of accounts receivable had been sold. The proceeds from the sale wereare reflected as a reduction of accounts receivable on the consolidated balance sheets and asin net cash provided by operating cash flowsactivities in the consolidated statements of cash flows. The sale proceeds were used to pay down short-term debt.
Note N – ImpairmentRestructuring Charges and Restructuring Expense
Effective August 1, 2004,During fiscal 2008, the Company closedinitiated a transformational effort (the “Transformation Plan”) with the salegoal of its Decatur, Alabama, steel-processing facilityimproving the operational and its cold-rolling assets to Nucor Corporation (“Nucor”) for $80,392,000 cash. The sale excluded the slitting and cut-to-length assets and net working capital associated with this facility. The Company remains in a portionfinancial performance of the DecaturCompany. As part of the Transformation Plan, we reviewed our businesses and established clear profitability goals and objectives for each of them. These goals and objectives include initiatives to reduce our cost structure through a combination of facility underclosures, productivity improvements and headcount reductions. The Transformation Plan also includes searching for new growth opportunities, increasing efficiencies at production and administrative offices, and improving the management of our supply chain. This Transformation Plan will continue into fiscal 2009.
Under the Transformation Plan, a long-term lease with Nucortotal of $18,111,000 was incurred in fiscal 2008, and continueshas been recorded as restructuring charges in the consolidated statements of earnings. The details of these charges are explained in more detail below.
On September 25, 2007, the closure or downsizing of five locations in our Metal Framing segment was announced. The affected facilities were: the closure of East Chicago, Indiana; Rock Hill, South Carolina; Goodyear, Arizona; and Wildwood, Florida; and the downsizing of operations in Montreal, Canada. In addition, it was announced that the Metal Framing corporate offices will be moved from Pittsburgh, Pennsylvania, to serve customers requiringColumbus, Ohio. As of May 31, 2008, the closure and downsizing process is complete, except for the corporate offices, which will occur in fiscal 2009. The Rock Hill facility will continue to operate as a steel processing services inoperation and produce product for one of our joint ventures. Annual net sales generated by the Company’s core businessclosed operations totaled approximately $125,000,000, the majority of slitting and cutting-to-length.which are expected to be absorbed into nearby Metal Framing locations. As a result of a sale agreementthis initiative, we expect to record $12,700,000 in restructuring charges including: $5,100,000 representing severance, benefits and personnel-related costs for approximately 165 employees; $2,400,000 representing lease termination and facility-related costs; and $5,200,000 for accelerated depreciation on May 27, 2004,assets to be disposed of as the Company recorded a $67,400,000 pre-tax charge during its fourth quarter ended May 31, 2004. The charge included $66,642,000 for the impairment of assets at the Decatur facility and $758,000 for severance and employee related costs. The severance and employee related costs were due to the elimination of 40 administrative, production and other employee positions. The after-tax impact of this charge was $41,788,000 or $0.48 per diluted
share. An additional pre-tax charge of $5,608,000, mainly relating to contract termination costs, was recognized during the first quarter of fiscal 2005 ended August 31, 2004.facilities close. As of May 31, 2005, 35 employees2008, $8,097,000 of these costs had been terminated, andrecognized with the Company had paid severance and other employee related costsremainder of $471,000.
Also$4,603,000 to occur during the fourth quarter endedfirst half of fiscal 2009.
Through a combination of voluntary retirement and severance packages, we reduced our headcount by an additional 63 employees. As of May 31, 2004, the Company took an impairment charge2008, $4,362,000 of $1,998,000 on certain of its European LPG assets. The after-tax impact of this charge was $1,239,000 or $0.01 per diluted share. The Company hasthese costs had successbeen recognized in restructuring charges.
To assist in the European high-pressuredevelopment and refrigerant cylinder product lines, butimplementation of the LPG market was challenged by overcapacityTransformation Plan, we retained a major consulting firm and declining demand. The impairmentincurred $6,013,000 in professional fees, which have been recorded in restructuring charges for fiscal 2008. We expect to incur an additional $13,400,000 through fiscal 2009.
In addition to the above charges, a credit of $361,000 related to the adjustment of a prior year restructuring liability was recorded as a write-down of original cost to fair market value with future depreciation expense to be based on this value.
During the quarter ended November 30, 2002, the Company recorded a favorable pre-tax adjustment for restructuring of $5,622,000. This credit was the result of higher-than-estimated proceeds from the sale of real estate at the Company’s former facility in Malvern, Pennsylvania, and the net reduction of previously established reserves, partially offset by estimatedcharges during fiscal 2008. The restructuring charges for the announced closure of three additional facilities discussed below.
The components of this adjustmentfiscal 2008 are summarized as follows:
| In thousands | ||||
Gain on sale of Malvern assets | $ | (4,965 | ) | |
Reductions to other reserves | (3,637 | ) | ||
Charge for three additional facilities | 2,980 | |||
Total | $ | (5,622 | ) | |
| In thousands | Beginning Liability | Expense | Payments | Adjustments | Ending Liability | |||||||||||
Early retirement and severance | $ | - | $ | 6,221 | $ | (5,078 | ) | $ | - | $ | 1,143 | |||||
Other costs | 535 | 6,721 | (5,616 | ) | 70 | 1,710 | ||||||||||
| $ | 535 | 12,942 | $ | (10,694 | ) | $ | 70 | $ | 2,853 | |||||||
Non-cash charges | 5,169 | |||||||||||||||
Total | $ | 18,111 | ||||||||||||||
The closureCash expenditures of three additional facilities was announced$10,694,000, associated with implementing the Transformation Plan, were paid during fiscal 2008, with the quarter ended November 30, 2002. Two facilities fromremainder to be paid during fiscal 2009. Certain cash payments associated with lease terminations may be paid over the Metal Framing segment and one from the Pressure Cylinders segment were affected. The Metal Framing facilities in East Brunswick, New Jersey, and Atlanta, Georgia, were considered redundant following the July 31, 2002, acquisition of Unimast Incorporated (together with its subsidiaries, “Unimast”). The Pressure Cylinders facility, located in Citronelle, Alabama, produced acetylene cylinders. The production of these cylinders was partially transferred to another plant and outsourced. The closure of these three facilities resulted in a $2,980,000 pre-tax restructuring charge. The restructuring charge included a write-down to estimated fair value of certain equipment, property related costs, severance and employee related costs and other items. Severance and employee related costs of $604,000 were due to the elimination of 69 administrative, production and other employee positions.
Sales that were historically generated by the closed plants were transferred to other Company facilities except for the sales from the Itu, Brazil, facility and sales related to the painted and coated products at the Malvern, Pennsylvania, facility. Net sales not transferred were $0 and $9,090,000 for fiscal 2004 and fiscal 2003, respectively. The related operating loss for these products was $105,000 and $659,000 for fiscal 2004 and fiscal 2003, respectively.
remaining lease terms.
Note O – Goodwill and Other Intangibles
The Company adopted SFAS No. 141,Business Combinations, and SFAS No. 142,Goodwill and Other Intangible Assets, effective June 2001. SFAS No. 141 requires theWe use of the purchase method of accounting for any business combinations initiated after June 30, 2002, and further clarifies the criteria to recognize amortizable intangible assets separately from goodwill. Under SFAS No. 142,Goodwill and Other Intangible Assets, goodwill and indefinite-lived intangible assets are no longer amortized but are reviewed for impairment. The annual impairment test was performed during the fourth quarters of fiscal 20052008 and fiscal 2004,2007, and no goodwill was written off as a result. The Company hasWe have no intangibles with indefinite lives other than goodwill.
Goodwill by segment is summarized as follows at May 31:
| In thousands | 2005 | 2004 | ||||
Metal Framing | $ | 95,361 | $ | 95,361 | ||
Pressure Cylinders | 72,906 | 22,408 | ||||
| $ | 168,267 | $ | 117,769 | |||
| In thousands | 2008 | 2007 | ||||
Metal Framing | $ | 97,316 | $ | 97,176 | ||
Pressure Cylinders | 79,507 | 75,564 | ||||
Other | 6,700 | 6,701 | ||||
Total | $ | 183,523 | $ | 179,441 | ||
The change in Pressure Cylinders goodwill is primarily due to the acquisition of certain assets of Western Industries, Inc., the purchase of the minority interest of the Czech republic facility (See “Note Q – Acquisitions”), and foreign currency translation adjustments.
Other amortizable intangible assets are summarized as follows at May 31:
| 2005 | 2004 | 2008 | 2007 | |||||||||||||||||||||
| In thousands | Cost | Accumulated Amortization | Cost | Accumulated Amortization | Cost | Accumulated Amortization | Cost | Accumulated Amortization | ||||||||||||||||
Patents and trademarks | $ | 10,191 | $ | 3,296 | $ | 9,562 | $ | 2,524 | $ | 11,364 | $ | 6,217 | $ | 11,518 | $ | 5,218 | ||||||||
Customer relationships | 7,200 | 1,693 | — | — | 12,258 | 4,534 | 11,738 | 3,810 | ||||||||||||||||
Non compete agreement | 1,520 | 681 | 1,520 | 301 | ||||||||||||||||||||
Total | $ | 17,391 | $ | 4,989 | $ | 9,562 | $ | 2,524 | $ | 25,142 | $ | 11,432 | $ | 24,776 | $ | 9,329 | ||||||||
The increase in other amortizable intangible assets is due to the Wolfedale acquisition. Amortization expense was $2,465,000, $757,000$2,258,000, $1,991,000, and $1,591,000$2,348,000 for fiscal 2005,2008, fiscal 20042007 and fiscal 2003. Lives2006. These intangible assets are amortized on the straight-line method over their estimated useful lives, which range from 2 to 15 years.
Estimated amortization expense for these intangibles for the next five fiscal years is as follows:
| In thousands | |||
2006 | $ | 2,345 | |
2007 | 1,156 | ||
2008 | 1,156 | ||
2009 | 1,156 | ||
2010 | 1,156 |
| In thousands | |||
2009 | $ | 2,283 | |
2010 | 2,045 | ||
2011 | 1,682 | ||
2012 | 1,584 | ||
2013 | 1,584 | ||
Note P – Guarantees and Warranties
As of May 31, 2008, we had guarantees totaling $27,628,000 related to residual value guarantees for certain aircraft leases and for purchases by one of our unconsolidated joint ventures and a subsidiary.
The Company hasWe have established reserves for anticipated sales returns and allowances including limited warranties on certain products. The liability for sales returns and allowances is primarily based on historical experience and current information. The liability amounts related to warranties were immaterial at May 31, 20052008 and 2004.
See “Note A – Summary of Significant Accounting Policies – Nonrecurring Losses” for additional information on the Company’s nonrecurring loss related to guarantees.
2007.
Note Q – Acquisitions
On September 17, 2004, the CompanyAugust 16, 2006, we purchased substantially all100% of the capital stock of PSM for $31,727,000, net assets of the propanecash acquired. PSM is a specialty stainless steel processor located in Los Angeles, California, and specialty gas cylinder business of Western Industries, Inc. (“Western Cylinder Assets”). This business operates two facilities in Wisconsin, which manufacture 14.1 oz. and 16.4 oz. disposable cylinders for products such as hand torches, propane-fueled camping equipment, portable heaters and tabletop grills. The Western Cylinder Assets were purchased for $65,119,000 in cash and wereis included in the Company’s Pressure Cylinders segment asour Steel Processing segment. The purchase price is subject to change due to targeted earn-outs of September 17, 2004. Pro forma results, including the acquired business since the beginning of the earliest period presented, would not be materially different than actual results.
up to $8,500,000 through August 2009. The purchase price was allocated to the acquired assets and assumed liabilities based on their estimated fair values at the date of acquisition. Goodwill is defined asacquisition, and included the excessaccrual of $4,784,000 of the purchase price overearn-out as it was deemed to be probable of payment and the fair value allocated toof the identifiable net assets.assets exceeded the purchase price.
The purchase priceallocation was allocated as follows:
| In thousands | |||
Current assets | $ | 8,376 | |
Goodwill | 48,789 | ||
Intangibles | 7,200 | ||
Property, plant and equipment | 5,866 | ||
Total assets | 70,231 | ||
Other current liabilities | 5,112 | ||
Total liabilities | 5,112 | ||
Net cash paid | $ | 65,119 | |
| In thousands | ||||
Current assets | $ | 15,732 | ||
Intangibles | 6,920 | |||
Property, plant and equipment, net | 20,400 | |||
Total assets | 43,052 | |||
Current liabilities | 3,968 | |||
Identifiable net assets | 39,084 | |||
Earnout liability | 4,784 | |||
Total purchase price | 34,300 | |||
Less: cash acquired | (2,573 | ) | ||
Purchase price, net of cash | $ | 31,727 | ||
All ofOf the goodwill amount will be deductible for tax purposes. Intangibles include relationships and contracts customer lists that are being amortized generally over 2 -15 years.
On October 13, 2004, the Company purchased for $1,125,000 the 49% interest of the minority partner in the joint venture that operates a pressure cylinder manufacturing facility in Hustopece, Czech Republic. The purchase price was allocated to goodwill.
On November 5, 2004, the Company formed a 60%-owned consolidated Canadian metal framing joint venture with Encore Coils Holdings Ltd (“Encore”), operating under the name Dietrich Metal Framing Canada. The Company has contributed an aggregate of $1,700,000$2,000,000 related to the joint venture. The joint venture manufactures steel framing products at its Canadian facilities in Mississauga, Vancouver and LaSalle, and also offersfirst earn-out period ended August 31, 2007, we made a variety$1,100,000 payment, reducing the future targeted earn-outs to $6,500,000 as of proprietary products supplied by the Company’s Metal Framing facilities in the United States. The assets andMay 31, 2008
Pro forma results, of operations of this joint venture are consolidated in the Company’s Metal Framing segment.
On July 31, 2002, the Company acquired all of the outstanding stock of Unimast for $114,703,000 in cash (net of cash acquired) plus the assumption of $9,254,000 of debt. Unimast manufactures construction steel products, including light gauge steel framing, plastering steel and trim accessories, and serves the construction industry. The acquisition increased capacity for the Company’s existing products, expanded the Company’s product line to include Unimast’s complementary products and introduced new products to the Metal Framing segment, including metal corner bead and trim and vinyl construction accessories. The acquisition was accounted for using the purchase method, with results for Unimast included since the purchase date.
The purchase price was allocated to the acquired assets and assumed liabilities based on their estimated fair values at the date of acquisition. Goodwill is defined as the excess of the purchase price over the fair value allocated to the net assets.
The purchase price was allocated as follows:
| In thousands | |||
Current assets | $ | 69,612 | |
Goodwill | 37,248 | ||
Intangibles | 6,630 | ||
Other assets | 299 | ||
Property, plant and equipment | 36,815 | ||
Total assets | 150,604 | ||
Notes payable | 3,204 | ||
Other current liabilities | 26,647 | ||
Total current liabilities | 29,851 | ||
Long-term debt | 6,050 | ||
Total liabilities | 35,901 | ||
Net cash paid | $ | 114,703 | |
Intangibles include patents and trademarks that are being amortized generally over 10 years.
The following pro forma data summarizes the results of operations of the Company for fiscal 2003 assuming Unimast had been acquired atbusinesses described above since the beginning of the year. In preparingfiscal year of their respective acquisition, would not be materially different than actual results.
On June 2, 2008, Worthington purchased substantially all of the pro forma data, adjustmentsassets of the Sharon Companies Ltd. business (“Sharon Stairs”) for $37,000,000, net of cash acquired. Sharon Stairs designs and manufactures steel egress stair systems for the commercial construction market, and operates one manufacturing facility in Akron, Ohio. It will operate as part of Worthington Integrated Building Systems, LLC.
Note R – Business Interruption
On January 5, 2008, Severstal North America, Inc. (“Severstal”) incurred a furnace outage. Severstal is a primary steel supplier to, and a minority partner in, our Spartan Steel Coating, LLC joint venture. Severstal is also a steel supplier to some of our other Steel Processing locations and to our Pressure Cylinders segment. Business interruption losses have been madeand will continue to conform Unimast’s accounting policiesbe incurred in the form of lost sales and added costs for material, freight, scrap, and other items. We expect that our business interruption insurance will cover a substantial portion of these losses, and that the negative net impact to thoseoperating income, after insurance, will not exceed $1,000,000. The majority of the Company and to reflect purchase accounting adjustments and interest expense:
| In thousands, except per share | 2003 | ||
Net sales | $ | 2,267,510 | |
Net earnings | 80,203 | ||
Earnings per share - basic | $ | 0.93 | |
Earnings per share - diluted | 0.93 | ||
The pro forma information does not purportexpected losses were incurred during the fourth quarter of fiscal 2008, but some will continue through the end of calendar year 2008. For our financial statement reporting, losses will be netted against insurance proceeds, as they are determined to be indicative ofdirectly related to the results of operations that actually would have been obtained ifinsurable event and recovery from the acquisition had occurred on the dates indicated or the results of operations that will be reported in the future.insurance company is probable and estimable.
Note RS – Quarterly Results of Operations (Unaudited)
The following is a summary of the unaudited quarterly consolidated results of operations for the years ended May 31:fiscal 2008 and fiscal 2007:
| In thousands, except per share | Three Months Ended | Three Months Ended | ||||||||||||||||||||||
Fiscal 2005 | August 31 | November 30 | February 28 | May 31 | ||||||||||||||||||||
| Fiscal 2008 | August 31 | November 30 | February 29 | May 31 | ||||||||||||||||||||
Net sales | $ | 769,340 | $ | 745,168 | $ | 747,414 | $ | 816,962 | $ | 758,955 | $ | 713,664 | $ | 725,667 | $ | 868,875 | ||||||||
Gross margin | 159,644 | 124,518 | 109,152 | 105,559 | 78,785 | 70,010 | 75,727 | 131,225 | ||||||||||||||||
Net earnings | 57,859 | 47,623 | 33,122 | 40,808 | 20,168 | 14,740 | 18,302 | 53,867 | ||||||||||||||||
Earnings per share - basic | $ | 0.66 | $ | 0.54 | $ | 0.38 | $ | 0.46 | $ | 0.24 | $ | 0.18 | $ | 0.23 | $ | 0.68 | ||||||||
Earnings per share - diluted | 0.66 | 0.54 | 0.37 | 0.46 | 0.24 | 0.18 | 0.23 | 0.68 | ||||||||||||||||
Fiscal 2004 | August 31 | November 30 | February 29 | May 31 | ||||||||||||||||||||
| Fiscal 2007 | August 31 | November 30 | February 28 | May 31 | ||||||||||||||||||||
Net sales | $ | 498,035 | $ | 540,078 | $ | 558,067 | $ | 782,924 | $ | 778,720 | $ | 729,262 | $ | 677,250 | $ | 786,576 | ||||||||
Gross margin | 48,983 | 67,242 | 86,533 | 172,612 | 121,351 | 84,098 | 56,319 | 99,864 | ||||||||||||||||
Net earnings | 5,917 | 16,883 | 24,529 | 39,423 | 43,227 | 26,945 | 5,510 | 38,223 | ||||||||||||||||
Earnings per share - basic | $ | 0.07 | $ | 0.20 | $ | 0.28 | $ | 0.45 | $ | 0.49 | $ | 0.31 | $ | 0.07 | $ | 0.45 | ||||||||
Earnings per share - diluted | 0.07 | 0.20 | 0.28 | 0.45 | 0.48 | 0.31 | 0.06 | 0.45 | ||||||||||||||||
*The sum of the quarterly EPSearnings per share data presented in the table may not equal the annual results due to rounding and the impact of dilutive securities on the annual versus the quarterly EPS calculationsearnings per share calculations.
Results for the fourth quarter of fiscal 2008 (ended May 31, 2008), were negatively impacted by $4,894,000 of restructuring expense or $0.04 per diluted share.The restructuring expense primarily related to previously announced plant closures in the Metal Framing segment and rounding.professional fees in the Other category. To maintain consistency in the treatment of these professional fees certain professional fees totaling $3,300,000 reported in the previous three quarters in selling, general and administrative expense have been reclassified to restructuring charges in those quarters.
Results for the third quarter of fiscal 2008 (ended February 29, 2008), were negatively impacted by $4,179,000 of restructuring expense or $0.03 per diluted share. The restructuring expense primarily related to previously announced plant closures in the Metal Framing segment and professional fees in the Other category.
Results for the second quarter of fiscal 2008 (ended November 30, 2007), were negatively impacted by $4,602,000 of restructuring expense or $0.04 per diluted share. The restructuring expense primarily related to previously announced plant closures in the Metal Framing segment and professional fees in the Other category.
Results for the first quarter of fiscal 2005 ended2008 (ended August 31, 2004,2007), were reducednegatively impacted by a $5,608,000 pre-tax charge$4,436,000 of restructuring expense or $0.04 per diluted share. The restructuring expense primarily related to the sale of the Decatur, Alabama, cold mill and related assets. This charge was mainly due to contract termination costs that could not be accrued until the sale closed, which occurred on August 1, 2004, and other adjustments to the charge recorded at May 31, 2004. The impact of this charge was a reduction in net earnings of $3,538,000 million ($0.04 per diluted share).
Results for the second quarter of fiscal 2005 ended November 30, 2004, were increased by $1,735,000 ($0.01 per diluted share) due to a reduction in estimated tax liabilities from favorable tax audit settlements and related developments.
Results for the third quarter of fiscal 2005 ended February 28, 2005, were reduced by $4,290,000 ($0.05 per diluted share) due to a one-time state tax adjustment recorded in that quarter. In January 2005, the Sixth Circuit Court of Appeals held the state of Ohio’s investment tax credit program unconstitutional.
Results for the second quarter of fiscal 2004 ended November 30, 2003, included a credit to income tax expense of $1,361,000 ($0.01 per diluted share) from an adjustment to deferred taxes.
Results for the fourth quarter of fiscal 2004 ended May 31, 2004, included a pre-tax restructuring chargepreviously announced plant closures in the aggregate amount of $69,398,000 ($0.49 per diluted share, net of tax) related to impairment of certain assetsMetal Framing segment and other related costs atprofessional fees in the Decatur, Alabama, steel-processing facility and certain assets related to the European operations of the Pressure Cylinders segment. This quarter also included a credit of $6,364,000 ($0.07 per diluted share) to income tax expense for the favorable resolution of certain tax audits.Other category.
SCHEDULE II – VALUATION AND QUALIFYING ACCOUNTS
WORTHINGTON INDUSTRIES, INC. AND SUBSIDIARIES
COL. A. | COL. B. | COL. C. | COL. D. | COL. E. | |||||||||||||
Description | | Balance at Beginning of Period | Additions | | Deductions – Describe | | | Balance at End of Period | |||||||||
| | Charged to Costs and Expenses | | Charged to Other Accounts – Describe | | |||||||||||||
Year Ended May 31, 2005: | |||||||||||||||||
Deducted from asset accounts: | |||||||||||||||||
Allowance for possible | $ | 6,870,000 | $ | 5,583,000 | $ | 104,000(A | ) | $ | 1,332,000(B | ) | $ | 11,225,000 | |||||
Year Ended May 31, 2004: | |||||||||||||||||
Deducted from asset accounts: | |||||||||||||||||
Allowance for possible | $ | 5,267,000 | $ | 2,491,000 | $ | 108,000(A | ) | $ | 997,000(B | ) | $ | 6,870,000 | |||||
Year Ended May 31, 2003: | |||||||||||||||||
Deducted from asset accounts: | |||||||||||||||||
Allowance for possible | $ | 8,215,000 | $ | 178,000 | $ | 627,000(A | ) | $ | 3,753,000(B | ) | $ | 5,267,000 | |||||
| COL. A. | COL. B. | COL. C. | COL. D. | COL. E. | ||||||||||||||||||
| Description | Balance at Beginning of Period | Additions | Deductions – Describe | Balance at End of Period | ||||||||||||||||||
| Charged to Costs and Expenses | Charged to Other Accounts – Describe | |||||||||||||||||||||
Year Ended May 31, 2008:
Deducted from asset accounts: Allowance for possible losses on trade accounts receivable | $3,641,000 | 1,496,000 | 127,000 (A) | 415,000 (B) | $4,849,000 | |||||||||||||||||
Year Ended May 31, 2007:
Deducted from asset accounts: Allowance for possible losses on trade accounts receivable | $4,964,000 | 399,000 | 1,000 (A) | 1,723,000 (B) | $3,641,000 | |||||||||||||||||
Year Ended May 31, 2006:
Deducted from asset accounts: Allowance for possible losses on trade accounts receivable | $11,225,000 | 830,000 | 193,000 (A) | 7,284,000 (B) | $4,964,000 | |||||||||||||||||
Note A – Miscellaneous amounts.
Note B – UncollectibleUncollectable accounts charged to the allowance.allowance and a favorable bankruptcy settlement of $5,515,000 during the year ended May 31, 2006.
Item 9. –— Changes in and Disagreements With Accountants on Accounting and Financial Disclosure
No response required.
Not applicable.
Item 9A. –— Controls and Procedures
Evaluation of Disclosure Controls and Procedures
We maintain disclosure controls and procedures [as defined in Rules 13a-15(e) and 15d-15(e) under the Securities Exchange Act of 1934, as amended (the “Exchange Act”)] that are designed to provide reasonable assurance that information required to be disclosed in the reports that we file or submit under the Exchange Act is recorded, processed, summarized and reported within the time periods specified in the Securities and Exchange Commission’s rules and forms, and that such information is accumulated and communicated to our management, including our principal executive officer and our principal financial officer, as appropriate, to allow timely decisions regarding required disclosure.
Management, with the participation of our principal executive officer and our principal financial officer, performed an evaluation of the effectiveness of our disclosure controls and procedures (as defined in Rule 13a-15(e) under the Securities Exchange Act of 1934) as of the end of the fiscal year covered by this Annual Report on Form 10-K.10-K (the fiscal year ended May 31, 2008). Based on that evaluation, our principal executive officer and our principal financial officer have concluded that such disclosure controls and procedures were effective as of the end of the fiscal year covered by this Annual Report on Form 10-K10-K.
Changes in Internal Control Over Financial Reporting
We implemented a new enterprise resource planning system to ensureenhance automation of manufacturing processes at six of our Steel Processing plants with a plan to upgrade all of our Steel Processing locations. The new computer system automates certain control functions related to key manufacturing processes, such as inventory management.
There were no other changes in our internal control over financial reporting that material information relatingoccurred in the last fiscal quarter (the fiscal quarter ended May 31, 2008) that have materially affected, or are reasonably likely to Worthington Industries, Inc. andmaterially affect, our consolidated subsidiaries is made known to them, particularly during the period for which periodic reports of Worthington Industries, Inc., including this Annual Report on Form 10-K, are being prepared.
internal control over financial reporting.
Annual Report of Management on Internal Control Over Financial Reporting
Management is responsible for establishing and maintaining adequate internal control over financial reporting to provide reasonable assurance regarding the reliability of our financial reporting and the preparation of financial statements for external purposes in accordance with accounting principles generally accepted in the United States. Internal control over financial reporting includes those policies and procedures that (i) pertain to the maintenance of records that, in reasonable detail, accurately and fairly reflect the transactions and dispositions of the assets of Worthington Industries, Inc. and our consolidated subsidiaries; (ii) provide reasonable assurance that transactions are recorded as necessary to permit preparation of financial statements in accordance with accounting principles generally accepted in the United States, and that receipts and expenditures of Worthington Industries, Inc. and our consolidated subsidiaries are being made only in accordance with authorizations of management and directors of Worthington Industries, Inc. and our consolidated subsidiaries, as appropriate; and (iii) provide reasonable assurance regarding prevention or timely detection of unauthorized acquisition, use or disposition of the assets of Worthington Industries, Inc. and our consolidated subsidiaries that could have a material effect on the financial statements.
Management, with the participation of our principal executive officer and our principal financial officer, assessedevaluated the effectiveness of our internal control over financial reporting as of May 31, 2005,2008, the end of our fiscal year. Management based its assessment on criteria established inInternal Control-Integrated Framework issued by the Committee of Sponsoring Organizations of the Treadway Commission. Management’s assessment included evaluation of such elements as the design and operating effectiveness of key financial reporting controls, process documentation, accounting policies and our overall control environment. This assessment is supported by testing and monitoring performed under the direction of management.
Because of its inherent limitations, internal control over financial reporting may not prevent or detect misstatements. Also, projections of any evaluationsevaluation of effectiveness to future periods are subject to the risk that controls may become inadequate because of changes in conditions, or that the degree of compliance with the policies or procedures may deteriorate. Accordingly, even an effective system of internal control over financial reporting will provide only reasonable assurance with respect to financial statement preparation.
On September 17, 2004, Worthington Cylinders acquired substantially allBased on the assessment of the net assets (other than real property) of the propane and specialty gas cylinder business of Western Industries, Inc. (the “Western Cylinder Assets”). As permitted by the Securities and Exchange Commission, management excluded the Western Cylinder Assets from management’s assessment ofour internal control over financial reporting, as of May 31, 2005. This business constituted approximately 1% of consolidated total assets (excluding goodwill and other indefinite-lived intangible assets) as of May 31, 2005, and 1.5% of consolidated net sales for the fiscal year ended May 31, 2005. The Western Cylinder Assets will be included in management’s assessment of the internal control over financial reporting for Worthington Industries, Inc. and our consolidated subsidiaries as of May 31, 2006.
Based on our assessment, management has concluded that our internal control over financial reporting was effective as of May 31, 2008. The results of management’s assessment were reviewed with the endAudit Committee of the Board of Directors of Worthington Industries, Inc.
Additionally, our independent registered public accounting firm, KPMG LLP, independently assessed the effectiveness of our internal control over financial reporting and issued the accompanying Attestation Report of Independent Registered Public Accounting Firm.
Attestation Report of Independent Registered Public Accounting Firm
The Board of Directors and Shareholders
Worthington Industries, Inc.:
We have audited Worthington Industries, Inc.’s internal control over financial reporting as of May 31, 2005,2008, based on criteria established in Internal Control—Integrated Framework issued by the Committee of Sponsoring Organizations of the Treadway Commission (COSO). Worthington Industries, Inc.’s management is responsible for maintaining effective internal control over financial reporting and for its assessment of the effectiveness of internal control over financial reporting, included in the accompanying Annual Report of Management on Internal Control Over Financial Reporting. Our responsibility is to express an opinion on the Company’s internal control over financial reporting based on our audit.
We conducted our audit in accordance with the standards of the Public Company Accounting Oversight Board (United States). Those standards require that we plan and perform the audit to obtain reasonable assurance about whether effective internal control over financial reporting was maintained in all material respects. Our audit included obtaining an understanding of internal control over financial reporting, assessing the risk that a material weakness exists, and testing and evaluating the design and operating effectiveness of internal control based on the assessed risk. Our audit also included performing such other procedures as we considered necessary in the circumstances. We believe that our audit provides a reasonable basis for our opinion.
A company’s internal control over financial reporting is a process designed to provide reasonable assurance regarding the reliability of financial reporting and the preparation of financial statements for external reporting purposes in accordance with accounting principles generally accepted in the United States. We reviewed the results of management’s assessment with the Audit Committee of Worthington Industries, Inc.
Attestation Report of the Registered Public Accounting Firm
Our independent registered public accounting firm, KPMG LLP, audited management’s assessment and independently assessed the effectiveness of ourprinciples. A company’s internal control over financial reporting. KPMG LLP hasreporting includes those policies and procedures that (1) pertain to the maintenance of records that, in reasonable detail, accurately and fairly reflect the transactions and dispositions of the assets of the company; (2) provide reasonable assurance that transactions are recorded as necessary to permit preparation of financial statements in accordance with generally accepted accounting principles, and that receipts and
expenditures of the company are being made only in accordance with authorizations of management and directors of the company; and (3) provide reasonable assurance regarding prevention or timely detection of unauthorized acquisition, use, or disposition of the company’s assets that could have a material effect on the financial statements.
Because of its inherent limitations, internal control over financial reporting may not prevent or detect misstatements. Also, projections of any evaluation of effectiveness to future periods are subject to the risk that controls may become inadequate because of changes in conditions, or that the degree of compliance with the policies or procedures may deteriorate.
In our opinion, Worthington Industries, Inc. maintained, in all material respects, effective internal control over financial reporting as of May 31, 2008, based on criteria established inInternal Control—Integrated Framework issued an attestation report concurring with management’s assessment, which is included under “Item 8 – Financial Statements and Supplementary Data”by the Committee of this Annual Report on Form 10-K.
New ERP SystemSponsoring Organizations of the Treadway Commission.
We arealso have audited, in accordance with the processstandards of implementing a new software based enterprise resource planning (“ERP”) system throughout muchthe Public Company Accounting Oversight Board (United States), the consolidated balance sheets of Worthington Industries, Inc. and oursubsidiaries as of May 31, 2008 and 2007, and the related consolidated subsidiaries. Implementing a new system results in changes to business processesstatements of earnings, shareholders’ equity, and related controls. We believe that we are adequately controlling the transition to the new processes and controls and that there will be no negative impact to our internal control environment. In fact, onecash flows for each of the expected benefits ofyears in the fully implemented ERP system isthree-year period ended May 31, 2008, and our report dated July 30, 2008 expressed an enhancement of our internal control overunqualified opinion on those consolidated financial reporting.statements.
/s/ KPMG LLP |
Changes in Internal Control Over Financial ReportingColumbus, Ohio
There were no significant changes (except for the ERP changes noted above), which occurred during our fourth fiscal quarter of the period covered by this Annual Report of Form 10-K, in our internal control over financial reporting (as defined in Rule 13a-15(f) under the Securities Exchange Act of 1934) that have materially affected, or are reasonably likely to materially affect, our internal control over financial reporting.
July 30, 2008
The CompensationResignation of John S. Christie as a Director and Stock Option CommitteeOther Changes in the Composition of the Board of Directors of Worthington Industries, Inc. (the “Compensation Committee”)
On July 25, 2008, John S. Christie, who serves in the class of directors of the Company whose terms will expire at the 2008 Annual Meeting of Shareholders, notified the Company that he intended to resign as a director effective July 31, 2008. As previously disclosed in the Company's Current Report on Form 8-K filed on May 5, 2008, Mr. Christie previously notified the Company on May 2, 2008, that he wished to retire as President and Chief Financial Officer of the Company effective July 31, 2008. The Company's Board of Directors determined that they would accept his resignation from the Board at the time of his retirement with the Company on July 31, 2008.
To make the number of directors in each class equal, effective as of August 1, 2008, the directorship of Carl A. Nelson, Jr. shall be changed from a director in the class of directors whose term ends at the Annual Meeting of Shareholders in 2009 to a director in the class of directors whose term ends in 2008 to fill the vacancy created by Mr. Christie's resignation. The Board has implemented a long-term incentive programalso taken action to reduce the size of the Board from ten to nine directors, with three directors in which executive officerseach class, effective upon Mr. Nelson's change in class.
Entry into Indemnification Agreements with Directors and other key employeesExecutive Officers
In order to further ensure that the indemnification protections afforded under Ohio General Corporation Law and the Code of Regulations of Worthington Industries, Inc. (“Worthington Industries”) to directors and its subsidiaries (collectively,executive officers of Worthington Industries remain available, on July 25, 2008, Worthington Industries entered into indemnification agreements (the “Indemnification Agreements”) with each of Worthington Industries’ directors and executive officers (each, an “Indemnitee”). The Indemnification Agreements generally
require Worthington Industries to hold harmless and indemnify an Indemnitee, to the “Company”) participate, which anticipates considerationgreatest extent permitted by Ohio law, against specified expenses and liabilities that may arise in connection with a proceeding by reason of long-term performance awards based upon achieving measurable financial criteria overthe Indemnitee’s status or service as a multiple-year period. Under this program, performance awards have been granteddirector and/or officer of Worthington Industries, if the Indemnitee acted in good faith and in a manner the Indemnitee reasonably believed to be in or not opposed to the best interests of Worthington Industries and, with respect to any criminal proceeding, the Indemnitee had no reasonable cause to believe the Indemnitee’s conduct was unlawful. The Indemnification Agreements also require Worthington Industries to advance expenses to an Indemnitee prior to the final disposition of a proceeding if specified conditions are satisfied. The Indemnification Agreements provide procedures for determining an Indemnitee’s entitlement to indemnification and specify certain remedies for the Indemnitee relating to indemnification and advancement of expenses.
Worthington Industries is not obligated to make any payment to an Indemnitee under an Indemnification Agreement (a) if and to the extent that the Indemnitee has actually received payment under any insurance policy, any contract, the Amended Articles of Incorporation or Code of Regulations of Worthington Industries or otherwise of amounts otherwise payable under the Indemnification Agreement; (b) for expenses and other liabilities arising from the purchase and sale by the Indemnitee of securities in violation of Section 16(b) of the Securities Exchange Act of 1934, as amended; (c) if such payment is prohibited by applicable law; (d) with respect to any claim brought or made by the Indemnitee in a proceeding, unless (i) the bringing or making of the claim was approved or ratified by Worthington Industries’ Board of Directors or joined by Worthington Industries or (ii) the claim is brought or made by the Indemnitee following a change in control (as defined in the Indemnification Agreement) in order to enforce a right of the Indemnitee to receive indemnification; or (e) for expenses and other liabilities arising from a proceeding in which the court finds the Indemnitee’s actions to be knowingly fraudulent, deliberately dishonest or willful misconduct, except to the extent such indemnity is otherwise permitted by applicable law.
The Indemnification Agreements do not exclude any other rights to indemnification or advancement of expenses to which an Indemnitee may be entitled under the Amended Articles of Incorporation or Code of Regulations of Worthington Industries, applicable law (including Ohio General Corporation Law), any insurance policy, any contract or otherwise.
The foregoing summary is qualified in its entirety by reference to the full text of the Indemnification Agreements. Each of the Indemnification Agreements with the directors of Worthington Industries is identical in all material respects to the form of indemnification agreement for directors that is filed with this Annual Report on Form 10-K as Exhibit [10.32] and incorporated herein by reference. Each of the Indemnification Agreements with the executive officers of Worthington Industries is identical in all material respects to the form of indemnification agreement for executive officers that is filed with this Annual Report on Form 10-K as Exhibit [10.33] and incorporated herein by reference.
The following are the directors and executive officers of Worthington Industries who entered into Indemnification Agreements with Worthington Industries on July 25, 2008:
John P. McConnell | — | Chairman of the Board and Chief Executive Officer | ||
John S. Christie | — | President and Chief Financial Officer | ||
George P. Stoe | — | Executive Vice President and Chief Operating Officer | ||
Dale T. Brinkman | — | Vice President-Administration, General Counsel and Secretary | ||
Harry A. Goussetis | — | President, Worthington Cylinder Corporation | ||
Lester V. Hess | — | Treasurer | ||
John E. Roberts | — | President, Dietrich Industries, Inc. | ||
Ralph V. Roberts | — | Senior Vice President – Marketing; President, Worthington Integrated Building Systems, LLC | ||
Mark A. Russell | — | President, The Worthington Steel Company | ||
Richard G. Welch | — | Controller | ||
Virgil L. Winland | — | Senior Vice President – Manufacturing | ||
John B. Blystone | — | Director | ||
William S. Dietrich, II | — | Director | ||
Michael J. Endres | — | Director | ||
Peter Karmanos, Jr. | — | Director | ||
John R. Kasich | — | Director | ||
Carl A. Nelson, Jr. | — | Director | ||
Sidney A. Ribeau | — | Director | ||
Mary Schiavo | — | Director | ||
PART III
Item 10. — Directors, Executive Officers and Corporate Governance
Directors, Executive Officers and Persons Nominated or Chosen to Become Directors or Executive Officers
The information required by Item 401 of SEC Regulation S-K concerning the directors of Worthington Industries, Inc. 1997 Long-Term Incentive Plan (the “1997 LTIP”(“Worthington Industries” or the “Registrant”) with payouts based upon achieving performance levels over a three-year period. For corporate executives and employees, payouts of performance awards are generally tied to achieving specific levels (threshold, target and maximum), of corporate economic value added and earnings per sharethe nominees for the performance period with each performance measure carrying a 50% weighting. For business unit executives and employees, corporate economic value added and earnings per share measures together carry a 50% weighting and an operating income measure for the appropriate business unit is weighted 50%. If the performance level falls between “threshold” and “target” or between “target” and “maximum”, the award is prorated. Under the 1997 LTIP, the level of payouts, if any, is determined by the Compensation Committee after financial results for the applicable performance period are available and are generally paid within three months following the end of the applicable performance period. Performance awards may be paid in cash, in Common Sharesre-election as directors of Worthington Industries Inc., or other property or any combination thereof, at the sole discretion of the Compensation Committee at the time of payment.
Grants and payouts of long-term incentive awards under the 1997 LTIP have been shown in the Company’s Proxy Statements under the heading “EXECUTIVE COMPENSATION.” Information on performance awards granted to named executives of the Company on May 20, 2005 and payout performance LTIP awards granted for the three-year period ended May 31, 2005 will be shown under the headings “EXECUTIVE COMPENSATION – Long-Term Incentive Plan Awards” and EXECUTIVE COMPENSATION – Summary of Cash and Other Compensation,” respectively in the Company’s Proxy Statement for the Annual Meeting of Shareholders to be held
on September 29, 200524, 2008 (the “2005“2008 Annual Meeting”) is incorporated herein by reference from the disclosure to be included under the caption “PROPOSAL 1: ELECTION OF DIRECTORS” in Worthington Industries’ definitive Proxy Statement relating to the 2008 Annual Meeting (“Worthington Industries’ Definitive 2008 Proxy Statement”). The relevant portions, which will be filed pursuant to SEC Regulation 14A not later than 120 days after the end of the 2005 Proxy Statement are incorporated by reference into “Item 11 – Executive Compensation” of this Annual Report on Form 10-K. The 1997 LTIP is filed as Exhibit 10(e) of the Annual Report on Form 10-K filed by Worthington Industries, Inc., a Delaware corporation, for theIndustries’ fiscal 2008 (the fiscal year ended May 31, 1997 (SEC File No. 0-4016) and2008).
The information required by Item 401 of SEC Regulation S-K concerning the executive officers of Worthington Industries is incorporated herein by reference as Exhibit 10.6 of this Annual Report on Form 10-K andfrom the form of Performance Awarddisclosure included under the 1997 LTIP is filed as Exhibit 10.21caption “Supplemental Item – Executive Officers of the Registrant” in Part I of this Annual Report on Form 10-K.
PART III
Item 10. – Directors and Executive OfficersCompliance with Section 16(a) of the RegistrantExchange Act
In accordance with General Instruction G(3) of Form 10-K, theThe information regarding directors required by Item 401405 of SEC Regulation S-K is incorporated herein by reference from the materialdisclosure to be included under “PROPOSAL 1: ELECTIONthe caption “SECURITY OWNERSHIP OF DIRECTORS”CERTAIN BENEFICIAL OWNERS AND MANAGEMENT – Section 16(a) Beneficial Ownership Reporting Compliance” in the 2005 Proxy Statement. The information regarding executive officers required by Item 401 of Regulation S-K is included in Part I of this Form 10-K under the heading “Supplemental Item. – Executive Officers of the Registrant.” The information required by Item 405 of Regulation S-K is incorporated herein by reference from material to be included under “SECTION 16(a) BENEFICIAL OWNERSHIP REPORTING COMPLIANCE” in the 2005Worthington Industries’ Definitive 2008 Proxy Statement.
Procedures by which Shareholders may Recommend Nominees to Worthington Industries’ Board of Directors
Information concerning the Registrant’s Audit Committee and the determinationprocedures by the Registrant’swhich shareholders of Worthington Industries may recommend nominees to Worthington Industries’ Board of Directors that at least one member of the Audit Committee qualifies as an “audit committee financial expert” is incorporated herein by reference from the information which willdisclosure to be included under the headingscaptions “PROPOSAL 1: ELECTION OF DIRECTORS – Committees and Meetings of the Board – Committees of the Board” and “PROPOSAL 1: ELECTION OF DIRECTORS – Committees and Meetings of the Board – Audit Committee” in the Registrant’s Proxy Statement. Information concerning the nomination process for director candidates is incorporated herein by reference from the information which will be included under the headings “PROPOSAL 1: ELECTION OF DIRECTORS – Committees and Meetings of the Board – Nominating and Governance Committee” and “CORPORATE GOVERNANCE – Nominating Procedures” in Worthington Industries’ Definitive 2008 Proxy Statement. These procedures have not materially changed from those described in Worthington Industries’ Definitive Proxy Statement for the 2007 Annual Meeting of Shareholders held on September 26, 2007.
Audit Committee
The information required by Items 407(d)(4) and 407(d)(5) of SEC Regulation S-K is incorporated herein by reference from the disclosure to be included under the caption “PROPOSAL 1: ELECTION OF DIRECTORS – Nominating Procedures”Committees of the Board – Audit Committee” in the Registrant’sWorthington Industries’ Definitive 2008 Proxy Statement.
Code of Conduct; Committee Charters; Corporate Governance Guidelines
The Registrant’sWorthington Industries’ Board of Directors has adopted Charters for each of the Audit Committee, the Compensation and Stock Option Committee, the Executive Committee and the Nominating and Governance Committee as well as Corporate Governance Guidelines as contemplated by the applicable sections of the New York Stock Exchange Listed Company Manual.
In accordance with the requirements of Section 303A(10)303A.10 of the New York Stock Exchange Listed Company Manual, the Board of Directors of the RegistrantWorthington Industries has adopted a Business Code of Conduct covering the directors, officers and employees of the Registrant,Worthington Industries and its subsidiaries, including the Registrant’sWorthington
Industries’ Chairman of the Board and Chief Executive Officer (the principal executive officer), the Registrant’sWorthington Industries’ President and Chief Financial Officer (the principal financial officer) and the Registrant’sWorthington Industries’ Controller (the principal accounting officer). The Registrant will disclose the following events, if they occur, in a current report on Form 8-K to be filed with the “Corporate Governance” page of the Investor Relations section of the Registrant’s website located at www.worthingtonindustries.comSEC within the time periodrequired four business days following their occurrence as required byoccurrence: (A) the applicable rules of the SECdate and the requirements of Section 303A(10) of the New York Stock Exchange Listed Company Manual: (A) the nature of any amendment to a provision of the Registrant’s BusinessWorthington Industries’ Code of Conduct that (i) applies to the Registrant’sWorthington Industries’ principal executive officer, principal financial officer, principal accounting officer or controller, or persons performing similar functions, (ii) relates to any element of the “code of ethics” definition enumerated in Item 406(b) of SEC Regulation S-K, and (iii) is not a technical, administrative or other non-substantive amendment; and (B) a description of any waiver (including the nature of the waiver, the name of the person to whom the waiver was granted and the date of the waiver), including an implicit waiver, from a provision of the Business Code of Conduct granted to the Registrant’sWorthington Industries’ principal executive officer, principal financial officer, principal accounting officer or controller, or persons performing similar functions, that relates to one or more of the itemselements of the “code of ethics” definition set forth in Item 406(b) of SEC Regulation S-K.
In addition, Worthington Industries will disclose any waivers from the provisions of the Code of Conduct granted to a director or executive officer of Worthington Industries in a current report on Form 8-K to be filed with the SEC within the required four business days following their occurrence.
The text of each of the Charter of the Audit Committee, the Charter of the Compensation and Stock Option Committee, the Charter of the Executive Committee, the Charter of the Nominating and Governance Committee, the Corporate Governance Guidelines and the Business Code of Conduct is posted on the “Corporate Governance” page
of the Investor Relations“Investor Relations” section of the Registrant’s websiteWorthington Industries’ web site located at www.worthingtonindustries.com. Interested persons and shareholders of Worthington Industries may also obtain copies of each of these documents, without charge, by writing to the Investor Relations Department of the RegistrantWorthington Industries at Worthington Industries, Inc., 200 Old Wilson Bridge Road, Columbus, Ohio 43085, Attention: Allison M. Sanders. In addition, a copy of the Business Code of Conduct was filed as Exhibit 14 to the Registrant’s Annual Report on Form 10-K for the fiscal year ended May 31, 2004.
2007.
Item 11. –— Executive Compensation
In accordance with General Instruction G(3) of Form 10-K, theThe information required by this Item 11402 of SEC Regulation S-K is incorporated herein by reference from the material which willdisclosure to be contained in the Proxy Statementincluded under the headings “PROPOSAL 1: ELECTIONcaptions “EXECUTIVE COMPENSATION” and “COMPENSATION OF DIRECTORS – Compensation of Directors” and “EXECUTIVE COMPENSATION.” Such incorporationDIRECTORS” in Worthington Industries’ Definitive 2008 Proxy Statement.
The information required by reference shall not be deemed to specifically incorporate by reference the information referred to in Item 402(a)(8)407(e)(4) of SEC Regulation S-K.S-K is incorporated herein by reference from the disclosure to be included under the caption “CORPORATE GOVERNANCE — Compensation Committee Interlocks and Insider Participation” in Worthington Industries’ Definitive 2008 Proxy Statement.
The information required by Item 407(e)(5) of SEC Regulation S-K is incorporated herein by reference from the disclosure to be included under the caption “EXECUTIVE COMPENSATION — Compensation Committee Report” in Worthington Industries’ Definitive 2008 Proxy Statement.
Item 12. –— Security Ownership of Certain Beneficial Owners and Management and Related Stockholder Matters
Ownership of Common Shares of Worthington Industries
In accordance with General Instruction G(3) of Form 10-K, theThe information required by this Item 12 with respect to the security ownership403 of certain beneficial owners and managementSEC Regulation S-K is incorporated herein by reference from the material which willdisclosure to be contained in the Proxy Statementincluded under the heading “CERTAINcaption “SECURITY OWNERSHIP OF CERTAIN BENEFICIAL OWNERS OF COMMON SHARES.” AND MANAGEMENT” in Worthington Industries’ Definitive 2008 Proxy Statement.
Equity Compensation Plan Information
The information required by this Item 12 with respect to securities authorized for issuance under equity compensation plans201(d) of SEC Regulation S-K is incorporated herein by reference from the material contained in the Proxy Statementdisclosure to be included under the heading “EXECUTIVEcaption “EQUITY COMPENSATION – Equity Compensation Plan Information.”
PLAN INFORMATION” in Worthington Industries’ Definitive 2008 Proxy Statement.
Item 13. –— Certain Relationships and Related Transactions, and Director Independence
Certain Relationships and Related Person Transactions
In accordance with General Instruction G(3) of Form 10-K, theThe information required by this Item 13404 of SEC Regulation S-K is incorporated herein by reference tofrom the information for John H. McConnell anddisclosure in respect of John P. McConnell which willto be containedincluded under the heading “CERTAINcaption “SECURITY OWNERSHIP OF CERTAIN BENEFICIAL OWNERS OF COMMON SHARES” inAND MANAGEMENT” and from the Proxy Statement and by referencedisclosure to the material set forthbe included under the caption “TRANSACTIONS WITH CERTAIN RELATED PARTIES”PERSONS” in theWorthington Industries’ Definitive 2008 Proxy Statement.
Director Independence
The information required by Item 407(a) of SEC Regulation S-K is incorporated herein by reference from the disclosure to be included under the caption “CORPORATE GOVERNANCE – Director Independence” in Worthington Industries’ Definitive 2008 Proxy Statement.
Item 14. –— Principal Accountant Fees and Services
In accordance with General Instruction G(3) of Form 10-K, theThe information required by this Item 14 is incorporated herein by reference from the information which willdisclosure to be contained in the Proxy Statementincluded under the headingscaptions “AUDIT COMMITTEE MATTERS – Fees of Independent Auditors”Registered Public Accounting Firm Fees” and “AUDIT COMMITTEE MATTERS – Pre-Approval of Services Performed by the Independent Auditors.Registered Public Accounting Firm.”
PART IV
Item 15. –— Exhibits and Financial Statement Schedules
(a) | The following documents are filed as a part of this Annual Report on Form 10-K: |
(1) | Consolidated Financial Statements: |
The consolidated financial statements (and report thereon) listed below are filed as a part of this Annual Report on Form 10-K:
Report of Independent Registered Public Accounting Firm (KPMG LLP)
Consolidated Balance Sheets as of May 31, 20052008 and 20042007
Consolidated Statements of Earnings for the fiscal years ended May 31, 2005, 20042008, 2007 and 20032006
Consolidated Statements of Shareholders’ Equity for the fiscal years ended May 31, 2005, 20042008, 2007 and 2003
2006
Consolidated Statements of Cash Flows for the fiscal years ended May 31, 2005, 20042008, 2007 and 20032006
Notes to Consolidated Financial Statements – fiscal years ended May 31, 2005, 20042008, 2007 and 20032006
(2) | Financial Statement |
Schedule II – Valuation and Qualifying Accounts
All other financial statement schedules for which provision is made in the applicable accounting regulations of the SEC are omitted because they are not required or the required information required has been presented in the aforementioned consolidated financial statements.statements or notes thereto.
(3) | Listing of Exhibits: |
The exhibits listed on the “Index to Exhibits” beginning on page E-1 of this Annual Report on Form 10-K are filed with this Annual Report on Form 10-K or incorporated hereinin this Annual Report on Form 10-K by reference as noted in the “Index to Exhibits.” The “Index to Exhibits” specifically identifies each management contract or compensatory plan or arrangement required to be filed as an exhibit to this Annual Report on Form 10-K.10-K or incorporated in this Annual Report on Form 10-K by reference.
(b) | Exhibits: The exhibits listed on the “Index to Exhibits” beginning on page E-1 of this Annual Report on Form 10-K are filed with this Annual Report on Form 10-K or incorporated |
(c) | Financial Statement Schedule: The financial statement schedule listed in Item 15(a)(2) above is filed |
Pursuant to the requirements of Section 13 or 15(d) of the Securities Exchange Act of 1934, the Registrant has duly caused this report to be signed on its behalf by the undersigned, thereunto duly authorized.
WORTHINGTON INDUSTRIES, INC. | ||||||||
Date: | By: | /s/ John P. McConnell | ||||||
John P. McConnell, | ||||||||
Chairman of the Board and Chief Executive Officer | ||||||||
Pursuant to the requirements of the Securities Exchange Act of 1934, this report has been signed below by the following persons on behalf of the Registrant and in the capacities and on the date indicated.
SIGNATURE | DATE | TITLE | ||
/s/ John P. McConnell John P. McConnell | July 30, 2008 | Director, Chairman of the Chief Executive | ||
/s/ John S. Christie John S. Christie | July 30, 2008 | Director, President and Chief Financial Officer | ||
/s/ Richard G. Welch Richard G. Welch | July 30, 2008 | Controller (Principal Accounting | ||
* John B. Blystone | * | Director | ||
* William S. Dietrich, II | * | Director | ||
* Michael J. Endres | * | Director | ||
* Peter Karmanos, Jr. | * | Director | ||
* John R. Kasich | * | Director | ||
* Carl A. Nelson, Jr. | * | Director | ||
* Sidney A. Ribeau | * | Director | ||
* Mary Schiavo | * | Director | ||
*The undersigned, by signing his name hereto, does hereby sign this report on behalf of each of the above-identified directors of the Registrant pursuant to powers of attorney executed by such directors, andwhich powers of attorney are filed with this report.report as exhibits.
*By: | /s/ John P. McConnell | Date: | ||||||
John P. McConnell | ||||||||
Attorney-In-Fact |
| Exhibit | Description | Location | ||
|
|
| ||
3.1 | Amended Articles of Incorporation of Worthington Industries, Inc., as filed with Ohio Secretary of State on October 13, 1998 | Incorporated herein by reference to Exhibit 3(a) | ||
3.2 | Code of Regulations of Worthington Industries, Inc., as amended through September 28, 2000 [for SEC reporting compliance purposes only] | Incorporated herein by reference to Exhibit 3(b) | ||
4.1 | Form of Indenture, dated as of May 15, 1996, between Worthington Industries, Inc. and PNC Bank, Ohio, National Association, as Trustee, relating to up to $450,000,000 of debt | Incorporated herein by reference to Exhibit 4(a) | ||
4.2 |
|
| ||
| Form of 6.7% Note due December 1, 2009 | Incorporated herein by reference to Exhibit 4(f) | ||
| Second Supplemental Indenture, dated as of December 12, 1997, between Worthington Industries, Inc. and PNC Bank, Ohio, National Association, as Trustee. [NOTE: Effective November 15, 2006, U.S. Bank National Association succeeded The Bank of New York Trust Company, N.A. (formerly known as Bank of New York) as successor Trustee; which in turn was successor Trustee to J.P. Morgan Trust Company, National Association; which in turn was successor Trustee to Chase Manhattan Trust Company, National Association; which in turn was successor Trustee to PNC Bank, National Association, formerly known as PNC Bank, Ohio, National Association] | Incorporated herein by reference to Exhibit 4(g) | ||
| Third Supplemental Indenture, dated as of October 13, 1998, among Worthington Industries, Inc., a Delaware corporation, Worthington Industries, Inc., an Ohio corporation, and PNC Bank, National Association, as Trustee. [NOTE: Effective November 15, 2006, U.S. Bank National Association succeeded The Bank of New York Trust Company, N.A. (formerly known as Bank of New York) as successor Trustee; which in turn was successor Trustee to J.P. Morgan Trust Company, National Association; which in turn was successor Trustee to Chase Manhattan Trust Company, National Association; which in turn was successor Trustee to PNC Bank, National Association, formerly known as PNC Bank, Ohio, National | Incorporated herein by reference to Exhibit 4(h) | ||
| 4.5 | Fourth Supplemental Indenture, dated as of May 10, 2002, between Worthington Industries, Inc. and J.P. Morgan Trust Company, National Association, as successor Trustee [Note: Effective November 15, 2006, U.S. Bank National Association succeeded The Bank of New York Trust Company, N.A. (formerly known as Bank of New York) as successor Trustee; which in turn was successor Trustee to J.P. Morgan Trust Company, National Association; which in turn was successor Trustee to Chase Manhattan Trust Company, National Association; which in turn was successor Trustee to PNC Bank, National Association, formerly known as PNC Bank, Ohio, National Association] | Incorporated by reference to Exhibit 4(h) to the Registrant's Annual Report on Form 10-K for the fiscal year ended May 31, 2002 (SEC File No. 1-8399) | ||
| 4.6 | Tri-Party Agreement, dated as of October 30, 2006, among The Bank of New York Trust Company, N.A., U. S. Bank National Association and Worthington Industries, Inc. | Incorporated herein by reference to Exhibit 10.1 to the Registrant’s Current Report on Form 8-K dated November 2, 2006 and filed with the SEC on the same date (SEC File No. 1-8399) | ||
| 4.7 | $435,000,000 Second Amended and Restated Revolving Credit Agreement, dated as of |
| ||
| 4.8 | First Amendment to Credit Agreement, dated as of May 6, 2008, among Worthington Industries, Inc., as Borrower; the Lenders party thereto; and PNC Bank, National Association, as Administrative Agent for the Lenders | Incorporated herein by reference to Exhibit 4.1 to the Registrant’s Current Report on Form 8-K dated May 8, 2008 and filed with the SEC on the same date (SEC File No. 1-8399) | ||
| Note Purchase Agreement, dated December 17, 2004, between Worthington Industries, Inc. and Allstate Life Insurance Company, Connecticut General Life Insurance Company, United of Omaha Life Insurance Company and Principal Life Insurance Company | Incorporated herein by reference to Exhibit 4.1 to the Registrant's Current Report on Form 8-K dated December 20, 2004 and filed with the SEC on December 21, 2004 (SEC File No. 1-8399) | ||
| 4.10 | Form of Floating Rate Senior Note due December 17, 2014 | Incorporated herein by reference to Exhibit 4.2 to the Registrant’s Current Report on Form 8-K dated December 20, 2004 and filed with the SEC on December 21, 2004 (SEC File No. 1-8399) | ||
|
| Incorporated herein by reference to Exhibit 4.2 | ||
| Agreement to furnish instruments and agreements defining rights of holders of long-term debt | Filed herewith | ||
10.1 | Worthington Industries, Inc. Non-Qualified Deferred Compensation Plan effective March 1, 2000* |
| ||
10.2 | Worthington Industries, Inc. 2005 Non-Qualified Deferred Compensation Plan* | Incorporated herein by reference to Exhibit 10.1 | ||
| 10.3 |
| Incorporated herein by reference to Exhibit 10.1 to the Registrant's Current Report on Form 8-K dated November 17, 2005 and filed with the SEC on November 18, 2005 (SEC File No. 1-8399) | ||
| 10.4 | Worthington Industries, Inc. Deferred Compensation Plan for Directors, as Amended and Restated, effective June 1, 2000* | Incorporated herein by reference to Exhibit 10(d) | ||
| Worthington Industries, Inc. 2005 Deferred Compensation Plan for Directors* | Incorporated herein by reference to Exhibit 10.2 |
| Worthington Industries, Inc. 1990 Stock Option Plan, as amended* | Incorporated herein by reference to Exhibit 10(b) | ||||
| Worthington Industries, Inc. 1997 Long-Term Incentive Plan (material terms of performance goals most recently approved by shareholders on September 25, 2003) * | Incorporated herein by reference to Exhibit 10(e) | ||||
| Form of Non-Qualified Stock Option Agreement for non-qualified stock options granted under the Worthington Industries, Inc. 1997 Long-Term Incentive Plan* | Incorporated herein by reference to Exhibit 10.1 | ||||
| Worthington Industries, Inc. 2000 Stock Option Plan for Non-Employee Directors (reflects amendments through September 25, 2003)* | Incorporated herein by reference to Exhibit | ||||
| Form of Non-Qualified Stock Option Agreement for non-qualified stock options granted under the Worthington Industries, Inc. 2000 Stock Option Plan for Non-Employee | Incorporated herein by reference to Exhibit 10.2 | ||||
| Worthington Industries, Inc. 2003 Stock Option Plan (as approved by shareholders on September 25, 2003)* | Incorporated herein by reference to Exhibit 10.2 | ||||
| Form of Non-Qualified Stock Option Agreement for non-qualified stock options granted under the Worthington Industries, Inc. 2003 Stock Option Plan* | Incorporated herein by reference to Exhibit 10.3 | ||||
| 10.13 |
| Incorporated herein by reference to Exhibit 10 to the Registrant’s Registration Statement on Form S-8 filed September 27, 2006 (SEC Registration No. 333-137614) | ||||
| 10.14 | Form of Nonqualified Stock Option Award Agreement under the Worthington Industries, Inc. 2006 Equity Incentive Plan for Non-Employee Directors entered into by Worthington Industries, Inc. in order to evidence the grant of nonqualified stock options to non- | Incorporated herein by reference to Exhibit 10.2 to the Registrant's Current Report on Form 8-K dated October 2, 2006 and filed with the SEC on the same date (SEC File No. 1-8399) | ||||
employee directors of Worthington Industries, Inc. on September 27, 2006 and to be entered into by Worthington Industries, Inc. in order to evidence future grants of nonqualified stock options to non-employee directors of Worthington Industries, Inc.* | ||||
| 10.15 | Form of Restricted Stock Award Agreement under the Worthington Industries, Inc. 2006 Equity Incentive Plan for Non-Employee Directors entered into by Worthington Industries, Inc. in order to evidence the grant of restricted stock on September 27, 2006 to non-employee directors of Worthington Industries, Inc. and to be entered into by Worthington Industries, Inc. in order to evidence future grants of restricted stock to non-employee directors of Worthington Industries, Inc.* | Incorporated herein by reference to Exhibit 10.3 to the Registrant's Current Report on Form 8-K dated October 2, 2006 and filed with the SEC on the same date (SEC File No. 1-8399) | ||
| 10.16 | Receivables Purchase Agreement, dated as of November 30, 2000, among Worthington Receivables Corporation, as Seller, Worthington Industries, Inc., as Servicer, members of various purchaser groups from time to time party thereto and PNC Bank, National Association, as Administrator | Incorporated herein by reference to Exhibit 10(h)(i) | ||
| Amendment No. 1 to Receivables Purchase Agreement, dated as of May 18, 2001, among Worthington Receivables Corporation, as Seller, Worthington Industries, Inc., as Servicer, members of various purchaser groups from time to time party thereto and PNC Bank, National Association, as Administrator | Incorporated herein by reference to Exhibit 10(h)(ii) | ||
| Amendment No. 2 to Receivables Purchase Agreement, dated as of May 31, 2004, among Worthington Receivables Corporation, as Seller, Worthington Industries, Inc., as Servicer, members of various purchaser groups from time to time party thereto | Incorporated herein by reference to Exhibit 10(g)(x) | ||||
| Amendment No. 3 to Receivables Purchase Agreement, dated as of January 27, 2005, among Worthington Receivables Corporation, as Seller, Worthington Industries, Inc., as Servicer, the members of the various purchaser groups from time to time party thereto and PNC Bank, National Association, as Administrator | Incorporated herein by reference to Exhibit 10.15 to the Registrant’s Annual Report on Form 10-K for the fiscal year ended May 31, 2005 (SEC File No. 1-8399) | ||||
| 10.20 | Amendment No. 4 to Receivables Purchase Agreement, dated as of January 25, 2008, among Worthington Receivables Corporation, as Seller, Worthington Industries, Inc., as Servicer, the members of the various purchaser groups from time to time party thereto and PNC Bank, National Association, as Administrator | Filed | ||
| Purchase and Sale Agreement, dated as of November 30, 2000, between the various originators listed therein and Worthington Receivables Corporation | Incorporated herein by reference to Exhibit 10(h)(iii) | ||
| Amendment No. 1, dated as of May 18, 2001, to Purchase and Sale Agreement, dated as of November 30, 2000, between the various originators listed therein and Worthington Receivables Corporation | Incorporated herein by reference to Exhibit 10(h)(iv) | ||
|
|
| ||
|
|
| ||
| Summary of Cash Compensation for Directors of Worthington Industries, Inc. |
| ||
|
|
| ||
|
| Incorporated herein by reference to Exhibit | ||
| 10.25 | Form of Letter Evidencing Cash Performance Awards Granted under the Worthington Industries, Inc. 1997 Long-Term Incentive Plan* | Incorporated herein by reference to Exhibit 10.21 to the Registrant’s Annual Report on Form 10-K for the fiscal year ended May 31, 2005 (SEC File No. 1-8399) | ||
| 10.26 | Form of Letter Evidencing Cash Performance Awards and Performance Share Awards Granted under the Worthington Industries, Inc. 1997 Long-Term Incentive Plan – Targets for 3-Year Period Ending May 31, 2009* | Incorporated herein by reference to Exhibit 10.1 to the Registrant’s Current Report on Form 8-K dated May 25, 2006 and filed with the SEC on the same date (SEC File No. 1-8399) | ||
| 10.27 | Form of Letter Evidencing Cash Performance Awards Granted under the Worthington Industries, Inc. 1997 Long-Term Incentive Plan – Targets for Six-Month Performance Period Ended May 31, 2008* | Incorporated herein by reference to Exhibit 10.1 to the Registrant’s Current Report on Form 8-K dated November 30, 2007 and filed with the SEC on the same date (SEC File No. 1-8399) | ||
| 10.28 | Form of Letter Evidencing Cash Performance Awards and Performance Share Awards Granted under the Worthington Industries, Inc. 1997 Long-Term Incentive Plan – Targets for 3-Year Period Ending May 31, 2010* | Incorporated herein by reference to Exhibit 10.1 to the Registrant’s Current Report on Form 8-K dated June 27, 2007 and filed with the SEC on the same date (SEC File No. 1-8399) | ||
| 10.29 | Settlement and Release Agreement between Edmund L. Ponko, Jr. (executed on June 19, 2007) and Dietrich Industries, Inc. (executed on June 18, 2007)* | Incorporated herein by reference to Exhibit 10.28 to the Registrant’s Annual Report on Form 10-K for the fiscal year ended May 31, 2007 (SEC File No. 1-8399) | ||
| 10.30 | Summary of Annual Base Salaries of Named Executive Officers of Worthington Industries, Inc., effective as of June 29, 2008* | Filed herewith | ||
| 10.31 | Summary of arrangement with John S. Christie, the Registrant’s President and Chief Financial Officer, who will be taking early retirement effective July 31, 2008* | Incorporated herein by reference to the discussion in “Item 5.02 – Departure of Directors or Certain Officers; Election of Directors; Appointment of Certain Officers; Compensatory Arrangements of Certain Officers” of the Current Report on Form 8-K dated May 5, 2008 and filed with the SEC on the same date (SEC File No. 1-8399) | ||
| 10.32 | Form of Indemnification Agreement entered into on July 25, 2008 between Worthington Industries, Inc. and each director of Worthington Industries, Inc. | Filed herewith | ||
| 10.33 | Form of Indemnification Agreement entered into on July 25, 2008 between Worthington Industries, Inc. and each executive officer of Worthington Industries, Inc. | Filed herewith | ||
| 14 | Worthington Industries, Inc. Code of Conduct | Incorporated herein by reference to Exhibit 14 to the Registrant’s Annual Report on Form 10-K for the fiscal year ended May 31, 2007 (SEC File No. 1-8399) | ||
| 21 | Subsidiaries of Worthington Industries, Inc. | Filed herewith | ||
| Consent of Independent Registered Public Accounting Firm |
| ||
|
| Filed herewith | ||
| 23.2 | Consent of Independent Auditor (KPMG LLP) with respect to consolidated financial statements of Worthington Armstrong Venture | Filed herewith | ||
| 24 | Powers of Attorney of Directors and Executive Officers of Worthington Industries, Inc. | Filed herewith | ||
| 31.1 | Rule 13a - 14(a) / 15d - 14(a) Certification (Principal Executive Officer) | Filed herewith | ||
31.2 | Rule 13a - 14(a) / 15d - 14(a) Certification (Principal Financial Officer) | Filed herewith | ||
32.1 | Section 1350 Certification of Principal Executive Officer | Filed herewith | ||
32.2 | Section 1350 Certification of Principal Financial Officer | Filed herewith | ||
| 99.1 | Worthington Armstrong Venture consolidated financial statements as of December 31, 2007 and 2006 and for the years ended December 31, 2007, 2006 and 2005 | Filed herewith |
| * | Indicates management contract or compensatory plan or |
E-5E-8