UNITED STATES
SECURITIES AND EXCHANGE COMMISSION
Washington, D.C. 20549
FORM 10-K
ANNUAL REPORT
pursuant to Section 13 or 15(d)
of the Securities Exchange Act of 1934
FOR THE FISCAL YEAR ENDED JUNE 30, 20052007
000-15701
(Commission file number)
NATURAL ALTERNATIVES INTERNATIONAL, INC.
(Exact name of registrant as specified in its charter)
| Delaware | 84-1007839 | |
| (State of incorporation) | (IRS Employer Identification No.) | |
1185 Linda Vista Drive San Marcos, California 92078 | (760) 744-7340 | |
| (Address of principal executive offices) | (Registrant’s telephone number) | |
Securities registered pursuant to Section 12(b) of the Act:
None
Title of each class | Name of exchange on which registered | |
Common Stock, $0.01 par value per share | Nasdaq Global Market |
Securities registered pursuant to Section 12(g) of the Act:
None
Common Stock, $0.01 par value per shareIndicate by check mark if Natural Alternatives International, Inc. (NAI) is a well-known seasoned issuer, as defined in Rule 405 of the Securities Act of 1933. ¨ Yes x No
Indicate by check mark if NAI is not required to file reports pursuant to Section 13 or Section 15(d) of the Securities Exchange Act of 1934. ¨ Yes x No
Indicate by check mark whether Natural Alternatives International, Inc. (NAI)NAI (1) has filed all reports required to be filed by Section 13 or 15(d) of the Securities Exchange Act of 1934 during the preceding 12 months (or for such shorter period that NAI was required to file such reports), and (2) has been subject to such filing requirements for the past 90 days. x Yes ¨ No
Indicate by check mark if disclosure of delinquent filers pursuant to Item 405 of Regulation S-K is not contained herein, and will not be contained, to the best of NAI’s knowledge, in definitive proxy or information statements incorporated by reference in Part III of this Form 10-K or any amendment to this Form 10-K. x¨
Indicate by check mark whether NAI is a large accelerated filer, an accelerated filer, (as defined in Rule 12b-2 of the Act).or a non-accelerated filer. (Check one):
Large accelerated filer ¨ YesAccelerated filer ¨ Non-accelerated filer x No
Indicate by check mark whether NAI is a shell company (as defined in Rule 12b-2 of the Exchange Act.): Yes ¨ NoYes x No
The aggregate market value of NAI’s common stock held by non-affiliates of NAI as of the last business day of NAI’s most recently completed second fiscal quarter (December 31, 2004)29, 2006) was approximately $41,243,757$45,238,820 (based on the closing sale price of $9.23$8.67 reported by Nasdaq on December 31, 2004)29, 2006). For this purpose, all of NAI’s officers and directors and their affiliates were assumed to be affiliates of NAI.
As of September 8, 2005, 6,032,367October 15, 2007, 6,977,199 shares of NAI’s common stock were outstanding, net of 61,000180,941 treasury shares.
DOCUMENTS INCORPORATED BY REFERENCE
Part III (Items 10, 11, 12, 13 and 14) of this Form 10-K incorporates by reference portions of NAI’s definitive proxy statement for its Annual Meeting of Stockholders to be held December 2, 2005,11, 2007, to be filed on or before October 28, 2005.2007.
(i)
SPECIAL NOTE ABOUT FORWARD-LOOKING STATEMENTS
Certain statements in this report, including information incorporated by reference, are “forward-looking statements” within the meaning of Section 27A of the Securities Act of 1933, Section 21E of the Securities Exchange Act of 1934, and the Private Securities Litigation Reform Act of 1995. Forward-looking statements reflect current views about future events and financial performance based on certain assumptions. They include opinions, forecasts, intentions, plans, goals, projections, guidance, expectations, beliefs or other statements that are not statements of historical fact. Words such as “may,” “will,” “should,” “could,” “would,” “expects,” “plans,” “believes,” “anticipates,” “intends,” “estimates,” “approximates,” “predicts,” or “projects,” or the negative or other variation of such words, and similar expressions may identify a statement as a forward-looking statement. Any statements that refer to projections of our future financial performance, our anticipated growth and trends in our business, our goals, strategies, focus and plans, and other characterizations of future events or circumstances, including statements expressing general optimism about future operating results, are forward-looking statements. Forward-looking statements in this report may include statements about:
future financial and operating results, including projections of net sales, revenue, income, net income per share, profit margins, expenditures, liquidity, goodwill valuation and other financial items;
development of new products, brands and marketing strategies;
• | the effect of the discontinuance of Dr. Cherry’s television program and our ability to develop a new marketing plan for, and to sustain, our Pathway to Healing® product line; |
distribution channels, product sales and performance and timing of product shipments;
• | our ability to expand the customer base of the As We Change® catalog and achieve higher sales, profitability and cash flows as a result; |
inventories and the impactadequacy and intended use of accounting pronouncements;our facilities;
current or future customer orders;
the impact on our business and results of operations and variations in quarterly net sales from seasonal and other factors;
management’s goals and plans for future operations; and
our ability to improve operational efficiencies, manage costs and business risks and improve or maintain profitability;
growth, expansion, diversification and acquisition strategies, the success of such strategies, and the benefits we believe can be derived from such strategies;
personnel;
the outcome of regulatory, tax and litigation matters;
sources and availability of raw materials;
operations outside the United States;
the adequacy of reserves and allowances;
overall industry and market performance;
competition;
current and future economic and political conditions;
the impact of accounting pronouncements; and
other assumptions described in this report underlying or relating to any forward-looking statements.
The forward-looking statements in this report speak only as of the date of this report and caution should be taken not to place undue reliance on any such forward-looking statements. Forward-looking statements are subject to certain events, risks, and uncertainties that may be outside of our control. When considering forward-looking statements, you should carefully review the risks, uncertainties and other cautionary statements in this report as they identify certain important factors that could cause actual results to differ materially from those expressed in or implied by the forward-looking statements. These factors include, among others, the risks described under Item 71A of Part I and elsewhere in this report, as well as in other reports and documents we file with the SEC.United States Securities and Exchange Commission (SEC).
| ITEM 1. | BUSINESS |
Overview
Our vision is to enrich the world through the best of nutrition.
As our primary business activity, we provide private label contract manufacturing services to companies that market and distribute vitamins, minerals, herbs, and other nutritional supplements, as well as other health care products, to consumers both within and outside the United States. Additionally, under our direct-to-consumer marketing program, we develop, manufacture and market our own products, as well as market third party branded products, including a variety of high quality nutritional, beauty, skin care, exercise, lifestyle and work with nationally recognized physicians to develop brand nameother personal care products, that reflect their individual approaches to restoring, maintaining or improving health.
through our wholly owned subsidiary, Real Health Laboratories, Inc. (RHL), an integrated direct marketer of branded nutritional supplements and other lifestyle products. RHL’s operations include in-house creative, catalog design, supply chain management and call center and fulfillment activities.
Our U.S.-based manufacturing facilities are located in Vista, California. These facilities were recertified in June 2005 by the Therapeutic Goods Administration (“TGA”)(TGA) of Australia after theirits audit of our Good Manufacturing Practices (“GMP”)(GMP). TGA evaluates new therapeutic products, prepares standards, develops testing methods and conducts testing programs to ensure that products are high in quality, safe and effective. The TGA also conducts a range of assessment and monitoring activities including audits of the manufacturing practices of companies who export and sell products to Australia. TGA certification enables us to manufacture products for export into countries that have signed the Pharmaceutical Inspection Convention, which include most European countries as well as several Pacific Rim countries. TGA certifications are generally reviewed every eighteen months.
months and our existing TGA certification is currently under review.
Our California facilities also have been awarded GMP registration annually by NSF International (NSF) through the NSF Dietary Supplements Certification Program since October 2002.
GMP requirements are regulatory standards and guidelines establishing necessary processes, procedures and documentation for manufacturers in an effort to assure the products produced by that manufacturer have the identity, strength, composition, quality and purity they are represented to possess.
Natural Alternatives International Europe S.A. (NAIE), our wholly owned subsidiary existing under the laws of Switzerland, also operates a manufacturing, warehousing, packaging and distribution facility in Manno, Switzerland. In January 2004, NAIE obtained a pharmaceutical license to process pharmaceuticals for packaging, importation, export and sale within Switzerland and other countries from the Swissmedic Authority of Bern, Switzerland. In March 2007, following the expansion of NAIE’s manufacturing facilities to include powder filling capabilities, NAIE obtained an additional pharmaceutical license from the Swissmedic Authority certifying NAIE’s expanded facilities conform to GMP. We believe the licensethese licenses and NAIE’s new capabilities help strengthen our relationships with existing customers and can help improve our ability to develop relationships with new customers. The license islicenses are valid until January 2009.
In addition to our operations in the United States and Switzerland, we have a full-time representative in Japan who provides a range of services to our customers currently present in or seeking to expand into the Japanese market and other markets in the Pacific Rim. These services include regulatory and marketing assistance along with guidance and support in adapting products to these markets.
Originally founded in 1980, Natural Alternatives International, Inc. reorganized as a Delaware corporation in 1989. Unless the context requires otherwise, all references in this report to the “Company,” “NAI,” “we,” “our,” and “us” refer to Natural Alternatives International, Inc. and, as applicable, NAIE, RHL and our other wholly owned subsidiaries. Our principal executive offices are located at 1185 Linda Vista Drive, San Marcos, California, 92078.
Business Strategy
Our goals are to increaseachieve long-term growth and diversify our net sales while improving our overall financial results.sales. To achieveaccomplish these goals, we have sought and intend to continue to seek to:
leverage our state of the strengthart facilities to increase the value of the goods and services we provide to our existing customer relationships through new product introductions;
invest in expanding and marketing our own branded products, including those acquired through our acquisition opportunities;of RHL; and
improve operational efficiencies and manage costs.costs and business risks to improve profitability.
Overall, we believe there is an opportunity to enhance consumer confidence in the quality of our nutritional supplements and their adherence to label claims through the education provided by direct sales and direct-to-consumer marketing programs. We believe our GMP and TGA certified manufacturing operations, science based product formulation,formulations, peer-reviewed clinical studies and regulatory expertise provide us with a sustainable competitive advantage by providing our customers with a high degree of confidence in our products.the products we manufacture.
WeWhile today’s consumer may have access to a variety of information, we believe the lack of relevant and reliable consumer educationmany consumers remain uneducated about nutrition and nutritional supplementation, combined withuncertain about the duplicationrelevance or reliability of brands and products in the retail sales channel createinformation they have or are confused about conflicting claims or information, which we believe creates a significant opportunity for the direct sales marketing channel. The direct sales marketing channel has proved, and we believe will continue to prove, to be a highly effective method for marketing high quality nutritional supplements as associates or other personalities educate consumers on the benefits of science based nutritional supplements. We believe this education process can lead to premium product pricing and avoid competing with brands of inferior quality and lower pricing in other distribution channels. Our two largest customers operate in the direct sales marketing channel. Thus, our growth has been fueled primarily by the effectiveness of our customers in this marketing channel.
Further, we believe our acquisition of RHL in December 2005 has strengthened our ability to achieve certain of our goals. Through RHL, we are able to market our own branded products and have expanded our distribution channels. Our acquisition of RHL also has provided the following benefits:
Additional expertise in direct marketing and retail channels;
Existing, leading branded products in the Food, Drug and Mass Market (FDM) retail channel; and
Access to additional direct marketing and mass-market channels for our products and concepts.
We believe our comprehensive approach to customer service is unique within our industry. We believe this approach, together with our commitment to high quality, innovative products and the leadership ofinvestment in our experienced management team,branded products, will provide the means to implement our strategies and achieve our goals. There can be no assurance, however, that we will successfully implement any of our business strategies or that we will increase or diversify our net sales or improve our overall financial results.
Products, Principal Markets and Methods of Distribution
Our primary business activity is to provide private label contract manufacturing services to companies that market and distribute vitamins, minerals, herbs, and other nutritional supplements, as well as other health care products, to consumers both within and outside the United States. Our private label contract manufacturing customers include companies that market nutritional supplements through direct sales marketing channels, direct response television and retail stores. We manufacture products in a variety of forms, including capsules, tablets, chewable wafers and powders to accommodate a variety of consumer preferences.
We provide strategic partnering services to our private label contract manufacturing customers, including the following:
customized product formulation;
clinical studies;
manufacturing;
marketing support;
international regulatory and label law compliance;
international product registration; and
packaging in multiple formats and labeling design.
Additionally, under our direct-to-consumer marketing program,branded products segment, we develop, manufacture and market our own products. Under the direct-to-consumer marketing program, weproducts and work with nationally recognized physicians and others to develop brand name products that reflect their individual approaches to restoring, maintaining or improving health. Direct-to-consumer marketing programThese products are sold through a variety of distribution channels including television, programs, print media and the internet.
We believealso market the direct-to-consumer marketing program can be an effective method for marketing ourReal Health® Laboratories branded nutritional supplement product line, as well as third party products, through the As We Change® (AWC) catalog and certain other distribution channels. The Real Health® Laboratories nutritional supplement product line consists of ten condition-specific, custom formulated products and is marketed through mass retail, with distribution to FDM retailers. The AWC catalog is a lifestyle catalog geared towards women between the ages of 45 and 65. The quarterly print catalog offers a variety of high quality nutritional, supplements. In March 2000, we launched Dr. Cherry’s Pathway to Healingbeauty, skin care, exercise, lifestyle and other personal care products.TM product line. As of June 30, 2005, the product line included nineteen condition specific, custom formulated products. The products are primarily marketed through a weekly television program.
For the last three fiscal years ended June 30, our net sales were derived from our private label contract manufacturing and direct-to-consumer marketing program were as followsthe following (dollars in thousands):
| Fiscal 2005 | Fiscal 2004 | Fiscal 2003 | |||||||
Private Label Contract Manufacturing | $ | 83,382 | $ | 68,493 | $ | 45,768 | |||
Direct-to-Consumer Marketing Program | 8,110 | 10,041 | 10,194 | ||||||
Total Net Sales | $ | 91,492 | $ | 78,534 | $ | 55,962 | |||
| 2007 | 2006 | 2005 | |||||||||||||
| $ | % | $ | % | $ | % | ||||||||||
Private Label Contract Manufacturing | $ | 80,732 | 83 | $ | 85,758 | 86 | $ | 83,862 | 91 | ||||||
Branded Products | 16,396 | 17 | 13,854 | 14 | 8,110 | 9 | |||||||||
Total Net Sales | $ | 97,128 | 100 | $ | 99,612 | 100 | $ | 91,972 | 100 | ||||||
Research and Development
We are committed to quality research and development. We focus on the development of new science based products and the improvement of existing products. We periodically test and validate our products to help ensure their stability, potency, efficacy and safety. We maintain quality control procedures to verify that our products comply with applicable specifications and standards established by the Food and Drug Administration and other regulatory agencies. We also direct and participate in clinical research studies, often in collaboration with scientists and research institutions, to validate the benefits of a product and provide scientific support for product claims and marketing initiatives. We believe our commitment to research and development, team of experienced personnel, as well as our facilities and strategic alliances with our suppliers and customers, allow us to effectively identify, develop and market high-quality and innovative products.
As part of the services we provide to our private label contract manufacturing customers, we may perform, but are not required to perform, certain research and development activities related to the development or improvement of their products. While our customers typically do not pay directly for this service, the cost of this service is included as a component of the price we charge to manufacture and deliver their products. Research and development costs, which include costs associated with international regulatory compliance services we provide to our customers, are expensed as incurred.
Our research and development expenses for the last three fiscal years ended June 30 were $1.9 million for 2007, $1.7 million for 2006 and $3.5 million for 2005, $2.8 million for 2004 and $1.7 million for 2003.2005.
Sources and Availability of Raw Materials
We use raw materials in our operations including powders, excipients, empty capsules, and components for packaging and distributing our finished products. We typically buy raw materials in bulk from a limited number of qualified vendors located both within and outside the United States. During fiscal 2005, Carrington Laboratories Incorporated was our largest supplier, accounting for 35% of our total raw material purchases.
We test the raw materials we buy to ensure their quality, purity and potency before we use them in our products. We typically buy raw materials in bulk from qualified vendors located both within and outside the United States. During the fiscal year ended June 30, 2005, we2007, our three largest suppliers accounted for 39% of our total raw material purchases. We did not experience any significant shortages or difficulties obtaining adequate supplies of raw materials during fiscal 2007 and we do not anticipate any significant shortages or difficulties in the near term.
Major Customers
NSA International, Inc. has been our largest customer over the past several years. During the fiscal year ended June 30, 2005,2007, NSA International, Inc. accounted for approximately 40% of our net sales. Our second largest customer was Mannatech, Incorporated, which accounted for approximately 39%31% of our net sales during fiscal 2005.2007. Both NSA International, Inc. and Mannatech, Incorporatedof these customers are private label contract manufacturing customers. No other customer accounted for 10% or more of our net sales during fiscal 2005. Our sales and marketing team is focused2007. We continue to focus on obtaining new private label contract manufacturing customers and developing new direct-to-consumer marketing programsgrowing our branded products, including those acquired through the acquisition of RHL, to reduce the risks associated with deriving a significant portion of our net sales from a limited number of customers.
Competition
We compete with other manufacturers, distributors and distributorsmarketers of vitamins, minerals, herbs, and other nutritional supplements, beauty, skin care, exercise, lifestyle and other personal care products, both within and outside the United States. The nutritional supplement industry isand lifestyle product industries are highly fragmented and competition for the sale of nutritional supplements and lifestyle products comes from many sources. These products are sold primarily through retailers (drug store chains, supermarkets, and mass market discount retailers), health and natural food stores, and direct sales channels (mail order, network marketing and e-marketing companies). The products we produce for our private label contract manufacturing customers may compete with our direct-to-consumerown branded products, although we believe such competition is limited.
We believe private label contract manufacturing competition in our industry is based on, among other things, customized services offered, product quality and safety, innovation, price and customer service. We believe we compete favorably with other companies because of our ability to provide comprehensive turn key solutions for customers, our certified manufacturing operations and our commitment to quality and safety through our research and development activities.
Our future competitive position in the industryfor both private label contract manufacturing and branded products will likely depend on, but not be limited to, the following:
the continued acceptance of our products by our customers and consumers;
our ability to continue to develop high quality, innovative products;
our ability to attract and retain qualified personnel;
the effect of any future governmental regulations on our products and business;
the results of, and publicity from, product safety and performance studies performed by governments and other research institutions;
the continued growth of the global nutrition industry; and
our ability to respond to changes within the industry and consumer demand, financially and otherwise.
The nutritional supplement industry isand lifestyle product industries are highly competitive and we expect the level of competition to remain high over the near term. We do not believe it is possible to accurately estimate the number or size of our competitors. The nutritional supplement industry has undergone consolidation in the recent past and we expect that trend to continue in the near term.
Government Regulation
Our business is subject to varying degrees of regulation by a number of government authorities in the United States, including the United States Food and Drug Administration (FDA), the Federal Trade Commission (FTC), the Consumer Product Safety Commission, the United States Department of Agriculture, and the Environmental
Protection Agency. Various agencies of the states and localities in which we operate and in which our products are sold also regulate our business, such as the California Department of Health Services, Food and Drug Branch. The areas of our business that these and other authorities regulate include, among others:
product claims and advertising;
product labels;
product labels;ingredients; and
The FDA, in particular, regulates the formulation, manufacturing, packaging, storage, labeling, promotion, distribution and sale of vitamin and other nutritional supplements in the United States, while the FTC regulates marketing and advertising claims. TheIn August 2007, a new rule issued by the FDA issued a final rule called “Statements Made for Dietary Supplements Concerning the Effectwent into effect requiring companies that manufacture, package, label, distribute or hold nutritional supplements to meet certain GMPs to ensure such products are of the Productquality specified and are properly packaged and labeled. Companies have up to three years to comply with the new requirements depending on the Structure or Functionsize of the Body,” which includes regulations requiring companies, their suppliers and manufacturerscompany. In our case, given the current number of our employees, we would be required to meet GMP incomply with the preparation, packaging, storage and shipment of their products. The FDA also published a Notice of Advance Rule Making for Good Manufacturing Practices that would require manufacturing of dietary supplements to follow GMP. While the final regulations are subject to revision, wenew requirements by June 25, 2009. We are committed to meeting or exceeding the standards set by the FDA on a timely basis and believe we are well positioned to operate within the new GMPs mandated by the FDA.
The FDA has also issued regulations governingregulates the labeling and marketing of dietary supplements and nutritional products. They include:products, including:
the identification of dietary supplements or nutritional products and their nutrition and ingredient labeling;
requirements related to the wording used for claims about nutrients, health claims, and statements of nutritional support;
labeling requirements for dietary supplements or nutritional products for which “high potency” and “antioxidant” claims are made;
notification procedures for statements on dietary supplements or nutritional products; and
premarket notification procedures for new dietary ingredients in nutritional supplements.
The Dietary Supplement Health and Education Act of 1994 (DSHEA) revised the provisions of the Federal Food, Drug and Cosmetic Act concerning the composition and labeling of dietary supplements and defined dietary supplements to include vitamins, minerals, herbs, amino acids and other dietary substances used to supplement diets. DSHEA generally provides a regulatory framework to help ensure safe, quality dietary supplements and the dissemination of accurate information about such products. The FDA is generally prohibited from regulating active ingredients in dietary supplements as drugs unless product claims, such as claims that a product may heal, mitigate, cure or prevent an illness, disease or malady, trigger drug status.
In December 2006, the Dietary Supplement and Nonprescription Drug Consumer Protection Act was passed, which further revised the provisions of the Federal Food, Drug and Cosmetic Act. Under the new act, manufacturers, packers or distributors whose name appears on the product label of a dietary supplement or nonprescription drug are required to include contact information on the product label for consumers to use in reporting adverse events associated with the product’s use and to notify the FDA of any serious adverse event report within 15 business days of receiving such report. Events reported to the FDA would not be considered an admission from a company that its product caused or contributed to the reported event. The new act becomes effective in December 2007. The FDA is in the process of developing industry guidance on how to comply with this new law. We are committed to meeting or exceeding the provisions of this act on a timely basis.
We are also subject to a variety of other regulations in the United States, including those relating to bioterrorism, taxes, labor and employment, import and export, the environment and intellectual property.
Our operations outside the United States are similarly regulated by various agencies and entities in the countries in which we operate and in which our products are sold. The regulations of these countries may conflict with those in the United States and may vary from country to country. The sale of our products in certain European countries is subject to the rules and regulations of the European Union, which may be interpreted differently among the countries within the European Union. In markets outside the United States, we may be required to obtain approvals, licenses or certifications from a country’s ministry of health or comparable agency before we begin operations or the marketing of products in that country. Approvals or licenses may be conditioned on reformulation of our products for a particular market or may be unavailable for certain products or product ingredients. These regulations may limit our ability to enter certain markets outside the United States.
Intellectual Property
Trademarks. We have developed and use registered trademarks in our business, particularly relating to corporate, brand and product names. We own 2128 trademark registrations in the United States and have sixfive trademark applications pending with the United States Patent and Trademark Office. Federal registration of a trademark enables the registered owner of the mark to bar the unauthorized use of the registered mark in connection with a similar productproducts in the same channels of trade by any third party anywhere in the United States, regardless of whether the registered owner has ever used the trademark in the area where the unauthorized use occurs.
We have filed applications and own trademark registrations and intend to register additional trademarks in foreign countries where our products are or may be sold in the future. We have one trademark application filedregistered with the Japan TrademarkPatent Office.
We also claim ownership and protection of certain product names, unregistered trademarks and service marks under common law. Common law trademark rights do not provide the same level of protection afforded by registration of a trademark. In addition, common law trademark rights are limited to the geographic area in which the trademark is actually used. We believe these trademarks, whether registered or claimed under common law, constitute valuable assets, adding to our recognition and the marketing of our products and that these proprietary rights have been and will continue to be important in enabling us to compete.
Trade Secrets. We own certain intellectual property, including trade secrets that we seek to protect, in part, through confidentiality agreements with employees and other parties. Although we regard our proprietary technology, trade secrets, trademarks and similar intellectual property as critical to our success, we rely on a combination of trade secrets, contract, patent, copyright and trademark law to establish and protect ourthe rights in our products and technology. In addition, the laws of certain foreign countries may not protect our intellectual property rights to the same extent as the laws of the United States.
Patents and Patent Licenses. We own certain United States patents. In addition, we have licensedan exclusive worldwide rightslicense to four certain United States patents, and each patent’s corresponding foreign patent application, and are currently involved in research and development of products employing the licensed inventions. These patents relate to the ingredient formerly known as “Oxford Factor”.Factor.” We are currently selling this ingredient to a customer for use in a limited market under the name of Beta-AlanineTM. We also have a nonexclusive worldwide license to five certain United States patents and are currently involved in research and development of products employing the licensed inventions.
Backlogs
Our backlog, comprised primarily of private label contract manufacturing orders, was approximately $16.0$15.1 million at September 3, 2007, and $24.3 million at September 2, 2005 and $15.8 million at September 2, 2004.2006. Our private label contract manufacturing sales are made primarily pursuant to standard purchase orders for the delivery of products. Quantities of our private label contract manufacturing products to be delivered and delivery schedules are frequently revised to reflect changes in our customers’ needs. Customer orders generally can be cancelled or rescheduled without significant penalty to the customer. For these reasons, our backlog as of any particular date is not representative of actual sales for any succeeding period, and therefore, we believe that backlog is not necessarily a good indicator of future revenue.
Working Capital Practices
We manufacture products based on anticipated demand or following receipt of customer specific purchase orders and as a result our inventory primarily consists of raw materials and work in process. Our raw material purchases are made primarily pursuant to standard purchase orders for the delivery of raw materials based upon anticipated demand. Customer specific delivery requirements, combined withcustomer cancellation or rescheduling of orders and raw material lead times impact the amount of inventory on hand at any given time. We typically purchase raw materials on 30-day payment terms. Discounts are taken periodically for early payment.
Third party branded products inventory offered in our As We Change® catalog is purchased in advance of catalog mailings to ensure products are available when the catalogs are mailed.
Sales
Private label contract manufacturing sales are typically made based upon 30-day terms. A 2% discount is provided to customers that pay within 10 days of invoice date.
RHL warrants its products for full satisfaction, generally from 30 to 120 days. Our policy requires us to replace the product or refund the purchase price to the customer.
Employees
As of June 30, 2005,2007, we employed 208240 full-time employees in the United States, sixfive of whom held executive management positions. Of the remaining full-time employees, 3244 were employed in research, laboratory and quality control, 1134 in sales and marketing, and 159157 in manufacturing and administration. From time to time we use temporary personnel to help us meet short-term operating requirements. These positions typically are in manufacturing and manufacturing support. As of June 30, 2005,2007, we had 5071 temporary personnel.
As of June 30, 2005,2007, NAIE employed an additional 25 full-time employees. Most of these positions are in the areas of manufacturing and manufacturing support.
Our employees are not represented by a collective bargaining agreement and we have not experienced any work stoppages as a result of labor disputes. We believe our relationship with our employees is good.
Seasonality
WeAlthough we believe there is no material impact on our business or results of operations from seasonal factors.
factors, we have experienced and expect to continue to experience variations in quarterly net sales due to the timing of private label contract manufacturing orders and variations in product offerings included in our As We Change® catalog.
Financial Information about Our Business SegmentSegments and Geographic Areas
Following our acquisition of RHL on December 5, 2005 through June 30, 2006, our business consisted of two segments identified as NAI, which primarily provides private label contract manufacturing services to companies that market and distribute nutritional supplements and other health care products, and RHL, which markets and distributes branded nutritional supplements and other lifestyle products.
Effective July 1, 2006, we changed our reporting segments to reflect the structure of our organization after the integration of previously outsourced fulfillment and call center activities for our Dr. Cherry Pathway to Healing®product line into RHL’s existing operations. The new reportable segments are as follows:
Private label contract manufacturing, in which we primarily provide manufacturing services to companies that market and distribute nutritional supplements and other health care products; and
Branded products, in which we market and distribute branded nutritional supplements and other lifestyle products in the following distribution channels:
• | Direct-to-consumer marketing programs, under which we develop, manufacture and market our own products and work with nationally recognized physicians and others to develop brand name products that reflect their individual approaches to restoring, maintaining or improving health. These products are sold through a variety of distribution channels, including television programs, print media and the internet. The Dr. Cherry Pathway to Healing®product line is sold under a direct-to-consumer marketing program; |
• | Food, Drug and Mass Market (FDM) retail channel in which we sell the Real Health® Laboratories nutritional supplement product line; and |
• | As We Change® (AWC) catalog, a lifestyle catalog geared towards women between the ages of 45 and 65, in which we sell our own branded products as well as third party products. The quarterly print catalog offers a variety of high quality nutritional, beauty, skin care, exercise, lifestyle and other personal care products. |
Our business consists of one industry segment, the development,private label contract manufacturing marketing and distribution of nutritional supplements. Our products are sold both withinin the United States and in markets outside the United States, including Europe, Australia and Japan. OurThe primary market outside the United States is Europe.
For the last three fiscal years, net sales by geographic region were as follows (dollars in thousands):
| Fiscal 2005 | Fiscal 2004 | Fiscal 2003 | |||||||
Net Sales | |||||||||
United States | $ | 67,784 | $ | 56,350 | $ | 41,838 | |||
Markets Outside the United States | 23,708 | 22,184 | 14,124 | ||||||
Total Net Sales | $ | 91,492 | $ | 78,534 | $ | 55,962 | |||
The allocation of net sales between the United States and markets outside the United States is based on the location of the customers. Products manufactured by NAIE accounted for 46% of net sales in markets outside the United States in fiscal 2005, 42% in fiscal 2004 and 51% in fiscal 2003. No Our branded products manufactured by NAIE wereare only sold in the United States during the last three fiscal years.States.
For additional financial information, including financial information about our business segment and geographic areas, please see the consolidated financial statements and accompanying notes to the consolidated financial statements included under Item 8 of this report.
As we continue to expand intoOur activities in markets outside the United States we will become increasinglyare subject to political, economic and other risks in the countries in which theour products are sold and in which we operate. For more information about these and other risks, please see Items 1A, 7 and 7A in this report.
| ITEM 1A. | RISK FACTORS |
You should carefully consider the risks described below, as well as the other information in this report, when evaluating our business and future prospects. If any of the following risks actually occur, our business, financial condition and results of operations could be seriously harmed. In that event, the market price of our common stock could decline and you could lose all or a portion of the value of your investment in our common stock.
Because we derive a significant portion of our revenues from a limited number of customers, our revenues would be adversely affected by the loss of a major customer or a significant change in its business, personnel or the timing or amount of its orders.
We have in the past and expect to continue to derive a significant portion of our revenues from a relatively limited number of customers. During the fiscal year ended June 30, 2007, sales to one customer, NSA International, Inc., were approximately 40% of our total net sales. Our second largest customer was Mannatech, Incorporated, which accounted for approximately 31% of our net sales during fiscal 2007. The loss of one of these customers or other major customers, a significant decrease in sales or the growth rate of sales to these customers, or a significant change in their business or personnel, would materially affect our financial condition and results of operations. Furthermore, the timing of our customers’ orders is impacted by their marketing programs, supply chain management, entry into new markets and new product introductions, all of which are outside of our control. All of these attributes have had and will have a significant impact on our business. Based on press releases issued by Mannatech, Incorporated, Mannatech achieved record sales in each of its fiscal years ended December 31, 2006, 2005 and 2004. While Mannatech similarly reported record sales for its second quarter ended June 30, 2007, based on disclosures in its quarterly report on Form 10-Q for such quarter filed with the SEC, it’s outlook for the remainder of 2007 is uncertain due to certain negative publicity and heightened litigation and regulatory activities that have affected or may affect recruiting efforts and sales in the near term. Thus, there can be no assurance that its prior sales levels will continue.
Our future growth and stability depends, in part, on our ability to diversify our sales. Our efforts to establish new products, brands, markets and customers could require significant initial investments, which may or may not result in higher sales and improved financial results.
Our business strategy depends in large part on our ability to develop new products, marketing strategies, brands and customer relationships. These activities often require a significant up-front investment including, among others, customized formulations, regulatory compliance, product registrations, package design, product testing, pilot production runs, marketing, brand development and the build up of initial inventory. We may experience significant delays from the time we increase our operating expenses and make investments in inventory until the time we generate net sales from new products or customers, and it is possible that we may never generate any revenue from new products or customers after incurring such expenditures. If we incur significant expenses and investments in inventory that we are not able to recover, and we are not able to compensate for those expenses, our operating results could be adversely affected.
On December 5, 2005, we acquired RHL and may, in the future, pursue acquisitions of other companies that, if not successful, could adversely affect our business, financial condition and results of operations.
On December 5, 2005, we completed our acquisition of RHL, an integrated direct marketer of nutritional supplements and other lifestyle products. RHL’s business is subject to all of the operational risks that normally arise for a direct marketing company, including those related to competition, profitability, economic conditions, suppliers, customers, adverse publicity, product liability claims and other litigation, regulation, personnel, and intellectual property rights.
In the future, we may pursue additional acquisitions of other companies as part of our strategy focused on long-term growth and diversification of sales and our customer base. Acquisitions, including the RHL acquisition, involve numerous risks, including:
potential difficulties related to integrating the products, personnel and operations of the acquired company;
failure to operate as a combined organization utilizing common information and communication systems, operating procedures, financial controls and human resources practices;
diverting management’s attention from the normal daily operations of the business;
entering markets in which we have no or limited prior direct experience and where competitors in such markets have stronger market positions;
potential loss of key employees of the acquired company;
potential inability to achieve cost savings and other potential benefits expected from the acquisition;
an uncertain sales and earnings stream from the acquired company; and
| ��� | potential impairment charges, which may be significant, against goodwill and purchased intangible assets acquired in the acquisition due to changes in conditions and circumstances that occur after the acquisition, many of which may be outside of our control. |
There can be no assurance that our acquisition of RHL or other acquisitions that we may pursue will be successful. If we pursue an acquisition but are not successful in completing it, or if we complete an acquisition but are not successful in integrating the acquired company’s employees, products or operations successfully, our business, financial position or results of operations could be adversely affected.
We are required to assess the value of goodwill annually for potential impairment, which requires, among others, significant management judgment to forecast future operating results used in the determination. In the fourth quarter of fiscal 2007, we recorded a $7.0 million non-cash, goodwill impairment charge and may, in the future, be required to recognize additional impairment charges, which could be significant, against goodwill and purchased intangible assets due to changes in conditions and circumstances, many of which may be outside of our control.
Following the acquisition of RHL on December 5, 2005, we recorded approximately $7.5 million of goodwill. In the fourth quarter of fiscal 2007, we recorded a $7.0 million non-cash, goodwill impairment charge as a result of our annual testing of goodwill. There can be no assurance that an additional non-cash impairment charge will not be required. Any such additional charge could have a negative effect on our results of operations but would not impact our cash flows or cash position.
Our operating results will vary and there is no guarantee that we will earn a profit. Fluctuations in our operating results may adversely affect the share price of our common stock.
While our net sales and income from operations have been relatively positive during the past three fiscal years, when compared to prior periods, there can be no assurance that our net sales will improve in the near term, or that we will earn a profit in any given year. We have experienced losses in the past and may incur losses in the future. Our operating results will fluctuate from year to year and/or from quarter to quarter due to various factors including differences related to the timing of revenues and expenses for financial reporting purposes and other factors described in this report. At times, these fluctuations may be significant. Fluctuations in our operating results may adversely affect the share price of our common stock.
A significant or prolonged economic downturn could have a material adverse effect on our results of operations.
Our results of operations are affected by the level of business activity of our customers, which in turn is affected by the level of consumer demand for their products. A significant or prolonged economic downturn may adversely affect the disposable income of many consumers and may lower demand for the products we produce for our private label contract manufacturing customers, as well as our branded products. A decline in consumer demand and the level of business activity of our customers due to economic conditions could have a material adverse effect on our revenues and profit margins.
Because our direct-to-consumer sales rely on the marketability of key personalities, the inability of a key personality to perform his or her role or the existence of negative publicity surrounding a key personality may adversely affect our revenues.
For the fiscal year ended June 30, 2007, our direct-to-consumer products accounted for approximately 7% of our net sales. These products may be marketed with a key personality through a variety of distribution channels. The inability or failure of a key personality to fulfill his or her role, or the ineffectiveness of a key personality as a spokesperson for a product, a reduction in the exposure of a key personality due to the discontinuance of a marketing program or otherwise or negative publicity about a key personality may adversely affect the sales of our product associated with that personality and could affect the sale of other products. A decline in sales would negatively affect our results of operations and financial condition.
Our industry is highly competitive and we may be unable to compete effectively. Increased competition could adversely affect our financial condition.
The market for our products is highly competitive. Many of our competitors are substantially larger and have greater financial resources and broader name recognition than we do. Our larger competitors may be able to devote greater resources to research and development, marketing and other activities that could provide them with a competitive advantage. Our market has relatively low entry barriers and is highly sensitive to the introduction of new products that may rapidly capture a significant market share. Increased competition could result in price reductions, reduced gross profit margins or loss of market share, any of which could have a material adverse effect on our financial condition and results of operations. There can be no assurance that we will be able to compete in this intensely competitive environment.
We may not be able to raise additional capital or obtain additional financing if needed.
Our cash from operations may not be sufficient to meet our working capital needs and/or to implement our business strategies. Although we amended our credit facility to increase our working capital line of credit to $12.0 million, there can be no assurance that this line of credit will be sufficient to meet our needs. Furthermore, if we fail to maintain certain loan covenants we may no longer have access to the credit line. The credit line terminates in November 2008. As a result, we may need to raise additional capital or obtain additional financing.
At any given time it may be difficult for companies to raise capital due to a variety of factors, some of which may be outside a company’s control, including a tightening of credit markets, overall poor performance of stock markets, and/or an economic slowdown in the United States or other countries. Thus, there is no assurance we would be able to raise additional capital if needed. To the extent we do raise additional capital, the ownership position of existing stockholders could be diluted. Similarly, there can be no assurance that additional financing will be available if needed or that it will be available on favorable terms. Under the terms of our credit facility, there are limits on our ability to create, incur or assume additional indebtedness without the approval of our lender.
Our inability to raise additional capital or to obtain additional financing if needed would negatively affect our ability to implement our business strategies and meet our goals. This, in turn, would adversely affect our financial condition and results of operations.
The failure of our suppliers to supply quality materials in sufficient quantities, at a favorable price, and in a timely fashion could adversely affect the results of our operations.
We buy our raw materials from a limited number of suppliers. During fiscal 2007, approximately 39% of our total raw material purchases were from three suppliers. The loss of any of our major suppliers or of a supplier that provides any hard to obtain materials could adversely affect our business operations. Although we believe that we could establish alternate sources for most of our raw materials, any delay in locating and establishing relationships with other sources could result in product shortages, with a resulting loss of sales and customers. In certain situations we may be required to alter our products or to substitute different materials from alternative sources.
We rely solely on one supplier to process certain raw materials that we use in the product line of our largest customer. The loss of or unexpected interruption in this service would materially adversely affect our results of operations and financial condition.
A shortage of raw materials or an unexpected interruption of supply could also result in higher prices for those materials. Although we may be able to raise our prices in response to significant increases in the cost of raw materials, we may not be able to raise prices sufficiently or quickly enough to offset the negative effects of the cost increases on our results of operations.
There can be no assurance that suppliers will provide the quality raw materials needed by us in the quantities requested or at a price we are willing to pay. Because we do not control the actual production of these raw materials, we are also subject to delays caused by interruption in production of materials based on conditions outside of our control, including weather, transportation interruptions, strikes and natural disasters or other catastrophic events.
Our business is subject to the effects of adverse publicity, which could negatively affect our sales and revenues.
Our business can be affected by adverse publicity or negative public perception about our industry, our competitors, or our business generally. This adverse publicity may include publicity about the nutritional supplements industry generally, the efficacy, safety and quality of nutritional supplements and other health care products or ingredients in general or our products or ingredients specifically, and regulatory investigations, regardless of whether these investigations involve us or the business practices or products of our competitors. There can be no assurance that we will be able to avoid any adverse publicity or negative public perception in the future. Any adverse publicity or negative public perception will likely have a material adverse effect on our business, financial condition and results of operations. Our business, financial condition and results of operations also could be adversely affected if any of our products or any similar products distributed by other companies are alleged to be or are proved to be harmful to consumers or to have unanticipated health consequences.
We could be exposed to product liability claims or other litigation, which may be costly and could materially adversely affect our operations.
We could face financial liability due to product liability claims if the use of our products results in significant loss or injury. Additionally, the manufacture and sale of our products involves the risk of injury to consumers from tampering by unauthorized third parties or product contamination. We could be exposed to future product liability claims that, among others: our products contain contaminants; we provide consumers with inadequate instructions about product use; or we provide inadequate warning about side effects or interactions of our products with other substances.
We maintain product liability insurance coverage, including primary product liability and excess liability coverage. The cost of this coverage has increased dramatically in recent years, while the availability of adequate insurance coverage has decreased. While we currently expect to be able to continue our product liability insurance, there can be no assurance that we will in fact be able to continue such insurance coverage, that our insurance will be adequate to cover any liability we may incur, or that our insurance will continue to be available at an economically reasonable cost.
Additionally, it is possible that one or more of our insurers could exclude from our coverage certain ingredients used in our products. In such event, we may have to stop using those ingredients or rely on indemnification or similar arrangements with our customers who wish to continue to include those ingredients in their products. A substantial increase in our product liability risk or the loss of customers or product lines could have a material adverse effect on our results of operations and financial condition.
If we or our private label contract manufacturing customers expand into additional markets outside the United States or our or their sales in markets outside the United States increase, our business would become increasingly subject to political, economic, regulatory and other risks in those markets, which could adversely affect our business.
Our future growth may depend, in part, on our ability and the ability of our private label contract manufacturing customers to expand into additional markets outside the United States or to improve sales in markets outside the United States. There can be no assurance that we or our customers will be able to expand in existing markets outside
the United States, enter new markets on a timely basis, or that new markets outside the United States will be profitable. There are significant regulatory and legal barriers in markets outside the United States that must be overcome. We will be subject to the burden of complying with a wide variety of national and local laws, including multiple and possibly overlapping and conflicting laws. We also may experience difficulties adapting to new cultures, business customs and legal systems. Our sales and operations outside the United States are subject to political, economic and social uncertainties including, among others:
changes and limits in import and export controls;
increases in custom duties and tariffs;
changes in government regulations and laws;
coordination of geographically separated locations;
absence in some jurisdictions of effective laws to protect our intellectual property rights;
changes in currency exchange rates;
economic and political instability; and
currency transfer and other restrictions and regulations that may limit our ability to sell certain products or repatriate profits to the United States.
Any changes related to these and other factors could adversely affect our business, profitability and growth prospects. If we or our customers expand into additional markets outside the United States or improve sales in markets outside the United States, these and other risks associated with operations outside the United States are likely to increase.
Our products and manufacturing activities are subject to extensive government regulation, which could limit or prevent the sale of our products in some markets and could increase our costs.
The manufacturing, packaging, labeling, advertising, promotion, distribution, and sale of our products are subject to regulation by numerous national and local governmental agencies in the United States and in other countries. Failure to comply with governmental regulations may result in, among other things, injunctions, product withdrawals, recalls, product seizures, fines, and criminal prosecutions. Any action of this type by a governmental agency could materially adversely affect our ability to successfully market our products. In addition, if the governmental agency has reason to believe the law is being violated (for example, if it believes we do not possess adequate substantiation for product claims), it can initiate an enforcement action. Governmental agency enforcement could result in orders requiring, among other things, limits on advertising, consumer redress, divestiture of assets, rescission of contracts, and such other relief as may be deemed necessary. Violation of these orders could result in substantial financial or other penalties. Any action by the governmental agency could materially adversely affect our ability and our customers’ ability to successfully market those products.
In markets outside the United States, before commencing operations or marketing our products, we may be required to obtain approvals, licenses, or certifications from a country’s ministry of health or comparable agency. Approvals or licensing may be conditioned on reformulation of products or may be unavailable with respect to certain products or product ingredients. We must also comply with product labeling and packaging regulations that vary from country to country. Furthermore, the regulations of these countries may conflict with those in the United States and with each other. The sale of our products in certain European countries is subject to the rules and regulations of the European Union, which may be interpreted differently among the countries within the European Union. The cost of complying with these various and potentially conflicting regulations can be substantial and can adversely affect our results of operations.
We cannot predict the nature of any future laws, regulations, interpretations, or applications, nor can we determine what effect additional governmental regulations, when and if adopted, would have on our business. They could include requirements for the reformulation of certain products to meet new standards, the recall or discontinuance of certain products, additional record keeping, expanded or different labeling, and additional scientific substantiation. Any or all of these requirements could have a material adverse effect on our operations.
If we are unable to attract and retain qualified management personnel, our business will suffer.
Our executive officers and other management personnel are primarily responsible for our day-to-day operations. We believe our success depends largely on our ability to attract, maintain and motivate highly qualified management personnel. Competition for qualified individuals can be intense, and we may not be able to hire additional qualified personnel in a timely manner and on reasonable terms. Our inability to retain a skilled professional management team could adversely affect our ability to successfully execute our business strategies and achieve our goals.
Our manufacturing, fulfillment and call center activities are subject to certain risks.
We manufacture the vast majority of our products at our manufacturing facility in California and our fulfillment and call center activities are centralized at RHL’s facility. As a result, we are dependent on the uninterrupted and efficient operation of these facilities, which are located within approximately 45 miles of each other in the San Diego area of Southern California. Our manufacturing, fulfillment and call center operations are subject to power failures, blackouts, the breakdown, failure or substandard performance of equipment, the improper installation or operation of equipment, natural or other disasters, and the need to comply with the requirements or directives of governmental agencies, including the FDA. In addition, we may in the future determine to expand or relocate our facilities, which may result in slow downs or delays in our operations. While we have implemented and are evaluating various emergency, contingency and disaster recovery plans and maintain business interruption insurance, there can be no assurance that the occurrence of these or any other operational problems at our facilities in California or at NAIE’s facility in Switzerland would not have a material adverse effect on our business, financial condition and results of operations. Furthermore, there can be no assurance that our contingency plans will prove to be adequate or successful if needed or that our insurance will continue to be available at a reasonable cost or, if available, will be adequate to cover any losses that we may incur from an interruption in our manufacturing and distribution operations.
We may be unable to protect our intellectual property rights or may inadvertently infringe on the intellectual property rights of others.
We possess and may possess in the future certain proprietary technology, trade secrets, trademarks, tradenames, licenses and similar intellectual property. There can be no assurance that we will be able to protect our intellectual property adequately. In addition, the laws of certain foreign countries may not protect our intellectual property rights to the same extent as the laws of the United States. Litigation in the United States or abroad may be necessary to enforce our intellectual property rights, to determine the validity and scope of the proprietary rights of others or to defend against claims of infringement. This litigation, even if successful, could result in substantial costs and diversion of resources and could have a material adverse effect on our business, results of operation and financial condition. If any such claims are asserted against us, we may seek to obtain a license under the third party’s intellectual property rights. There can be no assurance, however, that a license would be available on terms acceptable or favorable to us, if at all.
Collectively, our officers and directors own a significant amount of our common stock, giving them influence over corporate transactions and other matters and potentially limiting the influence of other stockholders on important policy and management issues.
Our officers and directors, together with their families and affiliates, beneficially owned approximately 24% of our outstanding shares of common stock as of June 30, 2007, including approximately 19% of our outstanding shares of common stock beneficially owned by Mark LeDoux, our Chief Executive Officer and the Chairman of the Board, and his family and affiliates. As a result, our officers and directors, and in particular Mr. LeDoux, could influence such business matters as the election of directors and approval of significant corporate transactions.
Various transactions could be delayed, deferred or prevented without the approval of stockholders, including:
transactions resulting in a change in control;
mergers and acquisitions;
tender offers;
election of directors; and
proxy contests.
There can be no assurance that conflicts of interest will not arise with respect to the officers and directors who own shares of our common stock or that conflicts will be resolved in a manner favorable to us or our other stockholders.
If our information technology system fails, our operations could suffer.
Our business depends to a large extent on our information technology infrastructure to effectively manage and operate many of our key business functions, including order processing, customer service, product manufacturing and distribution, cash receipts and payments and financial reporting. A long term failure or impairment of any of our information technology systems could adversely affect our ability to conduct day-to-day business.
If certain provisions of our Certificate of Incorporation, Bylaws and Delaware law are triggered, the future price investors might be willing to pay for our common stock could be limited.
Certain provisions in our Certificate of Incorporation, Bylaws and Delaware corporate law help discourage unsolicited proposals to acquire our business, even if the proposal would benefit our stockholders. Our Board of Directors is authorized, without stockholder approval, to issue up to 500,000 shares of preferred stock having such rights, preferences, and privileges, including voting rights, as the Board of Directors designates. The rights of our common stockholders will be subject to, and may be adversely affected by, the rights of holders of any preferred stock that may be issued in the future. Any or all of these provisions could delay, deter or prevent a takeover of our company and could limit the price investors are willing to pay for our common stock.
Our stock price could fluctuate significantly.
Stock prices in general have been historically volatile and ours is no different. The trading price of our stock may fluctuate in response to:
broad market fluctuations and general economic and/or political conditions;
fluctuations in our financial results;
relatively low trading volumes;
future offerings of our common stock or other securities;
the general condition of the nutritional supplement or lifestyle product industries;
increased competition;
regulatory action;
adverse publicity;
manipulative or illegal trading practices by third parties; and
product and other public announcements.
The stock market has historically experienced significant price and volume fluctuations. There can be no assurance that an active market in our stock will continue to exist or that the price of our common stock will not decline. Our future operating results may be below the expectations of securities analysts and investors. If this were to occur, the price of our common stock would likely decline, perhaps substantially.
From time to time our shares may be listed for trading on one or more foreign exchanges, with or without our prior knowledge or consent. Certain foreign exchanges may have less stringent listing requirements, rules and enforcement procedures than the Nasdaq Global Market or other markets in the United States, which may increase the potential for manipulative trading practices to occur. These practices, or the perception by investors that such practices could occur, may increase the volatility of our stock price or result in a decline in our stock price, which in some cases could be significant.
| ITEM 1B. | UNRESOLVED STAFF COMMENTS |
Not applicable.
| ITEM 2. | PROPERTIES |
This table summarizes our facilities as of June 30, 2005.2007. We believe our facilities are adequate to meet our operating requirements for the foreseeable future.
Location | Nature of Use | Square Feet | How Held | Lease Expiration
| ||||
San Marcos, CA USA | Owned/leased | Various | ||||||
Vista, CA USA(1) | Manufacturing, warehousing, packaging and distribution | 162,000 | Leased | March 2014 | ||||
Manno, Switzerland | Manufacturing, warehousing, packaging and distribution | Leased | December 2015 | |||||
San Diego, CA USA(3) | RHL headquarters, warehousing, call center and fulfillment | 16,000 | Leased | May 2009 | ||||
| (1) | This facility is used by NAI primarily for its private label contract manufacturing segment. |
| (2) | This facility is used by NAIE, our wholly owned Swiss |
| This facility is used primarily by RHL, our wholly owned subsidiary, for our branded products segment. |
| (4) | We expect to renew our leases in the normal course of |
| We use approximately 93,000 square feet for |
| We own approximately 29,500 square feet and lease the remaining 10,800 square feet. The lease for approximately 8,000 square feet terminates in February 2008 and the lease for the remaining space |
| ITEM 3. | LEGAL PROCEEDINGS |
From time to time, we become involved in various investigations, claims and legal proceedings that arise in the ordinary course of our business. These matters may relate to product liability, employment, intellectual property, tax, regulation, contract or other matters. The resolution of these matters as they arise will be subject to various uncertainties and, even if such claims are without merit, could result in the expenditure of significant financial and managerial resources. While unfavorable outcomes are possible, based on available information, we generally do not believe the resolution of these matters including that discussed below, will result in a material adverse effect on our business, consolidated financial condition, or results of operation. However, a settlement payment or unfavorable outcome could adversely impact our results of operation. Our evaluation of the likely impact of these actions including that discussed below, could change in the future and we could have unfavorable outcomes that we do not expect.
On February 10, 2005, a complaint was filed against NAI on behalf of Novogen Research Pty. Ltd. in the United States District Court, Southern District of New York alleging a cause of action for patent infringement of a Novogen patent by products manufactured by NAI. The parties are attempting to resolve the matter in an out-of-court settlement but if we are unable to do so we intend to vigorously defend the action.
As of September 8, 2005, other than as set forth above,October 15, 2007, neither NAI nor its subsidiaries were a party to any material pending legal proceeding nor was any of their property the subject of any material pending legal proceeding.
ITEM 4. SUBMISSION OF MATTERS TO A VOTE OF SECURITY HOLDERS
| ITEM 4. | SUBMISSION OF MATTERS TO A VOTE OF SECURITY HOLDERS |
We did not submit any matters to our stockholders for a vote during the fourth quarter ended June 30, 2005.
2007.
ITEM 5. MARKET FOR OUR COMMON EQUITY, RELATED STOCKHOLDER MATTERS AND ISSUER PURCHASES OF EQUITY SECURITIES
| ITEM 5. | MARKET FOR OUR COMMON EQUITY, RELATED STOCKHOLDER MATTERS AND ISSUER PURCHASES OF EQUITY SECURITIES |
Market Information
Our common stock trades on the Nasdaq NationalGlobal Market under the symbol “NAII.” Below are the high and low closing prices of our common stock as reported on the Nasdaq NationalGlobal Market for each quarter of the fiscal years ended June 30, 20052007 and 2004:2006:
| Fiscal 2005 | Fiscal 2004 | |||||||||||
| High | Low | High | Low | |||||||||
First Quarter | $ | 9.65 | $ | 6.32 | $ | 5.47 | $ | 4.68 | ||||
Second Quarter | $ | 11.46 | $ | 7.88 | $ | 6.41 | $ | 4.70 | ||||
Third Quarter | $ | 9.85 | $ | 6.37 | $ | 9.60 | $ | 6.20 | ||||
Fourth Quarter | $ | 8.21 | $ | 6.75 | $ | 13.80 | $ | 7.27 | ||||
| Fiscal 2007 | Fiscal 2006 | |||||||||||
| High | Low | High | Low | |||||||||
First Quarter | $ | 10.84 | $ | 7.77 | $ | 8.25 | $ | 6.64 | ||||
Second Quarter | $ | 9.25 | $ | 8.37 | $ | 6.80 | $ | 5.27 | ||||
Third Quarter | $ | 9.26 | $ | 7.90 | $ | 8.54 | $ | 6.34 | ||||
Fourth Quarter | $ | 8.22 | $ | 7.05 | $ | 10.86 | $ | 8.00 | ||||
In addition to the Nasdaq NationalGlobal Market, our shares are also listed for trading on the Berlin-Bremen Stock Exchange, the Frankfurt Stock Exchange, and the XETRA Stock Exchange, each of which is a foreign exchange located in Germany. We are not aware of any other exchanges on which our shares are traded.
Holders
As of September 8, 2005,October 15, 2007, there were approximately 360317 stockholders of record of our common stock.
Dividends
We have never paid a dividend on our common stock and we do not intend to pay a dividend in the foreseeable future. Our current policy is to retain all earnings to help provide funds for future growth. Additionally, under the terms of our credit facility, we are precluded from paying a dividend.
Recent Sales of Unregistered Securities
During the fiscal year ended June 30, 2005,2007, we did not sell any unregistered securities.
Repurchases
During the fourth quarter of the fiscal 2005,year ended June 30, 2007, we did not repurchase any shares of our common stock, nor were any repurchases made on our behalf.
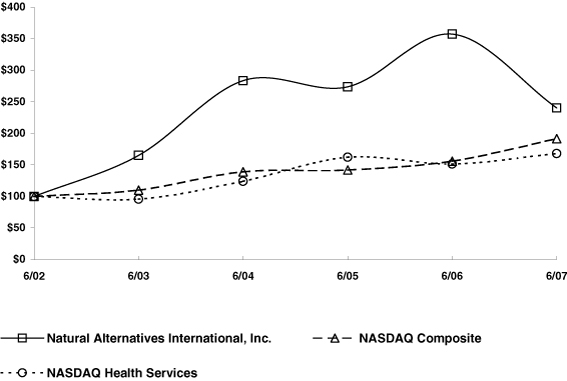
Performance Graph
The graph below provides a comparison of cumulative total returns for our common stock, the Nasdaq Composite Index, and the Nasdaq Health Services Index for the five year period ended June 30, 2007. The graph assumes an investment of $100 on June 30, 2002 in each of our common stock, and the stock comprising the Nasdaq Composite Index and the Nasdaq Health Services Index. Each of the indices assumes that all dividends were reinvested. The graph lines merely connect the prices on the dates indicated and do not reflect fluctuations between those dates.
The stock performance shown above is not indicative of future performance.
The performance information above is not deemed to be filed with the SEC or subject to the liabilities of Section 18 of the Securities Exchange Act of 1934, as amended, and shall not be deemed incorporated by reference by any general statement incorporating by reference this report into any filing with the SEC, except to the extent we specifically incorporate this information by reference.
ITEM 6. SELECTED FINANCIAL DATA
| ITEM 6. | SELECTED FINANCIAL DATA |
The following tables contain certain financial information about NAI, including its subsidiaries. When youYou should review this information you should keeptogether with our audited consolidated financial statements and the notes to the consolidated financial statements included under Item 8 in mind that it is historical.this report. Our future financial condition and results of operations will vary from our historical financial information below based on a variety of factors. You should carefully review the following information together with the information on risks described under Item 7Items 1A and 7A and elsewhere in this report, which identify certain important factors that could cause our future financial condition and our consolidated financial statements included in this report under Item 8.results of operations to vary.
Annual Financial Data
Annual Financial Information for Years Ended June 30 (Amounts in thousands, except per share amounts) | Annual Financial Information for Years Ended June 30 (Amounts in thousands, except per share amounts) | |||||||||||||||||||||||||||||||||||||||
| 2005 | 2004 | 2003 | 2002 | 2001 | 2007 | 2006 | 2005 | 2004 | 2003 | |||||||||||||||||||||||||||||||
Net sales | $ | 91,492 | $ | 78,534 | $ | 55,962 | $ | 50,037 | $ | 42,158 | $ | 97,128 | $ | 99,612 | $ | 91,972 | $ | 78,534 | $ | 55,962 | ||||||||||||||||||||
Cost of goods sold | 73,095 | 59,964 | 42,781 | 39,068 | 33,970 | 75,842 | 78,364 | 74,317 | 59,964 | 42,781 | ||||||||||||||||||||||||||||||
Gross profit | 18,397 | 18,570 | 13,181 | 10,969 | 8,188 | 21,286 | 21,248 | 17,655 | 18,570 | 13,181 | ||||||||||||||||||||||||||||||
Selling, general & administrative expenses | 14,605 | 15,188 | 12,012 | 10,684 | 8,848 | 18,968 | 16,630 | 13,863 | 15,188 | 12,012 | ||||||||||||||||||||||||||||||
Loss on impairment of intangible assets acquired | — | — | — | — | 1,544 | |||||||||||||||||||||||||||||||||||
Non-cash goodwill impairment charge | 7,037 | — | — | — | — | |||||||||||||||||||||||||||||||||||
Income (loss) from operations | 3,792 | 3,382 | 1,169 | 285 | (2,204 | ) | (4,719 | ) | 4,618 | 3,792 | 3,382 | 1,169 | ||||||||||||||||||||||||||||
Other income (expense): | ||||||||||||||||||||||||||||||||||||||||
Interest income | 21 | 24 | 57 | 16 | 92 | 11 | 28 | 21 | 24 | 57 | ||||||||||||||||||||||||||||||
Interest expense | (280 | ) | (274 | ) | (252 | ) | (665 | ) | (755 | ) | (660 | ) | (565 | ) | (280 | ) | (274 | ) | (252 | ) | ||||||||||||||||||||
Foreign exchange gain (loss) | (137 | ) | 57 | 12 | (68 | ) | 15 | 77 | 41 | (137 | ) | 57 | 12 | |||||||||||||||||||||||||||
Proceeds from vitamin antitrust litigation | — | — | 225 | 3,410 | 298 | — | — | — | — | 225 | ||||||||||||||||||||||||||||||
Other, net | 13 | (165 | ) | (59 | ) | 259 | 35 | 125 | (11 | ) | 13 | (165 | ) | (59 | ) | |||||||||||||||||||||||||
Total other income (expense) | (383 | ) | (358 | ) | (17 | ) | 2,952 | (315 | ) | (447 | ) | (507 | ) | (383 | ) | (358 | ) | (17 | ) | |||||||||||||||||||||
Income (loss) before income taxes | 3,409 | 3,024 | 1,152 | 3,237 | (2,519 | ) | (5,166 | ) | 4,111 | 3,409 | 3,024 | 1,152 | ||||||||||||||||||||||||||||
Provision for (benefit from) income taxes | 1,210 | 24 | 47 | (642 | ) | 2,370 | ||||||||||||||||||||||||||||||||||
Provision for income taxes | 119 | 1,441 | 1,210 | 24 | 47 | |||||||||||||||||||||||||||||||||||
Net income (loss) | $ | 2,199 | $ | 3,000 | $ | 1,105 | $ | 3,879 | $ | (4,889 | ) | $ | (5,285 | ) | $ | 2,670 | $ | 2,199 | $ | 3,000 | $ | 1,105 | ||||||||||||||||||
Net income (loss) per common share: | ||||||||||||||||||||||||||||||||||||||||
Basic | $ | 0.37 | $ | 0.51 | $ | 0.19 | $ | 0.67 | $ | (0.85 | ) | $ | (0.77 | ) | $ | 0.42 | $ | 0.37 | $ | 0.51 | $ | 0.19 | ||||||||||||||||||
Diluted | $ | 0.34 | $ | 0.48 | $ | 0.18 | $ | 0.67 | $ | (0.85 | ) | $ | (0.77 | ) | $ | 0.39 | $ | 0.34 | $ | 0.48 | $ | 0.18 | ||||||||||||||||||
Weighted average common shares: | ||||||||||||||||||||||||||||||||||||||||
Basic | 5,949 | 5,843 | 5,809 | 5,788 | 5,770 | 6,836 | 6,340 | 5,949 | 5,843 | 5,809 | ||||||||||||||||||||||||||||||
Diluted | 6,465 | 6,304 | 6,021 | 5,798 | 5,770 | 6,836 | 6,776 | 6,465 | 6,304 | 6,021 | ||||||||||||||||||||||||||||||
Balance sheet data at end of period: | ||||||||||||||||||||||||||||||||||||||||
Total assets | $ | 44,138 | $ | 42,468 | $ | 30,724 | $ | 27,510 | $ | 25,068 | $ | 47,380 | $ | 62,453 | $ | 44,138 | $ | 42,468 | $ | 30,724 | ||||||||||||||||||||
Working capital | $ | 14,398 | $ | 17,468 | $ | 12,321 | $ | 8,725 | $ | 5,045 | $ | 16,216 | $ | 13,172 | $ | 14,398 | $ | 17,468 | $ | 12,321 | ||||||||||||||||||||
Long-term debt and capital lease obligations, net of current portion | $ | 2,979 | $ | 3,841 | $ | 2,386 | $ | 1,576 | $ | 3,567 | ||||||||||||||||||||||||||||||
Long-term debt, net of current portion | $ | 2,756 | $ | 4,596 | $ | 2,979 | $ | 3,841 | $ | 2,386 | ||||||||||||||||||||||||||||||
Total stockholders’ equity | $ | 26,917 | $ | 24,128 | $ | 20,777 | $ | 19,608 | $ | 15,604 | $ | 30,022 | $ | 33,291 | $ | 26,917 | $ | 24,128 | $ | 20,777 | ||||||||||||||||||||
Quarterly Financial Data - Unaudited
Quarterly Financial Information for Fiscal 2005 and Fiscal 2004 (Amounts in thousands, except per share amounts) | Quarterly Financial Information for Fiscal 2007 and Fiscal 2006 (Amounts in thousands, except per share amounts) | |||||||||||||||||||||||||||||||||||||||||||||||||||||||||||||||
| Fiscal 2005 | Fiscal 2004 | Fiscal 2007 | Fiscal 2006 | |||||||||||||||||||||||||||||||||||||||||||||||||||||||||||||
| Q4 | Q3 | Q2 | Q1 | Q4 | Q3 | Q2 | Q1 | Q4 | Q3 | Q2 | Q1 | Q4 | Q3 | Q2 | Q1 | |||||||||||||||||||||||||||||||||||||||||||||||||
Net sales | $ | 24,730 | $ | 22,490 | $ | 21,545 | $ | 22,727 | $ | 23,350 | $ | 21,268 | $ | 17,195 | $ | 16,721 | $ | 24,127 | $ | 23,791 | $ | 24,049 | $ | 25,161 | $ | 34,380 | $ | 23,387 | $ | 19,945 | $ | 21,900 | ||||||||||||||||||||||||||||||||
Cost of goods sold | 20,456 | 18,277 | 16,953 | 17,409 | 17,874 | 16,215 | 13,300 | 12,575 | 19,455 | 18,394 | 18,347 | 19,646 | 26,808 | 17,585 | 15,933 | 18,038 | ||||||||||||||||||||||||||||||||||||||||||||||||
Gross profit | 4,274 | 4,213 | 4,592 | 5,318 | 5,476 | 5,053 | 3,895 | 4,146 | 4,672 | 5,397 | 5,702 | 5,515 | 7,572 | 5,802 | 4,012 | 3,862 | ||||||||||||||||||||||||||||||||||||||||||||||||
Selling, general & administrative expenses | 3,433 | 3,538 | 3,710 | 3,924 | 4,279 | 4,047 | 3,346 | 3,516 | 4,747 | 4,801 | 4,737 | 4,683 | 5,622 | 4,655 | 3,169 | 3,184 | ||||||||||||||||||||||||||||||||||||||||||||||||
Non-cash goodwill impairment charge | 7,037 | — | — | — | — | — | — | — | ||||||||||||||||||||||||||||||||||||||||||||||||||||||||
Income from operations | 841 | 675 | 882 | 1,394 | 1,197 | 1,006 | 549 | 630 | ||||||||||||||||||||||||||||||||||||||||||||||||||||||||
Income (loss) from operations | (7,112 | ) | 596 | 965 | 832 | 1,950 | 1,147 | 843 | 678 | |||||||||||||||||||||||||||||||||||||||||||||||||||||||
Other income (expense): | ||||||||||||||||||||||||||||||||||||||||||||||||||||||||||||||||
Interest income | 6 | 5 | 6 | 4 | 3 | 3 | 9 | 9 | 3 | 3 | 4 | 1 | 1 | 1 | 16 | 10 | ||||||||||||||||||||||||||||||||||||||||||||||||
Interest expense | (89 | ) | (86 | ) | (54 | ) | (51 | ) | (111 | ) | (69 | ) | (51 | ) | (43 | ) | (126 | ) | (137 | ) | (167 | ) | (230 | ) | (265 | ) | (159 | ) | (83 | ) | (58 | ) | ||||||||||||||||||||||||||||||||
Foreign exchange gain (loss) | (115 | ) | (188 | ) | 168 | (2 | ) | (38 | ) | (50 | ) | 130 | 15 | 14 | 7 | 48 | 8 | 51 | (8 | ) | (23 | ) | 21 | |||||||||||||||||||||||||||||||||||||||||
Other, net | (3 | ) | (8 | ) | 25 | (1 | ) | (96 | ) | (22 | ) | (25 | ) | (22 | ) | 128 | 10 | (4 | ) | (9 | ) | (4 | ) | (4 | ) | (3 | ) | — | ||||||||||||||||||||||||||||||||||||
Total other income (expense) | (201 | ) | (277 | ) | 145 | (50 | ) | (242 | ) | (138 | ) | 63 | (41 | ) | 19 | (117 | ) | (119 | ) | (230 | ) | (217 | ) | (170 | ) | (93 | ) | (27 | ) | |||||||||||||||||||||||||||||||||||
Income before income taxes | 640 | 398 | 1,027 | 1,344 | 955 | 868 | 612 | 589 | ||||||||||||||||||||||||||||||||||||||||||||||||||||||||
Income (loss) before income taxes | (7,093 | ) | 479 | 846 | 602 | 1,733 | 977 | 750 | 651 | |||||||||||||||||||||||||||||||||||||||||||||||||||||||
Provision for (benefit from) income taxes | 355 | 121 | 242 | 492 | (47 | ) | 13 | 36 | 22 | (498 | ) | 110 | 292 | 215 | 557 | 356 | 289 | 239 | ||||||||||||||||||||||||||||||||||||||||||||||
Net income | $ | 285 | $ | 277 | $ | 785 | $ | 852 | $ | 1,002 | $ | 855 | $ | 576 | $ | 567 | ||||||||||||||||||||||||||||||||||||||||||||||||
Net income (loss) | $ | (6,595 | ) | $ | 369 | $ | 554 | $ | 387 | $ | 1,176 | $ | 621 | $ | 461 | $ | 412 | |||||||||||||||||||||||||||||||||||||||||||||||
Net income per common share: | ||||||||||||||||||||||||||||||||||||||||||||||||||||||||||||||||
Net income (loss) per common share: | ||||||||||||||||||||||||||||||||||||||||||||||||||||||||||||||||
Basic | $ | 0.05 | $ | 0.05 | $ | 0.13 | $ | 0.14 | $ | 0.17 | $ | 0.15 | $ | 0.10 | $ | 0.10 | $ | (0.96 | ) | $ | 0.05 | $ | 0.08 | $ | 0.06 | $ | 0.18 | $ | 0.09 | $ | 0.07 | $ | 0.07 | |||||||||||||||||||||||||||||||
Diluted | $ | 0.04 | $ | 0.04 | $ | 0.12 | $ | 0.13 | $ | 0.15 | $ | 0.13 | $ | 0.09 | $ | 0.09 | $ | (0.96 | ) | $ | 0.05 | $ | 0.08 | $ | 0.05 | $ | 0.16 | $ | 0.09 | $ | 0.07 | $ | 0.06 | |||||||||||||||||||||||||||||||
Weighted average common shares: | ||||||||||||||||||||||||||||||||||||||||||||||||||||||||||||||||
Basic | 5,982 | 5,958 | 5,929 | 5,924 | 5,881 | 5,849 | 5,822 | 5,821 | 6,898 | 6,885 | 6,840 | 6,720 | 6,589 | 6,572 | 6,186 | 6,013 | ||||||||||||||||||||||||||||||||||||||||||||||||
Diluted | 6,414 | 6,421 | 6,572 | 6,448 | 6,606 | 6,335 | 6,162 | 6,107 | 6,898 | 7,202 | 7,185 | 7,201 | 7,169 | 7,006 | 6,485 | 6,469 | ||||||||||||||||||||||||||||||||||||||||||||||||
ITEM 7. MANAGEMENT’S DISCUSSION AND ANALYSIS OF FINANCIAL CONDITION AND RESULTS OF OPERATION
| ITEM 7. | MANAGEMENT’S DISCUSSION AND ANALYSIS OF FINANCIAL CONDITION AND RESULTS OF OPERATION |
The following discussion and analysis is intended to help you understand our financial condition and results of operations for the last three fiscal years ended June 30, 2005.2007. You should read the following discussion and analysis together with our audited consolidated financial statements and the notes to the consolidated financial statements included under Item 8 in this report. Our future financial condition and results of operations will vary from our historical financial condition and results of operations described below.below based on a variety of factors. You should carefully review the risks described under this Item 7Items 1A and 7A and elsewhere in this report, which identify certain important factors that could cause our future financial condition and results of operations to vary.
Executive Overview
The following overview does not address all of the matters covered in the other sections of this Item 7 or other items in this report or contain all of the information that may be important to our stockholders or the investing public. This overview should be read in conjunction with the other sections of this Item 7 and this report.
Our primary business activity is providing private label contract manufacturing services to companies that market and distribute vitamins, minerals, herbs and other nutritional supplements, as well as other health care products, to consumers both within and outside the United States. Historically, our revenue has been largely dependent on sales to one or two private label contract manufacturing customers and subject to variations in the timing of such customers’ orders, which in turn is impacted by such customers’ internal marketing programs, supply chain management, entry into new markets and new product introductions.
MajorA cornerstone of our business developmentsstrategy is to achieve long-term growth and diversify our sales. We have sought and expect to continue to seek to diversify our sales both by developing relationships with additional, quality-oriented, private label contract manufacturing customers and developing and growing our own line of branded products. To that end, during fiscal 2005 included the following:2006, we established relationships with two new private label contract manufacturing customers, and completed our acquisition of RHL, an integrated direct marketer of its own and third party branded nutritional supplements and other lifestyle products.
Beginning in April 2007, Dr. Cherry ceased airing his weekly television program, which had served as the primary customer acquisition vehicle in marketing the Pathway to Healing® product line. While sales of the product line have been primarily generated by continuity orders from long-standing repeat customers, the loss of the television program is anticipated to have a negative impact on our ability to acquire new customers. We continue working with Dr. Cherry to evaluate alternative marketing programs and revise marketing plans to support the product line.
In the fourth quarter of fiscal 2007, we recorded a $7.0 million non-cash goodwill impairment charge as a result of our Vista, California facility, which included the acquisitionannual testing of additional manufacturing equipment.
goodwill and other intangible assets as discussed in our Critical Accounting Policies below.
OurDuring fiscal 2008, we plan to continue to focus for fiscal 2006 includes the following:on:
Leveraging our new facility and TGA recertification to:
• | Implementing focused initiatives to grow our branded product lines and to sustain our Pathway to Healing® product line; |
Improving operational efficiencyefficiencies and managemanaging costs and business risks to improve profitability; and
Identifying and evaluateevaluating additional acquisition opportunities that could increase product lines, expand distribution channels, enhance manufacturing capabilities or reduce risksrisk associated with a variety of factors.
Looking forward, we expect to continue our trend of annual revenue growth. We anticipate quarterly revenue fluctuations due to, among other things, the timing of customer orders that are impacted by marketing programs, supply chain management, entry into new markets and new product introductions.
We also expect our long-term trend of growth in annual operating income to continue, however; there may be periodic quarterly declines in operating income due to revenue fluctuations, regulatory compliance costs and investments in new marketing, brand development and channel diversification initiatives. Regulatory compliance costs related to our TGA recertification are largely complete. We anticipate the reduction in regulatory compliance costs to be offset by incremental costs for implementing focused initiatives to establish our own branded products through new distribution channels.
Critical Accounting Policies and Estimates
Our consolidated financial statements included under Item 8 in this report have been prepared in accordance with United States generally accepted accounting principles (GAAP). Our significant accounting policies are described in the notes to our consolidated financial statements. The preparation of financial statements in accordance with GAAP requires that we make estimates and assumptions that affect the amounts reported in our financial statements and their accompanying notes. We have identified certain policies that we believe are important to the portrayal of our financial condition and results of operations. These policies require the application of significant judgment by our management. We base our estimates on our historical experience, industry standards, and various other assumptions that we believe are reasonable under the circumstances. Actual results could differ from these estimates under different assumptions or conditions. An adverse effect on our financial condition, changes in financial condition, and results of operations could occur if circumstances change that alter the various assumptions or conditions used in such estimates or assumptions. Our critical accounting policies include those listed below.
Goodwill and Intangible Asset Valuation
The purchase method of accounting for acquisitions requires extensive use of accounting estimates and judgments to allocate the purchase price to the fair value of the net tangible and intangible assets acquired. Goodwill and intangible assets deemed to have indefinite lives are not amortized, but are subject to annual impairment tests. The amounts and useful lives assigned to other intangible assets impact future amortization. Determining the fair values and useful lives of intangible assets requires the use of estimates and the exercise of judgment. While there are a number of different generally accepted valuation methods to estimate the value of intangible assets acquired, we primarily use the discounted cash flow method and relief-from-royalty method. These methods require significant management judgment to forecast the future operating results used in the analysis. In addition, other significant estimates are required such as residual growth rates and discount factors. The estimates we use to value and amortize intangible assets are consistent with the plans and estimates that we use to manage our business and are based on available historical information and industry estimates and averages. These judgments can significantly affect our net operating results.
We are required to assess goodwill impairment annually using the methodology prescribed by Statement of Financial Accounting Standards No. 142, “Goodwill and Other Intangible Assets” (SFAS 142). SFAS 142 requires that goodwill be tested for impairment at the reporting unit level on an annual basis or more frequently if we believe indicators of impairment exist. Application of the goodwill impairment test requires judgment, including the identification of reporting units, assigning assets and liabilities to reporting units, assigning goodwill to reporting units and determining the fair value of each reporting unit. Goodwill impairment is determined using a two-step process. The first step of the goodwill impairment test is used to identify potential impairment by comparing the fair value of a reporting unit with the net book value (or carrying amount), including goodwill. If the fair value of the reporting unit exceeds the carrying amount, goodwill of the reporting unit is considered not impaired and the second
step of the impairment test is unnecessary. If the carrying amount of the reporting unit exceeds the fair value, the second step of the goodwill impairment test is performed to measure the amount of impairment loss, if any. The second step of the goodwill impairment test compares the implied fair value of the reporting unit’s goodwill with the carrying amount of that goodwill. If the carrying amount of the reporting unit’s goodwill exceeds the implied fair value of that goodwill, an impairment loss is recognized in an amount equal to that excess. The implied fair value of goodwill is determined in the same manner as the amount of goodwill recognized in a business combination, accordingly the fair value of the reporting unit is allocated to all of the assets and liabilities of that unit as if the reporting unit had been acquired in a business combination and the fair value of the reporting unit was the purchase price paid to acquire the reporting unit.
Our branded products reporting unit for which we previously recorded approximately $7.5 million of goodwill, consists of the Dr. Cherry Pathway to Healing® product line, Real Health® Laboratories product line and the As We Change® catalog. The fair value of the branded products reporting unit was determined using a combination of the income approach and the market approach. Under the income approach, the fair value of a reporting unit is calculated based on the present value of estimated future cash flows. The present value of future cash flows uses our estimates of revenue for the reporting unit, driven by assumed growth rates and estimated costs as well as appropriate discount rates. Under the market approach, fair value is estimated based on market multiples of earnings for comparable companies and similar transactions. The weighting applied to the income approach of 80% and market approach of 20% was based on the data available and specific facts and circumstances.
In performing the first step of the fiscal 2007 goodwill impairment test, we determined there was an indicator of impairment in the branded products reporting unit because the carrying value of the reporting unit exceeded the estimated fair value. The excess of the carrying value over the estimated fair value of the branded products reporting unit was primarily due to the following developments that led to lower expected future cash flows:
• | A decrease in sales from the Dr. Cherry Pathway to Healing® product line, the highest margin product line included in the branded products reporting unit; |
• | The lower volume of Pathway to Healing® product line sales decreased the anticipated cost savings from our integration of previously outsourced fulfillment and call center activities following the acquisition of RHL, which reduced our ability to invest in expanding and marketing our branded products; |
• | The additional time and investment required to expand the Real Health® Laboratories product line to additional FDM retail customers and introduce new products to existing FDM customers; and |
• | Investments were made in fiscal 2007 to the As We Change® catalog in an effort to increase the active customer base and sales. We believe additional time and investment are required to expand the active customer base to a level where the catalog can generate higher cash flow. |
In performing the second step of the goodwill impairment test, we allocated the estimated fair values of the branded products reporting unit determined in step one of the impairment test, to the assets and liabilities in accordance with SFAS 141.
Determining the fair value of the reporting unit under the first step of the goodwill impairment test and determining the fair value of individual assets and liabilities of a reporting unit under the second step of the goodwill impairment test is judgmental in nature and often involves the use of significant estimates and assumptions. These estimates and assumptions could have a significant impact on whether or not an impairment charge is recognized and also the magnitude of any such charge. Estimates of fair value are primarily determined using discounted cash flows and market comparisons. These approaches use significant estimates and assumptions, including projection and timing of future cash flows, discount rates reflecting the risk inherent in future cash flows, perpetual growth rates, determination of appropriate market comparables, and determination of whether a premium or discount should be applied to comparables. It is reasonably possible that the plans and estimates used to value these assets may be incorrect. If our actual results, or the plans and estimates used in future impairment analyses, are lower than the original estimates used to assess the recoverability of these assets, we could incur additional impairment charges.
Revenue Recognition
We recognize revenue in accordance with SECthe SEC’s Staff Accounting Bulletin No. 101,104, “Revenue Recognition in Financial Statements” (SAB 101)104), Statement of Financial Accounting Standards No. 48, “Revenue Recognition When Right of Return Exists” (SFAS 48), and Emerging Issues Task Force Abstract No. 01-09, “Accounting for Consideration Given by a Vendor to a Customer (Including a Reseller of the Vendor’s Products)” (EITF 01-09).
SAB 101104 requires that four basic criteria be met before revenue can be recognized: 1) there is evidence that an arrangement exists; 2) delivery has occurred; 3) the fee is fixed or determinable; and 4) collectibility is reasonably assured. SFAS 48 states that revenue from sales transactions where the buyer has the right to return the product shall be recognized at the time of sale only if (1) the seller’s price to the buyer is substantially fixed or determinable at the date of sale; (2) the buyer has paid the seller, or the buyer is obligated to pay the seller and the obligation is not contingent on resale of the product; (3) the buyer’s obligation to the seller would not be changed in the event of theft or physical destruction or damage of the product; (4) the buyer acquiring the product for resale has economic substance apart from that provided by the seller; (5) the seller does not have significant obligations for future performance to directly bring about resale of the product by the buyer; and (6) the amount of future returns can be reasonably estimated. We recognize revenue upon determination that all criteria for revenue recognition have been met. The criteria are usually met at the time title passes to the customer, which usually occurs upon shipment. Revenue from shipments where title passes upon delivery is deferred until the shipment has been delivered.
We account for RHL payments made to customers in accordance with EITF 01-09, which states that cash consideration (including a sales incentive) given by a vendor to a customer is presumed to be a reduction of the selling prices of the vendor’s products or services and, therefore, should be characterized as a reduction of revenue when recognized in the vendor’s income statement, rather than a sales and marketing expense. RHL has various agreements with customers that provide for discounts and rebates. These agreements are classified as a reduction of revenue. Certain other costs associated with customers that meet the requirements of EITF 01-09 are recorded as sales and marketing expense. Vendor considerations recorded as a reduction of sales were $235,000 for the year ended June 30, 2007.
RHL warrants its products for full satisfaction, generally from 30 to 120 days. Our policy requires us to replace the product or refund the purchase price to the customer. At the time product revenue is recognized, we record an allowance for anticipated returns with an offsetting decrease to revenue based on historical experience. We periodically assess the adequacy of our liability and adjust the balance as necessary.
We record reductions to gross revenue for estimated returns of private label contract manufacturing products and branded products. The estimated returns are based on the trailing six months of private label contract manufacturing gross sales and our historical experience for both private label contract manufacturing and branded product returns. However, the estimate for product returns does not reflect the impact of a large product recall resulting from product nonconformance or other factors as such events are not predictable nor is the related economic impact estimable.
As part of the services we provide to our private label contract manufacturing customers, we may perform, but are not required to perform, certain research and development activities related to the development or improvement of their products. While our customers typically do not pay directly for this service, the cost of this service is included as a component of the price we charge to manufacture and deliver their products.
Additionally, we record reductions to gross revenue for estimated returns of private label contract manufacturing products and direct-to-consumer products. The estimated returns are based upon the trailing six months of private label contract manufacturing gross sales and our historical experience for both private label contract manufacturing and direct-to-consumer product returns. However, the estimate for product returns does not reflect the impact of a large product recall resulting from product nonconformance or other factors as such events are not predictable nor is the related economic impact estimable.
Inventory Reserve
We operate primarily as a private label contract manufacturer that builds products based upon anticipated demand or following receipt of customer specific purchase orders. As a result, we have limited realization risk in finished goods and work-in-process inventories. Our inventory reserve primarily relates to, but is not necessarily limited to, realization risk for raw materials. Our estimate to reduce inventory to net realizable value is based upon expiration of the raw materials’ efficacy, foreseeable demand of raw materials, market conditions and specific factors that arise fromFrom time to time, related to regulatory and other factors. The reserve level reflects our historical experience. If demand and/we build inventory for private label contract manufacturing customers under a specific purchase order with delivery dates that may subsequently be rescheduled or canceled at the customer’s request. We value inventory at the lower of cost or market on an item-by-item basis and establish reserves equal to all or a portion of the related inventory to reflect situations in which the cost of the inventory is not expected to be recovered. This requires us to make estimates regarding the market value of our inventory, including an assessment for excess and obsolete inventory. In evaluating whether inventory is stated at the lower of cost or market, management considers such factors as the amount of inventory on hand, the estimated time required to sell such inventory, the remaining shelf life and efficacy, the foreseeable demand within a specified time horizon and current and expected market conditions. Based on this evaluation, we record adjustments to cost of goods sold to adjust inventory to its net realizable value. These adjustments are estimates, which could vary significantly, either favorably or unfavorably, from actual requirements if future economic conditions, are less favorable than we estimate, additional inventory reserves may be required.customer demand or other factors differ from expectations.
Accounting for Income Taxes
We estimate income taxes in each of the jurisdictions in which we operate. This process involves estimating our actual current tax exposure, together with assessing temporary differences resulting from differing treatment of items, such as property and equipment depreciation, for tax and financial reporting purposes. Actual income taxes could vary from these estimates due to future changes in income tax law or results from final tax examination reviews.
We record valuation allowances to reduce our deferred tax assets to an amount that we believe is more likely than not to be realized. We consider estimated future taxable income and ongoing prudent and feasible tax planning strategies in assessing the need for a valuation allowance. If we determine that we will not realize all or part of our deferred tax assets in the future, we will record an adjustment to the carrying value of the deferred tax asset, which
would be reflected as income tax expense. Conversely, if we determine that we will realize a deferred tax asset, which currently has a valuation allowance, we wouldwill reverse the valuation allowance, which would be reflected as income tax benefit.
Additionally, we have not recorded U.S. income tax expense for NAIE’s retained earnings that we have declared as indefinitely reinvested offshore, thus reducing our overall income tax expense. The earnings designated as indefinitely reinvested in NAIE are based uponon the actual deployment of such earnings in NAIE’s assets and our expectations of the future cash needs of NAIE and NAI. Income tax laws also are also a factor in determining the amount of foreign earnings to be indefinitely reinvested offshore.
We carefully review several factors that influence the ultimate disposition of NAIE’s retained earnings declared as reinvested offshore, and apply stringent standards to overcomingovercome the presumption of repatriation. Despite this approach, because the determination involves our future plans and expectations of future events, the possibility exists that amounts declared as indefinitely reinvested offshore may ultimately be repatriated. For instance, NAI’s actual cash needs may exceed our current expectations or NAIE’s actual cash needs may be less than our current expectations. Additionally, changes may occur in tax laws and and/or accounting standards that could change our conclusion aboutdetermination of the status of NAIE’s retained earnings. This would result in additional income tax expense in the fiscal year in which we determine that amounts are no longer indefinitely reinvested offshore.
On an interim basis, we estimate what our effective tax rate will be for the full fiscal year and record a quarterly income tax provision in accordance with the anticipated annual rate. As the fiscal year progresses, we continually refine our estimate based upon actual events and earnings by jurisdiction during the year. This continual estimation process periodically results in a change to our expected effective tax rate for the fiscal year. When this occurs, we adjust the income tax provision during the quarter in which the change in estimate occurs so that the year-to-date provision equals the expected annual rate.
It is our policy toWe establish reserves based uponon management’s assessment of exposure for certain positions taken in previously filed tax returns that may become payable upon audit by tax authorities. The tax reserves are analyzed at least annually, generally in the fourth quarter of each year, and adjustments are made as events occur whichthat warrant adjustments to the reserve.
During the fourth quarter of fiscal 2007, we reduced our tax contingency reserves after the Internal Revenue Service completed an audit of our fiscal 2005 tax return.
Derivative Financial Instruments
We use derivative financial instruments in the management of our foreign currency exchange risk inherent in our forecasted transactions denominated in Euros. We may hedge our foreign currency exposures by entering into offsetting forward exchange contracts and currency options. We account for derivative financial instruments using the deferral method under FASFinancial Accounting Standard 133, “Accounting for Derivatives and Related Hedging Activity,”Activity” (FAS 133), when such instruments are intended to hedge identifiable, firm foreign currency commitments or anticipated transactions and are designated as, and effective as, hedges. Foreign exchange exposures arising from certain transactions that do not meet the criteria for the deferral method are marked-to-market.
We recognize any unrealized gains and losses associated with derivative instruments in income in the period in which the underlying hedged transaction is realized. In the event the derivative instrument is deemed ineffective or sold prior to maturity, we would recognize the resulting gain or loss in income at that time.
Allowance for Doubtful Accounts
We maintain an allowance for doubtful accounts to reflect our estimate of current and past due receivable balances that may not be collected. The allowance for doubtful accounts is based upon our assessment of the collectibility of specific customer accounts, the aging of accounts receivable and our history of bad debts. We believe that the allowance for doubtful accounts is adequate to cover anticipated losses in the receivable balance under current conditions; however,conditions. However, significant deterioration in the financial condition of our customers, resulting in an impairment of their ability to make payments, could materially change these expectations and an additional allowance may be required.
Defined Benefit Pension Plan
We sponsor a defined benefit pension plan
plan. The plan obligation and related assets of the defined benefit pension plan are presented in the notes to the consolidated financial statements. Plan assets, which consist primarily of marketable equity and debt instruments, are valued based upon third party market quotations. Independent actuaries, through the use of a number of assumptions, determine plan obligation and annual pension expense. Key assumptions in measuring the plan obligation include the discount rate and estimated future return on plan assets. In determining the discount rate, we use an average long-term bond yield. Asset returns are based uponon the historical returns of multiple asset classes to develop a risk free rate of return and risk premiums for each asset class. The overall rate for each asset class was developed by combining a long-term inflation component, the risk free rate of return and the associated risk premium. A weighted average rate is developed based on the overall rates and the plan’s asset allocation.
We have discussed the development and selection of these critical accounting policies with the Audit Committee of our Board of Directors and the Audit Committee has reviewed our disclosure relating to these policies.
Results of Operations
The results of operations for the fiscal years ended June 30 were as follows (dollars in thousands, except per share amounts):
| 2005 | 2004 | Percent Change (2005- 2004) | 2003 | Percent Change (2004- 2003) | 2007 | 2006 | % Change (2007-2006) | 2005 | % Change (2006-2005) | |||||||||||||||||||||||||
Private label contract manufacturing | $ | 83,382 | $ | 68,493 | 22 | % | $ | 45,768 | 50 | % | $ | 80,732 | $ | 85,758 | (6) | $ | 83,862 | 2 | ||||||||||||||||
Direct-to-consumer marketing program | 8,110 | 10,041 | (19 | )% | 10,194 | (2 | )% | |||||||||||||||||||||||||||
Branded products | 16,396 | 13,854 | 18 | 8,110 | 71 | |||||||||||||||||||||||||||||
Total net sales | 91,492 | 78,534 | 16 | % | 55,962 | 40 | % | 97,128 | 99,612 | (3) | 91,972 | 8 | ||||||||||||||||||||||
Cost of goods sold | 73,095 | 59,964 | 22 | % | 42,781 | 40 | % | 75,842 | 78,364 | (3) | 74,317 | 5 | ||||||||||||||||||||||
Gross profit | 18,397 | 18,570 | (1 | )% | 13,181 | 41 | % | 21,286 | 21,248 | — | 17,655 | 20 | ||||||||||||||||||||||
Gross profit % | 20.1 | % | 23.6 | % | 23.6 | % | 21.9 | % | 21.3 | % | 19.2 | % | ||||||||||||||||||||||
Selling, general & administrative expenses | 14,605 | 15,188 | (4 | )% | 12,012 | 26 | % | 18,968 | 16,630 | 14 | 13,863 | 20 | ||||||||||||||||||||||
% of net sales | 19.5 | % | 16.7 | % | 15.1 | % | ||||||||||||||||||||||||||||
Non-cash goodwill impairment charge | 7,037 | — | n/a | — | n/a | |||||||||||||||||||||||||||||
Income (loss) from operations | (4,719 | ) | 4,618 | (202) | 3,792 | 22 | ||||||||||||||||||||||||||||
% of net sales | 16.0 | % | 19.3 | % | 21.5 | % | (4.9 | %) | 4.6 | % | 4.1 | % | ||||||||||||||||||||||
Other expenses, net | 383 | 358 | 7 | % | 17 | 2006 | % | 447 | 507 | (12) | 383 | 32 | ||||||||||||||||||||||
Income before income taxes | 3,409 | 3,024 | 13 | % | 1,152 | 163 | % | |||||||||||||||||||||||||||
Income (loss) before income taxes | (5,166 | ) | 4,111 | (226) | 3,409 | 21 | ||||||||||||||||||||||||||||
% of net sales | 3.7 | % | 3.9 | % | 2.1 | % | (5.3 | %) | 4.1 | % | 3.7 | % | ||||||||||||||||||||||
Net income | $ | 2,199 | $ | 3,000 | (27 | )% | $ | 1,105 | 171 | % | ||||||||||||||||||||||||
Net income (loss) | $ | (5,285 | ) | $ | 2,670 | (298) | $ | 2,199 | 21 | |||||||||||||||||||||||||
% of net sales | 2.4 | % | 3.8 | % | 2.0 | % | (5.4 | %) | 2.7 | % | 2.4 | % | ||||||||||||||||||||||
Diluted net income per common share | $ | 0.34 | $ | 0.48 | (29 | )% | $ | 0.18 | 167 | % | ||||||||||||||||||||||||
Basic/Diluted net income (loss) per common share | $ | (0.77 | ) | $ | 0.39 | (297) | $ | 0.34 | 15 | |||||||||||||||||||||||||
Fiscal 20052007 Compared to Fiscal 20042006
The percentage decrease in private label contract manufacturing net sales was primarily attributed to the following:
| Percentage Change | |||
Arbonne International | (7 | )(1) | |
Shaklee Corporation | 4 | (2) | |
Mannatech, Incorporated | 1 | (3) | |
Impact of foreign exchange rates | 1 | ||
Other customers | (5 | )(4) | |
Total | (6 | ) | |
1 | During fiscal 2006, we established a relationship with Arbonne International, which included significant initial shipments of a single new product in our fiscal 2006 fourth quarter. Shipments continued in fiscal 2007 but at a lower volume. |
2 | During fiscal 2006, we established a relationship with Shaklee Corporation. |
3 | Net sales to Mannatech, Incorporated increased primarily as a result of higher volumes of established products in existing markets contributing three percentage points of net sales growth, partially offset by a shift in sales mix to lower priced products. |
4 | A decrease in net sales to other customers was primarily due to the discontinuation of a customer relationship contributing three percentage points of the net sales reduction. |
The percentage increase in net sales of our branded products was primarily attributed to the following distribution channels:
| Percentage Change | |||
As We Change® (“AWC”) catalog | 26 | (1) | |
FDM retail channel | 7 | (1) | |
Direct-to-consumer marketing program | (15 | )(2) | |
Total | 18 | ||
1 | RHL was acquired on December 5, 2005 resulting in only seven months of net sales from these acquired brands for fiscal 2006. |
2 | Net sales from our direct-to-consumer marketing programs decreased primarily from lower sales of the Dr. Cherry Pathway to Healing® product line. |
Gross profit margin increased 0.6 percentage points primarily due to the following:
| Percentage Change | |||
Shift in sales mix | 1.6 | (1) | |
Changes in overhead expenses | (0.9 | ) | |
Reduced inventory reserves | 0.1 | ||
Incremental direct and indirect labor | (0.2 | ) | |
Total | 0.6 | ||
1 | The shift in sales mix resulted primarily from higher margin branded products sales comprising a higher percentage of sales compared to fiscal 2006 as a result of the RHL acquisition and changes within private label contract manufacturing sales mix. |
Private label contract manufacturing gross profit margin remained relatively consistent at 15.4% in fiscal 2007 compared to 15.6% in fiscal 2006 primarily due to reduced fixed cost leverage on lower net sales partially offset by a favorable shift in sales mix.
Branded products gross profit margin decreased 2.8 percentage points to 53.8% in fiscal 2007 from 56.6% in fiscal 2006 primarily due to a shift in sales mix to As We Change® catalog sales from the Dr. Cherry Pathway to Healing® product line sales.
Selling, general and administrative expenses increased $2.3 million, or 14%, primarily due to the inclusion of the results from NAI’s acquisition of Real Health Laboratories, Inc. for a full year in fiscal 2007 as compared to a partial year in fiscal 2006. The incremental branded products expenses were partially offset by reduced personnel expenses for the termination of certain private label contract manufacturing sales and marketing personnel in June 2006.
In the fourth quarter of fiscal 2007, we recorded a $7.0 million non-cash goodwill impairment charge as a result of our annual testing of goodwill and other intangible assets as discussed in our Critical Accounting Policies above.
Other expense, net decreased $60,000 primarily due to a favorable legal settlement of $90,000 awarded during our fiscal 2007 fourth quarter. Additionally, foreign exchange gains increased $36,000 due to the strengthening of the Euro and the related impact on the translation of Euro denominated cash and receivables. These gains were partially offset by an increase in interest expense of $95,000 primarily due to the additional $3.8 million term loan obtained in December 2005 to partially fund the RHL acquisition and an increase in our weighted average interest rate on our variable rate debt.
Our effective tax rate for fiscal 2007 was 2.3% compared to 35.1% in fiscal 2006. The decrease in our effective rate was primarily attributed to reducing our tax contingency reserves after the Internal Revenue Service completed an audit of our fiscal 2005 tax return in our fiscal 2007 fourth quarter.
Fiscal 2006 Compared to Fiscal 2005
The percentage increase in private label contract manufacturing net sales was attributed to the following:
| Percentage Change | ||||
| ||||
NSA International, Inc. | ||||
Mannatech, Incorporated | ||||
| ( | ) | ||
Other customers | ||||
Total | ||||
1 | During fiscal 2006, we established a relationship with Arbonne International, which included $9.0 million of net sales for initial shipments of a single new product. |
2 | Growth in net sales to NSA International, Inc. over the prior year resulted primarily from higher volumes of established products in existing markets, which contributed two percentage points of the net sales growth, partially offset by lower average prices per unit, which reduced our net sales growth by one percentage point. |
3 | The reduction in net sales to Mannatech, Incorporated from the prior year resulted primarily from a shift in sales mix to lower priced products, which resulted in five percentage points of the decrease and lower volumes of established products in existing markets of three percentage points. |
Net sales growthto our two largest customers as a percentage of total net sales decreased to 67% from NSA International, Inc over79% in the prior year resulted primarily from higher volumes of established products in existing markets.
year.
The increase in our private label contract manufacturing net sales was partially offset by the decrease in our direct-to-consumer net sales. This decrease was a continuation of the decline in sales for the Dr. Cherry Pathway to HealingTM product line due to our prior reduction in media spending investment in new television markets for the product line and a reduction in new customer acquisitions from our primary television market. We market our Dr. Cherry Pathway to HealingTM product line primarily through weekly television programming. During the third quarter we completed what we believe are improvements to the content and style of several of the programs. The new programming was introduced in the beginning of April 2005. The initial impact of the new programming appears to be positive as fourth quarter net sales improved 5% over the third quarter of fiscal 2005. In addition, we terminated the Chopra Center EssentialsTM product line in June 2005.
Gross profit margin decreasedincreased 2.1 percentage points to 20.1%21.3% in fiscal 20052006 from 23.6%, or 3.5 percentage points, from19.2% in fiscal 2004.2005. The decreaseincrease in gross profit margin was primarily due to the following:
| Percentage | ||||
Shift in sales mix | ||||
| ||||
| ||||
| ||||
| ) | |||
Reduced overhead expenses | 0.2 | (2) | ||
Total | ||||
1 | The shift in sales mix resulted primarily from higher margin branded products sales comprising a higher percentage of sales compared to fiscal 2005 as a result of the RHL acquisition. Additionally, contract manufacturing powder sales comprised a lower percentage of sales compared to fiscal 2005. Powder products typically include higher material cost as a percentage of selling price compared to capsule or tablet products, resulting in lower gross profit margins. |
2 | Overhead expenses decreased 0.2 percentage points primarily due to higher sales and improved fixed cost leverage, however in absolute dollars overhead increased $700,000, from the prior year primarily due to: |
Incremental expenses related to our facility expansion in sales mix resulted from selling higher volumes of established powder products to one of our largest customers. Powder products typically include higher material costVista, California and Manno, Switzerland as a percentage of selling price compared to capsule or tablet products, resulting in lower gross profit margins;follows:
Rent and facility related expenses as a percentage of net sales$396,000; and
Depreciation and amortization expenses related primarily to our facility expansion in Vista, California of $410,000;
Incremental inbound freight and shipping expense of $408,000; partially offset by
Reduced outsourced lab testing and consulting of $429,000 in conjunction with the preparation for our TGA audit in fiscal 2005.
Selling, general and administrative expenses increased 0.6 percentage points$2.8 million, or $1.6 million,20%, from the prior year primarily due to the following:
Selling,Additional RHL selling, general and administrative expenses decreased $583,000, or 4%, from the prior yearof $4.1 million; and
• | Incremental direct-to-consumer marketing brand development expenses of $489,000, primarily for the launch on a test basis of a direct mail campaign featuring Dr. Richard Linchitz, a nationally recognized physician, and TheraflexTM, one of our proprietary formulas; partially offset by |
Reduced NAI selling, general and administrative expenses of $1.9 million primarily attributabledue to the following:
Nonrecurring compliance expenses incurred in fiscal 2005 for TGA regulatory of $706,000 due to increased regulatory certification requirements to improve service to our customers selling products in international markets.and Sarbanes-Oxley of $323,000;
Reduced personnel costsexpenses of $844,000$456,000 primarily due to changes in personnel to strengthen quality assurance,the termination of certain regulatory compliance and product formulation and sales and marketing.personnel in June 2005, partially offset by employee restructuring costs for the termination of the Senior Vice President - Sales & Marketing in June 2006;
Reduced stock compensation expense of $131,000$102,000 primarily associated with the acceleration of the vesting of all outstanding and unvested stock options.options in fiscal 2005; and
Reduced clinical study costsbad debt expense of $398,000 as a result$211,000, primarily due to lower risk of lowering our level of participation in certain clinical studies.
Other expense, net increased $25,000 over the prior year$124,000 primarily attributabledue to the following:
An increase in interest expense of $285,000 primarily due to the following:
Additional $3.8 million term loan obtained in December 2005 to partially fund the RHL acquisition;
Increase in our weighted average interest rate on our variable rate debt; and
Incremental utilization of our line of credit to fund inventory purchases in the third quarter for orders shipped in the fourth quarter.
Foreign exchange gain of $41,000 compared to a foreign exchange loss of $137,000 in the prior year. This improvement of $178,000 was primarily due to the net loss associated with derivative financial instruments to manage our foreign currency exchange risksrisk of $109,000.
Our effective tax rate for fiscal 20052006 was 35.5%35.1% compared to 1%35.5% in fiscal 2004. The increase in our effective rate is primarily attributable to the reduction in our valuation allowance on our net deferred tax assets in the prior year. Income taxes for fiscal 2005 differed from statutory rates primarily due to our Swiss federal and cantonal income tax holiday and the utilization of certain federal and state tax credits. Our Swiss tax holiday ended on June 30, 2005. We anticipate NAIE’s effective tax rate for Swiss federal, cantonal and communal taxes will be approximately 23% in fiscal 2006 compared to our fiscal 2005 effective rate of 5%.
During the fourth quarter of fiscal 2005 we repatriated $2.0 million of NAIE’s foreign earnings under the American Jobs Creation Act (the “Act”), which was signed into law by the President on October 22, 2004. The Act creates a temporary incentive for U.S. multinational corporations to repatriate accumulated income earned outside the U.S. by providing an 85% dividend received deduction for certain dividends from controlled foreign corporations. The $2.0 million repatriation resulted in an increase of $232,000 in our tax provision for fiscal 2005. NAIE’s repatriated foreign earnings previously had been designated as permanently reinvested and the remaining undistributed retained earnings continue to be designated as such subsequent to the one-time repatriation.
Fiscal 2004 Compared to Fiscal 2003
Consolidated private label contract manufacturing net sales for the fiscal year ended June 30, 2004, increased $22.7 million, or 50%, over the prior year. Changes in currency exchange rates, namely the strengthening of the Euro, contributed $1.1 million dollars, or 2%, of this growth. Excluding the impact of changes in currency exchange rates, the remaining increase was due primarily to additional net sales of $14.1 million, or 31%, to our two largest customers. Net sales to our largest customer increased $6.0 million due to higher volumes of established products in existing markets. Net sales to our second largest customer increased $3.7 million from new products in existing markets and $4.4 million from established products in existing markets. Additionally, net sales increased $4.9 million from net sales to new customers and $3.4 million due to incremental volumes sold to customers obtained in the fourth quarter of fiscal 2003.
The Dr. Cherry Pathway to HealingTM product line comprised 100% of our direct-to-consumer net sales for the fiscal years ended June 30, 2004 and 2003. Direct-to-consumer net sales remained consistent due to a reduction in our media spending investment in new television markets for the Dr. Cherry Pathway to HealingTM product line, as the investment did not produce what we considered to be adequate results. Additionally, we experienced a reduction in new customer acquisitions from our primary television market, while the average order value remained consistent. We have identified opportunities to improve the content and style of the television programs and anticipate introducing the upgraded television programs in the third quarter of fiscal 2005.
Gross profit margin remained consistent despite a 1.4 percentage point increase in material cost as a percentage of net sales, due to a 1.5 percentage point decrease in labor and overhead as a percentage of net sales.
Our material cost as a percentage of net sales was 54.4% ($42.7 million) for fiscal 2004 and 53.0% ($29.6 million) in the prior year. The increase in material cost as a percentage of net sales was primarily due to an increase in inventory reserves of $854,000 for specific inventory realization risks and $111,000 for products as a result of terminating the Jennifer O’Neill Signature LineTM brand. The inventory allowance as a percentage of gross inventory at June 30, 2004 remained consistent with June 30, 2003. Additionally, 0.5 percentage points of the increase related to a shift in our sales mix to higher volume, lower margin products in fiscal 2004. Our labor and overhead expenses as a percentage of net sales were 22.0% ($17.2 million) for fiscal 2004 compared to 23.5% ($13.1 million) in the prior year. The decrease in labor and overhead as a percentage of net sales was primarily due to improved leverage of fixed costs on higher net sales.
In June 2004, we began the build out of tenant improvements for approximately 46,000 square feet at our Vista facility. We anticipate the build out will be completed by the end of our second quarter in fiscal 2005. We anticipate being able to initiate production activities in the third quarter of fiscal 2005. If we are unable to complete the build out and transition our operating activities as planned, we could experience a disruption in our manufacturing capabilities and incur additional costs to fulfill customer orders.
Selling, general and administrative expenses as a percentage of net sales decreased 2.2 percentage points in fiscal 2004 compared to fiscal 2003. In absolute dollars, however, selling, general and administrative expenses increased $3.2 million in fiscal 2004. The increase was primarily attributable to compensation payments under our fiscal 2004 Management Incentive Plan of $1.2 million, higher property, product liability and general liability insurance costs of $457,000 and research and development initiatives of $948,000.
During fiscal 2004, we made significant investments in our research and development initiatives primarily in the areas of clinical studies, regulatory assistance and personnel. Clinical studies increased $168,000 over the prior year primarily for efficacy validation of products in production and development stages. Regulatory related costs increased $381,000 over the prior year for services provided to current and prospective customers for international product registration, international and domestic product compliance and other services. Personnel costs increased $369,000 over the prior year to strengthen our team in the areas of regulatory and product formulation along with the hiring of our new Vice President of Science and Technology.
Other expense increased over the prior year primarily due to a $61,000 charge in conjunction with refinancing our credit facility in May 2004. The charge related to a prepayment penalty and the write off of capitalized issuance costs and is included in interest expense in our consolidated statements of income. Additionally, we received proceeds from the settlement of claims associated with the vitamin antitrust litigation of $225,000 in fiscal 2003.
At June 30, 2004, we reduced our valuation allowance on our deferred tax assets based on historical operating profits. The effective tax rate for fiscal 2004 was 1% compared to 4% in fiscal 2003. NAIE operates under a five-year Swiss federal and cantonal income tax holiday that ends June 30, 2005. Following the expiration of our tax holiday, we anticipate NAIE’s effective tax rate for Swiss federal, cantonal and communal taxes will be approximately 23% compared to our current effective rate of approximately 5%.
Our net income was $3.0 million ($0.48 per diluted share) in fiscal 2004 and $1.1 million ($0.18 per diluted share) in fiscal 2003. Excluding the effect of the litigation settlement proceeds of $225,000 in the prior year, net income increased $2.1 million compared to $880,000 ($0.15 per diluted share).
Liquidity and Capital Resources
Our primary sources of liquidity and capital resources are cash flows provided by operating activities and the availability of borrowings under our credit facility. Net cash provided by operating activities was $15.1 million in fiscal 2007 compared to net cash used in operating activities of $3.8 million in fiscal 2006 and provided by operating activities of $2.5 million in fiscal 2005,2005.
At June 30, 2007, changes in accounts receivable, consisting primarily of amounts due from our private label contract manufacturing customers, provided $7.8 million in cash during fiscal 2007 compared to $2.3 million of cash used in the prior year. Cash provided by accounts receivable in fiscal 2007 was due to higher collections from our record quarterly sales in our fiscal 2006 fourth quarter. Days sales outstanding was 35 days during fiscal 2007 compared to 45 days in fiscal 2006. This decrease in days sales outstanding was primarily due to timing of shipments.
At June 30, 2007, changes in inventory provided $3.0 million in cash during fiscal 2007 compared to $3.3 million of cash used in fiscal 2004 and $3.3 million2006. The decrease in inventory at June 30, 2007 was primarily for selling through inventory on hand as of June 30, 2006 for a private label contract manufacturing customer during fiscal 2003. Our operating cash flow in fiscal 2005 was impacted by the following:
2007.
Approximately $1.0$1.7 million of our operating cash flow was generated by NAIE in fiscal 2005.2007. In June 2005, we repatriated $2.0 million of NAIE retained earnings under the American Jobs Creation Act. As of June 30, 2005,2007, NAIE’s undistributed retained earnings are considered indefinitely reinvested.
Cash used in investing activities in fiscal 20052007 was $7.7$2.7 million compared to $3.3$7.9 million in fiscal 20042006 and $779,000 in fiscal 2003. Capital expenditures were $7.7 million in fiscal 2005 compared to $3.32005. Cash used in investing activities for fiscal 2006 included $5.6 million of net cash used in the acquisition of RHL. Capital expenditures were $2.7 million in fiscal 2004 and $977,0002007 compared to $2.3 million in fiscal 2003.2006 and $7.7 million in fiscal 2005. Fiscal 2007 capital expenditures were primarily for manufacturing equipment in our Vista, California and Manno, Switzerland facilities and call center computer software and hardware for our RHL facility. Additionally, we recently completed the expansion of our manufacturing facility in Manno, Switzerland to include powder filling capabilities. Fiscal 2006 capital expenditures were primarily for manufacturing equipment in our Vista, California and Manno, Switzerland facilities. Fiscal 2005 capital expenditures were primarily for the expansion of our Vista, California production facility, which included the acquisition of additional manufacturing equipment. The expanded facility should help us improve operational efficiency, increase manufacturing capacity and reduce business risk. On February 1,Fiscal 2005 we amended our credit facility to increase the limitation on our capital expenditures for the fiscal year ended June 30, 2005 from $6.5 million to $8.0 million. All other terms and conditions of our credit facility remain in full force and effect. Capital expenditures included $960,000 of tenant improvements that were funded by landlord allowances.
Our consolidated debt decreased to $3.8$4.6 million at June 30, 20052007 from $4.7$15.9 million at June 30, 2004.2006 primarily due to net payments of $9.6 million to our outstanding working capital line of credit balance at June 30, 2006. Our $12.0 millionfiscal 2006 working capital line of credit balance was primarily for additional investment in inventory for orders from a new private label contract manufacturing customer that were subsequently shipped in the fourth quarter of fiscal 2006 and during fiscal 2007.
We have a bank credit facility isof $20.9 million, comprised of an $8.0a $12.0 million working capital line of credit and $4.0$8.9 million in term loans. The working capital line of credit expires in November 2006, is secured by our accounts receivable and other rights to payment, general intangibles, inventory and equipment, has an interest rate of Prime Rate or LIBOR plus 1.75%, as elected by the CompanyNAI from time to time, and borrowings are subject to eligibility requirements for current accounts receivable and inventory balances. The term loans consist of a $1.1 million, 15 year term loan due June 2011, secured by our San Marcos building, at an interest rate of 8.25%; a $700,000, ten10 year term loan with a twenty year amortization, secured by our San Marcos building, at an interest rate of LIBOR plus 2.25%; a $1.8 million, four year term loan, secured by our accounts receivable and other rights to payment, general intangibles, inventory and equipment, at an interest rate of LIBOR plus 2.10%; and a $1.5 million, five year term loan, secured by equipment, at an interest rate of LIBOR plus 2.10%; and a $3.8 million, four year term loan, secured by equipment, at an interest rate of LIBOR plus 2.10%. Monthly payments on the term loans are approximately $63,000$145,000 plus interest. As
We amended our credit facility on December 1, 2005 and again on March 29, 2006 to increase our working capital line of credit from $8.0 million to $12.0 million, and to extend the maturity date from November 1, 2006 to November 1, 2007, as well as to make certain modifications to the financial covenants, including: (i) an increase in our ratio of total liabilities/tangible net worth covenant from 1.25/1.0 to 1.75/1.0 through June 30, 2005,2006 (the ratio returned to 1.25/1.0 from July 1, 2006 through June 30, 2007 and was to return to 1.0/1.0 thereafter but was subsequently further amended); (ii) a limit on capital expenditures of $5,500,000 for fiscal years 2006 and 2007; (iii)
an increase in our ability to incur additional aggregate annual operating lease expenses from $100,000 to $500,000 without prior approval from the lender; (iv) an increase in our ability to create specific indebtedness other than with our current lender from $0 to $1,000,000; (v) replacement of the EBITDA coverage ratio with a fixed charge coverage ratio (aggregate of net profit after taxes, depreciation and amortization expenses and net contributions/aggregate current maturity of long-term debt and capitalized lease payments) not less than 1.25/1.0 as of each fiscal quarter end; (vi) an increase in borrowings against eligible inventory from $3.0 million to $6.0 million, provided the outstanding borrowings shall not at any time exceed eligible accounts receivable; (vii) a change in permissible accounts receivable concentration to allow up to 35% for a new customer acceptable to the lender; and (viii) a change in the calculation of the fixed charge coverage ratio to a rolling 4-quarter basis from each fiscal quarter end.
On January 24, 2007, we had $7.7 million available underfurther amended our credit facility to extend the maturity date for the working capital line of credit from November 1, 2007 to November 1, 2008, and maintain the ratio of total liabilities/tangible net of a $270,000 outstanding letter of credit issued to our landlord. Under our credit facility, we may not create, incur or assume additional indebtedness without the approval of our lender.
On May 13, 2005, we purchased seven option contracts designated and effective as cash flow hedges to protect against the foreign currency exchange risk inherent in a portion of our forecasted transactions denominated in Euros. The seven options expire monthly beginning June 2005 and ending December 2005. The option contracts had a notional amount of $4.2 million, a weighted average strike price of $1.19, and a purchase price of $21,000. The risk of loss associated with the options is limited to premium amounts paidworth covenant at 1.25/1.0 for the option contracts. As of June 30, 2005, we had not exercised anyremainder of the options and oneterm of the options had expired.
On July 7, 2005, we purchased 12 option contracts designated and effective as cash flow hedges to protect against the foreign currency exchange risk inherent in a portion of our forecasted transactions denominated in Euros. The 12 options expire monthly beginning January 2006 and ending December 2006. The option contracts had a notional amount of $7.0 million, a weighted average strike price of $1.16, and a purchase price of $152,000. The risk of loss associated with the options is limited to premium amounts paid for the option contracts.
There are no other derivative financial instruments at June 30, 2005.
credit facility.
As of June 30, 2005,2007, we were not in compliance with our quarterly net income and annual net income financial covenants under our credit facility, which require quarterly net income after taxes of at least $1.00 and annual fiscal year net income of at least $750,000. As of June 30, 2007, our net loss was $6.6 million for our fourth quarter of fiscal 2007 and $5.3 million for fiscal 2007. Our lender has agreed to waive their default rights as a result of these covenant violations as of June 30, 2007.
Additionally, as of September 28, 2007, we were not in compliance with our annual Form 10-K financial reporting covenant under our credit facility, which requires that a copy of our annual report on Form 10-K be provided to our lender not later than 90 days after our fiscal year end. Our lender also has agreed to waive their default rights as a result of this covenant violation as of September 28, 2007.
As of June 30, 2007, we did not have an outstanding balance on the working capital line of credit and the amount outstanding on the term loans was $4.6 million.
On September 22, 2006, NAIE, our wholly owned subsidiary, entered into a credit facility to provide it with a credit line of up to CHF 1,300,000, or approximately $1.1 million, which is the initial maximum aggregate amount that can be outstanding at any one time under the credit facility. This maximum amount will be reduced by CHF 160,000, or approximately $130,000, at the end of each year beginning on December 31, 2007. On February 19, 2007, NAIE amended its credit facility to provide that the maximum aggregate amount that may be outstanding under the facility cannot be reduced below CHF 500,000, or approximately $407,000. As of June 30, 2007, there was no outstanding balance under the credit facility.
Under its credit facility, NAIE may draw amounts either as current account loan credits to its current or future bank accounts or as fixed loans with a maximum term of 24 months. Current account loans will bear interest at the rate of 5% per annum. Fixed loans will bear interest at a rate determined by the parties based on current market conditions and must be repaid pursuant to a repayment schedule established by the parties at the time of the loan. If a fixed loan is repaid early at NAIE’s election or in connection with the termination of the credit facility, NAIE will be charged a pre-payment penalty equal to 0.1% of the principal amount of the fixed loan or CHF 1,000 (approximately $800), whichever is greater. The bank reserves the right to refuse individual requests for an advance under the credit facility, although its exercise of such right will not have the effect of terminating the credit facility as a whole.
As of June 30, 2007, we had $1.9$4.9 million in cash and cash equivalents.equivalents and $7.5 million available under our line of credit. We plan on fundingbelieve our available cash, cash equivalents and potential cash flows from operations will be sufficient to fund our current working capital needs, capital expenditures and debt payments using available cash, cash flow from operations and our credit facility.
through at least the next 12 months.
Off-Balance Sheet Arrangements
We doAs of June 30, 2007, we did not have any significant off-balance sheet debt nor dodid we have any transactions, arrangements, obligations (including contingent obligations) or other relationships with any unconsolidated entities or other persons that mayhave or are reasonably likely to have a material current or future effect on our financial condition, changes in financial condition, results of operations, liquidity, capital expenditures, capital resources, or significant components of revenue or expenses.expenses material to investors.
Contractual Obligations
This table summarizes our known contractual obligations and commercial commitments at June 30, 20052007 (dollars in thousands).
| Payments Due By Period | Payments Due By Period | |||||||||||||||||||||||||||||
Contractual Obligations | Total | Less Than 1 Year | 1 –3 Years | 3 –5 Years | More Than 5 Years | Total | Less Than 1 Year | 1 –3 Years | 3 –5 Years | More Than 5 Years | ||||||||||||||||||||
Long-Term Debt | $ | 3,840 | $ | 861 | $ | 1,783 | $ | 596 | $ | 600 | $ | 4,581 | $ | 1,825 | $ | 2,147 | $ | 181 | $ | 428 | ||||||||||
Operating Leases | 18,605 | 1,872 | 3,856 | 3,916 | 8,961 | 16,645 | 2,239 | 4,383 | 4,458 | 5,565 | ||||||||||||||||||||
Total Obligations | $ | 22,445 | $ | 2,733 | $ | 5,639 | $ | 4,512 | $ | 9,561 | $ | 21,226 | $ | 4,064 | $ | 6,530 | $ | 4,639 | $ | 5,993 | ||||||||||
1 | Operating lease obligations are shown net of $72,000 in sublease rental income that should be received through March 2009. |
Inflation
We do not believe that inflation or changing prices have had a material impact on our historical operations or profitability.
Recent Accounting Pronouncements
In November 2004,July 2006, the FASB issued Statement of Financial Accounting Standards Board (FASB) issued FASB Interpretation No. 151, “Inventory Costs,48 (FIN 48), “Accounting for Uncertainty in Income Taxes.” FIN 48 prescribes detailed guidance for the financial statement recognition, measurement and disclosure of uncertain tax positions recognized in an amendment of APBenterprise’s financial statements in accordance with FASB Statement No. 43, Chapter 4” (SFAS 151). SFAS 151 clarifies that abnormal inventory costs such as costs of idle facilities, excess freight and handling costs, and wasted materials (spoilage) are required109, “Accounting for Income Taxes.” Tax positions must meet a more-likely-than-not recognition threshold at the effective date to be recognized as current period charges. The provisionsupon the adoption of SFAS 151 areFIN 48 and in subsequent periods. FIN 48 is be effective for our fiscal year beginning July 1, 2006.2007 and the provisions of FIN 48 will be applied to all tax positions upon initial adoption of the interpretation. The cumulative effect of applying the provisions of this interpretation will be reported as an adjustment to the opening balance of retained earnings for that fiscal year. We have evaluated the provisions of FIN 48 and do not expect that the adoption of SFAS 151 will have a material impact on our consolidated financial position or results of operations.
On December 16, 2004, the FASB finalized SFAS 123R, “Share Based Payment” (SFAS 123R), which will be effective for our interim and annual reporting periods beginning after June 15, 2005. SFAS 123R will require that we expense stock options and employee stock purchase plan shares using a binomial lattice valuation model that the FASB believes is capable of more fully reflecting certain characteristics of employee stock options. The effect of expensing stock options and employee stock purchase plan shares on our reported results of operations using the Black-Scholes model is presented in the notes to our consolidated financial statements under Item 8 of this report.
In May 2005,September 2006, the FASB issued Statement of Financial Accounting Standards No. 154, “Accounting Changes and Error Corrections”157, “Fair Value Measurements” (SFAS 154)157). SFAS 154 replaces APB Opinion No. 20, “Accounting Changes”157 defines fair value, establishes a framework for measuring fair value in generally accepted accounting principles, and FASB Statement No. 3, “Reporting Accounting Changes in Interim Financial Statements.”expands disclosures about fair value measurements. The provisions of SFAS 154 requires that a voluntary change in accounting principle be applied retrospectively with all prior period financial statements presented on the new accounting principle, unless it is impracticable to do so. SFAS 154 also provides that a correction of errors in previously issued financial statements should be termed a “restatement.” The new standard is157 are effective for accounting changes and correction of errorsour fiscal year beginning July 1, 2005.2008. We do not expect thatare currently evaluating the adoptionimpact of SFAS 154 will have157.
In February 2007, the FASB issued Statement of Financial Accounting Standards No. 159, “The Fair Value Option for Financial Assets and Financial Liabilities” (SFAS 159). SFAS 159 allows measurement of specified financial instruments, warranty and insurance contracts at fair value on a materialcontract by contract basis, with changes in fair value recognized in earnings in each period. The provisions of SFAS 159 are effective for our fiscal year beginning July 1, 2009. We are currently evaluating the impact on our consolidated financial position or results of operations.SFAS 159.
Risks
You should carefully consider the risks described below, as well as the other information in this report, when evaluating our business and future prospects. If any of the following risks actually occur, our business, financial condition and results of operations could be seriously harmed. In that event, the market price of our common stock could decline and you could lose all or a portion of the value of your investment in our common stock.
Because we derive a significant portion of our revenues from a limited number of customers, our revenues would be adversely affected by the loss of a major customer or a significant change in its business or personnel.
We have in the past, and expect to continue, to derive a significant portion of our revenues from a relatively limited number of customers. During the fiscal year ended June 30, 2005, sales to one customer, NSA International, Inc., were approximately 40% of our total net sales. Our second largest customer was Mannatech, Incorporated, which accounted for approximately 39% of our net sales. The loss of either of these customers or other major customers, a significant decrease in sales or the growth rate of sales to these customers, or a significant change in their business or personnel, would materially affect our financial condition and results of operations. Based on press releases issued by Mannatech, Incorporated, Mannatech achieved record net sales in its fiscal year ended December 31, 2004 and in the first two quarters of its fiscal 2005. There can be no assurance that such results will continue. A significant decline in Mannatech’s net sales or the growth rate of such sales could materially affect our financial condition and results of operations.
Our future growth and stability depends, in part, on our ability to diversify our net sales. Our efforts to establish new products, brands, markets and customers could require significant initial investments, which may or may not result in higher net sales and improved financial results.
Our business strategy depends in large part on our ability to develop new products, marketing strategies, brands and customer relationships. These activities often require a significant up-front investment including, among others, customized formulations, regulatory compliance, product registrations, package design, product testing, pilot production runs, marketing and the build up of initial inventory. We may experience significant delays from the time we increase our operating expenses and make investments in inventory until the time we generate net sales from new products or customers, and it is possible that we may never generate any revenue from new products or customers after incurring such expenditures. If we incur significant expenses and investments in inventory that we are not able to recover, and we are not able to compensate for those expenses, our operating results could be adversely affected.
Our operating results will vary and there is no guarantee that we will earn a profit. Fluctuations in our operating results may adversely affect the share price of our common stock.
While our net sales and income from operations have both improved during the past three fiscal years, there can be no assurance that they will continue to improve, or that we will earn a profit in any given year. We have experienced losses in the past and may incur losses in the future. Our operating results may fluctuate from year to year due to various factors including differences related to the timing of revenues and expenses for financial reporting purposes and other factors described in this report. At times, these fluctuations may be significant. Fluctuations in our operating results may adversely affect the share price of our common stock.
A significant or prolonged economic downturn could have a material adverse effect on our results of operations.
Our results of operations are affected by the level of business activity of our customers, which in turn is affected by the level of consumer demand for their products. A significant or prolonged economic downturn may adversely affect the disposable income of many consumers and may lower demand for the products we produce for our private label contract manufacturing customers, as well as for our direct-to-consumer products. A decline in consumer demand and the level of business activity of our customers due to economic conditions could have a material adverse effect on our revenues and profit margins.
Because our direct-to-consumer sales rely on the marketability of key personalities, the inability of a key personality to perform his or her role or the existence of negative publicity surrounding a key personality may adversely affect our revenues.
For the fiscal year ended June 30, 2005, our direct-to-consumer products accounted for approximately 9% of our net sales. These products are marketed with a key personality through a variety of distribution channels. The inability or failure of a key personality to fulfill his or her role, or the ineffectiveness of a key personality as a spokesperson for a product, a reduction in the exposure of a key personality or negative publicity about a key personality may adversely affect the sales of our product associated with that personality and could affect the sale of other products. A decline in sales would negatively affect our results of operations and financial condition.
Our industry is highly competitive and we may be unable to compete effectively. Increased competition could adversely affect our financial condition.
The market for our products is highly competitive. Many of our competitors are substantially larger and have greater financial resources and broader name recognition than we do. Our larger competitors may be able to devote greater resources to research and development, marketing and other activities that could provide them with a competitive advantage. Our market has relatively low entry barriers and is highly sensitive to the introduction of new products that may rapidly capture a significant market share. Increased competition could result in price reductions, reduced gross profit margins or loss of market share, any of which could have a material adverse effect on our financial condition and results of operations. There can be no assurance that we will be able to compete in this intensely competitive environment.
We may not be able to raise additional capital or obtain additional financing if needed.
Our cash from operations may not be sufficient to meet our working capital needs and/or to implement our business strategies. Although we obtained an $8.0 million line of credit in May 2004, there can be no assurance that this line of credit will be sufficient to meet our needs. Furthermore, if we fail to maintain certain loan covenants we will no longer have access to the credit line. The credit line has a 2.5 year term and will terminate in November 2006. As a result, we may need to raise additional capital or obtain additional financing.
In recent years, it has been difficult for companies to raise capital due to a variety of factors including the overall poor performance of the stock markets and the economic slowdown in the United States and other countries. Thus, there is no assurance we would be able to raise additional capital if needed. To the extent we do raise additional capital, the ownership position of existing stockholders could be diluted. Similarly, there can be no assurance that additional financing will be available if needed or that it will be available on favorable terms. Under the terms of our
credit facility, we may not create, incur or assume additional indebtedness without the approval of our lender. Our inability to raise additional capital or to obtain additional financing if needed would negatively affect our ability to implement our business strategies and meet our goals. This, in turn, would adversely affect our financial condition and results of operations.
The failure of our suppliers to supply quality materials in sufficient quantities, at a favorable price, and in a timely fashion could adversely affect the results of our operations.
We buy our raw materials from a limited number of suppliers. During fiscal 2005, Carrington Laboratories Incorporated was our largest supplier, accounting for 35% of our total raw material purchases. The loss of Carrington Laboratories Incorporated or other major supplier could adversely affect our business operations. Although we believe that we could establish alternate sources for most of our raw materials, any delay in locating and establishing relationships with other sources could result in product shortages, with a resulting loss of sales and customers. In certain situations we may be required to alter our products or to substitute different materials from alternative sources.
We rely solely on one supplier to process certain raw materials that we use in the product line of our largest customer. The loss of or unexpected interruption in this service would materially adversely affect our results of operations and financial condition.
A shortage of raw materials or an unexpected interruption of supply could also result in higher prices for those materials. Although we may be able to raise our prices in response to significant increases in the cost of raw materials, we may not be able to raise prices sufficiently or quickly enough to offset the negative effects of the cost increases on our results of operations.
There can be no assurance that suppliers will provide the quality raw materials needed by us in the quantities requested or at a price we are willing to pay. Because we do not control the actual production of these raw materials, we are also subject to delays caused by interruption in production of materials based on conditions outside of our control, including weather, transportation interruptions, strikes and natural disasters or other catastrophic events.
Our business is subject to the effects of adverse publicity, which could negatively affect our sales and revenues.
Our business can be affected by adverse publicity or negative public perception about our industry, our competitors, or our business generally. This adverse publicity may include publicity about the nutritional supplements industry generally, the efficacy, safety and quality of nutritional supplements and other health care products or ingredients in general or our products or ingredients specifically, and regulatory investigations, regardless of whether these investigations involve us or the business practices or products of our competitors. There can be no assurance that we will be able to avoid any adverse publicity or negative public perception in the future. Any adverse publicity or negative public perception will likely have a material adverse effect on our business, financial condition and results of operations. Our business, financial condition and results of operations also could be adversely affected if any of our products or any similar products distributed by other companies are alleged to be or are proved to be harmful to consumers or to have unanticipated health consequences.
We could be exposed to product liability claims or other litigation, which may be costly and could materially adversely affect our operations.
We could face financial liability due to product liability claims if the use of our products results in significant loss or injury. Additionally, the manufacture and sale of our products involves the risk of injury to consumers from tampering by unauthorized third parties or product contamination. We could be exposed to future product liability claims that, among others: our products contain contaminants; we provide consumers with inadequate instructions about product use; or we provide inadequate warning about side effects or interactions of our products with other substances.
We maintain product liability insurance coverage, including primary product liability and excess liability coverage. The cost of this coverage has increased dramatically in recent years, while the availability of adequate insurance coverage has decreased. There can be no assurance that product liability insurance will continue to be available at an economically reasonable cost or that our insurance will be adequate to cover any liability we may incur.
Additionally, it is possible that one or more of our insurers could exclude from our coverage certain ingredients used in our products. In such event, we may have to stop using those ingredients or rely on indemnification or similar arrangements with our customers who wish to continue to include those ingredients in their products. A substantial increase in our product liability risk or the loss of customers or product lines could have a material adverse effect on our results of operations and financial condition.
As we continue to expand into markets outside the United States our business becomes increasingly subject to political and economic risks in those markets, which could adversely affect our business.
Our future growth may depend, in part, on our ability to continue to expand into markets outside the United States. There can be no assurance that we will be able to expand our presence in our existing markets outside the United States, enter new markets on a timely basis, or that new markets outside the United States will be profitable. There are significant regulatory and legal barriers in markets outside the United States that we must overcome. We will be subject to the burden of complying with a wide variety of national and local laws, including multiple and possibly overlapping and conflicting laws. We also may experience difficulties adapting to new cultures, business customs and legal systems. Our sales and operations outside the United States are subject to political, economic and social uncertainties including, among others:
Any changes related to these and other factors could adversely affect our business, profitability and growth prospects. As we continue to expand into markets outside the United States, these and other risks associated with operations outside the United States are likely to increase.
Our products and manufacturing activities are subject to extensive government regulation, which could limit or prevent the sale of our products in some markets and could increase our costs.
The manufacturing, packaging, labeling, advertising, promotion, distribution, and sale of our products are subject to regulation by numerous national and local governmental agencies in the United States and in other countries. Failure to comply with governmental regulations may result in, among other things, injunctions, product withdrawals, recalls, product seizures, fines, and criminal prosecutions. Any action of this type by a governmental agency could materially adversely affect our ability to successfully market our products. In addition, if the governmental agency has reason to believe the law is being violated (for example, if it believes we do not possess adequate substantiation for product claims), it can initiate an enforcement action. Governmental agency enforcement could result in orders requiring, among other things, limits on advertising, consumer redress, divestiture of assets, rescission of contracts, and such other relief as may be deemed necessary. Violation of these orders could result in substantial financial or other penalties. Any action by the governmental agency could materially adversely affect our ability and our customers’ ability to successfully market those products.
In markets outside the United States, before commencing operations or marketing our products, we may be required to obtain approvals, licenses, or certifications from a country’s ministry of health or comparable agency. Approvals or licensing may be conditioned on reformulation of products or may be unavailable with respect to certain products or product ingredients. We must also comply with product labeling and packaging regulations that vary from country to country. Furthermore, the regulations of these countries may conflict with those in the United States and with each other. The sale of our products in certain European countries is subject to the rules and regulations of the European Union, which may be interpreted differently among the countries within the Union. The cost of complying with these various and potentially conflicting regulations can be substantial and can adversely affect our results of operations.
We cannot predict the nature of any future laws, regulations, interpretations, or applications, nor can we determine what effect additional governmental regulations, when and if adopted, would have on our business. They could include requirements for the reformulation of certain products to meet new standards, the recall or discontinuance of certain products, additional record keeping, expanded or different labeling, and additional scientific substantiation. Any or all of these requirements could have a material adverse effect on our operations.
If we are unable to attract and retain qualified management personnel, our business will suffer.
Our executive officers and other management personnel are primarily responsible for our day-to-day operations. We believe our success depends largely on our ability to attract, maintain and motivate highly qualified management personnel. Competition for qualified individuals can be intense, and we may not be able to hire additional qualified personnel in a timely manner and on reasonable terms. Our inability to retain a skilled professional management team could adversely affect our ability to successfully execute our business strategies and achieve our goals.
Our manufacturing activity is subject to certain risks.
We currently manufacture the vast majority of our products at our manufacturing facility in California. As a result, we are dependent on the uninterrupted and efficient operation of that facility. Our manufacturing operations are subject to power failures, the breakdown, failure or substandard performance of equipment, the improper installation or operation of equipment, natural or other disasters, and the need to comply with the requirements or directives of governmental agencies, including the FDA. In addition, we may in the future determine to expand or relocate our manufacturing facilities, which may result in slow downs or delays in our manufacturing operations. While we maintain business interruption insurance, there can be no assurance that the occurrence of these or any other operational problems at our facility in California or at NAIE’s facility in Switzerland would not have a material adverse effect on our business, financial condition and results of operations. Furthermore, there can be no assurance that our insurance will continue to be available at a reasonable cost or, if available, will be adequate to cover any losses that we may incur from an interruption in our manufacturing and distribution operations.
We may be unable to protect our intellectual property rights or may inadvertently infringe on the intellectual property rights of others.
We possess and may possess in the future certain proprietary technology, trade secrets, trademarks, tradenames and similar intellectual property. There can be no assurance that we will be able to protect our intellectual property adequately. In addition, the laws of certain foreign countries may not protect our intellectual property rights to the same extent as the laws of the United States. Litigation in the United States or abroad may be necessary to enforce our intellectual property rights, to determine the validity and scope of the proprietary rights of others or to defend against claims of infringement. This litigation, even if successful, could result in substantial costs and diversion of resources and could have a material adverse effect on our business, results of operation and financial condition. If any such claims are asserted against us, we may seek to obtain a license under the third party’s intellectual property rights. There can be no assurance, however, that a license would be available on terms acceptable or favorable to us, if at all.
Collectively, our officers and directors own a significant amount of our common stock, giving them influence over corporate transactions and other matters and potentially limiting the influence of other stockholders on important policy and management issues.
Our officers and directors, together with their families and affiliates, beneficially owned approximately 25% of our outstanding shares of common stock as of June 30, 2005. As a result, our officers and directors could influence such business matters as the election of directors and approval of significant corporate transactions.
Various transactions could be delayed, deferred or prevented without the approval of stockholders, including:
There can be no assurance that conflicts of interest will not arise with respect to the officers and directors who own shares of our common stock or that conflicts will be resolved in a manner favorable to us or our other stockholders.
If our information technology system fails, our operations could suffer.
Our business depends to a large extent on our information technology infrastructure to effectively manage and operate many of our key business functions, including order processing, customer service, product manufacturing and distribution, cash receipts and payments and financial reporting. A long term failure or impairment of any of our information technology systems could adversely affect our ability to conduct day-to-day business.
If certain provisions of our Certificate of Incorporation, Bylaws and Delaware law are triggered, the future price investors might be willing to pay for our common stock could be limited.
Certain provisions in our Certificate of Incorporation, Bylaws and Delaware corporate law help discourage unsolicited proposals to acquire our business, even if the proposal benefits our stockholders. Our Board of Directors is authorized, without stockholder approval, to issue up to 500,000 shares of preferred stock having such rights, preferences, and privileges, including voting rights, as the board designates. The rights of our common stockholders will be subject to, and may be adversely affected by, the rights of holders of any preferred stock that may be issued in the future. Any or all of these provisions could delay, deter or prevent a takeover of our company and could limit the price investors are willing to pay for our common stock.
Our stock price could fluctuate significantly.
Our stock price has been volatile in recent years. The trading price of our stock could fluctuate in response to:
The stock market has historically experienced significant price and volume fluctuations. There can be no assurance that an active market in our stock will continue to exist or that the price of our common stock will not decline. Our future operating results may be below the expectations of securities analysts and investors. If this were to occur, the price of our common stock would likely decline, perhaps substantially.
From time to time our shares may be listed for trading on one or more foreign exchanges, with or without our prior knowledge or consent. Certain foreign exchanges may have less stringent listing requirements, rules and enforcement procedures than the Nasdaq Stock Market or other markets in the United States, which may increase the potential for manipulative trading practices to occur. These practices, or the perception by investors that such practices could occur, may increase the volatility of our stock price or result in a decline in our stock price, which in some cases could be significant.
ITEM 7A. QUANTITATIVE AND QUALITATIVE DISCLOSURES ABOUT MARKET RISK
| ITEM 7A. | QUANTITATIVE AND QUALITATIVE DISCLOSURES ABOUT MARKET RISK |
We are exposed to market risk, which is the potential loss arising from adverse changes in market rates and prices, such as interest and foreign currency exchange rates. We generally do not enter into derivatives or other financial instruments for trading or speculative purposes. We may, however, enter into financial instruments to try to manage and reduce the impact of changes in foreign currency exchange rates. We cannot predict with any certainty our future exposure to fluctuations in interest and foreign currency exchange rates or other market risks or the impact, if any, such fluctuations may have on our future business, product pricing, consolidated financial condition, results of operations or cash flows. The actual impact of any fluctuations in interest or foreign currency exchange rates may differ significantly from those discussed below.
Interest Rates
At June 30, 2005,2007, we had fixed rate debt of $602,000$429,000 and variable rate debt of approximately $3.2$4.2 million. The interest rates on our variable rate debt range from LIBOR plus 1.75% to LIBOR plus 2.25%. As of June 30, 2005,2007, the weighted average effective interest rate on our variable rate debt was 4.50%7.78%. An immediate one hundred basis point (1.0%) increase in the interest rates on our variable rate debt, holding other variables constant, would have increased our interest expense by $48,000$82,000 for the fiscal year ended June 30, 2005.2007. Interest rates have been at or near historic lows in recent years.years but have been increasing during the past year. There can be no guarantee that interest rates will not rise.rise further. Any increase in interest rates may adversely affect our results of operations and financial condition.
Foreign Currencies
To the extent our business continues to expand outside the United States, an increasing share of our net sales and cost of sales will be transacted in currencies other than the United States dollar. Accounting practices require that our non-United States dollar-denominated transactions be converted to United States dollars for reporting purposes. Consequently, our reported net income may be significantly affected by fluctuations in currency exchange rates. When the United States dollar strengthens against currencies in which products are sold or weakens against currencies in which we incur costs, net sales and costs could be adversely affected.
Our main exchange rate exposures are with the Swiss Franc and the Euro against the United States dollar. This is due to NAIE’s operations in Switzerland and the payment in Euros by our largest customer for finished goods. Additionally, we pay our NAIE employees and certain operating expenses in Swiss Francs. We may enter into forward exchange contracts, foreign currency borrowings and option contracts to hedge our foreign currency risk. Our goal in seeking to manage foreign currency risk is to provide reasonable certainty to the functional currency value of foreign currency cash flows and to help stabilize the value of non-United States dollar-denominated earnings.
On May 13, 2005, we purchased seven option contracts designated and effective as cash flow hedges to protect against the foreign currency exchange risk inherent in a portion of our forecasted transactions denominated in Euros. The seven options expire monthly beginning June 2005 and ending December 2005. The option contracts had a notional amount of $4.2 million, a weighted average strike price of $1.19, and a purchase price of $21,000. The risk of loss associated with the options is limited to premium amounts paid for the option contracts. As of June 30, 2005, we had not exercised any of the options and one of the options had expired.
On July 7, 2005, we purchased 12 option contracts designated and effective as cash flow hedges to protect against the foreign currency exchange risk inherent in a portion of our forecasted transactions denominated in Euros. The 12 options were to expire monthly beginning January 2006 and ending December 2006.2006, but we sold the options that had not yet expired as of July 6, 2006 as described below. The option contracts had a notional amount of $7.0 million, a weighted average strike price of $1.16, and a purchase price of $152,000. The risk of loss associated with the options iswas limited to premium amountsthe purchase price paid for the option contracts.
On April 6, 2006, we purchased seven option contracts designated and effective as cash flow hedges to protect against the foreign currency exchange risk inherent in a portion of our forecasted transactions denominated in Euros. The seven options were to expire monthly beginning January 2007 and ending July 2007, but we sold the options in July 2006 as described below. The option contracts had a notional amount of $4.9 million, a weighted average strike price of $1.16, and a purchase price of $62,000. The risk of loss associated with the options was limited to the purchase price paid for the option contracts.
On July 6, 2006, we sold the then unexpired options purchased on July 7, 2005 and April 6, 2006 for $13,000. The proceeds were used to purchase 12 option contracts designated and effective as cash flow hedges to protect against the foreign currency exchange risk inherent in a portion of our forecasted transactions denominated in Euros. The 12 options expire monthly beginning August 2006 and ending July 2007. The option contracts had a notional amount of $8.9 million, a weighted average strike price of $1.24, and a purchase price of $103,000. The risk of loss associated with the options is limited to the purchase price paid for the option contracts. As of June 30, 2007, 11 of the options had expired. As of June 30, 2007, the unrealized losses associated with the options sold on July 6, 2006 were $7,000 and will be recognized in cost of goods sold under the original monthly option contract expiration dates.
On January 18, 2007, we purchased three option contracts designated and effective as cash flow hedges to protect against the foreign currency exchange risk inherent in a portion of our forecasted transactions denominated in Euros. The three options expire monthly beginning August 2007 and ending October 2007. The option contracts had a notional amount of $1.9 million, a weighted average strike price of $1.24, and a purchase price of $12,000. The risk of loss associated with the options is limited to the purchase price paid for the option contracts.
On April 3, 2007, we purchased three option contracts designated and effective as cash flow hedges to protect against the foreign currency exchange risk inherent in a portion of our forecasted transactions denominated in Euros. The three options expire monthly beginning November 2007 and ending January 2008. The option contracts had a notional amount of $1.9 million, a weighted average strike price of $1.29, and a purchase price of $18,000. The risk of loss associated with the options is limited to the purchase price paid for the option contracts.
On June 30, 2005,2007, the Swiss Franc closed at 1.281.23 to 1.00 United States dollar and the Euro closed at 0.830.74 to 1.00 United States dollar. A 10% adverse change to the exchange rates between the Swiss Franc and the Euro against the United States dollar, holding other variables constant, would have decreased our net income for the fiscal year ended June 30, 20052007 by $762,000.$471,000.
ITEM 8. FINANCIAL STATEMENTS AND SUPPLEMENTARY DATA
| ITEM 8. | FINANCIAL STATEMENTS AND SUPPLEMENTARY DATA |
Report of Independent Registered Public Accounting Firm
The Board of Directors and Stockholders
Natural Alternatives International, Inc.
We have audited the accompanying consolidated balance sheets of Natural Alternatives International, Inc. as of June 30, 20052007 and 2004,2006, and the related consolidated statements of incomeoperations and comprehensive income (loss), stockholders’ equity, and cash flows for each of the three years in the period ended June 30, 2005.2007. Our audits also included the financial statement schedule listed in the index at Item 15(2). These financial statements and schedule are the responsibility of the Company’s management. Our responsibility is to express an opinion on these financial statements and schedule based on our audits.
We conducted our audits in accordance with the standards of the Public Company Accounting Oversight Board (United States). Those standards require that we plan and perform the audit to obtain reasonable assurance about whether the financial statements are free of material misstatement. We were not engaged to perform an audit of the Company’s internal control over financial reporting. Our audit included consideration of internal control over financial reporting as a basis for designing audit procedures that are appropriate in the circumstances, but not for the purpose of expressing an opinion on the effectiveness of the Company’s internal control over financial reporting. Accordingly, we express no such opinion. An audit also includes examining, on a test basis, evidence supporting the amounts and disclosures in the financial statements, assessing the accounting principles used and significant estimates made by management, and evaluating the overall financial statement presentation. We believe that our audits provide a reasonable basis for our opinion.
In our opinion, the financial statements referred to above present fairly, in all material respects, the consolidated financial position of Natural Alternatives International, Inc. at June 30, 20052007 and 2004,2006, and the consolidated results of its operations and its cash flows for each of the three years in the period ended June 30, 2005,2007, in conformity with U.S. generally accepted accounting principles. Also, in our opinion, the related financial statement schedule, when considered in relation to the basic financial statements taken as a whole, presents fairly in all material respects the information set forth therein.
/s/ Ernst & Young LLP
San Diego, California
August 5, 2005October 12, 2007
Natural Alternatives International, Inc.
Consolidated Balance Sheets
As of June 30
(Dollars in thousands, except share and per share data)
| 2005 | 2004 | |||||||
Assets | ||||||||
Current assets: | ||||||||
Cash and cash equivalents | $ | 1,916 | $ | 7,495 | ||||
Accounts receivable - less allowance for doubtful accounts of $221 at June 30, 2005 and $132 at June 30, 2004 | 10,834 | 8,889 | ||||||
Inventories, net | 12,987 | 12,863 | ||||||
Deferred income taxes | 421 | 1,010 | ||||||
Other current assets | 1,012 | 633 | ||||||
Total current assets | 27,170 | 30,890 | ||||||
Property and equipment, net | 16,507 | 11,380 | ||||||
Other assets: | ||||||||
Deferred income taxes | 276 | — | ||||||
Other noncurrent assets, net | 185 | 198 | ||||||
Total other assets | 461 | 198 | ||||||
Total assets | $ | 44,138 | $ | 42,468 | ||||
Liabilities and Stockholders’ Equity | ||||||||
Current liabilities: | ||||||||
Accounts payable | $ | 7,973 | $ | 7,567 | ||||
Accrued liabilities | 1,923 | 2,078 | ||||||
Accrued compensation and employee benefits | 1,351 | 2,626 | ||||||
Income taxes payable | 664 | 320 | ||||||
Current portion of long-term debt | 861 | 831 | ||||||
Total current liabilities | 12,772 | 13,422 | ||||||
Long-term debt, less current portion | 2,979 | 3,841 | ||||||
Deferred income taxes | — | 717 | ||||||
Deferred rent | 1,264 | 220 | ||||||
Long-term pension liability | 206 | 140 | ||||||
Total liabilities | 17,221 | 18,340 | ||||||
Commitments and contingencies | ||||||||
Stockholders’ equity: | ||||||||
Preferred stock; $.01 par value; 500,000 shares authorized; none issued or outstanding | — | — | ||||||
Common stock; $.01 par value; 20,000,000 shares authorized at June 30, 2005 and 8,000,000 at June 30, 2004, issued and outstanding 6,064,467 at June 30, 2005 and 5,970,992 at June 30, 2004 | 61 | 60 | ||||||
Additional paid-in capital | 11,494 | 10,864 | ||||||
Accumulated other comprehensive loss | (137 | ) | (96 | ) | ||||
Retained earnings | 15,792 | 13,593 | ||||||
Treasury stock, at cost, 61,000 shares at June 30, 2005 and June 30, 2004 | (293 | ) | (293 | ) | ||||
Total stockholders’ equity | 26,917 | 24,128 | ||||||
Total liabilities and stockholders’ equity | $ | 44,138 | $ | 42,468 | ||||
| 2007 | 2006 | |||||||
Assets | ||||||||
Current assets: | ||||||||
Cash and cash equivalents | $ | 4,876 | $ | 2,157 | ||||
Accounts receivable - less allowance for doubtful accounts of $20 at June 30, 2007 and $217 June 30, 2006 | 5,264 | 12,839 | ||||||
Inventories, net | 14,099 | 17,054 | ||||||
Deferred income taxes | 1,441 | 1,059 | ||||||
Other current assets | 2,204 | 1,916 | ||||||
Total current assets | 27,884 | 35,025 | ||||||
Property and equipment, net | 15,059 | 15,943 | ||||||
Goodwill and purchased intangibles, net | 4,268 | 11,303 | ||||||
Other noncurrent assets, net | 169 | 182 | ||||||
Total assets | $ | 47,380 | $ | 62,453 | ||||
Liabilities and Stockholders’ Equity | ||||||||
Current liabilities: | ||||||||
Accounts payable | $ | 6,330 | $ | 5,221 | ||||
Accrued liabilities | 1,840 | 2,265 | ||||||
Accrued compensation and employee benefits | 1,403 | 1,964 | ||||||
Line of credit | — | 9,574 | ||||||
Income taxes payable | 270 | 1,063 | ||||||
Current portion of long-term debt | 1,825 | 1,766 | ||||||
Total current liabilities | 11,668 | 21,853 | ||||||
Long-term debt, less current portion | 2,756 | 4,596 | ||||||
Deferred income taxes | 1,620 | 1,260 | ||||||
Deferred rent | 1,238 | 1,262 | ||||||
Long-term pension liability | 76 | 191 | ||||||
Total liabilities | 17,358 | 29,162 | ||||||
Commitments and contingencies | ||||||||
Stockholders’ equity: | ||||||||
Preferred stock; $.01 par value; 500,000 shares authorized; none issued or outstanding | — | — | ||||||
Common stock; $.01 par value; 20,000,000 shares authorized at June 30, 2007 and June 30, 2006, issued and outstanding 7,001,230 at June 30, 2007 and 6,685,546 at June 30, 2006 | 69 | 67 | ||||||
Additional paid-in capital | 17,335 | 15,331 | ||||||
Accumulated other comprehensive loss | (184 | ) | (276 | ) | ||||
Retained earnings | 13,177 | 18,462 | ||||||
Treasury stock, at cost, 70,000 shares at June 30, 2007 and 61,000 shares at June 30, 2006 | (375 | ) | (293 | ) | ||||
Total stockholders’ equity | 30,022 | 33,291 | ||||||
Total liabilities and stockholders’ equity | $ | 47,380 | $ | 62,453 | ||||
See accompanying notes to consolidated financial statements.
Natural Alternatives International, Inc.
Consolidated Statements Of IncomeOperations And Comprehensive Income (Loss)
For the Years Ended June 30
(Dollars in thousands, except share and per share data)
| 2005 | 2004 | 2003 | ||||||||||
Net sales | $ | 91,492 | $ | 78,534 | $ | 55,962 | ||||||
Cost of goods sold | 73,095 | 59,964 | 42,781 | |||||||||
Gross profit | 18,397 | 18,570 | 13,181 | |||||||||
Selling, general & administrative expenses | 14,605 | 15,188 | 12,012 | |||||||||
Income from operations | 3,792 | 3,382 | 1,169 | |||||||||
Other income (expense): | ||||||||||||
Interest income | 21 | 24 | 57 | |||||||||
Interest expense | (280 | ) | (274 | ) | (252 | ) | ||||||
Foreign exchange gain (loss) | (137 | ) | 57 | 12 | ||||||||
Proceeds from vitamin antitrust litigation | — | — | 225 | |||||||||
Other, net | 13 | (165 | ) | (59 | ) | |||||||
| (383 | ) | (358 | ) | (17 | ) | |||||||
Income before income taxes | 3,409 | 3,024 | 1,152 | |||||||||
Provision for income taxes | 1,210 | 24 | 47 | |||||||||
Net income | $ | 2,199 | $ | 3,000 | $ | 1,105 | ||||||
Unrealized gain resulting from change in fair value of derivative instruments, net of tax | 8 | — | — | |||||||||
Additional minimum pension liability, net of tax | (49 | ) | (96 | ) | — | |||||||
Comprehensive income | $ | 2,158 | $ | 2,904 | $ | 1,105 | ||||||
Net income per common share: | ||||||||||||
Basic | $ | 0.37 | $ | 0.51 | $ | 0.19 | ||||||
Diluted | $ | 0.34 | $ | 0.48 | $ | 0.18 | ||||||
Weighted average common shares outstanding: | ||||||||||||
Basic shares | 5,949,212 | 5,843,241 | 5,809,140 | |||||||||
Diluted shares | 6,464,714 | 6,304,167 | 6,021,155 | |||||||||
| 2007 | 2006 | 2005 | ||||||||||
Net sales | $ | 97,128 | $ | 99,612 | $ | 91,972 | ||||||
Cost of goods sold | 75,842 | 78,364 | 74,317 | |||||||||
Gross profit | 21,286 | 21,248 | 17,655 | |||||||||
Selling, general & administrative expenses | 18,968 | 16,630 | 13,863 | |||||||||
Non-cash goodwill impairment charge | 7,037 | – | – | |||||||||
Income (loss) from operations | (4,719 | ) | 4,618 | 3,792 | ||||||||
Other income (expense): | ||||||||||||
Interest income | 11 | 28 | 21 | |||||||||
Interest expense | (660 | ) | (565 | ) | (280 | ) | ||||||
Foreign exchange gain (loss) | 77 | 41 | (137 | ) | ||||||||
Other, net | 125 | (11 | ) | 13 | ||||||||
| (447 | ) | (507 | ) | (383 | ) | |||||||
Income (loss) before income taxes | (5,166 | ) | 4,111 | 3,409 | ||||||||
Provision for income taxes | 119 | 1,441 | 1,210 | |||||||||
Net income (loss) | $ | (5,285 | ) | $ | 2,670 | $ | 2,199 | |||||
Unrealized gain (loss) resulting from change in fair value of derivative instruments, net of tax | 54 | (89 | ) | 8 | ||||||||
Change in minimum pension liability, net of tax | 38 | (50 | ) | (49 | ) | |||||||
Comprehensive income (loss) | $ | (5,193 | ) | $ | 2,531 | $ | 2,158 | |||||
Net income (loss) per common share: | ||||||||||||
Basic | $ | (0.77 | ) | $ | 0.42 | $ | 0.37 | |||||
Diluted | $ | (0.77 | ) | $ | 0.39 | $ | 0.34 | |||||
Weighted average common shares outstanding: | ||||||||||||
Basic | 6,836,018 | 6,340,110 | 5,949,212 | |||||||||
Diluted | 6,836,018 | 6,775,661 | 6,464,714 | |||||||||
See accompanying notes to consolidated financial statements.
Natural Alternatives International, Inc.
Consolidated Statements Of Stockholders’ Equity
For the Years Ended June 30
(Dollars in thousands)
| Common Stock | Additional Capital | Retained Earnings | Treasury Stock | Accumulated Comprehensive (Loss) | Total | |||||||||||||||||||||
| Shares | Amount | |||||||||||||||||||||||||
Balance, June 30, 2002 | 6,073,179 | $ | 61 | $ | 11,362 | $ | 9,488 | $ | (1,303 | ) | $ | — | $ | 19,608 | ||||||||||||
Issuance of common stock for employee stock purchase plan and stock option exercises | 14,353 | — | 33 | — | — | — | 33 | |||||||||||||||||||
Compensation expense related to stock options | — | — | 31 | — | — | — | 31 | |||||||||||||||||||
Net income | — | — | — | 1,105 | — | — | 1,105 | |||||||||||||||||||
Balance, June 30, 2003 | 6,087,532 | 61 | 11,426 | 10,593 | (1,303 | ) | — | 20,777 | ||||||||||||||||||
Issuance of common stock for employee stock purchase plan and stock option exercises | 94,860 | 1 | 327 | — | — | — | 328 | |||||||||||||||||||
Cancellation of treasury stock | (211,400 | ) | (2 | ) | (1,008 | ) | — | 1,010 | — | — | ||||||||||||||||
Compensation expense related to stock options | — | — | 119 | — | — | — | 119 | |||||||||||||||||||
Additional minimum pension liability, net of tax | — | — | — | — | — | (96 | ) | (96 | ) | |||||||||||||||||
Net income | — | — | — | 3,000 | — | — | 3,000 | |||||||||||||||||||
Balance, June 30, 2004 | 5,970,992 | 60 | 10,864 | 13,593 | (293 | ) | (96 | ) | 24,128 | |||||||||||||||||
Issuance of common stock for employee stock purchase plan and stock option exercises | 93,475 | 1 | 427 | — | — | — | 428 | |||||||||||||||||||
Compensation expense related to stock options | — | — | 72 | — | — | — | 72 | |||||||||||||||||||
Compensation expense related to the acceleration of stock options | — | — | 131 | — | — | — | 131 | |||||||||||||||||||
Unrealized gain resulting from change in fair value of derivative instruments, net of tax | — | — | — | — | — | 8 | 8 | |||||||||||||||||||
Additional minimum pension liability, net of tax | — | — | — | — | — | (49 | ) | (49 | ) | |||||||||||||||||
Net income | — | — | — | 2,199 | — | — | 2,199 | |||||||||||||||||||
Balance, June 30, 2005 | 6,064,467 | $ | 61 | $ | 11,494 | $ | 15,792 | $ | (293 | ) | $ | (137 | ) | $ | 26,917 | |||||||||||
| Common Stock | Additional Capital | Retained Earnings | Treasury Stock | Accumulated Other Comprehensive Loss | Total | |||||||||||||||||||
| Shares | Amount | |||||||||||||||||||||||
Balance, June 30, 2004 | 5,970,992 | $ | 60 | $ | 10,864 | $ | 13,593 | $ | (293 | ) | $ | (96 | ) | $ | 24,128 | |||||||||
Issuance of common stock for employee stock purchase plan and stock option exercises | 93,475 | 1 | 427 | — | — | — | 428 | |||||||||||||||||
Compensation expense related to stock options | — | — | 72 | — | — | — | 72 | |||||||||||||||||
Compensation expense related to the acceleration of stock options | — | — | 131 | — | — | — | 131 | |||||||||||||||||
Unrealized gain resulting from change in fair value of derivative instruments, net of tax | — | — | — | — | — | 8 | 8 | |||||||||||||||||
Change in minimum pension liability, net of tax | — | — | — | — | — | (49 | ) | (49 | ) | |||||||||||||||
Net income | — | — | — | 2,199 | — | — | 2,199 | |||||||||||||||||
Balance, June 30, 2005 | 6,064,467 | 61 | 11,494 | 15,792 | (293 | ) | (137 | ) | 26,917 | |||||||||||||||
Issuance of common stock for employee stock purchase plan and stock option exercises | 111,079 | 1 | 462 | — | — | — | 463 | |||||||||||||||||
Issuance of common stock related to business acquisition | 510,000 | 5 | 3,250 | — | — | — | 3,255 | |||||||||||||||||
Compensation expense related to stock options and employee stock purchase plan | — | — | 88 | — | — | — | 88 | |||||||||||||||||
Compensation expense related to the acceleration of stock options | — | — | 37 | — | — | — | 37 | |||||||||||||||||
Unrealized loss resulting from change in fair value of derivative instruments, net of tax | — | — | — | — | — | (89 | ) | (89 | ) | |||||||||||||||
Change in minimum pension liability, net of tax | — | — | — | — | — | (50 | ) | (50 | ) | |||||||||||||||
Net income | — | — | — | 2,670 | — | — | 2,670 | |||||||||||||||||
Balance, June 30, 2006 | 6,685,546 | 67 | 15,331 | 18,462 | (293 | ) | (276 | ) | 33,291 | |||||||||||||||
Issuance of common stock for employee stock purchase plan and stock option exercises | 315,684 | 2 | 1,083 | — | — | — | 1,085 | |||||||||||||||||
Compensation expense related to stock options and employee stock purchase plan | — | — | 249 | — | — | — | 249 | |||||||||||||||||
Repurchase of common stock | — | — | — | — | (82 | ) | — | (82 | ) | |||||||||||||||
Tax benefit from exercise of stock options | — | — | 672 | — | — | — | 672 | |||||||||||||||||
Unrealized loss resulting from change in fair value of derivative instruments, net of tax | — | — | — | — | — | 54 | 54 | |||||||||||||||||
Change in minimum pension liability, net of tax | — | — | — | — | — | 38 | 38 | |||||||||||||||||
Net loss | — | — | — | (5,285 | ) | — | — | (5,285 | ) | |||||||||||||||
Balance, June 30, 2007 | 7,001,230 | $ | 69 | $ | 17,335 | $ | 13,177 | $ | (375 | ) | $ | (184 | ) | $ | 30,022 | |||||||||
See accompanying notes to consolidated financial statements.
Natural Alternatives International, Inc.
Consolidated Statements Of Cash Flows
For the Years Ended June 30
(Dollars in thousands)
| 2005 | 2004 | 2003 | ||||||||||
Cash flows from operating activities | ||||||||||||
Net income | $ | 2,199 | $ | 3,000 | $ | 1,105 | ||||||
Adjustments to reconcile net income to net cash provided by operating activities: | ||||||||||||
Provision for uncollectible accounts receivable | 89 | 105 | (46 | ) | ||||||||
Depreciation and amortization | 2,559 | 2,676 | 2,477 | |||||||||
Deferred income taxes | (404 | ) | (293 | ) | — | |||||||
Non-cash compensation | 203 | 119 | 31 | |||||||||
Pension benefit (expense), net of contributions | 17 | (77 | ) | (78 | ) | |||||||
Loss on disposal of assets | 20 | 86 | 10 | |||||||||
Changes in operating assets and liabilities: | ||||||||||||
Accounts receivable | (2,034 | ) | (3,326 | ) | (2,086 | ) | ||||||
Inventories | (124 | ) | (5,018 | ) | 26 | |||||||
Tax refund receivable | — | — | 701 | |||||||||
Other assets | (427 | ) | 71 | (175 | ) | |||||||
Accounts payable and accrued liabilities | 1,351 | 3,758 | 1,180 | |||||||||
Income taxes payable | 344 | 274 | (85 | ) | ||||||||
Accrued compensation and employee benefits | (1,275 | ) | 1,909 | 235 | ||||||||
Net cash provided by operating activities | 2,518 | 3,284 | 3,295 | |||||||||
Cash flows from investing activities | ||||||||||||
Proceeds from sale of property and equipment | — | — | 109 | |||||||||
Capital expenditures | (7,706 | ) | (3,322 | ) | (977 | ) | ||||||
Repayment of notes receivable | 13 | 7 | 89 | |||||||||
Net cash used in investing activities | (7,693 | ) | (3,315 | ) | (779 | ) | ||||||
Cash flows from financing activities | ||||||||||||
Borrowings on long-term debt | — | 4,055 | 2,500 | |||||||||
Payments on long-term debt | (832 | ) | (2,339 | ) | (1,707 | ) | ||||||
Increase in restricted cash | — | — | 1,500 | |||||||||
Issuance of common stock | 428 | 328 | 33 | |||||||||
Net cash provided by (used in) financing activities | (404 | ) | 2,044 | 2,326 | ||||||||
Net increase (decrease) in cash and cash equivalents | (5,579 | ) | 2,013 | 4,842 | ||||||||
Cash and cash equivalents at beginning of year | 7,495 | 5,482 | 640 | |||||||||
Cash and cash equivalents at end of year | $ | 1,916 | $ | 7,495 | $ | 5,482 | ||||||
Supplemental disclosures of cash flow information | ||||||||||||
Cash paid during the year for: | ||||||||||||
Taxes | $ | 1,075 | $ | 44 | $ | — | ||||||
Interest | $ | 280 | $ | 243 | $ | 252 | ||||||
Disclosure of non-cash activities: | ||||||||||||
Treasury stock cancelled | $ | — | $ | 1,010 | $ | — | ||||||
Net unrealized gains resulting from change in fair value of derivative instruments | $ | 8 | $ | — | $ | — | ||||||
Additional minimum pension liability | $ | 49 | $ | 96 | $ | — | ||||||
| 2007 | 2006 | 2005 | ||||||||||
Cash flows from operating activities | ||||||||||||
Net income (loss) | $ | (5,285 | ) | $ | 2,670 | $ | 2,199 | |||||
Adjustments to reconcile net income (loss) to net cash provided by (used in) operating activities: | ||||||||||||
Provision (reduction) for uncollectible accounts receivable | (199 | ) | (34 | ) | 89 | |||||||
Depreciation and amortization | 3,330 | 2,990 | 2,559 | |||||||||
Amortization of purchased intangibles | 252 | 148 | – | |||||||||
Non-cash equipment impairment charge | 201 | – | – | |||||||||
Non-cash goodwill impairment charge | 7,037 | – | – | |||||||||
Tax benefit from exercise of stock options | (672 | ) | – | – | ||||||||
Deferred income taxes | 169 | (530 | ) | (404 | ) | |||||||
Non-cash compensation | 249 | 125 | 203 | |||||||||
Pension benefit (expense), net of contributions | (78 | ) | (98 | ) | 17 | |||||||
Loss on disposal of assets | 12 | – | 20 | |||||||||
Changes in operating assets and liabilities (net of effects of business acquisition): | ||||||||||||
Accounts receivable | 7,774 | (2,264 | ) | (2,034 | ) | |||||||
Inventories | 2,955 | (3,279 | ) | (124 | ) | |||||||
Other assets | (94 | ) | (569 | ) | (427 | ) | ||||||
Accounts payable and accrued liabilities | 215 | (3,901 | ) | 1,351 | ||||||||
Income taxes payable | (247 | ) | 399 | 344 | ||||||||
Accrued compensation and employee benefits | (561 | ) | 527 | (1,275 | ) | |||||||
Net cash provided by (used in) operating activities | 15,058 | (3,816 | ) | 2,518 | ||||||||
Cash flows from investing activities | ||||||||||||
Capital expenditures | (2,729 | ) | (2,295 | ) | (7,706 | ) | ||||||
Proceeds from sale of property & equipment | 70 | – | – | |||||||||
Net cash paid for business acquisition | – | (5,617 | ) | – | ||||||||
Repayment of notes receivable | – | – | 13 | |||||||||
Net cash used in investing activities | (2,659 | ) | (7,912 | ) | (7,693 | ) | ||||||
Cash flows from financing activities | ||||||||||||
Borrowings on long-term debt | – | 3,800 | – | |||||||||
Payments on long-term debt | (1,781 | ) | (1,868 | ) | (832 | ) | ||||||
Net borrowings (payments) on line of credit | (9,574 | ) | 9,574 | – | ||||||||
Issuance of common stock | 1,085 | 463 | 428 | |||||||||
Repurchase of common stock | (82 | ) | – | – | ||||||||
Tax benefit from exercise of stock options | 672 | – | – | |||||||||
Net cash provided by (used in) financing activities | (9,680 | ) | 11,969 | (404 | ) | |||||||
Net increase (decrease) in cash and cash equivalents | 2,719 | 241 | (5,579 | ) | ||||||||
Cash and cash equivalents at beginning of year | 2,157 | 1,916 | 7,495 | |||||||||
Cash and cash equivalents at end of year | $ | 4,876 | $ | 2,157 | $ | 1,916 | ||||||
Supplemental disclosures of cash flow information | ||||||||||||
Cash paid during the year for: | ||||||||||||
Taxes | $ | 698 | $ | 1,558 | $ | 1,075 | ||||||
Interest | $ | 668 | $ | 536 | $ | 280 | ||||||
Disclosure of non-cash activities: | ||||||||||||
Net unrealized gains (losses) resulting from change in fair value of derivative instruments | $ | 54 | $ | (89 | ) | $ | 8 | |||||
Change in minimum pension liability, net of tax | $ | 38 | $ | 50 | $ | 49 | ||||||
See accompanying notes to consolidated financial statements.
NOTES TO CONSOLIDATED FINANCIAL STATEMENTS
A. Organization and Summary of Significant Accounting Policies
Organization
We provide private label contract manufacturing services to companies that market and distribute vitamins, minerals, herbs, and other nutritional supplements, as well as other health care products, to consumers both within and outside the United States. We also develop, manufacture and market our own products. We operate in a single segment, nutritional supplements.
International SubsidiarySubsidiaries
On January 22, 1999, NAIENatural Alternatives International Europe S.A. (NAIE) was formed as our wholly-ownedwholly owned subsidiary, based in Manno, Switzerland, which is adjacent to the city of Lugano.Switzerland. In September 1999, NAIE opened its manufacturing facility to provide manufacturing capability in encapsulation and tablets, finished goods packaging, quality control laboratory testing, warehousing, distribution and administration. Upon formation, NAIE obtained from the Swiss tax authorities a five-year Swiss federal and cantonal income tax holiday that ended June 30, 2005.
On December 5, 2005, we acquired Real Health Laboratories, Inc. (RHL), which primarily markets branded nutritional supplements and other lifestyle products. RHL’s operations include in-house creative, catalog design, supply chain management and call center and fulfillment activities.
Principles of Consolidation
The consolidated financial statements include the accounts of NAINatural Alternatives International, Inc. (NAI) and our wholly-owned subsidiary, NAIE.wholly owned subsidiaries, NAIE and RHL. All significant intercompany accounts and transactions have been eliminated. The functional currency of NAIE, our foreign subsidiary, is the United States dollar. The financial statements of NAIE have been translated at either current or historical exchange rates, as appropriate, with gains and losses included in the consolidated statements of income.operations.
Reclassifications
Certain reclassications to prior period information have been made to conform to current presentation. For the fiscal year ended June 30, 2007, we recorded $642,000 of shipping costs for our private label contract manufacturing sales in cost of goods sold on the Statements Of Operations And Comprehensive Income (Loss) in accordance with the Financial Accounting Standards Board Emerging Issue Task Force No. 00-10, “Accounting for Shipping and Handling Fees and Costs.” Private label contract manufacturing shipping costs of $481,000 for the fiscal year ended June 30, 2006 and $480,000 for the fiscal year ended June 30, 2005, were reclassified from net sales to cost of goods sold to conform to current year presentation.
For the fiscal year ended June 30, 2007, we recorded $1.4 million of shipping costs for our branded products sales in cost of goods sold on the Statement Of Operations And Comprehensive Income (Loss). Branded products shipping costs of $1.1 million for the fiscal year ended June 30, 2006 and $742,000 for the fiscal year ended June 30, 2005, were reclassified from selling, general and administrative expenses to cost of goods sold to conform to current year presentation.
For the three fiscal years ended June 30, 2007, all costs incurred on the shipment of product to customers were included in costs of goods sold. Shipping and handling costs for the last three fiscal years ended June 30 were $2.0 million for 2007, $2.0 million for 2006 and $1.4 million for 2005.
Recent Accounting Pronouncements
In July 2006, the Financial Accounting Standards Board (FASB) issued FASB Interpretation No. 48 (FIN 48), “Accounting for Uncertainty in Income Taxes.” FIN 48 prescribes detailed guidance for the financial statement recognition, measurement and disclosure of uncertain tax positions recognized in an enterprise’s financial statements in accordance with FASB Statement No. 109, “Accounting for Income Taxes.” Tax positions must meet a more-likely-than-not recognition threshold at the effective date to be recognized upon the adoption of FIN 48 and in
subsequent periods. FIN 48 is be effective for our fiscal year beginning July 1, 2007 and the provisions of FIN 48 will be applied to all tax positions upon initial adoption of the interpretation. The cumulative effect of applying the provisions of this interpretation will be reported as an adjustment to the opening balance of retained earnings for that fiscal year. We have evaluated the provisions of FIN 48 and do not expect that the adoption will have a material impact on our consolidated financial position or results of operations.
In September 2006, the FASB issued Statement of Financial Accounting Standards No. 157, “Fair Value Measurements” (SFAS 157). SFAS 157 defines fair value, establishes a framework for measuring fair value in generally accepted accounting principles, and expands disclosures about fair value measurements. The provisions of SFAS 157 are effective for our fiscal year beginning July 1, 2008. We are currently evaluating the impact of SFAS 157.
In February 2007, the FASB issued Statement of Financial Accounting Standards No. 159, “The Fair Value Option for Financial Assets and Financial Liabilities” (SFAS 159). SFAS 159 allows measurement of specified financial instruments, warranty and insurance contracts at fair value on a contract by contract basis, with changes in fair value recognized in earnings in each period. The provisions of SFAS 159 are effective for our fiscal year beginning July 1, 2009. We are currently evaluating the impact of SFAS 159.
Cash and Cash Equivalents
We consider all highly liquid investments with a maturity of three months or less when purchased to be cash equivalents.
Inventories
Our inventories are recorded at the lower of cost (first-in, first-out) or market (net realizable value). Such costs include raw materials, labor and manufacturing overhead.
Property and Equipment
We state property and equipment at cost. Depreciation of property and equipment is provided using the straight-line method over their estimated useful lives, generally ranging from 1 to 39 years. We amortize leasehold improvements using the straight-line method over the shorter of the life of the improvement or the term of the lease. Maintenance and repairs are expensed as incurred. Significant expenditures that increase economic useful lives are capitalized.
Impairment of Long-Lived Assets
Long-lived assets and certain identifiable intangibles are reviewed for impairment whenever events or changes in circumstances indicate that the carrying amount of an asset may not be recoverable. Recoverability of assets to be held and used is measured by a comparison of the carrying amount of an asset to future net cash flows expected to be generated by the asset. If such assets are considered to be impaired, the impairment to be recognized is measured by the amount by which the carrying amount of the assets exceeds the fair value of the assets. We report assets to be disposed of at the lower of the carrying amount or fair value less costs to sell.
Goodwill and Other Intangible Assets
Under SFAS 142, goodwill and other intangible assets with indefinite useful lives are not amortized, but are reviewed annually for impairment or more frequently if impairment indicators arise. Separable intangible assets that have finite lives are amortized over their useful lives. Under SFAS 142, goodwill and other intangible assets with indefinite useful lives resulting from acquisitions are not amortized.
Statement of Financial Accounting Standards No.144, “Accounting for the Impairment or Disposal of Long-Lived Assets” (SFAS 144) addresses financial accounting and reporting for the impairment of long-lived assets (excluding goodwill) and for long-lived assets to be disposed of. However, SFAS 144 retains the fundamental provisions of Statement of Financial Accounting Standards No. 121, “Accounting for the Impairment of Long-Lived Assets and for Long-Lived Assets to Be Disposed Of” for recognition and measurement of the impairment of long-lived assets to be held and used.
Revenue Recognition
We recognize revenue in accordance with SECthe SEC’s Staff Accounting Bulletin No. 101,104, “Revenue Recognition in Financial Statements” (SAB 101)(SAB104), Statement of Financial Accounting Standards No. 48, “Revenue Recognition When Right of Return Exists” (SFAS 48) and Emerging Issues Task Force Abstract (EITF) No. 01-09, “Accounting for Consideration Given by a Vendor to a Customer (Including a Reseller of the Vendor’s Products)” (EITF 01-09). SAB 101104 requires that four basic criteria be met before revenue can be recognized: 1) there is evidence that an arrangement exists; 2) delivery has occurred; 3) the fee is fixed or determinable; and 4) collectibility is reasonably assured. SFAS 48 states that revenue from sales transactions where the buyer has the right to return the product shall be recognized at the time of sale only if (1) the seller’s price to the buyer is substantially fixed or determinable at the date of sale; (2) the buyer has paid the seller, or the buyer is obligated to pay the seller and the obligation is not contingent on resale of the product; (3) the buyer’s obligation to the seller would not be changed in the event of theft or physical destruction or damage of the product; (4) the buyer acquiring the product for resale has economic substance apart from that provided by the seller; (5) the seller does not have significant obligations for future performance to directly bring about resale of the product by the buyer; and (6) the amount of future returns can be reasonably estimated. We recognize revenue upon determination that all criteria for revenue recognition have been met. The criteria are usually met at the time title passes to the customer, which usually occurs upon shipment. Revenue from shipments where title passes upon delivery is deferred until the shipment has been delivered.
We account for RHL payments made to customers in accordance with EITF 01-09, which states that cash consideration (including a sales incentive) given by a vendor to a customer is presumed to be a reduction of the selling prices of the vendor’s products or services and, therefore, should be characterized as a reduction of revenue when recognized in the vendor’s income statement, rather than a sales and marketing expense. RHL has various agreements with customers that provide for discounts and rebates. These agreements are classified as a reduction of revenue. Certain other costs associated with customers that meet the requirements of EITF 01-09 are recorded as sales and marketing expense. Vendor considerations recorded as a reduction of sales were $235,000 for the year ended June 30, 2007 and $148,000 for the year ended June 30, 2006.
Additionally,RHL warrants its products for full satisfaction, generally from 30 to 120 days. Our policy requires us to replace the product or refund the purchase price to the customer. At the time product revenue is recognized, we record an allowance for anticipated returns with an offsetting decrease to revenue based on historical experience. We periodically assess the adequacy of our liability and adjust the balance as necessary.
We record reductions to gross revenue for estimated returns of private label contract manufacturing products and direct-to-consumerbranded products. The estimated returns are based upon the trailing six months of private label contract manufacturing gross sales and our historical experience for both private label contract manufacturing and direct-to-consumerbranded product returns.
However, the estimate for product returns does not reflect the impact of a large product recall resulting from product nonconformance or other factors as such events are not predictable nor is the related economic impact estimable.
Cost of Goods Sold
Cost of goods sold includes raw material, labor and manufacturing overhead.
Shipping and Handling Costs
In accordance with EITF No. 00-10, “Accounting for Shipping and Handling Fees and Costs,” we include fees earned on the shipment of our products to customers in sales and include costs incurred on the shipment of product to customers in costs of goods sold.
Research and Development Costs
As part of the services we provide to our private label contract manufacturing customers, we may perform, but are not obligated to perform, certain research and development activities related to the development or improvement of their products. While our customers typically do not pay directly for this service, the cost of this service is included as a component of the price we charge to manufacture and deliver their products.
Research and development costs are expensed when incurred. Our research and development expenses for the last three fiscal years ended June 30 were $1.9 million for 2007, $1.7 million for 2006 and $3.5 million for 2005, $2.8 million for 2004 and $1.7 million for 2003.
2005.
Advertising Costs
We expense the production costs of advertising the first time the advertising takes place, except for direct-response advertising for RHL branded products and the As We Change® catalog, which is capitalized and amortized over its expected period of future benefits. These direct-response advertising costs as incurred.consist primarily of catalogs. The capitalized costs of the advertising are amortized over the projected life of the catalog following its publication, typically six months. We incurred and expensed advertising costs in the amount of $865,000$5.4 million during the fiscal year ended June 30, 2005, $1.32007, $3.6 million during fiscal 20042006 and $1.5 million$865,000 during fiscal 2003.2005. These costs arewere included in selling, general and administrative expenses in the accompanying statements of income.operations.
We included advertising costs of $665,000 at June 30, 2007 and $630,000 at June 30, 2006 in other current assets in the accompanying balance sheets.
Income Taxes
We account for income taxes using the asset and liability method. Under this method, deferred tax assets and liabilities are recognized for the future tax consequences attributable to differences between the financial statement carrying amounts of existing assets and liabilities and their respective tax bases and operating loss and tax credit carryforwards. Deferred tax assets and liabilities are measured using enacted tax rates, for each of the jurisdictions in which we operate, expected to apply to taxable income in the years in which those temporary differences are expected to be recovered or settled. The effect on deferred tax assets and liabilities of a change in tax rates is recognized in operations in the period that includes the enactment date.
We do not record U.S. income tax expense for NAIE’s retained earnings that are declared as indefinitely reinvested offshore, thus reducing our overall income tax expense. The amount of earnings designated as indefinitely reinvested in NAIE is based upon the actual deployment of such earnings in NAIE’s assets and our expectations of the future cash needs of our U.S. and foreign entities. Income tax laws are also a factor in determining the amount of foreign earnings to be indefinitely reinvested offshore.
It is our policy to establish reserves based uponon management’s assessment of exposure for certain positions taken in previously filed tax returns that may become payable upon audit by tax authorities. The tax reserves are analyzed at least annually, generally in the fourth quarter of each year, and adjustments are made as events occur whichthat warrant adjustments to the reserve.
Stock-Based Compensation
We have an equity incentive plansplan under which we have granted nonqualified and incentive stock options to employees, non-employee directors and consultants. We also have an employee stock purchase plan. We accountBefore July 1, 2005, we accounted for stock-based awards to employees, including shares issued pursuant to the employee stock purchase plan, in accordance withunder the recognition and measurement provisions of Accounting Principles Board Opinion No. 25, “Accounting for Stock Issued to Employees” (APB 25), and related interpretations. We haveinterpretations, as permitted by Statement of Financial Accounting Standard No. 123, “Accounting for Stock-Based Compensation” (SFAS 123).
Effective July 1, 2005, we adopted the disclosure-only alternativefair value recognition provisions of Statement of Financial Accounting Standards No. 123, “Accounting123R, “Share Based Payment” (SFAS 123R), using the modified-prospective-transition method. Under that transition method, compensation cost is recognized (a) for Stock-Based Compensation” (SFAS 123), as amended by SFAS No. 148, “Accounting for Stock-Based Compensation –Transition and Disclosure” (SFAS 148).
Pro forma information regarding net income and net income per common share is required and has been determined as if we had accounted for ourall stock-based awards undergranted before, but not yet vested as of, July 1, 2005, based on the grant date fair value method, insteadestimated in accordance with the original provisions of SFAS 123, and (b) for all stock-based awards granted after July 1, 2005, based on the guidelines provided by APB 25. grant-date fair value estimated in accordance with the provisions of SFAS 123R. Results for periods prior to implementation have not been restated.
We estimated the fair value of the stock option awards at the date of grant and employee stock purchase plan shares at the beginning of the offering period using the Black-Scholes option valuation model. The Black-Scholes option valuation model was developed for use in estimating the fair value of traded options that have no vesting restrictions and are fully transferable. Option valuation models require the input of highly subjective assumptions.
Black-Scholes uses assumptions includingrelated to volatility, the risk-free interest rate, the dividend yield (which is assumed to be zero, as we have not paid any cash dividends) and employee exercise behavior. Expected volatilities used in the model are based mainly on the historical volatility of our stock price and other factors. The risk-free interest rate is derived from the U.S. Treasury yield curve in effect in the period of grant. The expected life and stock price volatility. Because our options have characteristics significantly differentof the fiscal 2007 grants is derived from those of traded options, and because changes in the subjective input assumptions can materially affecthistorical experience.
The per share fair value estimates,of options granted in connection with stock option plans and rights granted in connection with the opinionemployee stock purchase plan reported below has been estimated at the date of management, the existing models do not necessarily provide a reliable single measuregrant or beginning of the offering period, as applicable, with the following weighted average assumptions:
| Employee Stock Options | Employee Stock Purchase Plans | |||||||||||||||||||||||
| Fiscal Years Ended June 30, | Fiscal Years Ended June 30, | |||||||||||||||||||||||
| 2007 | 2006 | 2005 | 2007 | 2006 | 2005 | |||||||||||||||||||
Expected life (years) | 4.0 – 5.0 | 4.0 – 5.0 | 4.0 – 8.0 | 0.5 | 0.5 | 0.5 | ||||||||||||||||||
Risk-free interest rate | 4.4 – 4.9 | % | 4.4 – 4.9 | % | 3.4 – 3.8 | % | 4.8 | % | 3.9 | % | 2.0 | % | ||||||||||||
Volatility | 40 | % | 47 | % | 54 | % | 33 | % | 51 | % | 54 | % | ||||||||||||
Dividend yield | 0 | % | 0 | % | 0 | % | 0 | % | 0 | % | 0 | % | ||||||||||||
Weighted average fair value | $ | 2.75 | $ | 2.76 | $ | 3.82 | $ | 0.75 | $ | 1.11 | $ | 2.36 | ||||||||||||
For purposes of these disclosures, we have amortized the estimated fair value of our stock option awards.awards to expense over the options’ vesting periods and of our employee stock purchase plan shares to expense over the offering period. The following table illustrates the effect on net income (loss) and net income (loss) per common share as if the fair value method had been applied to all outstanding and unvested awards in each period (dollars in thousands, except per share data):
| Fiscal Years Ended June 30, | ||||||||||||
| 2007 | 2006 | 2005 | ||||||||||
Net income (loss) - as reported | $ | (5,285 | ) | $ | 2,670 | $ | 2,199 | |||||
Plus: Reported stock-based compensation | 249 | 125 | 203 | |||||||||
Less: Fair value stock-based compensation | (249 | ) | (125 | ) | (2,658 | ) | ||||||
Net income (loss) - pro forma | $ | (5,285 | ) | $ | 2,670 | $ | (256 | ) | ||||
Reported basic net income (loss) per common share | $ | (0.77 | ) | $ | 0.42 | $ | 0.37 | |||||
Pro forma basic net income (loss) per common share | $ | (0.77 | ) | $ | 0.42 | $ | (0.04 | ) | ||||
Reported diluted net income (loss) per common share | $ | (0.77 | ) | $ | 0.39 | $ | 0.34 | |||||
Pro forma diluted net income (loss) per common share | $ | (0.77 | ) | $ | 0.39 | $ | (0.04 | ) | ||||
Effective April 27, 2005, our Board of Directors approved the acceleration of the vesting of all outstanding and unvested options held by directors, officers and other employees under our 1999 Omnibus Equity Incentive Plan. As a result of the acceleration, options to acquire 827,932 shares of our common stock, which otherwise would have vested over the next 36 months, became immediately exercisable. This action was taken to eliminate, to the extent permitted, the transition expense that we otherwise would incurhave incurred in connection with the adoption of SFAS 123R. Included in the options to acquire 827,932 shares of our common stock were options to purchase 545,992 shares with exercise prices greater than our closing stock price on the date of acceleration. Under the accounting guidance of APB 25, the accelerated vesting resulted in a charge for stock-based compensation of approximately $131,000, which was recognized in the fourth quarter of fiscal 2005. Additionally, our pro forma disclosure includesIn the effectfourth quarter of this accelerated vesting,fiscal 2006 we recorded an additional charge of $37,000.
The aggregate intrinsic value of awards outstanding as calculated under SFAS 123, of $1.8June 30, 2007 was $1.7 million. The aggregate intrinsic value of awards exercisable as of June 30, 2007 was $1.6 million. In addition, the aggregate intrinsic value of awards exercised was $1.6 million which would have otherwise beenduring fiscal 2007. The total remaining unrecognized compensation cost related to unvested awards amounted to $771,000 at June 30, 2007 and is expected to be recognized in our consolidated statements of operations over the next three fiscal years, upon the adoption of SFAS 123R in the first quarter of fiscal 2006.
years. The per share fair value of options granted in connection with stock option plans and rights granted in connection with employee stock purchase plans reported below has been estimated at the date of grant with the following weighted average assumptions:remaining requisite service period of the unvested awards was 2.2 years.
| Employee Stock Options | Employee Stock Purchase Plans | |||||||||||||||||||||||
| Fiscal Years Ended June 30, | Fiscal Years Ended June 30, | |||||||||||||||||||||||
| 2005 | 2004 | 2003 | 2005 | 2004 | 2003 | |||||||||||||||||||
Expected life (years) | 4.0 – 8.0 | 4.0 – 8.0 | 4.0–6.0 | 0.5 | 0.5 | 0.5 | ||||||||||||||||||
Risk-free interest rate | 3.4–3.8 | % | 2.4–3.7 | % | 4.0 | % | 2.0 | % | 1.0 | % | 1.5 | % | ||||||||||||
Volatility | 54 | % | 64 | % | 71 | % | 54 | % | 64 | % | 71 | % | ||||||||||||
Dividend yield | 0 | % | 0 | % | 0 | % | 0 | % | 0 | % | 0 | % | ||||||||||||
Weighted average fair value | $ | 3.82 | $ | 3.21 | $ | 1.75 | $ | 2.36 | $ | 1.82 | $ | 1.10 | ||||||||||||
For purposes of pro forma disclosures, we have amortized the estimated fair value of our stock option awards to expense over the options’ vesting periods and the estimated fair value of our employee stock purchase plan shares over the offering period. Our pro forma information under SFAS 123 and SFAS 148 is as follows (dollars in thousands, except per share data):
| Fiscal Years Ended June 30, | ||||||||||||
| 2005 | 2004 | 2003 | ||||||||||
Net income - as reported | $ | 2,199 | $ | 3,000 | $ | 1,105 | ||||||
Plus: Reported stock-based compensation | 203 | 119 | 31 | |||||||||
Less: Fair value stock-based compensation | (2,658 | ) | (718 | ) | (299 | ) | ||||||
Net income (loss) - pro forma | $ | (256 | ) | $ | 2,401 | $ | 837 | |||||
Reported basic net income per common share | $ | 0.37 | $ | 0.51 | $ | 0.19 | ||||||
Pro forma basic net income (loss) per common share | $ | (0.04 | ) | $ | 0.41 | $ | 0.14 | |||||
Reported diluted net income per common share | $ | 0.34 | $ | 0.48 | $ | 0.18 | ||||||
Pro forma diluted net income (loss) per common share | $ | (0.04 | ) | $ | 0.38 | $ | 0.14 | |||||
Fair Value of Financial Instruments
The carrying amounts of certain of our financial instruments, including cash and cash equivalents, accounts receivable, notes receivable, accounts payable, line of credit and notes payable approximate fair value due to the relatively short maturity of such instruments. The carrying amounts for long-term debt approximate fair value as the interest rates and terms are comparable to rates and terms that could be obtained currently for similar instruments.
Use of Estimates
Our management has made a number of estimates and assumptions relating to the reporting of assets and liabilities, revenue and expenses, and the disclosure of contingent assets and liabilities to prepare these consolidated financial statements in conformity with United States generally accepted accounting principles. Actual results could differ from those estimates.
Net Income per Common Share
We compute net income per common share in accordance with SFASStatement of Financial Accounting Standards No. 128, “Earnings Per Share.” This statementShare” (SFAS 128). SFAS 128 requires the presentation of basic income per common share, using the weighted average number of common shares outstanding during the period, and diluted income per common share, using the additional dilutive effect of all dilutive securities. The dilutive impact of stock options account for the additional weighted average shares of common stock outstanding for our diluted net income per common share computation. We calculated basic and diluted net income per common share as follows (amounts in thousands, except per share data):
| For the Years Ended June 30, | |||||||||
| 2005 | 2004 | 2003 | |||||||
Numerator | |||||||||
Net income | $ | 2,199 | $ | 3,000 | $ | 1,105 | |||
Denominator | |||||||||
Basic weighted average common shares outstanding | 5,949 | 5,843 | 5,809 | ||||||
Dilutive effect of stock options | 516 | 461 | 212 | ||||||
Diluted weighted average common shares outstanding | 6,465 | 6,304 | 6,021 | ||||||
Basic net income per common share | $ | 0.37 | $ | 0.51 | $ | 0.19 | |||
Diluted net income per common share | $ | 0.34 | $ | 0.48 | $ | 0.18 | |||
Numerator Net income (loss) Denominator Basic weighted average common shares outstanding Dilutive effect of stock options Diluted weighted average common shares outstanding Basic net income (loss) per common share Diluted net income (loss) per common share For the Years Ended June 30, 2007 2006 2005 $ (5,285 ) $ 2,670 $ 2,199 6,836 6,340 5,949 — 436 516 6,836 6,776 6,465 $ (0.77 ) $ 0.42 $ 0.37 $ (0.77 ) $ 0.39 $ 0.34
Shares related to stock options of 193,000240,000 for the fiscal year ended June 30, 2005, 61,0002007, 284,000 for fiscal 20042006 and 74,000193,000 for fiscal 2003,2005, were excluded from the calculation of diluted net income (loss) per common share, as the effect of their inclusion would be anti-dilutive.
Concentrations of Credit Risk
Financial instruments that subject us to concentrations of credit risk consist primarily of cash and cash equivalents and accounts receivable. We place our cash and cash equivalents with highly rated financial institutions. Credit risk with respect to receivables is concentrated with our three largest customers, whose receivable balances collectively represented 86%75% of gross accounts receivable at June 30, 20052007 and 73%79% at June 30, 2004.2006. Concentrations of credit risk related to the remaining accounts receivable balances are limited due to the number of customers comprising our remaining customer base.
B. InventoriesGoodwill and Purchased Intangibles
Goodwill and other acquisition-related intangibles as of June 30, 2007 were as follows (dollars in thousands):
| Amortization Life in Years | Gross Amount | Accumulated Amortization | Impairment Charge (1) | Net Amount | ||||||||||||
Goodwill | N/A | $ | 7,495 | $ | — | $ | (7,037 | ) | $ | 458 | ||||||
Distributor relationships | 13 | 500 | (60 | ) | — | 440 | ||||||||||
Direct consumer relationships | 9 | 400 | (70 | ) | — | 330 | ||||||||||
Tradenames | 20 | 3,300 | (262 | ) | — | 3,038 | ||||||||||
Non-compete agreements | 2 | 10 | (8 | ) | — | 2 | ||||||||||
| $ | 11,705 | $ | (400 | ) | $ | (7,037 | ) | $ | 4,268 | |||||||
(1) | Non-cash goodwill impairment charge as a result of annual testing in accordance with SFAS 142. |
Our branded products reporting unit for which we have previously recorded approximately $7.5 million of goodwill, consists of the Dr. Cherry Pathway to Healing® product line, Real Health® Laboratories product line and the As We Change® catalog. The fair value of the branded products reporting unit was determined using a combination of the income approach and the market approach. Under the income approach, the fair value of a reporting unit is calculated based on the present value of estimated future cash flows. The present value of future cash flows uses our estimates of revenue for the reporting unit, driven by assumed growth rates and estimated costs as well as appropriate discount rates. Under the market approach, fair value is estimated based on market multiples of earnings for comparable companies and similar transactions. The weighting applied to the income approach of 80% and market approach of 20% was based on the data available and specific facts and circumstances.
In performing the first step of the fiscal 2007 goodwill impairment test, we determined there was an indicator of impairment in the branded products reporting unit because the carrying value of the reporting unit exceeded the estimated fair value. The excess of the carrying value over the estimated fair value of the branded products reporting unit was primarily due to the following developments that led to lower expected future cash flows:
• | A decrease in sales from the Dr. Cherry Pathway to Healing® product line, the highest margin product line included in the branded products reporting unit; |
• | The lower volume of Pathway to Healing® product line sales decreased the anticipated cost savings from our integration of previously outsourced fulfillment and call center activities following the acquisition of RHL, which reduced our ability to invest in expanding and marketing our branded products; |
• | The additional time and investment required to expand the Real Health® Laboratories product line to additional Food, Drug and Mass Market (FDM) retail customers and introduce new products to existing FDM customers; and |
• | Investments were made in fiscal 2007 to the As We Change® catalog in an effort to increase the active customer base and sales. We believe additional time and investment are required to expand the active customer base to a level where the catalog can generate higher cash flow. |
In performing the second step of the goodwill impairment test, we allocated the estimated fair values of the branded products reporting unit determined in step one of the impairment test, to the assets and liabilities in accordance with SFAS 141.
The estimated future amortization expense of purchased intangible assets as of June 30, 2007 was as follows (dollars in thousands):
Fiscal year 2008 | $ | 249 | |
Fiscal year 2009 | 247 | ||
Fiscal year 2010 | 247 | ||
Fiscal year 2011 | 247 | ||
Fiscal year 2012 | 247 | ||
Thereafter | 2,573 | ||
| $ | 3,810 | ||
C. Inventories
Inventories, net consisted of the following at June 30 (dollars in thousands):
| 2005 | 2004 | |||||
Raw materials | $ | 8,068 | $ | 7,915 | ||
Work in progress | 3,230 | 3,066 | ||||
Finished goods | 1,689 | 1,882 | ||||
| $ | 12,987 | $ | 12,863 | |||
| 2007 | 2006 | |||||
Raw materials | $ | 6,997 | $ | 8,461 | ||
Work in progress | 3,410 | 5,339 | ||||
Finished goods | 3,692 | 3,254 | ||||
| $ | 14,099 | $ | 17,054 | |||
C.D. Property and Equipment
Property and equipment consisted of the following at June 30 (dollars in thousands):
Depreciable Life In Years | 2005 | 2004 | ||||||||
Land | NA | $ | 393 | $ | 393 | |||||
Building and building improvements | 7 – 39 | 2,713 | 3,235 | |||||||
Machinery and equipment | 3 – 12 | 18,470 | 17,345 | |||||||
Office equipment and furniture | 3 – 5 | 3,280 | 4,038 | |||||||
Vehicles | 3 | 204 | 204 | |||||||
Leasehold improvements | 1 – 15 | 9,244 | 4,954 | |||||||
Total property and equipment | 34,304 | 30,169 | ||||||||
Less: accumulated depreciation and amortization | (17,797 | ) | (18,789 | ) | ||||||
Property and equipment, net | $ | 16,507 | $ | 11,380 | ||||||
| Depreciable Life In Years | 2007 | 2006 | ||||||||
Land | NA | $ | 393 | $ | 393 | |||||
Building and building improvements | 7 – 39 | 2,726 | 2,721 | |||||||
Machinery and equipment | 3 – 12 | 19,514 | 20,208 | |||||||
Office equipment and furniture | 3 – 5 | 4,470 | 3,843 | |||||||
Vehicles | 3 | 204 | 204 | |||||||
Leasehold improvements | 1 – 15 | 10,325 | 9,434 | |||||||
Total property and equipment | 37,632 | 36,803 | ||||||||
Less: accumulated depreciation and amortization | (22,573 | ) | (20,860 | ) | ||||||
Property and equipment, net | $ | 15,059 | $ | 15,943 | ||||||
D.E. Debt
We amended our credit facility on December 1, 2005 and again on March 29, 2006 to increase our working capital line of credit from $8.0 million to $12.0 million, extend the maturity date from November 1, 2006 to November 1, 2007 and modify certain financial covenants. We also obtained an additional $3.8 million term loan on December 5, 2005, to fund, in part, the cash purchase price of the RHL acquisition.
We haveAs a result of the amendments and additional term loan, our bank credit facility increased to a total of $20.9 million, comprised of a $12.0 million credit facility with a bank. The facility is comprised of an $8.0 million working capital line of credit and $4.0$8.9 million in term loans. The working capital line of credit expires in November 2006, is secured by our accounts receivable and other rights to payment, general intangibles, inventory and equipment, has an interest rate of Prime Rate or LIBOR plus 1.75%, as elected by the CompanyNAI from time to time, and borrowings are subject to eligibility requirements for current accounts receivable and inventory balances. The term loans consist of a $1.1 million, 15 year term loan due June 2011, secured by our San Marcos building, at an interest rate of 8.25%; a $700,000, ten10 year term loan with a twenty year amortization, secured by our San Marcos building, at an interest rate of LIBOR plus 2.25%; a $1.8 million, four year term loan, secured by our accounts receivable and other rights to payment, general intangibles, inventory and equipment, at an interest rate of LIBOR plus 2.10%; and a $1.5 million, five year term loan, secured by equipment, at an interest rate of LIBOR plus 2.10%; and the $3.8 million, four year term loan, secured by equipment, at an interest rate of LIBOR plus 2.10%. Monthly payments on the term loans are approximately $63,000$145,000 plus interest.
On January 24, 2007, we further amended our credit facility to extend the maturity date for the working capital line of credit from November 1, 2007 to November 1, 2008, and maintain the ratio of total liabilities/tangible net worth covenant at 1.25/1.0 for the remainder of the term of the credit facility.
As of June 30, 2005, the outstanding amount2007 we were not in compliance with our quarterly net income and annual net income financial covenants under our credit facility. Quarterly net income after taxes may not be less than $1.00 and annual fiscal year net income net less than $750,000. As of June 30, 2007 our net loss was $6.6 million for our fourth quarter of fiscal 2007 and $5.3 million for fiscal 2007. Our lender has agreed to waive their default rights as a result of these covenant violations as of June 30, 2007.
Additionally, as of September 28, 2007, we were not in compliance with our annual Form 10-K financial reporting covenant under our credit facility, which requires that a copy of our annual report on the term loans was $3.2 million andForm 10-K be provided to our lender not later than 90 days after our fiscal year end. Our lender also has agreed to waive their default rights as a result of this covenant violation as of September 28, 2007.
As of June 30, 2007, we did not have an outstanding balance on the working capital line of credit.credit and the amount outstanding on the term loans was $4.6 million. As of June 30, 2005,2007, we had $7.7$7.5 million available under the line of credit, netcredit.
As of a $270,000May 1, 2007, in accordance with our lease agreement, we no longer have an amount outstanding under our letter of credit issued to our landlord.
On September 22, 2006, NAIE, our wholly owned subsidiary, entered into a credit facility to provide it with a credit line of up to CHF 1,300,000, or approximately $1.1 million, which is the initial maximum aggregate amount that can be outstanding at any one time under the credit facility. This maximum amount will be reduced by CHF 160,000, or approximately $130,000, at the end of each year beginning on December 31, 2007. On February 1, 2005, we19, 2007, NAIE amended ourits credit facility withto provide that the bank to increasemaximum aggregate amount that may be outstanding under the limitation on our capital expenditures for the fiscal year ended June 30, 2005 from $6.5 million to $8.0 million. All other terms and conditions of our credit facility remain in full force and effect.
Additionally, we have a term loan agreement for $1.1 million, secured by our San Marcos building, at an annual interest rate of 8.25%. The loan is due in June 2011 and provides for principal and interest payable in monthly installments of $10,800.cannot be reduced below CHF 500,000, or approximately $407,000. As of June 30, 2005,2007, there was no outstanding balance under the outstanding amount on the loan was $602,000.
credit facility.
The composite interest rate on all of our outstanding debt was 5.18%7.84% at June 30, 20052007 and 5.44%7.16% at June 30, 2004.
2006.
Aggregate amounts of long-term debt maturities as of June 30, 20052007 were as follows (dollars in thousands):
2006 | $ | 861 | |
2007 | 895 | ||
2008 | 888 | ||
2009 | 445 | ||
2010 | 151 | ||
Thereafter | 600 | ||
| $ | 3,840 | ||
2008 | $ | 1,825 | |
2009 | 1,455 | ||
2010 | 692 | ||
2011 | 146 | ||
2012 | 35 | ||
Thereafter | 428 | ||
| $ | 4,581 | ||
E.F. Income Taxes
The provision for (benefit from) income taxes for the years ended June 30 consisted of the following (dollars in thousands):
| 2005 | 2004 | 2003 | 2007 | 2006 | 2005 | |||||||||||||||||||
Current: | ||||||||||||||||||||||||
Federal | $ | 1,320 | $ | 175 | $ | — | $ | (83 | ) | $ | 1,515 | $ | 1,320 | |||||||||||
State | 94 | 3 | — | (3 | ) | 229 | 94 | |||||||||||||||||
Foreign | 109 | 139 | 47 | 96 | 227 | 109 | ||||||||||||||||||
| 1,523 | 317 | 47 | 10 | 1,971 | 1,523 | |||||||||||||||||||
Deferred: | ||||||||||||||||||||||||
Federal | (398 | ) | 1,045 | (372 | ) | 96 | (558 | ) | (398 | ) | ||||||||||||||
State | 85 | 293 | (163 | ) | 13 | 28 | 85 | |||||||||||||||||
Change in valuation allowance | — | (1,631 | ) | 535 | ||||||||||||||||||||
| (313 | ) | (293 | ) | — | 109 | (530 | ) | (313 | ) | |||||||||||||||
Provision for income taxes | $ | 1,210 | $ | 24 | $ | 47 | $ | 119 | $ | 1,441 | $ | 1,210 | ||||||||||||
Net deferred tax assets and deferred tax liabilities as of June 30 were as follows (dollars in thousands):
| 2005 | 2004 | |||||||
Deferred tax assets: | ||||||||
Allowance for doubtful accounts | $ | 85 | $ | 48 | ||||
Accrued vacation expense | 189 | 156 | ||||||
Tax credit carryforward | 99 | 128 | ||||||
Allowance for inventories | 659 | 414 | ||||||
Other, net | 93 | — | ||||||
Net operating loss carryforward | 31 | 264 | ||||||
Total gross deferred tax assets | $ | 1,156 | $ | 1,010 | ||||
Deferred tax liabilities: | ||||||||
Accumulated depreciation and amortization | (459 | ) | (717 | ) | ||||
Deferred tax liabilities | (459 | ) | (717 | ) | ||||
Net deferred tax assets | $ | 697 | $ | 293 | ||||
| 2007 | 2006 | |||||||
Deferred tax assets: | ||||||||
Allowance for doubtful accounts | $ | 6 | $ | 85 | ||||
Accrued vacation expense | 212 | 166 | ||||||
Tax credit carryforward | 153 | 163 | ||||||
Allowance for inventories | 807 | 875 | ||||||
Other, net | 281 | 244 | ||||||
Deferred rent | 344 | 423 | ||||||
Net operating loss carryforward | 30 | 26 | ||||||
Total gross deferred tax assets | $ | 1,833 | $ | 1,982 | ||||
Deferred tax liabilities: | ||||||||
Accumulated depreciation and amortization | (2,012 | ) | (2,183 | ) | ||||
Deferred tax liabilities | (2,012 | ) | (2,183 | ) | ||||
Net deferred tax assets (liabilities) | $ | (179 | ) | $ | (201 | ) | ||
At June 30, 2005,2007, we had state tax net operating loss carryforwards of approximately $530,000.$507,000. The state tax loss carryforwards will begin to expire in 2007,2014, unless previously utilized.
During the fourth quarter of fiscal 2007, we reduced our tax contingency reserves by $422,000 after the Internal Revenue Service completed an audit of our fiscal 2005 tax return.
NAIE obtained from the Swiss tax authorities a five-year Swiss federal and cantonal income tax holiday that ended June 30, 2005. Following the expiration of our tax holiday, we anticipate NAIE’s effective tax rate for Swiss federal, cantonal and communal taxes will beis approximately 23%20%. NAIE had net income of $1.0 million$903,000 for the fiscal year ended June 30, 2005.
2007. Undistributed earnings of NAIE amounted to approximately $4.4 million at June 30, 2007. These earnings are considered to be indefinitely reinvested and, accordingly, no provision for U.S. federal taxes has been provided thereon.
A reconciliation of income taxes computed by applying the statutory federal income tax rate of 34% to net income before income taxes for the year ended June 30 is as follows (dollars in thousands):
| 2005 | 2004 | 2003 | ||||||||||
Income taxes computed at statutory federal income tax rate | $ | 1,159 | $ | 1,029 | $ | 392 | ||||||
State income taxes, net of federal income tax expense | 118 | 196 | 67 | |||||||||
Increase (decrease) in valuation allowance | — | (1,631 | ) | 534 | ||||||||
Expenses not deductible for tax purposes | 53 | 69 | 12 | |||||||||
Foreign tax holiday | (304 | ) | (187 | ) | (228 | ) | ||||||
Foreign tax withholding | 101 | — | — | |||||||||
Dividend tax | 131 | — | — | |||||||||
Prior year adjustments | — | 305 | (668 | ) | ||||||||
Transfer pricing adjustment | — | 264 | — | |||||||||
Other | (48 | ) | (21 | ) | (62 | ) | ||||||
Income taxes as reported | $ | 1,210 | $ | 24 | $ | 47 | ||||||
Effective tax rate | 35.5 | % | 0.8 | % | 4.1 | % | ||||||
| 2007 | 2006 | 2005 | ||||||||||
Income taxes (benefit) computed at statutory federal income tax rate | $ | (1,756 | ) | $ | 1,396 | $ | 1,159 | |||||
State income taxes, net of federal income tax expense | 56 | 188 | 118 | |||||||||
Expenses not deductible for tax purposes | 32 | 37 | 53 | |||||||||
Foreign tax rate differential | (140 | ) | (108 | ) | (304 | ) | ||||||
Foreign tax withholding | — | — | 101 | |||||||||
Dividend tax | — | — | 131 | |||||||||
Goodwill impairment, not deductible for tax purposes | 2,393 | — | — | |||||||||
Tax contingency reserve reduction | (422 | ) | — | — | ||||||||
Other | (44 | ) | (72 | ) | (48 | ) | ||||||
Income taxes as reported | $ | 119 | $ | 1,441 | $ | 1,210 | ||||||
Effective tax rate | 2.3 | % | 35.1 | % | 35.5 | % | ||||||
F.G. Employee Benefit Plans
We have a profit sharing plan pursuant to Section 401(k) of the Internal Revenue Code of 1986, as amended (the “Code”), whereby participants may contribute a percentage of compensation not in excess of the maximum allowed under the Code. All employees with six months of continuous employment are eligible to participate in the plan. We may make contributions to the plan at the discretion of our Board of Directors. Effective July 1, 2001, the plan was amended to require that we match one half of the first 6% of a participant’s compensation contributed to the plan. Effective January 1, 2004, the plan was amended to require that we match 100% of the first 3% and 50% of the next 2% of a participant’s compensation contributed to the plan. The total contributions under the plan charged to operations totaled $315,000$302,000 for the fiscal year ended June 30, 2005, $200,0002007, $321,000 for fiscal 2004,2006, and $79,000$315,000 for fiscal 2003.2005.
We have a “Cafeteria Plan” pursuant to Section 125 of the Code, whereby health care benefits are provided for active employees through insurance companies. Substantially all active full-time employees are eligible for these benefits. We recognize the cost of providing these benefits by expensing the annual premiums, which are based on benefits paid during the year. The premiums expensed for these benefits totaled $876,000$969,000 for the fiscal year ended June 30, 2005, $697,0002007, $858,000 for fiscal 2004,2006, and $492,000$876,000 for fiscal 2003.
2005.
In December 1999, we adopted an employee stock purchase plan that providesinitially provided for the issuance of up to 150,000 shares of our common stock. BeginningSince July 1, 2004, the number of shares available for purchase under the plan will increasehas increased by 25,000 each year on July 1 and will continue to increase by such amount each July 1 until determined otherwise by the Board of Directors. The plan is intended to qualify under Section 423 of the Code and is for the benefit of qualifying employees. Under the terms of the plan, participating employees may have up to 15% of their compensation withheld through payroll deductions to purchase shares of our common stock at 85% of the closing sale price for the stock as quoted on the Nasdaq NationalGlobal Market on either the first or last trading day in the offering period, whichever is lower. As of June 30, 2005, 129,5442007, 162,173 shares of common stock were issued pursuant to this plan.
plan and 62,827 shares were available for future issuance.
We sponsor a defined benefit pension plan, which provides retirement benefits to employees based generally on years of service and compensation during the last five years before retirement. Effective June 21, 1999, we adopted an amendment to freeze benefit accruals to the participants. We contribute an amount not less than the minimum funding requirements of the Employee Retirement Income Security Act of 1974 nor more than the maximum tax-deductible amount.
Disclosure of Funded Status
The following table sets forth the defined benefit pension plan’s funded status and amount recognized in our consolidated balance sheets at June 30 (dollars in thousands):
| 2005 | 2004 | |||||||
Change in Benefit Obligation | ||||||||
Benefit obligation at beginning of year | $ | 1,286 | $ | 1,102 | ||||
Interest cost | 73 | 72 | ||||||
Actuarial loss | 139 | 118 | ||||||
Benefits paid | (10 | ) | (6 | ) | ||||
Benefit obligation at end of year | $ | 1,488 | $ | 1,286 | ||||
Change in Plan Assets | ||||||||
Fair value of plan assets at beginning of year | $ | 1,146 | $ | 937 | ||||
Actual return on plan assets | 83 | 139 | ||||||
Employer contributions | 63 | 76 | ||||||
Benefits paid | (10 | ) | (6 | ) | ||||
Fair value of plan assets at end of year | $ | 1,282 | $ | 1,146 | ||||
Reconciliation of Funded Status | ||||||||
Benefit obligation in excess of fair value of plan assets | $ | (206 | ) | $ | (140 | ) | ||
Unrecognized net actuarial loss | 241 | 96 | ||||||
Net amount recognized | $ | 35 | $ | (44 | ) | |||
Additional Minimum Liability Disclosures | ||||||||
Accrued benefit liability | $ | (206 | ) | $ | (140 | ) | ||
| 2007 | 2006 | |||||||
Change in Benefit Obligation | ||||||||
Benefit obligation at beginning of year | $ | 1,546 | $ | 1,488 | ||||
Interest cost | 82 | 82 | ||||||
Actuarial (gain) loss | 22 | (24 | ) | |||||
Benefits paid | (101 | ) | — | |||||
Benefit obligation at end of year | $ | 1,549 | $ | 1,546 | ||||
Change in Plan Assets | ||||||||
Fair value of plan assets at beginning of year | $ | 1,355 | $ | 1,282 | ||||
Actual return on plan assets | 175 | (7 | ) | |||||
Employer contributions | 44 | 80 | ||||||
Benefits paid | (101 | ) | — | |||||
Fair value of plan assets at end of year | $ | 1,473 | $ | 1,355 | ||||
Reconciliation of Funded Status | ||||||||
Benefit obligation in excess of fair value of plan assets | $ | (76 | ) | $ | (191 | ) | ||
Unrecognized net actuarial loss | 260 | 323 | ||||||
Net amount recognized | $ | 184 | $ | 132 | ||||
Additional Minimum Liability Disclosures | ||||||||
Accrued benefit liability | $ | (76 | ) | $ | (191 | ) | ||
The weighted-average rates used for the years ended June 30 in determining the projected benefit obligations for the defined benefit pension plan were as follows:
| 2005 | 2004 | 2007 | 2006 | |||||||||
Discount rate | 5.50 | % | 6.00 | % | 5.50 | % | 5.50 | % | ||||
Compensation increase rate | N/A | N/A | N/A | N/A | ||||||||
Net Periodic Benefit Cost
The components included in the defined benefit pension plan’s net periodic benefit costincome for the fiscal years ended June 30 were as follows (dollars in thousands):
| 2005 | 2004 | 2003 | 2007 | 2006 | 2005 | |||||||||||||||||||
Interest cost | $ | 73 | $ | 72 | $ | 67 | $ | 82 | $ | 82 | $ | 73 | ||||||||||||
Expected return on plan assets | (89 | ) | (73 | ) | (64 | ) | (106 | ) | (106 | ) | (89 | ) | ||||||||||||
Recognized actuarial loss | 15 | 7 | — | |||||||||||||||||||||
Net periodic benefit cost (income) | $ | (16 | ) | $ | (1 | ) | $ | 3 | ||||||||||||||||
Net periodic benefit income | $ | (9 | ) | $ | (17 | ) | $ | (16 | ) | |||||||||||||||
We expect to contribute $43,000 to our defined benefit pension plan in fiscal 2008.
The following benefit payments are expected to be paid:
2008 | $ | 184 | |
2009 | 237 | ||
2010 | 274 | ||
2011 | 314 | ||
2012 | 374 | ||
2013-2017 | 2,752 | ||
| $ | 4,135 | ||
The weighted-average rates used for the years ended June 30 in determining the defined benefit pension plan’s net pension costs, were as follows:
| 2005 | 2004 | 2003 | |||||||
Discount rate | 6.00 | % | 6.00 | % | 6.50 | % | |||
Expected long term rate of return | 8.00 | % | 8.00 | % | 7.50 | % | |||
Compensation increase rate | N/A | N/A | N/A |
Discount rate Expected long-term rate of return Compensation increase rate 2007 2006 2005 5.50 % 5.50 % 6.00 % 8.00 % 8.00 % 8.00 % N/A N/A N/A
Our expected rate of return is determined based on a methodology that considers historical returns of multiple classes analyzed to develop a risk free real rate of return and risk premiums for each asset class. The overall rate for each asset class was developed by combining a long-term inflation component, the risk free real rate of return, and the associated risk premium. A weighted average rate was developed based on those overall rates and the target asset allocation of the plan.
Our defined benefit pension plan’s weighted average asset allocation at June 30 and weighted average target allocation were as follows:
| 2005 | 2004 | Target Allocation | |||||||
Equity securities | 62 | % | 61 | % | 60 | % | |||
Debt securities | 30 | % | 31 | % | 32 | % | |||
Real estate | 8 | % | 8 | % | 8 | % | |||
| 100 | % | 100 | % | 100 | % | ||||
| 2007 | 2006 | Target Allocation | |||||||
Equity securities | 63 | % | 60 | % | 60 | % | |||
Debt securities | 37 | % | 40 | % | 40 | % | |||
Real estate | — | % | — | % | — | % | |||
| 100 | % | 100 | % | 100 | % | ||||
The underlying basis of the investment strategy of our defined benefit pension plan is to ensure that pension funds are available to meet the plan’s benefit obligations when they are due. Our investment strategy is a long-term risk controlled approach using diversified investment options with a relatively minimal exposure to volatile investment options like derivatives.
G.H. Stockholders’ Equity
Treasury Stock
In January 1999, the Board of Directors approved a repurchase program of up to 500,000 shares of our common stock. This program was terminated by the Board of Directors in October 2002 after the repurchase of 272,400 shares. During March 2004, 211,400 shares of such repurchased common stock were cancelled and returned to the status of authorized but unissued shares of our common stock.
On September 25, 2006, our former Chief Scientific Officer surrendered 9,000 shares of our common stock as payment of the exercise price for incentive stock options.
On June 29, 2007, the independent members of the Board of Directors approved the repurchase of 100,000 shares of our common stock from Mark LeDoux, our Chief Executive Officer and the Chairman of the Board, his wife, their family limited partnership and related children’s trust, conditioned on a purchase price equal to a 10% discount from the closing price on such date. The repurchase was completed on July 6, 2007.
Stock Option Plans
On December 6, 1999, our stockholders approved the adoption of the 1999 Omnibus Equity Incentive Plan (the “1999 Plan”). A total of 500,000 shares of common stock were initially reserved under the 1999 Plan for issuance to our directors, officers, other employees, and consultants. Under the terms of the 1999 Plan, the aggregate number of shares of common stock that may be awarded is automatically increased on January 1st of each year, commencing January 1, 2000, by a number equal to the lesser of 2.5% of the total number of common shares then outstanding or 100,000 shares. The 1999 Plan has increased by 100,000 common shares on each of January 1 of each year from 2000 2001, 2002, 2003, 2004 and 2005.through 2007. In addition, at our Annual Meetings of Stockholders held on January 30, 2004 and December 31, 2004, our stockholders approved amendments to the 1999 Plan to increase the number of shares of common stock available under the 1999 Plan by an additional 500,000 shares, for a total increase of 1,000,000 shares.
Grants under the 1999 Plan can be either incentive stock options or nonqualified stock options. Options granted under the 1999 Plan have either a five or a ten-year term.
Effective April 27, 2005, our Board of Directors approved the acceleration of the vesting of all outstanding and unvested options held by directors, officers and other employees under ourthe 1999 Omnibus Equity Incentive Plan. As a result of the acceleration, options to acquire 827,932 shares of our common stock, which otherwise would have vested over the next 36 months, became immediately exercisable. This action was taken to eliminate, to the extent permitted, the transition expense that we otherwise would incurhave incurred in connection with the adoption of SFAS 123R. Included in the options to acquire 827,932 shares of our common stock were options to purchase 545,992 shares with exercise prices greater than our closing stock price on the date of acceleration. Under the accounting guidance of APB 25, the accelerated vesting resulted in a charge for stock-based compensation of approximately $131,000, which was recognized in the fourth quarter of fiscal 2005. In the fourth quarter of fiscal 2006 we recorded an additional charge of $37,000.
Stock option activity for the three years endingended June 30, 20052007 was as follows:
| 1992 Incentive Plan | 1998 Outside | 1999 Plan | Total All Plans | Weighted Average Exercise Price | ||||||||||||||||
Outstanding at June 30, 2002 | 85,000 | 20,000 | 421,800 | 526,800 | 3.58 | |||||||||||||||
Exercised | — | — | (6,199 | ) | (6,199 | ) | 2.17 | |||||||||||||
Forfeited | (85,000 | ) | — | (135,401 | ) | (220,401 | ) | 5.57 | ||||||||||||
Granted | — | — | 285,000 | 285,000 | 3.08 | |||||||||||||||
Outstanding at June 30, 2003 | — | 20,000 | 565,200 | 585,200 | 2.60 | |||||||||||||||
Exercised | — | (20,000 | ) | (61,700 | ) | (81,700 | ) | 3.40 | ||||||||||||
Forfeited | — | — | (8,600 | ) | (8,600 | ) | 5.61 | |||||||||||||
Granted | — | — | 774,800 | 774,800 | 6.26 | |||||||||||||||
| 1999 Plan | Weighted Average Exercise Price | |||||||||||||||||||
Outstanding at June 30, 2004 | — | — | 1,269,700 | 1,269,700 | 4.76 | 1,269,700 | $ | 4.76 | ||||||||||||
Exercised | — | — | (49,945 | ) | (49,945 | ) | 2.86 | (49,945 | ) | $ | 2.86 | |||||||||
Forfeited | — | — | (20,955 | ) | (20,955 | ) | 5.82 | (20,955 | ) | $ | 5.82 | |||||||||
Granted | — | — | 240,500 | 240,500 | 8.56 | 240,500 | $ | 8.56 | ||||||||||||
Outstanding at June 30, 2005 | — | — | 1,439,300 | 1,439,300 | 5.45 | 1,439,300 | $ | 5.45 | ||||||||||||
Exercisable at June 30, 2005 | — | — | 1,439,300 | 1,439,300 | 5.45 | |||||||||||||||
Exercised | (93,700 | ) | $ | 3.93 | ||||||||||||||||
Forfeited | (79,500 | ) | $ | 8.99 | ||||||||||||||||
Granted | 140,000 | $ | 7.41 | |||||||||||||||||
Outstanding at June 30, 2006 | 1,406,100 | $ | 5.54 | |||||||||||||||||
Exercised | (388,305 | ) | $ | 4.61 | ||||||||||||||||
Forfeited | (20,400 | ) | $ | 8.00 | ||||||||||||||||
Granted | 240,000 | $ | 8.89 | |||||||||||||||||
Outstanding at June 30, 2007 | 1,237,395 | $ | 6.45 | |||||||||||||||||
Exercisable at June 30, 2007 | 904,995 | $ | 5.71 | |||||||||||||||||
Weighted-average remaining contractual life in years | — | — | 3.71 | 3.71 | 2.71 | |||||||||||||||
Available for grant at June 30, 2005 | — | — | 536,752 | 536,752 | ||||||||||||||||
Available for grant at June 30, 2007 | 456,652 | |||||||||||||||||||
During fiscal 2002, we granted options to purchase 90,000 shares to employees at an exercise price below the fair market value of the stock on the grant date. During fiscal 2004, we granted options to purchase 150,000 shares to an employee at an exercise price below the fair market value of the stock on the grant date. We recorded approximately $72,000 of compensation expense related to these option grants in fiscal 2005, $63,000 in fiscal 2004 and $31,000 in fiscal 2003. As a result of the acceleration of vesting of all outstanding and unvested options on April 27, 2005, we expensed the unamortized deferred compensation associated with these options.
Additionally, during fiscal 2004 we recorded $56,000 of compensation expense related to options granted to a non-employee to purchase 15,000 shares.
The following is a further breakdown of the options outstanding at June 30, 2005:2007:
Range of Exercise Prices | Number Outstanding | Weighted Average Remaining Contractural Life | Weighted Average Exercise Price | Number Exercisable | Weighted Average Exercise Price | |||||||
$1.80 - $2.03 | 166,800 | 4.64 | $ | 1.97 | 166,800 | $ | 1.97 | |||||
$2.04 - $3.02 | 245,400 | 2.34 | $ | 2.63 | 245,400 | $ | 2.63 | |||||
$3.03 - $5.21 | 310,000 | 3.49 | $ | 4.96 | 310,000 | $ | 4.96 | |||||
$5.22 - $6.65 | 407,600 | 3.56 | $ | 6.56 | 407,600 | $ | 6.56 | |||||
$6.66 - $10.47 | 309,500 | 4.71 | $ | 8.58 | 309,500 | $ | 8.58 | |||||
$ 1.80 - $10.47 | 1,439,300 | 3.71 | $ | 5.45 | 1,439,300 | $ | 5.45 | |||||
Range of Exercise Prices | Number Outstanding | Weighted Average Remaining Contractural | Weighted Average Exercise Price | Number Exercisable | Weighted Average Exercise Price | |||||||
$2.00 - $3.02 | 212,995 | 1.83 | $ | 2.41 | 212,995 | $ | 2.41 | |||||
$3.70 - $5.59 | 235,000 | 1.64 | $ | 5.09 | 235,000 | $ | 5.09 | |||||
$6.50 - $7.93 | 379,900 | 2.65 | $ | 6.93 | 263,900 | $ | 6.81 | |||||
$8.05 - $10.47 | 409,500 | 3.83 | $ | 8.90 | 193,100 | $ | 8.60 | |||||
$2.00 - $10.47 | 1,237,395 | 2.71 | $ | 6.45 | 904,955 | $ | 5.71 | |||||
H.I. Commitments
We lease a total of 181,500172,800 square feet of our manufacturing facilities from unaffiliated third parties under non-cancelable operating leases, including 162,000 square feet at our manufacturing facility in Vista, California and 19,50010,800 square feet at our San Marcos, California facility. The leases onlease for approximately 8,000 square feet at the San Marcos facility have various expiration dates throughterminates in February 2008 and the lease for the remaining leased space at San Marcos terminates in December 2007. The lease on the Vista facility expires in March 2014.
On February 25, 2004, we entered into an agreement to sublet 42,000 square feet at our Vista, California facility. The sublease was for a term of seven months that began on April 1, 2004, and provided for monthly rental income equal to our rental expense for the space. The sublease agreement ended October 31, 2004. The space is currently being used for warehousing.
As required under the terms of our Vista lease, on May 11, 2004, we provided a letter of credit in the amount of $440,000 to the landlord. The amount of the letter of credit will bewas reduced by approximately 33% each year. On April 1, 2005,As of June 30, 2007 we reduced ourdid not have an outstanding amount to $270,000.
on the letter of credit.
NAIE leases facility space in Manno, Switzerland. The leased space totals approximately 38,00046,000 square feet. We primarily use the facilities for manufacturing, packaging, warehousing and distributing nutritional supplement products for the European marketplace. The lease expires in December 2015.
On March 28, 2007, we entered into an agreement to sublet approximately 3,000 square feet at our Manno, Switzerland facility. The sublease is for a term of two years that began on April 1, 2007, and provides for monthly rental income equal to our rental expense for the space.
RHL leases facility space in San Diego, California. The leased space totals approximately 16,000 square feet. We primarily use the facilities for RHL’s headquarters, warehousing and a call center and fulfillment. The lease expires in May 2009.
Minimum rental commitments (exclusive of property tax, insurance and maintenance) under all non-cancelable operating leases with initial or remaining lease terms in excess of one year, including the lease agreements referred to above, are set forth below as of June 30, 20052007 (dollars in thousands):
2006 | $ | 1,872 | |
2007 | 1,937 | ||
2008 | 1,919 | ||
2009 | 1,939 | ||
2010 | 1,977 | ||
Thereafter | 8,961 | ||
| $ | 18,605 | ||
| 2008 | 2009 | 2010 | 2011 | 2012 | There- after | |||||||||||||||
Gross minimum rental commitments | $ | 2,280 | $ | 2,244 | $ | 2,170 | $ | 2,209 | $ | 2,249 | $ | 5,565 | ||||||||
Sublease income commitments | (41 | ) | (31 | ) | — | — | — | — | ||||||||||||
| $ | 2,239 | $ | 2,213 | $ | 2,170 | $ | 2,209 | $ | 2,249 | $ | 5,565 | |||||||||
Rental expense totaled $1.7$2.2 million for the fiscal year ended June 30, 2005, $1.22007, $2.0 million for fiscal 2004,2006 and $947,000$1.7 million for fiscal 2003.2005. Rental expense was offset by sublease rental income in the amount of $137,000 for fiscal 2005, $68,000$11,000 in fiscal 2004 and zero2007, $0 in fiscal 2003.
2006 and $137,000 in fiscal 2005.
I.J. Foreign Currency Instruments
On August 9, 2004,July 7, 2005, we purchased ten monthly participating forward12 option contracts designated and effective as cash flow hedges to protect against the foreign currency exchange risk inherent in a portion of our forecasted transactions denominated in Euros. The participating forward contracts consisted of ten put12 options providing protection ifwere to expire monthly beginning January 2006 and ending December 2006, but we sold the exchange rate of the United States dollar to the Euro decreased below our contracted strike price of $1.1892, and ten call options that offset the initial costhad not yet expired as of the purchased put options.July 6, 2006 as described below. The call options obligated us to give up 50% of the foreign currency gain related to the forecasted transaction if the United States dollar/Euro exchange rate increased above our contracted strike price. The participating forwardoption contracts had an initiala notional amount of $1.5$7.0 million, and a weighted average strike price of $1.1892. As$1.16, and a purchase price of June 30, 2005, we had exercised all$152,000. The risk of loss associated with the participating forwardoptions was limited to the purchase price paid for the option contracts.
On May 13, 2005,April 6, 2006, we purchased seven option contracts designated and effective as cash flow hedges to protect against the foreign currency exchange risk inherent in a portion of our forecasted transactions denominated in Euros. The seven options were to expire monthly beginning June 2005January 2007 and ending December 2005.July 2007, but we sold the options in July 2006 as described below. The option contracts had a notional amount of $4.2$4.9 million, a weighted average strike price of $1.19,$1.16, and a purchase price of $21,000.$62,000. The risk of loss associated with the options was limited to the purchase price paid for the option contracts.
On July 6, 2006, we sold the then unexpired options purchased on July 7, 2005 and April 6, 2006 for $13,000. The proceeds were used to purchase 12 option contracts designated and effective as cash flow hedges to protect against the foreign currency exchange risk inherent in a portion of our forecasted transactions denominated in Euros. The 12 options expire monthly beginning August 2006 and ending July 2007. The option contracts had a notional amount of $8.9 million, a weighted average strike price of $1.24, and a purchase price of $103,000. The risk of loss associated with the options is limited to premium amountsthe purchase price paid for the option contracts. As of June 30, 2005, we had not exercised any of the options and one2007, 11 of the options had expired. As of June 30, 2007, the unrealized losses associated with the options sold on July 6, 2006 were $7,000 and will be recognized in cost of goods sold under the original monthly option contract expiration dates.
On January 18, 2007, we purchased three option contracts designated and effective as cash flow hedges to protect against the foreign currency exchange risk inherent in a portion of our forecasted transactions denominated in Euros. The three options expire monthly beginning August 2007 and ending October 2007. The option contracts had a notional amount of $1.9 million, a weighted average strike price of $1.24, and a purchase price of $12,000. The risk of loss associated with the options is limited to the purchase price paid for the option contracts.
On April 3, 2007, we purchased three option contracts designated and effective as cash flow hedges to protect against the foreign currency exchange risk inherent in a portion of our forecasted transactions denominated in Euros. The three options expire monthly beginning November 2007 and ending January 2008. The option contracts had a notional amount of $1.9 million, a weighted average strike price of $1.29, and a purchase price of $18,000. The risk of loss associated with the options is limited to the purchase price paid for the option contracts.
For the fiscal year ended June 30, 2005,2007, approximately $109,000$219,000 had been charged to income for option contracts outstanding during the year.
J. Related Party Transactions
Duringyear, $106,000 for the fiscal 1999, we made a 6% interest bearing loan of $20,000 to our Chief Scientific Officer. The noteyear ended June 30, 2006 and interest due were being paid in biweekly payments of $550. The balance of$109,000 for the note, including accrued interest, was paid in full in September 2004.fiscal year ended June 30, 2005.
K. Economic Dependency
We had substantial net sales to certain customers during the fiscal years ended June 30 shown in the following table. The loss of any of these customers, or a significant decline in net sales or the growth rate of net sales to these customers could have a material adverse impact on our net sales and net income. Net sales to any one customer representing 10% or more of the respective year’s total net sales for the three years ended June 30 were as follows (dollars in thousands):
| 2005 | 2004 | 2003 | 2007 | 2006 | 2005 | |||||||||||||||||||||||||||||||||
| Net Sales by Customer | % of Total Net Sales | Net Sales by Customer | % of Total Net Sales | Net Sales by Customer | % of Total Net Sales | Net Sales by Customer | % of Total Net Sales | Net Sales by Customer | % of Total Net Sales | Net Sales by Customer | % of Total Net Sales | |||||||||||||||||||||||||||
Customer 1 | $ | 36,991 | 40 | % | $ | 31,182 | 40 | % | $ | 24,119 | 43 | % | $ | 38,786 | 40 | % | $ | 37,700 | 38 | % | $ | 36,991 | 40 | % | ||||||||||||||
Customer 2 | 35,193 | 39 | % | 23,464 | 30 | % | 15,337 | 27 | % | 29,822 | 31 | % | 29,241 | 29 | % | 35,193 | 39 | % | ||||||||||||||||||||
Customer 3 | (a | ) | (a | ) | 10,133 | 10 | % | (a | ) | (a | ) | |||||||||||||||||||||||||||
| $ | 72,184 | 79 | % | $ | 54,646 | 70 | % | $ | 39,456 | 70 | % | $ | 68,608 | 71 | % | $ | 77,074 | 77 | % | $ | 72,184 | 79 | % | |||||||||||||||
| (a) | Net sales were less than 10% of the respective period’s total net sales. |
Accounts receivable from these customers totaled $9.5$3.9 million at June 30, 2005,2007 and $6.6$10.5 million at June 30, 2004.2006.
We buy certain products from a limited number of raw material suppliers. The loss of any of these suppliers could have a material adverse impact on our net sales and net income. Carrington Laboratories Incorporated comprised 35%During fiscal 2007, approximately 39% of our total raw material purchases for the year ended June 30, 2005.were from three suppliers. Accounts payable to Carrington Laboratories Incorporated was $660,000these suppliers were $1.6 million at June 30, 2005.2007. No other supplier comprised 10% or more of our raw material purchases for the year ended June 30, 2005.
2007.
L. Contingencies
From time to time, we become involved in various investigations, claims and legal proceedings that arise in the ordinary course of our business. These matters may relate to product liability, employment, intellectual property, tax, regulation, contract or other matters. The resolution of these matters as they arise will be subject to various uncertainties and, even if such claims are without merit, could result in the expenditure of significant financial and managerial resources. While unfavorable outcomes are possible, based on available information, we generally do not believe the resolution of these matters including that discussed below, will result in a material adverse effect on our business, consolidated financial condition, or results of operation. However, a settlement payment or unfavorable outcome could adversely impact our results of operation. Our evaluation of the likely impact of these actions including that discussed below, could change in the future and we could have unfavorable outcomes that we do not expect.
On February 10, 2005, a complaint was filed againstAs of October 15, 2007, neither NAI on behalf of Novogen Research Pty. Ltd. in the United States District Court, Southern District of New York alleging a cause of action for patent infringement of a Novogen patent by products manufactured by NAI. The parties are attempting to resolve the matter in an out-of-court settlement but if we are unable to do so we intend to vigorously defend the action.
Wenor its subsidiaries were a plaintiff in an anti-trust lawsuit against several manufacturersparty to any material pending legal proceeding nor was any of vitamins and other raw materials that we purchased. Other similarly situated companies filed a numbertheir property the subject of similar lawsuits against some or all of the same manufacturers. Our lawsuit was consolidated with some of the others and captionedIn re: Vitamin Antitrust Litigation. As of June 30, 2003, all of our claims under the vitamin antitrust litigation were settled. Settlement payments that we received of $225,000 in fiscal 2003 and $3.4 million in fiscal 2002 are included in proceeds from vitamin antitrust litigation in the accompanying statements of income for fiscal 2003 and 2002, as applicable.any material pending legal proceeding.
M. Segment Information
Following our acquisition of RHL on December 5, 2005 through June 30, 2006, our business consisted of two segments, as defined by Statement of Financial Accounting Standards No. 131, “Disclosures about Segments of an Enterprise and Related Information,” identified as NAI, which primarily provides private label contract manufacturing services to companies that market and distribute nutritional supplements and other health care products, and RHL, which markets and distributes branded nutritional supplements and other lifestyle products.
Effective July 1, 2006, we changed our reporting segments to reflect the structure of our organization after the integration of previously outsourced fulfillment and call center activities for our Dr. Cherry Pathway to Healing®product line into RHL’s existing operations. The new reportable segments are as follows:
Private label contract manufacturing, in which we primarily provide manufacturing services to companies that market and distribute nutritional supplements and other health care products; and
Branded products, in which we market and distribute branded nutritional supplements and other lifestyle products in the following distribution channels:
• | Direct-to-consumer marketing programs, under which we develop, manufacture and market our own products and work with nationally recognized physicians and others to develop brand name products that reflect their individual approaches to restoring, maintaining or improving health. These products are sold through a variety of distribution channels, including television programs, print media and the internet. The Dr. Cherry Pathway to Healing®product line is sold under a direct-to-consumer marketing program; |
• | Food, Drug and Mass Market (FDM) retail channel in which we sell the Real Health® Laboratories nutritional supplement product line; and |
• | As We Change® (AWC) catalog, a lifestyle catalog geared towards women between the ages of 45 and 65, in which we sell our own branded products as well as third party products. The quarterly print catalog offers a variety of high quality nutritional, beauty, skin care, exercise, lifestyle and other personal care products. |
We evaluate performance based on a number of factors. The primary performance measures for each segment are net sales and income or loss from operations before corporate allocations. Operating income or loss for each segment does not include corporate general and administrative expenses, interest expense and other miscellaneous income and expense items. Corporate general and administrative expenses include, but are not limited to: human resources, legal, finance, information technology, and other corporate level related expenses, which are not allocated to either segment. The accounting policies of our segments are the same as those described in the summary of significant accounting policies in Note A.
Our operating results by business consistssegment shown below for the fiscal years ended June 30, 2006 and 2005 have been restated to reflect our new reporting segments, with the exception of onethe information on total assets as we believe it would be impractical to restate such information. Accordingly, the total asset information is provided only for our new reporting segments as of June 30, 2007. Our operating results by business segment for the development,years ended June 30 were as follows (dollars in thousands):
| 2007 | 2006 | 2005 | ||||||||||
Net Sales | ||||||||||||
Private label contract manufacturing | $ | 80,732 | $ | 85,758 | $ | 83,862 | ||||||
Branded products | 16,396 | 13,854 | 8,110 | |||||||||
| $ | 97,128 | $ | 99,612 | $ | 91,972 | |||||||
| 2007 | 2006 | 2005 | ||||||||||
Income (loss) from Operations | ||||||||||||
Private label contract manufacturing | $ | 10,315 | $ | 10,347 | $ | 8,787 | ||||||
Branded products(1) | (8,260 | ) | 757 | 1,804 | ||||||||
Income from operations of reportable segments | 2,055 | 11,104 | 10,591 | |||||||||
Corporate expenses not allocated to segments | (6,774 | ) | (6,486 | ) | (6,799 | ) | ||||||
| $ | (4,719 | ) | $ | 4,618 | $ | 3,792 | ||||||
(1) | Fiscal 2007 operating loss included non-cash goodwill impairment charge of $7.0 million. |
| 2007 | |||
Total Assets | |||
Private label contract manufacturing | $ | 39,583 | |
Branded products | 7,797 | ||
| $ | 47,380 | ||
Our private label contract manufacturing marketing and distribution of nutritional supplements. Our products are sold both in the United States and in markets outside the United States, including Europe, Australia and Japan. Our primary market outside the United States is Europe.
Our branded products are only sold in the United States.
Net sales by geographic region, based upon the customers’ location, for the three years ended June 30 were as follows (dollars in thousands):
| Year Ended June 30 | |||||||||
| 2005 | 2004 | 2003 | |||||||
United States | $ | 67,784 | $ | 56,350 | $ | 41,838 | |||
Markets Outside the United States | 23,708 | 22,184 | 14,124 | ||||||
Total Net Sales | $ | 91,492 | $ | 78,534 | $ | 55,962 | |||
| 2007 | 2006 | 2005 | |||||||
United States | $ | 76,308 | $ | 78,955 | $ | 68,140 | |||
Markets outside the United States | 20,820 | 20,657 | 23,832 | ||||||
Total net sales | $ | 97,128 | $ | 99,612 | $ | 91,972 | |||
Products manufactured by NAIE accounted for 46%45% of net sales in markets outside the United States in fiscal 2005, 42%2007, 49% in fiscal 20042006, and 51%46% in fiscal 2003.
2005. No products manufactured by NAIE were sold in the United States during the fiscal years ended June 30, 2005, 20042007, 2006 and 2003.
2005.
Assets and capital expenditures by geographic region, based on the location of the company or subsidiary at which they were located or made, for the three years ended June 30 were as follows (dollars in thousands):
2005 | Long-Lived Assets | Total Assets | Capital Expenditures | |||||||||||||||
2007 | Long-Lived Assets | Total Assets | Capital Expenditures | |||||||||||||||
United States | $ | 17,144 | $ | 40,470 | $ | 7,397 | $ | 17,362 | $ | 41,493 | $ | 1,681 | ||||||
Europe | 1,053 | 3,668 | 309 | 1,965 | 5,887 | 1,048 | ||||||||||||
| $ | 18,197 | $ | 44,138 | $ | 7,706 | $ | 19,327 | $ | 47,380 | $ | 2,729 | |||||||
2004 | Long-Lived Assets | Total Assets | Capital Expenditures | |||||||||||||||
United States | $ | 10,833 | $ | 38,625 | $ | 3,138 | ||||||||||||
Europe | 1,135 | 3,843 | 184 | |||||||||||||||
| $ | 11,968 | $ | 42,468 | $ | 3,322 | |||||||||||||
2003 | Long-Lived Assets | Total Assets | Capital Expenditures | |||||||||||||||
United States | $ | 9,996 | $ | 26,724 | $ | 755 | ||||||||||||
Europe | 1,362 | 4,000 | 222 | |||||||||||||||
| $ | 11,358 | $ | 30,724 | $ | 977 | |||||||||||||
2006 | Long-Lived Assets | Total Assets | Capital Expenditures | ||||||
United States | $ | 27,735 | $ | 57,661 | $ | 1,835 | |||
Europe | 1,202 | 4,792 | 460 | ||||||
| $ | 28,937 | $ | 62,453 | $ | 2,295 | ||||
2005 | Long-Lived Assets | Total Assets | Capital Expenditures | ||||||
United States | $ | 17,144 | $ | 40,470 | $ | 7,397 | |||
Europe | 1,053 | 3,668 | 309 | ||||||
| $ | 18,197 | $ | 44,138 | $ | 7,706 | ||||
SCHEDULE II
Natural Alternatives International, Inc.
Valuation And Qualifying Accounts
For Thethe Years Ended June 30, 2005, 20042007, 2006 and 20032005
(Dollars in thousands)
| (Dollars in thousands) | Balance at Beginning of Period | Provision | (Deductions) | Balance at End of Period | ||||||||||||||||||||||||
| Balance at Beginning of Period | Provision | (Deductions) | Balance at End of Period | |||||||||||||||||||||||||
Fiscal year ended June 30, 2007: | ||||||||||||||||||||||||||||
Inventory reserves | $ | 2,416 | $ | 1,415 | $ | (1,722 | )(3) | $ | 2,109 | |||||||||||||||||||
Allowance for doubtful accounts | $ | 217 | $ | (41 | ) | $ | (156 | ) | $ | 20 | ||||||||||||||||||
Fiscal year ended June 30, 2006: | ||||||||||||||||||||||||||||
Inventory reserves | $ | 1,815 | $ | 1,594 | (1) | $ | (993 | ) | $ | 2,416 | ||||||||||||||||||
Allowance for doubtful accounts | $ | 221 | $ | 57 | (2) | $ | (61 | ) | $ | 217 | ||||||||||||||||||
Fiscal year ended June 30, 2005: | ||||||||||||||||||||||||||||
Inventory reserves | $ | 1,113 | $ | 1,529 | $ | (827 | ) | $ | 1,815 | $ | 1,113 | $ | 1,529 | $ | (827 | ) | $ | 1,815 | ||||||||||
Allowance for doubtful accounts | $ | 132 | $ | 101 | $ | (12 | ) | $ | 221 | $ | 132 | $ | 101 | $ | (12 | ) | $ | 221 | ||||||||||
Fiscal year ended June 30, 2004: | ||||||||||||||||||||||||||||
Inventory reserves | $ | 708 | $ | 965 | $ | (560 | ) | $ | 1,113 | |||||||||||||||||||
Allowance for doubtful accounts | $ | 27 | $ | 106 | $ | (1 | ) | $ | 132 | |||||||||||||||||||
Fiscal year ended June 30, 2003: | ||||||||||||||||||||||||||||
Inventory reserves | $ | 1,467 | $ | 19 | $ | (778 | ) | $ | 708 | |||||||||||||||||||
Allowance for doubtful accounts | $ | 105 | $ | (46 | ) | $ | (32 | ) | $ | 27 | ||||||||||||||||||
| (1) | Includes $77,000 related to purchase price accounting for the RHL acquisition. |
| (2) | Includes $160,000 related to purchase price accounting for the RHL acquisition. |
| (3) | Includes $523,000 of raw material inventory used to produce finished good inventory that was sold during fiscal 2007. The raw material inventory was reserved before fiscal 2007. |
| ITEM 9. | CHANGES IN AND DISAGREEMENTS WITH ACCOUNTANTS ON ACCOUNTING AND FINANCIAL DISCLOSURE |
None.
None.
ITEM 9A. CONTROLS AND PROCEDURES
| ITEM 9A. | CONTROLS AND PROCEDURES |
We maintain certain disclosure controls and procedures.procedures as defined under the Securities Exchange Act of 1934. They are designed to help ensure that material information is: (1) gathered and communicated to our management, including our principal executive and financial officers, onin a manner that allows for timely basis;decisions regarding required disclosures; and (2) recorded, processed, summarized, reported and filed with the SEC as required under the Securities Exchange Act of 1934.
1934 and within the time periods specified by the SEC.
Our management, with the participation of our Chief Executive Officer and Chief Financial Officer, evaluated the effectiveness of the design and operation of our disclosure controls and procedures as of June 30, 2005.2007. Based on theirsuch evaluation, theyour Chief Executive Officer and Chief Financial Officer concluded that our disclosure controls and procedures were not effective for their intended purpose described above. above as of June 30, 2007 because of the material weakness identified below.
A material weakness is a deficiency, or a combination of deficiencies, in internal control over financial reporting, such that there is a reasonable possibility that a material misstatement of our annual or interim financial statements will not be prevented or detected on a timely basis. Management has determined that a material weakness in internal control over financial reporting existed as of June 30, 2007 regarding our annual goodwill impairment analysis. In particular, management has determined that we did not have an appropriate process in place to develop and support the forecasts and plans necessary to complete our annual goodwill impairment analysis in a timely manner. As a result, while we were able to complete our analysis and record an adjustment to impair goodwill in our financial statements before their publication in this report, we were unable to timely file this report.
There were no changes to our internal controls during the fourth quarter ended June 30, 20052007 that have materially affected, or that are reasonably likely to materially affect, our internal controls. The matter identified above and the steps necessary to remediate such weakness are under review by management and our Board of Directors. In addition, at the end of our 2008 fiscal year, management will be required to provide an assessment of the effectiveness of our internal control over financial reporting. We are in the process of performing the system and process documentation, evaluation and testing required for management to make this assessment. We have not completed this process or our assessment. In the course of evaluation and testing, management may identify additional deficiencies that will need to be addressed and remediated. There can be no assurance that our remediation efforts will be successful or that our control procedures will be effective in accomplishing their objectives at all times.
| ITEM 9B. | OTHER INFORMATION |
None.
ITEM 9B. OTHER INFORMATIONPART III
None.
ITEM 10. DIRECTORS AND EXECUTIVE OFFICERS
| ITEM 10. | DIRECTORS, EXECUTIVE OFFICERS AND CORPORATE GOVERNANCE |
The information for this item is incorporated by reference to the sections “Our Board of Directors,” “Our Executive Officers,” “Section 16(a) Beneficial Ownership Reporting Compliance,” and “Code of Ethics” in our definitive proxy statement for our Annual Meeting of Stockholders to be held on December 2, 2005,11, 2007, to be filed on or before October 28, 2005.2007.
ITEM 11. EXECUTIVE COMPENSATION
| ITEM 11. | EXECUTIVE COMPENSATION |
The information for this item is incorporated by reference to the sections “Director Compensation” and “Executive Officer Compensation” in our definitive proxy statement for our Annual Meeting of Stockholders to be held on December 2, 2005,11, 2007, to be filed on or before October 28, 2005.2007.
ITEM 12. SECURITY OWNERSHIP OF CERTAIN BENEFICIAL OWNERS AND MANAGEMENT AND RELATED STOCKHOLDER MATTERS
| ITEM 12. | SECURITY OWNERSHIP OF CERTAIN BENEFICIAL OWNERS AND MANAGEMENT AND RELATED STOCKHOLDER MATTERS |
The information for this item is incorporated by reference to the sections “Stock Holdings of Certain Owners and Management” and “Securities Authorized for Issuance Under Equity Compensation Plans” in our definitive proxy statement for our Annual Meeting of Stockholders to be held on December 2, 2005,11, 2007, to be filed on or before October 28, 2005.2007.
ITEM 13. CERTAIN RELATIONSHIPS AND RELATED TRANSACTIONS
| ITEM 13. | CERTAIN RELATIONSHIPS AND RELATED TRANSACTIONS, AND DIRECTOR INDEPENDENCE |
The information for this item is incorporated by reference to the section “Certain Relationships and Related Transactions” in our definitive proxy statement for our Annual Meeting of Stockholders to be held on December 2, 2005,11, 2007, to be filed on or before October 28, 2005.2007.
ITEM 14. PRINCIPAL ACCOUNTING FEES AND SERVICES
| ITEM 14. | PRINCIPAL ACCOUNTING FEES AND SERVICES |
The information for this item is incorporated by reference to the sections “Audit Fees,” “Audit-Related Fees,” “Tax Fees,” “All Other Fees” and “Pre-Approval Polices and Procedures” in our definitive proxy statement for our Annual Meeting of Stockholders to be held on December 2, 2005,11, 2007, to be filed on or before October 28, 2005.2007.
ITEM 15. EXHIBITS AND FINANCIAL STATEMENT SCHEDULES
| ITEM 15. | EXHIBITS AND FINANCIAL STATEMENT SCHEDULES |
The following documents are filed as part of this report:
| (1) | Financial Statements. The financial statements listed below are included under Item 8 of this report: |
Consolidated Balance Sheets as of June 30, 20052007 and 2004;2006;
Consolidated Statements of IncomeOperations and Comprehensive Income (Loss) for the years ended June 30, 2005, 20042007, 2006 and 2003;2005;
Consolidated Statements of Stockholders’ Equity for the years ended June 30, 2005, 20042007, 2006 and 2003;2005;
Consolidated Statements of Cash Flows for the years ended June 30, 2005, 20042007, 2006 and 2003;2005; and
Notes to Consolidated Financial Statements.
| (2) | Financial Statement Schedule. The following financial statement schedule is included under Item 8 of this report: |
Schedule II - Valuation and Qualifying Accounts for the years ended June 30, 2005, 20042007, 2006 and 2003.2005.
| (3) | Exhibits. The following exhibit index shows those exhibits filed with this report and those incorporated by reference: |
EXHIBIT INDEX
| Exhibit Number | Description | Incorporated By Reference To | ||
| 3(i) | Amended and Restated Certificate of Incorporation of Natural Alternatives International, Inc. filed with the Delaware Secretary of State on January 14, 2005 | Exhibit 3(i) of NAI’s Quarterly Report on Form 10-Q for the quarterly period ended December 31, 2004, filed with the commission on February 14, 2005 | ||
| 3(ii) | By-laws of Natural Alternatives International, Inc. dated as of December 21, 1990 | NAI’s Registration Statement on Form S-1 (File No. 33-44292) filed with the commission on December 21, 1992 | ||
| 3(iii) | Amendment to the By-laws of Natural Alternatives International, Inc. effective as of June 29, 2007 | Exhibit 3(ii) of NAI’s Current Report on Form 8-K dated June 29, 2007, filed with the commission on July 6, 2007 | ||
| 4(i) | Form of NAI’s Common Stock Certificate | |||
| 10.1 | 1999 Omnibus Equity Incentive Plan as adopted effective May 10, 1999, amended effective January 30, 2004, and further amended effective December 3, | Exhibit 10.1 of NAI’s Quarterly Report on Form 10-Q for the quarterly period ended December 31, 2004, filed with the commission on February 14, 2005 | ||
| 10.2 | 1999 Employee Stock Purchase Plan as adopted effective October 18, 1999 | Exhibit B of NAI’s definitive Proxy Statement filed with the commission on October 21, 1999 | ||
| 10.3 | Management Incentive | Exhibit 10.3 of NAI’s Quarterly Report on Form 10-Q for the quarterly period ended September 30, 2003, filed with the commission on November 5, 2003 | ||
| 10.4 | Amended and Restated Employment Agreement dated as of January 30, 2004, by and between NAI and | Exhibit | ||
| 10.5 | Amended and Restated Employment Agreement dated as of January 30, 2004, by and between NAI and | Exhibit | ||
| 10.6 | Amended and Restated Employment Agreement dated as of January 30, 2004, by and between NAI and | |||
| Exhibit 10.8 of NAI’s Annual Report on Form 10-K for the fiscal year ended June 30, 2004, filed with the commission on September 14, 2004 | ||||
| Amended and Restated Exclusive License Agreement effective as of September 1, 2004 by and among NAI and Dr. Reginald B. Cherry | Exhibit 10.11 of NAI’s Annual Report on Form 10-K for the fiscal year ended June 30, 2004, filed with the commission on September 14, 2004 | |||
| Exclusive License Agreement effective as of September 1, 2004 by and among NAI and Reginald B. Cherry Ministries, Inc. | Exhibit 10.12 of NAI’s Annual Report on Form 10-K for the fiscal year ended June 30, 2004, filed with the commission on September 14, 2004 | |||
| First Amendment to Exclusive License Agreement effective as of December 10, 2004 by and among NAI and Reginald B. Cherry Ministries, Inc. | Exhibit 10.3 of NAI’s Quarterly Report on Form 10-Q for the quarterly period ended December 31, 2004, filed with the commission on February 14, 2005 | |||
| Lease of Facilities in Vista, California between NAI and Calwest Industrial Properties, LLC, a California limited liability company | Exhibit 10.10 of NAI’s Quarterly Report on Form 10-Q for the quarterly period ended September 30, 2003, filed with the commission on November 5, 2003 | |||
| Credit Agreement dated as of May 1, 2004 by and between NAI and Wells Fargo Bank, National Association | Exhibit 10.11 of NAI’s Quarterly Report on Form 10-Q for the quarterly period ended March 31, 2004, filed with the commission on May 17, 2004 | |||
| First Amendment to Credit Agreement dated as of February 1, 2005 by and between NAI and Wells Fargo Bank, National Association | Exhibit 10.1 of NAI’s Current Report on Form 8-K dated February 1, 2005, filed with the commission on February 7, 2005 | |||
| Form of Indemnification Agreement entered into between NAI and each of its directors | Exhibit 10.15 of NAI’s Annual Report on Form 10-K for the fiscal year ended June 30, 2004, filed with the commission on September 14, 2004 | |||
| Lease of Facilities in Manno, Switzerland between NAIE and Mr. Silvio Tarchini dated May 9, 2005 (English translation) | Exhibit 10.19 of NAI’s Quarterly Report on Form 10-Q for the quarterly period ended March 31, 2005, filed with the commission on May 13, 2005 | |||
| Lease of Facilities in Manno, Switzerland between NAIE and Mr. Silvio Tarchini dated July 25, 2003 (English translation) | ||||
| Lease of Facilities in Manno, Switzerland between NAIE and Mr. Silvio Tarchini dated June 8, 2004 (English translation) | ||||
| Lease of Facilities in Manno, Switzerland between NAIE and Mr. Silvio Tarchini dated February 7, 2005 (English translation) | ||||
| License Agreement effective as of April 28, 1997 by and among Roger Harris, Mark Dunnett and NAI | ||||
| Amendment to License Agreement effective as of March 17, 2001 by and among Roger Harris, Mark Dunnett and NAI | Exhibit 10.23 of NAI’s Annual Report on Form 10-K for the fiscal year ended June 30, 2005, filed with the commission on September 8, 2005 | |||
| 10.20 | Amendment effective as of September 15, 2005 to Lease of Facilities in Manno, Switzerland between NAIE and Mr. Silvio Tarchini dated May 9, 2005 (English translation) | Exhibit 10.24 of NAI’s Quarterly Report on Form 10-Q for the quarterly period ended September 30, 2005, filed with the commission on November 4, 2005 | ||
| 10.21 | Stock Purchase Agreement effective as of December 5, 2005, by and among NAI and William H. Bunten II and/or Elizabeth W. Bunten, as the trustees of The Bunten Family Trust dated April 14, 2001, John F. Dullea and Carolyn A. Dullea, as the trustees of The John F. and Carolyn A. Dullea Trust dated June 20, 2001, Lincoln Fish, and Michael L. Irwin, as trustee of The Michael L. Irwin Trust u/t/a June 25, 1991 | Exhibit 10.1 of NAI’s Current Report on Form 8-K dated December 5, 2005, filed with the commission on December 9, 2005 | ||
| 10.22 | Form of Lock-Up Agreement effective as of December 5, 2005 entered into between NAI and each Selling Stockholder | Exhibit 10.2 of NAI’s Current Report on Form 8-K dated December 5, 2005, filed with the commission on December 9, 2005 | ||
| 10.23 | Employment Agreement effective as of December 5, 2005, by and between RHL and John F. Dullea* | Exhibit 10.3 of NAI’s Current Report on Form 8-K dated December 5, 2005, filed with the commission on December 9, 2005 | ||
| 10.24 | Lease of RHL Facilities in San Diego, California between RHL and Lessor dated February 5, 2003 | Exhibit 10.4 of NAI’s Current Report on Form 8-K dated December 5, 2005, filed with the commission on December 9, 2005 | ||
| 10.25 | Promissory Note made by NAI for the benefit of Wells Fargo Equipment Finance, Inc. in the amount of $3,800,000 | Exhibit 10.5 of NAI’s Current Report on Form 8-K dated December 5, 2005, filed with the commission on December 9, 2005 | ||
| 10.26 | Patent License Agreement by and between Unither Pharma, Inc. and RHL dated May 1, 2002 | Exhibit 10.6 of NAI’s Current Report on Form 8-K dated December 5, 2005, filed with the commission on December 9, 2005 | ||
| 10.27 | Second Amendment to Credit Agreement dated as of December 1, 2005 by and between NAI and Wells Fargo Bank, National Association | Exhibit 10.30 of NAI’s Quarterly Report on Form 10-Q for the quarterly period ended December 31, 2005, filed with the commission on February 14, 2006 | ||
| 10.28 | Exclusive License Agreement by and between NAI and Richard Linchitz, M.D. effective as of August 23, 2005 | Exhibit 10.32 of NAI’s Quarterly Report on Form 10-Q for the quarterly period ended December 31, 2005, filed with the commission on February 14, 2006 | ||
| 10.29 | Letter amendment to Lease of RHL Facilities in San Diego, California between RHL and Lessor dated January 10, 2006 | Exhibit 10.33 of NAI’s Quarterly Report on Form 10-Q for the quarterly period ended December 31, 2005, filed with the commission on February 14, 2006 | ||
| 10.30 | First Amendment to Lease of Facilities in Vista, California between NAI and Calwest Industrial Properties, LLC, a California limited liability company, effective December 21, 2004 | Exhibit 10.34 of NAI’s Quarterly Report on Form 10-Q for the quarterly period ended December 31, 2005, filed with the commission on February 14, 2006 | ||
| 10.31 | Second Amendment to Lease of Facilities in Vista, California between NAI and Calwest Industrial Properties, LLC, a California limited liability company, effective January 13, 2006 | Exhibit 10.35 of NAI’s Quarterly Report on Form 10-Q for the quarterly period ended December 31, 2005, filed with the commission on February 14, 2006 | ||
| 10.32 | Third Amendment to Credit Agreement dated as of March 15, 2006 by and between NAI and Wells Fargo Bank, National Association | Exhibit 10.35 of NAI’s Quarterly Report on Form 10-Q for the quarterly period ended March 31, 2006, filed with the commission on May 9, 2006 | ||
| 10.33 | Standard Sublease Multi-Tenant by and between J. Gelt Corporation dba Casa Pacifica and RHL (lease reference date March 6, 2006) | Exhibit 10.37 of NAI’s Annual Report on Form 10-K for the fiscal year ended June 30, 2006, filed with the commission on September 18, 2006 | ||
| 10.34 | Loan Agreement between NAIE and Credit Suisse dated as of September 22, 2006, including general conditions (portions of the Loan Agreement have been omitted pursuant to a request for confidential treatment) | Exhibit 10.36 of NAI’s Quarterly Report on Form 10-Q for the quarterly period ended September 30, 2006, filed with the commission on November 1, 2006 | ||
| 10.35 | Employment Agreement effective as of November 20, 2006, by and between NAI and Alvin McCurdy* | Exhibit 10.1 of NAI’s Current Report on Form 8-K dated November 20, 2006, filed with the commission on November 21, 2006 | ||
| 10.36 | Fourth Amendment to Credit Agreement dated as of November 1, 2006, and entered into on January 24, 2007, by and between NAI and Wells Fargo Bank, National Association | Exhibit 10.37 of NAI’s Quarterly Report on Form 10-Q for the quarterly period ended December 31, 2006, filed with the commission on January 30, 2007 | ||
| 10.37 | Revolving Line of Credit Note (as revised) made by NAI for the benefit of Wells Fargo Bank, National Association in the amount of $12,000,000 | Exhibit 10.38 of NAI’s Quarterly Report on Form 10-Q for the quarterly period ended December 31, 2006, filed with the commission on January 30, 2007 | ||
| 10.38 | Sublease Contract for facilities in Manno, Switzerland, between NAIE and Vertime SA effective as of April 1, 2007 (portions of the Sublease Contract have been omitted pursuant to a request for confidential treatment) (English translation) | Exhibit 10.39 of NAI’s Quarterly Report on Form 10-Q for the quarterly period ended March 31, 2006, filed with the commission on May 14, 2007 | ||
| 10.40 | Second Amendment to License Agreement Amending The First Amendment Dated March 17, 2001 to License Agreement Dated April 28, 1997 by and among Roger Harris, Mark Dunnett and NAI dated as of March 26, 2007 | Exhibit 10.40 of NAI’s Quarterly Report on Form 10-Q for the quarterly period ended March 31, 2007, filed with the commission on May 14, 2007 | ||
| 10.41 | First Amendment to Loan Agreement between NAIE and Credit Suisse dated as of February 19, 2007 | Exhibit 10.41 of NAI’s Quarterly Report on Form 10-Q for the quarterly period ended March 31, 2007, filed with the commission on May 14, 2007 | ||
| 10.42 | Settlement Agreement and Release of Claims and Rights between NAI and DHL Express, Inc. dated April 16, 2007 | Exhibit 10.42 of NAI’s Quarterly Report on Form 10-Q for the quarterly period ended March 31, 2007, filed with the commission on May 14, 2007 | ||
| 10.43 | Settlement Agreement executed as of June 26, 2006, by and between Novogen Research Pty. Ltd. and NAI | Exhibit 10.36 of NAI’s Annual Report on Form 10-K for the fiscal year ended June 30, 2006, filed with the commission on September 18, 2006 | ||
| 10.44 | Consulting Agreement effective as of July 1, 2007, by and between Dr. John A. Wise and NAI | Filed herewith | ||
| 21 | Subsidiaries of the Company | Filed herewith | ||
| 23.1 | Consent of Independent Registered Public Accounting Firm | Filed herewith | ||
| 31.1 | Rule 13a-14(a)/15d-14(a) Certification of Chief Executive Officer | Filed herewith | ||
| 31.2 | Rule 13a-14(a)/15d-14(a) Certification of Chief Financial Officer | Filed herewith | ||
| 32 | Section 1350 Certification | Filed herewith | ||
| * | Indicates management contract or compensatory plan or arrangement. |
Pursuant to the requirements of Section 13 or 15(d) of the Securities Exchange Act of 1934, Natural Alternatives International, Inc., the registrant, has duly caused this report to be signed on its behalf by the undersigned, thereunto duly authorized.
Date: September 8, 2005October 15, 2007
| NATURAL ALTERNATIVES INTERNATIONAL, INC. | ||
| By: | /s/ Mark A. LeDoux | |
| Mark A. LeDoux, Chief Executive Officer | ||
Pursuant to the requirements of the Securities Exchange Act of 1934, this report has been signed below by the following persons on behalf of Natural Alternatives International, Inc., in the capacities and on the dates indicated.
Signature | Title | Date | ||
/s/ Mark A. LeDoux (Mark A. LeDoux) | Chief Executive Officer and
(principal executive officer) | |||
/s/ John R. Reaves (John R. Reaves) | Chief Financial Officer (principal financial officer and
| |||
/s/ Joe E. Davis (Joe E. Davis) | Director | |||
/s/ Alan G. Dunn (Alan G. Dunn) | Director | |||
/s/ Alan J. Lane (Alan J. Lane) | Director | |||
/s/ Lee G. Weldon (Lee G. Weldon) | Director | |||
5265