PAGE 9
Item 1A. RISK FACTORS — continued
changes in accounting policies or procedures as may be required by the Financial Accounting Standards Board or other regulatory agencies
If S&T does not adjust to changes in the financial services industry, its financial performance may suffer.
S&T’s ability to maintain its history of strong financial performance and return on investment to shareholders will depend in part on its ability to expand its scope of available financial services to its customers. In addition to other banks, competitors include security dealers, brokers, mortgage bankers, investment advisors, and finance and insurance companies. The increasingly competitive environment is, in part, a result of changes in regulation, changes in technology and product delivery systems, and the accelerating pace of consolidation among financial service providers.
PAGE 9
Item 1A. RISK FACTORS — continued
Future governmental regulation and legislation could limit our growth.
S&T is subject to extensive state and federal regulation, supervision and legislation that govern nearly every aspect of our operations. Changes to these laws could affect our ability to deliver or expand our services and diminish the value of our business. See “Supervision and Regulation” for additional information.
ChangesInterest rate movements impact the earnings of S&T.
S&T is exposed to interest rate risk, through the operations of its banking subsidiary, since substantially all of S&T Bank’s assets and liabilities are monetary in nature. Interest rate risk arises from market driven fluctuations in interest rates could reducethat affect cash flows, income, expense and cash flow.
value of financial instruments. S&T’s&T Bank’s earnings, like that of most financial institutions, largely depend on net interest income, and cash flow depends to a great extent onwhich is the difference between the interest income earned on interest-earning assets, such as loans and investments, and the interest expense paid on interest-bearing liabilities, such as deposits and borrowings. In an increasing interest rate environment, the cost of funds is expected to increase more rapidly than the interest earned on the loans and securities because the primary source of funds are deposits with generally shorter maturities than the maturities on loans and investment securities,securities. This causes the net interest rate spread to compress and negatively impact S&T Bank’s profitability.
S&T’s business strategy includes growth plans through internal growth and acquisitions. Our financial condition and results of operations could be negatively affected if we fail to grow or fail to manage our growth effectively.
S&T intends to continue pursuing a profitable growth strategy. Our prospects must be considered in light of the interest paidrisks, expenses and difficulties frequently encountered by companies in growth stages of development. We cannot assure you that we will be able to expand our market presence in our existing markets or successfully enter new markets or that any such expansion will not adversely affect our results of operations. Failure to manage our growth effectively could have a material adverse effect on depositsour business, future prospects, financial condition or results of operations and could adversely affect our ability to successfully implement our business strategy. Also, if we grow more slowly than anticipated, our operating results could be materially adversely affected.
Our ability to grow successfully will depend on a variety of factors including the continued availability of desirable business opportunities, the competitive responses from other borrowings. Interest ratesfinancial institutions in our market areas and our ability to manage our growth. While we believe we have the management resources and internal systems in place to successfully manage our future growth, there can be no assurance that growth opportunities will be available or that growth will be successfully managed.
Downturn in the local economies may adversely affect our business.
S&T’s business is concentrated in the western-Pennsylvania area. As a result, its financial condition, results of operations and cash flows are beyond our control, and they fluctuatesubject to changes if there are changes in response to generalthe economic conditions in this area. A prolonged period of economic recession or other adverse economic conditions in this area could have a negative impact on S&T. S&T can provide no assurance that conditions in its market area economies will not deteriorate in the future and the policies of various governmental and regulatory agencies, in particular, the Federal Reserve Board. Changes in monetary policy, including changes in interest rates, will influence the origination of loans, the purchase of investments, the generation of deposits and the rates receivedthat such deterioration would not have a material adverse effect on loans and investment securities and paid on deposits. Although increases in interest rates would result in additional interest income from each new loan made or serviced, the number of new loans is likely to decrease as interest rates rise. Any revenue reductions from fewer loans and increased interest expense paid in connection with borrowed funds and deposits may not be offset by the higher income as a result of increased interest rates.S&T.
Item 1B. UNRESOLVED STAFF COMMENTS
There were no unresolved comments received from the Securities and Exchange CommissionSEC regarding S&T’s periodic or current reports within the last 180 days prior to December 31, 2005.2006.
PAGE 10
S&T operates 5049 banking offices in Allegheny, Armstrong, Blair, Butler, Cambria, Clarion, Clearfield, Indiana, Jefferson, Westmoreland and surrounding counties in Pennsylvania.
S&T owns land and banking offices at the following locations:
133 Philadelphia Street Armagh, PA 15920 | 205 East Market Street Blairsville, PA 15717 | 111 Resort Plaza Drive Blairsville, PA 15717 | 456 Main Street Brockway, PA 15824 | |||
256 Main Street Brookville, PA 15825 | 209 Allegheny Boulevard Brookville, PA 15825 | 100 South Chestnut Street Derry, PA 15627 | 410 Main Street Clarion, PA 16214 | |||
650 Main Street Clarion, PA 16214 | 85 Greensburg Street Delmont, PA 15626 | 200 Patchway Road Duncansville, PA 16635 | 614 Liberty Boulevard DuBois, PA 15801 | |||
Coral Reef & Crooked Island Roads DuBois, PA 15801 | 35 West Scribner Avenue DuBois, PA 15801 | 34 North Main Street Homer City, PA 15748 | 420 Pleasantview Drive & Armstrong Street Ford City, PA 16226 | |||
920 Fifth Avenue Ford City, PA 16226 | 701 East Pittsburgh Street Greensburg, PA 15601 |
225 Lucerne Road Lucernemines, PA 15754 | 2175 Route 286 South Indiana, PA 15701 | |||
100 South Fourth Street Youngwood, PA 15697 | 501 Philadelphia Street Indiana, PA 15701 | 2190 Hulton Road Verona, PA 15147 | 4385 Old Wm. Penn Hwy Monroeville, PA 15146 | |||
4251 Old Wm. Penn Hwy Murrysville, PA 15668 | 628 Broad Street New Bethlehem, PA 16242 | 539 West Mahoning Street Punxsutawney, PA 15767 | 12262 Frankstown Road Pittsburgh, PA 15235 | |||
301 Unity Center Road Pittsburgh, PA 15239 | 7660 Saltsburg Road Pittsburgh, PA 15239 | 30 Towne Center Drive Leechburg, PA 15656 | 232 Hampton Avenue Punxsutawney, PA 15767 | |||
418 Main Street Reynoldsville, PA 15851 | 602 Salt Street Saltsburg, PA 15681 | 800 Philadelphia Street Indiana, PA 15701 | 355 North Fifth Street Indiana, PA 15701 | |||
| 196 Industrial Park Ebensburg, PA 15931 | ||||||
S&T leases land where S&T owns the banking offices and remote ATM buildings at the following locations:
8th & Merle Street Clarion, PA 16214 | 2320 Route 286 Pittsburgh, PA 15239 | 523 Franklin Avenue Vandergrift, PA 15690 | 435 South Seventh Street Indiana, PA 15701 | |||
1107 Wayne Avenue Indiana, PA 15701 | 1176 Grant Street Indiana, PA 15701 | 229 Westmoreland Drive, Route 30 Greensburg, PA 15601 | 220 New Castle Road Butler, PA 16001 | |||
| 835 Hospital Road Indiana, PA 15701 | ||||||
PAGE 11
Item 2. PROPERTIES — continued
S&T leases land and banking offices at the following locations:
| 20001 Route 19 Suite B Cranberry Township, PA 16066 | 6700 Hollywood Delmont, PA 15626 | 5522 Shaffer Road
| 206 East High Street Ebensburg, PA 15931 | |||||
Lawruk Plaza
| 324 North Fourth Street Indiana, PA 15701 |
| 3884 Route 30 East Latrobe, PA 15650 | |||||
3100 Oakland Avenue
|
| |||||||
|
|
| Two Gateway Center 603 Stanwix Street, Suite 125
| 33 South Sixth Street Indiana, PA 15701 | ||||
| 2388 Route 286 Holiday Park, PA 15239 | Shadyside Village 820 South Aiken Avenue Pittsburgh, PA 15232 | |||||||
The nature of our business generates a certain amount of litigation involving matters arising in the ordinary course of business. However, in management’s opinion, there are no proceedings pending to which S&T is a party or to which our property is subject, which, if determined adversely to S&T, would be material in relation to our shareholders’ equity or financial condition. In addition, no material proceedings are pending nor are known to be threatened or contemplated against us by governmental authorities or other parties.
Item 4. SUBMISSION OF MATTERS TO A VOTE OF SECURITY HOLDERS
There were no matters during the fourth quarter of the fiscal year covered by this report that were submitted to a vote of our security holders through solicitation of proxies or otherwise.
PAGE 12
Item 5. MARKET FOR REGISTRANT’S COMMON EQUITY, RELATED SHAREHOLDER
MATTERS AND ISSUER REPURCHASES OF EQUITY SECURITIES
STOCK PRICES AND DIVIDEND INFORMATION
S&T’s common stock is listed on the NASDAQ NationalGlobal Select Market System (“NASDAQ”) under the symbol STBA. The range of sale prices for the years 20052006 and 20042005 are as follows and is based upon information obtained from NASDAQ. As of the close of business February 9, 2006,January 25, 2007, there were 3,1133,062 shareholders of record of S&T. Dividends paid by S&T are primarily provided from S&T Bank’s dividends to S&T. The payment of dividends by S&T Bank to S&T is subject to the restrictions described in Note J to the Consolidated Financial Statements. The cash dividends declared shown below represent the historical per share amounts for S&T Common Stock.
| Price Range of Common Stock | Cash | |||||||||||||||||
| 2006 | Low | High | ||||||||||||||||
Fourth Quarter | $ | 31.14 | $ | 35.60 | $ | 0.30 | ||||||||||||
Third Quarter | 29.67 | 33.25 | 0.29 | |||||||||||||||
Second Quarter | 31.93 | 36.68 | 0.29 | |||||||||||||||
First Quarter | 35.59 | 37.68 | 0.29 | |||||||||||||||
| Price Range of Common Stock | Cash Dividends Declared | |||||||||||||||||
| 2005 | Low | High | ||||||||||||||||
Fourth Quarter | $ | 33.95 | $ | 39.24 | $ | 0.29 | $ | 33.95 | $ | 39.24 | $ | 0.29 | ||||||
Third Quarter | 35.77 | 40.52 | 0.28 | 35.77 | 40.52 | 0.28 | ||||||||||||
Second Quarter | 33.23 | 37.46 | 0.28 | 33.23 | 37.46 | 0.28 | ||||||||||||
First Quarter | 34.95 | 38.39 | 0.28 | 34.95 | 38.39 | 0.28 | ||||||||||||
| 2004 | ||||||||||||||||||
Fourth Quarter | $ | 35.50 | $ | 38.60 | $ | 0.27 | ||||||||||||
Third Quarter | 31.18 | 36.90 | 0.27 | |||||||||||||||
Second Quarter | 27.85 | 32.14 | 0.27 | |||||||||||||||
First Quarter | 29.16 | 31.65 | 0.26 | |||||||||||||||
During 2005,2006, S&T repurchased 660,4001,031,700 shares of its common stock at an average price of $35.09$34.19 per share. The impact of the repurchased shares is insignificanta $0.02 increase to diluted earnings per share. The remaining shares authorized under this program expired at December 31, 2005. S&T reissued 330,735 shares primarily through the exercise of employee stock options. In December 2005, our Board of Directors previously authorized a planstock buyback program for our repurchase2006 of up to one million shares, or approximately 4 percent of shares outstandingoutstanding. During 2006, S&T repurchased 999,000 shares under this program at an average cost of $34.20 per share. On October 16, 2006, the S&T Board of Directors authorized a new stock buyback program until September 30, 2007 of an additional one million shares with 32,700 shares repurchased under this plan during the period January 1,fourth quarter of 2006 at an average cost of $33.63 per share. S&T reissued 122,244 shares during 2006 primarily through December 31, 2006.the exercise of employee stock options.
PAGE 13
Item 5. MARKET FOR REGISTRANT’S COMMON EQUITY, RELATED SHAREHOLDER
MATTERS AND ISSUER REPURCHASES OF EQUITY SECURITIES — continued
FIVE-YEAR CUMULATIVE TOTAL RETURN
The following chart compares the cumulative total shareholder return on S&T Common Stock with the cumulative total shareholder return of the NASDAQ Composite Index and1NASDAQ Bank Index assuming a $100 investment in each on December 31, 2001.
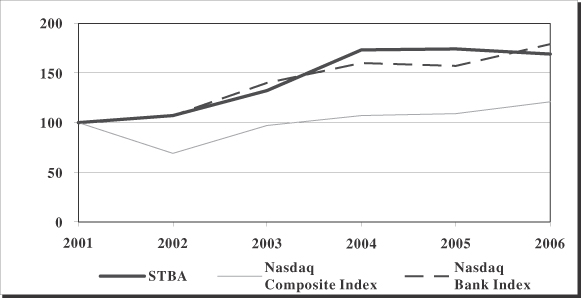
| 2001 | 2002 | 2003 | 2004 | 2005 | 2006 | |||||||||||||
STBA | $ | 100 | $ | 107 | $ | 132 | $ | 173 | $ | 174 | $ | 169 | ||||||
Nasdaq Composite Index | 100 | 69 | 97 | 107 | 109 | 121 | ||||||||||||
Nasdaq Bank Index | 100 | 107 | 140 | 160 | 157 | 179 | ||||||||||||
| 1 | The NASDAQ Bank Index contains securities of NASDAQ-listed companies classified according to the Industry Classification Benchmark as Banks. They include banks providing a broad range of financial services, including retail banking, loans and money transmissions. |
PAGE 14
Item 5. MARKET FOR REGISTRANT’S COMMON EQUITY, RELATED SHAREHOLDER
MATTERS AND ISSUER REPURCHASES OF EQUITY SECURITIES — continued
The following information describes the activity that has taken place during 20052006 with respect to S&T’s share repurchase plan:
| Period | Total Number of Shares Purchased | Average Price Paid per Share | Total Number of Shares Purchased as Part of Publicly Announced Plans | Maximum Number of Shares that Can be Purchased Under the Plan | |||||
01/01/2005 – 01/31/2005(1)(2)(3) | — | — | — | 1,000,000 | |||||
02/01/2005 – 02/28/2005 | — | — | — | 1,000,000 | |||||
03/01/2005 – 03/31/2005 | 115,000 | $ | 36.21 | 115,000 | 885,000 | ||||
04/01/2005 – 04/30/2005 | 129,100 | 33.83 | 129,100 | 755,900 | |||||
05/01/2005 – 05/31/2005 | 194,500 | 34.90 | 194,500 | 561,400 | |||||
06/01/2005 – 06/30/2005 | 79,900 | 35.41 | 79,900 | 481,500 | |||||
07/01/2005 – 07/31/2005 | — | — | — | 481,500 | |||||
08/01/2005 – 08/31/2005 | — | — | — | 481,500 | |||||
09/01/2005 – 09/30/2005 | 4,000 | 36.96 | 4,000 | 477,500 | |||||
10/01/2005 – 10/31/2005 | 126,900 | 35.24 | 126,900 | 350,600 | |||||
11/01/2005 – 11/30/2005 | — | — | — | 350,600 | |||||
12/01/2005 – 12/31/2005 | 11,000 | 36.94 | 11,000 | 339,600 | |||||
Total | 660,400 | $ | 35.09 | 660,400 | 339,600 | ||||
| Period | Total Number of Shares Purchased | Average Price Paid per Share | Total Number of Shares Purchased as Part of Publicly Announced Plans | Maximum Number of Shares that Can Be Purchased Under the Plans | |||||
01/01/2006 – 01/31/2006(1)(2)(3) | 40,000 | $ | 36.30 | 40,000 | |||||
02/01/2006 – 02/28/2006 | 33,000 | 36.13 | 33,000 | ||||||
03/01/2006 – 03/31/2006 | 131,000 | 35.88 | 131,000 | ||||||
04/01/2006 – 04/30/2006 | 175,000 | 35.43 | 175,000 | ||||||
05/01/2006 – 05/31/2006 | 225,000 | 35.11 | 225,000 | ||||||
06/01/2006 – 06/30/2006 | — | — | — | ||||||
07/01/2006 – 07/31/2006 | 100,000 | 31.72 | 100,000 | ||||||
08/01/2006 – 08/31/2006 | — | — | — | ||||||
09/01/2006 – 09/30/2006 | 295,000 | 32.38 | 295,000 | ||||||
10/01/2006 – 10/31/2006 | — | — | — | ||||||
11/01/2006 – 11/30/2006 | — | — | — | ||||||
12/01/2006 – 12/31/2006 | 32,700 | 33.63 | 32,700 | ||||||
Total | 1,031,700 | $ | 34.19 | 1,031,700 | 2,000,000 | ||||
| (1) | The plan was announced on December 20, |
| (2) | The plan was approved by the S&T Board of Directors for the repurchase of up to one million shares. |
| (3) | The expiration date of the plan is December 31, |
Item 6. SELECTED FINANCIAL DATA
| Year Ended December 31: | 2005 | 2004 | 2003 | 2002 | 2001 | 2006 | 2005 | 2004 | 2003 | 2002 | ||||||||||||||||||||
| (dollars in thousands, except per share data) | ||||||||||||||||||||||||||||||
INCOME STATEMENTS | ||||||||||||||||||||||||||||||
Interest income | $ | 172,122 | $ | 148,638 | $ | 151,460 | $ | 151,160 | $ | 166,702 | $ | 204,702 | $ | 172,122 | $ | 148,638 | $ | 151,460 | $ | 151,160 | ||||||||||
Interest expense | 59,514 | 40,890 | 47,066 | 56,300 | 76,713 | 91,584 | 59,514 | 40,890 | 47,066 | 56,300 | ||||||||||||||||||||
Provision for loan losses | 5,000 | 4,400 | 7,300 | 7,800 | 5,000 | 9,380 | 5,000 | 4,400 | 7,300 | 7,800 | ||||||||||||||||||||
Net interest income after provision for loan losses | 107,608 | 103,348 | 97,094 | 87,060 | 84,989 | 103,738 | 107,608 | 103,348 | 97,094 | 87,060 | ||||||||||||||||||||
Noninterest income | 37,568 | 34,202 | 36,204 | 32,680 | 31,230 | 40,390 | 37,386 | 34,401 | 36,204 | 32,680 | ||||||||||||||||||||
Noninterest expense | 62,646 | 60,191 | 60,658 | 51,766 | 49,875 | 69,279 | 62,464 | 60,390 | 60,658 | 51,766 | ||||||||||||||||||||
Income before taxes | 82,530 | 77,359 | 72,640 | 67,974 | 66,344 | 74,849 | 82,530 | 77,359 | 72,640 | 67,974 | ||||||||||||||||||||
Applicable income taxes | 24,287 | 23,001 | 20,863 | 19,370 | 19,046 | 21,513 | 24,287 | 23,001 | 20,863 | 19,370 | ||||||||||||||||||||
Net income | $ | 58,243 | $ | 54,358 | $ | 51,777 | $ | 48,604 | $ | 47,298 | $ | 53,336 | $ | 58,243 | $ | 54,358 | $ | 51,777 | $ | 48,604 | ||||||||||
PER SHARE DATA | ||||||||||||||||||||||||||||||
Net income—Basic | $ | 2.21 | $ | 2.05 | $ | 1.96 | $ | 1.83 | $ | 1.76 | $ | 2.07 | $ | 2.21 | $ | 2.05 | $ | 1.96 | $ | 1.83 | ||||||||||
Net income—Diluted | 2.18 | 2.03 | 1.94 | 1.81 | 1.75 | 2.06 | 2.18 | 2.03 | 1.94 | 1.81 | ||||||||||||||||||||
Dividends declared | $ | 1.13 | $ | 1.07 | $ | 1.02 | $ | 0.97 | $ | 0.92 | 1.17 | 1.13 | 1.07 | 1.02 | 0.97 | |||||||||||||||
Book Value | 13.41 | 13.12 | 12.48 | 11.51 | 11.01 | 13.37 | 13.41 | 13.12 | 12.48 | 11.51 | ||||||||||||||||||||
PAGE 1415
Item 6. SELECTED FINANCIAL DATA — continued
SELECTED FINANCIAL DATA
BALANCE SHEET TOTALS (PERIOD END):
| Year Ended December 31: | 2005 | 2004 | 2003 | 2002 | 2001 | 2006 | 2005 | 2004 | 2003 | 2002 | ||||||||||||||||||||
| (dollars in thousands) | ||||||||||||||||||||||||||||||
Total assets | $ | 3,194,979 | $ | 2,989,034 | $ | 2,900,272 | $ | 2,823,867 | $ | 2,357,874 | $ | 3,338,543 | $ | 3,194,979 | $ | 2,989,034 | $ | 2,900,272 | $ | 2,823,867 | ||||||||||
Securities | 494,575 | 518,171 | 611,083 | 641,164 | 585,265 | |||||||||||||||||||||||||
Securities available for sale Other investments | | 432,045 10,562 | | 481,257 13,318 | | 503,218 14,953 | | 594,179 16,904 | | 624,971 16,193 | ||||||||||||||||||||
Net loans | 2,454,934 | 2,253,089 | 2,069,142 | 1,968,755 | 1,615,842 | 2,633,071 | 2,454,934 | 2,253,089 | 2,069,142 | 1,968,755 | ||||||||||||||||||||
Total deposits | 2,418,884 | 2,176,263 | 1,962,253 | 1,926,119 | 1,611,317 | 2,565,306 | 2,418,884 | 2,176,263 | 1,962,253 | 1,926,119 | ||||||||||||||||||||
Securities sold under repurchase agreements and federal funds purchased | 137,829 | 98,384 | 182,020 | 194,388 | 152,282 | 133,021 | 137,829 | 98,384 | 182,020 | 194,388 | ||||||||||||||||||||
Short-term borrowings | 150,000 | 225,000 | 250,000 | 125,000 | — | 55,000 | 150,000 | 225,000 | 250,000 | 125,000 | ||||||||||||||||||||
Long-term borrowings | 83,776 | 86,325 | 116,933 | 211,693 | 251,256 | 171,941 | 83,776 | 86,325 | 116,933 | 211,693 | ||||||||||||||||||||
Junior subordinated debt securities | 25,000 | — | — | — | — | |||||||||||||||||||||||||
Total shareholders’ equity | 352,421 | 349,129 | 332,718 | 306,114 | 293,327 | 339,051 | 352,421 | 349,129 | 332,718 | 306,114 | ||||||||||||||||||||
Item 7. MANAGEMENT’S DISCUSSION AND ANALYSIS OF FINANCIAL CONDITION AND RESULTS OF OPERATIONS
OVERVIEW
S&T is a financial holding company with its headquarters located in Indiana, Pennsylvania with assets of approximately $3.2$3.3 billion at December 31, 2005.2006. S&T provides a full range of financial services through a branch network of 5049 offices located in Allegheny, Armstrong, Blair, Butler, Cambria, Clarion, Clearfield, Indiana, Jefferson and Westmoreland counties of Pennsylvania. S&T provides full service retail and commercial banking products as well as cash management services; insurance; estate planning and administration; employee benefit investment management and administration; corporate services; and other fiduciary services. S&T earns revenue primarily from interest on loans, security investments and fees charged for financial services provided to our customers. Offsetting these revenues are the cost of deposits and other funding sources, provision for loan losses as well as other operating costs such as: salaries and employee benefits, occupancy, data processing expenses and tax expense. Balance sheet growth in 20052006 included a 107 percent increase in commercial lending activities, and with an 11a 9 percent increase in depositsconsumer and residential mortgage loans with funding for that growth provided primarily attributable to our Green Plan savings account.by a 6 percent increase in deposits. S&T’s strategic plan to deliver profitable growth to our shareholders includes: increasing loans and core deposits with sufficient interest rate spreads, controlling loan delinquency and loan losses, controlling operating expenses and to expandexpanding the business through new de novo branching, merger and acquisitions, introduction of new products and services, and expansion of our products and services provided to our existing customers.
There are many uncertainties regarding the economy as S&T enters 2007. S&T continually strives to be well positioned for changes in both the economy and interest rates, regardless of the timing or direction of these changes. Management continually assesses our balance sheet, capital, liquidity and operation infrastructures in order to be positioned to take advantage of internal or acquisition growth opportunities.
There are many factors that could influence our results, both positively and negatively, in 2007. Because the majority of our revenue comes from net interest income, internally generated loan and deposit growth and the mix of that growth are major factors on our operations and financial condition. S&T has directed a fair amount of focus and resources in planning for 2007 to improve our generation and retention of low cost core deposits. On the other hand, a slowing economy could cause
PAGE 1516
Item 7. MANAGEMENT’S DISCUSSION AND ANALYSIS
OF FINANCIAL CONDITION AND RESULTS OF OPERATIONS — continued
deterioration in the asset quality measurements. S&T recognizes that our shift to a greater dependence on commercial loans in recent years exposes us to larger credit risks and greater swings in nonperforming loans and loan charge-offs when problems do occur. However, because of our earnings strength and strong capitalization, as well as the strengths of other businesses in our market area, management does not expect a decline in our ability to satisfactorily perform if a further decline in our economy occurs.
FINANCIAL CONDITION
Average earning assets grewincreased by $89.5$166.6 million in 20052006 primarily as a result of growth in commercial lending, consumer and residential mortgage activities. During 2005,2006, average loan balances increased by $145.6$217.3 million, and average securities, other investments and federal funds sold decreased $56.0$50.7 million. The funding for this loan growth was primarily provided by a $217.7$249.1 million increase in average deposits, and an increase of $13.3 million in noninterest earning assets, offset by a $129.2decrease of $4.6 million in average earnings retained and a $68.6 million decrease in average borrowings.
| 2005 | 2004 | 2006 | 2005 | |||||||||||||||||||||
| Loans | Average Loan Balance | Average Loan Balance Percentage | Average Loan Balance | Average Loan Balance Percentage | Average Loan Balance | Average Loan Balance Percentage | Average Loan Balance | Average Loan Balance Percentage | ||||||||||||||||
| (dollars in millions) | ||||||||||||||||||||||||
Commercial, mortgage and industrial | $ | 1,809.5 | 76 | % | $ | 1,664.1 | 75 | % | $ | 1,972.7 | 76 | % | $ | 1,809.5 | 76 | % | ||||||||
Residential real estate mortgage | 492.7 | 21 | % | 489.3 | 22 | % | 545.8 | 21 | % | 492.7 | 21 | % | ||||||||||||
Installment | 68.7 | 3 | % | 71.9 | 3 | % | 69.7 | 3 | % | 68.7 | 3 | % | ||||||||||||
Total | $ | 2,370.9 | 100 | % | $ | 2,225.3 | 100 | % | $ | 2,588.2 | 100 | % | $ | 2,370.9 | 100 | % | ||||||||
LENDING ACTIVITY
Average loans for the year ended December 31, 2005 (“2005”)2006 were $2.4$2.6 billion, a $145.6$217.3 million or 79 percent increase from the year ended December 31, 2004 (“2004”).2005. The increase in average loans for 20042005 compared to the year ended 2003 (“2003”)2004 was $190.6$145.5 million. Changes in the composition of the average loan portfolio during 2006 included increases of $163.2 million in commercial loans and $53.1 million in residential mortgage loans and an increase of $1.0 million in installment loans. Changes in the composition of the average loan portfolio during 2005 included increases of $145.4$145.3 million in commercial loans and $3.4 million in residential mortgage loans, offset by a decrease of $3.2 million in installment loans. Changes in the composition of the average loan portfolio during 2004 included increases of $229.8 million in commercial loans, offset by decreases of $25.7 million in residential mortgages and $13.5 million in installment loans. Total loans at December 31, 20052006 increased $204.1$174.8 million from December 31, 2004.2005. The increase is primarily attributable to $174.7 millionthe growth of loan growth within the commercial loan category, $34.7$124.1 million in home equitycommercial loans, offset by a $5.3$45.8 million decreasein residential mortgage loans and $4.9 million in consumer loan balances due to paydowns and sales into the secondary mortgage market. Total loans at December 31, 2004 increased $186.7 million from December 31, 2003. The increase is primarily attributable to $208.4 million of loan growth within the commercial loan category, offset by a $21.7 million decrease in consumer loan balances due to paydowns and sales into the secondary mortgage market.loans.
Average real estate construction and commercial loans, including mortgagecommercial and industrial, comprised 76 percent of the loan portfolio in 2005 compared to 75 percent in 2004.2006 and 2005. Commercial loans continued to be an area of strategic growth during 20052006 and 2004.2005. Although commercial loans can be an area ofhave a relatively higher risk profile, management believes these risks are mitigated by limiting concentrationsthrough active portfolio management, underwriting and applying rigorous underwriting review by loan administration.continuous review. At December 31, 2005,2006, variable-rate commercial loans were 5549 percent of the commercial loan portfolio as compared to 5755 percent at December 31, 2004.2005.
Average residential mortgage loans comprised 21 percent of the loan portfolio in 2005 compared to 22 percent in 2004.2006 and 2005. Residential mortgage lending continued to be a strategic focus during 20052006 through a centralized mortgage origination department, ongoing product redesign, secondary market activities and the utilization of commission compensated originators. Management believes that if a downturn in the local residential real estate market occurs, the impact of declining values on the real estate loan
PAGE 17
Item 7. MANAGEMENT’S DISCUSSION AND ANALYSIS
OF FINANCIAL CONDITION AND RESULTS OF OPERATIONS — continued
portfolio will be mitigated because of S&T’s conservative mortgage lending policies for portfolio loans, which generally require a maximum term of 20 years for fixed-rate mortgages, a maximum term of 30 years for adjustable-rate mortgages and private mortgage insurance for loans
PAGE 16
Item 7. MANAGEMENT’S DISCUSSION AND ANALYSIS
OF FINANCIAL CONDITION AND RESULTS OF OPERATIONS — continued
with less than a 20 percent down payment. Adjustable-rate mortgages with repricing terms of one, three and five years comprised 1310 percent of the residential mortgage portfolio in 20052006 and 1513 percent in 2004.2005. Home equity loans increased $42.4 million during 2006 and $34.7 million duringin 2005 and $11.3totaled $269.9 million in 2004at December 31, 2006 and totaled $227.5 million at December 31, 2005 and $192.8 million at December 31, 2004, respectively.2005. The increase in home equity loans is primarily attributable to successful marketing programs during 20052006 and 2004.2005.
Most of the decline in residential loans during 2005 was due to active participation in the secondary mortgage markets. S&T periodically designates specific loan originations, generally longer-term, lower-yielding 1–4 family mortgages as held for sale and sells them to Fannie Mae. The intent of these sales is to mitigate interest-rate risk associated with holding long-term residential mortgages in the loan portfolio, generate fee revenue from servicing, and maintain the primary customer relationship. During 2005,2006, S&T sold $36.4$18.8 million of 1–4 family mortgagesmortgage loans to Fannie Mae and currently services $185.1$180.8 million of secondary market mortgage loans. Fees and gains from mortgage servicing activities were $0.7 million in 2006 and $1.5 million in 2005 and 2004.2005. Management intends to continue to sell longer-term loans to Fannie Mae in the future on a selective basis, especially during periods of lower interest rates.
Average consumer installment loans comprised 3 percent of the loan portfolio in 20052006 and 2004.2005. Installment loan decreasesincreases during 20052006 were primarily the result of lower origination volumes.successful marketing programs during 2006. The balance of consumer installment loans at December 31, 20052006 was $68.2$73.1 million compared to $69.2$68.2 million at December 31, 2004.2005.
Loan underwriting standards for S&T are established by a formal policy administered by the S&T Bank CreditLoan Administration Department, and are subject to the periodic review and approval by our Board of Directors.
Rates and terms for commercial real estate, equipment loans and commercial lines of credit normally are negotiated, subject to such variables as financial condition of the borrower, economic conditions, marketability of collateral, credit history of the borrower and future cash flows. The loan to value policy guidelineguidelines for commercial real estate loans is generally 75–65–80 percent.
The loan to value policy guidelineguidelines for residential, first lien, mortgage loans is 80 percent. Higher loan to value loans may be approved with the appropriate private mortgage insurance coverage. Second lien positions are sometimes assumed with home equity loans, but normally only to the extent that the combined credit exposure for both first and second liens does not exceed 100 percent of the fair market value of the mortgage property.
We offer a variety of unsecured and secured installment loan and credit card products. Loan to value policy guidelines for direct loans are 90–100 percent of invoice for new automobiles and 80–90 percent of National Automobile Dealer Association (NADA) value for used automobiles.
The following table shows S&T’s loan distribution at the end of each of the last five years:
| December 31 | December 31 | |||||||||||||||||||||||||||||
| 2005 | 2004 | 2003 | 2002 | 2001 | 2006 | 2005 | 2004 | 2003 | 2002 | |||||||||||||||||||||
| (dollars in thousands ) | ||||||||||||||||||||||||||||||
| (dollars in thousands) | ||||||||||||||||||||||||||||||
Domestic Loans: | ||||||||||||||||||||||||||||||
Commercial, mortgage and industrial | $ | 1,565,035 | $ | 1,455,932 | $ | 1,328,378 | $ | 1,169,138 | $ | 1,016,113 | $ | 1,675,848 | $ | 1,565,035 | $ | 1,455,932 | $ | 1,328,378 | $ | 1,169,138 | ||||||||||
Real estate—construction | 339,179 | 274,783 | 193,874 | 191,927 | 115,825 | 352,482 | 339,179 | 274,783 | 193,874 | 191,927 | ||||||||||||||||||||
Real estate—mortgage | 519,076 | 487,445 | 499,661 | 541,102 | 430,261 | 564,821 | 519,076 | 487,445 | 499,661 | 541,102 | ||||||||||||||||||||
Installment | 68,216 | 69,191 | 78,707 | 96,726 | 80,569 | 73,140 | 68,216 | 69,191 | 78,707 | 96,726 | ||||||||||||||||||||
TOTAL LOANS | $ | 2,491,506 | $ | 2,287,351 | $ | 2,100,620 | $ | 1,998,893 | $ | 1,642,768 | $ | 2,666,291 | $ | 2,491,506 | $ | 2,287,351 | $ | 2,100,620 | $ | 1,998,893 | ||||||||||
PAGE 1718
Item 7. MANAGEMENT’S DISCUSSION AND ANALYSIS
OF FINANCIAL CONDITION AND RESULTS OF OPERATIONS — continued
The following table shows the maturity of loans (excluding residential mortgages of 1-4 family residences and installment loans) outstanding as of December 31, 2005.2006. Also provided are the amounts due after one year classified according to the sensitivity to changes in interest rates.
| Maturing | Maturing | |||||||||||||||||||||||
| Within One Year | After One But Within Five Years | After Five Years | Total | Within One Year | After One But Within Five Years | After Five Years | Total | |||||||||||||||||
| (dollars in thousands ) | ||||||||||||||||||||||||
| (dollars in thousands) | ||||||||||||||||||||||||
Commercial, mortgage and industrial | $ | 448,389 | $ | 471,318 | $ | 645,328 | $ | 1,565,035 | $ | 485,924 | $ | 502,447 | $ | 687,477 | $ | 1,675,848 | ||||||||
Real estate—construction | 109,243 | 148,487 | 81,449 | 339,179 | 148,968 | 130,178 | 73,336 | 352,482 | ||||||||||||||||
TOTAL | $ | 557,632 | $ | 619,805 | $ | 726,777 | $ | 1,904,214 | $ | 634,892 | $ | 632,625 | $ | 760,813 | $ | 2,028,330 | ||||||||
Fixed interest rates | $ | 120,783 | $ | 104,355 | $ | 200,335 | $ | 133,983 | ||||||||||||||||
Variable interest rates | 499,022 | 622,422 | 432,290 | 626,830 | ||||||||||||||||||||
TOTAL | $ | 619,805 | $ | 726,777 | $ | 632,625 | $ | 760,813 | ||||||||||||||||
SECURITIES ACTIVITY
Average securities and other investments decreased $49.8 million in 2006 and decreased $57.7 million in 2005 and decreased $72.72005. The largest components of the 2006 decrease included $24.6 million in 2004.U.S. government agency securities, $8.6 million in marketable equity securities, $7.7 million of mortgage-backed securities, $6.8 million of corporate securities and $2.9 million in treasury securities. Average other investments decreased $3.4 million in 2006 as compared to the 2005 full year average and is comprised of Federal Home Loan Bank (“FHLB”) stock that is a membership and borrowing requirement and is recorded at historical cost. The amount of S&T’s investment in FHLB stock depends upon S&T’s borrowing availability and level from the FHLB. Offsetting these decreases was an average increase of $4.2 million of states and political subdivisions. The largest components of the 2005 decrease included $67.5 million in U.S. government agency securities, $8.6 million of corporate securities $2.9 million in Federal Home Loan Bank (“FHLB”) stock and $2.1 million in treasury securities. The decreaseAverage other investments decreased $2.9 million in 2005 as compared to the 2004 full year average and is comprised of FHLB stock. Offsetting these decreases were average increases of $13.2 million of mortgage-backed securities and $10.2 million of states and political subdivisions. Both the decreases in securities isin 2006 and 2005 are partially attributable to ana S&T Asset Liability Committee (“ALCO”) strategy to reduce balances in both securities and borrowings to mitigate the interest rate risk of a flatteningflat or inverted yield curve. Offsetting these decreases were average increases of $13.2 million of mortgage backed securities and $10.2 million of states and political subdivisions. The FHLB capital stock is a membership and borrowing requirement and is acquired and sold at stated value. The amount of S&T’s investment in FHLB stock depends upon S&T’s borrowing availability and level from the FHLB. The largest components of the 2004 decrease included $45.7 million in U.S. government agency securities, $12.8 million of corporate securities, $26.8 million in mortgage-backed securities, $0.5 million in treasury securities and $0.4 million in corporate stocks. The decrease in securities is partially attributable to an ALCO strategy to reduce balances in both securities and borrowings to mitigate the interest rate risk of declining rates on a flattening yield curve. Offsetting these decreases were average increases of $11.9 million of states and political subdivisions and $1.6 million of FHLB stock.
OurThe equity securities portfolio is primarily comprised of bank holding companies. At December 31, 2005, our2006, the equity securities portfolio had a total market value of $65.1$55.3 million and net unrealized gains of $19.7$16.1 million. The equity securitysecurities portfolio consists of securities traded on the various stock markets and is subject to changes in market value.
S&T’s policy for security classification includes U.S. treasury securities, U.S. government corporations and agencies, mortgage-backed securities, collateralized mortgage obligations, states and political subdivisions, corporate securities, and marketable equity securities and other securities as available for sale. On a quarterly basis, management evaluates the securitysecurities portfolios for other-than-temporary declines in market value in accordance with Emerging Issues Task Force No. 03-1.FSP 115-1 and FAS 124-1, “The Meaning of Other-Than-Temporary Impairment and Its Application to Certain Investments”. During 2005,2006, there were $0.3 million of realized losses taken for an other-than-temporary impairmentimpairments on onethree equity investment security.securities. The performance of the equities and debt securities markets could generate further impairment in future periods. At December 31, 2005,2006, net unrealized gains on securities classified as available for sale, including equity securities, were approximately $13.5$9.8 million as compared to $31.7$13.5 million at December 31, 2004.2005. S&T has the intent and ability to hold these debt and equity securities until maturity or until market value recovers above cost.
PAGE 1819
Item 7. MANAGEMENT’S DISCUSSION AND ANALYSIS
OF FINANCIAL CONDITION AND RESULTS OF OPERATIONS — continued
S&T invests in various securities in order to provide a source of liquidity, increase net interest income and as a tool of ALCO to quickly reposition the balance sheet for interest rate risk purposes. Securities are subject to similar interest rate and credit risks as loans. In addition, by their nature, securities classified as available for sale are also subject to market value risks that could negatively affect the level of liquidity available to S&T, as well as equity.
Risks associated with various securities portfolios are managed and monitored by investment policies annually approved by the S&T Board of Directors, and administered through ALCO and the Treasury function of S&T Bank. As of December 31, 2005,2006, management is not aware of any risk associated with securities that would be expected to have a significant, negative effect on S&T’s statement of condition or statement of operations.
The following table sets forth the carrying amount of securities at the dates indicated:
| December 31 | December 31 | |||||||||||||||||
| 2005 | 2004 | 2003 | 2006 | 2005 | 2004 | |||||||||||||
| (dollars in thousands ) | ||||||||||||||||||
| (dollars in thousands) | ||||||||||||||||||
Available for Sale | ||||||||||||||||||
Marketable equity securities | $ | 65,114 | $ | 74,555 | $ | 72,591 | $ | 55,349 | $ | 65,114 | $ | 74,555 | ||||||
Obligations of U.S. government corporations and agencies | 221,037 | 237,514 | 325,903 | 180,003 | 221,037 | 237,514 | ||||||||||||
Collateralized mortgage obligations of U.S. government corporations and agencies | 63,638 | 46,528 | 44,251 | 60,090 | 63,639 | 46,528 | ||||||||||||
Mortgage-backed securities | 38,417 | 48,373 | 45,769 | 31,793 | 38,416 | 48,373 | ||||||||||||
U.S. treasury securities | 499 | 5,248 | 5,744 | — | 499 | 5,248 | ||||||||||||
Obligations of states and political subdivisions | 83,811 | 71,198 | 67,539 | 81,672 | 83,811 | 71,198 | ||||||||||||
Corporate securities | — | 16,493 | 21,464 | — | — | 16,493 | ||||||||||||
Other securities | 22,059 | 17,997 | 27,557 | 23,138 | 8,741 | 3,044 | ||||||||||||
TOTAL | $ | 494,575 | $ | 517,906 | $ | 610,818 | $ | 432,045 | $ | 481,257 | $ | 502,953 | ||||||
Held to Maturity | ||||||||||||||||||
Obligations of states and political subdivisions | $ | — | $ | 265 | $ | 265 | $ | — | $ | — | $ | 265 | ||||||
TOTAL | $ | — | $ | 265 | $ | 265 | $ | — | $ | — | $ | 265 | ||||||
PAGE 1920
Item 7. MANAGEMENT’S DISCUSSION AND ANALYSIS
OF FINANCIAL CONDITION AND RESULTS OF OPERATIONS — continued
The following table sets forth the maturities of securities at December 31, 2005,2006, and the weighted average yields of such securities (calculated on the basis of the amortized cost and effective yields weighted for the scheduled maturity of debt securities and estimated prepayment rates on most mortgage-backed securities). Tax-equivalent adjustments (using a 35 percent federal income tax rate) for 20052006 have been made in calculating yields on obligations of states and political subdivisions.
| Maturing | Maturing | |||||||||||||||||||||||||||||||||||||||||||||||||||||
Within One Year | After One But Within Five Years | After Five But Within Ten Years | After Ten Years | No Fixed Maturity | Within One Year | After One But Within Five Years | After Five But Within Ten Years | After Ten Years | No Fixed Maturity | |||||||||||||||||||||||||||||||||||||||||||||
| Amount | Yield | Amount | Yield | Amount | Yield | Amount | Yield | Amount | Amount | Yield | Amount | Yield | Amount | Yield | Amount | Yield | Amount | |||||||||||||||||||||||||||||||||||||
| (dollars in thousands) | ||||||||||||||||||||||||||||||||||||||||||||||||||||||
Available for Sale | ||||||||||||||||||||||||||||||||||||||||||||||||||||||
Marketable equity securities | $ | — | — | $ | — | — | $ | — | — | $ | — | — | $ | 65,114 | $ | — | — | $ | — | — | $ | — | — | $ | — | — | $ | 55,349 | ||||||||||||||||||||||||||
Obligations of U.S. government corporations and agencies | 40,328 | 6.18 | % | 170,658 | 3.93 | % | 10,051 | 4.44 | % | — | — | — | 37,677 | 3.48 | % | 142,327 | 4.08 | % | — | — | — | — | — | |||||||||||||||||||||||||||||||
Collateralized mortgage obligations of U.S. government corporations and agencies | 8,563 | 4.43 | % | 39,197 | 4.67 | % | 15,878 | 4.65 | % | — | — | — | 7,443 | 4.44 | % | 44,144 | 4.75 | % | 8,503 | 4.67 | % | — | — | — | ||||||||||||||||||||||||||||||
Mortgage-backed securities | 6,599 | 4.83 | % | 16,888 | 4.63 | % | 11,259 | 4.53 | % | 3,671 | 4.72 | % | — | 5,097 | 4.71 | % | 16,048 | 4.57 | % | 8,197 | 4.49 | % | 2,451 | 4.83 | % | — | ||||||||||||||||||||||||||||
U.S. treasury securities | 499 | 3.57 | % | — | — | — | — | — | — | — | ||||||||||||||||||||||||||||||||||||||||||||
Obligations of states and political subdivisions | 5,247 | 5.12 | % | 48,890 | 4.76 | % | 29,393 | 5.15 | % | 281 | 5.86 | % | — | 5,840 | 5.31 | % | 54,392 | 4.73 | % | 21,155 | 5.34 | % | 284 | 5.86 | % | — | ||||||||||||||||||||||||||||
Other securities | — | — | — | — | — | — | — | — | 22,059 | — | — | — | — | — | — | — | — | 23,138 | ||||||||||||||||||||||||||||||||||||
TOTAL | $ | 61,236 | $ | 275,633 | $ | 66,581 | $ | 3,952 | $ | 87,173 | $ | 56,057 | $ | 256,911 | $ | 37,855 | $ | 2,735 | �� | $ | 78,487 | |||||||||||||||||||||||||||||||||
Weighted Average Rate | 5.67 | % | 4.22 | % | 4.82 | % | 4.80 | % | 3.91 | % | 4.36 | % | 5.01 | % | 4.93 | % | ||||||||||||||||||||||||||||||||||||||
NONEARNINGNONINTEREST EARNING ASSETS
Average noninterest earning assets increased $13.3$20.9 million in 20052006 and $1.8$11.1 million in 2004.2005. The 20052006 increase was primarily attributable to increases in cash and due from banks, premises and equipment due to the addition of fivenew branches and administrative facilities during 2006 and accrued interest receivable on a higher earning asset balance. The 2005 increase of $11.1 million was primarily attributable to increases in cash and due from banks, premises and equipment due to the addition of new branches during 2005 and accrued interest receivable on a higher earning asset balance. The 2004 increase of $1.8 million was primarily due to an increase in premises and equipment related to the addition of three new branches during 2004.
ALLOWANCE FOR LOAN LOSSES
The balance in the allowance for loan losses increaseddecreased to $33.2 million or 1.25 percent of total loans at December 31, 2006 as compared to $36.6 million or 1.47 percent of total loans at December 31, 2005 as compared2005. The decrease in the allowance for loan losses is primarily attributable to $34.3 million or 1.50 percent of totalthree commercial loans at December 31, 2004.that were charged-off during 2006 totaling $11.4 million. During the second quarter of 2005,
PAGE 21
Item 7. MANAGEMENT’S DISCUSSION AND ANALYSIS
OF FINANCIAL CONDITION AND RESULTS OF OPERATIONS — continued
S&T split its allowance for credit losses into an allowance for loan losses and an allowance for lending-related commitments such as unfunded commercial real
PAGE 20
Item 7. MANAGEMENT’S DISCUSSION AND ANALYSIS
OF FINANCIAL CONDITION AND RESULTS OF OPERATIONS — continued
estate and commercial &and industrial term loan commitments. The allowance for lending-related commitments is included in other liabilities. This resulted in a decrease in the allowance for loan losses of $1.0 million and reduction in the allowance for loan losses to total loans from 1.44 percent to 1.40 percent at June 30, 2005. The allowance for lending-related commitments is computed using a methodology similar to that used to determine the allowance for loan losses. Amounts are added to the allowance for lending-related commitments through a charge to current earnings through noninterest expense. The balance in the allowance for lending-related commitments increased to $1.2 million at December 31, 2006 as compared to $0.8 million at December 31, 2005.
Management evaluates the degree of loss exposure for loans on a continuous basis through a formal allowance for loan loss policy as administered by theS&T Bank’s Loan Administration Department of S&T Bank and various management and director committees. Problem loans are identified and continually monitored through detailed reviews of specific commercial loans, and the analysis of delinquency and charge-off levels of consumer loan portfolios. Charged-off and recovered loan amounts are applied to the allowance for loan losses. Monthly updates are presented to the S&T Board of Directors as to the status of loan quality.
Amounts are added to the allowance for loan losses through a charge to current earnings through the provision for loan losses, based upon management’s assessment of the adequacy of the allowance for loan losses for probable loan losses. A quantitative analysis is utilized to support the adequacy of the allowance for loan losses. This analysis includes review of the historical charge-off rates for all loan categories, fluctuations and trends in various risk factors. Factors consider the level of S&T’s historical charge-offs that have occurred within the creditscredits’ economic life cycle. Management also assesses qualitative factors such as portfolio credit trends, unemployment trends, vacancy trends, loan growth and variable interest rate factors.
Significant to this analysis and assessment is the shift in loan portfolio composition to an increased mix of commercial loans. These loans are generally larger in size and, due to our continuing growth, many are not well seasoned and could be more vulnerable to an economic slowdown. Management relies on its risk rating process to monitor trends, which may be occurring relative to commercial loans to assess potential weaknesses within specific credits. Current risk factors, trends in risk ratings and historical charge-off experiences are considered in the determination of the allowance for loan losses. During 2005,2006, the risk rating profile of the portfolio remained relatively stable. Management believes its quantitativewas impacted by three commercial loans. Two of these loan relationships have combined remaining loan balances of $7.5 million, and qualitative analysiswe believe that the problem loans have been adequately reserved at December 31, 2006 and risk-rating process is sufficient and enables it to conclude that the total allowance for loan losses is adequate to absorb probable loan losses.losses as determined by the quarterly impairment analysis and risk-rating processes. The third credit has no remaining exposure and future collateral recovery is expected to be insignificant. The remaining risk rating profile of the portfolio has shown overall improvement absent the aforementioned loan relationships.
The allowance for loan losses is established based on management’s assessment of the factors noted above along with the growth in the loan portfolio. The additions to the allowance charged to operating expense has maintained the allowance as a percent of loans at the following levels at the end of each year presented below:
| Year Ended December 31 | ||||||||||||
| 2005 | 2004 | 2003 | 2002 | 2001 | ||||||||
| 1.47% | 1.50 | % | 1.50 | % | 1.51 | % | 1.64 | % | ||||
| Year Ended December 31 | ||||||||||||
| 2006 | 2005 | 2004 | 2003 | 2002 | ||||||||
| 1.25% | 1.47 | % | 1.50 | % | 1.50 | % | 1.51 | % | ||||
We have considered impaired loans in our determination of the allowance for loan losses. The allowance for loan losses for all impaired loans was $9,937,000$2,627,000 and $5,712,000$9,937,000 at December 31, 20052006 and 2004,2005, respectively.
PAGE 2122
Item 7. MANAGEMENT’S DISCUSSION AND ANALYSIS
OF FINANCIAL CONDITION AND RESULTS OF OPERATIONS — continued
This table summarizes our loan loss experience for each of the five years presented below:
| Year Ended December 31 | Year Ended December 31 | |||||||||||||||||||||||||||||||||||||||
| 2005 | 2004 | 2003 | 2002 | 2001 | 2006 | 2005 | 2004 | 2003 | 2002 | |||||||||||||||||||||||||||||||
| (dollars in thousands) | ||||||||||||||||||||||||||||||||||||||||
Balance at January 1: | $ | 34,262 | $ | 31,478 | $ | 30,138 | $ | 26,926 | $ | 27,395 | $ | 36,572 | $ | 34,262 | $ | 31,478 | $ | 30,138 | $ | 26,926 | ||||||||||||||||||||
Charge-offs: | ||||||||||||||||||||||||||||||||||||||||
Commercial, mortgage and industrial | 2,260 | 5,616 | 5,208 | 6,131 | 4,728 | 12,575 | 2,260 | 5,616 | 5,208 | 6,131 | ||||||||||||||||||||||||||||||
Real estate—mortgage | 529 | 484 | 905 | 588 | 912 | 394 | 529 | 484 | 905 | 588 | ||||||||||||||||||||||||||||||
Installment | 1,140 | 1,075 | 1,193 | 1,102 | 1,299 | 1,069 | 1,140 | 1,075 | 1,193 | 1,102 | ||||||||||||||||||||||||||||||
Total | 3,929 | 7,175 | 7,306 | 7,821 | 6,939 | 14,038 | 3,929 | 7,175 | 7,306 | 7,821 | ||||||||||||||||||||||||||||||
Recoveries: | ||||||||||||||||||||||||||||||||||||||||
Commercial, mortgage and industrial | 1,699 | 4,835 | 624 | 1,118 | 643 | 640 | 1,699 | 4,835 | 624 | 1,118 | ||||||||||||||||||||||||||||||
Real estate—mortgage | 235 | 408 | 384 | 349 | 404 | 201 | 235 | 408 | 384 | 349 | ||||||||||||||||||||||||||||||
Installment | 274 | 316 | 338 | 345 | 423 | 465 | 274 | 316 | 338 | 345 | ||||||||||||||||||||||||||||||
Total | 2,208 | 5,559 | 1,346 | 1,812 | 1,470 | 1,306 | 2,208 | 5,559 | 1,346 | 1,812 | ||||||||||||||||||||||||||||||
Net charge-offs | 1,721 | 1,616 | 5,960 | 6,009 | 5,469 | 12,732 | 1,721 | 1,616 | 5,960 | 6,009 | ||||||||||||||||||||||||||||||
Provision for loan losses | 5,000 | 4,400 | 7,300 | 7,800 | 5,000 | 9,380 | 5,000 | 4,400 | 7,300 | 7,800 | ||||||||||||||||||||||||||||||
Reserve for unfunded commitments | (969 | ) | — | — | — | — | ||||||||||||||||||||||||||||||||||
Allowance for lending-related commitments | — | (969 | ) | — | — | — | ||||||||||||||||||||||||||||||||||
Loan loss reserve from acquisition | — | — | — | 1,421 | — | — | — | — | — | 1,421 | ||||||||||||||||||||||||||||||
Balance at December 31: | $ | 36,572 | $ | 34,262 | $ | 31,478 | $ | 30,138 | $ | 26,926 | $ | 33,220 | $ | 36,572 | $ | 34,262 | $ | 31,478 | $ | 30,138 | ||||||||||||||||||||
Ratio of net charge-offs to average loans outstanding | 0.07 | % | 0.07 | % | 0.29 | % | 0.34 | % | 0.33 | % | 0.49 | % | 0.07 | % | 0.07 | % | 0.29 | % | 0.34 | % | ||||||||||||||||||||
This table shows allocation of the allowance for loan losses as of the end of each of the last five years:
| December 31 | December 31 | |||||||||||||||||||||||||||||||||||||||||||||||||||||||||||
| 2005 | 2004 | 2003 | 2002 | 2001 | 2006 | 2005 | 2004 | 2003 | 2002 | |||||||||||||||||||||||||||||||||||||||||||||||||||
| Amount | Percent of Loans in Each Category to Total Loans | Amount | Percent of Loans in Each Category to Total Loans | Amount | Percent of Loans in Each Category to Total Loans | Amount | Percent of Loans in Each Category to Total Loans | Amount | Percent of Loans in Each Category to Total Loans | Amount | Percent of Loans | Amount | Percent of Loans | Amount | Percent of Loans in Each Category to Total Loans | Amount | Percent of Loans | Amount | Percent of Loans | |||||||||||||||||||||||||||||||||||||||||
| (dollars in thousands) | ||||||||||||||||||||||||||||||||||||||||||||||||||||||||||||
Commercial, mortgage and industrial | $ | 32,053 | 63 | % | $ | 29,594 | 64 | % | $ | 26,947 | 63 | % | $ | 26,002 | 58 | % | $ | 22,628 | 62 | % | $ | 28,540 | 63 | % | $ | 32,053 | 63 | % | $ | 29,594 | 64 | % | $ | 26,947 | 63 | % | $ | 26,002 | 58 | % | ||||||||||||||||||||
Real estate—construction | 532 | 14 | % | 852 | 12 | % | 843 | 9 | % | 664 | 10 | % | 329 | 7 | % | 379 | 13 | % | 532 | 14 | % | 852 | 12 | % | 843 | 9 | % | 664 | 10 | % | ||||||||||||||||||||||||||||||
Real estate—mortgage | 613 | 21 | % | 585 | 21 | % | 558 | 24 | % | 685 | 27 | % | 744 | 26 | % | 536 | 21 | % | 613 | 21 | % | 585 | 21 | % | 558 | 24 | % | 685 | 27 | % | ||||||||||||||||||||||||||||||
Installment | 3,374 | 2 | % | 3,231 | 3 | % | 3,009 | 4 | % | 2,671 | 5 | % | 3,121 | 5 | % | 3,765 | 3 | % | 3,374 | 2 | % | 3,231 | 3 | % | 3,009 | 4 | % | 2,671 | 5 | % | ||||||||||||||||||||||||||||||
Unallocated | — | 0 | % | — | 0 | % | 121 | 0 | % | 116 | 0 | % | 104 | 0 | % | — | — | — | 0 | % | — | 0 | % | 121 | 0 | % | 116 | 0 | % | |||||||||||||||||||||||||||||||
TOTAL | $ | 36,572 | 100 | % | $ | 34,262 | 100 | % | $ | 31,478 | 100 | % | $ | 30,138 | 100 | % | $ | 26,926 | 100 | % | $ | 33,220 | 100 | % | $ | 36,572 | 100 | % | $ | 34,262 | 100 | % | $ | 31,478 | 100 | % | $ | 30,138 | 100 | % | ||||||||||||||||||||
Net loan charge-offs totaled $12.7 million in 2006 and $1.7 million in 2005. Net loan charge-offs increased during 2006 due to three commercial loan relationships that were charged-off during the period. The first relationship is a commercial construction company that was charged-down by $7.2 million during the third quarter of 2006. The relationship had a specific reserve assigned of $7.1 million at the time it was charged down. S&T had previously provided $5.1 million in 2005 and $1.6provided an additional $2.0 million in 2004.the second quarter of 2006. The balance of nonperforming loans, which include nonaccrual loans past due 90 days or more, at December 31, 2005, was $11.2 million or 0.45 percent of total loans. This comparesborrower continues to nonperforming loans of $6.3 million or 0.28 percent of total loans at December 31, 2004. The majority of the increase in nonperforming loans primarily relates to a $4.6 million commercial real estate loan classified asoperate,
PAGE 2223
Item 7. MANAGEMENT’S DISCUSSION AND ANALYSIS
OF FINANCIAL CONDITION AND RESULTS OF OPERATIONS — continued
nonperforming. but has experienced significant cash flow problems. The borrower has restricted ability to obtain new contracts and may be at-risk to continue as a going concern. The remaining $5.6 million loan balance on this relationship is believed to be adequately collateralized which includes receivables, equipment and personal guarantees. The second relationship is a $4.6 million mixed-use, commercial real estate loan participation with another financial institution, previously classified as nonaccrual, which was charged-down by $2.7 million during the second quarter of 2006. The commercial real estate company filed a voluntary chapter eleven bankruptcy petition during the second quarter of 2006. The remaining $1.8 million exposure is the estimated fair market value S&T expects to receive in sale proceeds based upon our percentage participation in the loan. The credit is on nonaccrual status at December 31, 2006. The third relationship is a wholesale distributor that filed a voluntary chapter eleven bankruptcy petition during the second quarter of 2006 after failing to obtain expected and significant new contracts and was previously classified as nonaccrual. A charge-off of $1.5 million was recorded during the second quarter of 2006 for this loan. No further exposure remains for this credit and future collateral recovery is expected to be insignificant.
The balance of nonaccrual loans past due 90 days or more, at December 31, 2006, was $19.9 million or 0.74 percent of total loans. This compares to nonaccrual loans of $11.2 million or 0.45 percent of total loans at December 31, 2005. Nonperforming assets totaled $20.4 million or 0.61 percent of total assets at December 31, 2006 as compared to $14.9 million or 0.47 percent at December 31, 2005. The most significant credits in nonperforming status at December 31, 2006 is a $5.6 million residual balance of the aforementioned commercial construction company and the $1.8 million residual balance related to the aforementioned mixed-use commercial real estate credit. Also affecting nonaccrual loans at December 31, 2006 was a $1.0 million loan relationship with an energy-related company. Two other $3.1 million loan relationships were classified as nonaccrual at December 31, 2006, but were fully resolved in January 2007. Also affecting nonperforming assets is a $3.2 million reduction in property acquired through foreclosure during 2006. The reduction is primarily attributable to a $2.4 million residential development property acquired in the fourth quarter of 2005, charged down to $1.5 million in the second quarter of 2006 that was sold for $1.6 million during the fourth quarter of 2006.
The provision for loans losses was $9.4 million for 2006, as compared to $5.0 million for 2005, as compared to $4.4 million for 2004.2005. The provision is based onwas the result of management’s detailed quarterlyfourth quarter analysis of the adequacy of the allowance for loan losses and is consistent with the significant increase in nonaccrual loans losses. During 2005, S&T recorded a specific allowance for one impaired commercial loan relationship, which accounted for the majoritythat occurred as result of the provision foraforementioned loan losses in 2005. S&T’s exposure with respect to this one commercial loan has been appropriately considered in determining the adequacy of its allowance for loan losses based on S&T’s value of the underlying collateral and the expectation of future cash flows.
relationships.
The following table summarizes our nonaccrual and past due loans:
| December 31 | December 31 | |||||||||||||||||||||||||||||
| 2005 | 2004 | 2003 | 2002 | 2001 | 2006 | 2005 | 2004 | 2003 | 2002 | |||||||||||||||||||||
| (dollars in thousands ) | ||||||||||||||||||||||||||||||
| (dollars in thousands) | ||||||||||||||||||||||||||||||
Nonaccrual loans | $ | 11,166 | $ | 6,309 | $ | 9,120 | $ | 5,831 | $ | 8,253 | $ | 19,852 | $ | 11,166 | $ | 6,309 | $ | 9,120 | $ | 5,831 | ||||||||||
Accruing loans past due 90 days or more | — | — | — | — | — | — | — | — | — | — | ||||||||||||||||||||
It is S&T’s policy to place loans in all categories on nonaccrual status when collection of interest or principal is doubtful, or generally when interest or principal payments are 90 days or more past due. There are no loans 90 days or more past due and still accruing. At December 31, 20052006 and 2004, nonaccrual2005, interest that was notwould have been recorded amounted to $565,000 and $535,000, respectively. At December 31, 2005 and 2004, nonaccrual interest that was recorded on paid currenthad the nonaccrual loans amounted to $660,000performed in accordance with the original loan terms would have been $1,642,000 and $825,000,$565,000, respectively. The accrual of interest on impaired loans is discontinued when the loan is 60 days past due or, in management’s opinion, the account should be placed on nonaccrual status. At December 31, 20052006 and 2004,2005, there was $5,507,000$8,617,000 and $2,138,000,$5,507,000, respectively, of impaired loans that were on nonaccrual. There are no foreign loan amounts required to be included in this table. There were no restructured loans in the periods presented.
PAGE 24
Item 7. MANAGEMENT’S DISCUSSION AND ANALYSIS
OF FINANCIAL CONDITION AND RESULTS OF OPERATIONS — continued
DEPOSITS
Average total deposits increased by $261.6 million in 2006 and $217.7 million in 2005 and $100.9 million in 2004.2005. The mix of average deposits changed in 20052006 with average time deposits increasing $31.7$25.4 million and average savings accounts increasing $266.7$327.1 million. Partially offsetting these increases is a decrease of $100.1$103.4 million in average money market and NOW accounts. Average noninterest-bearing deposits increased by $19.4$12.5 million or 53 percent in 20052006 and were approximately 1817 percent and 1918 percent of average total deposits during 20052006 and 2004,2005, respectively. The increase in savings accounts is primarily attributable to the success of the Green Plan savings account, which hashad grown to $494.7$641.9 million at December 31, 20052006 since its introduction in August 2004. The Green Plan account iswas indexed to the Federal Funds Target Rate. DepositDuring the first quarter of 2006, S&T introduced another high yield savings account to replace the Green Plan account called the Plan B account. After the introduction of the Plan B account, no further Green Plan accounts were opened. Plan B accounts were non-indexed and were expected to allow S&T to continue core deposit growth that better compliments shifting interest rate sensitivity. The S&T Cash Management account is similar to the Plan B account and was introduced in November 2006; both are non-indexed, but the S&T Cash Management account has the added feature of tiering, or the payment of higher rates on higher balances. At December 31, 2006, S&T Cash Management accounts, Green Plan and Plan B balances outstanding were $743.5 million. As of January 2, 2007, Green Plan and Plan B account balances were transferred to the new S&T Cash Management account. Core deposit growth has been an important strategic initiative for S&T, through the expansion of retail facilities, promotions and new products. Other important strategies include providing cash management services to commercial customers to increase transaction related deposits, and delivery services such as electronic banking. Total deposits at December 31, 20052006 increased $242.6$146.4 million compared to December 31, 2004.
PAGE 23
Item 7. MANAGEMENT’S DISCUSSION AND ANALYSIS
OF FINANCIAL CONDITION AND RESULTS OF OPERATIONS — continued
2005.
The daily average amount of deposits and rates paid on such deposits is summarized for the periods indicated in the following table:
| Year Ended December 31 | Year Ended December 31 | |||||||||||||||||||||||||||||||||||
| 2005 | 2004 | 2003 | 2006 | 2005 | 2004 | |||||||||||||||||||||||||||||||
| Amount | Rate | Amount | Rate | Amount | Rate | Amount | Rate | Amount | Rate | Amount | Rate | |||||||||||||||||||||||||
| (dollars in thousands ) | ||||||||||||||||||||||||||||||||||||
| (dollars in thousands) | ||||||||||||||||||||||||||||||||||||
Noninterest-bearing demand deposits | $ | 411,236 | $ | 391,885 | $ | 347,042 | $ | 423,808 | $ | 411,236 | $ | 391,885 | ||||||||||||||||||||||||
NOW/Money market accounts | 438,356 | 0.87 | % | 538,471 | 0.61 | % | 568,869 | 0.66 | % | 334,987 | 1.13 | % | 438,356 | 0.87 | % | 538,471 | 0.61 | % | ||||||||||||||||||
Savings deposits | 502,641 | 2.24 | % | 235,926 | 0.63 | % | 203,633 | 0.46 | % | 829,700 | 3.95 | % | 502,641 | 2.24 | % | 235,926 | 0.63 | % | ||||||||||||||||||
Time deposits | 889,261 | 3.34 | % | 857,534 | 3.02 | % | 803,323 | 3.30 | % | 914,621 | 4.04 | % | 889,261 | 3.34 | % | 857,534 | 3.02 | % | ||||||||||||||||||
TOTAL | $ | 2,241,494 | $ | 2,023,816 | $ | 1,922,867 | $ | 2,503,116 | $ | 2,241,494 | $ | 2,023,816 | ||||||||||||||||||||||||
Maturities of time certificates of deposit of $100,000 or more outstanding at December 31, 2005, are summarized as follows:
| (dollars in thousands ) | ||||||
| 2006 | ||||||
| (dollars in thousands) | ||||||
Three months or less | $ | 83,205 | $ | 86,464 | ||
Over three through six months | 19,101 | 80,028 | ||||
Over six through twelve months | 36,464 | 45,622 | ||||
Over twelve months | 67,896 | 49,532 | ||||
TOTAL | $ | 206,666 | $ | 261,646 | ||
We believe ourPAGE 25
Item 7. MANAGEMENT’S DISCUSSION AND ANALYSIS
OF FINANCIAL CONDITION AND RESULTS OF OPERATIONS — continued
Management believes that the S&T deposit base is stable and we havethat S&T has the ability to attract new deposits, mitigating a funding dependency on other more volatile sources. Special rate deposits of $100,000 and over were 10 percent and 9 percent of total deposits at December 31, 2006 and 2005, and 2004,respectively, and primarily represent deposit relationships with local customers in our market area. In addition, management believes that S&T has the ability to access both public and private markets to raise long-term funding if necessary. At December 31, 2005,2006, S&T had $57.2$2.8 million of brokered retail certificates of deposit outstanding compared to $37.3$57.2 million at December 31, 2004.2005. The purchase of brokered retail certificates of deposits in 20052006 and 20042005 was an ALCO strategy to increase liquidity for commercial loan demand, as an alternative to increased borrowings.
BORROWINGS
Average borrowings by S&T decreased $129.2$68.6 million in 20052006 as a result of increased deposit growth and lower levels of investment securities. Borrowings were comprised of retail repurchase agreements (“REPOs”), wholesale REPOs, federal funds purchased, FHLB advances and long-term borrowings. S&T defines REPOs with our retail customers as retail REPOs; wholesale REPOs are those transacted with other banks and brokerage firms with terms normally ranging from one to 365 days.
The average balance in retail REPOs decreasedincreased by $1.5 million in 2006 and $7.7 million in 2005 and increased by $11.4 million in 2004.2005. S&T views retail REPOs as a relatively stable source of funds because most of these accounts are with local, long-term customers.
Wholesale REPOs, federal funds purchased and FHLB advances averaged $293.3$140.3 million in 2005,2006, a decrease of $96.0$153.0 million from the 20042005 averages. The decrease is attributable to the increase in deposits in 2005,2006, which decreased our need for additional funds.
During 2005,2006, average fixed ratelong-term borrowings decreased $25.5 million. The decrease is attributableincreased $82.8 million as compared to the increase in deposits in 2005, which decreased our need for additional borrowings.December 31, 2005. At December 31, 2005,2006, S&T had long-term borrowings outstanding of $83.8$168.8 million at a fixed-rate and $3.1 million at a variable rate with the FHLB. The increase in long-term borrowings is part of an ALCO strategy to limit interest rate risk as customer preferences have shifted to short-term and variable rate deposits, and to take advantage of lower cost funds through the FHLB’s Community Investment Program.
During the third quarter of 2006, S&T Bank issued $25.0 million of junior subordinated debentures through a pooled transaction at an initial fixed rate of 6.78 percent. On September 15, 2011 and quarterly thereafter, S&T Bank has the option to redeem the subordinated debt, subject to a 30 day written notice and prior approval by the FDIC. If S&T Bank chooses not to exercise the option for early redemption on September 15, 2011 or subsequent quarters, the subordinated debt will convert to a variable rate of 3-month LIBOR plus 160 basis points. The subordinated debt qualifies as Tier 2 capital under regulatory guidelines and will mature on December 15, 2036.
PAGE 2426
Item 7. MANAGEMENT’S DISCUSSION AND ANALYSIS
OF FINANCIAL CONDITION AND RESULTS OF OPERATIONS — continued
the FHLB. The purpose of these borrowings was to provide matched fundings for newly originated loans, to mitigate the risk associated with volatile liability fundings, to take advantage of lower-cost funds through the FHLB’s Community Investment Program and to fund stock buy-backs.
During the fourth quarter of 2003, S&T prepaid $89.3 million of fixed-rate borrowings, with average maturities of approximately nine months and an average cost of 6.56 percent, resulting in a pretax prepayment charge of $3.6 million. The prepayment penalties are reflected in S&T’s Consolidated Statements of Income as noninterest expense. The funds were replaced with short-term borrowings having an average cost of 1.25 percent. The expense savings approximated $3.0 million in 2004 and $0.5 million in 2003. The reduction in higher-cost long-term debt was an ALCO strategy intended to mitigate the asset sensitivity position of S&T’s balance sheet and exposure to declining interest rates or a flattening yield curve.
The following table shows the distribution of our short-term borrowings and the weighted average interest rates thereon at the end of each of the last three years. Also provided are the maximum amount of borrowings and the average amounts of borrowings as well as weighted average interest rates for the last three years.
| Securities Sold under Repurchase Agreements and Federal Funds Purchased | 2005 | 2004 | 2003 | 2006 | 2005 | 2004 | ||||||||||||||||||
| (dollars in thousands) | ||||||||||||||||||||||||
Balance at December 31 | $ | 137,829 | $ | 98,384 | $ | 182,020 | $ | 133,021 | $ | 137,829 | $ | 98,384 | ||||||||||||
Average balance during the year | 132,406 | 164,645 | 185,214 | 114,544 | 132,406 | 164,645 | ||||||||||||||||||
Average interest rate during the year | 2.98 | % | 1.16 | % | 1.13 | % | 4.51 | % | 2.98 | % | 1.16 | % | ||||||||||||
Maximum month-end balance during the year | $ | 174,467 | $ | 199,538 | $ | 230,774 | $ | 156,471 | $ | 174,467 | $ | 199,538 | ||||||||||||
Average interest rate at year-end | 3.80 | % | 1.77 | % | 0.95 | % | 4.83 | % | 3.80 | % | 1.77 | % | ||||||||||||
| Federal Home Loan Bank (FHLB) Advances | 2005 | 2004 | 2003 | 2006 | 2005 | 2004 | ||||||||||||||||||
| (dollars in thousands) | ||||||||||||||||||||||||
Balance at December 31 | $ | 150,000 | $ | 225,000 | $ | 250,000 | $ | 55,000 | $ | 150,000 | $ | 225,000 | ||||||||||||
Average balance during the year | 221,918 | 293,391 | 142,136 | 88,342 | 221,918 | 293,391 | ||||||||||||||||||
Average interest rate during the year | 3.21 | % | 1.47 | % | 1.28 | % | 5.01 | % | 3.21 | % | 1.47 | % | ||||||||||||
Maximum month-end balance during the year | $ | 315,000 | $ | 380,000 | $ | 250,000 | $ | 150,000 | $ | 315,000 | $ | 380,000 | ||||||||||||
Average interest rate at year-end | 4.34 | % | 2.20 | % | 1.20 | % | 5.44 | % | 4.34 | % | 2.20 | % | ||||||||||||
WEALTH MANAGEMENT ASSETS
The year-end 20052006 market value balance of the S&T Bank Wealth Managementwealth management assets under management, which are not accounted for as part of the assets of S&T, increased 512 percent in 20052006 to $1.2$1.4 billion, with $912.8$959.8 million in Wealth Management Serviceswealth management services and $311.5$416.6 million in Brokerage Services.brokerage services. The 20052006 increase is attributable to increased performance in the stock markets and newly developed business relationships.
EXPLANATION OF USE OF NON-GAAP FINANCIAL MEASURES
In addition to the results of operations presented in accordance with generally accepted accounting principles (“GAAP”), S&T management uses, and this annual report contains or references, certain non-GAAP financial measures, such as net interest income on a fully tax-equivalent basis and operating revenue. S&T believes these non-GAAP financial measures provide information useful to investors in understanding our underlying operational performance and our business and performance trends as they facilitate comparisons with the performance of others in the financial
PAGE 25
Item 7. MANAGEMENT’S DISCUSSION AND ANALYSIS
OF FINANCIAL CONDITION AND RESULTS OF OPERATIONS — continued
services industry. Although S&T believes that these non-GAAP financial measures enhance investors’ understanding of S&T’s business and performance, these non-GAAP financial measures should not be considered an alternative to GAAP.
We believe the presentation of net interest income on a fully tax-equivalent basis ensures comparability of net interest income arising from both taxable and tax-exempt sources and is consistent with industry practice. Interest income per the consolidated statements of income is reconciled to net interest income adjusted to a fully tax-equivalent basis on page 27.29.
Operating revenue is the sum of net interest income and noninterest income less security gains. In order to understand the significance of net interest income to S&T business and operating results, S&T management believes it is appropriate to evaluate the significance of net interest income as a component of operating revenue.
PAGE 27
Item 7. MANAGEMENT’S DISCUSSION AND ANALYSIS
OF FINANCIAL CONDITION AND RESULTS OF OPERATIONS — continued
RESULTS OF OPERATIONS
Year Ended December 31, 2006
NET INCOME
Net income was $53.3 million or $2.06 per diluted earnings per share in 2006, an 8 percent decrease from the $58.2 million or $2.18 per diluted earnings per share in 2005. The decrease in earnings was primarily the result of a higher provision for loan losses due to the deterioration in the credit quality of three large commercial loan relationships, the $0.9 million charge-down for properties previously acquired through foreclosure and other increases to noninterest expense. The return on average assets was 1.64 percent for 2006, as compared to 1.90 percent for 2005. The return on average equity was 15.37 percent for 2006 compared to 16.57 percent for 2005.
RETURN ON EQUITY AND ASSETS
The table below shows consolidated operating and capital ratios of S&T for each of the last three years:
| Year Ended December 31 | |||||||||
| 2006 | 2005 | 2004 | |||||||
Return on average assets | 1.64 | % | 1.90 | % | 1.83 | % | |||
Return on average equity | 15.37 | % | 16.57 | % | 16.07 | % | |||
Dividend payout ratio | 56.34 | % | 50.38 | % | 51.70 | % | |||
Equity to asset ratio | 10.16 | % | 11.03 | % | 11.68 | % | |||
NET INTEREST INCOME
On a fully tax-equivalent basis, net interest income increased $1.0 million or 1 percent in 2006 compared to 2005. The net yield on interest earning assets decreased to 3.86 percent in 2006 as compared to 4.05 percent in 2005. The decrease in the net yield on earning assets is primarily attributable to the effect of rising short-term interest rates in combination with a flat and inverted yield curve during the period. S&T’s balance sheet is liability sensitive, with funding costs rising faster than asset yields in today’s interest rate environment.
In 2006, average loans increased $217.3 million and average securities, other investments and federal funds sold decreased $50.7 million. The yields on average loans increased by 80 basis points, and the yields on average securities increased 15 basis points. Overall funding costs increased 75 basis points.
Average interest-bearing deposits provided $249.1 million of the funds for the growth in average earning assets, at a cost of 3.54 percent in 2006 as compared to 2.45 percent in 2005. The cost of repurchase agreements and other borrowed funds increased 157 basis points to 4.96 percent.
Negatively affecting net interest income was a $13.8 million decrease in average net free funds during 2006 compared to 2005. Average net free funds are the excess of demand deposits, other noninterest-bearing liabilities and shareholders’ equity over nonearning assets. The decrease is primarily due to a successful stock buy-back program in 2006, higher levels of cash and due from banks, defined benefit pension plan fundings and an increase in premises and equipment due to new branches and administrative facilities during 2006.
Net interest income represents the difference between the interest and fees earned on interest-earning assets and the interest paid on interest-bearing liabilities. Net interest income is affected by changes in the volume of interest-earning assets and interest-bearing liabilities and changes in interest yields and rates. Therefore, maintaining consistent spreads between earning assets and
PAGE 28
Item 7. MANAGEMENT’S DISCUSSION AND ANALYSIS
OF FINANCIAL CONDITION AND RESULTS OF OPERATIONS — continued
interest-bearing liabilities is very significant to our financial performance because net interest income comprised 76 percent of operating revenue, (net interest income plus noninterest income, excluding security gains) in 2006 and 78 percent in 2005. The level and mix of earning assets and funds are continually monitored by ALCO in order to mitigate the interest-rate sensitivity and liquidity risks of the balance sheet. A variety of ALCO strategies were successfully implemented, within prescribed ALCO risk parameters, to maintain an acceptable net interest margin given the challenges of the current interest rate environment.
Interest on loans to and obligations of state, municipalities and other public entities are not subject to federal income tax. As such, the stated (pre-tax) yield on these assets is lower than the yields on taxable assets of similar risk and maturity. In order to make the pre-tax income and resultant yields comparable to taxable loans and investments, a tax-equivalent adjustment was added to interest income in the tables below. This adjustment is calculated using the U.S. federal statutory corporate income tax rate of 35 percent for 2006, 2005 and 2004.
The following table reconciles interest income per the consolidated statements of income to net interest income adjusted to a fully tax-equivalent basis:
| Year Ended December 31 | |||||||||
| 2006 | 2005 | 2004 | |||||||
| (dollars in thousands) | |||||||||
Interest income per consolidated statements of income | $ | 204,702 | $ | 172,122 | $ | 148,638 | |||
Adjustment to fully tax-equivalent basis | 4,504 | 4,042 | 3,706 | ||||||
Interest income adjusted to fully tax-equivalent basis | 209,206 | 176,164 | 152,344 | ||||||
Interest expense | 91,584 | 59,514 | 40,890 | ||||||
Net interest income adjusted to fully tax-equivalent basis | $ | 117,622 | $ | 116,650 | $ | 111,454 | |||
PAGE 29
Item 7. MANAGEMENT’S DISCUSSION AND ANALYSIS
OF FINANCIAL CONDITION AND RESULTS OF OPERATIONS — continued
Average Balance Sheet and Net Interest Income Analysis
| December 31 | |||||||||||||||||||||||||||
| 2006 | 2005 | 2004 | |||||||||||||||||||||||||
| Average Balance | Interest | Yield/ Rate | Average Balance | Interest | Yield/ Rate | Average Balance | Interest | Yield/ Rate | |||||||||||||||||||
| (dollars in thousands) | |||||||||||||||||||||||||||
ASSETS | |||||||||||||||||||||||||||
Loans(1)(2) | $ | 2,588,175 | $ | 187,818 | 7.26% | $ | 2,370,851 | $ | 153,193 | 6.46% | $ | 2,225,314 | $ | 128,086 | 5.76% | ||||||||||||
Taxable investment securities | 362,307 | 16,374 | 4.52% | 413,967 | 18,638 | 4.50% | 479,944 | 20,669 | 4.31% | ||||||||||||||||||
Tax-exempt investment securities(2) | 84,116 | 4,145 | 4.93% | 78,846 | 3,844 | 4.88% | 67,701 | 3,275 | 4.84% | ||||||||||||||||||
Other investments | 12,676 | 771 | 6.09% | 16,126 | 395 | 2.45% | 19,013 | 295 | 1.55% | ||||||||||||||||||
Federal funds sold | 1,890 | 98 | 5.20% | 2,750 | 94 | 3.42% | 1,050 | 19 | 1.81% | ||||||||||||||||||
Total interest-earning assets(3) | 3,049,164 | 209,206 | 6.86% | 2,882,540 | 176,164 | 6.11% | 2,793,022 | 152,344 | 5.45% | ||||||||||||||||||
Noninterest-earning assets: | |||||||||||||||||||||||||||
Cash and due from banks | 53,331 | 50,471 | 46,964 | ||||||||||||||||||||||||
Premises and equipment, net | 31,973 | 26,494 | 23,850 | ||||||||||||||||||||||||
Other assets | 162,866 | 149,305 | 142,249 | ||||||||||||||||||||||||
Less allowance for loan losses | (36,427 | ) | (35,466 | ) | (33,357 | ) | |||||||||||||||||||||
Total | $ | 3,260,907 | $ | 3,073,344 | $ | 2,972,728 | |||||||||||||||||||||
LIABILITIES AND SHAREHOLDERS’ EQUITY |
| ||||||||||||||||||||||||||
Interest-bearing liabilities: | |||||||||||||||||||||||||||
NOW/Money market accounts | $ | 334,987 | $ | 3,796 | 1.13% | $ | 438,356 | $ | 3,833 | 0.87% | $ | 538,471 | $ | 3,264 | 0.61% | ||||||||||||
Savings deposits | 829,700 | 32,787 | 3.95% | 502,641 | 11,263 | 2.24% | 235,926 | 1,493 | 0.63% | ||||||||||||||||||
Time deposits | 914,621 | 36,946 | 4.04% | 889,261 | 29,728 | 3.34% | 857,534 | 25,874 | 3.02% | ||||||||||||||||||
Federal funds purchased | 21,560 | 1,109 | 5.14% | 21,829 | 727 | 3.33% | 25,392 | 371 | 1.46% | ||||||||||||||||||
Securities sold under repurchase agreements | 92,984 | 4,063 | 4.37% | 110,577 | 3,218 | 2.91% | 139,253 | 1,547 | 1.11% | ||||||||||||||||||
Short-term borrowings | 88,342 | 4,424 | 5.01% | 221,918 | 7,127 | 3.21% | 293,391 | 4,321 | 1.47% | ||||||||||||||||||
Long-term borrowings | 154,276 | 7,988 | 5.18% | 78,419 | 3,618 | 4.61% | 103,900 | 4,020 | 3.87% | ||||||||||||||||||
Subordinated debt | 6,986 | 471 | 6.74% | — | — | — | — | — | — | ||||||||||||||||||
Total interest-bearing liabilities(3) | 2,443,456 | 91,584 | 3.75% | 2,263,001 | 59,514 | 2.63% | 2,193,867 | 40,890 | 1.86% | ||||||||||||||||||
Noninterest-bearing liabilities: | |||||||||||||||||||||||||||
Demand deposits | 423,808 | 411,236 | 391,885 | ||||||||||||||||||||||||
Other | 46,732 | 47,570 | 48,725 | ||||||||||||||||||||||||
Shareholders’ equity | 346,911 | 351,537 | 338,251 | ||||||||||||||||||||||||
Total | $ | 3,260,907 | $ | 3,073,344 | $ | 2,972,728 | |||||||||||||||||||||
Net interest income | $ | 117,622 | $ | 116,650 | $ | 111,454 | |||||||||||||||||||||
Net yield on interest-earning assets | 3.86% | 4.05% | 3.99% | ||||||||||||||||||||||||
| (1) | For the purpose of these computations, nonaccruing loans are included in the daily average loan amounts outstanding. |
| (2) | Tax-exempt income is on a fully tax-equivalent basis, including the dividend-received deduction for equity securities, using the statutory federal corporate income tax rate of 35 percent for 2006, 2005 and 2004. |
| (3) | Yields are calculated using historical cost basis. |
PAGE 30
Item 7. MANAGEMENT’S DISCUSSION AND ANALYSIS
OF FINANCIAL CONDITION AND RESULTS OF OPERATIONS — continued
The following tables set forth for the periods indicated a summary of the changes in interest earned and interest paid resulting from changes in volume and changes in rates:
| 2006 Compared to 2005 Increase (Decrease) Due to(1) | 2005 Compared to 2004 Increase (Decrease) Due to(1) | |||||||||||||||||||||||
| Volume | Rate | Net | Volume | Rate | Net | |||||||||||||||||||
| (dollars in thousands) | ||||||||||||||||||||||||
Interest earned on: | ||||||||||||||||||||||||
Loans(2) | $ | 14,043 | $ | 20,583 | $ | 34,626 | $ | 8,377 | $ | 16,729 | $ | 25,106 | ||||||||||||
Taxable investment securities | (2,326 | ) | 62 | (2,264 | ) | (2,841 | ) | 811 | (2,030 | ) | ||||||||||||||
Tax-exempt investment securities(2) | 257 | 43 | 300 | 539 | 30 | 569 | ||||||||||||||||||
Other investments | (85 | ) | 461 | 376 | (45 | ) | 145 | 100 | ||||||||||||||||
Federal funds sold | (29 | ) | 34 | 5 | 31 | 44 | 75 | |||||||||||||||||
Total interest-earning assets | 11,860 | 21,183 | $ | 33,043 | 6,061 | 17,759 | 23,820 | |||||||||||||||||
Interest paid on: | ||||||||||||||||||||||||
NOW/money market accounts | (904 | ) | 867 | (37 | ) | (607 | ) | 1,176 | 569 | |||||||||||||||
Savings deposits | 7,329 | 14,195 | 21,524 | 1,688 | 8,082 | 9,770 | ||||||||||||||||||
Time deposits | 848 | 6,370 | 7,218 | 958 | 2,896 | 3,854 | ||||||||||||||||||
Federal funds purchased | (9 | ) | 390 | 381 | (52 | ) | 408 | 356 | ||||||||||||||||
Securities sold under agreements to repurchase | (512 | ) | 1,357 | 845 | (318 | ) | 1,990 | 1,672 | ||||||||||||||||
Short-term borrowings | (4,290 | ) | 1,587 | (2,703 | ) | (1,053 | ) | 3,859 | 2,806 | |||||||||||||||
Long-term borrowings | 3,499 | 873 | 4,372 | (986 | ) | 583 | (403 | ) | ||||||||||||||||
Subordinated debt | 471 | — | 471 | — | — | — | ||||||||||||||||||
Total interest-bearing liabilities | 6,432 | 25,639 | 32,071 | (370 | ) | 18,994 | 18,624 | |||||||||||||||||
Change in net interest income | $ | 5,428 | $ | (4,456 | ) | $ | 972 | $ | 6,431 | $ | (1,235 | ) | $ | 5,196 | ||||||||||
| (1) | The change in interest due to both volume and rate has been allocated to volume and rate changes in proportion to the relationship of the absolute dollar amounts of the change in each. |
| (2) | Tax-exempt income is on a fully tax-equivalent basis using the statutory federal corporate income tax rate of 35 percent for 2006, 2005 and 2004. |
PROVISION FOR LOAN LOSSES
The provision for loan losses is an amount added to the allowance against which loan losses are charged. The provision for loan losses was $9.4 million and $5.0 million for 2006 and 2005, respectively. The provision is the result of management’s assessment of credit quality statistics and other risk factors that would have an impact on probable losses in the loan portfolio, and the model used to determine the adequacy of the allowance for loan losses. A statistical model is used to assist in the determination of the adequacy of the allowance for loan losses. Changes in the risk ratings within allowance for loan loss model are consistent with the decline in asset quality, which includes a significant increase in net loan charge-offs and nonaccrual loans that occurred as a result of the aforementioned commercial loan relationships.
Credit quality is the most important factor in determining the amount of the allowance, and the resulting provision. Also affecting the amount of the allowance and resulting provision is loan growth and portfolio composition. Most of the loan growth in 2006 and 2005 is attributable to larger commercial loans. Net loan charge-offs totaled $12.7 million for 2006 and $1.7 million in 2005. The most significant charge-offs for 2006 were the aforementioned $7.2 million construction company, $2.7 million for a commercial real estate loan participation and $1.5 million for a wholesale
PAGE 31
Item 7. MANAGEMENT’S DISCUSSION AND ANALYSIS
OF FINANCIAL CONDITION AND RESULTS OF OPERATIONS — continued
distributor, all of which were previously considered in the analysis for the adequacy of the allowance for loan losses. Nonaccrual loans to total loans increased to 0.74 percent at December 31, 2006 as compared to 0.45 percent at December 31, 2005.
NONINTEREST INCOME
Noninterest income, excluding net security gains, increased $2.5 million, or 8 percent in 2006 compared to 2005. Increases included $0.8 million or 9 percent in service charges on deposit accounts, a $0.9 million or 13 percent increase in wealth management fees, a $1.0 million or 17 percent increase in insurance activities and a $0.6 million or 8 percent increase in other revenue, offset by a $0.8 million or 53 percent decrease in mortgage banking activities.
S&T recognized $6.1 million of gains on the sale of securities in 2006. These gains were partially offset by $0.6 million of realized losses taken for an-other-than-temporary impairment, in accordance with FSP 115-1 and FAS 124-1, “The Meaning of Other-Than-Temporary Impairment and Its Application to Certain Investments”, on three equity investment securities. Security gains were primarily attributable to the sales of equity securities in order to maximize returns by taking advantage of market opportunities when presented. The equities portfolio is comprised primarily of bank holding company common stock.
The $0.8 million increase in service charges on deposit accounts is primarily a result of management’s continued effort to implement reasonable fees for services performed and to manage closely the collection of these fees, as well as to expand new cash management relationships. During 2006, fees for insufficient funds increased $0.9 million as a result of product redesign. The $0.9 million increase in wealth management fees were a result of new business development and increased performance in the stock market values of customer accounts during 2006. Insurance commissions increased $1.0 million primarily as a result of stronger overall sales volume and the acquisition of Holsinger Insurance Agency during the first quarter of 2006. These areas were the focus of several strategic initiatives and product enhancements implemented in order to expand these sources of noninterest income. The $0.8 million decrease in mortgage banking activities is primarily a result of lower origination volumes and a decline in the gain on sale recognized upon sale of these loans into the secondary markets reflective, of a general slow-down in the housing market. Other fee revenue increases of $0.6 million reflect normal organization expansion and include increases of $0.5 million in debit/credit card activity.
NONINTEREST EXPENSE
Noninterest expense increased $6.8 million or 11 percent in 2006 compared to 2005. S&T’s efficiency ratio, which measures noninterest expense as a percent of noninterest income, excluding security gains plus net interest income on a fully tax-equivalent basis, was 45 percent in 2006 and 42 percent in 2005.
Staff expense increased 8 percent or $2.9 million in 2006. This increase is primarily attributable to the effects of normal year-end merit increases, the addition of 15 average full-time equivalent staff to implement new strategic initiatives and expanded retail facilities and the $0.8 million effect of implementing Financial Accounting Standards Board Statement No. 123(R), “Share Based Payment”. Also impacting staff expense in 2006 is a $1.0 million incentive paid to all employees to provide transitioning from bank-wide stock option grants into a new performance-based incentive plan. No corporate-wide stock option grants, including grants to executive management and directors, were awarded in 2006, as compared to prior years. Average full-time equivalent staff was 801 in 2006 and 786 in 2005.
S&T’s net periodic defined benefit plan cost is based primarily on three assumptions: the discount rate for plan liabilities, the expected return on plan assets and the rate of compensation increase. Net periodic pension expense of $0.8 million and $0.9 million, respectively was recorded for S&T’s
PAGE 32
Item 7. MANAGEMENT’S DISCUSSION AND ANALYSIS
OF FINANCIAL CONDITION AND RESULTS OF OPERATIONS — continued
defined benefit plan for 2006 and 2005. Net periodic pension expense is expected to approximate $0.1 million for the year 2007, assuming no significant changes in plan assumptions.
Occupancy, equipment and data processing expense increased 7 percent or $0.9 million as compared to 2005 due to several facility restructurings, which included the addition of new branches and administrative facilities. Other tax expense increased 10 percent or $0.3 million as compared to 2005 primarily as a result of increases in Pennsylvania shares tax. Other expenses increased 25 percent or $2.5 million in 2006 as compared to 2005 primarily due to $1.0 million of write-downs of real estate previously acquired through foreclosure to current market values, an increase of $0.6 million in the allowance for lending-related commitments, a $0.3 million increase in legal expenses and $0.4 million of revenue received in 2005 for a historical rehabilitation tax credit partnership.
FEDERAL INCOME TAXES
Federal income tax expense decreased $2.8 million to $21.5 million in 2006 as compared to 2005. This decrease is primarily attributable to a decrease in pre-tax income. The effective tax rate of 29 percent in 2006 and 2005 was below the 35 percent statutory tax rate due to the tax benefits resulting from tax-exempt interest, excludable dividend income and the tax benefits associated with Low Income Housing Tax Credit (“LIHTC”) and Federal Historic Tax Credit projects. S&T currently does not incur any alternative minimum tax.
RESULTS OF OPERATIONS
Year Ended December 31, 2005
NET INCOME
Net income was a record $58.2 million or $2.18 per diluted earnings per share in 2005, a 7 percent increase from the $54.4 million or $2.03 per diluted earnings per share in 2004. The increase in earnings was primarily the result of increases in net interest income and noninterest income offset by lower security gains and increased noninterest expense. The return on average assets was 1.90 percent for 2005, as compared to 1.83 percent for 2004. The return on average equity wasat 16.57 percent for 2005 compared to 16.07 percent for 2004.
RETURN ON EQUITY AND ASSETS
The table below shows consolidated operating and capital ratios of S&T for each of the last three years:
| Year Ended December 31 | |||||||||
| 2005 | 2004 | 2003 | |||||||
Return on average assets | 1.90 | % | 1.83 | % | 1.81 | % | |||
Return on average equity | 16.57 | % | 16.07 | % | 16.23 | % | |||
Dividend payout ratio | 50.38 | % | 51.70 | % | 51.62 | % | |||
Equity to asset ratio | 11.03 | % | 11.68 | % | 11.47 | % | |||
NET INTEREST INCOME
On a fully tax-equivalent basis, net interest income increased $5.2 million or 4.7 percent in 2005 compared to 2004. The net yield on interest-earning assets increased to 4.05 percent in 2005 as compared to 3.99 percent in 2004. The increase in net yield on interest earning assets is attributable to the effect of higher short-term interest rates on a balance sheet that was asset sensitive most of the year, growth in core deposits and reduced balance sheet leveraging activities as the risk reward for leveraging activities have been significantly reduced by a flattening yield curve.
In 2005, average loans increased $145.6 million and average securities and federal funds sold decreased $56.0 million. The yields on average loans increased by 70 basis points and the yields on average securities increased 22 basis points. Overall funding costs increased 66 basis points.
Average interest-bearing deposits provided $198.3 million of the funds for the growth in average earning assets, at a cost of 2.45 percent in 2005 as compared to 1.88 percent in 2004. The cost of repurchase agreements and other borrowed funds increased 157 basis points to 3.39 percent.
PAGE 26
Item 7. MANAGEMENT’S DISCUSSION AND ANALYSIS
OF FINANCIAL CONDITION AND RESULTS OF OPERATIONS — continued
Positively affecting net interest income was a $20.3 million increase in average net free funds during 2005 compared to 2004. Average net free funds are the excess of demand deposits, other noninterest-bearing liabilities and shareholders’ equity over nonearning assets. Most of this increase is due to the successful marketing of new demand accounts and corporate cash management services.
Net interest income represents the difference between the interest and fees earned on interest-earning assets and the interest paid on interest-bearing liabilities. Net interest income is affected by changes in the volume of interest-earning assets and interest-bearing liabilities and changes in interest yields and rates. Therefore, maintaining consistent spreads between earning assets and interest-bearing liabilities is very significant to our financial performance because net interest income comprised 78 percent of operating revenue, (net interest income plus noninterest income, excluding security gains) in 2005 and 79 percent in 2004. The level and mix of earning assets and funds are continually monitored by ALCO in order to mitigate the interest-rate sensitivity and liquidity risks of the balance sheet. A variety of ALCO strategies were successfully implemented, within prescribed ALCO risk parameters that enabled us to maintain a net interest margin consistent with historical levels.
Interest on loans to and obligations of state, municipalities and other public entities is not subject to federal income tax. As such, the stated (pre-tax) yield on these assets is lower than the yields on taxable assets of similar risk and maturity. In order to make the pre-tax income and resultant yields comparable to taxable loans and investments, a tax-equivalent adjustment was added to interest income in the tables below. This adjustment has been calculated using the U.S. federal statutory corporate income tax rate of 35 percent for 2005, 2004 and 2003.
The following table reconciles interest income per the consolidated statements of income to net interest income adjusted to a fully tax-equivalent basis:
| Year Ended December 31 | |||||||||
| 2005 | 2004 | 2003 | |||||||
| (dollars in thousands ) | |||||||||
Interest income per consolidated statements of income | $ | 172,122 | $ | 148,638 | $ | 151,460 | |||
Adjustment to fully tax-equivalent basis | 4,042 | 3,706 | 3,675 | ||||||
Interest income adjusted to fully tax-equivalent basis | 176,164 | 152,344 | 155,135 | ||||||
Interest expense | 59,514 | 40,890 | 47,066 | ||||||
Net interest income adjusted to fully tax-equivalent basis | $ | 116,650 | $ | 111,454 | $ | 108,069 | |||
PAGE 2733
Item 7. MANAGEMENT’S DISCUSSION AND ANALYSIS
OF FINANCIAL CONDITION AND RESULTS OF OPERATIONS — continued
Average Balance Sheet and Net Interest Income Analysis
| December 31 | |||||||||||||||||||||||||||
| 2005 | 2004 | 2003 | |||||||||||||||||||||||||
| Average Balance | Interest | Yield/ Rate | Average Balance | Interest | Yield/ Rate | Average Balance | Interest | Yield/ Rate | |||||||||||||||||||
| (dollars in thousands ) | |||||||||||||||||||||||||||
ASSETS | |||||||||||||||||||||||||||
Loans(1)(2) | $ | 2,370,851 | $ | 153,192 | 6.46% | $ | 2,225,314 | $ | 128,087 | 5.76% | $ | 2,034,670 | $ | 126,535 | 6.22% | ||||||||||||
Taxable investment securities | 430,093 | 19,032 | 4.43% | 498,957 | 20,962 | 4.20% | 584,024 | 25,888 | 4.43% | ||||||||||||||||||
Tax-exempt investment securities(2) | 78,846 | 3,844 | 4.88% | 67,701 | 3,275 | 4.84% | 55,311 | 2,711 | 4.90% | ||||||||||||||||||
Interest-earning deposits with banks | 109 | 2 | 1.41% | 156 | 1 | 0.89% | 192 | 1 | 0.52% | ||||||||||||||||||
Federal funds sold | 2,750 | 94 | 3.42% | 1,050 | 19 | 1.81% | 40 | — | — | ||||||||||||||||||
Total interest-earning assets(3) | 2,882,649 | 176,164 | 6.11% | 2,793,178 | 152,344 | 5.45% | 2,674,237 | 155,135 | 5.80% | ||||||||||||||||||
Noninterest-earning assets: | |||||||||||||||||||||||||||
Cash and due from banks | 50,471 | 46,964 | 49,209 | ||||||||||||||||||||||||
Premises and equipment, net | 26,494 | 23,850 | 22,927 | ||||||||||||||||||||||||
Other assets | 149,196 | 142,093 | 138,978 | ||||||||||||||||||||||||
Less allowance for loan losses | (35,466 | ) | (33,357 | ) | (31,117 | ) | |||||||||||||||||||||
Total | $ | 3,073,344 | $ | 2,972,728 | $ | 2,854,234 | |||||||||||||||||||||
LIABILITIES AND SHAREHOLDERS’ EQUITY |
| ||||||||||||||||||||||||||
Interest-bearing liabilities: | |||||||||||||||||||||||||||
NOW/Money market accounts | $ | 438,356 | $ | 3,833 | 0.87% | $ | 538,471 | $ | 3,264 | 0.61% | $ | 568,869 | $ | 3,772 | 0.66% | ||||||||||||
Savings deposits | 502,641 | 11,263 | 2.24% | 235,926 | 1,493 | 0.63% | 203,633 | 944 | 0.46% | ||||||||||||||||||
Time deposits | 889,261 | 29,728 | 3.34% | 857,534 | 25,874 | 3.02% | 803,323 | 26,502 | 3.30% | ||||||||||||||||||
Federal funds purchased | 21,829 | 727 | 3.33% | 25,392 | 371 | 1.46% | 39,123 | 526 | 1.34% | ||||||||||||||||||
Securities sold under repurchase agreements | 110,577 | 3,218 | 2.91% | 139,253 | 1,547 | 1.11% | 146,091 | 1,567 | 1.07% | ||||||||||||||||||
Short-term borrowings | 221,918 | 7,127 | 3.21% | 293,391 | 4,321 | 1.47% | 142,136 | 1,814 | 1.28% | ||||||||||||||||||
Long-term borrowings | 78,419 | 3,618 | 4.61% | 103,900 | 4,020 | 3.87% | 228,963 | 11,941 | 5.22% | ||||||||||||||||||
Total interest-bearing liabilities(3) | 2,263,001 | 59,514 | 2.63% | 2,193,867 | 40,890 | 1.86% | 2,132,138 | 47,066 | 2.21% | ||||||||||||||||||
Noninterest-bearing liabilities: | |||||||||||||||||||||||||||
Demand deposits | 411,236 | 391,885 | 347,042 | ||||||||||||||||||||||||
Other | 47,570 | 48,725 | 56,071 | ||||||||||||||||||||||||
Shareholders’ equity | 351,537 | 338,251 | 318,983 | ||||||||||||||||||||||||
Total | $ | 3,073,344 | $ | 2,972,728 | $ | 2,854,234 | |||||||||||||||||||||
Net interest income | $ | 116,650 | $ | 111,454 | $ | 108,069 | |||||||||||||||||||||
Net yield on interest-earning assets | 4.05% | 3.99% | 4.04% | ||||||||||||||||||||||||
PAGE 28
Item 7. MANAGEMENT’S DISCUSSION AND ANALYSIS
OF FINANCIAL CONDITION AND RESULTS OF OPERATIONS — continued
The following tables set forth for the periods indicated a summary of the changes in interest earned and interest paid resulting from changes in volume and changes in rates:
2005 Compared to 2004 Increase (Decrease) Due to(1) | 2004 Compared to 2003 Increase (Decrease) Due to(1) | |||||||||||||||||||||||
| Volume | Rate | Net | Volume | Rate | Net | |||||||||||||||||||
| (dollars in thousands ) | ||||||||||||||||||||||||
Interest earned on: | ||||||||||||||||||||||||
Loans(2) | $ | 8,377 | $ | 16,728 | $ | 25,105 | $ | 11,856 | $ | (10,304 | ) | $ | 1,552 | |||||||||||
Taxable investment securities | (2,893 | ) | 963 | (1,930 | ) | (3,771 | ) | (1,155 | ) | (4,926 | ) | |||||||||||||
Tax-exempt investment securities(2) | 539 | 30 | 569 | 607 | (43 | ) | 564 | |||||||||||||||||
Interest-earning deposits with banks | — | 1 | 1 | — | — | — | ||||||||||||||||||
Federal funds sold | 31 | 44 | 75 | — | 19 | 19 | ||||||||||||||||||
Total interest-earning assets | 6,054 | 17,766 | 23,820 | 8,692 | (11,483 | ) | (2,791 | ) | ||||||||||||||||
Interest paid on: | ||||||||||||||||||||||||
NOW/money market accounts | (607 | ) | 1,176 | 569 | (202 | ) | (306 | ) | (508 | ) | ||||||||||||||
Savings deposits | 1,688 | 8,082 | 9,770 | 150 | 399 | 549 | ||||||||||||||||||
Time deposits | 957 | 2,897 | 3,854 | 1,788 | (2,416 | ) | (628 | ) | ||||||||||||||||
Federal funds purchased | (51 | ) | 407 | 356 | (185 | ) | 30 | (155 | ) | |||||||||||||||
Securities sold under repurchase agreements | (319 | ) | 1,990 | 1,671 | (73 | ) | 53 | (20 | ) | |||||||||||||||
Short-term borrowings | (1,053 | ) | 3,859 | 2,806 | 1,930 | 577 | 2,507 | |||||||||||||||||
Long-term borrowings | (986 | ) | 584 | (402 | ) | (6,522 | ) | (1,399 | ) | (7,921 | ) | |||||||||||||
Total interest-bearing liabilities | (371 | ) | 18,995 | 18,624 | (3,114 | ) | (3,062 | ) | (6,176 | ) | ||||||||||||||
Change in net interest income | $ | 6,425 | $ | (1,229 | ) | $ | 5,196 | $ | 11,806 | $ | (8,421 | ) | $ | 3,385 | ||||||||||
PROVISION FOR LOAN LOSSES
The provision for loan losses is an amount added to the allowance against which loan losses are charged. The provision for loan losses was $5.0 million and $4.4 million for 2005 and 2004, respectively. The provision is the result of management’s assessment of credit quality statistics and other risk factors that would have an impact on probable losses in the loan portfolio, and the model used to determine the adequacy of the allowance for loan losses. A statistical model is used for the determination of the adequacy of the allowance for loan losses. Changes in the provision and allowance for loan losses are directionally consistent with changes in credit quality and other risk factors. During 2005, S&T recorded a specific allowance for one impaired commercial loan relationship, which accounted for the majority of the provision for the loan losses for 2005. S&T’s exposure with respect to this one commercial loan has been appropriately considered in determining the adequacy of its allowance for loan losses based on the valuation of the underlying collateral and S&T’s expectation of future cash flows from this commercial loan relationship.
Credit quality is the most important factor in determining the amount of the allowance, and the resulting provision. Also affecting the amount of the allowance and resulting provision is loan growth
PAGE 29
Item 7. MANAGEMENT’S DISCUSSION AND ANALYSIS
OF FINANCIAL CONDITION AND RESULTS OF OPERATIONS — continued
and portfolio composition. Most of the loan growth in 2005 and 2004 is attributable to largerlarger-sized commercial loans. Net loan charge-offs totaled $1.7 million for 2005 and $1.6 million in 2004. Included in the 2004 net charge-offs is a $3.9 million recovery in the fourth quarter of 2004 of two previously charged-off commercial loans in the hotel and manufacturing industries that were considered in the determination of the allowance for loan losses. NonperformingNonaccrual loans to total loans increased to 0.45 percent at December 31, 2005 as compared to 0.28 percent at December 31, 2004.
NONINTEREST INCOME
Noninterest income, excluding net security gains, increased $3.7 million or 13 percent in 2005 compared to 2004. Increases included $0.2 million or 2 percent in service charges on deposit accounts, a $0.8 million or 13 percent increase in wealth management fees, a $0.2 million or 9 percent increase in letter of credit fees, a $1.1 million or 25 percent increase in insurance activities, a $0.1 million or 8 percent increase in mortgage banking activities and a $1.3 million or 25 percent increase in other revenue.
SecurityNet security gains totaled $5.0 million in 2005. S&T recognized $5.3 million of gross gains on securities and gross losses of $0.3 million on the sale of securities in 2005. Security gains were primarily attributable to the sales of equity securities in order to maximize returns by taking advantage of market opportunities when presented. OurThe equities portfolio is comprised primarily of bank holding company common stock.
The increase in wealth management fees were a result of new business and general market improvements as well as a $0.3 million increase in discount brokerage fees. Assets under management increased 5 percent in 2005 to $1.2 billion as a result of new customers and general market improvements. Insurance commissions increased $1.1 million primarily as a result of stronger overall sales volume and the acquisition of Bennett Associates Inc. and Cowher-Nehrig & Company during the first quarter of 2005. These areas were the focus of several strategic initiatives and product enhancements implemented in order to expand these sources of noninterest income. Other fee revenue increases of $1.3 million reflect normal organization expansion and include increases of $0.5 million in debit/credit card activity, $0.5 million of commercial loan swap fees and $0.2 million of gains on the sale of real estate owned acquired through foreclosure.
NONINTEREST EXPENSE
Noninterest expense increased $2.5 million or 4 percent in 2005 compared to 2004. S&T’s efficiency ratio, which measures noninterest expense as a percent of noninterest income, excluding security gains plus net interest income on a fully tax-equivalent basis, was 42 percent in 2005 and 43 percent in 2004.
Staff expense increased 6 percent or $1.9 million in 2005. This increase is primarily attributable to the effects of year-end merit increases and increased staffing levels required to implement new initiatives, offset by lower medical plan costs in 2005. Average full-time equivalent staff was 786 in 2005 and 774 in 2004.
S&T’s net periodic defined benefit plan cost is based primarily on three assumptions: the discount rate for plan liabilities, the expected return on plan assets and the rate of compensation increase. Net periodic pension expense of $0.9 million was recorded for S&T’s defined benefit plan for 2005 and 2004. Net periodic pension expense is expected to approximate $0.9 million for the year 2006, assuming no significant changes in plan assumptions.
Occupancy and equipment expense increased 14 percent or $1.0 million as compared to 2004 as a result of a renegotiated and shorter lease term for an existing headquarter facilitiesfacility resulting in anticipation of the construction of a new building targeted for completion in the third quarter of 2006, and the addition of five new branches since year-end 2004. Data processing costs increased 8 percent or $0.3 million in 2005 as
PAGE 3034
Item 7. MANAGEMENT’S DISCUSSION AND ANALYSIS
OF FINANCIAL CONDITION AND RESULTS OF OPERATIONS — continued
acceleration of depreciation terms for leasehold improvements. Data processing costs increased 8 percent or $0.3 million in 2005 as compared to 2004. This increase is primarily attributable to increased organizational growth related to increased business activity, primarily in the commercial lending and credit administration areas. Other expenses decreased 6 percent or $0.6 million in 2005 as compared to 2004 primarily due to a $0.4 million reduction in the losses on low income housing and historical rehabilitation tax credit projects, a $0.1 million decrease to the reserveallowance for unfunded loanlending-related commitments and a $0.1 million refund resulting from a sales/use tax review initiative.
FEDERAL INCOME TAXES
Federal income tax expense increased $1.3 million to $24.3 million in 2005 as compared to 2004. This increase is primarily attributable to a higher level of taxable income. The effective tax rate of 29 percent in 2005 and 30 percent in 2004 was below the 35 percent statutory tax rate due to the tax benefits resulting from tax-exempt interest, excludable dividend income and the tax benefits associated with Low Income Housing Tax Credit (“LIHTC”) and Federal Historic Tax Credit projects. S&T currently does not incur any alternative minimum tax.
RESULTS OF OPERATIONS
Year Ended December 31, 2004
NET INCOME
Net income was a record $54.4 million or $2.03 per diluted earnings per share in 2004, a 5 percent increase from the $51.8 million or $1.94 per diluted earnings per share in 2003. The increase in earnings was primarily the result of increases in net interest income and lower provision for loan losses, offset by lower security gains. The return on average assets was 1.83 percent for 2004, as compared to 1.81 percent for 2003. The return on average equity at 16.07 percent for 2004 compared to 16.23 percent for 2003.
NET INTEREST INCOME
On a fully tax-equivalent basis, net interest income increased $3.4 million or 3.2 percent for 2004 compared to 2003. The net yield on interest-earning assets decreased to 3.99 percent in 2004 as compared to 4.04 percent in 2003. The decline in net interest margin is primarily due to significant loan refinancing activities and the shift of customer preferences for lower-rate variable loans during a period of historically low interest rates. This effect on net interest income was offset by higher-earning asset volumes, the growth in core deposits and the replacement of some fixed-rate borrowings with short-term borrowings.
In 2004, average loans increased $190.6 million and average securities decreased $72.7 million. The yields on average loans decreased by 46 basis points and the yields on average securities decreased 19 basis points. Overall funding costs decreased 35 basis points.
Average interest-bearing deposits provided $56.1 million of the funds for the growth in average earning assets, at a cost of 1.88 percent in 2004 as compared to 1.98 percent in 2003. The cost of repurchase agreements and other borrowed funds decreased 102 basis points to 1.83 percent.
Positively affecting net interest income was a $57.2 million increase in average net free funds during 2004 compared to 2003. Average net free funds are the excess of demand deposits, other noninterest-bearing liabilities and shareholders’ equity over nonearning assets. Most of this increase is due to the successful marketing of new demand accounts and corporate cash management services.
PROVISION FOR LOAN LOSSES
The provision for loan losses was $4.4 million and $7.3 million for 2004 and 2003, respectively. Most of the loan growth in 2004 and 2003 is attributable to larger-sized commercial loans. Net loan charge-
PAGE 31
Item 7. MANAGEMENT’S DISCUSSION AND ANALYSIS
OF FINANCIAL CONDITION AND RESULTS OF OPERATIONS — continued
offs totaled $1.6 million for 2004 and $6.0 million in 2003. The decrease in 2004 is primarily attributable to the $3.9 million recovery in 2004 of two previously charged-off loans. Nonperforming loans to total loans decreased to 0.28 percent at December 31, 2004 as compared to 0.43 percent at December 31, 2003. The 2004 charge-offs primarily consist of commercial loans in the hotel and manufacturing industries that were considered in the determination of the prior period allowance for loan losses. The 2003 charge-offs were mostly related to commercial loans in the food processing, hotel and automotive sales industries that were also considered in the determination of the prior period allowance for loan losses.
NONINTEREST INCOME
Noninterest income, excluding net security gains, increased $0.7 million or 3 percent in 2004 compared to 2003. Increases included $0.1 million or 1 percent in service charges and fees, a $0.8 million or 15 percent increase in wealth management fees, a $0.3 million or 7 percent increase in insurance activities, a $0.1 million or 2 percent increase in other revenue offset by a $0.5 million or 27 percent decrease in mortgage banking income. Security gains totaled $5.3 million in 2004. S&T recognized $6.3 million of gains on securities and losses of $1.0 million on the sale of securities in 2004. Security gains were primarily attributable to the sales of equity securities in order to maximize returns by taking advantage of market opportunities when presented and to reduce the price and concentration risks developing in the equity portfolio as a result of increasing valuations in the stock market in general and with financial stocks in particular. Our equities portfolio is comprised primarily of bank holding company common stock. Debt securities were sold as part of an ALCO strategy to reduce the interest rate risk of an asset sensitive balance sheet position in a declining interest rate environment or a flattening yield curve.
The increase in wealth management fees were a result of new business and general market improvements. Assets under management increased 15 percent in 2004 to $1.2 billion. Insurance commissions increased $0.3 million from 2003 primarily as a result of new revenue being generated by Evergreen. These areas were the focus of several strategic initiatives and product enhancements implemented in order to expand these sources of noninterest income. Mortgage banking revenue decreased $0.5 million from 2003 as the result of a decline in residential mortgage originations in 2004. Other fee revenue increases of $0.1 million reflect normal organization expansion and include $0.2 million of losses on the sale of real estate owned acquired through foreclosure.
NONINTEREST EXPENSE
Noninterest expense decreased $0.5 million or 1 percent in 2004 compared to 2003. The primary factor in this reduction on noninterest expense relates to a $3.6 million prepayment penalty incurred in the fourth quarter of 2003 for early prepayment of $89.0 million of long-term debt. S&T’s efficiency ratio, which measures noninterest expense as a percent of noninterest income, excluding security gains plus net interest income on a fully tax-equivalent basis, was 43 percent in 2004 and 45 percent in 2003.
Staff expense increased 4 percent or $1.3 million in 2004. This increase is primarily attributable to higher medical plan costs, merit increases, higher staffing levels required to implement new initiatives in fee-based business lines in wealth management and retail banking products and services. Average full-time equivalent staff was 774 in 2004 and 764 in 2003.
S&T’s net periodic defined benefit plan cost is based primarily on three assumptions: the discount rate for plan liabilities, the expected return on plan assets and the rate of compensation increase. Net periodic pension expense of $0.9 million and $1.2 million was recorded for S&T’s defined benefit plan for 2004 and 2003, respectively.
PAGE 32
Item 7. MANAGEMENT’S DISCUSSION AND ANALYSIS
OF FINANCIAL CONDITION AND RESULTS OF OPERATIONS — continued
Occupancy and equipment expense increased 5 percent or $0.2 million as compared to 2003. The increase is primarily attributable to the 2004 opening of new offices in the Wildcat Commons Wal-Mart in Latrobe and Allegheny Towne Center in Leechburg, as well as the new Strawberry Meadows office in Altoona that opened in December 2003. Data processing costs increased 14 percent or $0.5 million in 2004 as compared to 2003. This increase is primarily attributable to increased organizational growth related to increased business activity, primarily in the commercial lending and credit administration areas. Other taxes increased 11 percent or $0.3 million in 2004 as compared to 2003 as a result of an increase in Pennsylvania shares tax. Marketing expense increased 18 percent or $0.4 million in 2004 as compared to 2003, primarily as a result of organizational expansion and strategic initiatives. Other expenses increased 4 percent or $0.4 million in 2004 as compared to 2003 primarily the result of normal changes due to activity increases, organizational expansion and fee increases from vendors. Other expenses also included a $0.5 million funding of S&T’s Charitable Foundation in 2004 as compared to $0.4 million in 2003.
FEDERAL INCOME TAXES
Federal income tax expense increased $2.1 million to $23.0 million in 2004 as compared to 2003. This increase is primarily attributable to a higher level of taxable income. The effective tax rate of 30 percent in 2004 and 29 percent in 2003 was below the 35 percent statutory tax rate due to the tax benefits resulting from tax-exempt interest, excludable dividend income and the tax benefits associated with Low Income Housing Tax Credit (“LIHTC”) and Federal Historic Tax Credit projects.
LIQUIDITY AND CAPITAL RESOURCES
Shareholders’ equity increased $3.3decreased $13.4 million at December 31, 20052006 compared to December 31, 2004.2005. The primary source of equity growth is earnings retention. Capital growth is a function of net income less dividends paid to shareholders and treasury stock activities.
Net income was $58.2$53.3 million and dividends paid to shareholders were $29.3$30.0 million for 2005.2006. S&T paid 5056 percent of 20052006 net income in dividends, equating to an annual dividend rate of $1.13$1.17 per share. Also affecting capital was a decrease of $11.7$2.1 million in unrealized gains on securities available for sale, net of tax, which is included in other comprehensive income. Also affecting capital was a decrease of $3.0 million upon adoption of Financial Accounting Standards Board Statement No. 158, “Employers’ Accounting for Defined Benefit Pension and Other Post Retirement Plans,” which is included in other comprehensive income, net of tax and the effects of stock buybacks.
During 2005,2006, S&T repurchased 660,4001,031,700 shares of its common stock at an average price of $35.09$34.19 per share. The impact of the repurchased shares is insignificant$0.02 increase to diluted earnings per share. The remaining shares authorized under this program expired at December 31, 2005. S&T reissued 330,735 shares during 2005 primarily through the exercise of employee stock options. In December 2005, our Board of Directors previously authorized a planstock buyback program for our repurchase2006 of up to one million shares, or approximately 4 percent of shares outstandingoutstanding. During 2006, S&T repurchased 999,000 shares under this program at an average cost of $34.20 per share. On October 16, 2006, the S&T Board of Directors authorized a new stock buyback program until September 30, 2007 of an additional one million shares with 32,700 shares repurchased under this plan during the period January 1,fourth quarter of 2006 at an average cost of $33.63 per share. S&T reissued 122,244 shares during 2006 primarily through the exercise of employee stock options. See schedule on page 15 for the 2006 share repurchase activity.
On September 21, 2006, S&T Bank issued $25.0 million of junior subordinated debt through a pooled transaction at an initial fixed rate of 6.78%. On September 15, 2011 and quarterly thereafter, S&T bank shall have the option to redeem the subordinated debt, subject to a 30 day written notice and prior approval by the FDIC. If S&T Bank chooses not to exercise the option for early redemption on September 15, 2011 or subsequent quarters, the subordinated debt will convert to a variable rate of 3-month LIBOR plus 160 basis points. The subordinated debt qualifies as Tier 2 capital under regulatory guidelines and will mature on December 31, 2006.15, 2036.
The book value of S&T’s common stock increased 2 percent from $13.12 at December 31, 2004 to $13.41 at December 31, 2005, primarily due to earnings retention.
We continue&T continues to maintain a strong capital position with a leverage ratio of 9.58.8 percent as compared to the 20052006 minimum regulatory guideline of 3 percent. S&T’s risk-based capital Tier 1 and Total ratios were 10.59.7 percent and 12.111.9 percent, respectively, at December 31, 2005,2006, which places S&T well above the Federal Reserve Board’s risk-based capital guidelines of 4 percent and 8 percent for
PAGE 35
Item 7. MANAGEMENT’S DISCUSSION AND ANALYSIS
OF FINANCIAL CONDITION AND RESULTS OF OPERATIONS — continued
Tier 1 and Total capital. Included in the total ratio is 45 percent of the pretax unrealized holding gains on available for sale equity securities as prescribed by banking regulations effective October 1, 1998. In addition, management believes that S&T has the ability to raise additional capital if necessary.
During 2003, S&T filed a shelf registration statement on Form S-3 under the Securities Act of 1933 with the SEC for the issuance of up to $150.0 million of a variety of securities including, debt and capital securities, preferred and common stock and warrants. S&T may use the proceeds from the sale of any securities for general corporate purposes, which could include investments at the holding
PAGE 33
Item 7. MANAGEMENT’S DISCUSSION AND ANALYSIS
OF FINANCIAL CONDITION AND RESULTS OF OPERATIONS — continued
company level, investing in, or extending credit to, its subsidiaries, possible acquisitions and stock repurchases. As of December 31, 2005,2006, S&T had not issued any securities pursuant to the shelf registration statement.
In April 1993, shareholders approved the S&T Incentive Stock Plan (“Stock Plan”) authorizing the issuance of a maximum of 1.2 million shares of S&T’s common stock to assist in attracting and retaining employees of outstanding ability and to align their interests with those of the shareholders of S&T. On October 17, 1994, the Stock Plan was amended to include outside directors. On April 21, 1997, shareholders approved an amendment to the Stock Plan increasing the number of authorized shares to 3.2 million. As of December 31, 2002, 3,180,822 nonstatutory stock options and 35,600 restricted stock awards had been granted to key employees and outside directors under the Stock Plan; 906,962 of these awards are currently exercisable. In April 2003, shareholders approved the 2003 S&T Incentive Stock Plan (“2003 Stock Plan”) authorizing the issuance of 1.5 million shares, subject to capital adjustments as provided in the 2003 Stock Plan. The purpose of the 2003 Stock Plan is to promote the long-term interests of S&T and its shareholders by attracting and retaining directors, officers and key employees. S&T believes that directors, officers and employees who own shares of its common stock will have a closer identification with S&T and a greater motivation to work for S&T’s success, because, as shareholders, they will participate in S&T’s growth and earnings. As of December 31, 2005, 933,5002006, 937,500 nonstatutory stock options had been granted under the 2003 Stock Plan to employees and directors; 515,350642,750 of these awards are currently exercisable. On December 19, 2005, S&T also granted 206,900 cash appreciation rights under the 2005 Cash Appreciation Rights Plan to employees. None of these awards are currently exercisable. No corporate-wide stock option grants, including grants to executive management and directors, were awarded in 2006.
S&T has various financial obligations, including contractual obligations and commitments that may require future cash payments. The following table presents as of December 31, 2005,2006, significant fixed and determinable contractual obligations to third parties by payment date:
| Payments Due In | Payments Due In | |||||||||||||||||||||||||||||
Less than One Year | One to Three Years | Three to Five Years | Over Five Years | Total | Less than One Year | One to Three Years | Three to Five Years | Over Five Years | Total | |||||||||||||||||||||
| (dollars in thousands) | ||||||||||||||||||||||||||||||
Deposits without a stated maturity(1) | $ | 1,485,776 | $ | — | $ | — | $ | — | $ | 1,485,776 | $ | 1,644,094 | $ | — | $ | — | $ | — | $ | 1,644,094 | ||||||||||
Time deposits(1) | 548,150 | 301,691 | 59,678 | 23,589 | 933,108 | 659,530 | 216,789 | 35,557 | 9,337 | 921,213 | ||||||||||||||||||||
Federal funds purchased and securities sold under repurchase agreements(1) | 137,829 | — | — | — | 137,829 | 133,021 | — | — | — | 133,021 | ||||||||||||||||||||
Short-term borrowings(1) | 150,000 | — | — | — | 150,000 | 55,000 | — | — | — | 55,000 | ||||||||||||||||||||
Long-term borrowings(1) | 45,344 | 10,741 | 18,934 | 8,757 | 83,776 | 20,921 | 135,394 | 6,324 | 9,303 | 171,942 | ||||||||||||||||||||
Junior subordinated debt securities(1) | — | — | — | 25,000 | 25,000 | |||||||||||||||||||||||||
Operating leases | 1,195 | 1,774 | 1,623 | 5,547 | 10,139 | 1,089 | 2,079 | 1,996 | 15,004 | 20,168 | ||||||||||||||||||||
Purchase obligations | 3,000 | 6,000 | 5,750 | — | 14,750 | 3,000 | 6,000 | 2,750 | — | 11,750 | ||||||||||||||||||||
Total | $ | 2,371,294 | $ | 320,206 | $ | 85,985 | $ | 37,893 | $ | 2,815,378 | $ | 2,516,655 | $ | 360,262 | $ | 46,627 | $ | 58,644 | $ | 2,982,188 | ||||||||||
| (1) | Excludes interest |
PAGE 36
Item 7. MANAGEMENT’S DISCUSSION AND ANALYSIS
OF FINANCIAL CONDITION AND RESULTS OF OPERATIONS — continued
Operating lease obligations represent short-term lease arrangements as described in Note F to the consolidated financial statements. Purchase obligations represent obligations under agreement with Metavante, S&T’s third party data processing servicer, for operational services outsourced. The Metavante obligation has a buyout provision of 40 percent of the remaining payments under the original term of the contract.
In the normal course of business, S&T commits to extend credit and issue standby letters of credit. These obligations are not recorded in our financial statements. Loan commitments and standby letters of credit are subject to S&T’s normal credit underwriting policies and procedures and generally
PAGE 34
Item 7. MANAGEMENT’S DISCUSSION AND ANALYSIS
OF FINANCIAL CONDITION AND RESULTS OF OPERATIONS — continued
require collateral based upon management’s evaluation of each customer’s financial condition and ability to satisfy completely the terms of the agreement and are renewed on an annual basis. Our exposure to credit loss in the event the customer does not satisfy the terms of the agreement equals the notional amount of the obligation less the value of any collateral. Unfunded commercial loan commitments totaled $635,809,000$686,204,000 and $547,627,000$635,809,000 at December 31, 20052006 and 2004,2005, respectively. Unfunded other loan commitments totaled $144,694,000$157,863,000 and $134,059,000$144,694,000 at December 31, 20052006 and 2004,2005, respectively; and obligations under standby letters of credit totaled $206,249,000$220,494,000 and $213,409,000$206,249,000 at December 31, 20052006 and 2004,2005, respectively.
REGULATORY MATTERS
S&T and S&T Bank are subject to periodic examinations by one or more of the various regulatory agencies. During 2005,2006, an examination of S&T Bank was conducted by the Federal Deposit Insurance Corporation (“FDIC”) and a financial holding company inspection was conducted by the Federal Reserve Bank of Cleveland.Cleveland (“Federal Reserve”). The inspectionexamination by the Federal Reserve Bank of ClevelandFDIC included, but was not limited to, procedures designed to review processeslending practices, credit quality, liquidity, operations and practices in relationcapital adequacy of S&T Bank and its subsidiaries. The examination by the Federal Reserve included, but was not limited to, credit, market, liquidity, operational, legalprocedures designed to review board of director and reputational risks.related committee meetings minutes, financial statements, corporate policies and intercompany transactions of S&T and its subsidiaries. No comments were received from the FDIC or Federal Reserve Bank of Cleveland that would have a material effect on S&T’s liquidity, capital resources or operations. S&T’s current capital position and results of regulatory examination allow it to pay the lowest possible rate for FDIC deposit insurance.
CRITICAL ACCOUNTING POLICIES AND JUDGMENTS
We have established various accounting policies that govern the application of accounting principles generally accepted in the United States in the preparation of its consolidated financial statements. The most significant of these policies are described in Note A — Accounting Policies. Certain of these policies require numerous estimates and strategic or economic assumptions that may prove inaccurate or subject to variations and may significantly affect S&T’s reported results and financial position for the period or in future periods. Changes in underlying factors, assumptions or estimates in any of these areas could have a material impact on S&T’s future financial condition and results of operations.
Securities
Securities are reported at cost adjusted for premiums and discounts and are recognized in interest income using the interest method over the period to maturity. Declines in market value of individual securities below their amortized cost, and that are other-than-temporary, will be written down to current market value and included in earnings as realized losses. Management systematically evaluates securities for other-than-temporary declines in market value on a quarterly basis. If the financial markets experience deterioration, additional charges to income could occur in future periods.
PAGE 37
Item 7. MANAGEMENT’S DISCUSSION AND ANALYSIS
OF FINANCIAL CONDITION AND RESULTS OF OPERATIONS — continued
Allowance for Loan Losses
Determination of an adequate allowance for loan losses is inherently subjective, as it requires estimations of occurrence of future events as well as timing of such events.
The allowance for loan losses is increased by charges to income and decreased by charge-offs (net of recoveries). S&T’s periodic evaluation of the adequacy of the allowance for loan losses is determined by management through evaluation of the loss exposure on individual impaired, nonperforming and delinquent and high-dollar loans; review of risk conditions and business trends; historical loss experience; and growth and composition of the loan portfolio, as well as other relevant factors.
PAGE 35
Item 7. MANAGEMENT’S DISCUSSION AND ANALYSIS
OF FINANCIAL CONDITION AND RESULTS OF OPERATIONS — continued
A quantitative analysis is utilized to support the adequacy of the allowance for loan losses. This analysis includes review of the historical charge-offs that have occurrence within the creditscredits’ economic life cycle. Management also assesses qualitative factors such as portfolio credit trends, unemployment trends, vacancy trends, loan growth and variable interest rate factors.
Significant to this analysis is the shift in loan portfolio composition to an increased mix of commercial loans. These loans are generally larger in size, and, due to our continuing growth, many are unsecured or new loan relationships. Management relies on its risk-rating process to monitor trends that may be occurring relative to commercial loans to assess potential weaknesses within the credit. Current risk factors and trends in risk ratings are considered in the determination and allocation of the allowance for loan losses. During 2005,2006, the risk-rating profile of the portfolio remained relatively stable.
The allowance for loan losses at December 31, 20052006 includes $32.1$28.5 million or 8886 percent of the allowance allocated to commercial and industrial and commercial real estate loans. The ability for customers to repay commercial loans is more dependent upon the success of their business, continuing income and general economic conditions. Accordingly, the risk of loss is higher on such loans than on residential real estate loans, which generally incur lower losses in the event of foreclosure as the collateral value typically exceeds the loan amounts.
Goodwill and Other Intangible Assets
S&T has $3.3$2.9 million of core deposit intangible assets subject to amortization and $49.1$49.9 million in goodwill, which is not subject to periodic amortization. S&T determined the amount of identifiable intangible assets based upon an independent core deposit analysis and insurance contract analysis. An annual evaluation of identifiable intangible assets for impairment is performed by S&T. S&T concluded that the recorded value of identifiable intangible assets was not impaired as a result of the evaluation as of December 31, 2006.
Goodwill arising from business combinations represents the value attributable to unidentifiable intangible elements in the business acquired. S&T’s goodwill relates to value inherent in the banking business and the value is dependent upon S&T’s ability to provide quality, cost-effective services in the face of free competition from other market participants on a regional basis. This ability relies upon continuing investments in processing systems, the development of value-added service features and the ease of use of S&T’s services. As such, goodwill value is supported ultimately by revenue that is driven by the volume of business transacted. A decline in earnings as a result of a lack of growth or the inability to deliver cost-effective services over sustained periods can lead to impairment of goodwill, which could adversely impact earnings in future periods. An annual evaluation of goodwill for impairment is performed by S&T. The market value of S&T and the implied market value of goodwill at the respective reporting unit level are estimated using industry comparable information. S&T has concluded that the recorded value of goodwill was not impaired as a result of the evaluation as of September 30, 2005.October 1, 2006.
PAGE 38
Item 7. MANAGEMENT’S DISCUSSION AND ANALYSIS
OF FINANCIAL CONDITION AND RESULTS OF OPERATIONS — continued
INFLATION
Management is aware of the significant effect inflation has on interest rates and can have on financial performance. S&T’s ability to cope with this is best determined by analyzing its capability to respond to changing interest rates and its ability to manage noninterest income and expense. S&T monitors its mix of interest-rate sensitive assets and liabilities through ALCO in order to reduce the impact of inflation on net interest income. Management also controls the effects of inflation by reviewing the prices of its products and services, by introducing new products and services and by controlling overhead expenses.
BUSINESS UNCERTAINTIES
There are many uncertainties regarding the economy as we enter 2006. S&T continually strives to be well positioned for changes in both the economy and interest rates, regardless of the timing or
PAGE 36
Item 7. MANAGEMENT’S DISCUSSION AND ANALYSIS
OF FINANCIAL CONDITION AND RESULTS OF OPERATIONS — continued
direction of these changes. We continually assess our balance sheet, capital, liquidity and operation infrastructures in order to be positioned to take advantage of internal or acquisition growth opportunities.
There are many factors that could influence our results, both positively and negatively, in 2006. Because the majority of our revenue comes from net interest income, internally generated loan and deposit growth and the mix of that growth are major factors on our operations and financial condition. S&T has directed a fair amount of focus and resources in planning for 2006 to improve our generation and retention of low cost core deposits. On the other hand, a slowing economy could cause deterioration in the asset quality measurements. We recognize that our shift to a greater dependence on commercial loans in recent years exposes us to larger credit risks and greater swings in nonperforming loans and charge-offs when problems do occur. However, because of our earnings strength and strong capitalization, as well as the strengths of other businesses in our market area, management does not expect a decline in our ability to satisfactorily perform if a further decline in our economy occurs.
“SAFE HARBOR” STATEMENT UNDER THE PRIVATE SECURITIES LITIGATION REFORM ACT OF 1995
This Annual Report on Form 10-K contains or incorporates statements that we believeS&T believes are “forward-looking statements” within the meaning of the Private Securities Litigation Reform Act of 1995. These statements generally relate to ourS&T’s financial condition, results of operations, plans, objectives, future performance or business. They usually can be identified by the use of forward-looking language such as “will likely result,” “may,” “are expected to,” “is anticipated,” “estimate,” “forecast,” “projected,” “intends to” or other similar words. You should not place undue reliance on these statements, as they are subject to risks and uncertainties, including but not limited to those described in this Form 10-K or the documents incorporated by reference. When considering these forward-looking statements, you should keep in mind these risks and uncertainties, as well as any cautionary statements we may make. Moreover, you should treat these statements as speaking only as of the date they are made and based only on information then actually known to us. We undertake no obligation to update publicly any forward-looking statements, whether as a result of new information, future events or otherwise.
These forward-looking statements are based on current expectations, estimates and projections about S&T’s business, management’s beliefs and assumptions made by management. These statements are not guarantees of future performance and involve certain risks, uncertainties and assumptions (“Future Factors”), which are difficult to predict. Therefore, actual outcomes and results may differ materially from what is expressed or forecasted in these forward-looking statements.
Future Factors include:
changes in interest rates, spreads on earning assets and interest-bearing liabilities, and interest rate sensitivity;
credit losses;
sources of liquidity;
legislation affecting the financial services industry as a whole, and/or S&T and its subsidiaries individually or collectively;
regulatory supervision and oversight, including required capital levels;
increasing price and product/service competition by competitors, including new entrants;
rapid technological developments and changes;
the ability to continue to introduce competitive new products and services on a timely, cost-effective basis;
the mix of products/services;
containing costs and expenses;
governmental and public policy changes, including environmental regulations;
reliance on large customers;
technological, implementation and cost/financial risks in large, multi-year contracts;
the outcome of pending and future litigation and governmental proceedings;
continued availability of financing;
PAGE 3739
Item 7. MANAGEMENT’S DISCUSSION AND ANALYSIS
OF FINANCIAL CONDITION AND RESULTS OF OPERATIONS — continued
financial resources in the amounts, at the times and on the terms required to support our future businesses; and
general economic or business conditions, either nationally or regionally, may be less favorable than expected, resulting in the actual financial results of mergeramong other things, a reduced demand for credit and acquisition activities compared to our initial expectations, including the full realization of anticipated cost savings and revenue enhancements.other services.
These are representative of the Future Factors that could affect the outcome of the forward-looking statements. In addition, such statements could be affected by general industry and market conditions and growth rates, general economic conditions, including interest rate and currency exchange rate fluctuations, and other Future Factors.
LIQUIDITY AND INTEREST RATE SENSITIVITY
Liquidity refers to the ability to satisfy the financial needs of depositors who want to withdraw funds, or of borrowers needing access to funds to meet their credit needs. Interest-rate sensitivity management seeks to avoid fluctuating net interest margins and to enhance net interest income through periods of changing interest rates. The Asset Liability Committee (ALCO)ALCO is responsible for establishing and monitoring the liquidity and interest rate sensitivity guidelines, procedures and policies.
The principal sources of asset liquidity are cash and due from banks, interest-earning deposits with banks, federal funds, investment securities that mature in one year or less and securities available for sale. At December 31, 2005,2006, the total of such assets was approximately $550.8$502.6 million or 1715 percent of consolidated assets. While much more difficult to quantify, liability liquidity is further enhanced by a stable core deposit base, access to credit lines at other financial institutions and S&T’s ability to renew maturing deposits. Certificates of deposit in denominations of $100,000 or more represented 910 percent of deposits at December 31, 20052006 and were outstanding primarily to local customers. S&T’s ability to attract deposits and borrow funds depends primarily on continued rate competitiveness, profitability, capitalization and overall financial condition.
Beyond the issue of having sufficient sources to fund unexpected credit demands or deposit withdrawals, liquidity management also is an important factor in monitoring and managing interest-rate sensitivity issues through ALCO. Through forecast and simulation models, ALCO is also able to project future funding needs and develop strategies for acquiring funds at a reasonable cost. ALCO uses a variety of measurements to monitor the liquidity position of S&T. These include liquidity gap, liquidity forecast, net loans and standby letters of credit to assets, net loans to deposits and net non-core funding dependence ratio.
Item 7A. QUANTITATIVE AND QUALITATIVE DISCLOSURES ABOUT MARKET RISK
Because the assets and liabilities of S&T are primarily monetary in nature, the presentation and analysis of cash flows in formats prescribed by accounting principles generally accepted in the United States are less meaningful for managing bank liquidity than for non-financial companies. Funds are typically provided from current earnings, maturity and sales of securities available for sale, loan
PAGE 38
Item 7A. QUANTITATIVE AND QUALITATIVE DISCLOSURES ABOUT MARKET RISK — continued
repayments, deposits and borrowings. The primary uses of funds include new loans, repayment of borrowings, the purchase of securities and dividends to shareholders. The level and mix of sources and uses of funds are constantly monitored and adjusted by ALCO in order to maintain credit, liquidity and interest-rate risks within prescribed policy guidelines while maximizing earnings.
ALCO monitors and manages interest-rate sensitivity through gap, rate shock analysisand rate ramp analyses, economic value of equity (EVE) and simulations in order to avoid unacceptable earnings fluctuations due to interest rate changes. S&T’s gap model includes certain managementInterest rate sensitivity analyses are highly dependent on assumptions, which have been developed based upon past experience and the expected behavior of customers.customers under various rate scenarios. The assumptions include principal prepayments for fixed rate
PAGE 40
Item 7(A). QUANTITATIVE AND QUALITATIVE DISCLOSURES ABOUT MARKET RISK — continued
loans, mortgage-backed securities and collateralized mortgage obligations (“CMOs”), and classifying the demand, savings and money market balances by degree of interest-rate sensitivity.
The gap and cumulative gap represents the net position of assets and liabilities subject to repricing in specified time periods, as measured by a ratio of rate sensitive assets to rate sensitive liabilities. The gap analysis below incorporates a flat rate scenario, and the following significant assumptions:
Monthly loan prepayments above contractual requirements | |||||
3 year ARM—Commercial Real Estate | 1.50 | % | |||
5 year ARM—Commercial Real Estate | 1.75 | % | |||
Fixed Rate—Commercial Real Estate | 1.75 | % | |||
Residential Real Estate | % | ||||
Fixed Rate Home Equity | 1.50 | % | |||
Other Installment Loans | 2.25 | % | |||
Deposit behavioral pattern/decay rate assumptions | |||||
NOW and Savings—Year #1 | 25.00 | % | |||
NOW and Savings—Year #2 | 25.00 | % | |||
NOW and Savings—beyond Year #2 | 50.00 | % | |||
Green Plan Savings—1-6 Months | 100.00 | % | |||
Money Market 1-6 Months | 100.00 | % | |||
S&T has not historically experienced significant fluctuations in demand deposit balances during periods of interest rate fluctuations. | NA | ||||
PAGE 3941
Item 7A.7(A). QUANTITATIVE AND QUALITATIVE DISCLOSURES ABOUT MARKET RISK — continued
Interest Rate Sensitivity
December 31, 20052006
| GAP | 1-6 Months | 7-12 Months | 13-24 Months | >2 Years | 1-6 Months | 7-12 Months | 13-24 Months | >2 Years | ||||||||||||||||||||||
| (dollars in thousands ) | ||||||||||||||||||||||||||||||
| (dollars in thousands) | ||||||||||||||||||||||||||||||
Repricing Assets: | ||||||||||||||||||||||||||||||
Cash/due from banks | $ | — | $ | — | $ | — | $ | 56,189 | $ | — | $ | — | $ | — | $ | 59,980 | ||||||||||||||
Securities | 51,498 | 31,735 | 57,917 | 353,425 | ||||||||||||||||||||||||||
Securities available for sale | 48,881 | 32,289 | 73,855 | 277,020 | ||||||||||||||||||||||||||
Other investments | 10,562 | — | — | — | ||||||||||||||||||||||||||
Net loans | 1,332,547 | 223,209 | 317,552 | 581,626 | 1,307,954 | 222,911 | 373,237 | 728,969 | ||||||||||||||||||||||
Other assets | — | — | — | 189,281 | — | — | — | 202,885 | ||||||||||||||||||||||
Total | 1,384,045 | 254,944 | 375,469 | 1,180,521 | 1,367,397 | 255,200 | 447,092 | 1,268,854 | ||||||||||||||||||||||
Repricing Liabilities: | ||||||||||||||||||||||||||||||
Demand | — | — | — | 435,672 | — | — | — | 448,453 | ||||||||||||||||||||||
NOW | 19,399 | 19,399 | 38,798 | 77,595 | 18,821 | 18,821 | 37,642 | 75,284 | ||||||||||||||||||||||
Money market | 242,228 | — | — | — | 163,105 | — | — | — | ||||||||||||||||||||||
Savings/clubs | 19,749 | 19,749 | 39,497 | 78,995 | 770,116 | 15,979 | 31,958 | 63,914 | ||||||||||||||||||||||
Green Plan savings | 494,695 | — | — | — | ||||||||||||||||||||||||||
Certificates | 350,830 | 197,366 | 198,706 | 186,205 | 443,555 | 215,979 | 161,685 | 99,994 | ||||||||||||||||||||||
Repos & short-term borrowings | 287,829 | — | — | — | 188,021 | — | — | — | ||||||||||||||||||||||
Long-term borrowings | 23,271 | 25,174 | 10,361 | 24,971 | 3,555 | 20,466 | 50,965 | 121,955 | ||||||||||||||||||||||
Swaps | — | — | — | — | ||||||||||||||||||||||||||
Other liabilities/equity | — | — | — | 404,490 | — | — | — | 388,275 | ||||||||||||||||||||||
Total | 1,438,001 | 261,688 | 287,362 | 1,207,928 | 1,587,173 | 271,245 | 282,250 | 1,197,875 | ||||||||||||||||||||||
GAP | (53,956 | ) | (6,744 | ) | 88,107 | (27,407 | ) | $ | (219,776 | ) | $ | (16,045 | ) | $ | 164,842 | $ | 70,979 | |||||||||||||
Cumulative GAP | $ | (53,956 | ) | $ | (60,700 | ) | $ | 27,407 | $ | — | $ | (219,776 | ) | $ | (235,821 | ) | $ | (70,979 | ) | $ | — | |||||||||
| Rate Sensitive Assets/Rate Sensitive Liabilities | December 31, 2005 | December 31, 2004 | December 31, 2006 | December 31, 2005 | ||||||
Cumulative 6 months | 0.96 | % | 1.11 | % | 0.86 | 0.96 | ||||
Cumulative 12 months | 0.96 | % | 1.10 | % | 0.87 | 0.96 | ||||
S&T’s one-year gap position at December 31, 20052006 indicates a liability sensitive position. This means that more liabilities than assets will reprice during the measured time frames. The implications of a liability sensitive position will differ depending upon the change in market interest rates.
For example, with a liability sensitive position in a declining interest rate environment, more liabilities than assets will decrease in rate. This situation could result in an increase to our interest rate spreads, and net interest income.income and operating spreads. Conversely, with a liability sensitive position in a rising interest rate environment, more liabilities than assets will increase in rates. This situation could result in a decrease to our interest rate spreads, and net interest income.income and operating spreads.
During 2005 S&T changed from being asset sensitive to slightlyhas become more liability sensitive since December 2005 mainly as measured by gap. The most important causea result of this is the increase inan inverted yield curve. An inverted yield curve occurs when short-term interest rates and the flattening ofare higher than long-term interest rates. When the yield curve. This makescurve is inverted customers tend to prefer short-term deposits and long-term loans, more attractive to customers, both of which make balance sheetsthe bank more liability sensitive. The shortening of deposits was seen in certificates of deposit, but was particularly evident in the success of the Green Plan, S&T’s new savings account that is indexed to the Federal Funds Target Rate.
In addition to the gap analysis, S&T performs a rate shock analysisand rate ramp analyses on a static balance sheet to estimate the effect that specific interest-rate changesa +/-100, +/-200 and +/-300 basis point instantaneous and gradual parallel shift in the yield curve would have on 12 months of pretax net interest income. The rate shock incorporates managementshocks incorporate assumptions regarding the level of interest rate changes on non-maturity
PAGE 40
Item 7A. QUANTITATIVE AND QUALITATIVE DISCLOSURES ABOUT MARKET RISK — continued
deposit products (savings, money market, NOW and demand deposits) and changes in the
PAGE 42
Item 7(A). QUANTITATIVE AND QUALITATIVE DISCLOSURES ABOUT MARKET RISK — continued
prepayment behavior of fixed rate loans and securities with optionality. Inclusion of these assumptions makes rate shock analysisand rate ramp analyses more useful than gap analysis alone. S&T’s policy is to limit the change in net interest income over a one-year horizon to -20% given changes in rates using shocks or rate ramps up to +/-300 basis points. Although +/-100 and +/-200 basis point changes for the rate shock and rate ramp analyses are not policy guidelines, these analyses are performed to ensure directional consistency of the +/-300 basis point analysis. The December 2006 results reflect a .14% increase and -5.96% decrease to net interest income in the -300 and +300 basis point rate shock analysis respectively.
The table below shows the resultspretax net interest income impact of the +/-300 rate shock analyses.
| Immediate Change in Rates | Immediate Change in Rates | |||||||||||||||
| Change in Pretax Net Interest Income | +300 bps | -300 bps | +300 bps | -300 bps | ||||||||||||
| (dollars in millions) | ||||||||||||||||
December 31, 2006 | $ | (6.8 | ) | $ | 0.0 | |||||||||||
December 31, 2005 | $ | (1.0 | ) | $ | (5.9 | ) | $ | (1.0 | ) | $ | (5.9 | ) | ||||
December 31, 2004 | $ | 6.7 | $ | (7.8 | ) | |||||||||||
ConsistentThe results in the - -300 basis point shock scenario are not consistent with our asset sensitive gap position in 2004, the rate shock analysis results showed net interest income increased in rates up and decreased in rates down. However, with a slightly liability sensitive gap position, in 2005, the rate shock analysis results were not consistent with gap in rates down, since gapwhich typically would indicate an increase in net interest income. The primary reasons for this are; 1)This is primarily due to: (1) rates on regular savings, NOW and money market accounts have lagged as short rates have increased and cannot be decreased to any great extent should rates go down; 2)down, and (2) loan prepaymentsrefinance activity will be considerable in rates down. When comparing December 2006 to December 2005 there was an improvement to net interest income in the -300 basis point rate shock scenario. This improvement can be attributed to three main reasons: (1) strong growth in savings and short term certificate of deposit balances; (2) fixed rate loan growth; and (3) implementing a strategy to mitigate the rates down whichrisk on the balance sheet through structured borrowings.
Consistent with a liability sensitive gap position, the +300 rate shock results show pretax net interest income decreasing in an increasing interest rate environment. The pretax net interest income decline in the +300 basis point results from December 2005 is not captured by gap analysis assuming flat rates; 3)primarily due to strong growth in short term deposits and an increase in fixed rate loans.
In order to monitor interest rate risk beyond the 2005one-year time horizon of shocks and rate ramps, S&T also performs economic value of equity (EVE) analysis. EVE represents the present value of all asset cash flows minus the present value of all liability cash flows. As with rate shock analysis, does not include growthEVE incorporates management assumptions which previously improved resultsregarding prepayment behavior of fixed rate loans and securities with optionality and core deposit behavior. S&T’s policy is to limit the change in bothEVE to -35% given changes in rates up to +/-300 basis points. The December 2006 results reflect a -9.02% and down;-8.75% decrease to EVE given a -300 and 4) the increased uncertainty of modeling customer behavior+300 basis point change in an interest rate environment that includes a generally flat yield curve with some inversions (longer-term rates lower than short-term rates).respectively.
PAGE 4143
Item 8. FINANCIAL STATEMENTS AND SUPPLEMENTARY DATA
Consolidated Financial Statements
PAGE 4244
S&T Bancorp, Inc. and Subsidiaries
| December 31 | 2005 | 2004 | ||||||
| (dollars in thousands, except per share data) | ||||||||
ASSETS | ||||||||
Cash and due from banks | $ | 56,189 | $ | 47,328 | ||||
Securities: | ||||||||
Available for sale | 494,575 | 517,906 | ||||||
Held to maturity (market value $0 in 2005 and $267 in 2004) | — | 265 | ||||||
Total Securities | 494,575 | 518,171 | ||||||
Loans, net of allowance for loan losses of $36,572 in 2005 and $34,262 in 2004 | 2,454,934 | 2,253,089 | ||||||
Premises and equipment, net | 29,123 | 25,491 | ||||||
Goodwill | 49,073 | 48,021 | ||||||
Other intangibles, net | 5,478 | 5,181 | ||||||
Bank owned life insurance | 33,107 | 32,077 | ||||||
Other assets | 72,500 | 59,676 | ||||||
Total Assets | $ | 3,194,979 | $ | 2,989,034 | ||||
LIABILITIES | ||||||||
Deposits: | ||||||||
Noninterest-bearing | $ | 435,672 | $ | 415,812 | ||||
Interest-bearing | 155,191 | 175,447 | ||||||
Money market | 242,228 | 332,009 | ||||||
Savings | 652,685 | 388,939 | ||||||
Time deposits | 933,108 | 864,056 | ||||||
Total Deposits | 2,418,884 | 2,176,263 | ||||||
Securities sold under repurchase agreements and federal funds purchased | 137,829 | 98,384 | ||||||
Short-term borrowings | 150,000 | 225,000 | ||||||
Long-term borrowings | 83,776 | 86,325 | ||||||
Other liabilities | 52,069 | 53,933 | ||||||
Total Liabilities | 2,842,558 | 2,639,905 | ||||||
SHAREHOLDERS’ EQUITY | ||||||||
Preferred stock, without par value, 10,000,000 shares authorized and none outstanding | — | — | ||||||
Common stock ($2.50 par value) Authorized—50,000,000 shares in 2005 and 2004 Issued—29,714,038 shares in 2005 and 2004 | 74,285 | 74,285 | ||||||
Additional paid-in capital | 26,120 | 24,079 | ||||||
Retained earnings | 326,158 | 297,690 | ||||||
Accumulated other comprehensive income | 9,172 | 20,875 | ||||||
Treasury stock (3,443,308 shares in 2005 and 3,113,643 shares in 2004, at cost) | (83,314 | ) | (67,800 | ) | ||||
Total Shareholders’ Equity | 352,421 | 349,129 | ||||||
Total Liabilities and Shareholders’ Equity | $ | 3,194,979 | $ | 2,989,034 | ||||
| December 31 | 2006 | 2005 | ||||||
| (dollars in thousands, except share and per share data) | ||||||||
ASSETS | ||||||||
Cash and due from banks | $ | 59,980 | $ | 56,189 | ||||
Securities available for sale | 432,045 | 481,257 | ||||||
Other investments | 10,562 | 13,318 | ||||||
Loans held for sale | 826 | 1,580 | ||||||
Portfolio loans, net of allowance for loan losses of $33,220 in 2006 and $36,572 in 2005 | 2,632,245 | 2,453,354 | ||||||
Premises and equipment, net | 35,700 | 29,123 | ||||||
Goodwill | 49,955 | 49,073 | ||||||
Other intangibles, net | 4,985 | 5,478 | ||||||
Bank owned life insurance | 34,251 | 33,107 | ||||||
Other assets | 77,994 | 72,500 | ||||||
Total Assets | $ | 3,338,543 | $ | 3,194,979 | ||||
LIABILITIES | ||||||||
Deposits: | ||||||||
Noninterest-bearing demand | $ | 448,453 | $ | 435,672 | ||||
Interest-bearing demand | 150,568 | 155,191 | ||||||
Money market | 163,105 | 242,228 | ||||||
Savings | 881,967 | 652,685 | ||||||
Time deposits | 921,213 | 933,108 | ||||||
Total Deposits | 2,565,306 | 2,418,884 | ||||||
Securities sold under repurchase agreements and federal funds purchased | 133,021 | 137,829 | ||||||
Short-term borrowings | 55,000 | 150,000 | ||||||
Long-term borrowings | 171,941 | 83,776 | ||||||
Junior subordinated debt securities | 25,000 | — | ||||||
Other liabilities | 49,224 | 52,069 | ||||||
Total Liabilities | 2,999,492 | 2,842,558 | ||||||
SHAREHOLDERS’ EQUITY | ||||||||
Preferred stock, without par value, 10,000,000 shares authorized and none outstanding | — | — | ||||||
Common stock ($2.50 par value) Authorized—50,000,000 shares in 2006 and 2005 Issued—29,714,038 shares in 2006 and 2005 | 74,285 | 74,285 | ||||||
Additional paid-in capital | 26,698 | 26,120 | ||||||
Retained earnings | 349,447 | 326,158 | ||||||
Accumulated other comprehensive income | 4,014 | 9,172 | ||||||
Treasury stock (4,352,764 shares in 2006 and 3,443,308 shares in 2005, at cost) | (115,393 | ) | (83,314 | ) | ||||
Total Shareholders’ Equity | 339,051 | 352,421 | ||||||
Total Liabilities and Shareholders’ Equity | $ | 3,338,543 | $ | 3,194,979 | ||||
See Notes to Consolidated Financial Statements
PAGE 4345
CONSOLIDATED STATEMENTS OF INCOME
S&T Bancorp, Inc. and Subsidiaries
| Year Ended December 31 | 2005 | 2004 | 2003 | 2006 | 2005 | 2004 | ||||||||||||
| (dollars in thousands, except per share data) | ||||||||||||||||||
INTEREST INCOME | ||||||||||||||||||
Loans, including fees | $ | 151,328 | $ | 126,337 | $ | 124,894 | $ | 185,544 | $ | 151,328 | $ | 126,337 | ||||||
Deposits with banks and federal funds sold | 95 | 20 | 1 | 101 | 95 | 20 | ||||||||||||
Investment Securities: | ||||||||||||||||||
Taxable | 15,990 | 18,003 | 21,925 | 14,293 | 15,990 | 18,003 | ||||||||||||
Tax-exempt | 2,499 | 2,129 | 1,762 | 2,694 | 2,499 | 2,129 | ||||||||||||
Dividends | 2,210 | 2,149 | 2,878 | 2,070 | 2,210 | 2,149 | ||||||||||||
Total Interest Income | 172,122 | 148,638 | 151,460 | 204,702 | 172,122 | 148,638 | ||||||||||||
INTEREST EXPENSE | ||||||||||||||||||
Deposits | 44,824 | 30,632 | 31,218 | 73,529 | 44,824 | 30,632 | ||||||||||||
Securities sold under repurchase agreements and federal funds purchased | 3,945 | 1,917 | 2,093 | 5,171 | 3,945 | 1,917 | ||||||||||||
Short-term borrowings | 7,127 | 4,321 | 1,814 | 4,424 | 7,127 | 4,321 | ||||||||||||
Long-term borrowings | 3,618 | 4,020 | 11,941 | |||||||||||||||
Long-term borrowings and capital securities | 8,460 | 3,618 | 4,020 | |||||||||||||||
Total Interest Expense | 59,514 | 40,890 | 47,066 | 91,584 | 59,514 | 40,890 | ||||||||||||
NET INTEREST INCOME | 112,608 | 107,748 | 104,394 | 113,118 | 112,608 | 107,748 | ||||||||||||
Provision for loan losses | 5,000 | 4,400 | 7,300 | 9,380 | 5,000 | 4,400 | ||||||||||||
Net Interest Income After Provision for Loan Losses | 107,608 | 103,348 | 97,094 | 103,738 | 107,608 | 103,348 | ||||||||||||
NONINTEREST INCOME | ||||||||||||||||||
Security gains, net | 5,008 | 5,344 | 8,058 | 5,481 | 5,008 | 5,344 | ||||||||||||
Service charges on deposit accounts | 9,587 | 9,383 | 9,252 | 10,412 | 9,587 | 9,383 | ||||||||||||
Wealth management fees | 6,977 | 6,201 | 5,410 | 7,862 | 6,977 | 6,201 | ||||||||||||
Letter of credit fees | 2,208 | 2,022 | 2,065 | 2,284 | 2,208 | 2,022 | ||||||||||||
Insurance agency fees | 5,685 | 4,558 | 4,277 | 6,637 | 5,685 | 4,558 | ||||||||||||
Mortgage banking | 1,497 | 1,391 | 1,989 | 703 | 1,497 | 1,391 | ||||||||||||
Other | 6,606 | 5,303 | 5,153 | 7,011 | 6,424 | 5,502 | ||||||||||||
Total Noninterest Income | 37,568 | 34,202 | 36,204 | 40,390 | 37,386 | 34,401 | ||||||||||||
NONINTEREST EXPENSE | ||||||||||||||||||
Salaries and employee benefits | 34,715 | 32,845 | 31,545 | 37,601 | 34,715 | 32,845 | ||||||||||||
Occupancy, net | 4,816 | 4,166 | 3,981 | 5,101 | 4,816 | 4,166 | ||||||||||||
Furniture and equipment | 3,251 | 2,916 | 2,826 | 3,297 | 3,251 | 2,916 | ||||||||||||
Other taxes | 2,698 | 2,609 | 2,345 | 2,973 | 2,698 | 2,609 | ||||||||||||
Data processing | 4,290 | 3,966 | 3,466 | 4,852 | 4,290 | 3,966 | ||||||||||||
Marketing | 2,326 | 2,399 | 2,026 | 2,478 | 2,326 | 2,399 | ||||||||||||
Amortization of intangibles | 214 | 347 | 347 | 325 | 214 | 347 | ||||||||||||
FDIC assessment | 293 | 289 | 305 | 302 | 293 | 289 | ||||||||||||
Loss on early extinguishment of debt | — | — | 3,591 | |||||||||||||||
Other | 10,043 | 10,654 | 10,226 | 12,350 | 9,861 | 10,853 | ||||||||||||
Total Noninterest Expense | 62,646 | 60,191 | 60,658 | 69,279 | 62,464 | 60,390 | ||||||||||||
Income Before Taxes | 82,530 | 77,359 | 72,640 | 74,849 | 82,530 | 77,359 | ||||||||||||
Applicable Income Taxes | 24,287 | 23,001 | 20,863 | 21,513 | 24,287 | 23,001 | ||||||||||||
Net Income | $ | 58,243 | $ | 54,358 | $ | 51,777 | $ | 53,336 | $ | 58,243 | $ | 54,358 | ||||||
Earnings per common share—Basic | $ | 2.21 | $ | 2.05 | $ | 1.96 | $ | 2.07 | $ | 2.21 | $ | 2.05 | ||||||
Earnings per common share—Diluted | 2.18 | 2.03 | 1.94 | 2.06 | 2.18 | 2.03 | ||||||||||||
Dividends declared per common share | 1.13 | 1.07 | 1.02 | 1.17 | 1.13 | 1.07 | ||||||||||||
See Notes to Consolidated Financial Statements
PAGE 4446
CONSOLIDATED STATEMENTS OF CHANGES IN SHAREHOLDERS’ EQUITY
S&T Bancorp, Inc. and Subsidiaries
| Comprehensive Income | Common Stock | Additional Paid-in Capital | Retained Earnings | Accumulated Other Comprehensive Income | Treasury Stock | Total | Comprehensive Income | Common Stock | Additional Paid-in Capital | Retained Earnings | Accumulated Other Comprehensive Income | Treasury Stock | Total | ||||||||||||||||||||||||||||||||||||||||
| (dollars in thousands, except per share data) | (dollars in thousands, except per share data) | (dollars in thousands, except per share data) | |||||||||||||||||||||||||||||||||||||||||||||||||||
Balance at January 1, 2003 | $ | 74,285 | $ | 20,746 | $ | 246,920 | $ | 26,499 | $ | (62,336 | ) | $ | 306,114 | ||||||||||||||||||||||||||||||||||||||||
Net income for 2003 | $ | 51,777 | 51,777 | 51,777 | |||||||||||||||||||||||||||||||||||||||||||||||||
Other comprehensive income, net of tax benefit of $240: | |||||||||||||||||||||||||||||||||||||||||||||||||||||
Unrealized gains on securities of $5,609 net of reclassification adjustment for gains included in net income of $4,923 | 686 | 686 | 686 | ||||||||||||||||||||||||||||||||||||||||||||||||||
Comprehensive Income | $ | 52,463 | |||||||||||||||||||||||||||||||||||||||||||||||||||
Cash dividends declared ($1.02 per share) | (26,998 | ) | (26,998 | ) | |||||||||||||||||||||||||||||||||||||||||||||||||
Treasury stock acquired (266,504 shares) | (6,866 | ) | (6,866 | ) | |||||||||||||||||||||||||||||||||||||||||||||||||
Treasury stock issued for stock options exercised (334,306 shares) | (524 | ) | 6,812 | 6,288 | |||||||||||||||||||||||||||||||||||||||||||||||||
Recognition of restricted stock compensation expense | 480 | 480 | |||||||||||||||||||||||||||||||||||||||||||||||||||
Tax benefit from nonstatutory stock options exercised | 1,237 | 1,237 | |||||||||||||||||||||||||||||||||||||||||||||||||||
Balance at December 31, 2003 | $ | 74,285 | $ | 21,939 | $ | 271,699 | $ | 27,185 | $ | (62,390 | ) | $ | 332,718 | $ | 74,285 | $ | 21,939 | $ | 271,699 | $ | 27,185 | $ | (62,390 | ) | $ | 332,718 | |||||||||||||||||||||||||||
Net income for 2004 | $ | 54,358 | 54,358 | 54,358 | $54,358 | 54,358 | 54,358 | ||||||||||||||||||||||||||||||||||||||||||||||
Other comprehensive income, net of tax expense of $2,209: | |||||||||||||||||||||||||||||||||||||||||||||||||||||
Unrealized losses on securities of $(2,791) net of reclassification adjustment for gains included in net income of $3,519 | (6,310 | ) | (6,310 | ) | (6,310 | ) | (6,310 | ) | (6,310 | ) | (6,310 | ) | |||||||||||||||||||||||||||||||||||||||||
Comprehensive Income | $ | 48,048 | $48,048 | ||||||||||||||||||||||||||||||||||||||||||||||||||
Cash dividends declared ($1.07 per share) | (28,367 | ) | (28,367 | ) | (28,367 | ) | (28,367 | ) | |||||||||||||||||||||||||||||||||||||||||||||
Treasury stock acquired (542,600 shares) | �� | (15,970 | ) | (15,970 | ) | (15,970 | ) | (15,970 | ) | ||||||||||||||||||||||||||||||||||||||||||||
Treasury stock issued for stock options exercised (490,584 shares) | (210 | ) | 10,560 | 10,350 | (210 | ) | 10,560 | 10,350 | |||||||||||||||||||||||||||||||||||||||||||||
Recognition of restricted stock compensation expense | 252 | 252 | 252 | 252 | |||||||||||||||||||||||||||||||||||||||||||||||||
Tax benefit from nonstatutory stock options exercised | 2,098 | 2,098 | 2,098 | 2,098 | |||||||||||||||||||||||||||||||||||||||||||||||||
Balance at December 31, 2004 | $ | 74,285 | $ | 24,079 | $ | 297,690 | $ | 20,875 | $ | (67,800 | ) | $ | 349,129 | $ | 74,285 | $ | 24,079 | $ | 297,690 | $ | 20,875 | $ | (67,800 | ) | $ | 349,129 | |||||||||||||||||||||||||||
Net income for 2005 | $ | 58,243 | 58,243 | 58,243 | $58,243 | 58,243 | 58,243 | ||||||||||||||||||||||||||||||||||||||||||||||
Other comprehensive income, net of tax expense of $4,096: | |||||||||||||||||||||||||||||||||||||||||||||||||||||
Unrealized losses on securities of $(8,448) net of reclassification adjustment for gains included in net income of $3,255 | (11,703 | ) | (11,703 | ) | (11,703 | ) | (11,703 | ) | (11,703 | ) | (11,703 | ) | |||||||||||||||||||||||||||||||||||||||||
Comprehensive Income | $ | 46,540 | $46,540 | ||||||||||||||||||||||||||||||||||||||||||||||||||
Cash dividends declared ($1.13 per share) | (29,775 | ) | (29,775 | ) | (29,775 | ) | (29,775 | ) | |||||||||||||||||||||||||||||||||||||||||||||
Treasury stock acquired (660,400 shares) | (23,176 | ) | (23,176 | ) | (23,176 | ) | (23,176 | ) | |||||||||||||||||||||||||||||||||||||||||||||
Treasury stock issued for stock options exercised (330,735 shares) | 245 | 7,662 | 7,907 | 245 | 7,662 | 7,907 | |||||||||||||||||||||||||||||||||||||||||||||||
Recognition of restricted stock compensation expense | 136 | 136 | 136 | 136 | |||||||||||||||||||||||||||||||||||||||||||||||||
Tax benefit from nonstatutory stock options exercised | 1,660 | 1,660 | 1,660 | 1,660 | |||||||||||||||||||||||||||||||||||||||||||||||||
Balance at December 31, 2005 | $ | 74,285 | $ | 26,120 | $ | 326,158 | $ | 9,172 | $ | (83,314 | ) | $ | 352,421 | $ | 74,285 | $ | 26,120 | $ | 326,158 | $ | 9,172 | $ | (83,314 | ) | $ | 352,421 | |||||||||||||||||||||||||||
Net income for 2006 | $53,336 | 53,336 | 53,336 | ||||||||||||||||||||||||||||||||||||||||||||||||||
Other comprehensive income, net of tax expense of $743: | |||||||||||||||||||||||||||||||||||||||||||||||||||||
Unrealized gains on securities of $1,441 net of reclassification adjustment for gains included in net income of $3,563 | (2,122 | ) | �� | (2,122 | ) | (2,122 | ) | ||||||||||||||||||||||||||||||||||||||||||||||
Comprehensive Income | $51,214 | ||||||||||||||||||||||||||||||||||||||||||||||||||||
Cash dividends declared ($1.17 per share) | (30,047 | ) | (30,047 | ) | |||||||||||||||||||||||||||||||||||||||||||||||||
Treasury stock acquired (122,244 shares) | (35,269 | ) | (35,269 | ) | |||||||||||||||||||||||||||||||||||||||||||||||||
Treasury stock issued for stock options exercised (1,031,700 shares) | (435 | ) | 3,190 | 2,755 | |||||||||||||||||||||||||||||||||||||||||||||||||
Recognition of restricted stock compensation expense | 59 | 59 | |||||||||||||||||||||||||||||||||||||||||||||||||||
Tax benefit from nonstatutory stock options exercised | 502 | 502 | |||||||||||||||||||||||||||||||||||||||||||||||||||
Recognition of nonstatutory stock option compensation expense | 452 | 452 | |||||||||||||||||||||||||||||||||||||||||||||||||||
Adjustment to initially apply SFAS No. 158, net of tax of $1,635 | (3,036 | ) | (3,036 | ) | |||||||||||||||||||||||||||||||||||||||||||||||||
Balance at December 31, 2006 | $ | 74,285 | $ | 26,698 | $ | 349,447 | $ | 4,014 | $ | (115,393 | ) | $ | 339,051 | ||||||||||||||||||||||||||||||||||||||||
See Notes to Consolidated Financial Statements
PAGE 4547
CONSOLIDATED STATEMENTS OF CASH FLOWS
S&T Bancorp, Inc. and Subsidiaries
| Year Ended December 31 | 2005 | 2004 | 2003 | 2006 | 2005 | 2004 | ||||||||||||||||||
| (dollars in thousands) | ||||||||||||||||||||||||
OPERATING ACTIVITIES | ||||||||||||||||||||||||
Net Income | $ | 58,243 | $ | 54,358 | $ | 51,777 | $ | 53,336 | $ | 58,243 | $ | 54,358 | ||||||||||||
Adjustments to reconcile net income to net cash provided by operating activities: | ||||||||||||||||||||||||
Provision for loan losses | 5,000 | 4,400 | 7,300 | 9,380 | 5,000 | 4,400 | ||||||||||||||||||
Provision for depreciation and amortization | 3,077 | 2,832 | 2,826 | |||||||||||||||||||||
Depreciation and amortization | 3,246 | 3,077 | 2,832 | |||||||||||||||||||||
Net amortization of investment security premiums | 1,119 | 2,200 | 3,144 | 967 | 1,119 | 2,200 | ||||||||||||||||||
Recognition of stock-based compensation expense | 954 | — | — | |||||||||||||||||||||
Security gains, net | (5,008 | ) | (5,344 | ) | (8,058 | ) | (5,481 | ) | (5,008 | ) | (5,344 | ) | ||||||||||||
Deferred income taxes | 1,100 | (1,612 | ) | (1,844 | ) | 1,802 | 1,100 | (1,612 | ) | |||||||||||||||
Tax benefit from nonstatutory stock options exercised | 1,660 | 2,098 | 1,237 | |||||||||||||||||||||
Excess tax benefits from stock-based compensation | (294 | ) | 1,660 | 2,098 | ||||||||||||||||||||
Mortgage loans originated for sale | (35,848 | ) | (42,191 | ) | (81,010 | ) | (17,649 | ) | (35,848 | ) | (42,191 | ) | ||||||||||||
Proceeds from the sale of loans | 36,354 | 42,983 | 82,616 | 18,760 | 36,354 | 42,983 | ||||||||||||||||||
Gains on the sale of loans, net | (506 | ) | (792 | ) | (1,606 | ) | (357 | ) | (506 | ) | (792 | ) | ||||||||||||
(Increase) decrease in interest receivable | (2,513 | ) | 677 | 258 | (1,501 | ) | (2,513 | ) | 677 | |||||||||||||||
Increase (decrease) in interest payable | 1,651 | 20 | (597 | ) | ||||||||||||||||||||
Increase in interest payable | 305 | 1,651 | 20 | |||||||||||||||||||||
(Increase) decrease in other assets | (12,243 | ) | 61 | (3,994 | ) | (9,398 | ) | (12,243 | ) | 61 | ||||||||||||||
(Decrease) increase in other liabilities | (101 | ) | 1,241 | (2,324 | ) | (2,834 | ) | (101 | ) | 1,241 | ||||||||||||||
Net Cash Provided by Operating Activities | 51,985 | 60,931 | 49,725 | 51,236 | 51,985 | 60,931 | ||||||||||||||||||
INVESTING ACTIVITIES | ||||||||||||||||||||||||
Net decrease in interest-earning deposits with banks | 97 | 2 | 13 | |||||||||||||||||||||
Proceeds from maturities of investment securities | — | — | 116 | |||||||||||||||||||||
Net (increase) decrease in interest-earning deposits with banks | (1 | ) | 97 | 2 | ||||||||||||||||||||
Proceeds from maturities of securities available for sale | 66,271 | 117,256 | 215,005 | 53,923 | 66,271 | 117,256 | ||||||||||||||||||
Proceeds from sales of securities available for sale | 6,506 | 44,948 | 64,408 | 11,838 | 6,506 | 44,948 | ||||||||||||||||||
Purchases of securities available for sale | (63,533 | ) | (75,931 | ) | (243,889 | ) | (12,950 | ) | (63,533 | ) | (75,931 | ) | ||||||||||||
Net increase in loans | (205,876 | ) | (188,347 | ) | (107,687 | ) | (188,271 | ) | (205,876 | ) | (188,347 | ) | ||||||||||||
Purchases of premises and equipment | (6,495 | ) | (4,939 | ) | (2,284 | ) | ||||||||||||||||||
Purchases of premises and equipment, net | (9,498 | ) | (6,495 | ) | (4,939 | ) | ||||||||||||||||||
Net Cash Used in Investing Activities | (203,030 | ) | (107,011 | ) | (74,318 | ) | (144,959 | ) | (203,030 | ) | (107,011 | ) | ||||||||||||
FINANCING ACTIVITIES | ||||||||||||||||||||||||
Net increase in core deposits | 173,569 | 163,813 | 49,841 | 158,318 | 173,569 | 163,813 | ||||||||||||||||||
Net increase (decrease) in time deposits | 69,052 | 50,199 | (13,708 | ) | ||||||||||||||||||||
Net (decrease) increase in short-term borrowings | (75,000 | ) | (9,650 | ) | 113,775 | |||||||||||||||||||
Net increase (decrease) in securities sold under repurchase agreements and federal funds purchased | 39,445 | (98,986 | ) | (1,143 | ) | |||||||||||||||||||
Net (decrease) increase in time deposits | (11,895 | ) | 69,052 | 50,199 | ||||||||||||||||||||
Net decrease in short-term borrowings | (95,000 | ) | (75,000 | ) | (9,650 | ) | ||||||||||||||||||
Net (decrease) increase in securities sold under repurchase agreements and federal funds purchased | (4,808 | ) | 39,445 | (98,986 | ) | |||||||||||||||||||
Proceeds from long-term borrowings | 50,868 | 4,932 | 55,540 | 133,509 | 50,868 | 4,932 | ||||||||||||||||||
Repayments of long-term borrowings | (53,417 | ) | (35,540 | ) | (150,305 | ) | (45,344 | ) | (53,417 | ) | (35,540 | ) | ||||||||||||
Proceeds from junior subordinated debt securities | 25,000 | — | — | |||||||||||||||||||||
Net treasury stock activity | (15,269 | ) | (5,620 | ) | (578 | ) | (32,514 | ) | (15,269 | ) | (5,620 | ) | ||||||||||||
Cash dividends paid to shareholders | (29,342 | ) | (28,101 | ) | (26,726 | ) | (30,046 | ) | (29,342 | ) | (28,101 | ) | ||||||||||||
Excess tax benefits from stock-based compensation | 294 | — | — | |||||||||||||||||||||
Net Cash Provided by Financing Activities | 159,906 | 41,047 | 26,696 | 97,514 | 159,906 | 41,047 | ||||||||||||||||||
Increase (decrease) in Cash and Cash Equivalents | 8,861 | (5,033 | ) | 2,103 | 3,791 | 8,861 | (5,033 | ) | ||||||||||||||||
Cash and Cash Equivalents at Beginning of Year | 47,328 | 52,361 | 50,258 | 56,189 | 47,328 | 52,361 | ||||||||||||||||||
Cash and Cash Equivalents at End of Year | $ | 56,189 | $ | 47,328 | $ | 52,361 | $ | 59,980 | $ | 56,189 | $ | 47,328 | ||||||||||||
See Notes to Consolidated Financial Statements
PAGE 4648
NOTES TO CONSOLIDATED FINANCIAL STATEMENTS
S&T Bancorp, Inc. and Subsidiaries
NOTE A
NATURE OF OPERATIONS
S&T Bancorp, Inc. (“S&T”) was incorporated on March 17, 1983 under the laws of the Commonwealth of Pennsylvania as a bank holding company and has two wholly owned subsidiaries, S&T Bank and 9th Street Holdings, Inc. S&T owns a one-half interest in Commonwealth Trust Credit Life Insurance Company (“CTCLIC”).
S&T is presently engaged in nonbanking activities through the following six entities: 9th Street Holdings, Inc., S&T Bancholdings, Inc., CTCLIC, S&T Insurance Group, LLC, S&T Professional Resources Group, LLC and Stewart Capital Advisors, LLC. 9th Street Holdings, Inc. was formed in June 1988 and S&T Bancholdings, Inc. was formed in August 2002 to hold and manage a group of investments previously owned by S&T Bank and to give S&T additional latitude to purchase other investments. CTCLIC, which is a joint venture with another financial institution, acts as a reinsurer of credit life, accident and health insurance policies sold by S&T Bank and the other institution. S&T Insurance Group, LLC distributes high-quality life insurance and long-term disability income insurance products through Evergreen Insurance Associates, LLC. S&T Professional Resources Group, LLC markets software developed by S&T. Stewart Capital Advisors, LLC was formed September 1,August 2005 to act as a registered investment advisor.advisor that manages private investment accounts for individuals and institutions and advises the Stewart Capital Mutual Fund.
ACCOUNTING POLICIES
The financial statements of S&T Bancorp, Inc. and subsidiaries have been prepared in accordance with accounting principles generally accepted in the United States. In preparing the financial statements, management is required to make estimates and assumptions that affect the reported amounts of assets and liabilities as of the datedates of the balance sheetsheets and revenues and expenses for the period.periods. Actual results could differ from those estimates. The more significant accounting policies are described below.
PRINCIPLES OF CONSOLIDATION
The consolidated financial statements include the accounts of S&T and its wholly owned subsidiaries. All significant intercompany transactions have been eliminated in consolidation. Investments of 20 percent — 50 percent of the outstanding common stock of investees are accounted for using the equity method of accounting. S&T operates within one business segment, community banking, providing a full range of services to individual and corporate customers.
CASH FLOW INFORMATION
S&T considers cash and due from banks as cash and cash equivalents. For the years ended December 31, 2006, 2005 2004 and 2003,2004, interest paid was $92,006,000, $61,213,000 $40,900,000 and $47,685,000,$40,900,000, respectively. Income taxes paid during 20052006 were $23,153,000$22,143,000 compared to $23,153,000 for 2005 and $20,808,000 for 2004 and $20,943,000 for 2003.2004. For the years ended December 31, 2006, 2005 2004 and 2003,2004, transfers of loans to other real estate owned was $523,000, $3,455,000 and $2,111,000, and $766,000.respectively.
SECURITIES
Management determines the appropriate classification of securities at the time of purchase. If management has the intent and S&T has the ability, at the time of purchase, to hold securities until maturity, they are classified as held to maturity and are stated at cost and adjusted for amortization of premiums and accretion of discounts. Securities to be held for indefinite periods of time are classified as available for sale and are recorded at market value, and unrealized gains and losses on these
PAGE 4749
NOTES TO CONSOLIDATED FINANCIAL STATEMENTS — continued
securities, net of related deferred income taxes, are reported in accumulated other comprehensive income. Gains or losses on the disposition of securities are based on the specific identification method. S&T does not engage in any securities trading activity.activity for its own account.
Management systematically evaluates securities for other-than-temporary declines in market value. Securities for which declines in market value are deemed to be other-than-temporary are written down to current market value and the resultant changes included in earnings as realized losses.
LOANS
Interest on loans is accrued and credited to operations based on the principal amount outstanding. Accretion of discounts and amortization of premiums on loans are included in interest income. Loan origination fees and direct loan origination costs are deferred and amortized as an adjustment of loan yield over the respective lives of the loans. Loans are placed on nonaccrual and interest is discontinued generally when interest and principal are 90 days or more past due.
Impaired loans are defined by management as commercial and commercial real estate loans which it is probable that S&T will not be able to collect all amounts due according to the contractual terms of the loan agreement. Residential real estate mortgages and consumer installment loans are large groups of smaller balance homogenous loans and are separately measured for impairment. Factors considered by management in determining impairment include payment status and underlying collateral value. All impaired loans are classified as substandard for risk classification purposes. Impaired loans are reserved, to the estimated value of collateral and/or cash flow associated with the loan, when management believes principal and interest will not be collected under the contractual terms of the loan. The accrual of interest on impaired loans is discontinued when the loan is 60 days past due or in management’s opinion the account should be placed on nonaccrual status (loans partially charged-off are generally immediately placed on nonaccrual status). When interest accrual is discontinued, all unpaid accrued interest is reversed against interest income.income and/or the allowance for loan losses, as applicable. Interest income is subsequently recognized only to the extent that cash payments are received.
The allowance for loan losses is established through provisions for loan losses charged against income. Loans considered to be uncollectible are charged against the allowance, and recoveries, if any, are credited to the allowance. The adequacy of the allowance for loan losses is determined by management through evaluation of the loss exposure on individual nonperforming, delinquent and high-dollar loans; review of various risk conditions and business trends; historical loss experience; and growth and composition of the loan portfolio, as well as other relevant risk factors.
A quantitative analysis is utilized to support the adequacy of the allowance for loan losses. This analysis includes review of the historical charge-off rates for loan categories, fluctuations and trends in the amount of classified loans and other risk factors. Factors consider the level of S&T’s historical charge-offs that have occurrence within the credits economic life cycle. Management also assesses subjective factors such as portfolio credit trends, unemployment trends, vacancy trends, loan growth and variable interest rate factors.
Significant to this analysis is the shift in loan portfolio composition to an increased mix of commercial loans. These loans are generally larger in size, and due to our continuing growth, many are new loan relationships. Management relies on its risk-rating process to monitor trends that may be occurring relative to commercial loans to assess potential weaknesses within the credit. Current factors and trends in risk ratings are considered in the determination and allocation of the allowance for loan losses.
S&T believes its quantitative and qualitative analysis and risk-rating process, which serves as the primary basis for assessing the adequacy of the allowance for loan losses, is sufficient to allow it to conclude that the total allowance for loan losses is adequate to absorb probable loan losses.
PAGE 4850
NOTES TO CONSOLIDATED FINANCIAL STATEMENTS — continued
LOANS ORIGINATED FOR SALE AND HELD FOR SALE
Loans held for sale consist of 1-4 family residential loans originated for sale in the secondary market and carried at lower of cost or market, determined on an aggregate basis. Loans held for sale were $1.6$0.8 million and $4.3$1.6 million at December 31, 20052006 and 2004,2005, respectively. Gains and losses on sales of loans held for sale are included in mortgage bankingother income in the consolidated statements of income. S&T manages its exposure to changes in the market value of loans from the date of commitment to the borrower and the loan’s ultimate sale by entering into mandatory forward commitments to sell the loans. The extent to which S&T elects to cover its loan production with forward commitments varies based upon factors deemed by management to be appropriate in the circumstances. The market value related to the risk of the commitment is the hedged asset or liability on the balance sheet with a corresponding offset recorded in the income statement. The adjustment to the hedged asset or liability is included in the basis of the hedged item, while the market value of the derivative is recorded as a freestanding asset or liability. The amounts of commitments to borrowers and commitments to sell loans were insignificant at December 31, 2005 and 2004.
PREMISES AND EQUIPMENT
Premises and equipment are stated at cost less accumulated depreciation. The provision for depreciationMaintenance and repairs are charged to expense as incurred, while improvements which extend an asset’s useful life are capitalized and depreciated over the estimated remaining life of the asset. Depreciation expense is computed generally by the straight-line method for financial reporting purposes and accelerated methods for income tax purposes. Useful lives range from three to 25 years for furniture and equipment; ten to 50 years for premises and two to 36 years for leasehold improvements. Leasehold improvements are amortized over the shorter of the asset’s useful life or the remaining lease term, including renewal periods when reasonably assured pursuant to SFAS No. 13, “Accounting for Leases.”
JOINT VENTURES
S&T has limited partnership investments in affordable housing and federal historic rehabilitation projects, for which it provides funding as a limited partner and receives tax credits and tax deductions for any losses incurred by the projects based on its partnership share. At December 31, 20052006 and 2004,2005, S&T had recorded investments in other assets on its balance sheet of approximately $13.7$15.7 million and $12.2$13.7 million, respectively, associated with these investments. S&T currently adjustsLow-income housing relationships are accounted for on the carrying valueequity basis and are periodically reviewed for impairment. Investments in partnerships for the purpose of these investmentsrehabilitating historic structures are evaluated for any losses incurred byimpairment at the limited partnership through earnings.end of each reporting period and are recorded at their net realizable value. S&T determined that it is not the primary beneficiary of these partnerships and does not consolidate them.
OTHER REAL ESTATE
Other real estate is included in other assets and is comprised of properties acquired through foreclosure proceedings or acceptance of a deed in lieu of a foreclosure. These properties are carried at the lower of cost or market value less estimated cost of resale. Loan losses arising from the acquisition of such property initially are charged against the allowance for loan losses. Gains or losses realized subsequent to acquisition are recorded in other expenses in the results of operations.
GOODWILL AND OTHER INTANGIBLE ASSETS
Goodwill represents the excess of the purchase price over the cost of net assets purchased. Goodwill is not amortized, but is evaluated for impairment annually. In 2006, 2005 2004 and 2003,2004, S&T performed the required impairment tests of goodwill at the respective reporting unit level and no impairment existed as of the valuation date, as the market value of S&T’s net assets exceeded their carrying value.
PAGE 51
NOTES TO CONSOLIDATED FINANCIAL STATEMENTS — continued
If, for any future period, S&T determines that there has been impairment in the carrying value of its goodwill balances, S&T will record a charge to earnings, which could have a material adverse effect on S&T’s net income.
Intangible assets consist of $3.8 million for the acquisition of core savings deposits ($2.32.0 million, net of accumulated amortization) and $1.4$1.5 million in cost for the acquisition of insurance contract relationships ($1.00.9 million, net of accumulated amortization), and are amortized over their estimated
PAGE 49
NOTES TO CONSOLIDATED FINANCIAL STATEMENTS — continued
weighted average lifelives of eleven and ten years, respectively.11 years. The estimated aggregate amortization expense for each of the five succeeding years will approximate $0.5 million.
| Goodwill | Core Deposit Intangible | Goodwill | Core Deposit Intangible | |||||||||||
| Dollars in thousands | ||||||||||||||
| dollars in thousands | ||||||||||||||
Balance at December 31, 2003 | $ | 48,021 | $ | 3,975 | ||||||||||
Additions/(reductions) | — | — | ||||||||||||
Amortization | — | (468 | ) | |||||||||||
Balance at December 31, 2004 | 48,021 | 3,507 | $ | 48,021 | $ | 3,507 | ||||||||
Additions/(reductions) | 1,052 | 276 | ||||||||||||
Additions | 1,052 | 276 | ||||||||||||
Amortization | — | (483 | ) | — | (483 | ) | ||||||||
Balance at December 31, 2005 | $ | 49,073 | $ | 3,300 | $ | 49,073 | $ | 3,300 | ||||||
Additions | 882 | 111 | ||||||||||||
Amortization | — | (494 | ) | |||||||||||
Balance at December 31, 2006 | $ | 49,955 | $ | 2,917 | ||||||||||
MORTGAGE LOAN SERVICING
Mortgage servicing assets are recognized as separate assets when servicing rights are acquired through loan originations when there is a definitive plan to sell the underlying loan.loan is sold. Upon sale, the mortgage servicing right is established, which represents the then current market value of future net cash flows expected to be realized for performing the servicing activities. The market value of the mortgage servicing rights are estimated by calculating the present value of estimated future net servicing cash flows, taking into consideration actual and expected mortgage loan prepayment rates, discount rates, servicing costs and other economic factors, which are determined based on current market conditions. The expected and actual rates of mortgage loan prepayments are the most significant factors driving the value of mortgage servicing rights. Increases in mortgage loan prepayments reduce estimated future net servicing cash flows because the life of the underlying loan is reduced. In determining the market value of the mortgage servicing rights, mortgage interest rates, which are used to determine prepayment rates and discount rates, are held constant over the estimated life of the portfolio. Capitalized mortgage servicing rights are reported in other assets and are amortized into noninterest income in proportion to, and over the period of, the estimated future net servicing income of the underlying mortgage loans.
Capitalized mortgage servicing rights are regularly evaluated for impairment based on the estimated market value of those rights. The mortgage servicing rights are stratified by certain risk characteristics, primarily loan term and note rate. If temporary impairment exists within a risk stratification tranche, a valuation allowance is established through a charge to income equal to the amount by which the carrying value exceeds the market value. If it is later determined all or a portion of the temporary impairment no longer exists for a particular tranche, the valuation allowance is reduced.
Mortgage servicing rights are also reviewed for other-than-temporary impairment. Other-than-temporary impairment exists when the recoverability of a recorded valuation allowance is determined to be remote, taking into consideration historical and projected interest rates and loan pay-off activity. When this situation occurs, the unrecoverable portion of the valuation allowance is applied
PAGE 52
NOTES TO CONSOLIDATED FINANCIAL STATEMENTS — continued
as a direct write-down to the carrying value of the mortgage servicing rights. Unlike a valuation allowance, a direct write-down permanently reduces the carrying value of the mortgage servicing rights and the valuation allowance, precluding subsequent recoveries.
For the year ended December 31, 20052006 and 2004,2005, the 1-4 family mortgage loans that were sold to Fannie Mae amounted to $36.4$18.8 million and $42.9$36.4 million, respectively. At December 31, 20052006 and 2004,2005, mortgage servicing rights were $2.2$2.1 million and $1.7$2.2 million, respectively. At December 31,
PAGE 50
NOTES TO CONSOLIDATED FINANCIAL STATEMENTS — continued
2006, 2005 2004 and 2003,2004, S&T’s servicing portfolio totaled $180.8 million, $185.1 million $175.9 million and $160.3$175.9 million, respectively. The fair market value of mortgage servicing rights was $2.4$2.2 million and $1.7$2.4 million at December 31, 20052006 and 2004,2005, respectively.
| Servicing Rights | Valuation Allowance | Net Carrying Value | Servicing Rights | Valuation Allowance | Net Carrying Value | |||||||||||||||||||
| Dollars in thousands | ||||||||||||||||||||||||
Balance at December 31, 2003 | $ | 1,659 | $ | 179 | $ | 1,480 | ||||||||||||||||||
Additions/(reductions) | 649 | 210 | 439 | |||||||||||||||||||||
Amortization | (245 | ) | (245 | ) | ||||||||||||||||||||
Balance at December 31, 2004 | 2,063 | 389 | 1,674 | $ | 2,063 | $ | 389 | $ | 1,674 | |||||||||||||||
Additions/(reductions) | 421 | (369 | ) | 790 | 421 | (369 | ) | 790 | ||||||||||||||||
Amortization | (286 | ) | (286 | ) | (286 | ) | — | (286 | ) | |||||||||||||||
Balance at December 31, 2005 | $ | 2,198 | $ | 20 | $ | 2,178 | 2,198 | 20 | 2,178 | |||||||||||||||
Additions/(reductions) | 239 | 36 | 203 | |||||||||||||||||||||
Amortization | (313 | ) | — | (313 | ) | |||||||||||||||||||
Balance at December 31, 2006 | $ | 2,124 | $ | 56 | $ | 2,068 | ||||||||||||||||||
DERIVATIVE FINANCIAL INSTRUMENTS
S&T utilizes derivative instruments from time to time for asset/liability management. These transactions involve both credit and market risk. The notional amounts are amounts on which calculations and payments are based. The notional amounts do not represent direct credit exposures. Direct credit exposure is limited to the net difference between the calculated amounts to be received and paid, if any. Interest-rate swaps are contracts in which a series of interest-rate flows (fixed and floating) are exchanged over a prescribed period. The notional amounts on which the interest payments are based are not exchanged. At December 31, 2005, S&T had no derivative instruments outstanding.
S&T has certain interest rate derivative positions that are not designated as hedging instruments. These derivative positions relate to transactions in which S&T enters into an interest rateinterest-rate swap with a customer while at the same time entering into an offsetting interest rateinterest-rate swap with another financial institution. In connection with each transaction, S&T agrees to pay interest to the customer on a notional amount at a variable interest rate and receive interest from the customer on a same notional amount at a fixed rate. At the same time, S&T agrees to pay another financial institution the same fixed interest rate on the same notional amount and receive the same variable interest rate on the same notional amount. The transaction allows S&T’s customer to effectively convert a variable rate loan to a fixed rate.rate for the customer. Because S&T acts as an intermediary for its customer, changes in the market value of the underlying derivative contracts offset each other and do not impact S&T’s results of operations. At December 31, 2005, S&T had a notional amount of $73.2 million of interest rate swaps paying and receiving a weighted average fixed rate of 6.88 percent.
S&T offers rate lock commitments to potential borrowers. The commitments are generally for sixty60 days and guarantee a specified interest rate for a loan if underwriting standards are met, but the commitment does not obligate the potential borrower to close on the loan. Accordingly, some commitments expire prior to becoming loans. S&T enters into such contracts in order to control interest rate risk under an asset/liability strategy that is meant to limit risk from holding longer-term mortgages. Whenever a customer desires these products, a mortgage originator quotes a secondary market rate, guaranteed for that day by the investor. The rate lock is executed between the mortgagee
PAGE 53
NOTES TO CONSOLIDATED FINANCIAL STATEMENTS — continued
and S&T, and in turn a forward sales contract is executed between S&T and the investor. Both the rate lock commitment and the corresponding forward sales contract for each customer are considered derivatives. As such, changes in the fair value of the derivatives during the commitment period are recorded in current earnings and included in other income on the consolidated statements of income.
PAGE 51
NOTES TO CONSOLIDATED FINANCIAL STATEMENTS — continued
WEALTH MANAGEMENT ASSETS AND INCOME
Assets held in a fiduciary capacity by the subsidiary bank, S&T Bank, are not assets of S&T Bank and are therefore not included in the consolidated financial statements. Wealth management fee income is reported on the consolidated statementsstatement of income.
STOCK-BASED COMPENSATION
S&T has various stock-based employee compensation plans, which are described in Note O. S&T accountsadopted Financial Accounting Standards Board (“FASB”) Statement of Financial Accounting Standard (“SFAS”) No. 123(R), “Share Based Payment,” on January 1, 2006. S&T is applying the modified prospective method. SFAS No. 123(R) requires measurement of compensation expense of all stock-based awards at market value on the date of grant and recognition of compensation expense over the service period for stock basedall awards granted or not yet vested at the date of adoption. As a result of applying the provisions of SFAS No. 123(R), during 2006, S&T recognized compensation usingexpense of $776,000, pretax and $505,000, net of tax. The effect of applying the intrinsic value method. provisions of SFAS No. 123(R) to both year-to-date basic earnings per share and diluted earnings per share was a decrease of $0.02.
Prior to the adoption of SFAS No. 123(R), S&T applied APB Opinion No. 25, “Accounting for Stock Issued to Employees,” in accounting for stock-based awards. No compensation expense was reflected in net income for 2005 and 2004. Results for prior periods have not been restated.
The following is proforma information regardingtable illustrates the effect on net income and earnings per share assuming that stock options were accounted for underif the market value method. The estimated market value of the options is amortizedmethod had been applied to expense over the vestingall outstanding and unvested awards in each period.
| 2005 | 2004 | 2003 | 2005 | 2004 | ||||||||||||||||
| (dollars in thousands, except per share data) | ||||||||||||||||||||
Net Income | $ | 58,243 | $ | 54,358 | $ | 51,777 | $ | 58,243 | $ | 54,358 | ||||||||||
Stock-based employee compensation cost determined if the market value method had been applied to all awards, net of tax | (2,173 | ) | (1,324 | ) | (353 | ) | (2,173 | ) | (1,324 | ) | ||||||||||
Proforma Net Income | $ | 56,070 | $ | 53,034 | $ | 51,424 | $ | 56,070 | $ | 53,034 | ||||||||||
Basic Earnings per Share | ||||||||||||||||||||
As reported | $ | 2.21 | $ | 2.05 | $ | 1.96 | $ | 2.21 | $ | 2.05 | ||||||||||
Proforma | 2.13 | 2.00 | 1.94 | 2.13 | 2.00 | |||||||||||||||
Diluted Earnings per Share | ||||||||||||||||||||
As reported | $ | 2.18 | $ | 2.03 | $ | 1.94 | $ | 2.18 | $ | 2.03 | ||||||||||
Proforma | 2.10 | 1.98 | 1.92 | 2.10 | 1.98 | |||||||||||||||
On June 20, 2005, the Board of Directors of S&T approved the accelerated vesting of the December 20, 2004 stock options awarded to eligible participants under the S&T Bancorp, Inc. 2003 Stock Incentive Plan (the “2003 Stock Plan,Plan”), which havehad an exercise price of $37.08. As a result of the acceleration, unvested options granted in 2004 to acquire approximately 381,000 shares of S&T’s common stock, which otherwise 50 percent would have vested on January 1, 2006 and the remaining shares on January 1, 2007, became immediately exercisable in full.exercisable. The options were not “in the money” (i.e., the exercise price of the options were in excess of the price of S&T’s common stock) at the time of acceleration. S&T will adopt Financial Accounting Standards Board Statement No. 123(R), Share-Based Payment, on January 1, 2006 and believes the above-mentioned acceleration of vesting will reduce the compensation expense related to its Incentive Stock Plan in 2006.
The market value was estimated at the date of grant using a Black-Scholes option pricing model with the following weighted-average assumptions for 2005, 2004 and 2003, respectively: risk-free interest rates of 4.36 percent, 3.61 percent and 3.27 percent; a dividend yield of 3.0 percent, 2.9 percent and 3.3 percent; volatility factors of the expected market price of S&T’s common stock of .27, .26 and .27; and a weighted-average expected life of seven years in 2005 and five years in 2004 and 2003.
PAGE 54
NOTES TO CONSOLIDATED FINANCIAL STATEMENTS — continued
The Black-Scholes option valuation model was developed for use in estimating the market value of traded options that have no vesting restrictions and are fully transferable. In addition, option valuation models require the input of highly subjective assumptions including the expected stock price volatility. S&T’s employee stock options have characteristics significantly different from those of traded options, and changes in the subjective input assumptions can materially affect the market value estimate. For the stock option grants awarded in 2006 and 2005, S&T followed the “short-cut approach,” in developing the estimate of expected life. Under this approach, the expected life is presumed to be the mid point between the vesting date and the end of the contractual term.
The market value for nonstatutory stock options were estimated at the grant dates using a Black-Scholes option pricing model with the following weighted-average assumptions for 2006, 2005, and 2004, respectively: risk-free interest rates of 4.36 percent, 3.61 percent and 3.27 percent; a dividend yield of 3.0 percent, 2.9 percent and 3.3 percent; volatility of the expected market price of S&T’s common stock of .27, .26, and .27; and a weighted-average expected life of seven years, five years and five years.
S&T maintains a Cash Appreciation Rights (“CARs”) plan, which are treated as liability instruments under SFAS No. 123(R). The current market value must be determined at each reporting date. The Black-Scholes option valuation model was used to determine the market value of the CARs as of December 31, 2006. The assumptions used to value the CARs are as follows: a risk-free interest rate of 4.64 percent; a dividend yield of 3.53 percent; volatility of the expected market price of S&T’s common stock of .26; and a weighted-average expected life of 5.98 years.
PENSIONS
Pension expense for S&T Bank’s defined benefit pension plan is actuarially determined using the projected unit credit actuarial cost method. The funding policy for the plan is to contribute amounts
PAGE 52
NOTES TO CONSOLIDATED FINANCIAL STATEMENTS — continued
to the plan sufficient to meet the minimum funding requirements of the Employee Retirement Income Security Act of 1974, plus such additional amounts as may be appropriate, subject to federal income tax limitation.
INCOME TAXES
Income taxes are accounted for under the liability method whereby deferred income taxes are recognized for the difference between the financial reporting and tax bases of assets and liabilities.
TREASURY STOCK
The purchase of S&T common stock is recorded at cost. At the time of reissuance, the treasury stock account is reduced using the average cost method.
EARNINGS PER COMMON SHARE
Basic Earnings Per Share (“EPS”) is calculated by dividing net income by the weighted average number of common shares outstanding during the period. Average shares outstanding for computing basic EPS were 25,735,295, 26,384,062 and 26,485,934 for 2006, 2005 and 26,427,899 for 2005, 2004, and 2003, respectively. Potentially dilutive securities are excluded from the basic calculation, but are included in diluted EPS. Average shares outstanding for computing diluted EPS were 25,940,352, 26,688,148 and 26,799,451 for 2006, 2005 and 26,723,434 for 2005, 2004, and 2003, respectively. In computing diluted EPS, average shares outstanding have been increased by the common stock equivalents relating to S&T’s outstanding stock options.
RECENTLY ISSUED ACCOUNTING PRONOUNCEMENTS
On December 16, 2004,In February 2006, the FASB issued SFAS No. 155, “Accounting for Certain Hybrid Financial Accounting Standards Board (FASB)Instruments.” Under current generally accepted accounting principles, an entity that holds a financial
PAGE 55
NOTES TO CONSOLIDATED FINANCIAL STATEMENTS — continued
instrument with an embedded derivative must bifurcate the financial instrument, resulting in the host and the embedded derivative being accounted for separately. SFAS No. 155 permits, but does not require, entities to account for certain financial instruments with an embedded derivative at fair value thereby eliminating the need to bifurcate the instrument into its host and the embedded derivative. This Statement will be effective for all financial instruments acquired or issued by S&T on or after January 1, 2007, and is not expected to have a significant impact on S&T’s financial position or results of operations.
In March 2006, the FASB issued SFAS No. 156, “Accounting for Servicing of Financial Assets.” This Statement amends SFAS No. 123 (revised 2004),Share-Based Payment, which is a revision140, “Accounting for Transfers and Servicing of FASB Statement No.123,Accounting for Stock-Based Compensation. Statement 123(R) supersedes APB Opinion No. 25,Accounting for Stock Issued to Employees,Financial Assets and amends FASB Statement No. 95,StatementExtinguishments of Cash Flows. Generally, the approach in Statement 123(R) is similarLiabilities,” with respect to the approach described inaccounting for separately recognized servicing assets and servicing liabilities. SFAS No. 156 requires companies to recognize a servicing asset or servicing liability each time it undertakes an obligation to service a financial asset by entering into a servicing contract. The Statement 123. However,permits a company to choose either the amortized cost method or fair value measurement method for each class of separately recognized servicing assets. This Statement 123(R) requires all share-based payments to employees, including grants of employee stock options, towill be recognized in the income statement based on their market values. Proforma disclosure is no longer an alternative.
Statement 123(R) originally required adoption no later that July 1, 2005. In April 2005, the Securities and Exchange Commission (“SEC”) issued a release that amends the compliance dates for Statement 123(R). Under the SEC’s new rule, S&T was required to adopt Statement 123(R)effective as of January 1, 2007 and is not expected to have a significant impact on S&T’s financial position and results of operations.
In June 2006, the FASB issued FASB Interpretation No. 48, “Accounting for Uncertainty in Income Taxes,” an interpretation of SFAS No. 109, “Accounting for Income Taxes,” to create a single model to address accounting for uncertainty in tax positions. FIN 48 clarifies the accounting for income taxes, by prescribing a minimum recognition threshold a tax position is required to meet before being recognized in the financial statements. FIN 48 also provides guidance on derecognition, measurement, classification, interest and penalties, accounting in interim periods, disclosure and transition. FIN 48 is effective for fiscal years beginning after December 15, 2006. S&T will adopt FIN 48 as of January 1, 2007, as required. The cumulative effect of adopting FIN 48 will be recorded in retained earnings. Upon adoption, management estimates that the cumulative effect adjustment will be immaterial to retained earnings, which is applyingsubject to revision as management completes its analysis.
In September 2006, the modified prospective method.FASB issued, SFAS No. 157, “Fair Value Measurements.” This standard provides enhanced guidance for using fair value to measure assets and liabilities. The standard also responds to investors’ requests for expanded information about the extent to which companies measure assets and liabilities at fair value, the information used to measure fair value, and the effect of fair value measurements on earnings. The standard applies whenever other standards require (or permit) assets or liabilities to be measured at fair value. The standard does not expand the use of fair value in any new circumstances. S&T expectswill be required to apply the new guidance effective January 1, 2008. S&T is in the process of determining the impact on S&T’s financial position and results of operations.
In September 2006, the FASB issued SFAS No. 158, “Employers’ Accounting for Defined Benefit Pension and Other Postretirement Plans, an amendment of SFASB No. 87, 88, 106 and 132(R).” SFAS No. 158 requires companies to earningsrecognize the over funded or under funded status of a defined benefit postretirement plan as an asset or liability in its statement of financial position and to recognize changes in that funded status in the year in which the changes occur through comprehensive income. The Statement improves financial reporting by requiring an employer to measure the funded status of a plan as of the date of its year-end statement of financial position. On December 31, 2006, to approximate $584,777,S&T adopted the recognition and disclosure provisions of SFAS No. 158, which resulted in the recognition of the funded status of its pension and postretirement plans as either assets or liabilities on the consolidated balance sheet and recognition of unrecognized actuarial gains/losses and prior service costs of $3.0 million as a separate component of accumulated comprehensive income, net of tax. SFAS No. 158 did not have an effect on S&T’s consolidated financial condition at December 31, 2005 or 2004. SFAS No. 158’s provisions regarding the change in the measurement date of defined
PAGE 56
NOTES TO CONSOLIDATED FINANCIAL STATEMENTS — continued
postretirement benefit plans are not applicable as S&T already uses a measurement date of December 31 for its pension plan. See Note N for further discussion of the effect of adopting SFAS No. 158 on S&T’s consolidated financial statements.
RECLASSIFICATION
Certain amounts in prior years’ financial statements have been reclassed to conform to the current year’s presentation. The reclassifications had no effect on S&T’s financial condition or results of operations.
NOTE B
Market Values of Financial Instruments
S&T utilizes quoted market values, where available, to assign market value to its financial instruments. In cases where quoted market values were not available, S&T uses present value methods to estimate the market value of its financial instruments. These estimates of market value are significantly affected by the assumptions made and, accordingly, do not necessarily indicate amounts that could be realized in a current market exchange.
PAGE 53
NOTES TO CONSOLIDATED FINANCIAL STATEMENTS — continued
The following methods and assumptions were used by S&T in estimating its market value disclosures for financial instruments:
CASH AND CASH EQUIVALENTS AND OTHER SHORT-TERM ASSETS
The carrying amounts reported in the consolidated balance sheet for cash and due from banks, interest-earning deposits with banks and federal funds sold approximate those assets’ market values.
SECURITIES
Market values for investment securities and securities available for sale are based on quoted market prices.
LOANS
For variable-rate loans that reprice frequently and with no significant change in credit risk, market values are based on carrying values. The market values for other loans are estimated using discounted cash flow analyses, using interest rates currently being offered for loans with similar terms to borrowers as adjusted for net credit losses and the loss of interest income from nonaccrual loans. The carrying amount of accrued interest approximates its market value.
DEPOSITS
The market values disclosed for demand deposits (e.g., noninterest and interest-bearing demand, money market and savings accounts) are, by definition, equal to the amount payable on demand. The carrying amounts for variable-rate, fixed-term, and certificates of deposit approximate their market value at year-end. Market values for fixed-rate certificates of deposit and other time deposits are based on the discounted value of contractual cash flows, using interest rates currently offered for deposits of similar remaining maturities.
SHORT-TERM BORROWINGS AND OTHER BORROWED FUNDS
The carrying amounts of federal funds purchased, securities sold under repurchase agreements and other borrowings approximate their market values.
PAGE 57
NOTES TO CONSOLIDATED FINANCIAL STATEMENTS — continued
LONG-TERM BORROWINGS
The market values disclosed for long-term borrowings are estimated using current interest rates for long-term borrowings of similar remaining maturities.
LOAN COMMITMENTS AND STANDBY LETTERS OF CREDIT
Estimates of the market value of these off-balance sheet items were not made because of the short-term nature of these arrangements and the credit standing of the counter-parties. Also, unfunded loan commitments relate principally to variable-rate commercial loans, typically non-binding and fees are not normally assessed on these balances.
Estimates of market value have not been made for items that are not defined as financial instruments, including such items as S&T’s core deposit intangibles and the value of its trust operation. S&T believes it is impractical to estimate a representational market value for these types of assets, which represent significant value to S&T.
PAGE 54
NOTES TO CONSOLIDATED FINANCIAL STATEMENTS — continued
The following table indicates the estimated market value of S&T’s financial instruments as of December 31:
| 2005 | 2004 | 2006 | 2005 | |||||||||||||||||||||
| Market Value | Carrying Value | Market Value | Carrying Value | Market Value | Carrying Value | Market Value | Carrying Value | |||||||||||||||||
| (dollars in thousands) | ||||||||||||||||||||||||
ASSETS | ||||||||||||||||||||||||
Cash | $ | 56,189 | $ | 56,189 | $ | 47,328 | $ | 47,328 | $ | 59,980 | $ | 59,980 | $ | 56,189 | $ | 56,189 | ||||||||
Securities: | ||||||||||||||||||||||||
Available for sale | 494,575 | 494,575 | 517,906 | 517,906 | ||||||||||||||||||||
Held to maturity | — | — | 267 | 265 | ||||||||||||||||||||
Securities available for sale | 432,045 | 432,045 | 481,257 | 481,257 | ||||||||||||||||||||
Other investments | 10,562 | 10,562 | 13,318 | 13,318 | ||||||||||||||||||||
Loans | 2,473,390 | 2,491,506 | 2,283,859 | 2,287,351 | 2,663,743 | 2,666,291 | 2,473,390 | 2,491,506 | ||||||||||||||||
LIABILITIES | ||||||||||||||||||||||||
Deposits | 2,412,412 | 2,418,884 | 2,180,798 | 2,176,263 | $ | 2,561,929 | $ | 2,565,306 | $ | 2,412,412 | $ | 2,418,884 | ||||||||||||
Securities sold under repurchase agreements & federal funds purchased | 137,829 | 137,829 | 98,384 | 98,384 | 132,751 | 133,021 | 137,829 | 137,829 | ||||||||||||||||
Short-term borrowings | 150,000 | 150,000 | 225,000 | 225,000 | 55,000 | 55,000 | 150,000 | 150,000 | ||||||||||||||||
Long-term borrowings | 84,967 | 83,776 | 89,342 | 86,325 | 173,122 | 171,941 | 84,967 | 83,776 | ||||||||||||||||
Junior subordinated debt securities | 25,115 | 25,000 | — | — | ||||||||||||||||||||
Interest-rate swaps | — | — | 54 | 54 | — | — | — | — | ||||||||||||||||
NOTE C
Restrictions on Cash and Due from Bank Accounts
The Board of Governors of the Federal Reserve System (“the Federal(the “Federal Reserve Board”) imposes certain reserve requirements on all depository institutions. These reserves are maintained in the form of vault cash or as a noninterest-bearing balance with the Federal Reserve Board. Required reserves averaged $16,464,000$17,593,000 during 2005.2006.
PAGE 58
NOTES TO CONSOLIDATED FINANCIAL STATEMENTS — continued
NOTE D
Securities
The following table indicates the composition of the securities portfolio at December 31:
| Available for Sale | Available for Sale | |||||||||||||||||||||||||
| 2005 | Amortized Cost | Gross Unrealized Gains | Gross Unrealized Losses | Market Value | ||||||||||||||||||||||
| 2006 | Amortized Cost | Gross Unrealized | Gross Unrealized Losses | Market Value | ||||||||||||||||||||||
| (dollars in thousands) | ||||||||||||||||||||||||||
Obligations of U.S. government corporations and agencies | $ | 224,325 | $ | 399 | $ | (3,687 | ) | $ | 221,037 | $ | 183,161 | $ | 16 | $ | (3,174 | ) | $ | 180,003 | ||||||||
Collateralized mortgage obligations of U.S. government corporations and agencies | 64,480 | 6 | (847 | ) | 63,639 | 61,087 | — | (997 | ) | 60,090 | ||||||||||||||||
Mortgage-backed securities | 39,321 | 46 | (951 | ) | 38,416 | 32,856 | 15 | (1,078 | ) | 31,793 | ||||||||||||||||
U.S. treasury securities | 499 | — | — | 499 | ||||||||||||||||||||||
Obligations of states and political subdivisions | 84,998 | 38 | (1,225 | ) | 83,811 | 82,733 | 37 | (1,098 | ) | 81,672 | ||||||||||||||||
Debt securities available for sale | 413,623 | 489 | (6,710 | ) | 407,402 | 359,837 | 68 | (6,347 | ) | 353,558 | ||||||||||||||||
Marketable equity securities | 45,421 | 20,084 | (391 | ) | 65,114 | 39,268 | 16,126 | (45 | ) | 55,349 | ||||||||||||||||
Other securities | 22,059 | — | — | 22,059 | 23,138 | — | — | 23,138 | ||||||||||||||||||
Total | $ | 481,103 | $ | 20,573 | $ | (7,101 | ) | $ | 494,575 | $ | 422,243 | $ | 16,194 | $ | (6,392 | ) | $ | 432,045 | ||||||||
| Available for Sale | |||||||||||||
| 2005 | Amortized Cost | Gross Unrealized Gains | Gross Unrealized Losses | Market Value | |||||||||
| (dollars in thousands) | |||||||||||||
Obligations of U.S. government corporations and agencies | $ | 224,325 | $ | 399 | $ | (3,687 | ) | $ | 221,037 | ||||
Collateralized mortgage obligations of U.S. government corporations and agencies | 64,480 | 6 | (847 | ) | 63,639 | ||||||||
Mortgage-backed securities | 39,321 | 46 | (951 | ) | 38,416 | ||||||||
U.S. treasury securities | 499 | — | — | 499 | |||||||||
Obligations of states and political subdivisions | 84,998 | 38 | (1,225 | ) | 83,811 | ||||||||
Debt securities available for sale | 413,623 | 489 | (6,710 | ) | 407,402 | ||||||||
Marketable equity securities | 45,421 | 20,084 | (391 | ) | 65,114 | ||||||||
Other securities | 8,741 | — | — | 8,741 | |||||||||
Total | $ | 467,785 | $ | 20,573 | $ | (7,101 | ) | $ | 481,257 | ||||
There were $6,069,000, $5,337,000 and $6,348,000 in gross realized gains and $588,000, $329,000 and $1,004,000 in gross realized losses in 2006, 2005 and 2004, in each case respectively, relative to securities available for sale.
PAGE 5559
NOTES TO CONSOLIDATED FINANCIAL STATEMENTS — continued
| Available for Sale | |||||||||||||
| 2004 | Amortized Cost | Gross Unrealized Gains | Gross Unrealized Losses | Market Value | |||||||||
| (dollars in thousands) | |||||||||||||
Obligations of U.S. government corporations and agencies | $ | 234,706 | $ | 3,107 | $ | (299 | ) | $ | 237,514 | ||||
Collateralized mortgage obligations of U.S. government corporations and agencies | 46,126 | 402 | — | 46,528 | |||||||||
Mortgage-backed securities | 48,197 | 436 | (260 | ) | 48,373 | ||||||||
U.S. treasury securities | 5,089 | 159 | — | 5,248 | |||||||||
Obligations of states and political subdivisions | 70,968 | 539 | (309 | ) | 71,198 | ||||||||
Corporate securities | 16,222 | 271 | — | 16,493 | |||||||||
Debt securities available for sale | 421,308 | 4,914 | (868 | ) | 425,354 | ||||||||
Marketable equity securities | 46,888 | 27,845 | (178 | ) | 74,555 | ||||||||
Other securities | 17,997 | — | — | 17,997 | |||||||||
Total | $ | 486,193 | $ | 32,759 | $ | (1,046 | ) | $ | 517,906 | ||||
| Held to Maturity | |||||||||||||
Obligations of states and political subdivisions | $ | 265 | $ | 2 | $ | — | $ | 267 | |||||
Total | $ | 265 | $ | 2 | $ | — | $ | 267 | |||||
There were $5,337,000, $6,348,000 and $10,552,000 in gross realized gains and $329,000, $1,004,000 and $2,494,000 in gross realized losses in 2005, 2004 and 2003, respectively, relative to securities available for sale. During 2005, S&T recognized an other-than-temporary impairment totaling $0.3 million on one equity security.
The following table presents the age of gross unrealized losses and market value by investment category:
| Less Than 12 Months | 12 Months or More | Total | |||||||||||||||||||
| 2005 | Market Value | Unrealized Losses | Market Value | Unrealized Losses | Market Value | Unrealized Losses | |||||||||||||||
| (dollars in thousands) | |||||||||||||||||||||
Obligations of U.S. government corporations and agencies | $ | 142,892 | $ | (2,553 | ) | $ | 32,825 | $ | (1,134 | ) | $ | 175,717 | $ | (3,687 | ) | ||||||
Collateralized mortgage obligations of U.S. government corporations and agencies | 58,696 | (847 | ) | — | — | 58,696 | (847 | ) | |||||||||||||
Mortgage-backed securities | 21,450 | (360 | ) | 14,466 | (591 | ) | 35,916 | (951 | ) | ||||||||||||
Obligations of states and political subdivisions | 58,898 | (753 | ) | 14,412 | (472 | ) | 73,310 | (1,225 | ) | ||||||||||||
Debt securities available for sale | 281,936 | (4,513 | ) | 61,703 | (2,197 | ) | 343,639 | (6,710 | ) | ||||||||||||
Marketable equity securities | 3,052 | (245 | ) | 2,857 | (146 | ) | 5,909 | (391 | ) | ||||||||||||
Total Temporarily Impaired Securities | $ | 284,988 | $ | (4,758 | ) | $ | 64,560 | $ | (2,343 | ) | $ | 349,548 | $ | (7,101 | ) | ||||||
PAGE 56
NOTES TO CONSOLIDATED FINANCIAL STATEMENTS — continued
| Less Than 12 Months | 12 Months or More | Total | Less Than 12 Months | 12 Months or More | Total | |||||||||||||||||||||||||||||||||||||
| 2004 | Market Value | Unrealized Losses | Market Value | Unrealized Losses | Market Value | Unrealized Losses | ||||||||||||||||||||||||||||||||||||
| 2006 | Market Value | Unrealized Losses | Market Value | Unrealized Losses | Market Value | Unrealized Losses | ||||||||||||||||||||||||||||||||||||
| (dollars in thousands) | ||||||||||||||||||||||||||||||||||||||||||
Obligations of U.S. government corporations and agencies | $ | 34,309 | $ | (150 | ) | $ | 4,889 | $ | (149 | ) | $ | 39,198 | $ | (299 | ) | $ | — | $ | — | $ | 175,041 | $ | (3,174 | ) | $ | 175,041 | $ | (3,174 | ) | |||||||||||||
Collateralized mortgage obligations of U.S. government corporations and agencies | 9,515 | (29 | ) | 50,575 | (968 | ) | 60,090 | (997 | ) | |||||||||||||||||||||||||||||||||
Mortgage-backed securities | 17,147 | (260 | ) | — | — | 17,147 | (260 | ) | — | — | 30,535 | (1,078 | ) | 30,535 | (1,078 | ) | ||||||||||||||||||||||||||
Obligations of states and political subdivisions | 19,596 | (275 | ) | 1,076 | (34 | ) | 20,672 | (309 | ) | 9,948 | (24 | ) | 65,731 | (1,074 | ) | 75,679 | (1,098 | ) | ||||||||||||||||||||||||
Debt securities available for sale | 71,052 | (685 | ) | 5,965 | (183 | ) | 77,017 | (868 | ) | 19,463 | (53 | ) | 321,882 | (6,294 | ) | 341,345 | (6,347 | ) | ||||||||||||||||||||||||
Marketable equity securities | 51 | (2 | ) | 2,239 | (176 | ) | 2,290 | (178 | ) | 989 | (45 | ) | — | — | 989 | (45 | ) | |||||||||||||||||||||||||
Total Temporarily Impaired Securities | $ | 71,103 | $ | (687 | ) | $ | 8,204 | $ | (359 | ) | $ | 79,307 | $ | (1,046 | ) | $ | 20,452 | $ | (98 | ) | $ | 321,882 | $ | (6,294 | ) | $ | 342,334 | $ | (6,392 | ) | ||||||||||||
| Less Than 12 Months | 12 Months or More | Total | ||||||||||||||||||||||||||||||||||||||||
| 2005 | Market Value | Unrealized Losses | Market Value | Unrealized Losses | Market Value | Unrealized Losses | ||||||||||||||||||||||||||||||||||||
| (dollars in thousands) | ||||||||||||||||||||||||||||||||||||||||||
Obligations of U.S. government corporations and agencies | $ | 142,892 | $ | (2,553 | ) | $ | 32,825 | $ | (1,134 | ) | $ | 175,717 | $ | (3,687 | ) | |||||||||||||||||||||||||||
Collateralized mortgage obligations of U.S. government corporations and agencies | 58,696 | (847 | ) | — | — | 58,696 | (847 | ) | ||||||||||||||||||||||||||||||||||
Mortgage-backed securities | 21,450 | (360 | ) | 14,466 | (591 | ) | 35,916 | (951 | ) | |||||||||||||||||||||||||||||||||
Obligations of states and political subdivisions | 58,898 | (753 | ) | 14,412 | (472 | ) | 73,310 | (1,225 | ) | |||||||||||||||||||||||||||||||||
Debt securities available for sale | 281,936 | (4,513 | ) | 61,703 | (2,197 | ) | 343,639 | (6,710 | ) | |||||||||||||||||||||||||||||||||
Marketable equity securities | 3,052 | (245 | ) | 2,857 | (146 | ) | 5,909 | (391 | ) | |||||||||||||||||||||||||||||||||
Total Temporarily Impaired Securities | $ | 284,988 | $ | (4,758 | ) | $ | 64,560 | $ | (2,343 | ) | $ | 349,548 | $ | (7,101 | ) | |||||||||||||||||||||||||||
During 2005,2006, S&T recognized other-than-temporary impairments totaling $0.3 million on three equity investment securities. S&T recognized an other-than-temporary impairment totaling $0.3 million on one equity security.security during 2005 and zero during 2004. S&T does not believe any individual unrealized loss as of December 31, 20052006 represents an other-than-temporary impairment. S&T performs a review on the entire securities portfolio on a quarterly basis to identify securities that may
PAGE 60
NOTES TO CONSOLIDATED FINANCIAL STATEMENTS — continued
indicate an other-than-temporary impairment. S&T management considers the length of time and the extent to which the market value has been less than cost and the financial condition of the issuer. The unrealized losses on thirty-three180 debt securities are primarily attributable to changes in interest rates. The unrealized losses on fivethree marketable equity securities are attributable to temporary declines in market value. S&T has both the intent and the ability to hold the securities contained in the previous table for a time necessary to recover the amortized cost or until maturity.
The amortized cost and estimated market value of debt securities at December 31, 2005,2006, by effective maturity, is included in the table below. Expected maturities will differ from contractual maturities because borrowers may have the right to call or prepay obligations with or without call or prepayment penalties.
For purposes of the maturity table, mortgage-backed securities and collateralized mortgage obligations, which are not due at a single maturity date, have been allocated over maturity groupings based upon the current estimated prepayment rates. The mortgage-backed securities and collateralized mortgage obligations may mature earlier or later than their weighted-average estimated maturities because of principal prepayment optionality.
| Available for Sale | Amortized Cost | Market Value | Amortized Cost | Market Value | ||||||||
| (dollars in thousands) | ||||||||||||
Due in one year or less | $ | 61,102 | $ | 61,236 | $ | 56,649 | $ | 56,057 | ||||
Due after one year through five years | 280,467 | 275,633 | 261,752 | 256,911 | ||||||||
Due after five years through ten years | 68,014 | 66,581 | 38,630 | 37,855 | ||||||||
Due after ten years | 4,040 | 3,952 | 2,806 | 2,735 | ||||||||
Total Debt Securities Available for Sale | $ | 413,623 | $ | 407,402 | $ | 359,837 | $ | 353,558 | ||||
At December 31, 20052006 and 2004,2005, securities with principal amounts of $274,399,000$287,994,000 and $294,745,000,$274,399,000, respectively, were pledged to secure repurchase agreements, public funds and trust fund deposits.
PAGE 57
NOTES TO CONSOLIDATED FINANCIAL STATEMENTS — continued
NOTE E
Loans
The following table indicates the composition of the loan portfolio at December 31:
| 2005 | 2004 | 2006 | 2005 | |||||||||||||
| (dollars in thousands) | ||||||||||||||||
Real estate—construction | $ | 339,179 | $ | 274,783 | $ | 346,173 | $ | 332,930 | ||||||||
Real estate—mortgages: | ||||||||||||||||
Residential | 519,076 | 487,445 | 570,304 | 523,745 | ||||||||||||
Commercial | 920,349 | 854,299 | 973,015 | 920,349 | ||||||||||||
Commercial and industrial | 644,686 | 601,633 | 702,833 | 644,686 | ||||||||||||
Consumer installment | 68,216 | 69,191 | 73,140 | 68,216 | ||||||||||||
Gross Loans | 2,491,506 | 2,287,351 | ||||||||||||||
Gross Portfolio Loans | 2,665,465 | 2,489,926 | ||||||||||||||
Allowance for loan losses | (36,572 | ) | (34,262 | ) | (33,220 | ) | (36,572 | ) | ||||||||
Net Loans | $ | 2,454,934 | $ | 2,253,089 | ||||||||||||
Total Portfolio Loans | 2,632,245 | 2,453,354 | ||||||||||||||
Loans held for sale | 826 | 1,580 | ||||||||||||||
Total Loans | $ | 2,633,071 | $ | 2,454,934 | ||||||||||||
PAGE 61
NOTES TO CONSOLIDATED FINANCIAL STATEMENTS — continued
The following table presents changes in the allowance for loan losses for the year ended December 31:
| 2005 | 2004 | 2003 | 2006 | 2005 | 2004 | |||||||||||||||||||
| (dollars in thousands) | ||||||||||||||||||||||||
Balance at beginning of year | $ | 34,262 | $ | 31,478 | $ | 30,138 | $ | 36,572 | $ | 34,262 | $ | 31,478 | ||||||||||||
Charge-offs | (3,929 | ) | (7,175 | ) | (7,306 | ) | (14,038 | ) | (3,929 | ) | (7,175 | ) | ||||||||||||
Recoveries | 2,208 | 5,559 | 1,346 | 1,306 | 2,208 | 5,559 | ||||||||||||||||||
Net charge-offs | (1,721 | ) | (1,616 | ) | (5,960 | ) | (12,732 | ) | (1,721 | ) | (1,616 | ) | ||||||||||||
Provision for loan losses | 5,000 | 4,400 | 7,300 | 9,380 | 5,000 | 4,400 | ||||||||||||||||||
Reclassification of allowance for loan losses on unfunded loan commitments(1) | (969 | ) | — | — | ||||||||||||||||||||
Reclassification of allowance for lending-related commitments(1) | — | (969 | ) | — | ||||||||||||||||||||
Balance at end of year | $ | 36,572 | $ | 34,262 | $ | 31,478 | $ | 33,220 | $ | 36,572 | $ | 34,262 | ||||||||||||
| (1) | During the second quarter of 2005, S&T reclassified $969,000 of its allowance for loan losses to a separate allowance for probable credit losses inherent in |
S&T Bank has granted loans to certain officers and directors of S&T as well as to certain affiliates of the officers and directors in the ordinary course of business. These loans were made on substantially the same terms, including interest rates and collateral, as those prevailing at the time for comparable transactions with unrelated persons and did not involve more than normal risk of collectability. The aggregate dollar amounts of these loans were $32,136,000$32,714,000 and $27,593,000$32,136,000 at December 31, 20052006 and 2004,2005, respectively. During 2005, $20,122,0002006, $15,196,000 of new loans were funded and repayments totaled $15,579,000.$14,618,000.
The principal balances of loans on nonaccrual status were $11,166,000$19,852,000 and $6,309,000$11,166,000 at December 31, 2006 and 2005, and 2004, respectively. At December 31, 2005, there were no commitments to lend additional funds on nonaccrual loans. Other real estate owned which is included in other assets, was $523,000 at December 31, 2006 and $3,712,000 at December 31, 2005 and $2,119,000 at December 31, 2004.2005.
S&T attempts to limit its exposure to concentrations of credit risk by diversifying its loan portfolio. S&T definesmonitors concentrations of credit risk as loans to a specific industry or group in excess of
PAGE 58
NOTES TO CONSOLIDATED FINANCIAL STATEMENTS — continued
10 percent of total loans.risk. At December 31, 20052006 and 2004,2005, S&T had no concentrations of credit risk by industry or group. Geographic concentrations exist because S&T provides a full range of banking services, including commercial, consumer and mortgage loans to individuals and corporate customers in its ten-county market areas in western Pennsylvania. Management believes these risks are mitigated by underwriting guidelines and ongoing review by loan administration.
The following table represents S&T’s investment in loans considered to be impaired and related information on those impaired loans:
| 2005 | 2004 | 2003 | 2006 | 2005 | 2004 | |||||||||||||
| (dollars in thousands) | ||||||||||||||||||
Recorded investment in loans considered to be impaired | $ | 29,745 | $ | 10,458 | $ | 12,260 | $ | 26,152 | $ | 29,745 | $ | 10,458 | ||||||
Recorded investment in impaired loans with no related allowance for loan losses | 7,741 | 1,388 | 4,087 | 19,698 | 7,741 | 1,388 | ||||||||||||
Loans considered to be impaired that were on a nonaccrual basis | 5,507 | 2,138 | 3,392 | 8,617 | 5,507 | 2,138 | ||||||||||||
Allowance for loan losses related to loans considered to be impaired | 9,937 | 5,712 | 3,914 | 2,627 | 9,937 | 5,712 | ||||||||||||
Average recorded investment in impaired loans | 16,325 | 13,762 | 10,217 | 31,426 | 16,325 | 13,762 | ||||||||||||
Total interest income per contractual terms on impaired loans | 2,115 | 684 | 1,012 | 2,675 | 2,115 | 684 | ||||||||||||
Interest income on impaired loans recognized on a cash basis | 1,854 | 571 | 913 | 1,867 | 1,854 | 571 | ||||||||||||
PAGE 62
NOTES TO CONSOLIDATED FINANCIAL STATEMENTS — continued
NOTE F
Premises and Equipment
The following table is a summary of the premises and equipment accounts at December 31:
| Estimated Useful Life | 2005 | 2004 | Estimated Useful Life | 2006 | 2005 | |||||||||||||||
| (dollars in thousands) | ||||||||||||||||||||
Land | Indefinite | $ | 4,530 | $ | 3,395 | Indefinite | $ | 4,738 | $ | 4,530 | ||||||||||
Premises | 10-50 years | 29,949 | 27,169 | 10-50 years | 35,746 | 29,949 | ||||||||||||||
Furniture and equipment | 3-10 years | 21,957 | 21,128 | 3-25 years | 24,704 | 21,957 | ||||||||||||||
Leasehold improvements | 2-25 years | 3,944 | 4,103 | 2-36 years | 3,376 | 3,944 | ||||||||||||||
| 60,380 | 55,795 | 68,564 | 60,380 | |||||||||||||||||
Accumulated depreciation | (31,257 | ) | (30,304 | ) | (32,864 | ) | (31,257 | ) | ||||||||||||
Total | $ | 29,123 | $ | 25,491 | $ | 35,700 | $ | 29,123 | ||||||||||||
Depreciation related to premises and equipment was $2,922,000, $2,863,000 and $2,485,000 in 2006, 2005 and $2,479,000 in 2005, 2004, and 2003, respectively.
Certain banking facilities are leased under short-term lease arrangements expiring at various dates to the year 2010.2051. All such leases are accounted for as operating leases. Rental expense for premises and equipment amounted to $2,555,000, $2,229,000 and $1,963,000 in 2006, 2005 and $1,925,000 in 2005, 2004, and 2003, respectively. Minimum annual rentals and renewal options for each of the years 2006-20102007-2011 are approximately $1,195,000, $895,000, $879,000, $851,000,$1,089,000, $1,060,000, $1,019,000, $1,003,000, and $772,000$993,000, respectively, and $5,547,000$15,004,000 for the years thereafter. Included in the above are leases entered into with three directors for which rental expense totaled $557,000, $611,000 and $575,000 in 2006, 2005 and $566,000 in 2005, 2004, and 2003, respectively.
PAGE 59
NOTES TO CONSOLIDATED FINANCIAL STATEMENTS — continued
NOTE G
Deposits
The following table indicates the composition of deposits at December 31:
| 2005 | 2004 | 2006 | 2005 | |||||||||||||||||||||
| Balance | Expense | Balance | Expense | Balance | Expense | Balance | Expense | |||||||||||||||||
| (dollars in thousands) | ||||||||||||||||||||||||
Noninterest-bearing demand | $ | 435,672 | $ | — | $ | 415,812 | $ | — | $ | 448,453 | $ | — | $ | 435,672 | $ | — | ||||||||
Interest-bearing demand | 155,191 | 21 | 175,447 | 19 | 150,568 | 60 | 155,191 | 21 | ||||||||||||||||
Money market | 242,228 | 3,812 | 332,009 | 3,245 | 163,105 | 3,736 | 242,228 | 3,812 | ||||||||||||||||
Savings | 652,685 | 11,263 | 388,939 | 1,493 | 881,967 | 32,787 | 652,685 | 11,263 | ||||||||||||||||
Time deposits | 933,108 | 29,728 | 864,056 | 25,875 | 921,213 | 36,946 | 933,108 | 29,728 | ||||||||||||||||
Total | $ | 2,418,884 | $ | 44,824 | $ | 2,176,263 | $ | 30,632 | $ | 2,565,306 | $ | 73,529 | $ | 2,418,884 | $ | 44,824 | ||||||||
The aggregate of all time deposits over $100,000 amounted to $206,666,000$261,646,000 and $192,761,000$206,666,000 for December 31, 2006 and 2005, and 2004, respectively.
PAGE 63
NOTES TO CONSOLIDATED FINANCIAL STATEMENTS — continued
The following table indicates the scheduled maturities of time deposits at December 31:
| 2005 | 2004 | 2006 | 2005 | |||||||||
| (dollars in thousands) | ||||||||||||
Due in one year | $ | 548,150 | $ | 377,245 | $ | 659,530 | $ | 548,150 | ||||
Due in one to two years | 198,753 | 226,575 | 161,689 | 198,753 | ||||||||
Due in two to three years | 102,937 | 146,426 | 55,100 | 102,937 | ||||||||
Due in three to four years | 38,479 | 51,487 | 15,440 | 38,479 | ||||||||
Due in four to five years | 21,200 | 36,772 | 20,117 | 21,200 | ||||||||
Due after five years | 23,589 | 25,551 | 9,337 | 23,589 | ||||||||
Total | $ | 933,108 | $ | 864,056 | $ | 921,213 | $ | 933,108 | ||||
NOTE H
Short-Term Borrowings
Short-term borrowings are for terms under one year and were comprised of retail repurchase agreements (“REPOs”), wholesale REPOs, federal funds purchased and FHLB advances. S&T defines repurchase agreements with its local retail customers as retail REPOs; short-term wholesale REPOs are those transacted with other banks and brokerage firms. Securities pledged as collateral under these REPO financing arrangements cannot be sold or repledged by the secured party. The fair value of collateral provided to a third party is continually monitored, and additional collateral is obtained or requested to be returned as appropriate. Federal funds purchased are unsecured overnight borrowings with other financial institutions; overnight and FHLB advances are for various terms secured by a blanket lien on securities, residential mortgages and other loans with the FHLB of Pittsburgh.
Securities Sold Under Repurchase Agreements and Federal Funds Purchased | 2005 | 2004 | 2003 | 2006 | 2005 | 2004 | ||||||||||||||||||
| (dollars in thousands) | ||||||||||||||||||||||||
Balance at December 31: | $ | 137,829 | $ | 98,384 | $ | 182,020 | $ | 133,021 | $ | 137,829 | $ | 98,384 | ||||||||||||
Average balance during the year | 132,406 | 164,645 | 185,214 | 114,544 | 132,406 | 164,645 | ||||||||||||||||||
Average interest rate during the year | 2.98 | % | 1.16 | % | 1.13 | % | 4.51 | % | 2.98 | % | 1.16 | % | ||||||||||||
Maximum month-end balance during the year | $ | 174,467 | $ | 199,538 | $ | 230,774 | $ | 156,471 | $ | 174,467 | $ | 199,538 | ||||||||||||
Average interest rate at year-end | 3.80 | % | 1.77 | % | 0.95 | % | 4.83 | % | 3.80 | % | 1.77 | % | ||||||||||||
| Federal Home Loan Bank (FHLB) Advances | 2006 | 2005 | 2004 | |||||||||||||||||||||
| (dollars in thousands) | ||||||||||||||||||||||||
Balance at December 31: | $ | 55,000 | $ | 150,000 | $ | 225,000 | ||||||||||||||||||
Average balance during the year | 88,342 | 221,918 | 293,391 | |||||||||||||||||||||
Average interest rate during the year | 5.01 | % | 3.21 | % | 1.47 | % | ||||||||||||||||||
Maximum month-end balance during the year | $ | 150,000 | $ | 315,000 | $ | 380,000 | ||||||||||||||||||
Average interest rate at year-end | 5.44 | % | 4.34 | % | 2.20 | % | ||||||||||||||||||
PAGE 6064
NOTES TO CONSOLIDATED FINANCIAL STATEMENTS — continued
| Federal Home Loan Bank (FHLB) Advances | 2005 | 2004 | 2003 | |||||||||
| (dollars in thousands) | ||||||||||||
Balance at December 31: | $ | 150,000 | $ | 225,000 | $ | 250,000 | ||||||
Average balance during the year | 221,918 | 293,391 | 142,136 | |||||||||
Average interest rate during the year | 3.21 | % | 1.47 | % | 1.28 | % | ||||||
Maximum month-end balance during the year | $ | 315,000 | $ | 380,000 | $ | 250,000 | ||||||
Average interest rate at year-end | 4.34 | % | 2.20 | % | 1.20 | % | ||||||
NOTE I
Long-Term Borrowings
The following table is a summary of long-term borrowings with the FHLB:
| 2005 | 2004 | 2006 | 2005 | |||||||||||||||||||||
| Balance | Average Rate | Balance | Average Rate | Balance | Average Rate | Balance | Average Rate | |||||||||||||||||
| (dollars in thousands) | ||||||||||||||||||||||||
Due in one year | $ | 45,344 | 3.79 | % | $ | 142 | 5.70 | % | $ | 20,920 | 5.39 | % | $ | 45,344 | 3.79 | % | ||||||||
Due in one to two years | 10,362 | 5.70 | % | 151 | 5.70 | % | 50,965 | 5.05 | % | 10,362 | 5.70 | % | ||||||||||||
Due in two to three years | 379 | 4.88 | % | 10,159 | 5.73 | % | 84,429 | 5.49 | % | 379 | 4.88 | % | ||||||||||||
Due in three to four years | 13,638 | 6.08 | % | 169 | 5.70 | % | 5,760 | 6.41 | % | 13,638 | 6.08 | % | ||||||||||||
Due in four to five years | 4,929 | 6.67 | % | 13,596 | 6.10 | % | 564 | 4.89 | % | 4,929 | 6.67 | % | ||||||||||||
Due after five years | 9,124 | 4.86 | % | 8,833 | 6.28 | % | 9,303 | 5.26 | % | 9,124 | 4.86 | % | ||||||||||||
Total | $ | 83,776 | 4.69 | % | $ | 33,050 | 6.03 | % | $ | 171,941 | 5.36 | % | $ | 83,776 | 4.69 | % | ||||||||
The purpose of these borrowings is to match-fund selected new loan originations, to mitigate interest-rate sensitivity risks and to take advantage of discounted borrowing rates through the FHLB for community investment projects.
S&T pledged securities and all 1-4 family and multi-family mortgage loans as collateral for any current or future FHLB borrowings. The total carrying amount of these pledged loans was $437,019,000$443,734,000 at December 31, 2005.2006. At December 31, 2005,2006, S&T had availability with the FHLB of $405,312,000.$516,518,000.
At December 31, 2006, S&T had long-term repurchase agreement borrowings totaling $50.0 million at a weighted average fixed-rate of 5.52 percent, which matures within one year. At December 31, 2005, S&T had no long-term repurchase agreement borrowings outstanding. At December 31, 2004, S&T had long-term repurchase agreement borrowings totaling $53,275,000 at a weighted average fixed-rate of 4.43 percent, which matured within one year. The purpose of these borrowings was to lock in fixed-rate fundings to mitigate interest-rate risk.
On September 21, 2006, S&T Bank issued $25.0 million of junior subordinated debt through a pooled transaction at an initial fixed rate of 6.78%. On September 15, 2011 and quarterly thereafter, S&T Bank has the option to redeem the subordinated debt, subject to a 30 day written notice and prior approval by the FDIC. If S&T Bank chooses not to exercise the option for early redemption on September 15, 2011 or subsequent quarters, the subordinated debt will convert to a variable rate of 3-month LIBOR plus 160 basis points. The subordinated debt qualifies as Tier 2 capital under regulatory guidelines and will mature on December 15, 2036.
NOTE J
Dividend and Loan Restrictions
Certain restrictions exist regarding the ability of S&T Bank to transfer funds to S&T in the form of dividends and loans. The amount of dividends that may be paid to S&T is restricted by regulatory guidelines concerning minimum capital requirements. S&T Bank could pay dividends of approximately $24.0$18.5 million without affecting its well-capitalized position at December 31, 2005.2006.
Federal law prohibits S&T from borrowing from S&T Bank unless such loans are collateralized by specific obligations. Further, such loans are limited to 10 percent of S&T Bank’s capital and additional paid-in capital, as defined.
PAGE 6165
NOTES TO CONSOLIDATED FINANCIAL STATEMENTS — continued
NOTE K
Litigation
S&T, in the normal course of business, is subject to various legal proceedings in which claims for monetary damages are asserted. No material losses are anticipated by S&T as a result of these legal proceedings.
NOTE L
Guarantees
S&T, in the normal course of business, commits to extend credit and issue standby letters of credit. The obligations are not recorded in S&T’s financial statements. Loan commitments and standby letters of credit are subject to S&T’s normal credit underwriting policies and procedures and generally require collateral based upon management’s evaluation of each customer’s financial condition and ability to satisfy completely the terms of the agreement. S&T’s exposure to credit loss, in the event the customer does not satisfy the terms of the agreement, equals the notional amount of the obligation less the value of any collateral. Unfunded commercial loan commitments totaled $635,809,000$686,204,000 and $547,627,000$635,809,000 at December 31, 20052006 and 2004,2005, respectively. Unfunded other loan commitments totaled $144,694,000$157,863,000 and $134,059,000$144,694,000 at December 31, 20052006 and 2004,2005, respectively; and obligations under standby letters of credit totaled $206,249,000$220,494,000 and $213,409,000$206,249,000 at December 31, 20052006 and 2004,2005, respectively.
NOTE M
Income Taxes
Income tax expense (credits) for the years ended December 31 are comprised of:
| 2005 | 2004 | 2003 | 2006 | 2005 | 2004 | ||||||||||||||||
| (dollars in thousands) | |||||||||||||||||||||
Current | $ | 23,288 | $ | 24,613 | $ | 22,707 | $ | 19,711 | $ | 23,288 | $ | 24,613 | |||||||||
Deferred | 999 | (1,612 | ) | (1,844 | ) | 1,802 | 999 | (1,612 | ) | ||||||||||||
Total | $ | 24,287 | $ | 23,001 | $ | 20,863 | $ | 21,513 | $ | 24,287 | $ | 23,001 | |||||||||
The provision for income taxes differs from the amount computed by applying the statutory federal income tax rate to income before income taxes. The statutory to effective tax rate reconciliation for the years ended December 31 is as follows:
| 2005 | 2004 | 2003 | 2006 | 2005 | 2004 | ||||||||||||||
Statutory tax rate | 35.0 | % | 35.0 | % | 35.0 | % | 35.0 | % | 35.0 | % | 35.0 | % | |||||||
Tax-exempt interest income | (2.3 | ) | (2.2 | ) | (2.2 | ) | (2.8 | ) | (2.3 | ) | (2.2 | ) | |||||||
Dividend exclusion | (0.7 | ) | (0.7 | ) | (1.0 | ) | (0.5 | ) | (0.7 | ) | (0.7 | ) | |||||||
Low income housing tax credits | (1.6 | ) | (1.5 | ) | (1.9 | ) | (1.9 | ) | (1.6 | ) | (1.5 | ) | |||||||
Other | (1.0 | ) | (0.9 | ) | (1.2 | ) | (1.1 | ) | (1.0 | ) | (0.9 | ) | |||||||
Effective tax rate | 29.4 | % | 29.7 | % | 28.7 | % | $ | 28.7 | % | 29.4 | % | 29.7 | % | ||||||
Income taxes applicable to security gains were $1,918,000 in 2006, $1,753,000 in 2005 and $1,870,000 in 2004 and $2,820,000 in 2003.2004.
PAGE 6266
NOTES TO CONSOLIDATED FINANCIAL STATEMENTS — continued
Significant components of S&T’s temporary differences were as follows at December 31:
| 2005 | 2004 | 2006 | 2005 | |||||||||||||
| (dollars in thousands) | ||||||||||||||||
Deferred tax liabilities: | ||||||||||||||||
Net unrealized holding gains on securities available for sale | $ | (4,939 | ) | $ | (11,240 | ) | $ | (3,796 | ) | $ | (4,939 | ) | ||||
Prepaid pension | (3,997 | ) | (1,796 | ) | ||||||||||||
Prepaid pension in other employee benefits | (5,816 | ) | (3,997 | ) | ||||||||||||
Deferred loan income | (2,476 | ) | (2,495 | ) | (1,949 | ) | (2,476 | ) | ||||||||
Purchase accounting | (4,783 | ) | (4,573 | ) | (3,855 | ) | (4,783 | ) | ||||||||
Other | (778 | ) | (1,412 | ) | (1,232 | ) | (778 | ) | ||||||||
Total deferred tax liabilities | (16,973 | ) | (21,516 | ) | (16,648 | ) | (16,973 | ) | ||||||||
Deferred tax assets: | ||||||||||||||||
Allowance for loan losses | 13,090 | 11,992 | 12,059 | 13,090 | ||||||||||||
Loan fees | 1,152 | 1,287 | 905 | 1,152 | ||||||||||||
Net adjustment to apply SFAS No. 158 | 1,635 | — | ||||||||||||||
State taxes NOL carryforwards | 274 | 226 | 325 | 274 | ||||||||||||
Other | 2,722 | 2,926 | 3,016 | 2,722 | ||||||||||||
Gross deferred tax assets | 17,238 | 16,431 | 17,940 | 17,238 | ||||||||||||
Less: | ||||||||||||||||
Valuation allowance | (274 | ) | (226 | ) | (325 | ) | (274 | ) | ||||||||
Total deferred tax assets | 16,964 | 16,205 | 17,615 | 16,964 | ||||||||||||
Net deferred tax liability included in other liabilities | $ | (9 | ) | $ | (5,311 | ) | ||||||||||
Net deferred tax asset (liability) | $ | 967 | $ | (9 | ) | |||||||||||
S&T Bank establishes a valuation allowance when it is more likely than not that the CorporationS&T will not be able to realize the benefit of the deferred tax assets, i.e., when future deductibility is uncertain. Periodically, the valuation allowance is reviewed and adjusted based on management’s assessments of realizable deferred tax assets. Gross deferred tax assets as of December 31, 20052006 and 20042005 were reduced by a valuation allowance of $0.3 million, and $0.2 million, respectively, related to state income tax net operating losses generated by certain subsidiaries, as utilization of these losses is not likely. These operating loss carryforwards total $5.0 million and will expire in the years 2019-2024.2020-2025.
The period change in deferred taxes is recorded both directly to capital and as a part of the income tax expense and can be summarized as follows at December 31:
| 2005 | 2004 | 2006 | 2005 | |||||||||||||
| (dollars in thousands) | ||||||||||||||||
Deferred tax changes reflected in other comprehensive income | $ | (6,301 | ) | $ | (3,392 | ) | $ | (2,778 | ) | $ | (6,301 | ) | ||||
Deferred tax changes reflected in federal income tax expense | 999 | (1,612 | ) | 1,802 | 999 | |||||||||||
Net change in deferred taxes | $ | (5,302 | ) | $ | (5,004 | ) | $ | (976 | ) | $ | (5,302 | ) | ||||
NOTE N
Employee Benefits
S&T Bank maintains a defined benefit pension plan (“Plan”(the “Plan”) covering substantially all employees. The benefits are based on years of service and the employee’s compensation for the highest five consecutive years in the last ten years. Contributions are intended to provide for benefits attributed to employee service to date and for those benefits expected to be earned in the future.
PAGE 6367
NOTES TO CONSOLIDATED FINANCIAL STATEMENTS — continued
The following table summarizes the components of net periodic pension expense for S&T Bank’s defined benefitthe Plan:
| 2005 | 2004 | 2003 | 2006 | 2005 | 2004 | |||||||||||||||||||
| (dollars in thousands) | ||||||||||||||||||||||||
Service cost—benefits earned during the period | $ | 1,725 | $ | 1,535 | $ | 1,219 | $ | 1,989 | $ | 1,725 | $ | 1,535 | ||||||||||||
Interest cost on projected benefit obligation | 2,583 | 2,313 | 2,174 | 2,763 | 2,583 | 2,313 | ||||||||||||||||||
Expected return on plan assets | (3,435 | ) | (2,978 | ) | (2,254 | ) | (4,135 | ) | (3,435 | ) | (2,978 | ) | ||||||||||||
Net amortization and deferral | 43 | 19 | 107 | 185 | 43 | 19 | ||||||||||||||||||
Net periodic pension expense | $ | 916 | $ | 889 | $ | 1,246 | $ | 802 | $ | 916 | $ | 889 | ||||||||||||
The following tables summarize the activity in the benefit obligation and Plan assets:
| 2005 | 2004 | 2006 | 2005 | |||||||||||||
| (dollars in thousands) | ||||||||||||||||
CHANGE IN PROJECTED BENEFIT OBLIGATION | ||||||||||||||||
Projected benefit obligation at beginning of year | $ | 43,070 | $ | 37,524 | $ | 48,440 | $ | 43,070 | ||||||||
Service cost | 1,725 | 1,535 | 1,989 | 1,725 | ||||||||||||
Interest cost | 2,583 | 2,312 | 2,763 | 2,583 | ||||||||||||
Plan participants’ contributions | 294 | 1,562 | 318 | 294 | ||||||||||||
Actuarial gain | 2,619 | 1,899 | (1,260 | ) | 2,619 | |||||||||||
Benefits paid | (1,851 | ) | (1,762 | ) | (1,934 | ) | (1,851 | ) | ||||||||
Projected benefit obligation at end of year | $ | 48,440 | $ | 43,070 | $ | 50,316 | $ | 48,440 | ||||||||
CHANGE IN PLAN ASSETS | ||||||||||||||||
Market value of plan assets at beginning of year | $ | 42,145 | $ | 35,184 | $ | 52,620 | $ | 42,145 | ||||||||
Actual return on plan assets | 2,829 | 4,161 | 5,586 | 2,829 | ||||||||||||
Employer contribution | 9,203 | 3,000 | 6,000 | 9,203 | ||||||||||||
Plan participants’ contributions | 294 | 1,562 | 318 | 294 | ||||||||||||
Benefits paid | (1,851 | ) | (1,762 | ) | (1,934 | ) | (1,851 | ) | ||||||||
Market value of plan assets at end of year | $ | 52,620 | $ | 42,145 | $ | 62,590 | $ | 52,620 | ||||||||
The following table sets forth the plan’sPlan’s funded status and the accrued pension cost in the consolidated balance sheets at December 31:
| 2005 | 2004 | 2006 | 2005 | |||||||||||||
| (dollars in thousands) | ||||||||||||||||
Projected benefit obligation at end of year | $ | (48,440 | ) | $ | (43,070 | ) | $ | (50,316 | ) | $ | (48,440 | ) | ||||
Market value of plan assets at end of year | 52,620 | 42,145 | 62,590 | 52,620 | ||||||||||||
Funded status | 4,180 | (925 | ) | 12,274 | 4,180 | |||||||||||
Unrecognized net loss | 7,105 | 3,907 | 4,225 | 7,105 | ||||||||||||
Unamortized prior service cost | 134 | 151 | 118 | 134 | ||||||||||||
Balance of initial unrecognized net asset | — | — | ||||||||||||||
Prepaid pension cost included in other assets | $ | 11,419 | $ | 3,133 | $ | 16,617 | $ | 11,419 | ||||||||
The accumulated benefit obligation forOn December 31, 2006, S&T Bank’sadopted the recognition and disclosure provisions of SFAS No. 158. SFAS No. 158 requires an employer to recognize the funded status of any defined benefit Plan was $41,370,000 atpension plan or postretirement benefit plan in the December 31, 2005 and $36,902,0002006 statement of financial position, with a corresponding adjustment to accumulated other comprehensive income, net of tax. For the Plan, the adjustment to accumulated other comprehensive income at December 31, 2004.adoption represents the net unrecognized
PAGE 6468
NOTES TO CONSOLIDATED FINANCIAL STATEMENTS — continued
actuarial loss and unamortized prior service cost which were previously netted against the plan’s funded status in S&T’s statement of financial position pursuant to the provisions of SFAS No. 87. These amounts will be subsequently recognized as net periodic pension cost pursuant to S&T’s historical accounting policy for amortizing such amounts. Further, actuarial gains and losses that arise in subsequent periods and are not recognized as net periodic pension cost in the same periods will be recognized as a component of other comprehensive income. Those amounts will be subsequently recognized as a component of net periodic pension cost on the same basis as the amounts recognized in accumulated other comprehensive income upon adoption of SFAS No. 158.
The incremental effect of adopting the provisions of SFAS No. 158 on S&T’s statement of financial position at December 31, 2006 is presented in the following table. The adoption of SFAS No. 158 had no effect on S&T’s consolidated statement of income for the year ended December 31, 2006, or for any prior periods presented, and will not effect S&T’s operating results in future periods.
| RETIREMENT PLAN OF S&T BANK | 2006 | ||
| (dollars in thousands) | |||
Amounts Recognized in the Statement of Financial Position and in Retained Earnings Consist of: | |||
Prior to adoption of SFAS No. 158: | |||
Prepaid benefit cost | $ | 16,617 | |
Accrued benefit liability | — | ||
Intangible asset | — | ||
Accumulated other comprehensive income | — | ||
Net amount recognized in retained earnings | $ | 16,617 | |
After adoption of SFAS No. 158: | |||
Net amount recognized in statement of financial position | $ | 12,274 | |
Amounts recognized in accumulated other comprehensive income consist of: | |||
Prior service cost | $ | 118 | |
Net actuarial loss | 4,225 | ||
Total (before tax effects) | $ | 4,343 | |
Change in accumulated other comprehensive income due to adoption of SFAS No. 158 (before tax effects) | $ | 4,343 | |
Included in accumulated other comprehensive income at December 31, 2006 are the following amounts that have not yet been recognized in net periodic pension cost: unrecognized prior service costs of $118,000 ($77,000, net of tax) and unrecognized actuarial losses of $4,225,000 ($2,746,000, net of tax). The prior service cost and actuarial loss included in accumulated other comprehensive income and expected to be recognized in net periodic pension cost during the year ended December 31, 2007 is $16,000 ($10,000, net of tax) and $0, respectively.
The accumulated benefit obligation for the Plan was $43,049,000 at December 31, 2006 and $41,370,000 at December 31, 2005.
Below are actuarial assumptions used in accounting for the Plan at December 31:
| 2005 | 2004 | 2003 | 2006 | 2005 | 2004 | |||||||||||||
Weighted-average discount rate | 6.00 | % | 6.00 | % | 6.25 | % | 5.75 | % | 6.00 | % | 6.00 | % | ||||||
Rate of increase in future compensation levels | 4.00 | % | 4.00 | % | 4.00 | % | 4.00 | % | 4.00 | % | 4.00 | % | ||||||
Expected long-term rate of return on plan assets | 8.00 | % | 8.00 | % | 8.00 | % | 8.00 | % | 8.00 | % | 8.00 | % |
PAGE 69
NOTES TO CONSOLIDATED FINANCIAL STATEMENTS — continued
S&T considers many factors when setting the assumed rate of return on Plan assets. As a general guideline the assumed rate of return is equal to the weighted average of the expected returns for each asset category and is estimated based on historical returns as well as expected future returns.
The Plan’s weighted-average asset allocations by asset category are as follows:
| Plan Assets at December 31 | Plan Assets at December 31 | |||||||||||
| Asset Category | 2005 | 2004 | 2006 | 2005 | ||||||||
Equity Securities | 59 | % | 66 | % | 55 | % | 59 | % | ||||
Debt Securities | 26 | % | 30 | % | 33 | % | 26 | % | ||||
Other | 15 | % | 4 | % | 12 | % | 15 | % | ||||
Total | 100 | % | 100 | % | 100 | % | 100 | % | ||||
S&T Bank’s Retirement Plan Committee determines the investment policy for the Plan. In general, the targeted asset allocation is 50 percent-70 percent equities and 30 percent-50 percent fixed-income. A strategic allocation within each asset class is employed based on the Plan’s time horizon, risk tolerances, performance expectations and asset class preferences. Investment managers have discretion to invest in any equity or fixed-income asset class, subject to the securities guidelines of the Plan’s Investment Policy Statement.
S&T Bank contributed $2.0 million to the Plan in 2005. S&T also contributed $7.2 million to the Plan in 2005 for 2006. S&T Bank also contributed $6.0 million to the Plan in 2006 for 2007. This contribution comprised the majority of the other asset category (e.g., money market account) at December 31, 2005.2006. Benefit payments, which reflect expected future service, as appropriate, are expected to be paid from the Plan for each of the years 2006-20102007-2011 and are $1,923,000, $2,008,000, $2,124,000, $2,269,000, $2,440,000,$1,981,000, $2,107,000, $2,270,000, $2,468,000, $2,663,000, respectively, and $15,012,000$16,382,000 for the five years thereafter.
S&T also has a supplemental executive retirement plan (“SERP”) for certain key employees. The SERP is unfunded. The balances of the actuarial present values of projected benefit obligations related to the SERP were $3,304,000$3,389,000 and $2,859,000$3,304,000 at December 31, 20052006 and 2004,2005, respectively. Accrued pension costs related to the SERP were $2,904,000$2,835,000 and $2,693,000$2,904,000 at December 31, 2006 and 2005, and 2004, respectively. In accordance with SFAS No. 158, $485,000 before tax was reflected in accumulated other comprehensive income at December 31, 2006 in relation to the SERP. In addition, S&T pays the post-retirement health care for a limited number of retirees. The SFAS No. 158 adjustment of ($156,000), before tax was reflected in accumulated other comprehensive income at December 31, 2006, in relation to post-retirement medical benefits. Net periodic pension cost related to the SERP was $340,000, $317,000 $279,000 and $279,000 for the yearyears ended December 31, 2006, 2005 2004 and 2003,2004, respectively. The actuarial assumptions are the same as those used for S&T’s defined benefit plan.the Plan.
S&T maintains a Thrift Plan, a qualified defined contribution plan, in which substantially all employees are eligible to participate. S&T makes matching contributions to the Thrift Plan up to 3 percent of participants’ eligible compensation and may make additional profit-sharing contributions as limitedprovided by the Thrift Plan. Expense related to these contributions amounted to $1,452,000, $1,963,000 and $1,428,000 in 2006, 2005 and $1,658,000 in 2005, 2004, and 2003, respectively.
NOTE O
Incentive and Restricted Stock Plan and Dividend Reinvestment Plan
S&T adopted an Incentive Stock Plan in 1992 (“1992 Stock Plan”) that provides for granting incentive stock options, nonstatutory stock options, restricted stock and stock appreciation rights (SARs).rights. On
PAGE 65
NOTES TO CONSOLIDATED FINANCIAL STATEMENTS — continued
October 17, 1994, the 1992 Stock Plan was amended to include outside directors. The 1992 Stock Plan covers a maximum of 3.2 million shares of S&T common stock and expires ten years from the date of board
PAGE 70
NOTES TO CONSOLIDATED FINANCIAL STATEMENTS — continued
approval. At December 31, 2002, 3,180,822 nonstatutory stock options and 35,600 restricted stock awards had been granted under the 1992 Stock Plan. No further awards will be made under the 1992 Stock Plan.
S&T adopted an Incentivethe 2003 Stock Plan in 2003 (“2003 Stock Plan”) that provides for granting incentive stock options, nonstatutory stock options, restricted stock and SARS.appreciation rights. The 2003 Stock Plan covers a maximum of 1.5 million shares of S&T common stock and expires ten years from the date of board approval. The 2003 Stock Plan is similar to the S&T1992 Stock Plan, which the 2003 Stock Plan replaced. As of December 31, 2005, 933,5002006, 937,500 nonstatutory stock options have been granted under the 2003 Stock Plan and 515,350642,750 are currently exercisable.
Each year S&T has granted nonstatutory stock options in 2006 under the 2003 Stock Plan at an exercise pricesprice determined by the S&T Bancorp, Inc. Board of Directors Compensation Benefits Committee on the date of grant. S&T granted nonstatutory stock options in 2005 under the 2003 Stock Plan at an exercise price equal to the market value of S&T common stock on the grant date.
date of grant. Nonstatutory stock options granted in 2006 and 2005 have a four-year vesting period and a ten-year life, with 25 percent vesting each year on January 1 of the succeeding year. Stock options granted in 2003 and 2004 under the 2003 Stock Plan and have a ten-year life. OptionsThere were 4,000 shares of nonstatutory stock options issued in 2006 and 202,500 shares of nonstatutory stock options issued in 2005 at a price of $37.86. The total compensation expense related to the 2006 grant will approximate $19,000, net of tax over the next three years. The total compensation expense related to the 2005 grant will approximate $857,000 net of tax over the next three years.
During 2006, total proceeds from the 122,200 shares of nonstatutory stock options exercised totaled $2,755,000 and resulted in a tax benefit of $502,000. During 2005, total proceeds for the 330,735 shares exercised totaled $7,906,000 and resulted in a tax benefit of $1,660,000. During 2004, total proceeds for the 490,525 shares exercised totaled $10,347,000 and resulted in a tax benefit of $2,098,000.
Below is activity for nonstatutory stock options for the years ending December 31:
| 2006 | 2005 | 2004 | ||||||||||||||||
| Number of Shares | Weighted Average Option Price | Number of Shares | Weighted Average Option Price | Number of Shares | Weighted Average Option Price | |||||||||||||
Outstanding at beginning of year | 1,775,762 | $ | 29.05 | 1,919,697 | $ | 27.25 | 2,041,572 | $ | 26.34 | |||||||||
Granted | 4,000 | 37.86 | 202,500 | 37.86 | 380,700 | 37.08 | ||||||||||||
Exercised | (122,200 | ) | 22.54 | (330,735 | ) | 23.90 | (490,525 | ) | 21.09 | |||||||||
Forfeited | (7,200 | ) | 35.04 | (15,700 | ) | 30.81 | (12,050 | ) | 28.13 | |||||||||
Outstanding at end of year | 1,650,362 | 29.52 | 1,775,762 | 29.05 | 1,919,697 | 27.25 | ||||||||||||
Exercisable at end of year | 1,443,862 | $ | 28.33 | 1,422,312 | $ | 27.70 | 1,110,922 | $ | 23.08 | |||||||||
PAGE 71
NOTES TO CONSOLIDATED FINANCIAL STATEMENTS — continued
The following table summarizes the total shares outstanding and the range and weighted average of exercise prices and remaining contractual lives at December 31:
| 2006 | 2005 | 2004 | |||||||||||||||||||
| Shares Outstanding | Exercise Price | Contractual Remaining Life (Years) | Shares Outstanding | Exercise Price | Contractual Remaining Life (Years) | Shares Outstanding | Exercise Price | Contractual Remaining Life (Years) | |||||||||||||
1995 | — | $ | — | — | — | $ | — | — | 23,000 | $ | 13.13 | 1 | |||||||||
1996 | — | — | — | 25,500 | 15.44 | 1 | 62,500 | 15.44 | 2 | ||||||||||||
1997 | 87,462 | 20.38 | 1 | 113,062 | 20.38 | 2 | 143,822 | 20.38 | 3 | ||||||||||||
1998 | 145,900 | 27.75 | 2 | 162,700 | 27.75 | 3 | 217,300 | 27.75 | 4 | ||||||||||||
1999 | 123,100 | 22.88 | 3 | 128,900 | 22.88 | 4 | 152,600 | 22.88 | 5 | ||||||||||||
2000 | 137,300 | 19.81 | 4 | 147,800 | 19.81 | 5 | 163,500 | 19.81 | 6 | ||||||||||||
2001 | 202,700 | 24.40 | 5 | 219,600 | 24.40 | 6 | 266,525 | 24.40 | 7 | ||||||||||||
2002 | 104,650 | 26.60 | 6 | 110,500 | 26.60 | 7 | 163,350 | 26.60 | 8 | ||||||||||||
2003 | 284,550 | 29.97 | 7 | 300,800 | 29.97 | 8 | 346,400 | 29.97 | 9 | ||||||||||||
2004 | 358,200 | 37.08 | 8 | 364,400 | 37.08 | 9 | 380,700 | 37.08 | 10 | ||||||||||||
2005 | 202,500 | 37.86 | 9 | 202,500 | 37.86 | 10 | — | — | — | ||||||||||||
2006 | 4,000 | 37.86 | 9 | — | — | — | — | — | — | ||||||||||||
Total | 1,650,362 | $ | 29.52 | 5.9 | 1,775,762 | $ | 29.05 | 6.6 | 1,919,697 | $ | 27.25 | 6.9 | |||||||||
The weighted-average remaining contractual term of shares currently exercisable at December 31, 2006 is 5.4 years.
S&T also maintains a Cash Appreciation Rights (“CARs”) plan under which CARs are granted. CARs are rights to appreciation of the market value of S&T’s common stock over the exercise price as of the date of grant. The CARs are settled in cash. There were no CARs granted in 2006 and 2004. CARs granted in 2005 have a four-year vesting period and a ten-year life, with 25 percent vesting each year on January 1 of the succeeding year. There were CARs with respect to 206,900 shares of S&T common stock issued in 2005 at a price of $37.86. During 2006, CARs with respect to 7,200 shares have been forfeited. The total compensation expense related to the 2005 grant will approximate $633,000, net of tax over the next three years.
In 2002,As of December 31, 2006, there were 35,6008,900 shares of unvested restricted stock awards granted at $26.60 per share.related to a previous grant. There were no restricted stock awards granted in 2005, 20042006 and 2003.2005. These shares vest 25 percent per year over the next four years with the first vesting, occurringwhich occurred on January 1, 2004. During the restricted period, the recipient receives dividends and can vote the shares. Generally, if the recipient leaves S&T before the end of the restricted period, the shares will be forfeited. Compensation expense for the restricted stock is ratably recognized over the period of service, generally the restricted period, based on the market value of the stock on the date of grant.
S&T, also maintains a Cash Appreciation Rights (CAR) plan under which CARs are granted. CARs are rights As of December 31, 2006 there were 8,900 shares of restricted stock remaining to appreciation of the market value of S&T’s common stock over the exercise price as of the date of grant. The CARs are settled in cash. CARs granted in 2005 have a four-year vesting period and a ten-year life, with 25 percent vesting each yearvest on January 1, of the succeeding year. There were 206,900 shares of CARs issued in 2005 at a price of $37.86 and none issued in 2004 and 2003.
Below is activity for nonstatutory stock options for the years ending December 31:
| 2005 | 2004 | 2003 | ||||||||||||||||
| Number of Shares | Weighted Average Option Price | Number of Shares | Weighted Average Option Price | Number of Shares | Weighted Average Option Price | |||||||||||||
Outstanding at beginning of year | 1,919,697 | $ | 27.25 | 2,041,572 | $ | 26.34 | 2,059,422 | $ | 23.71 | |||||||||
Granted | 202,500 | 37.86 | 380,700 | 37.08 | 350,300 | 29.97 | ||||||||||||
Exercised | (330,735 | ) | 23.90 | (490,525 | ) | 21.09 | (334,250 | ) | 18.82 | |||||||||
Forfeited | (15,700 | ) | 30.81 | (12,050 | ) | 28.13 | (33,900 | ) | 26.06 | |||||||||
Outstanding at end of year | 1,775,762 | 29.05 | 1,919,697 | 27.25 | 2,041,572 | 26.34 | ||||||||||||
Exercisable at end of year | 1,422,312 | $ | 27.70 | 1,110,922 | $ | 23.08 | 1,506,175 | $ | 23.40 | |||||||||
PAGE 66
NOTES TO CONSOLIDATED FINANCIAL STATEMENTS — continued
The following table summarizes the total shares outstanding and the range and weighted average of exercise prices and remaining contractual lives at December 31:
| 2005 | 2004 | 2003 | |||||||||||||||||||
| Shares Outstanding | Exercise Price | Contractual Remaining Life (Years) | Shares Outstanding | Exercise Price | Contractual Remaining Life (Years) | Shares Outstanding | Exercise Price | Contractual Remaining Life (Years) | |||||||||||||
1994 | — | $ | — | — | — | $ | — | — | 28,000 | $ | 9.50 | 1 | |||||||||
1995 | — | — | — | 23,000 | 13.13 | 1 | 80,000 | 13.13 | 2 | ||||||||||||
1996 | 25,500 | 15.44 | 1 | 62,500 | 15.44 | 2 | 116,000 | 15.44 | 3 | ||||||||||||
1997 | 113,062 | 20.38 | 2 | 143,822 | 20.38 | 3 | 185,322 | 20.38 | 4 | ||||||||||||
1998 | 162,700 | 27.75 | 3 | 217,300 | 27.75 | 4 | 306,100 | 27.75 | 5 | ||||||||||||
1999 | 128,900 | 22.88 | 4 | 152,600 | 22.88 | 5 | 217,800 | 22.88 | 6 | ||||||||||||
2000 | 147,800 | 19.81 | 5 | 163,500 | 19.81 | 6 | 193,650 | 19.81 | 7 | ||||||||||||
2001 | 219,600 | 24.40 | 6 | 266,525 | 24.40 | 7 | 379,300 | 24.40 | 8 | ||||||||||||
2002 | 110,500 | 26.60 | 7 | 163,350 | 26.60 | 8 | 185,100 | 26.60 | 9 | ||||||||||||
2003 | 300,800 | 29.97 | 8 | 346,400 | 29.97 | 9 | 350,300 | 29.97 | 10 | ||||||||||||
2004 | 364,400 | 37.08 | 9 | 380,700 | 37.08 | 10 | — | — | — | ||||||||||||
2005 | 202,500 | 37.86 | 10 | — | — | — | — | — | — | ||||||||||||
Total | 1,775,762 | $ | 29.05 | 6.6 | 1,919,697 | $ | 27.25 | 6.9 | 2,041,572 | $ | 26.34 | 6.7 | |||||||||
2007.
S&T also sponsors a dividend reinvestment plan (“Dividend Plan”) whereby shareholders may purchase shares of S&T common stock at market value with reinvested dividends and voluntary cash contributions. American Stock Transfer and Trust Company, the plan administrator and transfer agent, purchases the shares on the open market to fulfill the Dividend Plan’s needs.
PAGE 72
NOTES TO CONSOLIDATED FINANCIAL STATEMENTS — continued
NOTE P
S&T Bancorp, Inc. (parent company only)
Condensed Financial Information
| Balance Sheets at December 31: | 2005 | 2004 | ||||||||||
| BALANCE SHEETS AT DECEMBER 31: | 2006 | 2005 | ||||||||||
| (dollars in thousands) | ||||||||||||
ASSETS | ||||||||||||
Cash | $ | 54 | $ | 60 | $ | 83 | $ | 54 | ||||
Investments in: | ||||||||||||
Bank subsidiary | 308,732 | 298,211 | 295,780 | 308,732 | ||||||||
Nonbank subsidiary | 33,384 | 29,609 | ||||||||||
Nonbank subsidiaries | 36,678 | 33,384 | ||||||||||
Other assets | 17,864 | 28,430 | 17,490 | 17,864 | ||||||||
Total Assets | $ | 360,034 | $ | 356,310 | $ | 350,031 | $ | 360,034 | ||||
LIABILITIES | ||||||||||||
Dividends payable | $ | 7,613 | $ | 7,181 | $ | 7,615 | $ | 7,613 | ||||
Other liabilities | 3,365 | — | ||||||||||
Total Liabilities | 7,613 | 7,181 | 10,980 | 7,613 | ||||||||
Total Shareholder’s Equity | 352,421 | 349,129 | ||||||||||
Total Liabilities and Shareholder’s Equity | $ | 360,034 | $ | 356,310 | ||||||||
Total Shareholders’ Equity | 339,051 | 352,421 | ||||||||||
Total Liabilities and Shareholders’ Equity | $ | 350,031 | $ | 360,034 | ||||||||
| STATEMENTS OF INCOME FOR THE YEAR ENDED DECEMBER 31: | 2006 | 2005 | 2004 | |||||||
| (dollars in thousands) | ||||||||||
Dividends from subsidiaries | $ | 63,745 | $ | 44,733 | $ | 34,025 | ||||
Investment income | 67 | 16 | 29 | |||||||
Other Expenses | 818 | 802 | 774 | |||||||
Income before equity in undistributed net income of subsidiaries | 62,994 | 43,947 | 33,280 | |||||||
(Distribution in excess of net income) equity in undistributed net income of: | ||||||||||
Bank subsidiary | (13,448 | ) | 9,899 | 15,195 | ||||||
Nonbank subsidiaries | 3,790 | 4,397 | 5,883 | |||||||
Net Income | $ | 53,336 | $ | 58,243 | $ | 54,358 | ||||
| STATEMENTS OF CASH FLOWS FOR THE YEAR ENDED DECEMBER 31: | 2006 | 2005 | 2004 | |||||||||
| (dollars in thousands) | ||||||||||||
OPERATING ACTIVITIES | ||||||||||||
Net Income | $ | 53,336 | $ | 58,243 | $ | 54,358 | ||||||
Equity in undistributed net income of subsidiaries | 9,658 | (14,296 | ) | (21,078 | ) | |||||||
Tax benefit from nonstatutory stock options exercised | 1,049 | 1,795 | 2,098 | |||||||||
Other | (1,748 | ) | (1,137 | ) | (1,664 | ) | ||||||
Total Provided by Operating Activities | 62,295 | 44,605 | 33,714 | |||||||||
FINANCING ACTIVITIES | ||||||||||||
Dividends | (30,046 | ) | (29,342 | ) | (28,101 | ) | ||||||
Net treasury stock activity | (32,514 | ) | (15,269 | ) | (5,620 | ) | ||||||
Excess tax benefits from stock-based compensation | 294 | — | — | |||||||||
Total Used by Financing Activities | (62,266 | ) | (44,611 | ) | (33,721 | ) | ||||||
Increase (decrease) in Cash | 29 | (6 | ) | (7 | ) | |||||||
Cash at Beginning of Year | 54 | 60 | 67 | |||||||||
Cash at End of Year | $ | 83 | $ | 54 | $ | 60 | ||||||
PAGE 6773
NOTES TO CONSOLIDATED FINANCIAL STATEMENTS — continued
| Statements of Income for the year ended December 31: | 2005 | 2004 | 2003 | |||||||
| (dollars in thousands) | ||||||||||
Dividends from subsidiaries | $ | 44,733 | $ | 34,025 | $ | 30,173 | ||||
Investment income | 16 | 29 | 22 | |||||||
Other Expenses | 802 | 774 | 769 | |||||||
Income before equity in undistributed net income of subsidiaries | 43,947 | 33,280 | 29,426 | |||||||
Equity in undistributed net income (distribution in excess of net income) of: | ||||||||||
Bank subsidiary | 9,899 | 15,195 | 25,097 | |||||||
Nonbank subsidiary | 4,397 | 5,883 | (2,746 | ) | ||||||
Net Income | $ | 58,243 | $ | 54,358 | $ | 51,777 | ||||
| Statements of Cash Flows for the year ended December 31: | 2005 | 2004 | 2003 | |||||||||
| (dollars in thousands) | ||||||||||||
OPERATING ACTIVITIES | ||||||||||||
Net Income | $ | 58,243 | $ | 54,358 | $ | 51,777 | ||||||
Equity in undistributed net income of subsidiaries | (14,296 | ) | (21,078 | ) | (22,351 | ) | ||||||
Tax benefit from nonstatutory stock options exercised | 1,795 | 2,098 | 1,237 | |||||||||
Other | (1,137 | ) | (1,664 | ) | (3,409 | ) | ||||||
Total Provided by Operating Activities | 44,605 | 33,714 | 27,254 | |||||||||
FINANCING ACTIVITIES | ||||||||||||
Dividends | (29,342 | ) | (28,101 | ) | (26,726 | ) | ||||||
Net treasury stock activity | (15,269 | ) | (5,620 | ) | (578 | ) | ||||||
Total Used by Financing Activities | (44,611 | ) | (33,721 | ) | (27,304 | ) | ||||||
Decrease in Cash | (6 | ) | (7 | ) | (50 | ) | ||||||
Cash at Beginning of Year | 60 | 67 | 117 | |||||||||
Cash at End of Year | $ | 54 | $ | 60 | $ | 67 | ||||||
NOTE Q
Regulatory Matters
S&T is subject to various regulatory capital requirements administered by the federal banking agencies. Failure to meet the minimum capital requirements can initiate certain mandatory and possibly additional discretionary actions by regulators that, if undertaken, could have a direct material effect on S&T’s financial statements. Under capital guidelines and the regulatory framework for prompt corrective action, S&T must meet specific capital guidelines that involve quantitative measures of S&T’s assets, liabilities and certain off-balance sheet items as calculated under regulatory accounting practices. S&T’s capital amounts and classification are also subject to qualitative judgments by the regulators about components, risk weightings and other factors.
Quantitative measures established by regulation to ensure capital adequacy require S&T to maintain minimum amounts and ratios of Tier 1 and Total capital to risk-weighted assets and Tier 1 capital to average assets. As of December 31, 20052006 and 2004,2005, S&T meets all capital adequacy requirements to which it is subject.
PAGE 68
NOTES TO CONSOLIDATED FINANCIAL STATEMENTS — continued
To be classified as well capitalized, S&T must maintain minimum Tier 1 risk-based, Total risk-based and Tier 1 leverage ratios as set forth in the table below:
| Actual | For Capital Adequacy Purposes | To Be Well Capitalized Under Prompt Corrective Action Provisions | Actual | For Capital Adequacy Purposes | To Be Well Capitalized Under Prompt Corrective Action Provisions | |||||||||||||||||||||||||||||||
| Amount | Ratio | Amount | Ratio | Amount | Ratio | Amount | Ratio | Amount | Ratio | Amount | Ratio | |||||||||||||||||||||||||
| (dollars in thousands) | ||||||||||||||||||||||||||||||||||||
As of December 31, 2006 | ||||||||||||||||||||||||||||||||||||
Total Capital (to Risk Weighted Assets) | $ | 347,487 | 11.93 | % | $ | 233,085 | 8.00 | % | $ | 291,356 | 10.00 | % | ||||||||||||||||||||||||
Tier 1 Capital (to Risk Weighted Assets) | 282,030 | 9.68 | % | 116,543 | 4.00 | % | 174,814 | 6.00 | % | |||||||||||||||||||||||||||
Tier 1 Capital (to Average Assets) | 282,030 | 8.84 | % | 95,755 | 3.00 | % | 159,591 | 5.00 | % | |||||||||||||||||||||||||||
As of December 31, 2005 | ||||||||||||||||||||||||||||||||||||
Total Capital (to Risk Weighted Assets) | $ | 333,945 | 12.09 | % | $ | 220,973 | 8.00 | % | $ | 276,216 | 10.00 | % | $ | 333,945 | 12.09 | % | $ | 220,973 | 8.00 | % | $ | 276,216 | 10.00 | % | ||||||||||||
Tier 1 Capital (to Risk Weighted Assets) | 290,531 | 10.52 | % | 110,486 | 4.00 | % | 165,729 | 6.00 | % | 290,531 | 10.52 | % | 110,486 | 4.00 | % | 165,729 | 6.00 | % | ||||||||||||||||||
Tier 1 Capital (to Average Assets) | 290,531 | 9.50 | % | 122,354 | 3.00 | % | 152,943 | 5.00 | % | 290,531 | 9.50 | % | 91,766 | 3.00 | % | 152,943 | 5.00 | % | ||||||||||||||||||
As of December 31, 2004 | ||||||||||||||||||||||||||||||||||||
Total Capital (to Risk Weighted Assets) | $ | 320,318 | 12.58 | % | $ | 203,780 | 8.00 | % | $ | 254,725 | 10.00 | % | ||||||||||||||||||||||||
Tier 1 Capital (to Risk Weighted Assets) | 275,997 | 10.84 | % | 101,890 | 4.00 | % | 152,835 | 6.00 | % | |||||||||||||||||||||||||||
Tier 1 Capital (to Average Assets) | 275,997 | 9.51 | % | 116,059 | 3.00 | % | 145,074 | 5.00 | % | |||||||||||||||||||||||||||
The most recent notificationnotifications from the Federal Reserve Bank and the FDIC categorized S&T and S&T Bank, respectively, as well capitalized under the regulatory framework for corrective action. There have been no conditions or events that management believes have changed S&T or S&T Bank’s ranking during 2006 and 2005.
At December 31, 2006, S&T Bank’s Tier 1 and Total capital ratios were 8.54 percent and 10.64 percent, respectively, and Tier 1 capital to average assets was 7.74 percent. At December 31, 2005, S&T Bank’s Tier 1 and Total capital ratios were 9.57 percent and 10.89 percent, respectively, and Tier 1 capital to average assets was 8.61 percent. At December 31, 2004, S&T Bank’s Tier 1 and Total capital ratios were 9.98 percent and 11.36 percent, respectively, and Tier 1 capital to average assets was 8.73 percent.
PAGE 6974
NOTES TO CONSOLIDATED FINANCIAL STATEMENTS — continued
NOTE R
Selected Financial Data
(unaudited)
| 2005 | 2004 | 2006 | 2005 | ||||||||||||||||||||||||||||||||||||||||||||||||
| Fourth Quarter | Third Quarter | Second Quarter | First Quarter | Fourth Quarter | Third Quarter | Second Quarter | First Quarter | Fourth Quarter | Third Quarter | Second Quarter | First Quarter | Fourth Quarter | Third Quarter | Second Quarter | First Quarter | ||||||||||||||||||||||||||||||||||||
| (dollars in thousands, except per share data) | (dollars in thousands, except per share data) | (dollars in thousands, except per share data) | |||||||||||||||||||||||||||||||||||||||||||||||||
SUMMARY OF OPERATIONS | SUMMARY OF OPERATIONS | SUMMARY OF OPERATIONS | |||||||||||||||||||||||||||||||||||||||||||||||||
Income Statements: | |||||||||||||||||||||||||||||||||||||||||||||||||||
Interest income | $ | 46,476 | $ | 44,035 | $ | 42,145 | $ | 39,466 | $ | 39,075 | $ | 37,728 | $ | 36,239 | $ | 35,596 | $ | 52,833 | $ | 53,028 | $ | 50,957 | $ | 47,884 | $ | 46,476 | $ | 44,035 | $ | 42,145 | $ | 39,466 | |||||||||||||||||||
Interest expense | 17,991 | 15,595 | 13,780 | 12,148 | 11,287 | 10,549 | 9,548 | 9,506 | 24,758 | 24,186 | 22,830 | 19,810 | 17,991 | 15,595 | 13,780 | 12,148 | |||||||||||||||||||||||||||||||||||
Provision for loan losses | 1,500 | 3,000 | (300 | ) | 800 | (500 | ) | 1,500 | 1,900 | 1,500 | 828 | 1,352 | 5,700 | 1,500 | 1,500 | 3,000 | (300 | ) | 800 | ||||||||||||||||||||||||||||||||
Net interest income after provision for loan losses | 26,985 | 25,440 | 28,665 | 26,518 | 28,288 | 25,679 | 24,791 | 24,590 | 27,247 | 27,490 | 22,427 | 26,574 | 26,985 | 25,440 | 28,665 | 26,518 | |||||||||||||||||||||||||||||||||||
Security gains, net | 1,239 | 1,300 | 801 | 1,668 | 972 | 1,144 | 1,708 | 1,520 | 1,218 | 1,210 | 1,244 | 1,809 | 1,239 | 1,300 | 801 | 1,668 | |||||||||||||||||||||||||||||||||||
Noninterest income | 8,498 | 8,140 | 8,504 | 7,418 | 7,692 | 6,820 | 7,473 | 6,873 | 8,434 | 8,711 | 9,090 | 8,674 | 8,462 | 8,107 | 8,385 | 7,423 | |||||||||||||||||||||||||||||||||||
Noninterest expense | 16,273 | 14,695 | 15,605 | 16,073 | 15,745 | 14,898 | 14,812 | 14,736 | 18,727 | 16,339 | 17,273 | 16,939 | 16,237 | 14,662 | 15,486 | 16,078 | |||||||||||||||||||||||||||||||||||
Income before taxes | 20,449 | 20,185 | 22,365 | 19,531 | 21,207 | 18,745 | 19,160 | 18,247 | 18,172 | 21,072 | 15,488 | 20,118 | 20,449 | 20,185 | 22,365 | 19,531 | |||||||||||||||||||||||||||||||||||
Applicable income taxes | 5,886 | 5,818 | 6,872 | 5,711 | 6,655 | 5,468 | 5,588 | 5,290 | 4,973 | 6,408 | 4,251 | 5,881 | 5,886 | 5,818 | 6,872 | 5,711 | |||||||||||||||||||||||||||||||||||
Net income | $ | 14,563 | $ | 14,367 | $ | 15,493 | $ | 13,820 | $ | 14,552 | $ | 13,277 | $ | 13,572 | $ | 12,957 | $ | 13,199 | $ | 14,664 | $ | 11,237 | $ | 14,237 | $ | 14,563 | $ | 14,367 | $ | 15,493 | $ | 13,820 | |||||||||||||||||||
PER SHARE DATA | |||||||||||||||||||||||||||||||||||||||||||||||||||
Net income-Diluted | $ | 0.55 | $ | 0.54 | $ | 0.58 | $ | 0.51 | $ | 0.54 | $ | 0.50 | $ | 0.51 | $ | 0.48 | $ | 0.52 | $ | 0.57 | $ | 0.43 | $ | 0.54 | $ | 0.55 | $ | 0.54 | $ | 0.58 | $ | 0.51 | |||||||||||||||||||
Dividends declared | 0.29 | 0.28 | 0.28 | 0.28 | 0.27 | 0.27 | 0.27 | 0.26 | 0.30 | 0.29 | 0.29 | 0.29 | 0.29 | 0.28 | 0.28 | 0.28 | |||||||||||||||||||||||||||||||||||
Book value | 13.41 | 13.35 | 13.09 | 13.06 | 13.12 | 12.77 | 12.25 | 12.74 | 13.37 | 13.24 | 13.14 | 13.41 | 13.41 | 13.35 | 13.09 | 13.06 | |||||||||||||||||||||||||||||||||||
AVERAGE BALANCE SHEET TOTALS | AVERAGE BALANCE SHEET TOTALS | AVERAGE BALANCE SHEET TOTALS | |||||||||||||||||||||||||||||||||||||||||||||||||
Total assets | $ | 3,141,728 | $ | 3,090,488 | $ | 3,061,157 | $ | 2,998,237 | $ | 3,000,134 | $ | 3,002,225 | $ | 2,979,134 | $ | 2,908,794 | $ | 3,270,151 | $ | 3,285,807 | $ | 3,282,972 | $ | 3,205,843 | $ | 3,141,728 | $ | 3,090,488 | $ | 3,061,157 | $ | 2,998,237 | |||||||||||||||||||
Securities | 495,676 | 504,806 | 516,704 | 518,872 | 530,547 | 555,568 | 583,192 | 597,845 | 428,556 | 453,128 | 469,472 | 485,935 | 495,676 | 504,806 | 516,704 | 518,872 | |||||||||||||||||||||||||||||||||||
Net loans | 2,415,587 | 2,346,862 | 2,317,945 | 2,259,300 | 2,250,816 | 2,230,984 | 2,182,642 | 2,102,312 | 2,585,787 | 2,579,072 | 2,563,889 | 2,476,748 | 2,415,587 | 2,346,862 | 2,317,945 | 2,259,300 | |||||||||||||||||||||||||||||||||||
Total deposits | 2,348,991 | 2,269,085 | 2,188,288 | 2,157,201 | 2,116,041 | 2,040,251 | 1,982,751 | 1,955,025 | 2,572,123 | 2,518,761 | 2,494,841 | 2,424,946 | 2,348,991 | 2,269,085 | 2,188,288 | 2,157,201 | |||||||||||||||||||||||||||||||||||
Securities sold under repurchase agreements and federal funds purchased | 162,718 | 141,494 | 127,901 | 96,687 | 124,912 | 173,177 | 166,000 | 194,836 | 99,661 | 104,441 | 116,497 | 138,111 | 162,718 | 141,494 | 127,901 | 96,687 | |||||||||||||||||||||||||||||||||||
Short-term borrowings | 146,957 | 197,337 | 282,912 | 262,000 | 278,424 | 312,935 | 333,901 | 247,033 | 21,685 | 86,359 | 117,637 | 128,889 | 146,957 | 197,337 | 282,912 | 262,000 | |||||||||||||||||||||||||||||||||||
Long-term borrowings | 83,813 | 82,174 | 68,352 | 79,248 | 86,344 | 95,672 | 116,933 | 116,933 | 163,161 | 182,790 | 161,422 | 108,817 | 83,813 | 82,174 | 68,352 | 79,248 | |||||||||||||||||||||||||||||||||||
Subordinated debt | 25,000 | 2,717 | — | — | — | — | — | — | |||||||||||||||||||||||||||||||||||||||||||
Total shareholders’ equity | 353,373 | 351,432 | 348,871 | 353,472 | 347,105 | 333,545 | 300,474 | 341,835 | 342,303 | 343,176 | 346,351 | 356,341 | 353,373 | 351,432 | 348,871 | 353,472 | |||||||||||||||||||||||||||||||||||
PAGE 7075
S&T Bancorp, Inc. and Subsidiaries
S&T Bancorp, Inc. is responsible for the preparation, integrity, and fair presentation of the consolidated financial statements included in this annual report. The consolidated financial statements and notes included in this annual report have been prepared in conformity with United States generally accepted accounting principles and necessarily include some amounts that are based on management’s best estimates and judgments.
We, as management of S&T Bancorp, Inc., are responsible for establishing and maintaining effective adequate control over financial reporting that is designed to produce reliable financial statements in conformity with United States generally accepted accounting principles. The system of internal control over financial reporting as it relates to the financial statements is evaluated for effectiveness by management and tested for reliability through a program of internal audits. Actions are taken to correct potential deficiencies as they are identified. Any system of internal control, no matter how well designed, has inherent limitations, including the possibility that a control can be circumvented or overridden and misstatements due to error or fraud may occur and not be detected. Also, because of changes in conditions, internal control effectiveness may vary over time. Accordingly, even an effective system of internal control will provide only reasonable assurance with respect to financial statement preparation.
The Audit Committee, consisting entirely of independent directors, meets regularly with management, internal auditors and the independent registered public accounting firm, and reviews audit plans and results, as well as management’s actions taken in discharging responsibilities for accounting, financial reporting, and internal control. Ernst & Young LLP, independent registered public accounting firm, and the internal auditors have direct and confidential access to the Audit Committee at all times to discuss the results of their examinations.
REPORT ON MANAGEMENT’S ASSESSMENT OF INTERNAL CONTROL OVER FINANCIAL REPORTING
Management assessed the corporation’s system of internal control over financial reporting as of December 31, 2005,2006, in relation to criteria for effective internal control over financial reporting as described in “Internal Control — Integrated Framework,” issued by the Committee of Sponsoring Organizations of the Treadway Commission. Based on this assessment, management concludes that, as of December 31, 2005,2006, its system of internal control over financial reporting is effective and meets the criteria of the “Internal Control — Integrated Framework”. Ernst & Young LLP, independent registered public accounting firm, has issued an attestation report on management’s assessment of the Corporation’s internal control over financial reporting.
/s/ James C. Miller | /s/ Robert E. Rout |
James C. Miller, Chairman and Chief Executive Officer | Robert E. Rout Senior Executive Vice President, Chief Financial Officer and Secretary | |
Indiana, Pennsylvania | ||
February | ||
PAGE 7176
REPORT OF ERNST & YOUNG LLP, INDEPENDENT REGISTERED PUBLIC ACCOUNTING FIRM ON EFFECTIVENESS OF INTERNAL CONTROL OVER FINANCIAL REPORTING
S&T Bancorp, Inc. and Subsidiaries
Audit Committee of the Board of Directors
S&T Bancorp, Inc.
We have audited management’s assessment, included in the accompanying Report on Management’s Assessment of Internal Control Over Financial Reporting, that S&T Bancorp, Inc. maintained effective internal control over financial reporting as of December 31, 2005,2006, based on criteria established in Internal Control — Integrated Framework issued by the Committee of Sponsoring Organizations of the Treadway Commission (the COSO criteria). S&T Bancorp Inc.’s management is responsible for maintaining effective internal control over financial reporting and for its assessment of the effectiveness of internal control over financial reporting. Our responsibility is to express an opinion on management’s assessment and an opinion on the effectiveness of the Company’s internal control over financial reporting based on our audit.
We conducted our audit in accordance with the standards of the Public Company Accounting Oversight Board (United States). Those standards require that we plan and perform the audit to obtain reasonable assurance about whether effective internal control over financial reporting was maintained in all material respects. Our audit included obtaining an understanding of internal control over financial reporting, evaluating management’s assessment, testing and evaluating the design and operating effectiveness of internal control, and performing such other procedures as we considered necessary in the circumstances. We believe that our audit provides a reasonable basis for our opinion.
A company’s internal control over financial reporting is a process designed to provide reasonable assurance regarding the reliability of financial reporting and the preparation of financial statements for external purposes in accordance with generally accepted accounting principles. Because management’s assessment and our audit were conducted to also meet the reporting requirements of Section 112 of the Federal Deposit Insurance Corporation Improvement Act (FDICIA), management’s assessment and our audit of S&T Bancorp, Inc.’s internal control over financial reporting included controls over the preparation of financial statements in accordance with the instructions for the preparation of Consolidated Financial Statements for Bank Holding Companies (Form FRY-9C). A company’s internal control over financial reporting includes those policies and procedures that (1) pertain to the maintenance of records that, in reasonable detail, accurately and fairly reflect the transactions and dispositions of the assets of the company; (2) provide reasonable assurance that transactions are recorded as necessary to permit preparation of financial statements in accordance with generally accepted accounting principles, and that receipts and expenditures of the company are being made only in accordance with authorizations of management and directors of the company; and (3) provide reasonable assurance regarding prevention or timely detection of unauthorized acquisition, use, or disposition of the company’s assets that could have a material effect on the financial statements.
Because of its inherent limitations, internal control over financial reporting may not prevent or detect misstatements. Also, projections of any evaluation of effectiveness to future periods are subject to the risk that controls may become inadequate because of changes in conditions, or that the degree of compliance with the policies or procedures may deteriorate.
In our opinion, management’s assessment that S&T Bancorp, Inc. maintained effective internal control over financial reporting as of December 31, 2005,2006, is fairly stated, in all material respects, based on the COSO criteria. Also, in our opinion, S&T Bancorp, Inc. maintained, in all material respects, effective internal control over financial reporting as of December 31, 2005,2006, based on the COSO criteria.
We also have audited, in accordance with the standards of the Public Company Accounting Oversight Board (United States), the consolidated balance sheets of S&T Bancorp, Inc. as of December 31, 20052006 and 2004,2005, and the related consolidated statements of income, shareholders’ equity, and cash flows for each of the three years in the period ended December 31, 2005,2006, of S&T Bancorp, Inc. and our report dated February 24, 2006,23, 2007, expressed an unqualified opinion thereon.
/s/ Ernst & Young LLP
Pittsburgh, Pennsylvania
February 24, 200623, 2007
PAGE 7277
REPORT OF ERNST & YOUNG LLP, INDEPENDENT REGISTERED PUBLIC ACCOUNTING FIRM ON CONSOLIDATED FINANCIAL STATEMENTS
S&T Bancorp, Inc. and Subsidiaries
The Audit Committee of the Board of Directors
S&T Bancorp, Inc.
We have audited the accompanying consolidated balance sheets of S&T Bancorp, Inc. and subsidiaries as of December 31, 20052006 and 2004,2005, and the related consolidated statements of income, shareholders’ equity, and cash flows for each of the three years in the period ended December 31, 2005.2006. These financial statements are the responsibility of S&T’s management. Our responsibility is to express an opinion on these financial statements based on our audits.
We conducted our audits in accordance with the standards of the Public Company Accounting Oversight Board (United States). Those standards require that we plan and perform the audit to obtain reasonable assurance about whether the financial statements are free of material misstatement. An audit includes examining, on a test basis, evidence supporting the amounts and disclosures in the financial statements. An audit also includes assessing the accounting principles used and significant estimates made by management, as well as evaluating the overall financial statement presentation. We believe that our audits provide a reasonable basis for our opinion.
In our opinion, the financial statements referred to above present fairly, in all material respects, the consolidated financial position of S&T Bancorp, Inc. and subsidiaries at December 31, 20052006 and 2004,2005, and the consolidated results of their operations and their cash flows for each of the three years in the period ended December 31, 2005,2006, in conformity with U.S. generally accepted accounting principles.
As discussed in Note A to the consolidated financial statements, in 2006 the Company changed its method for the recognition of stock-based compensation expense in accordance with Financial Accounting Standards Board Statement 123(R),Share Based Payment. Also, as discussed in Note A to the consolidated financial statements, the Company changed its method of accounting for its defined benefit pension and postretirement plans as of December 31, 2006, in accordance with Financial Accounting Standards Board Statement No. 158,Employers’ Accounting for Defined Benefit Pension and Other Postretirement Plans.
We also have audited, in accordance with the standards of the Public Company Accounting Oversight Board (United States), the effectiveness of S&T Bancorp, Inc.’s internal control over financial reporting as of December 31, 2005,2006, based on criteria established in Internal Control — Integrated Framework issued by the Committee of Sponsoring Organizations of the Treadway Commission and our report dated February 24, 2006,23, 2007, expressed an unqualified opinion thereon.
/s/ Ernst & Young LLP
Pittsburgh, Pennsylvania
February 24, 200623, 2007
PAGE 7378
Item 9. CHANGES AND DISAGREEMENTS WITH ACCOUNTANTS ON ACCOUNTING AND
FINANCIAL DISCLOSURES
None
Item 9A. CONTROLS AND PROCEDURES
Evaluation of Disclosure Controls and Procedures
Under the supervision and with the participation of S&T’s Chief Executive Officer and Chief Financial Officer (its principal executive officer and principal financial officer) management has evaluated the effectiveness of the design and operation of S&T’s disclosure controls and procedures. Based on that evaluation, our CEO and CFO have concluded that our disclosure controls and procedures are effective as of December 31, 2005.2006.
Changes inManagement’s Report on Internal Control Over Financial Reporting
There were no changes in S&T’sOur management is responsible for establishing and maintaining adequate internal control over financial reporting, duringas such term is defined in Exchange Act Rule 13a-15(f). Management assessed the quarter ended December 31, 2005 that have materially affected, or are reasonably likely to materially affect, thecorporation’s system of internal control over financial reporting.reporting as of December 31, 2006, in relation to criteria for effective internal control over financial reporting as described in “Internal Control —Integrated Framework,” issued by the Committee of Sponsoring Organizations of the Treadway Commission. Based on this assessment, management concludes that, as of December 31, 2006, its system of internal control over financial reporting is effective and meets the criteria of the “Internal Control — Integrated Framework”.
Please refer to page 71 for Management’s ReportErnst & Young LLP, independent registered public accounting firm, has issued an attestation report on Internal Control Over Financial Reporting.management’s assessment of the Corporation’s internal control over financial reporting, as stated in their report which is included herein.
None
PAGE 7479
Item 10. DIRECTORS, AND EXECUTIVE OFFICERS OF THE REGISTRANTAND CORPORATE GOVERNANCE
The information required by Item 10 of Form 10-K is incorporated herein from the sections entitled “Beneficial Ownership of S&T Common Stock by Directors and Officers” and “Executive Officers of the Registrant” in our proxy statement relating to our April 17, 2006,16, 2007, annual meeting of shareholders.
Section 16(a) Beneficial Ownership Reporting Compliance
Section 16(a) of the Exchange Act, requires our directors, executive officers and persons who own more than 10 percent of our outstanding stock to file reports of ownership and changes in ownership with the SEC. To our knowledge, based solely on our review of such reports furnished to us and written representations that no other reports were required, all Section 16(a) filing requirements applicable to our directors, executive officers and greater-than-ten-percent shareholders were complied with during the year ended December 31, 2005.
Code of Ethics
S&T has adopted a code of ethics applicable to our Chief Executive Officer (our principal executive officer) and our Chief Financial Officer (our principal financial and principal accounting officer). We have posted the text of our code of ethics on our web site at www.stbancorp.com. We intend to post notice of any waiver from, or amendment to, any provision of our code of ethics on our web site.
Item 11. EXECUTIVE COMPENSATION
This information required by Item 11 of Form 10-K is incorporated herein from the sections entitled “S&T Board Fees”“Director Compensation” and “Remuneration of Executive Officers” in our proxy statement relating to our April 17, 2006,16, 2007, annual meeting of shareholders.
Item 12. SECURITY OWNERSHIP OF CERTAIN BENEFICIAL OWNERS AND MANAGEMENT AND RELATED SHAREHOLDER MATTERS
Except as set forth below the information required by Item 12 of Form 10-K is incorporated from the sections entitled “Principal Beneficial Owners of S&T Common Stock” and “Beneficial Ownership of S&T Common Stock by Directors and Officers” in our proxy statement relating to our April 17, 2006,16, 2007, annual meeting of shareholders.
EQUITY COMPENSATION PLAN INFORMATION
The following table provides information as of December 31, 20052006 related to the equity compensation plans in effect at that time.
| (a) | (b) | (c) | (a) | (b) | (c) | |||||||||
| Plan category | Number of securities to be issued upon exercise of outstanding options, warrants and rights | Weighted-average exercise price of outstanding options, warrants and rights | Number of securities remaining available for future issuance under equity compensation plan (excluding securities reflected in column (a)) | Number of securities to be issued upon exercise of outstanding options, warrants and rights | Weighted-average exercise price of outstanding options, warrants and rights | Number of securities remaining available for future issuance under equity compensation plan (excluding securities reflected in column (a)) | ||||||||
Equity compensation plan approved by shareholders1 | 1,775,762 | $ | 29.05 | 566,500 | 1,650,362 | $ | 29.52 | 562,500 | ||||||
Equity compensation plans not approved by shareholders | 0 | 0 | 0 | 0 | 0 | 0 | ||||||||
Total | 1,775,762 | $ | 29.05 | 566,500 | 1,650,362 | $ | 29.52 | 562,500 | ||||||
| (1) | Awards granted under the S&T Bancorp, Inc. Amended and Restated 1992 Incentive Stock Plan (the “1992 Plan”) and the 2003 Incentive Stock |
PAGE 75
Item 13. CERTAIN RELATIONSHIPS AND RELATED TRANSACTIONS, AND DIRECTOR INDEPENDENCE
The information required by Item 13 of Form 10-K is incorporated herein from the sections entitled “Transactions with Management and Others”Related Parties” and “Compensation Committee Interlocks and Insider Participation” in our proxy statement relating to our April 17, 2006,16, 2007, annual meeting of shareholders.
Item 14. PRINCIPAL ACCOUNTING FEES AND SERVICES
The information required by Item 14 of Form 10-K is incorporated herein from the section entitled “Independent Registered Public Accounting Firm” in our proxy statement relating to our April 17, 2006,16, 2007, annual meeting of shareholders.
All services provided by our independent registered public accounting firm in 2005 were pre-approved by the Audit Committee of the Board (the “Committee”). The Committee is required to pre-approve all audit and non-audit services performed by the independent registered public accounting firm to assure that the provision of such services does not impair the independent registered public accounting firm’s independence. In addition, any proposed services exceeding pre-approved cost levels require specific pre-approval by the Committee. The Committee may delegate pre-approval authority to one or more of its members. The member or members to whom such authority is delegated must report any pre-approval decisions to the Committee at its next scheduled meeting. The Audit Committee does not delegate its responsibilities to pre-approve services performed by the Independent Auditor to management.
PAGE 7680
Item 15. EXHIBITS, FINANCIAL STATEMENT SCHEDULES
(a) The following documents are filed as part of this report.
| (a) | The following documents are filed as part of this report. |
Consolidated Financial Statements: The following consolidated financial statements are included in Part II, Item 8 of this report. No financial statement schedules are being filed since the required information is inapplicable or is presented in the Consolidated Financial Statements or related Notes.
PAGE 7781
| (b) Exhibits | ||
| 3.1 | Articles of Incorporation of S&T Bancorp, Inc. Filed as Exhibit B to Registration Statement (No. 2-83565) on Form S-4 of S&T Bancorp, Inc., dated May 5, 1983, and incorporated herein by reference. | |
| 3.2 | Amendment to Articles of Incorporation of S&T Bancorp, Inc. Filed as Exhibit 3.2 to Form S-4 Registration Statement (No. 33-02600) dated January 15, 1986, and incorporated herein by reference. | |
| 3.3 | Amendment to Articles of Incorporation of S&T Bancorp, Inc. effective May 8, 1989, incorporated herein by reference. Filed as exhibit 3.3 to S&T Bancorp, Inc. Annual Report on Form 10-K for year ending December 31, 1998 and incorporated herein by reference. | |
| 3.4 | Amendment to Articles of Incorporation of S&T Bancorp, Inc. effective July 21, 1995. Filed as exhibit 3.4 to S&T Bancorp, Inc. Annual Report on Form 10-K for year ending December 31, 1998 and incorporated here by reference. | |
| 3.5 | Amendment to Articles of Incorporation of S&T Bancorp, Inc. effective June 18, 1998. Filed as exhibit 3.5 to S&T Bancorp, Inc. Annual Report on Form 10-K for year ending December 31, 1998 and incorporated herein by reference. | |
| 3.6 | By-laws of S&T Bancorp, Inc., as amended, December 16, 2002. Filed as Exhibit 3.6 to S&T Bancorp, Inc. Annual Report on Form 10-K for the year ending December 31, 2002 and incorporated herein by reference. | |
| 10.1 | S&T Bancorp, Inc. Amended and Restated 1992 Incentive Stock Plan. Filed as Exhibit 4.2 to Form S-8 Registration Statement (No. | |
| 10.2 | S&T Bancorp, Inc. 2003 Incentive Stock Plan. Filed as Exhibit 4.2 to Form S-8 Registration Statement (No. 333-111557) dated December 24, 2003 and incorporated herein by reference.* | |
| 21 | Subsidiaries of the Registrant. | |
| 23 | Consent of Ernst & Young LLP, Independent Registered Public Accounting Firm. | |
| 24 | Power of Attorney. | |
| 31.1 | Rule 13a-14(a) Certification of the Chief Executive Officer. | |
| 31.2 | Rule 13a-14(a) Certification of the Chief Financial Officer. | |
| 32 | Rule 13a-14(b) Certification of the Chief Executive Officer and Chief Financial Officer. | |
| * | Management Contract or Compensatory Plan or Arrangement |
PAGE 7882
Pursuant to the requirements of Section 13 or 15(d) of the Securities Exchange Act of 1934, the registrant has duly caused this report to be signed on its behalf by the undersigned, thereunto duly authorized.
S&T BANCORP, INC. (Registrant) | ||
/s/ James C. Miller | 02/ | |
James C. Miller, Chairman and Chief Executive Officer | Date | |
/s/ Robert E. Rout | 02/ | |
Robert E. Rout, Senior Executive Vice President, Chief Financial Officer and Secretary | Date | |
Pursuant to the requirements of the Securities Exchange Act of 1934, this report has been signed below by the following persons on behalf of the registrant and in the capacities and on the dates indicated.
| SIGNATURE | TITLE | DATE | ||
/s/ James C. Miller James C. Miller | Chairman and Chief Executive Officer (Principal Executive Officer) | 02/ | ||
/s/ Robert E. Rout Robert E. Rout | Senior Executive Vice President, Chief Financial Officer and Secretary (Principal Financial and Accounting Officer) | 02/ | ||
/s/ Joseph A. Kirk Joseph A. Kirk | Director | 02/ | ||
Thomas A. Brice | Director | 02/ | ||
* Todd D. Brice | Director | 02/ | ||
* James L. Carino | Director | 02/ | ||
John J. Delaney | Director | 02/ | ||
* Michael J. Donnelly | Director | 02/ | ||
PAGE 7983
| SIGNATURE | TITLE | DATE | ||||
*
| Director | 02/ | ||||
| William J. Gatti | ||||||
*
| Director | 02/ | ||||
| Ruth M. Grant | ||||||
*
| Director | 02/ | ||||
| Jeffrey D. Grube | ||||||
*
| Director | 02/ | ||||
| Frank W. Jones | ||||||
*
| Director | 02/ | ||||
| Samuel Levy | ||||||
| Director | 02/ | ||||
| James V. Milano | ||||||
| Director | 02/ | ||||
| Christine J. Olson | ||||||
| Director | 02/ | ||||
| Alan Papernick | ||||||
| Director | 02/ | ||||
| Myles D. Sampson | ||||||
| * | Director | 02/26/07 | ||||
| Charles A. Spadafora | ||||||
*By: | /s/ Joseph A. Kirk Joseph A. Kirk Attorney-in-fact | Director | 02/26/07 | |||
PAGE 8084